comments - oregon.gov
TRANSCRIPT
State of Oregon Department of Environmental Quality
Comments Program Options to Cap and Reduce Greenhouse Gas Emissions: Preliminary Report
This document is a compilation of written comments received during an open comment period regarding the preliminary report submitted to Governor Kate Brown on options to cap and reduce greenhouse gas emissions in response to Executive Order 20-04. The comment period was open from May 15, 2020 until June 15, 2020.
Commenters
Alea Kent 2 Alliance of Western Energy Consumers 3 Associated General Contractors 5 Associated Oregon Loggers 8 Association of Oregon Counties 14 Avista 15 bp 18 Cascade 20 Climate Solutions, EDF, NRDC, OEC 35 Engineers for a Sustainable Future 44 Environmental Caucus of the Democratic Party of Oregon 59 Eric Strid 66EVRAZ 71 Food Northwest 96 Forth 100 Green Energy Institute at Lewis & Clark Law School, Neighbors for Clean Air, Columbia Riverkeeper, 350PDX, and Center for Sustainable Economy 102 Janet Lorenzen 113 NFIB Oregon 116 Northwest Gas Association 119 Northwest Pulp and Paper Association 121 NW Natural 125 OCAP Coalition 133 Oregon Business & Industry 137 Oregon Farm Bureau 142 Oregon Forest and Industry Council 146 Oregon Manufacturers and Commerce 148 Oregon Refuse and Recycling Association 152 Oregon Trucking Association 154 Pacific Propane Gas Association 156 RNG Coalition 160 SOCAN 168 Tillamook 171 Western States Petroleum Association 173

1
From: Alea Kent Sent: Sunday, May 31, 2020 12:58 PMTo: CapandReduceSubject: Climate change
While I am all for controlling climate change, I am not for it at the cost of increasing cell towers, 5G or any other form of EMF emitting device.
These devices are damaging my health and because it is invisible, people are not aware of the incredible damage it is causing to human health, plants, animals and insects. As Martin Pall PhD says “5G is an extinction event.” We are killing ourselves with the every increasing need for the biggest and best and being better than others.
Alea Kent Talent, OR
Alliance of Western Energy Consumers ◆ 818 SW 3rd Avenue, #266 ◆ Portland, OR 97204 ◆ 971-544-7169 ◆ nwenergyusers.org
-1-
June 15, 2020
Oregon Department of Environmental Quality Office of Greenhouse Gas Programs [email protected]
Re: Program Options to Cap and Reduce Greenhouse Gas Emissions
To whom it may concern:
The Alliance of Western Energy Consumers (“AWEC”) respectfully submits these comments on the Department of Environmental Quality’s (“DEQ”) Preliminary Report on Program Options to Cap and Reduce Greenhouse Gas Emissions (“Preliminary Report”). AWEC is an association of large electricity and natural gas users in the Western United States, including in Oregon. In many cases, AWEC’s members use natural gas in essential operations for which there is no technologically feasible substitute. Accordingly, several of AWEC’s members are likely to be substantially and directly impacted by a cap and reduce program.
AWEC understands that DEQ has a mandate from the Governor to develop a cap and reduce
program. Accordingly, while AWEC has deep concerns with the disproportionate impacts a cap and reduce program will have on Oregon businesses, and the associated economic effects, compared with the level of carbon reductions achieved, AWEC’s intention with these comments is to identify issues that must be resolved to ensure a cap and reduce program that does not result in substantial economic harm to Oregon and carbon leakage that would undermine the goals of the program. That said, these comments should not be construed as a concession that DEQ has the legal authority to implement the cap and reduce program required by Executive Order 20-04, and AWEC reserves its right to take any legal position on the cap and reduce program ultimately developed.
AWEC appreciates and supports DEQ’s statement that an “important design question will be
measures to moderate compliance costs so that regulated entities have a stable, predictable pathway for business planning and making investment decisions.”1 A necessary addition to stability and predictability, however, must be achievability. Many businesses that are likely to be regulated under a cap and reduce program are already operating at the most efficient level that is currently technologically and economically feasible. A program that requires these entities to reduce emissions without identifying a means of achieving these reductions would be arbitrary and capricious, effectively requiring these entities to cease operations in Oregon. This in turn would result in a shift in production to other states and other countries where carbon emissions are typically far higher than in Oregon, resulting in an overall net increase to global emissions and undermining the intent of the cap and reduce program. Moreover, simply providing for the possibility that these entities could achieve compliance through the acquisition of alternative compliance instruments is insufficient without an understanding of how these instruments can be created and whether these instruments are likely to be available in sufficient quantities and at an affordable price to ensure the feasibility of their acquisition.
1 Preliminary Report § 3.3.4.
Alliance of Western Energy Consumers ◆ 818 SW 3rd Avenue, #266 ◆ Portland, OR 97204 ◆ 971-544-7169 ◆ nwenergyusers.org
-2-
Similarly, DEQ must make provision for Energy-Intensive, Trade-Exposed (“EITE”) businesses, which will be most vulnerable to the economic impacts of a cap and reduce program and the most likely to create carbon leakage as a consequence of this program. While the Preliminary Report identifies leakage as a consequence to be avoided, it does not explicitly state a need to protect EITEs from the most significant impacts of the program, or explain how it might identify whether a business or industry sector is EITE. The lack of any discussion of EITEs in the Preliminary Report and how a cap and reduce program will ensure their continued operation in Oregon – which, again, is in both the economic and environmental interests of the State – is a concerning deficiency. AWEC encourages DEQ to clarify up front that it does intend to provide for an alternative compliance pathway for EITEs and to identify industry categories that will qualify for EITE status.
AWEC appreciates the opportunity to provide these comments on the Preliminary Report and
looks forward to working with DEQ on the development of a cap and reduce program that appropriately balances the objective of reducing carbon emissions in the State with ensuring the economic viability of Oregon businesses.
Sincerely, /s/ Ed Finklea Ed Finklea Natural Gas Director Alliance of Western Energy Consumers
The Voice & Choice of the Construction Industry! @AGCOreCol • agcorecol
9450 SW Commerce Circle, #200 Wilsonville, OR 97070
503-682-3363 www.agc-oregon.org
2020 OFFICERS
Russ Batzer
President
Yohn Baldwin
First Vice President
Scott Williams
Second Vice President
Steve Malany
Secretary
Joe McDonnell
Treasurer
Sandy Trainor
Immediate Past President
EXECUTIVE DIRECTOR Mike Salsgiver
June 15, 2020
Oregon Department of Environmental Quality
Office of Greenhouse Gas Programs
700 NE Multnomah St., Suite 600
Portland, OR 97232
Submitted electronically to: [email protected]
Re: Comments on DEQ Program Options to Cap and Reduce Greenhouse Gas Emissions –
Preliminary Report – May 2020
We appreciate the opportunity to comment in response to DEQ’s Program Options to Cap and
Reduce Greenhouse Gas Emissions—Preliminary Report. The Associated General Contractors
Oregon-Columbia Chapter serves as the voice of the commercial construction industry. Since
1922, we’ve provided our members unmatched products and services improving businesses and
enhancing the professionalism of the construction industry. AGC offers training, education,
advocacy, human resources, labor relations, safety, and retirement programs, along with health
insurance, and an innovative workers’ compensation program.
AGC represents more than 830 member companies and associates and is the only trade
association representing the full range of commercial construction companies, from industrial to
building, heavy highway to multi-family residential. We are an association advocating for our
members’ ability to complete jobs in the most safe and cost-effective manner utilizing taxpayer
resources.
Our members build, maintain and preserve Oregon’s bridges and state highways, county roads
and city streets making a critical contribution to Oregon’s economic health. We believe both the
environment and the economy are best served when our transportation infrastructure is fully
maintained and preserved in a manner that serves Oregon’s current and future capacity needs.
Please see below for our responses to the questions raised by DEQ in its preliminary report on
Executive Order 20-04.
Section 2. Proposed stakeholder and public engagement processes
1. How might DEQ best coordinate the public engagement aspects of both the effort
described in this report on cap and reduce program or programs development and the
Clean Fuels Program expansion?
DEQ needs to prioritize stakeholder engagement despite the environment created by the
pandemic. Implementing a program of this magnitude demands a broad range of public input
equally matched to one of full transparency. Next steps and likely outcomes/changes to
The Voice & Choice of the Construction Industry! @AGCOreCol • agcorecol
9450 SW Commerce Circle, #200 Wilsonville, OR 97070
503-682-3363 www.agc-oregon.org
2020 OFFICERS
Russ Batzer
President
Yohn Baldwin
First Vice President
Scott Williams
Second Vice President
Steve Malany
Secretary
Joe McDonnell
Treasurer
Sandy Trainor
Immediate Past President
EXECUTIVE DIRECTOR Mike Salsgiver
individuals and state agencies should be clearly understood by all stakeholders, including those
directly and indirectly regulated industries.
2. How should DEQ engage with communities or individuals with limited or no internet
access?
In previous legislative sessions, each bill that aimed to reduce carbon emissions created an
unprecedented amount of public interest. DEQ should host town halls throughout the state - from
rural communities in northeast Oregon to an industrial area in Tualatin - to understand the
economic impacts in this time of a pandemic and the associated economic downturn.
3. What additional engagement strategies should the agency consider during the Phase 2
scoping work?
Hearing directly from the Oregonians whose jobs will most be impacted and the entities who will
be regulated will be essential. While the unintended consequences (economic challenges, impact
on Highway Trust Fund, etc.) are unknown at this point, all parties impacted should be directly
engaged.
4. Are the policy issues identified under “Stakeholder Engagement” in subsection 2.3.4. and
those in subsections 3.2. and 3.3. appropriately inclusive of issues, concerns and
considerations needing discussion?
Impacts to the Highway Trust Fund:
• Clearly, accelerating the transition from fossil-fuel powered vehicles toward electric and
other low emission vehicles and fuels is a primary goal. It is important to note that
Oregon’s transportation system is largely funded through fuel taxes. As a cap and reduce
program is developed and implemented it will, in all likelihood, accelerate an already
declining revenue stream (fuel taxes) and threaten Oregon’s ability to maintain and
preserve critical highway, county, and city transportation infrastructure.
Cost Containment:
• The agency should convene stakeholder meetings specific to the impacts of potential
increases to fuel costs. It is essential to provide regulated sectors and the public, an
opportunity to discuss what those increases mean and what the agency could do to
mitigate.
• The stacking of the multiple carbon programs will have a profound impact on all Oregon
motorists, freight trucking, and will have far reaching, downstream negative impacts on
the Oregon economy.
There is a lack of due diligence surrounding how transportation costs will inevitably impact
motorists, truckers, or the cost of raw materials and consumer goods. Further attention must be
paid to how cap and reduce interacts with the transportation sector and our ability to fund our
state’s transportation infrastructure.
The Voice & Choice of the Construction Industry! @AGCOreCol • agcorecol
9450 SW Commerce Circle, #200 Wilsonville, OR 97070
503-682-3363www.agc-oregon.org
2020 OFFICERS
Russ Batzer
President
Yohn Baldwin
First Vice President
Scott Williams
Second Vice President
Steve Malany
Secretary
Joe McDonnell
Treasurer
Sandy Trainor
Immediate Past President
EXECUTIVE DIRECTOR Mike Salsgiver
5. How should the agency approach identifying and selecting interested parties to serve on
the Rules Advisory Committee(s)?
DEQ’s application process for the Rules Advisory Committee should be transparent. DEQ needs
to ensure the RAC includes representation from each sector exposed to regulation as well as, the
consumers likely to be impacted by cost increases. A transparent and productive RAC should
include a balanced membership of individuals from all parts of the state.
6. What perspectives and expertise are critical in-terms of Rulemaking Advisory Committee member participation?
The focus of the cap and reduce program will be the transportation, manufacturing, and energy
sectors. For that reason, the RAC must include representatives from those entities/stakeholders
who own, maintain, build, use, and pay for Oregon’s transportation infrastructure.
7. Given the potential wide-reaching scope of proposed rules, how should the agency organize the Rulemaking Advisory Committee process to ensure critical issues receive adequate attention and discussion?
Many specific policy choices and issues will impact directly regulated entities and so-called
indirect stakeholders such as the construction industry. It will be incumbent upon the RAC to
consider the impacts upon stakeholders not directly regulated including, the payers of fuel taxes
and revenues supporting the Oregon Highway Trust Fund, and the industry that maintains and
preserves our transportation infrastructure.
Section 3. Framing key policy questions and options.
Limited due diligence has been done to understand the impacts to Oregon’s transportation system
and how to mitigate harm. We recommend an independent economic analysis be conducted to
understand this program’s impact to fuel prices and the future viability of the Oregon Highway
Trust Fund.
Our organization is committed to a process that equally considers the impact of emissions and
Oregon’s ability to fund the infrastructure critical to its economic vitality.
Thank you again for the opportunity to comment.
Submitted by:
John Rakowitz, Director of Public and Strategic Affairs
Associated General Contractors, Oregon-Columbia Chapter
^•»•
^awy _1LOGGERS, INC.
Associated Oregon Loggers, Inc. • P.O. Box 12339, Salem, OR 97309503/364-1330 • m: 503/930-4122 • [email protected]
www.oregonloggers.org"Representing the logging industry since 1969"
June 15, 2020
Oregon Department of Environmental QualityOffice of Greenhouse Gas Programs700 NE Multnomah St., Ste. 600Portland, OR 97232 [email protected]
Re: Comment on Preliminary Report—'Program Options to Cap and Reduce Greenhouse Gas Emissions ', May 2020
Dear Greenhouse Gas Program Office,
I am writing to submit comments in response to the Department of Environmental Quality (DEQ)Program Options to Cap and Reduce Greenhouse Gas Emissions — Preliminary Report, May 2020(Report).
These comments are made on behalf of Associated Oregon Loggers, Inc (AOL). AOL is thestatewide trade group representing 1,000 member small businesses engaged in harvest, protection,transportation, reforestation, access construction/maintenance, firefighting, forest improvement,young forest managing, forest health restoration, and allied forest management. These companiesprovide the essential management of private and public forests throughout Oregon. We serve asthe voice for Oregon's small business forest trades contractors, which include more than 23,000working families deployed across Oregon's top-3 largest traded good sector: forest products.
We wanted to take this opportunity to respond to several questions DEQ posed to stakeholdersupon releasing the Report surrounding DEQ program options for Executive Order 20-04, and theagency's initiation of work to "cap and reduce" greenhouse gas emissions (GHG) statewide. Ourcomments are as follows:
Section 2. Proposed Stakeholder Engagement
Overarching comment:Please curtail the DEQ Cap and Reduce program rulemaking process during 2020 and 2021.Since this Executive Order 20-04 was issued March 10, 2020, the COVID-19 outbreak created anunprecedented economic and public health crisis across America and the globe that has severelyimpacted Oregon's business economy, society, and state government. This crisis has forcedindustry, business, organizations, citizens, communities, local government, and agencies in ourstate to focus their attention on complying with health mandates, unemployment, lacking cashflow, and curtailed global markets, while also trying to find ways to stay afloat amid the suddenshocks to their normalcy and economic vitality. In recognizing the overwhelming scope ofCOVID-19—now its untenable duration in its fourth month—we ask that the DEQ suspend itsEO 20-04 rulemaking process immediately for the following reasons:
"AOL: Serving Oregon's forest professionals)!
Page 2 - Comment on Preliminary Report; Cap and Reduce GHG; AOL - June 15, 2020
A. EO 20-04 and its envisioned Cap and Reduce program places an enormous burden on theDEQ agency subject to its provisions. DEQ and other agencies are currently consumedwith responding to COVID-19 dismptions and/or compliance challenges, and will be foran indefinite future. The substantial agency financial resources to administer COVID-19tasking and mitigations costs added resources and pulls staff away from agency programresponsibilities. Under declining state revenue projections, substantial agencyprogrammatic cuts are imminent. DEQ has greater current priorities than increasingspending on a new additional Cap and Reduce program. Under less revenue, DEQ wouldbe prudent rather to focus existing taxpayer dollars on COVID-19 response, recovery, andeffectiveness of existing programs—rather than ramping-up a new program that promisescosts tens of millions of dollars to implement for DEQ and Oregonians.
B. EO 20-04 and the proposed Cap and Reduce program would result in the direct regulatoryburden of most every Oregon industry and citizen—as business, consumers, residents,agencies, employers, communities and government agencies—all consume energy andconsume products distributed or made with energy consumption. Virtually every industry,employer, and consuming citizen is financially and technically encumbered today due toCOVID-19. Oregon at-large is practically and financially unequipped to acquire the newencumbrances and burdens to participate in DEQ's highly-technical, expansive andexpensive rulemaking process. And these same Oregonians are even less equipped orwilling to accept the new encumbrances and burdensome Cap and Reduce outcomespromulgated by DEQ's highly-technical, expansive and expensive rulemaking. Oregonindustries, working families, communities, and local govermnents have not the bandwidthto sustained their livelihoods, their businesses, their agencies—in-addition to the difficultDEQ proposed rulemaking, nor the burdensome Cap and Reduce program outcomes.
1. How might DEQ best coordinate the public engagement aspects?IfDEQ were to proceed in the future with rulemaking, it should establish an executive order-specific webpage, which would expand its now-cloistered transparency to include all documentsand relevant information related to the Order and its information regarding upcoming meetings.This webpage should include current information about how the 1 6 agency efforts intertwine—showing each state agency's involvement in implementation of the order— so all Oregonians canmore easily access information and participate in rulemaking processes.
2. How should DEQ engage with communities or individuals with limited access?IfDEQ were to proceed in the future with rulemaking, DEQ staff should host a series ofin-person,community meetings. Environmental Quality Commission (EQC) meetings, and virtual meetingsto capture feedback from the affected stakeholders—including small business, working families,self-employed, employers, seniors, industries, trade associations, manufacturers, service providers,taxpayers, mral communities, local governments, citizens, rural business, and indirect consumers.
In-person meetings and opportunities for public comment must be located in different geographicareas to embrace diverse participation from a diverse Oregon, particularly working families whocould suffer displacement due to a proposed Cap and Reduce program. Stakeholders also shouldhave the opportunity to respond to work conducted by third-party consultants, regardless ofstakeholder access to internet.
"AOL: Serving Oregon's forest professionals"
Page 3 — Comment on Preliminary Report; Cap and Reduce GHG; AOL - June 15, 2020
3. What engagement strategies should DEQ consider for its scoping?IfDEQ were to proceed in the future with rulemaking, affected stakeholders must be thoroughlyconsulted and collaborated—including small business, working families, self-employed,employers, seniors, industries, trade associations, manufacturers, service providers, taxpayers,rural communities, local governments, citizens, rural business, and indirect consumers. Asproposed, noticeably absent from DEQ's stakeholder engagement strategy are Oregon's workingfamilies, small business, self-employed, rural residents/businesses, and those "indirect consumers"of Cap and Reduce-regulated energy. Like potentially-regulated entities, ALL of these heretoforeunrecognized stakeholder individuals, businesses, public sectors, self-employed, citizens, andgeographic localities would suffer negative impacts and significant cost increases under a Cap andReduce proposal. DEQ should prioritize engagement with ALL of these stakeholders who wouldface significant life-changing challenge and economic hardship under a Cap and Reduce proposal.
4. Are the policy issues identified under "Stakeholder Engagement" in the PreliminaryReport appropriately inclusive?We find the described proposal and its stakeholder scope of issues to be completely biased andunsatisfactory. The discriminatory presumption of the "regulated entity" is nonsensical, as thesole focus of affects and consideration for this Cap and Reduce proposal. The proposition ismyopic and disingenuous to consider the locus of regulation as only stationary large facilities,and/or fuel suppliers, and/or politically-favored energy types. Regulating just this handful ofcategories—using fallible government dictated metrics—ultimately still alters the energyallocation, cost, economy, disposition, and wealth distribution amongst all Oregonians. Suchmarket manipulation at the whims of state government is fraught by definition with inefficienciesand certain economic and societal peril. DEQ's abbreviated and exclusive stakeholderengagement proposal discourages and discounts such collaborative involvement or engagement ofthe entire diverse mix of affected Oregonians.
Furthermore, this Cap and Reduce proposal for stakeholder engagement clearly fails to address theinteraction among entities, consumers, businesses, producers, distributors, and agencies utilizingenergy within Oregon. All stakeholders must be afforded the opportunity and transparentdisclosure by DEQ of a full scope of cause and effect relationship assessment subject to alteredCap and Reduce paradigms proposed by DEQ and EO 20-04, under the alleged the "regulatedentity" stmcture. Such a DEQ-prepared full scope of cause and effect relationship assessmentmust be informed by input from all stakeholders. And, such a DEQ-prepared full scope of causeand effect relationship assessment must offer ALL stakeholders the opportunity and transparentdisclosure to weigh the economic, business, government, and societal interactions for alteredallocations and prices subject to Cap and Reduce-induced effects, including but not limited to:pricing, quality, quality, substitution, displacement, energy produced in-state versus out-of-state,import, export, unintended negative consequences, manufacturing output, farm & forest output,services industry output, tourism output, employment, family income, mean income, K-12schools, local governments, state agencies, state PERS pensions, interstate trade, intrastate trade,traded good economies, geographic mral-urban disposition, poverty and social services, businessattraction versus exodus from state, and so forth.
We recommend that DEQ's stakeholder engagement would encourage collaborative involvementand engagement from the diverse mix of affected Oregonians about ALL Cap and Reduce affects.
"AOL: Serving Oregon's forest professionals"
Page 4 - Comment on Preliminary Report; Cap and Reduce GHG; AOL - June 15, 2020
5. How should the agency approach identifying stakeholders to serve on the Rules AdvisoryCommittee(s)?The agency should create an inclusive application process and allow applicants to apply via emailor through the agency website to participate on the Rules Advisory Committee (RAC). The RACselection process should be transparent to the public and equitable to ALL interestedstakeholders—as described above.
The RAC should include a representative from each of the very many potentially-regulatedsectors, and regulated sectors should represent a majority of members on the RAC. Furthermore,the vast numbers of affected sectors of Oregon consumers and businesses should be included inthe RAC process. Indirectly-regulated stakeholders (the many as described above) and their verysignificant affects must also be represented. This is a sweeping economy-altering regulatoryprogram proposal, and all potentially regulated and affected entities should have a seat at the table.
Consumers will also bear the downstream costs of Cap and Reduce EO 20-04. Industrial,commercial, and residential energy consumer advocacy organizations and business tradeassociations must be represented on the RAC. Membership must be balanced to include manymore stakeholders from outside Portland's metro area.
Entities that could benefit financially from the Cap and Reduce EO 20-04 should not be includedon the RAC. This is a regulatory program; revenue raising is not within the scope of executiveauthority. RAC membership should include stakeholders who are subject to the regulatory and theindirect affects of the Cap and Reduce program.
6. What perspectives and expertise are critical in-terms ofRAC participation?Entities that are subject to regulation should comprise the majority ofRulemaking AdvisoryCommittee (RAC) members, program proposal, and all potentially regulated and affected entitiesshould have a seat at the table. These include: large stationary sources, transportation fuels, andall other liquid and gaseous fuels, including natural gas. Without this expertise, DEQ couldpromulgate Cap and Reduce rules that are not technologically feasible and, as a result, shutterOregon-based facilities. Indirectly-regulated stakeholders (the many as described above) and theirvery significant affects must also be represented. This is a sweeping economy-altering regulatory
Trade associations that represent potentially regulated Oregon entities—as well as indirectly-regulated stakeholders with expertise in the regulated business also must have a seat on the RAC.Industrial ratepayer advocacy organizations must also be included to provide critical feedback onthe impacts ofDEQ promulgated Cap and Reduce rules on energy consumers, since liquid andgaseous fuels are subject to EO 20-04. Because ratepayers are indirectly impacted by Cap andReduce regulations on natural gas and other gaseous fuels, they must be represented on the RAC.
7. Given the broad scope of proposed rules, how should the agency organize the RAC?Greenhouse gas Cap and Reduce rules will have a significant impact on the economy and vitalityof rural Oregon communities. Rulemaking must be organized to allow for maximum participationfrom potentially regulated entities and indirectly-regulated stakeholders (as described above),particularly those in rural areas. DEQ should engage early with energy intensive trade exposedentities in order to prevent leakage and ensure that working families are not unduly impacted.
"AOL: Serving Oregon 's forest professionals))
Page 5 - Comment on Preliminary Report; Cap and Reduce GHG; AOL - June 15, 2020
Section 3. Framing key policy questions and options.We are concerned that several aspects of the executive order exceed statutory authority.Additionally, it should be noted that the carbon reduction goals outlined in Executive Order 20-04cannot be achieved with existing technology.
Forest Sector — Particular communities and economic interests?Concerning subsection 3.3.5, we urge DEQ to consider the effects of emissions reductionprograms on particular communities and trade-exposed industries, to consider how suchprograms could produce a disproportionately deleterious effect on rural communities and therural-based industries, small businesses, local governments, K-12 schools, health and emergencyservices, and working families that support them.
Oregon's forest-producing communities and forest product businesses are an integral regulatedcommunity under the prosed Cap and reduce program. Oregon's forest sector directly supportsmore than 60,000 wage employment jobs throughout the state - many of those in the state's ruralcommunities - that pay employees an average wage that is 6% higher than the state averagewage. These jobs depend on a robust forest-products industry—and any reduction in fibersupply, forest trade employment, management production activity, or increase in the cost ofoperating forestry trade contracting and forest product businesses—would have serious andnegative impacts on the sector and business ability to continue to support those working families,communities and local governments.
Therefore, we urge DEQ to both recognize a comprehensive life-cycle assessment of the forestsector and forest products. We urge you to recognize regulatory credit to the entire forest sectorindustry for its carbon-capturing role in mitigating climate change. Please do not establishpreferential biases or market compliance mechanisms that would directly or indirectly suppressthe growing, harvesting, and life-cycle carbon capture of actively managed forestlands with anon-declining yield of wood fiber.
Infeasible ideals cannot be practically or economically achieved?DEQ notes that, iiThe executive order sets out the emissions reduction goals consistent with recentscience: Oregon will reduce its emissions at least 45 percent below 1990 levels by 2035 and atleast 80 percent below 1990 levels by 2050. " As the agency becomes informed of the modemrealities, the DEQ should acknowledge that the greenhouse gas reduction goals outlined in EO 20-04 are not feasible using today's technology, nor within the scope ofone-state governance.
During the first week of April 2020 (peak of stay home orders worldwide), global emissions ofgreenhouse gases were 17% below 2019 levels, as 89% of the populations that emit greenhousegases where staying at home. (The Economist, May 21, 2020). Yet even as travel by car andairplane nearly ceased, we are still expected to use 92% of the greenhouse gases emitted last year,globally. Economic shutdowns as a result ofcoronavirus have shown that the technology does notcurrently exist to meet Paris Accord or Oregon greenhouse gas reduction goals.
"AOL: Serving Oregon 's forest professionals))
Page 6 - Comment on Preliminary Report; Cap and Reduce GHG; AOL - June 15, 2020
The Economist (May 21, 2020) writes:"Shutting down swathes of the economy has led to huge cuts in greenhouse-gas emissions.In the first week of April, daily emissions worldwide were 17% belo-w -what they were lastyear. The International Energy Agency expects global industrial greenhouse-gas emissionsto be about 8% lower in 2020 than they -were in 2019, the largest annual drop since thesecond world war.
That drop reveals a crucial truth about the climate crisis. It is much too large to be solvedby the abandonment of planes, trains and automobiles. Even if people endure hugechanges in how they lead their lives, this sad experiment has shown, the world -would stillhave more than 90% of the necessary decarbonisation left to do to get on track for theParis agreement's most ambitious goal, of a climate only 1.5°C -warmer than it was beforethe Industrial Revolution.))
It is clear that eliminating the use of transportation fuels or shuttering businesses (such as with aCOVID-19 stay home order or through EO 20-04) will not achieve Oregon's unattainablegreenhouse gas reduction goals—particularly is a global shut down only resulted in 8% reductionin greenhouse gases. The COVID-19 April 2020 experience proves that humanity cannot achievegreenhouse gas reduction levels, such as those put forward by Governor Brown or in the ParisClimate Accord, simply by changing our lifestyles. Real technological breakthroughs in the fieldsof energy production, storage, and consumption are needed to meet Oregon's ambitious climategoals. And today's energy technologies are woefully inadequate if humanity is going to meet itsneed to power things with electricity; temperature control buildings; grow, distribute, and cookfood; manufacture goods; and move people and goods on trains, planes and automobiles withoutany carbon emissions.
Lacking a global technological revolution in the next couple of years (unlikely under the economicburdens ofCOVID-19), the Cap and Reduce proposal and EO 20-04 are likely to result in a shut-down of large sectors of Oregon's already fragile economy and the displacement of thousands ofworking families and small businesses—particularly those in rural and underserved areas of thestate.
Thank you for this comment opportunity on the Department's Program Options to Cap andReduce Greenhouse Gas Emissions — Preliminary Report. We urge you to adopt ourrecommendations.
Sincerely,
4<^^^-Rex Storm, Certified ForesterExecutive Vice President
Associated Oregon Loggers, Inc.
"AOL: Serving Oregon 's forest professionalsf)
June 15, 2020
Oregon Department of Environmental Quality Attn: Lauren Slawsky 700 NE Multnomah Street, Suite 600 Portland, OR 97232-4100
Submitted via electronic mail to: [email protected]
Dear: Lauren
Thank you for the opportunity to provide public comment on the Oregon Department of Environmental Qualities’ Greenhouse Gas Reduction Workplans for 2020 and 2021. As an organization, the Association of Oregon Counties (AOC) represents the voices of 120 county commissioners from all 36 counties and the communities they serve. We encourage the department to look to AOC and counties as partners as you begin the implementation process.
We know that the transportation sector (air, water, rail, road) is the largest contributor of greenhouse gas (GHG) emissions in Oregon, at 39 percent. As counties own and maintain the largest share of Oregon’s roads and bridges (39 percent), we are key stakeholders and partners in Oregon’s transportation system, and its climate goals and GHG emissions reduction strategies. Policies and regulations, such as the Clean Fuels Program, that influence the price and availability of fuel directly impact counties’ ability to deliver transportation services, as fuel taxes comprise a large portion of county road department budgets. Counties are invested in Oregon’s transportation future, which includes transitioning to electric and alternative fuel vehicles while ensuring adequate, stable, diverse, and dedicated funding for critical infrastructure.
To achieve Oregon’s shared goals, counties’ principles are to:
● Advocate for clean water and air, while balancing the impact on the community and economichealth of communities.
● Promote the use of energy efficiency in county buildings and vehicles.● Support policies that allow the development and use of alternative energy and bridge fuels locally
and globally.● Support the needs of Oregon's high growth counties, who have needs unique to growth issues
and tend to be higher-cost modernization and capacity-projects beyond the means of today'sprimary revenue source, the gas tax.
County Commissioners bring a wide variety of viewpoints that will help the department create a program that matches the needs of our diverse state and communities. We hope you will include us early on as stakeholders in your process so we can achieve our collective goal of building a program that benefits all of Oregon.
Regards,
Gina Nikkel Executive Director, Association of Oregon Counties
June 15, 2020 Lauren Slawsky Oregon Department of Environmental Quality 700 NE Multnomah Street, Suite 600 Portland, OR 97232 Submitted via email: [email protected] RE: DEQ Preliminary Report of Program Options to Cap and Reduce Greenhouse Gas Emissions and Preliminary Work Plan to Expand the Oregon Clean Fuels Program Dear Ms. Slawsky: Avista appreciates the opportunity to comment on the Department of Environmental Quality’s (DEQ’s) Program Options to Cap and Reduce Greenhouse Gas Emissions Preliminary Report. Avista’s perspective on these issues primarily derives from our role as a natural gas utility serving almost 100,000 customers in Oregon. In addition, Avista owns a natural-gas fired electrical generation facility in Oregon. Relative to an effort to cap and reduce emissions associated with natural gas delivery, Avista’s interests are to balance meeting emissions goals with our duty to serve Oregon customers, with consideration of the cost impacts to our customers. Here, we offer a few general comments followed by brief responses to the questions posed in the preliminary report requesting feedback. We offer no comments at this time regarding the discussion of the Environmental Quality Commission’s authority to set greenhouse gas (GHG) emission caps for indirect sources such as a natural gas utility. Natural gas plays, and should continue to play, an important role in supplying Oregonians with clean energy. Natural gas can provide highly efficient and lower life-cycle GHG emissions in many cases, particularly as a direct-use fuel. Natural gas is a reliable and cost-effective fuel for many Oregon businesses, such as food processors, nurseries, the wood products industry, manufacturers and others. Natural gas can continue to provide this value while reducing its GHG emissions. General Comments. Overall, Avista supports DEQ’s plan to conduct stakeholder engagement during the summer and fall of 2020 as a precursor to subsequent rulemaking. Given the potential scope of a regulatory program, at least some sector-specific workshops may be helpful to make good use of the time available. We agree that alternative compliance pathways will be important to achieve cost-effective emission reductions. Similarly, compliance instruments, including possible allocations, can play an important part in managing cost impacts. Natural gas utilities are well-situated to apply compliance instruments to benefit Oregon customers. Flexibility in applying compliance instruments, in developing compliance alternatives, in working across sectors and in having the ability to trade instruments and/or emissions, will promote permanent, cost-effective emission reductions.
While the preliminary report acknowledges legislative uncertainty, DEQ might consider identifying either key gaps in authority or ways that policies can be harmonized, particularly if new policy approaches emerge from the Legislature. Particularly for natural gas utilities, it will be essential for DEQ and the PUC to closely coordinate their efforts. Joint workshops with DEQ, the PUC and utilities are one way to promote such coordination. Regarding the specific questions DEQ poses in the preliminary report, Avista offers the following responses. 1. How might DEQ best coordinate the public engagement aspects of both the effort described in this report on cap and reduce program or programs development and the Clean Fuels Program expansion? It may be helpful within each setting to identify a possible subset of common issues, which would be the subject of a joint workshop or workshops. 2. How should DEQ engage with communities or individuals with limited or no internet access? One option is to ensure that phone-in access is possible for workshops. DEQ might also offer sign-up for paper-based engagement and consider posting notices at libraries, community centers and other community locations that are reopening. 3. What additional engagement strategies should the agency consider during the Phase 2 scoping work? DEQ might consider breaking up sessions into smaller bites when possible, or offering multiple times as it did with the recent listening sessions. For some topics that may be less familiar to some stakeholders, it may be helpful to start sessions with a brief educational component to level-set on the specific topic. Pre-workshop background information may also be useful. 4. Are the policy issues identified under “Stakeholder Engagement” in subsection 2.3.4. and those in subsections 3.2. and 3.3. appropriately inclusive of issues, concerns and considerations needing discussion? The policy issues identif ied appear fairly comprehensive at this time; additional issues are likely to arise during the engagement process. As noted above, the issue of harmonizing with existing policies and any future legislative adoptions should be considered. 5. How should the agency approach identifying and selecting interested parties to serve on the Rules Advisory Committee(s)? Given the breadth and potential scope of future rulemaking, having multiple committees or subcommittees may help focus participants’ engagement on issues of greatest importance. Given the diversity of customers served by natural gas utilities in the state, it would be appropriate to include more than one representative from the natural gas utility sector. Avista would be interested in participating in this effort. Our customers live in diverse settings in the state, generally in smaller communities, with unique energy challenges. We would appreciate the opportunity to contribute to this collaborative effort.
6. What perspectives and expertise are critical in-terms of Rulemaking Advisory Committee member participation? Among the many perspectives to consider, we suggest including those of cost impacts to residents and businesses alike, as well as economic development interests. Geographic diversity can help reflect economic diversity and other concerns as well. This may also be an opportunity to include representation by the Public Utility Commission in some form. 7. Given the potential wide-reaching scope of proposed rules, how should the agency organize the Rulemaking Advisory Committee process to ensure critical issues receive adequate attention and discussion? As noted above, breaking out policy and rule issues may promote more in-depth engagement by stakeholders on the issues most critical to their interests. One approach would be to have a central, plenary committee with issue sub-groups. Regarding the Clean Fuels Program, Avista supports efforts to encourage the use of cleane r transportation fuels. Compressed Natural Gas (CNG) and Liquefied Natural Gas (LNG) provide reduced emissions (GHG and other) compared to diesel, and can fit well in a wide range of applications. Thank you again for the opportunity to comment. We look forward to working with DEQ in this collaborative effort. Sincerely,
Bruce F. Howard Sr. Director, Environmental Affairs
1
June 15, 2020 Department of Environmental Quality Office of Greenhouse Gas Programs 700 NE Multnomah St. Suite 600 Portland, OR 97232 Dear Department of Environmental Quality Staff: On behalf of bp America (bp), thank you for the opportunity to provide comments on the Department of Environmental Quality’s (DEQ) recent submission “Program Options to Cap and Reduce Greenhouse Gas Emissions Preliminary Report” (“the Report”). bp supports this effort and is pleased to work with you to reduce greenhouse gas emissions in Oregon. bp is an integrated energy business with global operations. In Oregon, our business is focused on natural gas marketing and bringing transportation fuels to market, including renewable diesel produced at our Cherry Point Refinery in Washington state. In February 2020, bp introduced our ambition to become a net zero company by 2050 or sooner, and to help the world reach net zero. While bp believes carbon pricing is the most efficient way to achieve carbon reductions and continues to support an eventual carbon price in Oregon, we recognize the urgency of climate change demands action. That is why we will support the path laid out in Executive Order 20-04. With DEQ’s questions posed in Section 4 of the Report regarding stakeholder engagement, we offer the following: • To support the effective engagement of stakeholders, particularly during this period of
virtual on-line meetings, bp recommends the early and wide provision of resource materials in advance of engagements to ensure meaningful participation by all.
• bp recommends the agency appoint a well-defined Rulemaking Advisory Committee (RAC) made up of a diverse and balanced cross-section of regulated entities. The RAC should have input into research study planning and review.
• bp supports workshops on program design elements including: compliance instruments; alternative compliance mechanisms; tools for avoiding or minimizing leakage; cost containment; point of regulation; program cost transparency; reporting mechanisms; and program assurance.
bp America, Inc. 4519 Grandview RD Blaine, WA 98230
Pam Brady Director Government and Public Affairs
2
In response to DEQ’s request for suggestions on how to frame questions for the scoping and public engagement process on the key policy questions, we offer the following:
• How should the program be shaped so that it equitably captures all quantifiable GHGemissions across the economy?
• How should the program be shaped to prevent the shift of emissions and jobs from Oregonto other jurisdictions?
• How should the program consider other state or local programs that are complementary orconflicting with the overall program goals, including mitigation and harmonization?
• How should the program design consider best practices from existing programs like theOregon Clean Fuels Program?
We appreciate the opportunity to share this input and look forward to working with you in order to achieve meaningful reductions in carbon emissions. If you have any questions or would more information, please contact me.
Sincerely,
Pam Brady bp America
8113 W. GRANDRIDGE BLD, KENNEWICK, WA 99336-7166
TELEPHONE 509-734-4500 FACSIMILE 509-737-7166 www.cngc.com
Submitted electronically to via email at [email protected] Lauren Slawsky Office of Greenhouse Gas Programs Oregon Department of Environmental Quality 700 NE Multnomah St. Suite 600 Portland, OR 97232 Dear Ms. Slawsky: On March 10, 2020, Governor Brown signed Executive Order (EO) 20-04, establishing updated greenhouse gas emission (GHG) goals of at least 45 percent below 1990 emissions levels by 2035 and at least 80 percent below 1990 emissions levels by 2050. The EO also directs state agencies and commissions, including the Department of Environmental Quality (DEQ), to take actions to reduce and regulate greenhouse gases (GHGs) within the state of Oregon and to expedite agency processes, procedures and rulemaking to accelerate GHG emission reductions. Per reporting requirements for state agencies and commissions in the EO, DEQ submitted a preliminary report to Governor Brown on May 15, 2020, that lays out the Environmental Quality Council’s (EQC’s) legal authority to cap and reduce greenhouse gas (GHG) emissions, proposes a process to engage the public and stakeholders in gathering input into program design options, provides a preview of policy considerations and initial core program design elements, and describes the public comment process on the preliminary report. DEQ also provides a list of questions that the public is requested to provide input on by June 15, 2020, to inform DEQ’s final work plan and report that is to be submitted to Governor Brown by June 30, 2020. Cascade Natural Gas Corporation (Cascade) appreciates the opportunity to comment and provide input to the DEQ and includes the following comment and recommendations for consideration of the proposed public engagement process and DEQ’s proposed key policy considerations and options in the preliminary report. About Cascade Natural Gas Corporation: Cascade was formed in 1953 to serve communities in Oregon and Washington with clean, affordable natural gas. Cascade serves a diverse territory covering more than 32,000 square miles. Interstate pipelines transmit Cascade’s natural gas from production areas in the Rocky Mountains and western Canada to rural areas that rely on natural gas. Throughout our service areas, our focus is on maintaining safety, comfort, affordable rates and reliability for our customers. Today, Cascade serves about 75,000 customers in 29 communities in Oregon, and mainly rural communities.
Cascade Natural Gas Corporation Comments on DEQ Prelim GHG Reduction EO Report to Governor Brown June 15, 2020 Page | 2 Natural gas has played a critical role in reducing the state’s GHG emissions, providing a reliable alternative to more carbon intensive fossil fuels. At the outset, Cascade comments that GHG regulation established through DEQ rulemaking should provide consistent treatment of all utility sector emissions – and, consequently, all utility customers. A GHG rule should be administered so that natural gas customers are not asked to pay more than their fair share and placed at a competitive disadvantage. For instance, not including the electric sector in GHG reduction rulemaking, would result in some Oregon consumers paying for their emissions, while others would pay nothing and emit just as much. Cascade believes energy efficiency is the most effective means of reducing GHG emissions in our communities. Since 2006, the Company has actively partnered with the Energy Trust of Oregon to deliver conservation rebates and services to natural gas homes and businesses across our service area. Cascade collects Public Purpose Funds from our core customers to fund these critical efforts. In 2019, $1.46 million were paid in incentives to Cascade customers for increasing home and building efficiency and reducing their natural gas usage. Through these incentives, customers reduced their energy usage by 498,911 therms. Cascade appreciates the efforts of the Energy Trust in maximizing efficiency in customer homes and we are proud to provide ongoing feedback and guidance on these efforts through the Energy Trust’s Conservation Advisory Council (CAC). We participate in meetings and collaborate with Energy Trust staff to identify ways to grow and streamline efforts to help customers use less energy. Cascade also partners with local Community Action Agencies providing weatherization services to the economically vulnerable to deliver the Oregon Low Income Energy Conservation (OLIEC) program. We look forward to working with our agencies to identify ways to expand and strengthen services to our customers. As a revenue decoupled utility, Cascade takes the initiative to minimize the amount of therms used in natural gas homes and businesses. Our interest isn’t with how fast the meter spins, but rather with the quality, affordability, and reliability of our product. Cascade’s commitment to and foundation in environmental stewardship has led the Company to engage with local communities interested in reducing GHG emissions and streamlining fossil fuel usage as part of their climate action planning. In 2018, Cascade staff joined the City of Bend’s Climate Action Steering Committee (CASC) to help find ways to reduce the City’s GHG footprint consistent with its Community Climate Action Plan (CCAP). The City formed the CASC to engage the community and recommend actions to the City Council. All sectors of the community were engaged as part of this effort. This approach resulted in a plan that offers meaningful, holistic solutions to encourage and incentivize businesses and residents, through voluntary efforts, to reduce GHG emissions and fossil fuel use. The City Council adopted the Plan in December 2019, with Cascade’s full support. We’re proud to be part of a plan that recognizes the importance of preserving the economic vitality of Bend and considers impacts to vulnerable communities while reducing the effects of carbon and GHG emissions. Cascade looks forward to continuing to engage with the City to explore pathways forward for local biogas and expanded conservation efforts.
Cascade Natural Gas Corporation Comments on DEQ Prelim GHG Reduction EO Report to Governor Brown June 15, 2020 Page | 3 To achieve the goals established in the EO, significantly more reductions need to occur and will increase costs to customers. Cascade had estimated cost increases to the company’s natural gas customers under the legislative approaches from 2019 to 2020, which incorporated the same GHG reduction goals as published in EO 20-04. Although we expect DEQ’s rulemaking could be different, the same goals are stated. If the same reduction goals are applied to natural gas distribution utilities, Cascade’s residential and commercial customers may see rate increases in their bills starting in the first year the reductions are to be implement and would be projected to spike to a 46 percent increase by 2035 and would be expected to increase further as the cap reduces beyond 2035. This projection was anticipated under a legislative approach which included flexibility in the form of allowances, offset purchases and trading. If DEQ’s authority is constrained and cannot legally provide compliance flexibility and alternative compliance options, costs will be even higher for natural gas distribution utilities and customers. DEQ should apply as much flexibility within its authority as possible to provide sufficient pathways for compliance, and alternative compliance options for natural gas distribution utilities. Emissions reductions required within the strict goal timelines as identified in the EO will be challenging for natural gas utilities and could result in high costs to customers without sufficient compliance flexibility. Feedback and Comment on Specific Questions and Policy Considerations in DEQ’s Report DEQ included specific questions in the agency’s preliminary report requesting feedback and comment in submitting a final report to the Governor by June 30. At this time, Cascade offers input on the following questions and policy considerations:
1. How might DEQ best coordinate the public engagement aspects of both the effort described in this report on cap and reduce program or program development and the Clean Fuels Program expansion?
In coordinating public engagement for the proposed rule input and rulemaking process, DEQ must meet with all proposed regulated industries under the Governor’s EO. This will allow DEQ to maximize its understanding of the challenges and opportunities available for GHG reductions. DEQ should consider the interconnectedness of DEQ’s rulemaking with other agency requirements and its existing oversight pertaining to industry and should provide sufficient flexibility in compliance with GHG regulation in order for businesses to remain economically viable in Oregon. Challenges and opportunities will differ for each company within an industry depending on the individual characteristics of the business.
2. How should DEQ engage with communities or individuals with limited or no internet access?
Cascade recognizes the importance of continued social distancing to ensure public health and safety during the ongoing COVID-19 pandemic. Virtual meetings have helped ensure continued public participation during this health crisis. Cascade recognizes some communities or individuals, most notably in Cascade’s rural service areas, might have limited or no internet
Cascade Natural Gas Corporation Comments on DEQ Prelim GHG Reduction EO Report to Governor Brown June 15, 2020 Page | 4 access. In such cases, DEQ should consider alternatives including access to traditional phone-based conference call lines, as well as socially distanced, small-group feedback sessions with appropriate PPE, particularly with traditionally under-represented communities that may be more acutely impacted by increases to energy costs and energy burden. The DEQ should consider the additional time it may take to reach these communities. This is a significant rulemaking and sufficient feedback and representation may take longer than DEQ has proposed.
3. What additional engagement strategies should the agency consider during the Phase 2 scoping work?
Under Phase 2 of the scoping work, DEQ will be continuing with policy and program scoping by framing key policy constructs and issues. DEQ proposes to host three to five public meetings or listening sessions during summer and fall of 2020 focusing on introducing key concepts and soliciting feedback and concerns from the public. DEQ also proposes to host topic-specific workshops throughout the summer and fall of 2020 to collect input on key outcomes that a cap and reduce program should be designed to achieve, and alternative choices on how to achieve those outcomes. Specifically, DEQ plans to also engage with the Environmental Justice Task Force and other representatives from underrepresented and impacted communities, EQC and the legislature. Cascade appreciates DEQ hosting meetings and topic-specific workshops to engage the public and plans to participate in these meetings. We anticipate framing the key policy constructs and issues will be complicated with the overlapping agency regulation and oversight that currently exists for natural gas distribution utilities. For the topic-specific workshops, we recommend DEQ host industry-specific stakeholder meetings early on in this process. Meetings held specifically with energy industry representatives and those dependent on affordable, reliable energy for their livelihoods and homes will need to be sufficiently represented so that DEQ has the information necessary to understand the challenges and opportunities unique to this sector before entering the rulemaking process. DEQ should take adequate time to review how alternative compliance options can be utilized. Cascade believes alternative compliance options and compliance flexibility will be key for natural gas utilities to economically reduce emissions and to ensure we are able to continue to meet our obligation to serve customers in a safe, affordable, and reliable manner. We also recommend DEQ engage directly with organizations supporting low income communities and businesses who rely on natural gas for their energy. Cost for utilities to comply with rule requirements will be passed on to customers. DEQ must consider how establishing reduction requirements will economically impact low income, small business, and traditionally underserved communities.
4. Are the policy issues identified under “Stakeholder Engagement” in subsection 2.3.4. and those in subsections 3.2. and 3.3. appropriately inclusive of issues, concerns and considerations needing discussion?
Cascade Natural Gas Corporation Comments on DEQ Prelim GHG Reduction EO Report to Governor Brown June 15, 2020 Page | 5 Cascade appreciates DEQ’s acknowledgement that the agency will need to coordinate with other state agencies, specifically the Public Utilities Commission (PUC) regarding natural gas suppliers. The interplay between the DEQ’s cap and reduce program and other important governmental programs and compliance obligations, including those administered by the PUC and Oregon Department of Energy (ODOE), will be essential for DEQ to understand. Examples include cost recovery and allowance of essential compliance pathways such as renewable natural gas; and consideration of adjustments to the valuation of energy efficiency resources to support an increase in conservation program options for the Energy Trust of Oregon. DEQ should also work closely with the utility sector and ODOE to ensure all sectors of Oregon government are operating from a shared understanding of essential baseline data including a shared agreement on carbon intensity of all regulated fuel sources. Natural gas utilities can assist DEQ in understanding these connections, opportunities and challenges. As mentioned above, it is essential DEQ conduct outreach with low income and rural communities, as well as the business community, in regard to reducing GHG emissions from natural gas that is a low cost and clean energy choice for Oregonians.
5. What other issue areas should the agency convene stakeholder meetings for?
• As stated above, DEQ should convene stakeholder meetings to ensure a creative, dynamic, and flexible approach is taken regarding cap and reduce. Options should ensure energy affordability and reliability for all Oregonians.
• Stakeholder meetings should be held to identify interorganizational overlap and
streamline coordination between DEQ, Oregon Public Utility Commission (OPUC), Oregon Department of Energy (ODOE), Building Code Division (BDC), and other state agencies impacted by the Governor’s executive order.
• An inventory should be taken of GHG reduction priorities within each state agency or
department that intersect. Stakeholder meetings could then help refine a shared understanding of terms, baselines, and meaningful pathways to GHG reduction.
• Workshops should also be held on energy burden and energy affordability and ways to
mitigate the impacts of rate increases to traditionally underserved and economically vulnerable populations.
• Finally, DEQ should convene workshops on each of the compliance pathways developed
as part of cap and reduce and include the entities directly responsible for implementation of these goals. Utilities will require clarity on how credit will be given in regard to GHG reductions and how penalties would be considered when all energy efficiency programs outside the low income sector are delivered independently of the utilities via the Energy trust of Oregon as mentioned at the beginning of this comment letter.
Cascade Natural Gas Corporation Comments on DEQ Prelim GHG Reduction EO Report to Governor Brown June 15, 2020 Page | 6
6. How should the agency approach identifying and selecting interested parties to serve on the Rules Advisory Committee(s)?
Cascade believes all interested businesses, organizations, and or entities considered for regulation should be afforded an opportunity to serve on the Rules Advisory Committee (RAC). Cascade believes that a RAC appointment should not be limited in number due to the broad application of the EO and the extent of rulemaking to impact all Oregonians. The RAC, in the case of this rulemaking, could be a larger group due to the broad impacts of the rulemaking across Oregon. Particularly, businesses that would be regulated under cap and reduce should be afforded the opportunity to serve on the RAC as they are impacted by the regulation and can help inform DEQ of impacts and best approaches for this regulation.
7. What perspectives and expertise are critical in-terms of Rulemaking Advisory Committee member participation?
If the entity is being considered as a regulated party in upcoming rulemaking, either a representative from the impacted company, or their associated trade organization should be appointed to the RAC. Each company, business or regulated entity would have different perspectives and expertise that will be critical for DEQ to consider and broad representation will provide DEQ with the input the agency needs.
8. Given the potential wide-reaching scope of proposed rules, how should the agency organize the Rulemaking Advisory Committee process to ensure critical issues receive adequate attention and discussion?
In order to organize the RAC process to ensure critical issues receive adequate attention and discussion, Cascade recommends DEQ solicit information from each potentially regulated entity and schedule industry-specific workshops for input. Also, DEQ should ensure overlapping state agencies and departments have representation on the RAC. DEQ could consider having multiple RACs or sub-RACs instead of one large committee to gain efficiency and promote and facilitate fruitful discussion. The RAC could be broken into groups according to industry or subject matter areas. DEQ includes a list of other key policy considerations in the report. Cascade generally agrees that DEQ has identified appropriate policy considerations for stakeholder meetings and public outreach. Cascade can provide DEQ more detail on the policy considerations at future workshops and in comments. Cascade offers some brief preliminary thoughts on DEQ’s policy considerations: Cascade recommends the following:
• DEQ must consider the fiscal impacts to natural gas consumers and businesses, including small businesses, and the potential outcome of businesses moving out of state if reduction requirements cannot be met and compliance flexibility is
Cascade Natural Gas Corporation Comments on DEQ Prelim GHG Reduction EO Report to Governor Brown June 15, 2020 Page | 7
limited. This is particularly essential in the constrained economic environment Oregonians face due to the aftermath of COVID-19.
• Cascade agrees the costs associated with cap and reduce to the natural gas sector should not be disproportionate to other sectors and all sectors of Oregon’s economy must be included to achieve the new emission reduction goals.
• Allow for alternative compliance options and offsets, within DEQ’s legal authority, to be utilized for compliance for optimum cost-effectiveness and flexibility.
• Economic, social, and public health impacts, both positive and negative, must be considered in this rulemaking, particularly in consideration of the costs and impacts on vulnerable, rural, and low-income communities.
• Cascade agrees this additional regulation will increase administrative burden to the agency and to regulated entities and encourage streamlining to the extent possible.
• Compliance off ramps should be included in the rule if costs escalate.
9. Role of future innovation and technological developments Cascade looks forward to working with DEQ to explore how future innovation and technological developments can assist in reducing GHG emissions in Oregon. Cascade actively partners with communities in Oregon and Washington to promote efficient and sustainable use of natural gas for residential, commercial, industrial and low-income customers. As mentioned above, the company offers rebate programs for high-efficiency upgrades and weatherization through the Energy Trust of Oregon to its residential, commercial and industrial customers in Oregon. Energy Trust is tasked with reviewing the portfolio annually and updating with new technologies. In 2015, Cascade joined the Northwest Energy Efficiency Alliance (NEEA) Natural Gas Market Transformation Collaborative. This five-year effort, with a combined $18.3 million commitment from participants, was focused on advancing development and market adoption of energy-efficient natural gas products, practices and services in the Pacific Northwest. In 2019, Cascade renewed its membership in the alliance through 2024, obtained a director position on the collaborative’s board, and started funding the NW Power Council’s Regional Technical Forum to support regionally vetted and reviewed energy savings estimates for efficient natural gas technologies. Our membership in NEEA and on the NW Power Council’s Regional Technical Forum, as well as our partnership with the Energy Trust of Oregon, will expand discussion with DEQ on the innovation and technological advancements occurring in natural gas energy efficient appliances and conservation technology advancements.
Cascade Natural Gas Corporation Comments on DEQ Prelim GHG Reduction EO Report to Governor Brown June 15, 2020 Page | 8 For additional input on this topic, see Cascade’s comments submitted to the ODOE1.
10. Should the three sectors specifically identified in the EO be expected to achieve the same level of reductions, and would that level necessarily be the same as the level described in the EO?
DEQ’s GHG regulation should provide consistent treatment of all utility sector emissions and not be administered in a manner that places utility companies at a competitive disadvantage. Cascade has commented on prior Oregon legislative proposals that the emission reduction goals, the same as the goals established in the EO, far exceed the Paris Accord and are more stringent than any other state to the best of our knowledge. We expect the emission reductions to be a significant challenge for Oregon.
11. Should DEQ apply the rate of reductions over various time periods and should DEQ consider factors such as technological and economic feasibility, the emissions reductions that are expected to be achieved through other complimentary programs, and whether to have a separate cap for each sector, or one overall cap (or some combination of the two)?
Cascade recommends DEQ consider applying flexibility across the board. DEQ should explore options that allow for the most flexibility and identify where emission reductions could occur sooner or later, resulting in the least economic burden on Oregonians. Timelines for technological advancement can differ sector to sector. Advancements in natural gas appliance efficiency and market transformation is occurring and those projected advancements should be considered with the reductions identified for natural gas suppliers. As those technologies mature and adoption increases, costs should decrease. Cascade understands DEQ’s directive to increase Oregon’s Clean Fuels standard. However, there is concern that as DEQ increases the Clean Fuels standard, competition for renewable natural gas as a compliance option for multiple sectors will increase and may also increase the cost of renewable natural gas as a GHG reduction option for natural gas utilities replacing fossil natural gas with a lower emitting gas supply option. DEQ is also planning rulemaking to increase landfill methane capture in Oregon. Cascade encourages DEQ to ensure the regulations allow for natural gas utilities to utilize landfill gas as renewable natural gas for compliance to reduce GHG emissions for utility customers.
12. How to set limits for individual regulated entities within each sector. A cap or limit could be established either as an absolute mass-based amount in tons of emissions, or as an intensity-based measure of tons of emissions per unit of output or activity, such as a quantity goods or delivery of an amount of energy.
1 Cascade Natural Gas Corporation comments June 15, 2020, to Oregon Department of Energy on ODOE Preliminary Report to Governor on implementing EO 20-04 directives.
Cascade Natural Gas Corporation Comments on DEQ Prelim GHG Reduction EO Report to Governor Brown June 15, 2020 Page | 9 Cascade believes that the affected facility thresholds in DEQ’s recently finalized GHG emissions reporting rule may be the most appropriate threshold for identifying entities that would be regulated under cap and reduce. Cascade has not fully explored using an intensity-based measure for the natural gas suppliers. This limit approach could be evaluated within DEQ’s future workshops. Cascade does not have a specific baseline year to propose at this time but will review for future discussions with DEQ for determining how a baseline year would best be identified for natural gas distributors. Also, for DEQ’s question on mass emissions or intensity, Cascade will review and provide additional input to DEQ in a future stakeholder meeting.
13. Options to Avoid or Minimize Program Effects on Particular Communities and Economic Interests
Cascade Natural Gas serves about 75,000 customers, mainly in rural Oregon, in communities often challenged by higher rates of poverty. While we appreciate the need to regulate GHG emissions, we remain concerned the greatest impact of cap and reduce will be felt by those that can least afford it. Compounding this challenge is the fact that much of Cascade’s service area is in the central and eastern parts of the state that face much harsher winters than the more temperate western, coastal areas of Oregon. It will be essential safeguards are put into place to ensure rural Oregonians maintain consistent, reliable access to affordable energy, have access to the choice of fuel that best meets their needs, and are not penalized for utilizing the energy needed to maintain safety and comfort and to operate their businesses. It is important regionally based advocates for low income communities, low income weatherization agencies, and other key organizations are brought to the table to protect the state’s most vulnerable, and that those directly impacted by cap and reduce are able to express their needs and concerns. In closing, Cascade appreciates the opportunity to provide this initial input to DEQ on the agency’s plan for developing a cap and reduce regulation and looks forward to participating in future workshops and working with DEQ on this rulemaking. The reductions will be challenging to meet. To minimize costs to Oregonians, DEQ should include broad representation of stakeholders to gain input, provide discretion to the extent possible to explore and allow flexible compliance approaches, and provide consistent treatment of all utility sector emissions within the cap and reduce rule to avoid placing any industry at a competitive disadvantage. If you have any questions or would like to discuss these comments, please contact me at [email protected] or 701-222-7844. Sincerely, Abbie Krebsbach Director of Environmental Enclosure
Cascade Natural Gas Corporation Comments on DEQ Prelim GHG Reduction EO Report to Governor Brown June 15, 2020 Page | 10 cc: Cory Fong – Director of Governmental Affairs and Communication Scott Madison – Executive VP, Business Development & Gas Supply Mike Parvinen – Director of Regulatory Affairs
Alyn Spector – Manager, Energy Efficiency Policy Monica Cowlishaw – Manager, Energy Efficiency & Community Outreach
8113 W. GRANDRIDGE BLD, KENNEWICK, WA 99336-7166
TELEPHONE 509-734-4500 FACSIMILE 509-737-7166
www.cngc.com
Oregon Global Warming Commission
550 Capitol St. NE
Salem, OR 97301
Janine Benner
Director, Oregon Department of Energy
550 Capitol Street NE
Salem, Oregon 97301
Dear Director Benner and Members of the Oregon Global Warming Commission;
Cascade is pleased to submit comments regarding the Oregon Department of Energy (ODOE)’s
Implementation Report submitted to Governor Brown in May of 2020. This report was submitted
following Executive Order 20-04, directing State of Oregon agencies to take action to reduce and regulate
greenhouse gas emissions toward meeting reduction goals of at least 45 percent below 1990 emissions
levels by 2035 and at least 80 percent below 1990 levels by 2050. ODOE is tasked with pursuing
emissions reductions by establishing and updating standards for products to levels at least equivalent to
the most stringent standards among West Coast jurisdictions.
Cascade understands that ODOE will launch a rulemaking process this summer to establish new rules for
energy efficient products by September 1, 2020. In addition, ODOE plans to work with the Building
Codes Division (BCD) to adopt building efficiency goals for 2030 for new residential and commercial
construction. ODOE also plans to work with BCD to report on current progress toward achieving a goal
of at least 60 percent reduction in new building annual site energy consumption, and to develop metrics to
inform the baseline and reduction associated with code updates.
Finally, ODOE will work with the Oregon Department of Transportation, Department of Environmental
Quality, other state agencies, and utilities to conduct a statewide transportation electrification
infrastructure needs analysis to support transportation electrification goals.
Cascade looks forward to working with the Oregon Department of Energy to provide analysis and
feedback in support of pathways that meet the state’s GHG reduction objectives while maintaining
reliability and affordability for Oregon’s ratepayers. To begin this conversation, the Company offers the
following observations on the areas that will be addressed by ODOE in the coming months. We look
forward to developing these thoughts further, and remaining engaged as these discussions continue.
8113 W. GRANDRIDGE BLD, KENNEWICK, WA 99336-7166
TELEPHONE 509-734-4500 FACSIMILE 509-737-7166
www.cngc.com
Energy Efficient Product Rules
Cascade supports the work of ODOE in establishing and updating energy efficiency standards for
appliances. Cascade has a long history of promoting the use of high-efficiency commercial kitchen
equipment in its energy efficiency programs in Washington and supports similar programs and standards
in Oregon. Using natural gas directly for space, water heat, and cooking is the most efficient use of this
natural resource. Pairing the benefits of the direct use of natural gas with strong appliance efficiency
standards helps further strengthen the benefits of natural gas.
The Company appreciates ODOE’s desire to explore the development of new state standards to achieve
meaningful energy savings and GHG reductions where federal standards do not currently exist. It will be
important to ensure that transformative appliance standards are paired with coordinated market
engagement as this pathway is examined. This means making sure both qualifying electric and gas
equipment is available throughout the state, including in more rural communities by ensuring there are
available manufacturers and models in-state that meet the standards.
ODOE should also keep in mind that as more stringent energy efficiency rules take effect for appliances,
opportunities for energy efficiency incentives tend to narrow. This is because typically, under current
rules, energy efficiency rebates cannot be offered for equipment at code efficiency. If the equipment
standards raise, but the market is not able to rapidly adjust to these standards (older equipment still on
trucks, vendors slow on compliance with new standards) there will be a difference between technical
requirements and what is available to be physically installed in a home or building. To that end, ODOE
should work with the OPUC, Energy Trust, and local equipment vendors throughout Oregon to determine
if some additional market mechanisms and incentives would be reasonable if allowed for a certain
transitional period to support uptake of the new standard and ensure accessibility for small businesses and
those on fixed or limited incomes. This will be of particular importance for those impacted by COVID-19
and the current economic downturn.
Finally, Cascade encourages ODOE to examine more stringent appliance standards for both gas and
electric equipment, keeping in mind the source efficiency benefits of using natural gas directly for space,
water heat, and cooking as baselines are set for equipment utilizing this fuel source. Different fuels and
technologies have varied benefits when serving different end uses. Therefore, ensuring there’s a broad
range of efficient equipment for both gas and electric applications provides customers options to meet
their needs with the best tools for the job.
Building Efficiency Goals and Metrics
As a proud member of the Northwest Energy Efficiency Alliance (NEEA), Cascade recognizes the power
of energy efficiency and market transformation to drive meaningful carbon reductions. The Company
agrees with ODOE that energy efficiency is the cleanest, least expensive resource for reducing GHG
emissions.
Cascade has worked closely over the last decade with the Energy Trust of Oregon to support robust
energy efficiency efforts for all core ratepayers. We encourage continued innovation and partnership
8113 W. GRANDRIDGE BLD, KENNEWICK, WA 99336-7166
TELEPHONE 509-734-4500 FACSIMILE 509-737-7166
www.cngc.com
between ODOE and the Energy Trust to identify ways to achieve deeper energy efficiency opportunities
for natural gas customers, particularly those on fixed and limited incomes. Cascade also encourages
partnership between ODOE and Energy Trust where appropriate to support the expansion of building
efficiency programs to serve natural gas transport customers, where funds are available for this purpose.
In its Implementation Report, ODOE notes resilience as an important consideration when looking at ways
to meet the objectives of the Governor’s Executive Order, and that as Oregon moves to address GHG
emissions, it’s important that the state also maintains a strong focus on reliable, affordable energy.
Cascade wholeheartedly agrees. Ensuring that energy remains both affordable and reliable will be
essential as plans move forward. Continued diversification of fuel sources will help ensure flexibility and
support for the addition of renewable resources.
Cascade notes in the ODOE report that the goal is to achieve a 60 percent reduction in new building
annual site consumption of energy, excluding electricity used for transportation or appliances. However, it
is unclear if natural gas appliances use will likewise be excluded from the 60% new buildings. Electric
equipment utilized in Oregon has both varying source and site efficiencies depending on the fuel mix
utilized to generate electricity, and the efficiency level of the equipment used in the building (adjusting
for line losses). A blanket exclusion for the consumption of electric appliances in new buildings could
result in unintended increases to overall GHG emissions where natural gas equipment could have resulted
in overall lower emissions. Therefore, it’s important that energy consumption is treated equitably
regardless of fuel type and that full fuel cycle is taken into consideration.
Cascade looks forward to supporting ODOE’s efforts to help keep Oregon’s energy sector resilient and
affordable while the state transitions to a low carbon future. This includes diversifying our energy
resources through low carbon fuels like renewable natural gas and using our existing gas resources paired
with support technologies like solar assisted gas water heating to lower GHG impacts. We welcome the
opportunity to provide ODOE the information it needs to help Oregonians make informed decisions about
energy and to facilitate the adoption of technologies that reduce GHG emissions.
ODOE and Building Codes
Cascade recognizes the importance of well-designed energy code that encourages deeper energy savings
in homes and buildings throughout the state. This is achieved through a careful assessment of the GHG
intensity of electricity and natural gas based on the existing fuel mix used for generation and a consistent
approach to upstream emissions assessment regardless of fuel type or technology.
Cascade appreciates that ODOE staff recognizes the importance of stakeholder engagement to the
implementation of energy efficiency goals in the buildings sector. We are particularly interested in
participating in any public process associated with the Executive Order 20-04 directive for ODOE to
contract with a third-party consulting firm to assess cost implications, including long-term energy cost
savings, of the energy efficiency and building code actions set forth in paragraph 6 A-B.
8113 W. GRANDRIDGE BLD, KENNEWICK, WA 99336-7166
TELEPHONE 509-734-4500 FACSIMILE 509-737-7166
www.cngc.com
Cascade notes Section 6C of the EO directs ODOE to work with BCD to come to agreement on metrics,
based on best practice and academic research, to inform the baseline and reductions associated with code
updates. We believe this process should be undertaken with maximum opportunity for the public to
engage and to ensure that baselines are developed with transparent real-time GHG assumptions for the
gas and electric sector as they are today, rather than based on future projections or aspirational numbers.
Cascade looks forward to working alongside others in the community in support of helping ODOE and
BCD’s development modeling methodology and example code components for prototypes that reflect
increases in efficiency before actual measures are considered for code.
Transportation Goals
Cascade looks forward to working with ODOE, DOT, and DEQ to identify opportunities to integrate
natural gas fueling technologies as part of its Every Mile Counts work plan. While robust incentives have
been identified for the electric vehicle sector, Cascade encourages ODOE and the other departments
involved in this effort to consider similar incentives for adoption of NGVs, especially in the medium- and
heavy-duty sector.
Low Income Considerations
Energy affordability is essential to maintaining the health and wellbeing of all Oregonians, particularly
those from traditionally underserved populations, and individuals on fixed or limited incomes. Cascade
applauds ODOE’s commitment to looking at ways to integrate programs that reduce energy burden and
protect low income ratepayers while meeting the objectives of Executive Order 20-04. Of particular
interest to the Company are ways we can work with ODOE and OPUC to expand low income offerings or
engage in pilots that reduce low income energy burden and support deeper energy efficiency
opportunities.
Optimal energy efficiency opportunities for low income households:
- minimize out-of-pocket costs associated with work performed;
- offer loan products only where both energy and bill savings is sufficient to fully offset increased
monthly costs to the homeowners, and other funding opportunities are unavailable;
- assess the economic “trigger point” at which any participant’s benefits are outweighed by their
out of pocket costs; and
- identify additional direct and indirect benefits that would result in improved quality of life for a
program participant such as increased health, reduced sick-days, increased ability to spend funds
on other necessities and discretionary needs.
Cascade looks forward to partnering with Oregon Housing and Community Services (OHCS), our
regulators, and partner agencies that serve low income natural gas customers to identify innovations in
energy auditing, program valuation, and energy conservation measures for weatherization and other
efficiency services for qualified households.
8113 W. GRANDRIDGE BLD, KENNEWICK, WA 99336-7166
TELEPHONE 509-734-4500 FACSIMILE 509-737-7166
www.cngc.com
Renewable Natural Gas
In 2018, Cascade participated in the SB 334 committee associated with ODOE’s Biogas and Renewable
Natural Gas (RNG) Inventory. This report assessed the technical potential to convert waste streams
biogas and RNG. These efforts contributed to the successful passage of SB 98 during the 2019 Legislative
Session, providing for cost-recovery of RNG investments. Cascade looks forward to continuing to work
with ODOE, the OPUC, and local municipalities to support the integration of RNG into the state’s fuel
mix.
Cascade encourages ODOE’s continued research and analysis on RNG, hydrogen, and power-to-gas
technologies. We also support ODOE’s recommendation for a state grant program to improve community
energy resilience and recommend the inclusion of a diverse range of fuel sources including RNG.
Thank you again for the opportunity to submit comment regarding ODOE’s Implementation Report. We
believe that natural gas has a continued role to play in Oregon’s energy future and look forward to
working with ODOE towards continued innovation and to make best use of our essential natural resources
while reducing GHG impacts.
Sincerely,
Alyn Spector
Manager, Energy Efficiency Policy
Cascade Natural Gas Corporation
1
June 15, 2020
Oregon Department of Environmental Quality
Office of Greenhouse Gas Programs
700 NE Multnomah St. Suite 600
Portland, OR 97232
[email protected] Submitted via Email
cc: Kristen Sheeran, Nik Blosser, Richard Whitman,
Re: Comments by Climate Solutions, Oregon Environmental Council (OEC), Natural Resources
Defense Council (NRDC), and Environmental Defense Fund (EDF) on the Program Options to Cap
and Reduce Greenhouse Gas Emissions, Preliminary Report (“Cap and Reduce Report”)
Climate Solutions, OEC, NRDC, and EDF submit the following comments on the Oregon Department of
Environmental Quality’s (“DEQ”) “Preliminary Report: Program Options to Cap and Reduce Greenhouse
Gas Emissions.” Through Governor Brown’s Executive Order No. 20-04, Oregon has made a nationally
leading commitment to comprehensive climate action. Now, that commitment must be translated into a
portfolio of programs that is capable of delivering emission reductions from across the economy at the
needed scale and pace—and, critically, that will guarantee those results. Securing major climate pollution
reductions across the economy, creating high quality jobs, and promoting a just and equitable transition to
clean energy that centers frontline and most impacted communities to benefit from this transition should
serve as the foundation for the cap and reduce program developed under Oregon’s existing authority to
regulate greenhouse gas pollution.
The Environmental Quality Commission (EQC) can and should adopt a cap and reduce program that is
crafted to ensure state emissions reduction targets are met, and that ensures the benefits of climate action
are equitably distributed to Oregon communities that are most burdened by air pollution and systemic
environmental and social inequities, while also providing a powerful and replicable template for state-
level climate leadership.
Accordingly, our core recommendation to DEQ is to ensure that the final report provides for the
full scoping of various regulatory options—including comprehensive coverage—that will enable the
most effective, efficient, and equitable outcomes. With the public process just beginning, it is far too
early to take program design options that can deliver on those objectives off the table.
Our comments focus on four core areas: 1) calibrating the cap and reduce program to the proper level of
ambition, 2) appropriate scoping of program coverage, 3) scoping opportunities to advance mitigation
priorities, and 4) process considerations.
In addition, we also strongly encourage DEQ to incorporate the general directives of EO 20-04 into each
of its proposed implementation strategies and to develop a more holistic strategy for administering all of
2
the EO requirements. A lack of a cohesive strategy could result in regulatory gaps and missed
opportunities to take advantage of complementary program benefits.
The most overt regulatory gap is the absence of any strategy for DEQ to implement or even consider the
general directives that apply to all state agencies that are named in the EO. Specifically, EO 20-04
requires all named state agencies to:
1. Exercise any and all authority and discretion vested in them by law to help facilitate
Oregon’s achievement of the GHG emissions reduction goals;
2. Prioritize and expedite any processes and procedures that could accelerate reductions in
GHG emissions to the fullest extent allowed by law;
3. Consider and integrate climate change, its impacts, and the state’s GHG emissions
reductions goals into all planning, budgets, investments and policy making decisions to
the fullest extent allowable by law.
The agency’s separate initial reports regarding its preliminary implementation plans for each of its
specific directives (i.e., cap and reduce, clean fuels, landfill emissions, etc.) provide no indication of how
it intends to implement these general directives or incorporate them into its implementation strategies.
Integrating these general directives into the cap and reduce program would bolster DEQ’s ability to
accelerate emissions reductions and design an ambitious cap. Specifically, the general directives require
DEQ to “prioritize and expedite any processes and procedures that could accelerate reductions in GHG
emissions to the fullest extent allowed by law.” These directives thus empower DEQ to design a program
that would set a stringent cap that would lower quickly in the near term. They also instruct DEQ to make
full use of existing legal authority to regulate sources, in line with the statutory policy to “restore and
maintain the quality of the air resources of the state in a condition as free from air pollution as is
practicable, consistent with the overall public welfare of the state.”1 DEQ should therefore not only
follow the general directives as required under the EO; it should use the general directives to help it
develop the most comprehensive and effective regulatory programs possible.
We encourage DEQ to follow the lead of the Oregon Public Utility Commission (PUC). In the PUC’s
draft implementation report, the agency acknowledges its obligations to follow the same general
directives that apply to DEQ and a set of specific directives that apply only to the PUC. The PUC’s report
then integrates both the general and specific directives into a holistic proposal for complying with the EO.
I. The cap and reduce regulations should backstop Oregon’s greenhouse gas reduction goals,
guaranteeing that science-based emission reduction goals are achieved.
Governor Brown’s Executive Order sets clear emissions reduction targets of reducing climate pollution at
least 45% below 1990 levels by 2035, and 80% below 1990 levels by 2050. The order also directs the
DEQ to take actions necessary to cap and reduce emissions from large stationary sources, transportation,
and other liquid and gaseous fuels, consistent with the EO’s science-based emissions reduction
targets. Additionally, the EO directs agencies to exercise any and all authority and discretion vested in
them by law to help facilitate Oregon’s achievement of the emission reduction goals. This final directive
1 ORS 468A.010(1)(a).
3
is a key touchstone, as it explicitly requires DEQ to exercise its full authority to achieve the required
emission reductions.
In DEQ’s call for comments, DEQ invites comment on both process and key policy questions,
particularly in terms of how to frame these questions for the scoping and public engagement process. It is
critical that DEQ fully examines cap and reduce program options that are efficient, effective,
equitable, and allow the program to serve as a guarantee that reductions occur at the pace and
scale needed to meet the emission reduction targets. It is very challenging to provide certainty around
emission reduction outcomes without crafting a policy specifically designed to achieve that certainty. The
Executive Order is a model because of its scope and ambition—and it is critical that in addition to the
portfolio of programs, policies, and initiatives designed to catalyze deployment of clean technologies and
further resilience and adaptation, there is a regulatory backstop that can guarantee the necessary
reductions to meet Oregon’s goals. Because the DEQ is the expert state agency with the responsibility and
authority to assure reductions in air contaminants, it is critical that the cap and reduce regulatory
program achieves the targets. Complementary actions by other agencies should be considered as the
DEQ crafts its rules and regulations, but DEQ should assume primary responsibility for scoping and
crafting a regulatory framework to assure the pollution reduction outcomes are achieved.
II. The Cap and Reduce program should aim for broad coverage of sources and sectors to enable
higher ambition
DEQ should pursue the development of a multi-sector regulatory approach, guided by the broadly
supported principles of the Renew Oregon coalition. These principles include: ensuring major climate
pollution reduction across the economy, environmental integrity, creation of high quality jobs, and
ensuring a just and equitable transition to clean energy that centers frontline and most impacted
communities to benefit from this transition. There are a variety of ways to achieve these outcomes
including the use of well-designed market-based mechanisms. This will require DEQ to present to the
public and fully consider program designs that can unlock greater levels of efficiency and ambition by
covering the broadest set of sources.
a. DEQ can and should include the emissions associated with imported electricity
within the cap and reduce program.
If Oregon power companies are supplying power to their customers that is causing pollution to be emitted
elsewhere, these companies can be regulated as “air contamination sources,” meaning “any source at,
from, or by reason of which there is emitted into the atmosphere any air contaminant, regardless of who
the person may be who owns or operates the building, premises or other property in, at or on which such
source is located, or the facility, equipment or other property by which the emission is caused or from
which the emission comes.”2 DEQ has interpreted this statutory directive in the preliminary report,
outlining that “the legislature expected the EQC to address as air contamination sources both specific
buildings and premises that emit air pollution, and facilities, equipment or other property that cause air
pollution.” The DEQ does not offer any reason that activities that cause emissions upstream of the point
2 Id. § 468A.005(4) (emphasis added).
4
of regulation would fall beyond the EQC’s regulatory authority, which clearly encompasses activities that
cause emissions downstream of the point of regulation.
The EQC is well-within its legal authority to impose an allowance-holding requirement on electricity
suppliers, which qualify as “air contamination sources” under DEQ’s interpretation of the statute as
entities “by reason of which” emissions occur when the electricity they supply is generated (both in and
outside of Oregon). DEQ nonetheless posits that the EQC likely “does not have authority to regulate
emissions that occur outside of Oregon.”3 Remarkably, DEQ derives this limitation from the EQC’s broad
authority to establish air quality standards and emission standards:
The commission may establish air quality standards including emission standards for the entire state
or an area of the state. The standards shall set forth the maximum amount of air pollution permissible
in various categories of air contaminants and may differentiate between different areas of the state,
different air contaminants and different air contamination sources or classes thereof.4
DEQ reads this provision as only authorizing the EQC to promulgate regulations “‘for the . . . state,’
which DEQ interprets to mean the emissions must occur in the state.” The plain language, however,
militates against DEQ’s conclusion.
The text of the statute does not state that only emissions occurring within Oregon’s borders could be
subject to regulation by the EQC. Rather, the text simply delineates between the regulatory design
options of establishing emission standards for a smaller geographic area (i.e., in certain areas) and more
broadly (i.e., statewide). This does not prevent the EQC from accounting for emissions that occur
elsewhere when designing regulations “for the entire state.”5
The key issues for the EQC’s regulatory authority are whether the source--an entity by reason of which
there is an emission--is located in Oregon, and whether the regulation in question is helping protect
Oregonians from dangerous air pollution. Those criteria will be satisfied by requiring entities importing
electricity into Oregon from out of state to account for the emissions caused by the generation of the
electricity. Those emissions are occurring “by reason of” the importers’ purchase of the electricity to
serve customers in Oregon, and those greenhouse gas emissions exacerbate climate change and thereby
harm Oregonians and Oregon’s air quality. These sources of emissions, and all of the emissions that they
cause, should be included in DEQ’s scoping of regulatory design if it is to align with the statutory policy
to “restore and maintain the quality of the air resources of the state in a condition as free from air
pollution as is practicable, consistent with the overall public welfare of the state.”6.
b. Even if Oregon does not regulate emissions from imported power, it must
regulate emissions from in-state electricity generation under a cap.
3 DEQ preliminary report at 6. 4 ORS 468A.025(3). 5 Indeed, the EQC’s air quality standards—which are authorized along with emission standards in section
468A.025(3)—would likely require sufficient action to reduce air pollution to safe levels, regardless of whether the
emissions leading to the air pollution occurred in Oregon or elsewhere. 6 ORS 468A.010(1)(a).
5
The Governor’s Executive Order is clear: DEQ must use the full authority it possesses under the law to
achieve Oregon’s greenhouse gas reduction targets. It would contravene this directive to refuse to apply
mandatory emission reduction requirements to power plants, a significant source of greenhouse gas
emissions. These sources must be included under a cap that will ensure the needed greenhouse gas
reductions are achieved. We would strongly encourage the DEQ to revisit the conclusion in the
preliminary report that “other programmatic approaches are likely to be more appropriate and effective in
this area” and support full public engagement on the inclusion of in-state electricity generation under a
cap.
In addition, the electricity sector provides some of the most cost-effective opportunities for emissions
reductions, which is critical for smoothing the transition to a clean economy for all sectors. Moreover,
these sources emit not only greenhouse gases but also other harmful pollutants affecting Oregonians’
health– and it is critical that these sources are subject to an enforceable limit, that declines over time, that
will also help drive critical reductions in co-pollutants. Existing gas power plants in Oregon contribute to
air quality concerns7, affecting the health of local communities, in addition to the damage from pollution
associated with upstream production and distribution. While there are other policy tools available for the
state to continue to catalyze the transition to clean electricity—and we support moving expeditiously
forward on multiple fronts—none offer a suitable substitute for limiting pollution from in-state power
sector generation facilities as ensuring that they are subject to applicable greenhouse gas limits.
The DEQ posited that “if the EQC were to regulate the emissions from electric generation in Oregon, it
very likely that energy suppliers…would simply (over time) shift their resource utilization out of state”
and further notes that “this form of leakage is a major policy issue in program design, particularly in the
electricity sector.” This unsupported conclusion about leakage is counter to empirical evidence from
across the country, specifically the experience of states in the Regional Greenhouse Gas Initiative
(RGGI), where state regulations currently cap emissions only from in-state power sector generation. The
RGGI region primarily covers states that operate in competitive wholesale markets—where the potential
leakage pressures are even more acute than in states with vertically-integrated electric providers and only
a day-ahead market, such as Oregon.
The RGGI program has been highly successful across a number of key metrics—including securing
important carbon reductions while producing significant net economic benefits. RGGI, Inc. has issued
nine annual monitoring reports, summarizing data from between 2005 and most recently 2017. While
imports into the RGGI region have fluctuated over the years, “the observed trends in electricity demand,
electricity generation, and net electricity imports show there has been a small decrease in CO2 emissions
from total non-RGGI electric generation serving load in the nine-state RGGI region during the period of
2015 to 2017 and during the 2017 calendar year when compared to the base period”8. This decrease in
emissions from generators outside of RGGI serving load within RGGI demonstrates that greenhouse gas
7 Wright, Phil. “PGE seeks permit to increase pollution at Carty Plant.” East Oregonian, February 20, 2018.
Available at: https://www.eastoregonian.com/news/local/pge-seeks-permit-to-increase-pollution-at-carty-
plant/article_3c2604ed-4b96-5960-b4bf-51fb009b21d7.html 8 The Regional Greenhouse Gas Initiative, “CO2 Emissions from Electricity Generation and Imports in the Regional
Greenhouse Gas Initiative: 2017 Monitoring Report,” Nov. 2019, Pg. 3. Available at
https://www.rggi.org/sites/default/files/Uploads/Electricity-Monitoring-Reports/2017_Elec_Monitoring_Report.pdf.
(emphasis added).
6
emissions achieved within the RGGI states have not been achieved by shifting generation and emissions
out of RGGI.
Further, Resources for the Future (RFF) has shown in multiple analyses that an output-based allowance
allocation to in-state generators in the power sector has the potential to mitigate leakage—most recently
demonstrating the ability for such an allocation methodology to result in negative leakage in
Pennsylvania. (RFF has also demonstrated how output-based allocation can be used to mitigate emissions
leakage in Oregon’s industrial sector.) Virginia regulators recently adopted an output-based allocation
methodology in their 2019 regulation capping power sector carbon pollution, noting that the owners of
generation in Virginia are unlikely to face any competitive disadvantage relative to plants outside the state
“because of the use of updating-output based allocation,” as well as the ongoing efforts – and program
design elements—geared towards encouraging the reduction of in-state demand.9 In addition, EDF and
MJ Bradley and Associates released modeling in late 2019 specifically assessing the effects of capping
instate emissions in various states in the PJM Interconnection and the role of leakage. While capping
imported power improved the environmental performance of the policies, under no circumstances did
the disbenefit of emissions leakage dwarf the benefit of capping those in-state power sector sources.
Finally, Oregon has strong clean energy policies in place—and continued investment in energy efficiency
and in-state renewable energy development has been touted by regulators from Maine to Virginia as
effective tools to help mitigate any potential leakage effects in the power sector resulting from a cap on
in-state generation. It is reasonable to expect Oregon’s electric utilities—which own a significant
percentage of in-state generating capacity10— would not only continue to collaborate with regulators at
the Oregon PUC on efforts to deploy clean energy solutions, but also would not pursue strategies to close
existing assets and build or contract with new ones outside the state, particularly given corporate
commitments from major utilities to decarbonization, .
We urge DEQ to revisit this unsubstantiated conclusion, review modeling and policy design options
from across the country, and pursue the strategy that now eleven other states have adopted: a
strong cap on power sector emissions, along with ongoing complementary policies at the PUC to drive
investment in efficiency and in-state clean energy deployment. Under the executive order, Oregon can
continue to adapt its complementary policy framework to mitigate leakage risk—including requiring
customers who bypass the local distribution companies to meet clean energy goals.
III. DEQ should evaluate policy design options that ensure the value inherent in a market-based
regulatory program is used to further climate pollution mitigation for the benefit of Oregonians
a. The DEQ should carefully consider allowance distribution options that further
climate mitigation objectives and achieve just and equitable outcomes.
9 Virginia DEQ, “Proposed Regulation Agency Background Document,” Revised Proposed Stage, Regulation for
Emissions Trading (9 VAC5-140), December 27, 2018, available at
http://www.townhall.virginia.gov/L/ViewStage.cfm?stageid=8476. 10 Portland General Electric provides information about the capacity of their in-state, wholly-owned or jointly-
owned plants here: https://www.portlandgeneral.com/our-company/energy-strategy/how-we-generate-electricity
7
The allocation of compliance instruments bears significantly on how the costs and benefits of the cap and
reduce program are distributed—allowances and allowance value can and should be distributed to address
equity and align the distribution of value with broadly-supported Renew Oregon principles described
above. In presenting program options, in addition to examining allocation to regulated entities, DEQ
should outline options for providing allowances to non-government, non-regulated entities who can use
allowance value to further program and statutory objectives. These entities would receive revenue by
consigning their allowances to auction. Further, DEQ must also ensure that any direct allocation to
covered entities avoids windfalls, which can occur when industries are able to profitably pass through the
cost of surrendering allowance value to consumers. In short, program value must be used to advance,
and not frustrate, just and equitable mitigation priorities.
Such allowance allocation strategies could include, but are not limited to:
• Distribution to utilities with requirements to use allowance value for the exclusive benefit
of ratepayers while furthering GHG mitigation, including through beneficial electrification
investments.
• Distribution to EITEs that are employing best available emission control and energy
efficiency technologies and practices, based on actual need supported by data and third-
party review, and consistent with what other states have demonstrated is necessary for
avoiding emissions and economic leakage.
• Distribution to Tribes and other non-regulated entities to support projects that will further
program and statutory goals, including by reducing emissions.
Allowances allocated to non-regulated sources could automatically be consigned to auction, ensuring that
the allowances are available to regulated sources and that the value of the allowances can be directed to
facilitate greater emission reductions and otherwise support the effectiveness of the emission reduction
program. Revenue from the sale of allowances would flow directly back to the entity that received the
allocation, and be used to further progress towards Oregon’s emission reduction goals in a more equitable
way, meeting the twin goals of the EO: strong climate action and benefits for impacted communities
across the state, and furthering the statutory policy to “restore and maintain the quality of the air resources
of the state in a condition as free from air pollution as is practicable, consistent with the overall public
welfare of the state.”11 DEQ should evaluate strategies that align opportunities for reinvestment with
community priorities— past legislative versions of cap and invest had prioritized supporting mitigation
strategies for Tribes, impacted communities, and for natural and working lands. Examples of allocation
recipients to consider include, but are not limited to: renewable energy projects, energy efficiency
projects, or electric vehicle infrastructure and subsidies; emission reducing or sequestering agricultural or
forestry practices; job training programs for constructing zero-emission buildings; and incentives or
infrastructure to promote clean mobility in disproportionately impacted and frontline communities around
the state.
Regulators should present multiple options to stakeholders, and each should ensure that the regulation is
able to capture the value inherent in a greenhouse gas mitigation program that constrains the right to emit
for the benefit of Oregonians and ensure that value is directed in a manner that benefits Oregonians and
11 ORS 468A.010(1)(a).
8
furthers the statutory purposes. There is no right to pollute for free in Oregon. We will oppose any
allocation that fails to adequately guard against providing a windfall to regulated entities.
b. DEQ should examine other established program design elements that can
provide additional benefits to Oregonians.
Alongside cost containment features, the DEQ should examine program design options such as an
emissions containment reserve that will ensure the program continuously provides a strong economic
incentive to secure emission reductions required to achieve the EO’s climate targets. As experience with
other programs has shown, the significant uncertainty in predicting business-as-usual emissions for
covered sectors makes cap setting challenging in the absence of periodic reviews. The DEQ should
examine policy design elements that can avoid these pitfalls by providing certainty and transparency
regarding any cap adjustments. The EQC should strongly consider imposing a price floor for any
allowance auctions, consignment or otherwise, that are included in the program. An allowance price floor
provides certainty to businesses and entrepreneurs investing in emission reduction technologies and
strategies, ensuring that there is a consistent incentive for innovation and low-carbon investment. Under
an allowance distribution system, the EQC can also ensure regulatory stability and price certainty by
creating a cost containment reserve that sets aside allowances from future years and makes them available
in the event of unexpected and excessive allowance price increases.
Further, if practicable, deploying regulatory options that are compatible with programs in other states is
consistent with EQC’s obligation to regulate air pollution to achieve the greatest emission reductions
“practicable, consistent with the overall public welfare of the state,” 12 providing the enhanced flexibility
and broader coverage that will enable more efficient, ambitious, and ultimately effective, policy design.
Therefore, DEQ should examine policy choices with an eye towards keeping the opportunity for
collaboration available, especially as states such as New Mexico and Nevada begin work on climate
strategies and twelve states across the Northeast and Mid-Atlantic converge around recommendations for
a program to cap and reduce emissions from fuel suppliers.
IV. Key Process Considerations
DEQ must ensure the program prioritizes the needs and interests of impacted communities. Tribes,
communities of color, low-income communities, and other urban, rural, and coastal impacted
communities around Oregon are on the frontlines of climate change and experiencing the impacts of
climate change first and worst. These communities are also often disproportionately harmed by toxic air
pollution from industrial operations, cars, trucks, and the burning of fossil fuels for energy – many of the
same pollution sources to be regulated under the cap and reduce program. As a result, it is critical that the
program centers frontline and most impacted communities by ensuring representatives of these
communities are at the decision-making table as the cap and reduce program is developed, and that cap
and reduce program options and outcomes maximize the benefits for, and prioritize the needs and
interests of, these most impacted communities.
12 ORS 468A.010(1)(a).
9
For a more detailed discussion on process considerations, we would direct the agency to comments
submitted by the Renew Oregon coalition.
Conclusion
Securing a multi-sector cap and reduce framework in Oregon that places an enforceable limit on climate
pollution consistent with the scale of the challenge will get Oregon’s greenhouse gas emissions back on
track, spur innovation and create jobs, provide cleaner air, invest in communities, and provide a powerful
template for what state level climate leadership can achieve. If we create a successful program with strong
environmental integrity and equitable outcomes, it will demonstrate a clear and replicable path forward
for other states who need to get serious, fast, about delivering real reductions on a near-term timeline.
Taking critical program design options off the table before the public process has begun and a full vetting
can occur, based on available empirical data and the lessons learned from similar programs, needlessly
precludes that opportunity.
We look forward to working with DEQ to scope and shape a successful program. Thank you for
considering these comments.
Respectfully submitted,
Meredith Connolly, Oregon Director
Climate Solutions
Pam Kiely, Senior Director of Regulatory Strategy U.S. Climate
Environmental Defense Fund
Alex Jackson, Senior Attorney, Climate and Clean Energy Program
Natural Resources Defense Council
Jana Gastellum, Deputy Director for Programs
Oregon Environmental Council
Response to DEQ Initial Report, EO 20-04
Date 15 June 2020
TO: Greenhouse Gas Emissions Cap and Reduce Program Development Office
RE: Program Options to Cap and Reduce Greenhouse Gas Emissions, Preliminary Report
Submitted to: The Office of Governor Kate Brown By: Oregon Department of Environmental
Quality May 2020
By How Much Do Clean Fuels Reduce GHG Emission?
Clean fuels are highlighted in EO 20-04 as an asset for greenhouse gas (GHG) emission
reduction. The clean fuels metric, Carbon Intensity, quantifies the amount of carbon per unit
measurement of energy in any carbon fuel, including biofuels. This metric has lower
numbers for biofuels, since the amount of life cycle carbon used to produce this fuel is
relatively lower than that used for fossil fuels (diesel, gasoline, fossil gas). The result is a
cleaner carbon fuel.
The clean fuels concept originated in California, was developed from AB32 revenues,
requires ongoing funding to create, track and market offset credits, and succeeds in reducing
the demand for fossil fuels when blended with fossil fuels. Biodiesel and ethanol are
examples.
Oregon’s EO 20-04 also calls for a GHG cap and a schedule of GHG reductions. A different
metric is used to quantify mass carbon emissions: metric tons of CO2 per gallon of fuel.
This characteristic applies equally to fossil fuels and biofuels. We believe the GHG
emissions from any blend of biofuel are non-zero, and comparable to those from fossil fuel.
A question stemming from the EO is obvious: How can Oregon reduce GHG emissions by
advancing cleaner carbon fuels? Can a carbon fuel be employed to reduce carbon emissions?
If so, how significant is the reduction? This leads to a STEM question for DEQ: How is
Carbon Intensity to be computed as a mass carbon reduction? A response seems essential in
reaching science-based goals set by the GHG EO.
Submittal prepared by:
Tracy Farwell, Engineers for a Sustainable Future, Action Committee
Support for EO 20-04
Risk AssessmentComputing Carbon Reduction RatesImportant Program Standards
Tracy Farwell Engineers for a Sustainable Future, Action Committee
22 May 2020 http://esf-oregon.org/doku.php 1
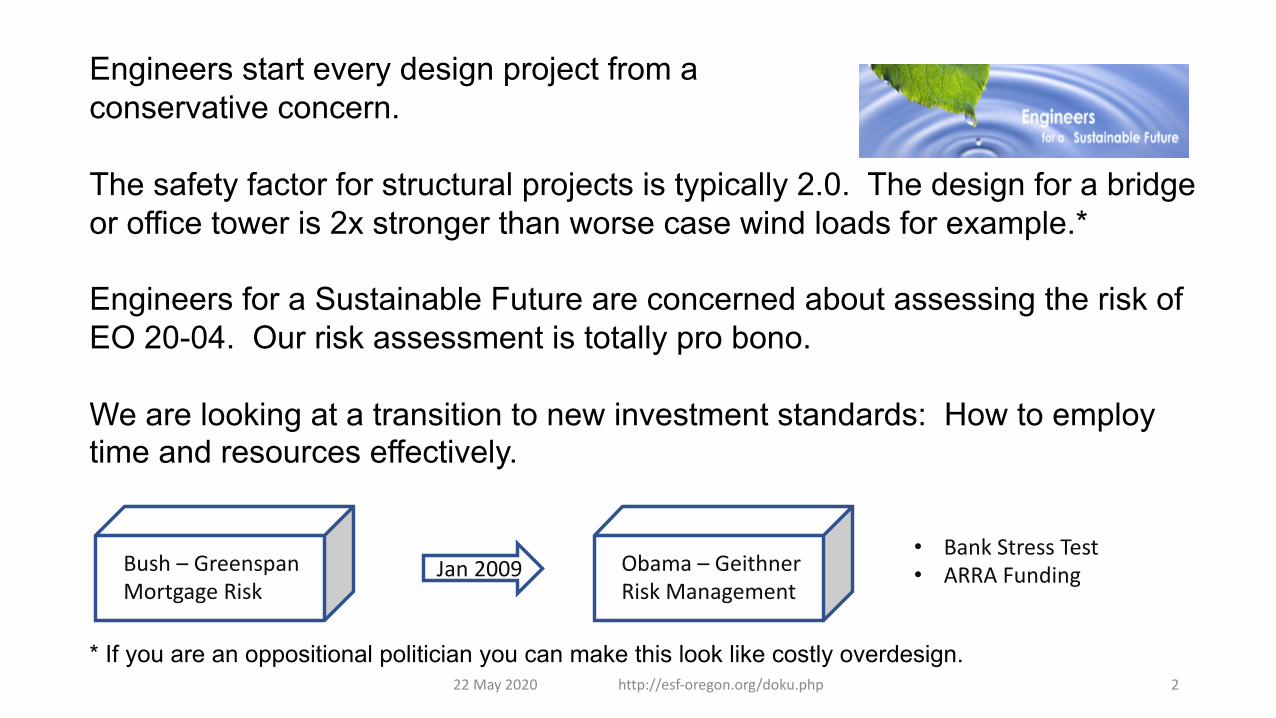
Engineers start every design project from a conservative concern.
The safety factor for structural projects is typically 2.0. The design for a bridge or office tower is 2x stronger than worse case wind loads for example.*
Engineers for a Sustainable Future are concerned about assessing the risk of EO 20-04. Our risk assessment is totally pro bono.
We are looking at a transition to new investment standards: How to employ time and resources effectively.
Bush – GreenspanMortgage Risk
Obama – GeithnerRisk Management
Jan 2009• Bank Stress Test• ARRA Funding
* If you are an oppositional politician you can make this look like costly overdesign.22 May 2020 http://esf-oregon.org/doku.php 2
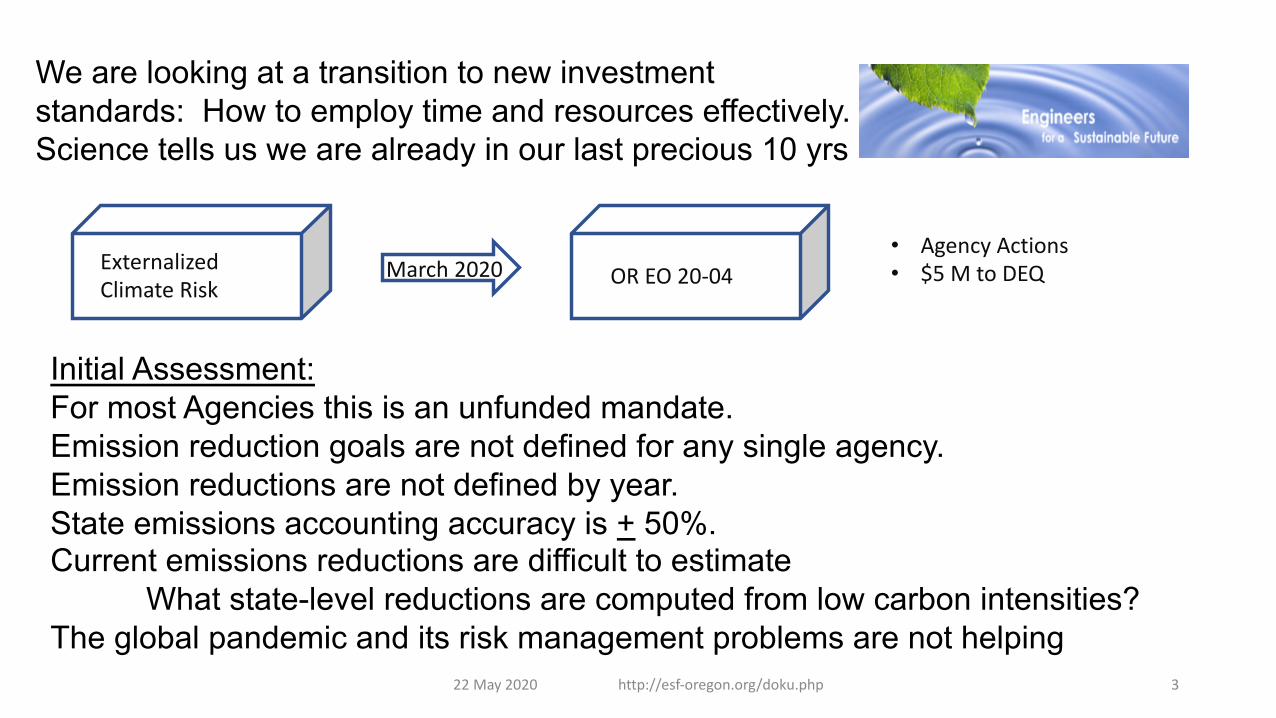
We are looking at a transition to new investment standards: How to employ time and resources effectively.Science tells us we are already in our last precious 10 yrs
Externalized Climate Risk OR EO 20-04March 2020
• Agency Actions• $5 M to DEQ
Initial Assessment:For most Agencies this is an unfunded mandate.Emission reduction goals are not defined for any single agency.Emission reductions are not defined by year.State emissions accounting accuracy is + 50%.Current emissions reductions are difficult to estimate
What state-level reductions are computed from low carbon intensities?The global pandemic and its risk management problems are not helping
22 May 2020 http://esf-oregon.org/doku.php 3
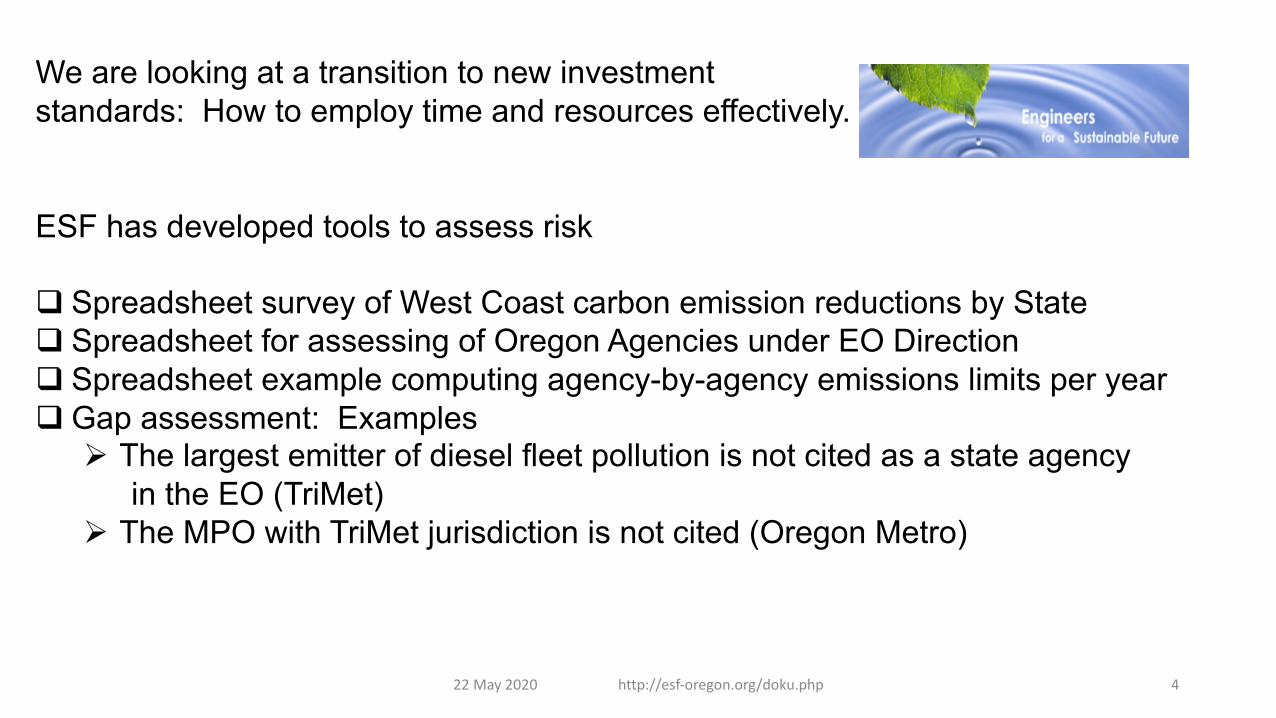
We are looking at a transition to new investment standards: How to employ time and resources effectively.
ESF has developed tools to assess risk
q Spreadsheet survey of West Coast carbon emission reductions by Stateq Spreadsheet for assessing of Oregon Agencies under EO Directionq Spreadsheet example computing agency-by-agency emissions limits per yearq Gap assessment: Examples
Ø The largest emitter of diesel fleet pollution is not cited as a state agency in the EO (TriMet)
Ø The MPO with TriMet jurisdiction is not cited (Oregon Metro)
22 May 2020 http://esf-oregon.org/doku.php 4
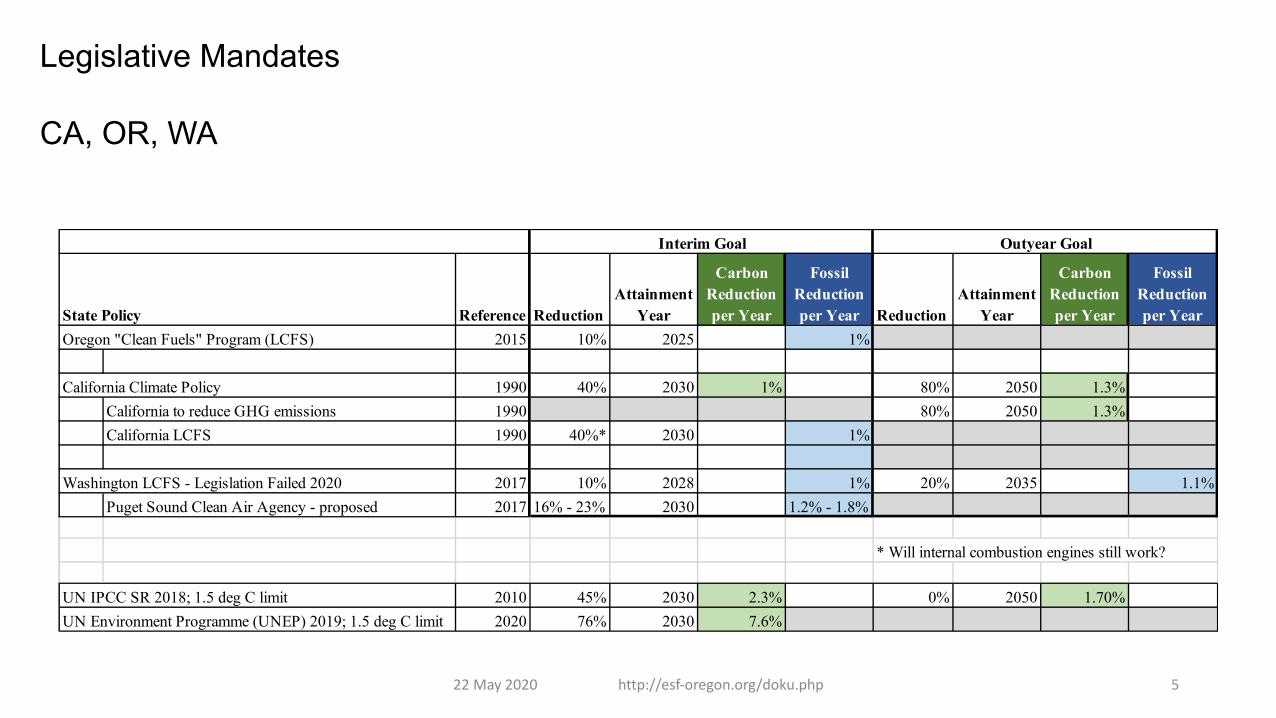
State Policy Reference ReductionAttainment
Year
Carbon Reduction per Year
Fossil Reduction per Year Reduction
Attainment Year
Carbon Reduction per Year
Fossil Reduction per Year
Oregon "Clean Fuels" Program (LCFS) 2015 10% 2025 1%
California Climate Policy 1990 40% 2030 1% 80% 2050 1.3%California to reduce GHG emissions 1990 80% 2050 1.3%California LCFS 1990 40%* 2030 1%
Washington LCFS - Legislation Failed 2020 2017 10% 2028 1% 20% 2035 1.1%Puget Sound Clean Air Agency - proposed 2017 16% - 23% 2030 1.2% - 1.8%
* Will internal combustion engines still work?
UN IPCC SR 2018; 1.5 deg C limit 2010 45% 2030 2.3% 0% 2050 1.70%UN Environment Programme (UNEP) 2019; 1.5 deg C limit 2020 76% 2030 7.6%
Interim Goal Outyear Goal
Legislative Mandates
CA, OR, WA
22 May 2020 http://esf-oregon.org/doku.php 5
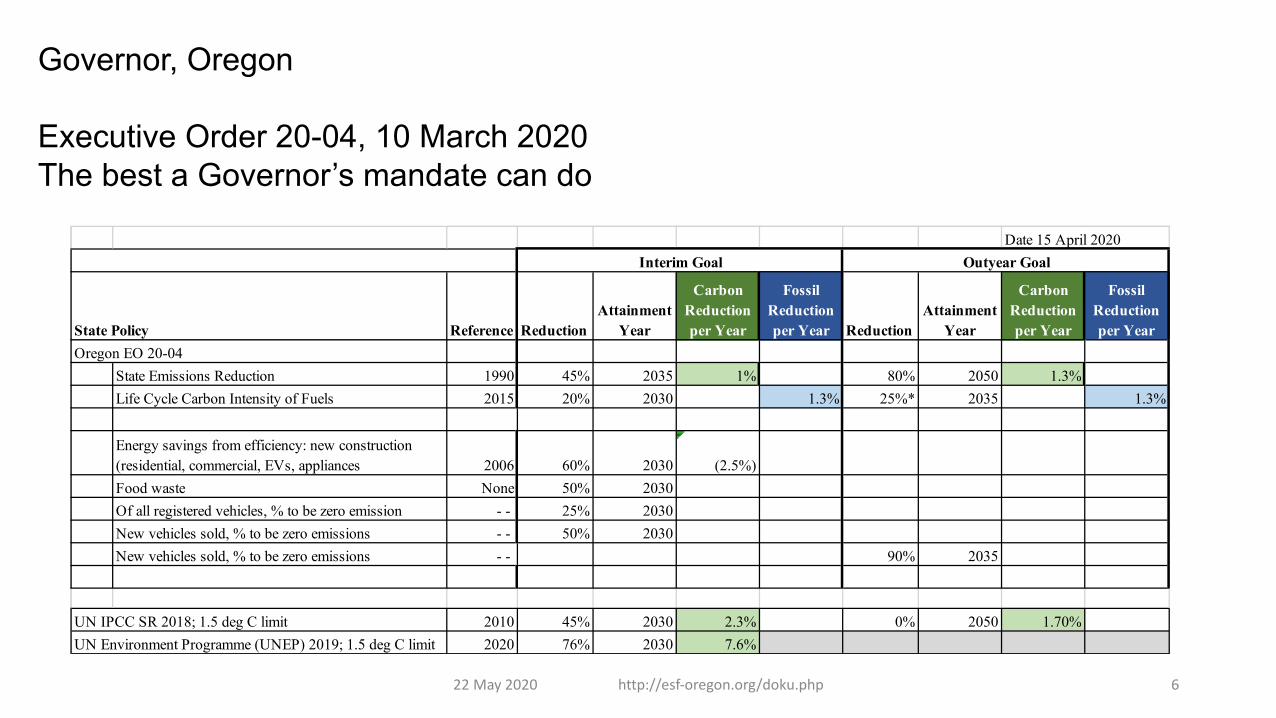
Governor, Oregon
Executive Order 20-04, 10 March 2020The best a Governor’s mandate can do
Date 15 April 2020
State Policy Reference ReductionAttainment
Year
Carbon Reduction per Year
Fossil Reduction per Year Reduction
Attainment Year
Carbon Reduction per Year
Fossil Reduction per Year
Oregon EO 20-04State Emissions Reduction 1990 45% 2035 1% 80% 2050 1.3%Life Cycle Carbon Intensity of Fuels 2015 20% 2030 1.3% 25%* 2035 1.3%
Energy savings from efficiency: new construction (residential, commercial, EVs, appliances 2006 60% 2030 (2.5%)Food waste None 50% 2030Of all registered vehicles, % to be zero emission - - 25% 2030New vehicles sold, % to be zero emissions - - 50% 2030New vehicles sold, % to be zero emissions - - 90% 2035
UN IPCC SR 2018; 1.5 deg C limit 2010 45% 2030 2.3% 0% 2050 1.70%UN Environment Programme (UNEP) 2019; 1.5 deg C limit 2020 76% 2030 7.6%
Interim Goal Outyear Goal
22 May 2020 http://esf-oregon.org/doku.php 6
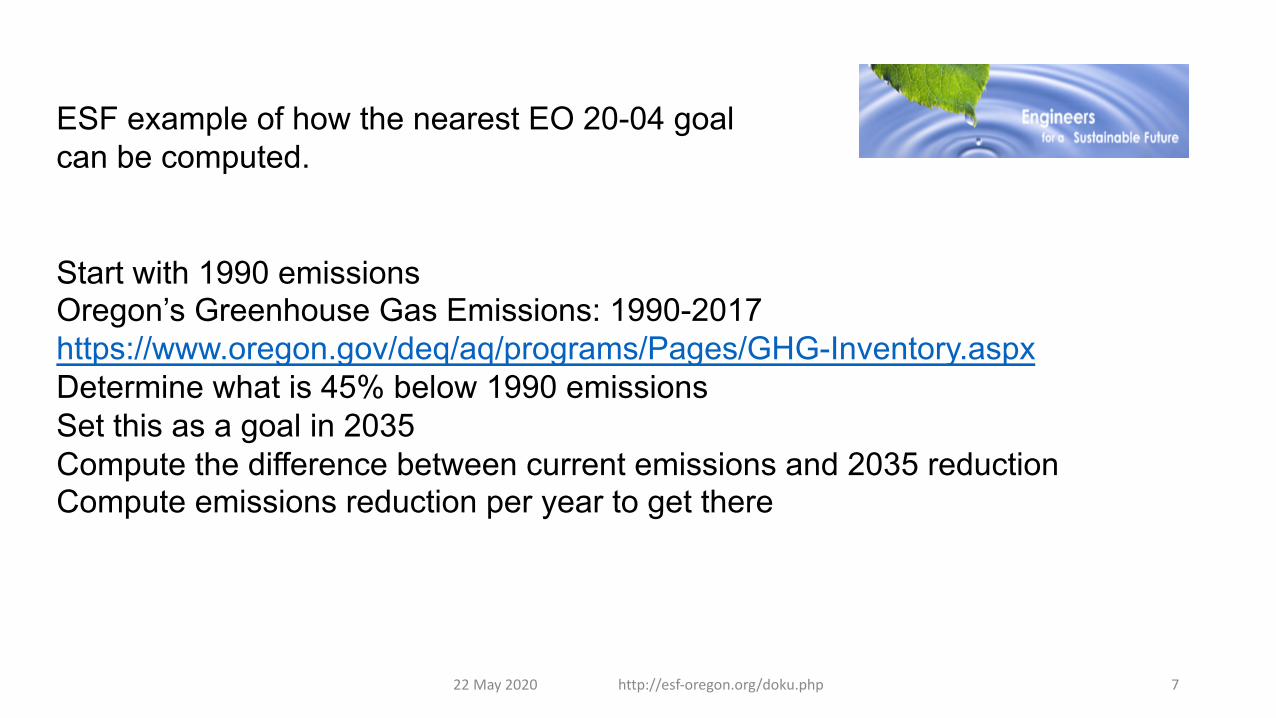
ESF example of how the nearest EO 20-04 goal can be computed.
Start with 1990 emissionsOregon’s Greenhouse Gas Emissions: 1990-2017https://www.oregon.gov/deq/aq/programs/Pages/GHG-Inventory.aspxDetermine what is 45% below 1990 emissionsSet this as a goal in 2035Compute the difference between current emissions and 2035 reductionCompute emissions reduction per year to get there
22 May 2020 http://esf-oregon.org/doku.php 7
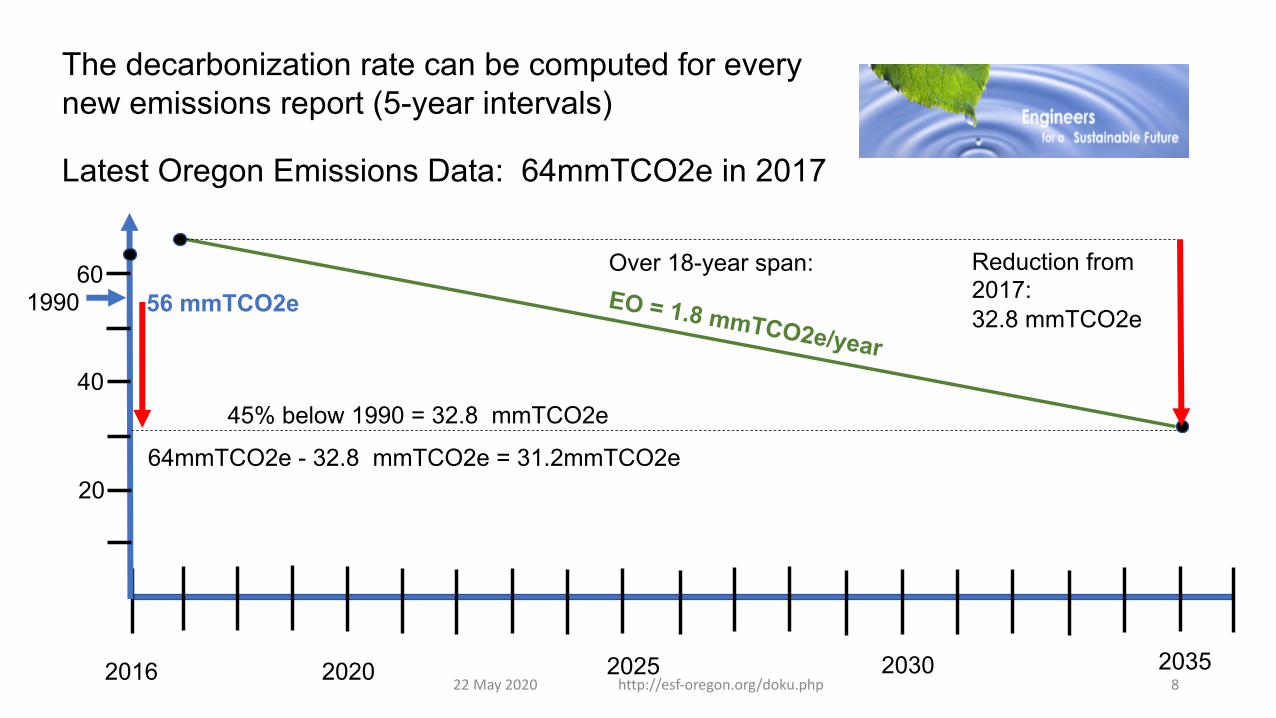
2025 203020202016
The decarbonization rate can be computed for every new emissions report (5-year intervals)
Latest Oregon Emissions Data: 64mmTCO2e in 2017
2035
1990 56 mmTCO2e
20
40
60
45% below 1990 = 32.8 mmTCO2e
EO = 1.8 mmTCO2e/year
64mmTCO2e - 32.8 mmTCO2e = 31.2mmTCO2e
Reduction from 2017:32.8 mmTCO2e
Over 18-year span:
22 May 2020 http://esf-oregon.org/doku.php 8
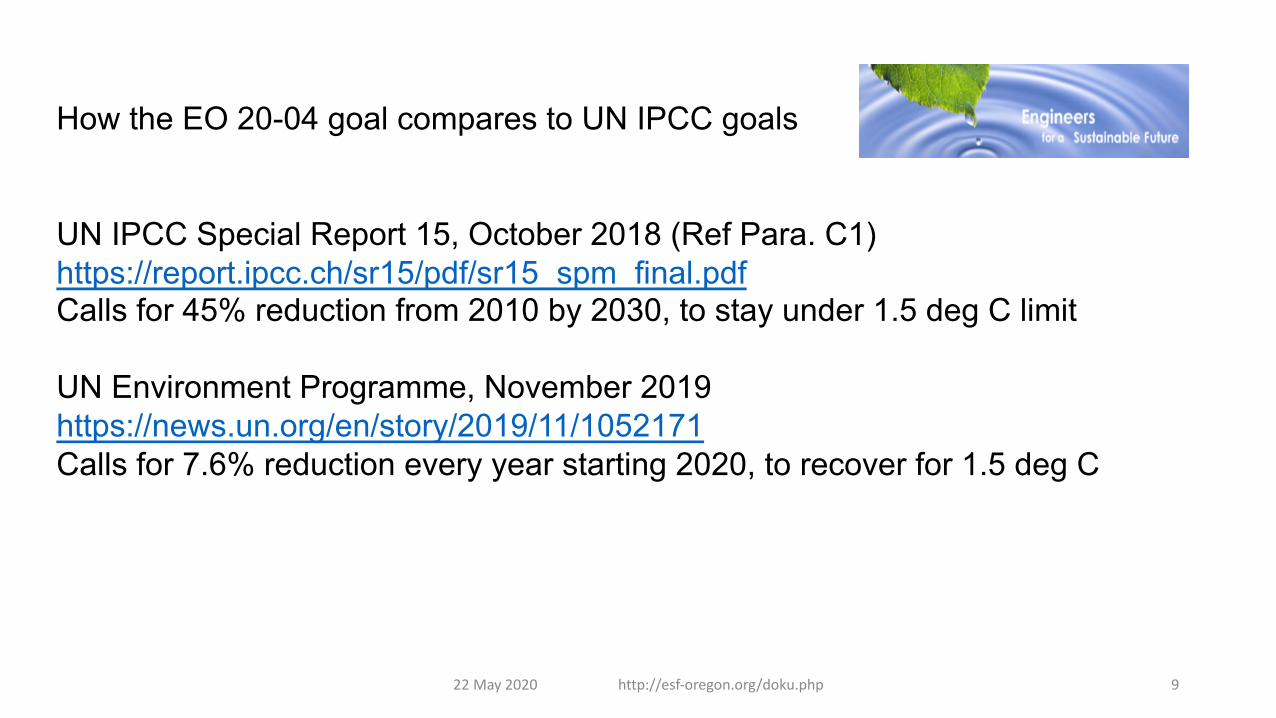
How the EO 20-04 goal compares to UN IPCC goals
UN IPCC Special Report 15, October 2018 (Ref Para. C1)https://report.ipcc.ch/sr15/pdf/sr15_spm_final.pdfCalls for 45% reduction from 2010 by 2030, to stay under 1.5 deg C limit
UN Environment Programme, November 2019https://news.un.org/en/story/2019/11/1052171Calls for 7.6% reduction every year starting 2020, to recover for 1.5 deg C
22 May 2020 http://esf-oregon.org/doku.php 9
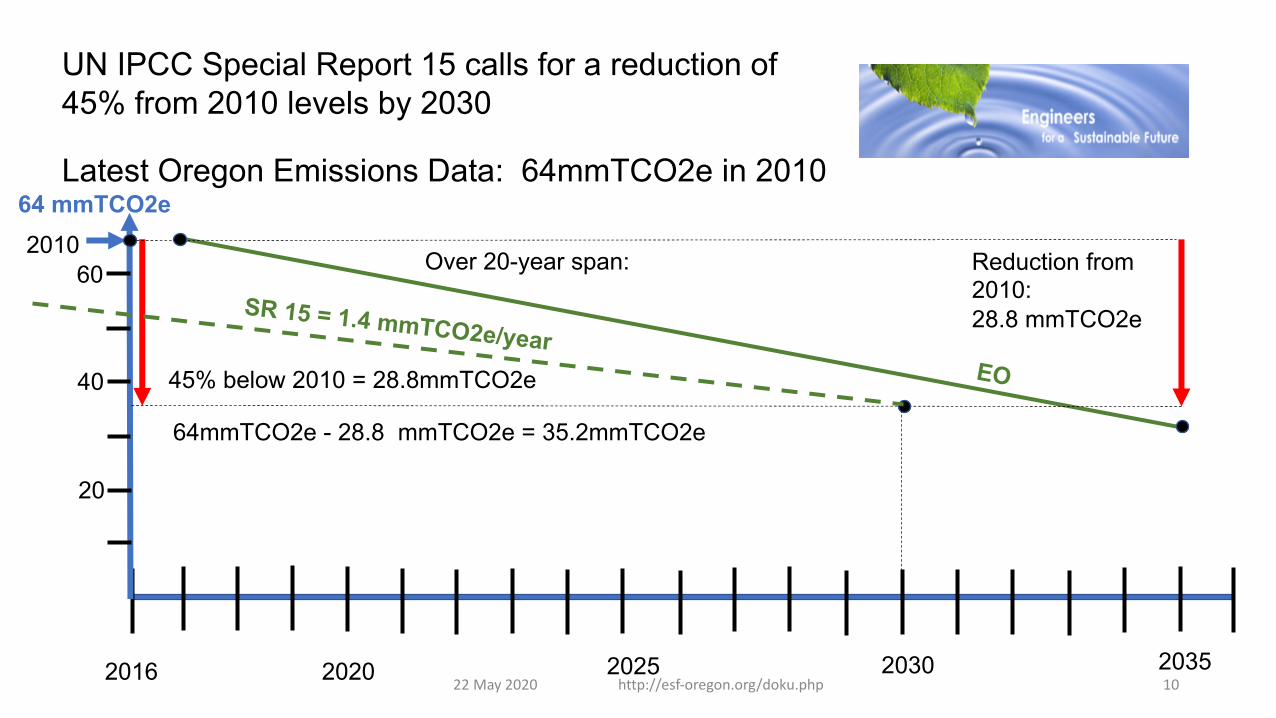
2025 203020202016
UN IPCC Special Report 15 calls for a reduction of45% from 2010 levels by 2030
Latest Oregon Emissions Data: 64mmTCO2e in 2010
2035
201064 mmTCO2e
20
40
60
45% below 2010 = 28.8mmTCO2e
Reduction from 2010:28.8 mmTCO2e
Over 20-year span:
64mmTCO2e - 28.8 mmTCO2e = 35.2mmTCO2e
SR 15 = 1.4 mmTCO2e/yearEO
22 May 2020 http://esf-oregon.org/doku.php 10
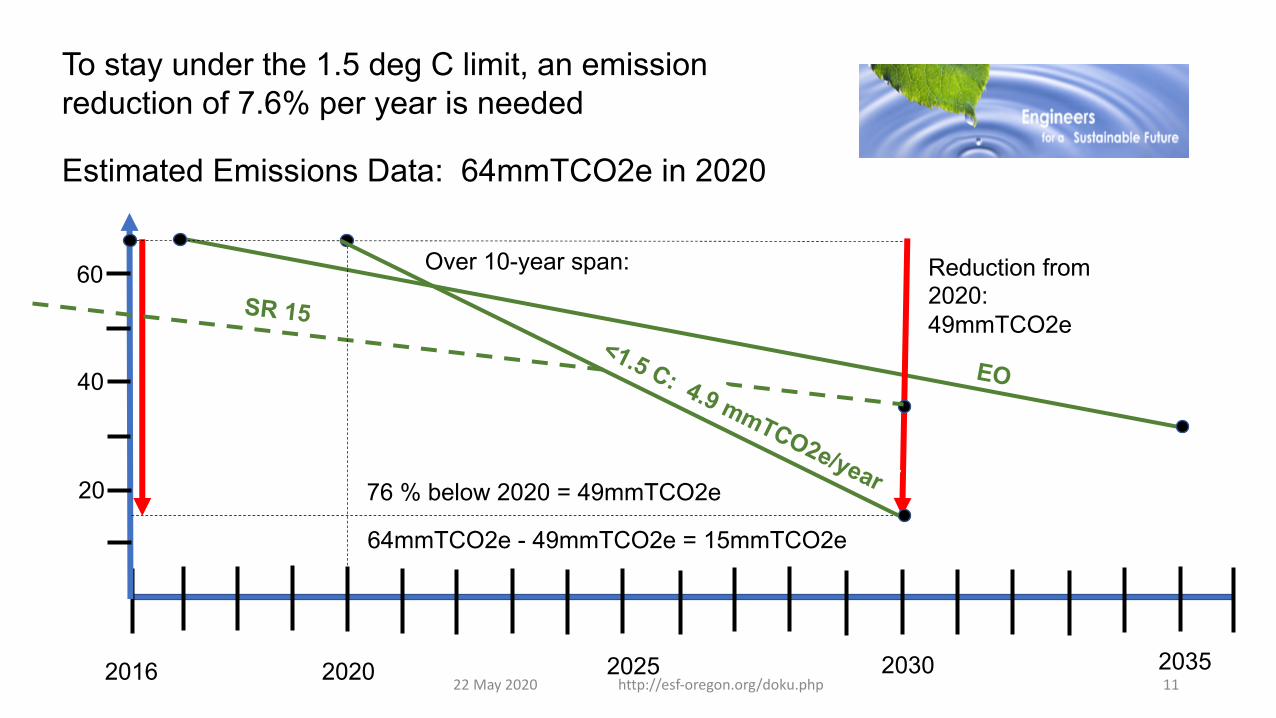
2025 203020202016
To stay under the 1.5 deg C limit, an emission reduction of 7.6% per year is needed
Estimated Emissions Data: 64mmTCO2e in 2020
2035
20
40
60
76 % below 2020 = 49mmTCO2e
Reduction from 2020:49mmTCO2e
Over 10-year span:
64mmTCO2e - 49mmTCO2e = 15mmTCO2e
<1.5 C: 4.9 mmTCO2e/year
SR 15
EO
22 May 2020 http://esf-oregon.org/doku.php 11
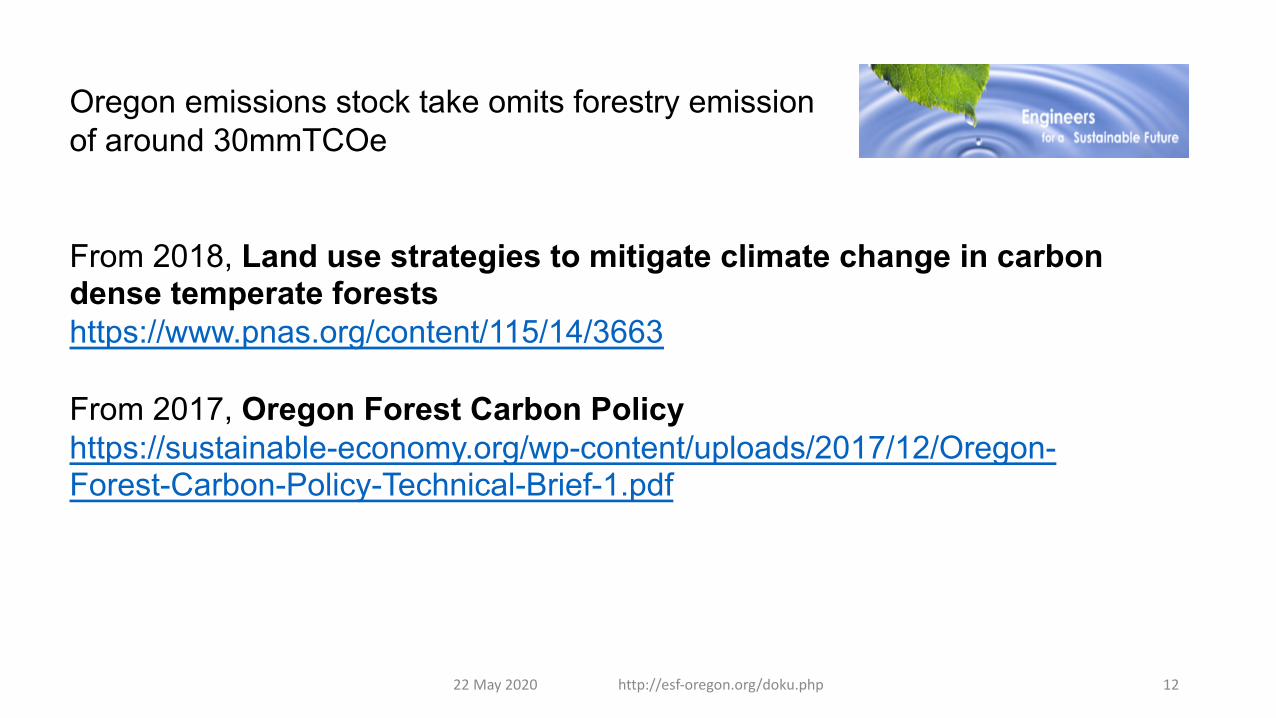
Oregon emissions stock take omits forestry emissionof around 30mmTCOe
From 2018, Land use strategies to mitigate climate change in carbon dense temperate forestshttps://www.pnas.org/content/115/14/3663
From 2017, Oregon Forest Carbon Policyhttps://sustainable-economy.org/wp-content/uploads/2017/12/Oregon-Forest-Carbon-Policy-Technical-Brief-1.pdf
22 May 2020 http://esf-oregon.org/doku.php 12
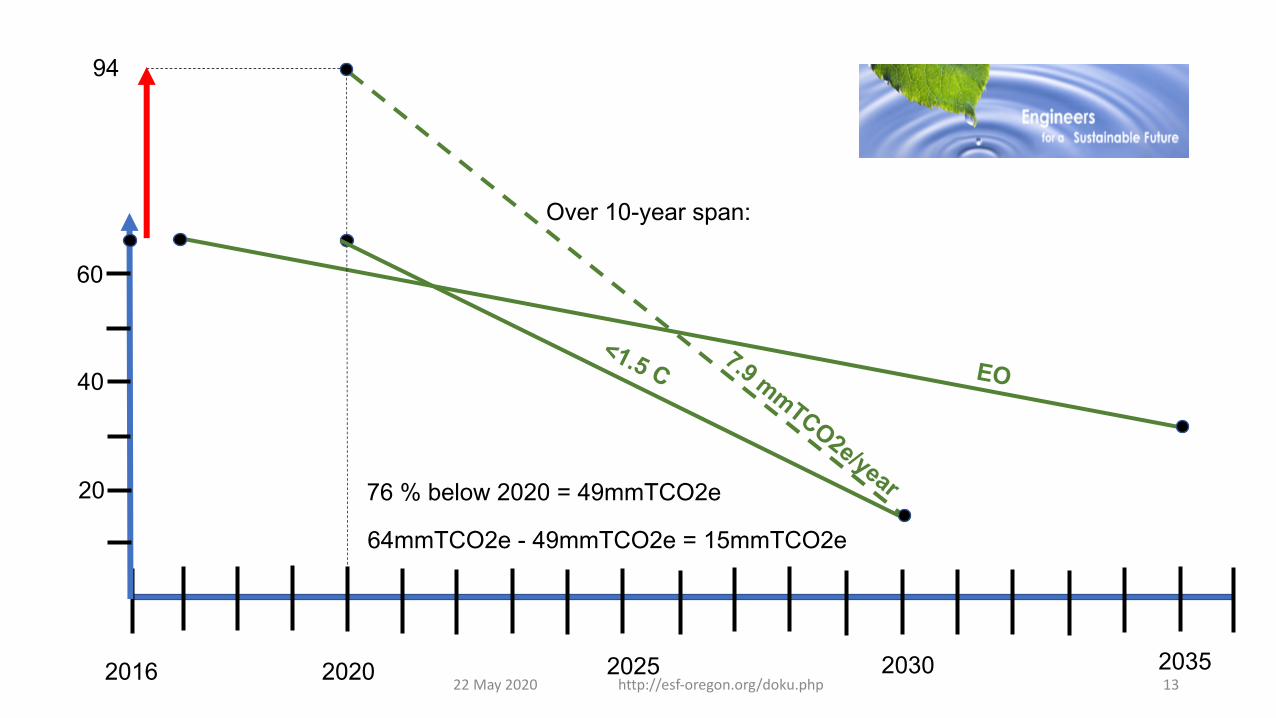
2025 203020202016 2035
20
40
60
76 % below 2020 = 49mmTCO2e
Over 10-year span:
64mmTCO2e - 49mmTCO2e = 15mmTCO2e
7.9 mmTCO2e/year
EO <1.5 C
94
22 May 2020 http://esf-oregon.org/doku.php 13
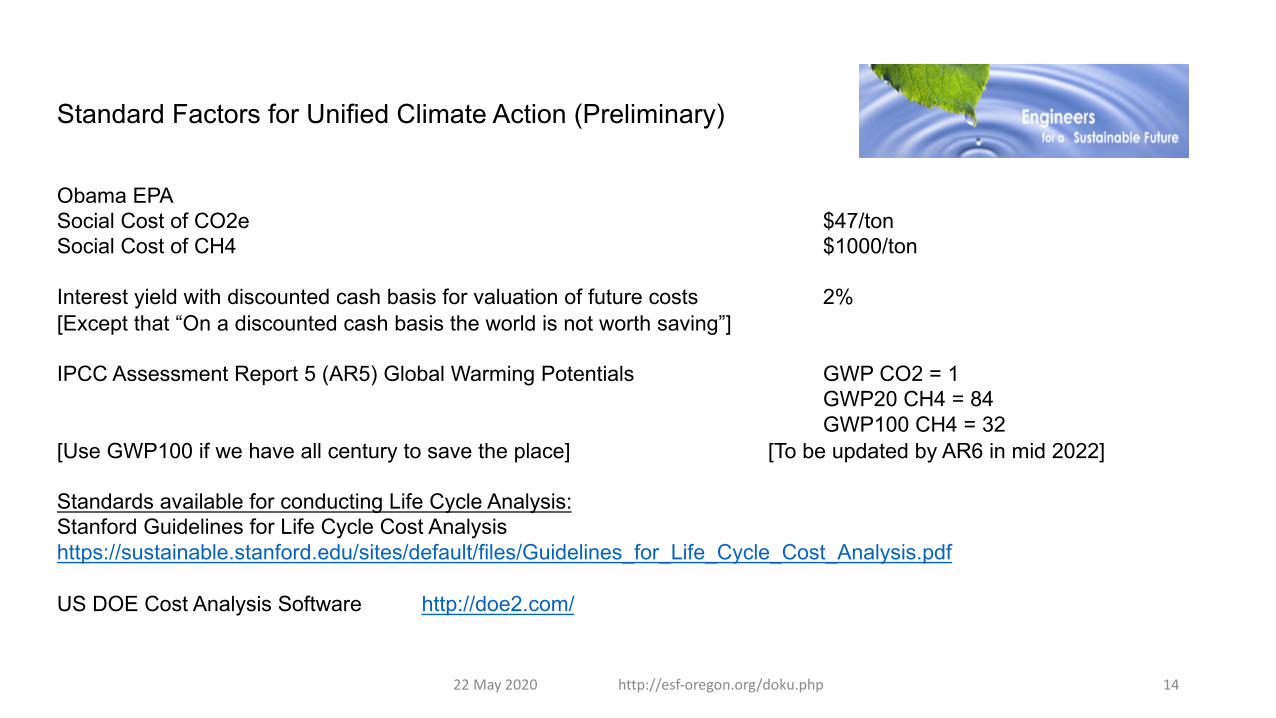
Standard Factors for Unified Climate Action (Preliminary)
Obama EPASocial Cost of CO2e $47/tonSocial Cost of CH4 $1000/ton
Interest yield with discounted cash basis for valuation of future costs 2%[Except that “On a discounted cash basis the world is not worth saving”]
IPCC Assessment Report 5 (AR5) Global Warming Potentials GWP CO2 = 1GWP20 CH4 = 84GWP100 CH4 = 32
[Use GWP100 if we have all century to save the place] [To be updated by AR6 in mid 2022]
Standards available for conducting Life Cycle Analysis:Stanford Guidelines for Life Cycle Cost Analysishttps://sustainable.stanford.edu/sites/default/files/Guidelines_for_Life_Cycle_Cost_Analysis.pdf
US DOE Cost Analysis Software http://doe2.com/
22 May 2020 http://esf-oregon.org/doku.php 14
1
June 15, 2020 Director Richard Whitman Department of Environmental Quality 700 NE Multnomah Ave. Suite 600 Portland, OR 97232
Re: Environmental Caucus of the Democratic Party of Oregon comments on Department of
Environmental Quality (DEQ) Preliminary Report on Program Options to Cap and Reduce
Greenhouse Gas (GHG) Emissions
Dear Director Whitman:
Thank you for the opportunity to comment on the Oregon Department of Environmental Quality’s (DEQ’s) preliminary report on Program Options to Cap and Reduce Greenhouse Gas Emissions required by the Oregon Climate Action Plan (Executive Order 20-04). We appreciate your thoughtful and thorough inclusion of the analysis of the authority of the DEQ to regulate greenhouse gas emissions.
Our comments have two sections. The first section is reflective of the process and overview. The second section offers our responses to specific DEQ questions including policy.
Part 1: Major factors affecting the GHG Cap and Reduce Program Options and Public Engagement
Public and Stakeholder Engagement For too long, agencies have frequently had strong majority corporate interests represented on rules advisory committees. But despite the escalating crisis, and discussions and compromises behind closed doors, corporations have not prioritized climate solutions on a sufficient timeline as dictated by science. We are pleased to see DEQ include environmental justice concerns in your planning document. We recommend that DEQ
● Train its staff for this rule in equity/environmental justice ● Ensure that public and scientific voices are in the majority on the rules advisory
committee (RAC), and any technical advisory or working groups. This majority should include representatives of climate experts, labor, policy and economic experts, and representatives from vulnerable populations, including, but not limited to, people of color, low income, rural populations, youth and elderly. Strong advocates must be the majority.
2
● Accept nominations from community advocates of representatives to fill the majority seats advocating for the public good and those to represent vulnerable groups.
● DEQ should consider ways to maximize industry parties who do not perpetuate disinformation and misinformation about the climate crisis, defining the GHG emissions caps, and for the suite of viable options for the GHG emissions cap and reduce program.
Pertaining to Listening Sessions: ● Ensure DEQ’s listening sessions provide ample time for listening. Introductions should be
10 minutes or less. ● Develop fact sheets on the health and social benefits of environmental regulations,
definitions, the risks of not reducing GHG emissions, and common falsehoods e.g., the falsehood that environmental regulations kill jobs.1
● Encourage the voice of minors at the listening sessions. ● It is best not to double book public meetings or to have comments due on the same day
for related programs such as Cap and Reduce and Clean Fuels. Engaging those with little or no internet access:
● In addition to holding in-person meetings as COVID19 reopening stages allow, DEQ can engage as it did before the internet through flyers, news articles, and sending fact sheets to citizens, local public offices, community centers, and libraries. (Please continue to be mindful that people may want to print documents from the internet and these should be mostly in black and white as color printing is not always available or affordable).
● DEQ should record videos of in-person meetings. Further, as to the listening sessions, DEQ should post a video of its presentation on its website. People with limited internet often can watch videos but cannot participate effectively in a zoom meeting.
● DEQ should consider a separate video describing the Executive Order available ahead of listening sessions in addition to one on the GHG Emissions Cap and Reduce Rule Making and Guidance.
● DEQ should provide graphs of the emissions gap and explain it to the public and how and under what timeframe it will close the gap.
Fund Coordination and Outreach for Environmental Justice and Impacted Communities Section 3C of the Executive Order places a priority on vulnerable populations and impacted communities and requires consultation with the Environmental Justice Task Force (EJTF). These efforts need to be adequately funded in order to be effective. Let’s not make the same mistake
1 On occasion, regulations may shift jobs but not overall employment more than other market factors. Thus the issue is training and other programs are crucial to ensure a just transition to a climate smart economy. M.C. Hafstead, R.C. Williams III Jobs and Environmental Regulation, in Environmental and Energy Policy and the Economy, volume 1, Kotchen, Stock, and Wolfram. 2020.
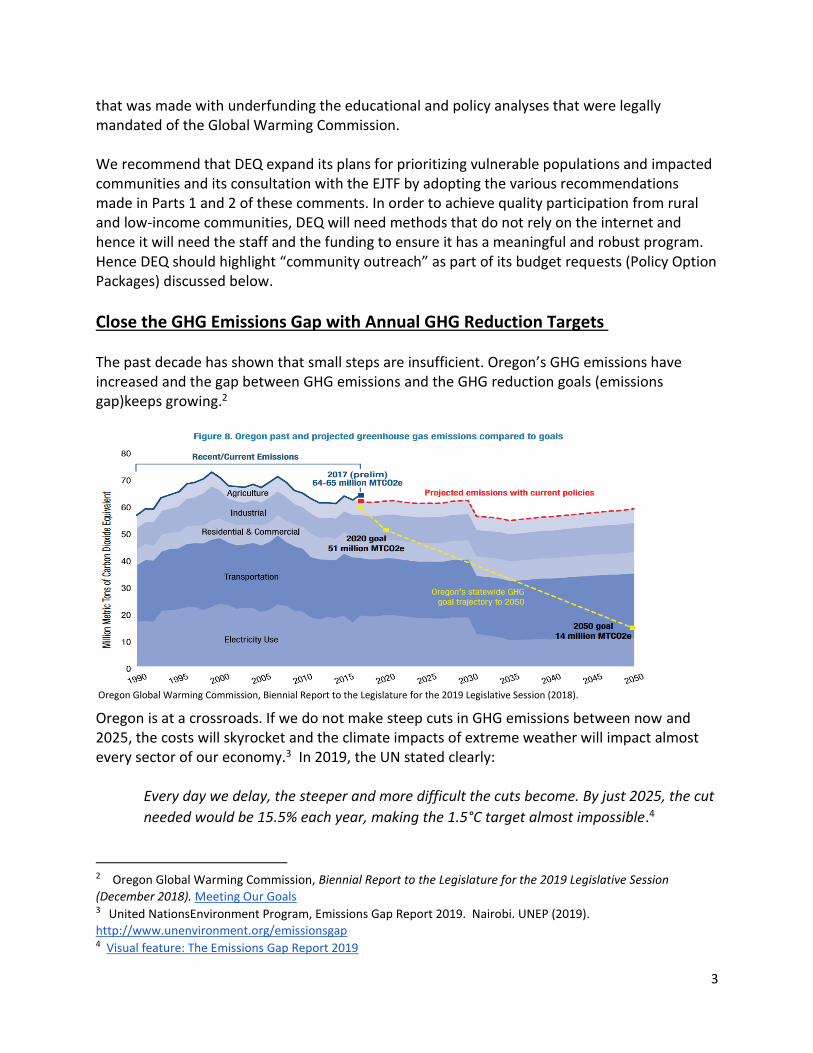
3
that was made with underfunding the educational and policy analyses that were legally mandated of the Global Warming Commission. We recommend that DEQ expand its plans for prioritizing vulnerable populations and impacted communities and its consultation with the EJTF by adopting the various recommendations made in Parts 1 and 2 of these comments. In order to achieve quality participation from rural and low-income communities, DEQ will need methods that do not rely on the internet and hence it will need the staff and the funding to ensure it has a meaningful and robust program. Hence DEQ should highlight “community outreach” as part of its budget requests (Policy Option Packages) discussed below.
Close the GHG Emissions Gap with Annual GHG Reduction Targets
The past decade has shown that small steps are insufficient. Oregon’s GHG emissions have increased and the gap between GHG emissions and the GHG reduction goals (emissions gap)keeps growing.2
Oregon Global Warming Commission, Biennial Report to the Legislature for the 2019 Legislative Session (2018).
Oregon is at a crossroads. If we do not make steep cuts in GHG emissions between now and 2025, the costs will skyrocket and the climate impacts of extreme weather will impact almost every sector of our economy.3 In 2019, the UN stated clearly:
Every day we delay, the steeper and more difficult the cuts become. By just 2025, the cut
needed would be 15.5% each year, making the 1.5°C target almost impossible.4
2 Oregon Global Warming Commission, Biennial Report to the Legislature for the 2019 Legislative Session
(December 2018). Meeting Our Goals 3 United NationsEnvironment Program, Emissions Gap Report 2019. Nairobi. UNEP (2019).
http://www.unenvironment.org/emissionsgap 4 Visual feature: The Emissions Gap Report 2019
4
In order to ensure that emissions are being reduced, the agencies need to adopt, monitor and enforce annual emissions reductions targets. If targets are missed, then Oregon needs to implement more aggressive measures yearly or more often. Further, the public needs to be informed yearly of the steps that Oregon has accomplished in reducing GHG emissions and preparing for climate-induced disasters. For 2020, the reduction target should be a rate of 7.6% of 2010 emissions, based on the UN’s 2019 models to close the emissions gap. This rate is likely to increase in 2021 if actions in 2020 are insufficient and climate impacts continue to escalate.
Add immediate climate actions in the budget requests for staffing/funding in 2020-21 We understand that the agencies will find it difficult to implement climate actions without staff and funding. Because this is a crisis, the agencies should act this summer by shifting existing staff resources away from other rules, plans, and projects into the climate actions. We also recommend that all state agencies be required to include climate actions in the budgets (Policy Option Packages) requests to the Governor’s office this summer for the 2021-23 biennium. We recommend that DEQ provide a robust set of Policy Option Packages in its budget for the GHG Emissions Cap and Reduce Program. Further, DEQ should make this rule the top priority for use of any federal stimulus funds.
Part 2: DEQ’s Questions and Answers In its Preliminary Report, DEQ asked for specific feedback on the questions below. DEQ Question #1. How might DEQ best coordinate the public engagement aspects of both the effort described in this report on cap and reduce program or programs development and the Clean Fuels Program expansion?
It is best not to double book public meetings or to have comments due on the same day. DEQ should consider having one or two people who represent the public good on both rules advisory committees. DEQ should avoid pressure by the regulated community to accept less aggressive caps and reductions of GHG emissions simply because of regulations or policy in the Clean Fuels program. The overall goal and the near future reality is that, other than in very limited circumstances, all vehicles and modes of transportation need to be zero GHG emissions. DEQ Question #4. Are the policy issues identified under “Stakeholder Engagement” in subsection 2.3.4. and those in subsections 3.2. and 3.3. appropriately inclusive of issues, concerns and considerations needing discussion?
5
There are several policy issues that need additional discussion. These include applying the concept of Social Costs of Carbon to policy decisions, using fast-track short term regulations and creating three separate rules for caps in each broad sector. Embed the Social Costs of Carbon into all Processes DEQ has not considered applying social costs of carbon (SCC) into their scope, including proposed budgets. The costs of continued greenhouse gas emissions are huge. At the same time the savings from rapid reductions in carbon emissions can be significant.5 The federal Interagency Working Group on the Social Cost of Carbon (IWG) has calculated SCC to reflect many of the impacts of climate change on health, natural resources, infrastructure and more. These numbers represent massive damages to health, property and our economy that will continue to rise due to delay in emissions reductions. Applying Social Costs of Carbon analyses up front in agency rules, programs, planning and budgets will drive prudent policy choices.6 The Social Costs of Carbon utilized should be fashioned after the 2017 IWG. The 95th percentile cost figure should be used rather than the average predicted cost. This higher figure reflects the high impact of climate change that is already occurring and better reflects true costs as the models omit quantification of many impacts such as ocean acidification on fisheries.7 Likewise, we need to set the discount rate at 2 percent or lower given the short duration of time we have to institute reductions to avoid greater catastrophe. Expedite Actions by Implementing a Suite of Fast-Track Measures Section 3B of the Executive Order 20-04(EO) placed climate actions on a fast track. It expressly instructs DEQs to “expedite all processes, including budgets, to address GHG reductions and climate resiliency.” Fast track measures should be included in section 3.3 --“Initial Key Policy Questions and Options” because they provide more certainty to regulated entities and the public. These measures encourage the regulated community to invest in GHG reduction actions between now and January 1, 2022. They also provide justification to their lenders and investors for GHG reductions now. This is important because the financial landscape has changeid.8 Lenders and
5 See e.g., Oregon Department of Energy, Primer on the Social Costs of Carbon(May 2020) SCC Primer 6 See e.g., Oregon Department of Energy, Primer on the Social Costs of Carbon (May 2020) SCC Primer 7 Paul, I et. al., Institute of Policy Integrity, The Social Cost of Greenhouse Gases and State Policy. Oct 2017. The
https://policyintegrity.org/files/publications/SCC_State_Guidance.pdf 8 C. Cummins, How Can Financial Institutions Deliver on the Paris Agreement? The Science-based Targets Initiative
explains its thinking on decarbonization for the finance industry, Responsible Investor. March 3, 2020. https://www.responsible-investor.com/articles/how-can-financial-institutions-deliver-on-the-paris-agreement
6
investors are actively supporting businesses that reduce GHG emissions, particularly carbon emissions.9 When combined with the fact that delays mean both more expensive solutions and expensive climate-induced impacts to the public and our economy, the “cost effectiveness and cost containment” (Section 3.3.4) consideration in this preliminary report needs to incorporate the current situation and not presume that the need for costs effectiveness and containment to regulated entities are more acute or more important than the costs to the public and the government services such as roads and fire protection of not reducing GHG emissions. There are a series of fast-track measures that are forms of alternative compliance that can be included in both 3.3.3 and the 3.3.4 options. Fast-track measures options include, but are not limited to:
● Incentives to reduce emissions immediately, ● Temporary or interim rules, or plans (such as requiring five percent reduction in 2020) ● Encouragement of agreements between DEQ/Regulated Entities that give credit for
rapid and substantial reductions between now and 2022, ● Issue a notice of the scope of Oregon’s upcoming rule to comply with California’s new
targets for GHG reductions. (e.g., Oregon's rule will be substantially consistent with California’s rule of new target for greenhouse gas reductions),
● Guidance on best practices to reduce emissions and guidance on reducing emissions to the degree that an entity will not be regulated (e.g., the facility or vehicle has zero GHG emission).
Separation of the Caps to apply to each major identified sector Consider simplifying this rule by breaking it into at least 3 separate rules one each for large stationary sources, transportation fuels, and other liquid fuels and natural gas. If trading will occur, each sector will need its own trading system. Comparisons across these sectors are very complicated. DEQ Question 4a. What other issue areas should the agency convene stakeholder meetings for? Disinformation and Misinformation from some regulated entities Over the past 60 years the oil and gas industry has promoted falsehoods as to both the impacts of GHG emissions and the costs to reduce them.10 It has no credibility with climate and public advocates, but its propaganda is perpetuated in public forums. Hence, DEQ should independently verify any claims by the large industrial sectors regarding the economic impacts
9 P. Sullivan, A Call for Investors to Put Their Money Toward a Green Future. New York Times Business. Jan 24,
2020. https://www.nytimes.com/2020/01/24/business/green-investments-climate-change.html 10 See e.g., S. Collins, Exxon knew about climate change almost 40 years ago, Scientific American (Oct 26, 2015).
7
or practicality of capping and reducing GHG emissions. DEQ should explore ways to minimize the disinformation and misinformation during the rulemaking process. DEQ Question 4b. What other approaches to organizing stakeholder conversations should the agency consider? DEQ may want to consider using the Deliberative Dialogue approach. Deliberative Dialogue Is a structured discussion which aims to find the best course of action. Its “purpose is not so much to solve a problem or resolve an issue as to explore the most promising avenues for action.”11 Its structure provides a forum for “thinking together” rather than debating or arguing. It allows us to listen and think together about the pros and cons of the means to attain desired ends.12 Sincerely,
Environmental Caucus of the Democratic Party of Oregon
Calla Felicity, Chair (Curry County) Catherine Thomason, Vice Chair (Multnomah County) Helen Kennedy, Treasurer (Lane County) Justin Bryce, State Central Committee Alternate Delegate (Benton County) Chris Moon, Chair, Green New Deal Standing Committee (Lane County) Zach Klonoski, Chair, Membership Standing Committee (Multnomah County) cc: Kristen Sheeran, Climate and Energy Policy Advisor to Governor Kate Brown Kathleen George, Chair, Environment Quality Commission
11 London, Scott. 2018. Thinking Together: The Power of Deliberative Dialogue, adapted from "The Power of
Deliberative Dialogue," published in the book, Public Thought and Foreign Policy, edited by Robert J. Kingston. http://www.scottlondon.com/reports/dialogue.html . 12 Id..For more information on moderating, visit the National Issues Forum Institute webpage at
https://www.nifi.org/en/deliberation; for more information on the structure and process,see M. L. McCoy, P. L. Scully Deliberative Dialogue to Expand Civic Engagement: What Kind of Talk Does Democracy Need? National Civic Review, vol. 91, no. 2, Summer 2002
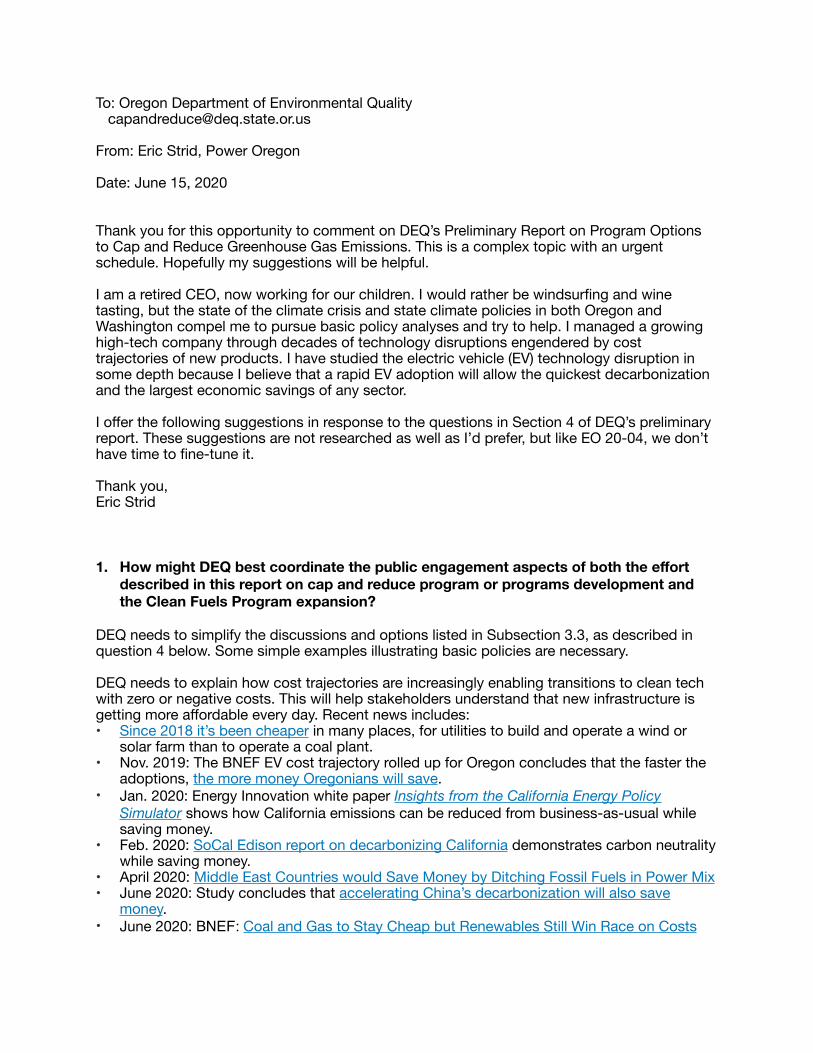
To: Oregon Department of Environmental Quality [email protected]
From: Eric Strid, Power Oregon
Date: June 15, 2020
Thank you for this opportunity to comment on DEQ’s Preliminary Report on Program Options to Cap and Reduce Greenhouse Gas Emissions. This is a complex topic with an urgent schedule. Hopefully my suggestions will be helpful.
I am a retired CEO, now working for our children. I would rather be windsurfing and wine tasting, but the state of the climate crisis and state climate policies in both Oregon and Washington compel me to pursue basic policy analyses and try to help. I managed a growing high-tech company through decades of technology disruptions engendered by cost trajectories of new products. I have studied the electric vehicle (EV) technology disruption in some depth because I believe that a rapid EV adoption will allow the quickest decarbonization and the largest economic savings of any sector.
I offer the following suggestions in response to the questions in Section 4 of DEQ’s preliminary report. These suggestions are not researched as well as I’d prefer, but like EO 20-04, we don’t have time to fine-tune it.
Thank you,Eric Strid
1. How might DEQ best coordinate the public engagement aspects of both the effort described in this report on cap and reduce program or programs development and the Clean Fuels Program expansion?
DEQ needs to simplify the discussions and options listed in Subsection 3.3, as described in question 4 below. Some simple examples illustrating basic policies are necessary.
DEQ needs to explain how cost trajectories are increasingly enabling transitions to clean tech with zero or negative costs. This will help stakeholders understand that new infrastructure is getting more affordable every day. Recent news includes: • Since 2018 it’s been cheaper in many places, for utilities to build and operate a wind or
solar farm than to operate a coal plant.• Nov. 2019: The BNEF EV cost trajectory rolled up for Oregon concludes that the faster the
adoptions, the more money Oregonians will save.• Jan. 2020: Energy Innovation white paper Insights from the California Energy Policy
Simulator shows how California emissions can be reduced from business-as-usual while saving money.
• Feb. 2020: SoCal Edison report on decarbonizing California demonstrates carbon neutrality while saving money.
• April 2020: Middle East Countries would Save Money by Ditching Fossil Fuels in Power Mix• June 2020: Study concludes that accelerating China’s decarbonization will also save
money. • June 2020: BNEF: Coal and Gas to Stay Cheap but Renewables Still Win Race on Costs
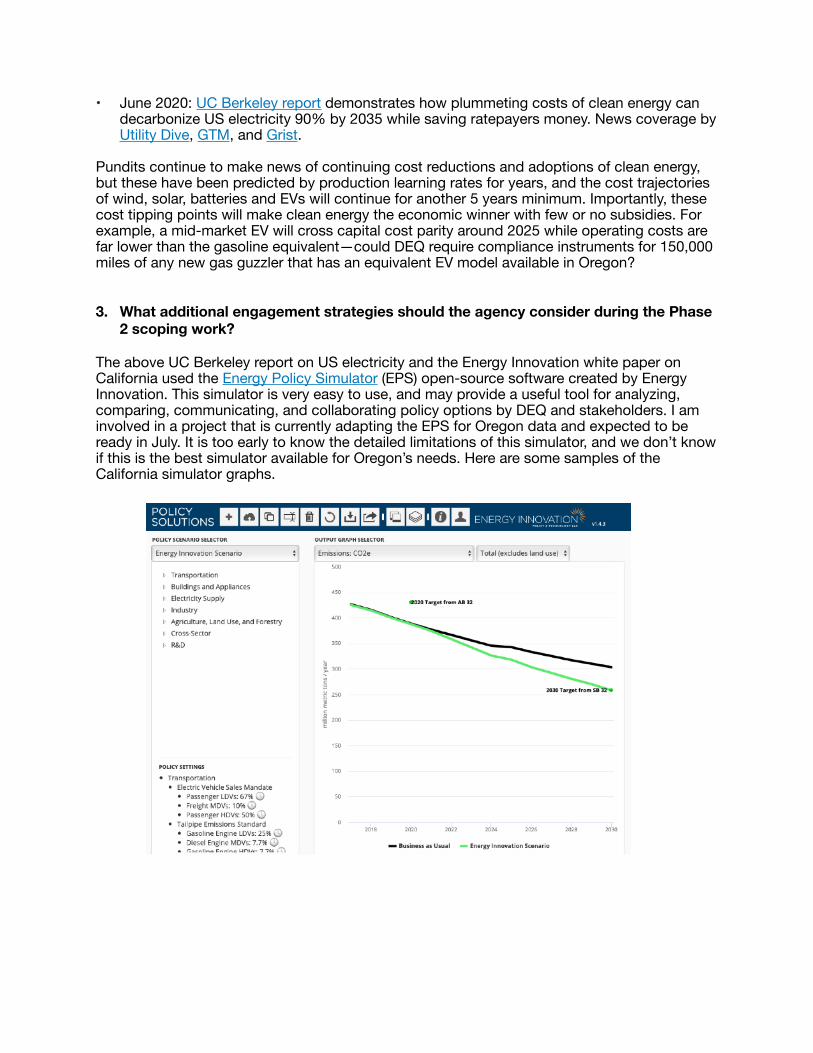
• June 2020: UC Berkeley report demonstrates how plummeting costs of clean energy can decarbonize US electricity 90% by 2035 while saving ratepayers money. News coverage by Utility Dive, GTM, and Grist.
Pundits continue to make news of continuing cost reductions and adoptions of clean energy, but these have been predicted by production learning rates for years, and the cost trajectories of wind, solar, batteries and EVs will continue for another 5 years minimum. Importantly, these cost tipping points will make clean energy the economic winner with few or no subsidies. For example, a mid-market EV will cross capital cost parity around 2025 while operating costs are far lower than the gasoline equivalent—could DEQ require compliance instruments for 150,000 miles of any new gas guzzler that has an equivalent EV model available in Oregon?
3. What additional engagement strategies should the agency consider during the Phase 2 scoping work?
The above UC Berkeley report on US electricity and the Energy Innovation white paper on California used the Energy Policy Simulator (EPS) open-source software created by Energy Innovation. This simulator is very easy to use, and may provide a useful tool for analyzing, comparing, communicating, and collaborating policy options by DEQ and stakeholders. I am involved in a project that is currently adapting the EPS for Oregon data and expected to be ready in July. It is too early to know the detailed limitations of this simulator, and we don’t know if this is the best simulator available for Oregon’s needs. Here are some samples of the California simulator graphs.
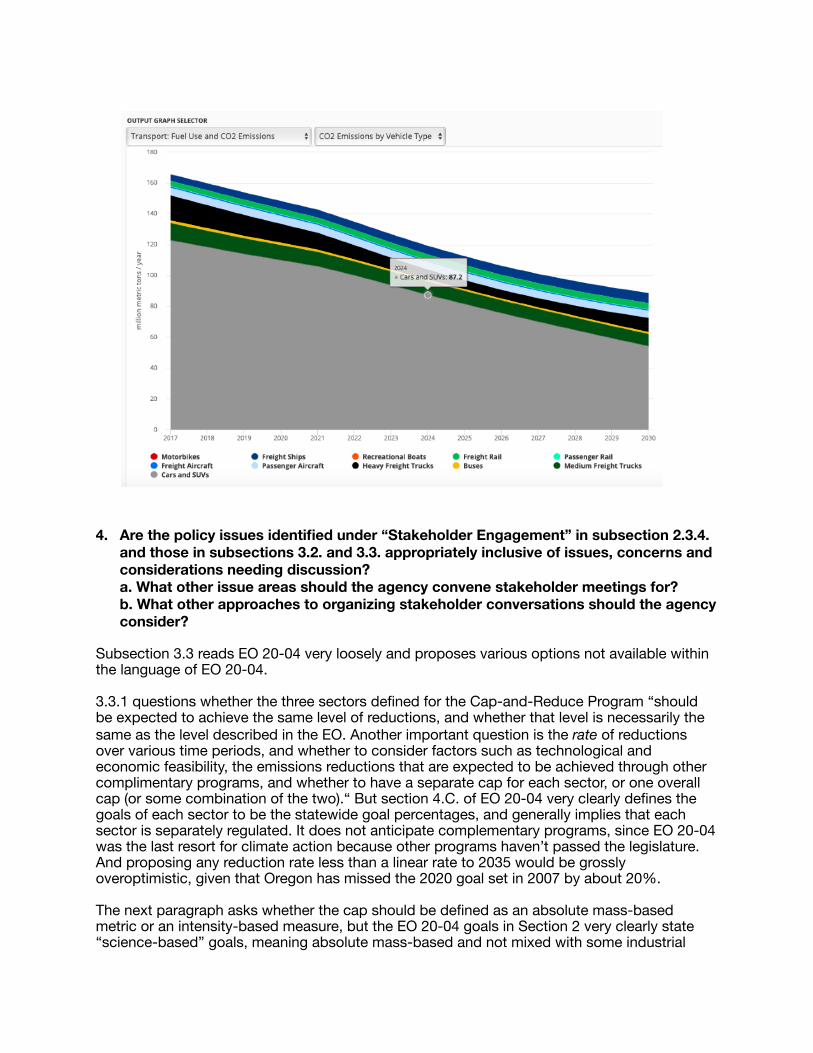
4. Are the policy issues identified under “Stakeholder Engagement” in subsection 2.3.4. and those in subsections 3.2. and 3.3. appropriately inclusive of issues, concerns and considerations needing discussion? a. What other issue areas should the agency convene stakeholder meetings for?b. What other approaches to organizing stakeholder conversations should the agency consider?
Subsection 3.3 reads EO 20-04 very loosely and proposes various options not available within the language of EO 20-04.
3.3.1 questions whether the three sectors defined for the Cap-and-Reduce Program “should be expected to achieve the same level of reductions, and whether that level is necessarily the same as the level described in the EO. Another important question is the rate of reductions over various time periods, and whether to consider factors such as technological and economic feasibility, the emissions reductions that are expected to be achieved through other complimentary programs, and whether to have a separate cap for each sector, or one overall cap (or some combination of the two).“ But section 4.C. of EO 20-04 very clearly defines the goals of each sector to be the statewide goal percentages, and generally implies that each sector is separately regulated. It does not anticipate complementary programs, since EO 20-04 was the last resort for climate action because other programs haven’t passed the legislature. And proposing any reduction rate less than a linear rate to 2035 would be grossly overoptimistic, given that Oregon has missed the 2020 goal set in 2007 by about 20%.
The next paragraph asks whether the cap should be defined as an absolute mass-based metric or an intensity-based measure, but the EO 20-04 goals in Section 2 very clearly state “science-based” goals, meaning absolute mass-based and not mixed with some industrial
output or financial measure. Thus, the questions raised in 3.3.1 are irrelevant and would only add complexity to the Cap-and Reduce Program discussion.
Subsection 3.3.4 proposes trading of compliance instruments to reduce program costs. In other words, the ability for polluters to avoid cleaning up emissions by cleaning up emissions somewhere else. This is politically unpopular, often exacerbates environmental justice issues, and is not likely the intent of EO 20-04.
Trading compliance instruments is the essence of the existing Clean Fuels Program. But emissions trading in the Clean Fuels Program (CFP) is already so complex that: • few people really understand it, except entities with enough attorneys; • it allows parties to pay-to-pollute, thus passing costs onto consumers or businesses and
continuing emissions where they currently pollute; and • it does not create price stability, since the cost of compliance depends on oil prices,
changes in other policies affecting the sector, new technology entrants, and total market volume.
The second paragraph of 3.3.4 proposes cross-sectoral trading to reduce program costs, but EO 20-04 clearly specifies that each sector caps and reduces per the statewide targets. Some complex criteria for reducing one sector faster than the others and then the others catching up, etc. could be postulated, but it’s not clear that such would necessarily reduce costs.
The third and fourth paragraphs of 3.3.4 propose “alternative compliance instruments through voluntary actions that create reductions in emissions outside the regulated sectors and sources.” In other words, the equivalent of carbon offsets. This ignores the problem that almost all carbon offsets are fraudulent with respect to additionality.
Subsection 3.3.5 notes past policy developments that seek to give specific segments or communities special treatment, and notes that “Options to achieve these policy outcomes can be complex, and often involve trade-offs between program effectiveness and equity consideration, or shifting of relative impacts to achieve more equitable results.”
If nearly all of the questions and options in subsection 3.3 were ignored, the program rulemaking would be far simpler, more fair, and ahead of schedule.
EO 20-04 does not allow much room for interpretations or creativity. Within the three sectors, the DEQ will mandate emissions reductions, possibly with emissions trading within each sector. DEQ cannot create carrots or sticks, outside of emission non-compliance fees. DEQ cannot define renewable portfolio standards, and vehicle emission performance standards are set through the Federal Clean Air Act.
DEQ’s cap-and-reduce program may not be optimally cost-effective compared to other policy options. In particular, restricting fuels for existing infrastructure (fixing a symptom) is costly and highly unpopular vs. steering the purchase of new infrastructure to clean options (fixing the root cause) is relatively very cheap and affects the party responsible for locking in emissions over the equipment’s lifetime. Could DEQ require a lifetime supply of compliance instruments to be purchased with the purchase of any new emitting infrastructure (like a vehicle)? Another example is financing clean infrastructure, providing a win-win-win for Oregon businesses and obviate emissions regulation.
5. How should the agency approach identifying and selecting interested parties to serve on the Rules Advisory Committee(s)?
• (Obvious) no current financial interest in any of the sectors that may be subject to the regulations.
• Business experience and perspective: has managed the earnings of a low-margin company; able to gain the respect of business stakeholders
• Experience with collaborating to find optimal solutions
6. What perspectives and expertise are critical in-terms of Rulemaking Advisory Committee member participation?
• Deeply understands and values the workings of Oregon ecosystems • Experience with top-down planning, like any CEO of a multi-division company must do
annually• Experience with managing a company through technology disruptions
Attachment 1 Oregon Share of Global GHG Emissions
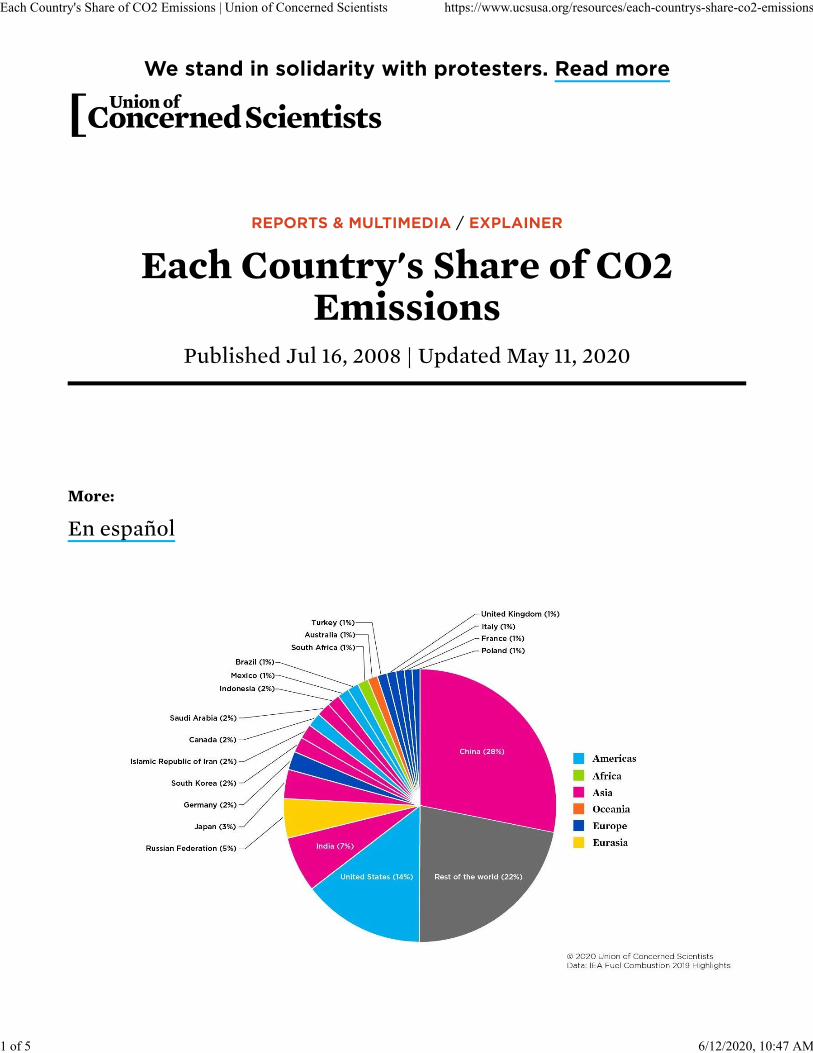
Each Country's Share of CO2 Emissions | Union of Concerned Scientists https://www.ucsusa.org/resources/each-countrys-share-co2-emissions
1 of 5 6/12/2020, 10:47 AM
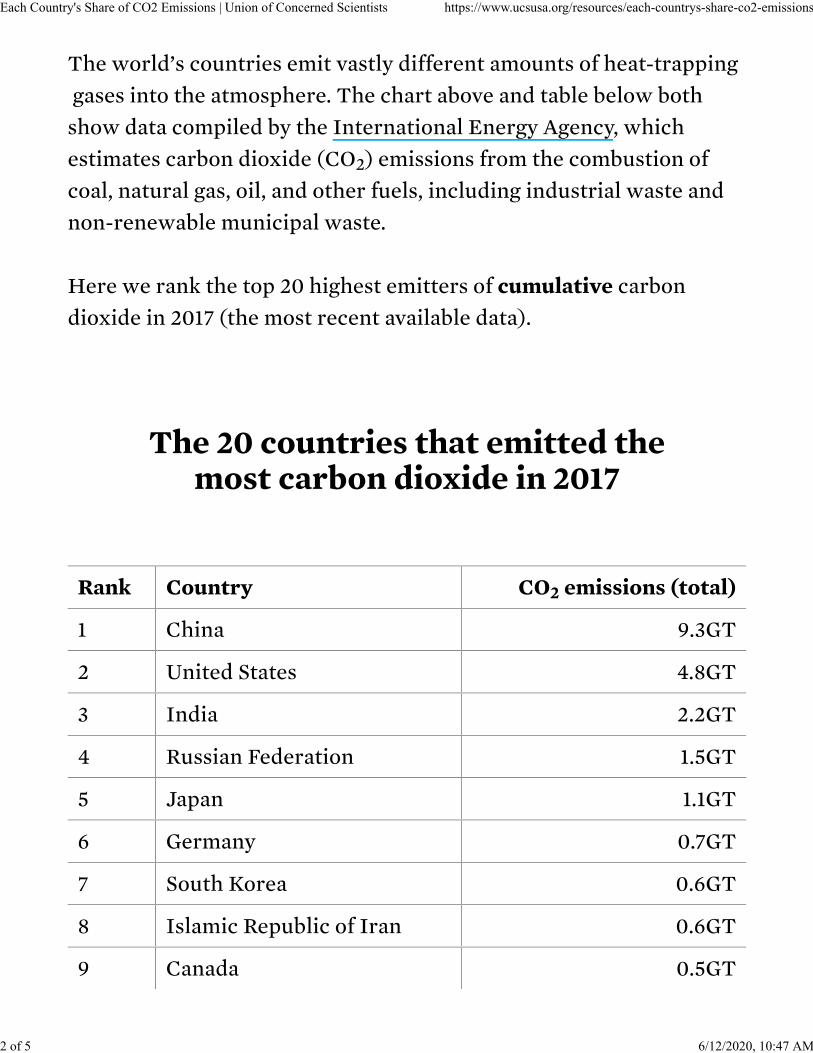
Each Country's Share of CO2 Emissions | Union of Concerned Scientists https://www.ucsusa.org/resources/each-countrys-share-co2-emissions
2 of 5 6/12/2020, 10:47 AM
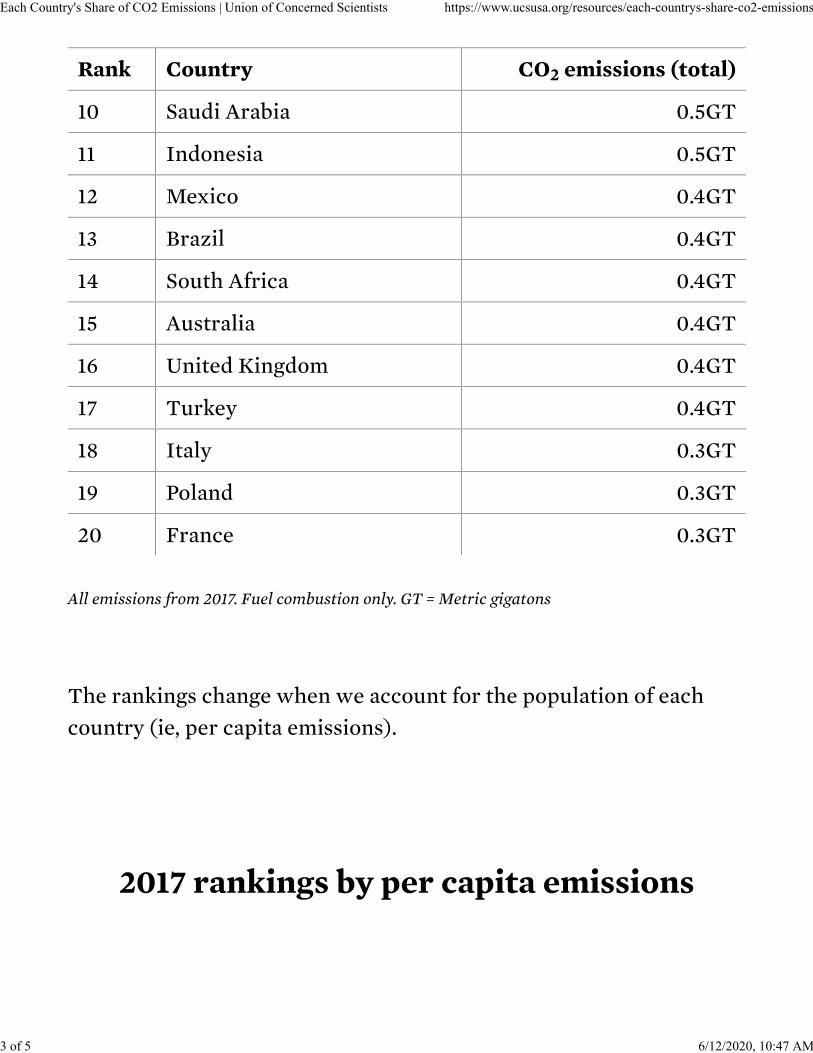
Each Country's Share of CO2 Emissions | Union of Concerned Scientists https://www.ucsusa.org/resources/each-countrys-share-co2-emissions
3 of 5 6/12/2020, 10:47 AM
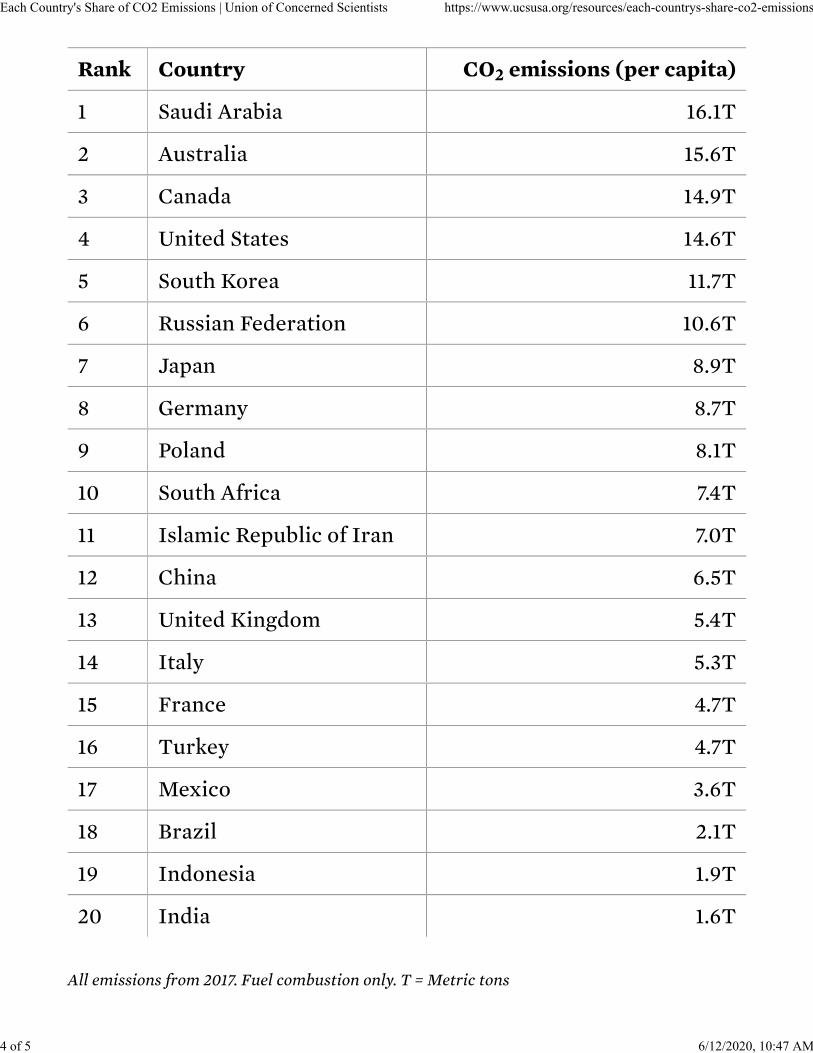
Each Country's Share of CO2 Emissions | Union of Concerned Scientists https://www.ucsusa.org/resources/each-countrys-share-co2-emissions
4 of 5 6/12/2020, 10:47 AM
Each Country's Share of CO2 Emissions | Union of Concerned Scientists https://www.ucsusa.org/resources/each-countrys-share-co2-emissions
5 of 5 6/12/2020, 10:47 AM
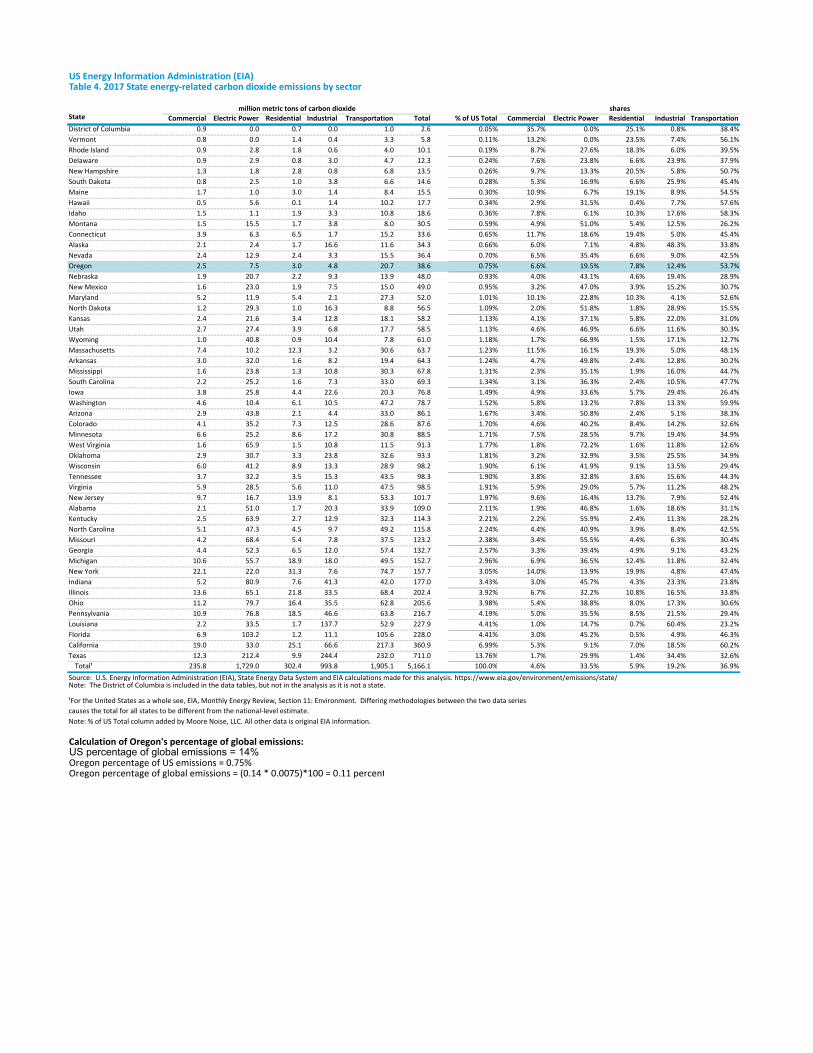
US Energy Information Administration (EIA) Table 4. 2017 State energy‐related carbon dioxide emissions by sector
State Commercial Electric Power Residential Industrial Transportation Total % of US Total Commercial Electric Power Residential Industrial Transportation
District of Columbia 0.9 0.0 0.7 0.0 1.0 2.6 0.05% 35.7% 0.0% 25.1% 0.8% 38.4%
Vermont 0.8 0.0 1.4 0.4 3.3 5.8 0.11% 13.2% 0.0% 23.5% 7.4% 56.1%
Rhode Island 0.9 2.8 1.8 0.6 4.0 10.1 0.19% 8.7% 27.6% 18.3% 6.0% 39.5%
Delaware 0.9 2.9 0.8 3.0 4.7 12.3 0.24% 7.6% 23.8% 6.6% 23.9% 37.9%
New Hampshire 1.3 1.8 2.8 0.8 6.8 13.5 0.26% 9.7% 13.3% 20.5% 5.8% 50.7%
South Dakota 0.8 2.5 1.0 3.8 6.6 14.6 0.28% 5.3% 16.9% 6.6% 25.9% 45.4%
Maine 1.7 1.0 3.0 1.4 8.4 15.5 0.30% 10.9% 6.7% 19.1% 8.9% 54.5%
Hawaii 0.5 5.6 0.1 1.4 10.2 17.7 0.34% 2.9% 31.5% 0.4% 7.7% 57.6%
Idaho 1.5 1.1 1.9 3.3 10.8 18.6 0.36% 7.8% 6.1% 10.3% 17.6% 58.3%
Montana 1.5 15.5 1.7 3.8 8.0 30.5 0.59% 4.9% 51.0% 5.4% 12.5% 26.2%
Connecticut 3.9 6.3 6.5 1.7 15.2 33.6 0.65% 11.7% 18.6% 19.4% 5.0% 45.4%
Alaska 2.1 2.4 1.7 16.6 11.6 34.3 0.66% 6.0% 7.1% 4.8% 48.3% 33.8%
Nevada 2.4 12.9 2.4 3.3 15.5 36.4 0.70% 6.5% 35.4% 6.6% 9.0% 42.5%
Oregon 2.5 7.5 3.0 4.8 20.7 38.6 0.75% 6.6% 19.5% 7.8% 12.4% 53.7%
Nebraska 1.9 20.7 2.2 9.3 13.9 48.0 0.93% 4.0% 43.1% 4.6% 19.4% 28.9%
New Mexico 1.6 23.0 1.9 7.5 15.0 49.0 0.95% 3.2% 47.0% 3.9% 15.2% 30.7%
Maryland 5.2 11.9 5.4 2.1 27.3 52.0 1.01% 10.1% 22.8% 10.3% 4.1% 52.6%
North Dakota 1.2 29.3 1.0 16.3 8.8 56.5 1.09% 2.0% 51.8% 1.8% 28.9% 15.5%
Kansas 2.4 21.6 3.4 12.8 18.1 58.2 1.13% 4.1% 37.1% 5.8% 22.0% 31.0%
Utah 2.7 27.4 3.9 6.8 17.7 58.5 1.13% 4.6% 46.9% 6.6% 11.6% 30.3%
Wyoming 1.0 40.8 0.9 10.4 7.8 61.0 1.18% 1.7% 66.9% 1.5% 17.1% 12.7%
Massachusetts 7.4 10.2 12.3 3.2 30.6 63.7 1.23% 11.5% 16.1% 19.3% 5.0% 48.1%
Arkansas 3.0 32.0 1.6 8.2 19.4 64.3 1.24% 4.7% 49.8% 2.4% 12.8% 30.2%
Mississippi 1.6 23.8 1.3 10.8 30.3 67.8 1.31% 2.3% 35.1% 1.9% 16.0% 44.7%
South Carolina 2.2 25.2 1.6 7.3 33.0 69.3 1.34% 3.1% 36.3% 2.4% 10.5% 47.7%
Iowa 3.8 25.8 4.4 22.6 20.3 76.8 1.49% 4.9% 33.6% 5.7% 29.4% 26.4%
Washington 4.6 10.4 6.1 10.5 47.2 78.7 1.52% 5.8% 13.2% 7.8% 13.3% 59.9%
Arizona 2.9 43.8 2.1 4.4 33.0 86.1 1.67% 3.4% 50.8% 2.4% 5.1% 38.3%
Colorado 4.1 35.2 7.3 12.5 28.6 87.6 1.70% 4.6% 40.2% 8.4% 14.2% 32.6%
Minnesota 6.6 25.2 8.6 17.2 30.8 88.5 1.71% 7.5% 28.5% 9.7% 19.4% 34.9%
West Virginia 1.6 65.9 1.5 10.8 11.5 91.3 1.77% 1.8% 72.2% 1.6% 11.8% 12.6%
Oklahoma 2.9 30.7 3.3 23.8 32.6 93.3 1.81% 3.2% 32.9% 3.5% 25.5% 34.9%
Wisconsin 6.0 41.2 8.9 13.3 28.9 98.2 1.90% 6.1% 41.9% 9.1% 13.5% 29.4%
Tennessee 3.7 32.2 3.5 15.3 43.5 98.3 1.90% 3.8% 32.8% 3.6% 15.6% 44.3%
Virginia 5.9 28.5 5.6 11.0 47.5 98.5 1.91% 5.9% 29.0% 5.7% 11.2% 48.2%
New Jersey 9.7 16.7 13.9 8.1 53.3 101.7 1.97% 9.6% 16.4% 13.7% 7.9% 52.4%
Alabama 2.1 51.0 1.7 20.3 33.9 109.0 2.11% 1.9% 46.8% 1.6% 18.6% 31.1%
Kentucky 2.5 63.9 2.7 12.9 32.3 114.3 2.21% 2.2% 55.9% 2.4% 11.3% 28.2%
North Carolina 5.1 47.3 4.5 9.7 49.2 115.8 2.24% 4.4% 40.9% 3.9% 8.4% 42.5%
Missouri 4.2 68.4 5.4 7.8 37.5 123.2 2.38% 3.4% 55.5% 4.4% 6.3% 30.4%
Georgia 4.4 52.3 6.5 12.0 57.4 132.7 2.57% 3.3% 39.4% 4.9% 9.1% 43.2%
Michigan 10.6 55.7 18.9 18.0 49.5 152.7 2.96% 6.9% 36.5% 12.4% 11.8% 32.4%
New York 22.1 22.0 31.3 7.6 74.7 157.7 3.05% 14.0% 13.9% 19.9% 4.8% 47.4%
Indiana 5.2 80.9 7.6 41.3 42.0 177.0 3.43% 3.0% 45.7% 4.3% 23.3% 23.8%
Illinois 13.6 65.1 21.8 33.5 68.4 202.4 3.92% 6.7% 32.2% 10.8% 16.5% 33.8%
Ohio 11.2 79.7 16.4 35.5 62.8 205.6 3.98% 5.4% 38.8% 8.0% 17.3% 30.6%
Pennsylvania 10.9 76.8 18.5 46.6 63.8 216.7 4.19% 5.0% 35.5% 8.5% 21.5% 29.4%
Louisiana 2.2 33.5 1.7 137.7 52.9 227.9 4.41% 1.0% 14.7% 0.7% 60.4% 23.2%
Florida 6.9 103.2 1.2 11.1 105.6 228.0 4.41% 3.0% 45.2% 0.5% 4.9% 46.3%
California 19.0 33.0 25.1 66.6 217.3 360.9 6.99% 5.3% 9.1% 7.0% 18.5% 60.2%
Texas 12.3 212.4 9.9 244.4 232.0 711.0 13.76% 1.7% 29.9% 1.4% 34.4% 32.6%
Total¹ 235.8 1,729.0 302.4 993.8 1,905.1 5,166.1 100.0% 4.6% 33.5% 5.9% 19.2% 36.9%
Source: U.S. Energy Information Administration (EIA), State Energy Data System and EIA calculations made for this analysis. https://www.eia.gov/environment/emissions/state/ Note: The District of Columbia is included in the data tables, but not in the analysis as it is not a state.
Note: % of US Total column added by Moore Noise, LLC. All other data is original EIA information.
Calculation of Oregon's percentage of global emissions:US percentage of global emissions = 14%Oregon percentage of US emissions = 0.75%Oregon percentage of global emissions = (0.14 * 0.0075)*100 = 0.11 percent
¹For the United States as a whole see, EIA, Monthly Energy Review, Section 11: Environment. Differing methodologies between the two data series
causes the total for all states to be different from the national‐level estimate.
million metric tons of carbon dioxide shares
Attachment 2 Oregon Poverty Information
Oregon Housing and Community Services
Poverty Report 2017
Executive Summary
There is plenty of reason for optimism when looking at economic data for Oregon over the past few
years. In 2015, median household income increased for the first time since the Great Recession, and job
growth has been steady in the majority of Oregon counties. Many rural areas are also beginning to see
economic improvement after having a notably slower start to recovery than metropolitan areas (Oregon
Office of Economic Analysis). These trends are not unique to our state: nationwide, it appears many
economic indicators have improved to approach or even surpass pre-recession levels.
While this is all good news, it does not apply evenly across the population. Recent data from the U.S.
Census Bureau's American Community Survey (ACS) shows that 16.5% of Oregonians are living with
household incomes below the poverty threshold, still a much higher rate than the 12.9% shown in 2007
before the financial crisis hit. Furthermore, rents have been increasing significantly all across the state,
far outpacing the recent growth in household income. As a result, more than half of Oregon renters are
paying more than 30% of their gross income toward their housing costs, making it difficult to balance
with savings and other living expenses.
This report provides the most recent data available from the Census Bureau on poverty rates and the
characteristics of those living in poverty in every county in Oregon. Data for the state and country as a
whole are also provided for context.
The data presented here show that even in the midst of a strengthening economy, the poverty rate in
Oregon (16.5%) remains above the national poverty rate (15.5%). In 2015 there were approximately
637,000 Oregonians living below the poverty line; this was roughly 121,000 more people than in 2010.
The hardest hit counties include Benton, Jefferson, Josephine, Lane, Malheur, and Sherman, which all
face poverty rates over 20%.
Children are especially vulnerable to the consequences of poverty and continue to be disproportionately
represented in the population living in poverty. Children under 18 years of age made up 22% of the total
statewide population in 2015, but they made up 29% of the total population living below the poverty
line. Furthermore, families with children and single women with children were much more likely to be
living in poverty than families overall. Just 11% of all families lived in poverty, compared to 18% of
families with children, and 42% of single women with children.
Poverty rates also vary significantly by race and ethnicity throughout Oregon. While the poverty rate
among whites was 15.1%, it was much higher for people of color, ranging from 16.1% for Asians up to
33.8% for African Americans.
Average and median household incomes began to rise in 2015 after stagnating for years after the
recession, but housing costs, particularly rents, have been increasing rapidly in many markets much
more quickly and for a longer period of time. This means that people must spend more of their earnings
on the cost of housing, leaving less money left over at the end of the month for other necessities such as
food, daycare, transportation, healthcare, or emergency savings. This is an especially difficult situation
llP a g e
Oregon Housing and Community Services
Poverty Report 2017
for people living below the poverty line. When a household spends more than 30% of their income on
the cost of housing and utilities, they have a housing cost burden. This report highlights data on
household incomes and housing cost burdens at various income levels. The median household income in
Oregon was $51,243 in 2015, but this differs greatly for renters and homeowners. The median
household income for renters was $32,513, while the median household income for homeowners was $67,070.
Approximately 80% of households with incomes at or below 30% of median family income in the state
faced a housing cost burden, and nearly 70% are actually considered severely cost burdened because
they spend more than half of their income on housing costs.
Households living below the poverty line who are severely cost burdened (spending more than 50% of
income on housing costs) are at an increased risk of homelessness. According to the 2017 Point-in-Time
count, completed on one night in January, there were 13,953 homeless people in Oregon. Fifty-seven
percent of this population was living in unsheltered locations not meant for habitation and the other
43% were living in emergency shelters or transitional housing units.
In addition to data on poverty, household income and homeless counts, this report also provides detail
on services provided by the state to assist those living in poverty. Oregon Housing and Community
Services (OHCS) funded the construction or preservation of 2,556 affordable housing units in 2015, a
more than 35% increase from the number of units created in 2014. Additionally, nearly 78,000
households received assistance for home heating costs, 46,600 households were able to prevent their
services from being disconnected in their home, and more than 5,000 had service restored in their home
because of energy assistance from OHCS. Finally, in 2016-17, 49.3% of Oregon students were eligible for
free or reduced lunch, 20.5% of all Oregonians received Food Stamps, and 2.8% received Temporary
Assistance for Needy Families.
It is clear from data and research, as well as from the stories of service providers and families struggling
to end the cycle of poverty, that these anti-poverty programs are critical to stabilizing people and
getting them back on their feet. This report is intended to provide policymakers, advocates, and the
public with the information they need to understand poverty in their communities and work together to
find ways to both support existing efforts to end poverty and develop new and innovative strategies for
ensuring that no one suffers through hunger, homelessness or the stress of living in poverty.
21P a g e
Oregon Housing and Community Services
Poverty Report 2017
How to Use This Report
This report provides readers with the most current information available from the U.S. Census Bureau's
American Community Survey (2011-2015) on poverty rates, the characteristics of people living in
poverty, and household incomes. Recent data regarding services provided by OHCS and Oregon's
Department of Human Services are also included. Finally, the report contains 2017 data on the
number of homeless people and households in the state. All information is provided at the national,
state, and county levels. In addition to all of these data points, the contact information and website for
the Community Action Agency in each county is included.
You can use the information in this report to:
1. Communicate: cite and use the poverty statistics of each Oregon County for grant applications,
talking points, reports, presentations and fundraisers.
2. Plan: Determine the areas of highest need by county or statewide as a starting point for developing
plans and policies to reduce poverty.
3. Analyze: Use the year-to-year comparisons to analyze the progress of area programs, then
modify, and expand the use of programs with the best results.
The report contains the following sections:
Executive Summary The Executive Summary includes the main findings from the report, with a focus on the statewide
statistics, to provide an overview of poverty trends in Oregon.
Fact Sheets There are two fact sheets that explain the Community Services Block Grant (CSBG) program and
demonstrate how anti-poverty programs can - and do - lift people out of poverty. Share this
information to show the effects of Community Action Agencies and government programs.
1. Community Services Block Grant (CSBG) - an overview of this important funding source and the
services that it makes possible.
2. Community Action Agency Success Stories - client stories from three Community Action Agencies
illustrating how funds were used to raise Oregonians out of poverty.
State and County Profiles
3IPage
Oregon Housing and Community Services
Poverty Report 2017
This is where you will find all the data on poverty, income, unemployment, and homelessness, as well
as data on the services provided to alleviate poverty. Each county profile includes some state and
national statistics to allow for comparisons to be made. The state profile also Includes the 2015 federal
poverty guidelines for each family size.
Fair Market Rents
The U.S. Department of Housing and Urban Development releases Fair Market Rents (FMRs) each year
to provide estimates of the cost of rent and utilities for modest apartments of various bedroom sizes in
every county across the country. The FMRs for Oregon are presented here.
Data Sources
This is where you can go to learn where each statistic in the state and county profiles comes from.
Links to the sources are provided, when available.
41Page
Oregon Housing and Community Services
Poverty Report 2017
Other clients have shared that the shower has helped them access employment and other services,
improved their mental health and confidence, and improved their overall quality of life.
The Center's longest-running volunteer shower monitor, Brenda Miller, has noted that the shower
created a cooperative atmosphere among clients, with clients taking active roles in setup and
takedown. In some cases, clients have given up their spots in order to let another client who is in
greater need access the shower unit.
For those of us fortunate to have a safe place to call home every night, we can take for granted simple
things, like keeping yourself clean. Clackamas Count Social Services is proud to support this important
work and the long term benefits that something as simple as a shower can provide.
Data Sources
Population change since 2000:
OHCS relies on county population data from the 2000 US Decennial Census and 2011-2015 American
Community Survey (Table B01003) for each county and the state.
http://2010.census.gov/2010census/
https ://www.census.gov/progra ms-su rveys/acs/
Poverty Rates:
Data for all counties, the state, and the US come from the 2011-2015 American Community Survey table
B17001.
https ://www.census.gov/progra ms-surveys/ acs/
Unemployment rates:
2011 through 2016 unemployment rates come from the Oregon Employment Department's local area
unemployment statistics for average covered non-farm unemployment rate by county.
www.gualityinfo.org
Poverty Population Characteristics:
Data for all counties, the state, and the US come from the 2011-15 American Community Survey tables
B17001 A-I, B17010, and B17016.
www.census.gov/acs/www/
Services Provided Table:
- Units funded with OHCS resources: this number represents the number of affordable housing units in
the county for the specified calendar year that were supported by funding allocated by OHCS. The
amounts do not represent rolling totals; the number reflects units funded for the specified year only.
10 IP a g e
Oregon Housing and Community Services
Poverty Report 2017
These could represent units being renovated or under construction. The data come from the OHCS
Department Information System for Housing (DISH), based on the funding approval date.
- OHCS funding for affordable housing: this number represents the funds allocated by OHCS to projects
in each county in the specified calendar year based on funding approval date. It represents funding from
several programs at OHCS implemented to help moderate- to low-income families by developing,
financing and preserving locally supported affordable housing. These fund awards can apply to
predevelopment, new construction and renovation activities. If there is a dollar amount and no new
units in a given year, the specified funding supported predevelopment or non-housing investments
(such as community rooms or public facilities). The data come from the OHCS Department Information
System for Housing (DISH).
Households receiving energy assistance-#: this number represents the number of households who
received assistance for home heating costs for the specified calendar year. Energy assistance represents
two programs: the Low Income Energy Assistance Program (LIEAP) and Oregon Energy Assistance
Program (OEAP). Some households receive assistance from both LIEAP and OEAP. This data represents
an unduplicated count within the county as well as for the state. State totals may not match the county
sum of households receiving assistance as some households may have received services in multiple
counties. The data come from the OHCS OPUS system for all counties except for Clackamas, Lane,
Multnomah and Washington counties where the local jurisdiction's energy and weatherization programs
submit data to OHCS energy program staff.
- Disconnects Prevented-#: this number represents the number of households receiving energy
assistance that were able to avoid having services disconnected from their homes. The data come from
the OHCS OPUS system for all counties except for Clackamas, Lane, Multnomah and Washington
counties where the local jurisdiction's energy and weatherization programs submit data to OHCS energy
program staff.
- Restored Utility-#: this number represents the number of households receiving energy assistance that
were able to restore utility services to their homes. The data come from the OHCS OPUS system for all
counties except for Clackamas, Lane, Multnomah and Washington counties where the local jurisdiction's
energy and weatherization programs submit data to OHCS energy program staff.
- Household income for energy assist avg-#: this number represents the average household income of
those receiving energy assistance. The county figures are actual averages and the statewide figure is
derived from weighted averages of county level data. The data come from the OHCS OPUS system for all
counties except for Clackamas, Lane, Multnomah and Washington counties where the local jurisdiction's
energy and weatherization programs submit data to OHCS energy program staff.
- Students eligible for free/reduced lunch-#: this figure represents the number of children within each
county that were eligible to receive free or reduced-price lunch. In general, students qualify for free or
11 I P a g e
Oregon Housing and Community Services
Poverty Report 2017
reduced-price lunch when the household receives public assistance, such as Temporary Assistance to
Needy Families or food stamps, or if the household income does not exceed 185 percent of the federal
poverty level. The data come from the Oregon Department of Education
www.ode.state.or.us/data/reports/toc.aspx#students.
- Students eligible for free/reduced lunch-%: this figure represents the number of children within each
county that were eligible to receive free or reduced-price lunch as a percentage of all enrolled students.
In general, students qualify for free or reduced-price lunch when the household receives public
assistance, such as Temporary Assistance for Needy Families or food stamps, or if the household income
does not exceed 185 percent of the federal poverty level. The data come from the Oregon Department
of Education www.ode.state.or.us/data/reports/toc.aspx#students.
- Population receiving Food Stamps-%: this number represents an unduplicated client count of food
stamp recipients as a percentage of the Census population estimate for each year. The data come from
DHS program staff.
- Population receiving TANF-%: this number represents an unduplicated client count of Temporary
Assistance for Needy Families in the year specified as a percentage of the Census population estimate
for each year. The data come from DHS program staff.
Household Income and Housing Burden:
Data for all counties, the state, and the US come from the 2011-2015 American Community Survey
tables B19113, B25074, and B25095.
https ://www.census.gov/progra ms-su rveys/acs/
Housing burden is defined as spending more than 30 percent of household income on gross housing
costs including utilities. According to HUD, extremely low-income households earn 30 percent of median
family income, very low-income households earn 50 percent of median family income, and low-income
households earn 80 percent of median family income.
Point in Time Homeless Count:
Homeless counts come from the January 2017 Point In Time Homeless Count (PITHC) as reported to
OHCS by each of the seven Continuums of Care in Oregon. This is a count done in a single night and
includes single individuals and individuals in families receiving shelter and services, those turned away,
and those counted on the street.
Consistent with the State of Oregon definition, chronically homeless includes individuals who have been
continually homeless for a year or more, or had at least four episodes of homelessness in the past three
years, in addition to having a disability, mental illness or addiction disorder.
Poverty Guidelines (on state page only):
12 I P a g e
Oregon Housing and Community Services
Poverty Report 2017
The US Department of Health and Human Services provides 2015 poverty threshold data by family size.
https://aspe.hhs.gov/2015-poverty-guidelines
Fair Market Rents:
The US Department of Housing and Urban Development 2015 Fair Market Rent data for each county by
unit size.
www.huduser.org/portal/datasets/fmr.html
13IPa ge
Oregon Economic News, Analysis and Outlook Posted by: Josh Lehner | May 28, 2020
Last week our office released the latest economic and revenue forecast(https://oregoneconomicanalysis.co/2020/05/20/oregon‐economic‐and‐revenue‐forecast‐june‐2020/) for the state. The outlook isn’t pretty aswe face years of high unemployment and reduced revenues for public services. Included in the forecastdocument was a section where we dig into the industry mix and regions of the state. We try to examinethe implications for the local outlook and how they vary around the state.
But first, our friends over at the Oregon Employment Department released county level employment datayesterday for April. This is our first hard look at the data, even if they are preliminary estimates that willbe revised in the months ahead. As expected, no county went unscathed. Job losses ranged from sizableto tragic. We already knew that job losses so far in the state were the deepest on record(https://oregoneconomicanalysis.com/2020/05/19/recessions‐in‐oregon‐graph‐of‐the‐week/), and in thechart below, it is clear that the vast majority of counties are seeing job losses that are larger thanexperienced during the Great Recession. (Next week we’ll dig further into why our office believes thiscycle will be shorter, and the recovery faster than last time, but for now, the initial severity of therecession is certainty worse.)
COVID-19 Regional Outlook | Oregon Office of Economic Analysis https://oregoneconomicanalysis.com/2020/05/28/covid-19-regional-outlook/
1 of 4 6/11/2020, 10:13 PM
(https://oregoneconomicanalysis.files.wordpress.com/2020/05/regionaloutlook0620‐1.png)
Given that social distancing impacted consumer services to a larger degree, regional economies in thestate that rely more upon these industries have been hit harder to date. Places like the North Coast,Central Oregon and parts of the Gorge all have a larger tourism‐dependent economy. These areas of thestate have seen the largest job losses (above) and the largest increases in the number of initial claims forunemployment insurance (below). While all sectors and regions of the state are seeing a recession, theseverity, at least initially is not uniform.
In recent years our office has spent a lot of time digging into long‐run sources of growth, and the mainreasons why Oregon’s economy is more volatile than the U.S. We have discussed the state’s industrialstructure (https://oregoneconomicanalysis.com/2018/05/31/oregons‐industrial‐structure‐and‐outlook/),how these structures have evolved at the regional level (https://oregoneconomicanalysis.com/2019/03/13/regional‐business‐cycle‐exposure‐pt‐2/), and how they play into regional volatility.(https://oregoneconomicanalysis.com/2019/02/21/regional‐business‐cycle‐exposure‐pt‐1/) Additionally,we highlighted the importance of both labor force growth (https://oregoneconomicanalysis.com/2019/04/17/future‐economic‐growth‐in‐oregon/), and productivity gains (https://oregoneconomicanalysis.com/2019/10/30/big‐question‐2‐capital‐and‐long‐run‐growth/) through the local lens. All of this work wasdesigned with an eye toward some unknown future recession and recovery. Well, it’s here now. Forthose interested in reading more, please refer to the links above. What follows below is based on whatwe included in our forecast document last week.
In that forecast document our office tried to look forward and see how regional economic structurescould impact future growth. We mapped our statewide forecasts by sector to each region. The findingsshow some areas may be better primed for growth from an industrial structure perspective, while othersare more likely to face future headwinds.
One key long‐run driver of growth is professional and business services, and office‐based work morebroadly, which tends to be concentrated in metro areas. As such, the Portland region, the WillametteValley and Central Oregon are best suited to see stronger gains due to their strengths in these sectors.
COVID-19 Regional Outlook | Oregon Office of Economic Analysis https://oregoneconomicanalysis.com/2020/05/28/covid-19-regional-outlook/
2 of 4 6/11/2020, 10:13 PM
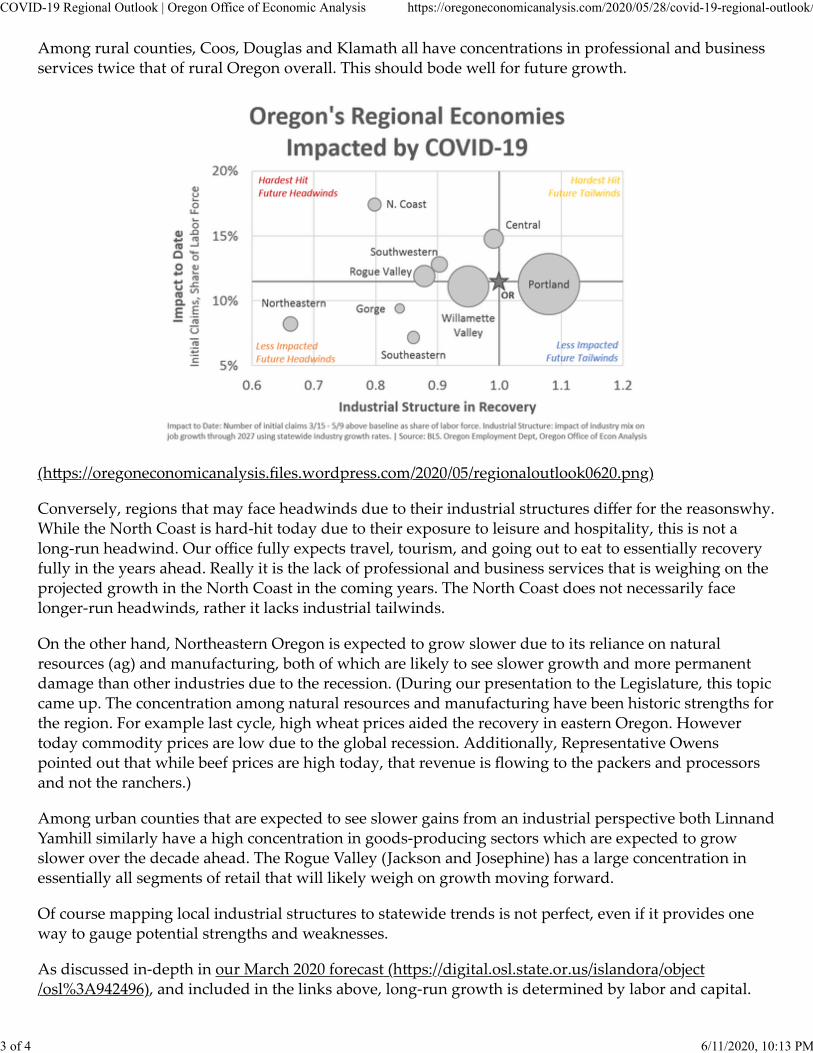
Among rural counties, Coos, Douglas and Klamath all have concentrations in professional and businessservices twice that of rural Oregon overall. This should bode well for future growth.
(https://oregoneconomicanalysis.files.wordpress.com/2020/05/regionaloutlook0620.png)
Conversely, regions that may face headwinds due to their industrial structures differ for the reasons why.While the North Coast is hard‐hit today due to their exposure to leisure and hospitality, this is not along‐run headwind. Our office fully expects travel, tourism, and going out to eat to essentially recoveryfully in the years ahead. Really it is the lack of professional and business services that is weighing on theprojected growth in the North Coast in the coming years. The North Coast does not necessarily facelonger‐run headwinds, rather it lacks industrial tailwinds.
On the other hand, Northeastern Oregon is expected to grow slower due to its reliance on naturalresources (ag) and manufacturing, both of which are likely to see slower growth and more permanentdamage than other industries due to the recession. (During our presentation to the Legislature, this topiccame up. The concentration among natural resources and manufacturing have been historic strengths forthe region. For example last cycle, high wheat prices aided the recovery in eastern Oregon. Howevertoday commodity prices are low due to the global recession. Additionally, Representative Owenspointed out that while beef prices are high today, that revenue is flowing to the packers and processorsand not the ranchers.)
Among urban counties that are expected to see slower gains from an industrial perspective both Linn andYamhill similarly have a high concentration in goods‐producing sectors which are expected to growslower over the decade ahead. The Rogue Valley (Jackson and Josephine) has a large concentration inessentially all segments of retail that will likely weigh on growth moving forward.
Of course mapping local industrial structures to statewide trends is not perfect, even if it provides oneway to gauge potential strengths and weaknesses.
As discussed in‐depth in our March 2020 forecast (https://digital.osl.state.or.us/islandora/object/osl%3A942496), and included in the links above, long‐run growth is determined by labor and capital.
COVID-19 Regional Outlook | Oregon Office of Economic Analysis https://oregoneconomicanalysis.com/2020/05/28/covid-19-regional-outlook/
3 of 4 6/11/2020, 10:13 PM
What the really means is it is all about the number of workers an economy has and how productive eachworker is. As such, key issues to watch are migration trends and changes in the working‐age population.Additionally productivity gains can come from many different types of capital, such as financial, natural,physical, human, and/or social.
Looking forward, all of the different types of capital and labor force gains can help drive future economicgrowth. If a regional economy lacks one source, it is not a deathblow to overall growth. Rather it signalsthe area must rely on other types or avenues for growth. Finally, even as the mix between, say, naturaland human capital plays out strongly in our office’s statewide forecast, keep in mind that one source ofgrowth is not inherently better than the others.
Posted in Employment, Miscellaneous, News | Tags: albany, benton, central oregon, clackamas, clatsop,columbia gorge, corvallis, County, covid‐19, covid19, Crook, curry, Deschutes, douglas, Employment,eugene, gorge, Grant, Great Recession, harney, Hood River, jackson, Jefferson, job, Job Loss, josephine,lake, lane, lincoln, linn, malheur, marion, Morrow, multnomah, north coast, northeastern, Oregon, polk,portland msa, portland region, Recession, Regional, rogue valley, salem, salem msa, south coast,southeastern, southwestern, tillamook, Umatilla, Wallowa, wasco, Washington, willamette valley
DemographicsEmploymentGraph of the WeekHousingIncomeLeading IndicatorsMiscellaneousNewsRevenueState Comparisons
Blog at WordPress.com.
COVID-19 Regional Outlook | Oregon Office of Economic Analysis https://oregoneconomicanalysis.com/2020/05/28/covid-19-regional-outlook/
4 of 4 6/11/2020, 10:13 PM
8338 NE Alderwood Road, Suite 160, Portland, OR 97220 Phone: 503.327.2200 • Website: www.foodnorthwest.org
June 15, 2020 Lauren Slawsky Oregon Department of Environmental Quality Office of Greenhouse Gas Programs 700 NE Multnomah Street, suite 600 Portland Oregon 97232 [email protected] RE: Program Options to Cap and Reduce Greenhouse Gas Emissions Dear Ms. Slawsky, Food Northwest appreciates this opportunity to submit comments in response to the Program Options to Cap and Reduce Greenhouse Gas Emissions Preliminary Report. Established in 1914 and headquartered in Portland, Food Northwest (formerly Northwest Food Processors Association) is an association of food producers in Oregon, Washington and Idaho. Many of our members have facilities in Oregon and will be significantly impacted directly or indirectly by the proposed Cap and Reduce Program. Food processing is the third largest manufacturing sector in Oregon. It employs 32,000 people and with multiplier effect supports about 80,000 jobs in Oregon. Food Northwest shares the Governor’s goal to protect and improve the environment. In 2009, Food Northwest was the first industry group in the nation to adopt a goal to reduce industry-wide energy intensity by 25% in 10 years and, through innovation, new technologies and resources, achieve a total of 50% in 20 years. We are proud that we have been a national leader in this effort. Having completed the first phase, this year Food Northwest launched the second phase of its goal to reduce industry-wide energy intensity by another 25% in 10 years. Food Northwest provides the following comments on specific issues identified in the Preliminary Report: Rulemaking Process
Page 2 - Food Northwest
Three Separate Sector Regulations The Governor’s Executive Order directs a sector-specific GHG Cap and Reduce Program and identifies three separate sectors: large stationary sources; transportation fuels; and other fuels, including natural gas. It would make sense to organize the rulemaking effort around the development of three separate sector regulations. Rules Advisory Committees We propose that a Rules Advisory Committee (RAC) be established for each of these three sectors. Separate RACs would be more efficient since each RAC would focus on the policies, issues and impacts that specifically relate to that sector. It would also help assure that critical issues receive adequate attention and discussion. The Clean Fuels Program coordination issues are appropriately addressed in the transportation fuels RAC. Each RAC should be comprised of at least 75% by the regulated community. Food Northwest recommends that rural communities and those indirectly impacted by the cost of regulations be represented in each RAC. In sections 2.34, 3.2 and 3.3, DEQ identified a large number of policy issues that need to be considered, evaluated and debated. RAC members should have knowledge and experience with these issues and understand how they impact the regulated community. Associations should not be excluded from participation in the RACs. Food Northwest has a long history of participation on DEQ RACs and other advisory committees. We are able to engage our membership in the process and often individual companies participate in the committee as well to describe specific impacts to their operations. As a result, Food Northwest should be a member of the Large Stationary source RAC (assuming it will be directly regulated) and also the Transportation and Other Fuels RACs as it represents businesses that will be impacted significantly, even if indirectly, by regulations in these sectors. The topics/issues to be considered by the RACs are extremely complex. Flexibility should be built into the schedule to allow additional time to ensure that critical issues receive sufficient discussion. An initial schedule for consideration of topics/issues will allow RAC members to prepare for discussions and provide supporting materials. Moreover, these topics and issues should be thoroughly vetted and discussed prior to draft of the proposed rule. This approach should not
Page 3 - Food Northwest
slow the process, but rather should help in addressing the most difficult questions before the draft rule is prepared. Policies DEQ has identified a number of policy issues in its report. They are worthy of consideration and discussion. Food Northwest highlights several policy issues below that are of particular importance to the food industry. COVID-19 Food Northwest is pleased that DEQ has identified COVID-19 as a policy consideration. This is a historic event that has disrupted our industry and must be taken into account in program development. To keep employees and communities safe has required significant changes in operations and investment in protective measures. Closures of restaurants, food services, and institutions have severely reduced or eliminated demand for many of our products. As a result, we have seen production curtailed, employees laid off or furloughed, and in some instances, short-term or extended plant closures. EITE Designation A second policy issue that is very important to food processors is designation of emissions intensive and trade exposed (EITE) industries. We agree with the Vivid Economics study conducted for the Carbon Policy Office that determined that food processors must be designated EITE. Under a cap and reduce program natural gas and transportation will become more expensive. This will increase the cost of making food in Oregon by an industry that is already, prior to COVID-19, operating on some of the thinnest margins of any business sector. Allocation of Compliance Instruments A 100% allocation of compliance instruments to food processors is necessary to prevent carbon and economic leakage in the food industry. Vivid Economics determined that leakage of food processors is a very real risk. This is especially true for potato companies who already have facilities in Idaho where there is little chance of carbon pricing regulation.
Page 4 - Food Northwest
This 100% allocation does not give food processors a free pass. Allocation of free compliance instruments would be equal to the EITE facility’s emissions so long as the facility is implementing Best Available Technology requirements, which will reduce carbon emissions. This approach was included in the 2020 legislative session’s SB 1530. We believe it is the best approach because it assures timely emissions reductions and allows food processors to devote funds to reducing emissions rather than purchasing allowances. Points of Regulation Food processors support stationary sources as the point of regulation, which includes on-site fuel combustion and process emissions. We prefer to be directly responsible for emissions reductions instead of regulated through our fuel suppliers. Thank you again for this opportunity to comment on the Preliminary Report. Food Northwest looks forward to participating in every phase of this rulemaking process. Please contact me if you have any questions regarding our comments or would like additional information. Sincerely,
Pamela Barrow Vice President Energy, Environmental & Sustainability
2035 NW Front Ave. Ste. 101. Portland, OR. 97209 forthmobility.org
June 12, 2020
Richard Whitman, Director Oregon Dept. of Environmental Quality 700 NE Multnomah Street, Suite 600 Portland, OR 97232-4100
RE: Comments on Phase 1 of DEQ’s “Program Options to Cap and Reduce GHG Emissions”
Dear Director Whitman,
I write to you today on behalf of Forth, a nonprofit trade association that advocates for the advancement of electric, hydrogen, shared, smart, connected, and autonomous mobility. Forth has more than 180 members, including auto manufacturers, electric vehicle charging suppliers, industry partners, utilities, local governments, and non-profit environmental organizations. We are pleased to provide these brief comments on your May 2020 report on the cap and reduce program directed in Governor Brown’s Executive Order 20-04.
As you know, Oregon is already behind in meeting its ambitious greenhouse gas reduction goals. Given that the transportation sector is now the state’s largest source of greenhouse gas emissions, it is critical that we take immediate and significant steps to reduce our transportation emissions. One of the best ways we can do that is to rapidly increase the electrification of our various transportation modes. Indeed, the Oregon Department of Transportation (ODOT) has suggested that 95% of Oregon’s vehicles will need to be electric, plug-in hybrids, or hybrids by 2050 in order to achieve our emissions reduction goals. Furthermore, both EO 20-04 and SB 1044 have made it clear that the rapid transition from internal combustion engines to zero-emission vehicles will need to play a key role in reducing emissions from the transportation sector.
As your agency begins its consideration of how to shape the cap and reduce program directed by the EO, Forth requests that you do so with an eye toward the transportation electrification (TE) options at your disposal. We recognize that addressing transportation emissions will present a different set of challenges from your regulation of stationary sources, but we believe that TE can and must play a significant role in those emission reductions. We look forward to assisting DEQ in exploring those options as you move forward with your policy development and rulemaking later this year. If you wish to incorporate the TE perspective into the planned Rulemaking Advisory Committee, we would be happy to assist in finding the right representative for that purpose.
Thank for considering our comments and please let me know if Forth can be of further assistance.
Sincerely,
Rhett Lawrence Pacific Northwest Policy Manager
1
June 15, 2020 Submitted via electronic mail Oregon Department of Environmental Quality 700 NE Multnomah St., Ste. 600 Portland, Oregon 97232
Re: Comments on Program Options to Cap and Reduce Greenhouse Gas Emissions Preliminary Report
The Green Energy Institute at Lewis & Clark Law School, Neighbors for Clean Air, Columbia Riverkeeper, 350PDX, and Center for Sustainable Economy appreciate the opportunity to comment on the Department of Environmental Quality’s Program Options to Cap and Reduce Greenhouse Gas Emissions preliminary report. We support DEQ’s efforts to develop an inclusive stakeholder-driven process to inform and guide the design of Oregon’s cap and reduce program. While the urgency of the climate crisis necessitates swift and ambitious action to reduce greenhouse gas emissions, it is imperative for the agency to design an effective program that maximizes climate and societal benefits while minimizing and mitigating adverse impacts to Oregon’s underserved frontline communities. In addition to establishing a greenhouse gas cap and reduce program for Oregon, Governor Kate Brown’s Executive Order 20-04 (EO 20-04) issued general directives to DEQ and other state agencies to prioritize and accelerate greenhouse gas reductions through additional agency actions, and to coordinate with other state agencies to achieve certain objectives. While DEQ’s preliminary reports on EO 20-04’s specific directives to the agency, including the cap and reduce program, DEQ’s preliminary reports do not identify strategies to implement Governor Brown’s general directives or increase coordination between DEQ and other state agencies or between the various departments within DEQ itself. Part I of these comments provides input on EO 20-04’s general directives. Part II provides feedback and responses to the specific questions DEQ solicited in its preliminary cap and reduce report.
I. Comments on General Directives and Coordination Needs We strongly encourage DEQ and the Environmental Quality Commission (EQC) to incorporate the general directives of EO 20-04 into each of their proposed implementation strategies and to develop a more holistic strategy for administering all of the EO requirements. DEQ has chosen to segment it proposed implementing strategies and to assign responsibility for administering the
2
EO’s specific directives to separate departments within the agency. While DEQ may believe this segmentation will streamline implementation, a lack of a cohesive strategy appears likely to result in regulatory gaps and missed opportunities to take advantage of complementary program benefits. The most overt regulatory gap is the absence of any strategy for DEQ to implement or even consider the general directives that apply to all state agencies that are named in the EO, including DEQ and the EQC. Specifically, EO 20-04 requires all named state agencies to:
a. exercise any and all authority and discretion vested in them by law to help facilitate Oregon’s achievement of the GHG emissions reduction goals;
b. prioritize and expedite any processes and procedures that could accelerate reductions in GHG emissions to the fullest extent allowed by law;
c. consider and integrate climate change, its impacts, and the state’s GHG emissions reductions goals into all planning, budgets, investments and policy making decisions to the fullest extent allowable by law.
DEQ has provided no indication of how it intends to implement these general directives or incorporate them into its implementation strategies. Instead, the agency has written separate initial reports regarding its preliminary implementation plans for each of its specific directives (i.e., cap-and-reduce, clean fuels, landfill emissions, etc.) with no reference to the general directives. DEQ is not exempt from the general directives, and each of its implementation plans should incorporate explanations of how the agency will follow both its specific program obligations and the general directives. DEQ and the EQC, in fact, have taken several actions since Governor Brown issued the EO in March that work in contravention of the general directive mandates. Most notably, shortly after the release of the EO, DEQ recommended that the EQC deny a petition to regulate emissions of black carbon, greenhouse gases, and other diesel pollutants from indirect sources. The EQC subsequently denied the petition. DEQ also supported a temporary waiver in fuel blending requirements in response to oil industry requests. Neither of these actions is consistent with exercising “any and all authority and discretion” to facilitate achievement of GHG emissions reductions goals or integrating climate change into all policy making decisions. Integrating these general directives into the cap-and-reduce program would bolster DEQ’s ability to accelerate emissions reductions and design an ambitious cap. The general directives require DEQ and the EQC to “prioritize and expedite any processes and procedures that could accelerate reductions in GHG emissions to the fullest extent allowed by law.” These directives thus empower DEQ and the EQC to design a program with a stringent emissions cap that would lower quickly in the near term. The general directives also support DEQ and the EQC maximizing their legal authority to regulate emitting sources. DEQ and the EQC should therefore not only follow the general directives out of a sense of obligation; they should use the general directives to help them develop the most effective regulatory programs possible. To the extent DEQ needs an example of how an agency can integrate the general directives into implementation plans, we encourage DEQ to follow the lead of the Oregon Public Utility
3
Commission (PUC). In the PUC’s draft implementation report, the agency acknowledges its obligations to follow the same general directives that apply to DEQ and a set of specific directives that apply only to the PUC. The PUC’s report then integrates both the general and specific directives into a holistic proposal for complying with the EO. While the PUC, like DEQ, must pursue a number of individual actions, its report indicates that PUC is actively thinking about how it can effectively integrate and harmonize its efforts into a more comprehensive strategy. We urge DEQ to engage in the same type of comprehensive and strategic planning. Based on the draft implementation plans it released, DEQ seems to be working in self-imposed siloes that will undermine decarbonization efforts and neglect the general directives. It is critical that the agency transparently explain how it will operationalize the general directives and maximize its authority to abate climate change and its impacts. The EO also directs DEQ to participate in an interagency working group with the Governor’s Office and other agencies to address climate impacts to impacted communities and coordinate strategies to guide climate action. Unfortunately, DEQ’s preliminary cap and reduce work plan does not identify a strategy for interagency coordination or make any reference to how DEQ will work with other agencies. This is in stark contrast to the PUC’s plan, which describes in some detail why coordination between the PUC, DEQ, and EQC are so important. Additionally, DEQ’s preliminary work plan fails to identify strategies for facilitating internal coordination and cooperation within the agency itself. DEQ’s siloed approach to EO implementation creates the risk that the agency will forego opportunities to take advantage of programmatic synergies. For example, DEQ has described emissions regulation as potentially regressive, because it may raise costs on lower-income communities. But DEQ is also responsible for developing a sustainable transportation strategy (STS) and for overseeing the clean fuels program, both of which provide opportunities to mitigate any potentially regressive impacts. If the greenhouse gas reduction program staff are not actively coordinating with DEQ staff responsible for clean fuels and the STS, this creates a heightened risk that DEQ will develop a weak emissions cap under the misapprehension that it is somehow acting justly. Similarly, DEQ’s preliminary cap and reduce work plan fails to identify efforts to coordinate with the agency’s air quality division to develop and implement programs to reduce emissions of greenhouse gases and other criteria pollutants simultaneously. Indirect source rules, for example, provide an opportunity to reduce greenhouse gas emissions while also reducing emissions of harmful particulate matter. We recognize that DEQ faces a heavy burden to design multiple implementation plans in a relatively short timeframe, and we realize it may be daunting for the agency to also integrate the general directives and more coordinating strategies into its implementation efforts. But fulfilling those burdens now will lead to a much more effective program in the future.
4
II. Responses to Specific Requests for Feedback
1. How might DEQ best coordinate the public engagement aspects of Cap and Reduce and Clean Fuels rulemaking?
This is a challenging time for public engagement given the pandemic sweeping the globe and attendant public health restrictions on large gatherings. Many best practices—including a primary focus on in person, discussion-based engagement—are very challenging to implement at this time. But public officials must do everything in their power to maximize the ability of the public to continue observing and participating in governmental decision-making. Youth, communities of color, and low income communities are underrepresented in these processes at the best of times, and the pandemic has deepened existing inequalities. This trend will continue to develop as federal resources dry up and housing, jobs, and healthcare access become increasingly unstable. The same populations who are struggling now will be disproportionately affected by climate change and its impact on already stressed economic, health and infrastructure systems. So it is time, as DEQ works toward policies that allow the agency to address the challenges of the pandemic, to start truly prioritizing environmental justice in every public process as we try to address climate change and other environmental threats to the state. One of the primary goals of environmental justice, as defined by the Environmental Protection Agency, is the meaningful involvement of disproportionately impacted communities,1 in the hope that creating more equal access to decision-making processes will start to reduce historically disproportionate environmental harm, particularly to black, indigenous and latino communities. EPA states that meaningful involvement requires that: ● People have an opportunity to participate in decisions about activities that may affect
their environment and/or health; ● The public's contribution can influence the regulatory agency's decision; ● Community concerns will be considered in the decision making process; and ● Decision makers will seek out and facilitate the involvement of those potentially
affected.2
This last point is the most critical in developing a public engagement strategy for the cap and reduce program scoping and rulemaking processes, in which already overwhelmed community based organizations (CBOs) may not evince preexisting concern and/or involvement in this process because of the many layers of harm falling disproportionately on their members. It is the duty of the agency to seek out and facilitate the involvement of environmental justice communities. The most efficient way to do this within existing agency engagement structures is to reach out early and often in this process to CBOs that represent the interests of black, indigenous, Latino, Asian and low income people, rather than waiting for them to initiate
1 U.S. Envt’l Protection Agency, Learn About Environmental Justice, https://www.epa.gov/environmentaljustice/learn-about-environmental-justice. 2 Id. 3 Cal. Nat. Resources Agency, Online Environmental Engagement - Building Our Skills Together - June 2-4 2020 2 Id.
5
engagement. This should be an explicit priority over the engagement of other stakeholders, given the historical failure to meaningfully involve these communities in decision-making processes. Reaching out directly to a variety of organizations does take time and effort up front, but should be more feasible with the involvement of a public engagement firm and the Community Liaison and Engagement Coordinator hired during the implementation of Cleaner Air Oregon.
The definition of environmental justice’s inclusion of equal access is also worth special consideration. What does equal access to this decisionmaking process look like for environmental justice communities? Industry stakeholders have access to technical experts to help them fully understand proposed policies and how they might impact them. Ideally, equal access for environmental justice communities would include not just translation services or more time to fully analyze proposals, but access to technical expertise to assist in making informed decisions about the policy.
Given the challenging atmosphere and capacity for public engagement right now, as well as the historical lack of technical expertise afforded to community-based groups, it is critical to consider the quality of engagement as well as the quantity of stakeholders engaged. The agency should consider what kind of input they are asking stakeholders to provide. At its current stage, the cap and reduce program, somewhat understandably, is extremely skeletal. While it makes sense to have stakeholder involvement drive which elements are included in a cap and reduce program, most stakeholders from the community as well as from regulated entities are not policy experts, especially on something as complex as carbon pricing. Furthermore, the agency is required to operationalize this program by January 2022. In order to meet timeline requirements and enhance quality of engagement, DEQ should carefully consider its methodology. Rather than presenting stakeholders with open-ended questions, DEQ should consider giving stakeholders a choice between various program elements or options. DEQ started to work toward this with the Hazard Index Rulemaking to some extent, offering two options for rulemaking for RAC members to choose between. This method can be even more useful when agencies provide explicit acknowledgment of potential tradeoffs. For example, giving pros and cons for a certain program element can help foster community understanding and make the feedback process easier to approach than starting with nothing.
2. How should DEQ engage with communities and individuals with limited/no internet access?
Similarly to the recommendations provided in the preceding subsection, we urge DEQ to reach out—early and often—to Latino community organizations, tribal representatives and other CBOs that work with communities with unreliable internet access to ask: a) how they are reaching people offline throughout the pandemic and b) if they can join scoping level conversations to represent their membership/communities. We have heard in our work with partner organizations that Latino community members often lack reliable internet access, and because of the conditions on reservations it seems likely that would also be an issue for some indigenous communities in Oregon. Often, the best way to promote engagement at a community level is to tap into organizations working within those communities and start building trust there, so as to conduct
6
engagement through preexisting organizing channels. These CBOs may have better insight into culturally specific and relevant outreach models in this unprecedented time.
3. What additional engagement strategies should the agency consider under Phase 2 scoping work?
The California Natural Resource Agency and California EPA hosted a series of webinars on online environmental engagement that may be helpful in designing DEQ’s public engagement process.3 Having reviewed these materials, primary takeaways include: ● Reach out to CBOs early and often, as emphasized elsewhere in these comments; ● Collect and monitor demographics where possible to determine who is participating; ● With the rise in smartphone ownership and recent trends toward online access on mobile
devices, it is critical that all tools be equally accessible on mobile devices as on desktops; ● Do not require use of technologies like AdobeConnect or WebEx (which requires almost
unlimited browser privacy permissions), which may be unfamiliar or overly complex for community use. Use Zoom instead;
● Require Zoom facilitation training for all staff who will be required to engage in this process, including use of breakout groups or other interactive tools;
● Be prepared to offer simultaneous language interpretation and closed captioning via Zoom;
● Collect all agendas, minutes, and other relevant documents for the program on one central user friendly webpage that is frequently updated, and have an offline-accessible folder to share upon request;
● Provide options for those without internet (phone, safe in-person); ● Properly notify the public of meeting times, agendas, and details for remote participation
72 hours in advance; ● Use visuals to communicate complex concepts to avoid the use of technical jargon; ● Use quick surveys to collect community feedback after program development options
have been shared; giving options to choose between with acknowledgement of tradeoffs can help foster community understanding;
● Acknowledge that this form of engagement has inherent limitations for two-way communication, discussion and relationship building; increase direct contact to CBOs seeking out opportunities for that type of engagement outside of webinars. To some extent, this can be moderated by focusing on preregistered conversations in smaller groups after information is shared to gather more feedback on specific program elements.
4. Are the policy issues identified under “Stakeholder Engagement” in subsection 2.3.4.
and those in subsections 3.2. and 3.3. appropriately inclusive of issues, concerns and considerations needing discussion?
DEQ’s preliminary report identifies a broad list of policy considerations and program design options to evaluate through the scoping and rulemaking processes. We appreciate the agency’s commitment to solicit public input on program design options and their potential implications 3 Cal. Nat. Resources Agency, Online Environmental Engagement - Building Our Skills Together - June 2-4 2020 (May 11, 2020) https://resources.ca.gov/Newsroom/Page-Content/News-List/Online-Environmental-Engagement.
7
during the forthcoming scoping phase, and we welcome the opportunity to provide input on the specific policy considerations identified in the report over the coming months. In response to DEQ’s specific requests for feedback on the policy issues identified in the preliminary report, we urge the agency to address several additional considerations and design options throughout the scoping and rulemaking processes. First, DEQ should expand the scope of its proposed cost containment stakeholder engagement workshop to include societal and environmental costs associated with climate change impacts. Second, the additional policy issues and design mechanisms identified in subsection II.4.b should be raised for consideration during the scoping phase.
a. Stakeholder Engagement Workshops We support the agency’s proposal to host topic-specific workshops in 2020 to solicit public input on cap and reduce program design and desired outcomes. However, we urge the agency to expand the scope of the cost containment workshop proposed under subsection 2.3.4. to include a discussion of the potential cost impacts resulting from inaction or insufficient action to reduce emissions. Greenhouse gas emitting industries and sectors currently externalize the costs related to their emissions onto the general public, rather than internalize those costs into their own business models. By proposing to focus the cost containment workshop discussion on costs to regulated industries rather than the public at large, DEQ has implied that it prioritizes minimizing financial impacts to emitters rather than protecting the general public from expensive climate change externalities. Instead, DEQ should prioritize minimizing financial impacts to the public, and particularly impacts to vulnerable frontline communities. We strongly urge the agency to shift its priorities and reframe the topic of the proposed cost containment workshop to reflect this community-centered focus. Society incurs substantial costs resulting from anthropogenic climate change, and the vast majority of these costs are currently born by the general public rather than by the commercial entities that profit from greenhouse gas-emitting activities. The Intergovernmental Panel on Climate Change (IPCC) projects that global temperature increase of 1.5ºC will cause $54 trillion in global damages by 2100.4 This estimate reflects potential societal costs under a scenario in which we take swift and meaningful action to reduce greenhouse gas emissions. If, however, we fail to take quick and decisive action, the projected costs on society increase to a staggering amount. Scientists estimate that a global temperature increase of 3.7ºC over pre-industrial levels would cause $551 trillion in global damages by 2100.5 To put this estimate into perspective, $551 trillion exceeds all of the wealth that currently exists in the world.6 In other words, if we fail to significantly reduce greenhouse gas emissions in the near term, the costs will likely exceed the global economy’s capacity to pay for climate-related damages. Under current legal and regulatory frameworks, the costs of climate change are and will continue to be disproportionately born by frontline communities. DEQ has an opportunity to develop cap 4 INTERGOVERNMENTAL PANEL ON CLIMATE CHANGE, SPECIAL REPORT: GLOBAL WARMING OF 1.5ºC ch. 3, p. 264 (2018), https://www.ipcc.ch/site/assets/uploads/sites/2/2019/06/SR15_Chapter3_Low_Res.pdf. 5 TYNDALL CENTRE FOR CLIMATE CHANGE RESEARCH, RISKS ASSOCIATED WITH GLOBAL WARMING OF 1.5ºC OR 2ºC (May 2018), https://tyndall.ac.uk/sites/default/files/publications/briefing_note_risks_warren_r1-1.pdf. 6 Felix Salmon, The Cost of Climate Change (Oct. 14, 2018), https://www.axios.com/climate-change-costs-wealth-carbon-tax-303d7cff-3085-49d9-accb-ec77689b9911.html.
8
and reduce rules that shift these cost burdens off the shoulders of Oregon’s vulnerable communities and onto the industries and sectors that produce the majority of the state’s greenhouse gas emissions. DEQ’s stakeholder engagement workshops should solicit public input on strategies to rebalance climate cost inequities.
b. Additional Policy Issues for Consideration DEQ has done a commendable job in identifying a wide variety of important policy considerations that should be addressed during the scoping phase. We urge agency decision-makers to take some additional issues into account while evaluating various program options. First, in addition to the general policy considerations listed under subsection 3.2 of the report, DEQ should consider the following impacts, mechanisms, and opportunities:
• Opportunities to maximize the scope of the cap and reduce program in accordance with the agency’s broad legal authority to regulate greenhouse gas emissions;
• Mechanisms for protecting the resiliency of the cap and reduce program in the event of policy shifts at the state or federal level;
• Potential impacts or implications of not adequately reducing greenhouse gas emissions or failing to craft sufficiently ambitious cap and reduce rules, including potential equity and environmental justice harms resulting from catastrophic climate change; and
• Opportunities for the agency to support tribes, local governments, communities, and other partners to facilitate cooperative and coordinated implementation of programs and rules.
Second, in addition to the key policy questions identified in subsection 3.3 of the report, DEQ should consider the following issues and design options:
• When identifying emissions baselines, the agency should consider whether and how the current economic downturn may permanently reduce activity in specific sectors. Baselines based exclusively on pre-2020 historical emissions may be too high if some emissions intensive industries fail to rebound following the pandemic.
• When considering how to structure emissions limits under the cap and reduce program, the agency should prioritize options that will ensure achievement of Oregon’s greenhouse gas reduction goals. Intensity-based emissions standards could fail to reduce emissions over time if regulated industries or sectors expand in the state. The agency should also consider adopting precautionary response mechanisms that would trigger automatic reductions in statewide, sector-specific, and/or source-specific caps if emissions exceed certain thresholds.
• The agency should consider the implications and risks of allowing regulated sources to bank compliance credits, particularly for long periods of time, and whether compliance credit banking could impede long-term emissions reductions.
• The agency should consider whether regulatory efforts to moderate compliance costs could diminish the value of compliance credits in a competitive credit market.
• In considering potential alternative compliance instruments, the agency should account for differences between the biogenic and fossil carbon cycles and ensure that emissions reductions in one cycle only offset carbon emissions from within that same cycle. For example, the agency should not permit regulated entities to offset fossil carbon
9
emissions through alternative compliance instruments created through reductions in biogenic carbon emissions.
5. How should the agency approach identifying and selecting interested parties to serve on the Rules Advisory Committee(s)?
The process for identifying and selecting Rules Advisory Committee (RAC) members should reflect the overarching purpose of the Governor’s executive order and the urgency of the climate crisis. While the rulemaking process should consider all stakeholder views, the agency should take care to ensure that RAC membership does not disproportionately reflect the views of commercial entities or economic sectors that have a vested interest in delaying decarbonization. If the agency allows potentially regulated entities to have a majority voice on a RAC, it risks diluting the ambition of the entire cap and reduce program. To mitigate this risk, the agency should ensure that community members have equal or more representation on all cap and reduce RACs. For every industry representative appointed to a committee, the agency should appoint at least one representative from a nongovernmental organization (NGO) or community group committed to decarbonization. The agency should also respect the diversity of viewpoints within the NGO community, just as it would between regulated industries. For example, an electric utility, a timber company, and a gas station may have similar objectives but not uniform interests, and the agency should not assume that all decarbonization-focused NGOs share uniform interests either. RACs should reflect the diverse views that exist within the NGO community. To identify interested parties to serve on the RACs, the agency should invite nominations, including self-nominations, for RAC membership. If the agency receives multiple nominations representing a specific interest or perspective and is unable to give all nominees a seat on a RAC, the agency should contact the associated individuals or organizations and give them an opportunity to select the number of participating representatives. Finally, the agency should appoint RAC members who are willing to develop solutions to challenging problems, rather than members who are likely to use their participation to disrupt the process and delay decarbonization. The process will not benefit from contentiousness or unproductive conflict. Similarly, the agency should not appoint anyone to the RAC who denies the legitimacy of climate science or other basic scientific realities.
6. What perspectives and expertise are critical in terms of Rulemaking Advisory Committee member participation?
RAC members should possess diverse subject matter expertise and reflect diverse perspectives. It is critical that the RAC include members with expertise in:
• law and policy, including knowledge and understanding of state and federal air quality laws, including the federal Clean Air Act; administrative law; constitutional law; energy law and electricity regulation; greenhouse gas regulation; and cap and trade policy;
• economics, including knowledge and understanding of the social cost of carbon and climate-focused cost-benefit analyses;
10
• sociology and behavioral economics, including knowledge and understanding of individual and commercial behavioral responses to economic pressures;
• deep decarbonization modeling and scenario analysis; • carbon offsets, including knowledge and understanding of forest practices and forest-
based carbon sequestration; • environmental justice and equity; • transportation, including knowledge and understanding of transportation electrification
technologies and market trends and projections; • zero-emissions technologies, including knowledge and understanding of renewable
energy, energy storage, power-to-gas, and vehicle electrification technologies; and • sustainable building and construction, including knowledge and understanding of energy
efficiency products and practices. It is also critical for RAC membership to reflect perspectives on:
• Environmental justice; • Communities of color and frontline communities; • A just transition; • Climate action through market-based mechanisms; • Climate action through means other than market-based mechanisms; and • Labor, with a focus on a just transition.
In order to facilitate meaningful involvement of underrepresented communities on a RAC, wherever possible appointees from those communities should be promptly paid for their time and expenses, including childcare.
7. Given the potential wide-reaching scope of proposed rules, how should the agency organize the Rulemaking Advisory Committee process to ensure critical issues receive adequate attention and discussion?
The agency should convene a central RAC that is tasked with reviewing and synthesizing discussions, findings, and recommendations produced by several policy or design-focused subcommittees. The agency should also convene a series of sub-RACs focused on discrete policy considerations and program design elements. The central RAC’s membership should represent the diverse expertise and perspectives listed in subsection II.6 and reflect balanced viewpoints as noted in subsection II.5. While subcommittee members should possess expertise relevant to the subcommittee’s specific focus area, the agency should also include the same level of full and fair representation as the central RAC. The agency should require each member of the central RAC to serve on at least two subcommittees, and should consider requiring members to serve on at least one subcommittee with a focus area outside the RAC member’s area of expertise or interest. This structure could help prevent RAC members from being pigeonholed or marginalized due to their specific interests or views. The agency should direct subcommittees to keep and submit detailed meeting minutes so the central RAC can be confident each subcommittee is functioning effectively and fairly considering diverse views.
11
III. Conclusion The unprecedented urgency and scale of the climate crisis has created a need for bold, ambitious regulatory action to reduce greenhouse gas emissions. Governor Kate Brown’s Executive Order 20-04 has the potential to create a comprehensive, coordinated statewide framework to facilitate emissions reductions within all economic sectors—but only if state agencies commit to exercise their full legal authorities to regulate sources of emissions and facilitate the transition to a carbon-free energy system. By directing the agency to establish a cap and reduce program, Governor Brown has given DEQ an opportunity to help drive a just transition to a cleaner, healthier, more equitable economy that benefits all Oregonians. But with this opportunity comes the responsibility to address the needs and concerns of historically underserved and underrepresented communities and minimize and mitigate adverse impacts on frontline communities that are already disproportionately affected by climate change. DEQ can exercise this responsibility by prioritizing environmental justice and equity considerations throughout the rulemaking process. Achieving a truly just transition will require regulated industries to internalize many of the future costs associated with their carbon emissions, particularly costs that have historically been externalized onto society at large. DEQ should take existing and projected externalities into account when weighing the costs and benefits of different program designs. The agency should also take into account the climate-related risks that could manifest if cap and reduce rules lack sufficient ambition or fail to effectively spur meaningful emissions reductions by regulated sources. Our window to achieve the level of emissions reductions necessary to prevent global temperatures from increasing beyond 1.5 degrees Celsius is narrowing by the day. It is imperative that DEQ and the EQC act quickly, justly, and effectively to reduce carbon emissions.
Sincerely, Amelia Schlusser, J.D., LL.M Staff Attorney, Green Energy Institute at Lewis & Clark Law School Tori Heroux, J.D. Program Director, Neighbors for Clean Air Erin Saylor, J.D. Staff Attorney, Columbia Riverkeeper Emily Krafft 350PDX Nicholas Caleb, J.D., LL.M. Staff Attorney, Center for Sustainable Economy
1
Oregon Department of Environmental Quality June 12, 2020 [email protected] RE: DEQ equitable process for cap and reduce In this letter I comment on how the DEQ can improve outreach to communities of color and tribes as part of the cap and reduce phase 1-3 rulemaking process. In the Governor’s executive order on climate, impacted communities are defined as tribes, communities of color, rural and coastal communities. Is this how the DEQ will be defining the term impacted communities? To coordinate outreach with Oregon communities of color and tribes, and to make the process two-directional and more equitable, the DEQ should:
● Create and advertise an application process for community groups focused on serving communities of color who want to be involved with cap and reduce.
○ On advertising, the U.S. Census serves as a good example. The Census partners with an organization that serves people of color and has state-wide networks with social justice groups. For the 2020 Census that is APANO, who connects other social justice groups to Census information for outreach. The DEQ could work with a social justice group, a union, a tribal group to help advertise to other groups. The groups helping with advertising would still need to apply to have a representative on the Rulemaking Advisory Committee.
○ On the application, it will ask groups if they want: (1) a phase one listening session for their leaders/members in Spanish or English, (2) a phase two consultation meeting(s), (3) a seat on the Rulemaking Advisory Committee.
○ In the application ask how the group coordinates with people who do not have internet service. Do they have phone meetings, a community center, meetings at local libraries, etc.?
○ In the application, ask about (1) their main concerns about climate change, (2) their main concerns about the process of rulemaking for a cap and reduce program, and (3) their main concerns about the content of a DEQ cap and reduce program.
○ In the application ask how they would contribute to diversifying voices (demographics, geographic location, etc.) for feedback or the Rulemaking Advisory Committee.
2
○ In the application ask about their capacity to participate in consultation meetings and the Rulemaking Advisory Committee (summarize responsibilities and time commitment). Do they have the capacity to meet during business hours or would evenings and weekend meetings make participation more possible? (Is the DEQ willing to meet after hours?)
● The DEQ should create scholarships that would compensate groups with a representative on the Rulemaking Advisory Committee like a stipend for their participation. It is problematic to expect people who are a part of and serve oppressed communities to volunteer their time. Their time and perspective is valuable. Particularly in this time of economic hardship due to Covid-19, the DEQ needs to think about the tradeoffs that social justice groups are making when they focus on climate rather than food banks, etc.
● In addition to synchronous listening sessions (at a specific date/time). The DEQ should collect feedback based on asynchronous methods (people can tune in when their schedule allows). Recordings of PowerPoint/voice presentations should be available online in Spanish and English. Descriptions of the cap and reduce program, and the harms it is trying to address, should minimize jargon and follow newspaper guidelines (be understandable to a person with an 8th grade education).
● The capacity of the Environmental Justice Task Force (EJTF) to respond to the DEQ is unclear. The EJTF is underfunded and relies on volunteers. On their website it says: “VACANT SEAT - Commission on Indian Services.” The Governor’s office needs to improve funding and capacity at the EJTF so that they can act as an effective partner in this process.
● Impacted communities and tribes are listed last in the DEQ report after regulated sectors. What proportion of consultation meetings or advisory seats will go to community groups focused on serving communities of color? Academic studies show that a minimum of 35% of the people on a committee need to be people of color in order for their voices not to be drowned out. Also, clarify the decision-making power that representatives will have (a vote, majority rules, advisory only and no decision-making power?).
● Communication to tribes is formalized in the DEQ report, but communication from tribes to the DEQ is not. This risks a top-down relationship where people with less institutional power are expected to listen but have no formalized mechanism to respond. Feedback may get folded in with comments from the general public. Tribes and all groups should be asked how they want to communicate with the DEQ and that should be formalized as part of the process.
3
● Truly equitable, collaborative work takes more time at the beginning of a project, but saves time during implementation due to stakeholder buy in. One cannot add an equity component to a typical timeline and expect to stay on schedule. The DEQ needs to plan more time at the beginning of the process for equitable outreach and discussion within the Rulemaking Advisory Committee.
● The Rulemaking Advisory Committee needs to define and track measures for equity outcomes. If something is not measured it is usually ignored in follow-up work. Measures should include benefits to impacted communities and not just reduced harms.
Equality emphasizes sameness and implies that everyone should be treated the same. However, equity emphasizes fairness, where people are treated based on what they need. Equity recognizes differences in opportunities, resources, and the systemic barriers that prevent participation in formal state politics. Please take these comments into consideration for the next DEQ report on cap and reduce. Sincerely, Prof. Janet Lorenzen Willamette University Department of Sociology 900 State Street Salem, OR 97301
June 15, 2020
Richard Whitman, Director
Department of Environmental Quality
700 NE Multnomah Street, Suite 600
Portland, OR 97232-4100
Director Whitman,
On behalf of the thousands of Oregon small business members of NFIB, many being the
smallest of small businesses, I am contacting DEQ today in response to the agency’s
request for comments on the cap and reduce preliminary report in response to Executive
Order 20-04, specifically relating to the potential impacts of proposed rules on small
businesses. DEQ asked stakeholders to respond to several questions listed in section 4 of
the report:
1. How might DEQ best coordinate the public engagement aspects of both the effort
described in this report on cap and reduce program or programs development and
the Clean Fuels Program expansion?
DEQ should create and maintain a one-stop online portal that is easy to navigate and
provide every link and document relating to Executive Order 20-04, including how each
state agency is involved and how Oregonians, specifically small businesses, may be
impacted by each element of the program. The portal should clearly communicate to
impacted groups and individuals how they can participate in the forthcoming rulemaking
process. DEQ should clearly identify any and all groups or individuals that may suffer
financial harm as a result of EO 20-04, as well as any and all groups or individuals that may
receive a financial benefit from the order.
2. How should DEQ engage with communities or individuals with limited or no
internet access?
DEQ should host in-person meetings across the state, in each and every impacted
community – both rural and urban, with the content of the meetings focused on the
information from the online portal. DEQ should invite representatives of print, television,
and online media to each meeting, taking care to emphasize any and all impacts of the
program on specific industries, companies, and/or local communities, especially cost-
related impacts on small businesses. DEQ should welcome public comment at each
meeting, providing ample time for public testimony, and when necessary, prioritizing
testimony from members of each community that may suffer a financial hardship as a
result of the program.
3. What additional engagement strategies should the agency consider during the
Phase 2 scoping work?
DEQ should actively work to engage consumers, families, and small businesses in each
phase of the program. Oregonians need to fully understand the costs/benefits of a cap and
reduce program so that they can accurately assess whether the program has the potential
for a good public return on investment – for each local community, and the state as a
whole.
4. Are the policy issues identified under “Stakeholder Engagement” in subsection
2.3.4. and those in subsections 3.2. and 3.3. appropriately inclusive of issues,
concerns and considerations needing discussion?
a. What other issue areas should the agency convene stakeholder meetings
for?
b. What other approaches to organizing stakeholder conversations should the
agency consider?
“The potential fiscal impacts of policy options to consumers and businesses, including small
businesses” is bulleted in subsection 3.2, but these stakeholders should be key to every
phase of the program and its development. Small business owners need to understand the
potential costs associated with the program – and workers need to know how the program
could impact their jobs, wages, etc. Every Oregonian needs to understand what they can
expect to pay for the program – and what measurable results they can expect in exchange
for what they pay.
5. How should the agency approach identifying and selecting interested parties to
serve on the Rules Advisory Committee(s)
DEQ should take the time to ensure that the RAC selection process is inclusive of the many
stakeholders that will be financially burdened by the program. The process should be open
and transparent, and stand-up to any and all scrutiny from interested parties or the media.
The RAC itself should consist of representatives of regulated industries, small businesses,
and consumers from every corner of the state. Those groups and individuals who stand to
profit from the program should be excluded, as that would be a clear conflict of interest.
6. What perspectives and expertise are critical in-terms of Rulemaking Advisory
Committee member participation?
Businesses and other regulated entities should make up the majority of the RAC because
they have first-hand knowledge and expertise about how regulations impact business
operations – and the potential financial implications for their customers, many of which are
smaller businesses and Oregon households. Other voices at the table should include
groups representing utility ratepayers and energy consumers. Again, those with nothing to
lose and everything to gain from the program should not be allowed a seat on the RAC.
7. Given the potential wide-reaching scope of proposed rules, how should the agency
organize the Rulemaking Advisory Committee process to ensure critical issues
receive adequate attention and discussion?
Oregonians need to be able to weigh in this program, especially given the “potential wide-
reaching scope of proposed rules.” The RAC process must give Oregonians ample time and
opportunity to provide feedback. The process should not move forward merely for the sake
of meeting arbitrary deadlines. Small businesses need to be considered at every step in the
process. With the COVID-19 recovery just now beginning, the cost impacts of a cap and
reduce policy will have an even greater negative impact on Oregon’s smallest employers
than when the economy was running at full steam. The ability to pay more for the same
amount of energy has only been reduced due to COVID-19. Small businesses are doing
everything they can to survive right now and should not be expected to shoulder another
government-induced economic hardship. Now more than ever, state government needs
prioritize Oregon’s home-grown businesses – so they can stay open, and stay in Oregon.
DEQ also requested comments on the key policy questions and options described in
summary form in section 3, particularly in terms of how to frame these questions for
the scoping and public engagement process that will take place between July of this
year and the beginning of formal rulemaking at the end of the year:
Oregonians deserve to know that they are getting what they pay for. If the state expects
Oregon families and small businesses to pay more for their energy usage, they should be
able to insist on the state delivering attainable, measurable results. Oregonians will not
accept another costly government program that fails to provide a sufficient return on
investment.
The RAC must prioritize delivering on the promises of the program. State agencies, at every
stage of the process, need to be open, transparent, and honest with the people of Oregon
on how the program is functioning – and whether they are on track to deliver results on
time. And if not, what went wrong and what it would take to right the ship.
As Oregon emerges from the COVID-19 crisis, public budgets are strained. The same is true
for small businesses and Oregon families. This program should take great care as it
develops to avoid exacerbating these unforeseen economic conditions.
Thank you for your time and consideration,
Anthony K. Smith
NFIB Oregon State Director
1914 Willamette Falls Drive, Suite 260
West Linn, Oregon 97068 t: 503.344.6637 f: 503.344.6693
www.nwga.org Twitter: @nwgas
June 15, 2020 Lauren Slawsky Cory-Ann Wind Oregon Department of Environmental Quality 700 NE Multnomah Street, Suite 600 Portland, OR 97232 Submitted via: [email protected]
[email protected] RE: Comments on ODEQ Report to the Governor concerning Executive Order 20-04 Dear Ms. Slawsky and Ms. Wind:
The Northwest Gas Association (NWGA) represents the three natural gas utilities and two transmission pipelines that provide warmth and comfort to over 2 million Oregon residents (772,000 households), and productive energy for more than 85,000 Oregon businesses and industries.
NWGA members support and are actively engaged in reducing regional greenhouse gas emissions (GHGs). Natural gas plays, and will continue to play, an essential role in Oregon’s clean energy future. We can pursue GHG reduction goals while smartly utilizing 30,000 miles of existing energy infrastructure represented by the natural gas transmission and distribution systems in Oregon.
The Program Options to Cap and Reduce Greenhouse Gas Emissions Preliminary Report raises several important policy questions. Consideration must be given to whether further, and more aggressive, efforts to reduce greenhouse gas emissions would result in leakage or encourage switching to fuels that unintentionally drive leakage and/or increase societal emissions.
Consequently, it will be critical to treat all fuels equally with regard to how lifecycle emissions are calculated. For example, if all upstream and downstream emissions related to natural gas are estimated, the same should be done for all other energy sources so that meaningful and accurate comparisons can be made by regulators and policy makers. This is not just a question of equity, but an essential step to achieving the greatest and most efficient reduction in GHGs.
Regarding process, it is vital that ODEQ capture and incorporate the unique and important perspectives offered by different natural gas providers and consumers. ODEQ will receive more robust and comprehensive input from the natural gas stakeholders by including representatives from all of the following on its Rulemaking Advisory Committee:
• The NWGA (to help inform the process with a broader regional and industry perspective) • At least two LDCs (representing different customer bases); • An interstate pipeline company; • A representative of the Alliance of Western Energy Consumers • A large commercial gas user such as a nursery or food processor • A small commercial sales customer; and • A residential gas customer
Regarding the Clean Fuels Program, the NWGA supports efforts to encourage the use of cleaner transportation fuels. Particularly for heavy trucks, Compressed Natural Gas (CNG) and Liquified Natural Gas (LNG) are viable, cleaner fuels that are already available. As supplies and on-road use of Renewable Natural Gas (RNG) increase, natural gas will actually serve as a carbon-negative transportation fuel.
Lower greenhouse gas (GHG) emissions targets under the Clean Fuels Program would encourage greater use of these fuels, create a market for the buildout of more fueling stations, and contribute significantly to lower emissions for the transportation sector with much lower adoption costs compared to electric heavy trucks.
The NWGA looks forward to working collaboratively with ODEQ as this process unfolds. Our industry has been pro-actively adopting and will continue to employ practices and technologies that reduce the emissions impact of the gas sector. Our work in this regard complements the state’s overall climate policy goals.
Natural gas, particularly direct-use appliances, are highly efficient and offer lower lifecycle GHG impacts than other products. Natural gas is a reliable and cost-effective fuel that is often the fuel of choice for important economic sectors in Oregon including food processors, nurseries, the wood products industry, manufacturers and others.
The natural gas system in Oregon represents billions of dollars in efficient, reliable and well-maintained infrastructure that keeps Oregonians warm and safe and is essential to many Oregon employers. This system can and should be a part of any future energy landscape.
Thank you for your time and consideration.
Sincerely,
DAN S. KIRSCHNER Executive Director cc: Avista Utilities Cascade Natural Gas Corp. NW Natural TC Energy GTN System Williams NW Pipeline
Submitted to: [email protected] June 15, 2020 TO: DEQ Office of GHG FROM: Northwest Pulp & Paper Association RE: Comment on Program Options to Cap and Reduce Greenhouse Gas Emissions Preliminary Report Thank you for the opportunity for the Northwest Pulp & Paper Association (NWPPA) to provide comment on Oregon Department of Environmental Quality’s (DEQ) Program Options to Cap and Reduce Greenhouse Gas Emissions Preliminary Report, May 2020. Background
NWPPA is a 64-year old regional trade association representing 12-member companies and 16 pulp and paper mills and various forest product manufacturing facilities in Oregon, Washington and Idaho. Our members hold various permits issued by DEQ including permits for Title V Air Operating Program, the Air Contaminant Discharge Program and report GHG emissions under DEQ’s Greenhouse Gas (GHG) Reporting and Third Party Verification Program. NWPPA members are at the forefront of Oregon air quality improvement efforts. Our members have embraced technically advanced and scientifically sound controls on air emissions over the past 20 plus years. We are proud of our dedication to efficient and environmentally sound processes and reduction of GHG emissions over time. We are committed to the hard work, expense and discipline it takes to be contribute to our communities. NWPPA staff are long-standing-stakeholder participants in numerous DEQ advisory committees including groups on: establishing regulatory programs, administrative rules (RACs), agency program improvement efforts and agency fee increases. NWPPA answers to Program Options document questions
How might DEQ best coordinate the public engagement aspects of both the effort described in this report on cap and reduce program or programs development and the Clean Fuels Program expansion?
NWPPA: DEQ should publish one clear timeline for each agency process aligning with a comprehensive overall timeline with integrated RAC committees and subcommittees including potentially regulated facilities (stakeholders) currently holding DEQ air quality permits or subject to DEQ Clean Fuels Program.
NWPPA comments on Program Options – June 15, 2020 Page 2 of 4
How should DEQ engage with communities or individuals with limited or no internet access?
NWPPA suggests DEQ consider: • Placing statewide newspaper notices and placing document copies in open public buildings
(e.g. libraries) in numerous locations. • Holding statewide meetings in accordance with current COVID-19 guidance. • Seeking to alleviate internet access problems with “slow” home-based internet connections
because of the COVID-19 stay at home executive orders. • Expanding webinar meeting platforms participant limits -- to stop participants from being
cut-off from webinars and not being able to re-enter webinars because of limitations. What additional engagement strategies should the agency consider during the Phase 2 scoping work?
NWPPA: NWPPA suggests DEQ should engage Individual trade associations via meeting, webinar or workshop on industry-specific technical regulatory issues to build understanding and agency knowledge of specific industrial operations. Are the policy issues identified under “Stakeholder Engagement” in subsection 2.3.4. and those in subsections 3.2. and 3.3. appropriately inclusive of issues, concerns and considerations needing discussion?
NWPPA: Topic areas for subgroup discussions for potentially regulated stationery air sources include specific workshops on advantages of and incentives for alternative compliance mechanisms including: • program credit for early actions; • program credit for on-site energy generation; • program credit for on-site cogeneration; and, • program credit for non-fossil-fuel self-generation. 3.3.2. The Scope of Program Coverage, Greenhouse Gas Emissions Thresholds, and Regulated Entities
NWPPA: DEQ should avoid leakage of GHG emissions and transfer of jobs to geographical areas outside Oregon that would increase carbon emissions in other jurisdictions and exacerbate the loss of Oregon tax revenue. 3.3.3. Distribution of Compliance Instruments
NWPPA: Compliance instruments should be easy to transfer between the government and regulated entities and not subject to transaction costs or instrument ownership by third party entities.
NWPPA comments on Program Options – June 15, 2020 Page 3 of 4
3.3.4. Cost Effectiveness and Cost Containment
NWPPA: DEQ should avoid leakage of GHG emissions and transfer of jobs to geographical areas outside Oregon through thoughtful program design based on Oregon’s manufacturing base and business environment. 3.3.5. Options to Avoid or Minimize Program Effects on Particular Communities and Economic Interests
NWPPA: DEQ should design the program to avoid leakage of GHG emissions and transfer of jobs to geographical areas outside Oregon that would increase carbon emissions in other jurisdictions and exacerbate the loss of Oregon tax revenue. a. What other issue areas should the agency convene stakeholder meetings for?
NWPPA: Meetings should be convened on alternative compliance mechanisms – for pulp and paper that could be investigation of on-site energy generation, cogeneration and/or non-fossil-fuel self-generation issues. b. What other approaches to organizing stakeholder conversations should the agency consider?
NWPPA: DEQ should hold individual stakeholder conversations with entities who are potentially regulated entities. Conversations should be kept confidential and designed to solicit input without fear of reprisal or regulatory consequences for entities already regulated by the DEQ. How should the agency approach identifying and selecting interested parties to serve on the Rules Advisory Committee(s)?
NWPPA: DEQ should use a written application process focusing on education, experience, knowledge and proven ability to work with other stakeholders on a RAC. What perspectives and expertise are critical in - terms of Rulemaking Advisory Committee member participation?
NWPPA: DEQ should consider multiple trade association representatives who represent air quality permit holders who are potentially regulated entities and have knowledge of Oregon air-quality-related administrative rules.
NWPPA comments on Program Options – June 15, 2020 Page 4 of 4
Given the potential wide - reaching scope of proposed rules , how should the agency organize the Rulemaking Advisory Committee process to ensure critical issues receive adequate attention and discussion?
NWPPA: The RAC should be arranged so that highly technical issues can separated and addressed by issue experts in subcommittees to make efficient use of participants’ time and knowledge. Thank you for the opportunity for NWPPA to comment on DEQ’s Office of Greenhouse Gas Program Options to Cap and Reduce Greenhouse Gas Emissions Preliminary Report.
June 15, 2020 VIA ELECTRONIC FILING Department of Environmental Quality Office of Greenhouse Gas Programs 700 NE Multnomah Street, Suite 600 Portland, Oregon 97232
RE: Report on Executive Order 20-04—NW Natural Comments NW Natural (“NW Natural” or “we”) appreciates this opportunity to provide comments on the Department of Environmental Quality’s (“DEQ”) May 2020 report: “Program Options to Cap and Reduce Greenhouse Gas Emissions” (the “Report”). NW Natural strongly supports the development of well-designed public policies to address the crisis of climate change. In addition, we have adopted, and continue to design and implement, measures to reduce our company’s and our customers’ carbon footprint. We look forward to sharing our ideas with DEQ as it undertakes this thoughtful process to collect public input. In these comments, we address a number of concepts and questions identified by DEQ in the Report. We have not attempted to address all of the issues in the Report, but our silence on certain issues should not be interpreted as indifference about those issues; we may address them in subsequent comments, particularly as DEQ’s proposed policies take further shape. I. About NW Natural NW Natural is a local distribution company (LDC) serving natural gas to more than 2.5 million people. Almost 90% of these customers are in Oregon with the remainder in Washington, making NW Natural the state’s largest gas utility. While NW Natural provides more energy than any other utility in Oregon, gas or electric, we do so efficiently and with very low greenhouse gas (GHG) emissions. NW Natural’s sales customers produce emissions equal to about 5% of the state’s overall GHG emissions. NW Natural has developed an overarching low carbon pathway as part of the company’s strategic plan that includes strategies to lower GHG emissions by driving down customer usage through energy efficiency; reducing the carbon intensity of our product through injection of both renewable natural gas (RNG) and renewable hydrogen; and displacing higher carbon fuels with fuels with lower carbon intensity, such as displacing diesel in transportation with both RNG and hydrogen.
Department of Environmental Quality EO 20-04 NW Natural Comments June 15, 2020, Page 2
The company supported the passage of a statewide cap-and-trade program (under SB 1530) as the most viable path towards economy-wide regulation of GHG emissions, and still believes that a complex and detailed policy framework for regulating the entire economy is best developed within the legislative process. The Governor issued Executive Order 20-04 after the legislature failed to pass a cap and trade law. NW Natural understands the EO is limited by the current authority of DEQ and the following comments recognize that some of the preferred policy solutions possible within the legislative framework are not possible due to the limits of current agency authority. II. Cap Design A. Entity Caps Should be Responsive to Sector-Specific Characteristics. In the event that DEQ elects to establish entity-specific caps, it should ensure that the stringency of those caps reflect sector-specific characteristics. Roughly two out of three Oregonians use natural gas in their homes for heating, water heating or cooking, yet the direct use natural gas sector represents 13% of the state’s emissions, a distant third to the transportation and electricity sectors. If fewer Oregonians used gas directly in their homes and businesses the State’s emissions would be higher now than they are. With this background, different sectors have different mitigation options available to them and the marginal costs of achieving GHG reductions vary considerably across activities. Some sectors have low-cost reduction options immediately available to them. However, other sectors—particularly the natural gas sector—lack incremental near-term low-cost options, and there is not a way to switch natural gas use to another fuel that will result in meaningful emissions reductions. For the direct use natural gas sector, it will take time for the costs of some mitigation technologies to decrease to manageable levels. However, the cost of utilizing the direct use sector to meet Oregon’s greenhouse gas reduction goals is likely lower than looking to replace the state’s vast needs for heating homes and businesses with an alternative source of energy. To be sure, the ability to trade compliance instruments among entities could help smooth differences among different sectors to a degree. However, if DEQ simply were to impose stringent uniform reduction levels for each regulated entity, it would force regulated entities in sectors with high marginal costs of GHG reduction to transfer substantial financial resources to regulated entities in low-cost sectors. This would not be an equitable outcome for the natural gas sector or its customers, and would be contrary to DEQ’s priority of avoiding “disproportionate cost impacts” on particular sectors. For these reasons, NW Natural urges DEQ to design both the level and timing of any entity-specific caps with attention to the characteristics of the entity’s sector and consider the likely market dynamics of any trading that could be allowed within the cap
Department of Environmental Quality EO 20-04 NW Natural Comments June 15, 2020, Page 3
and reduce program. B. The Trajectory of Caps Should be Responsive to Changing Circumstances. The Report contemplates that there will be an “initial” cap(s) that DEQ would adjust in a “progressive manner” over time. In designing a trajectory of emission caps, it will be important to balance long-term regulatory certainty with flexibility to adjust caps in light of changing conditions. NW Natural recommends that DEQ make clear in the agency’s June report that the agency will set cap trajectories towards its 2050 goals with the understanding there are many potential developments that could necessitate the agency to adjust the longer-term trajectory set out in the initial plan. Many factors will affect the cost and achievability of emission caps over time. These include technology innovation, fiscal impacts of the policy, changes in climate science, and climate policies developed by other states and the federal government. No one has perfect foresight into these factors and therefore any caps established by the program must be adjustable as necessary to reflect real-world conditions. In addition, the Report contemplates that DEQ will adopt other sector-specific climate policy measures to complement the cap. These complementary measures will also affect compliance with the cap. Given all of these important factors, which will change over time, it would be sound public policy for DEQ to: (i) establish an initial cap(s) that applies for a limited period of years and (ii) commit to revisiting and potentially adjusting the cap at the end of the initial period through a notice-and-comment rulemaking in which it would gather input on the full range of factors affecting the establishment of the next cap. C. Any Caps Applicable to Natural Gas Utilities Should Cover only Emissions From Their Sales Customers. Natural gas utilities have two types of customers: “sales” customers and “transport” customers. For customers on “sales” rate schedules a natural gas utility delivers and sells the natural gas used directly in homes and businesses (a customer pays the utility for both delivery service and for the natural gas commodity). For “transport” customers, the utility only delivers natural gas sold to the customer by another entity (the customer pays the utility for delivery service but a third-party gas marketer for the natural gas commodity). As became clear during the consideration of cap-and-trade legislation over the past two years, this distinction between “sales” and “transport” customers is important in the design of climate policies affecting the natural gas sector. The Report indicates that DEQ is contemplating regulating suppliers of fossil fuels—including natural gas utilities—as “air contamination sources” on the theory that such suppliers are the “generative stimulus, force, or cause” of their customers’ direct emissions. NW Natural
Department of Environmental Quality EO 20-04 NW Natural Comments June 15, 2020, Page 4
has questions about the validity of this interpretation. In any event, this interpretation is particularly problematic in the context of “transport” customers. As explained above, the utility does not actually sell gas to a “transport” customer; rather, it is a third-party marketer that actually sells the gas to the consumer. Because the natural gas utility is only providing a physical conduit for the marketer to deliver the gas to the marketer’s customer, it is difficult to see any legal basis for determining that the utility is the “generative force, stimulus, or cause” of the transport customer’s emissions from combusting the gas. In any event, the natural gas utility is not the “fuel supplier” for “transport” customers. Legal issues aside, there are policy design problems with holding utilities accountable for the emissions of gas users in the “transport” context. Because the gas utility does not provide the gas commodity for these customers they are not eligible for energy efficiency programs. For sales customers, by contrast, gas utilities procure energy efficiency (in partnership with the Energy Trust) when these demand-side resources cost less than the supply side portfolio. Similarly, NW Natural will begin to procure renewable natural gas under SB 98 that recently passed in Oregon, but the gas utility does not have the ability to purchase RNG for its “transport” customers. Because the utility is not the fuel supplier for “transport” customer, it cannot mitigate the emissions of those customers. The utility cannot engage the customer with energy efficiency programs, nor can it substitute RNG or renewable hydrogen. Therefore, if the utility’s entity cap encompassed not only “sales” customers but also “transport” customers, the utility would have to double down on mitigation for its sales customers, imposing measures out of proportion to the “sales” customers’ share of emissions. This doubling-down could have impacts on the rates paid by “sales” customer, which tend to be smaller entities than “transport” customers. For these reasons, if the DEQ moves forward with a policy of regulating fuel suppliers as “air contamination sources,” it should not regulate a natural gas utility for the emissions from combustion of gas for which the utility is not the fuel supplier. III. Minimizing Leakage Risks The Report appropriately recognizes that any cap-and-reduce program must be designed carefully to minimize the risk of “leakage.” Leakage occurs when a cap program merely drives emitting operations to entities outside the jurisdiction of the program—whether in-state or out-of-state. Leakage defeats the mitigation purposes of a cap program by shifting emissions rather than reducing them. A. Minimize Power Sector Leakage Risk by Setting Reasonable Caps on Natural Gas Sector Emissions. In order to minimize leakage risks, it is important to identify the potential sources of such risks and to design the cap-and-reduce program accordingly. As DEQ acknowledges,
Department of Environmental Quality EO 20-04 NW Natural Comments June 15, 2020, Page 5
one potential source of risk is in the power sector. Because (i) electricity grids span state lines, and (ii) the broader electricity sector is not included in the cap-and-reduce program, there is a particular risk that a program could shift other fuels to electricity or that generation could be shifted to non-regulated resources outside of Oregon without reducing emissions and potentially result in an increase in societal emissions. This risk could be realized if the cap-and-reduce program applies such stringent caps on the natural gas sector that it induces a precipitous, large-scale gas-to-electric switching, which given the carbon intensity of the electricity delivered to direct use natural gas customers would not lead to meaningful emissions reductions. To minimize this risk, the DEQ should be careful to ensure that natural gas utilities can comply with any near-term caps through a wide range of mitigation options, including energy efficiency measures and increased sales of renewable natural gas. B. Minimize Leakage Risk in the Natural Gas Sector by Regulating the Appropriate Entities for Transport Customer Emissions. As the Report recognizes, another source of leakage risk lies in the competitive landscape among fuel suppliers. We posit that a goal of the cap-and-reduce program should be parity in the compliance obligation amongst all uses of natural gas, including amongst gas on utility sales and transport schedules. One example of a scenario where parity would not hold would be one in which DEQ regulates natural gas utilities as “air contamination sources” for the emissions of their “sales” customers, but fails to regulate marketers or other entities for the emissions of “transport” customers. In such a scenario, “sales” customers would pay higher prices for natural gas than “transport” customers due to the differences in regulatory coverage. This difference could encourage larger “sales” customers to switch from utilities to marketers for their gas purchases, which would mean that emissions of these customers would fall outside the reach of the cap-and-reduce program. IV. Alternative Compliance Mechanisms NW Natural appreciates that DEQ is contemplating a market-based approach for the cap-and-reduce program. Depending on program design and an assessment of potential supply and demand, a market-based approach can help ensure that the cap is met at a lower cost. In particular, we appreciate that DEQ is considering making it possible for regulated entities to use a range of alternative compliance mechanisms in the program. One such mechanism is allowances from cap-and-trade programs in other jurisdictions. As an alternative compliance mechanism, allowances have unimpeachable environmental integrity. In a cap-and-trade program, an allowance represents a right-to-emit. Therefore, if an Oregon regulated entity were to purchase and retire an allowance from another state’s cap-and-trade program for use in the Oregon program, it would legally eliminate the corresponding amount of emissions in the other state’s program.
Department of Environmental Quality EO 20-04 NW Natural Comments June 15, 2020, Page 6
Authorizing the use of allowances from other state programs in the Oregon program would also help foster a multi-state approach to climate policy. It is well understood that, ultimately, Oregon cannot “go it alone” in addressing the climate crisis. In addition, the markets for activities that result in emissions span multiple borders. Authorizing the use of allowances from neighboring states would help up scale up the state’s effort and allow for collaboration in addressing the effect of regional markets on emitting activities. NW Natural also supports authorizing the use of credits from offset projects. Based on our long experience with such projects, we believe credits should be authorized only if the reductions or sequestration achieved by offset projects are additional, verifiable, enforceable, permanent, and subject to third-party verification. We believe a range of existing offsets programs can generate projects that meet these standards for environmental integrity. In addition to providing cost containment benefits, offsets provide opportunities for a broader range of entities to contribute to meeting the state’s GHG reduction goals. In particular, a robust offsets component of the cap-and-reduce program would offer opportunities for Oregonians to contribute to and benefit from the program, including through sequestration and other land management activities on the state’s working lands. The Governor’s E.O. sets out a multi-state agenda and state goals for “carbon sequestration and storage by Oregon’s natural and working landscapes, including forests, wetlands, and agricultural lands…” The offset provisions of DEQs program can provide a meaningful avenue for helping to support this goal. In order to realize these benefits, it will be important for DEQ to consider a range of state-established and voluntary programs. In particular, the offset protocols in the California program do not adequately reflect carbon benefits associated with Oregon’s forests, and exclude a variety of other worthy project types, such as projects involving grasslands. Even if such a market is not sanctioned directly by the State, a third mechanism that should be implemented – and is discussed in the report – is trading of emissions amongst entities with compliance obligations within the cap-and-reduce program. If some entities are able to reduce emissions below their own cap at a cost cheaper than another covered entity can reduce their emissions to meet their own cap, the latter should be able to sell emissions reductions to the former so that the same emissions reductions can be achieved at a lower cost. While such a market should not be seen as a panacea able to keep program costs at some level or another without a detailed assessment of the likely supply and demand, trading amongst covered entities could reduce the cost of emissions reduction and should be allowed. Also, if DEQ considers limits on the extent to which regulated entities can use alternative compliance mechanisms, NW Natural urges DEQ not to make the limits so restrictive that they prevent the realization of the substantial cost containment benefits
Department of Environmental Quality EO 20-04 NW Natural Comments June 15, 2020, Page 7
of such mechanisms. At the same time, we caution that any integration of offsets and allowances into the cap-and-reduce program should be based on realistic modeling of the available supply. V. Public Comment Process In general, NW Natural believes that Report outlines a thoughtful and well-designed program to gather public input from stakeholders, including on critical issues of Environmental Justice. The process described within the Stakeholder Engagement process suggests DEQ will host “topic-specific workshops” throughout the summer and fall. These sessions will be more valuable to the process if they are divided up by interest groups and allow for a more complete review of the DEQ program. A cap and reduce program must be reviewed in its entirety to understand its impacts on natural gas customers. The combination of who is given an emissions cap (entire sectors? specific entities? a combination?), what each covered entity’s emissions cap trajectories is, and the various mechanisms allowed for compliance must be examined together to understand the program’s impacts rather than the siloed approach laid out in the May 15 report. A piecemeal approach to these topics will not allow for an accurate review of the program’s costs and could result in a disjointed, conflicting policy and unintended consequences. For this reason, we believe these listening sessions should explore complete proposals rather than be divided up into topic specific workshops. Consistent with this need for a review of the entire program, going forward, we urge DEQ to develop more completely specified options for comment. With greater specification and detail, it will be possible for commenters such as NW Natural to provide clear and meaningful input. The current draft of the report calls out that membership on the Rulemaking Advisory Committee (RAC) should include “potentially regulated sectors (large stationary sources, fuel suppliers, including natural gas suppliers).” Potentially regulated sectors includes both a variety of transportation sources, large fuel users and natural gas utilities. These entities will not have uniform views on the program and will not be in a position to represent these varied perspectives. The updated report should make it clear that members from these various industries will be represented on the RAC. Given NW Natural is the largest of Oregon’s natural gas utilities, we believe the RAC would benefit from having our experience and insight when it comes to regulatory strategies and options for GHG emissions reductions. We also believe it will be critical to hear from a range of gas customers in devising these rules. Gas utilities will be working hard to represent our customers’ interests by understanding the likely costs of any program on specific customer groups of the decarbonization program. However, a residential gas customer and a large industrial
Department of Environmental Quality EO 20-04 NW Natural Comments June 15, 2020, Page 8
gas user may face very different cost impacts and these varied customer groups should be separately represented with membership on the RAC. * * * * NW Natural appreciates this opportunity to provide comment on the Report and DEQ’s initiative to develop a cap-and-reduce program. If you have questions or would like further information on our comments, please do not hesitate to contact Bill Edmonds at 971.344.2075. Sincerely, /s/ Nels Johnson Nels Johnson NW Natural
June 15, 2020 Office of Greenhouse Gas Programs Department of Environmental Quality 700 NE Multnomah St. Suite 600 Portland, OR 97232 RE: Comments on Cap and Reduce Preliminary Report DEQ’s Office of Greenhouse Gas Programs, We are writing to share our comments on the Oregon Department of Environmental Quality’s (DEQ’s) preliminary report on Program Options to Cap and Reduce Greenhouse Gas Emissions required by the Oregon Climate Action Plan (Executive Order 20-04). We greatly appreciate the opportunity to comment on the report. The depth and extent of the preliminary report indicates that DEQ is being diligent both in its proposed process to develop the cap and reduce program as well as identifying specific program design options. Getting the design and implementation of the cap and reduce program right is not only important for Oregon, but also to help inform climate action in other states. As DEQ noted in the cover memo to the report, cap and reduce is a key part of a “road map for how Oregon will do its part to bring GHG emissions under control and help avert a climate crisis.” Climate change is already having an impact here in Oregon and the impacts will get worse if we do not act quickly and comprehensively. The cap and reduce directive provides the opportunity to meaningfully reduce a significant portion of Oregon’s greenhouse gas emissions and can serve as an important component of Oregon’s climate action efforts moving forward. As a result, it is of the utmost importance that DEQ implements a cap and reduce program with strong environmental integrity. This program must follow the best available climate science and maximize greenhouse gas emissions reductions. In addition, DEQ must ensure the program prioritizes the needs and interests of impacted communities. Tribes, communities of color, low-income communities, and other impacted urban, rural, and coastal communities around Oregon are on the frontlines of climate change and experiencing the impacts of climate change first and worst. These communities are also often disproportionately harmed by toxic air pollution from industrial operations, cars, trucks, and the burning of fossil fuels for energy – many of the same pollution sources to be regulated under the cap and reduce program. As a result, it is critical that the program centers frontline and most impacted communities by ensuring representatives of these communities are at the decision-making table as the cap and reduce program is developed, and that cap and reduce program options and outcomes maximize the benefits for, and prioritize the needs and interests of, these most impacted communities.
With the context above, here are our specific comments:
● We agree engaging impacted communities and Oregon’s Tribes are critical in any
rulemaking, but DEQ must do more. Ensuring the process itself and representation in that process elevate Black, Indigenous, people of color and other frontline communities are critical to ensuring equitable outcomes from the cap and reduce program. In addition to planning regular engagement with Tribes and the Environmental Justice Task Force throughout the process, we are glad to see DEQ is including seats for Tribal representatives and representatives of impacted communities as part of the core make-up of the Rulemaking Advisory Committee (RAC). At the same time, DEQ can and must do more. We urge DEQ to:
○ Ensure that there is an over-representation of the Tribal and impacted communities seats compared to the other seats on the RAC. This will help ensure that the voices of these historically under-represented communities have the opportunity to be heard and their needs meaningfully reflected in the development of this program.
○ Work with the Governor’s office to support funding for the Environmental Justice Task Force (EJTF) so that the EJTF has the resources it needs to engage with DEQ.
○ Work with the Governor’s office and other agencies to develop a common understanding of the term “impacted communities” so that these communities can be properly identified and engaged by the agency. This should be informed by materials catalogued as part of the Oregon Legislature’s Clean Energy Jobs Work Group on Environmental Justice and Just Transition, including prior research by Portland State University on the subject.1,2
○ Solicit feedback on metrics to track and measure equity in outcomes from the cap and reduce program. Considering the equity impacts of policy options as noted on page 17 of the report is very important, but also ensuring there are metrics for tracking and assessing equity impacts once the program is implemented is critical.
○ Expand the impacted communities workshop topic area outlined on page 12 of the report to also consider benefits to impacted communities from cap and
1 Clean Energy Jobs Work Group on Environmental Justice and Just Transition: https://www.oregonlegislature.gov/helm/Pages/ejjt.aspx 2 Findings Brief for Equity Considerations for Greenhouse Gas Emissions Cap and Trade Legislation in Oregon: https://www.oregonlegislature.gov/helm/workgroup_materials/WG%204%20-%20Marisa%20A.%20Zapata%20Findings%20Brief.pdf
reduce, not just reducing or avoiding impacts from the program. There are significant public health and other co-benefits to reducing pollution for impacted communities.
○ Continue to seek out additional opportunities throughout the process to engage and listen to communities often left out of the conversations.
● Appoint a diverse Rulemaking Advisory Committee that includes as many or more
public interest representatives as industry representatives. In addition to an over-representation of Tribes and impacted communities seats on the RAC urged above, the RAC should also:
○ Include as many or more public interest representatives as industry
representatives. DEQ Rulemaking Advisory Committees have had a larger proportion of industry seats than public interest seats on a number of occasions. One example of where DEQ did things differently was the Cleaner Air Oregon Rulemaking Advisory Committee. The cap and reduce RAC should track closer to the Cleaner Air Oregon example with at least equal or more public interest representatives as compared to representatives of regulated/potentially regulated entities. Representatives of the environment, public health, and environmental justice have important voices to bring to the table on a critical climate program like cap and reduce. We appreciate seeing these representatives contemplated for participation on the RAC in the preliminary report and urge DEQ to ensure these seats are at least equal to or more than the industry seats.
○ Appoint a demographically (age, race, gender, etc.) and geographically diverse RAC. Diverse perspectives can help make the design of the program stronger.
○ Ensure expertise in climate science and climate change mitigation are represented on the RAC. Decisions to address climate change must be informed by science.
● Include labor voices in the design of the program. Workers have an important stake in the clean energy economy. But the preliminary report does not specifically mention labor as a key stakeholder in the cap and reduce program design. DEQ should ensure labor is part of the conversation – in the contracted analyses, at the Rulemaking Advisory Committee table, and throughout the discussion of policy considerations. Program options to support and incentive workforce training opportunities, responsible contracting standards, and jobs that pay a prevailing wage should be considered.
● Do not limit program options at the outset. As the outline of policy considerations show, there are a host of nuances and versions of program options to consider. We
assume more will likely surface in the public process. As a result, DEQ should not unnecessarily limit options on the table in its final report due June 30th, but rather keep program options open heading into the public process.
Thank you again for the opportunity to comment on the preliminary report and we look forward to participating in the discussion of policy considerations ahead. Sincerely, 350 Deschutes 350 Eugene 350 Salem Oregon 350.org Washington County Asian Pacific American Network of Oregon (APANO) Beyond Toxics Climate Solutions Douglas County Global Warming Coalition Environmental Caucus of the Democratic Party of Oregon Go Bio Community Fuels OLCV Metro Climate Action Team (MCAT) Oregon Climate Oregon Environmental Council Oregon League of Conservation Voters Oregon Public Health Association Natural Resources Defense Council Renew Oregon Residential Energy and Water Intelligence (Res-Intel) Rural Oregon Climate Political Action Committee (ROCPAC) Southern Oregon Climate Action Now (SOCAN) Southern Oregon Pachamama Alliance/Drawdown Sustainable Northwest Umpqua Watersheds
1149 Court Street NE Salem, OR 97301
T: 503.588.0050 F: 503.588.0052
Statewide: 800.452.7862 oregonbusinessindustry.com
June 15, 2020
Lauren Slawsky
Office of Greenhouse Gas Programs
Oregon Department of Environmental Quality
700 NE Multnomah Street, Suite 600
Portland, OR 97232
RE: Comments on Program Options to Cap and Reduce Greenhouse Gas Emissions
VIA EMAIL: [email protected]
Dear Ms. Slawsky:
Thank you for the opportunity to comment on the Department of Environmental Quality’s (DEQ)
Program Options to Cap and Reduce Greenhouse Gas Emissions. Oregon Business & Industry
(OBI) is Oregon’s most comprehensive business association representing approximately 1,600
businesses that employ more than 300,000 people. Many of our members will be significantly
impacted, both directly and indirectly, by the Cap and Reduce Program and we appreciate the
efforts DEQ has undertaken to outline their proposed process and engage directly with
impacted stakeholders in an open and thoughtful manner.
OBI has numerous concerns about this new proposed regulatory program, especially in the face
of hardships businesses are experiencing as a result of the COVID-19 pandemic and
associated economic downturn. Frankly, we are very concerned that no government agency
understands the full implications this historic event is inflicting on Oregon business and the
challenges those businesses will face in their effort to keep the doors open.
It is important to understand the business and economic backdrop against which this rulemaking
is being initiated. Nearly all Oregon businesses are in distress and are experiencing hardship.
This hardship is across the board, not limited to sectors that have experienced closures. Simply
put, Oregon’s businesses are reeling in response to drastic strains to their operations, whether
to keep their employees safe or to identify and address the dozens of previously unforeseen
logistical and operational implications this pandemic has brought. Some have taken to referring
to this difficult time as a “black swan event.” That label certainly applies to Oregon’s business
community. As a result of the COVID-19 pandemic, Oregon businesses are experiencing supply
chain interruptions, production delays, depressed markets, demand crashes, restricted cash
flow, massive capital uncertainty, and workforce and workflow disruptions.
For these reasons, OBI again requests that DEQ postpone development of a new rule until the
ramifications of the pandemic are past us and our economy is stabilized.
Cap and Reduce Comments
P a g e | 2
In the face of these grave and historic challenges, DEQ has pursued and the Environmental
Quality Commission has adopted significant new regulatory requirements, such as the Cleaner
Air Oregon Hazard Index rule (adopted in April 2020) and the Greenhouse Gas Reporting Third
Party Verification rule (adopted in May 2020). The costs of these regulatory requirements, when
added to the costs of preexisting programs and layered onto the COVID-19 related hardships
businesses also face, threaten to push many Oregon businesses or facilities to the brink. Right
now, numerous Oregon facilities face potentially millions of dollars in new regulatory costs,
stemming from investment in new air pollution control technology, reporting and regulatory
submittals related to the Cleaner Air Oregon program, third party verification of Greenhouse
Gas Reports, addressing Regional Haze requirements, and annual air permit fees that are likely
increase 70%almost immediately upon approval. These are limited to the air quality and
greenhouse gas programs; we have refrained from including a comprehensive listing of all
regulatory programs our members must demonstrate compliance with.
If DEQ will not postpone the rulemaking, now, more than ever before, DEQ must commit to
engaging with OBI and its members in a dialogue about what an effective program would look
like; a program that is also reasonable, achievable, practical and does not place crushing new
cost burdens on businesses as they are asked to address global concerns associated with
climate change.
Engage early with regulated entities, sector by sector
We appreciate DEQ’s careful attention and questions with respect to the stakeholder
engagement and scoping processes. DEQ is embarking on a major new regulatory program
under the extremely short timeline laid out in Executive Order 20-04.
OBI urges DEQ to engage early with the regulated community to understand the challenges we
foresee in the rulemaking process and implementation of the program. In recent history, we
have noted that DEQ has initiated rulemaking after proposals were already written and prior to
any substantial engagement with regulated entities. Seeking early input from regulated entities
is, in our view, a far more productive and efficient way for rulemaking to proceed than having to
go back and address problematic issues after the proposed rule has been drafted. Further, we
have noticed a recent trend where DEQ presents two, pre-prepared rule options at the initial
Rulemaking Advisory Committee (RAC) meeting. This approach presents a false dichotomy and
forces participants to select an option with which they may not agree, effectively eliminating real
engagement. Engaging the regulated community in an open and diligent way during the scoping
phase of the rulemaking will help address challenging issues on the front end and lead to a
more informed rulemaking approach.
Additionally, OBI strongly urges DEQ to engage the regulated community apart from the broad
universe of stakeholders and to do this sector by sector during the scoping phase. Broad
stakeholder meetings can be of value for some purposes and we would not expect exclusive
regulated community meetings as a rule. However, in order to facilitate meaningful dialogue to
inform the rulemaking, it is critical that the affected parties be able to speak candidly without
interests present that might utilize this information in unintended ways. Further, we believe that
Cap and Reduce Comments
P a g e | 3
this broad and complex rulemaking requires the discussion of detailed policy considerations that
can only be achieved in sector-specific conversations.
Limit rulemaking committee to those directly impacted
Gov. Brown’s Executive Order 20-04 to reduce greenhouse gas emissions presents a significant
change in approaching carbon reduction from legislation previously enacted or contemplated by
the Oregon Legislative Assembly (e.g., in either the 2019 or 2020 sessions).
In its analysis, the department notes that it is unlikely the Environmental Quality Commission
has the authority to auction allowances or charge a price for compliance instruments. The lack
of statutory authority for a carbon pricing program creates very significant differences between
the Cap and Reduce Program and previous carbon legislation considered by the Legislature
during the last two sessions.
Under a typical cap and trade program, significant revenues would have been raised and many
organizations would have applied for these funds to make investments in further reducing
greenhouse gas emissions. The intent of such efforts would serve to mitigate the impacts of
climate change and help communities adapt to those changes.
Given the department’s determination that there is insufficient existing statutory authority for
revenue to be generated for these purposes, OBI does not believe “climate investment”
organizations should serve on the RAC. Rather, the RAC should be composed of those parties
that are directly impacted by this new regulatory program.
The rulemaking committee should be predominantly regulated community
The Cap and Reduce Program will essentially be a traditional regulatory program where Oregon
facilities will be subject to regulatory (perhaps permitting) requirements, violations of which will
likely subject those facilities to enforcement and penalties. In order to meaningfully evaluate
various regulatory proposals for developing and implementing a Cap and Reduce Program, it is
crucial that regulated entities be robustly represented in this rulemaking process. For this
reason, representatives of the regulated community should comprise at least two-thirds of the
RAC.
Avoid duplicative advisory committee representation
Although we have advocated to fill at least two-thirds of the RAC with members of the regulated
community, DEQ should also be mindful of selecting RAC members that bring different
expertise and perspectives to the table. For example, two forest products companies can bring
very different perspectives to the table because they vary in size, raw material inputs, product
output, business models, energy mix, location and access to markets, and a variety of other
factors. Both perspectives are integral even though the two companies are in the same sector.
Diverse RAC representation will be critical to ensuring the Cap and Reduce Program does not
pick winners and losers in the way it regulates different types of sources.
Cap and Reduce Comments
P a g e | 4
Accordingly, stakeholder groups outside the regulated community should be similarly evaluated
for their value in bringing diverse input and expertise to the RAC discussion and rulemaking
process and avoid duplication of groups and individuals represented.
DEQ should consult associations
In order to establish a RAC representative of the affected sectors, DEQ should consult with the
associations whose members will be directly affected by the Cap and Reduce Program.
Associations commonly work together on public policy issues and will coordinate to ensure their
respective memberships across all sectors are well-represented in the rulemaking process.
These associations are obligated to appropriately represent their members and will have the
greatest insight into the specific individuals who can best contribute to the rulemaking process
based on their expertise, knowledge of the Air Quality Program and ability to work constructively
in a rulemaking process. Association size, number of affected businesses represented and the
association’s history participating in rulemaking relative to permitting programs should be an
additional consideration in the consultation process.
Key policy and program design elements should not disadvantage Oregon businesses or
unfairly impact certain sectors
Generally, DEQ should focus its efforts to ensure that Cap and Reduce Program elements do
not disproportionately or unfairly burden any Oregon business sector, whether in manufacturing,
transportation or natural gas. Likewise, DEQ must be aware of and avoid regulatory pitfalls that
would drive vulnerable energy-intensive and trade exposed businesses out-of-state, result in
unequal allocation of costs to small, rural and minority-owned businesses or communities, or
inefficiently allocate scarce state and business resources. In addition, DEQ should design the
program to acknowledge the significant greenhouse gas reductions already achieved by certain
Oregon business sectors, control cost increases (to deliver stability and certainty, while avoiding
surprises), and promote flexibility and creative solutions (such as openness to reliance upon
qualifying offsets from other jurisdictions).
Economic and emissions leakage must be avoided
While Oregon has been, and continues to be, a leader in reducing greenhouse gas emissions,
Oregon alone cannot change global temperatures. Influencing global climate change will require
a global response. That means the state should avoid creating regulations that could lower
emissions in Oregon but increase emissions globally by pushing production and increasing
manufacturing outside of Oregon. This is a risk acknowledged by the state’s own economic
analysis done by VIVID Economics. Increasing the costs on trade exposed business will lead to
increased global emissions by pushing manufacturing into states and countries with fewer
regulations and higher carbon intensive energy resources.
Along with emissions leakage, increased production outside Oregon means less economic
activity in the state, and certainly in many communities. Emissions reduction policies could have
a devastating impact on the economy and communities – especially the most financially
vulnerable – and have very little impact on global emissions. It is important that new regulations
Cap and Reduce Comments
P a g e | 5
will not increase the costs on businesses, communities and those most vulnerable and unable
to absorb increased costs.
OBI appreciates the opportunity to offer comments on DEQ’s Cap and Reduce rulemaking plan.
We look forward to actively engaging in the scoping and rulemaking ahead. Please contact me
should you have questions about our comments.
Sincerely.
Sharla Moffett
Director
Energy, Environment, Natural Resources & Infrastructure
June 15, 2020 Department of Environmental Quality Office of Greenhouse Gas Programs 700 NE Multnomah St., Suite 600 Portland, OR 97232 Re: Preliminary Report—Program Options to cap and Reduce Greenhouse Gas Emissions Director Whitman:
Thank you for the opportunity to provide DEQ with feedback on the scope and
stakeholder engagement proposals outlined in the Preliminary Report: Program
Options to Cap and Reduce Greenhouse Gas Emissions (May 15, 2020). As a reference,
the Oregon Farm Bureau Federation (OFB) is the state’s largest general agricultural
trade association representing nearly 7,000 families actively engaged in farming and
ranching. OFB has been an active participant in the carbon reduction conversation in the
legislature for the last four years due to the negative impacts these policies pose to farm
and ranch families.
As the Department of Environmental Quality is aware, Oregon’s farmers and ranchers
operate on very thin margins, and our members will likely bear a significant cost burden
if the agency places a declining cap on fuels, propane, and natural gas without any
protections for agricultural operations. The proposed Cap and Reduce program could
very likely shutter family farms and ranches across the state if the proposal isn’t
developed with consumer impacts in mind, particularly those of working families in rural
communities. This has been our primary concern since 2017 when the Oregon
Legislature initially introduced cap and trade legislation.
Much like our forests, Oregon’s farms and ranches also sequester significant carbon on
the landscape. Unfortunately, the majority of carbon policy proposals to date have
failed to acknowledge the incredible benefit that working agricultural landscapes
provide to Oregonians. Past cap and trade proposals also have advanced inflexible offset
criteria that prevent local producers from participating in a voluntary market. OFB
encourages DEQ to reset the conversation—not rehash old ideas from SB 1530 (2020) or
HB 2020 (2019).
OFB appreciates the opportunity to provide feedback on Section 2 of the Preliminary
Report, “Program Development and Stakeholder Engagement Process.” Please see our
comments below in response to questions posed by DEQ staff.
1. How might DEQ best coordinate the public engagement aspects of both the effort described in this report on cap and reduce program or programs development and the Clean Fuels Program expansion? DEQ should create a website landing page that is easily accessible by the public with contact information for staff implementing Cap and Reduce.
2. How should DEQ engage with communities or individuals with limited or no
internet access? DEQ should hold public information meetings in communities across Oregon. The agency also should engage through public comment at each EQC meeting, through telephone townhalls, and through the workshop process. Meetings should be distributed to reflect the geographical diversity of Oregon, particularly in areas with limited broadband access.
3. What additional engagement strategies should the agency consider during the
Phase 2 scoping work? Rural Oregonians should be included as impacted communities for targeted outreach. Rural Oregonians often drive longer distances to access critical services—groceries, health care, fuel, etc.—and they will bear a greater portion of the cost of a Cap and Reduce program. They also lack access to mass transit or other means of alternative transportation, which layers an even heavier burden on these families.
4. Are the policy issues identified under “Stakeholder Engagement” in subsection 2.3.4. and those in subsections 3.2. and 3.3. appropriately inclusive of issues, concerns and considerations needing discussion?
a. What other issue areas should the agency convene stakeholder meetings for? Regarding alternative compliance mechanisms, we assume the agency is referring to a voluntary carbon trading marketplace and the generation of offset credits. If the agency pursues a conversation related to offset generation, farmers and foresters (and their trade associations) must be central to that conversation—not NGOs that participate in third party carbon marketplaces. Many of these NGOs have yet to prove that they can navigate a flexible offset program that allows for local solutions and ideas to be considered. Since this is a regulatory program and not a revenue generating program, Oregon producers must be part of the larger conversation around alternative compliance mechanisms, namely offset credit generation, since they are the ones with on-the-ground expertise.
Should the agency pursue this conversation, DEQ must look beyond the California model for offset protocols (real, additional, quantifiable, permanent, etc.) and consider alternative compliance mechanisms that provide flexibility to those working and sequestering carbon on a dynamic landscape.
b. What other approaches to organizing stakeholder conversations should the
agency consider? Agriculture is an adversely impacted community, through the purchase of large amounts of fuel and natural gas and propane, and DEQ should organize outreach specific to the concerns raised by the agricultural community.
5. How should the agency approach identifying and selecting interested parties to
serve on the Rules Advisory Committee(s)? DEQ should work with sector-specific trade associations to identify representatives for the Rules Advisory Committee (RAC). DEQ should allow for input from impacted trade groups regarding RAC membership and provide an inclusive, public process for applications. It is important that RAC members have some background in Cap and Reduce program structure and associated policy and economic considerations.
6. What perspectives and expertise are critical in-terms of Rulemaking Advisory Committee member participation? Stakeholders (and their trade associations) who will bear the downstream costs of Cap and Reduce must have a voice on the RAC. Cap and Reduce is a regulatory program, and RAC participants should either be part of the directly regulated community or indirectly regulated community. For instance, farmers, ranchers, loggers, and truckers purchase large amounts of on-road fuel to move commodities. The cap on gasoline and diesel will indirectly impact farmers and ranchers. Farmers, ranchers and loggers also purchase large quantities of off-road diesel and will see an increase in the purchase price of dyed diesel. The majority of RAC membership must include entities that are directly regulated or indirectly impacted by the proposed Cap and Reduce program. Commercial, industrial, and residential consumers of natural gas and other liquid and gaseous fuels, such as propane, must also have a seat at the table. Nurseries and on-farm processing facilities will see a significant increase in the price of natural gas and propane, and these stakeholders must be represented on the RAC so that DEQ staff understand the direct and indirect impacts of the proposed Cap and Reduce program on Oregon businesses and farm and ranch families.
7. Given the potential wide-reaching scope of proposed rules, how should the agency organize the Rulemaking Advisory Committee process to ensure critical issues receive adequate attention and discussion? The different elements of the program cannot be considered independently, since the effects of the rules will be additive for Oregon businesses and families. For instance, the proposed increase in the Clean Fuels mandate, when considered alongside the proposed cap on gasoline and diesel under Cap and Reduce, will result in the stacking of costs on Oregon consumers. Oregon agriculture, which relies on affordable fuel for the production of food and fiber, will be particularly hard hit by the proposed increases to the Clean Fuels mandate and the development of a new Cap and Reduce mandate. These programs must be addressed together so that the public fully understand the impact of stacking policies (and hidden taxes) on the same gallon of fuel.
As a final point, OFB is concerned that much of the scope of the proposed Cap and
Reduce program falls outside of DEQ’s statutory authority. Also, recent data has
revealed that the proposed greenhouse gas reduction goals for the Cap and Reduce
program likely are not achievable with modern technology. This is concerning in that
implementing an Oregon-specific program that is not feasible will likely result in leakage
and the further devastation of rural, natural resources-based communities throughout
the state. This outcome would not serve stakeholders who are directly or indirectly
regulated through a Cap and Reduce program. We also continue to believe the outbreak
of COVID-19 and its impact on our economy necessitate a temporary suspension of
Executive Order 20-04 so that farmers and ranchers, and those who are a part of the
supply chain, have an opportunity to recover from this economic disaster.
Thank you for the opportunity to provide comments today. OFB looks forward to the
opportunity to continue to represent our members in the carbon reduction
conversation.
Sincerely,
Jenny Dresler Lobbyist Oregon Farm Bureau Federation
June 15, 2020
Dear Director Whitman,
On behalf of the Oregon Forest and Industries Council (“OFIC”) and the private forestland owners and forest product manufacturers that provide over 60,000 Oregonians with family-wage jobs, this letter is in response to the invitation from the Oregon Department of Environmental Quality (“DEQ”) to submit comments regarding DEQ’s preliminary report of “Program Options to Cap and Reduce Greenhouse gas Emissions” in furtherance of the policy objectives outlined in Governor Brown’s Executive Order 20-04 (the “EO”), signed on March 10, 2020. As a threshold matter, we believe work on this initiative should be suspended in light of the worldwide COVID-19 pandemic and the extreme impact it has had on the state budget. Despite this, DEQ continues to move forward and has solicited input on the proposed stakeholder and public engagement processes outlined in section 2 of the report, and comment on the key policy questions and options described in section 3.
First, we welcome the opportunity to submit comments on this matter. We hope DEQ upholds a commitment to both maintaining a transparent process as it labors to craft a Cap and Reduce program and to engaging stakeholders and impacted individuals, industries, and communities in its decision-making processes. OFIC’s members recognize that there is an important role for the state’s forests and forest products industry to play in mitigating ongoing effects of anthropogenic greenhouse gas emissions, and believes that a robust and sustainable timber industry is essential to any climate solution that the state conceives. Oregon’s forests capture nearly half of the state’s annual carbon emissions and harvested timber products provide low-emissions building materials that double as long-term storage media for the carbon sequestered by a tree during its lifetime. As the premier timber-producing state in the nation, Oregon is uniquely situated to fully employ its working forests in the mitigation of climate change.
With respect to the process questions contained within Section 2 of the report, we believe the identification and selection of interested parties to serve on the Rules Advisory Committee (“RAC”) should be inclusive and allow clearly articulated opportunities (via email, website, etc.) for stakeholders to apply. Representatives from all major sectors must be a part of the RAC, as the Cap and Reduce program is a regulatory program and the regulated community must constitute the majority of the members. Consumers, who will inevitably absorb downstream costs from any program developed, must also have meaningful representation. This can take the form of individual citizens or representatives from industrial, commercial and residential energy consumer advocacy organizations. Any entities that stand to financially profit at the expense of both regulated industries and the general public should not be participants on the RAC.
Because of the far-reaching, economy-altering impact of a Cap and Reduce program, any RAC process must ensure that all parts of the state and all segments of the Oregon economy have a fair opportunity to provide meaningful input. We believe it is essential that a series of community meetings take place around the state, most likely in the evenings when working people can attend to lend their voice, a voice that is often either not heard or disregarded. Working families are likely to suffer significant cost increases or loss of employment as a result of the EO and a Cap and Reduce program, and therefore should have ample opportunity to comment.
Another suggestion that OFIC believes is critical to maintain transparency and coherence is for DEQ to establish a centralized webpage on the implementation of the EO. This page should gather all the work from the various agencies that have been directed to undertake initiatives related to the EO. Currently, various state agencies have differing approaches to transparency and where they place climate change reduction work on their websites.
PO Box 12826 Salem, Oregon 97309
(503) 371-2942 Fax (503) 371-6223
www.ofic.com
Accumulating all related work in one centralized location is very important and will allow stakeholders and the general public to gain a better understanding of the ongoing work.
Regarding the policy considerations contained in Section 3 of the preliminary report, DEQ has requested input on whether the three sectors identified in the EO should be expected to achieve the same level of reductions. Although we do not wish to state an opinion on this broader question at present, we do petition the department to fashion a program that recognizes and grants full credit for emissions reductions that sources have already voluntarily implemented. We further encourage the department, in devising a plan for the distribution of compliance instruments, to allow vertically integrated businesses to internally trade, without limitation, compliance instruments or credits for carbon mitigation strategies and processes adopted by individual entities under common ownership.
Finally, as regards subsection 3.3.5 of the report, we ask the department, as it considers the effects of emissions reduction programs on particular communities and trade-exposed industries, to consider how such programs could produce a disproportionately deleterious effect on rural communities and the industries that support them. Oregon’s forest sector directly supports more than 60,000 jobs throughout the state – many of those in the state’s rural communities – that pay an average wage that is 6% higher than the state average wage. These jobs depend on a robust forest-products industry, and any reduction in fiber supply, or increase in the cost of operating mills would have serious and negative ramifications on the ability of the industry to continue to support those individuals who rely on it. Therefore, we urge the DEQ to both recognize and grant regulatory credit to the industry for the role that it plays in mitigating climate change and to take care not to create a market for compliance instruments that could directly or indirectly suppress the supply of fiber to the state’s mills.
Again, we thank you for providing an opportunity to give feedback on the department’s preliminary report and for consideration of our comments. While OFIC and our members have significant concerns regarding both the scope and legality of the proposed program and the realistic ability to achieve the reduction goals outlined in the EO, we look forward to future opportunities to engage with the DEQ as it begins the development of a greenhouse gas emissions cap and reduce program.
Best regards,
Mike Eliason General Counsel and Director of Government Affairs Oregon Forest and Industries Council
3080 25th St SE | Salem, OR 97302 www.oregonmanufacturers.org
June 15, 2020
Director Whitman & DEQ Staff: Thank you for the opportunity to submit comments in response to the Department of Environmental Quality’s Program Options to Cap and Reduce Greenhouse Gas Emissions—Preliminary Report. Oregon Manufacturers & Commerce is an association dedicated to promoting, protecting, and advancing Oregon manufacturers and their allied partners. From the silicon forest to forest products, fabricated metals, machinery, paper, rail cars, aerospace and food and beverage products, our members provide Oregonians with good paying jobs and economic stability for our state. We wanted to take this opportunity to respond to several of the questions DEQ posed to stakeholders upon releasing the preliminary report on Executive Order 20-04. Section 2. Proposed stakeholder and public engagement processes 1. How might DEQ best coordinate the public engagement aspects of both the effort described in this report on cap and reduce program or programs development and the Clean Fuels Program expansion? DEQ should establish an executive order-specific webpage that includes documents and relevant information related to the order, as well as information regarding upcoming meetings. This webpage should include information from each state agency involved in the implementation of the order so that Oregonians can more easily access information and participate in the rulemaking and workshop process. 2. How should DEQ engage with communities or individuals with limited or no internet access? DEQ staff should host a series of in-person, community level meetings, EQC meetings, and virtual meetings to capture public feedback. In-person meetings and opportunities for public comment ought to be located in different geographic areas of the state to allow for diverse participation from the public, particularly workers who could suffer displacement due to Executive Order 20-04. Stakeholders also should have the opportunity to respond to work conducted by third-party consultants, regardless of access to internet. 3. What additional engagement strategies should the agency consider during the Phase 2 scoping work? Working families are noticeably absent from the agency’s stakeholder engagement strategy. Like potentially regulated entities, these individuals could suffer negative impacts and significant cost increases under the executive order. DEQ should prioritize engagement with workers and self-employed individuals who will face significant challenges and economic hardship under the proposal.
3080 25th St SE | Salem, OR 97302 www.oregonmanufacturers.org
4. Are the policy issues identified under “Stakeholder Engagement” in subsection 2.3.4. and those in subsections 3.2. and 3.3. appropriately inclusive of issues, concerns and considerations needing discussion? a. What other issue areas should the agency convene stakeholder meetings for? DEQ must make provisions for Energy-Intensive, Trade-Exposed (“EITE”) entities, which are the most likely to suffer from potential carbon leakage as a consequence of this program. The agency’s Preliminary Report identifies leakage as a consequence to be avoided, but it does not state a need to protect EITEs from the most significant impacts of the program or how the program might identify whether a business or industry sector is EITE. b. What other approaches to organizing stakeholder conversations should the agency consider? DEQ must ensure that any proprietary information disclosed during Rules Advisory Committee process is kept confidential so as to not further disadvantage potentially regulated entities. 5. How should the agency approach identifying and selecting interested parties to serve on the Rules Advisory Committee(s)? The agency should create an inclusive application process and allow applicants to apply via email or through the agency website to participate on the Rules Advisory Committee (RAC). The RAC selection process should be transparent to the public and equitable to all interested stakeholders. The RAC should include a representative from each of the potentially regulated sectors, and regulated sectors should represent a majority of members on the RAC. This is a regulatory program, and all potentially regulated entities should have a seat at the table. Consumers will also bear the downstream costs of Executive Order 20-04, and industrial, commercial, and residential energy consumer advocacy organizations should be represented on the RAC. Membership must be balanced to include stakeholders both inside and outside the Portland Metro area. Entities that could benefit financially from the executive order should not be included on the RAC. This is a regulatory program; revenue raising is not within the scope of executive authority. RAC membership should include members who are subject to the regulatory Cap and Reduce program.
3080 25th St SE | Salem, OR 97302 www.oregonmanufacturers.org
6. What perspectives and expertise are critical in-terms of Rulemaking Advisory Committee member participation? Entities that are subject to regulation should comprise the majority of Rulemaking Advisory Committee (RAC) members. These include: large stationary sources, transportation fuels, and all other liquid and gaseous fuels, including natural gas. Without this expertise, DEQ could promulgate Cap and Reduce rules that are not technologically feasible and, as a result, shutter Oregon-based facilities. All trade associations that represent potentially regulated Oregon entities with expertise in air quality also must have a seat on the RAC. Industrial ratepayer advocacy organizations must also be included to provide critical feedback on the impacts of DEQ promulgated Cap and Reduce rules on energy consumers, since liquid and gaseous fuels are subject to Executive Order 20-04. Although ratepayers are indirectly impacted by Cap and Reduce regulations on natural gas and other liquid and gaseous fuels, they must be represented on the RAC. 7. Given the potential wide-reaching scope of proposed rules, how should the agency organize the Rulemaking Advisory Committee process to ensure critical issues receive adequate attention and discussion? Greenhouse gas Cap and Reduce rules will have a significant impact on the economy and vitality of rural Oregon communities. Rulemaking must be organized to allow for maximum participation from potentially regulated entities and workers, particularly those in rural areas of the state. DEQ should engage early with energy intensive trade exposed entities in order to prevent leakage and ensure that working families are not unduly impacted. Section 3. Framing key policy questions and options. First, we continue to believe the outbreak of COVID-19 and its impact on our economy necessitate a temporary suspension of this order so that the industries subject to its provisions have an opportunity to recover. Second, we are concerned that several aspects of the executive order exceed statutory authority. Finally, it should be noted that the carbon reduction goals outlined in Executive Order 20-04 cannot be achieved with existing technology. The agency notes that, “The executive order sets out the emissions reduction goals consistent with recent science: Oregon will reduce its emissions at least 45 percent below 1990 levels by 2035 and at least 80 percent below 1990 levels by 2050.” The agency should acknowledge that the greenhouse gas reduction goals outlined in the executive order are not feasible using today’s technology.
3080 25th St SE | Salem, OR 97302 www.oregonmanufacturers.org
During the first week of April 2020 (peak of stay home orders worldwide), global emissions of greenhouse gases were 17 percent below 2019 levels, as 89 percent of the populations that emit greenhouse gases where staying at home. (The Economist, May 21, 2020). Yet even as travel by car and airplane nearly ceased, we are still expected to use 92 percent of the greenhouse gases emitted last year, globally. Economic shutdowns as a result of coronavirus have shown that the technology does not currently exist to meet Paris Accord or Oregon greenhouse gas reduction goals. The Economist (May 21, 2020) writes:
“Shutting down swathes of the economy has led to huge cuts in greenhouse-gas emissions. In the first week of April, daily emissions worldwide were 17% below what they were last year. The International Energy Agency expects global industrial greenhouse-gas emissions to be about 8% lower in 2020 than they were in 2019, the largest annual drop since the second world war. That drop reveals a crucial truth about the climate crisis. It is much too large to be solved by the abandonment of planes, trains and automobiles. Even if people endure huge changes in how they lead their lives, this sad experiment has shown, the world would still have more than 90% of the necessary decarbonisation left to do to get on track for the Paris agreement’s most ambitious goal, of a climate only 1.5°C warmer than it was before the Industrial Revolution.”
It is clear that eliminating the use of transportation fuels or shuttering businesses (such as with a COVID-19 stay home order or through Executive Order 20-04) will not achieve Oregon’s unattainable greenhouse gas reduction goals—particularly is a global shut down only resulted in 8% reduction in greenhouse gases. April 2020 proves that humanity cannot achieve greenhouse gas reduction levels, such as those put forward by Governor Brown or in the Paris Climate Accord, simply by changing our lifestyles. Real technological breakthroughs in the fields of energy production, storage, and consumption are needed to meet Oregon’s ambitious climate goals. And today’s energy technologies are woefully inadequate if humanity is going to meet its need to power things with electricity; temperature control of buildings; grow, distribute, and cook food; manufacture goods; and move people and goods on trains, planes, vessels and automobiles without any carbon emissions. Without a global technological revolution, the executive order is likely to result in a shut-down of large sectors of Oregon’s already fragile economy and the displacement of thousands of workers—particularly those in rural and underserved areas of the state. Thank you again for the opportunity to comment,
Shaun Jillions, Executive Director
June 15, 2020
Sent via email to [email protected]
Oregon Department of Environmental Quality
Re: Comments on Executive Order 20-04 Implementation
Thank you for the opportunity to comment on the proposed process, policy considerations, and
initial core program design elements related to implementing Executive Order 20-04 (Cap and
Reduce Greenhouse Gas Emissions). Founded in 1965 to advance the efficiencies of
collecting and processing recyclables and solid waste, Oregon Refuse and Recycling Association
(ORRA) is the statewide trade association representing solid waste management companies in
Oregon. ORRA members collect and process most of Oregon's residential and commercial refuse
and recyclables, as well as operate material recovery facilities and many of Oregon's municipal solid
waste transfer stations, landfills, and compost facilities.
With a very ambitious timeline and process proposed to implement Executive Order 20-04,
ORRA appreciates the commitment of the Department of Environmental Quality (DEQ) and
Director Whitman to an inclusive process to foster engagement and transparency. With multiple
components and simultaneous meetings occurring, to facilitate participation and accessibility
across the state, effective communication is essential.
ORRA submits the following comments for your consideration:
1. To aid in effective communication, engagement, and transparency, all meetings related to
implementation of Executive Order 20-04, including pre-rulemaking public engagement,
should be recorded and made available on DEQ’s website in a central location that
houses all information related to implementation of Executive Order 20-04.
2. ORRA members provide regulated solid waste and recycling services in communities
across Oregon, and could be significantly affected by the implementation of Executive
Order 20-04. Therefore, ORRA has requested (through DEQ staff) to be included as a
member of the rulemaking advisory committee for Landfill Methane Emissions. ORRA is
assessing how best to engage and participate in the Clean Fuels discussions, and have
also requested to directly participate in whatever efforts are convened to address Food
Waste Reduction. Unlike the other preliminary work plans, the Preliminary Work Plan
for Reducing Food Waste does not describe a process for engaging and convening
conversations. ORRA would like DEQ to provide additional clarity about how it will
engage ORRA and other key partners in this process.
ORRA Comments on Executive Order 20-04 Implementation
June 15, 2020
Page 2 of 2
3. In response to DEQ’s request to comment on policy considerations and scoping, ORRA
has concerns with:
a. Section 1 Scoping of the Preliminary Work Plan for Achieving Reductions in
Methane Emissions from Landfills. Section 1 states “DEQ also would seek input
on whether alternative compliance measures for reducing the production of
methane should be considered in the rulemaking, including permit conditions
providing for limits or arrangements to limit putrescible waste accepted by a
facility." Preventing the generation, or limiting the types of materials for disposal
should be conducted upstream and not within the scope of this workplan for
landfills, as they have minimal impact on waste prevention and diversion
processes. Landfills are receivers and unable to limit putrescible waste from
coming to the facility; permit conditions limiting the amount of putrescible waste
is not feasible. Source reduction and diversion of putrescible waste needs to occur
upstream.
b. Section 8 of the Preliminary Work Plan for Achieving Reductions in Methane
Emissions from Landfills, specifically 8(b) Alternative measures to reduce
incoming (non-food) putrescible waste to landfills. Diversion of organic materials
happens before landfilling, and Oregon has robust recovery programs in place for
cardboard, newsprint, green waste, and woody debris. Source reduction and/or
diversion of these materials should not be considered within the scope of the work
plan for achieving reductions in Methane Emissions in the Air Quality Program.
4. In addition, ORRA requests consideration of the benefits landfills already have
established, providing renewable energy by creating electricity and renewable natural
gas. These efforts may be substantial in meeting Oregon’s greenhouse goals and should
be considered through the Clean Fuels Program or with the methane emissions in the Air
Quality Program.
Again, thank you for the opportunity to comment.
Sincerely,
Andrea J. Fogue
Governmental Affairs Director
c: ORRA Steering Committee
Contact: Waylon Buchan, OTA 503-707-5756 or [email protected]
June 15, 2020
The Oregon Trucking Associations represent the motor carriers who use and pay for Oregon’s transportation
infrastructure. They are responsible for transporting nearly 88% of all manufactured freight tonnage in
Oregon – roughly 150,514 tons per day. Now, more than ever, Oregonians are reminded of the importance of
these timely freight movements, because they allow citizens to safely stay home during the ongoing COVID-
19 pandemic without forgoing food, medicine, clothing, or other essential goods. At the same time, Oregon is
the most expensive state in the nation to operate a commercial heavy vehicle, where a typical 5-axle, 80,000-
pound truck results in $30,410 in combined state and federal taxes. Our members care deeply about the
environment, while also believing our economy and the environment are best served when our transportation
infrastructure is fully maintained to serve Oregon’s current and future capacity needs.
Executive Order No. 20-04 directs state agencies to implement policies geared toward achieving ambitious
greenhouse gas reduction goals established under ORS 468A.205. The order sets in motion three
government actions which will have significant impacts to Oregon’s transportation system, the economy, and
household budgets statewide. EO 20-04 directs DEQ to increase the stringency of the Clean Fuels Program as
well as implement a GHG reduction program similar to cap and trade. At the same time, the order formalizes
and mandates ODOT’s adherence to the Statewide Transportation Strategy, which will ultimately result in less
transportation capacity, fewer new lane miles, and a disinvestment in critical statewide infrastructure in
Oregon. We wish to register the following observations regarding EO 20-04 and the Statewide Transportation
Strategy Multi-Agency Implementation Work Plan.
Impacts to Highway Trust Fund
• One goal of climate change legislation is to transition away from fossil-fuel powered vehicles and
toward electric and other low emission vehicles and fuels. While this is a goal we support, Oregon’s
transportation system is funded, in large part, through fuel taxes. As seen from Legislative Revenue
Office Analysis during previous legislative sessions, cap and trade accelerates this already declining
revenue stream, resulting in less available funding to maintain and preserve the transportation system
relied on by all modes of travel – including trucks, cars, transit, bicycles, and pedestrians.
• An independent economic analysis must be conducted in order to model the range of fuel price
impacts to motorists and commercial trucking. The analysis should use all available data and consider
market factors to determine the range of potential impacts.
• As of this date, limited data collection and modeling have been conducted concerning the impacts of
the proposed cap and trade regime on the transportation sector and Oregon’s economy. Now that
state agencies are tasked with greenhouse gas emission reduction, it is their responsibility to conduct
the diligent analysis necessary to mitigate harm to the transportation system.
Future Transportation Investments
• Previous legislative proposals demonstrated that a cap and trade program will negatively impact
Oregon’s capacity to secure future transportation investments. With no planned funding alternative,
continued adoption of fuel-efficient vehicles, and additional mandates from EO 20-04, Highway Trust
Contact: Waylon Buchan, OTA 503-707-5756 or [email protected]
Fund revenues will dramatically decrease over time. Declining revenues will curtail future debt
capacity and bonding capability. It will also reduce road maintenance budgets for the state, counties,
and cities, jeopardizing road and bridge conditions across Oregon.
• Enshrining the Statewide Transportation Strategy in ODOT agency policy will constrain capacity
expansion efforts in a state where congestion at key bottlenecks is a critical concern. The STS favors
using limited resources for alternative modes in order to reduce trips and vehicle-miles-traveled, but
fails to adequately consider that for many Oregonians, using an alternative mode of transportation is
simply not feasible. Similarly, carpooling, transit, biking, and walking do little to facilitate the
movement of freight in Oregon.
• Under the STS, meaningful roadway capacity expansion in the form of new travel lanes will largely
become a matter of last resort. While proponents of this thinking believe that building infrastructure
“induces” demand, the fact remains that Oregon’s population continues to increase every year, and
our transportation system is not meeting existing or future demand.
• This is most prevalent in the Portland Rose Quarter bottleneck, which is currently listed as the #19
worst freight bottleneck in the nation by the American Transportation Research Institute. Any serious
greenhouse gas reduction program should aim to alleviate this critical bottleneck and reduce excess
idling emissions occurring along the corridor.
Cost Containment and Impact Oregon Households
• The cumulative increases in fuel costs to cars and trucks due to the 2017 Transportation Funding
Package, the Clean Fuels Program, and market conditions outside of Oregon’s ability to control are all
of significant concern. Just like previous legislative cap and trade proposals, the mandates within EO
20-04 will further exacerbate this issue by increasing the price impacts of the Clean Fuels Program
and stacking on a future, undefined cap and trade system through DEQ.
• This stacking of multiple carbon programs will have a profound impact on all Oregon motorists,
freight trucking, and will have downstream negative impacts on the Oregon economy.
• The majority of freight trucking relies on diesel fuel, and because no commercially viable alternatives
currently exist, transportation cost increases stemming from a cap and trade program will result in
increased prices for all consumer goods and building materials. At the same time, transportation
electrification efforts under the STS are almost exclusively aimed at passenger vehicles. This
recognizes the reality that zero-emission vehicles are not commercially viable for freight trucking
applications but does nothing to provide a transition path for commercial vehicles.
Conclusion
New agency programs under EO 20-04 will impose significant costs on several segments of Oregon’s
industries in order to reduce greenhouse gas emissions over time. Previous legislative efforts to pass cap and
trade failed because lawmakers neglected to address how transportation costs will inevitably impact motorists,
freight trucking, or the cost of raw materials and consumer goods.
Allow for the necessary due diligence and consideration of the impacts to the Highway Trust Fund. Consider a
phased-in timeline based on real analysis in order to address the consequences of EO 20-04 on Oregon’s
transportation system. While OTA is committed to preserving the climate for future generations, we also feel
strongly that protecting our infrastructure is vital to our children, grandchildren, and the economic vitality of
our state.
June 10, 2020
Oregon Department of Environmental Quality
700 NE Multnomah Street, Suite 600
Portland, OR 97232
RE: PPGA Comments on DEQ’s Preliminary Report
Thank you for the opportunity to provide feedback on the Oregon Department of Environmental
Quality’s Preliminary Report submitted to Governor Brown as directed under Executive Order
20-04.
The Pacific Propane Gas Association (PPGA) is the state trade association representing Oregon’s
propane industry. Our membership includes small multi-generational family businesses and large
corporations engaged in the retail marketing of propane gas to Oregonians. PPGA members
provide propane to the residential, commercial, agricultural, transportation and industrial markets
throughout Oregon. Currently, users of propane have found value in propane’s environmental
benefits, versatility, and affordability. This is demonstrated in the growth of propane demand
across all sectors of the energy markets. Propane gallon consumption has increased over 20% in
the past five years.
There are many environmental and customer benefits of using propane. Propane is an approved
clean fuel listed in the 1990 Clean Air Act. Substituting propane for other fuels is an economical
and viable step toward cleaner air. Using propane reduces the greenhouse gas carbon dioxide and
air pollutants like carbon monoxide and nitrogen oxide. Propane is extremely efficient because it
is employed directly at the point of use and does not require the initial infrastructure investment
or maintenance costs of other energy sources. Additionally, the fuel has much versatility due to
its portability and many applications.
PPGA agrees there is a compelling need to combat climate change and believes propane is part
of the solution to reduce greenhouse emissions in Oregon. PPGA offers these facts regarding
propane:
1. The Energy Star program gives propane a source site ratio of 1.01, compared to 3.03 for
electricity from the grid. This means it takes 3.03 units of electricity to produce and
deliver one unit of energy to a home, compared to only 1.01 for propane.
2. Propane is electric grid free making it a valuable partner energy source at solar and wind
generation facilities when the sun does not shine or the wind does not blow.
3. Particulate matter is listed as a carcinogen by the W.H.O. Vehicles using propane reduce
particulate matter to virtually zero.
4. Nationally propane produces 43 percent fewer greenhouse gas emissions than using an
equivalent amount of electricity generated from the U.S. grid.
5. Propane-fueled technologies produce fewer nitrogen oxide (NOx) and sulfur oxide (SOx)
emissions than technologies fueled by electricity, gasoline, and diesel. Because NOx and
SOx contribute to acid rain formation and cause respiratory ailments, manufacturers must
comply with laws that set limits for these emissions.
PPGA offers the following comments for consideration by the DEQ.
1. Propane is widely used in rural communities, and so PPGA supports a robust community
and individual engagement plan by DEQ that includes rural Oregonians. Our customers
include many low to moderate income families that will likely bear any potential fuel cost
increase that may result due to a cap and reduce program. Additionally, the agriculture
industry is a key sector served by the propane industry. PPGA wants to ensure any
potential fuel costs increases do not overly negatively impact the price of food and
agricultural commodities. It is imperative that rural families, businesses, and individuals
have ample opportunity to have their voices heard throughout the process.
2. DEQ noted it is particularly interested in receiving input on the proposed stakeholder and
public engagement process outlined in Section 2. PPGA requests that DEQ make clear
statements on the need to engage non-utility energy stakeholders in a meaningful way
during the work group and Rulemaking Advisory Committee process. During recent cap
and trade legislative policy proposal discussions little effort has been made to give voice
to small independent energy providers that are not regulated as public utilities. Under the
GHG reduction proposal, it is likely many of our members will be regulated and our
customers impacted. It is important to give voice to non-regulated entities to ensure fair
treatment of all energy providers. PPGA respectfully requests that Darren Engle of Blue
Star Gas be considered for appropriate work groups and Rulemaking Advisory
Committees. Blue Star Gas is a member company of PPGA and one of our many
members committed to reduction of GHG in Oregon through energy efficient programs,
new technology developments, adoption of renewable propane and reduction of
emissions from the transportation section through use of propane Autogas. Darren can be
reached at [email protected] or (530) 945-8604.
3. PPGA supports DEQ’s use of multiple Rules Advisory Committees. The energy sector is
complicated and diverse. Multiple RACs will ensure that DEQ can adequately pay
specific attention to the issues and challenges of different energy sectors. With that in
mind, PPGA strongly supports a RAC dedicated to energy providers who are not
regulated by the Oregon Public Utility Commission.
4. PPGA strongly encourages DEQ to keep cost containment in the workgroup topics. Many
of our members are small businesses with less than 10 employees. Our members do not
have large legal and regulatory compliance departments to comply with overburdensome
regulations. Any adopted program needs to be able to have guidelines that small
businesses can comply with easily and do not put undue burden on Oregon small
businesses.
5. PPGA supports equitable distribution of compliance instruments. In legislative cap and
trade policy proposals, credits were often provided on a political basis as opposed to a
fair and equitable basis. DEQ should not be in the business of picking winners and losers
through the distribution of compliance instruments. Without this approach regulated
entities may find little value in making long term investments in the Oregon markets, thus
resulting in unnecessary leakage.
DEQ proposals should ensure there are not adverse negative results in research and development
programs from those in the energy sector. PPGA is concerned that potential programs could
make the Oregon market look less attractive to the traditional energy sectors if proposals are not
equitable and fair to all energy sectors. DEQ proposals should help encourage and provide all
sectors with resources to help reduce greenhouse gas emissions. For example, propane marketers
have begun introducing renewable propane into the Oregon marketplace. Encouraging more
development in this and other similar projects will help our industry decarbonize our fuel.
Renewable propane has an ultra-low carbon intensity; as low as 19. Although still early in
development there are many promising feedstocks that can be used to create biofuels, even
including products like pistachio waste. It is important that DEQ proposals help industry
continue to develop and invest in these types of technologies.
The propane industry is committed to greenhouse gas reduction. PPGA offers rebate programs
funded by our members to assist Oregonians to purchase new and more efficient appliances and
we offer rebates for conversion or purchase of clean burning propane Autogas vehicles.
Oregon currently leads the nation in propane school bus fleet by percentage of school buses
within the state with about 14 percent of the buses in Oregon being fueled by propane. As of
2019, Oregon ranks 4th out of 51 (including Washington D.C.) for the total number of propane
buses and first for propane bus penetration within the school bus fleet with approximately 1159
school buses. Portland Public Schools began adopting propane buses in 1983 and by 2010 had
converted virtually all of its nearly 400 district-owned and contracted buses to run on propane.
Based on the cost to deploy the cleanest commercially available Type C buses for each fuel type,
a propane powered school bus is the most economical and environmentally friendly option in the
school transportation sector. Propane Autogas buses cut 96 percent more NOx emissions
compared with clean diesel buses.
Thank you for allowing us to share our feedback on this preliminary report and to provide some
information about our industry and steps we are taking to reduce the greenhouse gas impact from
our fuel. We would welcome the opportunity to engage in DEQ’s policy efforts moving forward.
Sincerely,
Matthew Solak
Executive Director
Pacific Propane Gas Association
Lana Butterfield
Director of Government Affairs
Pacific Propane Gas Association
1
June 15, 2020 Oregon Department of Environmental Quality 700 NE Multnomah St. Portland, OR 97232 Submitted via email to: [email protected] RE: RNG Coalition Comments on Cap and Reduce Program Preliminary Report The Coalition for Renewable Natural Gas (RNG Coalition) offers this comment letter in support of the Oregon Department of Environmental Quality’s (DEQ) work toward a “Cap-and-Reduce” Program. Cap-and-Reduce will help achieve a significant amount of Oregon’s greenhouse gas (GHG) reduction goals and Renewable Natural Gas (RNG) represents one of the most promising technologies that could be incentivized by such a program. Below we provide some background about our organization, and the RNG industry generally, before offering initial reactions to the key policy questions raised in DEQ’s preliminary report entitled Program Options to Cap and Reduce Greenhouse Gas Emissions (Preliminary Report).1
About the RNG Coalition and the RNG Industry
The RNG Coalition is the trade association for the RNG industry in the United States and Canada. Our diverse membership is comprised of leading companies across the RNG supply chain. Together we advocate for the sustainable development, deployment and utilization of RNG, so that present and future generations have access to domestic, renewable, clean fuel and energy in Oregon and across North America.2
The RNG industry is nascent relative to other renewables industries but has shown extraordinary growth recently that has been driven by policies designed to promote environmental and economic goals—including but not limited to clean air, improved waste management, increased job development, energy independence, and resource diversity.
Most of the RNG projects developed since 2011 have been incentivized by transportation decarbonization programs, including the Renewable Fuel Standard Program (RFS) run by the United States Environmental Protection Agency’s (US EPA), California and British Columbia’s Low Carbon Fuel Standards (LCFS), and Oregon’s Clean Fuel Program (CFP). Many recent RNG projects have been largely underwritten by the monetization of tradeable credits that RNG-sourced transportation fuel generates under these programs. Oregon should build off of the successful examples set by such programs when considering how to incentivize RNG under Cap-and-Reduce.
1 https://www.oregon.gov/deq/FilterDocs/CapandReducereport.pdf 2 For more information see: http://www.rngcoalition.com/
2
RNG Use Creates Significant Environmental and Economic Benefits
Despite the success of the existing programs promoting RNG in transportation described above, an opportunity for significant additional growth in RNG exists outside of the transportation and power sectors.3 If DEQ’s Cap-and-Reduce Program successfully motivates significant RNG use in other sectors it will represent a critical step forward for the industry.
There remain thousands of landfills, wastewater treatment facilities and livestock operations across North America—including many in Oregon—where raw biogas (methane) is being flared, or worse, is uncollected and escaping fugitively into the atmosphere as a short-lived climate pollutant that, according to the Intergovernmental Panel on Climate Change, is up to 84 times as potent a greenhouse gas as carbon dioxide.4
In addition to the environmental benefits of RNG, there are substantial economic benefits realized with increased development, deployment and utilization of RNG—including millions of dollars in capital investment ($10-$100 million per project) and creation of thousands of clean energy sector jobs (on the order of 173 direct and indirect jobs per project).5 The Cap-and-Reduce Program has the potential to unlock this RNG opportunity for the region.
DEQ Should Continue to Carefully Consider the Relationships Between Cap-and-Reduce, CFP, RPS, Senate Bill 98 and other Complementary Policies
As DEQ develops the Cap-and-Reduce Program we applaud DEQ’s attention to the relationship with other complementary policies already creating GHG reductions in Oregon. The CFP and the Renewable Portfolio Standard (RPS) are two critical “fuel switching” policies that are driving a significant amount of the more challenging6 GHG abatement activities in the power and transport sectors.
The RPS is clearly already creating a high penetration of renewable power, with a target of 20% renewable this year,7 and the CFS is beginning to motivate significant additional renewable fuel use—
3 ICF, Renewable Sources of Natural Gas: Supply and Emissions Reduction Assessment, 2019 https://gasfoundation.org/2019/12/18/renewable-sources-of-natural-gas/ 4 Intergovernmental Panel on Climate Change Fifth Assessment Report estimate of the Global Warming Potential of methane over a 20-year time horizon. See: Myhre et al. 2013: Anthropogenic and Natural Radiative Forcing. In: Climate Change 2013: The Physical Science Basis. Contribution of Working Group I to the Fifth Assessment Report of the Intergovernmental Panel on Climate Change. https://www.ipcc.ch/site/assets/uploads/2018/02/WG1AR5_Chapter08_FINAL.pdf 5 ICF, Economic Impacts of Deploying Low NOx Trucks fueled by Renewable Natural Gas, 2017 https://static1.squarespace.com/static/53a09c47e4b050b5ad5bf4f5/t/59077544ebbd1ad192d13ff6/1493660998766/ICF_RNG+Jobs+Study_FINAL+with+infographic.pdf 6 Traditionally switching toward renewable fuels and sources of electricity has been thought of as more challenging (often higher cost on a dollar-per-ton-reduced basis) than energy efficiency or other abatement opportunities. Despite this challenge, effectively promoting such “fuel switching” toward renewable energy remains critical to hitting Oregon’s GHG reduction goals. 7 https://olis.leg.state.or.us/liz/2016R1/Downloads/MeasureDocument/SB1547/Enrolled
3
with liquid biomass-based diesel substitutes now more than 10% of all liquid fuel used in diesel vehicles, and RNG used in transport providing more than 60% of all fuel used in natural gas vehicles.8
In contrast to the success in power and transportation, almost no low-GHG fuels are being used to substitute for conventional natural gas in non-transport applications in Oregon today. Therefore, a primary goal of Cap-and-Reduce program should be to provide a similarly strong incentive for fuel switching toward RNG and other substitutes for conventional natural gas.
Implementation of Senate Bill 989 of 2019, which is currently underway at the Oregon Public Utilities Commission (OPUC), will provide a framework for cost recovery and voluntary targets to aim for as natural gas utilities begin procuring RNG, but needs to be well-coordinated with the GHG accounting and incentives created under Cap-and-Reduce to ensure the maximum GHG reductions are achieved. These three policies (CFS, RPS, SB 98) create an interrelated system with the Cap-and-Reduce Program and the RNG industry will be responding holistically to the incentives created by this entire system.
Greenhouse Gas Emissions Reduction Goals, Sectoral Caps, Limits for Particular Entities, and the Trajectory(ies) of Reductions
We support setting science-based GHG emission reduction goals in alignment with achievement of the state-wide GHG goals, while also properly considering the relevant GHG abatement technologies—including RNG—available across various sectors and the possible economic benefits and costs of such technologies. With regard to overall program stringency, experience from other emissions trading program suggests that setting targets too loosely can lead to program compliance instrument prices remaining lower than expected—and investment in RNG and other important technologies being delayed as a consequence of low prices. One method to reduce the likelihood of program targets being set too laxly would be to rely on emissions-intensity based targets, which may be less likely to be impacted by underlying macroeconomic trends when compared to quantity-based targets.10 In the past, intensity targets have been criticized as not ensuring absolute GHG reductions or thought of as allowing for increased absolute emissions if aggressive economic growth occurred.11 However, many absolute quantity-based programs have erred on the side of overestimating current emissions and/or underestimating business-as-usual near-term emission decline trends when setting
8 Transportation fuel blend percentages are for Q4 2019 and taken from Oregon Clean Fuels Program Quarterly Data Summary. Available here: https://www.oregon.gov/deq/aq/Documents/cfp-q419.xlsx 9 https://olis.leg.state.or.us/liz/2019R1/Downloads/MeasureDocument/SB98/Enrolled 10 The Oregon CFS is a successful example of an intensity-based program. The CFS has managed to retain a strong incentive for GHG reductions even in the face of COVID-19 driven reduction in transportation fuel demand. 11 For a comparison of some of the tradeoffs of intensity-based programs see: http://pdf.wri.org/target_intensity.pdf
4
emission reduction goals. When coupled with unlimited banking of compliance instruments, this can lead to long-term oversupply of compliance instruments, depressed compliance instrument prices, and a lack of GHG abatement. We recommend that Oregon avoid this outcome. In many cases, it may be easier to properly assess the appropriate stringency of an intensity-based target for a given sector (or source) when compared to a quantity-based target because it eliminates one source of uncertainty (the demand for the product or energy service, which may be highly variable, especially in the current economic environment). If intensity-based targets are used for target-setting, credit trading can still be conducted in absolute units (e.g., metric tons of GHGs reduced). In such a framework, demand-reduction programs and efficiency-based actions can still be credited by developing appropriate quantification methodologies to estimate the absolute GHG benefits of such actions.12
The Scope of Program Coverage, Greenhouse Gas Emissions Thresholds, and Regulated Entities
Generally, in Cap-and-Trade programs, we support selecting a program scope that is as broad as possible—to incent reductions across the maximum amount of the region’s economy—but, as discussed above, in Oregon some sectors already have strong existing programs motivating the use of low-GHG technologies. Therefore, we recommend that DEQ target Cap-and-Reduce primarily toward emissions from non-transport, non-power sectors. The majority of emissions in these sectors are associated with combustion of conventional fuels in stationary applications (e.g., conventional natural gas), emissions of short-lived climate pollutants (e.g., methane), and process emissions in industrial activities.
With respect to the way in which Cap-and-Reduce covers GHG emissions associated with conventional natural gas use, we support the point of compliance being set with the natural gas utilities and natural gas suppliers being the primary covered entities, and direct coverage of emission-intensive and trade-exposed (EITE) sectors being used only if necessary to address EITE sectors’ process emissions and emissions leakage concerns (see additional comments on that topic below).
Distribution of Compliance Instruments
The Preliminary Report states that DEQ does not believe that the EQC has the authority to auction or otherwise sell rights to emit greenhouse gases or to distribute compliance instruments to a non-profit, third-party.13 This represents a significant difference from the established and developing cap-and-trade type programs in other parts of the country.14 It also takes away a key avenue by which existing US cap-and-trade programs create GHG abatement—reinvestment of allowance value. For example, in California, significant reinvestment of the revenue
12 For example, the California LCFS targets are based on a declining emissions intensity benchmark, but the program still credits efficiency projects at conventional petroleum refineries based on the absolute quantity of GHGs reduced. 13 Preliminary Report, page 8. 14 For example, in both California’s Cap-and-Trade Program and the Regional Greenhouse Gas Initiative a large share of compliance instruments are auctioned, and the proceeds reinvested by the government. The forthcoming Transportation and Climate Initiative even more explicitly acknowledges that the primary method of achieving GHG reductions is by raising revenue through auction and then reinvestment by using the term “Cap-and-Invest”.
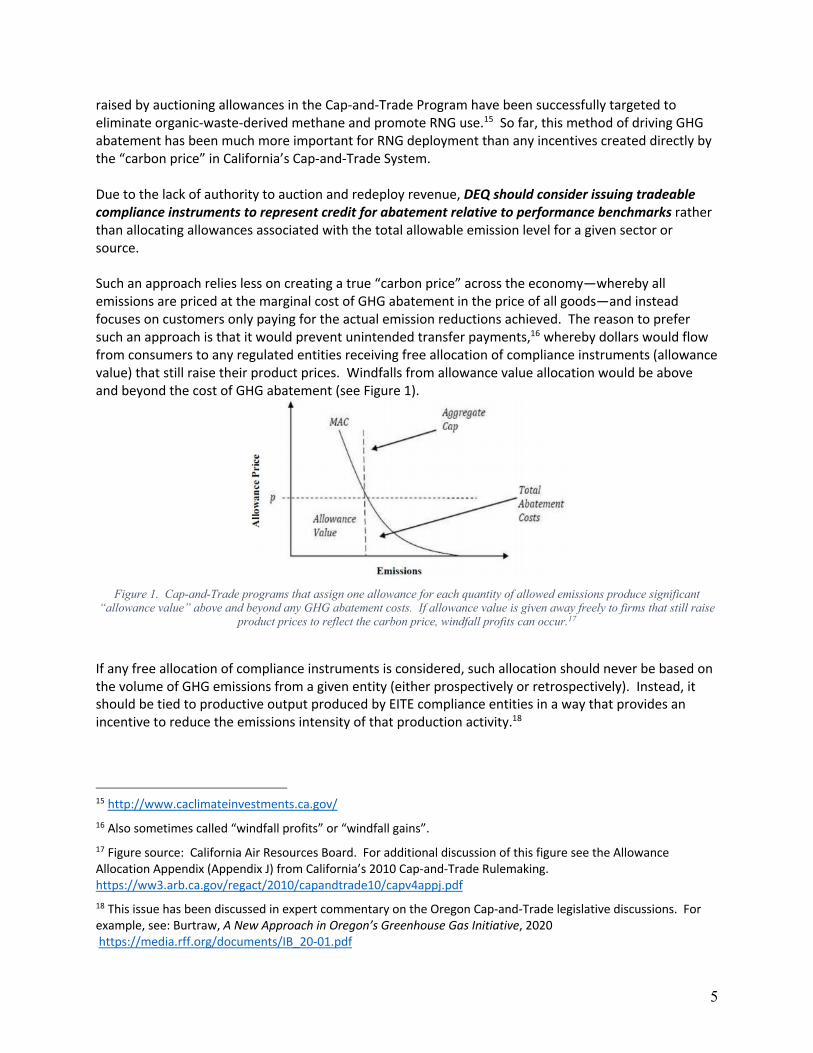
5
raised by auctioning allowances in the Cap-and-Trade Program have been successfully targeted to eliminate organic-waste-derived methane and promote RNG use.15 So far, this method of driving GHG abatement has been much more important for RNG deployment than any incentives created directly by the “carbon price” in California’s Cap-and-Trade System. Due to the lack of authority to auction and redeploy revenue, DEQ should consider issuing tradeable compliance instruments to represent credit for abatement relative to performance benchmarks rather than allocating allowances associated with the total allowable emission level for a given sector or source. Such an approach relies less on creating a true “carbon price” across the economy—whereby all emissions are priced at the marginal cost of GHG abatement in the price of all goods—and instead focuses on customers only paying for the actual emission reductions achieved. The reason to prefer such an approach is that it would prevent unintended transfer payments,16 whereby dollars would flow from consumers to any regulated entities receiving free allocation of compliance instruments (allowance value) that still raise their product prices. Windfalls from allowance value allocation would be above and beyond the cost of GHG abatement (see Figure 1).
Figure 1. Cap-and-Trade programs that assign one allowance for each quantity of allowed emissions produce significant
“allowance value” above and beyond any GHG abatement costs. If allowance value is given away freely to firms that still raise product prices to reflect the carbon price, windfall profits can occur.17
If any free allocation of compliance instruments is considered, such allocation should never be based on the volume of GHG emissions from a given entity (either prospectively or retrospectively). Instead, it should be tied to productive output produced by EITE compliance entities in a way that provides an incentive to reduce the emissions intensity of that production activity.18
15 http://www.caclimateinvestments.ca.gov/ 16 Also sometimes called “windfall profits” or “windfall gains”. 17 Figure source: California Air Resources Board. For additional discussion of this figure see the Allowance Allocation Appendix (Appendix J) from California’s 2010 Cap-and-Trade Rulemaking. https://ww3.arb.ca.gov/regact/2010/capandtrade10/capv4appj.pdf 18 This issue has been discussed in expert commentary on the Oregon Cap-and-Trade legislative discussions. For example, see: Burtraw, A New Approach in Oregon’s Greenhouse Gas Initiative, 2020 https://media.rff.org/documents/IB_20-01.pdf
6
Cost Effectiveness and Cost Containment
The first-best protection against uncertainties related to the cost of the Cap-and-Reduce program is having a clear understanding of what abatement actions the program is intended to drive, and the cost of supplying such abatement relative to the demand for abatement created by the declining program targets. We recommend that sector-specific analysis be undertaken, as part of contracted analyses referenced in the Preliminary Report, to create abatement supply curves that could inform both appropriate program targets and any cost containment features of the program.
We strongly support compliance instrument trading across all compliance entities as an excellent way to ensure that the most cost effective GHG abatement is incented. As described above, the majority of RNG projects are currently financed based on the value of such tradeable environmental credits. We also support the creation of price-stability mechanisms in tradeable environmental credit markets. Such features can increase investor certainty in such markets and provide consumer protection. Ideally both low price (e.g., price floors) and high price (e.g., cost containment reserves, credit clearance markets, etc.) stability options would be implemented to provide investors in RNG a clear understanding of the expected price band. Any such stability mechanisms should be designed so that operating GHG abatement projects have ample opportunity to monetize compliance instruments generated from proven emission reductions prior to the availability of additional flexible compliance options.
Options to Avoid or Minimize Program Effects on Particular Communities and Economic Interests
Considering the impacts of the program on both particular communities and various economic interests is critical. With respect to minimizing impacts on particular communities, we support program design proceeding in recognition of environmental justice principals and through the robust stakeholder process outlined in the Preliminary Report.
With respect to economic interest, product-based emissions-intensity benchmarks have been the primary method of addressing leakage concerns of EITE industries in California’s Cap-and-Trade program.19 We recommend that Oregon collaborate with California and other jurisdictions who have analyzed the exposure of various industries to determine which are EITE and consider if crediting/allocation based on harmonized benchmarks would address the concerns of such industries.
A concept that can also be helpful in minimizing emissions leakage is the idea of using lifecycle GHG accounting. Oregon has long been a pioneer in this area, since it developed the first state-level
19 For a description of how California first began to examine EITE issues see the leakage appendix (Appendix K) from CARB’s 2010 Cap-and-Trade rulemaking: https://ww3.arb.ca.gov/regact/2010/capandtrade10/capv4appk.pdf
Updates to that analysis are discussed here: https://ww2.arb.ca.gov/our-work/programs/cap-and-trade-program/allowance-allocation/allowance-allocation-industrial
7
consumption-based GHG inventory20 and uses lifecycle accounting in the CFP.21 LCA can work well in programs that use either quantity-based or intensity-based targets.22
We recognize from the Preliminary Report, that DEQ feels they do not have legal authority to regulate emissions outside of the state.23 This should not raise concerns about the use of lifecycle accounting (LCA) that includes out-of-state emissions in the scope of the program simply to maintain the correct incentives to achieve net GHG reductions (i.e., to assign a mandatory compliance obligation to emissions associated with imported products based on their LCA).24
Furthermore, regardless of whether or not emissions associated with imported product are assigned a compliance obligation, we believe LCA can, and should, be used when developing comparative methods to quantify the benefits of low-GHG activities for recognition under the Cap-and-Reduce program. For example, when comparing the benefits of using RNG to conventional gas, the lifecycle emission performance of both could be taken into account to determine the appropriate GHG benefit to offer credit for when a firm uses RNG.
For RNG, the advantage of using lifecycle accounting is that it will be able to capture the upstream methane reduction benefits of many RNG projects and it will also correctly assess any upstream impacts due to embedded energy in production and transport, including methane leakage. Neglecting these important effects is unwise when setting incentives for RNG projects if the goal is to maximize GHG emission reductions.25 At a minimum, lifecycle accounting should be used to evaluate the GHG performance of RNG and other biofuels under Cap-and-Reduce, ideally in a way that is harmonized with the CFP program. If such harmonization does not occur, we believe there may be confusion about what incentives exist with respect to RNG development for Oregon across various program.26
20 https://www.oregon.gov/deq/mm/Pages/Consumption-based-GHG.aspx 21 https://www.oregon.gov/deq/aq/programs/Pages/Clean-Fuels.aspx 22 LCA is not inherently linked to an intensity-based framework, although Oregon’s CFP and California’s LCFS are well-regarded LCA examples that also happen to set targets that are intensity-based. 23 Per page 18 of the Preliminary Report, “the EQC likely does not have authority to regulate emissions occurring outside the state.” 24 California’s LCFS has been found to permissibly regulate the in-state behavior of selling different mixtures of fuel (including imported fuel) based on its lifecycle GHG performance. Such use of lifecycle analysis did not amount to discrimination against interstate commerce or regulating extraterritoriality because the program’s LCA disincentivized the purchase of a fuel only to the extent that that fuel was relevantly different with respect to California’s legitimate interest in curbing greenhouse gas emissions and climate change. See: http://blogs.edf.org/climate411/files/2019/01/RMFU2_opinion_without_attachments.pdf 25 WRI, The Production and Use of Waste-Derived Renewable Natural Gas as a Climate Strategy in the United States, 2018 https://www.wri.org/publication/renewable-natural-gas 26 We have emphasized the importance of this interaction in our comments to the OPUC in the proceeding related to implementation of SB 98. See our submissions in OPUC Docket AR 632:
https://edocs.puc.state.or.us/efdocs/HAC/ar632hac84355.pdf https://edocs.puc.state.or.us/efdocs/HAC/ar632hac85918.pdf https://edocs.puc.state.or.us/efdocs/HAC/ar632hac131655.pdf https://edocs.puc.state.or.us/efdocs/HAC/ar632hac135949.pdf
8
The alternative to using lifecycle accounting is to use source-based accounting similar to that used in national and state-level GHG emission inventories.27 This source-based accounting is simpler in that it focuses only on the greenhouse gases emitted at the point of end combustion of the gas and usually makes the assumption that all bio-derived fuels are “carbon neutral” (i.e., have zero net CO2 emissions since CO2 created at the point of combustion are offset by the uptake of CO2 when the biological material that was the source of the RNG was grown). Using such a source-based system does not account for upstream methane effects (both reductions when the RNG is created and leakage as the gas is transported to end market) and is therefore not an ideal way to incent the utilities to procure the lowest-GHG RNG projects.
If lifecycle accounting is not used, some of the upstream benefits of RNG projects can be incented by offset-type crediting.28 If offset crediting is preferred, we support the DEQ undertaking a thorough review of the potential supply of such credit opportunities, the necessary compliance instrument price to motivate such opportunities, and consideration of the benefits of allowing unlimited use of such abatement as the first line of protection against high compliance instrument prices. Any approved offset protocols should incorporate as much of the lifecycle as possible so as to maximize the incentive to produce the lowest-GHG RNG.
Conclusion
The RNG Coalition appreciates the opportunity to participate and provide comments in this rulemaking. Our members look forward to investing in and constructing new RNG production facilities that create clean energy sector jobs and reduce GHGs in Oregon. We thank DEQ for their leadership on this topic.
Such robust dialogue will ensure that Oregon’s programs serve as a model and show the full breadth of benefits of RNG to ratepayers, environmental advocates, utilities and policymakers across North America.
Sincerely,
Sam Wade Director of State Regulatory Affairs Coalition for Renewable Natural Gas 1017 L Street #513 Sacramento, CA 95814
27 For a description of how these two approaches relate to RNG see pages 44-47 and Appendix B of the ICF study Renewable Sources of Natural Gas: Supply and Emissions Reduction Assessment cited above. 28 Assuming compliance instrument prices are sufficiently high and clear offset credit rules are established.
Response to DEQ questions seeking input
Alan Journet, Co-Facilitator,
Southern Oregon Climate Action Now
1. How might DEQ best coordinate the public engagement aspects of both the effort described in this report on cap and reduce program or programs development and the Clean Fuels Program expansion?
The two-phase process is probably best wherein substantial broad public representation is present on the Rules Advisory Committee(s) and the results of these deliberations are subject to public hearings - necessarily via some such technology as ZOOM while the COVID crisis continues.
2. How should DEQ engage with communities or individuals with limited or no internet access?
I don’t see how this can be achieved very easily without open public meetings advertised in the local media that feature low attendance and mask requirements, with adequate individual distancing.
3. What additional engagement strategies should the agency consider during the Phase 2 scoping work?
See response 1
4. Are the policy issues identified under “Stakeholder Engagement” in subsection 2.3.4. and those in subsections 3.2. and 3.3. appropriately inclusive of issues, concerns and considerations needing discussion?
a - Recent research has indicated that GHG emissions from forest operations (logging) annually exceed those from Transportation. Regrettably, with the exception of emissions resulting from fuel consumption, these largely escape assessment and regulation. While it is understandable that the DEQ program focus would be on ‘Regulated Emissions,’ DEQ should also commit to increasing the range of activities that emit and sequester greenhouse gases and bringing them within the assessed and ‘Regulated’ category. This will require developing new assessment protocols
b - While reducing emissions is a primary goal, the EO also incorporates language designed to promote carbon sequestration in our natural and working lands. This is reasonable since most projections suggest reducing emissions sufficiently to retain warming to 1.5°C above pre-industrial times will be difficult without development of techniques for removing greenhouse gases from the atmosphere. The most effective way to promote sequestration in forests and
farms is probably to incentivize it. Since the program generates no funds that could be used to invest directly in such an incentive system, another method of achieving sequestration funding is to offer polluting entities an option of offsetting their emissions to a limited extent by investing in (incentivizing) forestry or agricultural activities that achieve third-party certification as promoting sequestration.
a. What other issue areas should the agency convene stakeholder meetings for?
I imagine any proposal to assess GHG emissions from forestry and agriculture operations should include stakeholder meeting.
b. What other approaches to organizing stakeholder conversations should the agency consider?
5. How should the agency approach identifying and selecting interested parties to serve on the Rules Advisory Committee(s)?
It is very important that the Rules Advisory Committees be broadly representative and comprise individuals with relevant expertise. The representative component should include geographic representation, as well as sector and demographic representation. While it is clearly important to include the ‘regulated industries,’ it is also critical
6. What perspectives and expertise are critical in-terms of Rules Advisory Committee member participation?
a) It is unfortunate that ‘potentially regulated sectors’ are listed first since this creates the impression that the RAC will primarily serve that constituency when it should be seeking to address the very problem those entities cause.
b) It is critical that the RAC should be geographically representative.
c) It is equally important that expertise in science be represented on the RAC. While such representation can be found within entities such as OSUs Oregon Climate Change Research Institute, science expertise also exists among the statewide climate organizations forming the statewide coalition.
d) It is important to appreciate that ‘impacted communities’ exist across the state. notable among these are rural and coastal communities. While urban ‘impacted communities’ are well represented by organizations in Portland and Eugene, rural and coastal impacted communities are not. It is important, therefore, to include representation from these impacted regions of the state.
In this vein, I would like to offer two names: Alan R.P. Journet Ph.D. contact as above, and Hogan Sherrow Ph.D. Director of Rural Oregon Climate Political Action Committee. Though not climate scientists per se, both have been engaged in climate activism for several years including
giving presentations on the science. Both also are rural Oregonians living in the Rogue Valley.
7. Given the potential wide-reaching scope of proposed rules, how should the agency organize the Rulemaking Advisory Committee process to ensure critical issues receive adequate attention and discussion?
a) The most obvious organization to me is to establish a series of sub-committees and assign these responsibilities by economic sector {Transportation, Industry, Commercial, Residential, Agriculture, Forestry (these last two could be combined as ‘natural and working lands’ or ‘natural resources’).
To: Oregon Department of Environmental Quality From: Trevor Beltz, Manager of Government Relations and Public Affairs Date: June 15, 2020 RE: Greenhouse Gas Cap and Reduce Program Comments
Global climate change is real and may lead to significant detrimental effects on public health, economic vitality, natural resources, and Oregon's environment – coastal communities, such as Tillamook, are likely to experience effects most acutely. The Tillamook County Creamery Association would like to thank policy makers and state leaders for the tremendous work in recent legislative sessions in identifying policy options to cap and reduce greenhouse gas emissions. Extensive work lies ahead, and we must continue to think and act differently about greenhouse gas emissions mitigation and adaption as we move forward. We commend the Department of Environmental Quality for the thoroughness of the program’s preliminary report and appreciate the opportunity to provide feedback for consideration in the final version. With regard to initial key policy questions and options, we request consideration for public support of on-farm sequestration and emission reduction projects and opportunities. The Oregon dairy community has made great strides to reduce greenhouse gas emissions through projects such as dairy digesters, but there is much greater potential for offset and mitigation efforts. In California, for example, dairy digesters are providing the largest greenhouse gas reduction of all investments in the state’s climate action portfolio and digesters are ranked second of 60 climate programs in terms of cost effectiveness – providing one ton of GHG reduction (CO2e) for every $9 invested by the state. The CDFA also has grants for healthy soils practices, energy and water efficiency projects and alternative manure management strategies that lead to significant on-farm GHG reduction and carbon sequestration. Due to the high cost of digesters and other on-farm practices, these reductions of GHGs would be impossible without public support. Prior legislation proposed setting up a Climate Investment Fund in Oregon for these types of projects – future support and innovation will further prepare natural and working landscapes for impacts of climate change. As a major economic driver in Oregon, it is critical for the state to include and rely on the expertise of the Agriculture sector when considering impacted communities and rulemaking
advisory committee roles. Farmers and producers experience the effects of climate change first hand and want an opportunity to be a part of the solution. There are a number of other technical service providers in Oregon that are well versed in calculating GHG reductions on farms, such as Natural Resource Conservation Service, soil and water conservation districts, and University professionals that should be invited to the conversation. We expect the Oregon Department of Agriculture to offer multiple and varied approaches to engage farmers and industry members through their own rulemaking and in their participation on the Interagency Workgroup on Climate Impacts to Impacted Communities. Principles At TCCA, we depend on natural resources to deliver wholesome products and recognize our obligation to protect the resources that sustain us – as such, we have established the following principles to guide our engagement with proposed greenhouse gas emission reduction and carbon tax policies:
1. Climate change is happening; humans are measurably contributing.
2. Agriculture is a climate solution.
3. Carbon Tax revenues must be dedicated to a fund for renewable energy, separate from the State's General Fund. Monies must measurably go toward climate related actions within the taxed industry.
o Administration shouldn't exceed 5% of total programmatic costs.
4. Groups impacted by regulation, tax, or climate must have a voice.
o Increases in regulation on the agriculture industry should be balanced by advisory committee and governing board representation; led by incentive rather than penalty; and include reasonable implementation timelines.
5. Renewable power investments and purchase options must be transparent (source, fees, supply) and equitable.
Western States Petroleum Association 975 Carpenter Road NE Olympia, WA 98516 wspa.org
June 15, 2020 Oregon Department of Environmental Quality Office of Greenhouse Gas Programs 700 NE Multnomah St., Suite 600 Portland, OR 97232 Submitted electronically to: [email protected] Re: WSPA Comments on DEQ Program Options to Cap and Reduce Greenhouse Gas Emissions – Preliminary Report Western States Petroleum Association (WSPA) is a trade association that proudly represents companies that explore for, produce, refine, transport and market petroleum, petroleum products, natural gas, and other energy supplies in Oregon and four other western states. The way the world produces and consumes energy is evolving. And the members of Western States Petroleum Association are on the cutting edge of those changes, investing in and developing the affordable, reliable, and ever cleaner energy sources and technologies of the future. We believe that, working together, we can rise to the challenge of a changing climate. As such, we greatly appreciate the opportunity to comment on the Preliminary Report - Program Options to Cap and Reduce Greenhouse Gas Emissions, dated May 2020. This report responds to Governor Kate Brown’s March 10, 2020 Executive Order. WSPA member companies have strong experience with other greenhouse reduction programs including California’s Cap-and-Trade program and Europe’s ETS. The Cap and Reduce program, as envisioned, could include major requirements for fuel suppliers which makes WSPA a major stakeholder in this proposed rulemaking. We appreciate DEQ asking for early input, and we offer our responses to Preliminary Report Sections 1-3. Also, please note that these comments should be considered as part of Oregon Department of Transportation’s Statewide Transportation Strategy Multi-Agency Implementation Work Plan.
Section 1 – Existing Authorities to Regulate Greenhouse Gas Emissions
We note DEQ’s position that it has authority to regulate and limit greenhouse gas emissions
from indirect sources, including transportation fuels, but that DEQ does not have authority to
auction emission permits or collect revenue. We look forward to discussing these points further.
A program that limits consumer emissions from gasoline and diesel fuel could indirectly add
costs to what consumers pay for those fuels. DEQ’s proposal to implement a Cap and Reduce
program without clear legislative direction deserves a strong and transparent public process
similar to the process undertaken during the original Clean Fuels Program development.
Additionally, DEQ recently finalized rulemaking for its Greenhouse Gas Reporting Program,
which sets forth requirements for regulated entities to report a broad range of information that is
Oregon Department of Environmental Quality
June 15, 2020
Page 2
Western States Petroleum Association 1415 L Street, Suite 900, Sacramento, CA 95814 916.498.7750 wspa.org
considered confidential business information (CBI). In light of the limited legal protections
afforded to CBI, legislative protection should also be considered as part of the regulatory and
legislative package.
Section 2 – Program Development and Stakeholder Engagement Process
DEQ has asked a series of questions to which we provide the below input and responses.
• How should DEQ address the interplay between a clean fuels (CFP) expansion and
cap-and-reduce for transportation fuels?”
As we understand, the current Clean Fuels Program (CFP) and proposed sector-specific
Cap and Reduce program for transportation fuels both target the same goal: reduction of
greenhouse gas emissions from transportation fuels. Moreover, both might use carbon
intensity as a reduction metric. We believe that there is significant overlap between the two
programs. WSPA strongly recommends a single regulatory program addressing greenhouse
gas emissions from transportation fuels, and that when fuels are regulated, that it be done
under a single market-based program covering the broadest number of sectors, ideally
economy-wide. Overlapping CFP and Cap and Reduce programs would add complexity,
inefficiencies, and potentially additional costs for fuel consumers. Narrow sector-specific
programs are also far more expensive in reducing GHG emissions on a dollar-per-ton basis
than an economy-wide program. Therefore, WSPA recommends that any Cap and Reduce
stakeholder process strongly considers the implications of duplicative programs regulating
fuels sold in Oregon and options to avoid that outcome.
2018 and 2019 reports by Dr. Robert Stavins of Harvard University and Todd Schatzki of
The Analysis Group describe the inefficiencies of duplicative CFP and Cap-and-Trade
programs. Dr. Stavins presented these findings in 2019 to a joint legislative subcommittee
that considered adopting Cap-and-Trade. We recommend that DEQ again review these
reports and presentation, which we attach, and include them in early stakeholder discussion.
• “How should the agency approach identifying and selecting interested parties to
serve on the Rules Advisory Committee?”
WSPA recommends that the stakeholder process includes balanced participation from
industry, including transportation fuel suppliers, natural gas and other fuel suppliers.
Membership on the RAC should include: 1) WSPA and its member companies, 2) other
interested Oregon fuel suppliers, and 3) fuel consumer advocacy groups. WSPA strongly
believes that there is significant value in having both WSPA and its member companies
participate in the RAC. While WSPA provides a broad perspective on the impact Cap and
Reduce will create for the fuels sector, the member companies offer a more detailed
operational perspective on key issues. We also recommend that WSPA and DEQ schedule
meetings early in the process to share key learnings from similar rulemaking processes in
California and Washington. This would include focused discussion on key technical topics
Oregon Department of Environmental Quality
June 15, 2020
Page 3
Western States Petroleum Association 1415 L Street, Suite 900, Sacramento, CA 95814 916.498.7750 wspa.org
unique to fuel suppliers including learnings from California’s cap & trade program, covered
fuels, treatment of biofuels, and point of compliance.
• “What perspectives and expertise are critical for RAC member participation?”
WSPA recommends that these economic perspectives be included in stakeholder
discussion:
o Gasoline and diesel demand forecasting to 2035. Any consideration of capping
emissions from transportation fuels should consider realistic forecasts for fuel
demand. WSPA recommends that DEQ consider forecasts from Oregon DOT,
Oregon Department of Administrative Services – Office of Economic Analysis, and
potentially non-government sources.
o GHG contributions from all sectors of the economy (under the cap and from those
outside the cap as well as) and cost effectiveness of potential reduction options from
each sector. o Efficient program design. As noted above, DEQ should consider recommendations
from Stavins/Schatzki.
o Cost containment. We recommend that DEQ consider adding experts in emission
credit trading (e.g. IETA – Independent Emissions Trading Association) and
alternative compliance mechanisms (e.g. Climate Action Reserve) as stakeholders
and/or as RAC members.
• “Given the broad scope of the proposed rules, how should the agency organize the
RAC process to ensure critical issues receive adequate attention and discussion?”
WSPA agrees with DEQ’s idea that there be topic-specific workshops on key program
design elements, and we outline those below.
WSPA also recommends that DEQ and the RAC adopt a formal process for capturing public
input and questions and formal DEQ written response to those questions.
• “How should the policy questions and options introduced in Section 3 be framed
during the next phase in this process over the summer and fall?
WSPA agrees that at least some workshops be topic-specific. We suggest workshops
similar to those described by DEQ in its recent Overview presentation slide 13:
o Program scope / covered sources
▪ Covered fuels (gasolines, diesels, biofuels, other) and points of regulation
▪ Treatment of electricity, especially imported electricity
o Program design
▪ Baseline and reduction goals (cap and slope %)
▪ One combined vs. 3 separate programs
▪ Cross-sector trading
▪ Mass-based vs. intensity-based design.
Oregon Department of Environmental Quality
June 15, 2020
Page 4
Western States Petroleum Association 1415 L Street, Suite 900, Sacramento, CA 95814 916.498.7750 wspa.org
• WSPA would be prepared to speak to the inherent advantages and
disadvantages of these options for fuel suppliers. The changing
supply contracts for fuel suppliers in Oregon vs. other western states
is a consideration in making this decision.
o Cost containment: Supply and liquidity of alternative compliance instruments, offsets,
credit price caps, and supply of credits during shortage.
o Compliance pathways/Reduction opportunities.
• Contracted Economic and Environmental Analysis
The timing of the contracted analysis should be early enough in the program design and
rulemaking process to realistically inform its outcome. The analysis would ideally include
scenarios with different program stringencies, as well as different sectoral coverages
including economy-wide programs. This would allow optimization and the consideration of
cost-effectiveness and feasibility of emissions reduction opportunities for sectors and
sources inside the cap versus those outside the cap. To ensure transparency for the public,
all costs should be measured on a consistent dollars-per-ton basis.
Ideally, there should be opportunity for public comment on the scope of work to the
contractor, public comment on draft reports and public comment on final reports, again to
inform ultimate program design.
Section 3 – Key Policy Considerations and Options
• “Are the policy issues identified under “Stakeholder Engagement” appropriately
inclusive of issues, concerns and considerations needing discussion?”
We strongly suggest that DEQ consider the following in program design:
o Realistic compliance pathway(s) for transportation fuel suppliers. Fuel suppliers
cannot control end-use consumer demand for gasoline, diesel or other consumer
fuels such as natural gas. The DEQ should consider both 1) realistic demand
forecasts for gasoline and diesel products as described above, and 2) availability and
market liquidity of alternative compliance instruments in selecting the stringency of
the Cap and Reduce program.
o Allowing the use of “offsets” for compliance, including use of offsets from projects
outside the State of Oregon, as well as investments in projects outside of the sectors
under the cap.
o Allowing cross-sector trading for the three sectors under the cap to reduce the cost
to consumers.
o Designing the program to facilitate immediate or at least future broadening of
coverage across the full economy.
Oregon Department of Environmental Quality
June 15, 2020
Page 5
Western States Petroleum Association 1415 L Street, Suite 900, Sacramento, CA 95814 916.498.7750 wspa.org
o The design and use of periodic program reviews to ensure efficient use of resources
to achieve greenhouse gas reduction and prevent unintended consequences like
economic or environmental leakage.
Thank you again for the opportunity to comment. We look forward to meeting to further discuss
these ideas and welcome an open dialogue with you and your staff.
Sincerely,
Tiffany Roberts, Director, Legislative and Regulatory Policy Western States Petroleum Association CC: Amanda Pietz, Director, Climate Office Oregon Dept. of Transportation Jessica Spiegel, Director, NW Region Western States Petroleum Association
GHG Cap-and-Trade: Implications for
Effective and Efficient Climate Policy In
Oregon
Todd Schatzki, Ph.D. Prof. Robert N. Stavins
Analysis Group, Inc. Harvard University
November 2018
GHG Cap-and-Trade: Implications for Effective and Efficient Climate Policy In Oregon
Executive Summary
Todd Schatzki and Robert N. Stavins1
November 2018
Like many other states, Oregon has begun to pursue climate policies to attempt to fill the gap
created by the lack of effective climate policy at the Federal level. After adopting a variety of policies to
address climate change and other environmental impacts from energy use, Oregon is now contemplating
the adoption of a greenhouse gas (GHG) cap-and-trade system. However, interactions between policies
can have important consequences for environmental and economic outcomes. Thus, as Oregon considers
taking this step, reconsidering the efficacy of its other current climate policies may better position the state
to achieve long-run emission reductions at sustainable economic costs.
1. A Well-Designed GHG Cap-and-Trade Program is a Better Approach to Regulating GHG Emissions Than Alternatives
A GHG cap-and-trade system offers many advantages compared with other approaches to
reducing GHG emissions. By capping total emissions, a cap-and-trade system provides a high level of emissions certainty. By comparison, policies that target particular activities through standards do not
achieve any particular emission target with certainty.
In addition, cap-and-trade systems achieve emission reductions at a lower cost than other
regulatory approaches by creating a uniform incentive that encourages emission reductions through the least-costly approach. Thus, cap-and-trade creates incentives for sources to undertake the least-costly
emission reductions, while forgoing more costly options.
Development of a well-designed cap-and-trade system requires careful attention to the details. Prior legislative proposals in Oregon have included elements of a well-designed GHG cap-and-
trade system, such as broad economy-wide coverage and flexibility to allow sources to use offsets to cover
a portion of compliance obligations. However, many key program design decisions will be left to the
program’s regulator–the Oregon Environmental Quality Commission. Thus, decisions made in the
rulemaking process will have important implications for the program’s eventual performance and
possible success.
1 Dr. Schatzki is a Vice President at Analysis Group. Professor Stavins is A. J. Meyer Professor of Energy and Economic Development, John F. Kennedy School of Government, Harvard University; University Fellow, Resources for the Future; and Research Associate, National Bureau of Economic Research. He is an elected Fellow of the Association of Environmental and Resource Economists, was Chairman of the U.S. Environmental Protection Agency’s Environmental Economics Advisory Committee, and served as Lead Author of the Second, Third, and Sixth Assessment Reports and Coordinating Leading Author of the Fifth Assessment Report of the Intergovernmental Panel on Climate Change. Institutions listed are for purposes of identification only, implying no endorsement of this work. Support was provided by the Western States Petroleum Association, but the opinions expressed are exclusively those of the authors. Research assistance was provided by Jonathan Baker, Ben Dalzell and Scott Ario. To request further information or provide comments, Dr. Schatzki can be reached at: [email protected].
GHG Cap-and-Trade: Implications for Effective and Efficient Climate Policy In Oregon
Analysis Group, Inc. Page ES-2
2. Well-Designed Complementary Policies Can Improve Environmental and Economic Outcomes, Although Some Complementary Policies Raise Costs with Little (or No) Environmental Benefit
When developing a climate policy, states may consider pursing reductions through multiple
“complementary” policies that target individual activities that produce emissions. But what appears to be
logical, can turn out to be ineffective or worse yet, counter-productive.
Complementary policies may provide economic benefits when they target market failures
apart from the GHG emission externality, or when they target sources that are not covered by the cap-and-trade system. Many other legitimate market failures affect the climate change problem. For
example, energy efficiency programs may target distorted incentives to invest in building energy efficiency.
Targeting this additional market failure can achieve net cost savings from reduced energy use, while also
producing the ancillary benefit of reducing GHG emissions.
On the other hand, overlap between complementary policies and the GHG cap-and-trade program
can have perverse consequences. In general, when state-level policies overlap with cap-and-trade, the
complementary policies will fail to create any additional emission reductions. When a binding cap-
and-trade system is in place, aggregate emissions will equal the cap whether or not complementary policies
are implemented. Under such conditions, complementary policies produce no incremental emission
reductions, but simply shift emissions among sources or sectors covered by the cap (or worse, as we discuss
below).
Complementary policies may increase the cost of meeting emission targets when implemented alongside cap-and-trade. If complementary policies require that more costly emission reductions be
undertaken, then the shift from lower-cost to higher-cost reduction activities increases the overall cost of
achieving emission targets. Thus, unless a policy targets non-GHG market failures or sources not covered
by the cap, it likely raises costs (or is not binding).
Further, complementary policies may depress cap-and-trade allowance prices. When
complementary policies require emission reductions that are more costly than would be required under cap-
and-trade, the requirements reduce the quantity of emission reductions required to meet the cap, thus
depressing the price of allowances and reducing incentives for technological change.
In fact, many of Oregon’s climate policies would overlap with an economy-wide GHG cap-and-trade program. These policies will likely add little (or no) change in emissions once a cap-and-trade
program is adopted. They include the Renewable Portfolio Standard and Clean Fuels Program. However,
other policies may provide some economic benefits by targeting non-GHG market failures, such as the
Energy Trust of Oregon, which funds residential and commercial energy efficiency programs.
3. Consequences of Policy Overlap: Lessons from California for Oregon
California is several years ahead of Oregon in the adoption of its climate policies, and thus can
provide valuable lessons for Oregon. Analysis of California’s Low Carbon Fuel Standard (LCFS)
shows that it actually increases emissions relative to cap-and-trade alone, while also increasing costs. From 2013 to 2017, estimated costs were over $1 billion. However, as shown in Figure ES-1, since the
cap-and-trade program was expanded in 2015 to include transportation fuels, emissions outside of
GHG Cap-and-Trade: Implications for Effective and Efficient Climate Policy In Oregon
Analysis Group, Inc. Page ES-3
California (and outside the state’s GHG cap-and-trade system) have increased by more than 1.8 million
MTCO2e (through 2017). Moreover, as shown in Figure ES-2, the differences in costs between programs
are dramatic; while GHG cap-and-trade allowance prices have been below $16 per MTCO2e, LCFS
program credit prices have risen to nearly $180 per MTCO2e, more than a 11-fold difference.
Figure ES-1. Aggregate Change in Emissions from California’s LCFS
Figure ES-2. California’s LCFS Credit Prices vs. Cap-and-Trade Allowance Prices
-8,000
-7,000
-6,000
-5,000
-4,000
-3,000
-2,000
-1,000
0
1,000
2,000
2011 2012 2013 2014 2015 2016 2017 2018
Em
issi
ons
(Th
ousa
nd
s o
f M
TC
O2e
)
LCFS With Cap-and-Trade (Observed) LCFS Without Cap-and-Trade (Projected)
Interaction between LCFS and
Cap-and-Trade
0
20
40
60
80
100
120
140
160
180
200
2013 2014 2015 2016 2017 2018
Pri
ce (
$/M
etri
c T
on C
O2e)
LCFS Credit Price Cap-and-Trade Allowance Price
GHG Cap-and-Trade: Implications for Effective and Efficient Climate Policy In Oregon
Analysis Group, Inc. Page ES-4
Some have tried to justify these high costs and negligible environmental impacts by claiming that
the LCFS is a “technology” policy aimed at “spurring innovation.” While measuring innovation is complex,
it should be noted that compliance with the LCFS has largely been achieved through pre-existing
technologies. It is unclear to what degree, if any, improved efficiencies (“learning by doing”) have been
achieved through the demand for renewable fuels created by the LCFS. Moreover, LCFS costs are
comparable to all federal spending on renewable energy, raising the question of whether the LCFS is the
best use of society’s resources from the standpoint of investment in promoting energy technology
innovation.
4. Next Steps for Oregon Climate Policy
As Oregon contemplates the adoption of cap-and-trade, it has several options for its suite of climate
policies. One approach maintains all policies, as currently designed. Our analysis shows that, due to
interactions among overlapping climate policies, retaining certain complementary policies could be very
costly without achieving any incremental environmental benefits.
A second option would be to develop a GHG cap-and-trade program of sufficient stringency to
achieve targeted emissions or allow prices to rise to the social cost of carbon, and end complementary
policies that do not produce incremental benefits by addressing market failures unrelated to the GHG
emission externality or regulating sources not covered by the cap. This approach could begin by
undertaking a thorough assessment of the likely interactions among overlapping climate policies and the
extent to which policies address market failures unrelated to GHG emissions. The feasibility of this
approach will depend on how aggressively Oregon can pursue carbon pricing.
A third approach is a hybrid of these approaches. While economic analysis unambiguously shows
that policies relying on GHG emission pricing, such as GHG cap-and-trade, are the most cost-effective
approach to achieving emission targets, political realities may not support the immediate adoption of
climate policies relying largely (if not solely) on carbon pricing. But the costs of pursuing aggressive GHG
emission reductions goals through more-costly complementary policies will grow over time, which makes
that path not only costly but politically risky. The hybrid option involves a transition to increased reliance
on GHG cap-and-trade by diminishing the reliance (i.e., stringency) of some complementary policies and
gradually (or even quickly) shifting to the uniform-price incentives created by cap-and-trade.
GHG Cap-and-Trade: Implications for Effective and Efficient Climate Policy In Oregon
Todd Schatzki and Robert N. Stavins2
November 2018
Oregon is contemplating the adoption of a greenhouse gas (GHG) cap-and-trade system.3 For
example, Senate Bill 1507, also known as Oregon’s Clean Energy Jobs bill, would create a GHG cap-and-
trade system for major sources of GHG emissions.4 The GHG cap-and-trade system would add to the
existing policies Oregon has adopted to address climate change and other environmental impacts from
energy use. Like many other states, Oregon has begun to pursue climate policies to attempt to fill the gap
created by the lack of effective climate policy at the Federal level.
In this paper, we evaluate Oregon’s proposed GHG cap-and-trade system and consider its
implications for other climate policies Oregon has already adopted. Section I starts by discussing the
benefits of cap-and-trade as an approach to addressing climate change. In Section II, we discuss
“complementary” policies states are developing to address GHG emissions. Under certain conditions, such
additional policies can improve environmental and economic outcomes. However, due to interactions
between policies, some complementary policies raise costs and fail to achieve emission reductions. We
identify the conditions that lead to these different outcomes, and discuss how the particular policies
currently in place in Oregon would interact with the addition of a GHG cap-and-trade system. In Section
III, we analyze certain climate policies in California to identify the impacts of interactions that Oregon
might expect from its suite of policies. In particular, we examine California’s Low Carbon Fuel Standard
(LCFS), including its interactions with California’s GHG cap-and-trade system.
2 Dr. Schatzki is a Vice President at Analysis Group. Professor Stavins is Albert Pratt Professor of Business and Government, John F. Kennedy School of Government, Harvard University; University Fellow, Resources for the Future; and Research Associate, National Bureau of Economic Research. He is an elected Fellow of the Association of Environmental and Resource Economists, was Chairman of the U.S. Environmental Protection Agency’s Environmental Economics Advisory Committee, and served as Lead Author of the Second and Third Assessment Reports and Coordinating Leading Author of the Fifth Assessment Report of the Intergovernmental Panel on Climate Change. Institutions listed are for purposes of identification only, implying no endorsement of this work. Support was provided by the Western States Petroleum Association, but the opinions expressed are exclusively those of the authors. Research assistance was provided by Scott Ario, Jonathan Baker, and Ben Dalzell. To request further information or provide comments, Dr. Schatzki can be reached at: [email protected].
3 Oregon Department of Environmental Quality, “Considerations for Designing a Cap-and-Trade Program in Oregon,” February 14, 2017
4 79th Oregon Legislative Assembly, Senate Bill 1507, Ordered February 16, 2018.
GHG Cap-and-Trade: Implications for Effective and Efficient Climate Policy In Oregon
Analysis Group, Inc. Page 2
I. BENEFITS OF GHG CAP-AND-TRADE SYSTEMS
A cap-and-trade system limits (caps) the total emissions permitted from a designated set of sources.
By reducing the cap over time, emissions are reduced from current levels to meet policy objectives. Cap-
and-trade systems have been widely applied to GHG emissions. At present, there are approximately 21
systems covering emissions at the state, provincial, national, or regional level.5 A cap-and-trade system
can cover a large fraction of economy-wide emissions, because the energy sources that account for most
emissions can be regulated through a relatively small number of sources. For example, California’s GHG
cap-and-trade system covers approximately 85% of state-wide GHG emissions by regulating emissions
from electric power generators, large industrial facilities, and suppliers of natural gas and other fuels.6
By capping total emissions, a cap-and-trade system provides a high level of emission certainty.By comparison, policies that target particular activities through standards do not achieve any particular
emission target with certainty. For example, a low carbon fuel standard may reduce fuel carbon-intensity,
but it does not affect the number of miles driven or vehicle fuel efficiency. Thus, total emissions may
increase even if carbon-intensity is falling.
Cap-and-trade systems achieve emission reductions at a lower cost than other regulatory approaches. By imposing a cost on activities that generate emissions, cap-and-trade creates a uniform
incentive that encourages emission reductions through the least-costly approach. Sources that can reduce
emissions at a cost less than the cost of emission permits (allowance prices) will take steps to reduce
emissions, while sources that can only reduce emissions at a cost greater than allowance prices will not take
such action. Because allowances used to comply with the cap-and-trade system are tradeable among
regulated sources, allowances can flow to sources as needed to cover emissions.
Legislative proposals in Oregon (e.g., HB 4001, SB 1507) specify many elements of the GHG cap-
and-trade design, but also leave many features for the regulator, the Oregon Environmental Quality
Commission (EQC), to determine. These proposals include features of a well-designed GHG cap-and-trade
system, and, when providing the EQC with rule-making discretion, do not preclude potentially valuable
design features. But, as with any complex regulation, the design details that need to be worked out during
this rulemaking process would be critical to determining the eventual effectiveness of the policy.
In these proposals, the program would cover all sectors of the economy that are easily regulated
through a GHG cap-and-trade system, including large point sources and fuels, such as natural gas, gasoline
and diesel. Sources outside the proposed program are generally more difficult to monitor and enforce, thus
making regulation through other measures more promising.
Proposed legislation can accommodate key design features to take advantage of “when” and
“where” flexibility, although such features must be developed during the rulemaking process.Because GHG emissions are long-lived “stock” pollutants, the timing of emissions is less critical to the
damages they create than is the case with many other pollutants (e.g., criteria air pollutants). Thus, well-
designed cap-and-trade systems include banking and multi-year compliance periods to allow sources
5 ICAP. (2018). Emissions Trading Worldwide: Status Report 2018. Berlin: ICAP.
6 Center for Climate and Energy Solutions, “California Cap and Trade,” March 16, 2018.
GHG Cap-and-Trade: Implications for Effective and Efficient Climate Policy In Oregon
Analysis Group, Inc. Page 3
flexibility over when emission reductions are made.7 Further, because the impact of GHG emissions is
independent of where emissions occur, systems that include linking and offsets can lower the total costs of
achieving emission goals. The legislation includes specific provisions that permit the EQC to link Oregon’s
programs with other systems and allow sources to use offsets to fulfill up to 8% of their compliance
obligation.8
The proposed system includes an Allowance Price Containment Reserve, designed to help contain
the costs of compliance. The Reserve holds a finite quantity of allowances that are released only when
prices rise to a predetermined “trigger” price level. The Reserve can help mitigate costs and allowance
price volatility in the event that there is a sudden increase in demand that would lead to a spike in
allowance prices.
However, the proposed cap-and-trade system does not include an explicit price cap that could provide a “safety valve” in the event that demand for allowances suddenly increases. By itself, the
Reserve will not limit prices from rising to economically (and politically) unacceptable levels. Because the
Reserve holds a finite quantity of allowances, once the Reserve is exhausted, allowance prices can continue
to rise unabated.
A price cap has many benefits.9 A price cap sends a clear signal to the market about the range of
prices that could prevail in the future. It also provides market stability, because absent a price cap, there is
a risk that a sudden increase in prices undermines political support for the policy. In the past, the failure of
policies to include a safety valve has led to the suspension of emission trading programs when prices
suddenly rose to high levels, such as occurred in the RECLAIM program in California’s South Coast Air
Quality Management District.10
California recently adopted a price cap. In its draft rulemaking, the California Air Resources Board
(CARB) has set the price cap at $65 per MTCO2e in 2021. The price cap would rise at a rate of 5% plus
inflation. It is anticipated that CARB will finalize these rules this year.
In many respects, the GHG cap-and-trade proposals mirror systems already in place in California
and Quebec. This builds on experience gained with design of GHG cap-and-trade systems in California.
If sufficiently similar, Oregon could link its system to the California system and other systems (e.g.,
Quebec), if desired. Linkage can lower the total economic cost of achieving emission targets by expanding
the geographic scope of emission reductions opportunities.11
7 SB 1507 does not specify the length of compliance periods and does not explicitly allow allowance banking.
8 SB 1507, Section 17. Offset Projects; SB 1507, Section 19. Linkage with market-based compliance mechanisms in other jurisdictions.
9 SB 200. See Schatzki and Stavins, 2018.
10 The RECLAIM trading in the South Coast Air Quality District was dismantled after significant price spikes for RECLAIM allowances contributed to a broader crisis in California's electricity markets.
11 Stavins, Robert N., Judson Jaffe, and Matthew Ranson, “Linking Tradable Permit Systems: A Key Element of Emerging International Climate Policy Architecture.” Ecology Law Quarterly 36(2010):789-808.
GHG Cap-and-Trade: Implications for Effective and Efficient Climate Policy In Oregon
Analysis Group, Inc. Page 4
The compliance instruments -- allowances -- used by sources to comply with a cap-and-trade
system have substantial economic value.12 Thus, a key decision for legislators in developing a cap-and-
trade system is determining how these allowances will be allocated. This can affect both the aggregate
economic impact of the cap-and-trade program, as well as the distribution of its economic outcomes across
businesses and consumers.
Legislators have two basic options: freely allocating allowances to particular entities, or selling
allowances through auction. HB 4001 / SB 1507 proposes to allocate allowances through both of these
mechanisms. Some allowances would be allocated directly to electric and natural gas utilities and emission-
intensive, trade-exposed industries. These direct allocations have two distinct purposes. Direct allocations
to emission-intensive, trade-exposed industries through an updating, output-based allocation can offset the risk that the GHG cap-and-trade program leads to emission leakage.13 Emission leakage
occurs when economic activity shifts locations due to higher regulatory costs.
When allowances are allocated directly to regulated utilities, the allowance value is used to lower
customer bills to offset the impact of cap-and-trade on consumer energy costs. While this approach reduces
customer rate impacts, it also reduces energy customers’ incentives to reduce energy use. Thus, an
alternative approach that returns allowance value to customers in a lump sum dividend can help
offset program costs while preserving the (marginal) incentives for energy consumers to reduce their
energy use. This approach may also address distributional concerns, as carbon pricing tends to
disproportionately affect lower-income households.
Under SB 1507, as proposed, allowances that are not allocated directly would be sold through an
auction, with the government retaining the auction revenues. When selling allowances through an
auction, the resulting economic gains and their distribution throughout the economy depends on decisions made by the government about how revenues are used. The cost of a cap-and-trade program
is minimized when auction revenues are used to offset pre-existing distortionary taxes, such as income
taxes. This path was taken in British Columbia, which lowered several types of pre-existing taxes to offset
new revenues from its carbon tax, including personal income taxes, corporate income taxes, and industrial
property taxes.14
Legislative proposals in Oregon specify particular uses for the auction revenues, including road
and highway maintenance, public education (per existing articles in the State Constitution), projects aimed
12 Schatzki, Todd and Robert N. Stavins, “Using the Value of Allowances from California’s GHG Cap-and-Trade System”, Regulatory Policy Program, Mossavar-Rahmani Center for Business and Government, Harvard Kennedy School, August 27, 2012.
13 SB 1507 indicates that direct allocations to emission-intensive, trade-exposed industries should use an “output-based benchmarking methodology”. To mitigate leakage, direct allocations must reflect an “updated” estimate of each firm’s level of economic activity during the compliance year. Direct allocations that are fixed (even if based on historical output levels) fail to create an incentive for firms to pass-through the value of the direct allocation to their customers, which increases their ability to compete with firms that are not covered by the cap-and-trade system.
14 For example, corporate income taxes were reduced from 12% prior to the program to 11% in 2008, 10.5% in 2010 and 10% in 2011. In 2008, corporate income taxes to small business were reduced from 4.5% to 2.5%, and the threshold for the small-business tax rate was raised from $400,000 to $500,000.
GHG Cap-and-Trade: Implications for Effective and Efficient Climate Policy In Oregon
Analysis Group, Inc. Page 5
at achieving the bill’s objectives, and transitioning workers in affected communities.15 Road and
educational spending reflects requirements in the Oregon Constitution given the nature of the revenues
being collected.
Like Oregon’s proposal, many cap-and-trade programs use auction revenues to support projects
aimed at reducing GHG emissions. Such spending may seem natural given the goals of climate policy.
However, care is needed when selecting projects and activities to achieve environmental and economic
benefits. To achieve reductions in GHG emissions, such spending should target sources outside the cap or
programs that address market failures unrelated to GHG emissions. Below, we elaborate on these
conditions, as they pertain to complementary policies. But the same logic holds for revenue spending:
spending to reduce emissions from sources covered by the cap will not reduce total emissions because the
cap remains unchanged. Instead, such spending shifts where emissions occur under the cap and subsidizes
spending on emission reductions activities that otherwise would be made solely due to the cap-and-trade
price signals.
II. STATE CLIMATE POLICIES
In the wake of a lack of Federal leadership on climate policy, some states have sought to develop
their own policies, often in coordination with other states (and provinces). These state climate initiatives
often take a “belt and suspenders” approach that includes a suite of policies targeting different activities
that generate GHG emissions. This approach can aim to address each activity that produces GHG emissions
through one or more measures, sometimes regardless of the merits of each policy or the interactions among
the policies.
Oregon already has enacted several other policies intended to reduce GHG emissions, including:
Clean Fuels Program (CFP). The Clean Fuels Program is a standard designed to lower the carbon
intensity of transportation fuels. The CFP requires reductions in the average fuel carbon-intensity
below a baseline level. As regulated by the program, carbon-intensity reflects “life-cycle”
emissions that include tail pipe emissions, emissions sequestered in the process of growing fuel
crops (for renewable fuels), and emissions created during fuel production. Fuel suppliers can
comply with the standard by selling a mix of fuels with an average carbon-intensity below the cap
(i.e., “over-complying”), or by purchasing credits generated by suppliers that have over-complied
with the standard. The program was implemented in 2016.
Renewable Portfolio Standard (RPS). Oregon’s RPS requires that 50% of electric power used in
the state be generated from renewable sources of electricity by 2030. Renewable energy sources
include technologies such as wind power, solar power, geothermal power, small hydropower,
certain biomass products, and power generated with landfill gas.
Sustainable Transportation Initiative.16 This initiative is an integrated statewide effort to reduce
GHG emissions from the transportation sector. Efforts include: a Statewide Transportation
Strategy; GHG emission reduction targets for metropolitan areas; land use and transportation
15 SB 1507, Sections 26 and 28.
16 https://www.oregon.gov/ODOT/Programs/Pages/OSTI.aspx.
GHG Cap-and-Trade: Implications for Effective and Efficient Climate Policy In Oregon
Analysis Group, Inc. Page 6
scenario planning guidelines; and tools that support local governments in reaching their emissions
reduction goals.
Coal-to-Clean Law. This law requires that the state’s electric utilities eliminate coal-fired
electricity from their mix of energy generation by 2030.
Energy Trust of Oregon. The Energy Trust of Oregon provides information, cash incentives and
technical assistance to help Oregon utility customers invest in energy-saving or renewable energy
projects. Its services and support are available to both residential and commercial customers. The
Trust is funded by charges included in electric and natural gas utility customer bills.
Below, we identify the key conceptual issues affecting decisions to develop policies to complement
a GHG cap-and-trade program. First, we identify the conditions under which complementary policies can
improve environmental and economic outcomes, particularly by addressing problems (“market failures”)
not addressed by cap-and-trade and by targeting emission sources not targeted by cap-and-trade. Next, we
consider when interactions between GHG cap-and-trade systems and other policies are problematic, raising
costs and failing to achieve emission reductions. Finally, we consider options policymakers have when
political conditions do not support setting carbon prices at sufficiently high (efficient) levels.
A. Economic Principles for Complementary Policies
From an economic perspective, the primary purpose of regulatory interventions is to remedy market
failures that prevent markets from arriving at economically efficient outcomes. If a regulation can create
positive net benefits (benefits greater than costs) by addressing a market failure, without imposing excessive
costs or unintended consequences, economic welfare can be improved.
The key market failure contributing to health and environmental impacts is the failure of
households, businesses, and industry to account for these impacts in their energy use decisions. That is, energy prices do not reflect the true social costs of energy use. As a result, energy use and associated
impacts are too high from the standpoint of society as a whole.17 This problem has been well studied, and
there is universal consensus that the most efficient approach to this problem is to set energy prices at
their true social costs through environmental prices, such as carbon prices created through a cap-
and-trade system.
For climate change, the economic cost (damages) of additional GHG emissions are measured by
the social cost of carbon. Estimates of the social cost of carbon were developed by the United States
Government’s Interagency Working Group (IWG) on the Social Cost of Greenhouse Gases. Developed to
provide United States’ regulatory bodies with a consistent estimate of the social cost of carbon for use in
regulatory analyses,18 the IWG’s estimates of the social cost of carbon have become a standard benchmark,
17 In addition, energy may be underpriced for a variety of other reasons, which could also lead consumers to use excess energy.
18 See Technical Support Document: Social Cost of Carbon for Regulatory Impact Analysis Under Executive Order 12688, Interagency Working Group on Social Cost of Carbon, United States Government, February 2010 (“TSD 2010”) at 1-4. There have been a range of estimates produced of the social cost of carbon. See e.g. National Research Council, 2009, Hidden Costs of Energy: Unpriced Consequences of Energy Production and Use, Washington, DC: The National Academies Press at 216-219 for a brief review.
GHG Cap-and-Trade: Implications for Effective and Efficient Climate Policy In Oregon
Analysis Group, Inc. Page 7
used by many other regulators, including CARB.19 The IWG’s most recent estimates indicate that the
social cost of carbon from emissions occurring in 2030 would range from $25 to $115 per metric ton
(in nominal dollars), depending upon the choice of discount rate used to convert the future damages created by those emissions into present value terms.20 For example, the damages from 1 metric ton of
emissions in 2030 would be $79 in 2030 dollars when the future impact of those emissions are discounted
back to 2030 at a 3% discount rate. These social cost of carbon estimates represent the global damages to
various sectors, including agriculture and energy dependent sectors, climate driven human health impacts,
damages from sea-level rise, and impacts to ecosystem services.21
However, the failure of energy prices to reflect true environmental costs is not the only market
failure relevant to climate policy. From an economic perspective, the criteria for complementary policies
is relatively clear in principle. Complementary policies may provide economic benefits under one of
two conditions:22
1. The complementary policy targets market failures unrelated to the GHG emission
externality; or
2. The complimentary policy targets sources that are not under the cap of the cap-and-trade
program.
In each case, particular complementary policies must still be shown to provide positive net benefits and be
preferred to other alternatives.
We turn first to the rationale for complementary policies that there are market failures present which
are unrelated to the GHG emission externality. Several different types of market failures are particularly
relevant to the climate change problem:
19 CARB relies on the IWG’s estimate that employs a 3% discount rate. CARB also converts this value to 2015 dollars, accounting for inflation. See California Air Resources Board, California’s 2017 Climate Change Scoping Plan, November 2017 (“2017 Scoping Plan”) at 40 and fn. 97; see also CARB, “Preliminary Concepts” February 2018. at Table 5, available at https://www.arb.ca.gov/cc/capandtrade/meetings/20180302/ct_price_concept_paper.pdf.
20 See TSD 2016 at 4. The IWG also presents a set of higher estimates reflecting more extreme assumptions regarding the underlying modeling inputs. This higher set of estimates places the 2030 social cost of carbon at $240 in 2030 (in $2030). The IWG reports the social cost of carbon in $2007. We convert $2007 to $2030 using historical annual average CPI values for all urban consumers provided by the BLS (https://www.bls.gov/cpi/tables/supplemental-files/home.htm) and forecasted CPI values that we derive from forecasted year to year (specifically Q4 to Q4) percent changes in the CPI presented by the 2018 Economic Report of the President, (https://www.whitehouse.gov/wp-content/uploads/2018/.../ERP_2018_Final-FINAL.pdf, Table 8-1, column 4).
21 These values derive from three integrated assessment models (IAM) that assess how changes in greenhouse gas driven temperatures impose costs and various impacts. All models also contain some characterization of adaptation, and in various ways capture catastrophic or extreme climate change driven impacts. See TSD 2010 § III.A for further detail regarding the models underlying the social cost of carbon estimates. See also TSD 2016 § II for further detail regarding updates to these models that underlie the most recent social cost of carbon estimates. For further details regarding the process IWG followed in estimating the social cost of carbon, see TSD 2010 § III, IV.
22 Bennear, Lori and Robert N. Stavins, “Second-best theory and the use of multiple policy instruments,” Environmental and Resource Economics 37(1): 111-129, 2007.
GHG Cap-and-Trade: Implications for Effective and Efficient Climate Policy In Oregon
Analysis Group, Inc. Page 8
Information Problems. When market participants fail to have accurate information about a
product’s attributes, they can make decisions that do not account for the true costs and benefits
of alternative choices. Two types of information problems are of particular concern.23 The
principal-agent problem arises when one party makes decisions with financial implications for
another party. For example, building owners may not make investments in energy efficiency
if they lease to tenants that pay their own utility bills, since the tenant will keep the cost savings;
likewise, renters may not make such investments, because there is a high likelihood they will
move and lose out on future energy savings. Informational problems also include asymmetric
information, which arises when one party to a transaction has more information than others.
Behavioral failures. Behavioral market failures refer to market outcomes that derive from
actions that diverge from what economists have typically defined as rational behavior. For
example, consumers seem to require higher compensation for giving up a good than their
expressed willingness to pay for the same good. Behavioral failures have been invoked as an
explanation for the apparent failure of households and businesses to adopt cost-effective
energy efficient technologies – that is, technologies that produce energy cost savings that
exceed the cost of technology adoption.24
Innovation Spillovers.25 Achieving ambitious climate goals will require substantial innovation
in energy technologies to reduce their GHG emissions, while continuing to provide the many
benefits created by use of energy. Such innovation includes both development of new
technologies as well as increases in the efficiency and reductions in the cost of existing
technologies.
Innovation leads to positive knowledge spillovers as ideas from research and development
(R&D) flow into and enhance other R&D activities. Even if new innovations have legal
protections such as patent exclusivity, innovators cannot capture all of these spillovers.
Because innovators do not reap all of the rewards created by their innovation, private incentives
to invest in R&D are below the socially optimal level.
Congestion Externalities. Socially inefficient levels of traffic congestion lead to many costs,
including excess fuel use and emissions, and lost time. However, efficient congestion pricing
23 A third problem is related to the “public good” aspect of information: once created, information can be used by many people at little or no additional cost. Because it may be difficult to limit access to information, the incentive for any individual to develop information is reduced. Consequently, general information about energy efficiency may be underprovided. However, this public good attribute does not diminish the incentive for any individual market participant, such as a building owner, to supply information about their own product (or building), since this information can distinguish their products from competitors’ offerings. Building labeling has no obvious impact on this potential problem.
24 Stavins, Robert N., Todd Schatzki, and Jonathan Borck, “An Economic Perspective on Building Labeling Policies,” March 2013.
25 For a related discussion focusing on renewable energy technologies, see Gillingham, Kenneth and James Sweeney, “Market Failure and the Structure of Externalities”, In: Harnessing Renewable Energy, Boaz Moselle, Jorge Padilla, Richard Schmalensee (eds). RFF Press, 2019.
GHG Cap-and-Trade: Implications for Effective and Efficient Climate Policy In Oregon
Analysis Group, Inc. Page 9
may be impractical because of technical challenges. As a result, certain public policies may
target these externalities, such as subsidies for public transportation.
Network Externalities. Many energy systems include distribution networks that deliver fuel
to individual consumers. For a given technology or fuel type, the availability and reliability of
the network used to delivery energy is an important dimension of consumer technology choices.
Network externalities potentially affect these technology choices. Several examples from the
transportation sector illustrate network externalities.
Hydrocarbons, electricity and hydrogen are three important transportation fuel technologies
that each require distinct refueling infrastructure. At present, the ubiquity of gasoline service
stations creates a positive network externality -- the benefits of owning a traditional gasoline
powered vehicle increase with a more-developed refueling network. Due to these positive
network externalities, the incentives favor owning a gasoline-powered vehicle relative to, for
example, an electric vehicle, which depends on a less-developed network of electric charging
stations. While a more developed network of charging stations would increase the benefits of
owning an electric vehicle, without sufficient numbers of electric vehicles on the road,
incentives to invest in charging stations may be inadequate (Li et al, 2017). The resulting
“chicken-and-egg” problem may prevent the efficient market developments.
Another example of a network externality is hydrocarbon standards. Combustion and diesel
engines are designed to accept fuels meeting particular fuel specifications. For example, most
gasoline-powered vehicles rely on E10, which includes up to 10% ethanol, but cannot operate
on higher fractions of ethanol without creating risks of engine damage and voiding of
warranties. As a result, these technical engine standards may create a “blend wall” that limits
the ability to blend renewable fuels.
Policies aligned with the underlying market failure will address most efficiently and effectively
these market failures. For example, network externalities associated with refilling/recharging station
networks suggest subsidization of refilling/recharging networks.26 By contrast, while some other policies
would address transportation technologies, they would not necessarily address network externalities. For
example, an LCFS subsidizes all forms of transportation irrespective of whether a particular fuel faces a
network externality. Moreover, an LCFS subsidizes the variable costs associated with each fuel system,
rather than addressing the fixed costs (or standards) associated with refilling/recharging infrastructure.
Likewise, congestion externalities suggests some subsidization of public transportation or congestion zone
pricing. But, an LCFS would do nothing to address the congestion market failure, since it does not directly
address any component of a consumer’s travel decisions.
Similarly, policies to address innovation spillovers should target underinvestment in energy R&D.
Many market-based policies, such as GHG cap-and-trade systems, RPS and the LCFS, create financial
incentives for private firms (entrepreneurs) to increase investment in energy R&D. However, these policies
create uniform incentive for GHG reductions regardless of the state of technology development. Thus,
26 Of course, this approach is not without challenges. Uncertainty over which new technology will be the most cost-effective creates the risk that the “wrong” technology is subsidized.
GHG Cap-and-Trade: Implications for Effective and Efficient Climate Policy In Oregon
Analysis Group, Inc. Page 10
depending on the state of technology development, these policies may promote substantial technological
innovation or simply lead to widespread deployment of pre-existing technologies.
Despite these issues, regulators, such as CARB, have sometimes argued that these types of market-
based policies are “technology” policies aimed at encouraging innovation, as distinct from policies aimed
at cost-effectively achieving emission reductions. For example, CARB has argued that its LCFS is a
“technology” policy aimed at “spurring innovation” in cleaner fuels.27 However, this claim not only
suggests that the gains in energy innovation outweigh the higher costs of these policies, but that their net
gains outweigh those of other policies targeting increased energy R&D.
Other policy approaches may better target R&D incentives. For example, the federal government
(and some state governments) undertakes substantial direct R&D investment in energy technologies.28 To
the extent policies aim to subsidize innovative technologies, such subsidies can be gradually reduced as
market deployment increases. By contrast, most current policies such as California’s LCFS have no
mechanism to reduce incentives once a technology becomes mature.
B. Interactions between Cap-and-Trade and So-Called Complementary Policies
For state-level climate policies, interactions can occur between individual elements of a state policy
or between state policy and federal policy. In either case, interaction between policies has potential
implications for the cost-effectiveness of actions taken to reduce GHG emissions, and can have implications
for aggregate emission reductions as well.29 Interactions between policies are most problematic when two
conditions occur:30
1. When a state policy creates more stringent requirements that overlap with a “broader” state or
federal policy (“overlap criteria”); and
27 For example, “Since 2011, the LCFS has been a cornerstone of California’s effort to reduce greenhouse gas (GHGs) emissions and has spurred innovation in low-carbon transportation fuels such as hydrogen, electricity and biodiesel.” CARB, “CARB amends Low Carbon Fuel Standard for wider impact,” September 27, 2018.; “The LCFS is an important tool in California’s efforts to reduce the impacts of climate change by spurring innovation in an array of cleaner fuels.” CARB, “Air Resources Board readopts Low Carbon Fuel Standard,” July 19, 2017.; A group of UC Davis researchers concluded similarly, noting that “[t]he LCFS will clearly induce technological innovation and investment in new technologies, but perhaps with some delay.” Farrell, Alexander E. and Daniel Sperling, “A Low-Carbon Fuel Standard for California Part 1: Technical Analysis", Institute of Transportation Studies, UC Berkeley, May 29, 2007; See also Parson et al., 2018.
28 Clark, Corine, “Renewable Energy R&D Funding History: A Comparison with Funding for Nuclear Energy, Fossil Energy, Energy Efficiency, and Electric Systems R&D,” Congressional Research Service, June 18, 2018. https://fas.org/sgp/crs/misc/RS22858.pdf.
29 Goulder, Lawrence and Robert Stavins, “Challenges from State-Federal Interactions in U.S. Climate Change Policy,” American Economic Review Papers and Proceedings, volume 101, number 3, May 2011, pages 253-257. Goulder, Lawrence and Robert Stavins, “Interactions Between State and Federal Climate Change Policies,” The Design and Implementation of U.S. Climate Policy, eds. Don Fullerton and Catherine Wolfram. Cambridge: National Bureau of Economic Research, 2012.
30 Goulder and Stavins identify these conditions for interactions between state and federal climate policies. Goulder, Lawrence and Robert Stavins, 2012.
GHG Cap-and-Trade: Implications for Effective and Efficient Climate Policy In Oregon
Analysis Group, Inc. Page 11
2. The broader federal or state policy provides flexibility to meet requirements through adjustments
across sectors or states, i.e. averaging (“flexible policy criteria”.)
Not all policies meet these conditions. For example, broader state or federal policies using command and
control or price-based instruments have limited interaction with state-level policies. By contrast, policies
that trade in quantities (for example, cap-and-trade) and policies that average performance (for example,
renewable portfolio standards and fleet vehicle efficiency standards) provide flexibility that creates perverse
interactions between policies.
In the context of Oregon’s climate policies, the interaction of greatest concern is between the
GHG cap-and-trade program and other climate policies that regulate sources covered by the cap-and-trade program.31 For example, emissions from transportation fuel combustion are regulated by both
the cap-and-trade program and by the CFP, which mandates reductions in the GHG-intensity of
transportation fuels.
In general, when state-level policies overlap with cap-and-trade, the complementary policies will fail to create any additional emission reductions. With a binding cap-and-trade system in place,
aggregate emissions will equal the cap whether or not complementary policies are implemented.32 While
complementary policies may shift emissions among sources or sectors covered by the cap, aggregate
emissions will remain unchanged. Under these conditions, the complementary policy produces no
incremental emission reductions; it simply relocates the emissions (or worse, as we discuss below).
In addition, complementary policies may increase the cost of meeting emission targets when implemented alongside cap-and-trade. If complementary policies require that more costly emission
reductions be undertaken, then the shift from lower-cost to higher-cost reduction activities increases the
cost of achieving emission targets. If the complementary policy requires reductions that are cost-effective
under cap-and-trade then the reductions occur whether or not the complementary policy is implemented;
consequently, costs do not rise, but the policy is irrelevant. A complementary policy can shift emission
reductions to lower-cost emission reduction activities only if it targets non-GHG market failures, such as
information problems or behavioral biases regarding household energy use, or targets sectors not covered
by the cap-and-trade system.
Complementary policies may depress cap-and-trade allowance prices. Because
complementary policies may require emission reductions that are more costly than would be required under
cap-and-trade, these requirements displace emission reductions that would otherwise be required by the
cap-and-trade system. As a result, the quantity of emission reductions required to meet the cap are reduced,
31 Schatzki, Todd and Robert N. Stavins, “Implications of Policy Interactions for California’s Climate Policy” (with Robert N. Stavins), Regulatory Policy Program, Mossavar-Rahmani Center for Business and Government, Harvard Kennedy School, August 27, 2012.
32 If the cap is not binding, then complementary policies can reduce emissions. For example, for several quarters in recent years, California’s cap was not binding because the auction reserve prices limited allowance allocations. However, the low demand for allowances was primarily a result of the substantial emission reductions achieved by the complementary policies. Thus, the actual reduction in emissions achieved by the complementary policies was likely limited to the allowances unsold at auction.
GHG Cap-and-Trade: Implications for Effective and Efficient Climate Policy In Oregon
Analysis Group, Inc. Page 12
which depresses the price of cap-and-trade allowances. These low prices are problematic for induced
technological change.
In fact, several of Oregon’s existing climate policies regulate emissions that would be covered
by a GHG cap-and-trade system. Oregon’s RPS regulates the generation of electricity, which is
largely produced by large stationary sources and electricity imports, both of which would be covered by the proposed GHG cap-and-trade system.33 Because the RPS regulates sources covered by the GHG
cap-and-trade proposals, once the GHG cap-and-trade system is in place, the RPS will not achieve any
incremental emission reductions. Worse yet, because the RPS would raise costs if it required the adoption
of renewable energy technologies that reduced GHG emissions at a higher cost than other options.
Interactions between the Oregon’s CFP and its GHG cap-and-trade system would be more
complicated because portions of the transportation fuel lifecycle would be covered by the GHG cap-and-
trade system, while other portions of the fuel lifecycle would be outside the cap. In section III, we provide
a more detailed description of these interactions and analyze the actual change in emissions from the
California’s LCFS.
III. EXPERIENCE WITH INTERACTIONS BETWEEN CALIFORNIA’S LCFS AND
ITS GHG CAP-AND-TRADE SYSTEM
California’s AB 32 Scoping Plan includes multiple elements aimed at achieving climate targets
specified in California’s Global Warming Solutions Act of 2008. Implementation of these policies has been
staggered, but generally started several years in advance of policies in Oregon. Because many of these
policies have been in place for multiple years, California’s experience can provide a valuable lens into the
interactions among policies, which other states, such as Oregon, can expect from their suite of climate
policies.
We focus on interactions between California’s LCFS and its GHG cap-and-trade system. The
LCFS has been in place since 2013. While the GHG cap-and-trade system has been in place since 2013 as
well, the cap initially covered only large stationary point sources, and was not expanded to cover fuels until
2015. As a result, California’s experience allows market impacts to be analyzed before and after the
interactions between the programs first occurred.
A. Changes in Costs Due to the LCFS
Both the LCFS and GHG cap-and-trade system create price signals that reflect the marginal costs
of achieving emission reductions. The LCFS has its own trading program, and LCFS credit prices reflect
the (marginal) cost of reducing CO2 emissions by switching from high-carbon fuels to low-carbon fuels
given their differences in carbon intensity. Likewise, GHG allowance prices reflect the tradeoff between
taking actions to reduce emissions and the market value of those emission reductions.
There is a large difference between GHG cap-and-trade allowance prices and LCFS credit prices in California. Figure 1 compares LCFS credit prices and GHG allowance prices from 2013 to
33 SB 1507, Section 13.(2).
GHG Cap-and-Trade: Implications for Effective and Efficient Climate Policy In Oregon
Analysis Group, Inc. Page 13
present. For the program’s first few years, LCFS credit prices were often at relatively low levels,
comparable to GHG cap-and-trade allowance prices. However, after legal uncertainty about the program
was resolved and the carbon-intensity standard was reduced, prices increased appreciably, and have since
remained at levels above $80 per MTCO2e. In recent months, prices have been closer to $180 per MTCO2e.
By contrast, GHG cap-and-trade allowances prices are approximately $14 per MTCO2e and, for a period,
were at the administratively set auction reserve price (i.e. the price floor).
Figure 1. California’s LCFS Credit Prices vs. GHG Cap-and-Trade Allowance Prices
Notes: [1] The monthly cap-and-trade allowance price is calculated as the monthly average of the California
carbon allowance future contract price from SNL. [2] The monthly LCFS credit price is equal to the CARB
monthly average credit price.
Sources: [1] CARB. [2] SNL Financial.
The large difference between LCFS credit prices and GHG cap-and-trade allowance prices
in California indicates that, at the margin, the emission reductions being achieved by the LCFS are substantially more costly than reductions achieved through the GHG cap-and-trade system. For
example, in August 2018, LCFS credit prices averaged $179/MT, while GHG cap-and-trade allowance
prices averaged just $15/MT, indicating that marginal CO2e abatement costs are more than eleven times
greater in the LCFS program than in the GHG cap-and-trade system.
The interactions between the two programs place downward pressure on cap-and-trade allowance prices. In effect, the more costly emission reductions required by the LCFS displace less costly
emission reductions that would otherwise be achieved by the cap-and-trade program. But, by reducing
emissions from sources that are covered by the cap, the LCFS requirement effectively reduces the GHG
cap stringency, thus reducing allowance prices.
Credit prices for Oregon’s CFP will differ from prices in California’s LCFS. Figure 2 illustrates this, comparing credit prices and volume transacted from California’s LCFS and Oregon’s CFP.
0
20
40
60
80
100
120
140
160
180
200
2013 2014 2015 2016 2017 2018
Pri
ce (
$/M
etri
c T
on
CO
2e)
LCFS Credit Price Cap-and-Trade Allowance Price
GHG Cap-and-Trade: Implications for Effective and Efficient Climate Policy In Oregon
Analysis Group, Inc. Page 14
Differences in credit prices reflect a number of factors. One important factor is the difference in the stringency between Oregon and California. With a more stringent carbon-intensity standard, the use of a low-carbon fuel generates fewer credits, thus raising the cost of generating credits. For example, in 2017, Oregon’s CFP required reductions in carbon intensity of 0.5% (relative to a 2015 baseline), while California’s LCFS required reductions of 3.5% (relative to a 2010 baseline). In 2018, required reductions are 1% and 5% for Oregon and California, respectively. In addition, estimated carbon-intensity for individual renewable fuels tends to be lower in Oregon than in California, so substitutions generate more credits in Oregon than in California.34 Thus, use of a given type of low-carbon fuel will tend to create more credits in Oregon than California, thus lowering the cost.
Figure 2. Comparison of Credit Prices and Volume Transacted,
California’s LCFS and Oregon’s CFP
Sources: [1] CARB. [2] Oregon Department of Environmental Quality.
The incremental costs of achieving emission reductions through the LCFS, rather than the GHG cap-and-trade system, have been substantial. Figures 3 provides an estimate of the incremental
costs of the LCFS relative to the GHG cap-and-trade system. The observed emission reductions are
relatively small, less than 4% of the total annual emissions from the California transportation sector and
less than 2% of overall state GHG emissions. In total, estimated incremental LCFS costs were around $300
34 A key source of these differences is that California’s carbon-intensity estimates account for indirect land use change, whereas estimates in Oregon to not.
0
200
400
600
800
1,000
1,200
1,400
1,600
0
20
40
60
80
100
120
140
160
180
200
1 2 3 4 5 6 7 8 9 101112 1 2 3 4 5 6 7 8 9 101112 1 2 3 4 5 6 7 8
2016 2017 2018
Vol
ume
Tra
nsa
cted
(T
hou
san
ds o
f M
etri
c To
ns C
O2e)
Cre
dit
Pri
ce (
$/M
etri
c To
n C
O2e
)
CA Volume of Credits Transacted OR Volume of Credits Transacted
CA Average Credit Price OR Average Credit Price
GHG Cap-and-Trade: Implications for Effective and Efficient Climate Policy In Oregon
Analysis Group, Inc. Page 15
million in both 2016 and 2017, and over $750 million over the 5-year period from 2013 to 2017.
Extrapolating for 2018, estimated costs could exceed $400 million.
Figure 3. Annual Incremental Costs, California’s LCFS
Note: We distinguish in our calculations between expenditures by reducing entities and economic cost of
emission reductions. Expenditures associated with emission reductions are simply (annual emission reductions
[MT]) × (average annual credit price [$/MT]), where the average annual credit price represents the average of the
12 monthly CARB reported average credit prices. Costs of emission reductions can be represented by the area
under an emissions reduction supply curve between the origin and market clearing price, here represented by the
average annual credit price. If we make the simplifying assumption of a linear supply curve, costs will equal half
of the expenditures, since the area of a triangle is one half the area of a rectangle with same base and height.
Source: CARB.
B. Changes in Emissions Due to the LCFS
While the adoption of a GHG cap-and-trade system will increase the certainty of
environmental outcomes, interactions between the GHG cap-and-trade system and complementary programs have consequences for the incremental impact of these complementary measures. With the
LCFS, these interactions are complicated because LCFS compliance depends on the lifecycle emissions of
each type of transportation fuel, not simply emissions from vehicle fuel combustion. While all of the
vehicle emissions are covered by the cap-and-trade program, the portion of a fuel’s productions emissions
that are regulated by the cap-and-trade system varies across fuel types. The change in emissions due to the
LCFS will reflect these differences in emissions outside the cap, rather than activity that is covered by the
GHG cap-and-trade system.
Figure 4 illustrates the impact of the substitution of a quantity of ethanol for an equal quantity of
gasoline (CARBOB). The example assumes that the gasoline is refined in California, while ethanol is
refined in an out-of-state (non-California) refinery. The gasoline carbon-intensity is 101 gCO2e, including
$42.5 $38.0
$74.1
$307.5$295.5
$0
$50
$100
$150
$200
$250
$300
$350
2013 2014 2015 2016 2017
Incr
emen
tal
Cos
ts (
$M
)
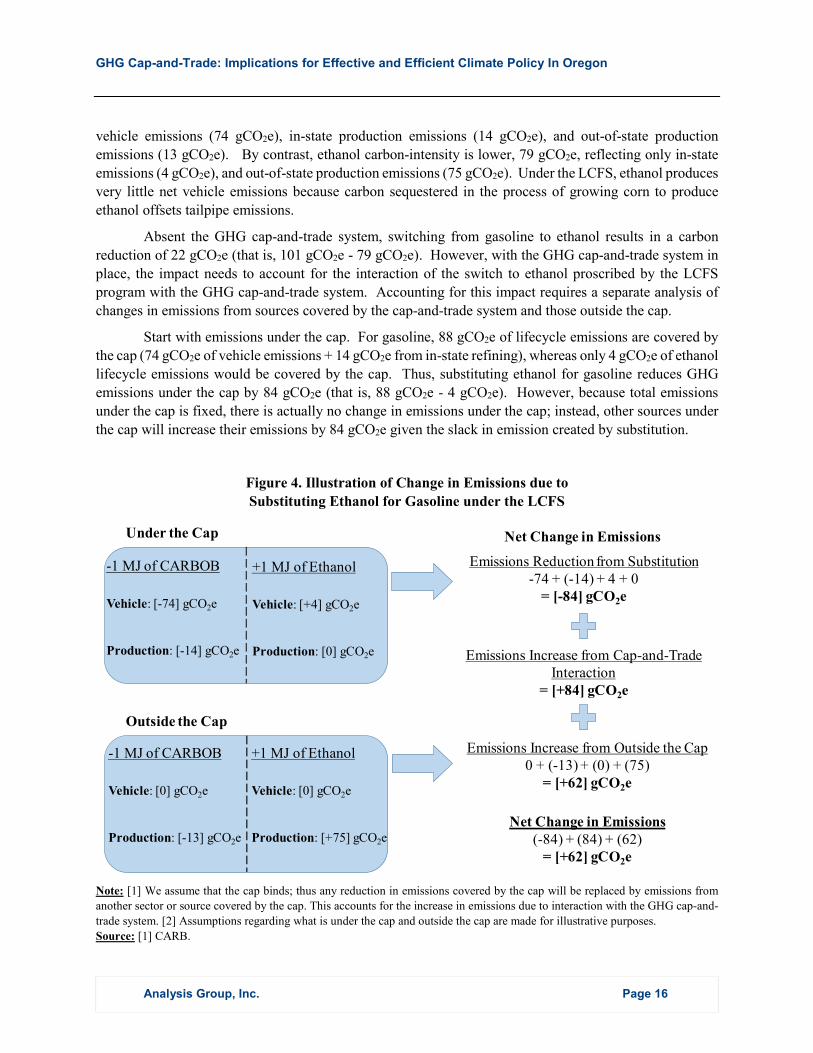
GHG Cap-and-Trade: Implications for Effective and Efficient Climate Policy In Oregon
Analysis Group, Inc. Page 16
vehicle emissions (74 gCO2e), in-state production emissions (14 gCO2e), and out-of-state production
emissions (13 gCO2e). By contrast, ethanol carbon-intensity is lower, 79 gCO2e, reflecting only in-state
emissions (4 gCO2e), and out-of-state production emissions (75 gCO2e). Under the LCFS, ethanol produces
very little net vehicle emissions because carbon sequestered in the process of growing corn to produce
ethanol offsets tailpipe emissions.
Absent the GHG cap-and-trade system, switching from gasoline to ethanol results in a carbon
reduction of 22 gCO2e (that is, 101 gCO2e - 79 gCO2e). However, with the GHG cap-and-trade system in
place, the impact needs to account for the interaction of the switch to ethanol proscribed by the LCFS
program with the GHG cap-and-trade system. Accounting for this impact requires a separate analysis of
changes in emissions from sources covered by the cap-and-trade system and those outside the cap.
Start with emissions under the cap. For gasoline, 88 gCO2e of lifecycle emissions are covered by
the cap (74 gCO2e of vehicle emissions + 14 gCO2e from in-state refining), whereas only 4 gCO2e of ethanol
lifecycle emissions would be covered by the cap. Thus, substituting ethanol for gasoline reduces GHG
emissions under the cap by 84 gCO2e (that is, 88 gCO2e - 4 gCO2e). However, because total emissions
under the cap is fixed, there is actually no change in emissions under the cap; instead, other sources under
the cap will increase their emissions by 84 gCO2e given the slack in emission created by substitution.
Figure 4. Illustration of Change in Emissions due to
Substituting Ethanol for Gasoline under the LCFS
Note: [1] We assume that the cap binds; thus any reduction in emissions covered by the cap will be replaced by emissions from
another sector or source covered by the cap. This accounts for the increase in emissions due to interaction with the GHG cap-and-
trade system. [2] Assumptions regarding what is under the cap and outside the cap are made for illustrative purposes.
Source: [1] CARB.
Net Change in Emissions
Outside the Cap
-1 MJ of CARBOB
Vehicle: [-74] gCO2e
Production: [-14] gCO2e
+1 MJ of Ethanol
Vehicle: [+4] gCO2e
Production: [0] gCO2e
-1 MJ of CARBOB
Vehicle: [0] gCO2e
Production: [-13] gCO2e
+1 MJ of Ethanol
Vehicle: [0] gCO2e
Production: [+75] gCO2e
Under the Cap
Emissions Reduction from Substitution-74 + (-14) + 4 + 0
= [-84] gCO2e
Emissions Increase from Cap-and-TradeInteraction
= [+84] gCO2e
Emissions Increase from Outside the Cap0 + (-13) + (0) + (75)
= [+62] gCO2e
Net Change in Emissions(-84) + (84) + (62)
= [+62] gCO2e
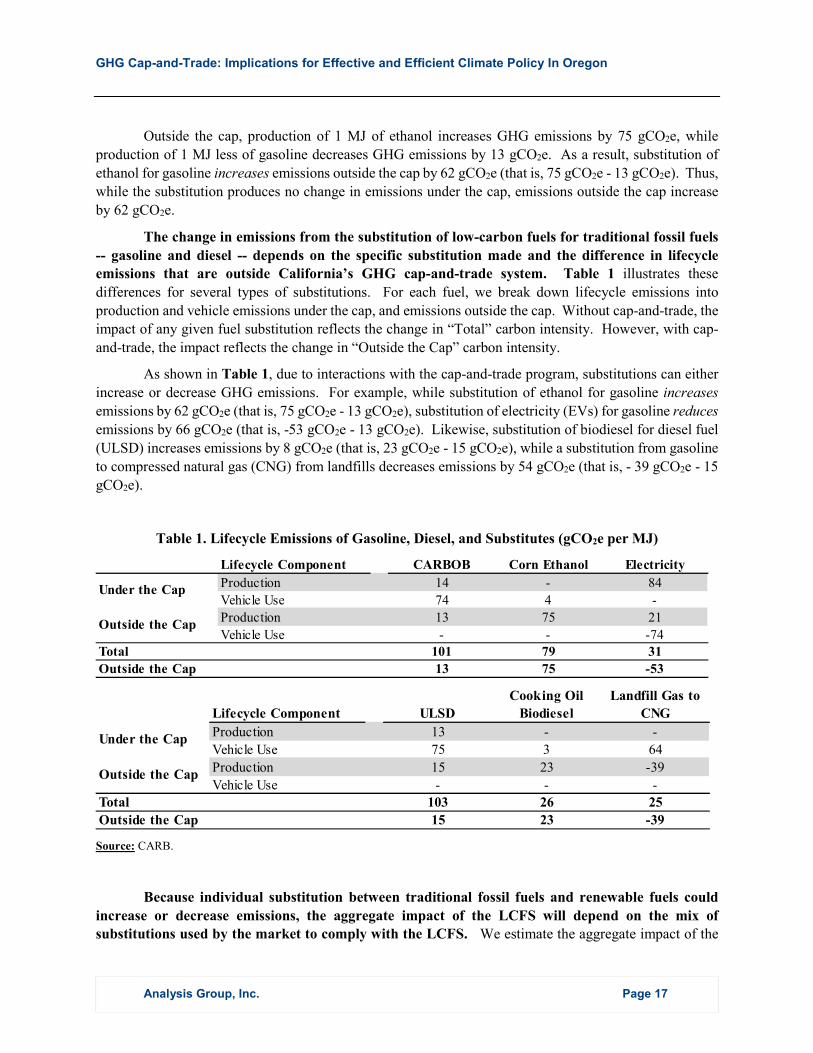
GHG Cap-and-Trade: Implications for Effective and Efficient Climate Policy In Oregon
Analysis Group, Inc. Page 17
Outside the cap, production of 1 MJ of ethanol increases GHG emissions by 75 gCO2e, while
production of 1 MJ less of gasoline decreases GHG emissions by 13 gCO2e. As a result, substitution of
ethanol for gasoline increases emissions outside the cap by 62 gCO2e (that is, 75 gCO2e - 13 gCO2e). Thus,
while the substitution produces no change in emissions under the cap, emissions outside the cap increase
by 62 gCO2e.
The change in emissions from the substitution of low-carbon fuels for traditional fossil fuels
-- gasoline and diesel -- depends on the specific substitution made and the difference in lifecycle emissions that are outside California’s GHG cap-and-trade system. Table 1 illustrates these
differences for several types of substitutions. For each fuel, we break down lifecycle emissions into
production and vehicle emissions under the cap, and emissions outside the cap. Without cap-and-trade, the
impact of any given fuel substitution reflects the change in “Total” carbon intensity. However, with cap-
and-trade, the impact reflects the change in “Outside the Cap” carbon intensity.
As shown in Table 1, due to interactions with the cap-and-trade program, substitutions can either
increase or decrease GHG emissions. For example, while substitution of ethanol for gasoline increases
emissions by 62 gCO2e (that is, 75 gCO2e - 13 gCO2e), substitution of electricity (EVs) for gasoline reduces
emissions by 66 gCO2e (that is, -53 gCO2e - 13 gCO2e). Likewise, substitution of biodiesel for diesel fuel
(ULSD) increases emissions by 8 gCO2e (that is, 23 gCO2e - 15 gCO2e), while a substitution from gasoline
to compressed natural gas (CNG) from landfills decreases emissions by 54 gCO2e (that is, - 39 gCO2e - 15
gCO2e).
Table 1. Lifecycle Emissions of Gasoline, Diesel, and Substitutes (gCO2e per MJ)
Source: CARB.
Because individual substitution between traditional fossil fuels and renewable fuels could
increase or decrease emissions, the aggregate impact of the LCFS will depend on the mix of substitutions used by the market to comply with the LCFS. We estimate the aggregate impact of the
Lifecycle Component CARBOB Corn Ethanol Electricity
Production 14 - 84
Vehicle Use 74 4 -
Production 13 75 21
Vehicle Use - - -74Total 101 79 31
Outside the Cap 13 75 -53
Under the Cap
Outside the Cap
Lifecycle Component ULSD
Cooking Oil
Biodiesel
Landfill Gas to
CNG
Production 13 - -
Vehicle Use 75 3 64
Production 15 23 -39
Vehicle Use - - -Total 103 26 25
Outside the Cap 15 23 -39
Under the Cap
Outside the Cap
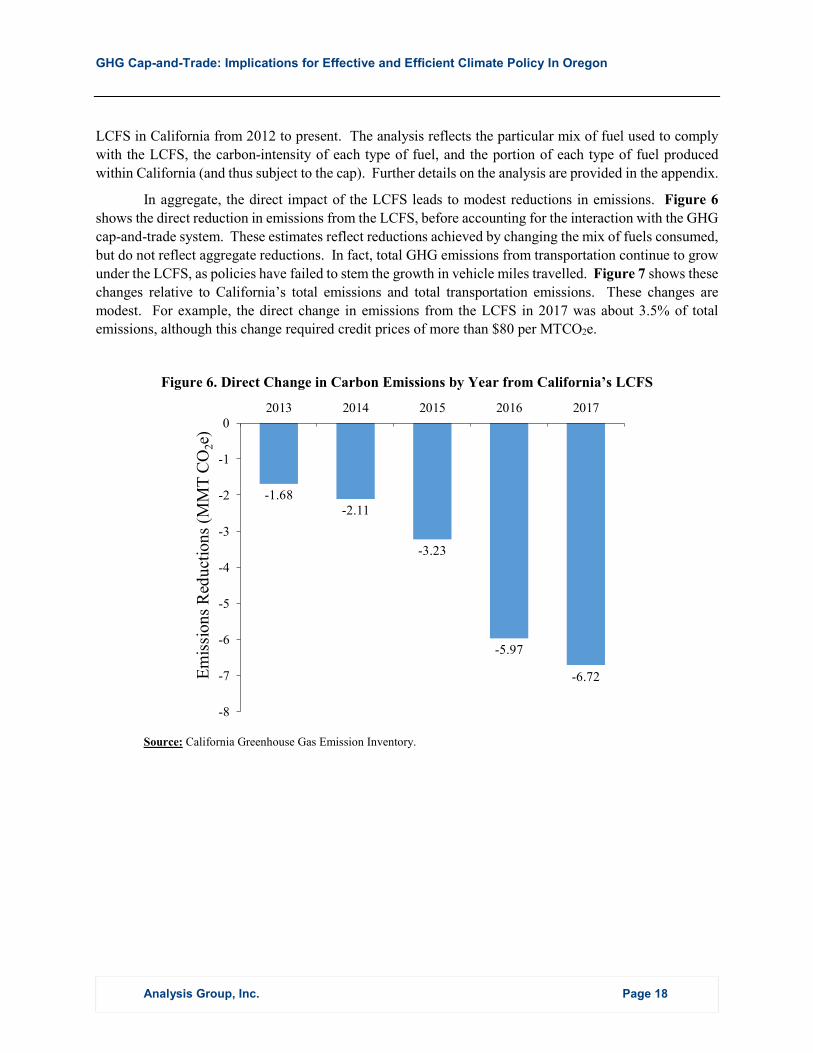
GHG Cap-and-Trade: Implications for Effective and Efficient Climate Policy In Oregon
Analysis Group, Inc. Page 18
LCFS in California from 2012 to present. The analysis reflects the particular mix of fuel used to comply
with the LCFS, the carbon-intensity of each type of fuel, and the portion of each type of fuel produced
within California (and thus subject to the cap). Further details on the analysis are provided in the appendix.
In aggregate, the direct impact of the LCFS leads to modest reductions in emissions. Figure 6
shows the direct reduction in emissions from the LCFS, before accounting for the interaction with the GHG
cap-and-trade system. These estimates reflect reductions achieved by changing the mix of fuels consumed,
but do not reflect aggregate reductions. In fact, total GHG emissions from transportation continue to grow
under the LCFS, as policies have failed to stem the growth in vehicle miles travelled. Figure 7 shows these
changes relative to California’s total emissions and total transportation emissions. These changes are
modest. For example, the direct change in emissions from the LCFS in 2017 was about 3.5% of total
emissions, although this change required credit prices of more than $80 per MTCO2e.
Figure 6. Direct Change in Carbon Emissions by Year from California’s LCFS
Source: California Greenhouse Gas Emission Inventory.
-1.68-2.11
-3.23
-5.97
-6.72
-8
-7
-6
-5
-4
-3
-2
-1
02013 2014 2015 2016 2017
Em
issi
ons
Red
uct
ion
s (M
MT
CO
2e)
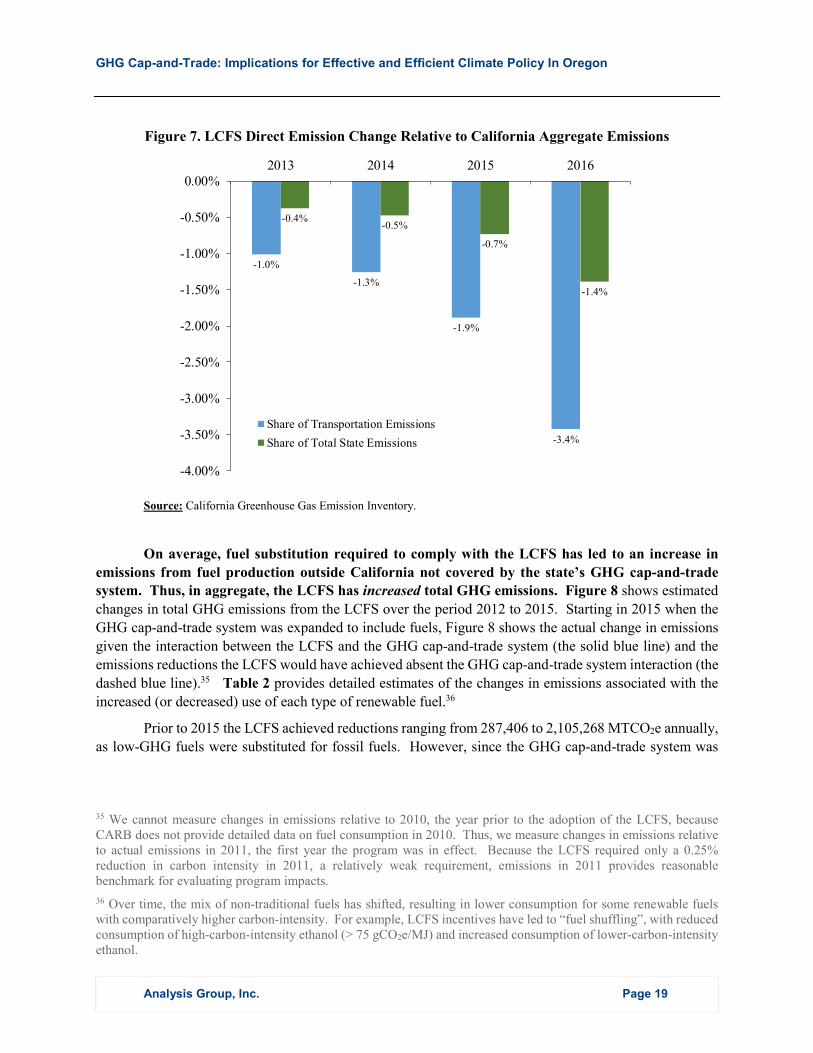
GHG Cap-and-Trade: Implications for Effective and Efficient Climate Policy In Oregon
Analysis Group, Inc. Page 19
Figure 7. LCFS Direct Emission Change Relative to California Aggregate Emissions
Source: California Greenhouse Gas Emission Inventory.
On average, fuel substitution required to comply with the LCFS has led to an increase in
emissions from fuel production outside California not covered by the state’s GHG cap-and-trade system. Thus, in aggregate, the LCFS has increased total GHG emissions. Figure 8 shows estimated
changes in total GHG emissions from the LCFS over the period 2012 to 2015. Starting in 2015 when the
GHG cap-and-trade system was expanded to include fuels, Figure 8 shows the actual change in emissions
given the interaction between the LCFS and the GHG cap-and-trade system (the solid blue line) and the
emissions reductions the LCFS would have achieved absent the GHG cap-and-trade system interaction (the
dashed blue line).35 Table 2 provides detailed estimates of the changes in emissions associated with the
increased (or decreased) use of each type of renewable fuel.36
Prior to 2015 the LCFS achieved reductions ranging from 287,406 to 2,105,268 MTCO2e annually,
as low-GHG fuels were substituted for fossil fuels. However, since the GHG cap-and-trade system was
35 We cannot measure changes in emissions relative to 2010, the year prior to the adoption of the LCFS, because CARB does not provide detailed data on fuel consumption in 2010. Thus, we measure changes in emissions relative to actual emissions in 2011, the first year the program was in effect. Because the LCFS required only a 0.25% reduction in carbon intensity in 2011, a relatively weak requirement, emissions in 2011 provides reasonable benchmark for evaluating program impacts.
36 Over time, the mix of non-traditional fuels has shifted, resulting in lower consumption for some renewable fuels with comparatively higher carbon-intensity. For example, LCFS incentives have led to “fuel shuffling”, with reduced consumption of high-carbon-intensity ethanol (> 75 gCO2e/MJ) and increased consumption of lower-carbon-intensity ethanol.
-1.0%
-1.3%
-1.9%
-3.4%
-0.4%-0.5%
-0.7%
-1.4%
-4.00%
-3.50%
-3.00%
-2.50%
-2.00%
-1.50%
-1.00%
-0.50%
0.00%2013 2014 2015 2016
Share of Transportation Emissions
Share of Total State Emissions
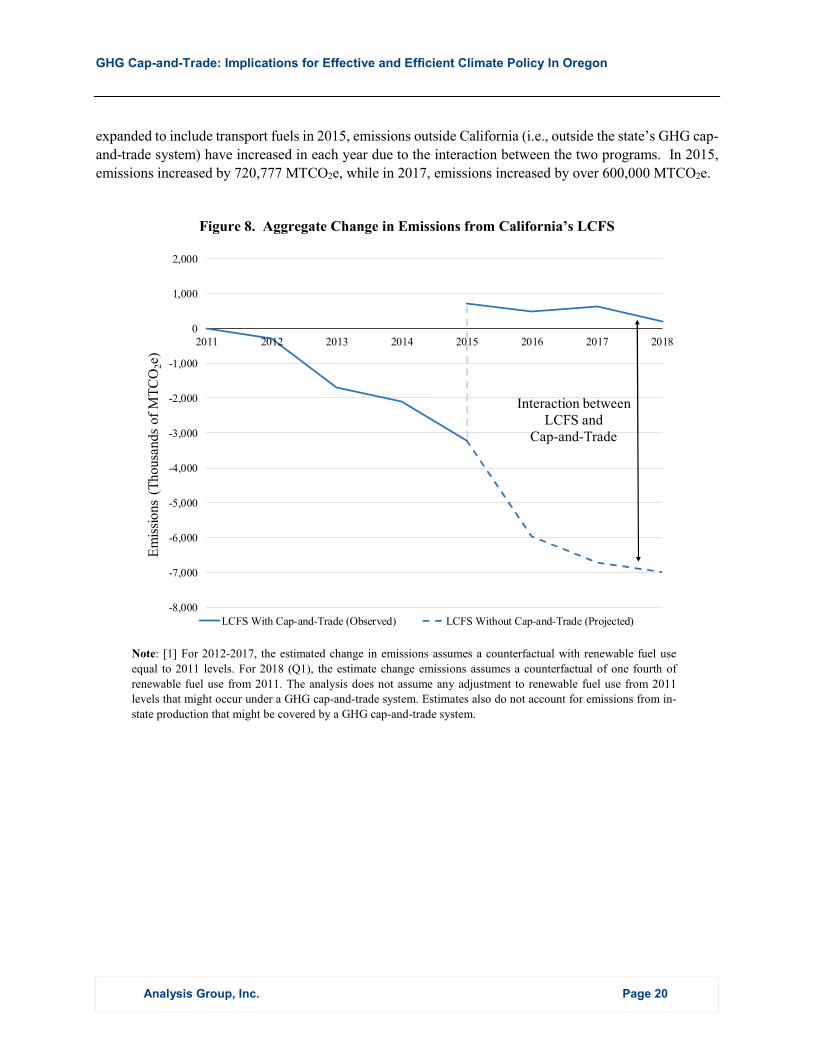
GHG Cap-and-Trade: Implications for Effective and Efficient Climate Policy In Oregon
Analysis Group, Inc. Page 20
expanded to include transport fuels in 2015, emissions outside California (i.e., outside the state’s GHG cap-
and-trade system) have increased in each year due to the interaction between the two programs. In 2015,
emissions increased by 720,777 MTCO2e, while in 2017, emissions increased by over 600,000 MTCO2e.
Figure 8. Aggregate Change in Emissions from California’s LCFS
Note: [1] For 2012-2017, the estimated change in emissions assumes a counterfactual with renewable fuel use
equal to 2011 levels. For 2018 (Q1), the estimate change emissions assumes a counterfactual of one fourth of
renewable fuel use from 2011. The analysis does not assume any adjustment to renewable fuel use from 2011
levels that might occur under a GHG cap-and-trade system. Estimates also do not account for emissions from in-
state production that might be covered by a GHG cap-and-trade system.
-8,000
-7,000
-6,000
-5,000
-4,000
-3,000
-2,000
-1,000
0
1,000
2,000
2011 2012 2013 2014 2015 2016 2017 2018
Em
issi
on
s (T
hou
sand
s of
MT
CO
2e)
LCFS With Cap-and-Trade (Observed) LCFS Without Cap-and-Trade (Projected)
Interaction between LCFS and
Cap-and-Trade
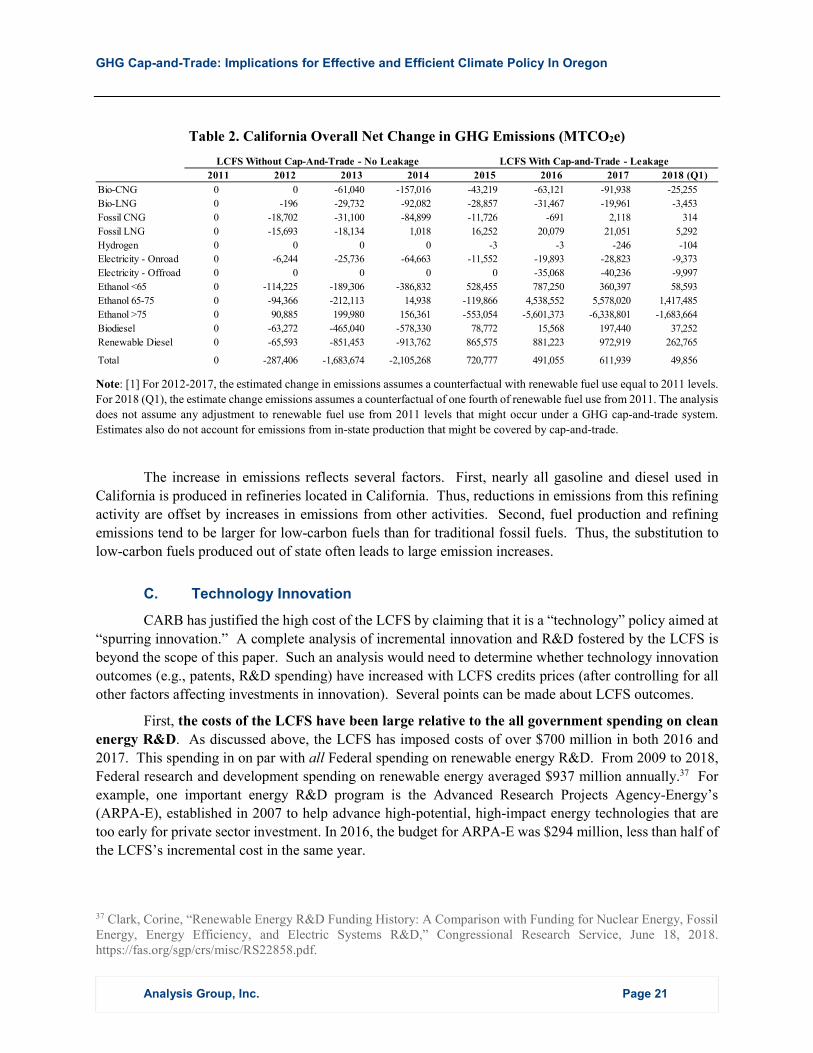
GHG Cap-and-Trade: Implications for Effective and Efficient Climate Policy In Oregon
Analysis Group, Inc. Page 21
Table 2. California Overall Net Change in GHG Emissions (MTCO2e)
Note: [1] For 2012-2017, the estimated change in emissions assumes a counterfactual with renewable fuel use equal to 2011 levels.
For 2018 (Q1), the estimate change emissions assumes a counterfactual of one fourth of renewable fuel use from 2011. The analysis
does not assume any adjustment to renewable fuel use from 2011 levels that might occur under a GHG cap-and-trade system.
Estimates also do not account for emissions from in-state production that might be covered by cap-and-trade.
The increase in emissions reflects several factors. First, nearly all gasoline and diesel used in
California is produced in refineries located in California. Thus, reductions in emissions from this refining
activity are offset by increases in emissions from other activities. Second, fuel production and refining
emissions tend to be larger for low-carbon fuels than for traditional fossil fuels. Thus, the substitution to
low-carbon fuels produced out of state often leads to large emission increases.
C. Technology Innovation
CARB has justified the high cost of the LCFS by claiming that it is a “technology” policy aimed at
“spurring innovation.” A complete analysis of incremental innovation and R&D fostered by the LCFS is
beyond the scope of this paper. Such an analysis would need to determine whether technology innovation
outcomes (e.g., patents, R&D spending) have increased with LCFS credits prices (after controlling for all
other factors affecting investments in innovation). Several points can be made about LCFS outcomes.
First, the costs of the LCFS have been large relative to the all government spending on clean
energy R&D. As discussed above, the LCFS has imposed costs of over $700 million in both 2016 and
2017. This spending in on par with all Federal spending on renewable energy R&D. From 2009 to 2018,
Federal research and development spending on renewable energy averaged $937 million annually.37 For
example, one important energy R&D program is the Advanced Research Projects Agency-Energy’s
(ARPA-E), established in 2007 to help advance high-potential, high-impact energy technologies that are
too early for private sector investment. In 2016, the budget for ARPA-E was $294 million, less than half of
the LCFS’s incremental cost in the same year.
37 Clark, Corine, “Renewable Energy R&D Funding History: A Comparison with Funding for Nuclear Energy, Fossil Energy, Energy Efficiency, and Electric Systems R&D,” Congressional Research Service, June 18, 2018. https://fas.org/sgp/crs/misc/RS22858.pdf.
LCFS Without Cap-And-Trade - No Leakage LCFS With Cap-and-Trade - Leakage
2011 2012 2013 2014 2015 2016 2017 2018 (Q1)
Bio-CNG 0 0 -61,040 -157,016 -43,219 -63,121 -91,938 -25,255
Bio-LNG 0 -196 -29,732 -92,082 -28,857 -31,467 -19,961 -3,453
Fossil CNG 0 -18,702 -31,100 -84,899 -11,726 -691 2,118 314
Fossil LNG 0 -15,693 -18,134 1,018 16,252 20,079 21,051 5,292
Hydrogen 0 0 0 0 -3 -3 -246 -104
Electricity - Onroad 0 -6,244 -25,736 -64,663 -11,552 -19,893 -28,823 -9,373
Electricity - Offroad 0 0 0 0 0 -35,068 -40,236 -9,997
Ethanol <65 0 -114,225 -189,306 -386,832 528,455 787,250 360,397 58,593
Ethanol 65-75 0 -94,366 -212,113 14,938 -119,866 4,538,552 5,578,020 1,417,485
Ethanol >75 0 90,885 199,980 156,361 -553,054 -5,601,373 -6,338,801 -1,683,664
Biodiesel 0 -63,272 -465,040 -578,330 78,772 15,568 197,440 37,252
Renewable Diesel 0 -65,593 -851,453 -913,762 865,575 881,223 972,919 262,765
Total 0 -287,406 -1,683,674 -2,105,268 720,777 491,055 611,939 49,856
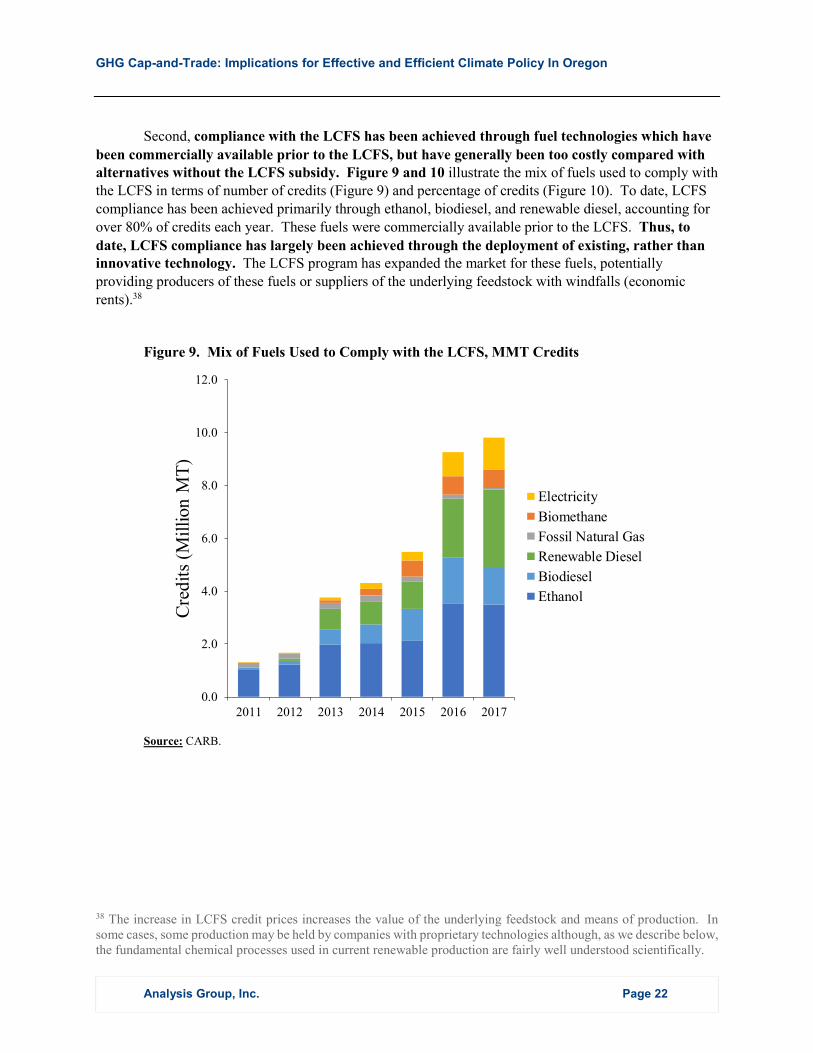
GHG Cap-and-Trade: Implications for Effective and Efficient Climate Policy In Oregon
Analysis Group, Inc. Page 22
Second, compliance with the LCFS has been achieved through fuel technologies which have
been commercially available prior to the LCFS, but have generally been too costly compared with alternatives without the LCFS subsidy. Figure 9 and 10 illustrate the mix of fuels used to comply with the LCFS in terms of number of credits (Figure 9) and percentage of credits (Figure 10). To date, LCFS compliance has been achieved primarily through ethanol, biodiesel, and renewable diesel, accounting for over 80% of credits each year. These fuels were commercially available prior to the LCFS. Thus, to
date, LCFS compliance has largely been achieved through the deployment of existing, rather than innovative technology. The LCFS program has expanded the market for these fuels, potentially providing producers of these fuels or suppliers of the underlying feedstock with windfalls (economic rents).38
Figure 9. Mix of Fuels Used to Comply with the LCFS, MMT Credits
Source: CARB.
38 The increase in LCFS credit prices increases the value of the underlying feedstock and means of production. In some cases, some production may be held by companies with proprietary technologies although, as we describe below, the fundamental chemical processes used in current renewable production are fairly well understood scientifically.
0.0
2.0
4.0
6.0
8.0
10.0
12.0
2011 2012 2013 2014 2015 2016 2017
Cre
dit
s (M
illi
on M
T)
Electricity
Biomethane
Fossil Natural Gas
Renewable Diesel
Biodiesel
Ethanol
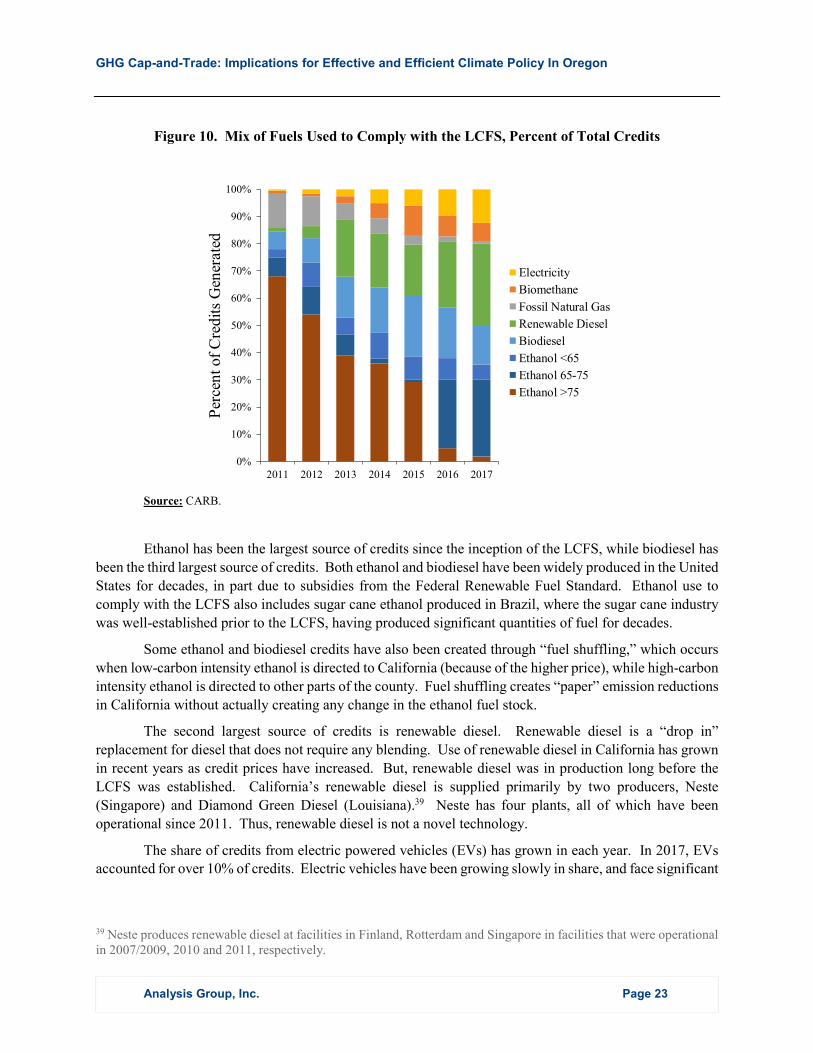
GHG Cap-and-Trade: Implications for Effective and Efficient Climate Policy In Oregon
Analysis Group, Inc. Page 23
Figure 10. Mix of Fuels Used to Comply with the LCFS, Percent of Total Credits
Source: CARB.
Ethanol has been the largest source of credits since the inception of the LCFS, while biodiesel has
been the third largest source of credits. Both ethanol and biodiesel have been widely produced in the United
States for decades, in part due to subsidies from the Federal Renewable Fuel Standard. Ethanol use to
comply with the LCFS also includes sugar cane ethanol produced in Brazil, where the sugar cane industry
was well-established prior to the LCFS, having produced significant quantities of fuel for decades.
Some ethanol and biodiesel credits have also been created through “fuel shuffling,” which occurs
when low-carbon intensity ethanol is directed to California (because of the higher price), while high-carbon
intensity ethanol is directed to other parts of the county. Fuel shuffling creates “paper” emission reductions
in California without actually creating any change in the ethanol fuel stock.
The second largest source of credits is renewable diesel. Renewable diesel is a “drop in”
replacement for diesel that does not require any blending. Use of renewable diesel in California has grown
in recent years as credit prices have increased. But, renewable diesel was in production long before the
LCFS was established. California’s renewable diesel is supplied primarily by two producers, Neste
(Singapore) and Diamond Green Diesel (Louisiana).39 Neste has four plants, all of which have been
operational since 2011. Thus, renewable diesel is not a novel technology.
The share of credits from electric powered vehicles (EVs) has grown in each year. In 2017, EVs accounted for over 10% of credits. Electric vehicles have been growing slowly in share, and face significant
39 Neste produces renewable diesel at facilities in Finland, Rotterdam and Singapore in facilities that were operational in 2007/2009, 2010 and 2011, respectively.
0%
10%
20%
30%
40%
50%
60%
70%
80%
90%
100%
2011 2012 2013 2014 2015 2016 2017
Per
cen
t of
Cre
dit
s G
ener
ated
Electricity
Biomethane
Fossil Natural Gas
Renewable Diesel
Biodiesel
Ethanol <65
Ethanol 65-75
Ethanol >75
GHG Cap-and-Trade: Implications for Effective and Efficient Climate Policy In Oregon
Analysis Group, Inc. Page 24
technical hurdles to broad commercial acceptance (including battery life and cost, and necessary recharging infrastructure). EVs also benefit from multiple state and federal subsidies, including federal tax deductions, rebates and incentives and requirements related to EV charging stations. The extent to which the LCFS materially increases these incentives is unclear.
D. Implications for Oregon
California’s experience with its LCFS has important implications for Oregon.
First, the GHG cap-and-trade system will achieve emission reductions at a lower cost than
other (complementary) policies that Oregon has already adopted to address climate change and other environmental impacts. At present, credit prices for the CFP program are approximately $80 per
MTCO2e, which is significantly above likely GHG cap-and-trade allowance prices. At present, emission
reduction costs from the RPS appear comparable (but subject to uncertainty due to limited information).40
These costs may rise as the stringency of Oregon’s CFP standard increases.
Second, Oregon should expect the adoption of a GHG cap-and-trade system will have consequences for the effectiveness of the CFP in producing incremental emission reductions. Like
California’s LCFS, the CFP will lead to no (or little) emission reductions, and potentially even increase
emissions as has been the experience in California. As with California, actual emission outcomes will
depend on the particular fuel substitutions used to comply with the CFP. However, differences between
the state’s programs and markets will lead to differences in emission outcomes. While nearly all of
California’s fossil fuel refining occurs in-state and is thus under the cap, none of Oregon’s fuel is refined
in-state, and so all reductions in refining emissions are outside the cap. All else equal, this will increase the
emission reductions achieved by the CFP (compared to California’s LCFS) because reduced gasoline and
diesel consumption will reduce out-of-state refinery emissions. In addition, details of the policies, notably
the carbon-intensities, differ between the states.
Oregon’s CFP has yet to have a meaningful impact on renewable fuel use, thus making it premature
to evaluate potential impacts of the overlap with a GHG cap-and-trade system. In 2017, renewable fuel use
increased by only 33 Million MJ compared with 20,360 Million MJ consumed in 2016, an increase of less
than 0.2%.41 Changes in the mix of non-traditional fuels led to reductions in emissions (as measured by
Oregon) of 17,751 MTCO2e. This is a very small change in emissions, less than 0.1% of total transportation
in emissions in 2016 (24.2 million MTCO2e). This change in fuel mix included a decrease in ethanol
consumption of 713 Million MJ and an increase in consumption of other fuels (including biodiesel,
renewable diesel and forms of CNG) of 746 Million MJ. This shift in the composition of non-traditional
fuels may be the result of CFP incentives, or it may be the result of other market factors.
40 In 2017, the average reported cost of bundled RECs was $29 per REC for Portland General Electric. (Reported cost per REC for unbundled RECs was substantially lower.) Assuming that the REC displaces natural gas-fired generation with a heat rate of 8 MMBtu per MWh, this results in a cost of $68 per MTCO2e. PacifiCorp’s costs were not publicly reported. Portland General Electric, UM 1958 - PGE 2017 Renewable Portfolio Standard Compliance Report, June 1, 2018. https://www.oregon.gov/energy/energy-oregon/Documents/2017-PGE-Compliance-Report.pdf
41 As with our analysis of California’s LCFS, we estimate changes in emissions relative to 2016, the first year of the CFP, because Oregon does not report detailed information on non-traditional fuel use in 2015.
GHG Cap-and-Trade: Implications for Effective and Efficient Climate Policy In Oregon
Analysis Group, Inc. Page 25
IV. NEXT STEPS FOR OREGON CLIMATE POLICY
As Oregon contemplates the adoption of a GHG cap-and-trade system, it has several options for its
suite of climate policies. One approach maintains all policies, as currently proposed, with a new GHG
cap-and-trade system plus existing complementary policies. Our analysis shows that, due to
interactions among overlapping climate policies, retaining many of the existing complementary
policies could be very costly without achieving any incremental environmental benefits.
A second option would develop a GHG cap-and-trade system of sufficient stringency to
achieve targeted emissions or allow prices to rise to the social cost of carbon, and end complementary
policies that do not produce incremental economic benefits by addressing market failure unrelated to the GHG emission externality or target sources not covered by the cap. This approach could begin
by undertaking a thorough assessment of the likely interactions among overlapping climate policies and the
extent to which policies address market failures unrelated to GHG emissions or target sources not covered
by the GHG cap-and-trade system. Economic analysis unambiguously shows that this second option,
relying largely (if not solely) on GHG emission pricing, is the most cost-effective approach to
achieving emission targets.
However, political realities may not support the immediate adoption of climate policies relying on
high (efficient) carbon pricing. Thus, when carbon pricing is adopted, the resulting price levels are often
well below the social cost of carbon and price levels that would be needed to achieve the emission targets
sought by legislators. Instead, states (and other local governments) often take a “belts and suspenders”
approach that pursues reduction through a “suite” of policies targeting many of the activities that lead to
GHG emissions (i.e., the first option described above). This approach is often more politically expedient,
as it offers the possibility of addressing climate change while hiding the costs. However, this approach
may actually be less effective at achieving desired emission reductions. And, as state climate policies
become increasing stringent, the costs associated with inefficient complementary policies will become
larger.
A third option takes a hybrid approach by enacting carbon pricing that begins at relatively
low levels that are politically feasible even if they are not optimal, gradually raising prices over time.As carbon prices are increased over time, reliance on the more costly complementary policies to achieve
targeted emission reductions can be diminished, and in some cases eliminated. Those complementary
policies that address other legitimate market failures (e.g., energy R&D, energy efficiency programs, etc.)
or sources outside the cap would be retained. Thus, the burden of achieving GHG emission reductions can
be shifted from complementary policies to GHG pricing.
Along with acclimating politicians and citizens to carbon pricing, decisions about the use of the
revenues from GHG pricing may also have an important role in affecting political willingness to adopt
ambitious carbon-pricing policies. Much of the opposition stems from the perception that carbon pricing
constitutes a new tax. Thus, while decisions about revenue use has important impacts on the costs of
achieving climate goals, these decisions may also lower political barriers to GHG cap-and-trade systems if
revenues uses can defuse arguments grounded in opposition to new taxes. In particular, making a GHG
cap-and-trade system revenue neutral may address concerns that the policy is a new tax. Making the use
of revenues transparent may also reduce political opposition.
In the interim, there are several important considerations for decisions regarding complementary
policies. First, policies that meet the criteria identified above, such as addressing market-failures unrelated
GHG Cap-and-Trade: Implications for Effective and Efficient Climate Policy In Oregon
Analysis Group, Inc. Page 26
to the GHG emission externality or targeting emission sources outside the emission cap, will continue to
provide economic, and potentially environmental, benefits. Second, complementary policies that achieve
emission reductions at a lower cost than alternatives will be more economically efficient. Finally,
complementary policies that include mechanisms to reduce their stringency over time may better allow
carbon pricing to achieve a growing share of emission reductions. In this regard, subsidies are problematic,
as they create a constituency that inevitably lobbies for their preservation.
GHG Cap-and-Trade: Implications for Effective and Efficient Climate Policy In Oregon
Analysis Group, Inc. Page 27
Technical Appendix
Our analysis assesses the change in lifecycle emissions achieved by the LCFS. In particular, for
fuels covered by both the LCFS and GHG cap-and-trade programs—CARBOB gasoline, ULSD diesel,
ethanol, electricity, biodiesel, and CNG—we model the change in emissions due to switching from either
CARBOB or ULSD diesel to a lower carbon intensity fuel substitute. The model is similar in structure to
that used in Schatzki and Stavins (2012), with three key differences: (1) the model relies on actual fuel
usage reported by ARB instead of forecasted scenarios; (2) the model considers all alternative fuel types
instead of just a few different forms of low-carbon fuels; and (3) the model accounts for differences in the
location of production.
The model considers annual emission changes due to the LCFS in two distinct periods of the
program. The first period occurs from 2011 through 2014, prior to the GHG cap-and-trade system
expanding to cover fuels. The second period occurs from 2015 through the first quarter of 2018 (the latest
period for which data exists), during which time the GHG cap-and-trade system and the LCFS both
regulated transport fuels.
In the 2011-2014 period, the analysis calculates the emissions changes due to fuel switching caused by the LCFS alone. Specifically, changes in emissions are calculated for each alternative fuel type as the difference between the carbon intensity of the alternative fuel being switched to and the carbon intensity of the fuel being switched away from (CARBOB or ULSD diesel). Because the LCFS considers lifecycle carbon intensity (i.e. throughout the entire production process and point of use), the change in emissions from fuel switching reflects lifecycle emissions changes.
In the 2015-2018 (Q1) period, the analysis calculates the emissions due both to fuel switching as just described and the interaction between the LCFS and GHG cap-and-trade system. In estimating the impact of this interaction, changes in emissions depend upon the component of each fuel’s production process that occurs within California and outside California. The GHG cap-and-trade system covers emissions from combustion, in-state petroleum refining, and in-state renewable fuel production. Therefore, the model incorporates the following assumptions:
Crude production occurs in and outside California, reflecting data from CARB, while
CARBOB gasoline and ULSD diesel refining occur solely in California.42
Production of ethanol occurs both in and outside California, reflecting data from the
Energy Information Administration (EIA).43
Production of renewable diesel occurs outside California, reflecting market information
and communications with market participants.
42 CARB, “Detailed CA-GREET Pathway for California Reformulated Gasoline Blendstock for Oxygenate Blending (CARBOB) from Average Crude Refined in California,” December 15, 2014, available at https://www.arb.ca.gov/fuels/lcfs/121514carbob.pdf; CARB, “Detailed California-Modified GREET Pathway for Ultra Low Sulfur Diesel (ULSD) from Average Crude Refined in California,” December 15, 2015, available at https://www.arb.ca.gov/fuels/lcfs/121514ulsd.pdf.
43 For ethanol production see EIA, “California State Energy Profile,” October 19, 2017, available at https://www.eia.gov/state/print.php?sid=CA; for biodiesel production see EIA, “Monthly Biodiesel Report,” September 2018, available at https://www.eia.gov/biofuels/biodiesel/production/biodiesel.pdf.
GHG Cap-and-Trade: Implications for Effective and Efficient Climate Policy In Oregon
Analysis Group, Inc. Page 28
Production of electricity used to power electric vehicles is covered entirely by the GHG
cap-and-trade system, consistent with the program design.
Production of remaining fuels (bio-CNG, bio-LNG, fossil CNG, fossil LNG, and
hydrogen) occur within California.
The lifecycle emissions change (in grams of CO2e per MJ) implied by the model are captured in the table below:
California Change in GHG (gCO2e/MJ)
Source: [1] Carbon intensities are calculated based on fuel volumes and credits from ARB's LCFS Quarterly Data spreadsheet as
of 7/3/2018.
Annual Direct Emission Reductions and Incremental Costs, California’s LCFS
Note: We distinguish in our calculations between expenditures by reducing entities and economic cost of emission reductions.
Expenditures associated with emission reductions are simply (annual emission reductions [MT]) × (average annual credit price
[$/MT]), where the average annual credit price represents the average of the 12 monthly CARB reported average credit prices.
Costs of emission reductions can be represented by the area under an emissions reduction supply curve between the origin and
market clearing price, here represented by the average annual credit price. If we make the simplifying assumption of a linear supply
curve, costs will equal half of the expenditures, since the area of a triangle is one half the area of a rectangle with same base and
height.
Source: CARB.
LCFS Without Cap-And-Trade - No Leakage LCFS With Cap-and-Trade - Leakage
2011 2012 2013 2014 2015 2016 2017 2018 (Q1)
Bio-CNG - - -81 -76 -8 -8 -8 -8
Bio-LNG -78 -78 -72 -59 -8 -8 -8 -8
Fossil CNG -27 -27 -27 -26 -8 -8 -8 -8
Fossil LNG -19 -19 -19 -19 -8 -8 -8 -8
Hydrogen - - - - -8 -8 -8 -8
Electricity - Onroad -57 -57 -69 -69 -8 -8 -8 -8
Electricity - Offroad - - - - - -8 -8 -8
Ethanol <65 -41 -48 -41 -40 45 44 39 43
Ethanol 65-75 -30 -30 -30 -28 51 53 53 53
Ethanol >75 -12 -13 -16 -16 64 60 59 59
Biodiesel -61 -67 -78 -85 5 1 10 9
Renewable Diesel -81 -72 -57 -63 41 27 22 21
Year
Observed Emission
Reductions (MT)
[A]
Average Credit Price
($ / MT)
[B]
Estimated Incremental Cost of
Reducing Emissions
[C] = ([A] * [B]) / 2
2013 1,683,674 50.5 $42,512,760
2014 2,105,268 36.1 $37,982,546
2015 3,225,935 45.9 $74,062,084
2016 5,969,891 103.0 $307,548,894
2017 6,723,286 87.9 $295,544,445
2018Q1 1,749,576 124.7 $109,056,884
GHG Cap-and-Trade: Implications for Effective and Efficient Climate Policy In Oregon
Analysis Group, Inc. Page 29
California LCFS Emission Reductions Relative to Total Emissions, 2013 - 2016 (MMT of CO2e)
Source: California Greenhouse Gas Emission Inventory.
2017 Direct Emission Reductions and Incremental Costs, Oregon’s CFP
Note: We distinguish in our calculations between expenditures by reducing entities and economic cost of emission reductions.
Expenditures associated with emission reductions are simply (annual emission reductions [MT]) × (average annual credit price
[$/MT]). Costs of emission reductions can be represented by the area under an emissions reduction supply curve between the origin
and market clearing price, here represented by the average annual credit price. If we make the simplifying assumption of a linear
supply curve, costs will equal half of the expenditures, since the area of a triangle is one half the area of a rectangle with same base
and height.
Source: Oregon Department of Environmental Quality.
Year Emission Reductions
[A]
Emissions
[B]
Reduction Share
[C] = [A] / [B]
Emissions
[D]
Reduction Share
[E] = [A] / [D]
2013 1.68 165.8 1.02% 447.6 0.38%
2014 2.11 167.14 1.26% 444.1 0.47%
2015 3.23 170.89 1.89% 441.4 0.73%
2016 5.97 174.01 3.43% 429.4 1.39%
Transportation Sector All Sources
Observed Emission
Reductions (MT)
[A]
Average Credit Price
($ / MT)
[B]
Estimated Incremental Cost of
Reducing Emissions
[C] = ([A] * [B]) / 2
17,751 48.1 $426,810
Transitioning to Long-Run Effective and
Efficient Climate Policies
Prof. Robert N. Stavins
Harvard University
Todd Schatzki, Ph.D.
Rebecca Scott, Ph.D.
Analysis Group, Inc.
March 2019
Transitioning to Long-Run Effective and Efficient Climate Policies
Executive Summary
Robert N. Stavins, Todd Schatzki and Rebecca Scott1
March 2019
A combination of factors pose significant barriers to developing effective and efficient sets of
policies to achieve long-run climate policy objectives. Political opposition to particular types of policy
mechanisms (for example, GHG pricing) and the global, stock-pollutant nature of the climate problem are
among the major factors posing practical policy challenges. Effective and efficient climate policy is needed
in the long run to meaningfully address the climate problem, making the design of transitions to such long-
run policies from the current portfolio of policies an important task for policymakers.
1. Efficient Long-Run Climate Policy Should be Grounded in GHG Pricing, with Additional Policies to Target Emissions Not Subject to GHG Pricing and Address Other Relevant Market Failures
It is widely acknowledged that the foundation of long-run effective and efficient GHG policy will
be GHG pricing reflecting the social cost of GHG emissions. Effective and efficient policies, however,
must address two key issues. First, because it is infeasible, impractical, or too costly to monitor some
emission sources, GHG pricing will inevitably not cover all emissions. For example, agricultural sources,
such as methane from cows, are typically not covered by cap-and-trade systems. Hence, policy measures
targeting emissions sources not covered by GHG pricing should be undertaken (if those policies foster
benefits greater than costs). Second, market failures unrelated to the GHG emission externality can directly
or indirectly affect GHG emissions. We refer to these as “non-GHG market failures.” For example, firms
may invest too little in research and development (R&D) on low-GHG technology development because
information about their innovations will spill over to other firms, thus preventing investing firms from
capturing the full benefits of their investments. Patents reduce but do not fully prevent these information
spillover effects. Other market failures affect property-owner investments in energy efficiency,
development of alternative vehicle refueling infrastructure (“chicken-and-egg” problems), and many other
energy-related decisions. Appropriate, well-designed policies addressing these specific market failures can
improve economic outcomes, while reducing emissions.
1 Professor Stavins is A. J. Meyer Professor of Energy and Economic Development, John F. Kennedy School of Government, Harvard University; University Fellow, Resources for the Future; and Research Associate, National Bureau of Economic Research. He is an elected Fellow of the Association of Environmental and Resource Economists, was Chairman of the U.S. Environmental Protection Agency’s Environmental Economics Advisory Committee, and served as Lead Author of the Second, Third, and Sixth Assessment Reports and Coordinating Leading Author of the Fifth Assessment Report of the Intergovernmental Panel on Climate Change. Institutions listed are for purposes of identification only, implying no endorsement of this work. Dr. Schatzki is a Vice President and Dr. Scott a Manager at Analysis Group. Support was provided by the Western States Petroleum Association, but the opinions expressed are exclusively those of the authors. Research assistance was provided by Mona Birjandi-Feriz and Ben Dalzell. To request further information or provide comments, Dr. Schatzki can be reached at: [email protected].
Transitioning to Long-Run Effective and Efficient Climate Policies
Analysis Group, Inc. Page 2
Long-run efficient climate policies do not include all policy options that can reduce GHG
emissions. For example, performance standards aimed primarily at reducing GHG emissions are less cost-
effective than GHG pricing. Moreover, when implemented alongside cap-and-trade, these policies may
create perverse interactions, raising costs but creating little (or no) change in GHG emissions. Our previous
analysis demonstrated that due to these interactions, California’s Low Carbon Fuel Standard (LCFS)
increased GHG emissions (given increases in out-of-state emissions) and raised costs by over $700 million
from 2013 to 2017.
While political factors may make immediate adoption of GHG pricing at appropriate levels
impractical, wise policy design can enable a smooth transition to such pricing over time. Making this
transition will yield large social benefits, and it may be necessary in order to meaningfully reduce GHG
emissions if the high costs of less-efficient approaches reduce society’s willingness to pursue them.
Reducing reliance on less-efficient policies may face opposition. Once in place, firms supplying
the products and technologies needed to comply with these policies have a vested interest in perpetuating
the policies. For example, rooftop solar installers have an interest in maintaining policies subsidizing
rooftop solar. However, gradual transition away from more costly policies can mitigate the impacts on
these firms, as citizens gradually become acclimated to GHG pricing.
2. Governments Have Options to Transition from Current Policies to Efficient Long-Run Policies
The first step in the transition to efficient long-run climate policies is establishing GHG pricing. In
practice, initial pricing levels will be below the socially optimal level because of political constraints,
among other factors. But once adopted, GHG pricing can be gradually increased.
In tandem, dependence on complementary policies targeting GHG emissions also covered by cap-
and-trade (for example, performance standards) can be reduced. This transition has several effects. First,
reducing reliance on the less-efficient policies undoes the artificial downward pressure they put on GHG
prices. Thus, the price distortion is reduced. Second, gradually reducing dependence on these policies
lowers costs, as the less-efficient policy is scaled back. But this transition does not impact on total emissions
when GHG pricing is created through a cap-and-trade program.
There are three options to reduce reliance on a complementary policy: (1) reducing its stringency;
(2) ending the program at a future date (“sunsetting”); or (3) a combination of (1) and (2). For example,
Figure ES-1 illustrates two alternatives trajectories for Oregon’s Clean Fuel Program (CFP), which reduces
the carbon-intensity of transportation fuels by 10 percent by 2025. One alternative (the dashed blue line)
reduces the carbon-intensity reductions by 80 percent compared to current levels. A second alternative (the
solid blue line) sunsets the CFP in 2025, but otherwise keeps the CFP carbon-intensity standard unchanged;
the current rule keeps the CFP carbon-intensity at the 2025 level, unless the standard is subsequently
changed. By comparison, the cap-and-trade program’s emission cap remains unchanged; thus, total in-state
emissions are unchanged although the CFP standards are modified.
3. Governments Have Multiple Options for Efficiently Addressing Market Failures Not Directly Related to GHG Emissions
Governments have many policy options to address non-GHG market failures. A transition to more
efficient climate policy can include new (or enhanced) measures that address these market failures.
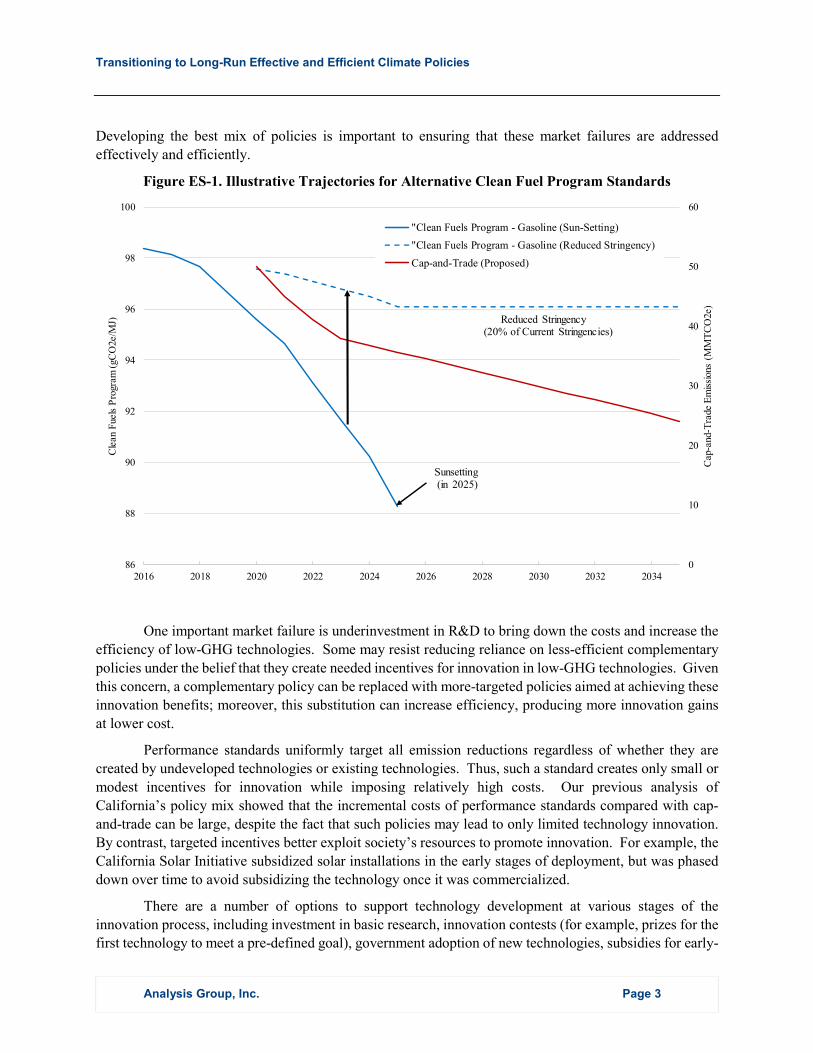
Transitioning to Long-Run Effective and Efficient Climate Policies
Analysis Group, Inc. Page 3
Developing the best mix of policies is important to ensuring that these market failures are addressed
effectively and efficiently.
Figure ES-1. Illustrative Trajectories for Alternative Clean Fuel Program Standards
One important market failure is underinvestment in R&D to bring down the costs and increase the
efficiency of low-GHG technologies. Some may resist reducing reliance on less-efficient complementary
policies under the belief that they create needed incentives for innovation in low-GHG technologies. Given
this concern, a complementary policy can be replaced with more-targeted policies aimed at achieving these
innovation benefits; moreover, this substitution can increase efficiency, producing more innovation gains
at lower cost.
Performance standards uniformly target all emission reductions regardless of whether they are
created by undeveloped technologies or existing technologies. Thus, such a standard creates only small or
modest incentives for innovation while imposing relatively high costs. Our previous analysis of
California’s policy mix showed that the incremental costs of performance standards compared with cap-
and-trade can be large, despite the fact that such policies may lead to only limited technology innovation.
By contrast, targeted incentives better exploit society’s resources to promote innovation. For example, the
California Solar Initiative subsidized solar installations in the early stages of deployment, but was phased
down over time to avoid subsidizing the technology once it was commercialized.
There are a number of options to support technology development at various stages of the
innovation process, including investment in basic research, innovation contests (for example, prizes for the
first technology to meet a pre-defined goal), government adoption of new technologies, subsidies for early-
0
10
20
30
40
50
60
86
88
90
92
94
96
98
100
2016 2018 2020 2022 2024 2026 2028 2030 2032 2034
Cap
-and
-Tra
de E
mis
sion
s (M
MT
CO
2e)
Cle
an F
uels
Pro
gram
(gC
O2e
/MJ)
"Clean Fuels Program - Gasoline (Sun-Setting)
"Clean Fuels Program - Gasoline (Reduced Stringency)
Cap-and-Trade (Proposed)
Sunsetting(in 2025)
Reduced Stringency (20% of Current Stringencies)
Transitioning to Long-Run Effective and Efficient Climate Policies
Analysis Group, Inc. Page 4
stage technologies (declining as technologies reach commercialization), and investment in infrastructure
necessary for new technology deployment (for example, electric vehicle charging stations). Smaller
jurisdictions (such as individual states, like Oregon) may face practical considerations that make certain
options more efficient and feasible than others.
Thus, governments have sensible approaches to climate policy that increase reliance on GHG
pricing over time, reduce the use of less efficient complementary policies, and expand policies that enhance
innovation. Such policy evolution over time reduces costs, while preserving GHG emission goals.
Transitioning to Long-Run Effective and Efficient Climate Policies
Analysis Group, Inc. Page 5
.Transitioning to Long-Run Effective and Efficient Climate Policies
Robert N. Stavins, Todd Schatzki and Rebecca Scott2
March 2019
A combination of factors pose significant barriers to developing effective and efficient portfolios
of policies to achieve long-run climate policy objectives. Among these factors are political opposition to
particular types of policy mechanisms; challenges converting local concern about the climate to efficient
policies, given the global-commons, stock-pollutant nature of the climate problem; technical challenges in
designing low-GHG energy systems; and coordination challenges among nations given free-rider
incentives. Given these factors, the design of current climate policies ought to consider the sequence of
policy design, with the aim of transitioning over time to more effective and efficient climate policies.
This paper evaluates factors affecting the potential to transition over time to more efficient long-
run climate policies, including the sequence of policies to be adopted. By considering these factors,
policymakers can increase the likelihood that more efficient policies emerge from the current suite of less-
efficient measures being pursued by some national and sub-national governments.3
To make these concepts tangible, we focus on the state of Oregon, which is currently contemplating
the adoption of a GHG cap-and-trade system.4 Policies that create GHG pricing, such as a cap-and-trade
system, are the foundation of an economically efficient climate policy. But the immediate transition to
GHG pricing at efficient price levels is politically tenuous. Thus, in the interim, many jurisdictions pursue
less efficient (and less effective) policies that pass political muster. We consider how governments, such
as the State of Oregon, might transition from these less-efficient policies to more efficient GHG pricing
policies over time.
2 Professor Stavins is Albert Pratt Professor of Business and Government, John F. Kennedy School of Government, Harvard University; University Fellow, Resources for the Future; and Research Associate, National Bureau of Economic Research. He is an elected Fellow of the Association of Environmental and Resource Economists, was Chairman of the U.S. Environmental Protection Agency’s Environmental Economics Advisory Committee, and served as Lead Author of the Second and Third Assessment Reports and Coordinating Leading Author of the Fifth Assessment Report of the Intergovernmental Panel on Climate Change. Institutions listed are for purposes of identification only, implying no endorsement of this work. Dr. Schatzki is a Vice President and Dr. Scott a Manager at Analysis Group. Support was provided by the Western States Petroleum Association, but the opinions expressed are exclusively those of the authors. Research assistance was provided by Mona Birjandi-Feriz and Ben Dalzell. To request further information or provide comments, Dr. Schatzki can be reached at: [email protected].
3 This paper builds upon our previous paper, “GHG Cap-and-Trade: Implications for Effective and Efficient Climate Policy In Oregon”. In that paper, we evaluated Oregon’s proposed GHG cap-and-trade system and considered its implications for other climate policies Oregon had already adopted. In this paper, we focus on how governments, such as Oregon, can shift toward more efficient long-run climate policies.
4 For example, Senate Bill 1507, also known as Oregon’s Clean Energy Jobs bill, would create a GHG cap-and-trade system for major sources of GHG emissions. 79th Oregon Legislative Assembly, Senate Bill 1507, Ordered February 16, 2018.
Transitioning to Long-Run Effective and Efficient Climate Policies
Analysis Group, Inc. Page 6
In Section I, we start by defining the principles of long-run effective and efficient climate policies.
We also discuss various barriers to immediate adoption of more efficient policies and consider how the
sequence of policies adopted can affect a government’s ability to transition to more efficient policies in the
long run. Sections II and III consider particular transitions through which governments can improve the
long-run efficiency of climate policies. In Section II, we consider the transition from less-efficient
complementary policies aimed at reducing GHG emissions to GHG pricing. In Section III, we consider
policy transitions aimed at addressing market failures that indirectly affect GHG emissions, focusing on
policies to increase the pace of development of low-GHG technologies without resorting to sector- or
technology-specific standards.
I. LONG-RUN EFFECTIVE AND EFFICIENT CLIMATE POLICIES
The fundamentals of economically efficient or cost-effective (least-cost) climate policies are well
understood, but political and technical impediments can lead to the adoption of climate policies that fall
short in various regards. As a result, governments often take a “belts and suspenders” approach that pursues
GHG abatement through broad suites of policy measures that separately target each category of emission
source. While an efficient climate policy will likely include multiple measures, those measures will look
different from a set of policy measures which focus on individual sources.
A. Economic Principles for Long-Run Effective and Efficient Climate Policies
From an economic perspective, efficient climate policy will aim to reduce GHG emissions through
a set of policies that maximize net benefits (that is, the difference between benefits and costs). This set of
policies will include three components to address three respective market failures as directly as possible:5
1. GHG pricing. GHG pricing internalizes the environmental impacts of energy-use decisions of
households, businesses, and industry through either a GHG cap-and-trade system or a GHG tax. In
principle, the price placed on GHG emissions should reflect the true costs (damages) of GHG
emissions, often referred to as the “social cost of carbon”. An important numerical benchmark for
the social cost of carbon are estimates developed by the United States Government’s Interagency
Working Group (IWG) on the Social Cost of Greenhouse Gases.6, 7 The IWG’s most recent
5 Bennear, Lori and Robert N. Stavins, “Second-best theory and the use of multiple policy instruments,” Environmental and Resource Economics 37(1): 111-129, 2007.
6 These social costs of carbon estimates represent the global damages to various sectors, including agriculture and energy dependent sectors, climate driven human health impacts, damages from sea-level rise, and impacts to ecosystem services. Peace, Janet and Robert N. Stavins, “In Brief: Meaningful and Cost Effective Climate Policy: The Case for Cap and Trade,” Pew Center on Global Climate Change, June 2010; Stavins, Robert N., “A U.S. Cap-and-Trade System to Address Global Climate Change,” The Hamilton Project, October 30, 2007.
7 The IWG developed these estimates to provide United States’ regulatory bodies with a consistent estimate of the social cost of carbon for use in regulatory analyses. See Technical Support Document: Social Cost of Carbon for Regulatory Impact Analysis Under Executive Order 12688, Interagency Working Group on Social Cost of Carbon, United States Government, February 2010 (“TSD 2010”). For other estimates, see for example National Research
Transitioning to Long-Run Effective and Efficient Climate Policies
Analysis Group, Inc. Page 7
estimates indicate that the social cost of carbon from emissions occurring in 2030 would range from
$25 to $115 per metric ton (in nominal dollars), depending upon the choice of discount rate used
to convert the future damages created by those emissions into present value terms.8
2. Complementary policies targeting sources not covered by GHG pricing. Because it is
infeasible, impractical, or too costly to monitor some emission sources, GHG pricing will inevitably
not cover all emissions. For example, agricultural sources, such as methane from cows, are
typically not covered by cap-and-trade systems. Hence, policy measures targeting emissions
sources not covered by GHG pricing should be included (if those policies foster benefits greater
than costs).
3. Complementary policies targeting “non-GHG market failures.” Some economic decisions that
directly or indirectly affect GHG emissions are plagued by market failures unrelated to the GHG
emission externality. We refer to these as “non-GHG market failures.” Such market failures arise
from innovation spillovers, network externalities, information problems, behavioral phenomena,
congestion externalities, and other factors.9 Policies directly aligned with the underlying market
failure will typically address the problem most efficiently and effectively. For example, network
externalities associated with refilling/recharging stations may suggest directly subsidizing
refilling/recharging networks, rather than subsidizing all forms of low-GHG transportation (for
example, LCFS).10
Long-run efficient climate policies by no means include all potential complementary policies that
(directly or indirectly) reduce GHG emissions. In particular, various types of standards may be less cost-
effective than GHG pricing in achieving emission reductions. Examples of such standards include low
carbon fuel standards that mandate reductions in the average carbon-intensity of transport fuels and
renewable portfolio standards that mandate increases in the share of electricity generated by so-defined
renewable technologies.
Council, 2009, Hidden Costs of Energy: Unpriced Consequences of Energy Production and Use, Washington, DC: The National Academies Press at 216-219 for a brief review.
8 For example, the social cost of carbon in 2030 reflects present and future damages from 1 metric ton of emissions in 2030 discounted back to 2030 at a 3 percent discount rate. See TSD 2016 at 4. The IWG reports the social cost of carbon in $2007. We convert $2007 to $2030 using historical annual average CPI values for all urban consumers provided by the BLS (https://www.bls.gov/cpi/tables/supplemental-files/home.htm) and forecasted CPI values that we derive from forecasted year to year (specifically Q4 to Q4) percent changes in the CPI presented by the 2018 Economic Report of the President, (https://www.whitehouse.gov/wp-content/uploads/2018/.../ERP_2018_Final-FINAL.pdf, Table 8-1, column 4).
9 Schatzki and Stavins (2018) provide a discussion of these market failures. For a related discussion, focusing on renewable energy technologies, see Gillingham, Kenneth and James Sweeney, “Market Failure and the Structure of Externalities”, In: Harnessing Renewable Energy, Boaz Moselle, Jorge Padilla, Richard Schmalensee (eds). RFF Press, 2019.
10 Of course, this approach is not without challenges. Uncertainty over which new technology will be the most cost-effective inevitably creates risk that the wrong technology is subsidized.
Transitioning to Long-Run Effective and Efficient Climate Policies
Analysis Group, Inc. Page 8
When implemented with efficient GHG pricing, such overlapping complementary policies may
provide limited environmental benefit, while having significant unintended consequences.11 When
implemented with GHG cap-and-trade, a complementary policy aimed at reducing GHG emissions
generally causes little (or no) additional GHG emissions reductions, as it simply shifts emissions among
sources covered by the cap, without effecting the cap’s stringency.12 However, while leaving emissions
unaffected, such a complementary policy generally raises costs by shifting emission reduction efforts to
more costly actions proscribed by the complementary policy.13 Moreover, such a policy will tend to depress
cap-and-trade allowance prices,14 thus diluting the magnitude of the GHG price signal,15 which is
particularly problematic for inducing technological change. Schatzki and Stavins (2018) analyze
California’s GHG cap-and-trade and Low Carbon Fuel Standard policies, finding that, relative to cap-and-
trade alone, the LCFS actually increased GHG emissions (because of induced increases in out-of-state
emissions) and raised costs by over $700 million from 2013 to 2017.
In practice, it may be difficult to distinguish between complementary policies addressing non-GHG
market failures and those simply seeking emission reductions from sources already covered by GHG
pricing. All GHG measures, including GHG pricing and standards aimed at reducing emissions, such as
RPS and LCFS, create financial incentives for private firms (entrepreneurs) to increase investment in energy
research and development (R&D). Thus, advocates of sector- or technology-specific standards often argue
that they are intended to achieve technology change needed to reduce emissions.16 In these cases, the
11 For a general discussion of policy interactions, see Schatzki, Todd and Robert N. Stavins, “Implications of Policy Interactions for California’s Climate Policy” (with Robert N. Stavins), Regulatory Policy Program, Mossavar-Rahmani Center for Business and Government, Harvard Kennedy School, August 27, 2012.
12 As we show in Schatzki and Stavins (2018), emissions can increase or decrease when complementary policies overlap partially with the cap-and-trade system. For example, California’s LFCS covers lifecycle emissions that include sources under California’s cap-and-trade system and also some outside the system. In fact, the LCFS has increased emissions because of induced change in emissions outside the state.
13 A complementary policy may be non-binding, in which case it has no effect on costs.
14 Cap-and-trade design can incorporate mechanisms to mitigate the downward impact of complementary policies on GHG price levels. However, these designs do not mitigate the other inefficiencies associated with inefficient complementary policies. Burtraw, Dallas, et al., “Quantities with Prices,” Resources for the Future Working Paper 18-08, March 2018.
15 Interactions between complementary policies and a GHG tax differ from those between complementary policies and cap-and-trade. When implemented with GHG taxes, complementary policies aimed at reducing GHG emissions may achieve additional emission reductions, although these reductions occur at (marginal) costs greater than the GHG tax. If the GHG tax is set at the efficient level, additional emission reductions would achieve negative net benefits (that is, benefits less than costs).
16 For example, the California Air Resources Board (CARB) has stated: “Since 2011, the LCFS has been a cornerstone of California’s effort to reduce greenhouse gas (GHGs) emissions and has spurred innovation in low-carbon transportation fuels such as hydrogen, electricity and biodiesel” (CARB, “CARB amends Low Carbon Fuel Standard for wider impact,” September 27, 2018); “The LCFS is an important tool in California’s efforts to reduce the impacts of climate change by spurring innovation in an array of cleaner fuels” (CARB, “Air Resources Board readopts Low Carbon Fuel Standard,” July 19, 2017). Other researchers have similarly focused on the LCFS as a policy to induce technological innovation and investment in new technologies, including Farrell, Alexander E. and Daniel Sperling, “A Low-Carbon Fuel Standard for California Part 1: Technical Analysis", Institute of Transportation Studies, UC
Transitioning to Long-Run Effective and Efficient Climate Policies
Analysis Group, Inc. Page 9
relevant question becomes whether these measures address underinvestment in technology development in
the most efficient way, or whether alternatives would more effectively direct society’s resources toward
advanced technology development.
B. Current Policy Mixes
National and sub-national governments have taken multiple paths in developing climate policies.
Within the United States, faced with less federal leadership on climate policy, some states have sought to
develop their own policies, often in coordination with other states (and Canadian provinces). These state
climate initiatives often seem to take a “belt and suspenders” approach that includes a suite of policies
targeting different activities that generate GHG emissions. These measures include GHG pricing through
taxes and/or cap-and trade; prohibitions on certain technologies (for example, coal-fired generation); sector-
specific and technology-specific performance standards, such as Renewable Portfolio Standards (RPS) and
Low Carbon Fuel Standards (LCFS); technology subsidies; low-GHG resource procurements (for example,
multi-year contracts for wind resources); and various means to support R&D.
The set of policies adopted by Oregon provides one example of a mix of measures a given state
may take to reduce GHG emissions:
Clean Fuels Program (CFP). The Clean Fuels Program is a version of an LCFS, that is, a standard
designed to lower the carbon-intensity of transportation fuels. The CFP requires reductions in the
average fuel carbon-intensity below a baseline level. As regulated by the program, carbon-intensity
reflects “life-cycle” emissions including tail pipe emissions, emissions sequestered in the process
of growing fuel crops (for renewable fuels), and emissions created during fuel production. Fuel
suppliers can comply with the standard by selling a mix of fuels with an average carbon-intensity
below the cap (that is, by “over-complying”), or by purchasing credits generated by suppliers that
have over-complied with the standard. The program was implemented in 2016.
Renewable Portfolio Standard (RPS). Oregon’s RPS requires that 50 percent of electric power
used in the state be generated from renewable sources of electricity by 2040. Renewable energy
sources include technologies such as wind power, solar power, geothermal power, small
hydropower, certain biomass products, and power generated with landfill gas.
Oregon Renewable Fuel Standards. Oregon’s Renewable Fuel Standards require that fuels sold
in the state include 10 percent ethanol in gasoline and 5 percent biodiesel in diesel fuel.17
Sustainable Transportation Initiative.18 This is an integrated statewide effort to reduce GHG
emissions from the transportation sector, and it includes several components: a Statewide
Transportation Strategy, GHG emission reduction targets for metropolitan areas, land use and
transportation-scenario planning guidelines, and tools that support local governments in reaching
their emissions-reduction goals.
Berkeley, May 29, 2007, and Parson, Edward et al., “Controlling Greenhouse Gas Emissions from Transport Fuels: The Performance and Prospect of California’s Low Carbon Fuel Standard,” Pritzker Brief No. 10, June 2018.
17 Oregon Department of Environmental Quality, Clean Fuels Programs, Policies and Partnerships: https://www.oregon.gov/deq/aq/programs/Pages/Clean-Fuels-More.aspx.
18 https://www.oregon.gov/ODOT/Programs/Pages/OSTI.aspx.
Transitioning to Long-Run Effective and Efficient Climate Policies
Analysis Group, Inc. Page 10
Coal-to-Clean Law. This law requires the state’s electric utilities to eliminate coal-fired electricity
from their mix of energy generation by 2030.
Energy Trust of Oregon. The Energy Trust of Oregon provides information, cash incentives, and
technical assistance to help Oregon utility customers invest in energy-saving or renewable energy
projects. Its services and support are available to both residential and commercial customers. The
Trust is funded by charges included in electric and natural gas utility customer bills.
The State is now contemplating the adoption of a GHG cap-and-trade program, which would
provide a foundation for more effective and efficient long-run climate policy. As it does so, the State can
also consider whether adjustments to existing policies or the introduction of new policies might better
position the State to transition to more effective and efficient policies in the long run. Such benefits may
spill over to other governments (national or sub-national), which may draw lessons from Oregon’s
experiences with the evolution of its climate policy.
C. Barriers to Efficient Long-Run Climate Policies
If we know which initiatives provide for a long-run efficient climate change policy, why wait to
implement those policies? The simple answer is politics, while a more nuanced answer acknowledges that
over time we continue to learn about policies’ effectiveness in addressing many aspects of the climate
problem, particularly barriers to developing low-GHG technologies.
Political realities may not support the immediate adoption of climate policies that rely on
sufficiently high (efficient) GHG pricing.19 Some may oppose climate policies, per se, which is a barrier
to any climate policy. To the extent that more efficient policies can lower costs, such opposition may be
diminished by adopting these more efficient policies. Others oppose GHG pricing policies because of their
apparent cost or association with “taxes” and government actions. Such opposition reflects many factors,
including misperceptions of the underlying economics, concern about the incidence of the policy (that is,
who pays), and concern about how GHG pricing revenues will be used.
Thus, when GHG pricing is adopted, the resulting price levels are often well below the social cost
of carbon or price levels that would be needed to achieve the emission targets sought by legislators. Instead,
states (and other local governments) often pursue the “belts and suspenders” approach through a “suite” of
policies targeting many of the activities that cause GHG emissions. This approach is often more politically
expedient, as it offers the possibility of addressing climate change while at least partially hiding the costs.20
However, as state climate policy targets become increasing ambitious, this approach may become
less effective at achieving desired emission reductions, and the costs associated with inefficient
19 Other factors may contribute, such as emission and economic leakage if there are large differences in GHG prices between jurisdictions. More generally, on climate policy “sequencing”, see: Meckling, Jonas, Thomas Sterner and Gernot Wagner, “Policy sequencing toward decarbonization,” Nature Energy, November 2017; Pahle, Michael, et al., “What Stands in the Way Becomes the Way, Sequencing in Climate Policy to Ratchet Up Stringency Over Time,” Resources for the Future Report, June 2017.
20 Some argue that this approach may provide other political benefits, such as building constituencies to support subsequent, more stringency policies.
Transitioning to Long-Run Effective and Efficient Climate Policies
Analysis Group, Inc. Page 11
complementary policies may become greater, further undermining political viability. Moreover, measures
that establish preferences for particular technologies create financial incentives for the private suppliers of
these technologies to advocate for perpetuation of the policies, even if they are no longer warranted.21 Such
“rent-seeking” is particularly evident in current policies targeting development of specific technologies.22
For example, rooftop solar companies advocate for perpetuation of net metering policies and other subsidies
that lower the costs of rooftop solar, while ethanol producers advocate for perpetuation of the federal
Renewable Fuel Standard, which subsidizes the production of eligible fuels.23 As we discuss in Section
II.C, appropriate policy design can reduce these incentives. For example, subsidies for rooftop solar in the
California Solar Initiative gradually declined according to pre-set schedules, thus providing an initial
incentive to help early deployment of rooftop solar in California, while eliminating the incentives after the
technology had crossed hurdles to commercialization.
Decisions about the use of revenues from GHG pricing policies (tax revenues or auction revenues
in cap-and-trade systems) are also key to political willingness to adopt GHG pricing. The implications of
revenue use for political viability are complex, as political constituencies differ in their view about the best
use of GHG pricing revenues. Some constituencies are generally opposed to any new policies that enlarge
government coffers; for these groups, transparent mechanisms that return revenues directly to citizens, such
as rebate checks, may reduce their opposition to GHG pricing. Other constituencies supportive of more
direct regulation may wish to direct GHG revenues to efforts to reduce GHG emissions. Such spending
can be beneficial if targeted at emissions not covered by GHG pricing and at non-GHG market failures,
such as underinvestment in low-GHG R&D. If spent simply to reduce emissions covered by GHG pricing,
then such spending will likely create distortions.
While decisions about revenue use have significant impacts on the costs of achieving climate goals,
these decisions may also lower political barriers to GHG cap-and-trade systems if revenue uses can defuse
arguments grounded in opposition to new taxes. For example, making a GHG cap-and-trade system
revenue-neutral through transparent return of revenues to citizens may address concerns that the policy is,
21 Meckling, Jonas, Thomas Sterner and Gernot Wagner, “Policy sequencing toward decarbonization,” Nature Energy, November 2017; Pahle, Michael, et al., “What Stands in the Way Becomes the Way, Sequencing in Climate Policy to Ratchet Up Stringency Over Time,” Resources for the Future Report, June 2017.
22 The value of investments made by firms in supplying technologies used to comply with an inefficient complementary policy may diminish if reliance is reduced on that policy. A gradual transition can diminish potential reduction in value, if any. However, any loss in value may also be diminished if the technology is induced by GHG pricing or other policies. For example, certain fuels used to comply with Oregon’s CFP may also be induced by Oregon’s existing renewable fuels standards or GHG cap-and-trade. Moreover, if Oregon were to exclude certain biofuels from GHG cap-and-trade compliance, as is the case in California, this would also induce increased consumption.
23 State regulators often allow residential households to “sell back” electricity generated through rooftop solar, an approach characterized as “net metering.” This subsidizes households installing rooftop solar at the expense of other customers, because customers without rooftop solar must bear a disproportionate share of the utility’s fixed costs of operation. However, altering rate structures to account for these cross-subsidies has led to large public battles with well-capitalized interests supporting indefinite continuation of net metering policies. Moot, John, “Subsidies, Climate Changes, Electric Markets and the FERC,” Energy Law Journal 35:345-374, 2014.
Transitioning to Long-Run Effective and Efficient Climate Policies
Analysis Group, Inc. Page 12
in effect, a new tax, while directing some funds to R&D efforts may mitigate underinvestment in efforts to
develop advanced low-GHG technology.
II. OPTIONS FOR TRANSITIONING TO MORE EFFICIENT LONG-RUN CLIMATE
POLICIES
Given typical political circumstances, policymakers seeking to develop efficient long-run climate
policies must consider the evolution of climate policies over time. This evolution may include a sequential
process that adds new (and possibly subtracts existing) policies over time, and that adjusts the relative
stringency of policies to achieve a more effective policy portfolio.
At present, climate policies typically rely too little on GHG pricing, too much on standards aimed
at technology adoption in particular sectors, and too little on addressing certain non-GHG market failures,
particularly underinvestment in R&D of advanced low-GHG technologies.24 While immediate adoption of
high GHG prices may not be politically feasible, policy design can facilitate the transition to greater reliance
on GHG pricing over time and greater attention to non-GHG market failures, as appropriate. Transitioning
to more efficient long-run climate policies potentially will involve several steps:
1. Develop (or enhance) market-based GHG prices. Policies must first be developed that
establish GHG pricing. Initially, price levels may be relatively low to acclimate individuals
and firms to the use of GHG pricing. Thus, initial prices may be below the economically
efficient level (for example, below the social cost of carbon).
Over time, reliance on GHG pricing can be increased by setting more ambitious emission
reductions targets and/or reducing the stringency of complementary policies that tend to
depress GHG prices.
GHG pricing policies need to determine how revenues from GHG taxes or allowance auctions
are used. Revenues can be used to lower economic costs, while also addressing political
realities. Opposition to GHG pricing may reflect both direct resistance from particularly
affected industries or individuals and broad opposition to new sources of government revenue
(that is, opposition to “taxes”). Options that “rebate” revenues transparently may mitigate
perceptions about government use of GHG revenues. However, other options, such as reducing
other distortionary taxes (e.g., income taxes), may reduce climate policy costs.25
2. Eliminate or phase out complementary policies designed largely (if not exclusively) to achieve GHG emission reductions. These so-called complementary policies generally raise
24 For example, American Energy Innovation Council, Restoring American Energy Innovation Leadership, Report Card, Challenges, and Opportunities, February 2015; National Academy of Sciences, The Power of Change: Innovation for Development and Deployment of Increasingly Clean Electric Power Technologies, Washington, DC: National Academies Press, 2016, available at http://nap.edu/21712 (“NAS 2016”). 25 See, Stavins, Robert N. and Todd Schatzki, “Using the Value of Allowances from California’s GHG Cap-and-Trade System” (with Robert N. Stavins), Regulatory Policy Program, Mossavar-Rahmani Center for Business and Government, Harvard Kennedy School, August 27, 2012.
Transitioning to Long-Run Effective and Efficient Climate Policies
Analysis Group, Inc. Page 13
the cost of emission reductions and depress cap-and-trade prices. Over time, tapering off (and
eventually eliminating) these policies shifts the burden of achieving emission reductions to
GHG pricing, while also raising allowance prices to create broader incentives to achieve
emission reductions.
3. Develop or strengthen efficient and effective complementary policies to target emissions not covered by GHG pricing and address non-GHG market failures. With cap-and-trade in place,
some complementary policies can continue to support environmental goals while enhancing
economic efficiency. These policies include measures that target emissions outside the cap of
the cap-and-trade system and measures that address non-GHG market failures. Given the need
for advanced, low-GHG technologies to address climate change, policies that address
underinvestment in R&D due to innovation spillovers are essential for long-run efficient
climate policy. Policies that address other market failures (for example, information, incentive,
and behavioral problems) can also be important additions to efficient policy portfolios.
These transitions should account for characteristics of and interactions between these policies that
affect economic and political outcomes. Some policies can compete with one another for government
funding, while others can create revenues sources to potentially support new initiatives. Some policies can
draw attention to government efforts to mitigate GHG emissions, while others are more hidden. Some
policies create a small group of beneficiaries that may lobby for their perpetuation, while others create more
diffuse beneficiaries.
To illustrate the various aspects of such transitions, we consider two important cases. First, we
consider the transition between a cap-and-trade program and a complementary policy that targets reductions
in emissions under the cap. Through stylized analysis, we illustrate the tradeoffs between a newly proposed
cap-and-trade system in Oregon and the state’s current Clean Fuel Program, which provides incentives to
reduce the carbon-intensity of transportation fuels. Second, we consider developing (or enhancing) policies
to address non-GHG market failures. Specifically, we consider policy options to develop or expand R&D
for low-GHG technologies.
A. Transition from Complementary Policy to GHG Pricing: Illustration with
Oregon’s GHG Cap-and-Trade and Clean Fuel Program
Faced with a gap between current policies and a long-run efficient policy, governments have several
options.
First, gradually reduce the stringency of complementary policies targeting GHG emission reductions. Under this approach, the stringency of the complementary policy is reduced, while GHG
pricing is enacted or remains in place. While the complementary policy remains partially in place,
complying with it becomes less costly, until the policy itself is no longer binding. At this point, actions
needed to comply with the complementary policy are being taken due to incentives from GHG pricing.
Second, sunset complementary policies targeting GHG emission reductions. Under this
approach, the complementary policy is set to be terminated at a pre-determined future date. In the interim
period, the policy remains in effect as currently designed, or under modified scope or stringency. Of course,
reduced stringency and sun-setting can be combined to arrive at an alternative transition that combines both
effects.
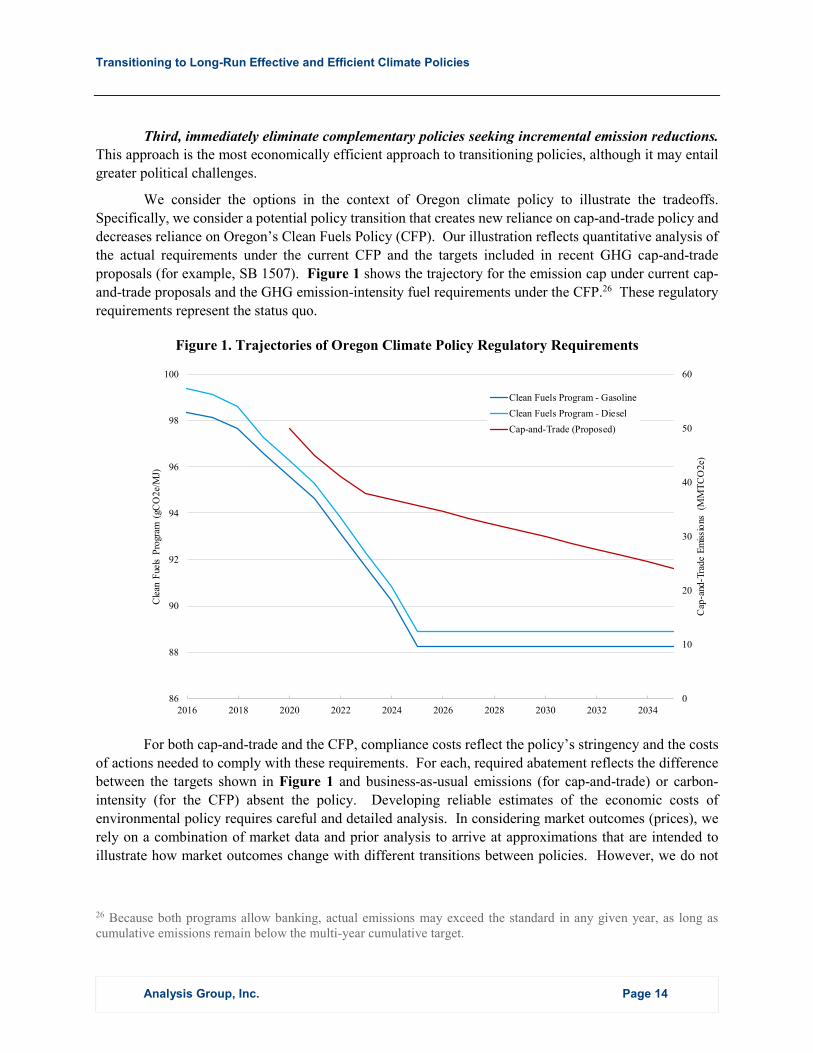
Transitioning to Long-Run Effective and Efficient Climate Policies
Analysis Group, Inc. Page 14
Third, immediately eliminate complementary policies seeking incremental emission reductions. This approach is the most economically efficient approach to transitioning policies, although it may entail
greater political challenges.
We consider the options in the context of Oregon climate policy to illustrate the tradeoffs.
Specifically, we consider a potential policy transition that creates new reliance on cap-and-trade policy and
decreases reliance on Oregon’s Clean Fuels Policy (CFP). Our illustration reflects quantitative analysis of
the actual requirements under the current CFP and the targets included in recent GHG cap-and-trade
proposals (for example, SB 1507). Figure 1 shows the trajectory for the emission cap under current cap-
and-trade proposals and the GHG emission-intensity fuel requirements under the CFP.26 These regulatory
requirements represent the status quo.
Figure 1. Trajectories of Oregon Climate Policy Regulatory Requirements
For both cap-and-trade and the CFP, compliance costs reflect the policy’s stringency and the costs
of actions needed to comply with these requirements. For each, required abatement reflects the difference
between the targets shown in Figure 1 and business-as-usual emissions (for cap-and-trade) or carbon-
intensity (for the CFP) absent the policy. Developing reliable estimates of the economic costs of
environmental policy requires careful and detailed analysis. In considering market outcomes (prices), we
rely on a combination of market data and prior analysis to arrive at approximations that are intended to
illustrate how market outcomes change with different transitions between policies. However, we do not
26 Because both programs allow banking, actual emissions may exceed the standard in any given year, as long as cumulative emissions remain below the multi-year cumulative target.
0
10
20
30
40
50
60
86
88
90
92
94
96
98
100
2016 2018 2020 2022 2024 2026 2028 2030 2032 2034C
ap-a
nd-T
rade
Em
issi
ons
(M
MT
CO
2e)
Cle
an F
uels
Pro
gram
(gC
O2e
/MJ)
Clean Fuels Program - Gasoline
Clean Fuels Program - Diesel
Cap-and-Trade (Proposed)
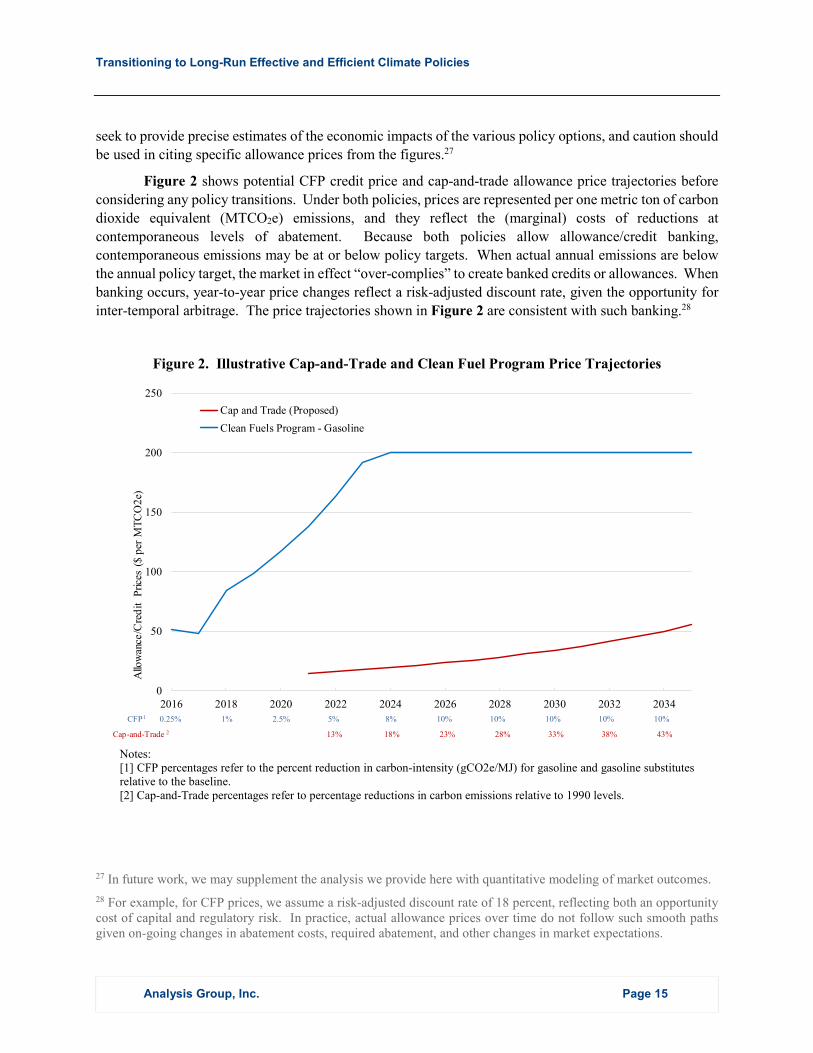
Transitioning to Long-Run Effective and Efficient Climate Policies
Analysis Group, Inc. Page 15
seek to provide precise estimates of the economic impacts of the various policy options, and caution should
be used in citing specific allowance prices from the figures.27
Figure 2 shows potential CFP credit price and cap-and-trade allowance price trajectories before
considering any policy transitions. Under both policies, prices are represented per one metric ton of carbon
dioxide equivalent (MTCO2e) emissions, and they reflect the (marginal) costs of reductions at
contemporaneous levels of abatement. Because both policies allow allowance/credit banking,
contemporaneous emissions may be at or below policy targets. When actual annual emissions are below
the annual policy target, the market in effect “over-complies” to create banked credits or allowances. When
banking occurs, year-to-year price changes reflect a risk-adjusted discount rate, given the opportunity for
inter-temporal arbitrage. The price trajectories shown in Figure 2 are consistent with such banking.28
Figure 2. Illustrative Cap-and-Trade and Clean Fuel Program Price Trajectories
Notes: [1] CFP percentages refer to the percent reduction in carbon-intensity (gCO2e/MJ) for gasoline and gasoline substitutes relative to the baseline. [2] Cap-and-Trade percentages refer to percentage reductions in carbon emissions relative to 1990 levels.
27 In future work, we may supplement the analysis we provide here with quantitative modeling of market outcomes.
28 For example, for CFP prices, we assume a risk-adjusted discount rate of 18 percent, reflecting both an opportunity cost of capital and regulatory risk. In practice, actual allowance prices over time do not follow such smooth paths given on-going changes in abatement costs, required abatement, and other changes in market expectations.
0
50
100
150
200
250
2016 2018 2020 2022 2024 2026 2028 2030 2032 2034
Allo
wan
ce/C
red
it P
rices
($
per
MT
CO
2e)
Allowance Price Trajectory for Cap-and-Trade and Clean Fuel Program (CFP) in Oregon
Cap and Trade (Proposed)
Clean Fuels Program - Gasoline
CFP1 0.25% 1% 2.5% 5% 8% 10% 10% 10% 10% 10%
Cap-and-Trade 2 13% 18% 23% 28% 33% 38% 43%
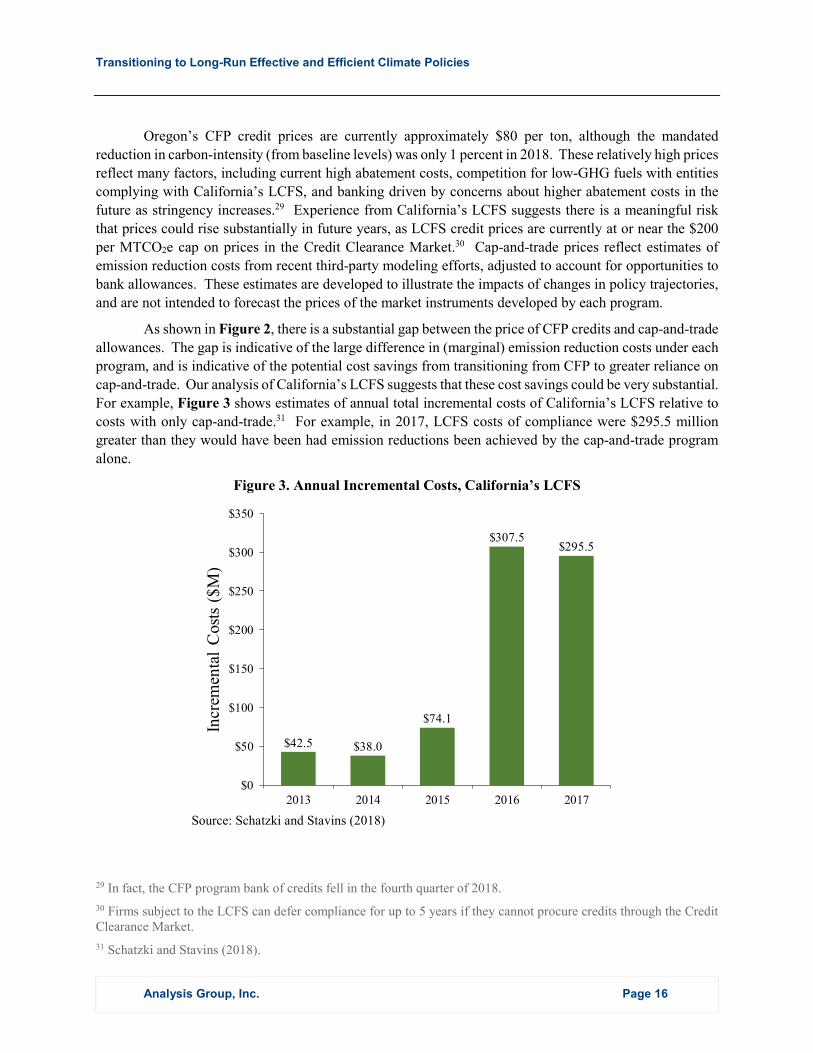
Transitioning to Long-Run Effective and Efficient Climate Policies
Analysis Group, Inc. Page 16
Oregon’s CFP credit prices are currently approximately $80 per ton, although the mandated
reduction in carbon-intensity (from baseline levels) was only 1 percent in 2018. These relatively high prices
reflect many factors, including current high abatement costs, competition for low-GHG fuels with entities
complying with California’s LCFS, and banking driven by concerns about higher abatement costs in the
future as stringency increases.29 Experience from California’s LCFS suggests there is a meaningful risk
that prices could rise substantially in future years, as LCFS credit prices are currently at or near the $200
per MTCO2e cap on prices in the Credit Clearance Market.30 Cap-and-trade prices reflect estimates of
emission reduction costs from recent third-party modeling efforts, adjusted to account for opportunities to
bank allowances. These estimates are developed to illustrate the impacts of changes in policy trajectories,
and are not intended to forecast the prices of the market instruments developed by each program.
As shown in Figure 2, there is a substantial gap between the price of CFP credits and cap-and-trade
allowances. The gap is indicative of the large difference in (marginal) emission reduction costs under each
program, and is indicative of the potential cost savings from transitioning from CFP to greater reliance on
cap-and-trade. Our analysis of California’s LCFS suggests that these cost savings could be very substantial.
For example, Figure 3 shows estimates of annual total incremental costs of California’s LCFS relative to
costs with only cap-and-trade.31 For example, in 2017, LCFS costs of compliance were $295.5 million
greater than they would have been had emission reductions been achieved by the cap-and-trade program
alone.
Figure 3. Annual Incremental Costs, California’s LCFS
Source: Schatzki and Stavins (2018)
29 In fact, the CFP program bank of credits fell in the fourth quarter of 2018.
30 Firms subject to the LCFS can defer compliance for up to 5 years if they cannot procure credits through the Credit Clearance Market.
31 Schatzki and Stavins (2018).
$42.5 $38.0
$74.1
$307.5$295.5
$0
$50
$100
$150
$200
$250
$300
$350
2013 2014 2015 2016 2017
Incr
emen
tal
Cos
ts (
$M
)
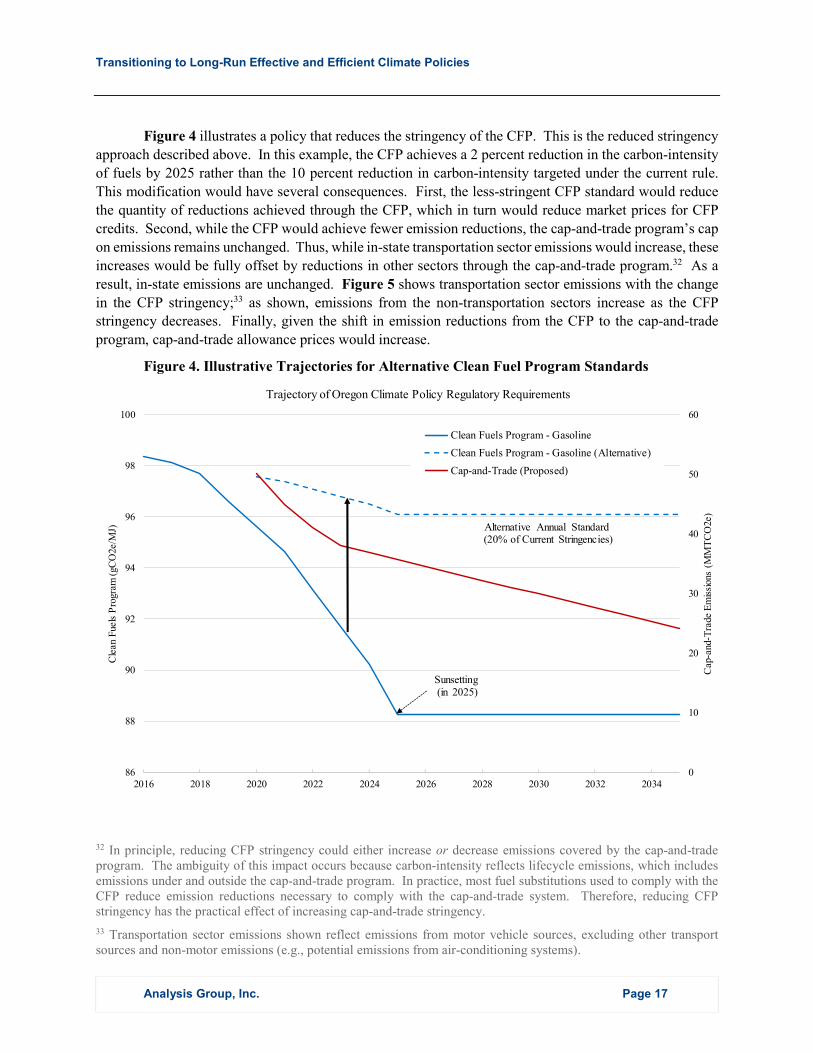
Transitioning to Long-Run Effective and Efficient Climate Policies
Analysis Group, Inc. Page 17
Figure 4 illustrates a policy that reduces the stringency of the CFP. This is the reduced stringency
approach described above. In this example, the CFP achieves a 2 percent reduction in the carbon-intensity
of fuels by 2025 rather than the 10 percent reduction in carbon-intensity targeted under the current rule.
This modification would have several consequences. First, the less-stringent CFP standard would reduce
the quantity of reductions achieved through the CFP, which in turn would reduce market prices for CFP
credits. Second, while the CFP would achieve fewer emission reductions, the cap-and-trade program’s cap
on emissions remains unchanged. Thus, while in-state transportation sector emissions would increase, these
increases would be fully offset by reductions in other sectors through the cap-and-trade program.32 As a
result, in-state emissions are unchanged. Figure 5 shows transportation sector emissions with the change
in the CFP stringency;33 as shown, emissions from the non-transportation sectors increase as the CFP
stringency decreases. Finally, given the shift in emission reductions from the CFP to the cap-and-trade
program, cap-and-trade allowance prices would increase.
Figure 4. Illustrative Trajectories for Alternative Clean Fuel Program Standards
32 In principle, reducing CFP stringency could either increase or decrease emissions covered by the cap-and-trade program. The ambiguity of this impact occurs because carbon-intensity reflects lifecycle emissions, which includes emissions under and outside the cap-and-trade program. In practice, most fuel substitutions used to comply with the CFP reduce emission reductions necessary to comply with the cap-and-trade system. Therefore, reducing CFP stringency has the practical effect of increasing cap-and-trade stringency.
33 Transportation sector emissions shown reflect emissions from motor vehicle sources, excluding other transport sources and non-motor emissions (e.g., potential emissions from air-conditioning systems).
0
10
20
30
40
50
60
86
88
90
92
94
96
98
100
2016 2018 2020 2022 2024 2026 2028 2030 2032 2034
Cap
-and
-Tra
de E
mis
sion
s (M
MT
CO
2e)
Cle
an F
uels
Pro
gram
(gC
O2e
/MJ)
Trajectory of Oregon Climate Policy Regulatory Requirements
Clean Fuels Program - Gasoline
Clean Fuels Program - Gasoline (Alternative)
Cap-and-Trade (Proposed)
Sunsetting(in 2025)
Alternative Annual Standard(20% of Current Stringencies)
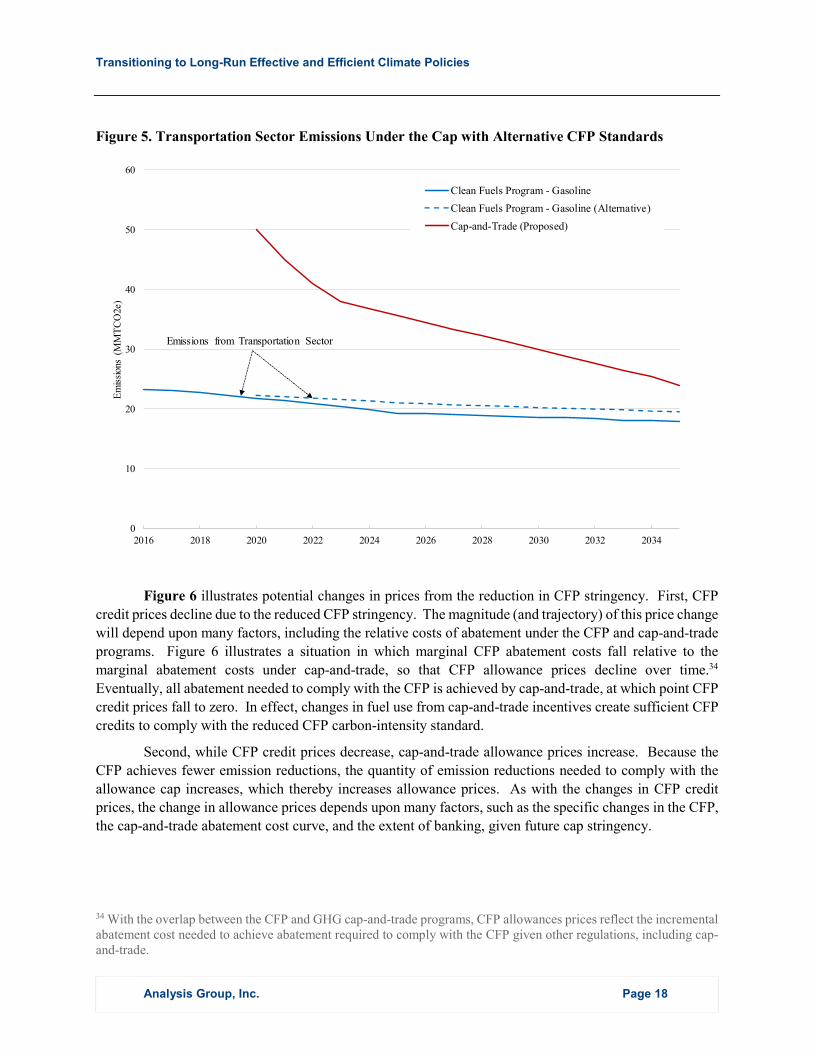
Transitioning to Long-Run Effective and Efficient Climate Policies
Analysis Group, Inc. Page 18
Figure 5. Transportation Sector Emissions Under the Cap with Alternative CFP Standards
Figure 6 illustrates potential changes in prices from the reduction in CFP stringency. First, CFP
credit prices decline due to the reduced CFP stringency. The magnitude (and trajectory) of this price change
will depend upon many factors, including the relative costs of abatement under the CFP and cap-and-trade
programs. Figure 6 illustrates a situation in which marginal CFP abatement costs fall relative to the
marginal abatement costs under cap-and-trade, so that CFP allowance prices decline over time.34
Eventually, all abatement needed to comply with the CFP is achieved by cap-and-trade, at which point CFP
credit prices fall to zero. In effect, changes in fuel use from cap-and-trade incentives create sufficient CFP
credits to comply with the reduced CFP carbon-intensity standard.
Second, while CFP credit prices decrease, cap-and-trade allowance prices increase. Because the
CFP achieves fewer emission reductions, the quantity of emission reductions needed to comply with the
allowance cap increases, which thereby increases allowance prices. As with the changes in CFP credit
prices, the change in allowance prices depends upon many factors, such as the specific changes in the CFP,
the cap-and-trade abatement cost curve, and the extent of banking, given future cap stringency.
34 With the overlap between the CFP and GHG cap-and-trade programs, CFP allowances prices reflect the incremental abatement cost needed to achieve abatement required to comply with the CFP given other regulations, including cap-and-trade.
0
10
20
30
40
50
60
2016 2018 2020 2022 2024 2026 2028 2030 2032 2034
Em
issi
ons
(MM
TC
O2e
)
Clean Fuels Program - Gasoline
Clean Fuels Program - Gasoline (Alternative)
Cap-and-Trade (Proposed)
Emissions from Transportation Sector
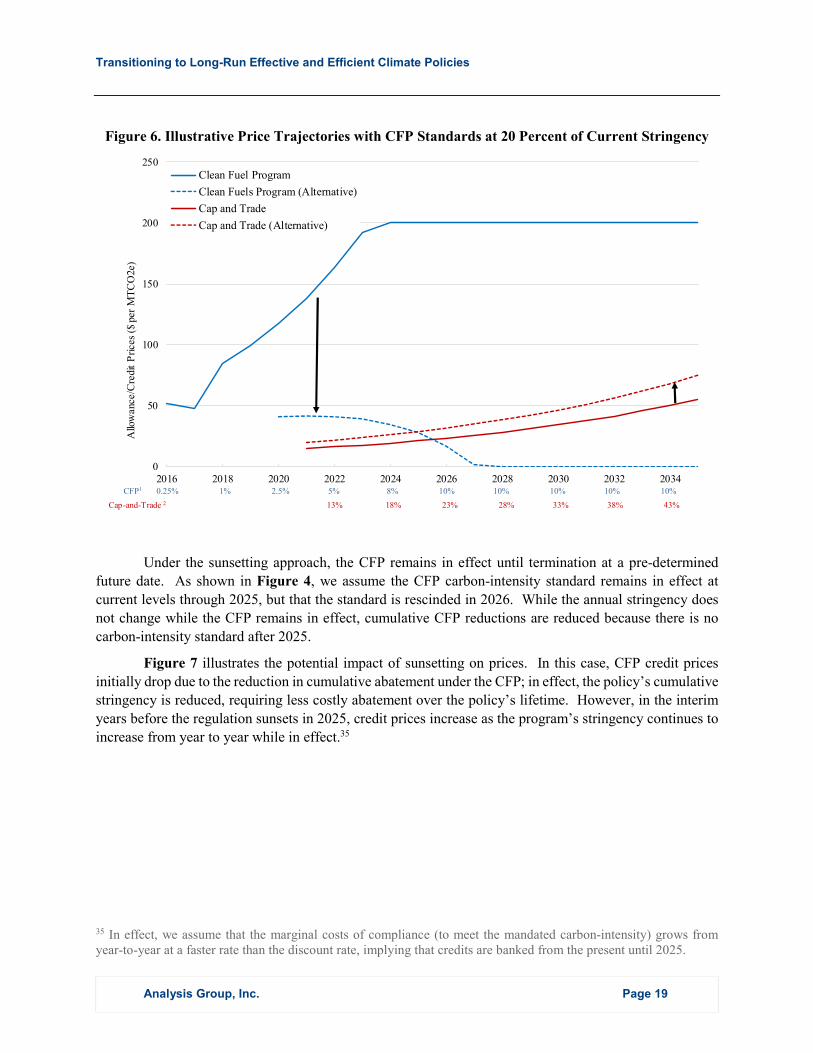
Transitioning to Long-Run Effective and Efficient Climate Policies
Analysis Group, Inc. Page 19
Figure 6. Illustrative Price Trajectories with CFP Standards at 20 Percent of Current Stringency
Under the sunsetting approach, the CFP remains in effect until termination at a pre-determined
future date. As shown in Figure 4, we assume the CFP carbon-intensity standard remains in effect at
current levels through 2025, but that the standard is rescinded in 2026. While the annual stringency does
not change while the CFP remains in effect, cumulative CFP reductions are reduced because there is no
carbon-intensity standard after 2025.
Figure 7 illustrates the potential impact of sunsetting on prices. In this case, CFP credit prices
initially drop due to the reduction in cumulative abatement under the CFP; in effect, the policy’s cumulative
stringency is reduced, requiring less costly abatement over the policy’s lifetime. However, in the interim
years before the regulation sunsets in 2025, credit prices increase as the program’s stringency continues to
increase from year to year while in effect.35
35 In effect, we assume that the marginal costs of compliance (to meet the mandated carbon-intensity) grows from year-to-year at a faster rate than the discount rate, implying that credits are banked from the present until 2025.
0
50
100
150
200
250
2016 2018 2020 2022 2024 2026 2028 2030 2032 2034
Allo
wan
ce/C
redi
t P
rice
s ($
per
MT
CO
2e)
Clean Fuel Program
Clean Fuels Program (Alternative)
Cap and Trade
Cap and Trade (Alternative)
CFP1 0.25% 1% 2.5% 5% 8% 10% 10% 10% 10% 10%
Notes:
Cap-and-Trade 2 13% 18% 23% 28% 33% 38% 43%
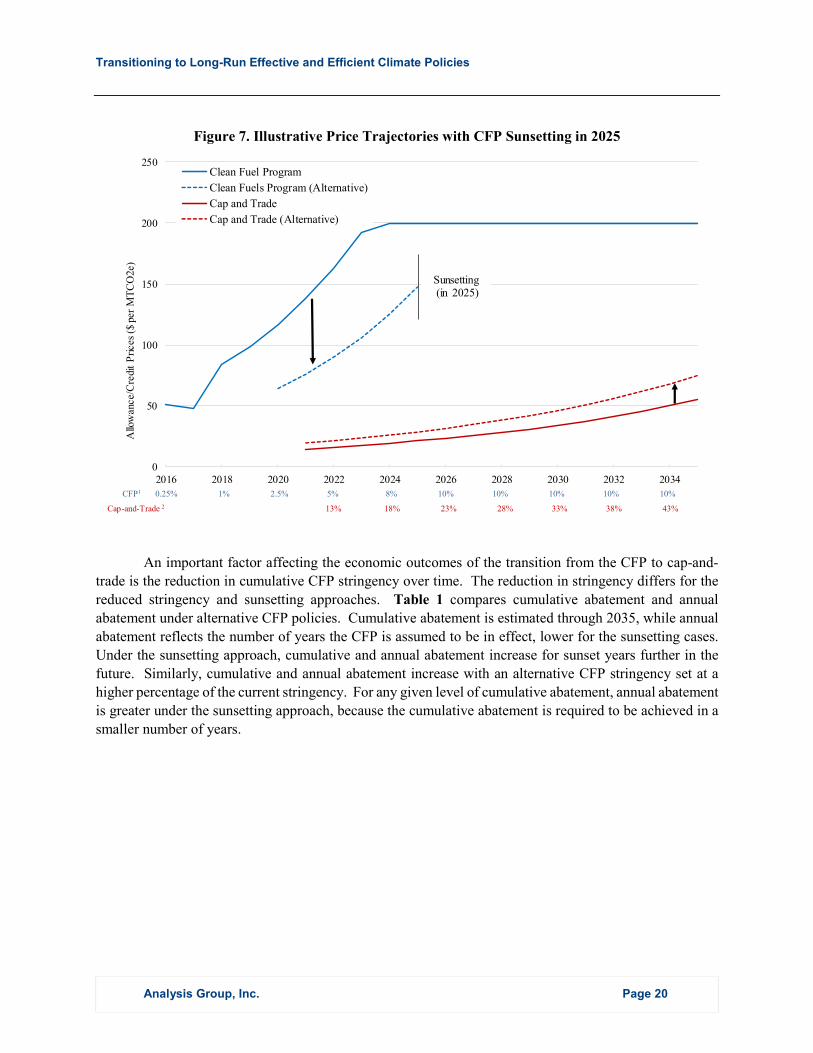
Transitioning to Long-Run Effective and Efficient Climate Policies
Analysis Group, Inc. Page 20
Figure 7. Illustrative Price Trajectories with CFP Sunsetting in 2025
An important factor affecting the economic outcomes of the transition from the CFP to cap-and-
trade is the reduction in cumulative CFP stringency over time. The reduction in stringency differs for the
reduced stringency and sunsetting approaches. Table 1 compares cumulative abatement and annual
abatement under alternative CFP policies. Cumulative abatement is estimated through 2035, while annual
abatement reflects the number of years the CFP is assumed to be in effect, lower for the sunsetting cases.
Under the sunsetting approach, cumulative and annual abatement increase for sunset years further in the
future. Similarly, cumulative and annual abatement increase with an alternative CFP stringency set at a
higher percentage of the current stringency. For any given level of cumulative abatement, annual abatement
is greater under the sunsetting approach, because the cumulative abatement is required to be achieved in a
smaller number of years.
0
50
100
150
200
250
2016 2018 2020 2022 2024 2026 2028 2030 2032 2034
Allo
wan
ce/C
redi
t P
rice
s ($
per
MT
CO
2e)
Clean Fuel Program
Clean Fuels Program (Alternative)
Cap and Trade
Cap and Trade (Alternative)
Sunsetting(in 2025)
CFP1 0.25% 1% 2.5% 5% 8% 10% 10% 10% 10% 10%
Cap-and-Trade 2 13% 18% 23% 28% 33% 38% 43%
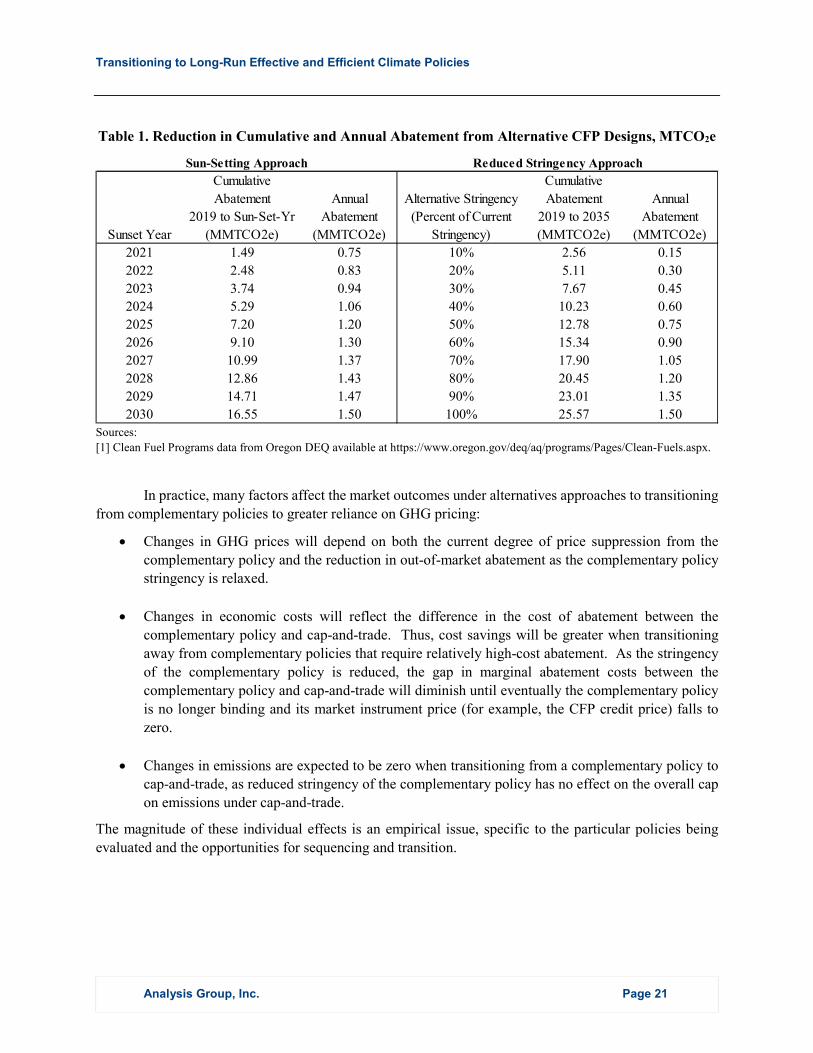
Transitioning to Long-Run Effective and Efficient Climate Policies
Analysis Group, Inc. Page 21
Table 1. Reduction in Cumulative and Annual Abatement from Alternative CFP Designs, MTCO2e
Sources:
[1] Clean Fuel Programs data from Oregon DEQ available at https://www.oregon.gov/deq/aq/programs/Pages/Clean-Fuels.aspx.
In practice, many factors affect the market outcomes under alternatives approaches to transitioning
from complementary policies to greater reliance on GHG pricing:
Changes in GHG prices will depend on both the current degree of price suppression from the
complementary policy and the reduction in out-of-market abatement as the complementary policy
stringency is relaxed.
Changes in economic costs will reflect the difference in the cost of abatement between the
complementary policy and cap-and-trade. Thus, cost savings will be greater when transitioning
away from complementary policies that require relatively high-cost abatement. As the stringency
of the complementary policy is reduced, the gap in marginal abatement costs between the
complementary policy and cap-and-trade will diminish until eventually the complementary policy
is no longer binding and its market instrument price (for example, the CFP credit price) falls to
zero.
Changes in emissions are expected to be zero when transitioning from a complementary policy to
cap-and-trade, as reduced stringency of the complementary policy has no effect on the overall cap
on emissions under cap-and-trade.
The magnitude of these individual effects is an empirical issue, specific to the particular policies being
evaluated and the opportunities for sequencing and transition.
Sun-Setting Approach Reduced Stringency Approach
Sunset Year
Cumulative
Abatement
2019 to Sun-Set-Yr
(MMTCO2e)
Annual
Abatement
(MMTCO2e)
Alternative Stringency
(Percent of Current
Stringency)
Cumulative
Abatement
2019 to 2035
(MMTCO2e)
Annual
Abatement
(MMTCO2e)
2021 1.49 0.75 10% 2.56 0.15
2022 2.48 0.83 20% 5.11 0.30
2023 3.74 0.94 30% 7.67 0.45
2024 5.29 1.06 40% 10.23 0.60
2025 7.20 1.20 50% 12.78 0.75
2026 9.10 1.30 60% 15.34 0.90
2027 10.99 1.37 70% 17.90 1.05
2028 12.86 1.43 80% 20.45 1.20
2029 14.71 1.47 90% 23.01 1.35
2030 16.55 1.50 100% 25.57 1.50
Transitioning to Long-Run Effective and Efficient Climate Policies
Analysis Group, Inc. Page 22
B. Transitions to Address Non-GHG Market Failures: Example of Under-
Investment in Low-GHG Technology Development
Effective and efficient long-run climate policy will include mitigation of non-GHG market failures
(affecting GHG emissions) through efficient policy measures. Developing such measures requires careful
assessment of the non-GHG market failures affecting GHG emissions, identification of potential policy
measures to mitigate those market failures, and assessment of which options provide the greatest net
benefits. We consider one particularly important market failure, underinvestment in research and
development into advanced low-GHG technologies. This market failure is important for several reasons.
First, research that lowers the cost of reducing GHG emissions can help other jurisdictions,
including other countries that face more severe economic constraints, to pursue GHG reductions to meet
more ambitious goals. The benefits of such positive technology spillovers may far exceed the benefits any
given country can produce by reducing its own emissions.36
Second, there is general agreement that there is under-investment in research and development into
advanced low-GHG technologies, particularly given the need for such advanced technologies to achieve
meaningful reductions in GHG emissions at reasonable costs.
Third, the transition away from sector- or technology-specific complementary policies toward
greater reliance on GHG pricing may reduce incentives for advanced technology development in the sectors
in which complementary policies are being relaxed. Creating or enhancing measures that focus directly on
low-GHG technologies may offset any decreases in incentives for advanced technology development.
Performance standards typically provide uniform incentives for GHG reductions irrespective of the
state of development of the technologies used to reduce emissions. Thus, these policies may promote
substantial technological innovation or simply lead to widespread deployment of existing technologies.
Other policy mechanisms better target financial incentives toward technology development. For example,
while California’s LCFS may promote technology development, as is argued by CARB, the overall program
cost is very high, on par with total federal spending on low-GHG energy technologies.37 Thus, a
reallocation of resources from California’s LCFS or Oregon’s CFP to measures that directly target R&D
incentives may create substantial efficiency gains.
Given our focus on Oregon’s CFP, we direct attention to market failures affecting the development
of advanced technologies in the transportation sector. Below, we discuss the market failures that limit the
development of low-GHG technologies, and then examine policy measures to address these market failures.
36 Fischer, Carolyn, “The Role of Technology Policies in Climate Mitigation,” Resources for the Future Issue Brief #09-08, July 2009 (“Fischer 2009”), p. 7.
37 Schatzki and Stavins (2018).
Transitioning to Long-Run Effective and Efficient Climate Policies
Analysis Group, Inc. Page 23
1. R&D Market Failures in the Transportation Sector
All GHG policies create incentives for private-sector investment in clean energy and energy
efficiency, with GHG taxes and cap-and-trade doing so by raising the effective price of GHGs.38 Indeed,
the lack of appropriate GHG prices—and the correspondingly low reward for reducing emissions—has
been the most important reason for underinvestment in this area. A number of additional market failures,
however, may slow investment in R&D and the deployment of new technologies. Because such
technologies can lower the overall cost of reducing GHG emissions, policies to address energy R&D market
failures should be part of an efficient portfolio of climate policies.39
Market failures affecting development of low-GHG technologies arise at different points in the
R&D process, which begins with basic research and continues with applied research, development and
practical demonstration, and ultimately adoption and diffusion of new technology.40 Below we provide an
overview of market failures that can affect transportation R&D at various stages.
a) Knowledge Spillovers
One of the major impediments to efficient levels of R&D is that investors are unable to capture the
full value of their innovations. One innovation may spur further innovations; new knowledge may “spill
over” to other firms. As a result, individual incentives to invest in R&D are lower than the societal rewards.
These mismatched incentives are the rationale for patents, which allow investors to capture a
greater portion of their innovations’ value. However, knowledge spillovers often create value beyond what
patents are able to protect, and thus private incentives for R&D may still be less than socially optimal levels.
While knowledge spillovers occur throughout the R&D process, they are most acute at the basic
research stage, leading to the greatest gap between private and social returns on investment.41 As the
rewards to basic research typically are far in the future, the incentives to conduct such research are less
likely to be preserved by limited-lifetime patents.42
38 Jaffe, Adam B., Richard G. Newell, and Robert N. Stavins, “Technology Policy for Energy and the Environment,” Innovation Policy and the Economy, Vol. 4, 2004 (“JNS 2004”), pp. 43-45, 49-50.
39 See Fischer, Carolyn, and Richard G. Newell, “Environmental and technology policies for climate mitigation,” Journal of Environmental Economics and Management, Vol. 55, 2008, pp. 142-162; Newell, Richard G., “The Role of Energy Technology Policy Alongside Carbon Pricing,” in Implementing a U.S. Carbon Tax: Challenges and Debates, 2015 (“Newell 2015”), p. 180; and Aldy, Joseph E., et al., “Designing Climate Mitigation Policy,” Journal of Economic Literature 48:4, 2010 (“Aldy et al. 2010”), p. 924.
40 See, for example, the NAS 2016, pp. 51-53; Newell 2015; Jaffe, Adam B., Richard G. Newell, and Robert N. Stavins, “Energy-Efficient Technologies and Climate Change Policies: Issues and Evidence,” Resources for the Future Climate Issue Brief No. 19, Dec. 1999 “Jaffe, Newell, and Stavins 1999”), pp. 8-10.
41 Aldy et al. 2010, p. 925.
42 Fischer 2009, p. 3.
Transitioning to Long-Run Effective and Efficient Climate Policies
Analysis Group, Inc. Page 24
b) Incomplete Information43
Another factor that may discourage investment in R&D is asymmetry between the information
available to investors and the information available to those actually performing the R&D. If investors’
ability to forecast a new technology’s potential profitability is poorer than that of scientists, engineers, and
firms undertaking R&D, then this lack of information creates an additional risk for investors. As
compensation for this risk, investors require a risk premium, which effectively pushes up the cost of R&D
and leads to underinvestment.44
c) Network Effects and Other Adoption Externalities
At the adoption phase, several factors may discourage the diffusion of new technologies. As
mentioned above, knowledge spillovers may continue beyond the research stage of the innovation process.
If firms can benefits from others’ learning-by-doing, then they will have an incentive to avoid some of the
costs and risks of introducing a technology by waiting for others to go first. The same phenomenon can
occur on the consumer side, with consumers putting off adoption of a new technology until others have
tried it and generated know-how through learning-by-using.45 Both learning-by-doing and learning-by-
using may slow the diffusion of a new technology.
Network externalities can also pose barriers to technology diffusion. Positive network externalities
arise when a technology’s value to consumers increases with its market penetration. A single telephone,
for example, is basically useless; the phone’s value arises from its ability to connect with a network of other
telephone users.
Network externalities can be a particularly significant barrier to the rollout of new transportation
technologies, as the usefulness of such technology to consumers can depend on an infrastructure network.
Gasoline-fueled cars, for example, derive much of their usefulness from the availability of filling stations
that sell gasoline.
Network effects can lock society into existing technologies compatible with infrastructure that is
already available. Where network externalities exist, alternatives to the existing technology face a “chicken-
and-egg” problem: the alternative is only useful to consumers if there is an infrastructure network to support
that technology, but the infrastructure network does not exist because consumers do not demand the
technology in the absence of the network.46
43 Low-GHG technologies also face substantial regulatory risk. Regulatory risks are particularly high for low-GHG technologies because, in effect, demand for these technologies depends on policies created by legislators and regulators. Without these policies, the low-GHG attribute of these technologies may have little value, absent independent demand from individual consumers or corporations.
44 Jaffe, Adam B., Richard G. Newell, and Robert N. Stavins, “A tale of two market failures: Technology and environmental policy,” Ecological Economics 54, 2005, pp. 167-168.
45 JNS 2004, p. 40. There is some evidence of learning-by-using in the adoption of hybrid vehicles. See Heutel, Garth, and Erich Muehlegger, “Consumer Learning and Hybrid Vehicle Adoption,” Environmental and Resource Economics62:1, 2015, pp. 125-161.
46 See, for example, JNS 2004, pp. 41-42.
Transitioning to Long-Run Effective and Efficient Climate Policies
Analysis Group, Inc. Page 25
A barrier to the diffusion of electric vehicles, for example, is the lack of an extensive network of
charging stations for drivers to rely on. Without a large fleet of electric vehicles that need charging stations,
however, there is insufficient incentive to construct charging stations. Similarly, there is little incentive for
filling stations to offer lower-GHG fuel blends if drivers do not demand them, but if those fuel blends are
not easily available, then consumers will shy away from purchasing the specially-designed engines required
to use many lower-GHG fuel blends.47
d) Behavioral Biases
Adoption and diffusion of new technologies may also be discouraged by consumer behavioral
biases and bounded rationality. Many energy-efficient technologies, for example, require an upfront
investment in exchange for lower energy costs in the following years. However, consumers may fail to
appropriately balance these future savings against up-front technology costs. For example, consumers may
place too much weight on the extra up-front cost of more efficient vehicles (that also emit fewer GHGs),
such as hybrids or electric vehicles, and too little weight on the subsequent fuel savings. Consequently,
some consumers who would be better off with a hybrid may instead opt for standard gas-powered cars.48
The existence of such behavioral biases among some consumers could also lower the overall demand for
energy-efficient technology and therefore reduce incentives to invest in clean-technology R&D.
2. Policies to Remedy R&D Market Failures in the Transportation
Sector
Multiple policy instruments are available to address R&D market failures in the transportation
sector. Below, we assess the tradeoffs among some of the options available to policymakers.
a) Support for Basic and Applied Research, Development, and
Practical Demonstration
Government financial support has the potential to bring about socially-beneficial research that
would not otherwise take place. This support can come in a number of forms, including:
47 See, for example, U.S. Energy Information Administration, “Biofuels: Ethanol and Biodiesel Explained,” August 8, 2018, available at https://www.eia.gov/energyexplained/index.php?page=biofuel_home; Gent, Edd, “New Biofuels Could Work in Regular Diesel Engines,” Scientific American, June 20, 2017, available at https://www.scientificamerican.com/article/new-biofuel-could-work-in-regular-diesel-engines.
48 The evidence is mixed as to whether such myopia affects vehicle purchase decisions. Some studies find that consumers undervalue the savings associated with better fuel efficiency, but this finding is sensitive to discount rate assumptions. See Allcott, Hunt, and Nathan Wozny, “Gasoline Prices, Fuel Economy, and the Energy Paradox,” Review of Economics and Statistics 96(5), 2014, pp. 779-195; Dreyfus, Mark K., and W. Kip Viscusi, “Rates of Time Preference and Consumer Valuations of Automobile Safety and Fuel Efficiency,” Journal of Law and Economics39(1), 1995, pp. 79-105; discussion in Parry, Ian W., Margaret Wells, and Winston Harrington, “Automobile Externalities and Policies,” Journal of Economic Literature 45, 2007; and Gerarden, Todd D., Richard G. Newell, and Robert N. Stavins, “Assessing the Energy-Efficiency Gap,” Journal of Economic Literature 55(4), 2017, p. 1509.
Transitioning to Long-Run Effective and Efficient Climate Policies
Analysis Group, Inc. Page 26
Direct funding of research in the public sector and research grants to non-profit, educational, and private institutions. Governments can, and do, finance research directly. Direct funding may
take the form of support for research within public institutions. The federal government, for
example, supports 17 national laboratories within the Department of Energy (DOE), which
undertake basic and applied research in a large number of areas related to clean energy (among
other topics).49 Funding may also take the form of grants to institutions, such as universities and
other non-profit entities. For example, DOE administers an extensive portfolio of research grants
open to applications from a variety of institution types.50 One of its grant programs is the Advanced
Research Projects Agency-Energy (ARPA-E), which provides short-term funding for projects that
parlay research into practical technology.51 State and local governments also fund some scientific
research, but such funding is currently small: as of 2015, nonfederal government spending
comprised only 0.1 percent of total U.S. spending on basic research and 0.3 percent of total U.S.
spending on applied research.52
Tax breaks for research outside the public sector. Governments may use tax incentives to lower
the effective cost of research. In the U.S., for example, the federal government introduced a
“Research and Experimentation” tax credit in 1981, which allows businesses to claim a portion of
their R&D expenditures as credits against their tax bills.53
Inducement prizes that offer a monetary reward for achieving a particular innovation. Whereas
direct funding and tax incentives provide support for R&D inputs, inducement prizes reward R&D
outcomes.54 Typically, an inducement prize specifies a goal and offers a monetary reward either
to the first entity that meets that goal (“first-past-the-post”) or the entity that meets that goal in the
best way in a pre-specified time period (“best-in-class” or “contest”).55 Inducement prizes may
49 U.S. Department of Energy, Office of Science, “Laboratories,” available athttps://science.energy.gov/laboratories.
50 See, for example, U.S. Department of Energy, Office of Science, “Funding Opportunity Announcements,” available at https://science.energy.gov/grants/foas/open.
51 See, for example, National Academies of Sciences, Engineering, and Medicine, An Assessment of ARPA-E, Washington, DC: National Academies Press, 2017, available at https://www.nap.edu/download/24778#, p. ix.
52 These figures reflect all U.S. R&D, not just clean-technology R&D. See National Science Board, “Science & Engineering Indicators 2018,” Tables 4-7 and 4-8, available athttps://www.nsf.gov/statistics/2018/nsb20181/data/appendix.
53 Until 2015, this tax credit was nominally temporary, but repeatedly extended; in 2015, it was made permanent. See, for example, U.S. Department of the Treasury, Office of Tax Analysis, “Research and Experimentation (R&E) Credit,” October 12, 2016, available at https://www.treasury.gov/resource-center/tax-policy/tax-analysis/Documents/RE-Credit.pdf.
54 Newell, Richard G., and Nathan E. Wilson, “Technology Prizes for Climate Change Mitigation,” Resources for the Future Discussion Paper 05-33, 2005, available at https://media.rff.org/documents/RFF-DP-05-33.pdf?_ga=2.235491459.36518121.1550503193-1451887737.1549321608 (“Newell and Wilson 2005”), p. 3.
55 Newell and Wilson 2005, pp. 33-34; National Research Council, Innovation Inducement Prizes at the National Science Foundation, Washington, DC: National Academies Press, 2007, available at https://www.nap.edu/download/11816, p. 5.
Transitioning to Long-Run Effective and Efficient Climate Policies
Analysis Group, Inc. Page 27
therefore be able to steer researchers’ efforts toward a particularly socially desirable scientific or
technological advancement.
Inducement prizes have a lengthy history in the transportation sector. One of the earliest known
uses, by the British government in the early 1700s, was to improve ship navigation via better
measurement of longitude.56 The use of inducement prizes has continued to encourage
transportation innovations since then, with privately-funded prizes offered for the first airplane
flight between New York and France57 and for the first private, reusable, manned vehicle capable
of reaching space;58 and with publicly-funded prizes offered for autonomous vehicle technology
(the famous DARPA Grand Challenge) and for certain innovations that could facilitate space travel
(the NASA Centennial Challenges).59 Inducement prizes have also been used to encourage
improvements in energy efficiency,60 and DOE has recently offered a number of clean-energy
prizes, such as the H2 Refuel H-Prize Competition for “small-scale hydrogen fueling”61 and the L
Prize for an LED bulb with the qualities of a 60-watt incandescent bulb.62
When contemplating support for clean-energy research, policymakers should compare the
advantages and disadvantages of funding R&D directly in the public and non-profit sectors versus
subsidizing R&D in the private sector. Direct funding allows policymakers to target advancements that
yield large social payoffs, such as technologies that supply public goods. Direct funding may also allow
policymakers to ensure continued work on socially beneficial research that might otherwise be difficult to
induce in the private sector, whether because knowledge spillovers are large, the timeline for profitability
is far off, or private investors’ institutional features (such as business models averse to capital-intensive
projects) discourage projects.63 In this sense, the ability to select projects to support may be desirable.
However, this responsibility also comes with disadvantages, as the private sector may have better
knowledge about the potential profitability of different technologies and may therefore be in a better
56 Newell and Wilson 2005, p. 14.
57 The $25,000 Orteig Prize was announced in 1919, and won by Charles Lindbergh in 1927. See Morgan, Jaison G., “Inducing Innovation Through Prizes,” Innovations, Fall 2008, available athttps://www.mitpressjournals.org/doi/pdf/10.1162/itgg.2008.3.4.105, pp. 105-106 and note 2.
58 In particular, the Ansari X-Prize offered $10 million to the first “privately financed […] spaceship capable of: [c]arrying 3 people [t]o 1000 Km about the Earth’s surface [t]wice within 2 weeks.” (Ansari X-Prize, “Launching a New Space Industry,” available at https://ansari.xprize.org/prizes/ansari.)
59 Newell and Wilson 2005, pp. 18-20.
60 Newell and Wilson 2005, p. 16.
61 U.S. Department of Energy, Hydrogen & Fuel Cells Program, “About the H-Prize,” available athttps://www.hydrogen.energy.gov/hprize.html.
62 See, for example, Whyte, Chelsea, “Philips Win L Prize, but the Race is Still on for a Better Bulb,” National Geographic News, August 5, 2011, available at https://news.nationalgeographic.com/news/energy/2011/08/110803-philips-led-light-bulb-wins-l-prize/.
63 See, for example, JNS 2004, p. 56.
Transitioning to Long-Run Effective and Efficient Climate Policies
Analysis Group, Inc. Page 28
position to allocate R&D efforts efficiently.64 Given these tradeoffs, the preferred strategy may involve a
mix of direct funding and tax incentives.
When policymakers have a clear sense of the particular innovation they wish to support, both direct
research funding and inducement prizes may be sensible options. Inducement prizes come with several
advantages. While they require policymakers to lay out a clear goal, they are agnostic about the means of
achieving it, meaning that policymakers do not have to bet on a particular technology, and innovators with
diverse ideas may cast their hats into the ring.65 As the prize is only awarded if the goal is achieved, the
government does not bear the risk associated with creative approaches.66 In some cases, incentive prizes
may therefore be able to bring about a particular level of innovation at a lower cost than research grants.67
On the downside, however, such prizes are not appropriate to all R&D challenges. They are workable only
for challenges that can be distilled cleanly into a goal that can be objectively judged.68
Long-term credibility is also important for the effectiveness of R&D tax incentives. As R&D may
only pay off on a relatively distant horizon, investors may not be particularly influenced by short-run tax
breaks or tax incentives whose long-run existence is uncertain.69 Such considerations should be taken into
account when devising tax policy to encourage innovation. Similar concerns apply to the creation of
inducement prizes, because without a credible guarantee that it will be paid out on the publicized terms, a
prize will be less effective in spurring investment in R&D. To protect a prize’s credibility against future
budget shortfalls or changes in political sentiment, policymakers may want to consider putting the prize
money in escrow or purchasing an insurance policy up-front to pay the prize money when it comes due.70
b) Interventions to Address Barriers to Adoption and Diffusion
At the adoption and diffusion stages of technological innovation, policy intervention may be useful
in addressing adoption externalities (such as network effects and knowledge spillovers from learning-by-
doing and learning-by-using), possible behavioral phenomena, and other impediments. Appropriate
intervention may help overcome, or hasten the overcoming of “chicken-and-egg” problems that discourage
transitions to cleaner technologies. Among the tools that policymakers might consider are:
Loans and loan guarantees to support clean-energy firms. As discussed above, information
asymmetries may increase the cost of borrowing to invest in innovative new technologies. More
generally, it may be difficult and expensive to secure funding to deploy new low-GHG
64 See, for example, JNS 2004, p. 57; Schatzki and Stavins 2015, p. 16.
65 Newell 2015, p. 185.
66 NAS 2016, p. 64.
67 Newell and Wilson 2005, p. 7.
68 Newell 2015, p. 185.
69 Newell 2015, p. 182.
70 Newell and Wilson 2005, pp. 22-23.
Transitioning to Long-Run Effective and Efficient Climate Policies
Analysis Group, Inc. Page 29
technologies: such technologies often lack a financial track record that banks use to evaluate risk,71
and often they also require a high capital intensity that conflicts with venture capital business
models.72 Given these challenges to securing funding, governments may consider subsidized loans
or loan guarantees for firms deploying new low-GHG technologies.
At the federal level, DOE’s Loans Program Office does precisely that. It provides loans and loan
guarantees to bridge the “commercial deployment funding gap” for emerging clean-energy and
clean-transportation technologies.73 Its Advanced Technology Vehicles Manufacturing (ATVM)
program, for example, provides loans to support the building and revamping of U.S. factories to
produce fuel-efficient, alternative-fuel, and electric vehicles, and associated infrastructure.74 The
ATVM program has provided loans to Tesla to support its Model S and Nissan to support its Leaf.75
There is a history of loan programs at the state level as well. In fact, Oregon has a State Energy
Loan Program (SELP) to provide low-interest loans for energy-efficiency, alternative-energy, and
alternative-fuel projects.76
Grants to support late-stage development, deployment, and adoption. Monetary grants are
another potential instrument to encourage desired deployment and adoption of clean-transportation
technologies. The Federal Transit Administration (FTA), for example, administers a Public
Transportation Innovation Program that offers grants for demonstration and deployment projects,77
and a Low or No Emission Vehicle Program that provides state and local governments with funding
71 U.S. Department of Energy, Loan Programs Office (LPO), “LPO Financial Performance,” November 2014, available at https://www.energy.gov/sites/prod/files/2014/11/f19/DOE-LPO-MiniReport_Final%2011%2013%2014_0.pdf (“LPO 2014”), p. 2.
72 See, for example, Ghosh, Shikhar, and Ramana Nanda, “Venture Capital Investment in the Clean Energy Sector,” Harvard Business School Working Paper 11-020, 2010, available athttps://www.hbs.edu/faculty/Publication%20Files/11-020_0a1b5d16-c966-4403-888f-96d03bbab461.pdf.
73 LPO 2014, p. 2.
74 U.S. Department of Energy, Loan Programs Office, “ATVM,” available at https://www.energy.gov/lpo/atvm (LPO, “ATVM”); U.S. Department of Energy, Loan Programs Office, “Eligibility for the Deployment and Manufacturing of Infrastructure for Alternative Fuel Vehicles and Electric Vehicles,” January 9, 2017, available athttps://www.energy.gov/sites/prod/files/2017/01/f34/FactSheet_Vehicle_Announcements_01_9_17.pdf.
75 LPO, “ATVM.”
76 SELP is not accepting applications at present. See Oregon Department of Energy, “Energy Loan Program,” available at https://www.oregon.gov/energy/incentives/pages/energy-loan-program.aspx; U.S. Department of Energy (DOE), Alternative Fuels Data Center, “Electricity Laws and Incentives in Oregon,” available athttps://afdc.energy.gov/fuels/laws/ELEC?state=or (DOE, “Electricity Laws and Incentives in Oregon”).
77 Federal Transit Administration (FTA), “Public Transportation Innovation – 5312,” available athttps://www.transit.dot.gov/funding/grants/public-transportation-innovation-5312.
Transitioning to Long-Run Effective and Efficient Climate Policies
Analysis Group, Inc. Page 30
for low-GHG buses.78 At the state level, Oregon provides grants to support the purchase of cleaner
school busses.79
Inducement prizes. With appropriate tweaks to their design, inducement prizes can also be used
at the adoption and diffusion stages of the innovation process. For example, a policymaker could
design an inducement prize in which the reward is a government purchasing contract.80
Alternatively, the policymaker could set an inducement prize in which the reward depends on the
extent of deployment. For example, the early 1990s, a consortium of energy utilities, with help
from the U.S. EPA and the Washington State Energy Office, created an inducement prize called
the Super Efficient Refrigeration Program (SERP). Under SERP, the firm that produced the best
energy-efficient, CFC-free refrigerator was awarded a rebate for each such unit sold (up to a
predetermined limit).81 Potentially, a similar inducement-prize design could be used to encourage
the deployment of new transportation technology, such as vehicles compatible with low-GHG fuel
blends.
Tax breaks, rebates, and other subsidies. Barriers to the diffusion of new technologies may also
be targeted with policies that lower the perceived costs of deployment and adoption. Tax breaks
are one such policy. The federal government provides multiple tax credits for low-GHG
technologies, including a corporate tax credit for electricity production using wind, geothermal,
and solar technologies;82 a personal tax credit for home installation of renewable-energy systems
(for example, solar, small wind, and heat pumps);83 and tax credits of $2,500 to $7,500 for the
purchase of plug-in electric vehicles.84 These tax credits reduce the effective cost to consumers of
adopting new technologies, and may therefore help encourage faster diffusion. Rebates are another
way in which investment in new energy-efficient technologies can be subsidized. The California
Solar Initiative, for example, provided consumers and businesses that install solar-power systems
with rebates based on the system’s expected or actual electricity production.85
78 Federal Transit Administration (FTA), “Low or No Emission Vehicle Program – 5339(c),” available athttps://www.transit.dot.gov/funding/grants/lowno.
79 DOE, “Electricity Laws and Incentives in Oregon.”
80 Newell and Wilson 2005, p. 32.
81 Gillingham, Kenneth, Richard Newell, and Karen Palmer, “Retrospective Examination of Demand-Side Energy Efficiency Policies,” Resources for the Future Discussion Paper 04-19 rev, September 2004, available athttps://ageconsearch.umn.edu/record/10477/files/dp040019.pdf, pp. 17-20.
82 U.S. Department of Energy (DOE), “Renewable Electricity Production Tax Credit (PTC),” available athttps://www.energy.gov/savings/renewable-electricity-production-tax-credit-ptc.
83 U.S. Department of Energy, “Residential Renewable Energy Tax Credit,” available athttps://www.energy.gov/savings/residential-renewable-energy-tax-credit.
84 U.S. Internal Revenue Service (IRS), “Plug-In Electric Drive Vehicle Credit,” January 29, 2019, available athttps://www.irs.gov/businesses/plug-in-electric-vehicle-credit-irc-30-and-irc-30d.
85 State of California, California Energy Commission & California Public Utilities Commission, “Step 3: Apply for Incentives,” available at https://www.gosolarcalifornia.ca.gov/csi/step3.php.
Transitioning to Long-Run Effective and Efficient Climate Policies
Analysis Group, Inc. Page 31
Design of subsidies should consider many factors. One factor is the “salience” of different forms
of incentives to individuals and businesses. Evidence shows that consumers respond differently to
various forms of subsidization (for example, tax credits, rebates, or preferential benefits, such as
high occupancy vehicle access), even when the monetary value of incentives is similar. Another
factor is permanence.86 Tapering off the size of the subsidy can reduce the risk that technology
suppliers are incentivized to lobby for perpetuation of the subsidy, even after the technology
becomes fully commercialized. Both the federal plug-in vehicle tax credits and the California Solar
Initiative reduced the subsidy value as the number of individuals taking advantage of the subsidy
hit certain milestones.
Government adoption of new technologies. In addition to policies that seek to encourage diffusion
of new technologies by nudging the behavior of consumers and businesses, governments can
influence adoption through their own purchasing decisions. By selecting advanced technologies,
governments can absorb some of the learning-by-using costs and help to support development of
needed infrastructure networks.
At the federal level, regulations already require that some vehicle-purchase decisions reflect
efficiency and emissions criteria. Department of Defense rules require it to choose hybrid or electric
over traditional vehicles for non-combat purposes when costs are similar,87 and federal statutes
require that a proportion of federal (and even some state) vehicle fleet additions be comprised of
certain advanced fuel vehicles (including hybrids).88 At the state and municipal levels, governments
have the opportunity to choose emerging clean-transportation technologies for the use of employees
and the provision of public services. Portland, Oregon, for example, recently announced plans to
transition its bus fleet gradually from diesel to electric.89
Utility and construction regulations to advance infrastructure availability. One way to expand
the network infrastructure necessary to fuel certain low-GHG vehicles is to support development
of a network of refueling stations. Options include: public funding of a large, integrated network,
developed by private contractors or regulated utilities; subsidies for new refueling station
development or expansion of refueling capabilities at existing stations; or development and
zoning requirements. In Oregon, a 2017 executive order mandates that the state building code be
updated to require that new parking structures are compatible with the installation of two or more
electric-vehicle charging stations.90
86 Gallagher, Kelly Sims and Eric Muehlegger, “Giving green to get green? Incentives and consumer adoption of hybrid vehicle technology,” Journal of Environmental Economics and Management 61(1): 1-15, 2011.
87 U.S. Department of Energy (DOE), Alternative Fuels Data Center, “Electricity Laws and Incentives in Federal,” available at https://afdc.energy.gov/fuels/laws/ELEC?state=US (DOE, “Electricity Laws and Incentives in Federal”).
88 DOE, “Electricity Laws and Incentives in Federal.”
89 Theen, Andrew, “TriMet debuts $500 million plan to ditch diesel buses, go electric,” OregonLive.com, 2018, available at https://www.oregonlive.com/commuting/2018/09/trimet_debuts_500_million_plan.html.
90 DOE, “Electricity Laws and Incentives in Oregon”; State of Oregon Office of the Governor, Executive Order No. 17-21, “Accelerating Zero Emission Vehicle Adoption in Oregon to Reduce Greenhouse Gas Emissions and
Transitioning to Long-Run Effective and Efficient Climate Policies
Analysis Group, Inc. Page 32
Policy decisions to address adoption externalities should reflect multiple considerations. In
selecting among the many measures available, policymakers should aim to create the greatest net benefits
given the potential for targeted technologies to lower the aggregate cost of reducing GHG emissions. These
benefits will reflect many factors, including the nature and severity of adoption externalities, the scope of
use for targeted technologies, and the potential for reductions in technology costs.
Policies to counteract adoption externalities come with risks that should be considered from the
outset. Providing incentives for technology deployment may require that policymakers choose particular
technologies to support. With this choice comes the risk of backing the “wrong” technology, that is, a
technology that proves to be less cost-effective than alternatives.91 If there are network externalities,
government support could perversely lead to lock-in on a more costly technology. For example, government
incentives or requirements for flex-fuel vehicles could lead to lock-in on that technology, which may prove
more costly in the long-run than alternatives, such as electricity or hydrogen-fueled vehicles; but, of course,
the same is true for each of these alternatives. Given uncertainty in costs, approaches that allow the market
flexibility to innovate can reduce these risks.
Government subsidies also create incentives for suppliers to exert effort through lobbying to
maintain these subsidies (that is, rent-seeking behavior).92 One way to mitigate such rent-seeking is to taper
subsidies over time through predetermined schedules.93 The California Solar Initiative provides rebates to
consumers and businesses that install solar panels, with the size of the rebate declining as more solar panels
are installed.94 Similarly, the federal tax credit for plug-in electric vehicles is being phased out as
manufacturer sales of these vehicles increase.95
In addition to the considerations and risks outlined above, policymakers should keep in mind that
market failures at the adoption and diffusion stages, and the potential effect of policy responses directed at
those market failures, vary from sector to sector and from technology to technology. Markets and
technologies should be analyzed individually when considering policy intervention.96
3. Special Considerations for Policymakers at the State Level
States contemplating measures to address R&D market failures may face different tradeoffs than
policymakers acting at the federal level. Effective implementation of many R&D measures involves fixed
Address Climate Change,” November 6, 2017, available athttps://www.oregon.gov/gov/Documents/executive_orders/eo_17-21.pdf.
91 See, for example, JNS 2004, p. 42.
92 Newell 2015, p. 187.
93 See, for example, Schatzki, Todd, and Robert N. Stavins, “Beyond AB 32: Post-2020 Climate Policy for California,” January 2014, available at https://papers.ssrn.com/sol3/papers.cfm?abstract_id=2378669, p. 41.
94 California Energy Commission & California Public Utilities Commission, “California Solar Initiative Rebate,” available at https://www.gosolarcalifornia.ca.gov/csi/rebates.php.
95 U.S. Department of Energy (DOE), “Renewable Electricity Production Tax Credit (PTC),” available athttps://www.energy.gov/savings/renewable-electricity-production-tax-credit-ptc.
96 See, for example, Aldy et al. 2010, p. 925.
Transitioning to Long-Run Effective and Efficient Climate Policies
Analysis Group, Inc. Page 33
costs, implying that federal programs may be more efficient than individual state programs. For example,
evaluation of proposals to fund basic research requires highly technical staff to evaluate research proposals,
assess each project’s potential, and understand promising areas for technological development. Given these
factors, among others, most basic research funding occurs at the federal level.
Lacking federal action, individual states could coordinate with like-minded states and provinces to
pool research funding, coordinate research priorities, and share resources to administer funding programs.
Such pooling would avoid duplication of effort in learning about the technological landscape and maximize
use of skilled resources to analyze options and reach decisions about funding and measures to pursue. In
addition, pooling would allow states to diversify the risks associated with their research investments,
particularly if those investments involve financial commitments, such as loans or loan guarantees.97
These pooling benefits would need to be weighed against the local economic benefits of directing
funding to researchers at in-state universities or firms, although multi-state initiatives could include
procedures for ensuring that the economic benefits of research activities are spread among states
contributing to the initiatives. However, directing funding to local institutions may come at a cost if these
resources are less effective at achieving the underlying technology development that is the objective of the
measures. Moreover, research that eventually lowers the cost of reducing GHG emissions may have the
greatest net benefits of the actions an individual state can take, as reductions in technology costs can spill
over across the globe, thus leading to broader emission reductions. Hence, catering to local economic
interests may reduce the efficacy of policies aimed at advancing low-GHG technology more than is
immediately apparent.98
Naturally, a concern among smaller-scale policy jurisdictions, such as states, may be that their own
investments crowd out investment that otherwise would have been undertaken by larger bodies, such as the
federal government. If the federal government targeted an overall level of basic research funding for the
country as a whole, for example, then investments by Oregon might simply shift a portion of the investment
burden to Oregon without increasing overall investment. Potentially, coordination with the federal
government — particularly on the use of matching funds, with the state offering funding on the condition
of federal matching, or vice versa — might help alleviate this concern.
97 States may also potentially increase the impact of their policies by coordinating with policymakers at the federal level. The National Academy of Sciences (NAS) has suggested a network of “Regional Energy Innovation and Development Institutes” (REIDIs) to coordinate and cooperate with federal energy-innovation programs. Such a system could be useful in directing state efforts where they are most effective. NAS 2016, p. 68.
98 Fischer 2009, p. 7.
GHG Cap-and-Trade: Implications for Effective and Efficient Climate Policy In Oregon
Robert N. StavinsA.J. Meyer Professor of Energy & Economic Development
John F. Kennedy School of Government, Harvard UniversityDirector, Harvard Environmental Economics ProgramDirector, Harvard Project on Climate Agreements
Salem, OregonNovember 8, 2018
PAGE 1OREGON CAP-AND-TRADE ■ NOVEMBER 2018
Agenda
Introduction
Cap-and-Trade
Complementary Policies: Theory
Complementary Policy Interactions: Empirical Evidence (Lessons from California)
Conclusions
PAGE 2OREGON CAP-AND-TRADE ■ NOVEMBER 2018
Current Oregon policies intended to reduce GHG emissions Clean Fuels Program ( a low-carbon fuel standard) Renewable Portfolio Standard “Coal-to-Clean” Legislation Energy efficiency program funded through the Energy Trust of Oregon
Oregon is now considering adoption of a cap-and-trade system to reduce greenhouse gas (GHG) emissions
Introduction: Oregon Climate Policy
PAGE 3OREGON CAP-AND-TRADE ■ NOVEMBER 2018
The Good News about GHG Cap-and-Trade
A well-designed GHG cap-and-trade system has advantages over other approaches to reducing GHG emissions
Cap-and-Trade provides relative certainty over emissions outcomes Cap ensures achievement of emission target (subject to adequate monitoring
and enforcement) But standards targeted at specific activities may not provide such certainty Example: Clean Fuels Program (CFP) only affects mix of fuels on the
market; it does not affect miles driven, or fuel efficiency of motor vehicles
Cap-and-Trade provides cost-effective way to achieve reductions Only carbon-pricing can achieve economy-wide emission reductions Lowest cost approach to reducing GHG emissions (incentive for sources with
low-cost emission options to take on additional responsibility) Provides price signals to stimulate long-term technological change
Cap-and-Trade
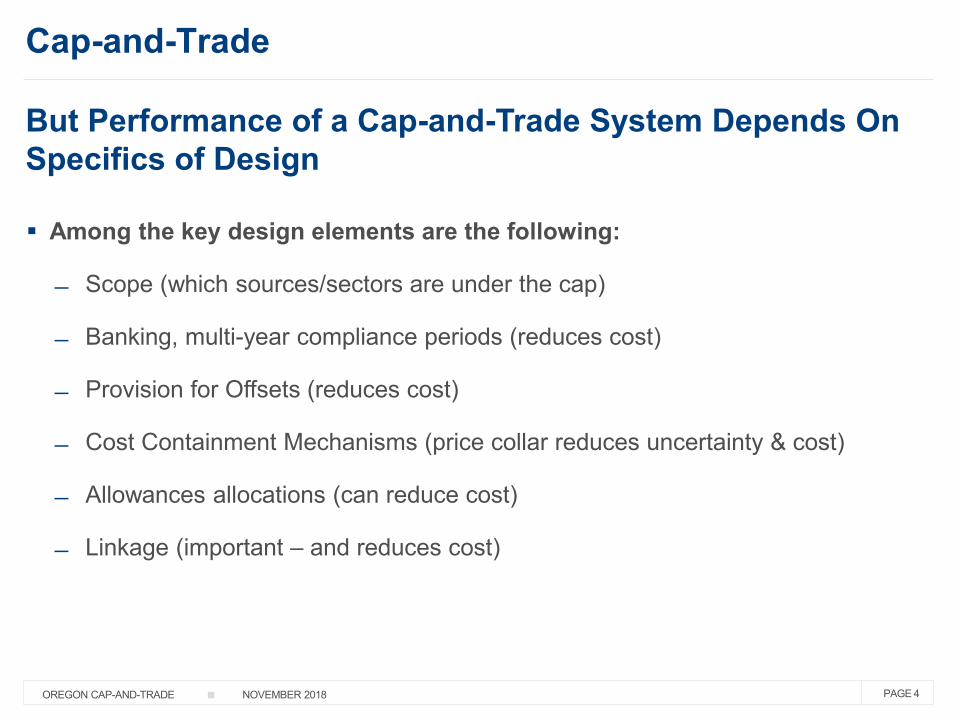
PAGE 4OREGON CAP-AND-TRADE ■ NOVEMBER 2018
But Performance of a Cap-and-Trade System Depends On Specifics of Design
Among the key design elements are the following:
Scope (which sources/sectors are under the cap)
Banking, multi-year compliance periods (reduces cost)
Provision for Offsets (reduces cost)
Cost Containment Mechanisms (price collar reduces uncertainty & cost)
Allowances allocations (can reduce cost)
Linkage (important – and reduces cost)
Cap-and-Trade
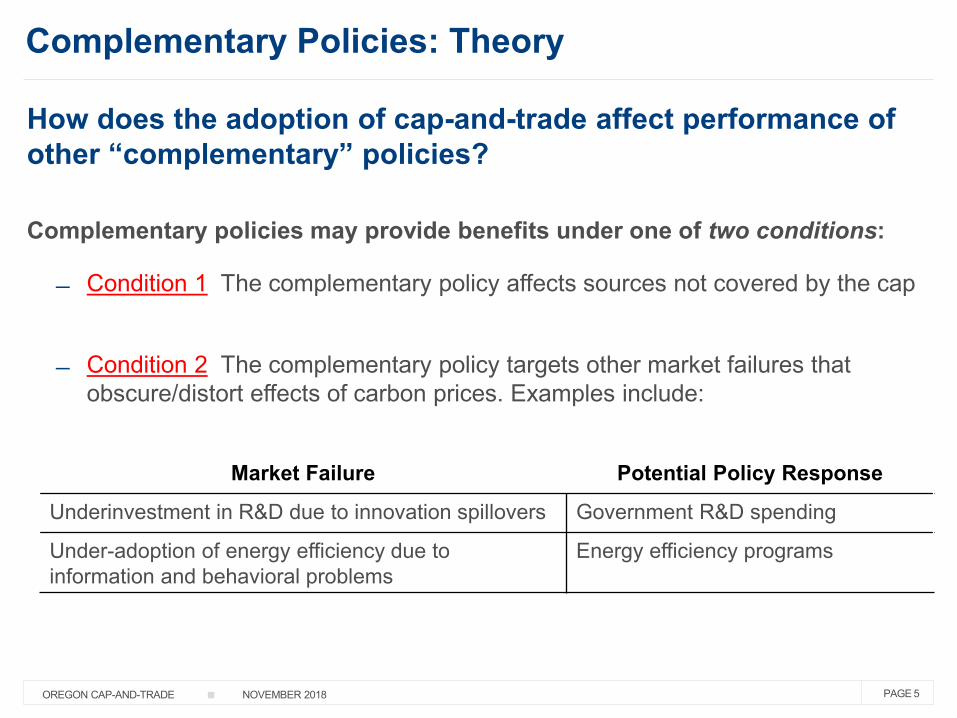
PAGE 5OREGON CAP-AND-TRADE ■ NOVEMBER 2018
How does the adoption of cap-and-trade affect performance of other “complementary” policies?
Complementary policies may provide benefits under one of two conditions:
Condition 1 The complementary policy affects sources not covered by the cap
Condition 2 The complementary policy targets other market failures that obscure/distort effects of carbon prices. Examples include:
Complementary Policies: Theory
Market Failure Potential Policy Response
Underinvestment in R&D due to innovation spillovers Government R&D spending
Under-adoption of energy efficiency due to information and behavioral problems
Energy efficiency programs
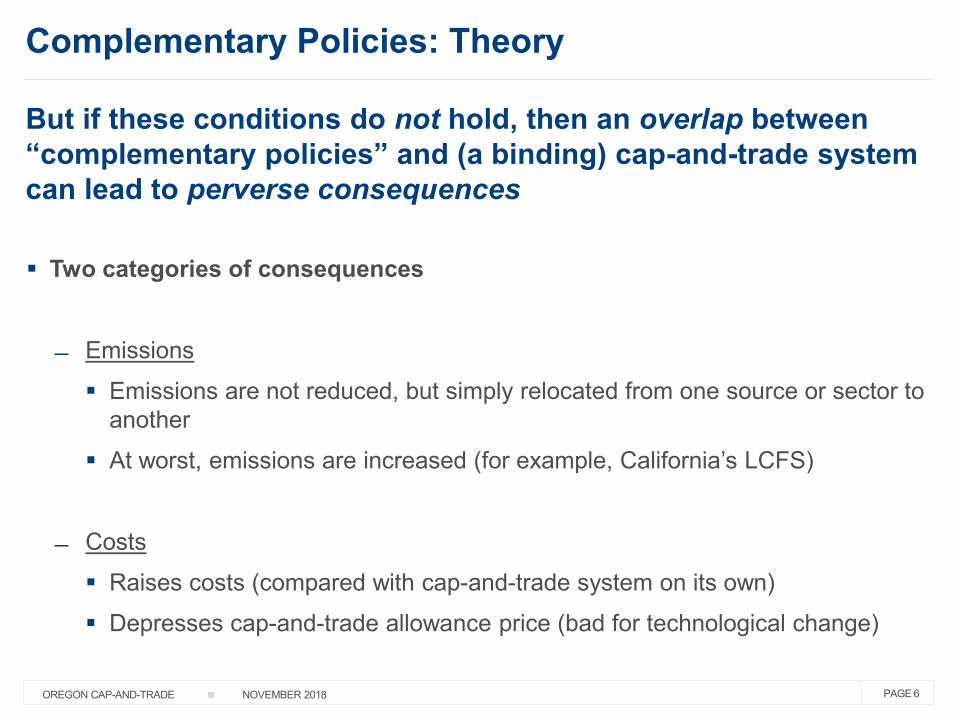
PAGE 6OREGON CAP-AND-TRADE ■ NOVEMBER 2018
But if these conditions do not hold, then an overlap between “complementary policies” and (a binding) cap-and-trade system can lead to perverse consequences
Two categories of consequences
Emissions Emissions are not reduced, but simply relocated from one source or sector to
another At worst, emissions are increased (for example, California’s LCFS)
Costs Raises costs (compared with cap-and-trade system on its own) Depresses cap-and-trade allowance price (bad for technological change)
Complementary Policies: Theory
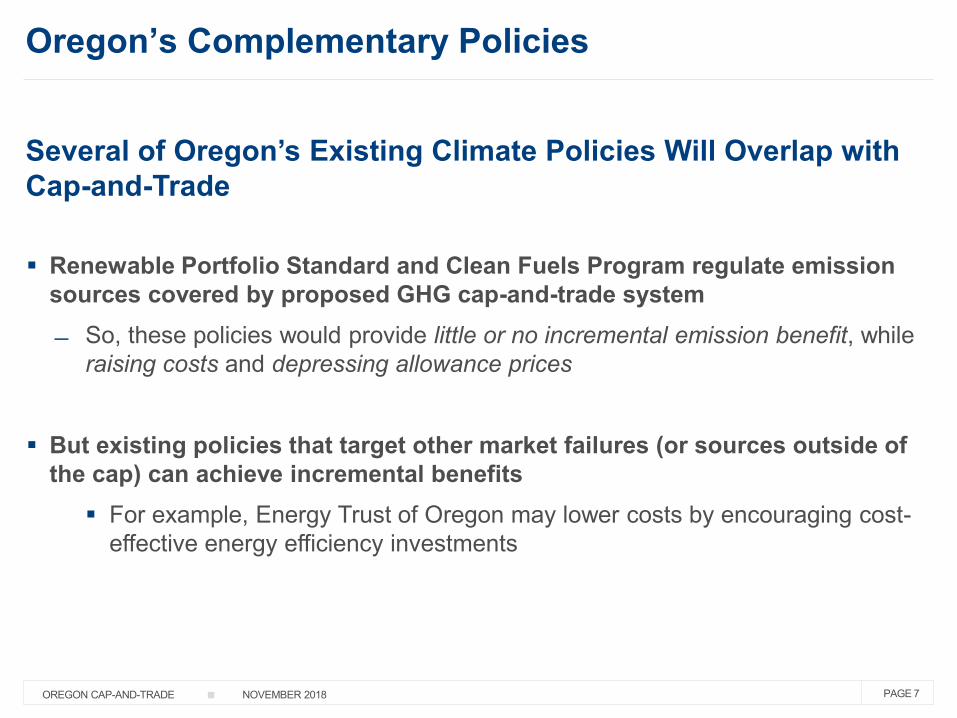
PAGE 7OREGON CAP-AND-TRADE ■ NOVEMBER 2018
Several of Oregon’s Existing Climate Policies Will Overlap with Cap-and-Trade
Renewable Portfolio Standard and Clean Fuels Program regulate emission sources covered by proposed GHG cap-and-trade system So, these policies would provide little or no incremental emission benefit, while
raising costs and depressing allowance prices
But existing policies that target other market failures (or sources outside of the cap) can achieve incremental benefits For example, Energy Trust of Oregon may lower costs by encouraging cost-
effective energy efficiency investments
Oregon’s Complementary Policies
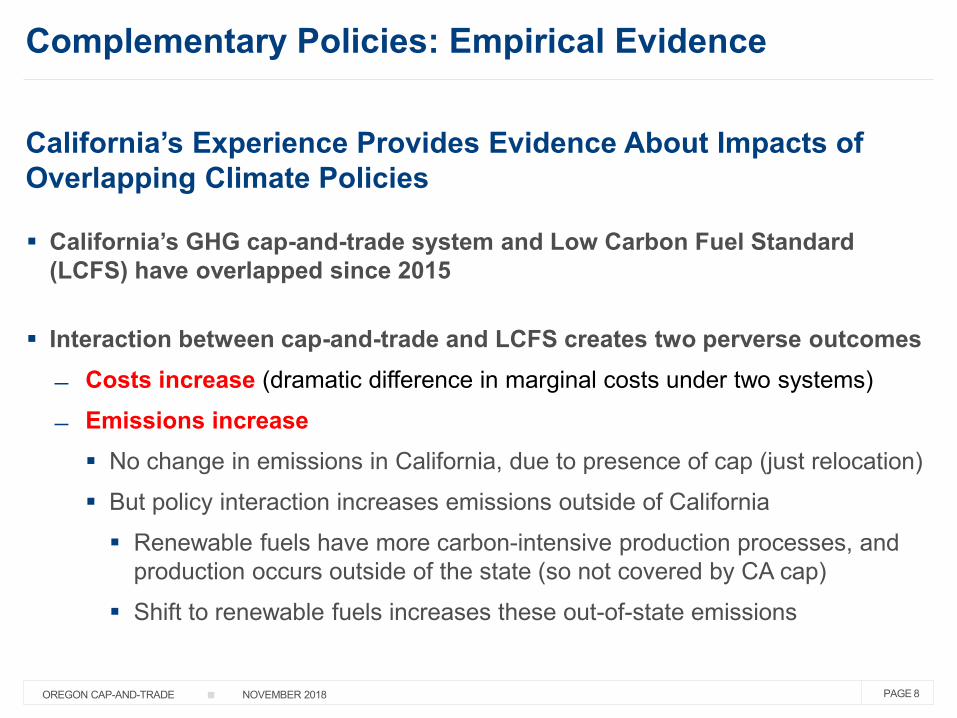
PAGE 8OREGON CAP-AND-TRADE ■ NOVEMBER 2018
California’s Experience Provides Evidence About Impacts of Overlapping Climate Policies
California’s GHG cap-and-trade system and Low Carbon Fuel Standard (LCFS) have overlapped since 2015
Interaction between cap-and-trade and LCFS creates two perverse outcomes Costs increase (dramatic difference in marginal costs under two systems) Emissions increase No change in emissions in California, due to presence of cap (just relocation) But policy interaction increases emissions outside of California Renewable fuels have more carbon-intensive production processes, and
production occurs outside of the state (so not covered by CA cap) Shift to renewable fuels increases these out-of-state emissions
Complementary Policies: Empirical Evidence
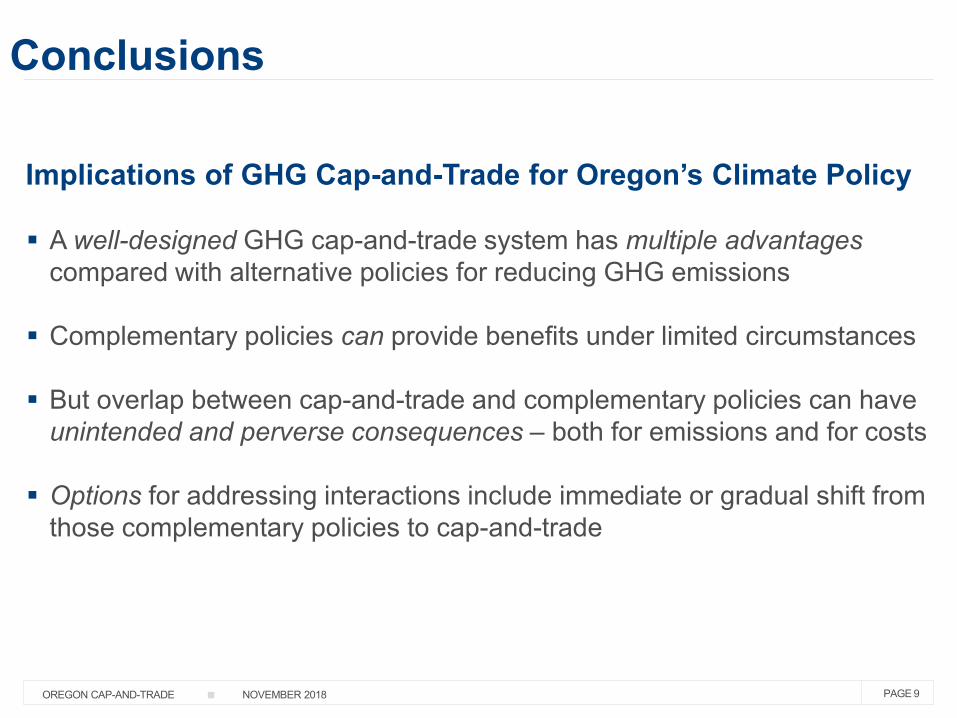
PAGE 9OREGON CAP-AND-TRADE ■ NOVEMBER 2018
Conclusions
Implications of GHG Cap-and-Trade for Oregon’s Climate Policy
A well-designed GHG cap-and-trade system has multiple advantagescompared with alternative policies for reducing GHG emissions
Complementary policies can provide benefits under limited circumstances
But overlap between cap-and-trade and complementary policies can have unintended and perverse consequences – both for emissions and for costs
Options for addressing interactions include immediate or gradual shift from those complementary policies to cap-and-trade
PAGE 10OREGON CAP-AND-TRADE ■ NOVEMBER 2018
New Paper:
“GHG Cap-and-Trade: Implications for Effective and Efficient Climate Policy in Oregon” Todd Schatzki, Analysis GroupRobert N. Stavins, Harvard University
PAGE 11OREGON CAP-AND-TRADE ■ NOVEMBER 2018
11
For More Information
Harvard Project on Climate Agreementswww.belfercenter.org/climate
Harvard Environmental Economics Programwww.hks.harvard.edu/m-rcbg/heep
Websitewww.stavins.com
Blogwww.robertstavinsblog.org/
Twitter@robertstavins