annual report - tuv nord
TRANSCRIPT

2 0 1 9
Annual Report

The most successful innovations always come about as a result of dialogue, exchanges of experience and technical expertise in teams which bring together a wide range of different players. We aspire to use these innovations to help our cus-tomers make even better decisions so that they can be both more successful and more sustainable.Dr. Dirk Stenkamp, Chairman of the Board of Management

01
Contents
02 Letter from the Chairman of the Board of Management
04 The Group Executive Committee06 Report from the Supervisory Board
08 Consolidated Financial Statements10 Group Management Report24 Consolidated Income Statement25 Statement of Comprehensive Income26 Consolidated Balance Sheet28 Consolidated Cash Flow Statement30 Statement of Changes in Consolidated Equity
32 Notes to the Consolidated Financial Statements33 General Principles35 Summary of Significant Accounting Policies42 Consolidated Income Statement Disclosures44 Notes on the Consolidated Statement of
Comprehensive Income45 Consolidated Balance Sheet Disclosures60 Consolidated Cash Flow Statement Disclosures60 Other Disclosures71 Governing Bodies

02
T Ü V N O R D G R O U P | A N N U A L R E P O R T
Dear clients, partners and colleagues,
For all of us at TÜV NORD, 2019 was a very particular year, full of encounters, experiences and emotion. The celebrations marking our 150th anniversary brought home very clearly to us the ongoing viability and systemic relevance of the task with which society has entrusted us: to use technology to protect people from harm. Furthermore, we have spent these 150 years instilling confidence and trust in new technologies: in 1869, it was the steam engine; in the modern age – as it will be in the world of tomorrow – the focus is on the digital networking of our world. We took the opportunity offered by the many anniversary events to talk to our customers, staff and partners about the ex- pectations that stakeholders will have of our Group in the future. These conversations have inspired us and motivated us, in accordance with our mission statement, to leave no stone unturned and waste no time in our quest for the best solutions for our customers and to implement those solutions based on our sustainability goals.
Our core business is becoming increasingly digital. This includes the testing of digitally networked systems just as much as it does the methodology employed in those tests. For instance, smart algo-rithms are now having an impact on many areas of life: self-teaching applications on our smartphones are optimising our daily routines and the way we get around, what we eat and how we communicate. The transmission of millions of datasets is making it possible to draw conclusions about how we behave in traffic situations. Insurance companies are offering reduced premiums for defensive drivers. Data updates which can affect the way we drive are finding their way virtually unnoticed through the ether into vehicle control software. For us at TÜV NORD, the implication is that static tests which take place at rigidly defined intervals are no longer enough in this digital world to guarantee functional safety and data protection. What we need instead are regulations to cover dynamic testing proce-dures which constantly provide information about the functionality, safety and integrity of vehicles, industrial robots and medical equipment.
In the years to come, we aspire to use our breadth of knowledge and many thousands of daily meetings with customers even more effectively to develop new digital services and products. It’s with this in mind that we are using process improvements and new work environments to establish a culture of innovation and change that will offer our staff more time for creativity and invention.
Our decisions as an enterprise particularly take into account our responsibility for society and the environment. We are honouring this commitment especially in our use of market-leading testing technologies and engineering expertise to protect the world’s climate and resources. Digitalisation in the form of real-time supply chains and production processes such as 3D printing is presenting us with a historic opportunity to consign to history surplus industrial production and the wasteful use of resources and to replace them with a demand structure that is tailored to individual customers and their real needs. It’s in this way that the fourth industrial revolution is fast becoming the digital harbinger of the fifth, whose overriding imperatives will be climate protection and sustainability.

03
It is a self-evident pillar of our corporate culture that the most successful innovations always come about as a result of dialogue, exchanges of experience and technical expertise in teams which bring together a wide range of different players. We aspire to use these innovations to help our customers make even better decisions so that they can be both more successful and more sustainable. You will find examples of these in the magazine that accompanies this annual report under the title “Dialogue enhances knowledge”.
The TÜV NORD GROUP continued to grow in 2019 in terms of both sales and other relevant financial ratios. For the first time, the number of employees topped the 14,000 mark – never before have so many people worked for our Group. All of our staff across the world are motivated every day by a desire to play their part in a shared endeavour to protect people and technology and to contribute to pro- tecting the climate and preserving our planet. At this point we would like once again to warmly welcome on board all those who joined the TÜV NORD family in 2019.
In the name of the Supervisory Board, the Board of Management, the Group Executive Committee and the staff councils, I offer my heartfelt thanks for our successful collaboration and, especially, for the trust you have placed in our company in the past year. My special thanks go out to all those employees and partners worldwide who have been working for our customers with such great dedication. We look forward to continuing our wide-ranging conversations and to working together in a spirit of mutual trust and confidence in 2020.
Kind regards,
Dr. Dirk StenkampChairman of the Board of Management
L E T T E R F R O M T H E C H A I R M A N O F T H E B O A R D O F M A N A G E M E N T

04
T Ü V N O R D G R O U P | A N N U A L R E P O R T
The Group Executive Committee
1 2
3 4
1 | DIRK KRETZSCHMAR IT business unit
2 | LUIS GÓMEZ Aerospace business unit
3 | DR. RALF JUNG Industrial Services business unit
4 | HARTMUT ABELN Mobility business unit
5 | JÜRGEN HIMMELSBACH CFO
6 | DR. DIRK STENKAMP Chairman of the Board of Management
7 | HARALD REUTTER Board Member Human Resources
8 | JÖRG BECKS Training business unit ¹
9 | DR. MAIK TIEDEMANN Engineering and Natural Resources business unit
10 | AXEL DRECKSCHMIDT Training business unit ²
1 as of 1 January 2020, as scheduled 2 until 31 December 2019, as scheduled

05
T H E G R O U P E X E C U T I V E C O M M I T T E E
5 6
7
9
8
10

06
T Ü V N O R D G R O U P | A N N U A L R E P O R T
Report from the Supervisory Board
In 2019, the Supervisory Board carried out the tasks incumbent upon it according to the law and the articles of association; it regularly supervised the management work of the Board of Management and continuously offered advice to the Board in its management of the company. In particular, it was regularly kept informed, both verbally and in writing, of the position of the Group and the business trends within it. In the year under review, four regular meetings of the Supervisory Board took place on 9 April, 4 June, 25 September and 3 December, at which the Board of Management reported in detail on the current situation of the Group and the major Group companies. The Board of Management also delivered assessments of the opportunities and risks that might present themselves in the further course of the year and the current financial and asset situation of the Group. In this way, the Supervisory Board was kept abreast of corporate policy intentions, corporate planning and ongoing business transactions. Outside the meetings, the Chair-man of the Supervisory Board was also kept regularly informed by the Chairman of the Board of Management of current issues.
At the meeting of 4 June, after a thoroughgoing review and period of consultation, the Supervisory Board gave its consent to the purchase of a stake in two companies for which its approval was required. At the meeting of 3 December, the budget for 2020 was discussed and approved. At the same meeting the Supervisory Board acknowledged the results of the review looking at the appropriateness of the remuneration paid to Board members and adopted resolutions for the further development of Board member remuneration. The Supervisory Board largely met in the presence of the Board of Management but deliberated in the absence of the Board of Management on matters such as Board member remuner-ation and other board-related issues.
In order to carry out its tasks and prepare its deliberations and decisions, the Supervisory Board set up two committees which effectively support the work of the plenum.
The executive committee / the personnel committee held eleven meetings and a teleconference during the year under review. The discussions focused primarily on the preparation of the plenary sessions and of the personnel and remuneration decisions to be made by the Supervisory Board. Where necessary, the Supervisory Board was furnished with recommendations for decision-making.

07
R E P O R T F R O M T H E S U P E R V I S O R Y B O A R D
In 2019, the Finance Committee met four times in advance of the Supervisory Board meetings and paid particular attention to the annual financial statement, earnings trends, risk and opportunities management and interest rate trends, particularly in respect of pension obligations. In its meeting of 26 November, the Finance Committee addressed the plans for the 2020 fiscal year. Key findings were in each case reported back to the following Super- visory Board meetings.
The auditors appointed by the General Meeting of 9 April 2019, BDO AG from Essen, audited the annual financial statements of TÜV NORD AG published by the Board of Management on 31 December 2019 and the consolidated financial statements, including the asso- ciated reports on the situation of the company and the Group. The auditors issued an audit opinion that was free of any reservations. The auditors noted that the Board of Management had established an appropriate information and monitoring system whose design and management rendered it suitable for anticipating developments that might pose a risk to the continued existence of the company.
The financial statement documents and the audit reports for the 2019 fiscal year were discussed at length in the meeting of the Finance Committee on 17 March 2020 and the Supervisory Board meeting of 24 March 2020. The Board of Management and the auditors were present at the deliberations on the annual and con- solidated financial statements. The auditors reported on the main results of their audit and their findings concerning the internal control system and risk management. They also made themselves avail- able to the Supervisory Board should the latter require additional information.
On the basis of its own audit of the annual and consolidated financial statements and the management reports and on the basis of the report and the recommendation of the Finance Committee, the Super- visory Board felt able to concur with the auditors’ conclusions. No objections were raised. The Supervisory Board approved both the annual and the consolidated financial statements.
At the end of the meeting of 3 December, Dr. Jürgen-Johann Rupp left the Supervisory Board. In an extraordinary General Meeting held on the same day, Mr. Reinhold Rüther was appointed to the Supervisory Board as the successor to Dr. Rupp for the remainder
of the latter’s term. The Chairman of the Supervisory Board acknowl- edged Dr. Rupp’s years of dedicated work on the Supervisory Board and thanked him on behalf of the committee for his greatly appreciated cooperation.
The Board of Management remains unchanged. Mr. Jürgen Himmelsbach was once again appointed as Chief Financial Officer for the period ending 31 August 2025.
The Supervisory Board would like to thank all the Group company employees worldwide, the company’s managers, the Board of Management, the Group Executive Committee and the employee representatives for their dedicated and successful work in 2019.
The Supervisory Board
Prof. Dr. Karl Friedrich JakobChairman
Hanover, March 2020

08
T Ü V N O R D G R O U P | A N N U A L R E P O R T
+ 52.9
2017 2018 2019
1,184.81,229.5
1,282.4
K E Y F IN A N C I A L R AT I O S 2 0 19
in € million
S A L E S T R E N D S
in € million
T R E N D IN W O R K F O R C E N U M B E R S
International Domestic Total
S A L E S B Y B U S IN E S S U NI T
in %
2017 2018 2019
10,53910,780
11,276
2,9313,115
3,387
7,608 7,6657,889
* before special effects
2019 2018
EBIT * 75.2 80.2
EBT 74.0 80.5
Balance sheet total 1,042.9 924.0
Net financial position 37.0 21.9
Pension provision 528.5 507.2
3.8 Aerospace
0.3 Holding / Services
2.0 IT
9.9 Engineering and Natural
Resources
7.8 Training
33.0 Mobility
43.1 Industrial Services

09
C O N S O L I D A T E D F I N A N C I A L S T A T E M E N T S 2 0 1 9
Consolidated Financial Statements
10 Group Management Report10 Fundamental Principles of the Group10 Economic Report14 Non-financial Performance Indicators15 Report on Expected Developments, Opportunities and Risks19 Corporate Responsibility20 Corporate Governance21 Statement on Corporate Governance22 Further Information
24 Consolidated Income Statement25 Statement of Comprehensive Income26 Consolidated Balance Sheet28 Consolidated Cash Flow Statement30 Statement of Changes in Consolidated Equity

10
T Ü V N O R D G R O U P | A N N U A L R E P O R T
58
T Ü V N O R D G R O U P | C O R P O R A T E R E P O R T
Group Management Report
F U N D A M E N TA L P R I N C I P L E S O F T H E G R O U P
Business modelEstablished 150 years ago, the TÜV NORD GROUP is the byword for safety and trust. As a service provider with many years of experi-ence in the areas of technology and safety, the TÜV NORD GROUP is dedicated to providing answers to important global questions with implications for the future. Its professionals and experts provide innovative inspection, certifi cation, consultancy and engineering services with the highest levels of expertise in accordance with globally applicable standards. In this way, the TÜV NORD GROUP as a technology group guarantees comprehensive support for its regional, domestic and international customers.
The TÜV NORD GROUP has divided its activities into six business units and the Holding / Services division and is active in the TICCET (Testing, Inspection, Certifi cation, Consulting, Engineering, Training) market. Extensive consulting and training services are off ered alongside the traditional testing business. The Group has a unique selling proposition in the sector as a whole, with services in the engineering and natural resources as well as aerospace fi elds.
■■ The certifi cation, service and testing portfolio of the companies in the Industrial Services business unit includes specifi c indi-vidual tests and the management of complex security solutions.
■■ The Mobility business unit off ers numerous services, such as vehicle and driving tests, vehicle assessments, testing of vehicle components and vehicles (homologation) and development-related consulting for the automotive sector.
■■ In 2019, the Natural Resources business unit was renamed to Engineering and Natural Resources to empathize the growing importance of engineering services. The unit off ers services in plant construction and process engineering, construction and infrastructure, mining and energy markets.
■■ The core activities of the Training business unit are vocational education and training for specialists and managers, along with publicly funded training measures.
■■ The Aerospace business unit is involved in activities concerning the procurement, modifi cation, testing and certifi cation of electronic components for the aerospace industry.
■■ The IT business unit focuses on IT security assessment services for hardware and software as well as testing and certifi cation services for IT infrastructures for the validation of the security and availability of data centres and cloud providers.
As of 31 December 2019, the Group with its management company TÜV NORD AG embraced 85 fully consolidated companies, 42 of them domiciled in Germany and 43 abroad. The TÜV NORD AG consolidated fi nancial statement includes all major companies in Germany and abroad in which TÜV NORD AG either directly or indi-rectly holds the majority of voting rights.
E C O N O M I C R E P O R T
General economic and sector-specific conditionsAcross the world, the start of 2020 has been marked by ongoing political uncertainties, resulting in a much-reduced willingness of companies to invest and thus weighing on foreign trade. The risks associated with an escalation of trade confl icts and Brexit remain high. The global economy remains subdued, which was refl ected in a decline in world trade in the second half of 2019. While indus-trial production continued to decline in the developed economies, it increased somewhat in emerging economies, especially in Asia. At 3.0% for 2019, global growth was well below the previous year’s level (3.7%). China, India and the US remained the main drivers of growth, but the same countries are also largely responsible for the global slowdown. At 1.1% for 2019, growth in the Eurozone was well below the previous year’s level (1.9%).
The weakness of the German economy continues. The loss in value added in the industrial sector, which continues to decline, is largely being off set by growth in services and construction. A sharper downturn or even a pronounced recession is not expected at present. The export-oriented German industry is still confronted by weak global trade caused by trade confl icts, a stagnating global industrial economy and a global slowdown in the demand for motor vehicles. This is having a dampening eff ect on domestic investment and is serving to boost domestic demand for intermediate and capital goods. The less export-dependent sectors of the domestic economy have so far remained relatively unaff ected. However, private and government demand for consumer goods and construc-tion services are reliably bolstering demand overall. At 0.5%, however, for the reasons laid out above, overall growth failed to match that of the previous year (2018: 1.5%).
11
C O N S O L I D A T E D F I N A N C I A L S T A T E M E N T S 2 0 1 9
59
F I N A N C I A L R E P O R T
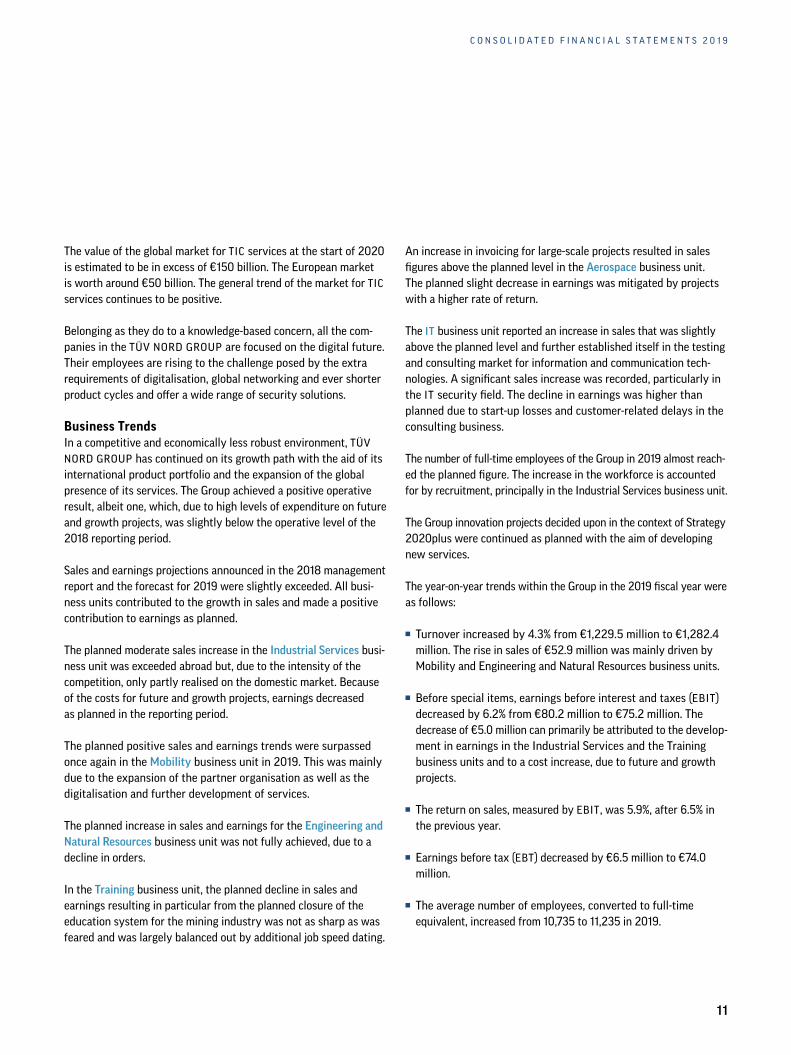
The value of the global market for TIC services at the start of 2020 is estimated to be in excess of €150 billion. The European market is worth around €50 billion. The general trend of the market for TIC services continues to be positive.
Belonging as they do to a knowledge-based concern, all the com- panies in the TÜV NORD GROUP are focused on the digital future. Their employees are rising to the challenge posed by the extra requirements of digitalisation, global networking and ever shorter product cycles and off er a wide range of security solutions.
Business TrendsIn a competitive and economically less robust environment, TÜV NORD GROUP has continued on its growth path with the aid of its international product portfolio and the expansion of the global presence of its services. The Group achieved a positive operative result, albeit one, which, due to high levels of expenditure on future and growth projects, was slightly below the operative level of the 2018 reporting period.
Sales and earnings projections announced in the 2018 management report and the forecast for 2019 were slightly exceeded. All busi-ness units contributed to the growth in sales and made a positive contribution to earnings as planned.
The planned moderate sales increase in the Industrial Services busi-ness unit was exceeded abroad but, due to the intensity of the competition, only partly realised on the domestic market. Because of the costs for future and growth projects, earnings decreased as planned in the reporting period.
The planned positive sales and earnings trends were surpassed once again in the Mobility business unit in 2019. This was mainly due to the expansion of the partner organisation as well as the digitalisation and further development of services.
The planned increase in sales and earnings for the Engineering and Natural Resources business unit was not fully achieved, due to a decline in orders.
In the Training business unit, the planned decline in sales and earnings resulting in particular from the planned closure of the education system for the mining industry was not as sharp as was feared and was largely balanced out by additional job speed dating.
An increase in invoicing for large-scale projects resulted in sales fi gures above the planned level in the Aerospace business unit. The planned slight decrease in earnings was mitigated by projects with a higher rate of return.
The IT business unit reported an increase in sales that was slightly above the planned level and further established itself in the testing and consulting market for information and communication tech-nologies. A signifi cant sales increase was recorded, particularly in the IT security fi eld. The decline in earnings was higher than planned due to start-up losses and customer-related delays in the consulting business.
The number of full-time employees of the Group in 2019 almost reach-ed the planned fi gure. The increase in the workforce is accounted for by recruitment, principally in the Industrial Services business unit.
The Group innovation projects decided upon in the context of Strategy 2020plus were continued as planned with the aim of developing new services.
The year-on-year trends within the Group in the 2019 fi scal year were as follows:
■■ Turnover increased by 4.3% from €1,229.5 million to €1,282.4 million. The rise in sales of €52.9 million was mainly driven by Mobility and Engineering and Natural Resources business units.
■■ Before special items, earnings before interest and taxes (EBIT) decreased by 6.2% from €80.2 million to €75.2 million. The decrease of €5.0 million can primarily be attributed to the develop-ment in earnings in the Industrial Services and the Training business units and to a cost increase, due to future and growth projects.
■■ The return on sales, measured by EBIT, was 5.9%, after 6.5% in the previous year.
■■ Earnings before tax (EBT) decreased by €6.5 million to €74.0 million.
■■ The average number of employees, converted to full-time equivalent, increased from 10,735 to 11,235 in 2019.
58
T Ü V N O R D G R O U P | C O R P O R A T E R E P O R T
Group Management Report
F U N D A M E N TA L P R I N C I P L E S O F T H E G R O U P
Business modelEstablished 150 years ago, the TÜV NORD GROUP is the byword for safety and trust. As a service provider with many years of experi-ence in the areas of technology and safety, the TÜV NORD GROUP is dedicated to providing answers to important global questions with implications for the future. Its professionals and experts provide innovative inspection, certifi cation, consultancy and engineering services with the highest levels of expertise in accordance with globally applicable standards. In this way, the TÜV NORD GROUP as a technology group guarantees comprehensive support for its regional, domestic and international customers.
The TÜV NORD GROUP has divided its activities into six business units and the Holding / Services division and is active in the TICCET (Testing, Inspection, Certifi cation, Consulting, Engineering, Training) market. Extensive consulting and training services are off ered alongside the traditional testing business. The Group has a unique selling proposition in the sector as a whole, with services in the engineering and natural resources as well as aerospace fi elds.
■■ The certifi cation, service and testing portfolio of the companies in the Industrial Services business unit includes specifi c indi-vidual tests and the management of complex security solutions.
■■ The Mobility business unit off ers numerous services, such as vehicle and driving tests, vehicle assessments, testing of vehicle components and vehicles (homologation) and development-related consulting for the automotive sector.
■■ In 2019, the Natural Resources business unit was renamed to Engineering and Natural Resources to empathize the growing importance of engineering services. The unit off ers services in plant construction and process engineering, construction and infrastructure, mining and energy markets.
■■ The core activities of the Training business unit are vocational education and training for specialists and managers, along with publicly funded training measures.
■■ The Aerospace business unit is involved in activities concerning the procurement, modifi cation, testing and certifi cation of electronic components for the aerospace industry.
■■ The IT business unit focuses on IT security assessment services for hardware and software as well as testing and certifi cation services for IT infrastructures for the validation of the security and availability of data centres and cloud providers.
As of 31 December 2019, the Group with its management company TÜV NORD AG embraced 85 fully consolidated companies, 42 of them domiciled in Germany and 43 abroad. The TÜV NORD AG consolidated fi nancial statement includes all major companies in Germany and abroad in which TÜV NORD AG either directly or indi-rectly holds the majority of voting rights.
E C O N O M I C R E P O R T
General economic and sector-specific conditionsAcross the world, the start of 2020 has been marked by ongoing political uncertainties, resulting in a much-reduced willingness of companies to invest and thus weighing on foreign trade. The risks associated with an escalation of trade confl icts and Brexit remain high. The global economy remains subdued, which was refl ected in a decline in world trade in the second half of 2019. While indus-trial production continued to decline in the developed economies, it increased somewhat in emerging economies, especially in Asia. At 3.0% for 2019, global growth was well below the previous year’s level (3.7%). China, India and the US remained the main drivers of growth, but the same countries are also largely responsible for the global slowdown. At 1.1% for 2019, growth in the Eurozone was well below the previous year’s level (1.9%).
The weakness of the German economy continues. The loss in value added in the industrial sector, which continues to decline, is largely being off set by growth in services and construction. A sharper downturn or even a pronounced recession is not expected at present. The export-oriented German industry is still confronted by weak global trade caused by trade confl icts, a stagnating global industrial economy and a global slowdown in the demand for motor vehicles. This is having a dampening eff ect on domestic investment and is serving to boost domestic demand for intermediate and capital goods. The less export-dependent sectors of the domestic economy have so far remained relatively unaff ected. However, private and government demand for consumer goods and construc-tion services are reliably bolstering demand overall. At 0.5%, however, for the reasons laid out above, overall growth failed to match that of the previous year (2018: 1.5%).

12
T Ü V N O R D G R O U P | A N N U A L R E P O R T
60
T Ü V N O R D G R O U P | C O R P O R A T E R E P O R T
EarningsThe 2019 fi scal year ended with a turnover of €1,282.4 million (2018: €1,229.5 million). The following fi gure shows the trend of sales in the Group (€ million):
T R E N D O F S A L E S
2015
1,116.61,153.6 1,184.8
1,229.51,282.4
2016 2017 2018 2019
The breakdown of sales by region (€ million) is shown in the following fi gure:
S A L E S BY R EG I O N
948.2Germany
7.6Africa
184.0Rest of Europe
117.2Asia
25.4America
The Group’s domestic revenue in 2019 amounted to €948.2 million (2018: €903.4 million). Turnover from the international business amounted to €334.2 million (2018: €326.1 million) and achieved a share of 26.1%.
Broken down by business units and Holding / Services, the following overall picture emerged for the year 2019:
R E V E N U E BY B U S I N E S S U N I T
43.1Industrial Services
0.3Holding / Services
9.9Engineeringand Natural
Resources
33.0Mobility
7.8Training
3.8Aerospace
2.0IT
Due the heterogeneous nature of their market presence, their various product portfolios and their regional focus, the individual business units followed very diff erent developmental trends.
The Industrial Services business unit generated a turnover of €552.6 million (2018: €559.9 million), in which the development of foreign business was especially positive. In Germany, sales of €345.9 million failed to match the previous year’s level (2018: €361.0 million), essentially due to the assignment of two com-panies to the Engineering and Natural Resources business unit as of 1 January 2019. The increase in foreign sales to €206.7 million (2018: €198.9 million) was principally accounted for by healthy developments in India.
The turnover of the Mobility business unit, at €423.7 million, was 8.5% higher than in the previous year, €390.5 million. The increase in sales was primarily accounted for by transactions with coopera-tion partners. Furthermore, the initial consolidations of TÜV NORD Sofortgutachten GmbH & Co. KG and TÜV NORD live expert GmbH & Co. KG have an impact as of 1 January 2019.

13
C O N S O L I D A T E D F I N A N C I A L S T A T E M E N T S 2 0 1 9
61
F I N A N C I A L R E P O R T
In the Engineering and Natural Resources business unit, a turnover of €127.3 million (2018: €106.5 million) was generated: the increase was due in particular to the allocation of two companies from the Industrial Service business unit and the good performance of the Geo Engineering & Exploration business segment.
In the Training business unit sales declined to €100.3 million (2018: €101.2 million), because of the scheduled closure of the mining colleges as of 31 July 2018.
The sales of the Aerospace business unit, at €49.0 million, surpassed those of the previous year (2018: €47.6 million), due to an increase in billing for major projects.
The sales of the IT business unit increased to €25.9 million (2018: €18.6 million) due to the initial consolidation as of 1 January 2019 of TÜV NORD IT Secure Communications GmbH & Co. KG, which off ers consultancy services in the IT security fi eld.
Group expenses increased by 5.4% to €1,252.9 million during the year under review. The cost of materials reached a level of €238.4 million in comparison to €216.1 million in the previous year. This is primarily attributable to higher costs for purchased services.
Personnel expenses increased by 4.1% to €741.9 million due to the recruitment of new staff .
Further information on expenses can be found in the Notes to the Consolidated Financial Statements, under No. 3, Consolidated Income Statement disclosures.
Earnings before tax (EBT) amounted to €74.0 million and were thus €6.5 million below the previous year’s result of €80.5 million. As in the previous year, all the business units contributed to the positive result of the Group. Due to the initial application of IFRS 16 (Leases), the EBT decreased by €0.8 million.
Net profi t, at €46.0 million, was 10.1% less than that of the previous year (2018: €51.2 million).
Assets The TÜV NORD GROUP balance sheet reveals a sound structure. Total assets increased to €1,042.9 million during the year under review, as against €924.0 million in 2018.
Non-current assets rose from €548.2 million to €656.3 million. This was primarily due to an increase in property, plant and equipment levels as a result of the initial application of IFRS 16 (Leases). The rate of coverage of non-current assets (equity plus pension provisions divided by non-current assets) amounts to 99.4% (2018: 112.4%).
Current assets, which make up 37.1% of total assets, are recognised at €386.6 million (2018: €375.8 million). The increase is due to a growth in cash and cash equivalents to €89.3 million (2018: €73.5 million).
The Group has additional hidden reserves, which primarily take the form of property ownership and shareholdings.
Equity, at €124.0 million, is above the level of the previous year (2018: €108.7 million). The equity ratio amounts to 11.9% (2018: 11.8%). Due to the lowering of the discount rate for pension obligations, actuarial losses in the Other equity positions amounting to €24.2 million in 2019 (2018: €36.6 million) were off set, thereby aff ecting the consolidated income statement.
In the 2019 fi scal year, €765.4 million (2018: €766.8 million) of plan assets were netted against pension provisions. The proportion of the provisions for current and future pension obligations that is not covered by plan assets amounted to €528.5 million (2018: €507.2 million). The cause for this increase was the signifi cant reduction in the discount rate of pension provisions.
Reinsurance coverage increased in 2019, thus narrowing the pensions coverage gap, adjusted for the eff ects of a change in the discount rate, still further in comparison to the previous year.
Further information on the net asset position can be found in the Notes to the Consolidated Financial Statements, under No. 5, “Consoli dated Balance Sheet disclosures”.
Financial statusNotwithstanding the high amount of investment and expenditure on innovations and digitalisation projects, the TÜV NORD Group further improved its positive net fi nancial position. On 31 December 2019 and was thus not indebted as of the record date. This enables investment in innovation, training and the sustainability of services.

14
T Ü V N O R D G R O U P | A N N U A L R E P O R T
62
T Ü V N O R D G R O U P | C O R P O R A T E R E P O R T
The most important objectives of the conservative fi nancial policy remain the further maintenance of the Group’s good rating and the safeguarding of an adequate level of liquidity for the centralised fi nancing of the subsidiary companies by the Group at a level that meets their needs. In addition, it is fundamental to the Group’s fi nancial strategy to ensure a broad measure of fi nancial fl exibility along with transparent risk and opportunity management.
The Deutsche Bundesbank, having investigated important fi nancial metrics such as profi tability, internal fi nancing strength, liquidity and capital structure on the basis of audited fi nancial statements, has for the thirteenth year in succession awarded the TÜV NORD Group the accolade of eligibility for refi nancing with central banks. The Group thus belongs to the group of companies whose credit liabilities can be used by commercial banks as collateral with regard to the Deutsche Bundesbank. This guarantees the TÜV NORD GROUP a preferred position in terms of access to fi nancial resources.
The cash fl ow (see “Consolidated Cash Flow Statement”) amounted to €86.6 million and was essentially applied to investments in intangible assets and in fi xed assets and in property, plant and equipment, and to the reinsurance of pension liabilities. Capital expenditure excluding corporate acquisitions amounted to €56.7 million in the year under review as against €57.6 million in 2018. Of this, €48.5 million was invested by the German companies, and €8.2 million abroad. The focus was on the construction of real estate in Essen, physical investment in testing equipment, vehicle fl eets and computer hardware and software. No material capital expenditure obligations existed as of the reporting date.
The Group spent a total of €7.4 million (2018: €2.2 million) on the acquisition of companies and equity holdings during the year under review. All projects were assessed by value creation criteria; every potential acquisition or capital investment project was assessed and analysed both regarding the return and its impact on the consoli-dated balance sheet.
The Group’s net fi nancial position amounted to €37.0 million at the end of the year under review, a fi gure that was, despite high investments, above that of the previous year (2018: €21.9 million).
The existing syndicated loan for the Group for €100.0 million had not been used as of 31 December 2019.
In 2019, the Group was in the position to meet its payment obli-gations at all times.
Overall situationIn view of the macroeconomic situation, the TÜV NORD GROUP is satisfi ed with the way the year under review progressed. However, notwithstanding the very good operating profi t of the Group, every eff ort continues to be made to optimise the company’s position in terms of its earnings, assets and fi nances. TÜV NORD GROUP assumes that the earnings, asset and fi nancial positions will remain stable in the future.
N O N - F I N A N C I A L P E R F O R M A N C E I N D I C AT O R S
Innovation reportThe technological revolution is having a signifi cant impact on the Group’s business. The Group needs a vibrant and purposeful culture of innovation, the targeted promotion of innovation and an es-tablished and active innovation management to form the basis of its success if these opportunities are to be exploited and the challenges mastered. Digitalisation and innovation are therefore key drivers for the growth of the TÜV NORD GROUP.
In 2019, an Innovation Council was established from across the business units to act as a governance body for the continuous development of the innovation portfolio of TÜV NORD GROUP.
Innovation boards have been implemented in all the business units with responsibility for the monitoring, controlling and coordination of the respective innovation processes. These boards assess and decide on the continuation of individual innovation ideas and projects from the initial idea through to market launch.
The establishment of innovation controlling has made it possible for the TÜV NORD GROUP to carry out quarterly surveys and analyses of sales, costs, investments, employee numbers and general inno-vation costs. The Board of Management and the Supervisory Board are regularly kept informed of the results.
The expertise of the TÜV NORD employees and its global presence form the ideal basis for the digital transformation and the Group’s innovation process, both of which are needed to underpin the success of TÜV NORD GROUP’s customers in the digital age. For this purpose, the TÜV NORD GROUP is also involved in universities and cooperates with research institutions. In addition, employees of the TÜV NORD GROUP are to be found in relevant committees for the domestic and international development of industry-specifi c regulations.

15
C O N S O L I D A T E D F I N A N C I A L S T A T E M E N T S 2 0 1 9
63
F I N A N C I A L R E P O R T
The necessary cultural change is being actively promoted from within the company by the work of the Digital Academy. This successful programme is in its third year and has met with a great deal of interest, including from beyond the TÜV NORD GROUP. Just under 40 digitisation projects have already emerged from the Digital Academy and are either being implemented or have already been completed. Employees from all the business units have been trained as digital experts and taken on new and greater challenges in their organisations, thereby acting as catalysts for change. With this eff ective concept, TÜV NORD GROUP recorded some initial successes with external customers in 2019.
EmployeesAs of 31 December 2019, the domestic and foreign companies of the TÜV NORD GROUP employed an average of 11,235 staff (converted to full-time equivalent) in comparison to 10,735 in the previous year.
Including the experts provided by the associations, the average number of full-time employees was 11,276 (2018: 10,780). On the reporting date of 31 December 2019, the absolute number of employees was 14,088. The proportion of women working in the Group remains at 29%.
7,889 employees work in Germany. The number of employees abroad increased in 2019 to 3,387. The largest business unit is Industrial Services, with 5,910 employees in Germany and abroad, followed by the Mobility business unit with 2,761 employees.
It is the knowledge and technical expertise of the staff that form the basis of the long-term success of the TÜV NORD GROUP. For this to be maintained, a comprehensive portfolio of measures for the training and development of staff and managers alike is an absolute necessity. Expenditure amounting to €8.2 million was in-curred in 2019 for the use of internal and external training services (2018: €8.0 million).
As an employer, the TÜV NORD GROUP is the byword for open and authentic communication, both internally and with the outside world. The average length of service in TÜV NORD GROUP, at over ten years, is higher than the comparable fi gures from the competi-tor companies. This shows just how important it is for the Group to have a culture that strengthens the bonds of loyalty between the employees and their companies. The “Open Company” seal of approval issued by Kununu since 2012 confi rms the successful implementation of these values.
The Board of Management would like to thank all the staff and company managers, both domestic and abroad, for their commit-ment. The success achieved in the year 2019 would have been impossible without their dedication to their work. The thanks also go out to the employee representatives for their constructive collaboration in a spirit of trust.
R E P O R T O N E X P E C T E D D E V E L O P M E N T S , O P P O R T U N I T I E S A N D R I S K S
Report on expected developmentsThe leading German economic research institutes expect weaker growth in the global economy as a whole in 2020 compared to 2019. This forecast is due in particular to the ongoing trade dispute between the United States and China and declining growth in the latter. Likewise, after growth of 1.1% in the Eurozone in 2019, signifi cantly lower rates of growth are also predicted here for the next two years. According to the current forecasts of leading German economic research institutes, the heavily export-dependent German economy will also grow signifi cantly more slowly than in previous years, primarily due to the negative economic impact of Brexit. Growth forecasts for 2020 are expected to average out at 0.8%.
A further growth driver in the dynamic global TICCET business are the major growth markets in the Asia-Pacifi c region. Growth is being further amplifi ed by the harmonisation of standards and guide-lines as well as the introduction of new legal frameworks and standards. In contrast, relatively low growth rates on the domestic and European markets, high levels of competitive pressure and the existing skills shortage may have a negative impact on the growth of the European market participants.
For the 2020 reporting period, the TÜV NORD GROUP thus expects a stable development with regard to fi nancial performance indicators. Furthermore, an increase in sales with a rate of growth slightly in excess of the level achieved in 2019 is expected. The major organic growth drivers are the Industrial Services, Mobility and Engineer-ing and Natural Resources business units.
The TÜV NORD GROUP anticipates, as before, that all the business units will continue to contribute positively to earnings. A positive operative result is anticipated for the Group as a whole, albeit one which, due to high levels of expenditure on future projects and a worsening macroeconomic outlook, will be slightly below the operative level of the 2019 reporting period.
62
T Ü V N O R D G R O U P | C O R P O R A T E R E P O R T
The most important objectives of the conservative fi nancial policy remain the further maintenance of the Group’s good rating and the safeguarding of an adequate level of liquidity for the centralised fi nancing of the subsidiary companies by the Group at a level that meets their needs. In addition, it is fundamental to the Group’s fi nancial strategy to ensure a broad measure of fi nancial fl exibility along with transparent risk and opportunity management.
The Deutsche Bundesbank, having investigated important fi nancial metrics such as profi tability, internal fi nancing strength, liquidity and capital structure on the basis of audited fi nancial statements, has for the thirteenth year in succession awarded the TÜV NORD Group the accolade of eligibility for refi nancing with central banks. The Group thus belongs to the group of companies whose credit liabilities can be used by commercial banks as collateral with regard to the Deutsche Bundesbank. This guarantees the TÜV NORD GROUP a preferred position in terms of access to fi nancial resources.
The cash fl ow (see “Consolidated Cash Flow Statement”) amounted to €86.6 million and was essentially applied to investments in intangible assets and in fi xed assets and in property, plant and equipment, and to the reinsurance of pension liabilities. Capital expenditure excluding corporate acquisitions amounted to €56.7 million in the year under review as against €57.6 million in 2018. Of this, €48.5 million was invested by the German companies, and €8.2 million abroad. The focus was on the construction of real estate in Essen, physical investment in testing equipment, vehicle fl eets and computer hardware and software. No material capital expenditure obligations existed as of the reporting date.
The Group spent a total of €7.4 million (2018: €2.2 million) on the acquisition of companies and equity holdings during the year under review. All projects were assessed by value creation criteria; every potential acquisition or capital investment project was assessed and analysed both regarding the return and its impact on the consoli-dated balance sheet.
The Group’s net fi nancial position amounted to €37.0 million at the end of the year under review, a fi gure that was, despite high investments, above that of the previous year (2018: €21.9 million).
The existing syndicated loan for the Group for €100.0 million had not been used as of 31 December 2019.
In 2019, the Group was in the position to meet its payment obli-gations at all times.
Overall situationIn view of the macroeconomic situation, the TÜV NORD GROUP is satisfi ed with the way the year under review progressed. However, notwithstanding the very good operating profi t of the Group, every eff ort continues to be made to optimise the company’s position in terms of its earnings, assets and fi nances. TÜV NORD GROUP assumes that the earnings, asset and fi nancial positions will remain stable in the future.
N O N - F I N A N C I A L P E R F O R M A N C E I N D I C AT O R S
Innovation reportThe technological revolution is having a signifi cant impact on the Group’s business. The Group needs a vibrant and purposeful culture of innovation, the targeted promotion of innovation and an es-tablished and active innovation management to form the basis of its success if these opportunities are to be exploited and the challenges mastered. Digitalisation and innovation are therefore key drivers for the growth of the TÜV NORD GROUP.
In 2019, an Innovation Council was established from across the business units to act as a governance body for the continuous development of the innovation portfolio of TÜV NORD GROUP.
Innovation boards have been implemented in all the business units with responsibility for the monitoring, controlling and coordination of the respective innovation processes. These boards assess and decide on the continuation of individual innovation ideas and projects from the initial idea through to market launch.
The establishment of innovation controlling has made it possible for the TÜV NORD GROUP to carry out quarterly surveys and analyses of sales, costs, investments, employee numbers and general inno-vation costs. The Board of Management and the Supervisory Board are regularly kept informed of the results.
The expertise of the TÜV NORD employees and its global presence form the ideal basis for the digital transformation and the Group’s innovation process, both of which are needed to underpin the success of TÜV NORD GROUP’s customers in the digital age. For this purpose, the TÜV NORD GROUP is also involved in universities and cooperates with research institutions. In addition, employees of the TÜV NORD GROUP are to be found in relevant committees for the domestic and international development of industry-specifi c regulations.

16
T Ü V N O R D G R O U P | A N N U A L R E P O R T
64
T Ü V N O R D G R O U P | C O R P O R A T E R E P O R T
For the Industrial Services business unit, moderate sales growth is expected in the classic business fi elds, both in Germany and abroad. In 2020 the costs of growth and future projects, coupled with stiff competition, will have a dampening eff ect on earnings. However due to the expected improvement in earnings and the above-mentioned initial consolidation, a moderate improvement in the operating result is nevertheless planned.
For the Mobility business unit, the growth trend in sales and earnings is expected to continue. This is mainly due to the expansion of the partner organisation as well as the digitalisation and further development of services.
In 2020, the Engineering and Natural Resources business unit is forecast to see increased demand in 2020 in the areas of infra-structure, plant engineering and plant and product testing. In the context of eff orts to reduce its dependence on the commodities market and to boost sales, additions to the service portfolio are planned both in Germany and abroad, as is an expansion of the engineering activities. New services and products are thus expected to increase sales, which will be roughly at the level of the 2019 reporting period. A moderate increase in operating profi t is forecast.
The Training business unit expects sales and earnings to increase in 2020, mainly due to the strong growth in products off ered on the free market by the TÜV NORD Akademie. A slight decline in oper-ating profi t is planned as a result of investments in future projects.
The Aerospace business unit plans a decline in sales and a stable result for 2020. The unit is continuing its strategy of focusing on services with high added value.
The IT business unit is planning signifi cant sales and earnings in-creases, particularly in the IT security fi eld.
The planned increases in turnover in the Group go hand in hand with a scheduled increase in the number of employees for 2020. The increase in the workforce is accounted for by recruitment, principally in the Industrial Services and Mobility business units.
The innovation projects identifi ed in the context of the Strategy 2020plus should contribute to the organic growth of the Group in the long term. These projects will continue in 2020 with the aim of developing new services.
Risk and opportunity management systemIts international presence means that the TÜV NORD GROUP is exposed to a wide range of risks but also well positioned to take advantage of opportunities. The risk and opportunity management system is thus an important element of corporate governance. Early identifi cation and forward-looking management form the basis of a systematic risk and opportunity management policy.
In the context of the risk and opportunity management system, regular analyses of market and competition data are carried out in all the companies in which the TÜV NORD GROUP holds a majority stake. Market potentials are continuously observed for the early identifi cation of macroeconomic and sector-specifi c opportunities. Moreover, effi cient measures to reduce or eliminate risk are intro-duced. A standardised, IT-supported periodic process is used to identify risks in the individual companies at the end of each quarter. The risks identifi ed here are assessed in line with the scale of their potential to cause damage and likelihood of occurrence, so that recommendations for action can subsequently be developed and implemented to minimise or eliminate risk. For individual risks, precautionary provision is made where necessary. With the aid of the Group’s centralised insurance management system, the possible fi nancial impacts of arising risks can be limited using appropriate insurance contracts. Any risks remaining after the countermeasures have been adopted serve as the basis for reporting to the risk management of the TÜV NORD GROUP. Generally reported on at scheduled intervals are signifi cant and existential risks, with additional ad-hoc reports as and when particular events occur.
The Group Executive Committee, the Board of Management and the Supervisory Board are kept informed at regular intervals of the current risk situation of the Group. They discuss at length the causes of the risk situation and the measures taken in response to it. Additionally, the eff ectiveness of the risk management system is verifi ed by the corporate internal audit department and external auditors. The results of these audits are reported to the Board of Management and the Supervisory Board.
Risks and Opportunities for TÜV NORD GROUPWith its diversifi ed services, the Group is exposed to a wide range of risks but well positioned to take advantage of a whole raft of opportunities. None of these have signifi cantly changed in a year-on-year comparison. In the 2019 reporting period, no risks were identifi ed which might either individually or collectively

17
C O N S O L I D A T E D F I N A N C I A L S T A T E M E N T S 2 0 1 9
65
F I N A N C I A L R E P O R T
endanger the survival of the Group or substantially impair its asset, fi nancial and earnings position. As far, as can be seen at present, there are no risks in the foreseeable future, which might jeopardise the survival of the Group.
Interest rate risks can arise in connection with pension obligations. The plan assets intended to fi nance the pension obligations are managed in a fi duciary capacity by the TÜV NORD PENSION TRUST e.V., which was founded in 2008. Changes to the actuarial interest rates in the valuation of pension obligations can have an impact on the net present value of the discounted pension obligations and thus infl uence the equity capital and overall earnings.
The Group is not exposed to any material price change, credit loss or liquidity risks, or to risks arising from fl uctuations in cash fl ow. The Group’s fi nancial assets are invested in such a way that, as far as can be seen at present, no material risks exist.
Digitalisation and global networking are both an opportunity for, and a challenge to, the TÜV NORD GROUP.
The individual business units report the following risks and oppor-tunities in their business activities:
The Industrial Services business unit expects its business to continue to develop positively in the coming years. The business unit is exposed to risks, above all in its core European market. Intense price competition in tandem with equally intense competition regarding the recruiting of qualifi ed staff may have a negative impact on the achievement of its objectives. Digitalisation off ers the opportunity both to mitigate the skill shortage threat posed by demographic developments and to slim down processes. However, there is a real risk in Germany that regulations will be amended with the eff ect that previously mandatory tests will no longer be required and / or other, yet less qualifi ed staff , will be granted permission to carry out tests in place of the experts. Opportunities for the expansion of business activities lie in off ering new services and expanding existing ones: for example, the Group’s market presence in the fi elds of wind energy, railway technology, food and medical devices is being geared to international markets. To realise these oppor-tunities, an organisational structure has been put in place that focuses even more single-mindedly on the customers. Using this structure, all the companies within the business unit have since January 2019 been managed using a standardised process. In addition, the sales
activities of the business units are being intensifi ed. Alongside the emphasis on the acquisition of major national and international projects, a strong focus is being placed on the expansion of cross-selling activities.
As a result of the amendment of the Atomic Energy Act in 2011, the nuclear business is confronted with the medium- to long-term risk of declining orders in Germany. All the important contracts for de-commissioning and dismantling in Germany have been acquired, thereby creating a long-term basis for the further adaptation of the portfolio. There are long-term opportunities in the German market with regard to decommissioning and waste management, diversifi ca-tion, modernisation and the digitalisation of products and services. The integration of international companies and their areas of expertise is opening up new markets and opportunities in the global energy sector, for example in the energy supply systems fi eld (grids and storage).
In the certifi cation business, changes to the statutory base make it impossible to rule out the possibility that individual services will become obsolete or be cut back. However, due to the high level of diversifi cation and the heterogeneity of the customer structure, this risk is manageable. The risk remains that accreditation bodies will impose drastic sanctions, up to and including the revocation of accreditation for certain areas, in the event of violations of the rules by individual employees of the certifi cation company. In TÜV NORD CERT GmbH, a quality management system has been set up for the purpose, for instance, of obtaining the important and central DAkkS accreditation, one of the functions of which is to minimise risk through internal auditing. Opportunities continue to arise through process optimisation and investments in the areas of digitalisation alongside energy management, social standards and consumer protection.
The development of the Mobility business unit is expected to remain stable in the coming years while the previous premises and con-ditions remain largely unchanged. The customer-group-oriented strategy of the Mobility business unit fundamentally revolves around the identifi cation using market and competition analyses of sector-specifi c risks and changes in market conditions in the segments and regions. The implementation of a nationwide market presence with franchise partners will allow services to be off ered throughout Germany, with the eff ect of countering the trend to-wards increasing concentration in the car dealership and workshop

18
T Ü V N O R D G R O U P | A N N U A L R E P O R T
66
T Ü V N O R D G R O U P | C O R P O R A T E R E P O R T
sector. The Group is prey to intensive eff orts by the competition to lure away both customers and staff , giving rise to a risk that top performers will be lost to the Group. Targeted measures are being implemented to fi nd suitable applicants for vacant positions and to enhance the loyalty to the company of its top performers.
No discernible risks to the Mobility business unit have arisen out of the exhaust emissions scandal that was uncovered in the 2015 reporting period. The scandal has aff ected the type approval process in the form of changes to testing and measurement procedures and the increased use of appropriate measuring technology. Oppor-tunities have arisen for the Mobility business unit out of the changes in inspection and measurement procedures (e.g. the further development of type testing for exhaust gas emissions) and the increasing use of the corresponding measurement technology (e.g. Real Driving Emission (RDE), Portable Emission Measurement Systems (PEMS)). As of 2018, tailpipe emissions measurements have been made mandatory once again for all vehicles to ensure the maximum eff ectiveness of the periodic exhaust emissions tests. Tech-nological developments in the automotive sector are resulting in changes in the requirements on data protection and data security. The increasing complexity of equipment and vehicles requires that the existing tests be supplemented by the testing of software for security management purposes. The Group sees opportunities to expand business activities in the manufacturing business in the form of the further development of methods to test systems in-stalled in vehicles. The off er of vehicle valuations in growing second-hand car markets around the world presents further opportunities. Penetration of the market will be facilitated here using new tech-nologies and the development of targeted corporations.
The Engineering and Natural Resources business unit’s project business is subject to special complexity and country risks as well as to risks that arise from increasing competitive pressure. Overall, demand for commodities-related services depends on global eco-nomic development, as does the infrastructure and plant construction market. Demand has stabilised at a low level in the exploration seismology fi eld; invitations to tender for major projects are being issued here. However, the level of competitive pressure remains high. Dependence on the mining industry is being gradually reduced by expanding the service portfolio, consistently implementing innovation projects and entering new markets. In plant engineering, for example, the business unit is also off ering its service portfolio in the chemical and petrochemical industry, thereby expanding a customer spectrum, which used to be limited to the steel industry.
For the companies of the Training business unit, falling unemploy-ment could give rise to risks in the coming years, as it may lead to a substantial reduction in the number of contracts for training measures fi nanced from public funds. The companies are mitigating the risk of regionally uneven reductions in order volumes with temporary training sites and the approval of new qualifi cation mea-sures to allow them to respond fl exibly to emerging needs. Further-more, the new Qualifi cation Opportunities Act off ers opportunities to retrain adults whose jobs are threatened by digitisation and automation. Nursing and healthcare are two areas which will in the future off er increasing opportunities, as the need for caregivers is increasing due to demographic trends. The training centres for healthcare and nursing off er initial and retraining measures along-side training and qualifi cations in geriatric care in the form of state registered seminars for care of the elderly. The greatest risk is currently to be found in the shortage of registered course heads in the fi eld of healthcare and nursing and in the implementation of the legislation governing the nursing profession which has been in force since 1 January 2010 and which still contains some signifi cant normative gaps in practical implementation that might lead to initial reluctance on the part of the training companies. In the TÜV-specifi c topic areas, there is a constant need for training as a result of technical developments or changes to rules and regulations. This will result in further opportunities for the companies in the Training business unit.
The companies in the Aerospace business unit are infl uenced by current developments and requirements in the space industry. This presents both opportunities and risks. The business unit has implemented a specialised service platform to minimise risk and seize opportunities. The “DOEEET” platform provides technical, logistical and commercial information and off ers comparison tools and crowd testing options, among other things. Prospects for business expansion are also off ered by increased growth in Europe and other emerging markets as well as the extension of existing services, such as the new Virtual Lab software, and the marketing of these services for other sectors, which require high levels of reliability. The new European regulation on the testing and certi-fi cation of drones also off ers a great opportunity for the business units, as does as the testing of small satellites.
Particular risks for the companies in the IT business unit are pre-sented by the constantly increasing shortage of IT security experts, both in Germany and abroad. Competition for qualifi ed specialists will continue in the coming year, which could jeopardise growth

19
C O N S O L I D A T E D F I N A N C I A L S T A T E M E N T S 2 0 1 9
67
F I N A N C I A L R E P O R T
ambitions in the sector, especially internationally. In Germany, recruit-ment measures are being taken, for instance at universities, and cooperation with external service providers is being intensifi ed and employee development improved, e.g. through the introduction of an expert career and a comprehensive range of trainings. The information and cybersecurity sector off ers great growth potential. New sales potential could be generated by the new strategic direction of the IT business unit, with its pronounced international focus. In June 2019, the EU introduced the Cybersecurity Act, a European regulation that strengthens the mandate of ENISA (Euro-pean Union Agency for Network and Information Security) and provides an EU-wide framework for the certifi cation of products, services and processes in line with IT security requirements. In recent years, the competences of the Federal Offi ce for Information Security (BSI) have been expanded at the national level – with the strengthening of ENISA, however, an increasing trend towards European competition is now emerging among IT security testing bodies, from which only well-positioned organisations across Europe are likely to benefi t. The IT business unit is in constant close con-tact with the BSI and ENISA and off ers advice in all IT-relevant issues.
C O R P O R AT E R E S P O N S I B I L I T Y
The TÜV NORD GROUP has now included sustainable action as an important plank of its business activities. The TÜV NORD GROUP sees the implementation of Corporate Responsibility (CR) as a long-term project.
This is based on the Group’s fi ve key values:
■■ The focus is on customers.The TÜV NORD GROUP considers it a responsibility to contribute to the success of its customers. The Group off ers them services of the highest quality and effi ciency in the context of a sustainable portfolio of services and new ideas to help them on their way into the future.
■■ Employees are the key to success. As employers, the TÜV NORD GROUP companies are responsible for creating an attractive work environment, which communicates their appreciation of their staff . They off er their employees the space they need to design a working life, which is characterised
by individual responsibility; they set great store by teamwork, support the reconciliation of work and family and off er individual training opportunities. The employees in turn have a responsi-bility to contribute to the success of the company.
■■ Integrity is the basis.TÜV NORD GROUP operates sustainably – in respect of the eco-nomy, the environment and society alike. A culture of openness is cultivated which is fi rmly rooted in mutual respect and trust. Based on a mandatory code of conduct, the TÜV NORD GROUP always acts lawfully and transparently in respect of its business partners and society. The TÜV NORD GROUP is also responsible for taking account of the impact of its actions on the environment and society.
■■ Diversity opens up new opportunities.Diversity and internationality are an enrichment for the business units and companies of the Group. The TÜV NORD GROUP promotes equal opportunities and respects the individuality of each and every person within it. The TÜV NORD GROUP uses mixed teams and interdisciplinary work to off er its customers tailor-made solutions.
■■ The Group has a forward-looking culture of innovation.The business units and companies of the TÜV NORD GROUP are continuously improving their products and processes, developing new ideas for their customers and driving innovation. They see it as their responsibility to future generations to measure their own services against sustainability criteria and requirements and to align themselves in the process with the United Nations Sustain-able Development Goals.
Back in 2018, the various activities carried out under the banner of sustainable and responsible economic management were pooled into a single Corporate Responsibility Strategy and divided into four fi elds of action:
■■ Responsible value creation ■■ Staff orientation ■■ Environmental orientation ■■ Societal orientation
These fi elds of action contain a total of 19 CR topics, which were elaborated in the wake of a materiality analysis. They were provided
66
T Ü V N O R D G R O U P | C O R P O R A T E R E P O R T
sector. The Group is prey to intensive eff orts by the competition to lure away both customers and staff , giving rise to a risk that top performers will be lost to the Group. Targeted measures are being implemented to fi nd suitable applicants for vacant positions and to enhance the loyalty to the company of its top performers.
No discernible risks to the Mobility business unit have arisen out of the exhaust emissions scandal that was uncovered in the 2015 reporting period. The scandal has aff ected the type approval process in the form of changes to testing and measurement procedures and the increased use of appropriate measuring technology. Oppor-tunities have arisen for the Mobility business unit out of the changes in inspection and measurement procedures (e.g. the further development of type testing for exhaust gas emissions) and the increasing use of the corresponding measurement technology (e.g. Real Driving Emission (RDE), Portable Emission Measurement Systems (PEMS)). As of 2018, tailpipe emissions measurements have been made mandatory once again for all vehicles to ensure the maximum eff ectiveness of the periodic exhaust emissions tests. Tech-nological developments in the automotive sector are resulting in changes in the requirements on data protection and data security. The increasing complexity of equipment and vehicles requires that the existing tests be supplemented by the testing of software for security management purposes. The Group sees opportunities to expand business activities in the manufacturing business in the form of the further development of methods to test systems in-stalled in vehicles. The off er of vehicle valuations in growing second-hand car markets around the world presents further opportunities. Penetration of the market will be facilitated here using new tech-nologies and the development of targeted corporations.
The Engineering and Natural Resources business unit’s project business is subject to special complexity and country risks as well as to risks that arise from increasing competitive pressure. Overall, demand for commodities-related services depends on global eco-nomic development, as does the infrastructure and plant construction market. Demand has stabilised at a low level in the exploration seismology fi eld; invitations to tender for major projects are being issued here. However, the level of competitive pressure remains high. Dependence on the mining industry is being gradually reduced by expanding the service portfolio, consistently implementing innovation projects and entering new markets. In plant engineering, for example, the business unit is also off ering its service portfolio in the chemical and petrochemical industry, thereby expanding a customer spectrum, which used to be limited to the steel industry.
For the companies of the Training business unit, falling unemploy-ment could give rise to risks in the coming years, as it may lead to a substantial reduction in the number of contracts for training measures fi nanced from public funds. The companies are mitigating the risk of regionally uneven reductions in order volumes with temporary training sites and the approval of new qualifi cation mea-sures to allow them to respond fl exibly to emerging needs. Further-more, the new Qualifi cation Opportunities Act off ers opportunities to retrain adults whose jobs are threatened by digitisation and automation. Nursing and healthcare are two areas which will in the future off er increasing opportunities, as the need for caregivers is increasing due to demographic trends. The training centres for healthcare and nursing off er initial and retraining measures along-side training and qualifi cations in geriatric care in the form of state registered seminars for care of the elderly. The greatest risk is currently to be found in the shortage of registered course heads in the fi eld of healthcare and nursing and in the implementation of the legislation governing the nursing profession which has been in force since 1 January 2010 and which still contains some signifi cant normative gaps in practical implementation that might lead to initial reluctance on the part of the training companies. In the TÜV-specifi c topic areas, there is a constant need for training as a result of technical developments or changes to rules and regulations. This will result in further opportunities for the companies in the Training business unit.
The companies in the Aerospace business unit are infl uenced by current developments and requirements in the space industry. This presents both opportunities and risks. The business unit has implemented a specialised service platform to minimise risk and seize opportunities. The “DOEEET” platform provides technical, logistical and commercial information and off ers comparison tools and crowd testing options, among other things. Prospects for business expansion are also off ered by increased growth in Europe and other emerging markets as well as the extension of existing services, such as the new Virtual Lab software, and the marketing of these services for other sectors, which require high levels of reliability. The new European regulation on the testing and certi-fi cation of drones also off ers a great opportunity for the business units, as does as the testing of small satellites.
Particular risks for the companies in the IT business unit are pre-sented by the constantly increasing shortage of IT security experts, both in Germany and abroad. Competition for qualifi ed specialists will continue in the coming year, which could jeopardise growth

20
T Ü V N O R D G R O U P | A N N U A L R E P O R T
68
T Ü V N O R D G R O U P | C O R P O R A T E R E P O R T
with specifi c objectives, measures and requirements for the Group’s business units and summarised in a CR Roadmap – in most cases with 2020 as the time horizon.
The CR management structure of the TÜV NORD GROUP was defi ned in 2018 via the organisational structures and bodies listed below.
In the TÜV NORD GROUP, Corporate Responsibility is anchored at the highest level of corporate governance: the responsibility lies with the Group Executive Committee. A CR steering committee consults internally on all crosscutting issues and activities – such as the creation and review of the CR Strategy, its implementation and CR reporting. The Group has created the function of CR Manager for the coordination of CR activities and communication.
At the business unit level, it is the management board of each unit, which is responsible for CR. It appoints a CR coordinator whose job is to collaborate in the CR steering committee at Group level and to support the business unit management in the strategic coordina-tion of CR activities.
In the case of the Group companies, responsibility for CR lies with the management of the respective companies. The management representative of the company supports the general management in the planning, implementation and reporting of CR activities.
The Corporate Responsibility Report for 2018 was the fi rst document to set out information on the economic, ecological and societal impact of the business activities of TÜV NORD, in which the TÜV NORD GROUP’s approach to integrating responsibility and sustain-ability into its corporate processes was explained. The plan is to publish progress reports for 2019 and 2020 to provide information on the Group’s ongoing commitment to CR.
C O R P O R AT E G O V E R N A N C E
For the eff ective implementation of corporate governance, the TÜV NORD GROUP takes its guidance from the requirements imposed by the German Corporate Governance Codex on capital-market-orientated companies. The governance structure is thus consistently aligned with the globally recognised Three Lines of Defence (TLoD) governance model and is the byword for responsible management and control with the aim of long-term value creation. With its three connected lines of defence, of which the fi rst is operative manage-
ment, the second risk management, controlling, law, compliance etc., and the third internal auditing, the TÜV NORD GROUP safeguards the lawfulness of all its business processes and organisational struc-tures along with the effi ciency and eff ectiveness of its established internal control system (ICS).
The Compliance Management System (CMS) of the TÜV NORD GROUP, which was established over 10 years ago, is an essential element of corporate governance as stipulated by TLoD. Taken together with the realignment of the Group’s mission statement and values, these strategies are a means of eff ectively preventing potential risks and averting damage to the TÜV NORD GROUP. The CMS is closely linked to the TÜV NORD GROUP’s CR strategy. Compliance and inte-grity are important components of this strategy. Compliance objectives, such as preventing corruption by means of e-learning modules, are therefore an integral part of the CR objectives.
A key role in this respect is played by the central CMS in TÜV NORD AG, which provides for the appointment of a point of contact for compliance issues. This offi cer coordinates compliance issues and tasks and is available to all employees as a point of contact. Appro-priately conceived and clearly formulated policies and regulations, accessible to all staff at all times via the Intranet, are fundamental factors when it comes to ensuring good corporate governance. The adoption of a corporate philosophy and a binding code of con-duct have given employees a concrete framework of guidelines for their actions, thus reinforcing good business practices in compliance with the law. Information events and trainings which make use of e-learning modules raise awareness among the staff of the signifi cance of compliance-relevant issues such as data protection or personal conduct at work.
The TÜV NORD GROUP takes a preventive approach to compliance and aims to reinforce a corporate culture that uses awareness-raising measures and staff education to prevent breaches of the rules before they have a chance to occur. This includes risk-oriented evaluation in the development of new business models or the acqui-sition of companies in the context of M&A projects.
Compliance is also an important assessment criterion in the selection of its suppliers and business partners and is guaranteed by a Compliance Code for suppliers and business partners, which forms the basis of existing and future business relationships. By signing the agreement on the Compliance Code, the suppliers of the Group undertake to act in the spirit of the TÜV NORD compliance stan-

21
C O N S O L I D A T E D F I N A N C I A L S T A T E M E N T S 2 0 1 9
69
F I N A N C I A L R E P O R T
dards. These include the basic requirements of human rights, equal opportunities and non-discrimination, environmental protection, product and occupational safety, and the observance of the law and the extirpation of corruption.
Members of staff , business partners and customers have a further possibility in the form of an ombudsman system, bound by principles of confi dentiality and anonymity, to communicate compliance issues or draw the Group’s attention to breaches of the compliance regulations of the TÜV NORD GROUP. A renowned lawyer, appoint-ed as an external point of contact for all employees, customers and business partners, gathers information on any violations of the law or policy to which he is alerted.
Compliance with the corporate governance rules and regulations is continually monitored by the Internal Audit Department through its risk-orientated audit planning. The quality management system implemented by the Group’s internal audit department aims to guarantee the effi ciency and eff ectiveness of its auditing work. The eff ectiveness of the established processes is regularly confi rmed by an external and voluntary audit in accordance with the DIIR (German institute of internal auditing) standard.
The CMS has been tested by external auditors on the basis of the IDW auditing standard PS 980. The audit report deemed the imple-mentation and orientation of the CMS to be appropriate. The assessment of the audit confi rms that the compliance management system is with suffi cient confi dence suitable for both the identi-fi cation of risks of major violations of the rules and the prevention of such violations in the fi rst place.
Awareness and sensitivity concerning compliance at corporate management level and among the employees have been deemed exemplary across the Group over a sustained period. Regular compliance queries submitted by the employees and the recommen-dations for conduct issued in reply in advance of active business transactions are eff ective and effi cient measures for the prevention of damage. Risk-based process controls, such as, for instance, a compliance check for business partners, systematically reduce potential compliance risks. The tracking, sanctioning, evaluation and documentation of breaches of compliance represent an integral part of the continuous improvement process. In addition to the continuous supply of up-to-date information, the Group’s point of contact for compliance presents a compliance report to the Board of Management and to the Group Executive Committee. These
measures strengthen the tried-and-tested compliance structures and permanently reinforce awareness of the mandatory nature of TÜV NORD compliance in the Group’s day-to-day business.
S TAT E M E N T O N C O R P O R AT E G O V E R N A N C E
Findings on the promotion of the participation of women in leadership positions according to Article 76 (4) and Article 111 (5) German Stock Corporation ActThe TÜV NORD GROUP pursues a strategy of diversity and is striv-ing to increase the percentage of women in managerial positions¹.
The Supervisory Board resolved back in 2017 that it was not seeking to increase the number of women in the Board of Management and the Supervisory Board for the period ending on 30 June 2022. Should any subsequent appointments become necessary, women will, as always, be off ered the same opportunities as men in both bodies.
The targets were either met or exceeded by 30 June 2017. For the fi rst and second tiers of management below the Board of Manage-ment, the target of 30% was met. For both targets, the deadline set for implementation was 30 June 2022.
For the other aff ected companies in the Group, the targets for the proportion of women in the Supervisory Board, the Board of Manage-ment and the next two tiers of management and implementation deadlines were set on time.
1 Pursuant to the act on the equal participation of women and men in managerial positions in the private and public sectors, certain companies in Germany are committed to setting targets for the proportion of women on their supervisory boards, executive boards and in the following two management tiers and to set a date for the achievement of these targets. The TÜV NORD GROUP pursues a strategy of diversity and is striving to increase the percentage of women in managerial positions.

22
T Ü V N O R D G R O U P | A N N U A L R E P O R T
70
T Ü V N O R D G R O U P | C O R P O R A T E R E P O R T
F U R T H E R I N F O R M AT I O N
TÜV NORD AG is deemed to be directly dependent within the mean-ing of Sec. 17 of the Stock Corporations Act (Aktiengesetz – AktG) upon TÜV Nord Holding GmbH & Co. KG of Hamburg and TÜV HSA Holding GmbH & Co. KG of Hanover, and indirectly dependent upon TÜV Nord e.V. and TÜV Hannover / Sachsen-Anhalt e.V. For the period from 1 January to 31 December 2019 and in respect of relevant special transactions during the 2019 fi scal year, the Board of Management of TÜV NORD AG has drawn up a report pursuant to Sec. 312 of the AktG regarding relations between the company on the one hand and TÜV Nord Holding GmbH & Co. KG, TÜV HSA Holding GmbH & Co. KG, TÜV Nord e.V., TÜV Hannover / Sachsen-An-halt e.V. and the affi liated companies on the other.
This report ends with the following declaration:
“We declare that, in the case of the legal transactions listed in the report on relations with affi liated companies, TÜV NORD AG received appropriate consideration for each transaction in accor-dance with the circumstances known to us at the time in which the legal transactions were executed.
No measures were taken or omitted on the initiative or in the interests of the dominant enterprise or any enterprise affi liated with it.”
Hanover, 28 February 2020
TÜV NORD AG
The Board of Management

23
C O N S O L I D A T E D F I N A N C I A L S T A T E M E N T S 2 0 1 9
70
T Ü V N O R D G R O U P | C O R P O R A T E R E P O R T
F U R T H E R I N F O R M AT I O N
TÜV NORD AG is deemed to be directly dependent within the mean-ing of Sec. 17 of the Stock Corporations Act (Aktiengesetz – AktG) upon TÜV Nord Holding GmbH & Co. KG of Hamburg and TÜV HSA Holding GmbH & Co. KG of Hanover, and indirectly dependent upon TÜV Nord e.V. and TÜV Hannover / Sachsen-Anhalt e.V. For the period from 1 January to 31 December 2019 and in respect of relevant special transactions during the 2019 fi scal year, the Board of Management of TÜV NORD AG has drawn up a report pursuant to Sec. 312 of the AktG regarding relations between the company on the one hand and TÜV Nord Holding GmbH & Co. KG, TÜV HSA Holding GmbH & Co. KG, TÜV Nord e.V., TÜV Hannover / Sachsen-An-halt e.V. and the affi liated companies on the other.
This report ends with the following declaration:
“We declare that, in the case of the legal transactions listed in the report on relations with affi liated companies, TÜV NORD AG received appropriate consideration for each transaction in accor-dance with the circumstances known to us at the time in which the legal transactions were executed.
No measures were taken or omitted on the initiative or in the interests of the dominant enterprise or any enterprise affi liated with it.”
Hanover, 28 February 2020
TÜV NORD AG
The Board of Management

24
T Ü V N O R D G R O U P | A N N U A L R E P O R T
73
F I N A N C I A L R E P O R T
Consolidated Income Statement
€k Note 2019 2018
Revenue 3.1. 1,282,351 1,229,470
Other internally generated additions to assets 720 69
Other operating income 3.2. 45,160 39,376
Cost of materials 3.3. −238,408 −216,122
Personnel expense 3.4.
a) Wages and salaries −606,278 −580,389
b) Social security contributions, post-employment and welfare benefi ts −135,628 −132,137
Depreciation, amortisation and impairment losses 3.5. −59,575 −34,329
Other operating expense 3.6. −213,037 −226,125
Operating profi t 75,306 79,814
Income from investments consolidated at equity 169 671
Income from other equity investments 272 385
Interest income 1,134 956
Interest expense −2,730 −981
Other fi nancial items −101 −364
Financial items 3.7. −1,256 666
EBT (earnings before tax) 74,049 80,480
Taxes on income 3.8. −28,002 −29,286
Consolidated earnings after tax 46,047 51,195
The consolidated earnings after tax are attributable to
owners of TÜV NORD AG 42,673 48,019
non-controlling interests 3,374 3,176

25
C O N S O L I D A T E D F I N A N C I A L S T A T E M E N T S 2 0 1 9
Statement of Comprehensive Income
€k 2019 2018
Consolidated earnings after tax 46,047 51,195
Items that will not be reclassified subsequently to the Income Statement
Actuarial gains and losses
Changes from unrealized gains and losses1 −33,128 −51,020
Taxes 8,880 14,390
−24,248 −36,630
Interests from subordinated registered debenture −2,063 −2,063
Changes in the fair value of financial investments in equity instruments recognised at fair value that do not affect net income 40 6
Share in other comprehensive income of at equity consolidated investments 281 −111
Total items that will not be reclassified subsequently to the Income Statement −25,990 −38,798
Items that will be reclassified subsequently to the Income Statement
Currency translation
Changes from unrealized gains and losses 1,030 −465
Changes from realized gains and losses 393 0
1,423 −465
Share in other comprehensive income of at equity consolidated investments
Changes from unrealized gains and losses 69 153
Total items that will be reclassified subsequently to the Income Statement 1,492 −312
Other comprehensive income −24,498 −39,110
Total comprehensive income 21,549 12,085
The total comprehensive income is attributable to
owners of TÜV NORD AG 18,551 9,598
non-controlling interests 2,998 2,487
1 Including non-controlling interests amounting to €−905k (2018: €−700k).

26
T Ü V N O R D G R O U P | A N N U A L R E P O R T
74
T Ü V N O R D G R O U P | C O R P O R A T E R E P O R T
Consolidated Balance Sheet
ASSETS€k Note 31. 12. 2019 31. 12. 2018
A. Non-Current Assets
Intangible assets 5.1. 99,559 94,192
Property, plant and equipment 5.2. 245,827 236,289
Rights of use from leases 5.3. 79,132 0
At equity consolidated investments 5.4. 8,233 6,471
Other fi nancial assets 5.5. 28,640 27,189
Trade and other receivables 5.7. 127 143
Other assets 5.8. 5,245 5,050
Deferred tax assets 3.8. 189,507 178,851
Total Non-Current Assets 656,270 548,185
B. Current Assets
Inventories 5.6. 5,291 3,394
Trade and other receivables 5.7. 265,428 265,363
Other assets 5.8. 16,594 15,541
Current tax assets 9,964 10,209
Cash and cash equivalents 5.9. 89,321 73,512
Total Current Assets 386,598 368,019
C. Assets Held For Sale 5.10. 0 7,813
Total Assets 1,042,868 924,017

27
C O N S O L I D A T E D F I N A N C I A L S T A T E M E N T S 2 0 1 9
75
F I N A N C I A L R E P O R T
EQUITY AND LIABILITIES€k Note 31. 12. 2019 31. 12. 2018
A. Equity
Subscribed capital 5.11. 10,000 10,000
Capital reserves 5.11. 114,413 114,413
Subordinated registered debenture 5.11. 50,000 50,000
Retained earnings 5.11. 258,990 220,916
Other equity items 5.11. −321,281 −297,159
Non-controlling interests 5.11. 11,865 10,557
Total Equity 123,987 108,727
B. Non-Current Liabilities and Provisions
Provisions for pensions and other post-employment benefi ts 5.12. 528,470 507,195
Other provisions 5.13. 34,583 35,682
Amounts payable to banks 5.14. 135 130
Liabilities from leases 5.14. 58,748 326
Trade and other payables 5.14. 11,572 8,545
Deferred tax liabilities 3.8. 12,262 9,407
Total Non-Current Liabilities and Provisions 645,770 561,285
C. Current Liabilities and Provisions
Provisions 5.13. 50,262 51,071
Amounts payable to banks 5.14. 171 105
Liabilities from leases 5.14. 21,022 158
Trade and other payables 5.14. 190,037 191,488
Current tax liabilities 11,619 11,183
Total Current Liabilities and Provisions 273,111 254,005
Total Equity and Liabilities 1,042,868 924,017
74
T Ü V N O R D G R O U P | C O R P O R A T E R E P O R T
Consolidated Balance Sheet
ASSETS€k Note 31. 12. 2019 31. 12. 2018
A. Non-Current Assets
Intangible assets 5.1. 99,559 94,192
Property, plant and equipment 5.2. 245,827 236,289
Rights of use from leases 5.3. 79,132 0
At equity consolidated investments 5.4. 8,233 6,471
Other fi nancial assets 5.5. 28,640 27,189
Trade and other receivables 5.7. 127 143
Other assets 5.8. 5,245 5,050
Deferred tax assets 3.8. 189,507 178,851
Total Non-Current Assets 656,270 548,185
B. Current Assets
Inventories 5.6. 5,291 3,394
Trade and other receivables 5.7. 265,428 265,363
Other assets 5.8. 16,594 15,541
Current tax assets 9,964 10,209
Cash and cash equivalents 5.9. 89,321 73,512
Total Current Assets 386,598 368,019
C. Assets Held For Sale 5.10. 0 7,813
Total Assets 1,042,868 924,017

28
T Ü V N O R D G R O U P | A N N U A L R E P O R T
Consolidated Cash Flow Statement
€k Note 2019 2018
Consolidated earnings after tax 46,047 51,195
Adjustments to take account of non-cash transactions
Depreciation of property, plant and equipment, amortisation of intangible assets and rights of use from leases 59,575 34,329
Amortisation of financial assets 101 364
Pension expenses −20,671 −29,789
Interest expenses on liabilities from leases 1,499 0
Cash flow 86,551 56,099
Appropriation of profits of at equity consolidated investments 291 −471
Interest income / expense 97 25
Changes in deferred tax assets and liabilities recognised as income or expense 2,283 5,253
Loss / Gain on disposal of intangible assets and property, plant and equipment −5,207 −2,451
Changes in inventories, receivables and other assets −4,602 −24,288
Changes in payables, other provisions and other liabilities 28,414 31,041
Income taxes paid −24,459 −19,534
Cash flow from operating activities 6. 83,368 45,674
Receipts from disposals of property, plant and equipment 22,767 5,340
Receipts from disposals of other financial assets 19 2,358
Payments for investments in intangible assets −2,571 −2,244
Payments for investments in property, plant and equipment −54,171 −55,369
Payments for investments in other financial assets −8,017 −2,010
Cash flow from investing activities 6. −41,973 −51,925
Interest received 1,140 569
Dividends to owners and non-controlling shareholders −3,509 −2,590
Interest expenses on liabilities from leases and repayment of liabilities from leases −22,269 0
Payments for the amortisation of loans 742 −246
Interest paid −3,060 −2,693
Cash flow from financing activities 6. −26,956 −4,960
Net change in cash and cash equivalents through payments made and received 14,439 −11,211
Net change in cash and cash equivalents through changes in exchange rates and in the basis of consolidation 1,370 15
Cash and cash equivalents at the beginning of the period 73,512 84,708
Cash and cash equivalents at the end of the period 89,321 73,512
Supplementary information:
Receipts from dividends included in cash flow from operating activities 732 585

29
C O N S O L I D A T E D F I N A N C I A L S T A T E M E N T S 2 0 1 9

30
T Ü V N O R D G R O U P | A N N U A L R E P O R T
Statement of Changesin Consolidated Equity
Further information on equity can be found in the Notes 5.11.
€k
Subscribed capital
Capital reserves
Subordinated
registered debenture
Retained earnings
Currency
translation differences
Financial Instruments at fair value through OCI
Actuarial gains and losses
Interests from subordinated
registered debenture
Share of
TÜV NORD AG’s owners
Non-controlling interests
Consolidated equity
Carrying amounts as of 31 December 2017 10,000 114,413 50,000 171,135 −3,006 −48 −247,646 −3,931 90,917 10,263 101,180
Adjustments IFRS 9, IFRS 15 0 0 0 4,505 0 0 0 0 4,505 0 4,505
Carrying amounts as of 1 January 2018 10,000 114,413 50,000 175,640 −3,006 −48 −247,646 −3,931 95,422 10,263 105,685
Comprehensive income 0 0 0 48,019 −118 6 −36,246 −2,063 9,598 2,487 12,085
Dividend payment 0 0 0 −1,238 0 0 0 0 −1,238 −1,352 −2,590
Changes in basis of consolidation 0 0 0 −1,057 0 0 0 0 −1,057 −841 −1,898
Other changes 0 0 0 −448 0 0 −4,107 0 −4,555 0 −4,555
Carrying amounts as of 31 December 2018 10,000 114,413 50,000 220,916 −3,124 −42 −287,999 −5,994 98,170 10,557 108,727
Carrying amounts as of 1 January 2019 10,000 114,413 50,000 220,916 −3,124 −42 −287,999 −5,994 98,170 10,557 108,727
Comprehensive income 0 0 0 42,673 1,234 40 −23,333 −2,063 18,551 2,998 21,549
Dividend payment 0 0 0 −1,000 0 0 0 0 −1,000 −2,509 −3,509
Changes in basis of consolidation 0 0 0 −1,670 0 0 0 0 −1,670 819 −851
Other changes 0 0 0 −1,929 0 0 0 0 −1,929 0 −1,929
Carrying amounts as of 31 December 2019 10,000 114,413 50,000 258,990 −1,890 −2 −311,332 −8,057 112,122 11,865 123,987

31
C O N S O L I D A T E D F I N A N C I A L S T A T E M E N T S 2 0 1 9
€k
Subscribed capital
Capital reserves
Subordinated
registered debenture
Retained earnings
Currency
translation differences
Financial Instruments at fair value through OCI
Actuarial gains and losses
Interests from subordinated
registered debenture
Share of
TÜV NORD AG’s owners
Non-controlling interests
Consolidated equity
Carrying amounts as of 31 December 2017 10,000 114,413 50,000 171,135 −3,006 −48 −247,646 −3,931 90,917 10,263 101,180
Adjustments IFRS 9, IFRS 15 0 0 0 4,505 0 0 0 0 4,505 0 4,505
Carrying amounts as of 1 January 2018 10,000 114,413 50,000 175,640 −3,006 −48 −247,646 −3,931 95,422 10,263 105,685
Comprehensive income 0 0 0 48,019 −118 6 −36,246 −2,063 9,598 2,487 12,085
Dividend payment 0 0 0 −1,238 0 0 0 0 −1,238 −1,352 −2,590
Changes in basis of consolidation 0 0 0 −1,057 0 0 0 0 −1,057 −841 −1,898
Other changes 0 0 0 −448 0 0 −4,107 0 −4,555 0 −4,555
Carrying amounts as of 31 December 2018 10,000 114,413 50,000 220,916 −3,124 −42 −287,999 −5,994 98,170 10,557 108,727
Carrying amounts as of 1 January 2019 10,000 114,413 50,000 220,916 −3,124 −42 −287,999 −5,994 98,170 10,557 108,727
Comprehensive income 0 0 0 42,673 1,234 40 −23,333 −2,063 18,551 2,998 21,549
Dividend payment 0 0 0 −1,000 0 0 0 0 −1,000 −2,509 −3,509
Changes in basis of consolidation 0 0 0 −1,670 0 0 0 0 −1,670 819 −851
Other changes 0 0 0 −1,929 0 0 0 0 −1,929 0 −1,929
Carrying amounts as of 31 December 2019 10,000 114,413 50,000 258,990 −1,890 −2 −311,332 −8,057 112,122 11,865 123,987
Accumulated Other Comprehensive Income

32
T Ü V N O R D G R O U P | A N N U A L R E P O R T
32
Notes to the Consolidated Financial Statements
33 General Principles35 Summary of Significant Accounting Policies42 Consolidated Income Statement Disclosures44 Notes on the Consolidated Statement of Comprehensive Income45 Consolidated Balance Sheet Disclosures60 Consolidated Cash Flow Statement Disclosures60 Other Disclosures71 Governing Bodies

N O T E S T O T H E C O N S O L I D A T E D F I N A N C I A L S T A T E M E N T S
33
Notes to the Consolidated Financial Statements
1 . G E N E R A L P R I N C I P L E S
1.1. Corporate informationThe TÜV NORD Group is one of the biggest technical service pro- viders in Germany, offering a broad range of testing, certification, engineering, consulting and training services for its customers in its Industrial Services, Mobility, Engineering and Natural Resources, Training, Aerospace and IT business units in all the world’s major countries.
TÜV NORD AG, with its registered office in Hanover, Germany, is the parent company of the Group, registered with the Commercial Registry of Hanover Local Court under no. HRB 200158.
The Board of Management of TÜV NORD AG completed the prepa- ration of the Consolidated Financial Statements as of 31 December 2019 and the Group Management Report for the 2019 fiscal year on 28 February 2020 and approved them for submission to the Supervisory Board.
1.2. Basis of presentation Taking advantage of the right of election pursuant to Art. 315e (3) of the German Commercial Code (HGB), TÜV NORD AG prepared its Consolidated Financial Statements up to 31 December 2019 in accordance with International Financial Reporting Standards (IFRS), while at the same time complying with the German supplementary provisions pursuant to Art. 315e (1) HGB. All the International Accounting Standards (IAS) and International Financial Reporting Standards (IFRS) adopted by the International Accounting Standards Board (IASB) up to 31 December 2019 and all the pronouncements of the International Financial Reporting Standards Interpretations Committee (IFRS IC) have been applied in relation to the 2019 fiscal year, to the extent that such standards had received the en-
dorsement of the Commission of the European Union up to the time of publication of the Consolidated Financial Statements and that their application is mandatory. The use of the two- statement approach shows a breakdown of the expense recognised in equity and income (Statement of Comprehensive Income) in addition to the Profit and Loss Account, the Balance Sheet and the Cash Flow Statement.
In order to achieve equivalence with consolidated financial statements prepared in accordance with the HGB, all statutory requirements of disclosure and explanation going beyond the IASB requirements have been complied with, in particular the preparation of a Group Management Report.
The Consolidated Financial Statements are presented in euro and on the basis of original cost (costs of purchase or production), with the exception of certain financial instruments which are recognised at fair value.
Unless otherwise indicated, the amounts are stated in thousands of euro (€k). The use of rounded-off values and percentages may result in differences due to financial rounding. For the sake of clarity and to make the financial statements more readily understandable, certain individual items are aggregated in the Balance Sheet and the Income Statement but disclosed and explained separately in the notes.
The Consolidated Financial Statements are based on the consolidated accounts. Separate financial statements of subsidiary companies prepared in their local currencies are translated into euro.
The reporting periods of the TÜV NORD Group and of all consolidated subsidiaries end on 31 December of each successive calendar year.

34
T Ü V N O R D G R O U P | A N N U A L R E P O R T
34
1.3. Accounting standards applied for the first time in the year under review
The IASB or, as the case may be, IFRS IC, has issued the following standards, amendments, clarifications and interpretations to exist- ing standards, which have received endorsement from the EU, i.e. been adopted into European law, and whose application is manda-tory in respect of the 2019 fiscal year:
E F F E C T I V E A P P L I C AT I O N
Standard / Interpretation Mandatory application
IFRS 16 “Leases”
Reporting periods beginning on or after 1. 1. 2019
IFRIC 23 “Uncertainty over Income Tax Treatments”
Reporting periods beginning on or after 1. 1. 2019
Amendments to IAS 19 “Plan Amend-ment, Curtailment or Settlement”
Reporting periods beginning on or after 1. 1. 2019
Amendments to IAS 28 “Long-term Interests in Associates and Joint Ventures”
Reporting periods beginning on or after 1. 1. 2019
Amendments to IFRS 9 “Prepayment Features with Negative Compensation”
Reporting periods beginning on or after 1. 1. 2019
Annual Improvements to IFRS Standards (Cycle 2015–2017)
Reporting periods beginning on or after 1. 1. 2019
In January 2016, the IASB published the new IFRS 16 standard entitled “Leases”, which supersedes the previous leasing standard IAS 17. The new standard must be applied by law to reporting periods beginning on or after 1 January 2019. The Group has been applied IFRS 16 for the first time in 2019. For more information on the effects, see 2.5.
All further, accounting standards whose application is mandatory as of the 2019 fiscal year have been applied by TÜV NORD AG; this has not, however, had any material impact on the presentation of the financial statements.
1.4. Newly issued accounting standards not yet applied The following amendments to existing standards issued by the IASB have already been adopted into European law, but their application is not yet mandatory for the year under review. The company has not elected to apply this provision in advance of its becoming mandatory.
N O E L E C T I V E A P P L I C AT I O N I N A D VA N C E
Standard / Interpretation Mandatory application
Amendments to IAS 1 and IAS 8 “Definition of Material”
Reporting periods beginning on or after 1. 1. 2020
Amendments to References to the Con- ceptual Framework in IFRS Standards
Reporting periods beginning on or after 1. 1. 2020
TÜV NORD AG is of the opinion that the application of the further standards, which were issued before the reporting date but whose application is not yet mandatory, will have no material consequences on assets, financial status and earnings.
The following standards and amendments to existing standards issued by the IASB have not yet received EU endorsement, with the effect that their application is not yet admissible:
A P P L I C AT I O N I N A D VA N C E I N A D M I S S I B L E
Standard / Interpretation Mandatory application
IFRS 17 “Insurance Contracts”
Reporting periods beginning on or after 1. 1. 2021
Amendments to IFRS 3 “Definition of a Business”
Reporting periods beginning on or after 1. 1. 2020
Amendments to IFRS 9, IAS 39, IFRS 7 “Interest Rate Benchmark Reform”
Reporting periods beginning on or after 1. 1. 2020
TÜV NORD AG is of the opinion that the application of these stan- dards will have no material consequences on assets, financial status and earnings.

N O T E S T O T H E C O N S O L I D A T E D F I N A N C I A L S T A T E M E N T S
35
2 . S U M M A R Y O F S I G N I F I C A N T A C C O U N T I N G P O L I C I E S
2.1. Basis of consolidationIncluding TÜV NORD AG, the Consolidated Financial Statements cover 42 (2018: 39) domestic and 43 (2018: 45) foreign companies in which TÜV NORD AG directly or indirectly holds a majority of the voting power, or over whose financial and operating policies it otherwise exerts control and is thus in a position to obtain bene- fits from their activities. In determining the situation with regard to control, potential voting rights that are currently exercisable or convertible are also taken into consideration.
In the fiscal year 2019, the removals from the list of fully consoli- dated subsidiaries resulted from one merger of a subsidiary with another fully consolidated Group company and from two deconsoli-dations on the grounds of diminished importance. Because of their increased importance, four non-consolidated companies have been consolidated for the first time.
In addition, six (2018: five) companies (see under 5.4.) are accounted for by the equity method.
Not included in the consolidation are companies which are of only minor significance for a true and fair view on assets, financial status and earnings of the Group. This waiver of consolidation has the effect of reducing group revenue by 0.8% (2018: 0.9%) and of a change in consolidated earnings before tax (EBT) of −0.4% (2018: −2.5%).
A list of shareholdings has been prepared in which TÜV NORD Group’s affiliates and other equity investments are listed, showing the proportion of the capital held. A list of all the Group’s shareholdings is published in the Federal Gazette as part of the Notes to the Consolidated Financial Statements.
2.2. Consolidation policyThe annual financial statements of the subsidiaries included in con- solidation are prepared in accordance with TÜV NORD AG’s accounting and valuation methods, which are applied uniformly throughout the Group.
Capital consolidation is effected using the purchase method, pursuant to IFRS 3, Business Combinations. Using the purchase method to account for business combinations assumes that, at the time of initial consolidation, all the assets, liabilities and contingent
liabilities of the company acquired and any intangible assets to be recognised in addition are measured at fair value. Any difference amounts between the cost of acquiring the interest in the company and the acquirer’s pro-rata share in the reassessed equity at the time of acquisition are allocated to the appropriate balance sheet items of the subsidiary up to the amount of their fair value. Any remaining positive difference is recognised as goodwill. If a negative difference arises, it is recognised as an expense in profit and loss for the reporting period during which the business com- bination takes place. Goodwill is tested for impairment at least once a year.
The earnings of subsidiary companies acquired or disposed of in the course of the fiscal year are included in the Consolidated Income Statement from the point in time when control was acquired or up to the effective time of disposal.
Significant associates and joint ventures are accounted for using the equity method. An associate is a business entity upon which the Group can exert significant influence through participation in financial and operating policy decisions, but over which it cannot exercise control. In general, such significant influence may be presumed if the Group holds 20% or more of the voting power. The pro rata earnings from such equity holdings are recognised under the item Income from investments in associates. Should any such equity investments be subject to long-term impairment, impairment losses are recognised. Where a Group company undertakes transactions with an associate, any resulting unrealised gains or losses are eliminated pro rata to the Group’s interest in the associate or joint venture.
Receivables and payables between companies included in consoli-dation are netted. Profits and losses arising out of intercompany transfers of assets that are to be recognised in the Consolidated Financial Statements are eliminated unless they are immaterial. Revenue and other income between consolidated companies are offset against the corresponding expenses.
During the process of consolidation, income tax effects are taken into account and deferred taxes recognised where appropriate.
Shares in the equity of subsidiaries that are held by parties outside the Group are recognised separately within equity capital. The proportions of the earnings of subsidiary companies attributable to outside shareholders (non-controlling interests) are stated sepa- rately in the Income Statement.

36
T Ü V N O R D G R O U P | A N N U A L R E P O R T
36
2.3. Currency translationTranslation into the presentation currencyThe annual financial statements of any foreign Group company whose functional currency is not the euro are translated into the Group presentation currency, i.e. the euro, in accordance with the functional currency concept. In general, the functional currencies of the foreign subsidiaries are their respective local currencies.
Assets and liabilities of foreign subsidiaries are translated at the exchange rate prevailing as of the balance sheet date. Equity is translated at historical rates of exchange. Expense and income are translated into euro at average rates for the year. Differences arising out of currency translation are recognised in Other compre- hensive income. Such a translation difference recognised in
comprehensive income is posted to profit and loss only if the company concerned is deconsolidated.
Translation into the functional currencyForeign currency transactions are translated into the functional currency at the exchange rate prevailing at the time of the transaction. Gains and losses resulting from the fulfilment of such transactions and from the translation as at the reporting date of monetary assets and liabilities denominated in foreign currencies are recognised in the Income Statement.
The following exchange rates are among those used for the trans- lation of the currencies of countries that are not members of the European Monetary Union:
C U R R E N C Y T R A N S L AT I O N Exchange rate as of the reporting date Annual average rate
Currency ISO Code 31. 12. 2019 31. 12. 2018 2019 2018
Brazilian real BRL 4.5157 4.4440 4.4135 4.3087
British pound sterling GBP 0.8508 0.8945 0.8773 0.8847
Bulgarian lev BGN 1.9558 1.9558 1.9558 1.9558
Canadian dollar CAD 1.4598 1.5605 1.4858 1.5302
Chinese renminbi yuan CNY 7.8205 7.8751 7.7339 7.8074
Croatian kuna HRK 7.4190 7.4125 7.4190 7.4181
Czech koruna CZK 25.4080 25.7240 25.6697 25.6432
Danish krone DKK 7.4715 7.4669 7.4744 7.4532
Egyptian pound EGP 17.9953 20.4040 17.1792 20.9776
Hong Kong dollar HKD 8.7473 8.9675 8.7724 9.2599
Indian rupee INR 80.1873 79.7296 78.8519 80.7278
Indonesian rupiah IDR 15,600.6240 16,501.6502 15,847.8605 16,806.7227
Korean won KRW 1,296.2771 1,277.9226 1,304.9038 1,299.2581
Malaysian ringgit MYR 4.5953 4.7317 4.6372 4.7642
Polish zloty PLN 4.2568 4.3014 4.2975 4.2606
South African rand ZAR 15.7773 16.4594 16.1731 15.6134
Swedish krone SEK 10.4471 10.2543 10.5876 10.2564
Thai baht THB 33.4150 37.0520 34.7722 38.1631
Turkish lira TRY 6.6845 6.0588 6.3573 5.6987
US dollar USD 1.1234 1.1450 1.1196 1.1815

N O T E S T O T H E C O N S O L I D A T E D F I N A N C I A L S T A T E M E N T S
37
2.4. Use of estimates The preparation of IFRS financial statements requires management to make certain estimates and assumptions, which have an impact on the carrying amounts of assets and liabilities, the disclosure of contingent assets and liabilities existing as of the reporting date, and the income and expense recognised for the fiscal year. In com- piling the Consolidated Financial Statements, estimates had to be made in particular with regard to the valuation of employee benefits under IAS 19, the impairment testing of goodwill, provisions from the human resources and social sector, the provision for threatened losses from pending transactions and the deferred tax assets relating to loss carryforwards.
Employee benefits relate essentially to obligations arising out of defined benefit pension commitments, which are determined on the basis of actuarial parameters. These require assumptions to be made about future wage and salary increases, trends in pension levels and the discount rate.
Changes in the parameters for determining defined benefit obligations and plan assets do not however affect consolidated earnings for the current year, since any actuarial gains or losses are recognised in Other comprehensive income.
Goodwill is subjected to an annual impairment test on the basis of the smallest cash-generating unit to which goodwill has been allocated and the management’s approved three-year operating plan.
Recognition and measurement of the provisions from the human resources and social sector and the provision for threatened losses are based on estimates of the probability of a future outflow of resources and on the basis of experience values and of the circum- stances known at the reporting date. To this extent, the actual outflow of resources may vary from the amount of the provision.
Deferred tax assets relating to loss carryforwards are accounted for on the basis of estimates of the extent to which the tax advantages can be realised in future, i.e. whether adequate taxable income or reduced tax expense is to be expected. The actual tax situation in future periods, and thus the actual extent to which loss carryfor- wards can be utilised, may vary from the estimate made at the time when the deferred taxes were recognised.
2.5. Change in accounting methodsThe first-time application of IFRS 16 had an impact on the consoli-dated financial statements. The changeover to IFRS 16 was based on the modified retrospective approach. As set forth below, IFRS 16 was applied without the retroactive adjustment of comparative disclosures.
As part of the changeover to IFRS 16, assets for the rights of use from leases amounting to €99,902k and liabilities from leases for €99,902k were recognised as of 1 January 2019. Of these lease liabilities, €21,484k were due within one year.
The Group has decided not to apply the new recognition and valuation rules to leases whose maturity ends within 12 months of the date of initial application. In this case, leases such as short-term leases and leases for low-value assets are recognised as expense from short-term leases and leases for low-value assets.
Based on the operating lease obligations as of 31 December 2018, the following reconciliation to the opening balance sheet value of lease liabilities took place as of 1 January 2019:
R E C O N C I L I AT I O N
€k
Operating lease obligations as of 31 December 2018 110,327
Minimum lease payments (nominal value) of liabilities from finance lease as of 31 December 2018 524
Use of recognition exemptions for short-term leases and leases for low-value assets −5,627
Other 252
Gross lease liabilities as of 1 January 2019 105,476
Discounting −5,574
Lease liabilities as of 1 January 2019 99,902
Present value of financial lease liabilities as of 31 December 2018 −509
Additional lease liabilities due to initial application of IFRS 16 as of 1 January 2019 99,393
Lease liabilities were discounted using incremental borrowing interest rates on 1 January 2019. In order to determine the incre-

38
T Ü V N O R D G R O U P | A N N U A L R E P O R T
38
mental borrowing interest rates, reference interest rates for a period of up to 30 years were derived from the yields on corporate bonds in major countries or currencies, provided that there was a sufficiently liquid market for corporate bonds. The reference interest rates were supplemented by a leasing risk premium.
The following figures resulted for the Consolidated Income Statement:
L E A S I N G I N T H E C O N S O L I D AT E D I N C O M E S TAT E M E N T
€k 2019
Amortisation of rights of use 20,770
Other operating expenses
Expenses from short-term leases and leases for low-value assets (plus ancillary costs from leases) 19,155
Financial items
Interest expense on lease liabilities 1,499
Information on rights of use and lease liabilities as well as further explanations can be found under the corresponding balance sheet items.
2.6. Accounting policiesAccounting is undertaken in accordance with the following principles:
Revenue realisationRevenue essentially consists of earnings from services and, pursuant to IFRS 15, is recognised in the period in which it was generated. In the consolidated balance sheet, the amounts recognised as inven- tories prior to the application of IFRS 15 as supplies are identified as contract assets.
The degree of completion or progress per contract to be applied is thereby calculated by the ratio of accrued costs to the calculated total costs (cost-to-cost method).
Intangible assetsIntangible assets encompass intangible assets acquired for consider- ation and internally generated intangible assets and goodwill.
Intangible assets acquired for consideration, e.g. software and ac- creditations, are valued at historical cost. This position also includes items identified during purchase price allocations, e.g. customer relations.
Internally generated intangible assets, e.g. software or research and development costs, are recognised at production cost if this meets the recognition criteria of IAS 38.
Intangible assets with a certain useful life are subject to amortisation by the straight-line method over a period of generally between 3 and 15 years, depending on the expected future economic benefits. The useful life is subject to annual review and, if necessary is adjusted in accordance with future expectations. If there is any indi- cation of impairment or if the recoverable amount is less than the amortised cost, an impairment loss must be recognised.
If the reasons for recognising such an impairment loss cease to apply, the impairment loss is reversed, where the resulting enhanced carrying amount may not exceed the amortised cost arrived at by normal amortisation.
Goodwill arising out of a business combination is recognised from the time when control is obtained over the company acquired (the acquisition date). It arises whenever the cost of acquiring the business exceeds the netted fair value of the identifiable assets, debts and contingent debts at the acquisition date. Goodwill is not subject to amortisation; instead, it is subjected to an impairment test at least once a year, and more frequently should any triggering events occur. The impairment test is carried out on the basis of cash-generating units, the recoverable amount of a cash-generating unit being compared with its carrying amount. Under IAS 36, an impairment loss is recognised if the carrying amount of a cash- generating unit to which goodwill has been allocated exceeds its recoverable amount. Impairment losses on goodwill, once recog-nised, may not be subsequently reversed.
The cash generating units correspond with the international busi- ness units Industrial Services, Mobility, Engineering and Natural Resources, Training, Aerospace and IT and the Group unit Holding / Services.
The recoverable amount is the higher of the cash-generating unit’s fair value less costs to sell and its value in use. The recoverable amount of a cash-generating unit is calculated by determining its value in use, using the discounted cash flow method on the basis of the three-year plan approved by management. In determining value in use certain assumptions have to be made, relating essen- tially to the rate at which operating profit will grow over the planning period, the cost of capital as well as the expected sustained growth rate after the end of the three-year plan. The cost of

N O T E S T O T H E C O N S O L I D A T E D F I N A N C I A L S T A T E M E N T S
39
capital is determined on the basis of the weighted average cost of capital (WACC).
Property, plant and equipmentAssets falling into the category of property, plant and equipment are recognised at depreciated costs (purchase or construction costs). Construction costs include not only direct costs but also attributable overheads.
The revaluation model as per IAS 16.31 is not applied. As a result, under current market conditions the carrying amounts of TÜV NORD Group’s real estate include hidden reserves.
Property, plant and equipment is normally depreciated by the straight-line method, unless in exceptional cases some other depreciation method appears more appropriate. Depreciation is based on the following useful lives:
U S E F U L L I V E S O F P R O P E R T Y, P L A N T A N D E Q U I P M E N T
years
Office buildings 30–50
Test facilities 20–30
Machinery 5–12
Furniture, fixtures and office equipment 3–20
Under IAS 36, “Impairment of assets”, property, plant and equipment are subject to impairment if the recoverable amount (see also under “Intangible assets” above) of the asset concerned has fallen below its carrying amount. If the reasons for recognising such an impairment loss cease to apply, the impairment loss is reversed, but only to the extent that the enhanced carrying amount does not exceed the asset’s depreciated cost. Such a reversal of an impairment loss is recognised as income.
LeasesIn the case of a lease, there is a contract, which transfers the right to use an asset (the leased asset) for an agreed period in return for a consideration.
IFRS 16 envisages a unified accounting model for the lessee: lease contracts are to be recognised as rights of use and, correspondingly, as a liability. IFRS 16 includes the option not to apply the require-
ment of IFRS 16 to short-term leases (term of less than 12 months) and leases for low-value assets. IFRS 16 does not essentially differ from IAS 17 requirements when it comes to lessor accounting. For lessors, the distinction between finance and operating leases must continue to be made as before. The TÜV NORD Group primarily enters into leases as an operating lessee.
As of 1 January 2019, both assets for the rights to use the leased assets and liabilities for the received payment obligations for all leases of the Group as a lessee are recognised at present value. The lease liability takes into account the following lease payments:
■■ Fixed payments less lease incentives received by the lessor ■■ Variable payments linked to an index or interest rate ■■ Expected payments from residual value guarantees ■■ Strike price of a purchase option if the exercise thereof has been deemed sufficiently safe and
■■ Contractual penalties for the termination of the lease, if the term of the lease takes into account the use of a termination option
If the interest rate implicitly underlying the lease is determinable, lease payments are discounted at this rate. If this is not the case, interest is discounted by means of a marginal borrowing interest rate.
The rights of use are valued on the basis of the acquisition costs, which are as follows:
■■ Lease liabilities ■■ Lease payments made in the event of, or before, provision, less lease incentives received
■■ Initial direct costs and ■■ Expected costs from decommissioning obligations
The amortised acquisition costs are used for the subsequent valuation. Amortisation of rights of use takes place on a straight-line basis over the period of the contractual relationship.
The facilitation of application for low-value leases and short-term leases (less than 12 months) is used, so that payments are recognised in a linear way as an expense (rental expense) in the consolidated profit-and-loss account. In addition, intangible asset leases are not affected by the application of the new rules. If con- tracts exist that contain both lease and non-lease components, the possibility of waiving the separation of these components is exercised. This does not extend to real estate leases.

40
T Ü V N O R D G R O U P | A N N U A L R E P O R T
40
The renewal and termination options (especially for real estate) con- tained in a number of lease contracts offer the Group the greatest possible operational flexibility. In determining the terms of the con- tract, all facts and circumstances that provide an economic incentive to exercise renewal options or not to exercise termination options are taken into account. If changes in the duration of the term that arise from the exercise or non-exercise of the options are sufficiently certain, they are taken into account in the term of the contract.
At equity consolidated investmentsAssociates and joint ventures are initially recognised at cost at the time of their acquisitions and, in subsequent accounting periods, in accor- dance with the proportion of the equity held, using the equity method. The carrying amounts are increased or decreased annually by the amount of the earnings attributable pro rata, the dividends distrib- uted or other changes in equity. Under IAS 28.33, accounting using the equity method is effected on the basis of the financial statements for the previous reporting period. Any goodwill is reviewed in connection with the impairment testing of the investment in the associate or joint venture. Goodwill is not subject to amortisation.
Other financial assetsThe Other financial assets item covers, above all, investments in non- consolidated affiliates, other equity investments, loans, securities and claims arising out of the reinsurance of pension obligations.
The financial instruments are categorised on the basis of the analysis of business model and payment flow conditions provided for in IFRS 9. The following categories are relevant for the TÜV NORD Group:
■■ Financial assets / liabilities recognised at amortised cost ■■ Financial assets / liabilities recognised at fair value which affect net income
■■ Equity instruments recognised at fair value that do not affect net income
In principle, the TÜV NORD Group recognises all the equity instru- ments it holds at fair value. Dividends from such instruments are however still recognised in profit or loss under other income where the right to receive payments is established.
Loans granted fall into the category “Recognised at amortised cost”.
Claims arising out of reinsurance fund shares that do not form part of the plan assets are recognised at fair value in accordance with IAS 19 on the basis of the information provided by the reinsurance
provider. There is no price reporting on the active market for employer’s pension liability insurance policies.
InventoriesInventories encompass exclusively raw materials, auxiliary materials, operating materials and advance payments, which are recognised at amortised cost after the initial application of IFRS 15 in the 2018 fiscal year.
Trade and other receivables, Other assetsReceivables include the company’s trade receivables, other receiv- ables and other assets. Impairments are determined based on expected loan defaults pursuant to IFRS 9. For trade receivables, loan defaults that are expected over the total period are recognised according to the simplified procedure. Non-current receivables bearing no or only low interest are discounted at a rate appropriate to the risk, to the extent that the interest effect is material. The amount discounted is recognised pro rata under interest income until the receivable becomes due.
The receivables and other assets also include contract assets, which are recognised in accordance with IFRS 15. The contract assets primarily relate to claims of the Group for consideration for services which have been completely provided but not yet invoiced as of the record date. The contract assets are reclassified as trade receiv- ables if the rights to them are held without reservation. This typically happens when the Group issues an invoice to the customer.
Cash and cash equivalentsCash and cash equivalents include freely disposable cash in hand, cheques and bank credit balances with a term of up to three months. They are recognised at nominal value.
Deferred tax assets and liabilitiesDeferred tax assets and liabilities are recognised for all temporary differences between the carrying amounts of assets and liabilities in the IFRS balance sheet and their tax bases and also for consoli-dation measures recognised through profit or loss and are where permissible set off against one another in the balance sheet. Deferred tax assets are recognised to the extent that it is probable that there will be taxable income against which the deductible temporary difference can be offset. Deferred tax assets also include claims for reductions in amounts of tax payable arising out of the expected utilisation of existing loss carryforwards in subsequent years, to the extent that their realisation within a period of 5 years is suffi- ciently certain. Deferred tax assets and liabilities are also recognised

N O T E S T O T H E C O N S O L I D A T E D F I N A N C I A L S T A T E M E N T S
41
where temporary differences arise in connection with business combinations (corporate acquisitions), with the exception of temporary differences relating to goodwill.
Deferred taxes are determined on the basis of the rates of taxation that apply or are expected to apply under current law in the individual countries at the time of realisation. Tax rates that will be applicable in future years are used for calculation purposes to the extent that they have already been fixed in law or that the legis- lative process is practically completed.
Changes in deferred tax assets and liabilities in the balance sheet gen- erally lead to tax expense or income in the income statement, unless they relate to items recognised in comprehensive income; in this case the deferred taxes are also recognised in comprehensive income.
Deferred taxes are not recognised at the reporting date in respect of temporary differences in connection with investments in subsidiar-ies, associates or joint ventures (outside basis differences). It is not possible to make any reasonable estimate of the amounts of these unrecognised deferred tax liabilities.
For the calculation of domestic deferred taxes, a tax rate of 32.0%, unchanged from the previous year, has been applied.
Assets held for saleAssets held for sale are shown separately in the balance sheet if they can be sold in their existing condition and it is probable that they will be. When assets are first classified as “held for sale”, they are re- valued at the lower of carrying amount and fair value less costs to sell. Impairment losses resulting from the first-time classification of the assets as being “held for sale” and any later impairments (or re- versals of impairments) are recognised as expense (or income) in the Income Statement. Assets held for sale are not subject to amortisation.
Provisions for pensions and other post-employment benefitsPost-employment benefit plans are classified as either defined benefit or defined contribution plans, depending on the economic sub- stance of the plan as derived from its principal terms and conditions. Plans are classified as defined benefit plans if the actuarial or the investment risk falls on the employer. Post-employment benefit commitments that cannot be unambiguously classified as defined benefit plans are regarded as defined contribution plans.
The requisite level of pension provisions in respect of defined benefit obligations is determined by actuarial valuation using the
projected unit credit method. This valuation is carried out by actuaries as of every balance sheet date. Actuarial gains and losses arising are accounted for directly in equity without passing through the Income Statement and are recognised in the Group Statement of Comprehensive Income.
Through the transfer of claims to reinsurance to TÜV NORD PENSION TRUST e.V. of Hanover, plan assets have been formed which serve to secure the pension obligations.
The service cost included in pension expense and the included net interest expense are recognised under “Personnel expense”.
Payment obligations under defined contribution pension plans (the statutory pension funds) are recognised in the income statement for the period concerned.
Other provisionsOther provisions are formed if a legal or constructive obligation presently exists towards third parties as a result of a past event, in respect of which it is probable that an outflow of resources will be required to settle the obligation and a reliable estimate can be made of the amount of the provision required. The measurement of the provisions is effected using the best estimate of the amount required to settle the obligation, which is not set off against any possible claims for recourse. Non-current provisions are discounted if the interest effect is material.
Trade and other payablesInterest-bearing payables to banks are recognised at the amount disbursed less directly attributable transaction costs. Financing costs are distributed as expense over the term, increasing the carrying amount of the liability in subsequent periods. Trade and other pay- ables are recognised at fair value. Non-current liabilities that are not subject to interest are discounted using the effective interest method if the interest effect is material.
Contingent liabilitiesContingent liabilities are possible obligations that might arise from past events and whose existence will be confirmed by future events not within the control of the TÜV NORD Group. They may also be existing obligations that cannot be recognised because an outflow of resources is improbable or the amount of the obligation cannot be estimated with sufficient reliability. Such contingent liabilities are recognised at the level of liability existing at the reporting date.

42
T Ü V N O R D G R O U P | A N N U A L R E P O R T
42
3 . C O N S O L I D AT E D I N C O M E S TAT E M E N T D I S C L O S U R E S
3.1. RevenueRevenue breaks down between the six business units and Holding / Services as follows:
R E V E N U E S
€k 2019 2018
Industrial Services 552,558 559,935
Mobility 423,703 390,453
Engineering and Natural Resources 127,280 106,478
Training 100,258 101,199
Aerospace 49,049 47,620
IT 25,946 18,551
Holding / Services 3,557 5,234
Total 1,282,351 1,229,470
Revenue amounting to €948,154k (2018: €903,373k) was generated in Germany, €184,009k (2018: €198,243k) in the rest of Europe and €150,188k (2018: €127,854k) in the rest of the world.
The revenue consists almost entirely of earnings from services which are realised in the same period pursuant to IFRS 15. Revenue includes €79,865k (2018: €84,013k) relating to partly fulfilled contracts to render services, which were recognised as contract assets as of the reporting date.
3.2. Other operating incomeOther operating income amounting to €45,160k (2018: €39,376k) is made up essentially of the following components: income from disposal of tangible assets €7,454k (2018: €3,236k), income from the reversal of provisions €7,244k (2018: €10,783k), income from ancillary services €2,674k (2018: €2,538k), canteen takings €2,478k (2018: €2,281k), income from the reversal of impairment losses on trade receivables €1,526k (2018: €497k), income from tenancy agreements €283k (2018: €334k) and income from the reversal of a negative difference recognised as an expense €272k (2018: €192k).
3.3. Cost of materials
C O S T O F M AT E R I A L S
€k 2019 2018
Cost of raw materials and supplies 40,539 40,614
Cost of services bought in 197,869 175,508
Total 238,408 216,122
3.4. Personnel expense
P E R S O N N E L E X P E N S E
€k 2019 2018
Wages and salaries 606,278 580,389
Social security contributions 108,745 102,087
Post-employment benefit expense 23,551 26,385
Other employee benefits 3,332 3,665
Total 741,906 712,526
On average over the year, the consolidated companies had 11,235 employees (2018: 10,735) (expressed as full-time equivalents). In- cluding the experts provided by the associations, the average number of full-time employees was 11,276 (2018: 10,780). 7,889 employees work in Germany. The number of employees abroad increased in 2019 to 3,387. The Group’s employees are for the most part salaried staff.
3.5. Depreciation, amortisation and impairment lossesThe increase in total depreciations is essentially due to the appli- cation for the first time of IFRS 16.
D E P R E C I AT I O N , A M O R T I S AT I O N A N D I M PA I R M E N T L O S S E S
€k 2019 2018
Depreciation and amortisation of assets 38,805 34,329
Depreciation and amortisation of rights of use from leases 20,770 0
Total 59,575 34,329

N O T E S T O T H E C O N S O L I D A T E D F I N A N C I A L S T A T E M E N T S
43
3.6. Other operating expensesOther operating expenses €213,037k (2018: €226,125k) principally relate to travelling expenses €43,947k (2018: €43,231k), occupancy expenses €42,453k (2018: €63,462k), operating and administrative expenses €22,855k (2018: €22,203k), advertising and communi-cation expenses €21,093k (2018: €19,611k), other services €19,975k (2018: €17,760k), legal and consultancy fees €7,644k (2018: €7,779k) and donations and contributions €2,472k (2018: €2,250k). Value adjustments on doubtful trade receivables amounting to €3,301k (2018: €3,091k) are also included, as are other taxes in the amount of €3,028k (2018: €2,578k). The decrease in rental and premises costs is due to the initial application of IFRS 16.
3.7. Financial items
F I N A N C I A L I T E M S
€k 2019 2018
Income from at equity consolidated investments 169 671
Income from other equity investments 272 385
Amortisation of other financial investments and securities −101 −365
Financial items (excluding interest result) 340 691
Other interest and similar income 1,134 956
Interest and similar expense −2,730 −981
a) Interest included in lease payments −1,499 −8
b) Other interest expense −1,230 −974
Net interest result −1,596 −25
Financial items (including interest result) −1,256 666
The reduction in the financial result is essentially due to interest expense from leases which were included for the first time in the 2019 fiscal year with the first-time application of IFRS 16.
3.8. Taxes on incomeThe Group’s tax expense is as follows:
TA X E S O N I N C O M E
€k 2019 2018
Current tax expense −25,720 −24,033
Deferred tax expense −2,283 −5,253
Total −28,002 −29,286
The deferred taxes result from the formation or reversal of tax accruals in profit or loss during the fiscal year. In both fiscal years, the deferred taxes are predominantly the result of temporary differences being recognised or reversed.
The following reconciliation statement summarises the individual deferred tax items determined in relation to the individual companies and applying the tax rates prevailing in the various countries, taking due account of consolidation measures. The table reconciles expected tax expense with the tax expense actually recognised.
I N C O M E TA X E X P E N S E
€k 2019 2018
Earnings before tax 74,049 80,480
Expected income tax expense (tax rate: 32.0%; 2018: 32.0%) 23,696 25,754
Effect of different foreign tax rates / Other differences −220 −108
Changes in tax rates or tax legislation −27 −3
Permanent differences resulting from non-deductible expense, tax-free income etc. 603 555
Current taxes for previous periods 478 871
Deferred taxes for previous periods 686 -639
Effects of value adjustments 2,786 2,855
Recognised income tax expense 28,002 29,285
The expected tax rate for both fiscal years was determined on the basis of a corporation tax rate of 15.0% plus a solidarity levy of 5.5% of the tax due and a local business tax rating of 462%. The applicable tax rates for companies outside Germany range from 10.0% to 34.0%.

44
T Ü V N O R D G R O U P | A N N U A L R E P O R T
44
Deferred taxes resulting from recognition and measurement differences arose in the following balance sheet items:
D E F E R R E D TA X E S2019 2018
€k
Deferred tax
assets
Deferred tax lia- bilities
Deferred tax
assets
Deferred tax lia- bilities
Intangible assets 3,204 8,020 2,360 7,313
Property, plant and equipment 701 8,723 577 9,819
Other assets 2,169 5,555 2,443 3,531
Pension provisions 183,693 0 173,484 0
Other provisions 9,378 264 10,210 23
Other liabilities 485 177 700 119
Tax loss carryforwards 354 0 475 0
Gross amount 199,984 22,739 190,249 20,805
Offsettings −10,477 −10,477 −11,398 −11,398
Balance sheet recognition 189,507 12,262 178,851 9,407
Deferred tax assets are recognised only if there is sufficient prob- ability that these tax advantages will be realised. Any value adjustments are determined taking into account all positive and negative factors known at the present time that may influence future taxable earnings. The estimates made for this purpose may be subject to future adjustments.
Deferred taxes amounting to €8,880k (2018: €14,390k) were rec- ognised in comprehensive income. This is essentially a result of the recognition of actuarial gains / losses relating to pension provisions.
As of the reporting date, deferred tax assets were recognised for loss carryforwards for €1,395k (2018: €1,892k) existing in the Group. In respect of further tax loss carryforwards in the amount of €97,571k (2018: €81,532k), no additional deferred tax assets have been recognised as of the reporting date, since it is not suffi- ciently certain that these can be realised. Under current legislation, there is no limitation, either of time or amount, on such loss carryforwards for tax purposes.
4 . N O T E S O N T H E C O N S O L I D AT E D S TAT E M E N T O F C O M P R E H E N S I V E I N C O M E
The deferred taxes in the amount of €8,880k (2018: €14,390k) re- ported in Other comprehensive income relate to the actuarial losses of €33,128k (2018: €51,020k) in the fiscal year. The actuarial losses after deferred tax amount to €24,248k (2018: €36,630k). The other comprehensive income before deferred tax amounts to €−33,378k (2018: €−53,500k).

N O T E S T O T H E C O N S O L I D A T E D F I N A N C I A L S T A T E M E N T S
45
5 . C O N S O L I D AT E D B A L A N C E S H E E T D I S C L O S U R E S
In accordance with IAS 1, the Consolidated Balance Sheet (Statement of Financial Position) is structured to present the breakdown between current and non-current assets and liabilities. Assets and liabilities are regarded as current if it is expected that they will be recovered or settled within a year. Inventories and trade receivables
are also classified as current, irrespective of their expected use or due dates, if they are to be sold, used or recovered not within one year, but within the company’s normal operating cycle. In accordance with IAS 12, deferred taxes are recognised as non- current assets or liabilities.
5.1. Intangible assetsThe following changes in intangible assets occurred:
I N TA N G I B L E A S S E T S – C H A N G E S 2 0 1 9
€k
Concessions, proprietary rights and similar rights and assets,
including licences on such rights and assets
Goodwill
Payments made on account
Total
Cost (of purchase or production)
Amounts as of 1 January 59,367 91,122 178 150,668
Changes in basis of consolidation 0 4,850 0 4,850
Additions / Current investments 2,444 0 101 2,545
Disposals −334 0 −1 −335
Reclassifications 2 0 −28 −27
Currency translation differences −14 34 3 23
Amounts as of 31 December 61,465 96,006 253 157,724
Accumulated amortisation and impairment losses
Amounts as of 1 January 55,352 1,124 0 56,476
Additions 2,080 0 0 2,080
Disposals −333 0 0 −333
Reclassifications −46 0 0 −46
Currency translation differences −13 1 0 −12
Amounts as of 31 December 57,040 1,125 0 58,165
Net carrying amounts 4,425 94,881 253 99,559

46
T Ü V N O R D G R O U P | A N N U A L R E P O R T
46
I N TA N G I B L E A S S E T S – C H A N G E S 2 0 1 8
€k
Concessions, proprietary rights and similar rights and assets,
including licences on such rights and assets
Goodwill
Payments made on account
Total
Cost (of purchase or production)
Amounts as of 1 January 59,736 91,111 39 150,886
Additions / Current investments 2,104 0 139 2,242
Disposals −2,404 0 0 −2,404
Reclassifications 1 0 0 1
Currency translation differences −69 11 0 −58
Amounts as of 31 December 59,367 91,122 178 150,668
Accumulated amortisation and impairment losses
Amounts as of 1 January 55,961 1,123 0 57,084
Additions 1,834 0 0 1,834
Disposals −2,378 0 0 −2,378
Reclassifications 0 0 0 0
Currency translation differences −65 1 0 −64
Amounts as of 31 December 55,352 1,124 0 56,476
Net carrying amounts 4,015 89,998 178 94,192
Impairment testing of all the goodwill recognised in the Consolidated Balance Sheet did not lead to any additional impairment losses, since in each case the fair value less costs to sell is higher than the carrying amount recognised by the cash-generating unit concerned. The weighted average cost of capital (WACC) applied for discounting purposes is 6.00% (2018: 6.00%), where a growth discount of 1.0% is applied after the end of the three-year planning period.
No change that might reasonably be anticipated in any of the basic assumptions made for the purpose of determining the value in use of the cash-generating units could lead to their carrying amounts materially exceeding the recoverable amounts.
The goodwill subjected to impairment testing is essentially shared between the Engineering and Natural Resources (2019: €35,687k; 2018: €35,687k), Industrial Services (2019: €29,454k; 2018: €28,814k), Mobility (2019: €15,453k; 2018: €11,210k) and Aerospace (2019: €14,189k; 2018: €14,189k) business units.

N O T E S T O T H E C O N S O L I D A T E D F I N A N C I A L S T A T E M E N T S
47
5.2. Property, plant and equipmentThe following changes occurred in property, plant and equipment:
P R O P E R T Y, P L A N T A N D E Q U I P M E N T – C H A N G E S 2 0 1 9
€k
Land, leasehold rights and
buildings, including buildings on third-party land
Machinery
Furniture and fittings, other
factory and office equipment
Payments made on account and
assets under construction
Total
Cost (of purchase or production)
Amounts as of 1 January 262,368 165,679 230,192 8,406 666,645
Changes in basis of consolidation 0 604 485 0 1,089
Additions / Current investments 3,852 12,630 28,885 8,804 54,171
Disposals −6,429 −2,943 −22,740 −160 −32,272
Reclassifications 2,334 1,491 1,505 −5,447 −117
Currency translation differences 26 68 282 0 377
Amounts as of 31 December 262,151 177,529 238,609 11,603 689,893
Accumulated depreciation and impairment losses
Amounts as of 1 January 136,793 113,961 179,407 196 430,356
Changes in basis of consolidation 0 589 358 0 946
Depreciation 5,797 10,288 20,644 0 36,729
Impairment 0 0 0 0 0
Disposals −3,536 −2,677 −17,870 −6 −24,089
Reclassifications 0 481 −542 0 −61
Currency translation differences 7 10 167 0 185
Amounts as of 31 December 139,061 122,652 182,163 190 444,065
Net carrying amounts 123,091 54,877 56,446 11,413 245,827

48
T Ü V N O R D G R O U P | A N N U A L R E P O R T
48
P R O P E R T Y, P L A N T A N D E Q U I P M E N T – C H A N G E S 2 0 1 8
€k
Land, leasehold rights and
buildings, including buildings on third-party land
Machinery
Furniture and fittings, other
factory and office equipment
Payments made on account and
assets under construction
Total
Cost (of purchase or production)
Amounts as of 1 January 271,768 153,548 222,844 8,964 657,124
Changes in basis of consolidation 0 2 38 0 40
Additions / Current investments 6,718 14,572 26,970 7,109 55,369
Disposals −23,566 −2,937 −19,025 −13 −45,541
Reclassifications 7,586 621 −388 −7,654 165
Currency translation differences −138 −128 −247 −1 −513
Amounts as of 31 December 262,368 165,679 230,192 8,406 666,645
Accumulated depreciation and impairment losses
Amounts as of 1 January 147,037 107,491 175,972 196 430,695
Changes in basis of consolidation 0 1 9 0 10
Depreciation 5,023 9,173 18,298 0 32,493
Impairment 0 0 1 0 1
Disposals −15,240 −2,937 −14,446 0 −32,622
Reclassifications 0 300 −300 0 0
Currency translation differences −26 −67 −127 0 −221
Amounts as of 31 December 136,793 113,961 179,407 196 430,356
Net carrying amounts 125,575 51,718 50,786 8,210 236,289

N O T E S T O T H E C O N S O L I D A T E D F I N A N C I A L S T A T E M E N T S
49
The following assets are subject to limitations on their availability:
L I M I TAT I O N S O N AVA I L A B I L I T Y
€k 31. 12. 2019 31. 12. 2018
Machinery 253 180
Furniture and fittings, other factory and office equipment 584 673
Items of property, plant and equipment to the value of €3,259k (2018: €2,926k) are pledged as collateral for debt. The liabilities secured as of 31 December 2019 amount to €159k (2018: €253k).
Compensation payments by third parties for €627k (2018: €475k) are recognised as Other operating income.
5.3. Rights of use from leases The following table shows the rights of use that are recognised under a lease:
R I G H T S O F U S E F R O M L E A S E S
€k
Land and buildings
Machinery
IT, oper-ating and business
equipment
Total
As of 31 December 2019
Purchase costs 89,913 7,345 2,644 99,902
of which additions 89,913 7,309 2,171 99,393
Amortisations −17,574 −2,281 −915 −20,770
Balance sheet value 72,339 5,064 1,729 79,132
As of 31 December 2018
Purchase costs 0 40 655 695
of which additions 0 40 0 40
Amortisations 0 −4 −182 −186
Balance sheet value¹ 0 36 473 509
In the real estate sector, the Group mainly rents office buildings, test stations and laboratories. Longer-term lease contracts exist, especially in the case of real estate. As of 31 December 2019, around 20 real estate contracts with residual maturities of more than 10 years had been concluded. Leases may come with renewal and termination options.
Information on the corresponding lease liabilities can be found in section 5.14.
5.4. At equity consolidated investments The following table shows the names and the locations of the regis- tered offices of companies accounted for using the equity method, together with the percentage of the equity held, the company’s total equity and its total earnings after tax:
AT E Q U I T Y C O N S O L I D AT E D I N V E S T M E N T S
Name, location of registered office
Share of equity in %
Total equity 100% in €k
EAT 100% in €k
EnergieAgentur.NRW GmbH, Düsseldorf 50.00 632 155
GFÜ Gutachtenservice und Fahrzeug-Überprüfung GmbH, Klein-Winternheim 26.00 384 459
National Inspection and Technical Testing Company Ltd. (FAHSS), Damman / Saudi Arabia 25.11 7,655 −527
TÜV Middle East W.L.L., Manama / Bahrain 25.10 5,565 −767
TUV NORD NTA Mobility (Shang-hai) Co., Ltd., Shanghai / China 49.00 −2,456 52
UAB TÜVLITA, Vilnius / Lithuania 50.00 6,610 833
For the associates that are material to TÜV NORD AG the following table show financial information as well as a reconciliation to the carrying amount of the interest in the associate.
These figures were determined on the basis of audited financial statements for the previous year (see under 2.6.).
1 In the previous year, these were assets in the context of finance lease.

50
T Ü V N O R D G R O U P | A N N U A L R E P O R T
50
R E S U LT S F R O M FA H S S
€k 2018 2017
Revenues 23,188 24,137
Earnings after tax / total comprehensive income −527 646
Share of earnings after tax / total comprehensive income −132 162
B A L A N C E S H E E T I N F O R M AT I O N FA H S S
€k 31. 12. 2018 31. 12. 2017
Current assets 19,259 15,437
Non-current assets 3,447 3,777
Current liabilities −9,287 −5,738
Non-current liabilities −5,764 −5,927
Equity 7,655 7,549
Share of equity 1,931 1,904
Dividend payment during the year 0 0
Other 0 0
Book value of the at equity consolidated FAHSS 1,931 1,904
R E S U LT S F R O M T Ü V M I D D L E E A S T
€k 2018 2017
Revenues 19,202 18,741
Earnings after tax / total comprehensive income −767 1,029
Share of earnings after tax / total comprehensive income −193 258
B A L A N C E S H E E T I N F O R M AT I O N T Ü V M I D D L E E A S T
€k 31. 12. 2018 31. 12. 2017
Current assets 11,327 10,995
Non-current assets 787 569
Current liabilities −5,667 −4,244
Non-current liabilities −882 −1,751
Equity 5,565 5,569
Share of equity 1,397 1,398
Dividend payment during the year 0 0
Book value of the at equity consolidated TÜV Middle East 1,397 1,398
Results from non-material investments recognised using the equity method are shown in the following table:
R E S U LT S
€k 2018 2017
Revenue 32,474 26,071
Earnings after tax 1,499 −556
Share of earnings after tax 520 −268
The following table shows summarised balance sheet information on the non-material investments recognised using the equity method:
B A L A N C E S H E E T I N F O R M AT I O N
€k 31. 12. 2018 31. 12. 2017
Assets 12,767 10,681
Liabilities −7,597 −6,518
Equity 5,170 4,163
Book value of non-material associates 4,905 3,169

N O T E S T O T H E C O N S O L I D A T E D F I N A N C I A L S T A T E M E N T S
51
5.5. Other financial assets For TÜV NORD AG’s other equity investments please refer to the list of shareholdings (see under 7.8.).
The following changes in other financial assets occurred during the year under review:
O T H E R F I N A N C I A L A S S E T S – C H A N G E S 2 0 1 9
€k
Investments in affiliates
Investments in joint ventures
and associates (not equity accounted)
Other equity investments
Long-term securities
Loans granted
Shares in guarantee
funds arising from
reinsurance
Total
Cost (of purchase or production)
Amounts as of 1 January 13,801 1,376 135 979 1,161 16,293 33,746
Changes in basis of consolidation −5,374 0 0 0 550 0 −4,824
Additions 9,872 13 0 41 377 3,467 13,770
Disposals 0 0 −6 0 −13 −5,457 −5,476
Reclassifications 0 0 0 0 0 −874 −874
Currency translation differences 3 5 −2 0 0 0 6
Amounts as of 31 December 18,302 1,394 127 1,020 2,075 13,430 36,348
Accumulated amortisation and impairment losses
Amounts as of 1 January 5,164 185 0 224 985 0 6,558
Changes in basis of consolidation 500 0 0 0 550 0 1,050
Additions 90 0 0 11 0 0 101
Disposals 0 0 0 0 0 0 0
Reclassifications 0 0 0 0 0 0 0
Currency translation differences −1 0 0 0 0 0 −1
Amounts as of 31 December 5,753 185 0 235 1,535 0 7,709
Net carrying amounts 12,549 1,209 127 785 540 13,430 28,640
The additions / ongoing investments under the shares in affiliated companies refer to companies acquired in the 2019 fiscal year which are as yet of merely minor significance to the communication of a picture of the asset, financial and earnings position of the Group that reflects that actual circumstances.
Of the reinsurance claims on Alters- und Hinterbliebenen-Ver-sorgungsstelle der Technischen Überwachungs-Vereine – VvaG –, Essen, (AHV), claims of €3,032k (2018: €3,903k) have been pledged as collateral to secure loan liabilities and obligations arising out of pre-retirement part-time working arrangements.

52
T Ü V N O R D G R O U P | A N N U A L R E P O R T
52
O T H E R F I N A N C I A L A S S E T S – C H A N G E S 2 0 1 8
€k
Investments in affiliates
Investments in joint ventures
and associates (not equity accounted)
Other equity investments
Long-term securities
Loans granted
Shares in guarantee
funds arising from
reinsurance
Total
Cost (of purchase or production)
Amounts as of 1 January 12,436 1,270 176 7,804 1,120 18,922 41,728
Changes in basis of consolidation 0 0 0 0 0 0 0
Additions 1,631 230 0 0 150 2,555 4,565
Disposals 0 −117 −41 −6,825 −109 −1,711 −8,803
Reclassifications −250 0 0 0 0 −3,472 −3,722
Currency translation differences −16 −6 −1 0 0 0 −23
Amounts as of 31 December 13,801 1,376 135 979 1,161 16,293 33,746
Accumulated amortisation and impairment losses
Amounts as of 1 January 4,833 303 0 238 985 31 6,389
Changes in basis of consolidation 0 0 0 0 0 0 0
Additions 342 0 0 22 0 0 364
Disposals 0 −117 0 −36 0 −31 −184
Reclassifications 0 0 0 0 0 0 0
Currency translation differences −11 0 0 0 0 0 −11
Amounts as of 31 December 5,164 185 0 224 985 0 6,558
Net carrying amounts 8,638 1,191 135 755 177 16,293 27,189
Accruals / ongoing investments under shares in affiliates refer to company acquisitions in the 2018 fiscal year that are currently of secondary significance for the communication of a picture of the asset, financial and earnings position of the Group which reflects the actual circumstances.
5.6. Inventories
I N V E N T O R I E S
€k 2019 2018
Raw materials and supplies 2,304 1,739
Payments made on account 2,987 1,656
Total 5,291 3,394
Write-downs amounting to €0k (2018: €131k) are recognised under Inventories.

N O T E S T O T H E C O N S O L I D A T E D F I N A N C I A L S T A T E M E N T S
53
5.7. Trade and other receivables Trade and other receivables can be disaggregated in accordance with their residual terms as follows:
T R A D E A N D O T H E R R E C E I VA B L E S
2019 2018
€k Current Non-current Total Current Non-current Total
Trade receivables
from third parties 180,770 99 180,869 174,463 139 174,602
from contract assets 79,865 0 79,865 84,013 0 84,013
Receivables from affiliates 1,025 27 1,052 2,314 4 2,318
Receivables from joint ventures, associates and other entities in which equity investments are held 3,768 2 3,770 4,572 0 4,572
Total 265,428 127 265,555 265,363 143 265,506
Historical default rates and future-oriented conditions are considered for the determination of the value adjustments for receivables from goods and services. The expected loan defaults that arise according to the simplified procedure pursuant to IFRS 9 are as follows:
I M PA I R M E N T M AT R I X 3 1 D E C E M B E R 2 0 1 9
€k
expected loss in %
Trade receivables
Value adjustment
actual 1.0 174,985 1,837
1 to 30 days due 4.9 47,008 2,327
31 to 60 days due 9.2 15,543 1,438
61 to 90 days due 14.2 6,665 950
more than 90 days due 19.0 28,500 5,415
Total 272,701 11,967
I M PA I R M E N T M AT R I X 3 1 D E C E M B E R 2 0 1 8
€k
expected loss in %
Trade receivables
Value adjustment
actual 1.0 178,678 1,843
1 to 30 days due 4.9 45,629 2,225
31 to 60 days due 9.2 14,253 1,311
61 to 90 days due 14.2 5,612 796
more than 90 days due 18.6 25,360 4,742
Total 269,532 10,917

54
T Ü V N O R D G R O U P | A N N U A L R E P O R T
54
The closing balance of value adjustments for trade receivables and contract assets on 31 December 2019 is transferred to the opening balance sheet value of the value adjustments as follows:
VA L U E A D J U S T M E N T S
€k 2019 2018
Carrying amount as of 1 January 10.917 8.301
Changes in accounting methods 0 400
Changes in basis of consolidation 12 0
Additions 3.301 3.091
Use 737 378
Reversals 1.526 497
Carrying amount as of 31 December 11.967 10.917
During the period under review, value adjustments on doubtful re- ceivables were effected for €3,301k (2018: €3,091k). In the reporting period, bad debts amounting to €1,363k were written off.
No significant value adjustments were required for receivables from affiliated companies and joint ventures, associated companies and other participations.
5.8. Other assets Other assets with a residual term of more than one year are classi- fied as non-current, and those with a residual term of less than one year as current.
The other assets recognised essentially consist of accrued items and tax reimbursement claims. The items break down as follows:
O T H E R A S S E T S
2019 2018
€k Current Non-current Total Current Non-current Total
Other assets 16,594 5,245 21,839 15,541 5,050 20,591

N O T E S T O T H E C O N S O L I D A T E D F I N A N C I A L S T A T E M E N T S
55
5.9. Cash and cash equivalentsThe cash and cash equivalents consist of cheques, cash in hand and balances on account with a number of different banks in various currencies. The bank balances earn interest at customary market rates.
5.10. Assets held for saleIn previous year the position, “Assets held for sale” according to IFRS 5, discloses developed properties sold in the reporting period.
5.11. EquityFor further details of changes in equity between 1 January 2018 and 31 December 2019, see the Statement of Changes in Consolidated Equity.
TÜV NORD’s capital management policy aims not only to secure the continued existence of the business but also to achieve an adequate return in excess of the costs of capital, thereby enhancing the value of the company in the long term. The equity is monitored regularly on the basis of various indicators.
Subscribed capitalThe subscribed capital remains unchanged at €10,000k, divided into 100,000 registered no-par-value shares. All the shares are fully paid.
At the time of preparation of the Consolidated Financial Statements for the 2019 fiscal year, TÜV NORD AG had neither contingent nor authorised capital. TÜV NORD AG does not grant any share-based remuneration (share option programmes) to its employees.
Capital reservesThe capital reserves of TÜV NORD Group for €114,413k correspond to the capital reserves of TÜV NORD AG.
Subordinated registered debentureAs of 31 December 2019, the subordinated registered debentures taken out by the TÜV NORD AG amounted to €50,000.
On 8 December 2015, TÜV NORD AG took out a subordinated regis- tered debenture without a fixed term amounting to €10,000k with RWTÜV e.V., Essen. The interest rate is fixed at 4.125% until 7 June 2021 and will then increase by 100 basis points for each additional 5-year period. A termination option is exclusively available to TÜV NORD AG for the first time as of 7 June 2021, thereafter annually.
On 1 October 2015, TÜV NORD AG took out a subordinated regis- tered debenture without a fixed term amounting to €11,000k with TÜV Nord e.V., Hamburg and amounting to €9,000k with TÜV Hannover / Sachsen-Anhalt e.V., Hanover. The interest rate is fixed at 4.125% until 31 March 2021 and will then increase by 100 basis points for each additional 5-year period. A termination option is exclusively available to TÜV NORD AG for the first time as of 31 March 2021, thereafter annually.
On 22 December 2014, TÜV NORD AG took out a subordinated registered debenture without a fixed term amounting to €20,000k with Alters- und Hinterbliebenen-Versorgungsstelle der Tech-nischen Überwachungs-Vereine – VvaG –, Essen, (AHV). The interest rate is fixed at 4.125% until 30 June 2020 and will then increase by 100 basis points for each additional 5-year period. A termination option is exclusively available to TÜV NORD AG for the first time as of 30 June 2020. TÜV NORD AG plans to terminate and repay this subordinated registered debenture at this time.
Interest payments are at the discretion of TÜV NORD AG. They are also to be paid retroactively in full, for instance, in the event of the redemption of the registered debenture, distributions to the shareholders or the repayment of other liabilities of equal rank or in the case of economically similar procedures.
Retained earnings The retained earnings include the earnings of the consolidated com- panies, to the extent that these have not been distributed as dividends. In addition, the offsetting of asset-side and liability-side differences arising out of the capital consolidation of acquisitions up to 31 December 2006 and the net amount of non-cash adjustments in connection with the first-time adoption of IFRS are recognised under this item.
Other equity itemsThe other equity items include the non-cash impacts on equity of the currency translation of foreign subsidiaries’ separate financial statements, of the valuation of financial instruments at fair value, and of actuarial gains and losses arising out of post-employment benefit plans, and the deferred taxes recognised in connection with these items.
Non-controlling interestsNon-controlling interests cover holdings by investors outside TÜV NORD Group in the consolidated equity of Group companies.
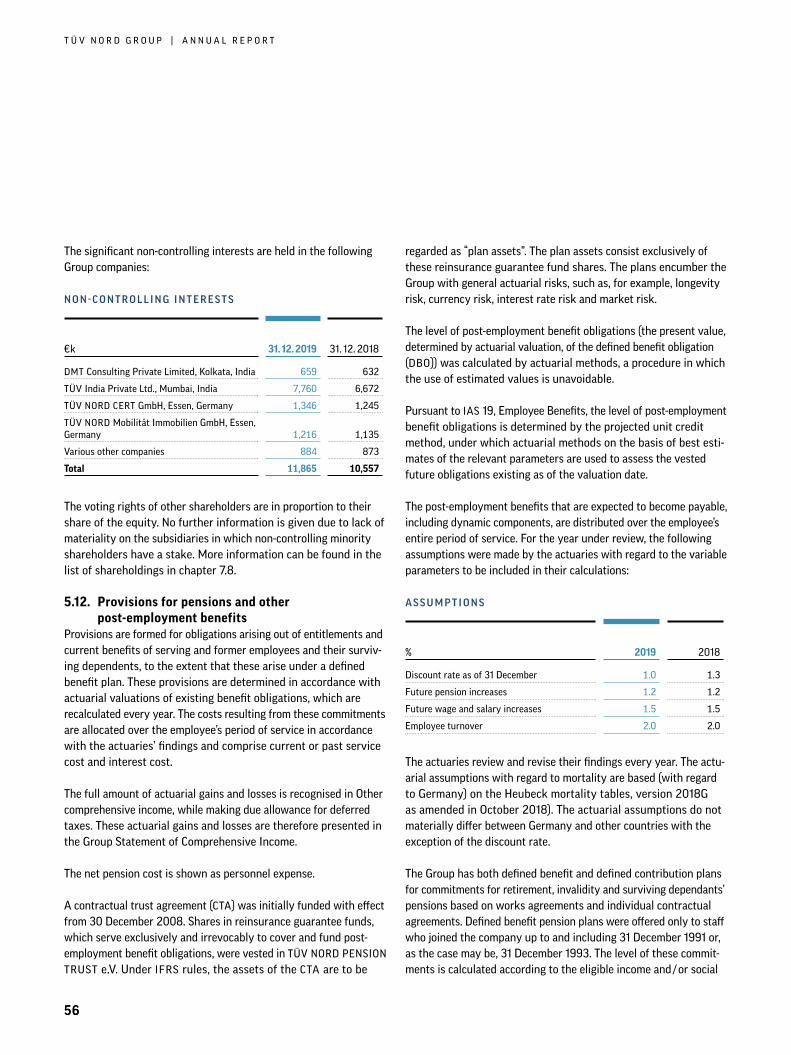
56
T Ü V N O R D G R O U P | A N N U A L R E P O R T
56
The significant non-controlling interests are held in the following Group companies:
N O N - C O N T R O L L I N G I N T E R E S T S
€k 31. 12. 2019 31. 12. 2018
DMT Consulting Private Limited, Kolkata, India 659 632
TÜV India Private Ltd., Mumbai, India 7,760 6,672
TÜV NORD CERT GmbH, Essen, Germany 1,346 1,245
TÜV NORD Mobilität Immobilien GmbH, Essen, Germany 1,216 1,135
Various other companies 884 873
Total 11,865 10,557
The voting rights of other shareholders are in proportion to their share of the equity. No further information is given due to lack of materiality on the subsidiaries in which non-controlling minority shareholders have a stake. More information can be found in the list of shareholdings in chapter 7.8.
5.12. Provisions for pensions and other post-employment benefits
Provisions are formed for obligations arising out of entitlements and current benefits of serving and former employees and their surviv- ing dependents, to the extent that these arise under a defined benefit plan. These provisions are determined in accordance with actuarial valuations of existing benefit obligations, which are recalculated every year. The costs resulting from these commitments are allocated over the employee’s period of service in accordance with the actuaries’ findings and comprise current or past service cost and interest cost.
The full amount of actuarial gains and losses is recognised in Other comprehensive income, while making due allowance for deferred taxes. These actuarial gains and losses are therefore presented in the Group Statement of Comprehensive Income.
The net pension cost is shown as personnel expense.
A contractual trust agreement (CTA) was initially funded with effect from 30 December 2008. Shares in reinsurance guarantee funds, which serve exclusively and irrevocably to cover and fund post- employment benefit obligations, were vested in TÜV NORD PENSION TRUST e.V. Under IFRS rules, the assets of the CTA are to be
regarded as “plan assets”. The plan assets consist exclusively of these reinsurance guarantee fund shares. The plans encumber the Group with general actuarial risks, such as, for example, longevity risk, currency risk, interest rate risk and market risk.
The level of post-employment benefit obligations (the present value, determined by actuarial valuation, of the defined benefit obligation (DBO)) was calculated by actuarial methods, a procedure in which the use of estimated values is unavoidable.
Pursuant to IAS 19, Employee Benefits, the level of post-employment benefit obligations is determined by the projected unit credit method, under which actuarial methods on the basis of best esti- mates of the relevant parameters are used to assess the vested future obligations existing as of the valuation date.
The post-employment benefits that are expected to become payable, including dynamic components, are distributed over the employee’s entire period of service. For the year under review, the following assumptions were made by the actuaries with regard to the variable parameters to be included in their calculations:
A S S U M P T I O N S
% 2019 2018
Discount rate as of 31 December 1.0 1.3
Future pension increases 1.2 1.2
Future wage and salary increases 1.5 1.5
Employee turnover 2.0 2.0
The actuaries review and revise their findings every year. The actu- arial assumptions with regard to mortality are based (with regard to Germany) on the Heubeck mortality tables, version 2018G as amended in October 2018). The actuarial assumptions do not materially differ between Germany and other countries with the exception of the discount rate.
The Group has both defined benefit and defined contribution plans for commitments for retirement, invalidity and surviving dependants’ pensions based on works agreements and individual contractual agreements. Defined benefit pension plans were offered only to staff who joined the company up to and including 31 December 1991 or, as the case may be, 31 December 1993. The level of these commit-ments is calculated according to the eligible income and / or social

N O T E S T O T H E C O N S O L I D A T E D F I N A N C I A L S T A T E M E N T S
57
insurance pension as well as length of service. The benefits are paid directly by the company, which granted the pension commitment.
The following table shows changes in the present value of future post-employment benefit obligations and of the plan assets.
C H A N G E S I N T H E P R E S E N T VA L U E O F F U T U R E B E N E F I T O B L I G AT I O N S A N D I N P L A N A S S E T S 2 0 1 9
€k Benefit obligation Plan assets Total
Carrying amounts as of 1 January 2019 1,273,946 −766,751 507,195
Current service cost 12,208 0 12,208
Net interest cost (interest cost / interest income) 17,360 −10,700 6,660
Net pension cost 29,568 −10,700 18,868
Actual interest on plan assets less actuarial interest income 0 −11,603 −11,603
Actuarial gains / losses from changes in financial assumptions 44,731 0 44,731
Remeasurement of defined benefit pension plans 44,731 −11,603 33,128
Pension payments −55,273 0 −55,273
Payments from the pension plan 0 41,815 41,815
Employer’s contributions to the pension plan 0 −17,342 −17,342
Total payments −55,273 24,473 −30,800
Transfer of obligations 786 −610 176
Changes in scope of consolidation / changes in currency translation and other effects 236 −333 −97
Carrying amounts as of 31 December 2019 1,293,994 −765,524 528,470
C H A N G E S I N T H E P R E S E N T VA L U E O F F U T U R E B E N E F I T O B L I G AT I O N S A N D I N P L A N A S S E T S 2 0 1 8
€k Benefit obligation Plan assets Total
Carrying amounts as of 1 January 2018 1,239,133 −754,282 484,851
Current service cost 12,759 0 12,759
Net interest cost (interest cost / interest income) 19,352 −12,079 7,273
Net pension cost 32,111 −12,079 20,032
Actual interest on plan assets less actuarial interest income 0 −7,338 −7,338
Actuarial gains / losses from changes in financial assumptions 57,452 0 57,452
Remeasurement of defined benefit pension plans 57,452 −7,338 50,114
Pension payments −54,121 0 −54,121
Payments from the pension plan 0 39,368 39,368
Employer’s contributions to the pension plan 0 −28,890 −28,890
Total payments −54,121 10,478 −43,643
Transfer of obligations −1,650 −1,256 −2,906
Changes in scope of consolidation / changes in currency translation and other effects 1,021 −2,274 −1,253
Carrying amounts as of 31 December 2018 1,273,946 −766,751 507,195

58
T Ü V N O R D G R O U P | A N N U A L R E P O R T
58
The benefit obligation in proportion to plan assets reflects the funded status of the benefit plan in question, with any excess of the benefit obligation over plan assets constituting a plan deficit. Both the benefit obligation and plan assets can vary over time, leading to an increase / decrease in the plan deficit. Reasons for such fluctuation can include changes in market interest rates and thus in the discount rate, or adjustments to actuarial assumptions.
The TÜV NORD Group’s plan assets exclusively comprise employer’s pension liability insurance policies and are subject to only limited fluctuation because of the existing minimum returns. A price report- ing on an active market does not exist for employer’s pension liability insurance policies. The recognised plan deficit is covered by cash flows from operating activities. It is the long-term goal of the TÜV NORD Group to gradually reduce the coverage gap in pensions. The employer contributions to plan assets are expected to amount to €18.0 million in 2020. The weighted average term of the remainder of benefit obligations is 13.5 years.
The table below shows the effects on the defined benefit obligation (DBO) of any change in the parameters. The analysis relates to para- meters where a change was considered possible as of the reporting date. The values here are mean values, which were weighted with the present value of the respective pension obligation. Any corre- lation between the parameters was not taken into account in the calculation.
S E N S I T I V I T Y A N A LY S I S
%
Change in parameter
Increase in parameter
Decrease in parameter
Interest rate 1.0%12.5%
DBO decrease15.6%
DBO increase
Rate of pension progression 0.5%
6.0% DBO increase
5.5% DBO decrease
Employer contributions to mandatory pension schemes as well as contributions to other defined contribution plans were made in the amount of €48.3 million in 2019 (2018: €45.7 million).
5.13. Other non-current and current provisions
O T H E R N O N - C U R R E N T A N D C U R R E N T P R O V I S I O N S
€k
Provisions for the areas of personnel and welfare
Sundry other provisions
Total
Carrying amounts as of 1 January 2019 44,976 41,778 86,753
Additions 30,092 9,414 39,507
Use 29,028 5,136 34,164
Reversals 3,461 3,783 7,244
Reclassifications / Transfers −216 173 −43
Currency translation differences 34 0 34
Carrying amounts as of 31 December 2019 42,398 42,447 84,845
The provisions for obligations in the areas of personnel and welfare relate essentially to pre-retirement part-time working, long-service bonuses, social plan measures and other personnel and non-wage personnel costs.
Of the total amount of the provisions in the areas of personnel and welfare as of 31 December 2019, €21,985k (2018: €23,966k) are non-current and €20,413k (2018: €21,010k) are current.
The sundry other provisions relate mainly to provisions for warranty obligations, provisions for threatened losses from pending trans- actions and other risks.
Of the total amount of the sundry other provisions as of 31 December 2019, €12,598k (2018: €11,716k) are non-current and €29,849k (2018: €30,061k) are current. No material interest accruals have been recognised on non-current provisions.

N O T E S T O T H E C O N S O L I D A T E D F I N A N C I A L S T A T E M E N T S
59
5.14. Non-current and current trade and other payablesCash payables can be disaggregated in accordance with their residual terms as follows:
C U R R E N T A N D N O N - C U R R E N T T R A D E A N D O T H E R PAYA B L E S
2019 2018
€k Current Non-current Total Current Non-current Total
Amounts payable to banks 171 135 306 105 130 235
Amounts payable under leases 21,022 58,748 79,770 158 326 484
Trade payables
to third parties 33,920 0 33,920 34,862 0 34,863
from contract liabilities 42,685 0 42,685 52,167 0 52,167
Payables to affiliates 2,446 3,203 5,648 1,582 5 1,587
Payables to joint ventures, associates and other entities in which equity investments are held 1,270 0 1,270 842 0 842
Outstanding invoices 21,873 0 21,873 21,125 0 21,125
Amounts payable to employees 29,802 1,215 31,018 27,869 865 28,734
Other taxes 13,774 0 13,774 12,036 0 12,036
Other payables 44,267 7,154 51,422 41,005 7,675 48,679
Total payables 211,230 70,455 281,685 191,751 9,001 200,752
Amounts payable under finance leases relate to leases of capital goods and are recognised as liabilities in the amount of the future obligation. They are due to mature as follows:
L I A B I L I T I E S F R O M L E A S E S
€k
Up to 1 year
1–5 years
More than
5 years
Total
Minimum lease payments for rented real estate 18,063 44,651 10,312 73,026
Minimum lease payments for other leases 2,959 3,785 0 6,744
The initial application of IFRS 16 on 1 January 2019 led to the addi- tional recognition of liabilities from leases. On the other hand, only liabilities from financial leases were recognised in the previous year in accordance with IAS 17.

60
T Ü V N O R D G R O U P | A N N U A L R E P O R T
60
In the 2019 reporting period, a repayment of liabilities from leases amounting to €20,138k was made, as was an interest payment on leases of €1,499k.
Liabilities from contract liabilities relate to contracts with regard to which the payments received from customers on account exceed the accumulated receivables from the fulfilment of the contracts concerned.
Amounts payable to employees include €18,905k (2018: €17,782k) for obligations in lieu of free time and €8,915k (2018: €8,265k) for obligations relating to holiday not yet taken.
As of 31 December 2019, other financial obligations arising from purchase commitments for property, plant and equipment exist for €1,834k (2018: €872k).
5.15. Contingent liabilitiesTÜV NORD AG bears liability in cases where it and its subsidiaries have given guarantees in favour of various contractual partners.
In the year under review, contingent liabilities for €13,010k (2018: €15,796k) are recognised which relate to sureties given for the most part to banks. TÜV NORD AG gives performance bonds in respect of liabilities of Group companies arising out of joint projects or consortia. If the consortium partner does not honour its contrac- tual obligations, TÜV NORD AG may be liable to meet claims for payment up to the amount of the agreed surety. Generally, the agreed terms correspond to those of the underlying transaction.
5.16. LitigationNeither TÜV NORD AG nor its Group companies are involved in litigation that could have a material impact on the economic or financial status of the companies or of the Group. In respect of other litigation, adequate provisions have been formed by the com- pany concerned in any given case for any awards that may be made against it. As of the reporting date, these provisions amount to €731k (2018: €1,057k).
6 . C O N S O L I D AT E D C A S H F L O W S TAT E M E N T D I S C L O S U R E S
The figures for cash and cash equivalents presented in the cash flow statement embrace all cash and cash equivalents recognised in the balance sheet, i.e. cash in hand, cheques and balances on account with banks. The recognised cash and cash equivalents are freely disposable and not subject to any restrictions in favour of third parties.
The cashflow from ongoing business transactions improved by approx. €20.8 million in particular as a result of the first-time application of IFRS 16. Operative lease payments, which reduced cashflow from ongoing business transactions in the previous year, are shown as of 2019 as cash outflow from financing activities and reduce these by the corresponding amount.
7. O T H E R D I S C L O S U R E S
7.1. Events after the reporting periodNo events of particular significance which are having a significant impact on the business of the Group occured after the end of the fiscal year.
7.2. Fees paid to the auditors of the Consolidated Financial Statements
The following fees paid to the auditors of the Consolidated Financial Statements, BDO AG Wirtschaftsprüfungsgesellschaft, during the year under review have been recognised as expenses pursuant to Article 314 (1) No. 9 of the German Commercial Code (HGB):
F E E S PA I D T O T H E AU D I T O R S
€k 2019 2018
Auditing services 683 717
Tax consultancy services 15 38
Other consultancy services 6 36
Total 704 791

N O T E S T O T H E C O N S O L I D A T E D F I N A N C I A L S T A T E M E N T S
61
7.3. Financial instrumentsThe evaluation of categories of financial instruments relevant after IFRS 9 for the reporting and the comparative period is shown in the following overview.
F I N A N C I A L I N S T R U M E N T S A S O F 3 1 D E C E M B E R 2 0 1 9
€k
Carrying amounts
At amortized cost
Fair Value through other
comprehensive income (FVOCI)
Fair Value
through profit or loss (FVTPL)
ASSETS
Non-current assets
Investments in affiliates 12,548 12,548
Investments in joint ventures and associates (not equity accounted) 1,209 1,209
Other equity investments 127 127
Securities 785 785
Loans 540 540
Receivables and other assets 4,067 4,067
Current assets
Trade receivables from third parties 260,635 260,635
Receivables and other assets 10,804 10,804
Cash and cash equivalents 89,321 89,321
LIABILITIES
Non-current liabilities
Amounts payable to banks 135 135
Other liabilities 10,941 10,941
Current liabilities
Amounts payable to banks 171 171
Trade payables to third parties 33,922 33,922
Other liabilities 136,773 136,773

62
T Ü V N O R D G R O U P | A N N U A L R E P O R T
62
F I N A N C I A L I N S T R U M E N T S A S O F 3 1 D E C E M B E R 2 0 1 8
€k
Carrying amounts
At amortized cost
Fair Value through other
comprehensive income (FVOCI)
Fair Value
through profit or loss (FVTPL)
ASSETS
Non-current assets
Investments in affiliates 8,638 8,638
Investments in joint ventures and associates (not equity accounted) 1,191 1,191
Other equity investments 135 135
Securities 755 755
Loans 177 177
Receivables and other assets 3,614 3,614
Current assets
Trade receivables from third parties 258,477 258,477
Receivables and other assets 13,234 13,234
Cash and cash equivalents 73,512 73,512
LIABILITIES
Non-current liabilities
Amounts payable to banks 130 130
Other liabilities 7,821 7,821
Current liabilities
Amounts payable to banks 105 105
Trade payables to third parties 34,863 34,863
Other liabilities 139,430 139,430
As laid down in the three stages of the valuation hierarchy in IFRS 13.72 et seq., the valuation of financial assets and liabilities is subject to the availability of the relevant information. For the first stage, quoted market prices are directly observable for identical asset values and liabilities in active markets. In the second stage, the assessment is made on the basis of valuation models, which are influenced by values that are observable on the market. The third stage envisages the application of valuation models that do not rely on observable market inputs. This was applied to the above- mentioned assets. There were no gains or losses in the period under review.
In view of the predominantly short maturities of the assets and liabilities measured at amortised cost, it is assumed that their carrying amounts approximately correspond to their fair values.

N O T E S T O T H E C O N S O L I D A T E D F I N A N C I A L S T A T E M E N T S
63
The securities classified as assessed at fair value with no impact on net earnings are based on market prices quoted on an active market (level 1 of the fair value hierarchy).
Net profit or loss by categoryNet profit or loss from financial instruments that is recognised in the Income Statement is allocated to the following categories:
N E T P R O F I T O R L O S S BY C AT E G O RY
2019 2018
€k
From interest
From subsequent measurement
From disposal
From interest
From subsequent measurement
From disposal
Financial assets 1,134 −3,498 0 956 −2,830 −35
Financial liabilities −1,221 371 0 −973 283 0
Interest on financial liabilities and impairment losses on loans granted are recognised in Financial items. Impairment losses on receivables (essentially trade receivables) and gains or losses from disposals of securities are recognised under Other losses or gains.
7.4. Management of financial risksTÜV NORD Group companies are exposed to financial risks in the course of their operations. These risks consist of credit, liquidity and market risks in the form of currency and interest rate risks. The risk situation has not changed in comparison to the previous report- ing period.
Through TÜV NORD AG’s centralised risk management system, these risks are managed and controlled on a Group-wide basis. The prin- ciples of the risk management system are explained in detail in the Management Report.
Credit default risksDefault risks arise in particular from day-to-day operations. The receivables of TÜV NORD Group companies are generally subject to a default risk, which it may seek to counter by demanding security, depending on the type and amount of the performance rendered. Where required, credit insurance with an excess component is con- cluded in respect of individual counterparties. In addition, payment in advance may be required. In order to minimise the risk of default, counterparties are subjected to creditworthiness assessments in accordance with internal guidelines before contracts are concluded.

64
T Ü V N O R D G R O U P | A N N U A L R E P O R T
64
Furthermore, customers’ financial standing is regularly reviewed during the term of the contract. If there is any concrete risk of default, precautionary write-downs are effected on the basis of either objective evidence in specific cases or the structure of maturities and the actual occurrence of defaults on payment.
Defaults on trade receivables, receivables based on contract assets and loans cannot exceed their carrying amount as of 31 December 2019. The structure of due dates of trade receivables is shown under 5.7.
The maximum credit risk relating to assets held for sale and financial instruments is equivalent to their market prices as of 31 December 2019.
Liquidity risksPossible liquidity risks – the danger that the Group might not be able to meet its payment obligations at all times – are managed through the implementation of comprehensive short-term and long-term liquidity planning, taking into account existing credit lines. Funding requirements are for the most part covered by equity, participation in cash pooling agreements or loans from banks or from Group com- panies, to the extent that this is feasible and reasonable in the context of the legal and tax situation in each case. Bank balances are held exclusively with banks of impeccable standing.
A variety of financing instruments available on the market are used to cover the Group’s central funding requirements. If events should occur that lead to an unexpectedly high requirement for liquidity, both existing liquidity in the form of cash and cash equivalents and also available credit lines can be drawn upon.
A credit line up to a limit of €100,000k (2018: €100,000k) is avail- able and can be drawn upon as required; the amount drawn down as of 31 December 2019 amounted to €0k. Interest at the three-month EURIBOR rate plus a margin of actual 80 basis points, minimum 0.8% per year, was payable on the amount drawn down from the time of disbursement.
An overview of the maturities of financial liabilities and the resulting outflows of funds can be found in the table of residual terms of liabilities (see under 5.14.).
Currency risksCurrency risks result from the assets and liabilities recognised in the balance sheet that are denominated in foreign currencies, the fair values of which may be negatively influenced by fluctuations in ex- change rates, and from pending foreign currency transactions whose future cash flows may develop disadvantageously as a result of exchange rate movements.
Exchange rate risk is of only minor importance, since the receivables and payables are due in local currency in the country in which the company concerned is domiciled. There are scarcely any country risks at the present time.
7.5. Related party disclosuresUnder IAS 24, Related party disclosures, companies are subject to an obligation to disclose relationships with, on the one hand, related business entities that are not fully consolidated, and, on the other, with persons with whom a close relationship exists.
Related party entities of the TÜV NORD Group are basically TÜV Nord e.V., TÜV Hannover / Sachsen-Anhalt e.V. and RWTÜV e.V. associations, “Aktaios” Verwaltungs-GmbH and RWTÜV GmbH with its subsidiaries. For further information in relation to the registered debentures taken out with the associations, see under section 5.11.
In addition, the Group maintains direct or indirect relationships in the normal course of its business activities not only with its con- solidated subsidiaries, but also with non-consolidated affiliates and associates. All trading relationships entered into in the normal course of business with non-consolidated related entities are con- ducted on the basis of normal market conditions such as are also customary in arm’s-length transactions.
Members of the Board of Management and the Supervisory Board are also considered related parties.
7.6. Total compensation of the Board of Management and the Supervisory Board
The compensation of key management personnel whose disclosure is required pursuant to IAS 24 embraces the compensation of the serving members of Board of Management and the Supervisory Board.

N O T E S T O T H E C O N S O L I D A T E D F I N A N C I A L S T A T E M E N T S
65
During the 2019 fiscal year, the serving members of the Board of Management received total compensation amounting to €1,662k (2018: €1,638k).
Total payments to former members of the Board of Management and their surviving dependants, consisting of pension payments and other compensation (one-off payments and payments for consultancy services), amounted to €675k (2018: €681k). A DBO for €16,355k (2018: €15,679k) exists towards former members of the Board of Management and their surviving dependants.
Members of the Supervisory Board were paid compensation of €486k (2018: €257k) for their services.
As in the previous year, no loans or advances were granted to mem- bers of the Board of Management or the Supervisory Board in the 2019 fiscal year. As was also the case in the previous year, no severance payments were made.
7.7. Proposal for the appropriation of profitsThe Board of Management proposes to the Annual General Meeting that of the net profits of TÜV NORD AG as determined in accord-ance with the provisions of the German Commercial code, €1,000k should be distributed to the shareholders as dividends.

66
T Ü V N O R D G R O U P | A N N U A L R E P O R T
66
7.8. List of shareholdings
Name, location of registered office
Share of equity %
Consolidated affiliates
adapt engineering GmbH & Co. KG, Nordhausen, Germany 100.00
ALTER TECHNOLOGY TÜV NORD France S.A. (former HIREX ENGINEERING SAS), Toulouse, France 100.00
ALTER TECHNOLOGY TÜV NORD Holdings Ltd. (former Optocap Holding Ltd.), Livingston, United Kingdom 100.00
ALTER TECHNOLOGY TÜV NORD S.A.U., Seville, Spain 100.00
ALTER TECHNOLOGY TÜV NORD UK Ltd. (former Optocap Ltd.), Livingston, United Kingdom 100.00
Asesoría y Control en Protección Radiológica, S.L. (ACPRO), Barcelona, Spain 100.00
Cualicontrol-ACI S.A.U., Madrid, Spain 100.00
DMT Consulting Limited, Nottingham, United Kingdom 100.00
DMT Consulting Private Limited, Kolkata, India 51.00
DMT GEOSCIENCES LTD., Calgary, Canada 100.00
DMT GmbH & Co. KG, Essen, Germany 100.00
DMT Engineering Surveying GmbH & Co. KG, Herne, Germany 100.00
DMT Petrologic GmbH & Co. KG, Hanover, Germany 100.00
EE Energy Engineers GmbH, Gelsenkirchen, Germany 100.00
ENCOS GmbH & Co. KG, Hamburg, Germany 100.00
FS FAHRZEUG-SERVICE GmbH & Co. KG, Hanover, Germany 100.00
Guangzhou TÜV Industrial Technical Services Co., Ltd., Guangzhou, China 100.00
GWQ GmbH & Co. KG, Moers, Germany 100.00
Höntzsch GmbH & Co. KG, Waiblingen, Germany 100.00
Ingenieurbüro Hofmann GmbH & Co. KG, Bamberg, Germany 65.00
MEDITÜV GmbH & Co. KG – Unternehmensgruppe TÜV NORD, Hanover, Germany 100.00
Nord-Kurs GmbH & Co. KG, Hamburg, Germany 100.00
PT. TÜV NORD Indonesia, Jakarta, Indonesia 100.00
THE INSPECTION COMPANY OF KOREA (INCOK), Seoul, Korea 100.00
TÜ-Service Anlagentechnik GmbH & Co. KG, Potsdam, Germany 100.00
TÜ Service Ingenieurgesellschaft mbH & Co. KG, Potsdam, Germany 100.00
TÜV ASIA PACIFIC LTD., Kwun Tong, Kowloon, Hong Kong 100.00
TÜV Croatia d.o.o., Slavonski Brod, Croatia 100.00
TÜV CYPRUS LTD., Nicosia, Cyprus 60.16
TÜV Eesti OÜ, Tallinn, Estonia 100.00
TÜV HELLAS (TÜV NORD) S.A., Athens, Greece 100.00
TÜV India Private Ltd., Mumbai, India 50.00
TÜV Informationstechnik GmbH Unternehmensgruppe TÜV NORD, Essen, Germany 100.00
TÜV Nederland QA B.V., Best, The Netherlands 100.00
TÜV NORD Akademie GmbH & Co. KG, Hamburg, Germany 100.00
TÜV NORD Austria GmbH, Vienna, Austria 100.00
TÜV Nord Baltik SIA, Riga, Latvia 100.00

N O T E S T O T H E C O N S O L I D A T E D F I N A N C I A L S T A T E M E N T S
67
Name, location of registered office
Share of equity %
TÜV NORD Bildung gGmbH, Essen, Germany 100.00
TÜV NORD Bulgarien GmbH, Plovdiv, Bulgaria 100.00
TÜV NORD CERT GmbH, Essen, Germany 94.00
TÜV NORD CERT UMWELTGUTACHTER Gesellschaft mbH, Hanover, Germany 100.00
TÜV NORD Czech, s.r.o., Prague, Czech Republic 100.00
TÜV Nord Danmark ApS, Kolding, Denmark 100.00
TÜV NORD do Brasil Avaliacoes da Qualidade EIRELLI (former BRTUV AVALIAÇÕES DA QUALIDADE Ltda.), São Paulo, Brazil 100.00
TÜV NORD EGYPT FOR INSPECTION AND CERTIFICATION SERVICES (S.A.E.), Cairo, Egypt 60.00
TÜV NORD EnSys GmbH & Co. KG, Hamburg, Germany 100.00
TÜV NORD Finland Oy, Vantaa, Finland 100.00
TÜV NORD Hangzhou Co., Ltd., Hangzhou, China 70.00
TÜV NORD Hochfrequenztechnik GmbH & Co. KG, Cologne, Germany 100.00
TÜV NORD HONG KONG LTD., Kwun Tong, Kowloon, Hong Kong 100.00
TÜV NORD Immobilien GmbH & Co. KG, Essen, Germany 100.00
TÜV NORD InfraChem GmbH & Co. KG, Marl, Germany 51.00
TÜV NORD INTEGRA BVBA, Berchem, Belgium 70.00
TÜV NORD International GmbH & Co. KG, Essen, Germany 100.00
TÜV NORD ITALIA S.r.l., Legnano, Italy 100.00
TÜV NORD IT Secure Communications GmbH & Co. KG, Berlin, Germany 100.00
TÜV NORD Korea Ltd., Seoul, Korea 100.00
TÜV NORD live-expert GmbH & Co. KG, Hanover, Germany 51.00
TÜV NORD (Malaysia) SDN. BHD., Petaling Jaya, Malaysia 100.00
TÜV NORD Mobilität GmbH & Co. KG, Hanover, Germany 100.00
TÜV NORD Mobilität Immobilien GmbH, Essen, Germany 94.00
TÜV NORD Mobility (Shanghai) Co. Ltd., Shanghai, China 100.00
TÜV NORD MPA Gesellschaft für Materialprüfung und Anlagensicherheit mbH & Co. KG, Leuna, Germany 100.00
TÜV NORD NC GmbH & Co. KG, Hanover, Germany 100.00
TÜV NORD Nederland Holding B.V., Rijswijk, The Netherlands 100.00
TÜV NORD Polska Sp. z o.o., Katowice, Poland 100.00
TÜV NORD SafetyConsult GmbH & Co. KG, Hanover, Germany 100.00
TÜV NORD Scandinavia AB, Gothenburg, Sweden 100.00
TÜV NORD Service GmbH & Co. KG, Hanover, Germany 100.00
TÜV NORD SLOVAKIA, s.r.o., Bratislava, Slovakia 100.00
TÜV NORD SofortGutachten GmbH & Co. KG, Hanover, Germany 51.00
TÜV NORD Systems GmbH & Co. KG, Hamburg, Germany 100.00
TÜV NORD Technisches Schulungszentrum GmbH & Co. KG, Hamburg, Germany 100.00
TÜV NORD (Thailand) Ltd., Bangkok, Thailand 99.97
TÜV NORD Transfer GmbH & Co. KG, Essen, Germany 100.00
TÜV NORD Umweltschutz GmbH & Co. KG, Hamburg, Germany 100.00
TÜV Teknik Kontrol ve Belgelendirme A.S., Istanbul, Turkey 100.00

68
T Ü V N O R D G R O U P | A N N U A L R E P O R T
68
Name, location of registered office
Share of equity %
TÜV Thüringen Anlagentechnik GmbH & Co. KG, Erfurt, Germany 99.94
TÜV Thüringen Fahrzeug GmbH & Co. KG, Erfurt, Germany 99.50
TÜV UK Ltd., London, United Kingdom 100.00
TÜV USA, Inc., Salem, USA 100.00
Unterstützungseinrichtung des Technischen Überwachungs-Vereins Hannover / Sachsen-Anhalt GmbH, Hanover, Germany 100.00
Verebus Engineering B.V., Rijswijk, The Netherlands 100.00
Versicherungsvermittlung TÜV NORD GmbH, Essen, Germany 100.00
Unconsolidated affiliates
adapt engineering Verwaltungsgesellschaft mbH, Nordhausen, Germany 100.00
ALTER TECHNOLOGY VENTURES, S.L., Tres Cantos, Spain 100.00
BILDUNG EmployAbility GmbH, Essen, Germany 100.00
British Mining Consultants Ltd., Sutton, United Kingdom 100.00
Controllo e Certificazione Prodotti Biologici S.R.L. (CCPB), Bologna, Italy 60.00
DMT Consulting Engineers Pty Ltd. (former International Mining Consultants Pty Ltd.), Brisbane, Australia 100.00
DMT Geosurvey spol. s.r.o., Prague, Czech Republic 100.00
DMT-KAI BATLA (Mozambique) Limitada, Maputo Cidade, Mozambique 51.00
DMT-Kai Batla Pty. Ltd., Bordeaux, South Africa 51.00
DMT Mining Consulting Ltd., Nottingham, United Kingdom 100.00
DMT Engineering Surveying Verwaltungsgesellschaft mbH, Herne, Germany 100.00
DMT Petrologic Verwaltungsgesellschaft mbH, Hanover, Germany 100.00
DMT Verwaltungsgesellschaft mbH, Essen, Germany 100.00
ENCOS Verwaltungsgesellschaft mbH, Hamburg, Germany 100.00
FAHRZEUG-SERVICE Verwaltungsgesellschaft mbH, Hanover, Germany 100.00
FORMATION SaarLor FSL EURL, Forbach, France 100.00
GWQ Verwaltungsgesellschaft mbH, Moers, Germany 100.00
Höntzsch Verwaltungsgesellschaft mbH, Waiblingen, Germany 100.00
Hundt & Partner Ingenieurgesellschaft mbH & Co. KG, Hanover, Germany 100.00
IMC Group Consulting Limited, Nottingham, United Kingdom 100.00
IMC Montan Consulting Limited, Nottingham, United Kingdom 100.00
IMC Montan Russia Limited, Nottingham, United Kingdom 100.00
Ingenieurbüro Hofmann Verwaltungsgesellschaft mbH, Bamberg, Germany 65.00
International Mining Consultants Ltd., Nottingham, United Kingdom 100.00
MacKay & Schnellmann Ltd., Nottingham, United Kingdom 100.00
MEDITÜV Verwaltungsgesellschaft mbH, Hanover, Germany 100.00
Montan Consulting Limited, Nottingham, United Kingdom 100.00
MONTAN RUSSIA Ltd., Nottingham, United Kingdom 100.00
Nord-Kurs Verwaltungsgesellschaft mbH, Hamburg, Germany 100.00
OICOS S.r.L., Bologna, Italy 55.00
PT. DMT Exploration Engineering Consulting Indonesia, Jakarta, Indonesia 74.00
Qualitatis Inspectie B.V., Hardenberg, The Netherlands 100.00

N O T E S T O T H E C O N S O L I D A T E D F I N A N C I A L S T A T E M E N T S
69
Name, location of registered office
Share of equity %
RP GmbH, Essen, Germany 100.00
RWTÜV Akademie GmbH, Essen, Germany 100.00
SEIQ – Serviços de Engenharia Industrial e Qualidade Ltda., Rio de Janeiro, Brazil 100.00
TN Portugal, Unipessoal Lda, Sines, Portugal 100.00
TÜ-Service Anlagentechnik Verwaltungsgesellschaft mbH, Berlin, Germany 100.00
TÜ Service Verwaltungsgesellschaft mbH, Potsdam, Germany 100.00
TÜV GmbH Hannover Hamburg Essen Berlin, Hanover, Germany 100.00
TÜV NORD Akademie Verwaltungsgesellschaft mbH, Hamburg, Germany 100.00
TÜV NORD ARGENTINA S.A., Buenos Aires, Argentina 100.00
TÜV NORD AUTO GmbH & Co. KG, Essen, Germany 100.00
TÜV NORD AUTO Verwaltungsgesellschaft mbH, Essen, Germany 100.00
TÜV NORD Bauqualität Verwaltungsgesellschaft mbH, Hanover, Germany 100.00
TÜV NORD Certification (Tianjin) Co., Ltd., Tianjin, China 76.90
TÜV NORD EnSys Hannover Verwaltungsgesellschaft mbH, Hanover, Germany 100.00
TÜV NORD FG GmbH & Co. KG, Hanover, Germany 100.00
TÜV NORD FG Verwaltungsgesellschaft mbH, Hanover, Germany 100.00
TÜV NORD FRANCE S.A.S., La Madeleine, France 100.00
TÜV NORD Hochfrequenztechnik Verwaltungsgesellschaft mbH, Cologne, Germany 100.00
TÜV NORD Holding SAL, Beirut, Lebanon 100.00
TÜV NORD Immobilien Verwaltungsgesellschaft, Essen, Germany 100.00
TÜV NORD InfraChem Verwaltungsgesellschaft mbH, Marl, Germany 51.00
TÜV NORD International Verwaltungsgesellschaft mbH, Essen, Germany 100.00
TÜV NORD IT Secure Communications Verwaltungsgesellschaft mbH, Berlin, Germany 100.00
TÜV NORD Lebanon SAL, Beirut, Lebanon 51.00
TÜV NORD live-expert Geschäftsführungs GmbH, Hanover, Germany 51.00
TÜV NORD Luxembourg s.a.r.l., Luxembourg, Luxembourg 100.00
TUV NORD Mobility Inc., Vancouver, Canada 100.00
TÜV NORD MEXICO S.A. DE C.V., Querétaro, Mexico 100.00
TÜV NORD Mobilität Verwaltungsgesellschaft mbH, Hanover, Germany 100.00
TÜV NORD MPA Verwaltungsgesellschaft mbH, Leuna, Germany 100.00
TÜV NORD Personal GmbH & Co. KG, Essen, Germany 75.00
TÜV NORD Personal Verwaltungsgesellschaft mbH, Essen, Germany 75.00
TÜV NORD Philippines, Inc., Manila, The Philippines 100.00
TÜV NORD ROMANIA S.R.L., Bucharest, Romania 100.00
TÜV NORD SafetyConsult Verwaltungsgesellschaft mbH, Hanover, Germany 100.00
TÜV NORD Service Verwaltungsgesellschaft mbH, Hanover, Germany 100.00
TÜV NORD SOUTHERN AFRICA (PTY) LTD., Cape Town, South Africa 49.00
TÜV NORD SysTec Verwaltungsgesellschaft mbH, Hamburg, Germany 100.00
TÜV NORD Systems Verwaltungsgesellschaft mbH, Hamburg, Germany 100.00
TÜV NORD Transfer Verwaltungsgesellschaft mbH, Essen, Germany 100.00

70
T Ü V N O R D G R O U P | A N N U A L R E P O R T
70
Name, location of registered office
Share of equity %
TÜV NORD TS Verwaltungsgesellschaft mbH, Hamburg, Germany 100.00
TÜV NORD Ukraina GmbH, Donetsk, Ukraine 100.00
TÜV NORD Umweltschutz Verwaltungsgesellschaft mbH, Hamburg, Germany 100.00
TÜV NORD VIETNAM LTD., Hanoi, Vietnam 100.00
TÜV Thüringen Anlagentechnik Verwaltungsgesellschaft mbH, Erfurt, Germany 99.60
TÜV Thüringen Fahrzeug Verwaltungsgesellschaft mbH, Erfurt, Germany 99.50
At equity accounted associates
GFÜ Gutachtenservice und Fahrzeug-Überprüfung GmbH, Klein-Winternheim, Germany 26.00
EnergieAgentur.NRW GmbH, Düsseldorf, Germany 50.00
National Inspection and Technical Testing Company Ltd. (FAHSS), Damman, Saudi Arabia 25.11
TÜV Middle East W.L.L., Manama, Bahrain 25.10
TUV NORD NTA Mobility (Shanghai) Co., Ltd., Shanghai, China 49.00
UAB TÜVLITA, Vilnius, Lithuania 50.00
Not at equity accounted associates (A) and joint ventures (JV)
ARGE “Technische Prüfstelle für den Kraftfahrzeugverkehr 21” GbR, Dresden, Germany (JV) 25.00
DMT Middle East W.L.L., Manama, Bahrain (A) 33.40
Energy Agency GmbH, Düsseldorf, Germany (JV) 50.00
IMC MONTAN Ltd., Nottingham, United Kingdom (JV) 50.00
TÜV NORD Autoservice GmbH, Bremerhaven, Germany (A) 25.10
TÜV NORD ENGINEERING SERVICES (M) SDN. BHD., Selangor, Malaysia (A) 30.00
TÜV NORD IRAN JOINT VENTURE CO., Tehran, Iran (A) 49.00
TÜV NORD PV Science and Technology Co., Ltd., Shanghai, China (A) 40.00
Other investments
D&T Microelectronica IAE, Barcelona, Spain 5.00
Engineering Financial Cooperative, Seoul, Korea 0.02
FSD Fahrzeugsystemdaten GmbH, Dresden, Germany 13.43
Gesellschaft für Anlagen- und Reaktorsicherheit (GRS) gGmbH, Cologne, Germany 15.40
Korea Electric Engineers Association, Seoul, Korea 0.12
WINDTEST Grevenbroich GmbH, Grevenbroich, Germany 12.50
¹ These trading partnerships take advantage of the exemption rule pursuant to Art. 264b HGB² These trading partnerships take advantage of the exemption rule pursuant to Art. 291 HGB

N O T E S T O T H E C O N S O L I D A T E D F I N A N C I A L S T A T E M E N T S
71
7.9. Governing BodiesMembers of the Board of Management:Dr. rer. nat. Dirk Stenkamp Chairman and CEO
Dipl.-Kfm. Jürgen Himmelsbach CFO Harald Reutter M.A. Human Resources
Members of the Supervisory Board:Prof. Dr. Karl Friedrich JakobChairman Chairman of the Board of Directors of RWTÜV e.V. (until 31 January 2020)
Dipl.-Ing. Rüdiger Sparfeld 1st Vice ChairmanVice Chairman of the Group Staff Council of TÜV NORD
Dr.-Ing. Guido RettigVice Chairman Chairman of the Board of Directors of TÜV Nord e.V. and TÜV Hannover / Sachsen-Anhalt e.V.
Peter Bremme Vice Chairman Regional Representative Special Services, of ver.di, Hamburg
Dr.-Ing. Klaus-Dieter Beck
Prof. Dr.-Ing. Heinz Jörg Fuhrmann Chairman of the Executive Board of Salzgitter AG
Andreas HennigerHead of Department of IG BCE head office Hanover
Ursula JedbergChair of the General Staff Council of TÜV NORD Bildung gGmbH
Carsten KohnVice Chairman of the Group Staff Council of TÜV NORD
Dr. rer. pol. Elmar LeggeChairman of the Board of Directors of RWTÜV e.V. (from 1 February 2020)Vice Chairman of the Board of Directors of RWTÜV e.V. (until 31 January 2020)
Dipl.-Wirtschaftsjur. (FH), MBA Tuesday PorterHead of the Group Representative Office TÜV NORD AG
Dipl.-Ing. Thomas Rappuhn
Roland RudolphVice Chairman of the General Staff Council of TÜV NORD Mobilität GmbH & Co. KG
Dr. jur. Jürgen-Johann Rupp (until 3 December 2019)Member of the Executive Board, RAG-Stiftung (from 1 April 2019)Member of the Executive Board, RAG Aktiengesellschaft (until 31 March 2019)
RA Reinhold Rüther (from 4 December 2019)Vice Chairman of the Board of Directors of RWTÜV e.V. (from 1 February 2020)Chairman of the Board of Management of RWTÜV GmbH
Dipl.-Ing. Stephan Schaller SCHALLER-BOARD-CONSULTANTS
Barbara SchippAttorney-at-law, Regional Legal Department of ver.di NRW
Dipl.-Kfm. Holger SieversVice Chairman of the Board of Directors of TÜV Nord. e.V. and TÜV Hannover / Sachsen-Anhalt e.V.
Elisabeth TeroddeHead of the Group Corporate Strategy and Organisational Development Division of TÜV NORD AG
Ute ThielVice Chairman of the General Staff Council of TÜV NORD Systems GmbH & Co. KG
Dipl.-Kfm. Lars VeldeCEO LAMARA Holding GmbH
Hanover, 28 February 2020
Dr. Dirk Stenkamp Jürgen Himmelsbach Harald Reutter

L E G A L N O T I C E
Publisher TÜV NORD AG Am TÜV 1 30519 Hanover Germany
tuev-nord-group.com [email protected]
Concept and design 3st kommunikation, Mainz
Illustrations and pictures gettyimages [ Cover ] Frauke Schumann [ P. 03–06 ]
Translation, English edition Jonathan Bruton, Shrewsbury, UK


TÜV NORD AG Am TÜV 1 30519 Hanover Germany
Telephone +49 511 998-0
tuev-nord-group.com [email protected]