centre d'economie de l'université paris nord
TRANSCRIPT
1
EU enlargement: what does it change for the European economic geography?
Sébastien Dupuch, Hugues Jennequin and El Mouhoub Mouhoud♣
Centre d’Economie de l’Université Paris Nord
Abstract: This paper evaluates the effects of the enlargement of the EU to the Central and Eastern European Countries (CEECs), focusing on agglomeration and industrial specialisation patterns in Europe. We first present the theoretical debate based on the New Economic Geography models. The outcome is that, in spite of the lack of labour mobility within the EU, a core periphery schema is expected to occur as a result of vertical linkages. Then, we provide evidence on real and structural convergence and FDI trends in the enlarged EU. We show that sectoral divergence resulting from agglomeration economies is likely to persist through a high-skilled core attracting increasing intensive activities and a low-skilled periphery. By discussing two alternative scenarios in terms of international specialisation, we show that Central European countries are likely to follow a “Spanish model” based on catching-up, industrial diversification and intra-industry trade, while Eastern countries could durably lag behind. Similarly, the Mediterranean economies, which are engaged in the Euro-Mediterranean partnership, exhibit very complementary international specialisation relative to the EU through resource and labour-intensive industries. Keywords: core-periphery model, European integration, specialisation, foreign direct investment, Euromed agreement Classification JEL: F15, F21, O52, R10
♣ CEPN CNRS UMR n° 71-15, Université de Paris 13, UFR Sc. Economiques, 99 av. JB Clément – 93430 Villetaneuse, [email protected], [email protected]. [email protected]
2
Introduction
Each new step of the European unification brings about concerns relative to the impact of regional
integration on production structures within the Member States. The economic geography of Europe
faces some new challenges with the next enlargement to the Central and Eastern European Countries
(CEECs) and the implementation of association agreements with Southern and Eastern Mediterranean
Countries (SEMCs)1: how will the location of activities and specialisation patterns be affected by the
accession of countries that exhibit various production structures and remote levels of development?
Will industrial agglomeration processes in an integrated area be stronger than dispersion and
diversification forces among participating nations? Which lessons can we derive from the experience
of the preceding waves of enlargement of the EU?
This article aims at discussing two opposite scenarios as regards future prospects of the European
economic geography. According to the first one, the predominance of intra-industry trade within
European nations results in weak specialisation in terms of production and employment. Thus, it
privileges the optimistic view of overall economic convergence between the EU Members States. For
example, the Emerson report (1990) underlines the current macroeconomic convergence of European
countries and proves to be hopeful when considering the impact of monetary integration. This report
considers that “EMU would reduce the incidence of country-specific shocks”. In the same vein,
Frankel and Rose (1998) argue that “increased integration may result in more highly correlated
business cycles because of common demand shocks or intra-industry trade”. The risks of asymmetric
shocks and increased spatial disparities resulting from strong relocation of activities are thus smaller
than expected. This kind of prediction suggests a minimal common framework of well-developed
redistributive policies across European nations.
Another point of view provided by the United States experience has been developed by some
economists like Paul Krugman. According to the New Economic Geography (NEG) framework, he
argues that deeper integration would translate into increased specialisation resulting from inter-
industry comparative advantages. The Member States would specialise in a small number of activities
and therefore would be more sensitive to asymmetric shocks. In NEG models, economic integration
leads to a spatial core-periphery schema, resulting in higher agglomeration and increased
specialisation detrimental to peripheral countries (Krugman, 1991a).
1 On May 2004, the 1st, the EU will be supplemented with ten countries: the Czech Republic, Cyprus, Estonia, Hungary, Latvia, Lithuania, Malta, Poland, Slovakia and Slovenia. We only deal with the CEECs including Bulgaria and Romania whose accession is postponed until 2007 or 2008, according to the latest EU officials' declarations. Because of data limitations, we restrict our sample of Mediterranean economies to five countries: Algeria, Egypt, Morocco, Tunisia and Turkey.
3
A French report by the Commissariat Général du Plan (CGP, 1999) positioned between these two
opposite points of view. It concluded that countries entering into the EMU were rather diversified and
would preserve most of their activities. Intra-European trade is mainly of intra-industry type but traded
goods within the EU are predominantly vertically differentiated. Therefore, EU countries face
structural and technological asymmetries, which can lead to more agglomerated production structures.
However, polarisation is less likely to occur across nations where production structures are rather
homogeneous than across regions, which are diverging within all European nations.
In this article, we explicitly include the candidate countries and the Mediterranean economies in the
discussion. We ask if the new incumbents are more likely to follow an intra-industry specialisation
path or, conversely, a deeper specialisation according to traditional comparative advantages. In the
first case, the CEECs would experience more industrial diversification with increasing intra-industry
trade that characterises developed or catching-up economies. In the second case, the risks of
asymmetric shocks would be stronger in countries that develop trade relations with the EU based on
their specialisation in traditional labour-intensive industries. When confronting our assumptions to
empirical evidence, we find that two different groups of countries can be drawn up according to
production structures, trade openness and FDI inflows. Only Central European countries tend to
develop intra-industry trade with the EU countries and are likely to catch-up with the EU average
while the more peripheral countries in Eastern Europe and the Mediterranean economic partners still
exhibit high levels of specialisation in traditional sectors. As a result, the European economic
geography indicates a persistent core-periphery structure.
The article is organised as follows. First, we put forward the impact of regional integration on the
distribution of industrial activities across Member States in a theoretical perspective. In a second
section, we gather the main stylised facts on real and structural convergence between candidate
countries and the EU, and discuss the likely effects of FDI on specialisation dynamics. The third
section of the article evaluates how much the Member States are specialised in an enlarged Union, and
the last one brings some elements of comparison with the SEMCs.
1. The theoretical framework
Economists identify two different sources of potential benefits from the EU integration: an
improvement in the allocation of resources and the accumulation of further resources (Baldwin, 1994).
However, the overall effects of deeper integration on the national economies are more ambiguous and
depend on regional characteristics. Thus, uneven economic development can result from unevenly
distributed natural resources and endowments. This distribution depends on exogenous regions' natural
4
advantages. Although relevant in some specific cases (mining or fishing activities), this analysis can't
explain the main features of location and specialisation pattern in Europe.
The New Economic Geography (NEG) ensuing from the standard location theory describes
economic forces which inflect the geographical distribution of activities. One of the main
contributions of NEG models is to endogeneise the market size. A confrontation between dispersion
and agglomeration forces appears, depending on the integration level2.
These forces result from the interactions between imperfect competition, economies of scale and
agglomeration externalities3. Firms and workers trade off between advantages from agglomeration
economies and mobility and transaction costs. The regional integration, assimilated to a decrease in
transaction costs, encourages firms to concentrate in order to benefit from economies of scale. As in
"new trade theory" models, increasing-returns-intensive sectors (so-called "modern" sectors) will be
disproportionately present in regions with good market access (Krugman, 1980). Moreover, associated
with this home market effect, NEG models show that the market size increases as manufacturing
agglomerates. Consequently, a cumulative causation can occur under some conditions.
Two kinds of NEG models explain the agglomeration process based on two different mechanisms.
First, the Core-Periphery model (Krugman, 1991b) assumes labour mobility across regions. It shows
that agglomeration of the modern sector is the unique stable equilibrium as soon as transaction costs
are sufficiently low. In this case, the cumulative gains increase for both geographically mobile
consumers and industrial firms (see box 1)4.
According to this model, the Eastern enlargement is expected to induce higher agglomeration
towards the core European regions. So, most of the CEECs would be marginalized. However, the
European experience exhibits some specificities that moderate the probability that such an
agglomeration process occurs. To a large extent, the geographical mobility assumption used in core-
periphery models is irrelevant in the European context (Bailly and al., 2003). These models are more
suited in the context of regional economies within nations than for studying international integration.
Without labour migration, concentration of firms can't induce any agglomeration of workers. The
core-periphery cumulative causation disappears. The effects of European integration on location
pattern are better explained by a second generation of NEG models.
2 See Ottaviano and Puga (1998) for a survey of NEG literature and Fujita and al. (1999), Neary (2001), Ottaviano and Thisse (2001 and 2003) or Baldwin and al. (2003) for more details. 3 All these externalities describe two kinds of interactions. On the one hand, so-called "technological externalities" occur outside the markets and act directly on the consumers' utility function or the firms' production function. Their formalisation is rare because difficult (see Rieber and Tran, 2001 for an example). On the other hand, so-called "pecuniary externalities" imply market mechanisms based interactions. 4 This result from the core-periphery model can be found under alternative assumptions: imperfect labour mobility (Ludema and Wooton, 1999), differentiating skills levels in the modern sector (Amiti and Pissarides, 2002), taste heterogeneity (Tabuchi and Thisse, 2001) or forward-looking expectations (Baldwin, 2001). All of these assumptions have no qualitative effect on the core-periphery model's behaviour

5
Box1: Forward and backward linkages and NEG models
NEG models' assumptions NEG models usually combine two regions and two sectors. Regions are identical in tastes, technologies and
endowments but sectors differ. The agricultural sector produces a homogeneous output under constant returns to scale and perfect competition. Agricultural good is freely traded so its price is identical in both regions. The manufacturing sector is imperfectly competitive and produces many varieties under increasing returns to scale. Following Dixit and Stiglitz (1977), production of any variety in the same proportion in any region requires the same fixed and variable quantities of input with a linear cost function. Moreover, each firm produces only one variety.
Considering two regions requires focusing on trade costs between them. By trade costs, NEG models not only include physical transport costs, but also monetary conversion, linguistic and cultural differences or specific norms. They are formalised as "iceberg" transport technology, initially introduced by Samuelson, in which only a fraction of a good arrives in the other region. The remaining production is consumed by transport necessities and importing more and more differentiated goods from induces a price index increase.
The forward and backward linkages: description The equilibrium location of firms is caused by interactions between centrifugal and centripetal forces
depending on the transaction costs level. The centripetal (centrifugal) forces include all economic relations promoting concentration (dispersion) of economic activities. The centripetal forces can be self-sustaining. They constitute a cumulative causation then recalling the Myrdal's concept. A change in a variable induces an adjustment in another variable, which reinforces in his turn the first change.
Each of the forward and backward linkages describes one part of these two causal elements. The forward linkages depict how an agent is linked to its suppliers while the backward linkages illustrate how an economic agent is linked to its customers.
Why agglomeration occurs in the core-periphery models? In a core-periphery model with mobile workforce, the cumulative causation takes place between the
industrial firms and the consumers. Thus, the forward linkage explains how industrial agglomeration incites workers to migrate. Manufacturing concentration generates both a decrease in the regional price index (the imported goods share decreases) and an increase in the regional nominal wage (following increasing competition). The regional real wage increase attracts more workers. This forward linkage takes place trough an income effect.
Consecutively, migration induces a growing of industrial expenditures through the growth of regional income. This home market effect attracts industrial firms and constitutes the backward linkage.
Why agglomeration occurs in the vertical linkage models? The vertical linkage models assume geographically immobile workers. The cumulative causation differs then.
An input-output structure of production is introduced in the industrial sector. We distinguish between upstream-supplier firms and downstream-customer firms. Consequently, the forward (backward) linkage describes how agglomeration of supplier (customers) firms induces concentration of customers (supplier) firms.
The forward linkage depicts a cost effect: more upstream firms in a location generate an increased variety of intermediate goods at a lower price through the newly exploited externalities. Then producers of final goods are attracted. The following backward linkage is a demand effect. Concentration of more downstream firms in this same location has two complementary consequences. On the one hand, it increases the regional wage. On the other hand, production by the relocated firm isn't any more imported and consumers benefit from the disappearing of trade costs for this new variety. In the end, regional manufacturing expenditures rise, attracting more upstream firms.
The Vertical-Linkage models (Krugman and Venables, 1995; Venables, 1996) describe another
agglomeration process based on two main relationship between these firms appear. The backward
linkages mean that firms gain to be located close to their customers. This link is related to a demand
6
effect. The forward linkages depict the firms' advantages to be located close to their suppliers. This is a
production cost effect. Downstream firms use upstream firms' production as an intermediate input.
Clustering of European activities is not only explained by the access to customers but also by the
access to suppliers through an input-output structure described by Hirschman (1958). Firms take
advantage from increasing returns to scale as trade costs on imported goods sharply decrease. Then,
forward and backward linkages specific to these models succeed in explaining the agglomeration
process without labour mobility (see box 1).
Both vertical linkage and core-periphery models conclude that further integration leads to more
agglomeration. However, this relation is non-monotonic. Industrial agglomeration causes a regional
wage differential. Now, the immobility of workforce can't equal the regional remuneration and wage
competition becomes a centrifugal force. At low trade costs, firms become more and more sensitive to
costs differentials, leading the “modern” sector to spread out (Puga, 1999). When the first stages of
integration occur, the forward and backward linkages induce a manufacturing clustering which is self-
sustaining. A core periphery pattern appears and entails differences in regional wages. In the last
stages of integration, this wage differential can be enough to make a peripheral location profitable.
Symmetry takes place again where the labour intensive activities relocate in low-costs regions.
Consequences of such models for the EU enlargement are noteworthy and depend on the initial
integration level. Further integration could increase the probability that industry spreads out as a result
of wage differentials among nations. Southern European countries should attract low-skilled intensive
industries while the high-skilled intensive activities would remain in the core. Thus, divergence in
income from the core periphery pattern is likely to be followed by a sectoral divergence across the
European regions.
This result is similar when both cumulative causations are associated. In a tri-sectoral model,
Jennequin (2003) associates industrial and Knowledge Intensive Based Services (KIBS) which are
supposed to produce under increasing returns to scale with differentiated output. An input - output
structure is assumed between them. The author proves that upstream services activities employing
high-skilled mobile workers play a significant role in the design of international economic geography.
The CEECs could suffer from future migration of their high-skilled workforce and experience strong
relocation of activities in favour of core countries, both in the KIBS and manufacturing production.
The NEG literature provides further conclusions about the next enlargement. A model by Puga and
Venables (1999) shows that catching-up can occur by waves of industrialisation when integration
includes more than two countries. Assuming exogenous technical progress, industrial centres tend to
develop and may come too large to be restricted in their initial location. When wage differentials are
sufficiently high, industry spreads to another country to benefit from low labour cost and economies of
scale.. More specifically to Eastern countries, the Manzocchi and Ottaviano's model (2001) underlines
7
the role of productivity in the transition process. They prove that deeper integration associated with
convergence in the productivity levels would enable them to increase their national income, to attract a
growing number of investments in the capital-intensive sectors and to upgrade their international
specialisation in these sectors.
In addition to these theoretical works, Computational General Equilibrium (CGE) models are used
in order to evaluate NEG models' conclusions and estimate the effects of the future enlargement on the
European economies5. A CGE model by Forslid and al. (2002a) assumes that the enlargement will
induce an increase in the CEECs productivity level6. Without considering investment related effects,
real income would increase by 15% on average as a result of a 5%-increase in productivity level.
These productivity related gains could prove to be an efficient remedy against exclusion. However,
considering the uneven success in the transition process, the Balkan countries and, to a lesser extent,
the Baltic countries seem to suffer from weak productivity gains. This point can partly explain current
divergence patterns between Eastern countries. Nevertheless, the relation between integration and real
income materialises through productivity gains. When the authors simulate directly the effect of a 5%-
decrease in trade costs, growth in real income is estimated to 3.3% and exports growth to 29%.
In another work by Baldwin and al. (1997) Eastern integration is assimilated to a 10% trade costs
decrease, according to both the Single Market access and the adoption of the EU's common external
tariff. The real income should rise by 1.5% and exports from the CEECs by 25% (respectively by
0.2% and 1.5% in the EU). Consequently, the CEECs would catch up with the EU. The authors also
suggest that the gains from the decrease of the CEECs risk premium would largely dominate all other
integration benefits. Moreover, inside the EU, the core countries (Germany, France, the United-
Kingdom) get two-thirds of the estimated gains. More recently, Bchir and Maurel (2002) examine
several alternative scenarios on the possible costs and benefits from the EUI enlargement. Overall
effects are rather limited for EU countries while the main impact is expected for Eastern countries.
However, all these benefits coming from the enlargement are highly sensitive to the necessarily
simplified CGE models' structure and to how large is the trade costs’ decrease. Only intuitions can be
provided. In the same way, the distribution of expected gains across countries and sectors is
insufficiently explained.
All this literature seems to indicate a feasible catching-up for the CEECs. However, many
uncertainties remain: How will integration affect productivity and investment? Should we expect
5 Most of CGE models are characterised by monopolistic competition and an input-output structure. Some simulations concerned the EU integration in the nineties before enlargement. For example Francois (2002) simulates a reduction in trade costs corresponding to 2% of the value of trade. The gains in national income rise to 0.34% on average in the EU. They are higher for the 1995 new members and increase with the workers' mobility. Forslid and al. (2002b) find a non-monotonic relation between trade costs and the distribution of sectors characterised by increasing returns to scale and substantial intra-industry linkages. 6 Selected countries are Bulgaria, the Czech Republic, Hungary, Poland, Romania, Slovakia and Slovenia.
8
deeper sectoral divergence as a result of the enlargement? Conclusions arising from theories and
simulations need to be supported by further analysis of location patterns within the enlarged EU . Prior
to their accession in the EU, what are the main stylised facts about international specialisation of
CEECs? The EU enlargement is likely to modify in many ways the future European economic
geography. The next section investigates the main features of accession countries in real and structural
terms. In particular, we insist on FDI-related impacts on specialisation patterns.
2. What is the impact of the enlargement on EU specialisation and location
patterns?
2.1. Real and structural convergence: stylised facts for CEECs
At the beginning of the transition towards a market-based economy, mass privatisation and
macroeconomic stabilisation programmes were implemented in CEECs. Meanwhile, the former USSR
economically and politically collapsed and the first trade agreements with EEC (i.e. ex-EU) were
adopted. As a consequence, CEECs trade flows were largely redirected towards the EU countries
thanks to proximity advantages and cultural links. In 2000, the EU members receive around two thirds
of the CEECs exports while they only accounted for 50% in 1993.
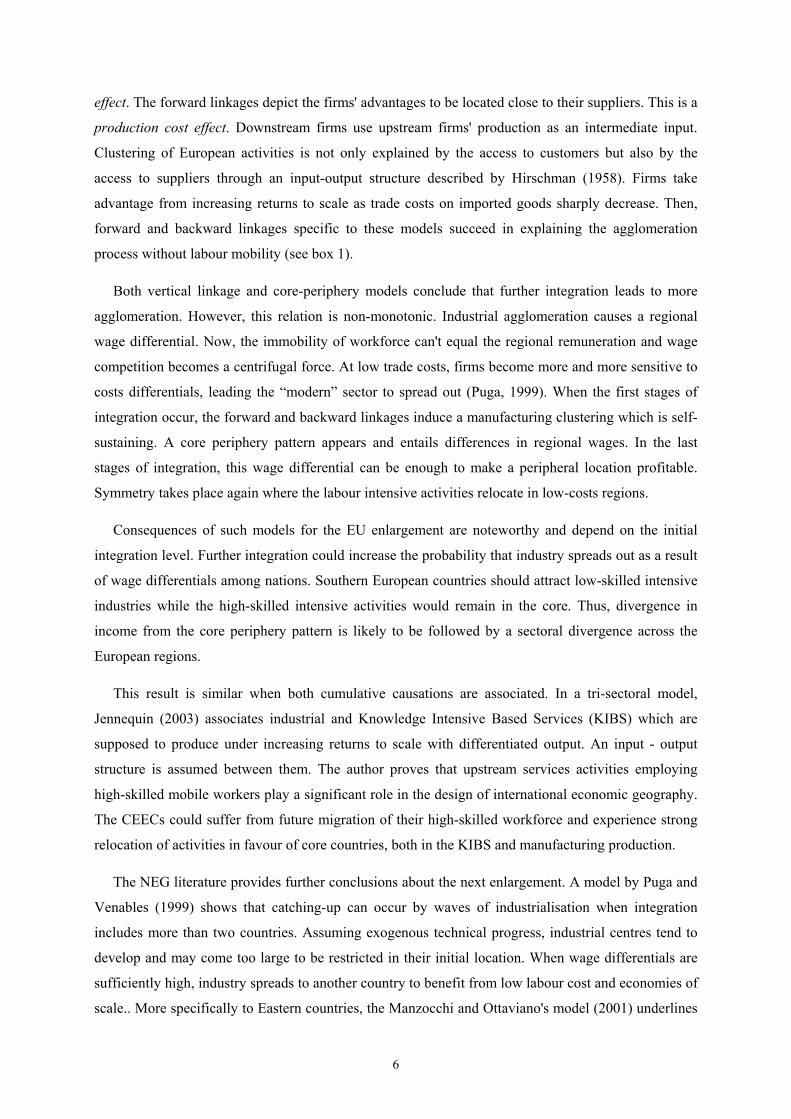
Table 1: PPP per capita GDP in the CEECs relative to the EU average 1980 1985 1991 1995 1999 2001
EU-9 1 EU-10 1 EU-15 1 1 1 1 Spain 0.70 0.78 0.78 0.82 0.84
Portugal 0.55 0.68 0.69 0.72 0.69 Greece 0.65 0.65 0.63 0.61 0.62 0.64
Czech Republic 0.62 0.59 0.57 Estonia 0.34 0.39 0.42 Poland 0.34 0.39 0.40
Slovenia 0.63 0.68 0.69 Hungary 0.45 0.50 0.51 Slovakia 0.46 0.49 0.48 Latvia 0.25 0.29 0.33
Bulgaria 0.33 0.28 0.28 Lithuania 0.32 0.34 0.38 Romania 0.28 0.24 0.25
Source : CEPII-CHELEM, Eurostat
The question of their potential economic catching-up becomes crucial with the formal integration
of these countries to the EU. In terms of per capita GDP, the new incumbents lag behind EU members
more than did Spain, Greece and Portugal when they joined the EEC (table 1). Slovenia, by far the
most advanced country among CEECs reaches 70% of EU per capita GDP while it amounts a 45%
average in the other Central and Eastern European countries. These countries are engaged in a slow
convergence process towards the EU as their GDP growth rates have not largely suffered from the
world economy decline. In the more peripheral countries, differences in economic levels are much
9
more pronounced. However, the Baltic States have experienced high growth rates for several years
while Bulgaria and Romania still have per capita GDP levels under 30% of the EU average.
Catching-up patterns are rather specific in the CEECs. They have been transition economies but not
underdeveloped ones. They were initially much industrialised and were endowed with skilled and
lower-cost labour force. When compared with the EU levels, the share of manufacturing remains high
both in terms of employment and value added, especially in the Czech Republic and Slovenia. While
the share of manufacturing remains high, the increasing importance of services in value added is a
relevant indicator of structural convergence, as it happened to be in the less advanced EU countries,
such as Portugal or Greece (Midelfart-Knarvik et al., 2002). Tertiary activities represent more than
60% of the value added in most of the candidate countries (Poland, Hungary, Slovakia and the Baltic
States). Moreover, the share of services developed faster than in countries where they were initially
undersized. As tertiary industries are associated with non tradable goods, they are much more
dispersed than manufacturing activities and their development can restrict specialisation dynamics.
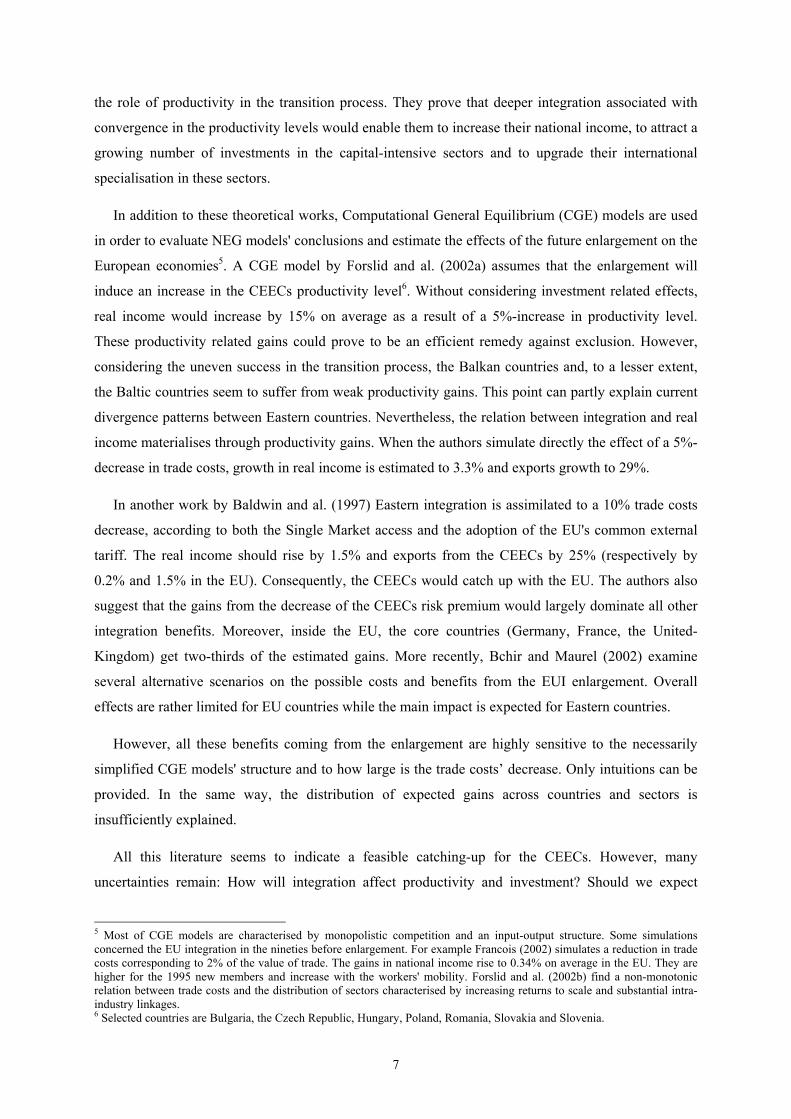
Chart 1: Relative unit labour costs in 2000 (EU-15=1)
0 0,2 0,4 0,6 0,8 1 1,2 1,4
Bulgaria
Romania
Slovakia
Hungary
Estonia
Czech Republic
Latvia
Lithuania
Poland
Slovenia
Greece
Portugal
Ireland
Spain
Finland
France
Austria
The Netherlands
United Kingdom
Germany
Denmark
Sweden
Source : Eurostat, authors’ calculations
However, high structural disparities can be observed both vis-à-vis the EU and within the candidate
countries. Wages and productivity differences are large. Slovenian nominal wages are more than twice
higher than in other Central European countries while wages in Bulgaria and Romania remain the
lowest. Although wage growth rates are higher in the candidate countries than in the EU, productivity
gains allow them to keep a strong competitive advantage in terms of unit labour costs (including
wages and social contributions). According to this index (chart 1), all the candidate countries are
advantaged relative to the EU countries, especially in sectors sensitive to price competitiveness. Only
10
Slovenia exhibits an index close to Greece while Bulgaria, Romania and Slovakia, where labour costs
are only 10% of the EU average, still rank at the bottom of the table.
According to skill levels, evidence in the candidate countries relative to the EU is mixed. Human
capital measures are complex and unsatisfactory as they only take into account educational attainment
and exclude experience and skills acquired throughout professional life7. Barro and Lee's (2000)
human capital measure is an indicator of educational attainment. The accession countries are rather
homogenous from this point of view. Except Slovenia, the CEECs often benefit from higher
educational level than other developed countries. However, considering the education level of active
people (Landesmann, 2003) discloses that around 30% of workers have not reached a secondary
school level both in the candidate countries and in the more advanced EU members. This share reaches
more than 40% in Bulgaria and Romania and even 60% in the Southern Europe. On the opposite, the
EU members have a higher share of high-skilled workers (the share of active population with a tertiary
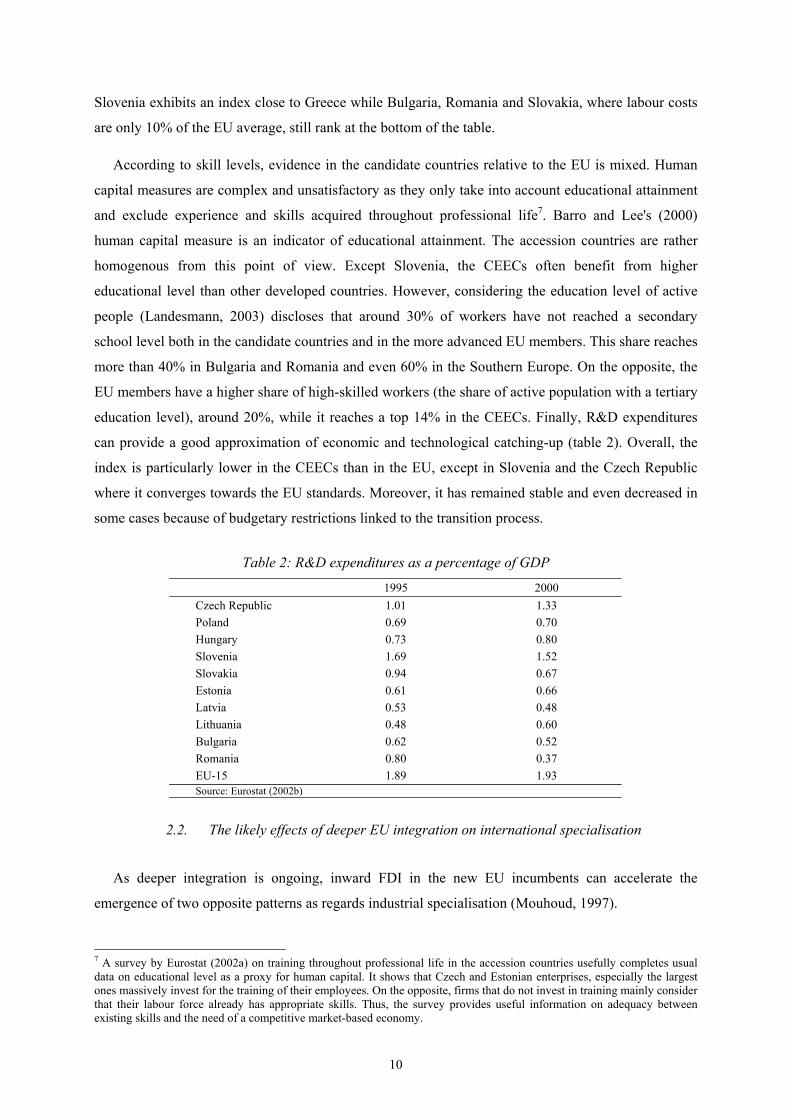
education level), around 20%, while it reaches a top 14% in the CEECs. Finally, R&D expenditures
can provide a good approximation of economic and technological catching-up (table 2). Overall, the
index is particularly lower in the CEECs than in the EU, except in Slovenia and the Czech Republic
where it converges towards the EU standards. Moreover, it has remained stable and even decreased in
some cases because of budgetary restrictions linked to the transition process.
Table 2: R&D expenditures as a percentage of GDP
1995 2000 Czech Republic 1.01 1.33 Poland 0.69 0.70 Hungary 0.73 0.80 Slovenia 1.69 1.52 Slovakia 0.94 0.67 Estonia 0.61 0.66 Latvia 0.53 0.48 Lithuania 0.48 0.60 Bulgaria 0.62 0.52 Romania 0.80 0.37 EU-15 1.89 1.93 Source: Eurostat (2002b)
2.2. The likely effects of deeper EU integration on international specialisation
As deeper integration is ongoing, inward FDI in the new EU incumbents can accelerate the
emergence of two opposite patterns as regards industrial specialisation (Mouhoud, 1997).
7 A survey by Eurostat (2002a) on training throughout professional life in the accession countries usefully completes usual data on educational level as a proxy for human capital. It shows that Czech and Estonian enterprises, especially the largest ones massively invest for the training of their employees. On the opposite, firms that do not invest in training mainly consider that their labour force already has appropriate skills. Thus, the survey provides useful information on adequacy between existing skills and the need of a competitive market-based economy.
11
First, we will characterise by inter-industry specialisation a development of trade flows based
predominantly on differences in factor endowments. It can confine countries whose specialisation is
driven by traditional and unskilled labour-intensive industries in a low-development trap. Instead of
building conditions that would allow them to compete on global markets, some countries could
attempt to exploit their own comparative advantages. The integration process may induce trade-
diverting effects in favour of the new members. It would encourage in these countries a specialisation
based on classical comparative advantages that could lock them in traditional sectors and reduce the
opportunity for an intra-industry trade upgrading.
Second, intra-industry specialisation can be considered as the most favourable case. After the
enlargement, the future EU will include both developed and backward countries. It can heighten the
emergence of spillover effects that would play a great role in the definition of specialisation patterns.
The transition countries are initially very industrialised and well endowed in physical capital, transport
and telecommunications infrastructure, although necessitating modernisation and disconnected from
EU networks. The project of future EU enlargement(s) was sufficiently credible, so that, firms by
expectation of the formal integration have decided for a long time to establish production units or joint
ventures agreements with the aim to benefit from first mover advantages in the perspective of
expansion strategies on local markets. In this context, economic and technological catching-up
processes can be enhanced and intra-industry trade can intensify.
Two distinct strategies as regards FDI can be associated with these two types of specialisation
patterns. In the context of deeper inter-industry specialisation, vertical type multinational strategies
dominate. Multinational firms disperse their production activities according to host countries'
comparative advantages. The more labour-intensive production steps, such as assembly, are relocated
in countries with cheaper labour force. These newly established affiliates generate imports of
intermediate goods, and exports of final goods between home and host countries as well as growing
intra-firm trade. Given that these FDI are motivated by differences in factor endowments, they hasten
an international division of labour which contributes to reinforce inter-industry specialisation patterns.
On the opposite, FDI are considered as horizontal when multinational firms are mainly stimulated
by expansion on local markets. In that case, the ownership of specific asset or technological
advantages allows a multinational firm to establish different production units in order to serve
domestic markets and benefit from scale economies at the firm-level and not only at the plant-level.
Foreign investors privilege proximity as they can be more reactive to the preference of consumers for
differentiated goods. This type of FDI is more likely to occur between countries whose preferences are
similar (Brainard, 1993; Markusen, 1995). These investments depend on market access considerations
and the search for complementarities in technology and know-how. They are then more likely to occur
in technology-intensive industries or in sectors that produce non tradable goods and services. They
12
contribute to increase both the number and the quality of products, and help to reinforce intra-industry
trade patterns, especially in quality-differentiated goods (Fontagné et al., 1998).
In the case of candidate countries, intra-industry specialisation is likely to be enhanced thanks to
inward FDI, especially in the Central European ones (Hungary, Czech Republic, Slovenia, Slovakia,
Estonia). However, in the more peripheral and lagging behind countries, FDI could contribute to the
persistence of inter-industry specialisation. Until now, FDI have materialised through two main
specific ways. First, foreign firms were related to mass privatisation programmes of former state-
owned enterprises. While they have to share risks associated with the future profitability of the new
entities, they benefit from a favourable position to gain local market shares. They can potentially bring
technology and managerial methods that help the adaptation of transition economies. Second, FDI can
be realised through joint ventures agreements and strategic alliances. Overall, fusions and acquisitions
(including joint-ventures agreements) have accounted for the bulk of FDI since the end of the eighties.
In the case of CEECs, acquisitions are more frequent than the creation of fully-owned affiliates
because of privatisation's programmes (Toubal, 2001).
2.3. FDI trends in the CEECs
Despite the world economic slowdown, inward FDI is still increasing in Eastern and Central
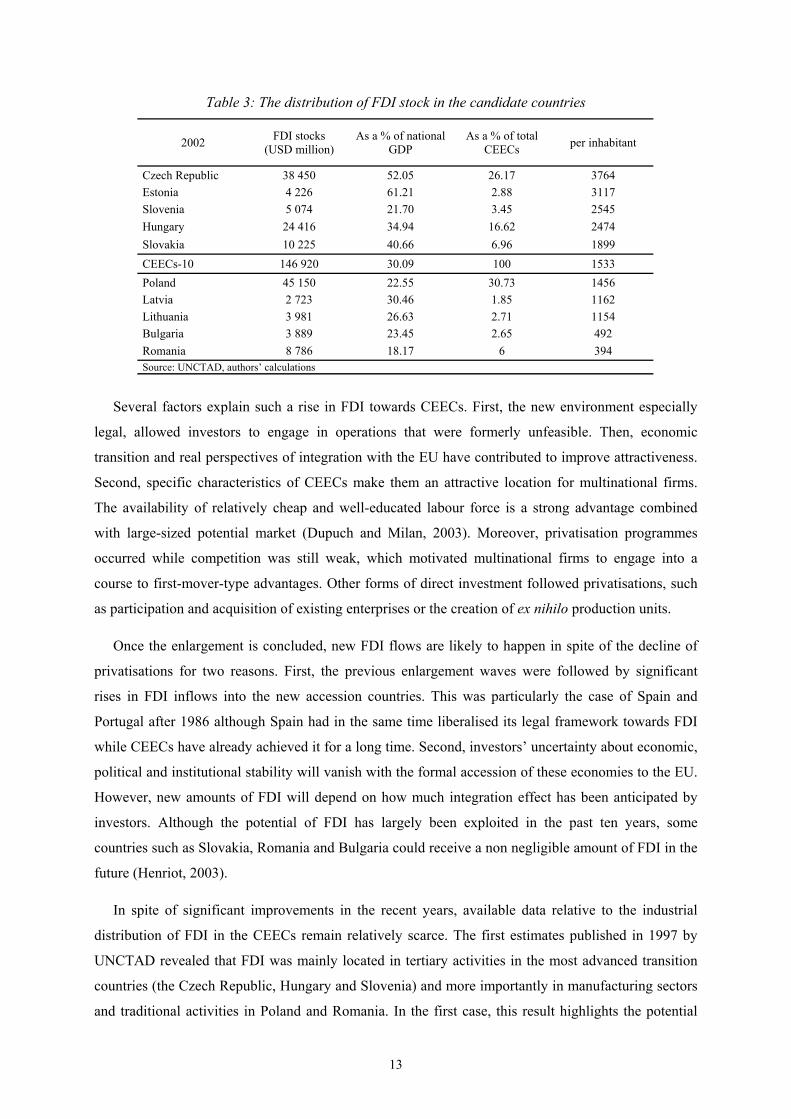
Europe. Their transitional nature has favoured the attractiveness of FDI. In 2002, the stock of inward
FDI in CEECs reaches more than USD 146 billion while it was marginal ten years ago (table 3). The
share of FDI in the candidate countries’ economies is significantly higher than their single
representation in the total world flows would suggest. In relative terms, FDI stock as a percentage of
GDP is around 30%, which is similar to the EU level, whereas the CEECs has received investment
flows for only a dozen of years. However, FDI stock in the CEECs remains low, compared with
amounts located in the EU area. As the EU will shift from 15 countries to 25, inward European FDI
stock will rise by only 4%.
Within candidate countries, FDI are not uniformly distributed. In absolute terms, Poland, the Czech
Republic and Hungary concentrate more than 75 % of total FDI stock in the region while FDI in the
Balkan and Baltic countries are rather low. In relative terms, concentration is much less evident since a
small country such as Estonia has received the highest FDI stock as a percentage of GDP. As far as
their geographic source is concerned, FDI mainly come from the EU (80% in 2000). More precisely,
half of total investments are sourced by three countries: the Netherlands, Germany and France which
became the first investor country in 2000 with a 21% share while it was only 5% in 19988.
8 The Netherlands are a particular case as a source country: due to the presence of holdings, investing firms are not fully Dutch, so the share of FDI from the Netherlands is overestimated.
13
Table 3: The distribution of FDI stock in the candidate countries
2002 FDI stocks (USD million)
As a % of national GDP
As a % of total CEECs per inhabitant
Czech Republic 38 450 52.05 26.17 3764 Estonia 4 226 61.21 2.88 3117 Slovenia 5 074 21.70 3.45 2545 Hungary 24 416 34.94 16.62 2474 Slovakia 10 225 40.66 6.96 1899 CEECs-10 146 920 30.09 100 1533 Poland 45 150 22.55 30.73 1456 Latvia 2 723 30.46 1.85 1162 Lithuania 3 981 26.63 2.71 1154 Bulgaria 3 889 23.45 2.65 492 Romania 8 786 18.17 6 394 Source: UNCTAD, authors’ calculations
Several factors explain such a rise in FDI towards CEECs. First, the new environment especially
legal, allowed investors to engage in operations that were formerly unfeasible. Then, economic
transition and real perspectives of integration with the EU have contributed to improve attractiveness.
Second, specific characteristics of CEECs make them an attractive location for multinational firms.
The availability of relatively cheap and well-educated labour force is a strong advantage combined
with large-sized potential market (Dupuch and Milan, 2003). Moreover, privatisation programmes
occurred while competition was still weak, which motivated multinational firms to engage into a
course to first-mover-type advantages. Other forms of direct investment followed privatisations, such
as participation and acquisition of existing enterprises or the creation of ex nihilo production units.
Once the enlargement is concluded, new FDI flows are likely to happen in spite of the decline of
privatisations for two reasons. First, the previous enlargement waves were followed by significant
rises in FDI inflows into the new accession countries. This was particularly the case of Spain and
Portugal after 1986 although Spain had in the same time liberalised its legal framework towards FDI
while CEECs have already achieved it for a long time. Second, investors’ uncertainty about economic,
political and institutional stability will vanish with the formal accession of these economies to the EU.
However, new amounts of FDI will depend on how much integration effect has been anticipated by
investors. Although the potential of FDI has largely been exploited in the past ten years, some
countries such as Slovakia, Romania and Bulgaria could receive a non negligible amount of FDI in the
future (Henriot, 2003).
In spite of significant improvements in the recent years, available data relative to the industrial
distribution of FDI in the CEECs remain relatively scarce. The first estimates published in 1997 by
UNCTAD revealed that FDI was mainly located in tertiary activities in the most advanced transition
countries (the Czech Republic, Hungary and Slovenia) and more importantly in manufacturing sectors
and traditional activities in Poland and Romania. In the first case, this result highlights the potential
14
positive role played by FDI in changing patterns of specialisation in these economies. As a
consequence, the location of FDI in non traditional industries is likely to favour the development of
intra-industry trade with the EU countries. In the latter case, the concentration of FDI in home
countries' comparative advantage industries is likely to reinforce specialisation in traditional
industries9.
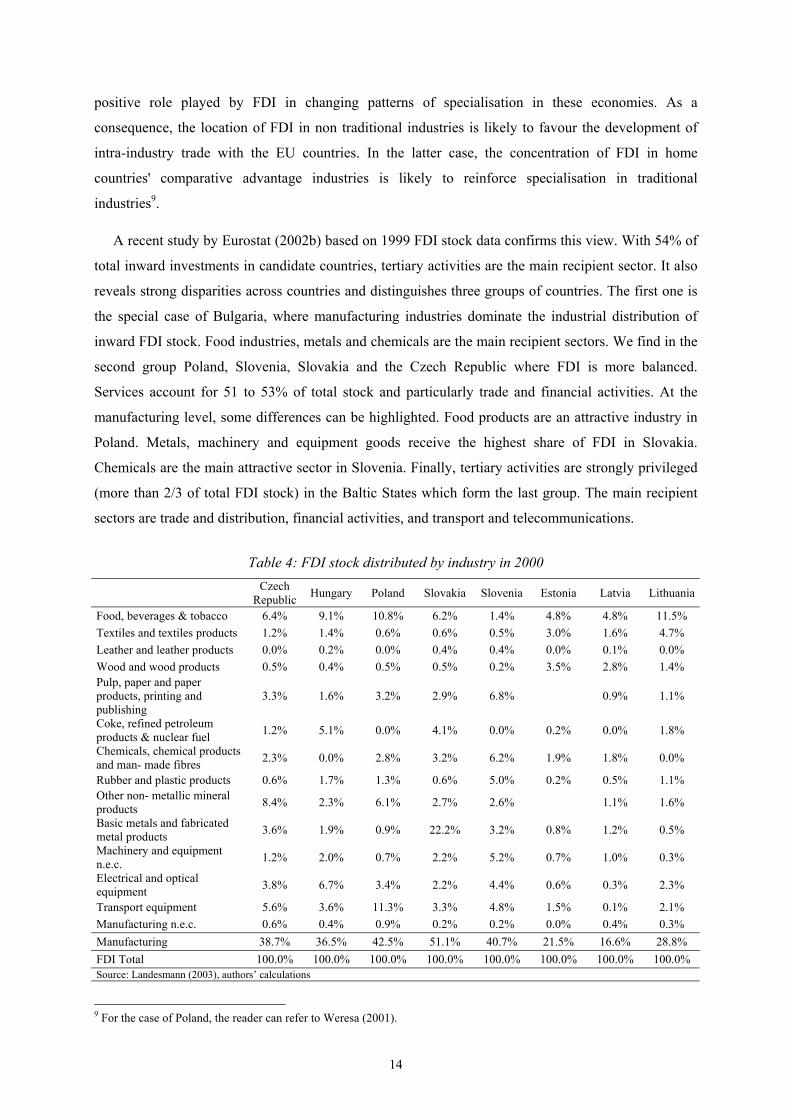
A recent study by Eurostat (2002b) based on 1999 FDI stock data confirms this view. With 54% of
total inward investments in candidate countries, tertiary activities are the main recipient sector. It also
reveals strong disparities across countries and distinguishes three groups of countries. The first one is
the special case of Bulgaria, where manufacturing industries dominate the industrial distribution of
inward FDI stock. Food industries, metals and chemicals are the main recipient sectors. We find in the
second group Poland, Slovenia, Slovakia and the Czech Republic where FDI is more balanced.
Services account for 51 to 53% of total stock and particularly trade and financial activities. At the
manufacturing level, some differences can be highlighted. Food products are an attractive industry in
Poland. Metals, machinery and equipment goods receive the highest share of FDI in Slovakia.
Chemicals are the main attractive sector in Slovenia. Finally, tertiary activities are strongly privileged
(more than 2/3 of total FDI stock) in the Baltic States which form the last group. The main recipient
sectors are trade and distribution, financial activities, and transport and telecommunications.
Table 4: FDI stock distributed by industry in 2000
Czech Republic Hungary Poland Slovakia Slovenia Estonia Latvia Lithuania
Food, beverages & tobacco 6.4% 9.1% 10.8% 6.2% 1.4% 4.8% 4.8% 11.5% Textiles and textiles products 1.2% 1.4% 0.6% 0.6% 0.5% 3.0% 1.6% 4.7% Leather and leather products 0.0% 0.2% 0.0% 0.4% 0.4% 0.0% 0.1% 0.0% Wood and wood products 0.5% 0.4% 0.5% 0.5% 0.2% 3.5% 2.8% 1.4% Pulp, paper and paper products, printing and publishing
3.3% 1.6% 3.2% 2.9% 6.8% 0.9% 1.1%
Coke, refined petroleum products & nuclear fuel 1.2% 5.1% 0.0% 4.1% 0.0% 0.2% 0.0% 1.8%
Chemicals, chemical products and man- made fibres 2.3% 0.0% 2.8% 3.2% 6.2% 1.9% 1.8% 0.0%
Rubber and plastic products 0.6% 1.7% 1.3% 0.6% 5.0% 0.2% 0.5% 1.1% Other non- metallic mineral products 8.4% 2.3% 6.1% 2.7% 2.6% 1.1% 1.6%
Basic metals and fabricated metal products 3.6% 1.9% 0.9% 22.2% 3.2% 0.8% 1.2% 0.5%
Machinery and equipment n.e.c. 1.2% 2.0% 0.7% 2.2% 5.2% 0.7% 1.0% 0.3%
Electrical and optical equipment 3.8% 6.7% 3.4% 2.2% 4.4% 0.6% 0.3% 2.3%
Transport equipment 5.6% 3.6% 11.3% 3.3% 4.8% 1.5% 0.1% 2.1% Manufacturing n.e.c. 0.6% 0.4% 0.9% 0.2% 0.2% 0.0% 0.4% 0.3% Manufacturing 38.7% 36.5% 42.5% 51.1% 40.7% 21.5% 16.6% 28.8% FDI Total 100.0% 100.0% 100.0% 100.0% 100.0% 100.0% 100.0% 100.0% Source: Landesmann (2003), authors’ calculations
9 For the case of Poland, the reader can refer to Weresa (2001).
15
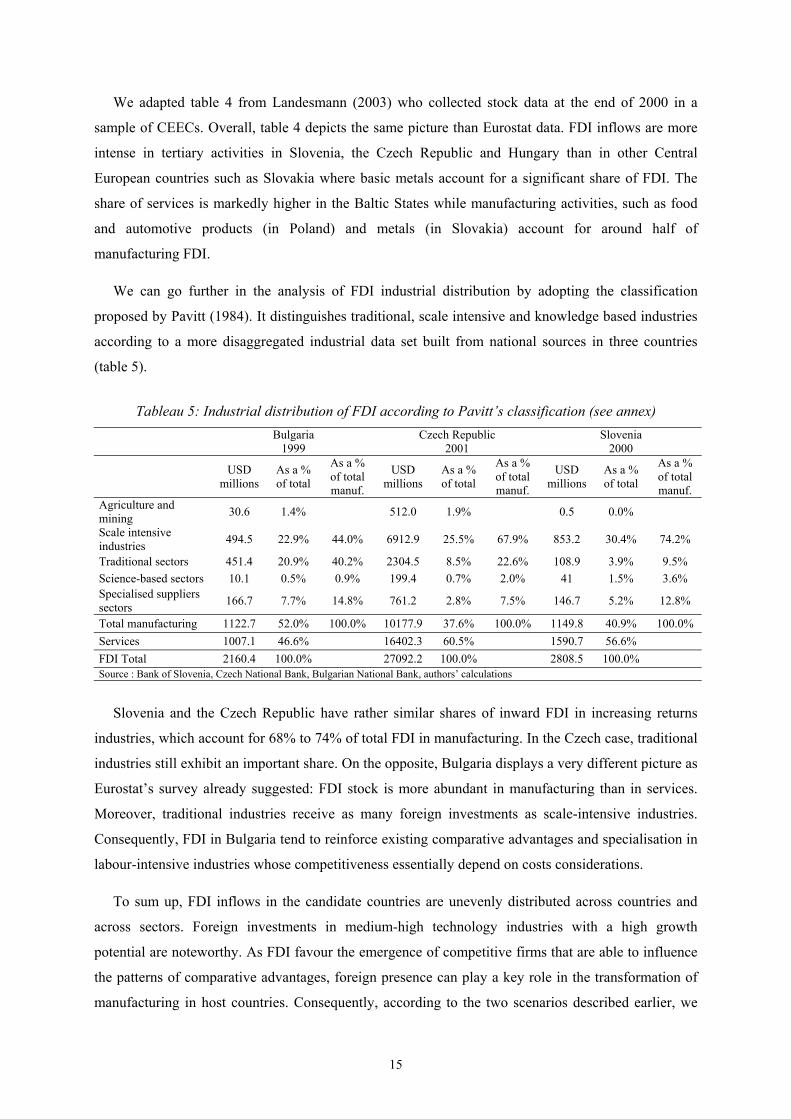
We adapted table 4 from Landesmann (2003) who collected stock data at the end of 2000 in a
sample of CEECs. Overall, table 4 depicts the same picture than Eurostat data. FDI inflows are more
intense in tertiary activities in Slovenia, the Czech Republic and Hungary than in other Central
European countries such as Slovakia where basic metals account for a significant share of FDI. The
share of services is markedly higher in the Baltic States while manufacturing activities, such as food
and automotive products (in Poland) and metals (in Slovakia) account for around half of
manufacturing FDI.
We can go further in the analysis of FDI industrial distribution by adopting the classification
proposed by Pavitt (1984). It distinguishes traditional, scale intensive and knowledge based industries
according to a more disaggregated industrial data set built from national sources in three countries
(table 5).
Tableau 5: Industrial distribution of FDI according to Pavitt’s classification (see annex)
Bulgaria 1999
Czech Republic 2001
Slovenia 2000
USD millions
As a % of total
As a % of total manuf.
USD millions
As a % of total
As a % of total manuf.
USD millions
As a % of total
As a % of total manuf.
Agriculture and mining 30.6 1.4% 512.0 1.9% 0.5 0.0%
Scale intensive industries 494.5 22.9% 44.0% 6912.9 25.5% 67.9% 853.2 30.4% 74.2%
Traditional sectors 451.4 20.9% 40.2% 2304.5 8.5% 22.6% 108.9 3.9% 9.5% Science-based sectors 10.1 0.5% 0.9% 199.4 0.7% 2.0% 41 1.5% 3.6% Specialised suppliers sectors 166.7 7.7% 14.8% 761.2 2.8% 7.5% 146.7 5.2% 12.8%
Total manufacturing 1122.7 52.0% 100.0% 10177.9 37.6% 100.0% 1149.8 40.9% 100.0% Services 1007.1 46.6% 16402.3 60.5% 1590.7 56.6% FDI Total 2160.4 100.0% 27092.2 100.0% 2808.5 100.0% Source : Bank of Slovenia, Czech National Bank, Bulgarian National Bank, authors’ calculations
Slovenia and the Czech Republic have rather similar shares of inward FDI in increasing returns
industries, which account for 68% to 74% of total FDI in manufacturing. In the Czech case, traditional
industries still exhibit an important share. On the opposite, Bulgaria displays a very different picture as
Eurostat’s survey already suggested: FDI stock is more abundant in manufacturing than in services.
Moreover, traditional industries receive as many foreign investments as scale-intensive industries.
Consequently, FDI in Bulgaria tend to reinforce existing comparative advantages and specialisation in
labour-intensive industries whose competitiveness essentially depend on costs considerations.
To sum up, FDI inflows in the candidate countries are unevenly distributed across countries and
across sectors. Foreign investments in medium-high technology industries with a high growth
potential are noteworthy. As FDI favour the emergence of competitive firms that are able to influence
the patterns of comparative advantages, foreign presence can play a key role in the transformation of
manufacturing in host countries. Consequently, according to the two scenarios described earlier, we
16
can distinguish countries where FDI benefit to industries where host country have comparative
advantages yet and countries where FDI is oriented towards home country’s comparative advantaged
industries.
However, it is difficult to distinguish vertical and horizontal types of FDI in the CEECs. On the one
hand, cost advantages make them attractive for foreign firms’ industrial relocation by means of both
FDI and international subcontracting. In unskilled labour-intensive industries (for example assembly
steps in clothing, leather, footwear or electrical materials) international subcontracting operations with
the CEECs intensified in the beginning of the transition process, especially under outward-processing
trade. These operations played a key role in the growing of manufacturing exports of these countries
with the EU (Chevallier and al., 1999). Nevertheless, increasing labour costs along the transition
process make such an advantage transitory, especially in the most advanced candidate countries
(Resmini, 2000). On the other hand, weak potential demand can be perceived as a barrier to FDI by
means of penetrating Eastern markets. Nevertheless, increasing purchasing power and the perspective
of formal integration make this aspect transitory again.
Considering that industries in which foreign firms mostly export their sales can be seen as the
consequence of relocation strategies, Eltetö (1998) concludes that around 40% of FDI in Hungary is
the result of such a strategy while 60% is motivated by market access consideration. More recently,
Aussillioux and Pajot (2001) showed that French FDI in the CEECs are driven by home country’s
comparative-advantages-industries with the clear exception of Romania and Turkey where relocation
strategies predominate.
As a consequence, FDI flows can contribute to the transformation of international specialisation
and help to improve R&D and skilled labour industrial contents. Despite weak R&D intensities, some
of the candidate countries that were formerly endowed with national innovation systems are shifting
from specialisation based on low-technology industries towards medium-high technology industries.
In 1996, the CEECs mainly produce down and medium-market goods but great differences exist in the
structure of CEECs trade with EU countries. Down-market goods represent 44% of Hungarian exports
while it reaches 73% of Romanian exports. On the opposite, the share of up-market goods varies from
31% in Slovenia and 28% in Hungary to a low 8% in Romania. Between 1993 and 1996, the relative
position in up-market products improved for all Central European countries, which strongly contrasts
with the situation of Latvia, Lithuania and the Balkan countries. In the former case, this result
excludes the scenario of locking specialisation in traditional sectors (Freudenberg and Lemoine, 1999)
3. Trade specialisation patterns in an enlarged Union
3.1. International specialisation in the EU-25
17
Many papers have described empirical evidence on the location of activity in the EU10. The
distribution of activities follows the same trend with an increasing relative concentration over the last
two decades (Dupuch and Jennequin, 2001). Distinction between industrial characteristics provides
more precise information. The European periphery predominantly attracts labour and low-tech
intensive activities whereas high-tech, high-skilled or increasing returns to scale intensive activities are
more spatially agglomerated in the core regions (Midelfart-Knarvik and al., 2002).
While specialisation in the US seems to be declining, it has increased within the EU since the
1970’s. Moreover, peripheral countries like Portugal, Finland or Greece exhibit a more pronounced
specialisation than core countries (Dupuch and al., 2001). At the regional level, studies are quite
mixed in their conclusions. No significant tendency emerges in the EU (Combes and Overman, 2003).
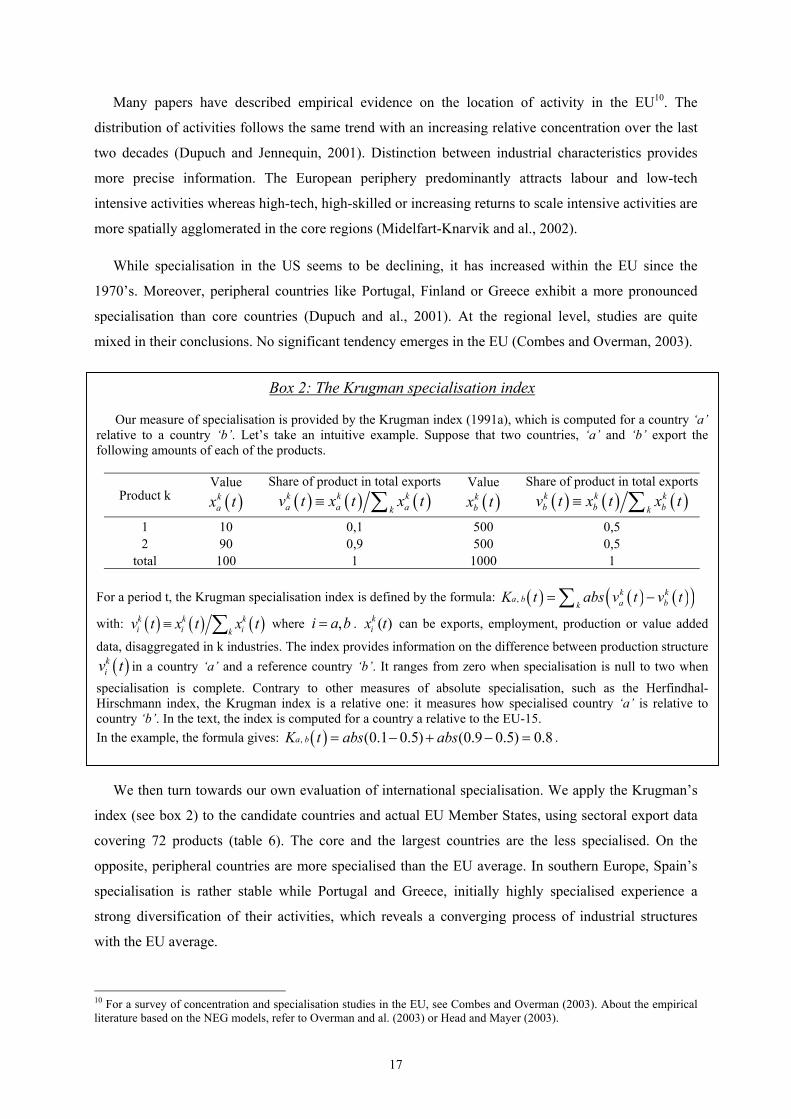
We then turn towards our own evaluation of international specialisation. We apply the Krugman’s
index (see box 2) to the candidate countries and actual EU Member States, using sectoral export data
covering 72 products (table 6). The core and the largest countries are the less specialised. On the
opposite, peripheral countries are more specialised than the EU average. In southern Europe, Spain’s
specialisation is rather stable while Portugal and Greece, initially highly specialised experience a
strong diversification of their activities, which reveals a converging process of industrial structures
with the EU average.
10 For a survey of concentration and specialisation studies in the EU, see Combes and Overman (2003). About the empirical literature based on the NEG models, refer to Overman and al. (2003) or Head and Mayer (2003).
Box 2: The Krugman specialisation index
Our measure of specialisation is provided by the Krugman index (1991a), which is computed for a country ‘a’relative to a country ‘b’. Let’s take an intuitive example. Suppose that two countries, ‘a’ and ‘b’ export the following amounts of each of the products.
Product k Value ( )k
ax t Share of product in total exports
( ) ( ) ( )k k ka a ak
v t x t x t≡ ∑ Value ( )k
bx t Share of product in total exports
( ) ( ) ( )k k kb b bk
v t x t x t≡ ∑
1 10 0,1 500 0,5 2 90 0,9 500 0,5
total 100 1 1000 1 For a period t, the Krugman specialisation index is defined by the formula: ( ) ( ) ( )( ),
k ka b a bk
K t abs v t v t= −∑
with: ( ) ( ) ( )k k ki i ik
v t x t x t≡ ∑ where ,i a b= . ( )kix t can be exports, employment, production or value added
data, disaggregated in k industries. The index provides information on the difference between production structure ( )k
iv t in a country ‘a’ and a reference country ‘b’. It ranges from zero when specialisation is null to two when specialisation is complete. Contrary to other measures of absolute specialisation, such as the Herfindhal-Hirschmann index, the Krugman index is a relative one: it measures how specialised country ‘a’ is relative to country ‘b’. In the text, the index is computed for a country a relative to the EU-15. In the example, the formula gives: ( ), (0.1 0.5) (0.9 0.5) 0.8a bK t abs abs= − + − = .
18
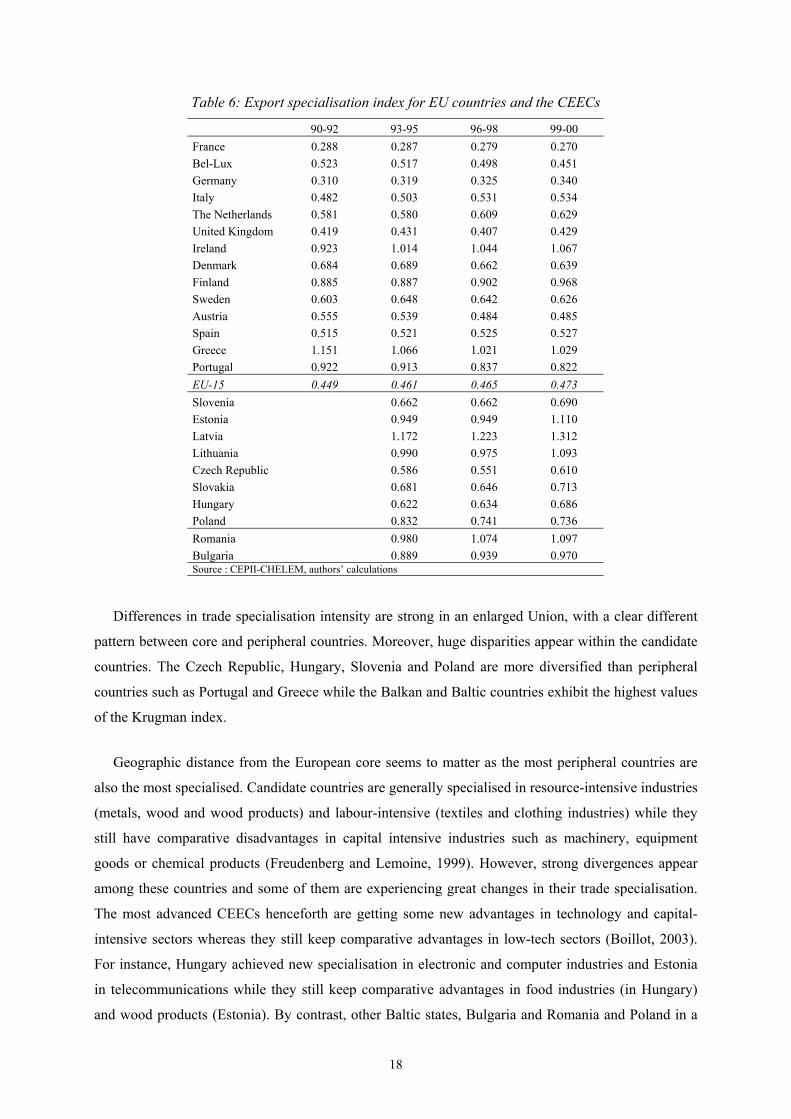
Table 6: Export specialisation index for EU countries and the CEECs
90-92 93-95 96-98 99-00 France 0.288 0.287 0.279 0.270 Bel-Lux 0.523 0.517 0.498 0.451 Germany 0.310 0.319 0.325 0.340 Italy 0.482 0.503 0.531 0.534 The Netherlands 0.581 0.580 0.609 0.629 United Kingdom 0.419 0.431 0.407 0.429 Ireland 0.923 1.014 1.044 1.067 Denmark 0.684 0.689 0.662 0.639 Finland 0.885 0.887 0.902 0.968 Sweden 0.603 0.648 0.642 0.626 Austria 0.555 0.539 0.484 0.485 Spain 0.515 0.521 0.525 0.527 Greece 1.151 1.066 1.021 1.029 Portugal 0.922 0.913 0.837 0.822 EU-15 0.449 0.461 0.465 0.473 Slovenia 0.662 0.662 0.690 Estonia 0.949 0.949 1.110 Latvia 1.172 1.223 1.312 Lithuania 0.990 0.975 1.093 Czech Republic 0.586 0.551 0.610 Slovakia 0.681 0.646 0.713 Hungary 0.622 0.634 0.686 Poland 0.832 0.741 0.736 Romania 0.980 1.074 1.097 Bulgaria 0.889 0.939 0.970 Source : CEPII-CHELEM, authors’ calculations
Differences in trade specialisation intensity are strong in an enlarged Union, with a clear different
pattern between core and peripheral countries. Moreover, huge disparities appear within the candidate
countries. The Czech Republic, Hungary, Slovenia and Poland are more diversified than peripheral
countries such as Portugal and Greece while the Balkan and Baltic countries exhibit the highest values
of the Krugman index.
Geographic distance from the European core seems to matter as the most peripheral countries are
also the most specialised. Candidate countries are generally specialised in resource-intensive industries
(metals, wood and wood products) and labour-intensive (textiles and clothing industries) while they
still have comparative disadvantages in capital intensive industries such as machinery, equipment
goods or chemical products (Freudenberg and Lemoine, 1999). However, strong divergences appear
among these countries and some of them are experiencing great changes in their trade specialisation.
The most advanced CEECs henceforth are getting some new advantages in technology and capital-
intensive sectors whereas they still keep comparative advantages in low-tech sectors (Boillot, 2003).
For instance, Hungary achieved new specialisation in electronic and computer industries and Estonia
in telecommunications while they still keep comparative advantages in food industries (in Hungary)
and wood products (Estonia). By contrast, other Baltic states, Bulgaria and Romania and Poland in a
19
lesser extent, still exhibit a high share of traditional activities (food products, metals, textiles) in their
export structure.
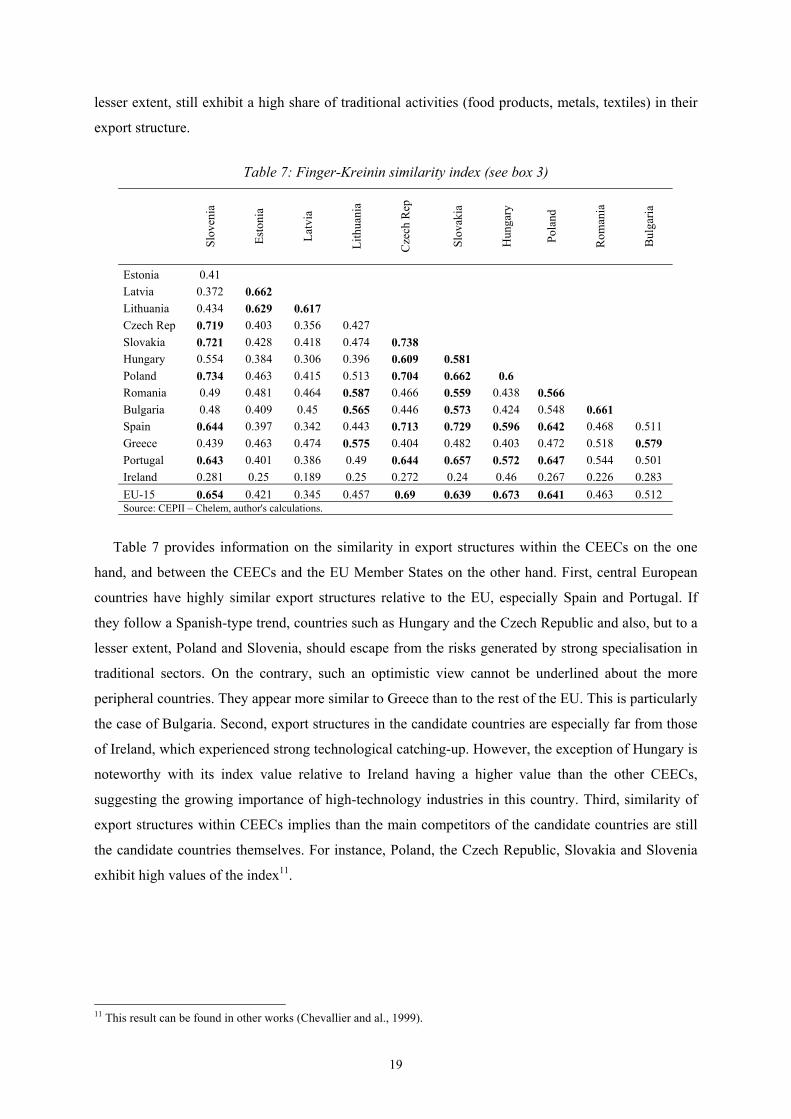
Table 7: Finger-Kreinin similarity index (see box 3)
Slov
enia
Esto
nia
Latv
ia
Lith
uani
a
Cze
ch R
ep
Slov
akia
Hun
gary
Pola
nd
Rom
ania
Bul
garia
Estonia 0.41 Latvia 0.372 0.662 Lithuania 0.434 0.629 0.617 Czech Rep 0.719 0.403 0.356 0.427 Slovakia 0.721 0.428 0.418 0.474 0.738 Hungary 0.554 0.384 0.306 0.396 0.609 0.581 Poland 0.734 0.463 0.415 0.513 0.704 0.662 0.6 Romania 0.49 0.481 0.464 0.587 0.466 0.559 0.438 0.566 Bulgaria 0.48 0.409 0.45 0.565 0.446 0.573 0.424 0.548 0.661 Spain 0.644 0.397 0.342 0.443 0.713 0.729 0.596 0.642 0.468 0.511 Greece 0.439 0.463 0.474 0.575 0.404 0.482 0.403 0.472 0.518 0.579 Portugal 0.643 0.401 0.386 0.49 0.644 0.657 0.572 0.647 0.544 0.501 Ireland 0.281 0.25 0.189 0.25 0.272 0.24 0.46 0.267 0.226 0.283 EU-15 0.654 0.421 0.345 0.457 0.69 0.639 0.673 0.641 0.463 0.512 Source: CEPII – Chelem, author's calculations.
Table 7 provides information on the similarity in export structures within the CEECs on the one
hand, and between the CEECs and the EU Member States on the other hand. First, central European
countries have highly similar export structures relative to the EU, especially Spain and Portugal. If
they follow a Spanish-type trend, countries such as Hungary and the Czech Republic and also, but to a
lesser extent, Poland and Slovenia, should escape from the risks generated by strong specialisation in
traditional sectors. On the contrary, such an optimistic view cannot be underlined about the more
peripheral countries. They appear more similar to Greece than to the rest of the EU. This is particularly
the case of Bulgaria. Second, export structures in the candidate countries are especially far from those
of Ireland, which experienced strong technological catching-up. However, the exception of Hungary is
noteworthy with its index value relative to Ireland having a higher value than the other CEECs,
suggesting the growing importance of high-technology industries in this country. Third, similarity of
export structures within CEECs implies than the main competitors of the candidate countries are still
the candidate countries themselves. For instance, Poland, the Czech Republic, Slovakia and Slovenia
exhibit high values of the index11.
11 This result can be found in other works (Chevallier and al., 1999).
20
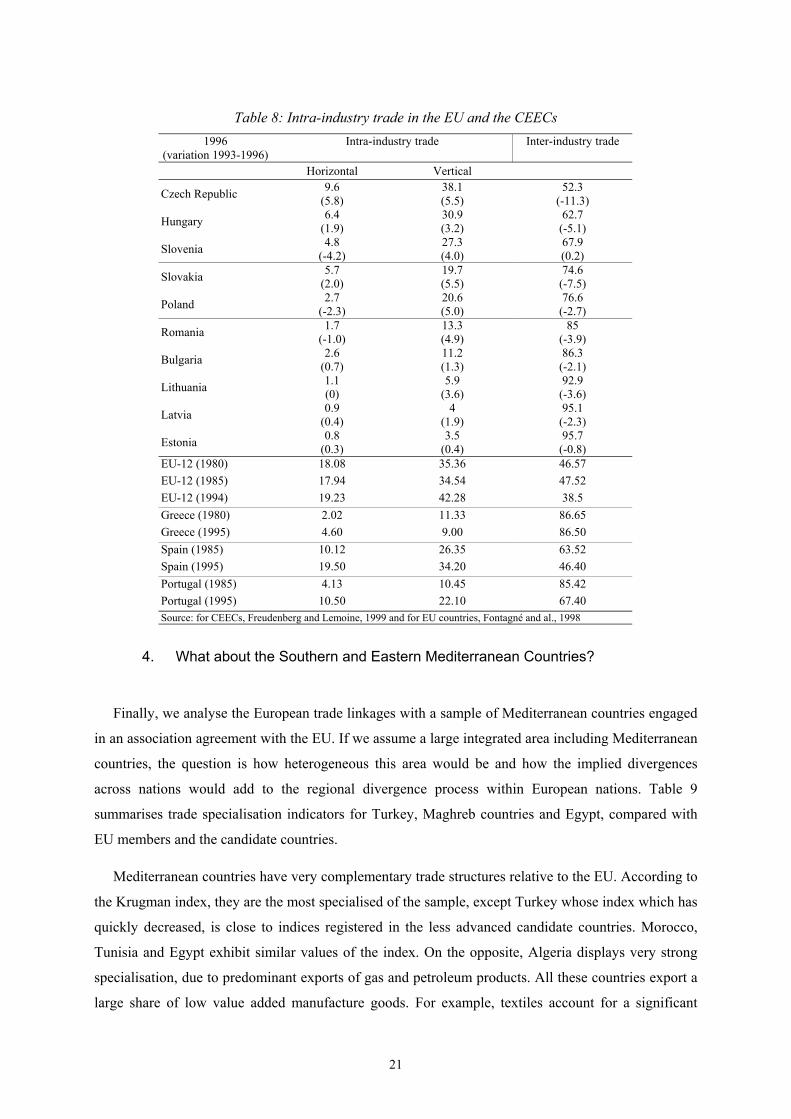
3.2. Towards an intra-industry specialisation?
Specialisation indices and trends in intra-industry trade between EU countries and the CEECs
provide similar conclusions. European trade is essentially intra-industry, especially in vertical
differentiation, whose increase has been noteworthy since 1985. However, peripheral countries are an
exception as regards this trend: inter-industry trade still predominates, despite a tangible catching-up
experienced in Spain and to a lesser extent in Portugal. Analysing trade patterns between the EU and
the candidate countries shows that inter-industry trade prevails and that large differences characterise
the future EU members.
Considering data from different sources, three distinct groups can be emphasised (table 8). First,
the Central European countries (Hungary, Slovenia and the Czech Republic) exhibit a high share of
intra-industry trade which outweighs that of Portugal and Greece. Poland and Slovakia stand at a more
intermediate level whereas inter-industry trade remains very predominant in both the Balkan and
Baltic countries (from 85% to 95%). Intra-industry trade in goods differentiated by quality (i.e.
vertically) represents 80 to 90% of total intra-industry trade and has experienced a significant rise
between 1993 and 1996, which advocates in favour of an early convergence process of trade structures
towards the EU standards. This shift appears more clearly in countries which had initially large
amounts of intra-industry trade, which could mean larger and larger disparities within the candidate
countries. According to Freudenberg and Lemoine (1999), some caveats subsist: is the convergence
suggested by trade patterns robust? Do production structures follow the same trend? For institutional
reasons (inefficiency in firm governance and residual state ownership in the capital of newly private
firms), the slow restructuring is the weak aspect of transition and can contradict the convergence
process (Andreff, 1999).
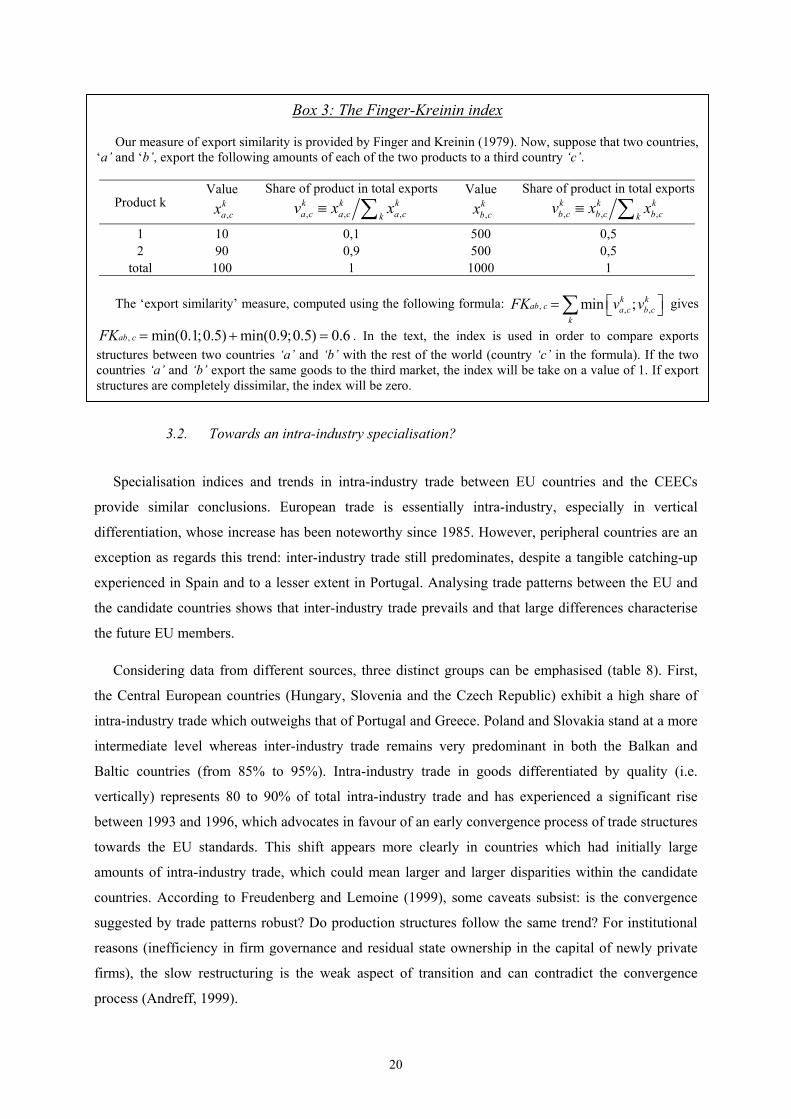
Box 3: The Finger-Kreinin index
Our measure of export similarity is provided by Finger and Kreinin (1979). Now, suppose that two countries, ‘a’ and ‘b’, export the following amounts of each of the two products to a third country ‘c’.
Product k Value ,
ka cx
Share of product in total exports
, , ,k k ka c a c a ck
v x x≡ ∑ Value ,
kb cx
Share of product in total exports
, , ,k k kb c b c b ck
v x x≡ ∑
1 10 0,1 500 0,5 2 90 0,9 500 0,5
total 100 1 1000 1
The ‘export similarity’ measure, computed using the following formula: , , ,min ;k kab c a c b c
kFK v v⎡ ⎤= ⎣ ⎦∑ gives
, min(0.1;0.5) min(0.9;0.5) 0.6ab cFK = + = . In the text, the index is used in order to compare exports structures between two countries ‘a’ and ‘b’ with the rest of the world (country ‘c’ in the formula). If the two countries ‘a’ and ‘b’ export the same goods to the third market, the index will be take on a value of 1. If export structures are completely dissimilar, the index will be zero.
21
Table 8: Intra-industry trade in the EU and the CEECs
1996 (variation 1993-1996)
Intra-industry trade Inter-industry trade
Horizontal Vertical
Czech Republic 9.6 (5.8)
38.1 (5.5)
52.3 (-11.3)
Hungary 6.4 (1.9)
30.9 (3.2)
62.7 (-5.1)
Slovenia 4.8 (-4.2)
27.3 (4.0)
67.9 (0.2)
Slovakia 5.7 (2.0)
19.7 (5.5)
74.6 (-7.5)
Poland 2.7 (-2.3)
20.6 (5.0)
76.6 (-2.7)
Romania 1.7 (-1.0)
13.3 (4.9)
85 (-3.9)
Bulgaria 2.6 (0.7)
11.2 (1.3)
86.3 (-2.1)
Lithuania 1.1 (0)
5.9 (3.6)
92.9 (-3.6)
Latvia 0.9 (0.4)
4 (1.9)
95.1 (-2.3)
Estonia 0.8 (0.3)
3.5 (0.4)
95.7 (-0.8)
EU-12 (1980) 18.08 35.36 46.57 EU-12 (1985) 17.94 34.54 47.52 EU-12 (1994) 19.23 42.28 38.5 Greece (1980) 2.02 11.33 86.65 Greece (1995) 4.60 9.00 86.50 Spain (1985) 10.12 26.35 63.52 Spain (1995) 19.50 34.20 46.40 Portugal (1985) 4.13 10.45 85.42 Portugal (1995) 10.50 22.10 67.40 Source: for CEECs, Freudenberg and Lemoine, 1999 and for EU countries, Fontagné and al., 1998
4. What about the Southern and Eastern Mediterranean Countries?
Finally, we analyse the European trade linkages with a sample of Mediterranean countries engaged
in an association agreement with the EU. If we assume a large integrated area including Mediterranean
countries, the question is how heterogeneous this area would be and how the implied divergences
across nations would add to the regional divergence process within European nations. Table 9
summarises trade specialisation indicators for Turkey, Maghreb countries and Egypt, compared with
EU members and the candidate countries.
Mediterranean countries have very complementary trade structures relative to the EU. According to
the Krugman index, they are the most specialised of the sample, except Turkey whose index which has
quickly decreased, is close to indices registered in the less advanced candidate countries. Morocco,
Tunisia and Egypt exhibit similar values of the index. On the opposite, Algeria displays very strong
specialisation, due to predominant exports of gas and petroleum products. All these countries export a
large share of low value added manufacture goods. For example, textiles account for a significant
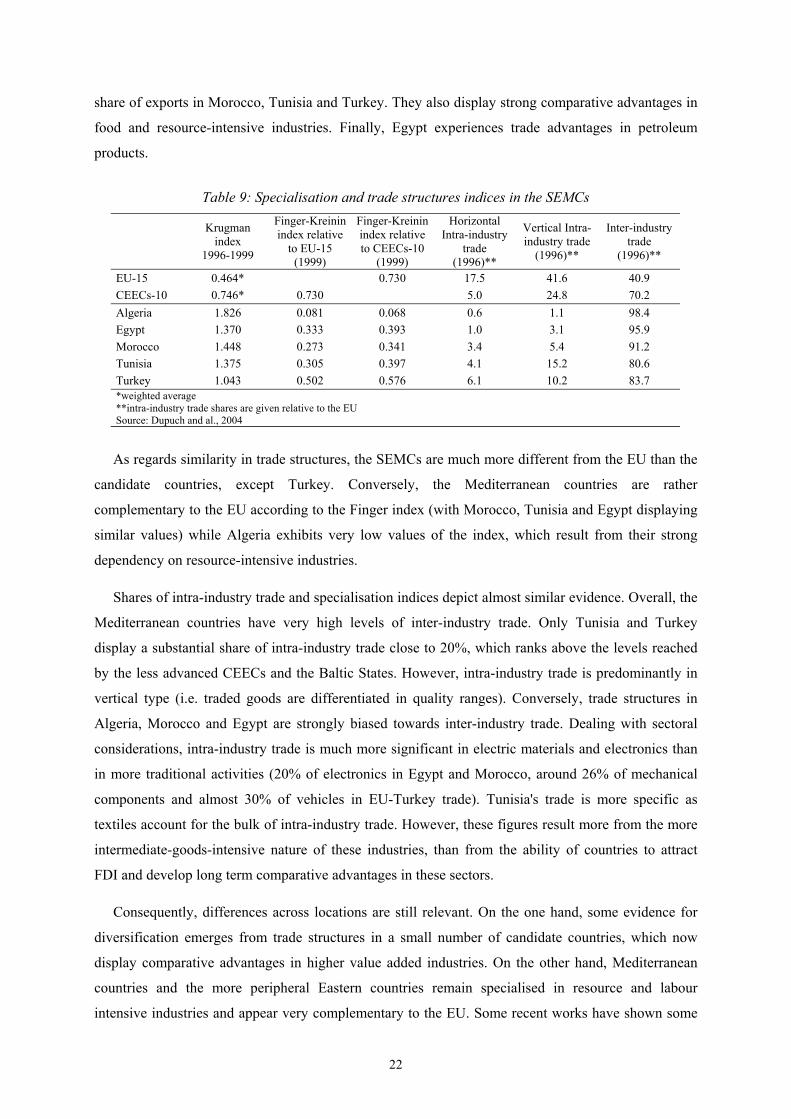
22
share of exports in Morocco, Tunisia and Turkey. They also display strong comparative advantages in
food and resource-intensive industries. Finally, Egypt experiences trade advantages in petroleum
products.
Table 9: Specialisation and trade structures indices in the SEMCs
Krugman
index 1996-1999
Finger-Kreinin index relative
to EU-15 (1999)
Finger-Kreinin index relative to CEECs-10
(1999)
Horizontal Intra-industry
trade (1996)**
Vertical Intra-industry trade
(1996)**
Inter-industry trade
(1996)**
EU-15 0.464* 0.730 17.5 41.6 40.9 CEECs-10 0.746* 0.730 5.0 24.8 70.2 Algeria 1.826 0.081 0.068 0.6 1.1 98.4 Egypt 1.370 0.333 0.393 1.0 3.1 95.9 Morocco 1.448 0.273 0.341 3.4 5.4 91.2 Tunisia 1.375 0.305 0.397 4.1 15.2 80.6 Turkey 1.043 0.502 0.576 6.1 10.2 83.7 *weighted average **intra-industry trade shares are given relative to the EU Source: Dupuch and al., 2004
As regards similarity in trade structures, the SEMCs are much more different from the EU than the
candidate countries, except Turkey. Conversely, the Mediterranean countries are rather
complementary to the EU according to the Finger index (with Morocco, Tunisia and Egypt displaying
similar values) while Algeria exhibits very low values of the index, which result from their strong
dependency on resource-intensive industries.
Shares of intra-industry trade and specialisation indices depict almost similar evidence. Overall, the
Mediterranean countries have very high levels of inter-industry trade. Only Tunisia and Turkey
display a substantial share of intra-industry trade close to 20%, which ranks above the levels reached
by the less advanced CEECs and the Baltic States. However, intra-industry trade is predominantly in
vertical type (i.e. traded goods are differentiated in quality ranges). Conversely, trade structures in
Algeria, Morocco and Egypt are strongly biased towards inter-industry trade. Dealing with sectoral
considerations, intra-industry trade is much more significant in electric materials and electronics than
in more traditional activities (20% of electronics in Egypt and Morocco, around 26% of mechanical
components and almost 30% of vehicles in EU-Turkey trade). Tunisia's trade is more specific as
textiles account for the bulk of intra-industry trade. However, these figures result more from the more
intermediate-goods-intensive nature of these industries, than from the ability of countries to attract
FDI and develop long term comparative advantages in these sectors.
Consequently, differences across locations are still relevant. On the one hand, some evidence for
diversification emerges from trade structures in a small number of candidate countries, which now
display comparative advantages in higher value added industries. On the other hand, Mediterranean
countries and the more peripheral Eastern countries remain specialised in resource and labour
intensive industries and appear very complementary to the EU. Some recent works have shown some
23
elements of trade diversification and quality upgrading, which remain marginal (Chevallier and
Freudenberg, 2001). Moreover, countries which experience shifts in intra-industry trade based on
textiles and clothing industries, like Tunisia, are likely to suffer more from the competition coming
from the China accession into the WTO and the future dismantling of the multi-fibre agreement than
from the accession of some CEECs to the EU.
Conclusion
The EU enlargement process, including southern and eastern Mediterranean countries, is
noteworthy for many reasons. The next enlargement wave is the largest and the most complex the EU
has ever had to deal with since its creation. It encompasses countries which are more lagging behind in
terms of economic performance than did Spain, Greece and Portugal when they joined the EEC in the
eighties. Moreover, the CEECs emerge from 12 years of transition that modified deeply and quickly
their economic and productive structures. Under these conditions, this new step of the European
unification may influence the economic geography both within and between the Member States more
than the preceding waves did.
Theoretically, in spite of the lack of labour mobility within the EU, a core periphery schema is
expected to occur as a result of vertical linkages. In terms of efficiency, the decrease in transaction
costs and the gains from agglomeration cumulate each other. Consequently, sectoral divergence
exhibited by the vertical linkages models can find evidence in the EU through a high-skilled core
attracting increasing intensive activities and a low-skilled periphery. These predictions are confronted
with data relative to the main stylised facts on real and structural convergence of the candidate
countries with the EU.
Two alternative scenario are discussed. We show strong differences in trade specialisation intensity
in an enlarged Union, with a clear different pattern between core countries and the periphery. The
former tend to converge towards the EU standards through the development of intra-industry trade and
the upgrading of specialisation patterns while the latter remain dependant from comparative
advantages in low-tech and labour-intensive sectors. The role of FDI in the host countries
specialisation patterns changes has been examined in this paper. The consequences of FDI in the
CEECs' international specialisation cannot be denied. In the Spanish case and in some of the candidate
countries, inward FDI have already played an important role in the shift towards intra-industry
specialisation. Actually, foreign firms are likely to bring with themselves technology, know-how and
management structures, which help the transition process towards a competitive market-based
economy. In the case of Mediterranean countries, benefits from FDI have been negligible until now. In
the last years and despite the Euromed agreement, FDI inflows have remained low for various reasons
24
such as unfavourable institutional framework, slow privatisation process, macroeconomic uncertainty
and small market size.
Finally, the picture of a diversified Europe in which nations keep the bulk of activities should not
be altered with the enlargement for the core countries, including some peripheral countries and some
new CEECs candidates to the enlargement. The core-periphery schema is likely to perpetuate, with a
larger core including Slovenia, a few urban and border Hungarian and Polish regions, the Czech
Republic and Slovakia while the EU periphery is enlarged to other Eastern and Mediterranean
countries. In this context, the lack of a regulatory framework at the EU level in such an heterogeneous
area could induce both economic and political tensions. Contrary to its founders' will, the result would
be to reduce the large EU to, more or less, a free trade area.
References
Amiti M. and Pissarides C., 2002, Trade and Industrial Location with Heterogeneous Labour, Centre for Economic Performance, DP 0541, august
Andreff W., 1999, “Privatisation et Gouvernement d’Entreprise dans les économies en transition”, Economie Internationale n°77, pp. 97-129
Aussilloux V. and Pajot M., 2001, Enjeux Commerciaux de l’Elargissement de l’Union Européenne, Fourgeaud seminar, Direction de la Prévision, Ministry of the economy and finances, february
Bailly F., Mouhoud E.M., Oudinet J., 2003, "Union européenne : Les nouvelles dynamiques migratoires : relance et complexification", Chronique Internationale de l'IRES, n°84
Baldwin R.E., 1994, Towards an Integrated Europe, Centre for Economic Policy Research, London
Baldwin R.E., 2001, "Core-Periphery Model with Forward-looking Expectations", Regional Science and Urban Economics 31, pp.21-49
Baldwin R.E., Forslid R., Martin P., Ottaviano G.I.P. and Robert-Nicoud F., 2003, Economic Geography and Public Policy, Princeton University Press, Princeton
Baldwin R.E., Francois J. and Portes R., 1997, "The Costs and Benefits of Eastern Enlargement: the Impact on the EU and Central Europe", Economic Policy 24, pp.125-176
Barro R. and Lee J.W., 2000, International Data on Educational Attainment: Updates and Implications, CID Working Paper n°42
Bchir M. H. and Maurel M., 2002, Impacts économiques et sociaux de l'élargissement pour l'Union Européenne et la France, Document de travail CEPII n°2002-03, avril
Boillot J.J., 2003, L’Union Européenne élargie, un défi économique pour tous, La Documentation Française
Brainard S.L., 1993, A Simple Theory of Multinational Corporations and Trade with a Trade-off between Proximity and Concentration, NBER Working Paper n°4269
Chevallier A. and Freudenberg M., 2001, "La nature des Echanges Euro-méditerranéens et les perspectives d'intégration régionale", in Dessus S and Devlin J., Vers une intégration régionale Arabe Euro-méditerranéenne, Centre de Développement de l'OCDE, pp.53-91
Chevallier A., Lemoine F. and Neyman L., 1999, “L’Union Européenne et sa Périphérie, Conséquences de l’Intégration Commerciale de l’Europe Centrale”, Revue Economique, vol.50, n°6, pp.1169-1184
Combes P.P. and Overman H., 2003, "The Spatial Distribution of Economic Activities in the European Union", in Handbook of Regional and Urban Economics Volume IV, edited by V. Henderson and J.F. Thisse
Commissariat Général du Plan (CGP), 1999, Scénario pour une Nouvelle Géographie Economique de l’Europe, Economica, Paris
25
Dixit A.K. and Stiglitz J.E., 1977, "Monopolistic Competition and Optimum Product Diversity", American Economic Review 67, pp.297-308
Dupuch S. and Jennequin H, 2001, Intégration Régionale et Géographie Economique Européenne : Quelques Résultats Empiriques, CEPN Working Paper 04-2001
Dupuch S., Jennequin H. and Mouhoud E.M., 2001, "Intégration Européenne, Elargissement aux PECO et Economie Géographique", Région et Développement, 2001-13, pp.125-162
Dupuch S. and Milan C., 2003, Les Déterminants des Investissements Directs Européens dans les pays d'Europe Centrale et Orientale, CEPN Working Paper 07-2003
Dupuch S., Mouhoud E.M. and Talahite F., 2004, "Les Perspectives d'intégration entre l'Union Européenne, les PECO et les pays Sud méditerranéens : incidences sur les tendances de la spécialisation des activités en Europe", Economie Internationale, forthcoming
Eltetö A., 1998, Economic Performance of Foreign Investment Enterprises, Effects of FDI in Hungary, Institute for World Economics, Budapest, mimeo
Emerson M. and al., 1990, One market, one money, Oxford, Oxford University Press
Eurostat, 2002a, "Première enquête sur la formation professionnelle continue en entreprise dans les pays candidats", Statistiques en Bref, Thème 3, 2/2002
Eurostat, 2002b, "Investissements directs étrangers dans les pays candidats: répartition par secteur d'activité et par pays investisseur", Statistiques en Bref, Thème 2, 55/2002
Finger J.M., and Kreinin M.E., 1979, "A Measure of Export Similarity and its Possible Uses", The Economic Journal, vol. 89, pp. 905-912
Fontagné L., Freudenberg M. and Péridy N., 1998, Intra-Industry Trade and the Single Market: Quality Matters, CEPR Discussion Paper n°1953
Forslid R., Haaland J., Maestad O. and Midelfart-Knarvik K.H., 2002a, "Integration and Transition: Scenarios for Locations of Production and Trade in Europe", Economics of Transition, Vol.10 (1), pp.93-117
Forslid R., Haaland J. and Midelfart-Knarvik K.H., 2002b, "a U-shaped Europe? A Simulation Study of Industrial Location", Journal of International Economics 57, pp.273-297
Francois J., 2002, "Factor Mobility, Economic Integration, and the Location of Industry", in Economic Impact of EU Membership on Entrants: New Methods and Issues, R.E. Baldwin and A. Brunetti Volume Editors, Kluwer Academic Publishers: Boston/Dordrecht/London
Frankel J. and Rose A., 1998, "The Endogeneity of Optimum Currency Criteria", The Economic Journal, vol.108, pp.1009-1025
Freudenberg M. and Lemoine F., 1999, Central and Eastern European Countries in the International Division of Labour in Europe, CEPII Working Paper n°1999-05
Fujita M., Krugman P. and Venables A., 1999, The Spatial Economy. Cities, Regions and International Trade, MIT Press, Cambridge, MA
Head K. and Mayer T., 2003, "The Empirics of Agglomeration and Trade", in Handbook of Regional and Urban Economics Volume IV, edited by V. Henderson and J.F. Thisse
Henriot A., 2003, Prospects for the location of industrial activities after EU enlargement, document de travail COE n°61, janvier
Hirshman, A.O., 1958, The Strategy of Economic Development, Yale University Press, New Haven, CT.
Jennequin H., 2003, Secteur Tertiaire Différencié et Qualification de la Main d’œuvre, un Modèle d’Economie Géographique Tri-sectoriel, CEPN Working Paper 13-2003
Krugman P.R. and Venables A., 1995, "Globalization and the Inequality of Nations", Quarterly Journal of Economics, 110(4), pp.857-880
Krugman P.R., 1980, "Scale Economies, Product Differentiation and the Pattern of Trade", American Economic Review 70, pp.950-959
Krugman P.R., 1991a, Geography and Trade, MIT Press
Krugman P.R., 1991b, "Increasing Returns and Economic Geography", Journal of Political Economy 99, pp.483-499
26
Landesmann M., 2003, Structural features of economic integration in an Enlarged Europe: patterns of catching-up and industrial specialisation, Economic Papers n°181, DG Economy and Finance, European Commission
Ludema R. and Wooton I., 1999, "Regional Integration, Trade, and Migration: Are Demand Linkage Relevant in Europe?", in Migration the Controversies and the Evidence, Faini R., de Melo J. and K. Zimmermann (eds.), CEPR London
Manzocchi S. and Ottaviano G.I.P., 2001, "Outsiders in Economic Integration: the Case of a Transition Economy", Economics of Transition, Vol.9 (1), pp.229-249
Markusen J.R., 1995, “The Boundaries of Multinational Enterprises and the Theory of International Trade”, Journal of Economic Perspectives, Vol.9, n°2, pp.169-189
Midelfart-Knarvik K.H., Overman H., Redding S. and Venables A., 2002, "Integration and Industrial Specialisation in the European Union", Revue Economique, 53(3), pp.469-481
Mouhoud E.M., 1997, “The Links between Migration, Free Trade and Regional Integration: specific characteristics of the CEECs”, in Migration, Free Trade and Regional Integration in Central and Eastern Europe, OECD WIFO, Verlag Österreich, Wien
Neary J.P., 2001, "Of Hype and Hyperbolas: Introducing the New Economic Geography", Journal of Economic Literature, Vol. 39:2, June, pp.536-561
Ottaviano G.I.P. and Puga D., 1998, "Agglomeration in the Global Economy: a Survey of the New Economic Geography", The World Economy 21, pp.707-731
Ottaviano G.I.P. and Thisse J.F., 2001, "On Economic Geography in Economic Theory: Increasing Returns and Pecuniary Externalities", Journal of Economic Geography 1, pp.153-179
Ottaviano G.I.P. and Thisse J.F., 2003, "Agglomeration and Economic Geography", in Handbook of Regional and Urban Economics Volume IV, edited by V. Henderson and J.F. Thisse
Overman H., Redding S. and Venables A., 2003, "The Economic Geography of Trade, Production, and Income: A Survey of Empirics", in The Handbook of International Trade J. Harrigan and K. Choi (eds.), Basil Blackwell., Oxford
Pavitt K, 1984, "Sectoral Patterns of Technical change: Towards a Taxonomy and Theory", Research Policy, vol.13(6), pp.343-373
Puga D., 1999, "The Rise and Fall of Regional Inequalities", European Economic Review 43, pp.303-334
Puga D. and Venables A., 1999, "Agglomeration and Economic Development: Import Substitution vs. Trade Liberalisation", Economic Journal, Volume 109, Issue 455, pp.292-311
Resmini L., 2000, “The Determinants of Foreign Direct Investment in the CEECs, New Evidence From Sectoral Patterns”, The Economics of Transition, vol.8, n°3, pp.665-689
Rieber A. and Tran T.A.D., 2002, "Technology Diffusion, North-South Spillovers and Industrial Location", Journal of Economic Development, Volume 27, Issue 1, June, pp.25-40
Tabuchi T. and Thisse J.F., 2002, "Taste Heterogeneity, Labor Mobility and Economic Geography", Journal of Development Economics, Volume 69, Issue 1, October, pp.155-177
Toubal L.F., 2001, “Le capital étranger en Europe Centrale et Orientale”, Le courrier des pays de l’Est, n°1313
Venables A., 1996, "Equilibrium Locations of Vertically Linked Industries", International Economic Review 37 (2), pp.341-359
Weresa M., 2001, "The impact of foreign direct investment on Poland's trade with European Union", Post-Communist Economies, vol. 13, n°1

27
Annex: Pavitt’s classification
Pavitt (1984) has developed a sectoral taxonomy of sectors of production and use of innovation. He identifies
four major groups of sectors, with respect of the source of the innovations that they use and to the influence of science on the industrial performance.
- ‘Supplier-dominated’ sectors are broadly traditional industries in which innovative activity is rather limited to adaptation of new capital equipments and intermediate inputs which have been developed and produced by upstream suppliers. They include textile, clothing, leather, printing and publishing, wood products).
- ‘Scale-intensive’ industries mostly rely on scale economies in production and design or R&D provided both internally or by equipment suppliers. This group includes transport equipment, cars, electrical consumer durables, metal manufacturing, parts of the chemical industry…
- ‘Specialised supplier’ industries embody a specialised knowledge in design and equipment-building. They generate products aimed at specific applications, market segments or single users. Typically, this group includes mechanical and instruments engineering.
- ‘Science-based’ sectors include the electronics industries and most of the chemical industries (pharmaceuticals). Major innovations as well as the improvements in process yields are frequent in these sectors where R&D and laboratories are key elements. A high proportion of their product innovation enters a wide number of sectors as capital or intermediate inputs.