annual report 2017–18 annual report 2017–18 - parliament
TRANSCRIPT
EPA Annual Report 2017–18
Clair
Annual Report 2017–18 -
NSW Environment Protection Authority
Annual Report 2017–18 wwww.epa.nsw.gov.au
Annual Report 2017–18
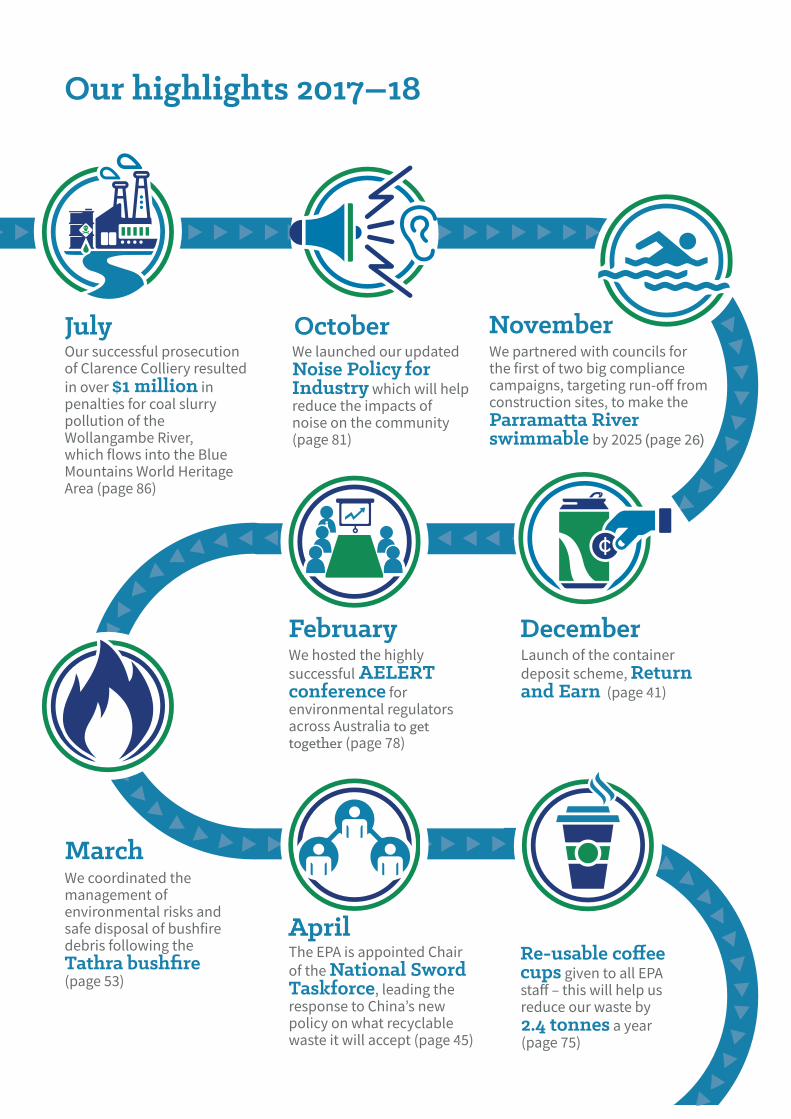
Our highlights 2017–18
�������������������� ������������������������� ���
��������$1 million�������� �������������������� ������ �������������������������������� �� ����������� �������������� ���� ����!�����"#$
July������������������� ���
Noise Policy�for Industry��������������������� �������� ������������� ���������� ��!�����"%$
October November������ �������� ������������� ������ ��� ���������������������������� ���� �������&�'��������� ��� ������ ���� ����(�� ���
Parramatta River swimmable ���)*)+�(�����)6)
,�������� ������ ������
������ ���������Return and Earn��!�����-%$
DecemberFebruary������ ��� ���������
�������� AELERT conference�������������� ������� ����������� �� �����to get together�!�����."$
/���01 ���������� ���������
�� ���National Sword Taskforce��������� ������������ �������2������������������ ������������� ��� ��������� �!�����-+$
Re-usable coffee cups������� ����01 �� �'�3� ���������������������������� �����
2.4 tonnes��������!�����.+$
����������� ��� ������������ ������������� �����(������������������������������������������ �� Tathra bushfire !�����+4$�
March
April
5������'������6����������������������������� ������ ���01 �������� ������ �� �����������7���������������
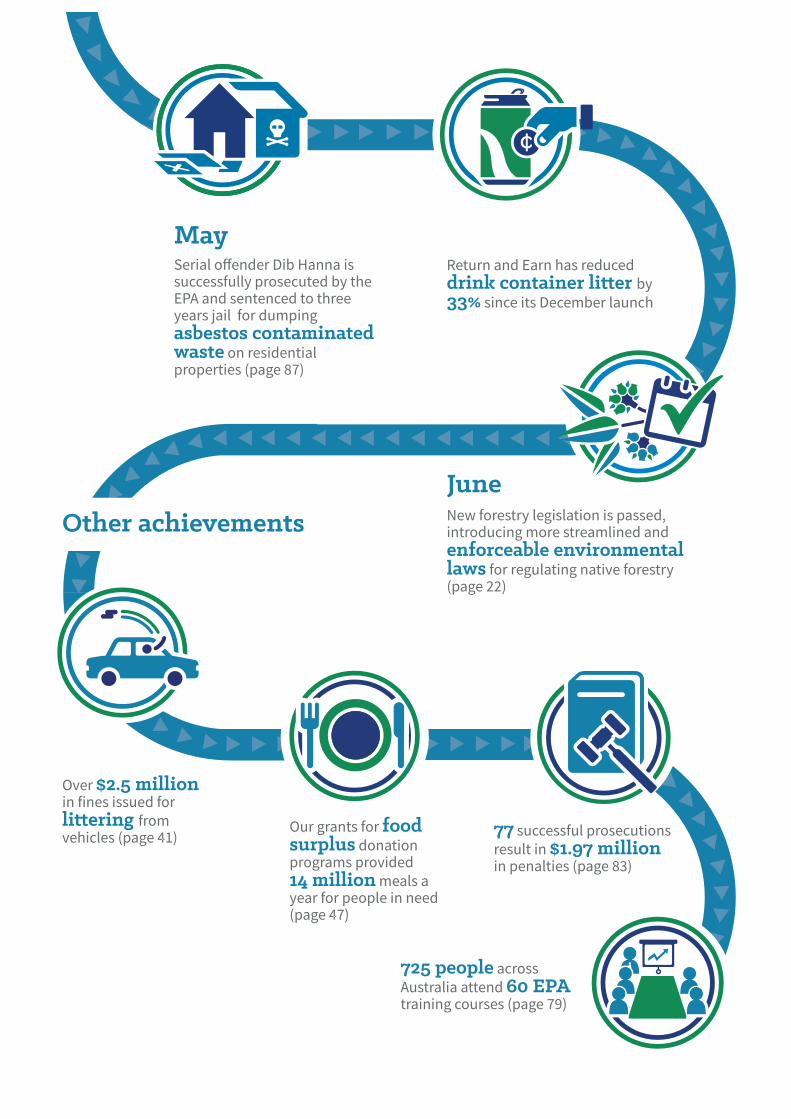
asbestos contaminated waste����������� ��������� ����!�����".$
8������� �������� ����������������� ��������������� �������������
enforceable environmental laws��������� ������ �������� ���!�����))$
May
June
�����$2.5 million�������������������
littering ������������!�����-%$
�������� �����food surplus����� ����������������������
14 million������������������������������!�����-.$
77����������������� ��������� ����$1.97 million�������� ����!�����"4$
725 people�������� �� ������ ����60 EPA� ����������������!�����.9$
Other achievements
�� ��������0����������������
drink container litter ���33%�������� ��6�������������
EPA Annual Report 2017–18
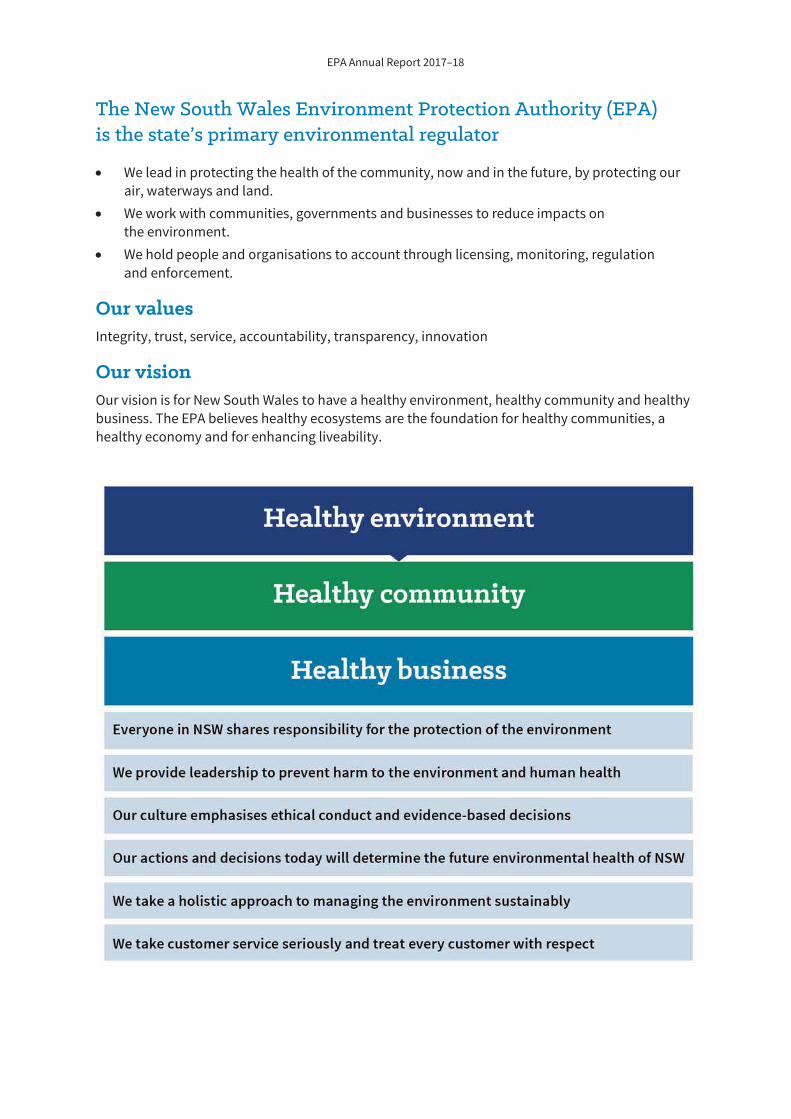
The New South Wales Environment Protection Authority (EPA) is the state’s primary environmental regulator
We lead in protecting the health of the community, now and in the future, by protecting our air, waterways and land. We work with communities, governments and businesses to reduce impacts on the environment. We hold people and organisations to account through licensing, monitoring, regulation and enforcement.
Our values Integrity, trust, service, accountability, transparency, innovation
Our vision Our vision is for New South Wales to have a healthy environment, healthy community and healthy business. The EPA believes healthy ecosystems are the foundation for healthy communities, a healthy economy and for enhancing liveability.
EPA Annual Report 2017–18
Contents
This report summarises the activities and performance of the NSW Environment Protection Authority in 2017–18.
Highlights 2017–18 inside front cover Message from the Acting EPA Chair and CEO 2
Looking ahead 4
Section 1: Our organisation 6
Section 2: Our performance 14
1: Improved human health and environmental protection 16 2: Innovative waste management 35 3: Effective management of environmental incidents 51 4: Sound strategic and planning advice 55 5: Effective communication and stakeholder engagement 58 6: Exemplary and innovative organisation 67
Section 3: Legal enforcement 82
Section 4: Grants and sponsorships 92
Section 5: Our people 96
Section 6: Governance 103
Section 7: Financial performance 123
Appendices 183
Index 221
This report is also available online at epa.nsw.gov.au
EPA Annual Report 2017–18
2
Message from the Acting EPA Chair and CEO It is my pleasure to present the EPA’s Annual Report for 2017–18, a productive year in which we worked with business, government and the public to protect the community and the environment.
At the EPA we value integrity, trust, service, accountability, transparency and innovation and are committed to maintaining and enhancing the liveability of NSW by preventing harm to human health and the environment.
Our Strategic Plan 2017–21 has a focus on outcomes and I am pleased to report some of our important highlights for 2017-18.
We began the rollout of the NSW container deposit scheme Return and Earn on 1 December 2017. By the end of June 2018, a total of 452 million containers had been returned. The largest litter reduction scheme ever introduced in NSW is already making a major contribution to meeting the Premier’s Priority of reducing the volume of litter in the state by 40% by 2020, with a 33% reduction in eligible containers littered by the end of May.
Serial waste offender Dib Hanna was prosecuted by the EPA and sentenced to prison for three years thanks to our successful application for his extradition from Victoria to face charges for repeated illegal dumping of asbestos-contaminated waste.
We played a key role in preparing the Forestry Legislation Amendment Act 2018, which was passed by the NSW Parliament in June 2018. The Act amends the regulatory framework for both public and private native forestry and will enhance the EPA’s compliance and enforcement powers.
We met our success measure to respond to all pollution incident reports within 30 minutes.
The NSW Public Service Commission’s People Matter Employee Survey reflected high staff engagement. The results help us to continually improve ourselves and strive to be an exemplar organisation.
We removed the backlog of unassessed contaminated sites by the end of 2017. All sites requiring regulation have now been assessed and are being made safe.
The EPA also faced some challenges this year.
Acting EPA Chair and CEO Anissa Levy
EPA Annual Report 2017–18
3
One of these was the need to urgently review recycling management in NSW. In January 2018, China began to stringently enforce restrictions on its import of recycled materials under its National Sword Policy. This impacted the global market for recyclable materials.
In response, the NSW Government appointed the EPA as Chair of a newly established intergovernmental taskforce to urgently progress a long-term strategic response to National Sword. It also announced a support package of up to $47 million managed by the EPA to help local government and industry respond immediately to these global changes.
Our response to National Sword in NSW this year has focused on examining opportunities to develop the market for recycled products, developing a circular economy policy and investigating long-term recycling strategies and support requirements.
The EPA Board’s Regulatory Assurance Statement, available on our website, provides more information on our regulatory performance and plans for important issues not covered in detail by this report. These include emerging chemicals, lead and asbestos contamination, and our key role in responding to per- and poly-fluoroalkyl substances (PFAS).
I thank our staff, the community and stakeholders for working with us to protect the community and the environment in NSW for current and future generations.
Anissa Levy Acting Chair and CEO NSW Environment Protection Authority
Letter of submission The Hon. Gabrielle Upton
Minister for the Environment, Minister for Local Government and Minister for Heritage
52 Martin Place SYDNEY NSW 2000
Dear Minister,
I am pleased to submit the Annual Report 2017-18 for the New South Wales Environment Protection Authority.
This report was prepared in accordance with the provisions of the Annual Reports (Statutory Bodies) Act 1984 and Annual Reports (Statutory Bodies) Regulation 2015.
This Annual Report must be presented in both Houses of Parliament within one month of receipt.
Yours sincerely,
Anissa Levy Acting Chair and CEO NSW Environment Protection Authority
EPA Annual Report 2017–18
4
Looking ahead In 2018–19, the EPA will continue to focus on:
providing a great service to everyone we work with and treating all our customers, be they citizens of NSW, licensees, or others, with respect ensuring we keep our eye on the outcomes we want to deliver for the environmental health of NSW through evidence-based and transparent decision-making and seeking innovative solutions being responsive – making sure we react quickly and effectively to incidents and hold ourselves accountable for our actions.
Over the coming year, we will continue to align our work with the priorities set out in the EPA Strategic Plan 2017–21. These priorities emphasise our response to changing global policies, government priorities, community needs and significant environmental issues.
The EPA Board and Executive have identified five areas of focus for the organisation. Our existing priorities have been modified to reflect these.
1. Protect communities affected by environmental issues and emerging problems
Work to predict risks and address environmental threats before they become a problem Establish a panel of independent experts to provide advice and support evidence-based decisions Boost our response to major environmental incidents with a rapid-response team, improved sampling capability and a trained, agile and mobile workforce
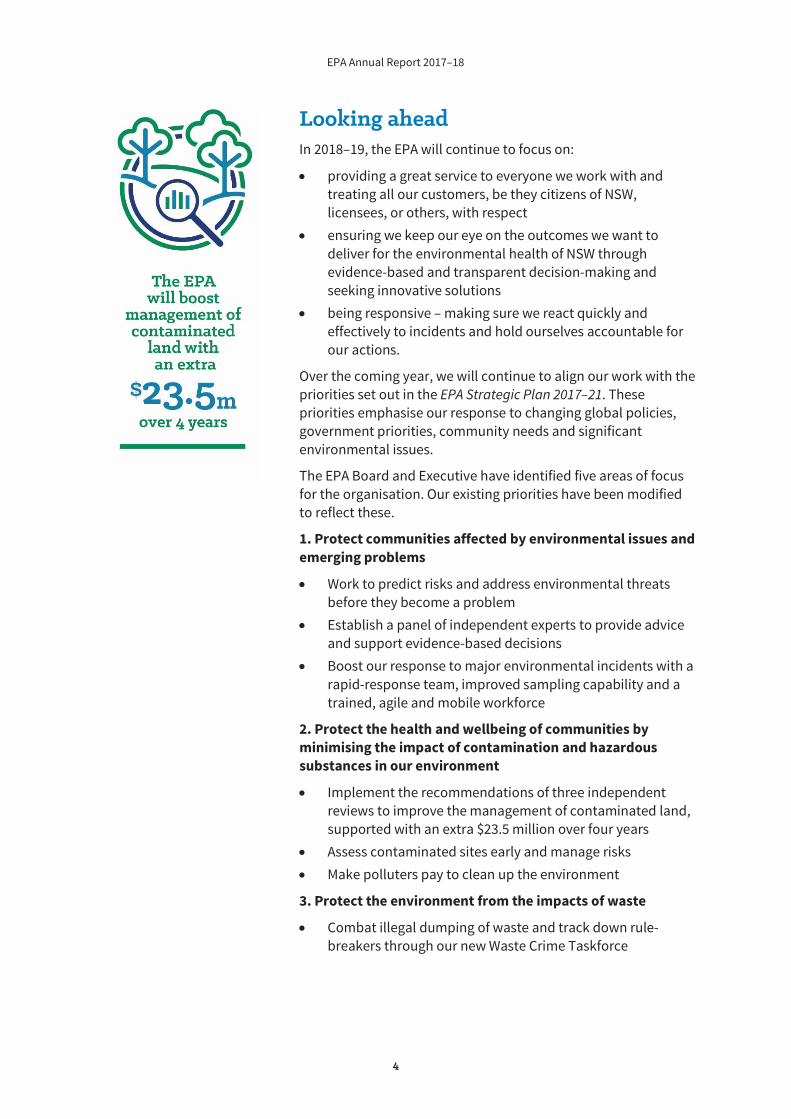
2. Protect the health and wellbeing of communities by minimising the impact of contamination and hazardous substances in our environment
Implement the recommendations of three independent reviews to improve the management of contaminated land, supported with an extra $23.5 million over four years Assess contaminated sites early and manage risks Make polluters pay to clean up the environment
3. Protect the environment from the impacts of waste
Combat illegal dumping of waste and track down rule-breakers through our new Waste Crime Taskforce
EPA Annual Report 2017–18
5
Reduce waste and encourage recycling by embedding the container deposit scheme and progressing the NSW response to China’s National Sword Policy, which limits the amount of materials Australia can send to China for reprocessing Reduce the volume of litter by 40% by 2020 (Premier’s Priority) Halt the growth in per capita waste generation and divert more waste from landfill with more recycling Reduce the amount of plastics entering the environment Reduce illegal dumping by 30% by 2020
4. Ensure people feel cared for when faced with environmental issues
Strengthen the EPA’s capacity for stakeholder engagement and active responses Enhance community confidence about environment protection by making decisions based on scientific evidence with the support of the Office of Environment and Heritage (OEH) Continue to listen to, and engage with, all stakeholders and address community concerns with compassion
5. Protect environmental values
Strengthen partnerships and improve environmental compliance by working closely, sharing knowledge and providing support to our local government partners Reduce population health impacts from exposure to air emissions by improving air quality across NSW Protect aquatic life, the usability of waterways and water resources by looking after the health of our rivers, coasts and groundwater Maintain key native forest values, including the protection of threatened species, with the regulation of native forestry operations Ensure environmental challenges are considered in planning for the future of the state.
We will also consider expanding the EPA’s regulatory assurance and governance activities by establishing a framework for monitoring, evaluating and reporting on our programs to ensure they achieve their objectives and intended results, and that we reduce risks for the organisation.
EPA Annual Report 2017–18
6
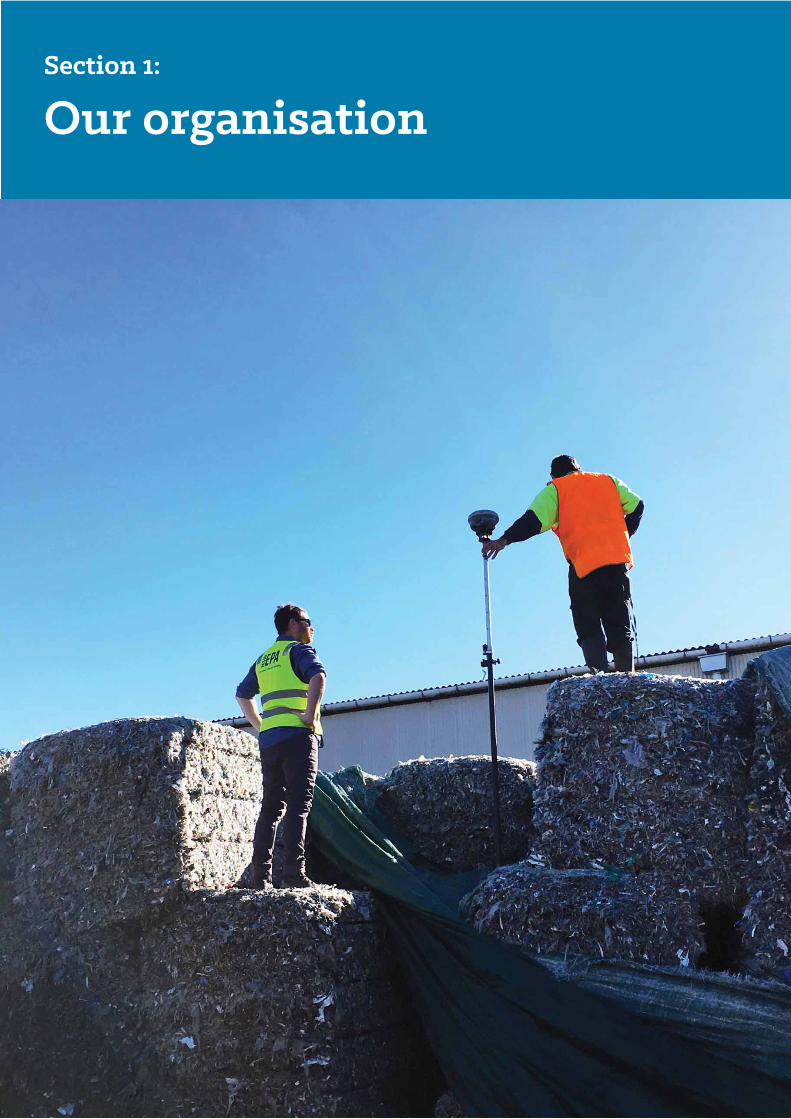
Section 1:
Our organisation

EPA Annual Report 2017–18
7
As the primary environmental regulator for NSW, the EPA protects the community and our environment.
The EPA is an independent statutory authority that sits in the Environment Portfolio as part of the Planning and Environment Cluster.
We work in partnership with business, government and the community to protect human health, reduce pollution and waste and prevent degradation of the environment. Our regulatory focus ensures we lead in protecting the environment and guiding our stakeholders and NSW residents to safeguard our natural resources.
We work with businesses to ensure their activities protect the environment and human health by:
issuing environment protection licences enforcing strict operating conditions and pollution reduction programs monitoring compliance with licence conditions and investigating pollution reports ordering the clean-up of pollution imposing fines or prosecuting organisations and individuals who break the law.
We also:
respond to and manage pollution incidents involving hazardous materials, in collaboration with other government agencies develop and inform environmental programs and policy deliver education and awareness programs support activities that protect the environment through grants and sponsorships provide technical support and expertise to other government agencies.
Our work is informed by contemporary scientific evidence, best practice management and feedback from our stakeholders. The EPA Strategic Plan sets out our work priorities and key result areas (see Section 2: Our performance). The plan is updated each year to reflect changes in focus and emerging issues.
OOur values Integrity Trust Service Accountability Transparency Innovation
Responding to emerging issues On the previous page, an EPA officer and a surveyor inspect a stockpile of recyclable waste. Photo: EPA
8
EPA Annual Report 2017–18
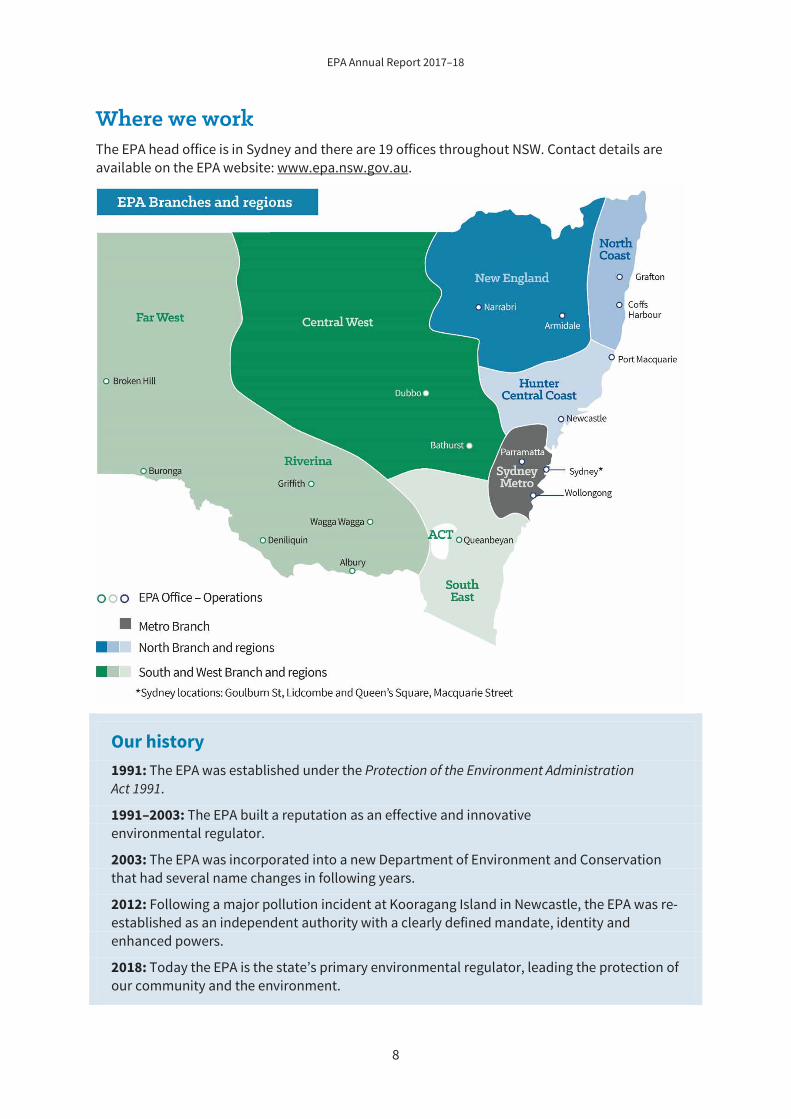
Where we work The EPA head office is in Sydney and there are 19 offices throughout NSW. Contact details are available on the EPA website: www.epa.nsw.gov.au.
Our history 1991: The EPA was established under the Protection of the Environment Administration Act 1991.
1991–2003: The EPA built a reputation as an effective and innovative environmental regulator.
2003: The EPA was incorporated into a new Department of Environment and Conservation that had several name changes in following years.
2012: Following a major pollution incident at Kooragang Island in Newcastle, the EPA was re-established as an independent authority with a clearly defined mandate, identity and enhanced powers.
2018: Today the EPA is the state’s primary environmental regulator, leading the protection of our community and the environment.
9
EPA Annual Report 2017–18
Who we work with Protecting the environment is everyone’s responsibility, which is why we work with communities, government and businesses to reduce impacts to the environment. In both our Strategic Plan and carrying out our responsibilities under the Protection of the Environment Operations Act 1997, we are committed to listening to and creating opportunities for the involvement of our stakeholders. We seek to build relationships through trust and mutual learning.
We work closely with the following key stakeholders:
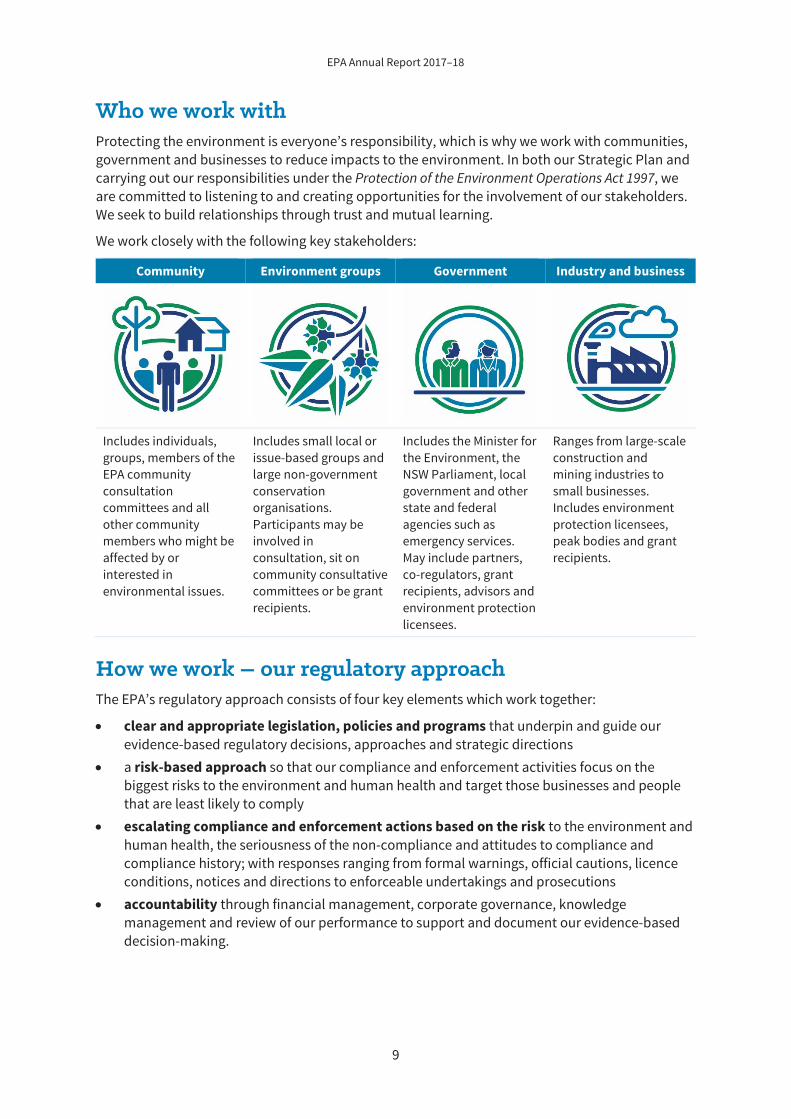
Community Environment groups Government Industry and business
Includes individuals, groups, members of the EPA community consultation committees and all other community members who might be affected by or interested in environmental issues.
Includes small local or issue-based groups and large non-government conservation organisations. Participants may be involved in consultation, sit on community consultative committees or be grant recipients.
Includes the Minister for the Environment, the NSW Parliament, local government and other state and federal agencies such as emergency services. May include partners, co-regulators, grant recipients, advisors and environment protection licensees.
Ranges from large-scale construction and mining industries to small businesses. Includes environment protection licensees, peak bodies and grant recipients.
How we work – our regulatory approach The EPA’s regulatory approach consists of four key elements which work together:
clear and appropriate legislation, policies and programs that underpin and guide our evidence-based regulatory decisions, approaches and strategic directions a risk-based approach so that our compliance and enforcement activities focus on the biggest risks to the environment and human health and target those businesses and people that are least likely to comply escalating compliance and enforcement actions based on the risk to the environment and human health, the seriousness of the non-compliance and attitudes to compliance and compliance history; with responses ranging from formal warnings, official cautions, licence conditions, notices and directions to enforceable undertakings and prosecutions accountability through financial management, corporate governance, knowledge management and review of our performance to support and document our evidence-based decision-making.
EPA Annual Report 2017–18
10
Our branches
Container Deposit Scheme The Branch was formed in early 2018 to oversee the implementation of the NSW Container Deposit Scheme, Return and Earn.
Successful rollout of Return and Earn will help to meet the Premier’s Priority to reduce the volume of litter in NSW by 40% by 2020. The CDS Branch will achieve this through:
program design, delivery and evaluation development of strategic policy management of the scheme contractor ongoing education and community engagement ensuring suppliers who are introducing new containers into NSW comply with regulatory requirements assessment and determination of eligible containers and collection point arrangements.
Prior to the launch of the new branch, CDS policy development was undertaken by the Waste and Resource Recovery Branch with communications and marketing assistance provided by the Stakeholder Engagement and Communications Branch.
Moving from policy development to implementation requires significantly different skill sets and resourcing levels, particularly in the first years of the scheme, as it moves from initiation to stabilisation and eventually a steady state.
Corporate Services Corporate Services supports the strategic objectives of the EPA through effective and efficient delivery of:
corporate financial management and control corporate risk management and governance management and coordination of human resources strategies and work health and safety services support services to the Executive and EPA Board ICT strategy and systems development and management management and development of service-level agreements management of the EPA’s core regulatory systems (CIRAM and PALMS) management of environment protection licensing and motor vehicle compliance Ministerial, Cabinet and Executive support.
EPA Annual Report 2017–18
11
Hazardous Incidents and Environmental Health The Hazardous Incidents and Environmental Health Branch protects the community and the environment from hazardous materials and legacy contamination. The branch comprises the following sections:
Contaminated Land Management Section which assesses contaminated sites notified to the EPA, regulates significantly contaminated land and runs programs to assist councils to deal with legacy contamination Hazardous Materials, Chemicals and Radiation Section which: o regulates the storage, treatment and transport
(including interstate transport) of hazardous waste o implements the National Code of Practice for the
Security of Radioactive Sources HAZMAT and Specialised Support Section which: o advises the Police and Fire and Rescue NSW on the
response and clean-up of hazardous materials following an incident
o performs environmental audits of industry sectors and licensed premises
o trains EPA operational and technical staff and external agencies to improve their regulatory capabilities.
Legal Services The Legal Services Branch provides legal support for the EPA’s activities by offering the following services:
advice on EPA legislation or legislation affecting the EPA’s activities represents the EPA in litigation to which the EPA is a party duty solicitor service to EPA staff support for making changes to the legislation the EPA administers arranges for external legal advice where necessary.
Regulatory Services Division The Regulatory Services Division operates across more than 15 locations throughout NSW and has over 250 staff. The division comprises:
three regional branches which deliver diverse regulatory programs across air, water, noise and pesticide use
EPA Annual Report 2017–18
12
the Regulatory Reform and Advice Branch which delivers legislative reform, policy and programs and technical assessments the Gas Regulation Branch which regulates gas activities in NSW as lead regulator under the NSW Gas Plan the Forestry Branch which regulates native forest logging on public and private land the Intelligence and Analysis Unit which provides an intelligence-led approach to compliance and regulation the Specialist Investigations Unit and Waste Crimes Taskforce.
Stakeholder Engagement and Communications The Stakeholder Engagement and Communications Branch provides information, education and support to the community to help inform decisions that could impact on the environment and improve the environmental performance of business, industry, community and government in NSW.
The branch’s core units and teams are:
Public Affairs and Communications Stakeholder Engagement Knowledge Strategy and Reporting Brand and Publishing Digital Design and Production.
Waste and Resource Recovery The Waste and Resource Recovery Branch protects the environment and human health from the inappropriate use of waste, promotes waste avoidance and facilitates greater resource recovery in NSW through:
development of policy and strategies advice on long-term infrastructure planning education and community engagement program design, delivery and evaluation regulation of licensed premises (landfills and recycling facilities) regulation of illegal dumping economic instruments (levies and Container Deposit Scheme) end-of-life waste regulation.
EPA Annual Report 2017–18
13
External factors affecting the EPA Our society’s environmental responses can be affected by broader, external issues at local, national and global levels. These issues can result in unexpected changes to patterns of growth and consumption. It is important for the EPA to be aware of these changes and how they may affect the environmental performance of households and businesses across NSW.
An example is population growth. The recent trend for population growth in NSW has been approximately 111,000 per year. By June 2017, there were 7.9 million people living in NSW, 61% of whom lived in Greater Sydney. Population growth can mean more waste and littering while economic uncertainty may affect the ability of businesses to comply with environmental regulations. Understanding these drivers helps the EPA work with business and the community to effectively navigate these changes.
Economic context Key economic factors affecting the EPA’s operations this year have been:
3.4% growth in the Australian economy (June 2017 to June 2018), linked to household consumer spending, business investment (particularly in non-residential construction), housing approvals, growth in the public sector and growth in exports economic growth in other major economies, which remains above expectations, as well as in our major trading partners core inflation, which remains low in the advanced economies, including Australia, although there has been a slight pick-up in recent months.
NSW and Victoria have continued to be the main drivers of Australian economic growth. This is because of a gradual strengthening in non-mining activity (including manufacturing, retail and wholesale trade and various services), depreciation of the Australian dollar since 2013 and low interest rates.
NSW gross state product (GSP) grew by 2.75% in 2016–17. This is forecast to grow by 3% (in real terms) in 2017–18, before stabilising at 2.75% for 2018–2020.
Implications for the EPA Both NSW and Victoria have disproportionate shares of business services activity. This reflects the status of Sydney and Melbourne as large financial centres. While business services tend to use less materials than primary and secondary industries, there may be related growth in activities such as investment in dwellings and offices.
Along with a growing population, an increase in per capita income has been a significant driver of economic growth in NSW. This is likely to lead to more spending on luxury items such as electronics. In turn, this will have an impact on both the amount and types of household waste generated.
Business investment and public infrastructure spending are expected to drive ongoing growth in construction. These major projects place a higher demand on the EPA’s ability to protect the community and the environment from associated impacts, such as noise, emissions and increased waste.
EPA Annual Report 2017–18
14
Section 2:
Our performance
EPA Annual Report 2017–18
15
Our achievements in 2017–18 align with the priorities set in the EPA Strategic Plan 2017–21 and are linked to the NSW Government’s goals and our key role of protecting human health and the environment.
The EPA is directly accountable for delivering the Premier’s Priority ‘Keeping our environment clean’. We also contribute to other state priorities such as ‘Improving government services’ and ‘Driving public sector diversity’.
The full suite of the EPA’s priorities also reflect the importance of our ongoing partnerships with government, business and the community to prevent and reduce negative environmental impacts.
Our priorities for 2017–18 have been to:
introduce an easy-to-use container deposit scheme reduce the volume of litter by 40% by 2020 minimise the impact of contamination and hazardous substances in our environment support innovative approaches to waste management reduce illegal dumping by 30% by 2020 enhance community confidence about environmental protection improve air quality across NSW improve water quality in the Greater Metropolitan Area maintain key native forest values, including threatened species habitat in State Forests contribute to planning for the future of NSW listen to our stakeholders.
Our work to address these priorities in 2017–18 is organised under six key result areas, each with corresponding outcomes, strategies and success measures:
1. Improved human health and environmental protection 2. Innovative waste management 3. Effective management of environmental incidents 4. Sound strategic and planning advice 5. Effective communication and stakeholder engagement 6. Exemplary and innovative organisation.
The following sections report on our performance in 2017–18 under each key result area.
This year we performed well against most of our success measures. Details are provided throughout this report.
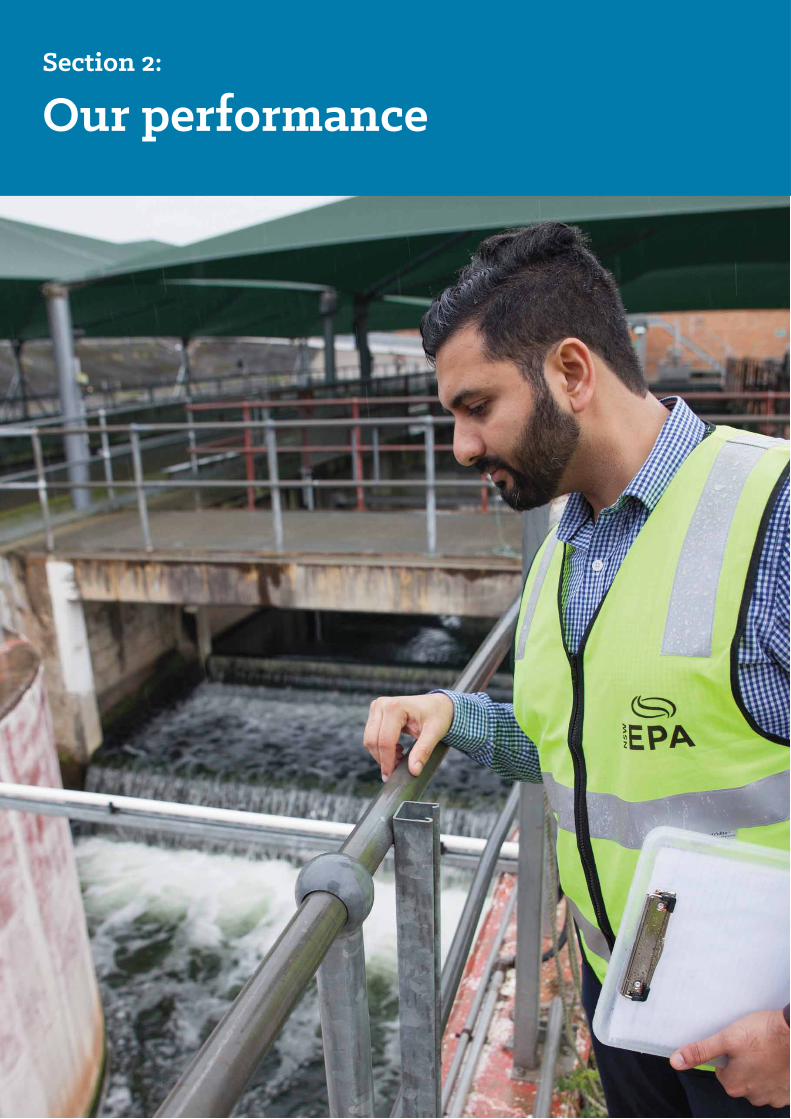
Keeping our rivers clean Correct sewage treatment helps ensure our rivers are healthy. On the previous page, an EPA officer is shown inspecting the sewage treatment process at a Sydney plant. Photo: Sarah Ryan/EPA
EPA Annual Report 2017–18
16
We protect the health of the community, now and for future generations, by protecting our air, waterways and land.
The EPA’s performance measures for this key result area are aligned to our regulatory role. Our regulatory activities impose strict environmental standards that prevent and minimise pollution.
In 2017–18, we maintained a strong focus on cleaning up contaminated land, leading forestry reforms, overseeing gas site rehabilitation and regulating poor environmental performers through risk-based licensing. We continued our engagement with councils and communities on issues, such as wood smoke pollution and water quality, and developed guidelines for the use of drones, which are an important tool that can enhance our understanding of environmental incidents.
The EPA is leading an investigation program to assess the legacy of PFAS (per- and poly-fluorinated alkyl substances) use across NSW, particularly at sites where it has been historically used in firefighting foams for training purposes. With the assistance of the NSW PFAS Taskforce, which includes NSW Health, Department of Primary Industries and the Office of Environment and Heritage, the EPA provides impacted residents with tailored, precautionary dietary advice to help them reduce exposure to PFAS.
Our regulatory activities also resulted in licensees complying with 99.4% of environment protection licence conditions. This result exceeds our 99% target and is consistent with high rates of compliance over the past six years.
When environmental offences pose significant potential or actual threats to human health and the environment, we prosecute the offenders. This year our legal team achieved a 98% success rate for prosecutions (excluding those for littering). See Section 3: Legal enforcement for more information.
Land
Managing contaminated land Land can become contaminated by substances such as chemicals, pesticides, heavy metals and petroleum, as a result of poor handling, storage or disposal practices. The EPA is
Key Result Area 1:
IImproved human health and environmental protection
EPA Annual Report 2017–18
17
responsible for regulating land that is significantly contaminated and poses a risk to human health or the environment. Sites that do not currently pose a risk are managed by local councils through the planning process.
The EPA investigates the reports of land contamination it receives and can order those responsible for the contamination to undertake further investigation and remediation. We aim to assess and prioritise 95% of contaminated sites within four months of being formally notified of the contamination, providing sufficient information is available.
Results
Backlog program Amendments to strengthen the Contaminated Land Management Act 1997 (CLM Act) in 2008 resulted in a significant increase in the number of notifications, most of which related to petroleum contamination at service stations.
The EPA prioritised assessment of the higher risk sites and in 2014 established a program to accelerate assessment of the remaining lower risk sites to ensure they were being appropriately managed. Clearing this backlog has been a priority for the NSW Government.
Assessment of all 834 backlog sites was completed by 31 December 2017. Of these, 19 required regulatory action, such as orders to clean up and manage the site. Contamination at the remaining sites was assessed as not significant enough to warrant regulation by the EPA.
New notifications and assessments In 2017–18:
100% of 39 new notifications were prioritised and assessed within four months 495 site assessments were finalised nine new sites were declared to be significantly contaminated, requiring management under the CLM Act regulation of six sites ended, as the EPA’s involvement with their remediation was complete.
Cost recovery In 2017–18, the EPA issued invoices totalling $121,706 to recover costs associated with orders and approved voluntary management proposals issued under Part 3 of the CLM Act.
Challenges Obtaining information required for a site assessment in a timely manner is an ongoing challenge. This is being addressed by:
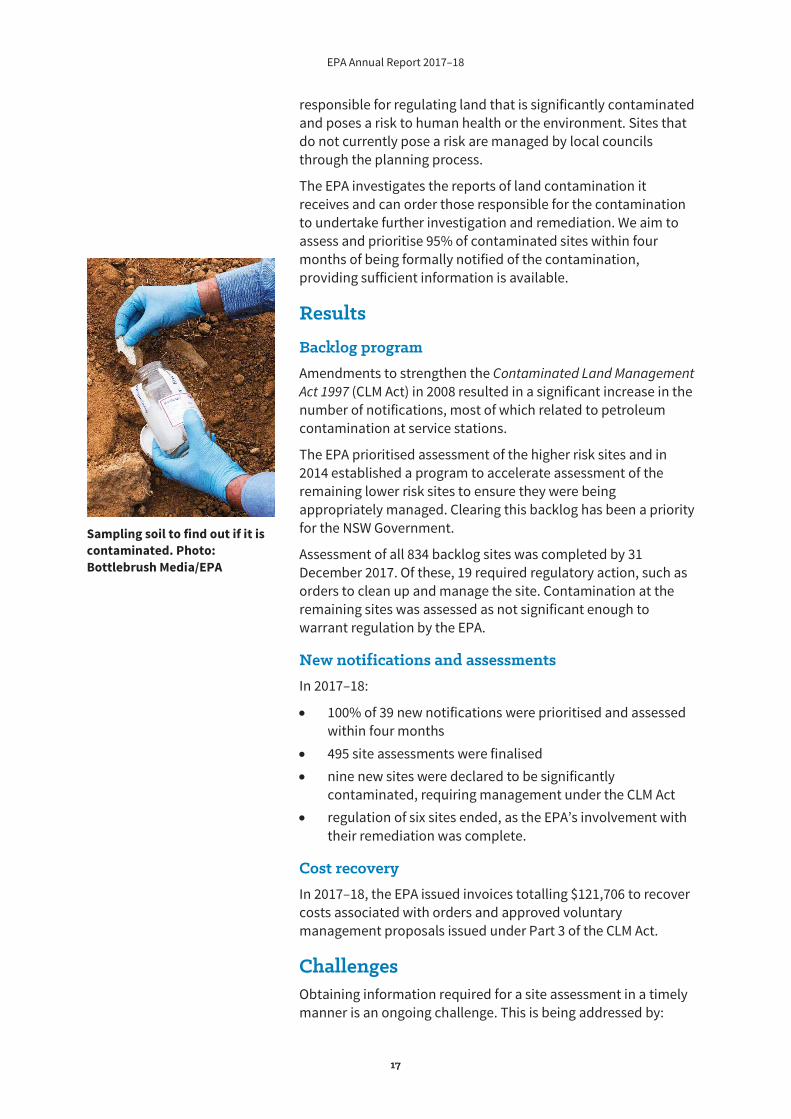
Sampling soil to find out if it is contaminated. Photo: Bottlebrush Media/EPA
EPA Annual Report 2017–18
18
updating the notification form to require more information requiring consultants to comply with the EPA’s Contaminated Land Consultant Certification Policy which, among other things, sets out which professional certification schemes the EPA recognises our Site Auditor Scheme, which accredits highly experienced contaminated land consultants who can be engaged to independently review the work of their peers in the industry.
Looking ahead The EPA is reviewing business practices to further improve site assessment and speed up regulatory processes as well as reviewing the CLM Act to strengthen it and improve efficiency. We are also undertaking preventaive programs and a Council Regional Capacity Building Program, which funds groups of regional councils to employ a specialist contaminated land officer.
Hazardous substances
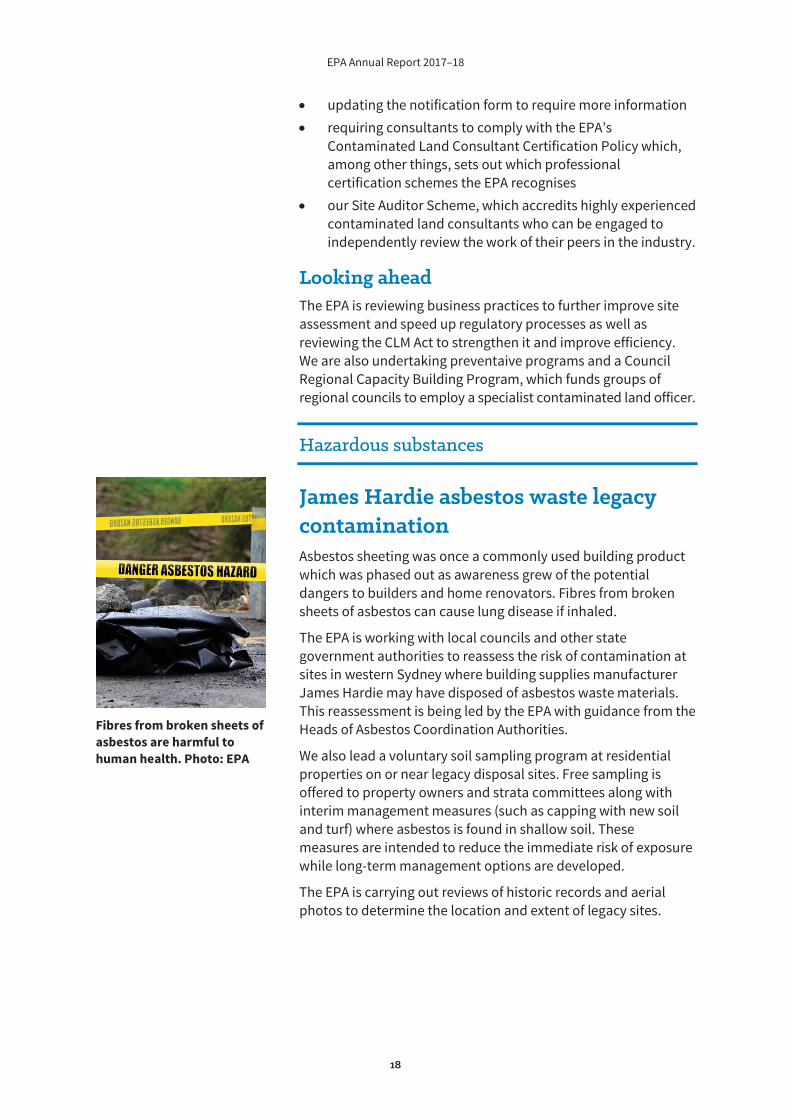
James Hardie asbestos waste legacy contamination Asbestos sheeting was once a commonly used building product which was phased out as awareness grew of the potential dangers to builders and home renovators. Fibres from broken sheets of asbestos can cause lung disease if inhaled.
The EPA is working with local councils and other state government authorities to reassess the risk of contamination at sites in western Sydney where building supplies manufacturer James Hardie may have disposed of asbestos waste materials. This reassessment is being led by the EPA with guidance from the Heads of Asbestos Coordination Authorities.
We also lead a voluntary soil sampling program at residential properties on or near legacy disposal sites. Free sampling is offered to property owners and strata committees along with interim management measures (such as capping with new soil and turf) where asbestos is found in shallow soil. These measures are intended to reduce the immediate risk of exposure while long-term management options are developed.
The EPA is carrying out reviews of historic records and aerial photos to determine the location and extent of legacy sites.
Fibres from broken sheets of asbestos are harmful to human health. Photo: EPA
EPA Annual Report 2017–18
19
Results In 2017–18:
Sampling was offered to 63 owners and strata committees at affected properties. Thirty owners agreed to sampling, which was completed at all properties. Interim management measures were offered for 16 properties and works completed at 13 of these. Soil sampling and interim management measures will be completed at all properties where consent has been granted by the end of 2018.
Parramatta City Council has also been sampling and implementing a management program for potential legacy sites in areas of public land within the local government area.
Challenges Maintaining good communications with affected residents and property owners has been challenging. The EPA is committed to ensuring community concerns about asbestos contamination are addressed. Ongoing community engagement on this issue has been a high priority and is critical to gaining property owners’ understanding and participation in the sampling program.
Activities have included letterbox drops, door-knocking, community meetings and one-on-one meetings with residents and property owners as part of the soil sampling program. While the community response has been mixed, some residents have provided positive feedback on the outcomes.
Looking ahead The reassessment program is ongoing. This work will inform a report on James Hardie disposal sites which will support the development of a long-term management strategy for these sites.
Managing exposure to hazardous substances Many substances in daily use, such as pesticides, industrial chemicals, hazardous waste, dangerous goods and radioactive materials, pose particular risks to human health and the environment. These substances must be carefully managed.
Hazardous substances play an important role in the NSW economy by increasing food production (pesticides applied to crops), delivering health benefits (radioactive scans and medicines), enabling mobility (dangerous goods – petrol fuels) and as components in a wide range of products (chemicals in
The EPA is committed to ensuring community concerns about asbestos contamination are addressed
EPA Annual Report 2017–18
20
batteries and household cleaners). As such, they are subject to regulatory control frameworks in NSW and across most Australian jurisdictions.
In NSW, hazardous substances regulation is categorised into dangerous goods, pesticides, industrial chemicals, hazardous waste and radiation management. Regulation covers import, export, manufacture, registration, storage, transport and use of these substances and rigorous controls on their end-of-use treatment or disposal, including waste tracking. The level and focus of regulating these substances depends on the hazards posed.
The EPA is improving hazardous substances management by:
working with industry, especially those with a history of non-compliance, to encourage better understanding and management of risks, improved compliance and reduced waste generation ensuring a robust regulatory framework with efficient and valuable outcomes that meet people’s needs working with the Commonwealth, other states and territories in harmonising regulatory approaches, data collection and data sharing.
Results Our Hazardous Materials, Chemicals and Radiation team works across a wide range of industries and issues. Achievements in 2017–18 included:
development of the Dangerous Goods Tank Vehicle Inspection Manual to help industry understand regulatory requirements and ensure proper maintenance of tank vehicles 17 inspections at mine sites to make sure their sealed radiation sources were stored and managed correctly with all mines found to have appropriate record keeping. Those who did not have warning signs near the radiation sources have since installed them following direction from the EPA improvements to the online radiation management licensing system which are expected to increase compliance by streamlining the requirements for 18,500 radiation licensees to update their information and seek accurate information about licence requirements inspections at 60 sites across NSW where quarantine fumigation is done with methyl bromide fumigant pesticide gas to identify fumigation practices and risks to human health and the environment – information from the inspections will improve our pesticide education programs and strengthen our regulatory approach.
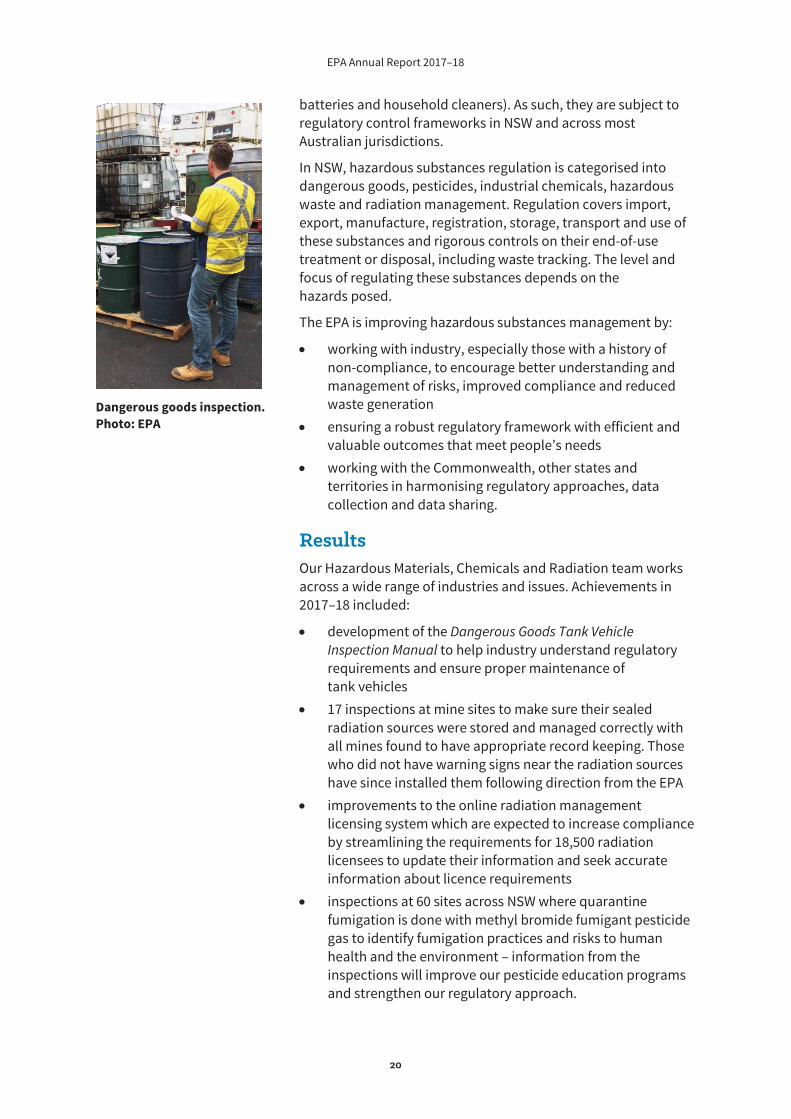
Dangerous goods inspection. Photo: EPA
EPA Annual Report 2017–18
21
Minimising the risks from hazardous waste Hazardous waste includes wastes from clinical procedures, the production of resins and glues and surface treatment of metals and plastics, residues from industrial disposal, waste oil and water, and wastes with compounds containing zinc, copper, cadmium, mercury, lead, asbestos and the like.
These wastes can pose substantial or potential harm to the environment and human health due to their explosive, reactive, flammable, persistent, toxic or corrosive properties. The EPA regulates the management of hazardous waste to minimise risks from its storage, transport, treatment and disposal.
Results Key tools for the regulation of hazardous substances are inspections and compliance campaigns that target facilities and associated transport. This year the EPA inspected about 30% of the state’s licensed hazardous waste storage and processing facilities. These inspections found a range of non-compliances with licence conditions at most sites, particularly relating to stormwater management, bunding, chemical storage and general housekeeping.
Most facilities had failed to: o carry out chemical storage, handling or spill
management in a competent manner o store all hazardous waste within an appropriate
storage system. Approximately half had failed to respond to chemical spills in a competent manner by cleaning up spills immediately and having spill kits readily available. Approximately a third had failed to: o prevent hazardous materials being tracked across
paved areas or driveways o maintain stormwater management controls o adequately manage air pollution from the storage of
hazardous materials.
We have addressed these non-compliances and will undertake follow-up inspections to ensure ongoing compliance. Repeat non-compliances may result in further regulatory action.
Looking ahead The lessons from our compliance program will inform future regulatory strategies to ensure inspection and enforcement efforts effectively target high-risk facilities.
This year the EPA inspected about 30% of the state’s licensed hazardous waste storage and processing facilities
EPA Annual Report 2017–18
22
Forestry
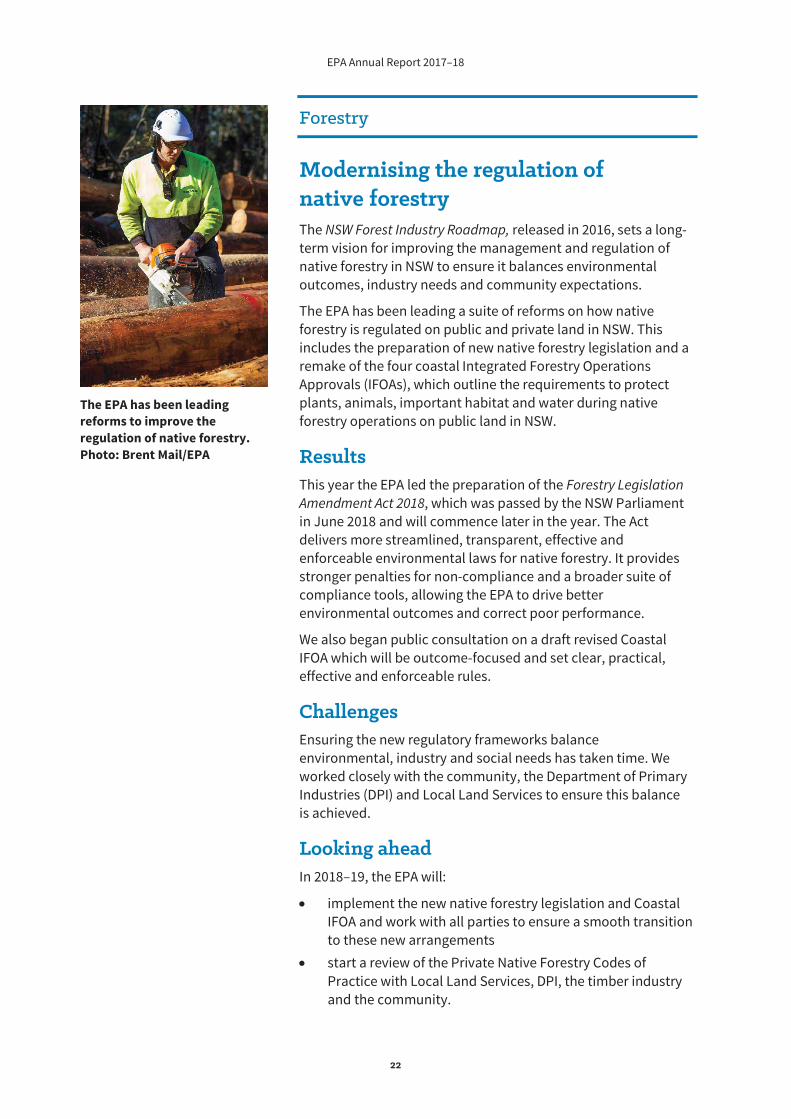
Modernising the regulation of native forestry The NSW Forest Industry Roadmap, released in 2016, sets a long-term vision for improving the management and regulation of native forestry in NSW to ensure it balances environmental outcomes, industry needs and community expectations.
The EPA has been leading a suite of reforms on how native forestry is regulated on public and private land in NSW. This includes the preparation of new native forestry legislation and a remake of the four coastal Integrated Forestry Operations Approvals (IFOAs), which outline the requirements to protect plants, animals, important habitat and water during native forestry operations on public land in NSW.
Results This year the EPA led the preparation of the Forestry Legislation Amendment Act 2018, which was passed by the NSW Parliament in June 2018 and will commence later in the year. The Act delivers more streamlined, transparent, effective and enforceable environmental laws for native forestry. It provides stronger penalties for non-compliance and a broader suite of compliance tools, allowing the EPA to drive better environmental outcomes and correct poor performance.
We also began public consultation on a draft revised Coastal IFOA which will be outcome-focused and set clear, practical, effective and enforceable rules.
Challenges Ensuring the new regulatory frameworks balance environmental, industry and social needs has taken time. We worked closely with the community, the Department of Primary Industries (DPI) and Local Land Services to ensure this balance is achieved.
Looking ahead In 2018–19, the EPA will:
implement the new native forestry legislation and Coastal IFOA and work with all parties to ensure a smooth transition to these new arrangements start a review of the Private Native Forestry Codes of Practice with Local Land Services, DPI, the timber industry and the community.
The EPA has been leading reforms to improve the regulation of native forestry. Photo: Brent Mail/EPA
EPA Annual Report 2017–18
23
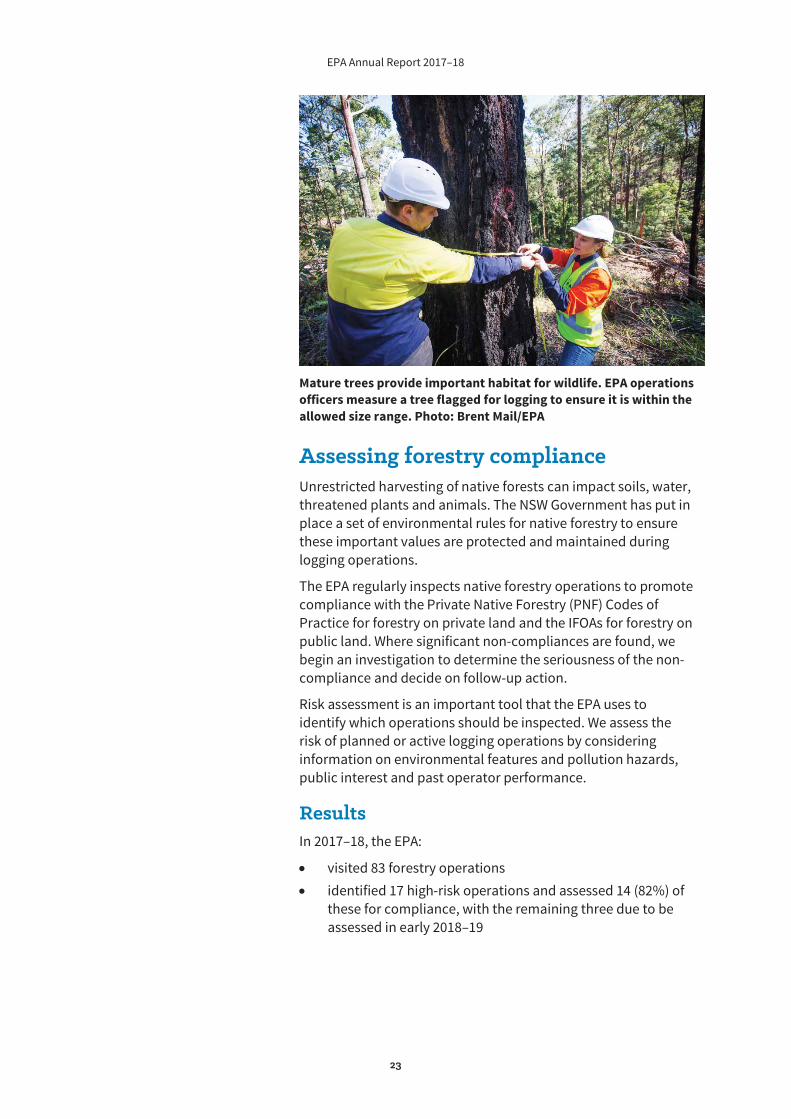
Mature trees provide important habitat for wildlife. EPA operations officers measure a tree flagged for logging to ensure it is within the allowed size range. Photo: Brent Mail/EPA
Assessing forestry compliance Unrestricted harvesting of native forests can impact soils, water, threatened plants and animals. The NSW Government has put in place a set of environmental rules for native forestry to ensure these important values are protected and maintained during logging operations.
The EPA regularly inspects native forestry operations to promote compliance with the Private Native Forestry (PNF) Codes of Practice for forestry on private land and the IFOAs for forestry on public land. Where significant non-compliances are found, we begin an investigation to determine the seriousness of the non-compliance and decide on follow-up action.
Risk assessment is an important tool that the EPA uses to identify which operations should be inspected. We assess the risk of planned or active logging operations by considering information on environmental features and pollution hazards, public interest and past operator performance.
Results In 2017–18, the EPA:
visited 83 forestry operations identified 17 high-risk operations and assessed 14 (82%) of these for compliance, with the remaining three due to be assessed in early 2018–19
EPA Annual Report 2017–18
24
issued 43 advisory letters, 18 formal warnings, 15 show causes, one clean-up notice, 11 corrective action requests, 17 official cautions, one stop work order and 12 penalty notices and terminated two PNF approvals.
While a lack of compliance was found at a high proportion of these operations, most did not constitute serious non-compliance or cause serious environmental harm. The most common non-compliances were poor selection and protection of important habitat trees and inadequate management of roads and stream crossings.
The EPA prosecuted Forestry Corporation of NSW (FCNSW) for not thoroughly searching and marking rocky outcrop exclusion zones at Glenbog State Forest in the Eden region during forestry activities in 2013. Large rocky outcrops are protected in State Forests because they provide habitat and refuge areas for some threatened plants and animals. FCNSW was convicted in October 2017 and fined $8000 in the NSW Land and Environment Court. FCNSW successfully defended a second charge relating to forestry operations near a rock feature, while a third charge was withdrawn.
Challenges The need to focus on forestry reform over the past year has impacted our capacity to meet our target of assessing the compliance of 95% of high-risk native forestry operations.
Looking ahead In 2018–19, the EPA will begin implementing changes to forestry regulation brought about by the Forestry Legislation Amendment Act 2018 and the new Coastal IFOA. This will include reassessing our regulatory program to ensure it works effectively under the new regulatory framework and put us on track to meet our compliance target in 2018–19.
Coal seam gas
Keeping gas site rehabilitation on track One of our key responsibilities as lead regulator for coal seam gas in NSW is to assess compliance with rehabilitation requirements for coal seam gas sites, including 20 titles the NSW Government bought back from title-holders. Rehabilitation for nine of these titles was confirmed by the Division of Resources and Energy before the EPA took on this role in July 2015.

EPA Annual Report 2017–18
25
EPA operations officers inspect the rehabilitation of a former coal seam gas well site. Photo: James Pridgeon/EPA
By 30 June 2018, we had conducted 213 rehabilitation inspections on the remaining sites. Once we are satisfied that rehabilitation has been carried out on a title, the Division of Resources and Geoscience conducts the final stage of the rehabilitation process and decides whether security bonds should be returned to the former title holder.
Results 95% of gas titles bought back by the Government under the NSW Gas Plan have been rehabilitated and their compliance confirmed.
Looking ahead One remaining title is partially rehabilitated. We are awaiting confirmation that rehabilitation is complete before coordinating site inspections to verify compliance.
Air
Raising awareness about wood smoke Wood heaters can be a major source of fine particle pollution, especially if they are inefficient or poorly maintained. There are significant adverse health impacts associated with exposure to fine particles, including cardiovascular and respiratory problems.
Social research indicates that the public are still largely unaware of the harmful impacts of wood smoke. To address this lack of awareness, the EPA developed a suite of educational materials that includes animations, radio ads, print and social media resources. The package was trialled in the Upper Hunter in winter 2017 and received positive feedback from residents.
Wood heaters can be a major source of fine particle pollution, which can have significant adverse health impacts
EPA Annual Report 2017–18
26
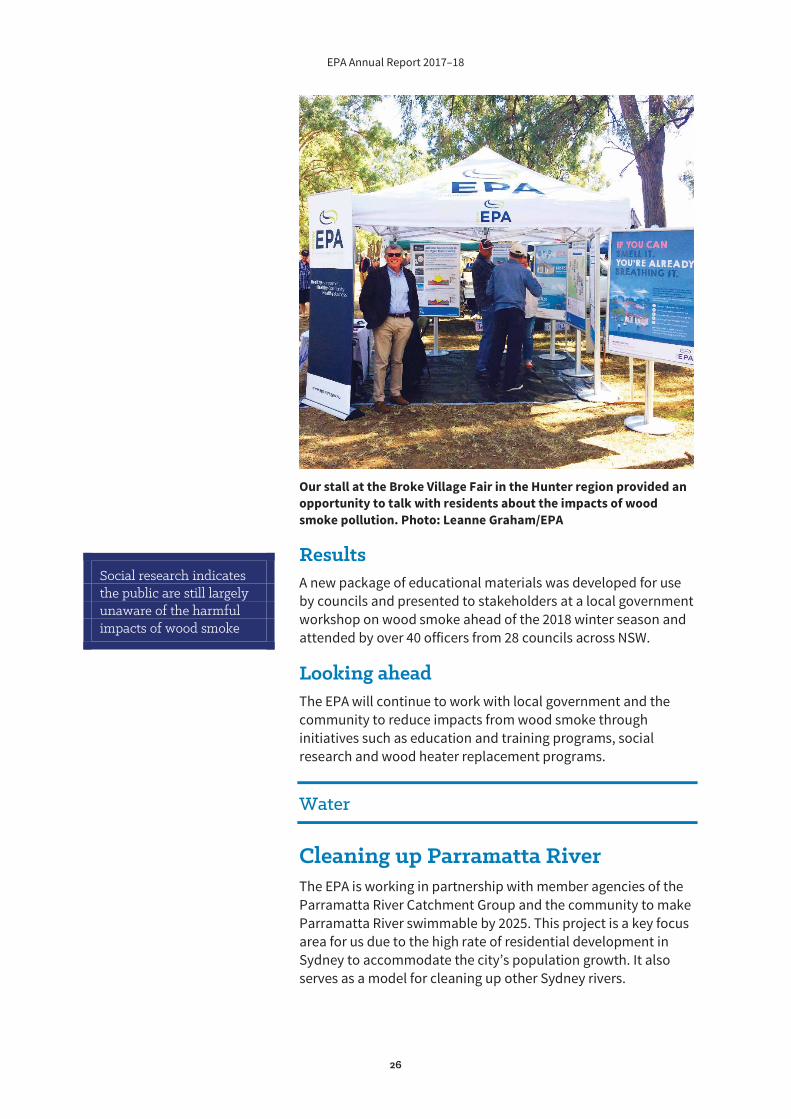
Our stall at the Broke Village Fair in the Hunter region provided an opportunity to talk with residents about the impacts of wood smoke pollution. Photo: Leanne Graham/EPA
Results A new package of educational materials was developed for use by councils and presented to stakeholders at a local government workshop on wood smoke ahead of the 2018 winter season and attended by over 40 officers from 28 councils across NSW.
Looking ahead The EPA will continue to work with local government and the community to reduce impacts from wood smoke through initiatives such as education and training programs, social research and wood heater replacement programs.
Water
Cleaning up Parramatta River The EPA is working in partnership with member agencies of the Parramatta River Catchment Group and the community to make Parramatta River swimmable by 2025. This project is a key focus area for us due to the high rate of residential development in Sydney to accommodate the city’s population growth. It also serves as a model for cleaning up other Sydney rivers.
Social research indicates the public are still largely unaware of the harmful impacts of wood smoke
EPA Annual Report 2017–18
27
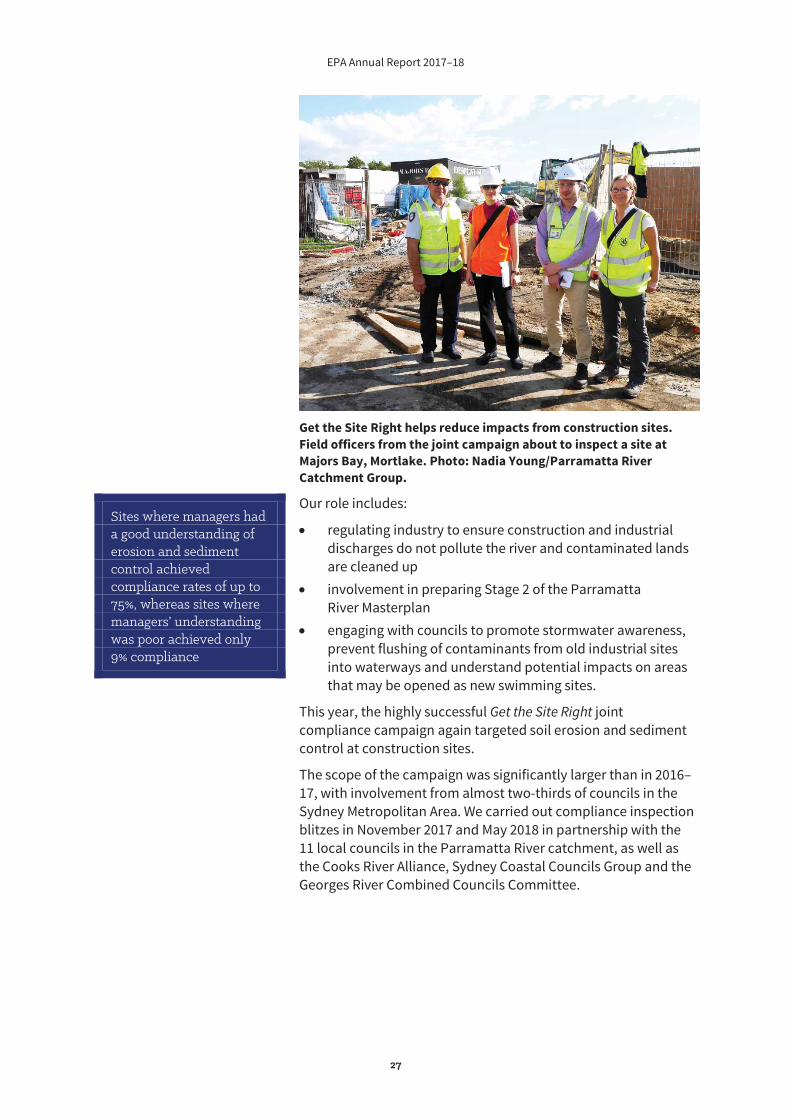
Get the Site Right helps reduce impacts from construction sites. Field officers from the joint campaign about to inspect a site at Majors Bay, Mortlake. Photo: Nadia Young/Parramatta River Catchment Group.
Our role includes:
regulating industry to ensure construction and industrial discharges do not pollute the river and contaminated lands are cleaned up involvement in preparing Stage 2 of the Parramatta River Masterplan engaging with councils to promote stormwater awareness, prevent flushing of contaminants from old industrial sites into waterways and understand potential impacts on areas that may be opened as new swimming sites.
This year, the highly successful Get the Site Right joint compliance campaign again targeted soil erosion and sediment control at construction sites.
The scope of the campaign was significantly larger than in 2016–17, with involvement from almost two-thirds of councils in the Sydney Metropolitan Area. We carried out compliance inspection blitzes in November 2017 and May 2018 in partnership with the 11 local councils in the Parramatta River catchment, as well as the Cooks River Alliance, Sydney Coastal Councils Group and the Georges River Combined Councils Committee.
Sites where managers had a good understanding of erosion and sediment control achieved compliance rates of up to 75%, whereas sites where managers’ understanding was poor achieved only 9% compliance

EPA Annual Report 2017–18
28
Results In 2017–18, as a result of Get the Site Right:
1,310 sites were inspected, of which 1,122 were in the Parramatta River catchment – more than double the inspections in 2016–17 councils issued over $400,000 in fines, as well as improvement notices and education materials to help improve compliance in future council officers’ participation and awareness has increased the campaign was recognised with a Highly Commended award at the 2018 Stormwater NSW Awards.
Monitoring indicated that sites with managers who had a good understanding of erosion and sediment control achieved compliance rates of up to 75%. However, sites where managers’ understanding was poor recorded only 9% compliance. These results show that focusing on education campaigns for site managers will provide the most benefits in terms of positive behaviour change and an improvement in river water quality.
Challenges Achieving the mission of making Parramatta River swimmable requires the sustained involvement of multiple stakeholders. To maintain commitment and ensure the blitzes are well coordinated, we have a dedicated staff member (our River Champion) who is the central point of contact for all stakeholders working with the EPA. This person also chairs the Parramatta River Catchment Group regulatory subcommittee, which provides leadership in directing regulatory efforts in the catchment.
Looking ahead In 2018–19, the EPA will continue to:
work with all partners to implement the Parramatta River Masterplan recommendations, including the goal of opening three new swimming sites work with Sydney Water to ensure works addressing sewage overflows target the right catchments participate in educational and promotional initiatives, including an international River Symposium in Sydney support and encourage councils to continue Get the Site Right activities to remind developers of their obligations to install and maintain sediment and erosion controls.
We will also shift the focus of joint compliance campaigns to chemical storage on industrial sites that drain into the river to ensure harmful chemicals do not adversely affect water quality.
EPA Annual Report 2017–18
29
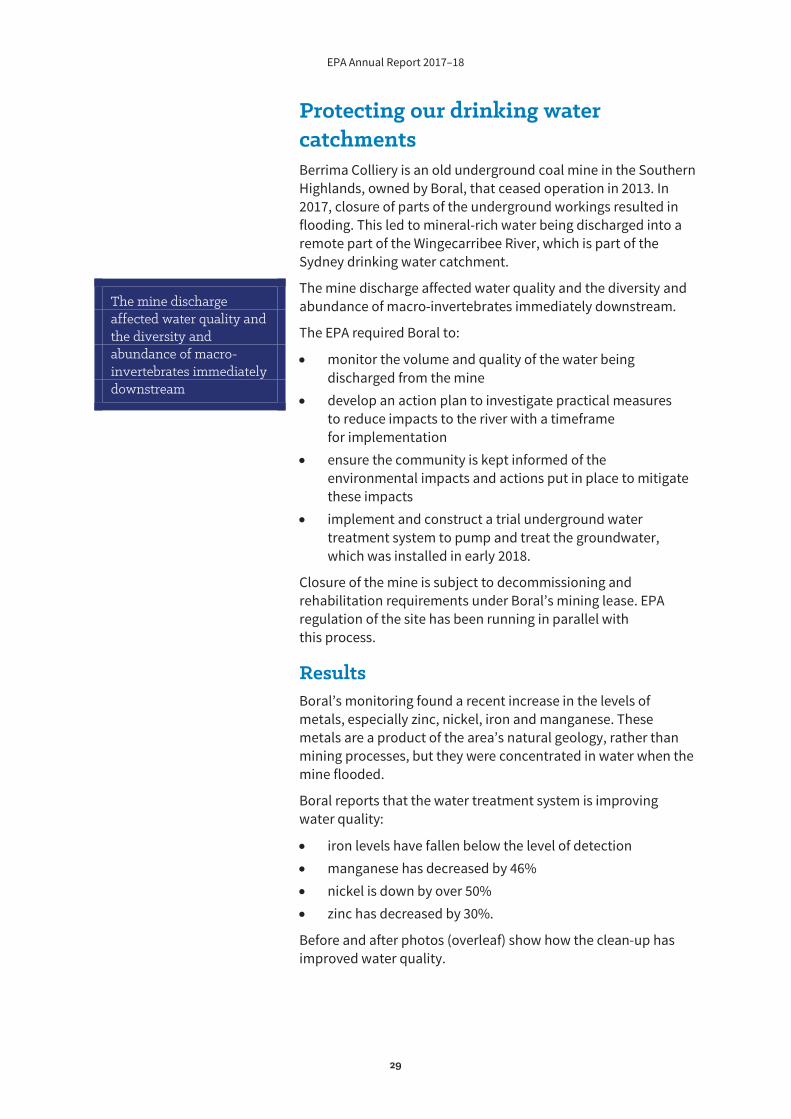
Protecting our drinking water catchments Berrima Colliery is an old underground coal mine in the Southern Highlands, owned by Boral, that ceased operation in 2013. In 2017, closure of parts of the underground workings resulted in flooding. This led to mineral-rich water being discharged into a remote part of the Wingecarribee River, which is part of the Sydney drinking water catchment.
The mine discharge affected water quality and the diversity and abundance of macro-invertebrates immediately downstream.
The EPA required Boral to:
monitor the volume and quality of the water being discharged from the mine develop an action plan to investigate practical measures to reduce impacts to the river with a timeframe for implementation ensure the community is kept informed of the environmental impacts and actions put in place to mitigate these impacts implement and construct a trial underground water treatment system to pump and treat the groundwater, which was installed in early 2018.
Closure of the mine is subject to decommissioning and rehabilitation requirements under Boral’s mining lease. EPA regulation of the site has been running in parallel with this process.
Results Boral’s monitoring found a recent increase in the levels of metals, especially zinc, nickel, iron and manganese. These metals are a product of the area’s natural geology, rather than mining processes, but they were concentrated in water when the mine flooded.
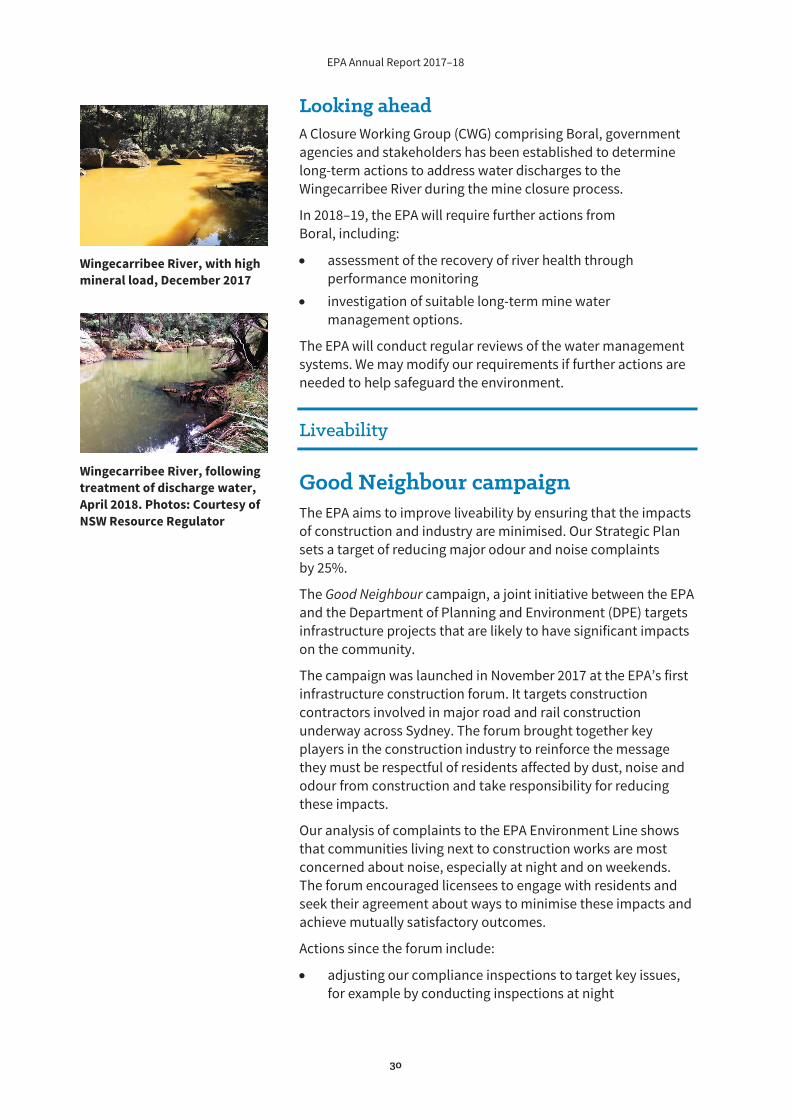
Boral reports that the water treatment system is improving water quality:
iron levels have fallen below the level of detection manganese has decreased by 46% nickel is down by over 50% zinc has decreased by 30%.
Before and after photos (overleaf) show how the clean-up has improved water quality.
The mine discharge affected water quality and the diversity and abundance of macro-invertebrates immediately downstream
EPA Annual Report 2017–18
30
Looking ahead A Closure Working Group (CWG) comprising Boral, government agencies and stakeholders has been established to determine long-term actions to address water discharges to the Wingecarribee River during the mine closure process.
In 2018–19, the EPA will require further actions from Boral, including:
assessment of the recovery of river health through performance monitoring investigation of suitable long-term mine water management options.
The EPA will conduct regular reviews of the water management systems. We may modify our requirements if further actions are needed to help safeguard the environment.
Liveability
Good Neighbour campaign The EPA aims to improve liveability by ensuring that the impacts of construction and industry are minimised. Our Strategic Plan sets a target of reducing major odour and noise complaints by 25%.
The Good Neighbour campaign, a joint initiative between the EPA and the Department of Planning and Environment (DPE) targets infrastructure projects that are likely to have significant impacts on the community.
The campaign was launched in November 2017 at the EPA’s first infrastructure construction forum. It targets construction contractors involved in major road and rail construction underway across Sydney. The forum brought together key players in the construction industry to reinforce the message they must be respectful of residents affected by dust, noise and odour from construction and take responsibility for reducing these impacts.
Our analysis of complaints to the EPA Environment Line shows that communities living next to construction works are most concerned about noise, especially at night and on weekends. The forum encouraged licensees to engage with residents and seek their agreement about ways to minimise these impacts and achieve mutually satisfactory outcomes.
Actions since the forum include:
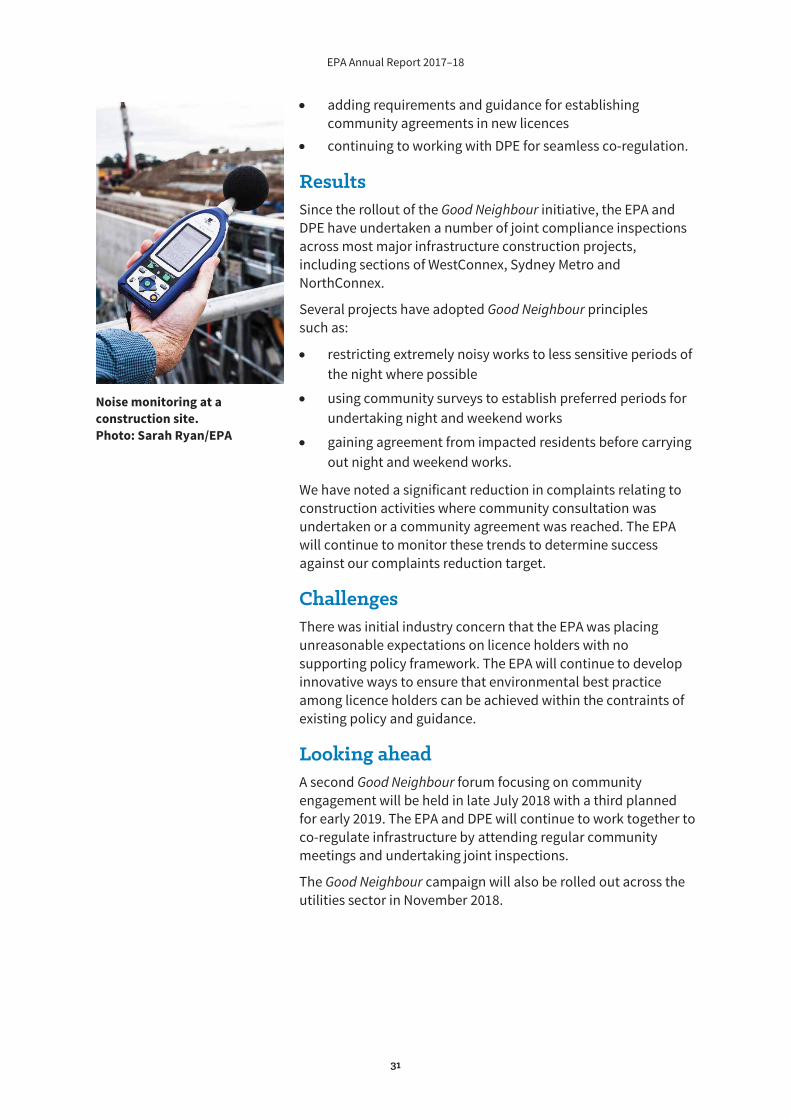
adjusting our compliance inspections to target key issues, for example by conducting inspections at night
Wingecarribee River, with high mineral load, December 2017
Wingecarribee River, following treatment of discharge water, April 2018. Photos: Courtesy of NSW Resource Regulator
EPA Annual Report 2017–18
31
adding requirements and guidance for establishing community agreements in new licences continuing to working with DPE for seamless co-regulation.
Results Since the rollout of the Good Neighbour initiative, the EPA and DPE have undertaken a number of joint compliance inspections across most major infrastructure construction projects, including sections of WestConnex, Sydney Metro and NorthConnex.
Several projects have adopted Good Neighbour principles such as:
restricting extremely noisy works to less sensitive periods of the night where possible
using community surveys to establish preferred periods for undertaking night and weekend works
gaining agreement from impacted residents before carrying out night and weekend works.
We have noted a significant reduction in complaints relating to construction activities where community consultation was undertaken or a community agreement was reached. The EPA will continue to monitor these trends to determine success against our complaints reduction target.
Challenges There was initial industry concern that the EPA was placing unreasonable expectations on licence holders with no supporting policy framework. The EPA will continue to develop innovative ways to ensure that environmental best practice among licence holders can be achieved within the contraints of existing policy and guidance.
Looking ahead A second Good Neighbour forum focusing on community engagement will be held in late July 2018 with a third planned for early 2019. The EPA and DPE will continue to work together to co-regulate infrastructure by attending regular community meetings and undertaking joint inspections.
The Good Neighbour campaign will also be rolled out across the utilities sector in November 2018.
Noise monitoring at a construction site. Photo: Sarah Ryan/EPA
EPA Annual Report 2017–18
32
Regulation
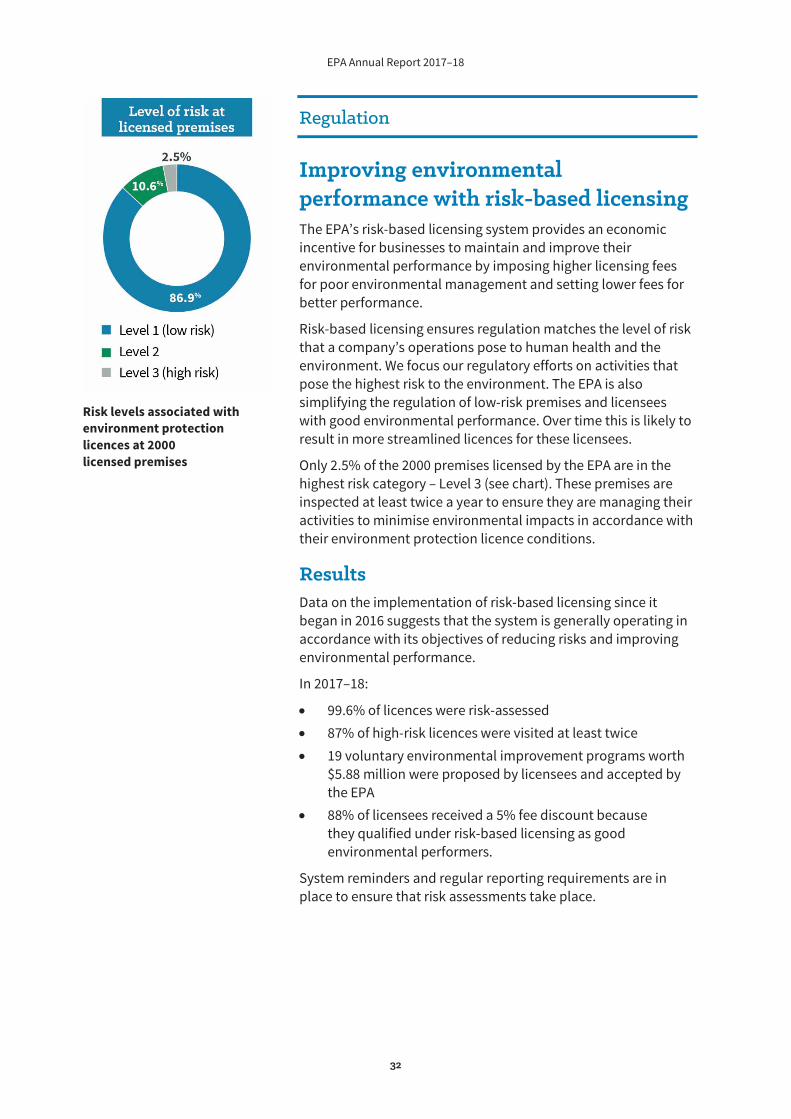
Improving environmental performance with risk-based licensing The EPA’s risk-based licensing system provides an economic incentive for businesses to maintain and improve their environmental performance by imposing higher licensing fees for poor environmental management and setting lower fees for better performance.
Risk-based licensing ensures regulation matches the level of risk that a company’s operations pose to human health and the environment. We focus our regulatory efforts on activities that pose the highest risk to the environment. The EPA is also simplifying the regulation of low-risk premises and licensees with good environmental performance. Over time this is likely to result in more streamlined licences for these licensees.
Only 2.5% of the 2000 premises licensed by the EPA are in the highest risk category – Level 3 (see chart). These premises are inspected at least twice a year to ensure they are managing their activities to minimise environmental impacts in accordance with their environment protection licence conditions.
Results Data on the implementation of risk-based licensing since it began in 2016 suggests that the system is generally operating in accordance with its objectives of reducing risks and improving environmental performance.
In 2017–18:
99.6% of licences were risk-assessed 87% of high-risk licences were visited at least twice 19 voluntary environmental improvement programs worth $5.88 million were proposed by licensees and accepted by the EPA 88% of licensees received a 5% fee discount because they qualified under risk-based licensing as good environmental performers.
System reminders and regular reporting requirements are in place to ensure that risk assessments take place.
Risk levels associated with environment protection licences at 2000 licensed premises
EPA Annual Report 2017–18
33
Looking ahead In March 2018, we started the first stage of a review of risk-based licensing. This will help assess whether the system can be refined, including the supporting guidance and procedures. External stakeholders will have opportunities to provide input to the review.
Our eyes in the sky Unmanned aircraft, also known as ‘drones’, are a valuable tool that support the EPA’s role as a modern environmental regulator. Drones enable us to collect a diverse range of information that helps us manage environmental incidents and make regulatory decisions, often more quickly, cost-effectively, safely and accurately than using land-based methods.
When appropriate, the EPA uses drones to:
take photos and videos collect samples map areas and verify boundaries undertake quantitative surveying.
We engage licensed operators to pilot the drones under the supervision of our authorised officers. This approach makes it possible for the EPA to access the latest equipment and applications in this rapidly evolving technology.
Results This year the EPA used drones in a range of situations including:
investigating spills of substances into water identifying illegal dumping hotspots determining the distances between pollution incidents and sensitive environments that may be affected by a spill in a remote location monitoring the size of stockpiles in waste facilities.
Drones were also used in quantitative surveying following the devastating Tathra bushfires, in collaboration with Bega Valley Shire Council and Fire and Rescue NSW. The information collected determined how much waste from the fire needed to be accommodated at the local landfill.
EPA Annual Report 2017–18
34
We also developed guidelines for the use of drones, which outline how EPA officers will ensure they are used safely, within the law and with consideration for people’s privacy. The guidelines included consideration of feedback from interagency and public consultation.
Challenges The guidelines seek to strike an appropriate balance between safety, efficiency and privacy for the EPA’s use of unmanned aircraft. Additional operational challenges for our use of unmanned aircraft include:
operating them under difficult weather conditions in cases of major incidents, a need to liaise with multiple agencies beforehand to ensure: o the safe use of airspace o the safety of those involved in managing the incident o actions on the ground are not compromised.
Looking ahead The EPA plans to increase the use of drones when undertaking its regulatory functions, taking advantage of the rapidly evolving range of applications available. We will continue to update our guidance and procedures as our experience with drones increases.
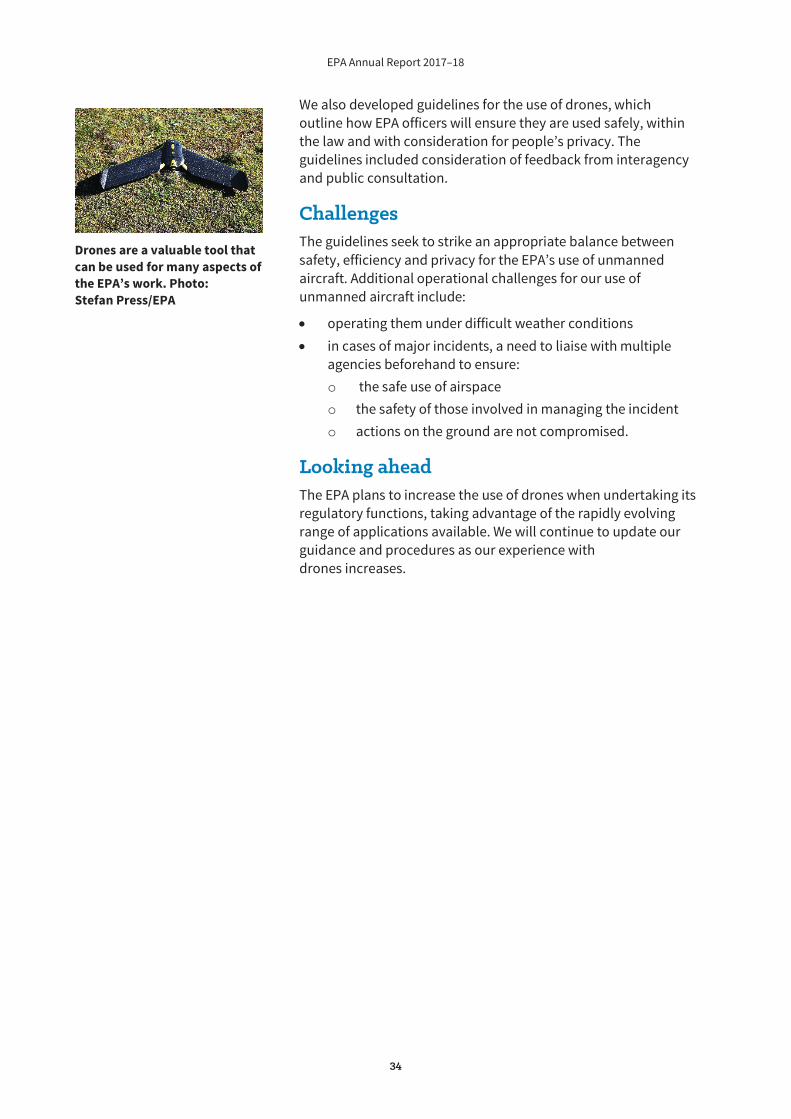
Drones are a valuable tool that can be used for many aspects of the EPA’s work. Photo: Stefan Press/EPA
EPA Annual Report 2017–18
35
Household and building waste can have significant impacts on human health and the environment if not managed well. Waste is also a potential resource. Recycling and re-using can help reduce the environmental impacts of extracting new resources.
The EPA partners with communities, businesses and local government to deliver programs that help the people of NSW reduce their waste, increase recycling and improve littering and waste disposal behaviour.
Our work is guided by the NSW Waste Avoidance and Resource Recovery Strategy 2014–21, which provides a framework for waste management and sets targets and strategies for addressing waste issues.
We regulate the collection, storage, transport and disposal of waste to protect human health and the environment and improve the liveability of our communities.
We also develop policies and contribute to legislative changes that help improve waste management.
This year:
our grants programs and sponsorships provided $24.5 million for a wide range of waste management, infrastructure and educational activities
we responded quickly and effectively to the challenges posed by China’s National Sword Policy, which limits the level of contamination in the waste material that China will accept for recycling
the container deposit scheme Return and Earn collected 452 million eligible drink containers, a reduction of 33% in this type of litter
we held repeat illegal dumping offender Mr Dib Hanna to account, with the court imposing a three-year prison sentence.
Key Result Area 2:
IInnovative waste management
EPA Annual Report 2017–18
36
Tackling illegal dumping
On track to reduce illegal dumping Illegal dumping is a serious environmental crime which has many adverse effects on the community and the environment. It also has negative impacts on the waste industry. The EPA plays a key role in combating this crime and we are committed to achieving the NSW Government’s goal of reducing illegal dumping by 30% by 2020.
Results
Strategy The NSW Illegal Dumping Strategy 2017–21 was finalised in early February 2018 following public consultation. The EPA played a key role in developing the strategy and is responsible for its implementation in partnership with stakeholders.
The strategy puts NSW on track to achieve the 2020 target of reducing illegal dumping by 30%. It aims to prevent dumping, penalise rogue waste operators and reduce the incidence of waste levy avoidance.
The strategy sets out 36 actions under the following six key approaches:
building an evidence base
stakeholder engagement and capacity-building
education and awareness
prevention, infrastructure and clean-up
regulation and enforcement
evaluation and monitoring.
Meeting the 2020 target will require the sustained involvement and collaboration of multiple stakeholders. The strategy provides a framework for us to partner with public land managers, local government, charities and community groups to deliver programs which are locally relevant. Stakeholder support for the strategy has been strong, particularly from local government.
The strategy is funded under the Waste Less, Recycle More initiative, which commits $65 million over four years to preventing illegal dumping and enforcement measures. See Appendix 4 for details of grants under this inititiative.
EPA Annual Report 2017–18
37
Prosecution and regulation On 31 May 2018, the Land and Environment Court sentenced serial illegal waste dumping offender Dib Hanna to three years’ imprisonment. Mr Hanna was also ordered to clean up the waste he had dumped. This was the first time the Court had been asked to consider jailing a ‘repeat waste offender’ under tough new anti-dumping legislation introduced by the NSW Government in 2013. See Section 3: Legal enforcement for details.
We also worked with NSW Police and Roads and Maritime Services to ensure safe transport and the correct disposal of waste. Initiatives included Operation Catapult, which targeted heavy vehicles at WestConnex worksites. The EPA inspected trucks to ensure waste loads were properly covered and going to the correct waste facilities.
Challenges RIDonline, the online system for reporting illegal dumping, has been opened up to the public. While this helps raise awareness of the problem, we are aware it may lead to a rise in the number of incidents being reported, which could give the impression that waste dumping is on the rise. This might not only affect the results reported towards achieving the 2020 target, but may also influence public perceptions about how successfully the EPA is managing illegal dumping.
Looking ahead The EPA is looking forward to working with our partners to implement the Illegal Dumping Strategy. Round 6 of the Combating Illegal Dumping Clean-up and Prevention Grants will open in September 2018.
See Appendix 4: Grants – waste programs for details of the illegal dumping grants awarded.
Looking out for Country Aboriginal communities are partnering with the EPA to deal with litter and legacy waste problems. The Muli Muli Clean Up Country Project was an initiative of the Muli Muli Ladies Club who were concerned about the impact of a 50-year-old waste dumping site that had encroached on traditional burial grounds. Illegal dumping was also a problem with 200 kilograms of waste being dumped every week.
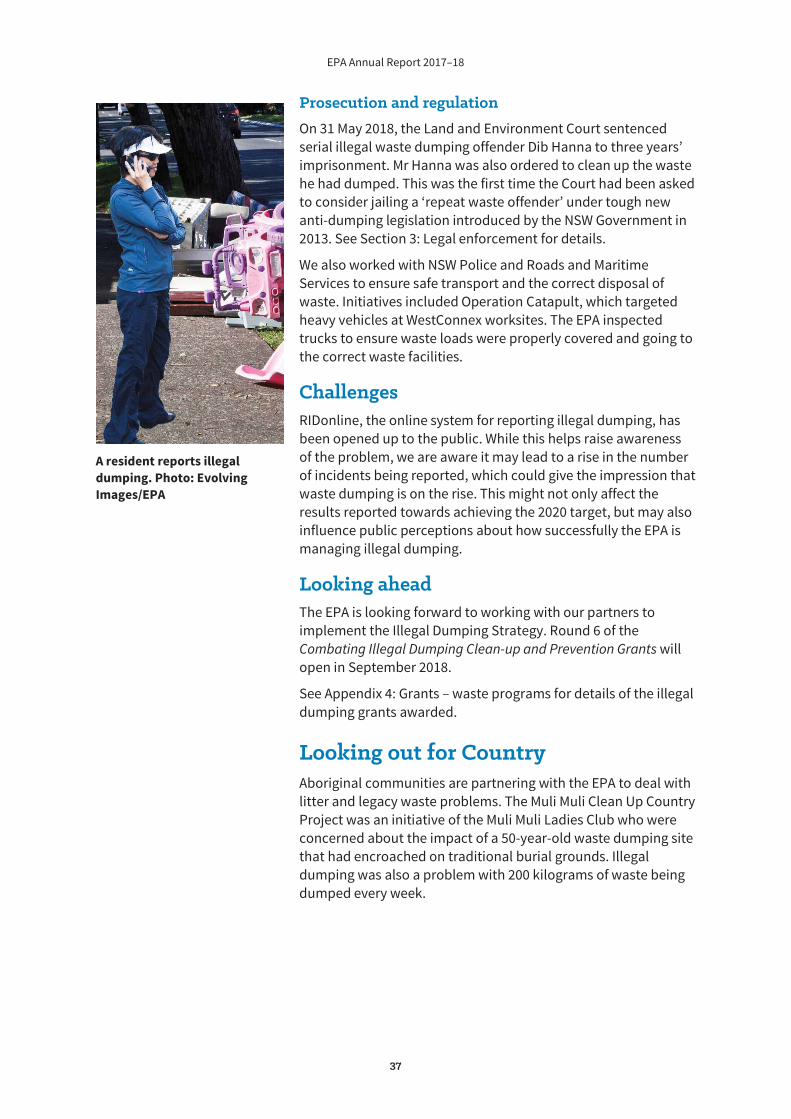
A resident reports illegal dumping. Photo: Evolving Images/EPA
EPA Annual Report 2017–18
38
Waste management in Aboriginal communities can be challenging due to:
remoteness from waste services a lack of licensed vehicles and trailers to remove rubbish poor relationships with local councils and service providers.
These challenges have often led to waste dumping, littering and burning of rubbish.
The EPA collaborated with North East Waste (NE Waste), Muli Muli Local Aboriginal Land Council and other community partners to develop and implement a Community Rubbish Management Plan. The plan included actions to remove dumped waste and encourage recycling.
A community engagement advisor was employed and a new recycling service employing two people from the community was established.
Engagement activities to encourage recycling and reduce littering and dumping included:
making recycling bags for each house that were designed by the Aunties a ‘Deadly Recycler’ competition with a meat tray prize working with a local Aboriginal artist on new bin signage a community day to paint the new recycling bins with animal totems a trip to the local tip and recycling centre development of two songs to build pride in Caring for Country through recycling and good waste management.
Results The project has visibly reduced littering and illegal dumping in the community. Achievements since the project was initiated in 2016 include:
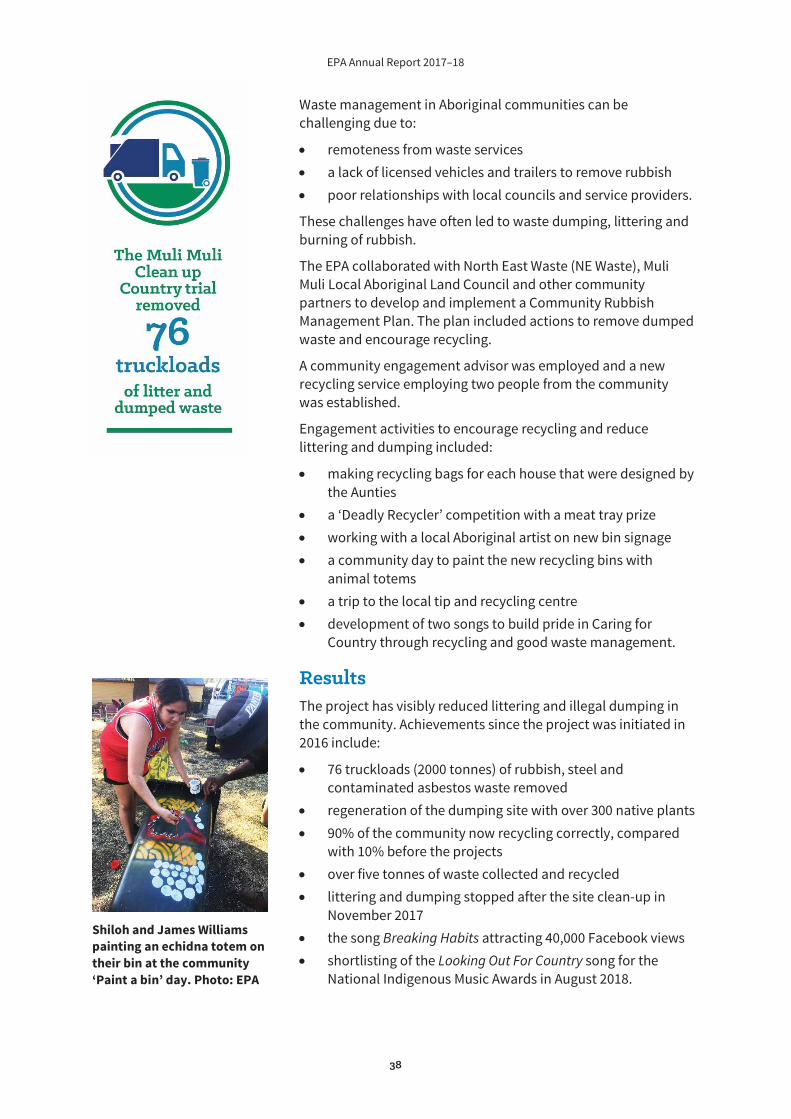
76 truckloads (2000 tonnes) of rubbish, steel and contaminated asbestos waste removed regeneration of the dumping site with over 300 native plants 90% of the community now recycling correctly, compared with 10% before the projects over five tonnes of waste collected and recycled littering and dumping stopped after the site clean-up in November 2017 the song Breaking Habits attracting 40,000 Facebook views shortlisting of the Looking Out For Country song for the National Indigenous Music Awards in August 2018.
Shiloh and James Williams painting an echidna totem on their bin at the community ‘Paint a bin’ day. Photo: EPA
EPA Annual Report 2017–18
39
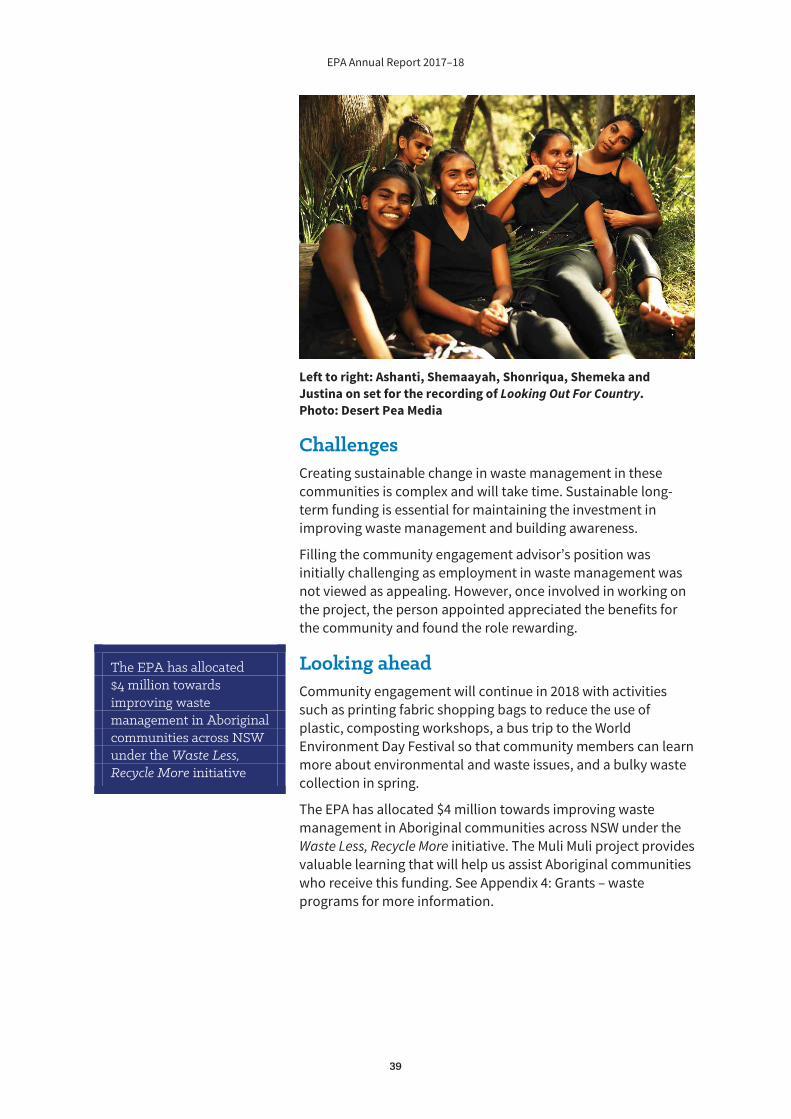
Left to right: Ashanti, Shemaayah, Shonriqua, Shemeka and Justina on set for the recording of Looking Out For Country. Photo: Desert Pea Media
Challenges Creating sustainable change in waste management in these communities is complex and will take time. Sustainable long-term funding is essential for maintaining the investment in improving waste management and building awareness.
Filling the community engagement advisor’s position was initially challenging as employment in waste management was not viewed as appealing. However, once involved in working on the project, the person appointed appreciated the benefits for the community and found the role rewarding.
Looking ahead Community engagement will continue in 2018 with activities such as printing fabric shopping bags to reduce the use of plastic, composting workshops, a bus trip to the World Environment Day Festival so that community members can learn more about environmental and waste issues, and a bulky waste collection in spring.
The EPA has allocated $4 million towards improving waste management in Aboriginal communities across NSW under the Waste Less, Recycle More initiative. The Muli Muli project provides valuable learning that will help us assist Aboriginal communities who receive this funding. See Appendix 4: Grants – waste programs for more information.
The EPA has allocated $4 million towards improving waste management in Aboriginal communities across NSW under the Waste Less, Recycle More initiative
EPA Annual Report 2017–18
40
Reducing litter
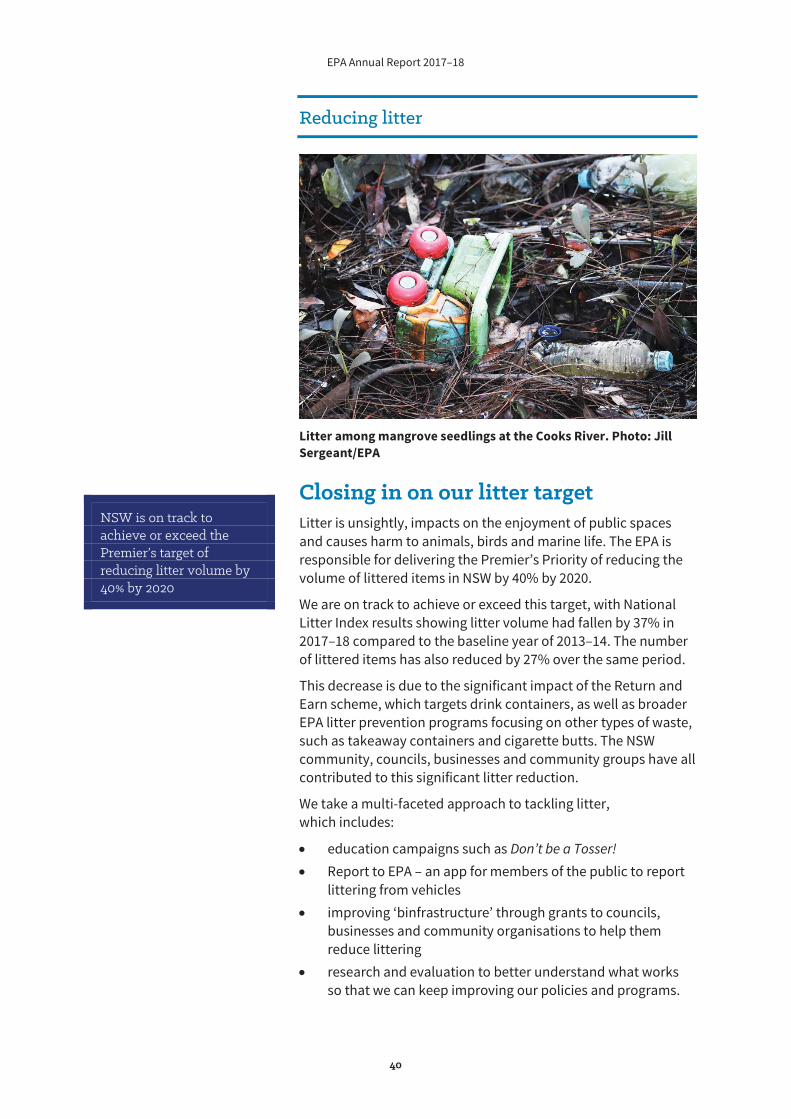
Litter among mangrove seedlings at the Cooks River. Photo: Jill Sergeant/EPA
Closing in on our litter target Litter is unsightly, impacts on the enjoyment of public spaces and causes harm to animals, birds and marine life. The EPA is responsible for delivering the Premier’s Priority of reducing the volume of littered items in NSW by 40% by 2020.
We are on track to achieve or exceed this target, with National Litter Index results showing litter volume had fallen by 37% in 2017–18 compared to the baseline year of 2013–14. The number of littered items has also reduced by 27% over the same period.
This decrease is due to the significant impact of the Return and Earn scheme, which targets drink containers, as well as broader EPA litter prevention programs focusing on other types of waste, such as takeaway containers and cigarette butts. The NSW community, councils, businesses and community groups have all contributed to this significant litter reduction.
We take a multi-faceted approach to tackling litter, which includes:
education campaigns such as Don’t be a Tosser!
Report to EPA – an app for members of the public to report littering from vehicles improving ‘binfrastructure’ through grants to councils, businesses and community organisations to help them reduce litteringresearch and evaluation to better understand what works so that we can keep improving our policies and programs.
NSW is on track to achieve or exceed the Premier’s target of reducing litter volume by 40% by 2020
EPA Annual Report 2017–18
41
Results Enforcement of litter laws has reinforced the message that littering is unacceptable. Since it started in February 2015, Report to EPA has received over 43,200 reports from over 32,400 registered litter reporters, resulting in 29,406 fines issued by the EPA.
In 2017–18, the EPA issued 8,377 fines for littering from vehicles, with a total value of over $2.2 million. Fines issued by other agencies brought the total penalties to over $2.5 million (see Appendix 3: Penalty notices – page 189).
Return and Earn helps clean up communities
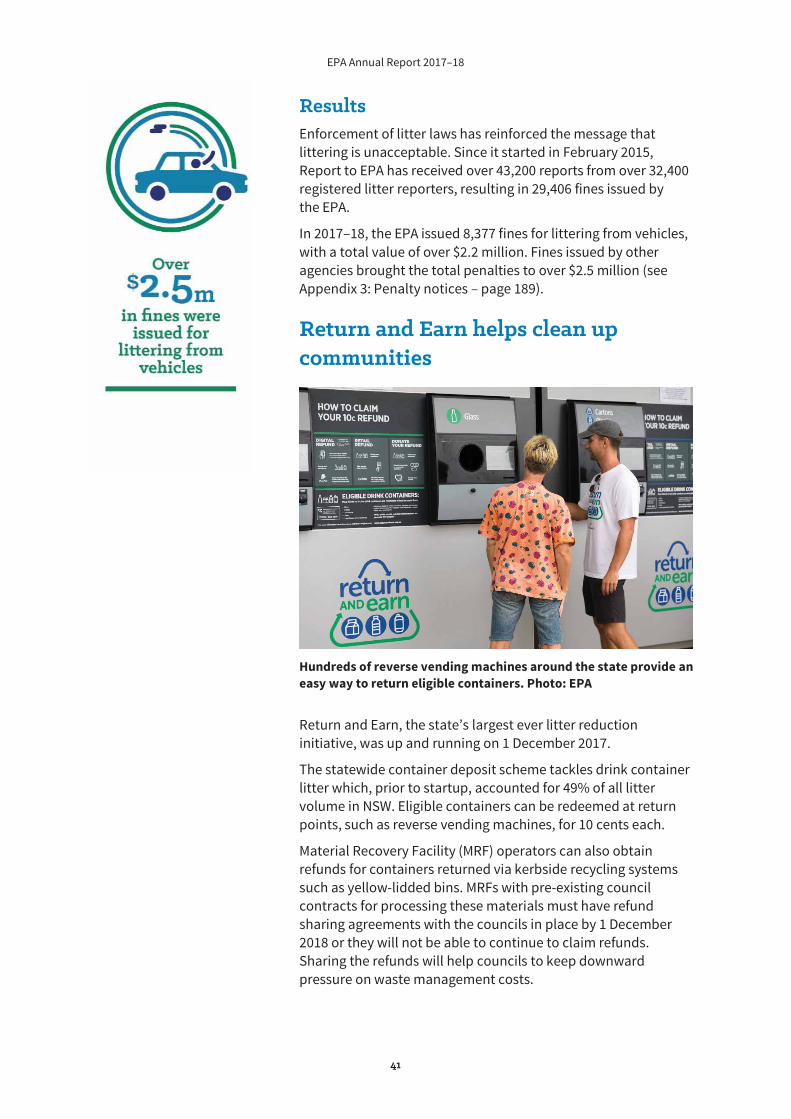
Hundreds of reverse vending machines around the state provide an easy way to return eligible containers. Photo: EPA
Return and Earn, the state’s largest ever litter reduction initiative, was up and running on 1 December 2017.
The statewide container deposit scheme tackles drink container litter which, prior to startup, accounted for 49% of all litter volume in NSW. Eligible containers can be redeemed at return points, such as reverse vending machines, for 10 cents each.
Material Recovery Facility (MRF) operators can also obtain refunds for containers returned via kerbside recycling systems such as yellow-lidded bins. MRFs with pre-existing council contracts for processing these materials must have refund sharing agreements with the councils in place by 1 December 2018 or they will not be able to continue to claim refunds. Sharing the refunds will help councils to keep downward pressure on waste management costs.
EPA Annual Report 2017–18
42
The EPA works with the scheme coordinator, Exchange for Change, and the network operator, TOMRA Cleanaway, to ensure their effective delivery of the scheme. The refunds and scheme costs are funded by beverage suppliers in NSW.
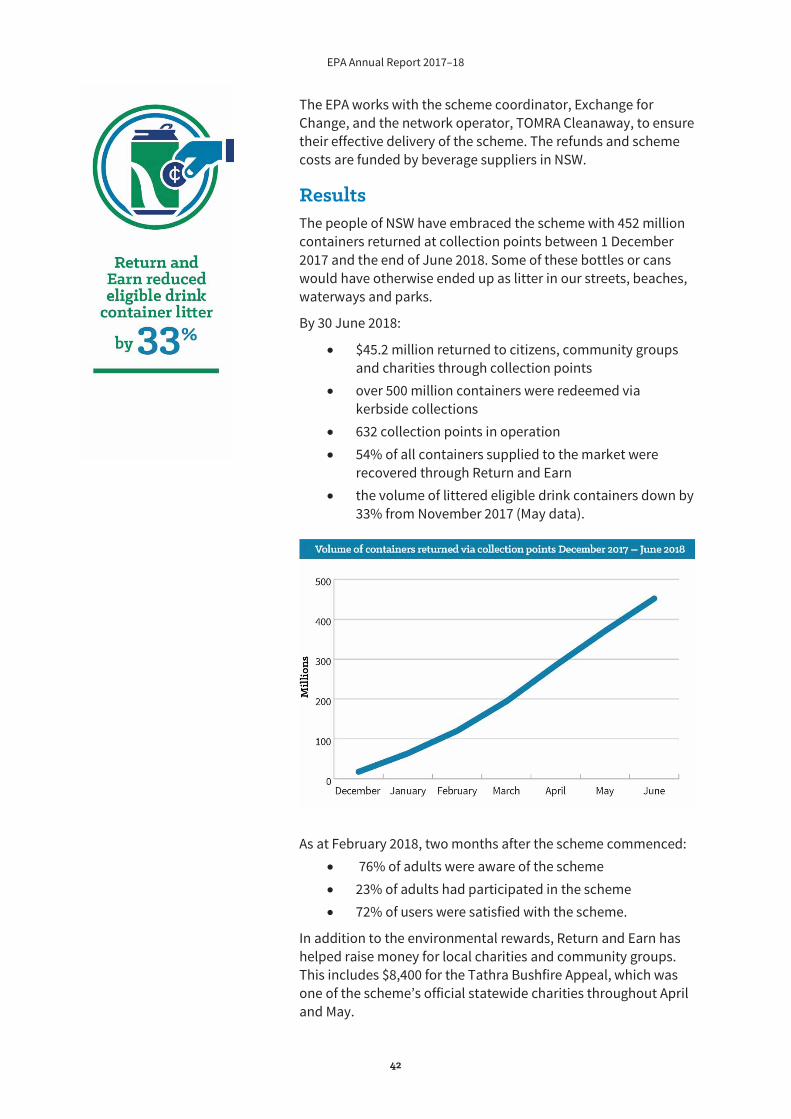
Results The people of NSW have embraced the scheme with 452 million containers returned at collection points between 1 December 2017 and the end of June 2018. Some of these bottles or cans would have otherwise ended up as litter in our streets, beaches, waterways and parks.
By 30 June 2018:
$45.2 million returned to citizens, community groups and charities through collection points over 500 million containers were redeemed via kerbside collections 632 collection points in operation 54% of all containers supplied to the market were recovered through Return and Earn the volume of littered eligible drink containers down by 33% from November 2017 (May data).
As at February 2018, two months after the scheme commenced:
76% of adults were aware of the scheme 23% of adults had participated in the scheme 72% of users were satisfied with the scheme.
In addition to the environmental rewards, Return and Earn has helped raise money for local charities and community groups. This includes $8,400 for the Tathra Bushfire Appeal, which was one of the scheme’s official statewide charities throughout April and May.
EPA Annual Report 2017–18
43
See Key Result Area 5: Effective communication and stakeholder engagement for more information about community fundraising.
Challenges Strong community engagement has resulted in high demand for reverse vending machines and return points. Rolling these out to keep pace with demand has been a challenge.
Community members and councils are concerned about increased litter and other household waste dumping near return points. While TOMRA Cleanaway staff clean the sites several times a day, the EPA has explored more ways to reduce litter and improve cleanliness, including signage and messaging.
Managing the impact of the scheme on small retailers near the NSW-Victorian border has been challenging. The EPA has provided transitional assistance to small businesss in this region to help them adjust to the new market conditions.
Looking ahead Rollout of return points across the state will continue and the EPA will promote further community fundraising opportunities.
The EPA will continue to work with the network operator to optimise the return point network.
Helping smokers bin their butts safely Cigarette butts are made of of cellulose acetate, a type of plastic, and contain chemicals that are harmful to human health and the environment. Butts make up 39% of all littered items in NSW.
Tackling cigarette butt littering is challenging. EPA research shows that littering behaviours such as the ‘flick’ or ‘drop and stomp’ are automatic for most smokers.
In 2018, the EPA conducted an innovative behaviour change trial to reduce cigarette butt littering. We collaborated with 16 councils to trial four different interventions across 40 sites.
The interventions were:
Pathways: Create the right environment to help smokers locate a smokers’ bin and dispose of butts appropriately. Pride and ownership: Help smokers feel welcome in a space, so they want to bin their butts. Positive social norming: Create cues to reinforce the right ‘social norm’ and trigger the right behaviour. Enforcement: Raise the risk of getting caught littering, through an increased presence of rangers and fines.
In 2018, we partnered with 16 councils on an innovative behaviour change trial that investigated ways to reduce cigarette butt littering
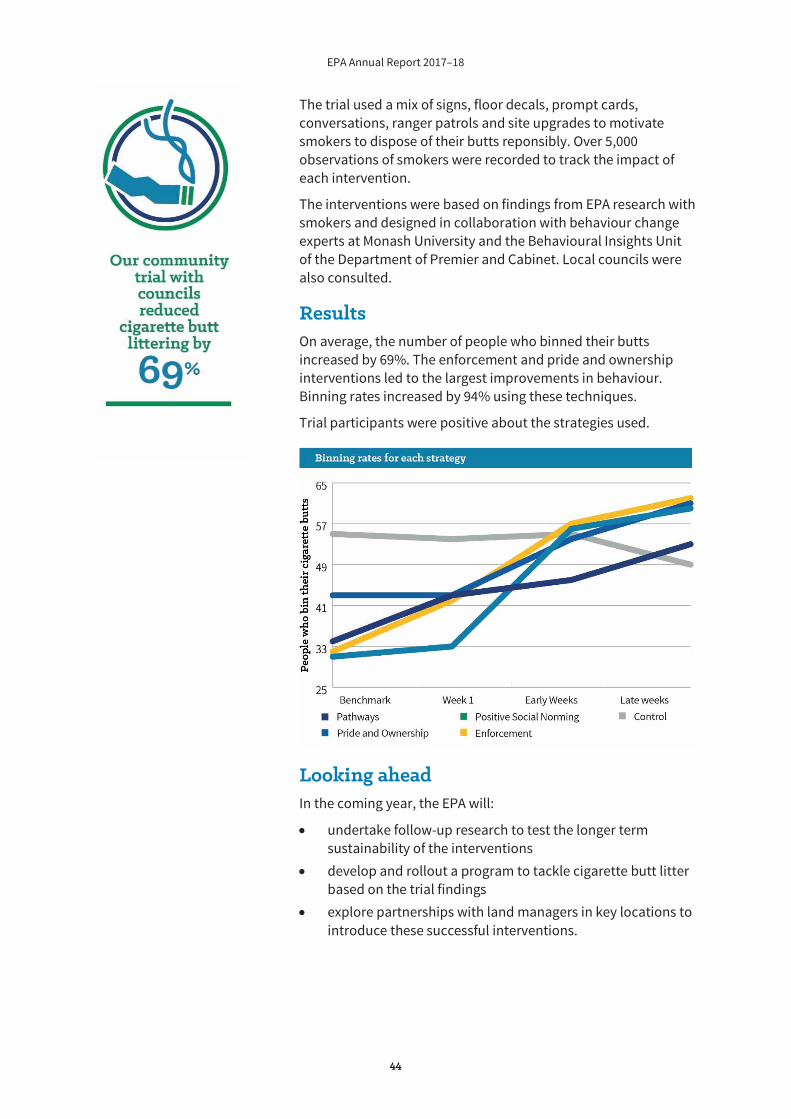
EPA Annual Report 2017–18
44
The trial used a mix of signs, floor decals, prompt cards, conversations, ranger patrols and site upgrades to motivate smokers to dispose of their butts reponsibly. Over 5,000 observations of smokers were recorded to track the impact of each intervention.
The interventions were based on findings from EPA research with smokers and designed in collaboration with behaviour change experts at Monash University and the Behavioural Insights Unit of the Department of Premier and Cabinet. Local councils were also consulted.
Results On average, the number of people who binned their butts increased by 69%. The enforcement and pride and ownership interventions led to the largest improvements in behaviour. Binning rates increased by 94% using these techniques.
Trial participants were positive about the strategies used.
Looking ahead In the coming year, the EPA will:
undertake follow-up research to test the longer term sustainability of the interventions develop and rollout a program to tackle cigarette butt litter based on the trial findings explore partnerships with land managers in key locations to introduce these successful interventions.
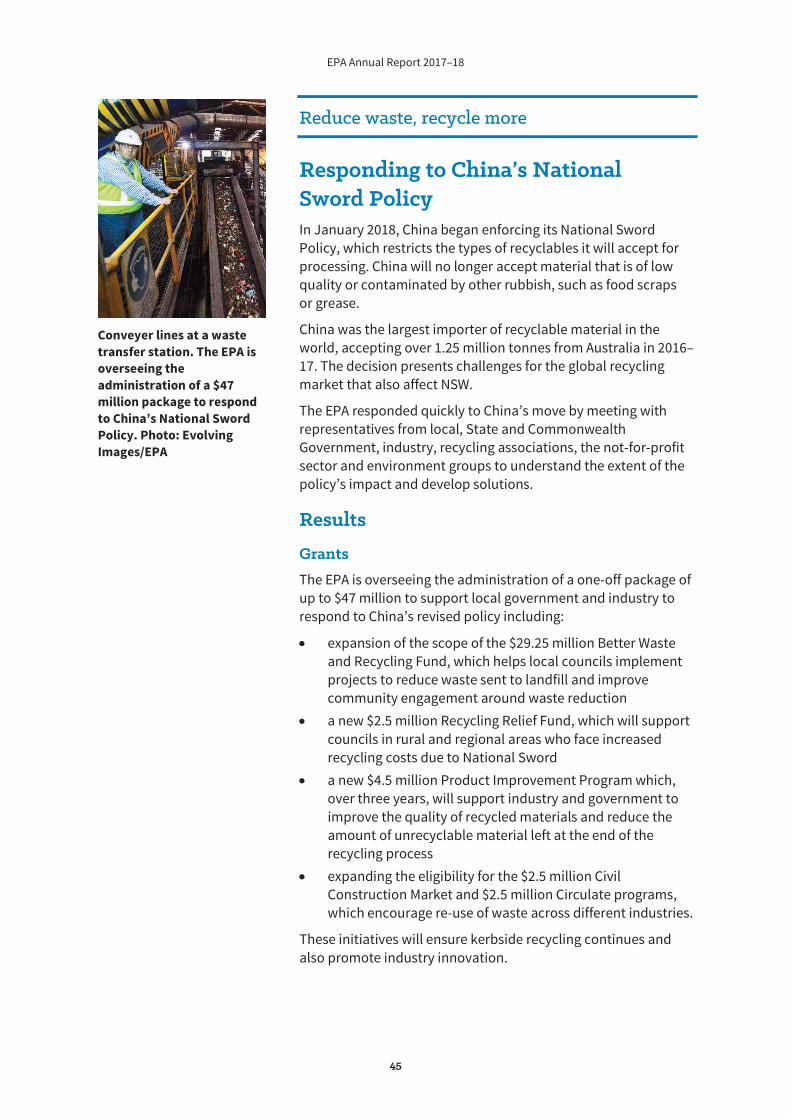
EPA Annual Report 2017–18
45
Reduce waste, recycle more
Responding to China’s National Sword Policy In January 2018, China began enforcing its National Sword Policy, which restricts the types of recyclables it will accept for processing. China will no longer accept material that is of low quality or contaminated by other rubbish, such as food scraps or grease.
China was the largest importer of recyclable material in the world, accepting over 1.25 million tonnes from Australia in 2016–17. The decision presents challenges for the global recycling market that also affect NSW.
The EPA responded quickly to China’s move by meeting with representatives from local, State and Commonwealth Government, industry, recycling associations, the not-for-profit sector and environment groups to understand the extent of the policy’s impact and develop solutions.
Results
Grants The EPA is overseeing the administration of a one-off package of up to $47 million to support local government and industry to respond to China’s revised policy including:
expansion of the scope of the $29.25 million Better Waste and Recycling Fund, which helps local councils implement projects to reduce waste sent to landfill and improve community engagement around waste reduction a new $2.5 million Recycling Relief Fund, which will support councils in rural and regional areas who face increased recycling costs due to National Sword a new $4.5 million Product Improvement Program which, over three years, will support industry and government to improve the quality of recycled materials and reduce the amount of unrecyclable material left at the end of the recycling process expanding the eligibility for the $2.5 million Civil Construction Market and $2.5 million Circulate programs, which encourage re-use of waste across different industries.
These initiatives will ensure kerbside recycling continues and also promote industry innovation.
Conveyer lines at a waste transfer station. The EPA is overseeing the administration of a $47 million package to respond to China’s National Sword Policy. Photo: Evolving Images/EPA
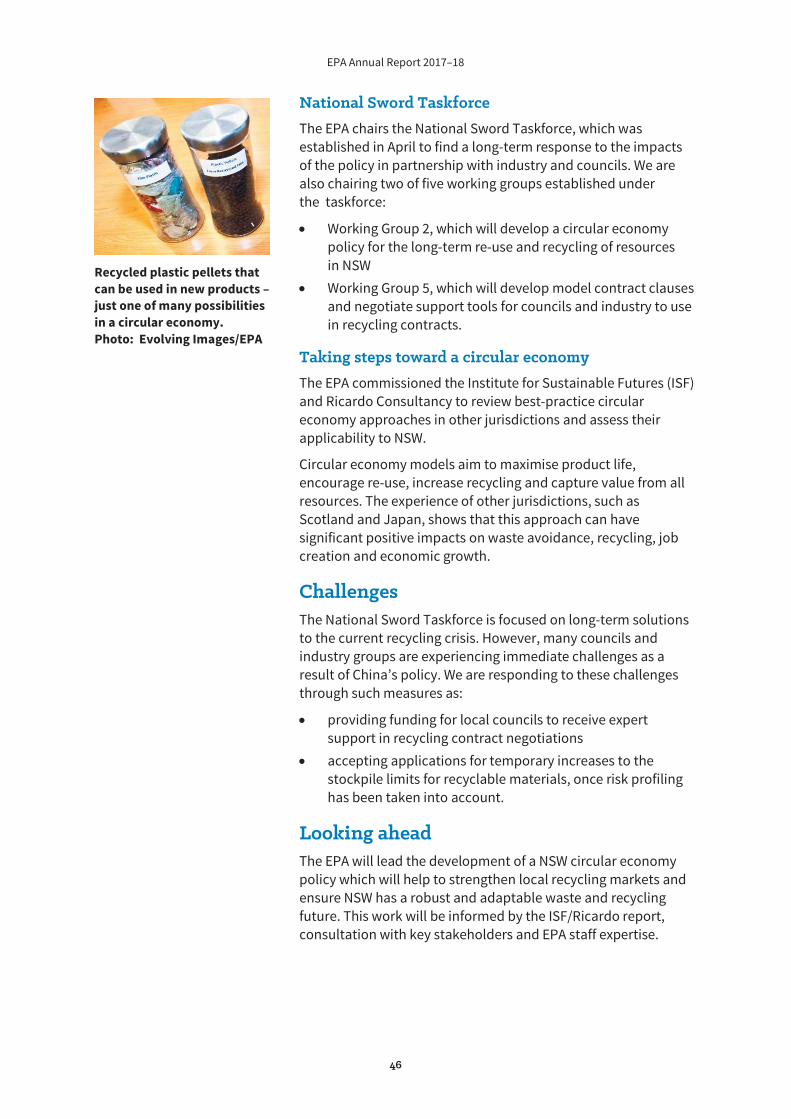
EPA Annual Report 2017–18
46
National Sword Taskforce The EPA chairs the National Sword Taskforce, which was established in April to find a long-term response to the impacts of the policy in partnership with industry and councils. We are also chairing two of five working groups established under the taskforce:
Working Group 2, which will develop a circular economy policy for the long-term re-use and recycling of resources in NSW Working Group 5, which will develop model contract clauses and negotiate support tools for councils and industry to use in recycling contracts.
Taking steps toward a circular economy The EPA commissioned the Institute for Sustainable Futures (ISF) and Ricardo Consultancy to review best-practice circular economy approaches in other jurisdictions and assess their applicability to NSW.
Circular economy models aim to maximise product life, encourage re-use, increase recycling and capture value from all resources. The experience of other jurisdictions, such as Scotland and Japan, shows that this approach can have significant positive impacts on waste avoidance, recycling, job creation and economic growth.
Challenges The National Sword Taskforce is focused on long-term solutions to the current recycling crisis. However, many councils and industry groups are experiencing immediate challenges as a result of China’s policy. We are responding to these challenges through such measures as:
providing funding for local councils to receive expert support in recycling contract negotiations accepting applications for temporary increases to the stockpile limits for recyclable materials, once risk profiling has been taken into account.
Looking ahead The EPA will lead the development of a NSW circular economy policy which will help to strengthen local recycling markets and ensure NSW has a robust and adaptable waste and recycling future. This work will be informed by the ISF/Ricardo report, consultation with key stakeholders and EPA staff expertise.
Recycled plastic pellets that can be used in new products – just one of many possibilities in a circular economy. Photo: Evolving Images/EPA
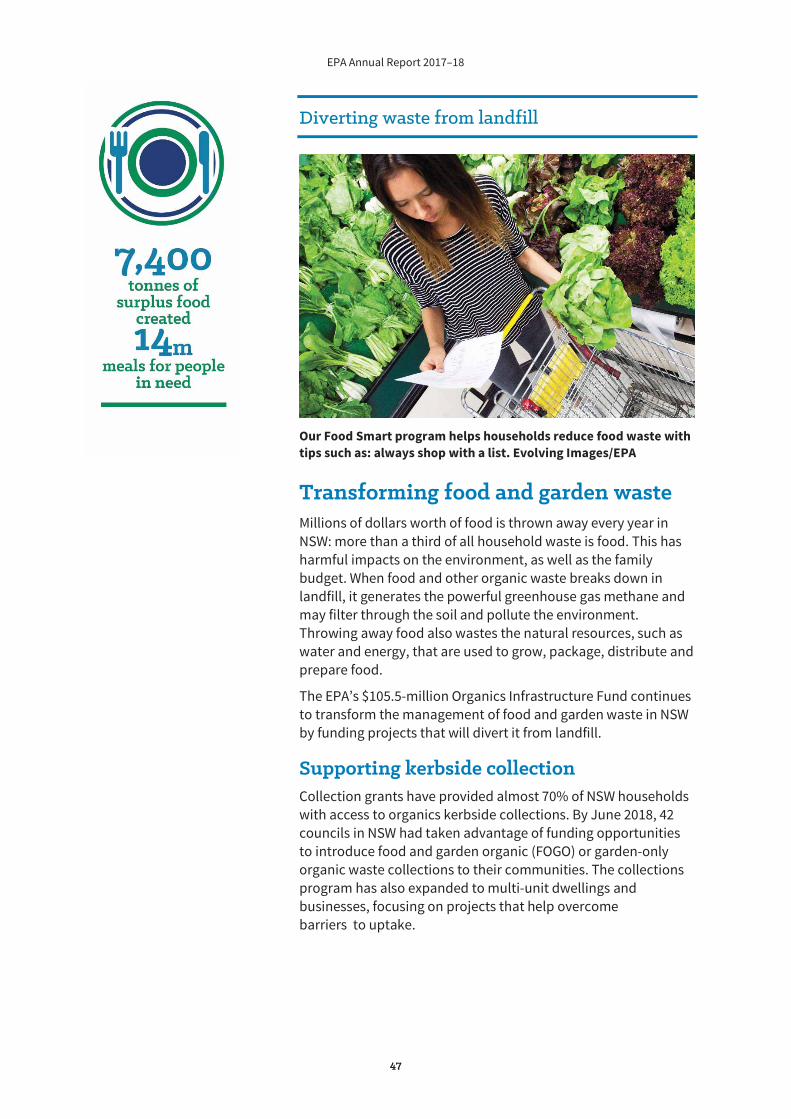
EPA Annual Report 2017–18
47
Diverting waste from landfill
Our Food Smart program helps households reduce food waste with tips such as: always shop with a list. Evolving Images/EPA
Transforming food and garden waste Millions of dollars worth of food is thrown away every year in NSW: more than a third of all household waste is food. This has harmful impacts on the environment, as well as the family budget. When food and other organic waste breaks down in landfill, it generates the powerful greenhouse gas methane and may filter through the soil and pollute the environment. Throwing away food also wastes the natural resources, such as water and energy, that are used to grow, package, distribute and prepare food.
The EPA’s $105.5-million Organics Infrastructure Fund continues to transform the management of food and garden waste in NSW by funding projects that will divert it from landfill.
Supporting kerbside collection Collection grants have provided almost 70% of NSW households with access to organics kerbside collections. By June 2018, 42 councils in NSW had taken advantage of funding opportunities to introduce food and garden organic (FOGO) or garden-only organic waste collections to their communities. The collections program has also expanded to multi-unit dwellings and businesses, focusing on projects that help overcome barriers to uptake.
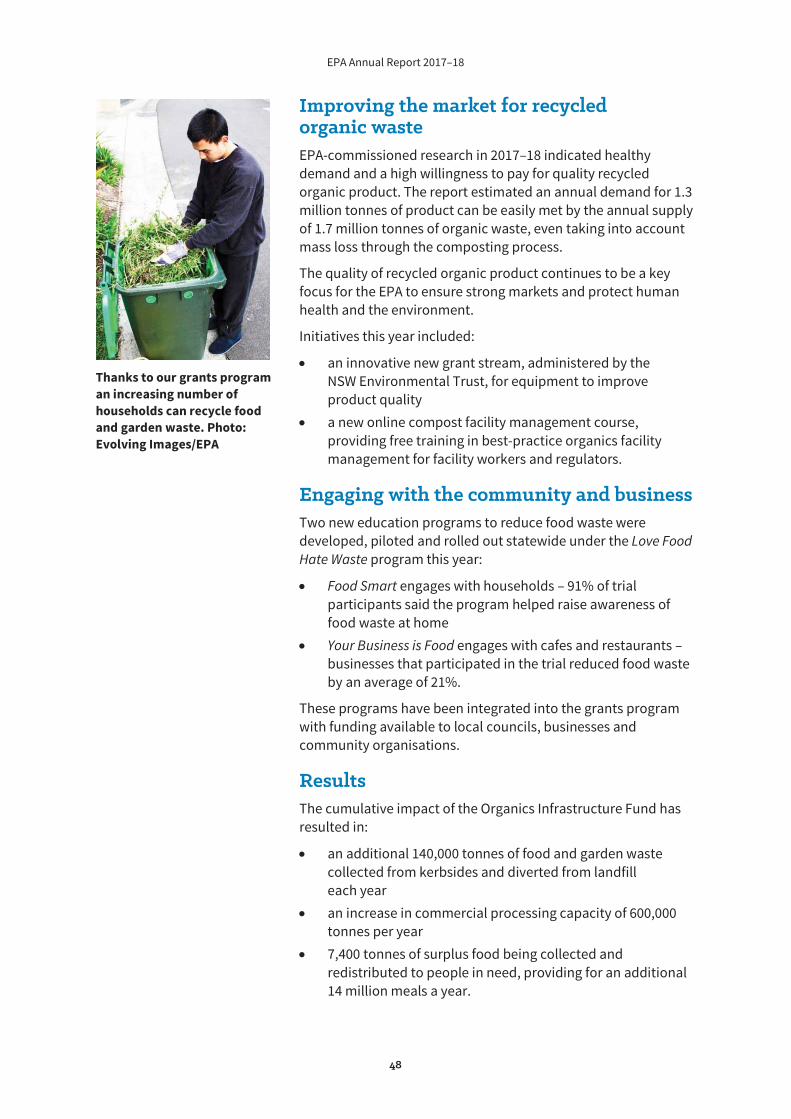
EPA Annual Report 2017–18
48
Improving the market for recycled organic waste EPA-commissioned research in 2017–18 indicated healthy demand and a high willingness to pay for quality recycled organic product. The report estimated an annual demand for 1.3 million tonnes of product can be easily met by the annual supply of 1.7 million tonnes of organic waste, even taking into account mass loss through the composting process.
The quality of recycled organic product continues to be a key focus for the EPA to ensure strong markets and protect human health and the environment.
Initiatives this year included:
an innovative new grant stream, administered by the NSW Environmental Trust, for equipment to improve product quality a new online compost facility management course, providing free training in best-practice organics facility management for facility workers and regulators.
Engaging with the community and business Two new education programs to reduce food waste were developed, piloted and rolled out statewide under the Love Food Hate Waste program this year:
Food Smart engages with households – 91% of trial participants said the program helped raise awareness of food waste at home Your Business is Food engages with cafes and restaurants – businesses that participated in the trial reduced food waste by an average of 21%.
These programs have been integrated into the grants program with funding available to local councils, businesses and community organisations.
Results The cumulative impact of the Organics Infrastructure Fund has resulted in:
an additional 140,000 tonnes of food and garden waste collected from kerbsides and diverted from landfill each year an increase in commercial processing capacity of 600,000 tonnes per year 7,400 tonnes of surplus food being collected and redistributed to people in need, providing for an additional 14 million meals a year.
Thanks to our grants program an increasing number of households can recycle food and garden waste. Photo: Evolving Images/EPA
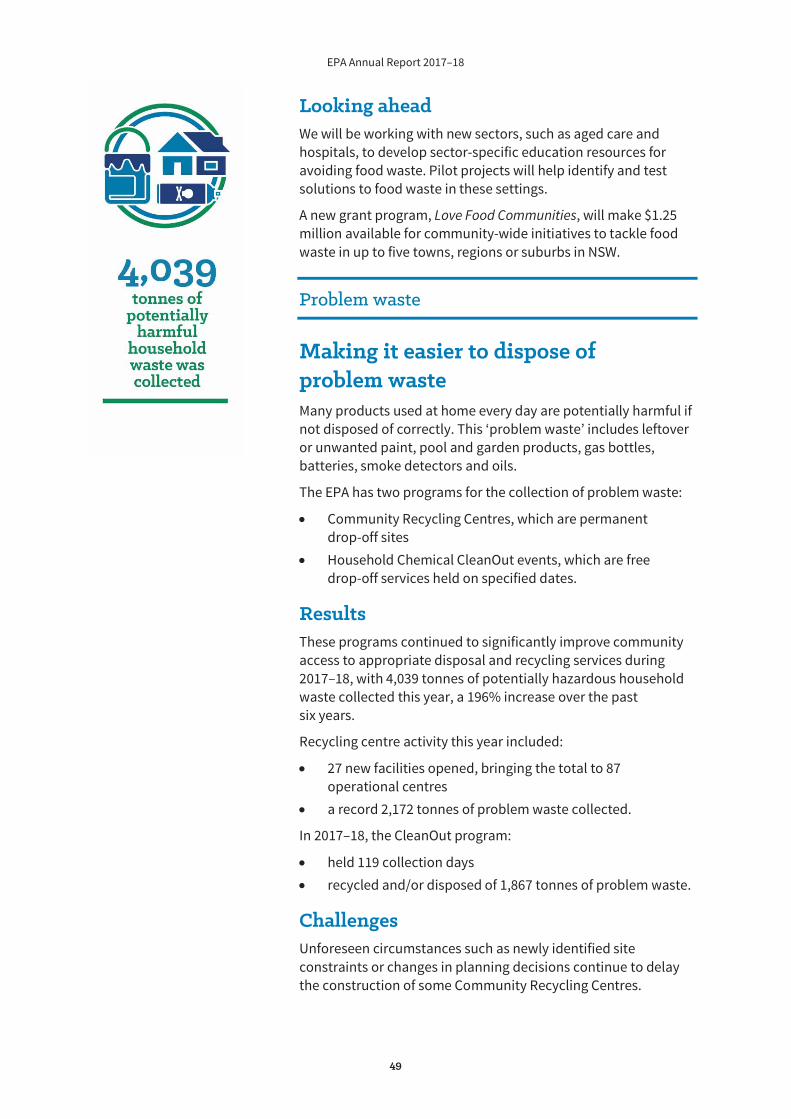
EPA Annual Report 2017–18
49
Looking ahead We will be working with new sectors, such as aged care and hospitals, to develop sector-specific education resources for avoiding food waste. Pilot projects will help identify and test solutions to food waste in these settings.
A new grant program, Love Food Communities, will make $1.25 million available for community-wide initiatives to tackle food waste in up to five towns, regions or suburbs in NSW.
Problem waste
Making it easier to dispose of problem waste Many products used at home every day are potentially harmful if not disposed of correctly. This ‘problem waste’ includes leftover or unwanted paint, pool and garden products, gas bottles, batteries, smoke detectors and oils.
The EPA has two programs for the collection of problem waste:
Community Recycling Centres, which are permanent drop-off sites Household Chemical CleanOut events, which are free drop-off services held on specified dates.
Results These programs continued to significantly improve community access to appropriate disposal and recycling services during 2017–18, with 4,039 tonnes of potentially hazardous household waste collected this year, a 196% increase over the past six years.
Recycling centre activity this year included:
27 new facilities opened, bringing the total to 87 operational centres a record 2,172 tonnes of problem waste collected.
In 2017–18, the CleanOut program:
held 119 collection days recycled and/or disposed of 1,867 tonnes of problem waste.
Challenges Unforeseen circumstances such as newly identified site constraints or changes in planning decisions continue to delay the construction of some Community Recycling Centres.
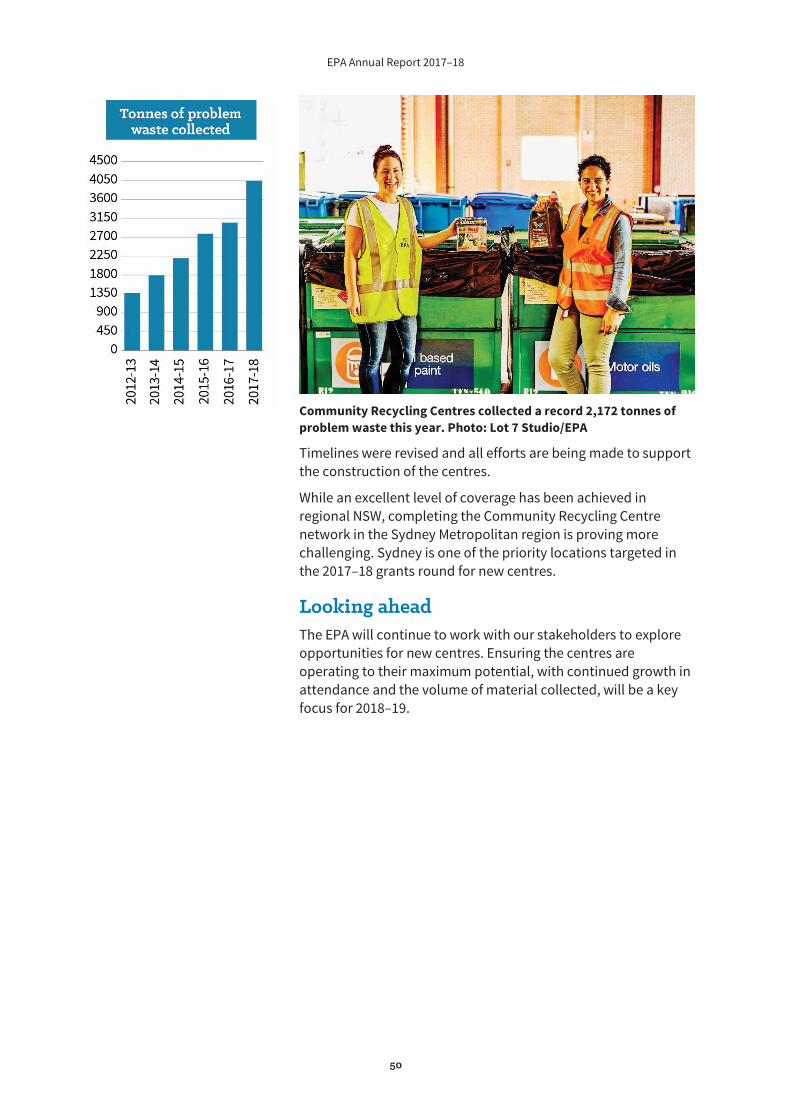
EPA Annual Report 2017–18
50
Community Recycling Centres collected a record 2,172 tonnes of problem waste this year. Photo: Lot 7 Studio/EPA
Timelines were revised and all efforts are being made to support the construction of the centres.
While an excellent level of coverage has been achieved in regional NSW, completing the Community Recycling Centre network in the Sydney Metropolitan region is proving more challenging. Sydney is one of the priority locations targeted in the 2017–18 grants round for new centres.
Looking ahead The EPA will continue to work with our stakeholders to explore opportunities for new centres. Ensuring the centres are operating to their maximum potential, with continued growth in attendance and the volume of material collected, will be a key focus for 2018–19.
EPA Annual Report 2017–18
51
The EPA plays an important role in managing incidents, such as discharges of waste and chemicals and spills of hazardous materials (HAZMAT) which may harm the environment and human health.
We work with industry to make sure that businesses are able to deal with incidents and are prepared to pay clean-up costs.
We partner with emergency services and other agencies to ensure a rapid and effective response to incidents. This includes alerting the public to risks and making the area safe as soon as possible.
This year we:
were notified of 256 HAZMAT incidents and responded or decided on appropriate action within 30 minutes in 100% of cases acted upon 100% of recommendations arising from debriefs after incidents.
Preparing for pollution incidents Forward planning helps reduce the harm caused by pollution incidents. Since 2012, all licensed premises that handle hazardous materials must have up-to-date Pollution Incident Response Management Plans (PIRMPs) at the ready. These plans ensure businesses have identified potential risks and are able to respond effectively should an incident occur.
The EPA monitors compliance to make sure licensees meet the PIRMP requirements.
Our annual return process questions licensees about how they prepare, make available, update, test and activate their PIRMPs. We undertake regulatory activities including compliance campaigns and audits.
In 2017–18, we assessed 47 PIRMPs during compliance audits at 24 small sewage treatment plants, 21 waste facilities and two other facilities.
Key Result Area 3:
EEffective management of environmental incidents
EPA Annual Report 2017–18
52
Results This year, annual returns showed that 99.8% of all licensees had Pollution Incident Response Management Plans.
Despite this solid result, our compliance audits found lower rates of compliance with actual requirements in the PIRMPs:
82% compliance for small sewage treatment plants 56% compliance for waste facilities.
Furthermore, non-compliance with some requirements was found to be high including:
83% of audited sites did not have detailed maps which showed key information, such as where potential pollutants were stored, nearby areas most likely to be affected by a pollution incident and the location of stormwater drains 77% did not test their plans as required or provide details of tests that had occurred 70% did not list all on-site pollutants in their pollutant inventory 30% did not provide all contact details for key personnel or relevant authorities.
The EPA worked with the audited premises to rectify these non-compliances and ensure licensees have effective procedures in place to deal with pollution incidents.
Looking ahead It is important to regularly audit PIRMPs to ensure they are fully compliant and updated to reflect any changes to licensees’ operations.
To improve compliance and encourage better reporting, we will:
review and update our online guidance material relating to PIRMPs develop an online template to assist licensees to prepare PIRMPs that comply with legislative requirements continue to audit PIRMPs on a routine basis as part of the EPA Compliance Audit Program and undertake compliance campaigns aimed at high-risk facilities take necessary regulatory action where repeat non-compliances are identified.
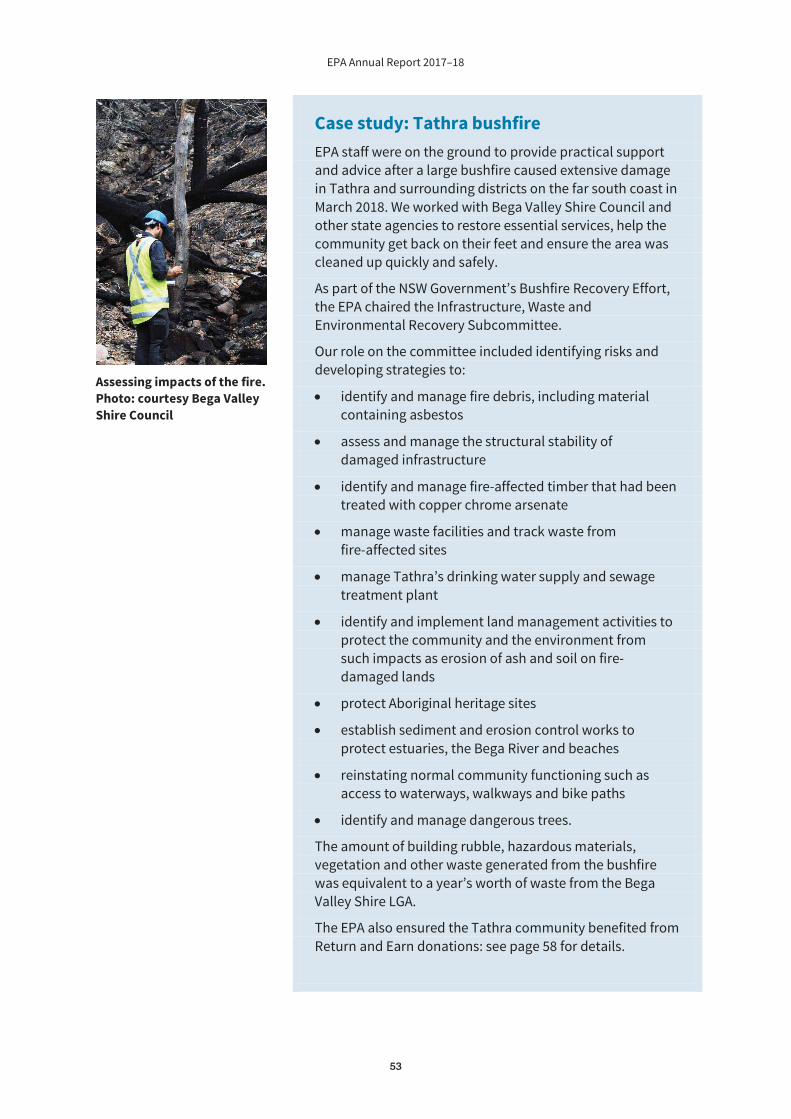
EPA Annual Report 2017–18
53
Case study: Tathra bushfire EPA staff were on the ground to provide practical support and advice after a large bushfire caused extensive damage in Tathra and surrounding districts on the far south coast in March 2018. We worked with Bega Valley Shire Council and other state agencies to restore essential services, help the community get back on their feet and ensure the area was cleaned up quickly and safely.
As part of the NSW Government’s Bushfire Recovery Effort, the EPA chaired the Infrastructure, Waste and Environmental Recovery Subcommittee.
Our role on the committee included identifying risks and developing strategies to:
identify and manage fire debris, including material containing asbestos
assess and manage the structural stability of damaged infrastructure
identify and manage fire-affected timber that had been treated with copper chrome arsenate
manage waste facilities and track waste from fire-affected sites
manage Tathra’s drinking water supply and sewage treatment plant
identify and implement land management activities to protect the community and the environment from such impacts as erosion of ash and soil on fire-damaged lands
protect Aboriginal heritage sites
establish sediment and erosion control works to protect estuaries, the Bega River and beaches
reinstating normal community functioning such as access to waterways, walkways and bike paths
identify and manage dangerous trees.
The amount of building rubble, hazardous materials, vegetation and other waste generated from the bushfire was equivalent to a year’s worth of waste from the Bega Valley Shire LGA.
The EPA also ensured the Tathra community benefited from Return and Earn donations: see page 58 for details.
Assessing impacts of the fire. Photo: courtesy Bega Valley Shire Council
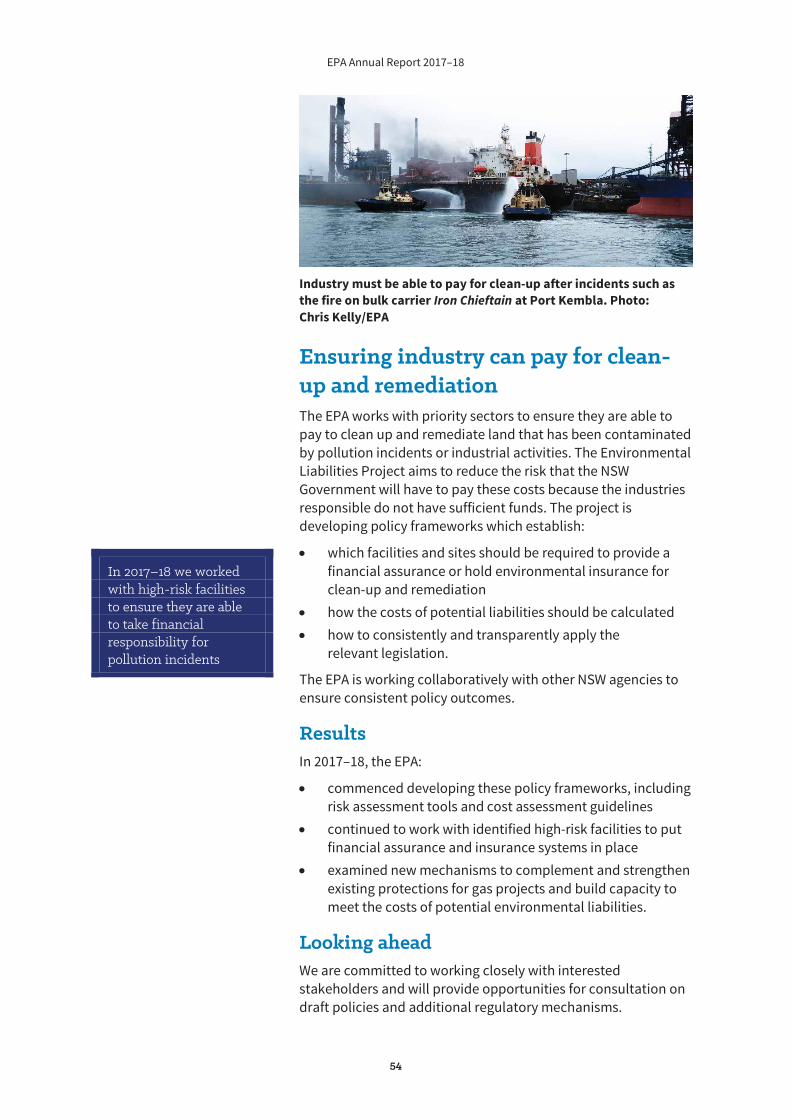
EPA Annual Report 2017–18
54
Industry must be able to pay for clean-up after incidents such as the fire on bulk carrier Iron Chieftain at Port Kembla. Photo: Chris Kelly/EPA
Ensuring industry can pay for clean-up and remediation The EPA works with priority sectors to ensure they are able to pay to clean up and remediate land that has been contaminated by pollution incidents or industrial activities. The Environmental Liabilities Project aims to reduce the risk that the NSW Government will have to pay these costs because the industries responsible do not have sufficient funds. The project is developing policy frameworks which establish:
which facilities and sites should be required to provide a financial assurance or hold environmental insurance for clean-up and remediation how the costs of potential liabilities should be calculated how to consistently and transparently apply the relevant legislation.
The EPA is working collaboratively with other NSW agencies to ensure consistent policy outcomes.
Results In 2017–18, the EPA:
commenced developing these policy frameworks, including risk assessment tools and cost assessment guidelines continued to work with identified high-risk facilities to put financial assurance and insurance systems in place examined new mechanisms to complement and strengthen existing protections for gas projects and build capacity to meet the costs of potential environmental liabilities.
Looking ahead We are committed to working closely with interested stakeholders and will provide opportunities for consultation on draft policies and additional regulatory mechanisms.
In 2017–18 we worked with high-risk facilities to ensure they are able to take financial responsibility for pollution incidents
EPA Annual Report 2017–18
55
The EPA contributes to planning for the future of NSW. We work with all levels of government to ensure environmental issues are considered when developments are approved and planning strategies and policies are prepared.
The EPA provides information and advice, as well as input into specific planning decisions, to protect air and water quality and address such issues as legacy contamination and noise.
We aim to respond to all planning matters carefully and in a timely manner. In 2017–18, we processed 86% of 687 referrals on time. While responding to complex referrals takes time and diligence, we always aim to improve our on-time performance.
Improving strategic planning
Planning for better cities As our cities change, the EPA works to reduce impacts from urban growth, the provision of infrastructure and industrial activities. Over the past three years, we have engaged with key government agencies and other stakeholders, including community, interest groups, businesses, industry and local government, during the development of the NSW Government’s A Metropolis of Three Cities: The Greater Sydney Region Plan and five supporting district implementation plans.
A Metropolis of Three Cities aligns land use, transport and infrastructure planning to reshape Greater Sydney as three unique, but connected cities – Western Parkland City, Central River City and Eastern Harbour City.
The district implementation plans were released by the Greater Sydney Commission (GSC) in March 2018. They build upon key initiatives such as the strategy for South Creek Corridor, which is the central element of urban design and water management for the Western Parkland City and a NSW Premier’s Priority. The strategy recognises the role of water in supporting healthy and liveable communities.
Key Result Area 4:
SSound strategic and planning advice
EPA Annual Report 2017–18
56
Results The EPA:
provided information and recommendations for managing water and air quality, noise and waste and promoting sustainability developed new approaches for protecting industrial lands provided information to help inform planning decisions that address land-use conflict from industrial lands. This helped the GSC’s development of a new concept of ‘urban hazard’ which includes supporting actions where industrial land is protected across Greater Sydney.
Challenges The importance of environmental considerations in strategic land-use and transport planning is continuing to increase with a growing and changing population.
Top issues for protecting the environment and public health include incorporating better air quality and water-sensitive urban design into our decisions and promoting consideration of impacts when locating sensitive uses (such as residential developments, schools and hospitals) near industrial sites or intensive agriculture.
Looking ahead In the year ahead, the EPA will:
provide advice during the planning and development of the Western Sydney Priority Growth Area associated with the second Sydney Airport and new precincts such as the Camellia Town Centre on the Parramatta River work with the Greater Sydney Commission and local councils to develop local strategic planning statements that shape how development controls in local environmental plans evolve over time to meet the community’s needs and satisfy key strategies and actions in the district and regional plans continue to work with Infrastructure NSW on the development and implementation of the South Creek Corridor Strategy which will include consideration of tools such as Protection of the Environment Policy provisions.
The importance of environmental considerations in strategic land-use and transport planning continues to increase with a growing and changing population
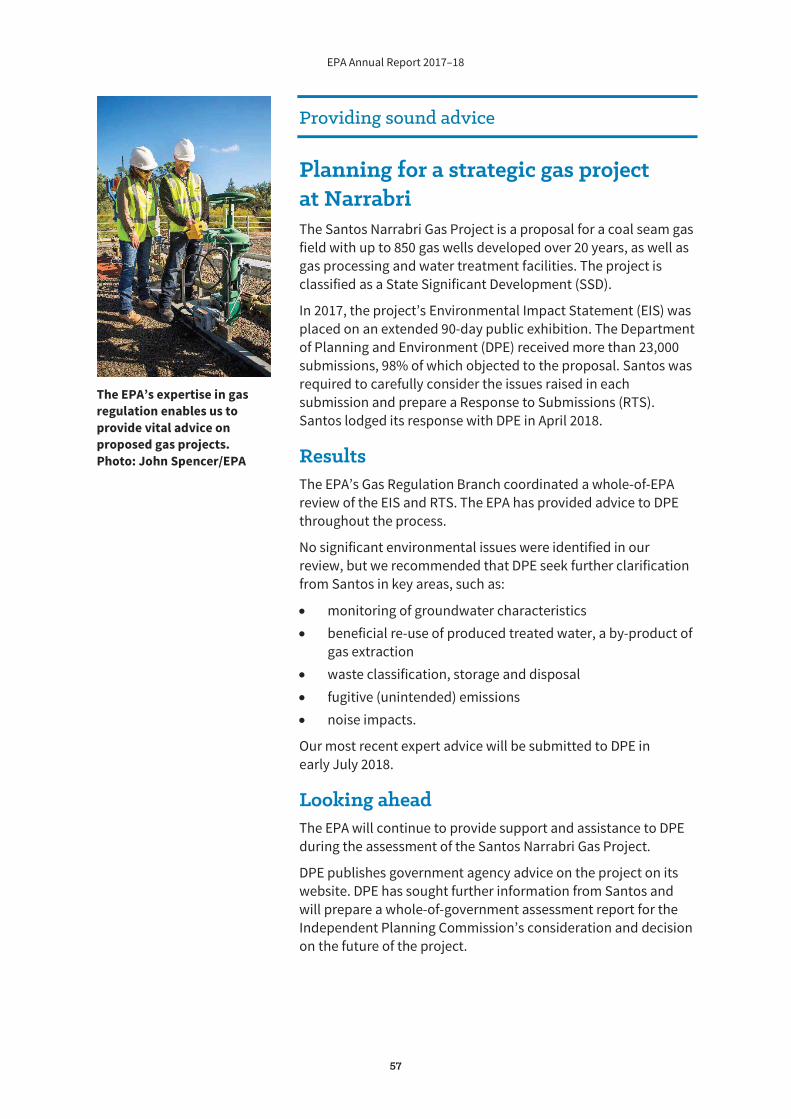
EPA Annual Report 2017–18
57
Providing sound advice
Planning for a strategic gas project at Narrabri The Santos Narrabri Gas Project is a proposal for a coal seam gas field with up to 850 gas wells developed over 20 years, as well as gas processing and water treatment facilities. The project is classified as a State Significant Development (SSD).
In 2017, the project’s Environmental Impact Statement (EIS) was placed on an extended 90-day public exhibition. The Department of Planning and Environment (DPE) received more than 23,000 submissions, 98% of which objected to the proposal. Santos was required to carefully consider the issues raised in each submission and prepare a Response to Submissions (RTS). Santos lodged its response with DPE in April 2018.
Results The EPA’s Gas Regulation Branch coordinated a whole-of-EPA review of the EIS and RTS. The EPA has provided advice to DPE throughout the process.
No significant environmental issues were identified in our review, but we recommended that DPE seek further clarification from Santos in key areas, such as:
monitoring of groundwater characteristics beneficial re-use of produced treated water, a by-product of gas extraction waste classification, storage and disposal fugitive (unintended) emissions noise impacts.
Our most recent expert advice will be submitted to DPE in early July 2018.
Looking ahead The EPA will continue to provide support and assistance to DPE during the assessment of the Santos Narrabri Gas Project.
DPE publishes government agency advice on the project on its website. DPE has sought further information from Santos and will prepare a whole-of-government assessment report for the Independent Planning Commission’s consideration and decision on the future of the project.
The EPA’s expertise in gas regulation enables us to provide vital advice on proposed gas projects. Photo: John Spencer/EPA
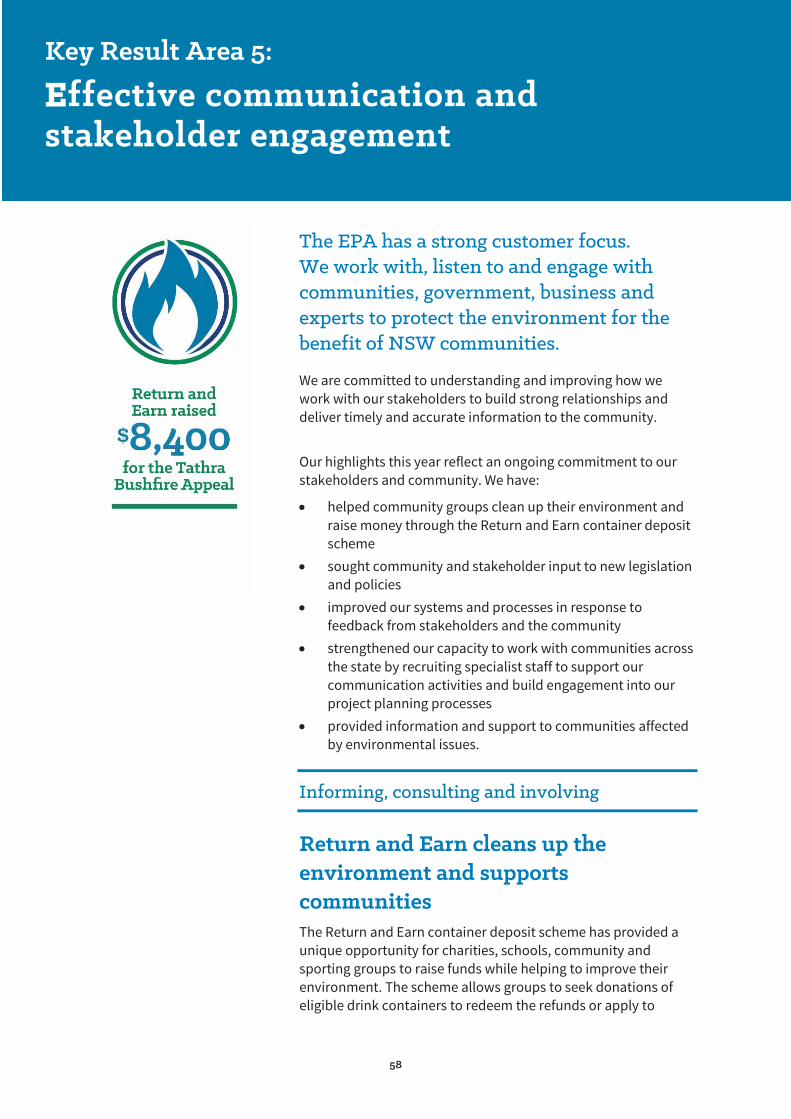
EPA Annual Report 2017–18
58
The EPA has a strong customer focus. We work with, listen to and engage with communities, government, business and experts to protect the environment for the benefit of NSW communities.
We are committed to understanding and improving how we work with our stakeholders to build strong relationships and deliver timely and accurate information to the community.
Our highlights this year reflect an ongoing commitment to our stakeholders and community. We have:
helped community groups clean up their environment and raise money through the Return and Earn container deposit scheme sought community and stakeholder input to new legislation and policies improved our systems and processes in response to feedback from stakeholders and the community strengthened our capacity to work with communities across the state by recruiting specialist staff to support our communication activities and build engagement into our project planning processes provided information and support to communities affected by environmental issues.
Informing, consulting and involving
Return and Earn cleans up the environment and supports communities The Return and Earn container deposit scheme has provided a unique opportunity for charities, schools, community and sporting groups to raise funds while helping to improve their environment. The scheme allows groups to seek donations of eligible drink containers to redeem the refunds or apply to
Key Result Area 5:
EEffective communication and stakeholder engagement
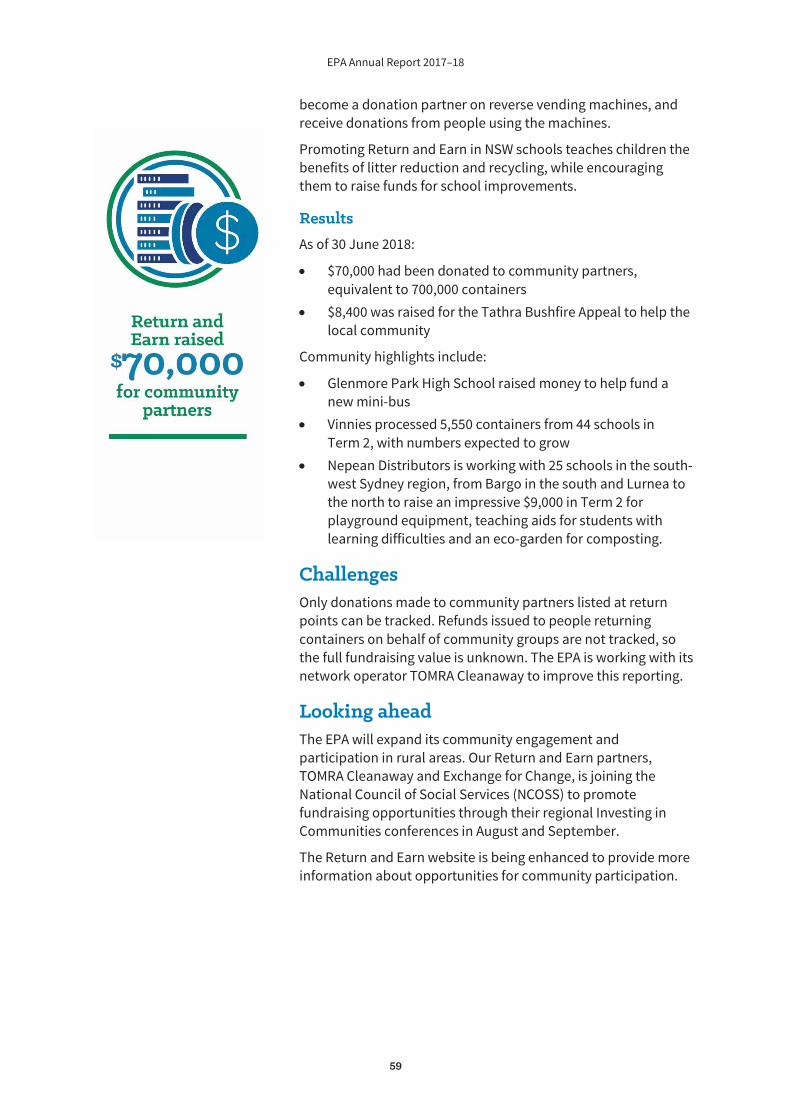
EPA Annual Report 2017–18
59
become a donation partner on reverse vending machines, and receive donations from people using the machines.
Promoting Return and Earn in NSW schools teaches children the benefits of litter reduction and recycling, while encouraging them to raise funds for school improvements.
Results As of 30 June 2018:
$70,000 had been donated to community partners, equivalent to 700,000 containers $8,400 was raised for the Tathra Bushfire Appeal to help the local community
Community highlights include:
Glenmore Park High School raised money to help fund a new mini-bus Vinnies processed 5,550 containers from 44 schools in Term 2, with numbers expected to grow Nepean Distributors is working with 25 schools in the south-west Sydney region, from Bargo in the south and Lurnea to the north to raise an impressive $9,000 in Term 2 for playground equipment, teaching aids for students with learning difficulties and an eco-garden for composting.
Challenges Only donations made to community partners listed at return points can be tracked. Refunds issued to people returning containers on behalf of community groups are not tracked, so the full fundraising value is unknown. The EPA is working with its network operator TOMRA Cleanaway to improve this reporting.
Looking ahead The EPA will expand its community engagement and participation in rural areas. Our Return and Earn partners, TOMRA Cleanaway and Exchange for Change, is joining the National Council of Social Services (NCOSS) to promote fundraising opportunities through their regional Investing in Communities conferences in August and September.
The Return and Earn website is being enhanced to provide more information about opportunities for community participation.
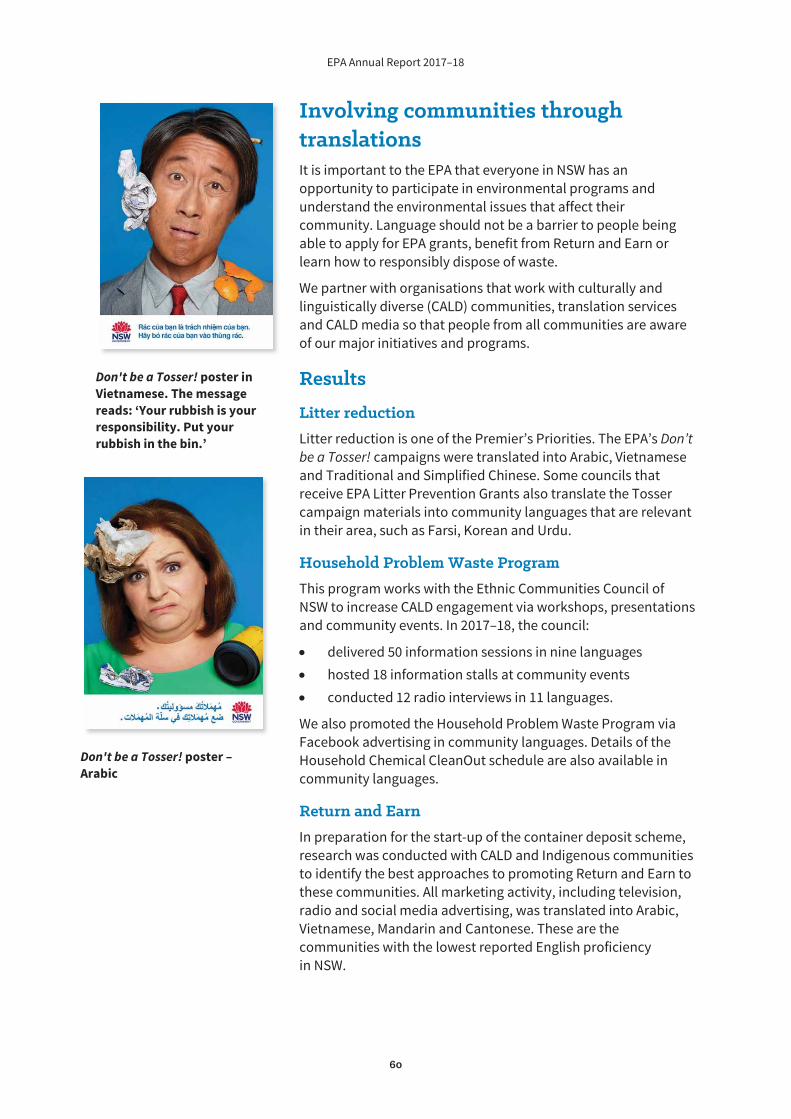
EPA Annual Report 2017–18
60
Involving communities through translations It is important to the EPA that everyone in NSW has an opportunity to participate in environmental programs and understand the environmental issues that affect their community. Language should not be a barrier to people being able to apply for EPA grants, benefit from Return and Earn or learn how to responsibly dispose of waste.
We partner with organisations that work with culturally and linguistically diverse (CALD) communities, translation services and CALD media so that people from all communities are aware of our major initiatives and programs.
Results
Litter reduction Litter reduction is one of the Premier’s Priorities. The EPA’s Don’t be a Tosser! campaigns were translated into Arabic, Vietnamese and Traditional and Simplified Chinese. Some councils that receive EPA Litter Prevention Grants also translate the Tosser campaign materials into community languages that are relevant in their area, such as Farsi, Korean and Urdu.
Household Problem Waste Program This program works with the Ethnic Communities Council of NSW to increase CALD engagement via workshops, presentations and community events. In 2017–18, the council:
delivered 50 information sessions in nine languages hosted 18 information stalls at community events conducted 12 radio interviews in 11 languages.
We also promoted the Household Problem Waste Program via Facebook advertising in community languages. Details of the Household Chemical CleanOut schedule are also available in community languages.
Return and Earn In preparation for the start-up of the container deposit scheme, research was conducted with CALD and Indigenous communities to identify the best approaches to promoting Return and Earn to these communities. All marketing activity, including television, radio and social media advertising, was translated into Arabic, Vietnamese, Mandarin and Cantonese. These are the communities with the lowest reported English proficiency in NSW.
Don't be a Tosser! poster in Vietnamese. The message reads: ‘Your rubbish is your responsibility. Put your rubbish in the bin.’
Don't be a Tosser! poster –Arabic
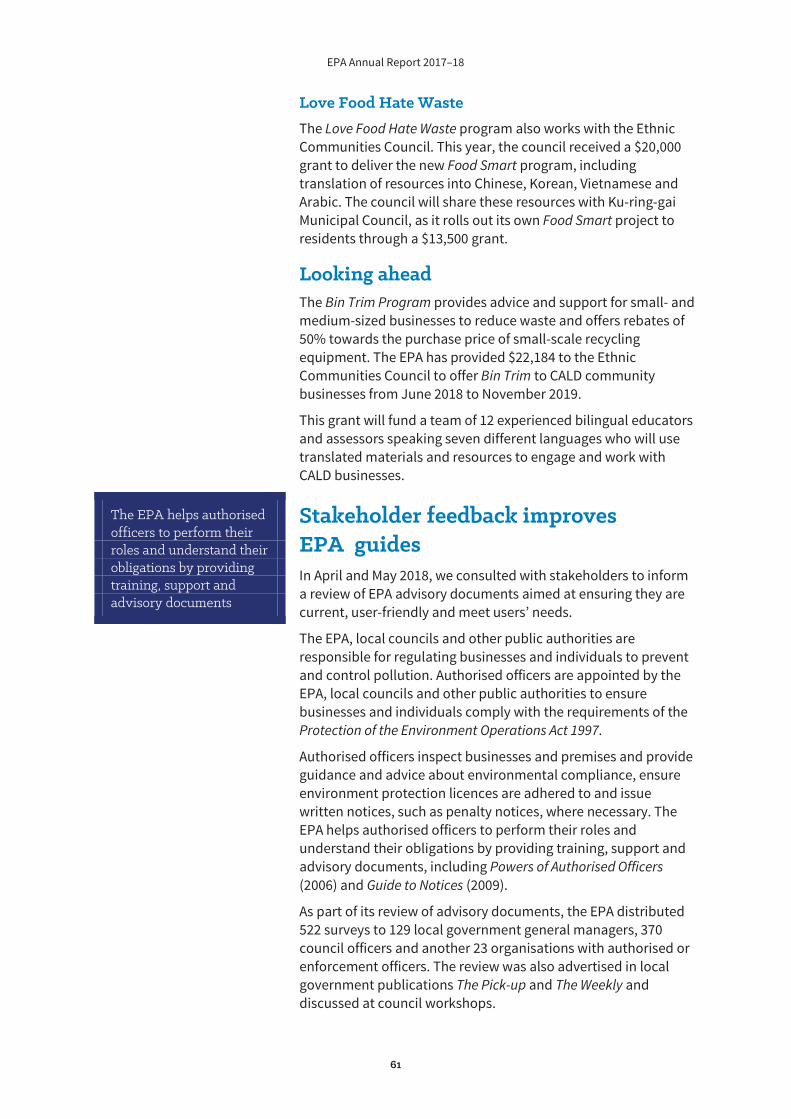
EPA Annual Report 2017–18
61
Love Food Hate Waste The Love Food Hate Waste program also works with the Ethnic Communities Council. This year, the council received a $20,000 grant to deliver the new Food Smart program, including translation of resources into Chinese, Korean, Vietnamese and Arabic. The council will share these resources with Ku-ring-gai Municipal Council, as it rolls out its own Food Smart project to residents through a $13,500 grant.
Looking ahead The Bin Trim Program provides advice and support for small- and medium-sized businesses to reduce waste and offers rebates of 50% towards the purchase price of small-scale recycling equipment. The EPA has provided $22,184 to the Ethnic Communities Council to offer Bin Trim to CALD community businesses from June 2018 to November 2019.
This grant will fund a team of 12 experienced bilingual educators and assessors speaking seven different languages who will use translated materials and resources to engage and work with CALD businesses.
Stakeholder feedback improves EPA guides In April and May 2018, we consulted with stakeholders to inform a review of EPA advisory documents aimed at ensuring they are current, user-friendly and meet users’ needs.
The EPA, local councils and other public authorities are responsible for regulating businesses and individuals to prevent and control pollution. Authorised officers are appointed by the EPA, local councils and other public authorities to ensure businesses and individuals comply with the requirements of the Protection of the Environment Operations Act 1997.
Authorised officers inspect businesses and premises and provide guidance and advice about environmental compliance, ensure environment protection licences are adhered to and issue written notices, such as penalty notices, where necessary. The EPA helps authorised officers to perform their roles and understand their obligations by providing training, support and advisory documents, including Powers of Authorised Officers (2006) and Guide to Notices (2009).
As part of its review of advisory documents, the EPA distributed 522 surveys to 129 local government general managers, 370 council officers and another 23 organisations with authorised or enforcement officers. The review was also advertised in local government publications The Pick-up and The Weekly and discussed at council workshops.
The EPA helps authorised officers to perform their roles and understand their obligations by providing training, support and advisory documents
EPA Annual Report 2017–18
62
Results Interest in the review of the advisory documents was high with a 24% response rate to the survey. Most respondents (93%) were local council officers.
Ease of use was a key issue raised, with 92% of respondents asking for templates for statutory notices and guidance to be made more readily available online.
One common request was that we include examples and case studies showing how authorised officers exercise their powers.
Looking ahead The EPA is combining the two key advisory documents into a single streamlined guide which will help authorised officers carry out their regulatory role. We are also considering other ways to better support authorised officers carry out their regulatory functions, including online options.
Community input into noise regulation Excessive noise is a concern for many people in NSW with prolonged exposure sometimes leading to anxiety and other health effects.
In mid-2017, we sought stakeholder and community input on a revision to the 2008 Noise Control Regulation and associated Regulatory Impact Statement, together with proposed approved methods for testing noise emissions.
Results The EPA received submissions from individuals, government agencies, councils, industry members and acoustic consultants.
The draft Regulation was updated to reflect feedback from the community consultation and was subsequently issued as the Protection of the Environment Operations (Noise Control) Regulation 2017.
Updates to the Regulation included provisions to improve management of noise from:
motor vehicles – the use of various accessories and devices such as horns and alarms marine vessels – offensive noise from musical instruments or sound systems on vessels noisy items, such as gardening equipment, tools and musical instruments shooting ranges.
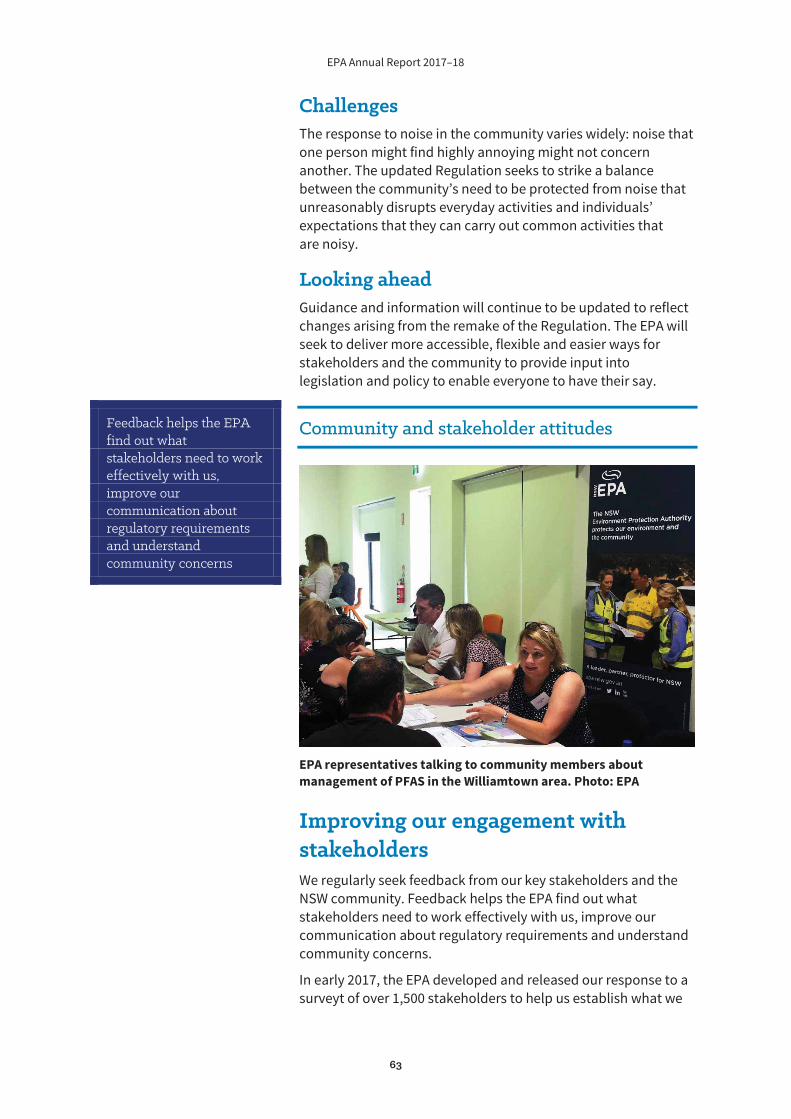
EPA Annual Report 2017–18
63
Challenges The response to noise in the community varies widely: noise that one person might find highly annoying might not concern another. The updated Regulation seeks to strike a balance between the community’s need to be protected from noise that unreasonably disrupts everyday activities and individuals’ expectations that they can carry out common activities that are noisy.
Looking ahead Guidance and information will continue to be updated to reflect changes arising from the remake of the Regulation. The EPA will seek to deliver more accessible, flexible and easier ways for stakeholders and the community to provide input into legislation and policy to enable everyone to have their say.
Community and stakeholder attitudes
EPA representatives talking to community members about management of PFAS in the Williamtown area. Photo: EPA
Improving our engagement with stakeholders We regularly seek feedback from our key stakeholders and the NSW community. Feedback helps the EPA find out what stakeholders need to work effectively with us, improve our communication about regulatory requirements and understand community concerns.
In early 2017, the EPA developed and released our response to a surveyt of over 1,500 stakeholders to help us establish what we
Feedback helps the EPA find out what stakeholders need to work effectively with us, improve our communication about regulatory requirements and understand community concerns
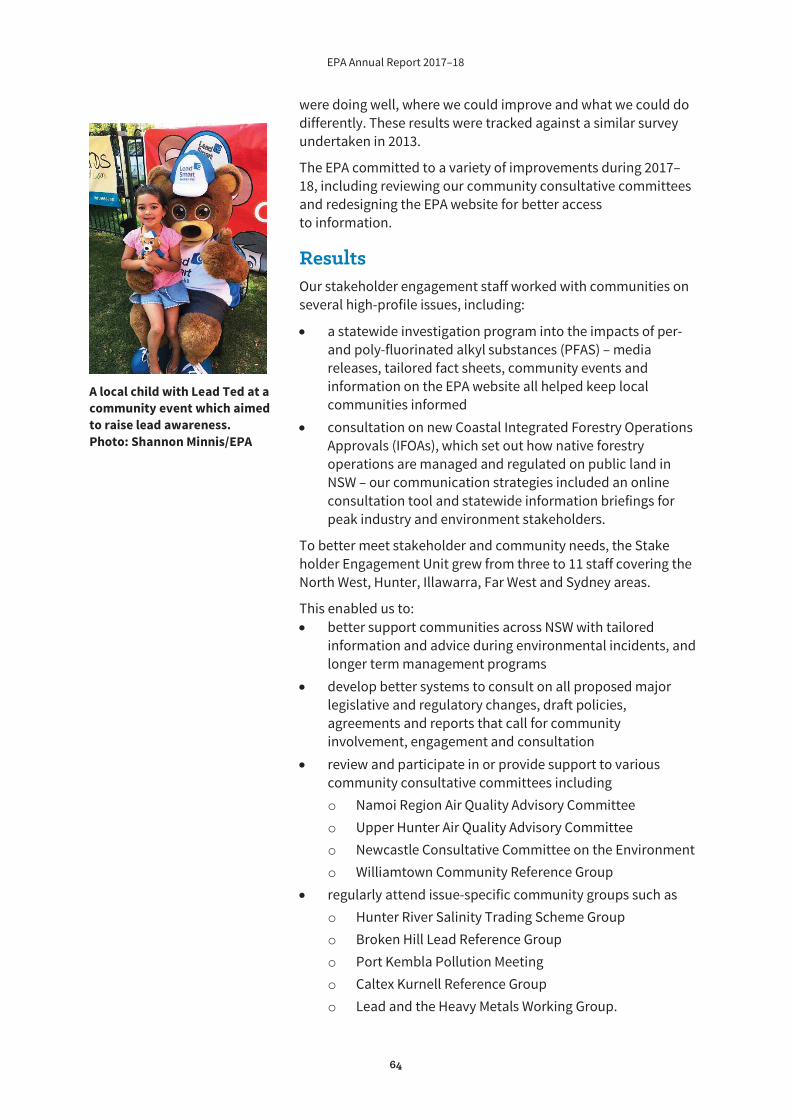
EPA Annual Report 2017–18
64
were doing well, where we could improve and what we could do differently. These results were tracked against a similar survey undertaken in 2013.
The EPA committed to a variety of improvements during 2017–18, including reviewing our community consultative committees and redesigning the EPA website for better access to information.
Results Our stakeholder engagement staff worked with communities on several high-profile issues, including:
a statewide investigation program into the impacts of per- and poly-fluorinated alkyl substances (PFAS) – media releases, tailored fact sheets, community events and information on the EPA website all helped keep local communities informed consultation on new Coastal Integrated Forestry Operations Approvals (IFOAs), which set out how native forestry operations are managed and regulated on public land in NSW – our communication strategies included an online consultation tool and statewide information briefings for peak industry and environment stakeholders.
To better meet stakeholder and community needs, the Stake holder Engagement Unit grew from three to 11 staff covering the North West, Hunter, Illawarra, Far West and Sydney areas.
This enabled us to: better support communities across NSW with tailored information and advice during environmental incidents, and longer term management programs develop better systems to consult on all proposed major legislative and regulatory changes, draft policies, agreements and reports that call for community involvement, engagement and consultation review and participate in or provide support to various community consultative committees including o Namoi Region Air Quality Advisory Committee o Upper Hunter Air Quality Advisory Committee o Newcastle Consultative Committee on the Environment o Williamtown Community Reference Group regularly attend issue-specific community groups such as o Hunter River Salinity Trading Scheme Group o Broken Hill Lead Reference Group o Port Kembla Pollution Meeting o Caltex Kurnell Reference Group o Lead and the Heavy Metals Working Group.
A local child with Lead Ted at a community event which aimed to raise lead awareness. Photo: Shannon Minnis/EPA

EPA Annual Report 2017–18
65
Challenges The community’s wellbeing is front and centre of all the EPA’s actions. During an environmental incident, the EPA works hard to provide timely, relevant and up-to-date information. However this can mean that projects with longer timeframes are sometimes paused so we can address immediate needs.
Looking ahead The EPA will continue to enhance its stakeholder engagement capability and customer service experience in line with Premier’s Priority 12. We are committed to improving our engagement processes through our online platform.
We will continue to develop tools to help our staff to better inform, consult and involve all stakeholders in all areas of our work.
Better Homes and Gardens host Graham Ross with EPA staff at our stall at the Sydney Home Show highlighting lead safety during home renovations. Photo courtesy: Ogilvie PR
Customer service
Responding promptly to inquiries The EPA responds to correspondence both from the public and on behalf of the Government and the Minister for the Environment. Responding quickly is a key focus of Premier’s Priority 12 and an important attribute identified in EPA stakeholder surveys.
In 2017–18, the EPA received 1,615 public correspondence and 1,672 items of parliamentary correspondence. Most correspondence was referred to the Waste and Resource
EPA Annual Report 2017–18
66
Recovery Branch (34%) and Container Deposit Scheme Branch (10%).
The EPA Environment Line is another avenue for the public to provide feedback and report pollution. It is open 24 hours/7 days a week, and received over 7000 reports of pollution for the EPA in 2017–18.
Results The EPA met a key performance measure for customer service this year, with 95% of general correspondence responded to within the target time of four weeks. This was an improvement of 1% on 2016–17.
Our response rates to parliamentary correspondence (80% responded to within two weeks) decreased by 7% from the previous year.
This slower response rate was due to the extremely high levels of correspondence relating to the new container deposit scheme, Return and Earn. Items of correspondence increased by over 70%, compared to 2016–17. Rates were especially high around the time of the scheme’s December 2017 launch, with 252 items logged over a short period.
Other achievements
This year we maintained our strong relationships with the media and continued to grow our online audience:
we responded to almost 840 requests for information and interviews from journalists more than 230 media releases were issued EPA tweets reached 841,900 Twitter users over 1.4 million visitors to the EPA website resulted in 4.7 million page views our 24/7 Environment Line took over 7000 calls.
Looking ahead The EPA will continue to improve customer satisfaction and enhance the services we offer. During 2018–19, we will commence a customer journey mapping project to develop a better understanding of the customer experience and improve the quality of that experience for people calling our Environment Line.
EPA Annual Report 2017–18
67
The EPA aims to lead by example. We work ethically and sustainably and are committed to continuous improvement. We encourage innovation and base our decisions and programs on strong evidence and detailed research.
EPA staff are highly capable and passionate about the work we do. We support our staff by encouraging an inclusive culture, listening to what they say and providing high quality training and development oportunities.
We pride ourselves on being a high-performing organisation. See other sections of this report for details of our achievements in governance, human resources and legal services.
Key achievements this year included:
leadership of the national Australasian Environmental Law Enforcement and Regulators neTwork (AELERT) conference for environmental regulators launching an inclusion and diversity subcommittee providing regulatory training to hundreds of operations officers across Australia reducing waste in our offices through staff-led and supported initiatives.
Employee engagement
Our people care Each year the EPA uses the NSW Public Sector People Matter Employee Survey to improve communication and engagement throughout the organisation. The survey provides an opportunity for around 400,000 public sector employees to give feedback on their experiences and perceptions of their workplace culture and operations.
This year the EPA had a strong response rate, with 92% of staff taking part. This is slightly higher than for the public sector
Key Result Area 6:
EExemplary and innovative organisation
EPA Annual Report 2017–18
68
overall and provides a good basis for understanding staff views and experiences across the organisation.
Results Overall the survey showed high levels of staff satisfaction, with:
an aggregate score of 70% for questions related to employee engagement (also a little higher than the public-sector average) 87% agreeing that their work group strives to achieve customer/client satisfaction 85% reporting that they receive help and support from other members of their work group.
See also Section 5: Our people matter (page 98) for more details about staff satisfaction. Areas that were most improved since last year include:
71% of staff agreeing that senior managers communicate the importance of customer/client satisfaction in achieving business objectives 77%were satisfied with their ability to access and use flexible working arrangements.
The survey identified that change management is an important area where the EPA can make improvements.
Looking ahead Each year we use the survey feedback to improve our communication and engagement throughout the organisation.
Over the next few months the Senior Management Group (SMG) will work with staff to identify how we can maintain our successes and deepen our understanding of challenges and other potential areas for improvement. This consultation will help inform the development and implementation of a People Matter Employee Survey Action Plan for the EPA.
Workplace diversity
Supporting inclusion and diversity It is important to the EPA that all our staff feel safe, encouraged and supported in their work. To support this important goal, we launched the Diversity Committee in November 2017.
The committee is a formal subcommittee of the EPA Executive that reflects the diversity of the wider community. Members include staff who are keen to increase the EPA’s diversity and representatives from other staff-led networks across the Planning and Environment Cluster, such as the Spokeswoman’s
Each year we use the People Matter survey feedback to improve our communication and engagement throughout the organisation
EPA Annual Report 2017–18
69
Program and Rainbow Connections (see Section 5: Our people – page 100).
This collective experience enables the committee to work with colleagues from across the public sector to increase diversity and inclusion and cultivate greater staff awareness of the importance of inclusion and diversity at work.
Results The committee organised three successful events attended by between 80 and 100 staff either online or in person:
the official launch event, with a panel discussion on ‘Diversity and inclusion in action’ featuring Disability Discrimination Commissioner Alastair McEwin, Climate Change Academic Dr Angela Maharaj and the ABC’s Head of Operations and ACON Board Member Manda Hatter a Harmony Day event with Race Discrimination Commissioner Dr Tim Soutphommasane as keynote speaker a panel discussion about age-discrimination in the workplace at the EPA’s Queanbeyan office in June 2018 with speakers including Amanda Crammon (NSW Department of Industry) Andreas Stricker (EPA) and Anne Martin (Australian National University).
EPA staff participated in a national survey by the Diversity Council of Australia’s Inclusion@YourWork Index to assess the diversity and inclusiveness of workplaces in the public and private sectors. Approximately 30% of the EPA’s staff (174) responded to the survey with:
62% agreeing they felt comfortable to be themselves, slightly above the public sector average (57%) 12.5% saying they had experienced discrimination in the previous 12 months 8.5% reporting experiencing harassment in the previous 12 months.
These results will help the committee develop benchmarks and prioritise the EPA’s diversity and inclusion initiatives.
Diversity and inclusion are complex issues that can mean different things to different people at different times throughout their careers. The committee developed a Diversity Statement which sets out what inclusion and diversity means at the EPA in 2018.
Looking ahead The committee is working to develop the first EPA Inclusion and Diversity Strategy by the end of 2018.
EEPA Diversity Statement The EPA is committed to ensuring that all our staff feel safe, encouraged and supported in their work and recognises the need to address and achieve diversity and inclusion. We know that diversity creates more acceptance, respect and understanding of differences, reducing fear and ignorance with consequential benefits as people feel free to be themselves and reach their potential. The EPA aims to create more cohesion between our colleagues, partners and community, leading to better outcomes for all.
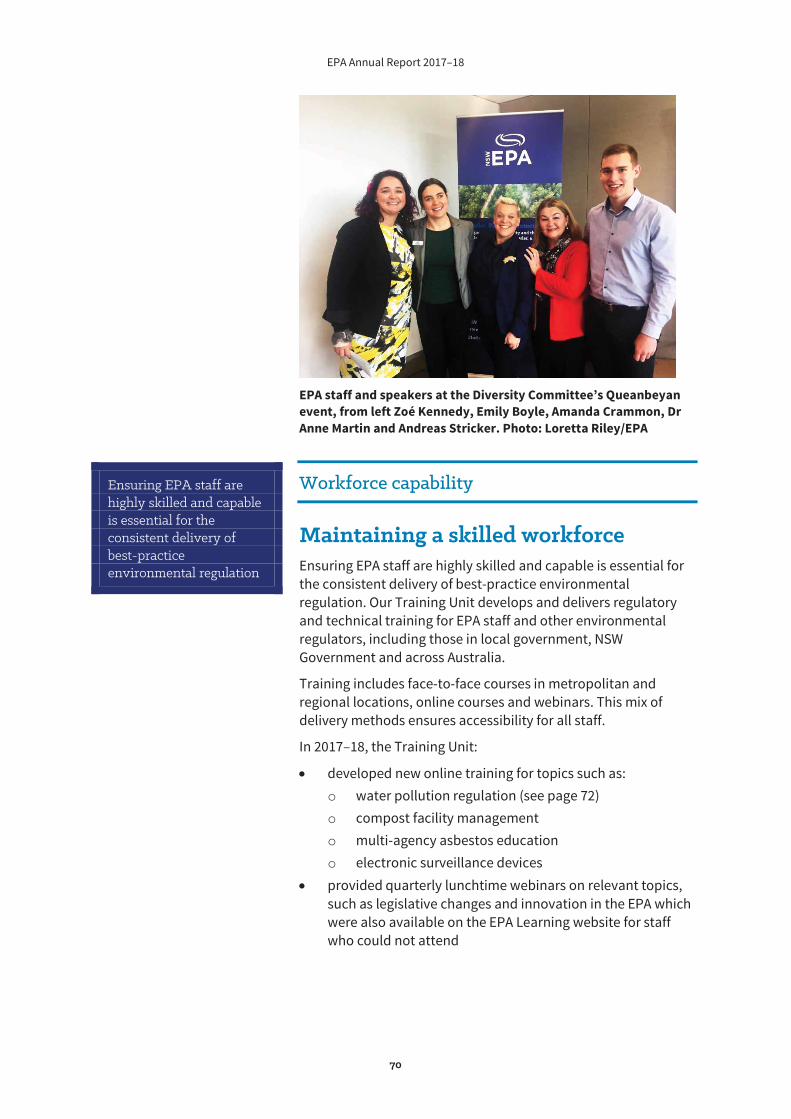
EPA Annual Report 2017–18
70
EPA staff and speakers at the Diversity Committee’s Queanbeyan event, from left Zoé Kennedy, Emily Boyle, Amanda Crammon, Dr Anne Martin and Andreas Stricker. Photo: Loretta Riley/EPA
Workforce capability
Maintaining a skilled workforce Ensuring EPA staff are highly skilled and capable is essential for the consistent delivery of best-practice environmental regulation. Our Training Unit develops and delivers regulatory and technical training for EPA staff and other environmental regulators, including those in local government, NSW Government and across Australia.
Training includes face-to-face courses in metropolitan and regional locations, online courses and webinars. This mix of delivery methods ensures accessibility for all staff.
In 2017–18, the Training Unit:
developed new online training for topics such as: o water pollution regulation (see page 72) o compost facility management o multi-agency asbestos education o electronic surveillance devices provided quarterly lunchtime webinars on relevant topics, such as legislative changes and innovation in the EPA which were also available on the EPA Learning website for staff who could not attend
Ensuring EPA staff are highly skilled and capable is essential for the consistent delivery of best-practice environmental regulation
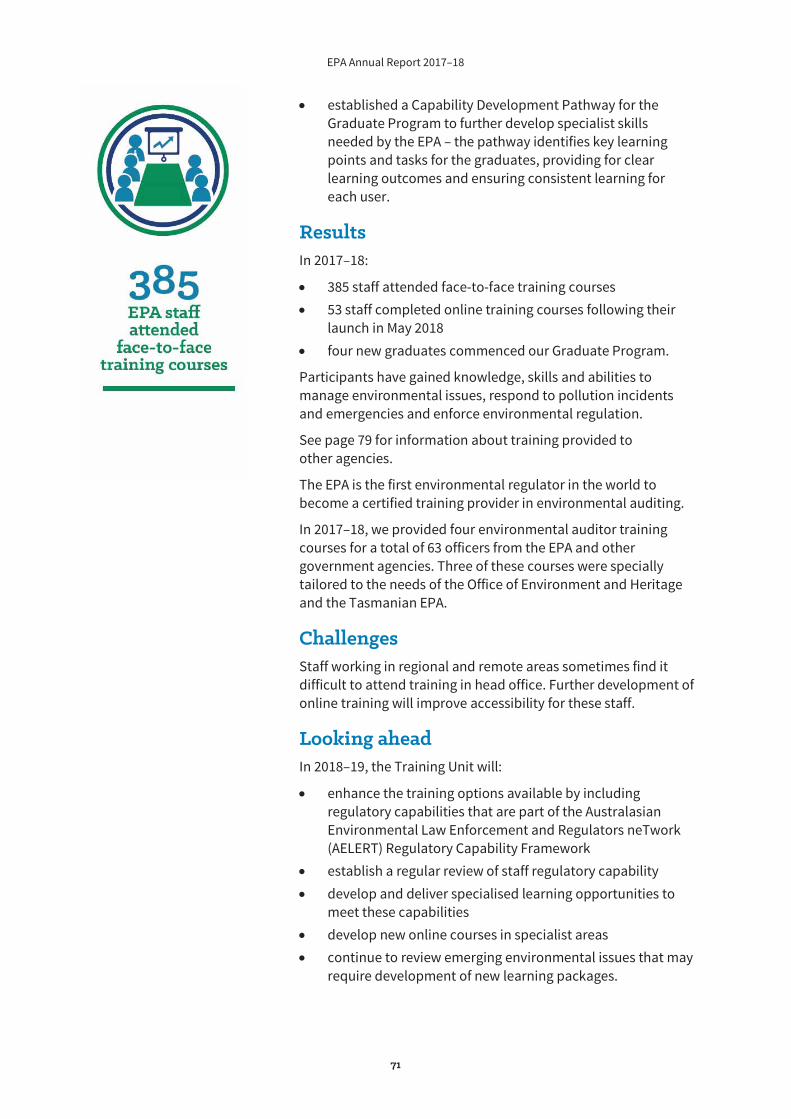
EPA Annual Report 2017–18
71
established a Capability Development Pathway for the Graduate Program to further develop specialist skills needed by the EPA – the pathway identifies key learning points and tasks for the graduates, providing for clear learning outcomes and ensuring consistent learning for each user.
Results In 2017–18:
385 staff attended face-to-face training courses 53 staff completed online training courses following their launch in May 2018 four new graduates commenced our Graduate Program.
Participants have gained knowledge, skills and abilities to manage environmental issues, respond to pollution incidents and emergencies and enforce environmental regulation.
See page 79 for information about training provided to other agencies.
The EPA is the first environmental regulator in the world to become a certified training provider in environmental auditing.
In 2017–18, we provided four environmental auditor training courses for a total of 63 officers from the EPA and other government agencies. Three of these courses were specially tailored to the needs of the Office of Environment and Heritage and the Tasmanian EPA.
Challenges Staff working in regional and remote areas sometimes find it difficult to attend training in head office. Further development of online training will improve accessibility for these staff.
Looking ahead In 2018–19, the Training Unit will:
enhance the training options available by including regulatory capabilities that are part of the Australasian Environmental Law Enforcement and Regulators neTwork (AELERT) Regulatory Capability Framework establish a regular review of staff regulatory capability develop and deliver specialised learning opportunities to meet these capabilities develop new online courses in specialist areas continue to review emerging environmental issues that may require development of new learning packages.
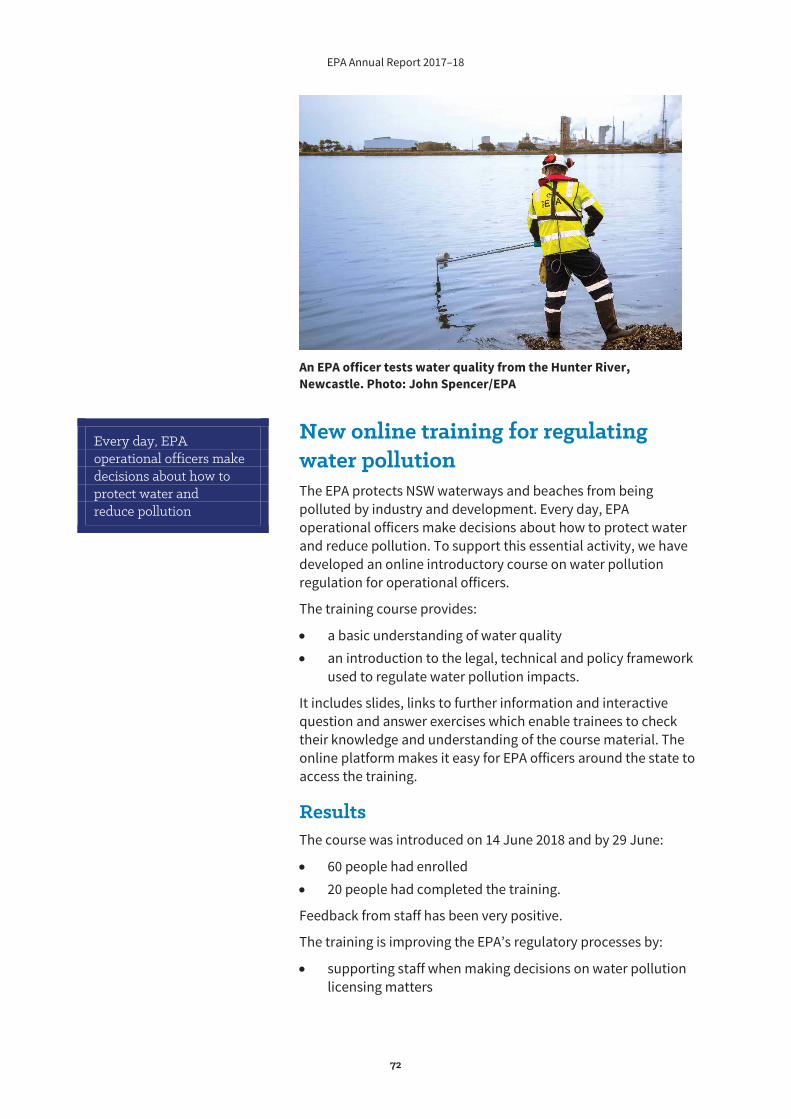
EPA Annual Report 2017–18
72
An EPA officer tests water quality from the Hunter River, Newcastle. Photo: John Spencer/EPA
New online training for regulating water pollution The EPA protects NSW waterways and beaches from being polluted by industry and development. Every day, EPA operational officers make decisions about how to protect water and reduce pollution. To support this essential activity, we have developed an online introductory course on water pollution regulation for operational officers.
The training course provides:
a basic understanding of water quality an introduction to the legal, technical and policy framework used to regulate water pollution impacts.
It includes slides, links to further information and interactive question and answer exercises which enable trainees to check their knowledge and understanding of the course material. The online platform makes it easy for EPA officers around the state to access the training.
Results The course was introduced on 14 June 2018 and by 29 June:
60 people had enrolled 20 people had completed the training.
Feedback from staff has been very positive.
The training is improving the EPA’s regulatory processes by:
supporting staff when making decisions on water pollution licensing matters
Every day, EPA operational officers make decisions about how to protect water and reduce pollution
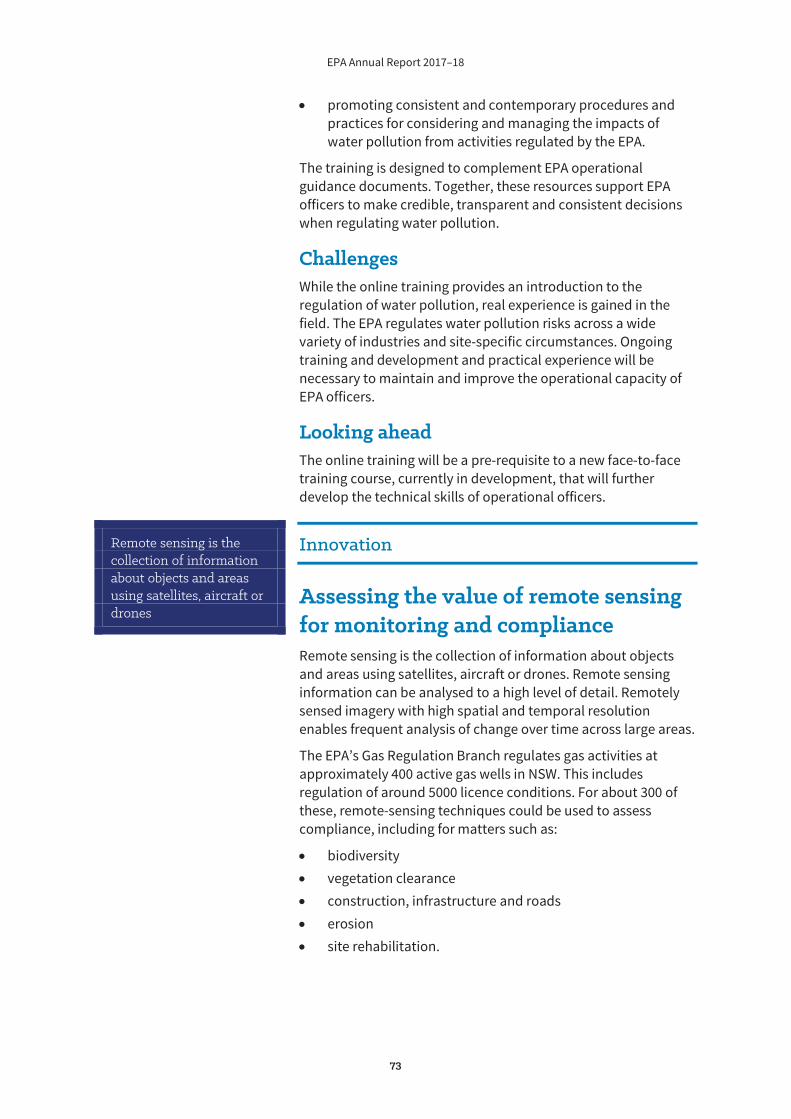
EPA Annual Report 2017–18
73
promoting consistent and contemporary procedures and practices for considering and managing the impacts of water pollution from activities regulated by the EPA.
The training is designed to complement EPA operational guidance documents. Together, these resources support EPA officers to make credible, transparent and consistent decisions when regulating water pollution.
Challenges While the online training provides an introduction to the regulation of water pollution, real experience is gained in the field. The EPA regulates water pollution risks across a wide variety of industries and site-specific circumstances. Ongoing training and development and practical experience will be necessary to maintain and improve the operational capacity of EPA officers.
Looking ahead The online training will be a pre-requisite to a new face-to-face training course, currently in development, that will further develop the technical skills of operational officers.
Innovation
Assessing the value of remote sensing for monitoring and compliance Remote sensing is the collection of information about objects and areas using satellites, aircraft or drones. Remote sensing information can be analysed to a high level of detail. Remotely sensed imagery with high spatial and temporal resolution enables frequent analysis of change over time across large areas.
The EPA’s Gas Regulation Branch regulates gas activities at approximately 400 active gas wells in NSW. This includes regulation of around 5000 licence conditions. For about 300 of these, remote-sensing techniques could be used to assess compliance, including for matters such as:
biodiversity vegetation clearance construction, infrastructure and roads erosion site rehabilitation.
Remote sensing is the collection of information about objects and areas using satellites, aircraft or drones
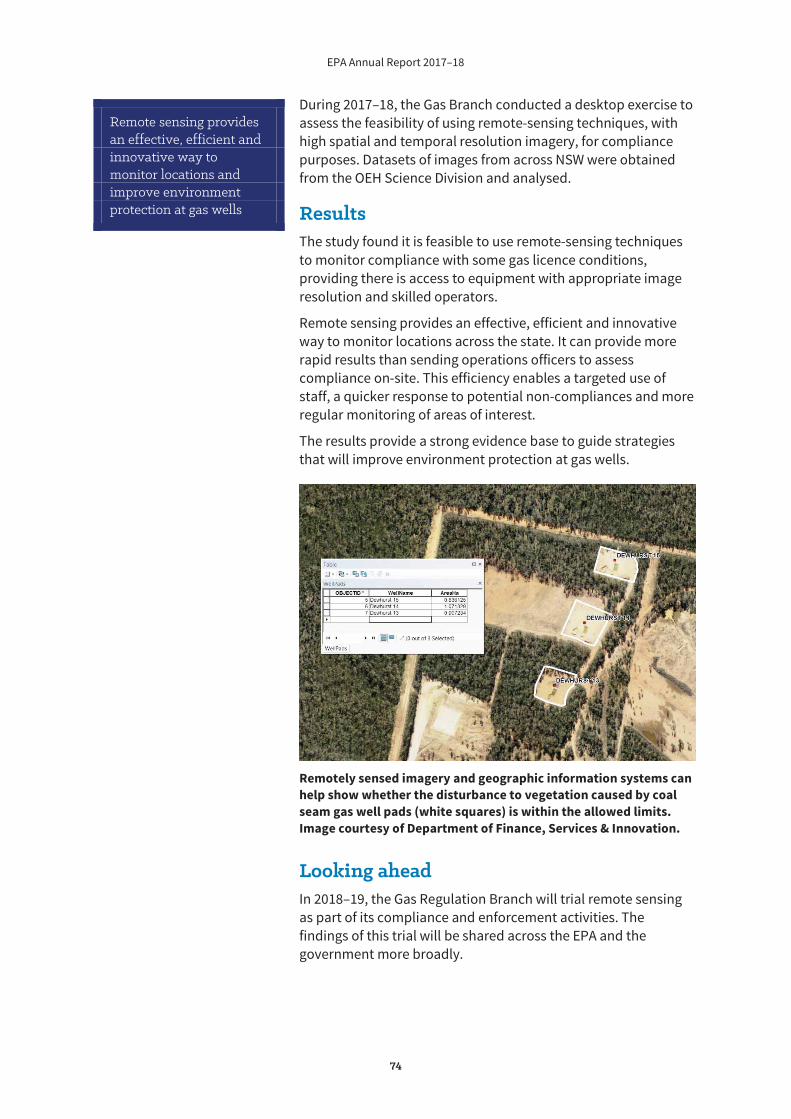
EPA Annual Report 2017–18
74
During 2017–18, the Gas Branch conducted a desktop exercise to assess the feasibility of using remote-sensing techniques, with high spatial and temporal resolution imagery, for compliance purposes. Datasets of images from across NSW were obtained from the OEH Science Division and analysed.
Results The study found it is feasible to use remote-sensing techniques to monitor compliance with some gas licence conditions, providing there is access to equipment with appropriate image resolution and skilled operators.
Remote sensing provides an effective, efficient and innovative way to monitor locations across the state. It can provide more rapid results than sending operations officers to assess compliance on-site. This efficiency enables a targeted use of staff, a quicker response to potential non-compliances and more regular monitoring of areas of interest.
The results provide a strong evidence base to guide strategies that will improve environment protection at gas wells.
Remotely sensed imagery and geographic information systems can help show whether the disturbance to vegetation caused by coal seam gas well pads (white squares) is within the allowed limits. Image courtesy of Department of Finance, Services & Innovation.
Looking ahead In 2018–19, the Gas Regulation Branch will trial remote sensing as part of its compliance and enforcement activities. The findings of this trial will be shared across the EPA and the government more broadly.
Remote sensing provides an effective, efficient and innovative way to monitor locations and improve environment protection at gas wells
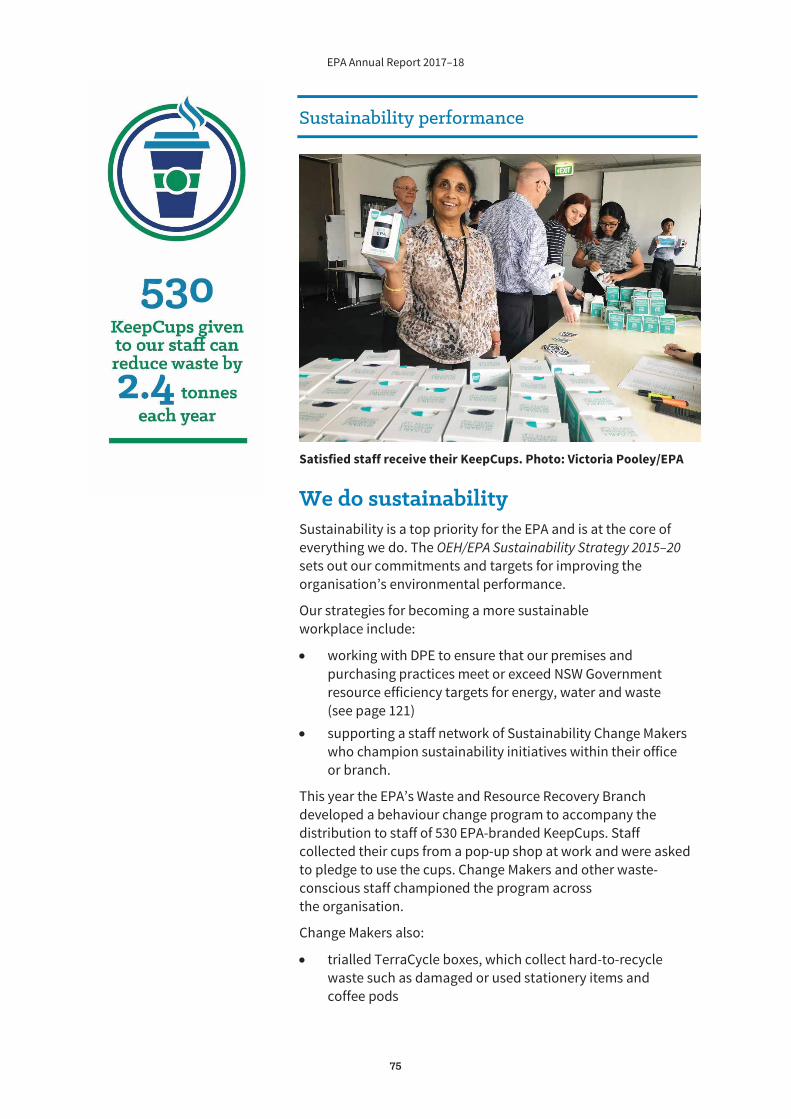
EPA Annual Report 2017–18
75
Sustainability performance
Satisfied staff receive their KeepCups. Photo: Victoria Pooley/EPA
We do sustainability Sustainability is a top priority for the EPA and is at the core of everything we do. The OEH/EPA Sustainability Strategy 2015–20 sets out our commitments and targets for improving the organisation’s environmental performance.
Our strategies for becoming a more sustainable workplace include:
working with DPE to ensure that our premises and purchasing practices meet or exceed NSW Government resource efficiency targets for energy, water and waste (see page 121) supporting a staff network of Sustainability Change Makers who champion sustainability initiatives within their office or branch.
This year the EPA’s Waste and Resource Recovery Branch developed a behaviour change program to accompany the distribution to staff of 530 EPA-branded KeepCups. Staff collected their cups from a pop-up shop at work and were asked to pledge to use the cups. Change Makers and other waste-conscious staff championed the program across the organisation.
Change Makers also:
trialled TerraCycle boxes, which collect hard-to-recycle waste such as damaged or used stationery items and coffee pods
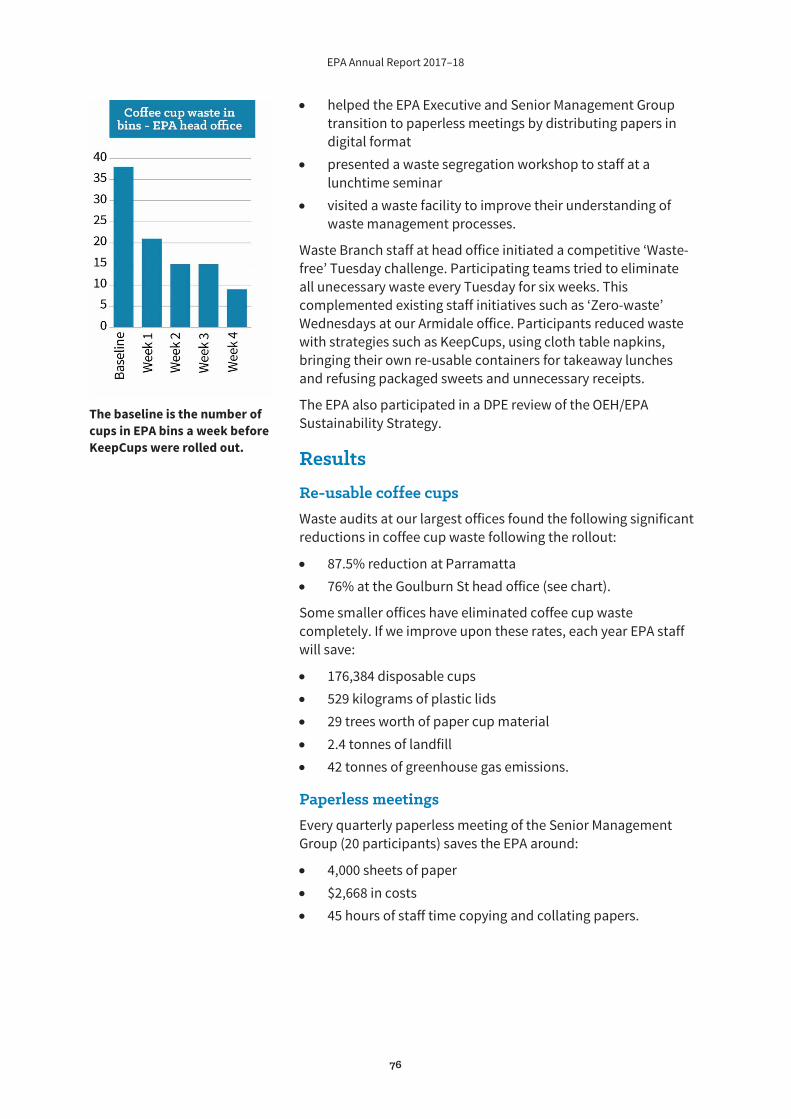
EPA Annual Report 2017–18
76
helped the EPA Executive and Senior Management Group transition to paperless meetings by distributing papers in digital format presented a waste segregation workshop to staff at a lunchtime seminar visited a waste facility to improve their understanding of waste management processes.
Waste Branch staff at head office initiated a competitive ‘Waste-free’ Tuesday challenge. Participating teams tried to eliminate all unecessary waste every Tuesday for six weeks. This complemented existing staff initiatives such as ‘Zero-waste’ Wednesdays at our Armidale office. Participants reduced waste with strategies such as KeepCups, using cloth table napkins, bringing their own re-usable containers for takeaway lunches and refusing packaged sweets and unnecessary receipts.
The EPA also participated in a DPE review of the OEH/EPA Sustainability Strategy.
Results
Re-usable coffee cups Waste audits at our largest offices found the following significant reductions in coffee cup waste following the rollout:
87.5% reduction at Parramatta 76% at the Goulburn St head office (see chart).
Some smaller offices have eliminated coffee cup waste completely. If we improve upon these rates, each year EPA staff will save:
176,384 disposable cups 529 kilograms of plastic lids 29 trees worth of paper cup material 2.4 tonnes of landfill 42 tonnes of greenhouse gas emissions.
Paperless meetings Every quarterly paperless meeting of the Senior Management Group (20 participants) saves the EPA around:
4,000 sheets of paper $2,668 in costs 45 hours of staff time copying and collating papers.
The baseline is the number of cups in EPA bins a week before KeepCups were rolled out.
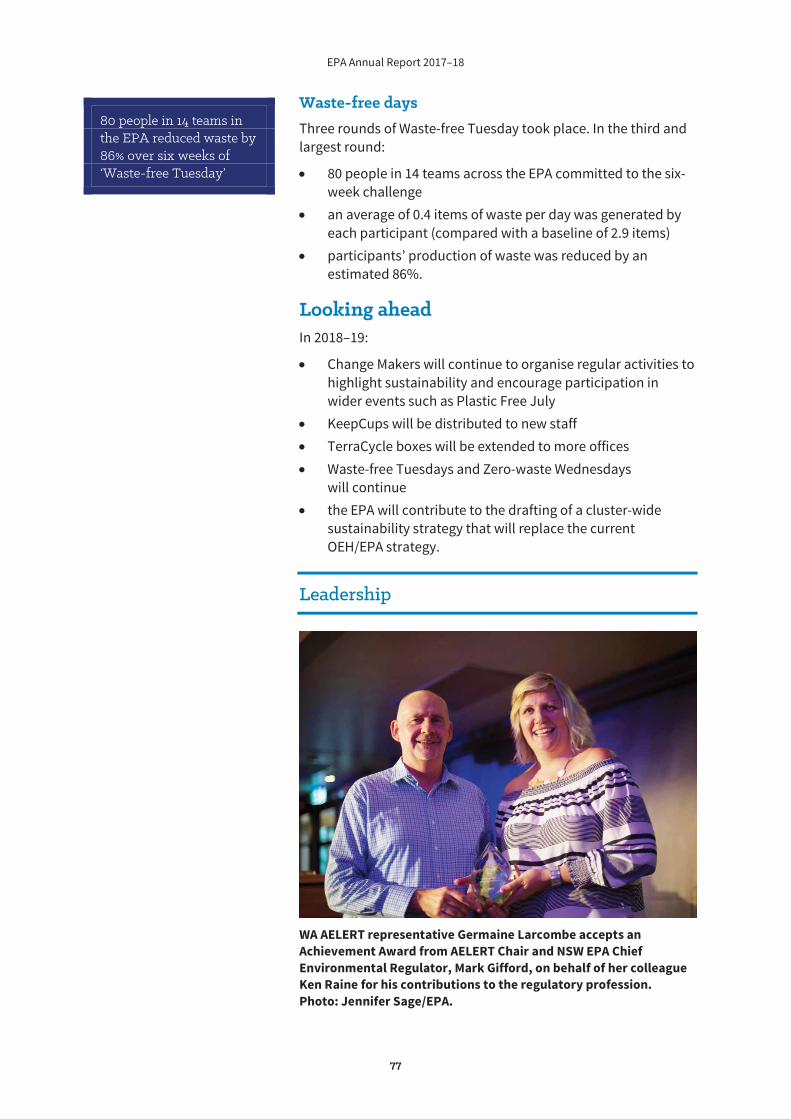
EPA Annual Report 2017–18
77
Waste-free days Three rounds of Waste-free Tuesday took place. In the third and largest round:
80 people in 14 teams across the EPA committed to the six-week challenge an average of 0.4 items of waste per day was generated by each participant (compared with a baseline of 2.9 items) participants’ production of waste was reduced by an estimated 86%.
Looking ahead In 2018–19:
Change Makers will continue to organise regular activities to highlight sustainability and encourage participation in wider events such as Plastic Free July KeepCups will be distributed to new staff TerraCycle boxes will be extended to more offices Waste-free Tuesdays and Zero-waste Wednesdays will continue the EPA will contribute to the drafting of a cluster-wide sustainability strategy that will replace the current OEH/EPA strategy.
Leadership
WA AELERT representative Germaine Larcombe accepts an Achievement Award from AELERT Chair and NSW EPA Chief Environmental Regulator, Mark Gifford, on behalf of her colleague Ken Raine for his contributions to the regulatory profession. Photo: Jennifer Sage/EPA.
80 people in 14 teams in the EPA reduced waste by 86% over six weeks of ‘Waste-free Tuesday’
EPA Annual Report 2017–18
78
Leading the AELERT network The Australasian Environmental Law Enforcement and Regulators neTwork (AELERT) is a well-respected and internationally recognised professional network for environmental regulators across Australasia. AELERT members work in local, State and Commonwealth Government agencies to implement and administer environmental legislation.
The EPA currently has a lead role in AELERT, with Chief Environmental Regulator Mark Gifford chairing the body since September 2017. Two secretariat staff who support the AELERT Steering Committee are based in Mark’s team. Their role includes establishing and supporting AELERT working clusters and communities of practice with practitioners from various agencies and regions to undertake collaborative work on regulatory issues of mutual interest.
The Secretariat team led the organisation of the 2018 AELERT Conference hosted in Sydney on 14–16 February. The conference provided an opportunity for environmental law practitioners and regulators to come together and share their experiences, knowledge and expertise.
Results The 2018 AELERT Conference was a huge success. The conference theme – Is Being Right Enough? – stimulated many productive conversations about regulation, compliance and enforcement, and regulatory practice.
265 delegates attended over three days 89% of post-conference survey participants agreed the conference either met, bettered or exceeded their expectations 90% of survey participants left the conference with a new insight, connection or resource to support their work.
Looking ahead In 2018–19, the Chair and Secretariat team aim to increase engagement with AELERT and encourage new memberships by:
visiting each jurisdiction to work with AELERT leaders on their needs, wants, challenges and knowledge reaching out to regional jurisdictions to offer support on environmental regulation, compliance and enforcement activities, skills and knowledge hosting several local and web-based knowledge-sharing and collaboration events.
EPA Annual Report 2017–18
79
Building regulatory capability across Australia The EPA contributes to consistent best practice environmental regulation across Australia by providing high quality learning and development opportunities for staff from other regulatory agencies. This ensures that environmental regulators around the country are equipped to deal with the complex issues they face on a daily basis.
In 2017–18, the EPA Training Unit:
managed the nationwide AELERT Professional Development and Training Program played an integral role in the development and launch of the AELERT Regulatory Officer Capability Framework which captures the core capabilities and skill sets required of regulatory officers from new starters through to managers and executives in regulatory agencies linked to accessible training opportunities with other regulators, such as the Department of Primary Industries online biosecurity legislation training modules developed stronger partnerships with co-regulators and local government though training and stakeholder engagement programs, such as sponsorship and facilitation of workshops at the NSW Local Government Rangers Conference delivered regulatory training to local, state and territory agencies with courses on: o the POEO Act o drafting statutory instruments o checking briefs of evidence.
Results In 2017–18, the EPA delivered 60 courses to over 725 participants, including EPA staff and people from other regulatory agencies.
Looking ahead In 2018–19, the EPA will:
continue to develop and tailor training packages related to emerging environmental issues develop more online learning opportunities to increase training accessibility continue to build and manage networking, information sharing and partnership opportunities.
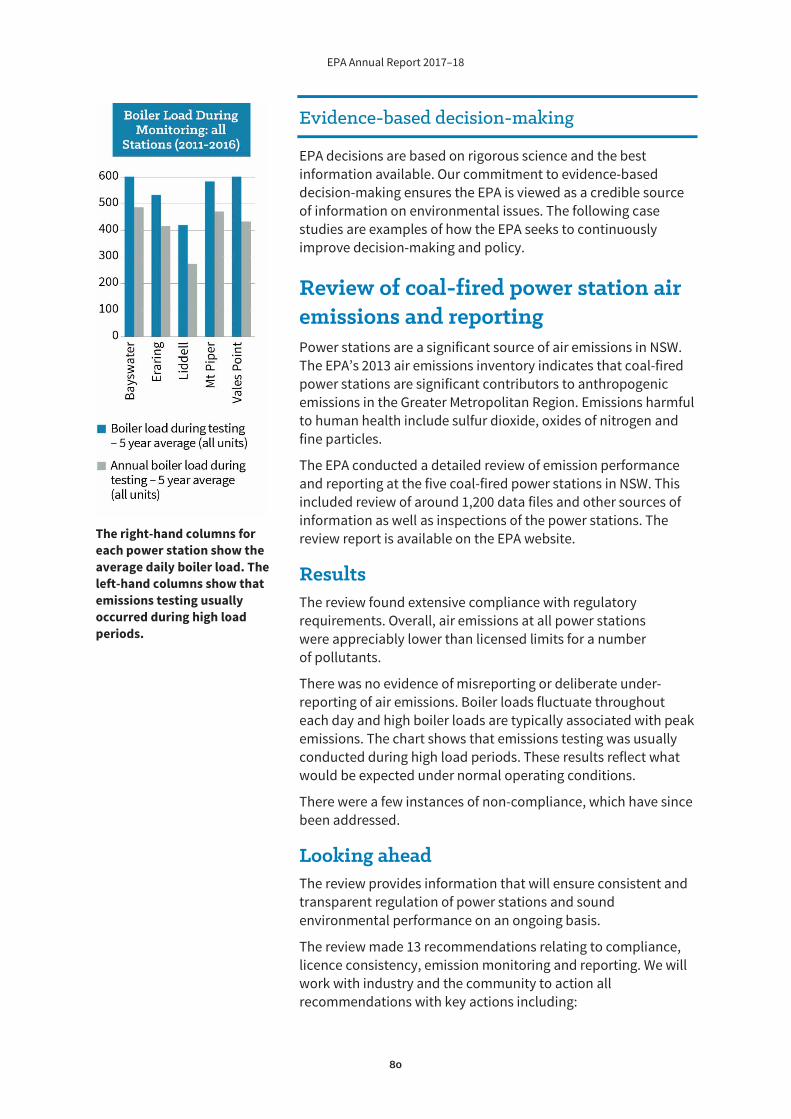
EPA Annual Report 2017–18
80
Evidence-based decision-making
EPA decisions are based on rigorous science and the best information available. Our commitment to evidence-based decision-making ensures the EPA is viewed as a credible source of information on environmental issues. The following case studies are examples of how the EPA seeks to continuously improve decision-making and policy.
Review of coal-fired power station air emissions and reporting Power stations are a significant source of air emissions in NSW. The EPA’s 2013 air emissions inventory indicates that coal-fired power stations are significant contributors to anthropogenic emissions in the Greater Metropolitan Region. Emissions harmful to human health include sulfur dioxide, oxides of nitrogen and fine particles.
The EPA conducted a detailed review of emission performance and reporting at the five coal-fired power stations in NSW. This included review of around 1,200 data files and other sources of information as well as inspections of the power stations. The review report is available on the EPA website.
Results The review found extensive compliance with regulatory requirements. Overall, air emissions at all power stations were appreciably lower than licensed limits for a number of pollutants.
There was no evidence of misreporting or deliberate under-reporting of air emissions. Boiler loads fluctuate throughout each day and high boiler loads are typically associated with peak emissions. The chart shows that emissions testing was usually conducted during high load periods. These results reflect what would be expected under normal operating conditions.
There were a few instances of non-compliance, which have since been addressed.
Looking ahead The review provides information that will ensure consistent and transparent regulation of power stations and sound environmental performance on an ongoing basis.
The review made 13 recommendations relating to compliance, licence consistency, emission monitoring and reporting. We will work with industry and the community to action all recommendations with key actions including:
The right-hand columns for each power station show the average daily boiler load. The left-hand columns show that emissions testing usually occurred during high load periods.
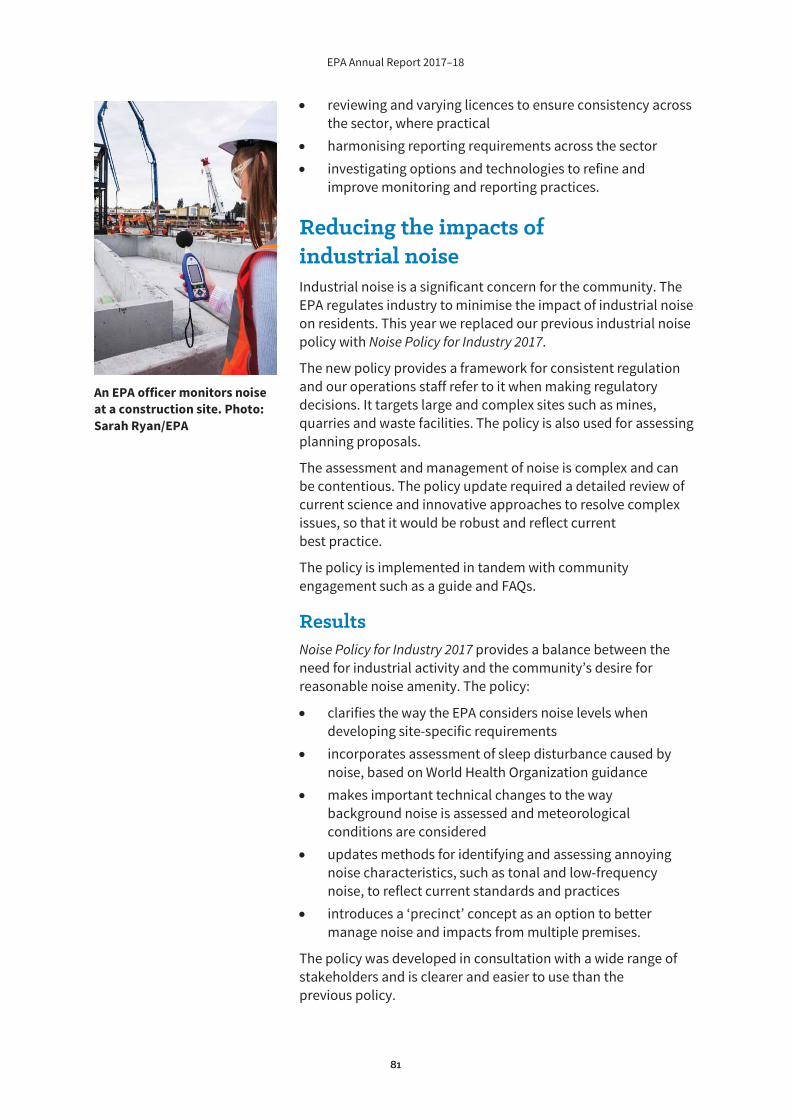
EPA Annual Report 2017–18
81
reviewing and varying licences to ensure consistency across the sector, where practical harmonising reporting requirements across the sector investigating options and technologies to refine and improve monitoring and reporting practices.
Reducing the impacts of industrial noise Industrial noise is a significant concern for the community. The EPA regulates industry to minimise the impact of industrial noise on residents. This year we replaced our previous industrial noise policy with Noise Policy for Industry 2017.
The new policy provides a framework for consistent regulation and our operations staff refer to it when making regulatory decisions. It targets large and complex sites such as mines, quarries and waste facilities. The policy is also used for assessing planning proposals.
The assessment and management of noise is complex and can be contentious. The policy update required a detailed review of current science and innovative approaches to resolve complex issues, so that it would be robust and reflect current best practice.
The policy is implemented in tandem with community engagement such as a guide and FAQs.
Results Noise Policy for Industry 2017 provides a balance between the need for industrial activity and the community’s desire for reasonable noise amenity. The policy:
clarifies the way the EPA considers noise levels when developing site-specific requirements incorporates assessment of sleep disturbance caused by noise, based on World Health Organization guidance makes important technical changes to the way background noise is assessed and meteorological conditions are considered updates methods for identifying and assessing annoying noise characteristics, such as tonal and low-frequency noise, to reflect current standards and practices introduces a ‘precinct’ concept as an option to better manage noise and impacts from multiple premises.
The policy was developed in consultation with a wide range of stakeholders and is clearer and easier to use than the previous policy.
An EPA officer monitors noise at a construction site. Photo: Sarah Ryan/EPA
EPA Annual Report 2017–18
82
Section 3:
Legal enforcement
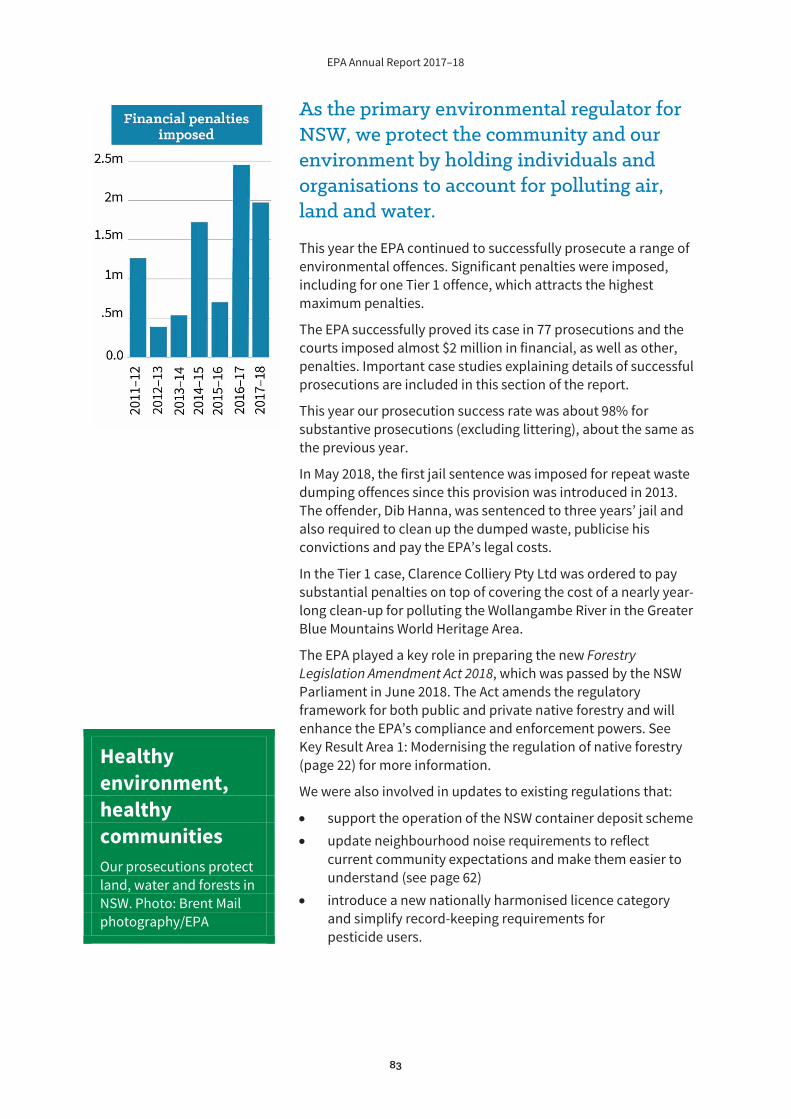
EPA Annual Report 2017–18
83
As the primary environmental regulator for NSW, we protect the community and our environment by holding individuals and organisations to account for polluting air, land and water.
This year the EPA continued to successfully prosecute a range of environmental offences. Significant penalties were imposed, including for one Tier 1 offence, which attracts the highest maximum penalties.
The EPA successfully proved its case in 77 prosecutions and the courts imposed almost $2 million in financial, as well as other, penalties. Important case studies explaining details of successful prosecutions are included in this section of the report.
This year our prosecution success rate was about 98% for substantive prosecutions (excluding littering), about the same as the previous year.
In May 2018, the first jail sentence was imposed for repeat waste dumping offences since this provision was introduced in 2013. The offender, Dib Hanna, was sentenced to three years’ jail and also required to clean up the dumped waste, publicise his convictions and pay the EPA’s legal costs.
In the Tier 1 case, Clarence Colliery Pty Ltd was ordered to pay substantial penalties on top of covering the cost of a nearly year-long clean-up for polluting the Wollangambe River in the Greater Blue Mountains World Heritage Area.
The EPA played a key role in preparing the new Forestry Legislation Amendment Act 2018, which was passed by the NSW Parliament in June 2018. The Act amends the regulatory framework for both public and private native forestry and will enhance the EPA’s compliance and enforcement powers. See Key Result Area 1: Modernising the regulation of native forestry (page 22) for more information.
We were also involved in updates to existing regulations that:
support the operation of the NSW container deposit scheme update neighbourhood noise requirements to reflect current community expectations and make them easier to understand (see page 62) introduce a new nationally harmonised licence category and simplify record-keeping requirements for pesticide users.
Healthy environment, healthy communities Our prosecutions protect land, water and forests in NSW. Photo: Brent Mail photography/EPA

EPA Annual Report 2017–18
84
Legal context Under legislation administered by the Minister for the Environment, the EPA:
issues and reviews environment protection licences issues penalty notices prosecutes individuals and companies that are alleged to have committed environmental offences enters into enforceable undertakings in lieu of prosecution.
See Appendix 1 for the full list of Acts administered by the EPA in 2017–18.
Legislative changes in 2017–18
New and amending Acts The Forestry Legislation Amendment Act 2018 was assented to in June 2018.
New and amending Regulations The following Regulations were made or remade in 2017–18:
Environmentally Hazardous Chemicals Regulation 2017 Pesticides Regulation 2017 Protection of the Environment Operations (General) Amendment (Penalty Notices) Regulation 2017 Protection of the Environment Operations (Noise Control) Regulation 2017 Protection of the Environment Operations (Waste) Amendment (Calculation of Contributions) Regulation 2018 Radiation Control Amendment (Fees) Regulation 2018 Waste Avoidance and Resource Recovery (Container Deposit Scheme) Amendment Regulation 2017 Waste Avoidance and Resource Recovery (Container Deposit Scheme) Amendment (Supply and Collection) Regulation 2017.
Minister’s role Pursuant to section 13(2) of the Protection of the Environment Administration Act 1991, the EPA is not subject to the control and direction of the Minister for the Environment regarding any decision to institute criminal or related proceedings under environment protection legislation. However, the EPA keeps the Minister informed of the progress of significant investigations and prosecutions.
EPA Annual Report 2017–18
85
Prosecutions for pollution offences The EPA commenced over 115 prosecutions in 2017–18 and completed 81. Of the completed prosecutions, 42 were for substantive offences and the other 39 were for court-elected matters where recipients of penalty notices for littering elected to have the matters determined by a court instead of paying the fine. The 42 substantive prosecutions resulted in:
39 convictions two matters where the offence was proven but a conviction was not recorded one dismissal.
The 39 court-elected littering prosecutions resulted in:
31 convictions five matters where the offence was proven but a conviction was not recorded three acquittals.
Total prosecutions under EPA legislation
Fines $907,120
Other financial penalties (excluding legal costs) $1,065,000
Total fines and other financial penalties $1,972,120
Appendix 2 provides full details of the substantive prosecutions completed under EPA legislation in 2017–18.
Prosecution case studies The case studies below provide insight into the range of offences which the EPA regularly prosecutes and highlight significant outcomes in the courts in 2017–18.
Ardent Leisure Ltd Offence: Water pollution and failure to keep current ‘as built’ diagrams for an underground petroleum storage system (UPSS)
Ardent engaged a specialist company to decommission a disused diesel fuel tank at its Rushcutters Bay Marina site. The company did not provide the contractor with documentation setting out the fuel line pipework at the site. Part-way through the decommissioning process, the contractors left the marina with a severed delivery pipe. After this, a member of the public’s purchase of diesel at the marina’s bowser activated a turbine pump, causing fuel to flow through the UPSS, including the severed pipe. Approximately 6,845 litres of diesel fuel escaped from the pipe. While up to 1,000 litres was captured on site, the remainder spilled into the waters of Rushcutters Bay.
Ardent was in possession of documentation that suggested that modifications had previously been made to the fuel line, but this was not provided to the contractor. The company failed to ensure that accurate ‘as-built’ drawings of the UPSS were kept. The provision of those drawings to the contractor was a practical measure that should have been taken to avoid the incident.
Plea: Guilty
Result: In April 2018, the Land and Environment Court convicted Ardent of polluting waters and failing to keep current ‘as built’ diagrams for the UPSS.
EPA Annual Report 2017–18
86
Ardent was ordered to pay:
a $135,000 fine for pollution of waters a $22,950 fine for failing to keep current ‘as built’ diagrams for the UPSS the prosecutor’s (EPA’s) investigation costs of $6,280 the prosecutor’s (EPA’s) legal costs.
Ardent was ordered to publicise details of the offences in The Sydney Morning Herald, The Australian Financial Review, Daily Telegraph, The Australian, Waterline and Logbook.
Clarence Colliery Pty Ltd Offence: Negligently causing the escape of a substance in a manner that harmed or was likely to harm the environment (Tier 1 offence – the most serious environmental offences which attract the highest maximum penalties)
Between 30 June 2015 and 1 July 2015, approximately 530 tonnes of coarse coal reject and coal fines slurry spilled from Clarence Colliery into the environment surrounding the mine site. Slurry containing coal fines also flowed into the Wollangambe River, which is in the Greater Blue Mountains World Heritage Area. Approximately 10.3 kilometres of the river was affected by this slurry. The EPA required Clarence Colliery to contain and clean up the spill. The clean-up process took 51 weeks and recovered more than 200 tonnes of coal material from the river.
Plea: Guilty
Result: In July 2017, the Land and Environment Court convicted Clarence Colliery of negligently causing the escape of a substance in a manner that harmed or was likely to harm the environment.
Clarence Colliery was ordered to pay:
a total penalty of $720,000 towards the following projects managed by the Office of Environment and Heritage: o $505,000 for ‘Stabilisation of walking tracks in the Newnes Plateau and Wollangambe/Mt
Wilson area’ o $55,000 for ‘Enhancing the survival of the endangered Blue Mountains water skink’ o $60,000 for ‘Water quality improvement – new toilet at Deep Pass’ o $100,000 for ‘Weed control in Wollangambe Catchment’ the prosecutor’s (EPA) investigation costs of $103,000 the prosecutor’s (EPA) legal costs.
Clarence Colliery was ordered to publicise details of the offence in The Australian Financial Review, The Sydney Morning Herald and the Lithgow Mercury.
Clarence Colliery was also charged by the Office of Environment and Heritage over the same incident with an offence under section 156A(1)(b) of the National Parks and Wildlife Act 1974 for damaging reserved land. The colliery was convicted of that offence and ordered to pay a total penalty of $330,000.
The penalties for both charges totalled $1,050,000.
EPA Annual Report 2017–18
87
Dib Hanna Abdallah Hanna Offences: Repeat waste offences
Throughout 2015, Mr Hanna distributed flyers across Sydney offering delivery of ‘free clean topsoil, clay, crushed bitumen or shale’. Four residents contacted him and requested clean topsoil. In response, Mr Hanna caused the delivery and deposit of a total of about 461 cubic metres of asbestos-contaminated waste to the residents’ properties.
Sometime later, Mr Hanna relocated to Victoria and failed to appear a number of times before the Land and Environment Court to answer the charges. Following an application by the EPA, the Court ordered the interstate arrest of Mr Hanna and his extradition to NSW. Victorian Police assisted with Mr Hanna’s arrest and extradition.
Plea: Guilty
Result: In May 2018, the Land and Environment Court convicted Mr Hanna of five repeat waste offences.
Mr Hanna was:
sentenced to an aggregate term of imprisonment of three years, with a non-parole period of two years and three months ordered to remove the waste from three properties ordered to pay the prosecutor’s (EPA) legal costs.
Mr Hanna was ordered to publicise details of the offences in the Daily Telegraph, Inside Waste Magazine and The Western Weekender.
Metropolitan Demolition and Recycling Pty Ltd Offence: Furnish false or misleading information in response to an investigative requirement
Metropolitan Demolition and Recycling provides specialist demolition services to industry and the public. This includes supplying hired plant and receiving and recycling construction and demolition waste into re-usable products such as road base.
After an inspection of the Metropolitan Demolition and Recycling waste facility at St Peters, the EPA requested an explanation for the purpose of a diary used by the company. The company informed the EPA that the diary was used to estimate load weights and improve quoting for the transport of demolition waste. However, the reason given was false – the diary was used as part of a ruse to avoid Roads and Maritime Services fines.
Plea: Guilty
Result: In April 2018, Metropolitan Demolition and Recycling was convicted in the Downing Centre Local Court of one offence of knowingly furnishing false information to the EPA in response to an investigative requirement.
Metropolitan Demolition and Recycling was ordered to pay:
a fine of $75,000 the prosecutor’s (EPA) legal costs.
P&M Quality Smallgoods Pty Ltd and JBS Australia Pty Ltd Offence: P&M Quality Smallgoods was charged with one offence of polluting waters and one offence of contravening a condition of their environment protection licence (EPL). JBS Australia was charged with one offence of polluting waters.
EPA Annual Report 2017–18
88
The EPL held by P&M Quality Smallgoods permitted the slaughter and processing of livestock at an abattoir in Scone. JBS Australia occupied the premises from June 2015 and carried out the licensed activities. From 26 to 31 August 2015, it is estimated that between 70,000 and 140,000 litres of partially treated effluent and wastewater was discharged by workers who had opened a valve on a discharge pipe to a location that was not permitted under the EPL. This discharge caused actual low-level and likely harm to the aquatic environment in a section of Two Mile Gully Creek between 50 and 315 metres in length.
Plea: Both offenders entered pleas of guilty
Result: In July 2017, P&M Quality Smallgoods was convicted in the Land and Environment Court for polluting waters and breaching an EPL condition. JBS Australia was also convicted in the Land and Environment Court for polluting waters.
P&M Quality Smallgoods was ordered to pay:
$90,000 in total to the NSW Environmental Trust the EPA’s investigation and legal costs.
JBS Australia was ordered to pay:
$60,000 to the NSW Environmental Trust the EPA’s investigation and legal costs.
P&M Quality Smallgoods and JBS Australia were ordered to publicise details of the offence(s) in The Newcastle Herald and Singleton Argus.
Rixa Quarries (No.2) Pty Ltd Offences: Carrying out a scheduled activity without an EPL
Between March and October 2013 Rixa Quarries No.2 extracted and processed over 30,000 tonnes of sand at Doonbah Quarry, Doonbah without the required EPL. While Rixa had applied for an EPL in May 2013, the EPA did not grant the application but requested additional information for its assessment of the application. Evidence provided by the defendant during the investigation showed that about 52,000 tonnes of sand was trucked off the premises between March 2013 and September 2013.
Plea: No plea. Rixa did not appear and was not represented in Court
Result: In July 2017, the Land and Environment Court convicted Rixa of carrying out a scheduled activity without an EPL.
Rixa was ordered to pay:
a $350,000 fine the prosecutor’s (EPA) legal costs.
Rixa was ordered to publicise details of the offence in The Sydney Morning Herald, Coffs Advocate, Northern Star, Daily Examiner, Byron Echo and Tweed Daily.
Toll Global Forwarding Pty Ltd Offence: Unsafe transport of goods
In October 2014, Toll Global Forwarding was contracted to transport approximately 16 tonnes of flammable dangerous goods comprising expandable polymeric beads which are used in the manufacture of polystyrene. Toll subcontracted Stockwell International Pty Ltd to carry out the
EPA Annual Report 2017–18
89
work. Stockwell engaged Mr Darren Hill to drive the dangerous goods from Stockwell’s premises to Smithfield.
On 17 October 2014, Mr Hill’s vehicle was pulled over on the M5 Motorway in Kingsgrove after passing through three tunnels in which transportation of dangerous goods is prohibited. Neither Mr Hill nor his vehicle were licensed to transport dangerous goods. In addition, the vehicle:
did not display the appropriate signage and placards did not have appropriate transport documentation was not equipped with a fire extinguisher or appropriate emergency information.
Plea: Guilty
Result: In May 2018, Toll was convicted in the Land and Environment Court for failing to ensure that dangerous goods transported by road were transported in a safe manner. Toll was ordered to pay:
a fine of $75,000 the prosecutor’s (EPA) legal costs.
Enforceable undertakings: an alternative to a court hearing Enforceable undertakings are an enforcement tool which can be used as an alternative to prosecution. Through an enforceable undertaking, the EPA may secure outcomes such as:
environmental restoration measures improvements to a company’s environmental systems a monetary contribution to an environmental project or initiative.
These undertakings are enforceable in the Land and Environment Court.
In 2017–18, the EPA entered into four enforceable undertakings which required the parties to take corrective actions and make monetary contributions totalling $332,170 to environmental projects and initiatives. The table summarises key actions and contributions.
Incident Company Agreed actions Amount
Diesel spill from underground petroleum storage system at Lidcombe Laboratories 11–17 July 2016
State of New South Wales (Office of Environment and Heritage)
Monetary contribution towards environmental works on the impacted adjacent golf course Measures to prevent future incidents
$15,000
Air pollution from burning waste at Harden–Murrumburrah Waste Transfer Station 8–26 October 2016
Hilltops Council Monetary contribution towards a targeted project to reduce illegal dumping in the region Measures to prevent future incidents Publicising the enforceable undertaking
$17,170
Ammonia leak at Beresfield factory 1 December 2016
Bartter Enterprises Pty Ltd
Monetary contribution for environmental works as per the Hunter Local Land Services Project Brief
$100,000
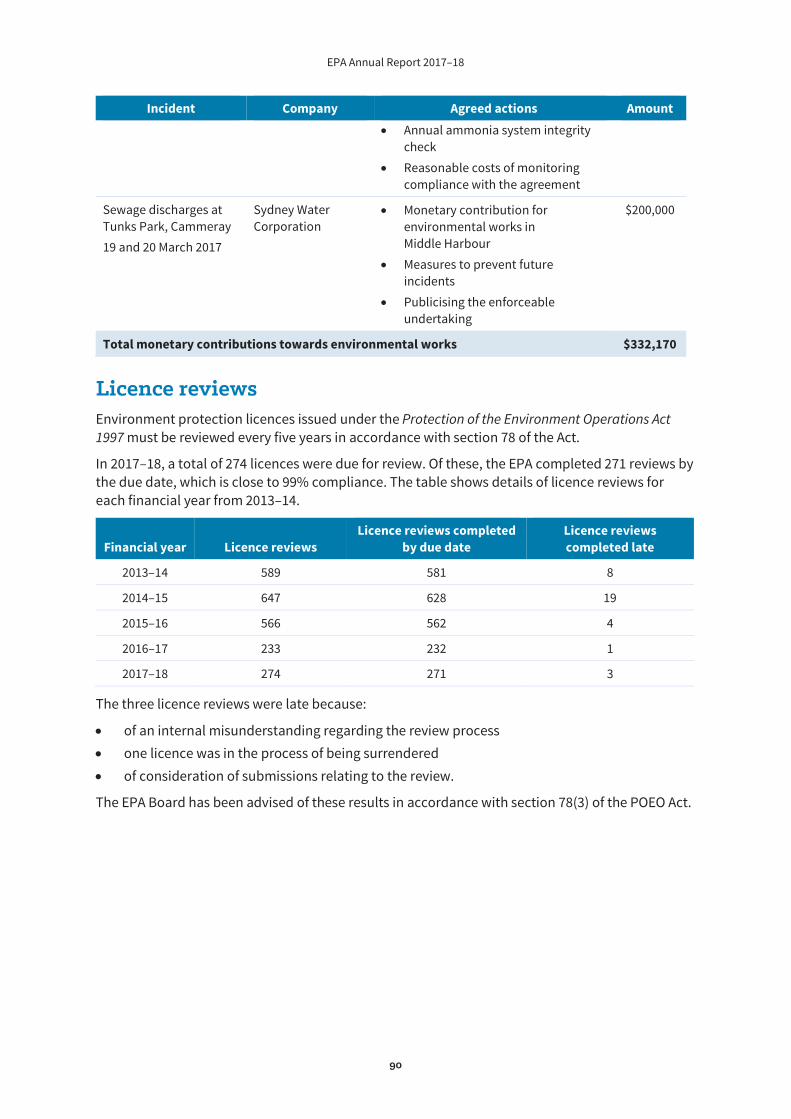
EPA Annual Report 2017–18
90
Incident Company Agreed actions Amount Annual ammonia system integrity check Reasonable costs of monitoring compliance with the agreement
Sewage discharges at Tunks Park, Cammeray 19 and 20 March 2017
Sydney Water Corporation
Monetary contribution for environmental works in Middle Harbour Measures to prevent future incidents Publicising the enforceable undertaking
$200,000
Total monetary contributions towards environmental works $332,170
Licence reviews Environment protection licences issued under the Protection of the Environment Operations Act 1997 must be reviewed every five years in accordance with section 78 of the Act.
In 2017–18, a total of 274 licences were due for review. Of these, the EPA completed 271 reviews by the due date, which is close to 99% compliance. The table shows details of licence reviews for each financial year from 2013–14.
Financial year Licence reviews Licence reviews completed
by due date Licence reviews completed late
2013–14 589 581 8
2014–15 647 628 19
2015–16 566 562 4
2016–17 233 232 1
2017–18 274 271 3
The three licence reviews were late because:
of an internal misunderstanding regarding the review process one licence was in the process of being surrendered of consideration of submissions relating to the review.
The EPA Board has been advised of these results in accordance with section 78(3) of the POEO Act.
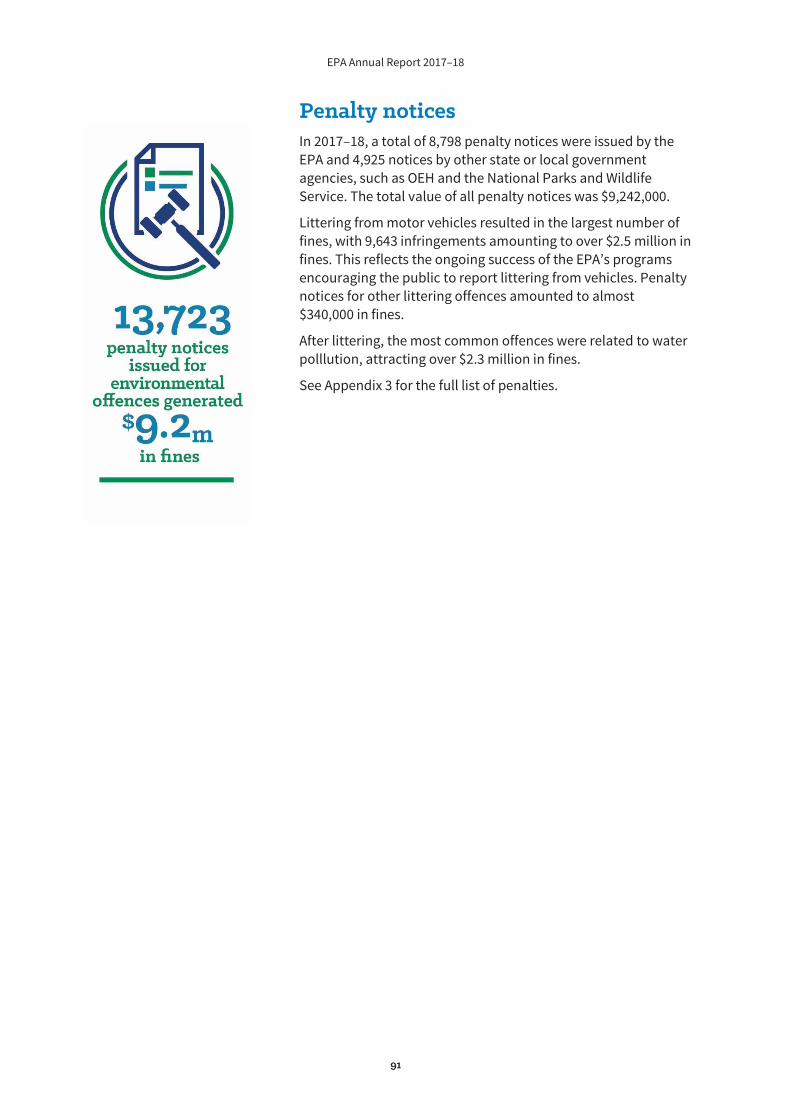
EPA Annual Report 2017–18
91
Penalty notices In 2017–18, a total of 8,798 penalty notices were issued by the EPA and 4,925 notices by other state or local government agencies, such as OEH and the National Parks and Wildlife Service. The total value of all penalty notices was $9,242,000.
Littering from motor vehicles resulted in the largest number of fines, with 9,643 infringements amounting to over $2.5 million in fines. This reflects the ongoing success of the EPA’s programs encouraging the public to report littering from vehicles. Penalty notices for other littering offences amounted to almost $340,000 in fines.
After littering, the most common offences were related to water polllution, attracting over $2.3 million in fines.
See Appendix 3 for the full list of penalties.
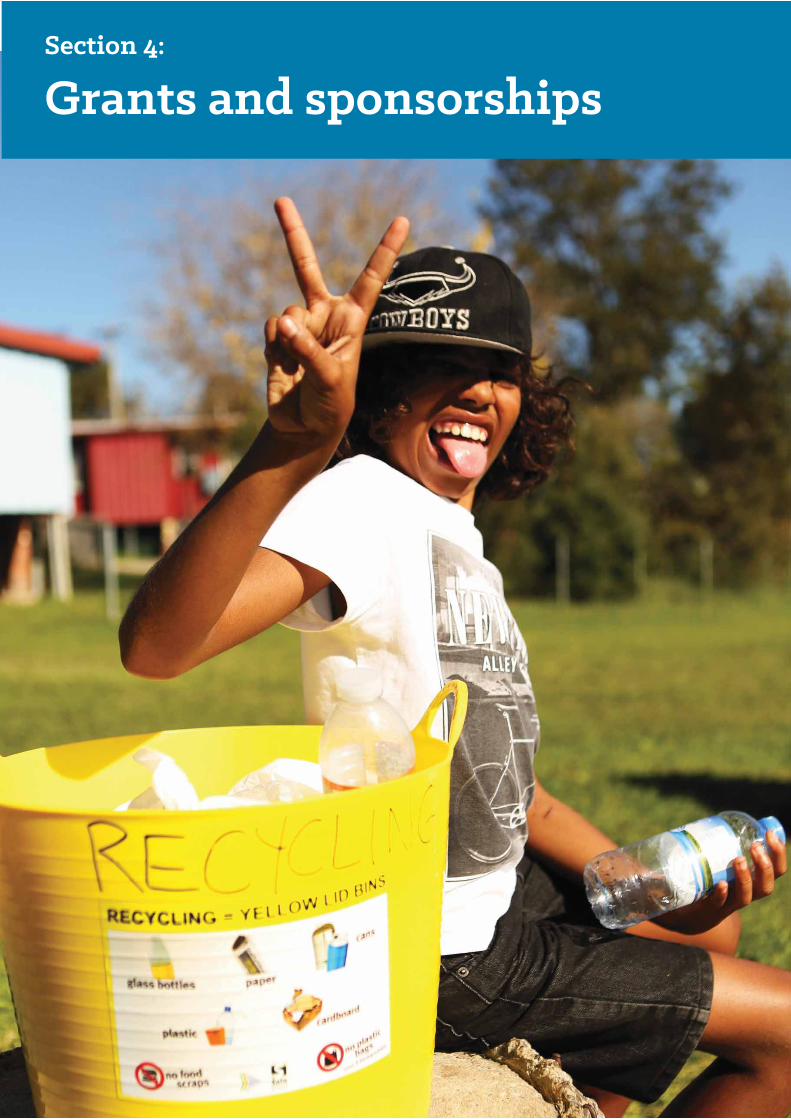
EPA Annual Report 2017–18
92
Section 4:
Grants and sponsorships
EPA Annual Report 2017–18
93
Protecting the environment is everyone’s responsibility. EPA grants and sponsorships are vital for achieving our vision for NSW of a healthy environment, healthy community and healthy business.
By providing much-needed funding for campaigns, resources, infrastructure, events, education and research, the EPA makes it possible for everyone in NSW to get involved in protecting the environment.
In 2017–18, we provided grants worth a total of $25.1 million. This breathed life into important initiatives, such as the disposal of household hazardous waste, litter prevention, investment in waste and recycling infrastructure, organics market development, food donation education, industrial ecology and business recycling programs.
Over the same period, we also provided $236,271 in sponsorships. These corporate disbursements supported valuable activities and events which align with the strategic goals and objectives of the EPA.
Grants The EPA provides grants to recipients at all levels, including government, business and community groups. This funding makes it possible for the recipients to deal with environmental issues in a targeted way.
In 2017–18, most EPA grants related to littering and waste management. They covered a variety of programs and activities such as:
engagement with the Muli Muli community in Northern NSW in a pilot waste management program that will inform similar future programs in other rural and remote Aboriginal communities the Recycling Relief Fund, which was established to help rural and regional councils to cover increased costs due to the impact of China accepting less recycling material from offshore investment in infrastructure to improve resource recovery and divert waste from landfill food donation education grants, which have provided 14 million meals for people in need – and helped businesses avoid 7,400 tonnes of food waste.
Supporting Aboriginal communities to tackle waste Gydiam Williams from the Muli Muli community taking part in a waste reduction project funded by the EPA, see story page 37. Photo: Desert Pea Media
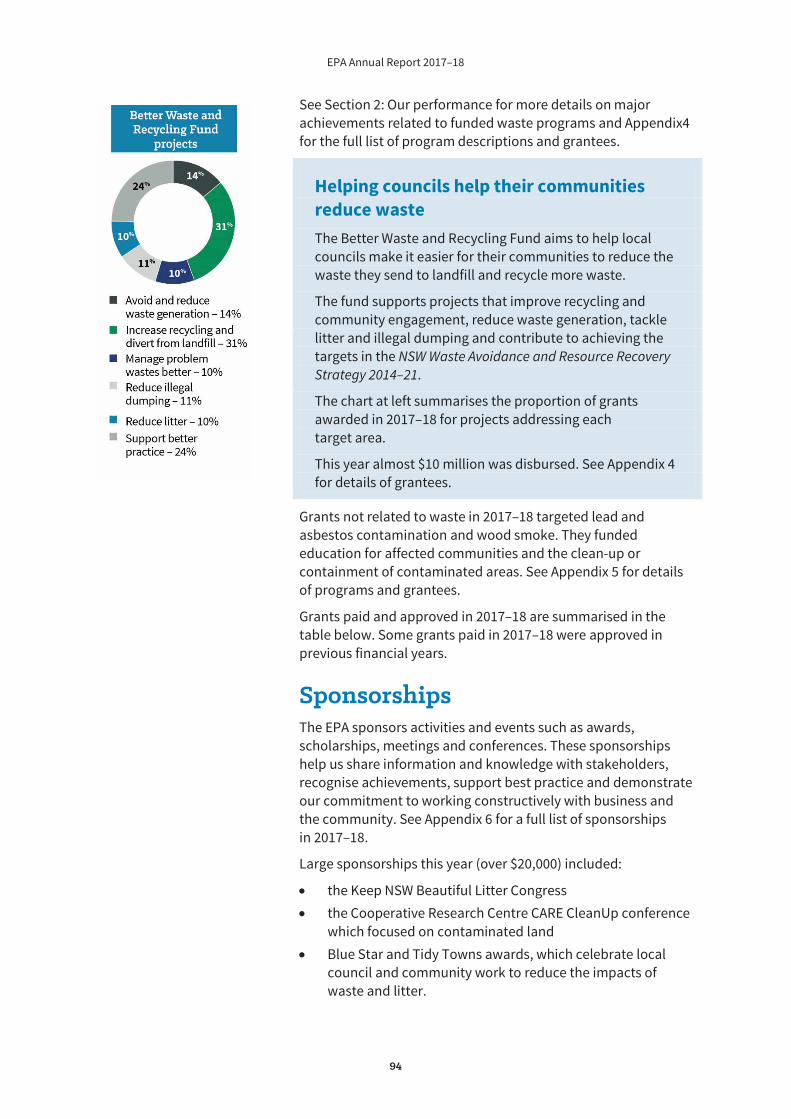
EPA Annual Report 2017–18
94
See Section 2: Our performance for more details on major achievements related to funded waste programs and Appendix4 for the full list of program descriptions and grantees.
Helping councils help their communities reduce waste The Better Waste and Recycling Fund aims to help local councils make it easier for their communities to reduce the waste they send to landfill and recycle more waste.
The fund supports projects that improve recycling and community engagement, reduce waste generation, tackle litter and illegal dumping and contribute to achieving the targets in the NSW Waste Avoidance and Resource Recovery Strategy 2014–21.
The chart at left summarises the proportion of grants awarded in 2017–18 for projects addressing each target area.
This year almost $10 million was disbursed. See Appendix 4 for details of grantees.
Grants not related to waste in 2017–18 targeted lead and asbestos contamination and wood smoke. They funded education for affected communities and the clean-up or containment of contaminated areas. See Appendix 5 for details of programs and grantees.
Grants paid and approved in 2017–18 are summarised in the table below. Some grants paid in 2017–18 were approved in previous financial years.
Sponsorships The EPA sponsors activities and events such as awards, scholarships, meetings and conferences. These sponsorships help us share information and knowledge with stakeholders, recognise achievements, support best practice and demonstrate our commitment to working constructively with business and the community. See Appendix 6 for a full list of sponsorships in 2017–18.
Large sponsorships this year (over $20,000) included:
the Keep NSW Beautiful Litter Congress the Cooperative Research Centre CARE CleanUp conference which focused on contaminated land Blue Star and Tidy Towns awards, which celebrate local council and community work to reduce the impacts of waste and litter.
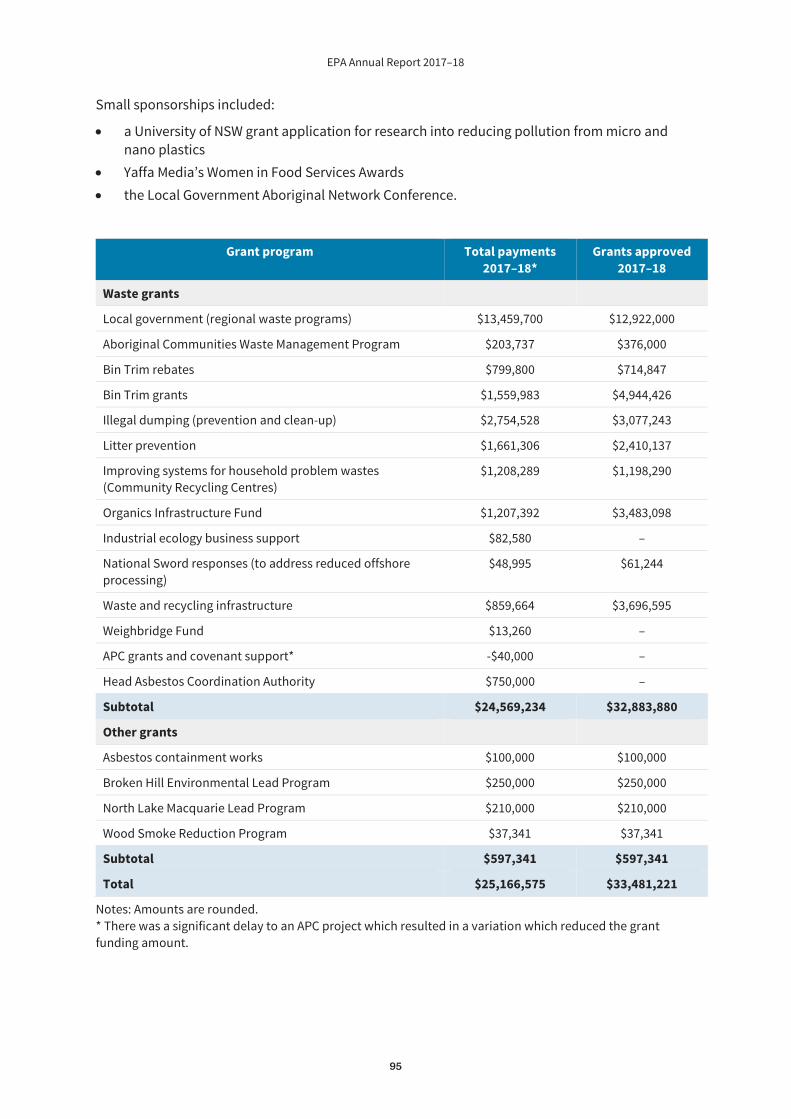
EPA Annual Report 2017–18
95
Small sponsorships included:
a University of NSW grant application for research into reducing pollution from micro and nano plastics Yaffa Media’s Women in Food Services Awards the Local Government Aboriginal Network Conference.
Grant program Total payments 2017–18*
Grants approved 2017–18
Waste grants
Local government (regional waste programs) $13,459,700 $12,922,000
Aboriginal Communities Waste Management Program $203,737 $376,000
Bin Trim rebates $799,800 $714,847
Bin Trim grants $1,559,983 $4,944,426
Illegal dumping (prevention and clean-up) $2,754,528 $3,077,243
Litter prevention $1,661,306 $2,410,137
Improving systems for household problem wastes (Community Recycling Centres)
$1,208,289 $1,198,290
Organics Infrastructure Fund $1,207,392 $3,483,098
Industrial ecology business support $82,580 –
National Sword responses (to address reduced offshore processing)
$48,995 $61,244
Waste and recycling infrastructure $859,664 $3,696,595
Weighbridge Fund $13,260 –
APC grants and covenant support* -$40,000 –
Head Asbestos Coordination Authority $750,000 –
Subtotal $24,569,234 $32,883,880
Other grants
Asbestos containment works $100,000 $100,000
Broken Hill Environmental Lead Program $250,000 $250,000
North Lake Macquarie Lead Program $210,000 $210,000
Wood Smoke Reduction Program $37,341 $37,341
Subtotal $597,341 $597,341
Total $25,166,575 $33,481,221
Notes: Amounts are rounded. * There was a significant delay to an APC project which resulted in a variation which reduced the grant funding amount.
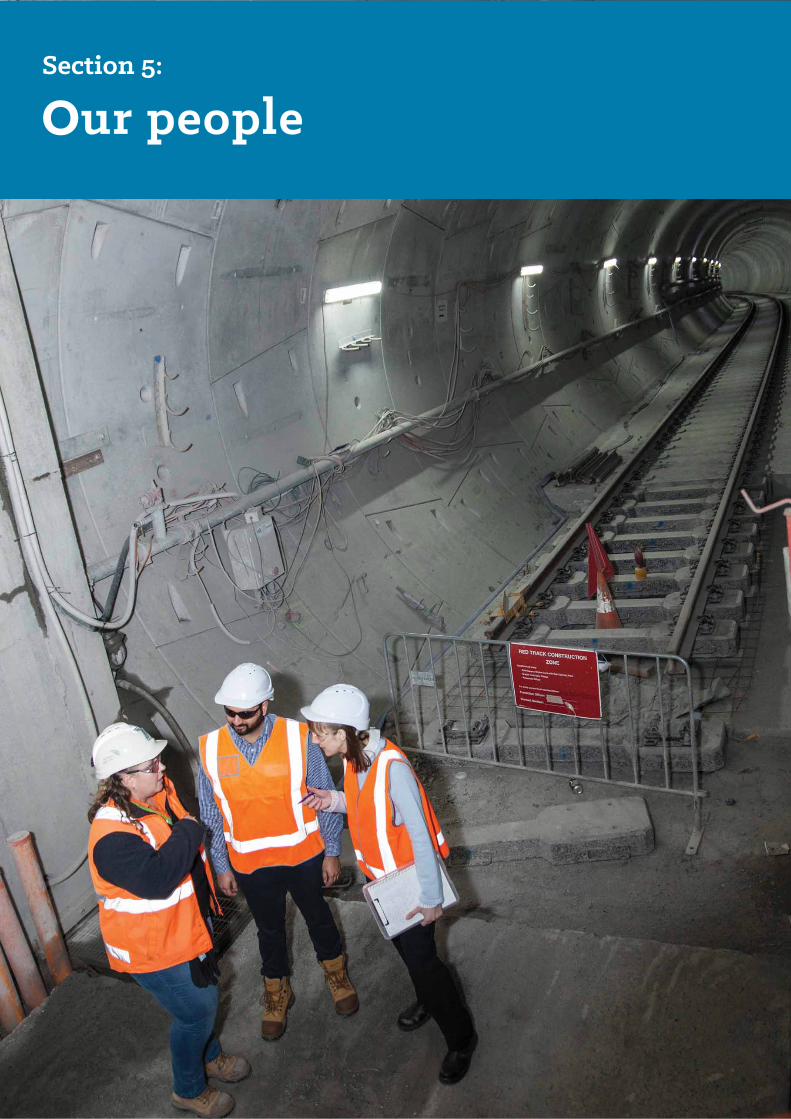
EPA Annual Report 2017–18
96
Section 5:
OOur people
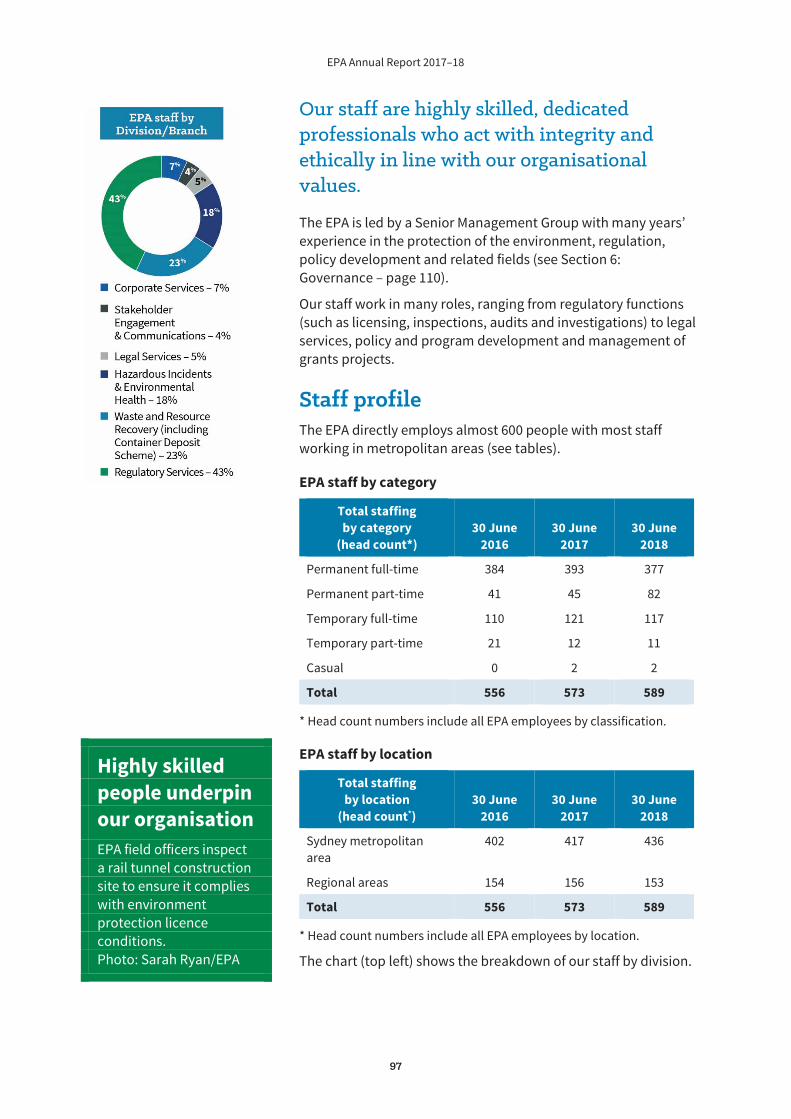
EPA Annual Report 2017–18
97
Our staff are highly skilled, dedicated professionals who act with integrity and ethically in line with our organisational values.
The EPA is led by a Senior Management Group with many years’ experience in the protection of the environment, regulation, policy development and related fields (see Section 6: Governance – page 110).
Our staff work in many roles, ranging from regulatory functions (such as licensing, inspections, audits and investigations) to legal services, policy and program development and management of grants projects.
Staff profile The EPA directly employs almost 600 people with most staff working in metropolitan areas (see tables).
EPA staff by category
Total staffing by category
(head count*) 30 June
2016 30 June
2017 30 June
2018
Permanent full-time 384 393 377
Permanent part-time 41 45 82
Temporary full-time 110 121 117
Temporary part-time 21 12 11
Casual 0 2 2
Total 556 573 589
* Head count numbers include all EPA employees by classification.
EPA staff by location
Total staffing by location
(head count*) 30 June
2016 30 June
2017 30 June
2018
Sydney metropolitan area
402 417 436
Regional areas 154 156 153
Total 556 573 589
* Head count numbers include all EPA employees by location.
The chart (top left) shows the breakdown of our staff by division.
Highly skilled people underpin our organisation EPA field officers inspect a rail tunnel construction site to ensure it complies with environment protection licence conditions. Photo: Sarah Ryan/EPA
EPA Annual Report 2017–18
98
The EPA continues to enhance workforce development by determining and acting on employee needs and providing a range of training and career development options to staff. ‘Maintaining a skilled workforce’ (page 70) provides more details.
Our people matter The People Matter 2018 NSW Public Sector Employee Survey provides important feedback on how our staff feel about working at the EPA and where improvements can be made.
The highest scoring questions from the survey clearly show that we have respect and support for our colleagues with:
87% agreeing that their work group strives to achieve customer/client satisfaction 85% reporting that they receive help and support from other members of their work group 84% agreeing that people in their work group treat each other with respect 84% knowing how to address any health and safety issues they might identify.
The survey showed the EPA continues to have a high level of employee engagement – at 70%, a little higher than the public sector average.
See Our people care (page 67) for more details about the survey.
The EPA Executive will review the People Matter 2018 findings and identify actions to address areas where we could improve.
Workplace diversity and development The EPA recognises the importance of a balanced workplace and supports opportunities and obligations that promote workforce diversity. Our results from the People Matter 2018 survey indicate that our diversity initiatives are effective with:
81% agreeing that the EPA respects individual differences (including cultures and backgrounds) 78% believing that personal (cultural) background is not a barrier to success in the EPA.
These results are higher than the public sector average for both questions which were 76% and 75%, respectively.
A higher proportion of EPA staff also agreed that senior managers support the career advancement of women (71% compared with 60% sector-wide).

EPA Annual Report 2017–18
99
Mechanisms for supporting diversity across the EPA include:
flexible and family-friendly work options – People Matter 2018 found that 77% of EPA staff were satisfied with their ability to access and use flexible working arrangements, compared with 59% for the whole public sector requiring both males and females on recruitment panels even though this is no longer necessary under the Government Sector Employment Act 2013 participation in the Career Trackers Indigenous Internship Program, which employs Aboriginal undergraduate students with the aim that, upon graduation, they will be qualified for ongoing positions in the EPA – three undergraduate interns commenced employment during 2017–18 a graduate employment program with seven graduates joining the organisation across two intakes in 2017–18 the Spokeswomen’s Committee (see below), which encourages EPA staff to further the rights and opportunities of women across the organisation the EPA Diversity Committee – a staff-led, organisation-wide working group championed by the EPA’s Chief Environmental Regulator (see ‘Supporting inclusion and diversity’ on page 68 for more information) the Executive’s People, Strategy and Culture Subcommittee.
Workforce diversity profiles
Trends in the representation of workforce diversity groups
Workforce diversity group Benchmark 30 June
2015 30 June
2016 30 June
2017 30 June
2018
Women 50% 53.1% 53.3% 53.7% 56.1%
Aboriginal and Torres Strait Islander People
3.3% 1.0% 1.1% 1.1% 1.8%
People whose first language spoken as a child was not English
23.2%* 13.1% 10.6% 13.1% 13.7%
People with a disability n/a** 3.1% 3.3% 3.8% 3.1%
People with a disability requiring work-related adjustment
n/a** 0.7% 1.3% 1.0% 1.0%
Women in Senior Leadership
40% by 2021 n/a*** n/a 31.8% 33.3%
LGBTQI n/a n/a n/a n/a 4.8%
* A benchmark from the Australian Bureau of Statistics (ABS) Census of Population and Housing has been included for people whose first language spoken as a child was not English. The ABS Census does not provide information about first language, but does provide information about country of birth. The benchmark of 23.2% is the percentage of the NSW general population born in a country where English is not the predominant language. ** Work is underway to improve the reporting of disability information in the sector to enable comparisons with population data. For this reason, no benchmark has been provided for people with a disability or for people with a disability requiring work-related adjustment.
*** Data not previously reported.
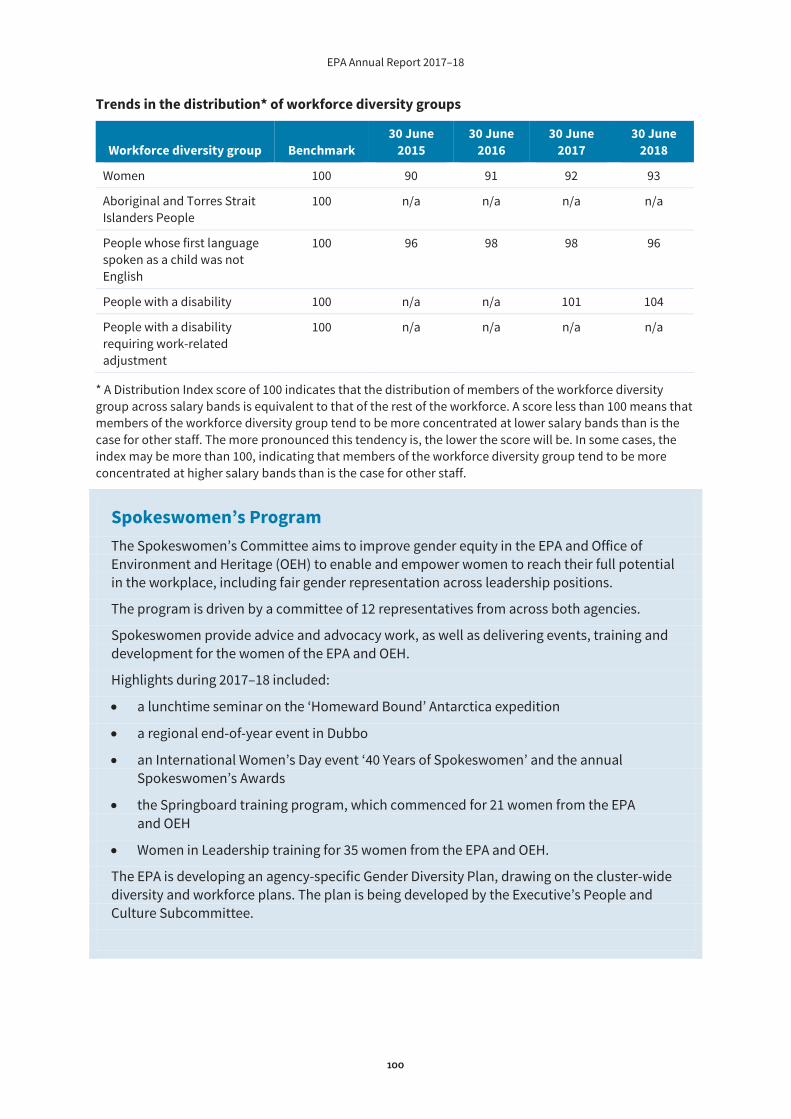
EPA Annual Report 2017–18
100
Trends in the distribution* of workforce diversity groups
Workforce diversity group Benchmark 30 June
2015 30 June
2016 30 June
2017 30 June
2018
Women 100 90 91 92 93
Aboriginal and Torres Strait Islanders People
100 n/a n/a n/a n/a
People whose first language spoken as a child was not English
100 96 98 98 96
People with a disability 100 n/a n/a 101 104
People with a disability requiring work-related adjustment
100 n/a n/a n/a n/a
* A Distribution Index score of 100 indicates that the distribution of members of the workforce diversity group across salary bands is equivalent to that of the rest of the workforce. A score less than 100 means that members of the workforce diversity group tend to be more concentrated at lower salary bands than is the case for other staff. The more pronounced this tendency is, the lower the score will be. In some cases, the index may be more than 100, indicating that members of the workforce diversity group tend to be more concentrated at higher salary bands than is the case for other staff.
Spokeswomen’s Program The Spokeswomen’s Committee aims to improve gender equity in the EPA and Office of Environment and Heritage (OEH) to enable and empower women to reach their full potential in the workplace, including fair gender representation across leadership positions.
The program is driven by a committee of 12 representatives from across both agencies.
Spokeswomen provide advice and advocacy work, as well as delivering events, training and development for the women of the EPA and OEH.
Highlights during 2017–18 included:
a lunchtime seminar on the ‘Homeward Bound’ Antarctica expedition
a regional end-of-year event in Dubbo
an International Women’s Day event ‘40 Years of Spokeswomen’ and the annual Spokeswomen’s Awards
the Springboard training program, which commenced for 21 women from the EPA and OEH
Women in Leadership training for 35 women from the EPA and OEH.
The EPA is developing an agency-specific Gender Diversity Plan, drawing on the cluster-wide diversity and workforce plans. The plan is being developed by the Executive’s People and Culture Subcommittee.
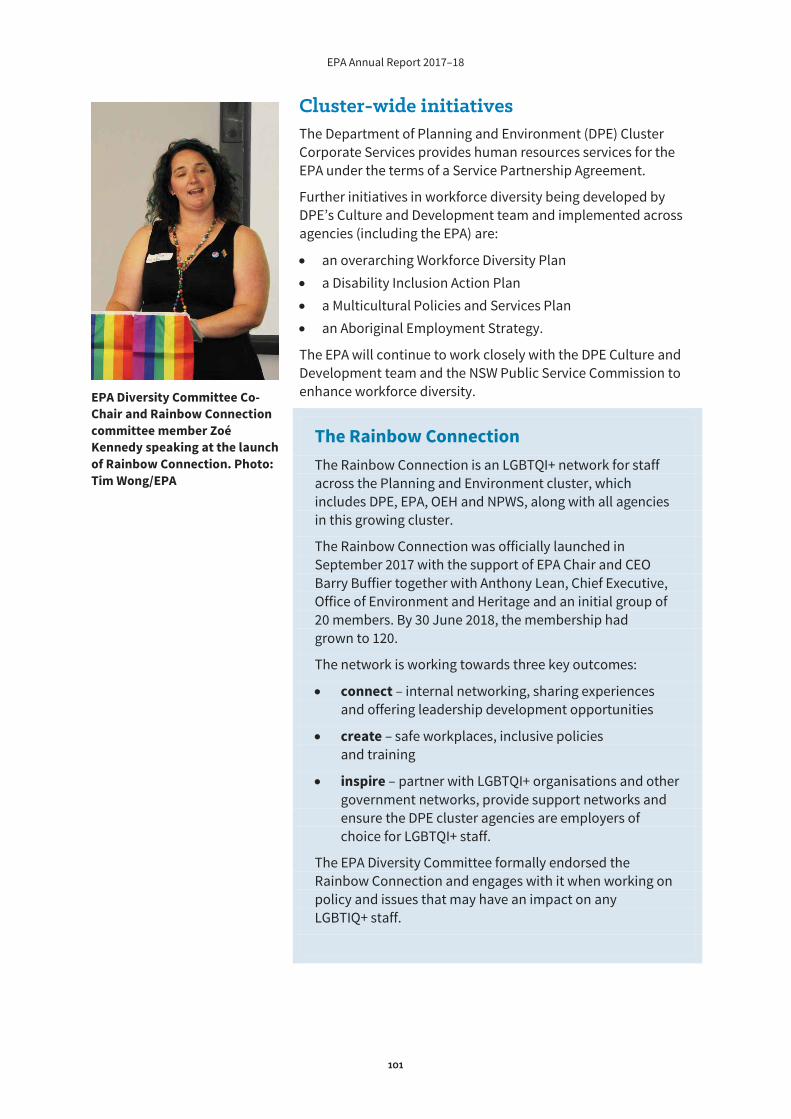
EPA Annual Report 2017–18
101
Cluster-wide initiatives The Department of Planning and Environment (DPE) Cluster Corporate Services provides human resources services for the EPA under the terms of a Service Partnership Agreement.
Further initiatives in workforce diversity being developed by DPE’s Culture and Development team and implemented across agencies (including the EPA) are:
an overarching Workforce Diversity Plan a Disability Inclusion Action Plan a Multicultural Policies and Services Plan an Aboriginal Employment Strategy.
The EPA will continue to work closely with the DPE Culture and Development team and the NSW Public Service Commission to enhance workforce diversity.
The Rainbow Connection The Rainbow Connection is an LGBTQI+ network for staff across the Planning and Environment cluster, which includes DPE, EPA, OEH and NPWS, along with all agencies in this growing cluster.
The Rainbow Connection was officially launched in September 2017 with the support of EPA Chair and CEO Barry Buffier together with Anthony Lean, Chief Executive, Office of Environment and Heritage and an initial group of 20 members. By 30 June 2018, the membership had grown to 120.
The network is working towards three key outcomes:
connect – internal networking, sharing experiences and offering leadership development opportunities
create – safe workplaces, inclusive policies and training
inspire – partner with LGBTQI+ organisations and other government networks, provide support networks and ensure the DPE cluster agencies are employers of choice for LGBTQI+ staff.
The EPA Diversity Committee formally endorsed the Rainbow Connection and engages with it when working on policy and issues that may have an impact on any LGBTIQ+ staff.
EPA Diversity Committee Co-Chair and Rainbow Connection committee member Zoé Kennedy speaking at the launch of Rainbow Connection. Photo: Tim Wong/EPA
EPA Annual Report 2017–18
102
Employee wellbeing initiatives We value our employees’ health and wellbeing. Initiatives that supported employees this year included:
Employee Flu Vaccination Program – The EPA offered an on-site flu vaccination clinic to staff at major office locations in Sydney and regionally. Staff at smaller locations had the option of having the vaccination at their GP or a participating pharmacy and claiming reimbursement. This was an expanded program from the one offered prior to last year’s flu season and we had a much higher employee uptake with 102 staff participating by the end of June 2018. voluntary respiratory health screening – Staff who regularly inspect sites that are suspected of containing asbestos can access respiratory health screening provided by the NSW Dust Diseases Authority. Twenty staff undertook testing in 2017 and all received reports showing they were not affected. Employee Assistance Program (EAP) – Staff can access free confidential counselling with the cluster’s contracted EAP provider for a range of wellbeing issues such as family problems, work-related stress, grief and loss. October safe work and mental health months – During October, the office focuses on various aspects of safety at work, including mental health. resilience workshops – In 2017–18, staff were able to attend workshops to understand factors that can affect their resilience and how they can improve it. Fitness Passport – Staff and their families can access a low-cost, flexible gym and pool membership offered in partnership with Fitness Passport.
See Section 6: Governance – Work health and safety (page 121) for more information about WHS claims and reports.
EPA Annual Report 2017–18
103
EPA Board 105
Executive members 110
Managing risks to achieve EPA objectives 113
Privacy management 119
Public access to information 119
Other statutory reporting requirements 120
Section 6:
Governance
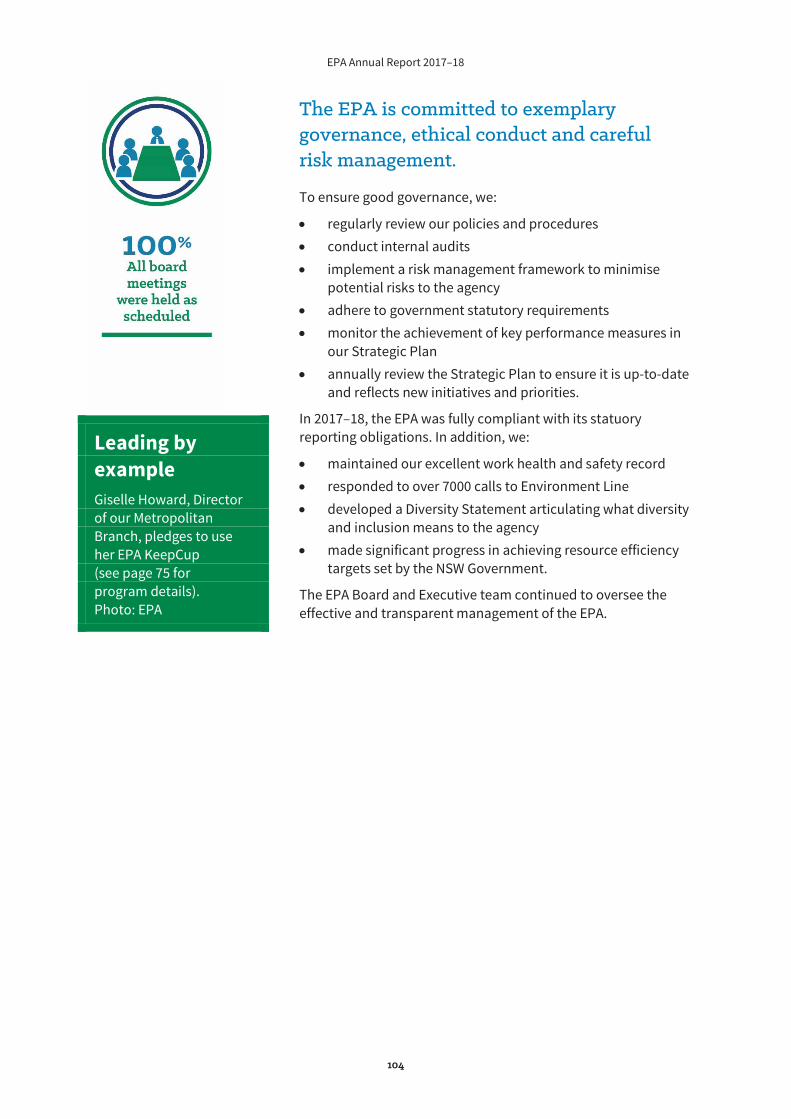
EPA Annual Report 2017–18
104
The EPA is committed to exemplary governance, ethical conduct and careful risk management.
To ensure good governance, we:
regularly review our policies and procedures conduct internal audits implement a risk management framework to minimise potential risks to the agency adhere to government statutory requirements monitor the achievement of key performance measures in our Strategic Plan annually review the Strategic Plan to ensure it is up-to-date and reflects new initiatives and priorities.
In 2017–18, the EPA was fully compliant with its statuory reporting obligations. In addition, we:
maintained our excellent work health and safety record responded to over 7000 calls to Environment Line developed a Diversity Statement articulating what diversity and inclusion means to the agency made significant progress in achieving resource efficiency targets set by the NSW Government.
The EPA Board and Executive team continued to oversee the effective and transparent management of the EPA.
Leading by example Giselle Howard, Director of our Metropolitan Branch, pledges to use her EPA KeepCup (see page 75 for program details). Photo: EPA
EPA Annual Report 2017–18
105
EPA and Board independence The independence of the Board and the EPA is established by the Protection of the Environment Administration Act 1991 (sections 15–19). In relation to independence, the Act specifies that:
The EPA Board is not subject to the control and direction of the Minister for the Environment in exercising any of its functions.
The Chair of the Board is appointed by the NSW Governor and is responsible for managing and controlling the affairs of the EPA in accordance with the Board’s policies and decisions, subject to any directions of the Minister.
The EPA is not subject to the control and direction of the Minister in relation to any:
o report or recommendation made to the Minister
o state of the environment report
o decision to institute criminal or related proceedings.
A report of any direction by the Minister is required to be tabled by or on behalf of the Minister in each House of Parliament and is to be included in the next available annual report.
EPA Board The EPA Board is an independent governing body that oversees and monitors the organisation. The Board has five members: the Chair and CEO, who is also the presiding member of the Board, and four part-time members who are appointed by the Governor of NSW on the recommendation of the Minister for the Environment.
EPA Board members have extensive experience in the fields of environmental science, environmental law, transport and infrastructure, business and corporate finance, risk planning and management. They also have established ties to, and understanding of, business and community groups.
When the Chair and CEO is on leave, or otherwise unavailable, the Minister appoints an Acting Chair and CEO. Following the resignation of Barry Buffier (effective 8 January 2018), Chief Environmental Regulator Mark Gifford was Acting Chair and CEO until the appointment of Anissa Levy to this role from 12 March.
Board members
Anissa Levy: Acting EPA Chair and CEO (from 12 March 2018) Bachelor of Engineering (Civil Engineering)
Appointed as Acting Chair and CEO on 12 March 2018
Anissa Levy brings a mix of private sector and state and local government experience to the EPA, spanning strategic transport planning and infrastructure planning and delivery. She has held several senior executive positions in the NSW Government.
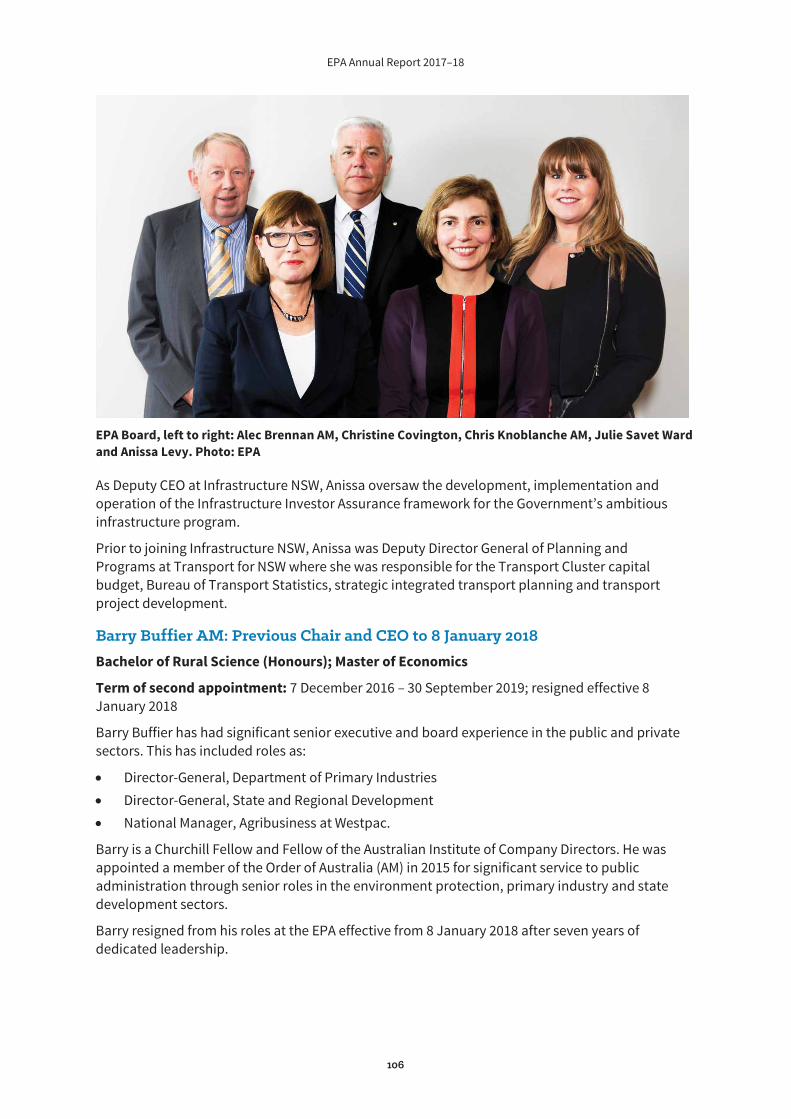
EPA Annual Report 2017–18
106
EPA Board, left to right: Alec Brennan AM, Christine Covington, Chris Knoblanche AM, Julie Savet Ward and Anissa Levy. Photo: EPA
As Deputy CEO at Infrastructure NSW, Anissa oversaw the development, implementation and operation of the Infrastructure Investor Assurance framework for the Government’s ambitious infrastructure program.
Prior to joining Infrastructure NSW, Anissa was Deputy Director General of Planning and Programs at Transport for NSW where she was responsible for the Transport Cluster capital budget, Bureau of Transport Statistics, strategic integrated transport planning and transport project development.
Barry Buffier AM: Previous Chair and CEO to 8 January 2018 Bachelor of Rural Science (Honours); Master of Economics
Term of second appointment: 7 December 2016 – 30 September 2019; resigned effective 8 January 2018
Barry Buffier has had significant senior executive and board experience in the public and private sectors. This has included roles as:
Director-General, Department of Primary Industries Director-General, State and Regional Development National Manager, Agribusiness at Westpac.
Barry is a Churchill Fellow and Fellow of the Australian Institute of Company Directors. He was appointed a member of the Order of Australia (AM) in 2015 for significant service to public administration through senior roles in the environment protection, primary industry and state development sectors.
Barry resigned from his roles at the EPA effective from 8 January 2018 after seven years of dedicated leadership.
EPA Annual Report 2017–18
107
Alec Brennan AM Bachelor of Science (Food Technology)(Honours); Master of Business Administration
Term of second appointment: 7 December 2016 – 6 December 2018
Alec Brennan brings to the EPA Board 40 years’ business experience in a range of industries including manufacturing, resources and distribution. His expertise covers such areas as strategy, process management, governance and finance and risk management. He also chairs the EPA Finance, Audit and Risk Committee.
Alec has been a public company director for more than 20 years and is a director of several private companies. He is a Fellow of the Australian Institute of Company Directors.
Alec was appointed a Member of the Order of Australia (AM) in 2013 for significant service to business and commerce, tertiary education administration and the community.
Christine Covington Diploma in Law
Term of second appointment: 7 December 2016 – 6 December 2020
Christine Covington is a solicitor of the Supreme Court of NSW with over 30 years’ experience in environmental, planning and property law. As a partner at Corrs Chambers Westgarth, Christine has worked widely with local government and on community engagement. Christine also has extensive experience in the NSW Land and Environment Court and the Supreme Court, dealing with planning appeals and environmental prosecutions.
Other professional roles and experience include:
NSW Government appointee to the Central Sydney Planning Committee Board member, Barangaroo Delivery Authority Board member (2009–2016), City West Housing Pty Ltd Deputy chair, ACT City Renewal Authority Fellow, Australian Institute of Company Directors.
Chris Knoblanche AM Bachelor of Commerce (Accounting and Financial Management)
Term of second appointment: 7 December 2016 – 6 December 2020
Chris Knoblanche has been advising local and multinational companies for over 35 years in areas such as corporate strategy, financing, risk control and management. He is a company director on several boards. Chris also sits on the EPA Finance, Audit and Risk Committee. Chris was previously CEO/Head of Citigroup, Corporate and Investment Banking, Australia and New Zealand. He is a member of the Institute of Chartered Accountants and a Fellow of the Australian Society of Certified Practising Accountants.
Chris was appointed a member of the Order of Australia (AM) in 2014 for significant service to arts administration, the community and the business and finance sector. In 2001, he was awarded the Centenary Medal by the Australian Government for service to Australian society through business and the arts.
EPA Annual Report 2017–18
108
Julie Savet Ward Bachelor of Science (Applied Physical Geography)(Honours); Master of Landscape Planning
Term of second appointment: 7 December 2016 – 6 December 2018
Julie Savet Ward has over 30 years’ experience in science, planning and the environment. She has expertise in environmental and sustainability regulation and a deep understanding of the planning, approval, design, construction and management of infrastructure, property and natural resource projects.
Julie is also skilled in brokering and managing relationships between government and the community. She is an experienced director and currently chairs or is a director of four boards. Julie is also a Fellow of the Australian Institute of Company Directors.
What does the EPA Board do? The Board’s functions, responsibilities and governance are detailed in its charter, which builds on provisions in the Protection of the Environment Operations Act 1997 (POEO Act) and Protection of the Environment Administration Act 1991 (POEA Act) and is reviewed every two to three years to ensure it meets contemporary requirements. The most recent review was finalised in May 2018.
In accordance with its charter, the EPA Board:
determines the EPA’s policies and long-term strategic plans oversees the effective, efficient and economic management of the organisation develops public information guidelines relating to criminal and related proceedings determines whether the EPA should prosecute for serious environment protection offences referred to in section 17 of the POEA Act advises the Minister for the Environment on matters relating to environment protection receives reports from staff on any failure by the EPA to comply with the requirement to review environment protection licences every five years approves exemptions from the provisions of EPA-administered legislation where the EPA is satisfied that compliance is not practicable and non-compliance will have no significant adverse effect on public health, property or the environment provides the Minister with an annual Regulatory Assurance Statement which summarises the EPA’s performance and is tabled in Parliament with the Annual Report and made available on the EPA website.
Board meetings held In 2017–18, the EPA Board met 12 times. Members attended all meetings, with the exception of Alec Brennan AM, who was unable to attend the Board meeting of 27 June 2018. He instead provided feedback on selected papers prior to the meeting.
8 August 2017 1 September 2017 (teleconference) 19 September 2017 (teleconference) 25 September 2017 2 November 2017 11 November 2017 (teleconference) 6 December 2017
EPA Annual Report 2017–18
109
20 December 2017 (teleconference) 21 February 2018 5 April 2018 17 May 2018 27 June 2018.
On 5 December 2017, the EPA Board held a joint strategic planning session with the EPA Executive.
Integrity of the Board
Conflict of interest disclosures Board members must disclose any pecuniary or other interests that may conflict with the proper performance of their duties. See Appendix 7 for details of these requirements.
All members of the EPA Board lodged their ordinary disclosure returns for the 2017–18 financial year by 1 October 2017.
In addition, all members of the Board provided Key Management Personnel Certificates in accordance with Australian Accounting Standards Board Standard 124.
Code of conduct The Board follows:
the EPA Board Code of Conduct, which outlines the fundamental values and principles that define the standards of behaviour expected of Board members the NSW Government Boards and Committees Guidelines, which outline fundamental values and principles that members should adhere to when carrying out their duties the Guidelines for Boards of Government Businesses, which outline the key private sector standards of corporate governance which are most appropriate to the practices and procedures for boards of government businesses.
Our Executive team The EPA Executive team comprises the Chair and CEO, the Chief Environmental Regulator and six senior directors. The Executive team leads the implementation of the EPA’s operations and is responsible for:
setting strategic directions for the EPA delivery of the EPA Strategic Plan final approval of policies, programs, systems and procedures overseeing the EPA’s regulatory framework overseeing an appropriate and effective financial and governance framework.
Our Executive team brings a wide range of skills and experience to the organisation, including in the areas of regulation, policy, communications, planning and conservation.
The Executive team is part of the EPA’s Senior Management Group, as shown in the EPA Organisation Chart. SMG work includes:
discussing key initiatives and challenges for the EPA sharing information on branch initiatives and priorities (such as ICT and system improvements)
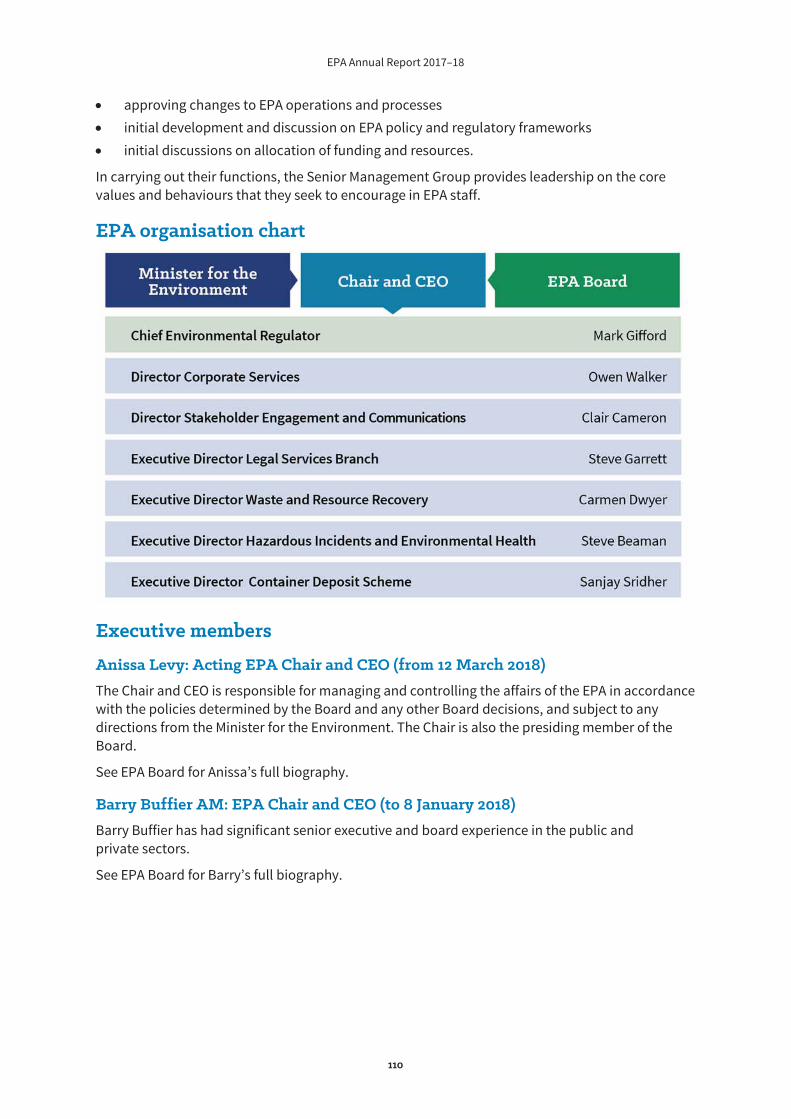
EPA Annual Report 2017–18
110
approving changes to EPA operations and processes initial development and discussion on EPA policy and regulatory frameworks initial discussions on allocation of funding and resources.
In carrying out their functions, the Senior Management Group provides leadership on the core values and behaviours that they seek to encourage in EPA staff.
EPA organisation chart
Executive members
Anissa Levy: Acting EPA Chair and CEO (from 12 March 2018) The Chair and CEO is responsible for managing and controlling the affairs of the EPA in accordance with the policies determined by the Board and any other Board decisions, and subject to any directions from the Minister for the Environment. The Chair is also the presiding member of the Board.
See EPA Board for Anissa’s full biography.
Barry Buffier AM: EPA Chair and CEO (to 8 January 2018) Barry Buffier has had significant senior executive and board experience in the public and private sectors.
See EPA Board for Barry’s full biography.
EPA Annual Report 2017–18
111
Mark Gifford PSM: Chief Environmental Regulator Bachelor of Business (Public Administration)
Mark Gifford leads the EPA’s day-to-day regulatory operations to ensure:
efficient delivery of diverse and complex environment protection services provision of targeted environmental policies and programs.
Mark has more than 30 years’ experience in management and leadership of government agencies. For most of that time he has worked in the areas of regulation and environment protection and conservation.
Carmen Dwyer: Acting Executive Director, Waste and Resource Recovery Bachelor of Applied Science (Environmental Science); Master of Applied Science (Environmental Restoration, Rehabilitation and Management)
Carmen Dwyer has led the Waste and Resource Recovery Division at the EPA since November 2017. Carmen has held a number of senior and middle management roles with the EPA. Some of her previous responsibilities included:
implementing the EPA’s transition to lead environmental regulator of coal seam gas delivery of regional compliance priorities across a broad range of industries development of pesticides policies.
Ms Dwyer has delivered the roles from central and western NSW and is currently based in the Dubbo office.
Steve Beaman PSM: Executive Director, Hazardous Incidents and Environmental Health Bachelor of Science
Steve Beaman has almost 25 years’ experience in environmental policy and regulation in the NSW Government, including more than 10 years as a Senior Executive. This experience is across a diverse range of policy and program areas, including incident management, contaminated sites, radiation regulation, chemicals, natural resources management, environmental planning and regulation, resource recovery and community programs.
Steve was recognised for his work with a Public Service Medal for outstanding public service to the NSW environment through waste reduction and recycling programs in 2016 and a Leaders List award by the environmental business WME Magazine for individual leadership in sustainability in 2014.
Clair Cameron: Director, Stakeholder Engagement and Communications Bachelor of Arts Communications (Public Relations and Organisational Communication); Master of Health Law
Clair Cameron leads communications, public affairs and stakeholder engagement, ensuring that her team provides clear and responsive information to the public and develops effective engagement and collaboration approaches.
Clair has a wealth of experience in communications and stakeholder engagement in both the private and public sectors. In her most recent position as General Manager, Communications and Stakeholder Engagement, Meat and Livestock Australia (MLA), Clair oversaw engagement with
EPA Annual Report 2017–18
112
multiple stakeholders, including peak councils, industry bodies, the Australian Government and Ministers’ offices.
Before the MLA, Clair worked for FTI Consulting, where as the head of Corporate and Public Affairs she managed a range of high-profile national and international clients. She has also worked in state government and in a Ministerial office.
Owen Walker: Director, Corporate Services, Chief Finance Officer Bachelor of Business (Economics and Finance); Masters in Accountancy; Certified Practising Accountant
Owen Walker leads the EPA’s corporate services, including:
corporate financial management and control corporate risk management and governance management and coordination of human resource strategies and WHS services ICT strategy and systems development and management management of POEO dangerous goods, pesticides and radiation licensing functions.
Owen has a wealth of experience in finance and governance in transport and environment portfolios in the NSW Government. He has held a number executive management positions over the past seven years.
Steve Garrett: Executive Director, Legal Services Bachelor of Economics; Bachelor of Laws
Steve Garrett leads the EPA’s Legal Services Branch.
Steve has worked in the EPA and the Office of Environment and Heritage since 1992 and has held senior management positions within the Legal Services Branch for about 20 years. He was previously an environmental lawyer with Blake Dawson Waldron (now Ashurst).
Steve has extensive experience in delivery and administration of environmental legislation to ensure good regulatory outcomes.
Sanjay Sridher: Executive Director, Container Deposit Scheme Masters of Business; Post-Graduate Certificate in Business Management; Post-Graduate Diploma in Change Management
Sanjay Sridher has significant experience in the public and private sectors as a senior executive. Prior to his current role, he was an Executive Vice President with the Downer Group and a Managing Director in Accenture’s Health and Public Service consulting practice.
Earlier career experiences include roles in the NSW Public Sector running Service First and as an Interim Executive for various departments in Her Majesty’s Government in the UK.
Sanjay is a certified Program and Project Manager and a Lean Six Sigma Champion.
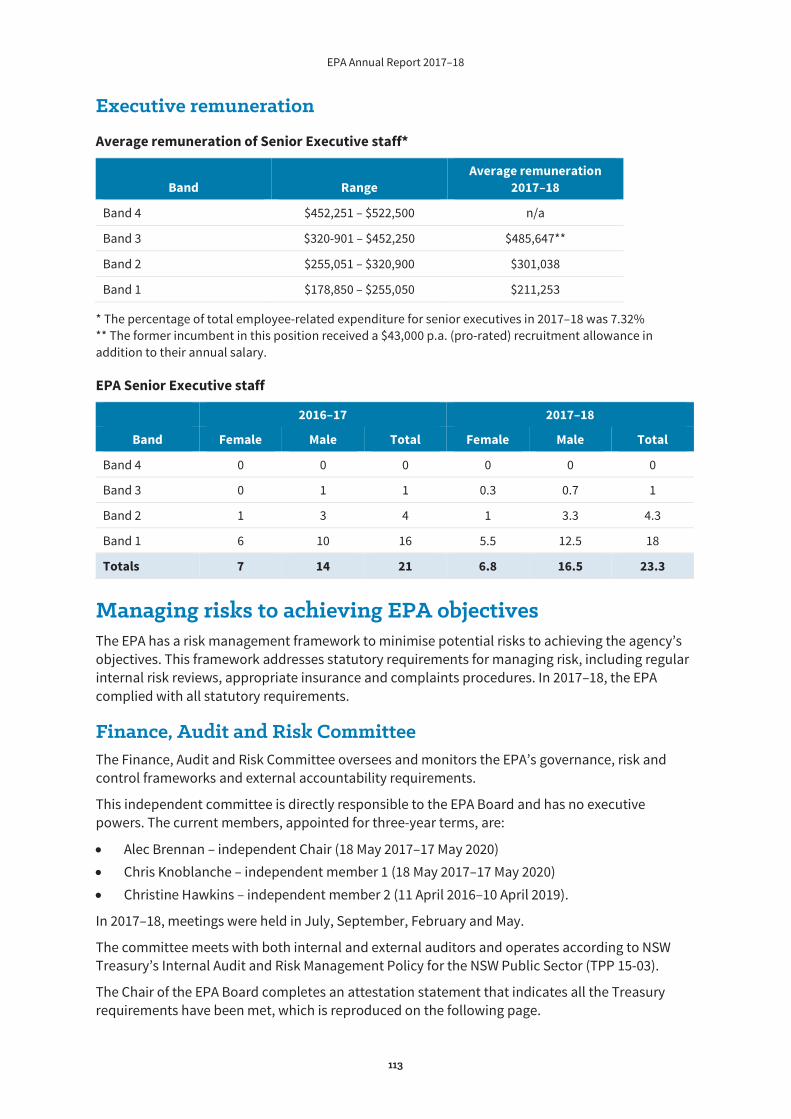
EPA Annual Report 2017–18
113
Executive remuneration
Average remuneration of Senior Executive staff*
Band Range Average remuneration
2017–18
Band 4 $452,251 – $522,500 n/a
Band 3 $320-901 – $452,250 $485,647**
Band 2 $255,051 – $320,900 $301,038
Band 1 $178,850 – $255,050 $211,253
* The percentage of total employee-related expenditure for senior executives in 2017–18 was 7.32% ** The former incumbent in this position received a $43,000 p.a. (pro-rated) recruitment allowance in addition to their annual salary.
EPA Senior Executive staff
2016–17 2017–18
Band Female Male Total Female Male Total
Band 4 0 0 0 0 0 0
Band 3 0 1 1 0.3 0.7 1
Band 2 1 3 4 1 3.3 4.3
Band 1 6 10 16 5.5 12.5 18
Totals 7 14 21 6.8 16.5 23.3
Managing risks to achieving EPA objectives The EPA has a risk management framework to minimise potential risks to achieving the agency’s objectives. This framework addresses statutory requirements for managing risk, including regular internal risk reviews, appropriate insurance and complaints procedures. In 2017–18, the EPA complied with all statutory requirements.
Finance, Audit and Risk Committee The Finance, Audit and Risk Committee oversees and monitors the EPA’s governance, risk and control frameworks and external accountability requirements.
This independent committee is directly responsible to the EPA Board and has no executive powers. The current members, appointed for three-year terms, are:
Alec Brennan – independent Chair (18 May 2017–17 May 2020) Chris Knoblanche – independent member 1 (18 May 2017–17 May 2020) Christine Hawkins – independent member 2 (11 April 2016–10 April 2019).
In 2017–18, meetings were held in July, September, February and May.
The committee meets with both internal and external auditors and operates according to NSW Treasury’s Internal Audit and Risk Management Policy for the NSW Public Sector (TPP 15-03).
The Chair of the EPA Board completes an attestation statement that indicates all the Treasury requirements have been met, which is reproduced on the following page.
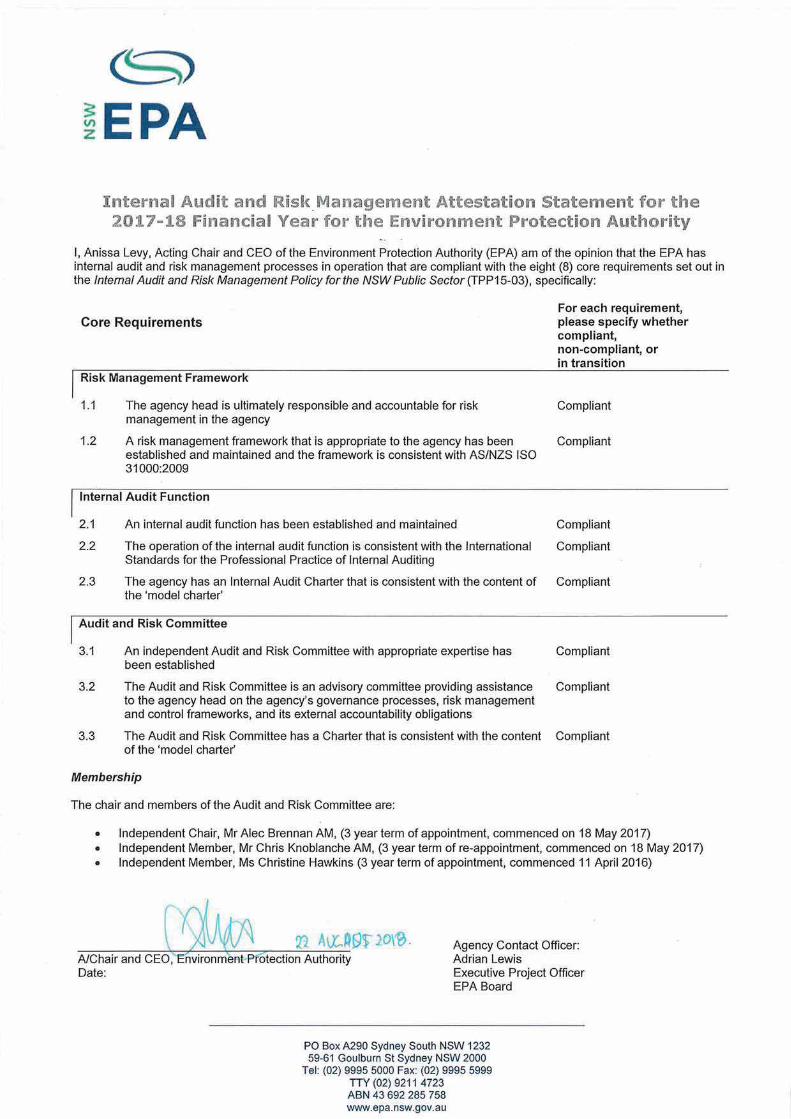
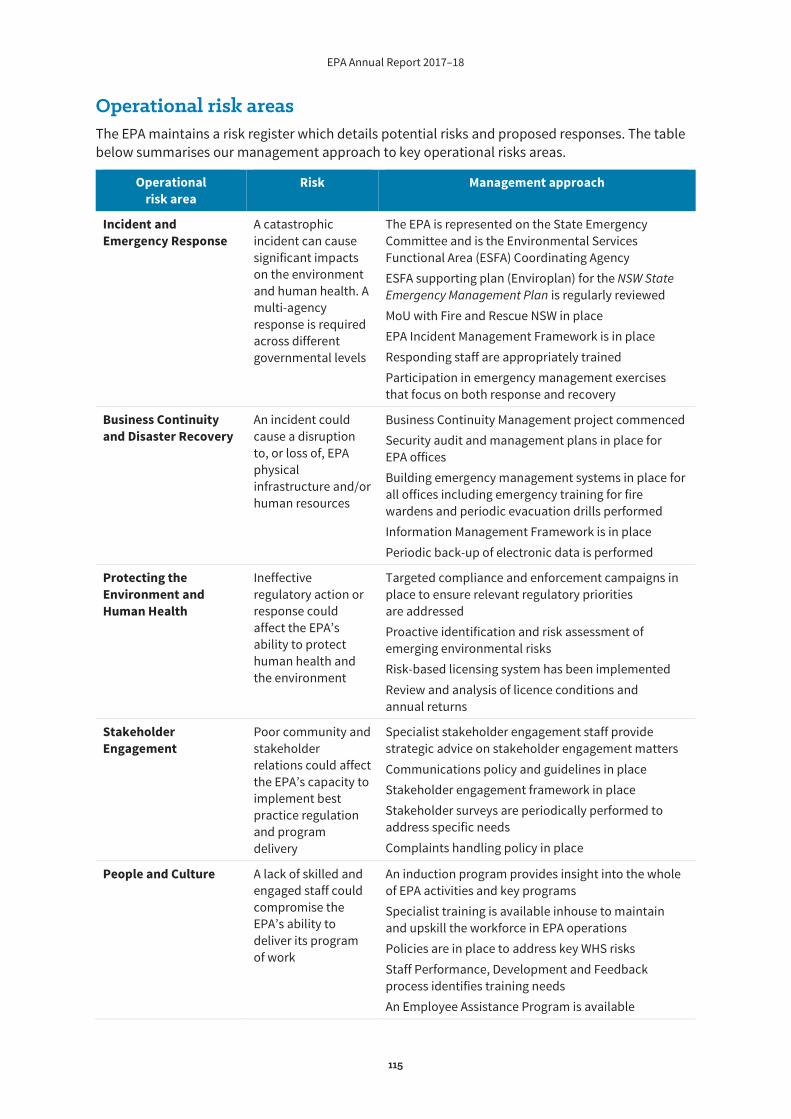
EPA Annual Report 2017–18
115
Operational risk areas The EPA maintains a risk register which details potential risks and proposed responses. The table below summarises our management approach to key operational risks areas.
Operational risk area
Risk Management approach
Incident and Emergency Response
A catastrophic incident can cause significant impacts on the environment and human health. A multi-agency response is required across different governmental levels
The EPA is represented on the State Emergency Committee and is the Environmental Services Functional Area (ESFA) Coordinating Agency ESFA supporting plan (Enviroplan) for the NSW State Emergency Management Plan is regularly reviewed MoU with Fire and Rescue NSW in place EPA Incident Management Framework is in place Responding staff are appropriately trained Participation in emergency management exercises that focus on both response and recovery
Business Continuity and Disaster Recovery
An incident could cause a disruption to, or loss of, EPA physical infrastructure and/or human resources
Business Continuity Management project commenced Security audit and management plans in place for EPA offices Building emergency management systems in place for all offices including emergency training for fire wardens and periodic evacuation drills performed Information Management Framework is in place Periodic back-up of electronic data is performed
Protecting the Environment and Human Health
Ineffective regulatory action or response could affect the EPA’s ability to protect human health and the environment
Targeted compliance and enforcement campaigns in place to ensure relevant regulatory priorities are addressed Proactive identification and risk assessment of emerging environmental risks Risk-based licensing system has been implemented Review and analysis of licence conditions and annual returns
Stakeholder Engagement
Poor community and stakeholder relations could affect the EPA’s capacity to implement best practice regulation and program delivery
Specialist stakeholder engagement staff provide strategic advice on stakeholder engagement matters Communications policy and guidelines in place Stakeholder engagement framework in place Stakeholder surveys are periodically performed to address specific needs Complaints handling policy in place
People and Culture A lack of skilled and engaged staff could compromise the EPA’s ability to deliver its program of work
An induction program provides insight into the whole of EPA activities and key programs Specialist training is available inhouse to maintain and upskill the workforce in EPA operations Policies are in place to address key WHS risks Staff Performance, Development and Feedback process identifies training needs An Employee Assistance Program is available
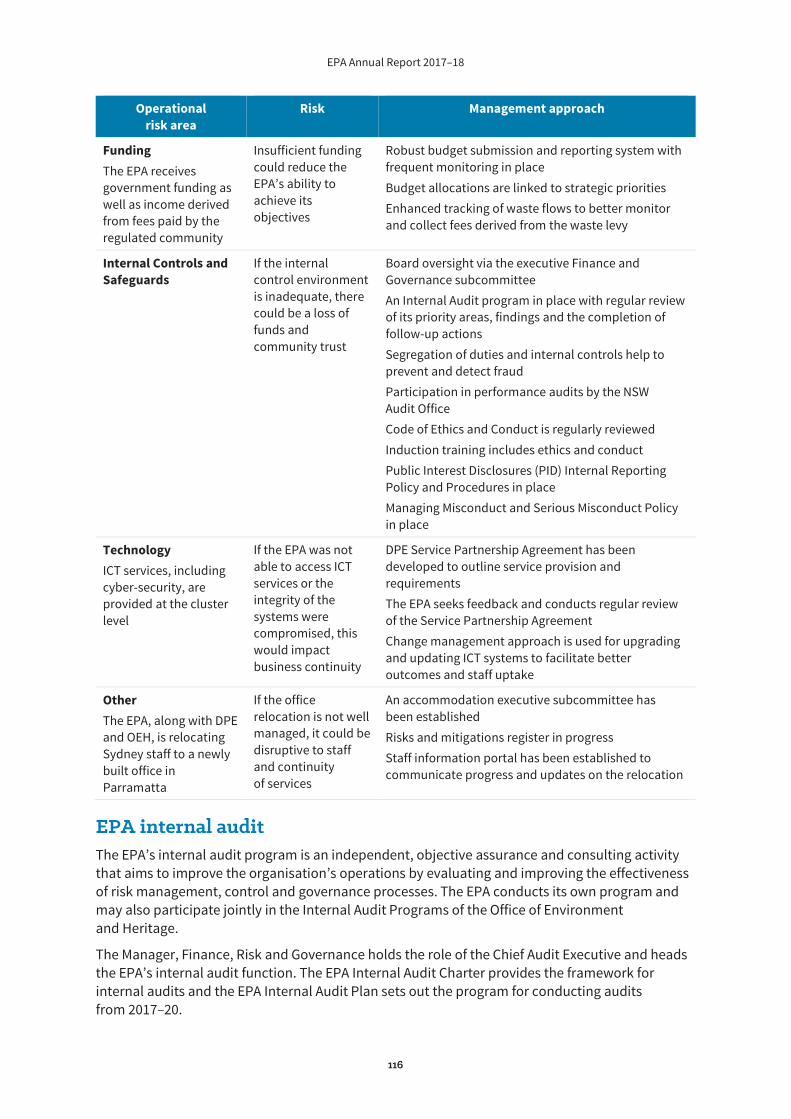
EPA Annual Report 2017–18
116
Operational risk area
Risk Management approach
Funding The EPA receives government funding as well as income derived from fees paid by the regulated community
Insufficient funding could reduce the EPA’s ability to achieve its objectives
Robust budget submission and reporting system with frequent monitoring in place Budget allocations are linked to strategic priorities Enhanced tracking of waste flows to better monitor and collect fees derived from the waste levy
Internal Controls and Safeguards
If the internal control environment is inadequate, there could be a loss of funds and community trust
Board oversight via the executive Finance and Governance subcommittee An Internal Audit program in place with regular review of its priority areas, findings and the completion of follow-up actions Segregation of duties and internal controls help to prevent and detect fraud Participation in performance audits by the NSW Audit Office Code of Ethics and Conduct is regularly reviewed Induction training includes ethics and conduct Public Interest Disclosures (PID) Internal Reporting Policy and Procedures in place Managing Misconduct and Serious Misconduct Policy in place
Technology ICT services, including cyber-security, are provided at the cluster level
If the EPA was not able to access ICT services or the integrity of the systems were compromised, this would impact business continuity
DPE Service Partnership Agreement has been developed to outline service provision and requirements The EPA seeks feedback and conducts regular review of the Service Partnership Agreement Change management approach is used for upgrading and updating ICT systems to facilitate better outcomes and staff uptake
Other The EPA, along with DPE and OEH, is relocating Sydney staff to a newly built office in Parramatta
If the office relocation is not well managed, it could be disruptive to staff and continuity of services
An accommodation executive subcommittee has been established Risks and mitigations register in progress Staff information portal has been established to communicate progress and updates on the relocation
EPA internal audit The EPA’s internal audit program is an independent, objective assurance and consulting activity that aims to improve the organisation’s operations by evaluating and improving the effectiveness of risk management, control and governance processes. The EPA conducts its own program and may also participate jointly in the Internal Audit Programs of the Office of Environment and Heritage.
The Manager, Finance, Risk and Governance holds the role of the Chief Audit Executive and heads the EPA’s internal audit function. The EPA Internal Audit Charter provides the framework for internal audits and the EPA Internal Audit Plan sets out the program for conducting audits from 2017–20.
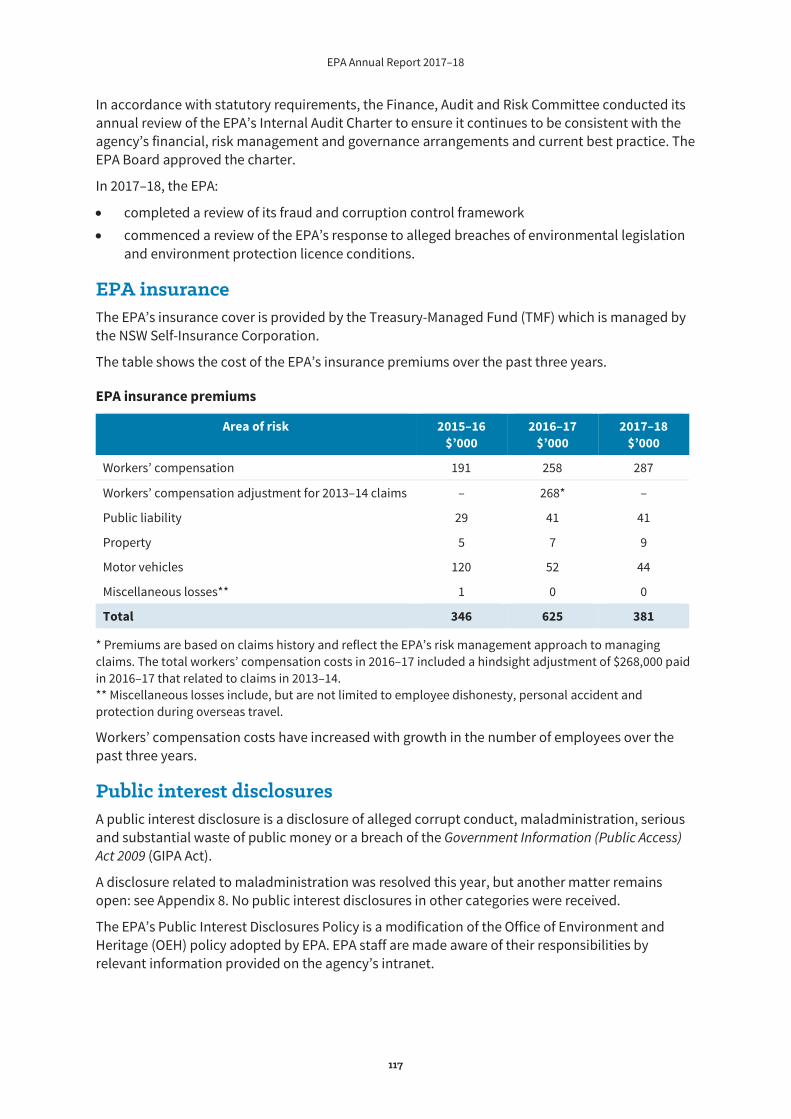
EPA Annual Report 2017–18
117
In accordance with statutory requirements, the Finance, Audit and Risk Committee conducted its annual review of the EPA’s Internal Audit Charter to ensure it continues to be consistent with the agency’s financial, risk management and governance arrangements and current best practice. The EPA Board approved the charter.
In 2017–18, the EPA:
completed a review of its fraud and corruption control framework commenced a review of the EPA’s response to alleged breaches of environmental legislation and environment protection licence conditions.
EPA insurance The EPA’s insurance cover is provided by the Treasury-Managed Fund (TMF) which is managed by the NSW Self-Insurance Corporation.
The table shows the cost of the EPA’s insurance premiums over the past three years.
EPA insurance premiums
Area of risk 2015–16 $’000
2016–17 $’000
2017–18 $’000
Workers’ compensation 191 258 287
Workers’ compensation adjustment for 2013–14 claims – 268* –
Public liability 29 41 41
Property 5 7 9
Motor vehicles 120 52 44
Miscellaneous losses** 1 0 0
Total 346 625 381
* Premiums are based on claims history and reflect the EPA’s risk management approach to managing claims. The total workers’ compensation costs in 2016–17 included a hindsight adjustment of $268,000 paid in 2016–17 that related to claims in 2013–14. ** Miscellaneous losses include, but are not limited to employee dishonesty, personal accident and protection during overseas travel.
Workers’ compensation costs have increased with growth in the number of employees over the past three years.
Public interest disclosures A public interest disclosure is a disclosure of alleged corrupt conduct, maladministration, serious and substantial waste of public money or a breach of the Government Information (Public Access) Act 2009 (GIPA Act).
A disclosure related to maladministration was resolved this year, but another matter remains open: see Appendix 8. No public interest disclosures in other categories were received.
The EPA’s Public Interest Disclosures Policy is a modification of the Office of Environment and Heritage (OEH) policy adopted by EPA. EPA staff are made aware of their responsibilities by relevant information provided on the agency’s intranet.
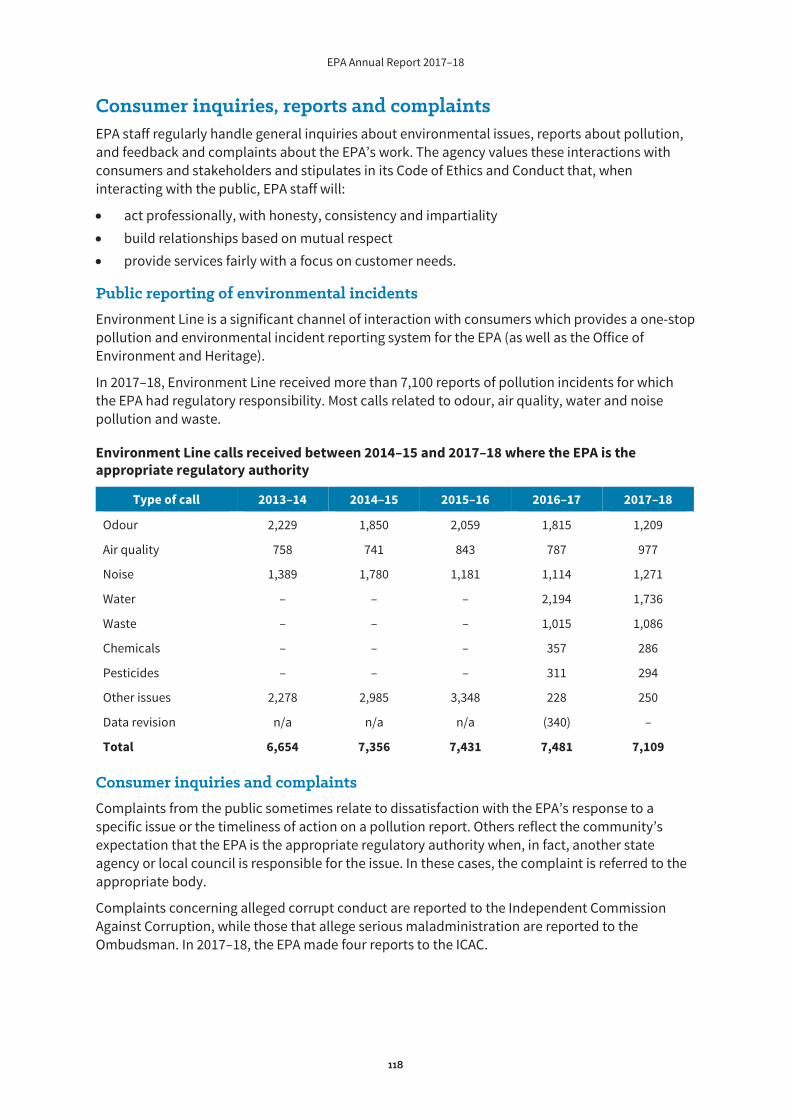
EPA Annual Report 2017–18
118
Consumer inquiries, reports and complaints EPA staff regularly handle general inquiries about environmental issues, reports about pollution, and feedback and complaints about the EPA’s work. The agency values these interactions with consumers and stakeholders and stipulates in its Code of Ethics and Conduct that, when interacting with the public, EPA staff will:
act professionally, with honesty, consistency and impartiality build relationships based on mutual respect provide services fairly with a focus on customer needs.
Public reporting of environmental incidents Environment Line is a significant channel of interaction with consumers which provides a one-stop pollution and environmental incident reporting system for the EPA (as well as the Office of Environment and Heritage).
In 2017–18, Environment Line received more than 7,100 reports of pollution incidents for which the EPA had regulatory responsibility. Most calls related to odour, air quality, water and noise pollution and waste.
Environment Line calls received between 2014–15 and 2017–18 where the EPA is the appropriate regulatory authority
Type of call 2013–14 2014–15 2015–16 2016–17 2017–18
Odour 2,229 1,850 2,059 1,815 1,209
Air quality 758 741 843 787 977
Noise 1,389 1,780 1,181 1,114 1,271
Water – – – 2,194 1,736
Waste – – – 1,015 1,086
Chemicals – – – 357 286
Pesticides – – – 311 294
Other issues 2,278 2,985 3,348 228 250
Data revision n/a n/a n/a (340) –
Total 6,654 7,356 7,431 7,481 7,109
Consumer inquiries and complaints Complaints from the public sometimes relate to dissatisfaction with the EPA’s response to a specific issue or the timeliness of action on a pollution report. Others reflect the community’s expectation that the EPA is the appropriate regulatory authority when, in fact, another state agency or local council is responsible for the issue. In these cases, the complaint is referred to the appropriate body.
Complaints concerning alleged corrupt conduct are reported to the Independent Commission Against Corruption, while those that allege serious maladministration are reported to the Ombudsman. In 2017–18, the EPA made four reports to the ICAC.
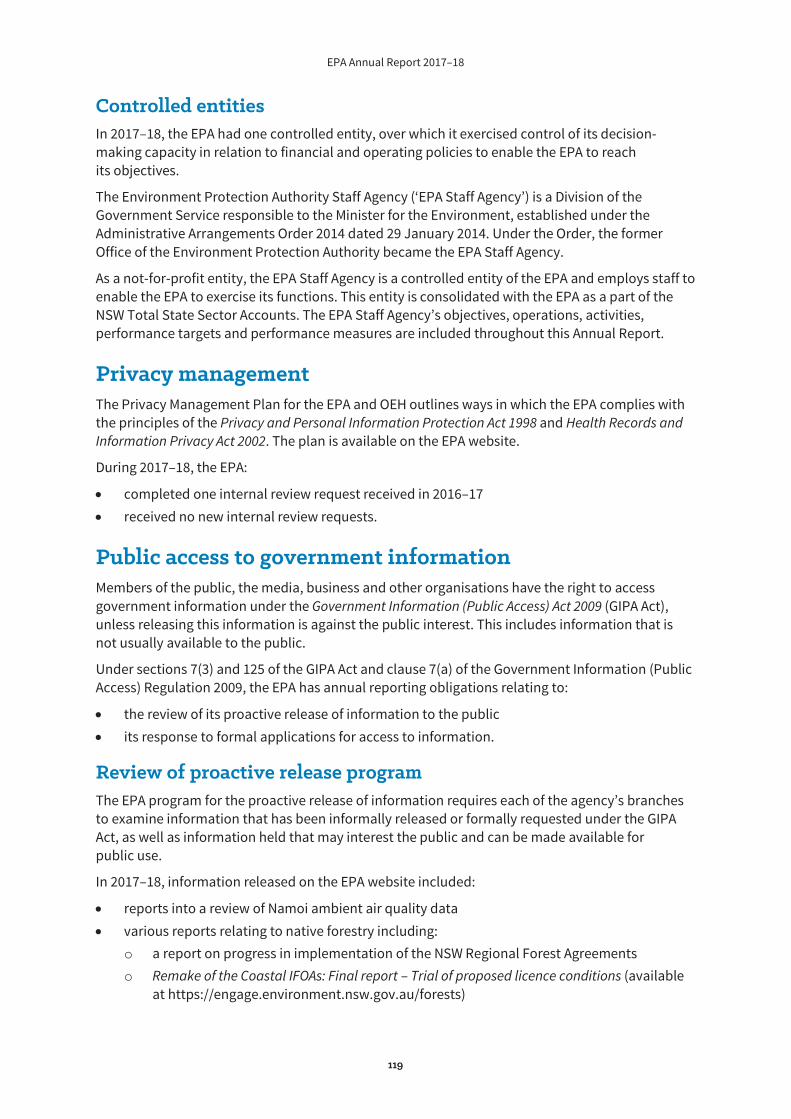
EPA Annual Report 2017–18
119
Controlled entities In 2017–18, the EPA had one controlled entity, over which it exercised control of its decision-making capacity in relation to financial and operating policies to enable the EPA to reach its objectives.
The Environment Protection Authority Staff Agency (‘EPA Staff Agency’) is a Division of the Government Service responsible to the Minister for the Environment, established under the Administrative Arrangements Order 2014 dated 29 January 2014. Under the Order, the former Office of the Environment Protection Authority became the EPA Staff Agency.
As a not-for-profit entity, the EPA Staff Agency is a controlled entity of the EPA and employs staff to enable the EPA to exercise its functions. This entity is consolidated with the EPA as a part of the NSW Total State Sector Accounts. The EPA Staff Agency’s objectives, operations, activities, performance targets and performance measures are included throughout this Annual Report.
Privacy management The Privacy Management Plan for the EPA and OEH outlines ways in which the EPA complies with the principles of the Privacy and Personal Information Protection Act 1998 and Health Records and Information Privacy Act 2002. The plan is available on the EPA website.
During 2017–18, the EPA:
completed one internal review request received in 2016–17 received no new internal review requests.
Public access to government information Members of the public, the media, business and other organisations have the right to access government information under the Government Information (Public Access) Act 2009 (GIPA Act), unless releasing this information is against the public interest. This includes information that is not usually available to the public.
Under sections 7(3) and 125 of the GIPA Act and clause 7(a) of the Government Information (Public Access) Regulation 2009, the EPA has annual reporting obligations relating to:
the review of its proactive release of information to the public its response to formal applications for access to information.
Review of proactive release program The EPA program for the proactive release of information requires each of the agency’s branches to examine information that has been informally released or formally requested under the GIPA Act, as well as information held that may interest the public and can be made available for public use.
In 2017–18, information released on the EPA website included:
reports into a review of Namoi ambient air quality data various reports relating to native forestry including: o a report on progress in implementation of the NSW Regional Forest Agreements o Remake of the Coastal IFOAs: Final report – Trial of proposed licence conditions (available
at https://engage.environment.nsw.gov.au/forests)
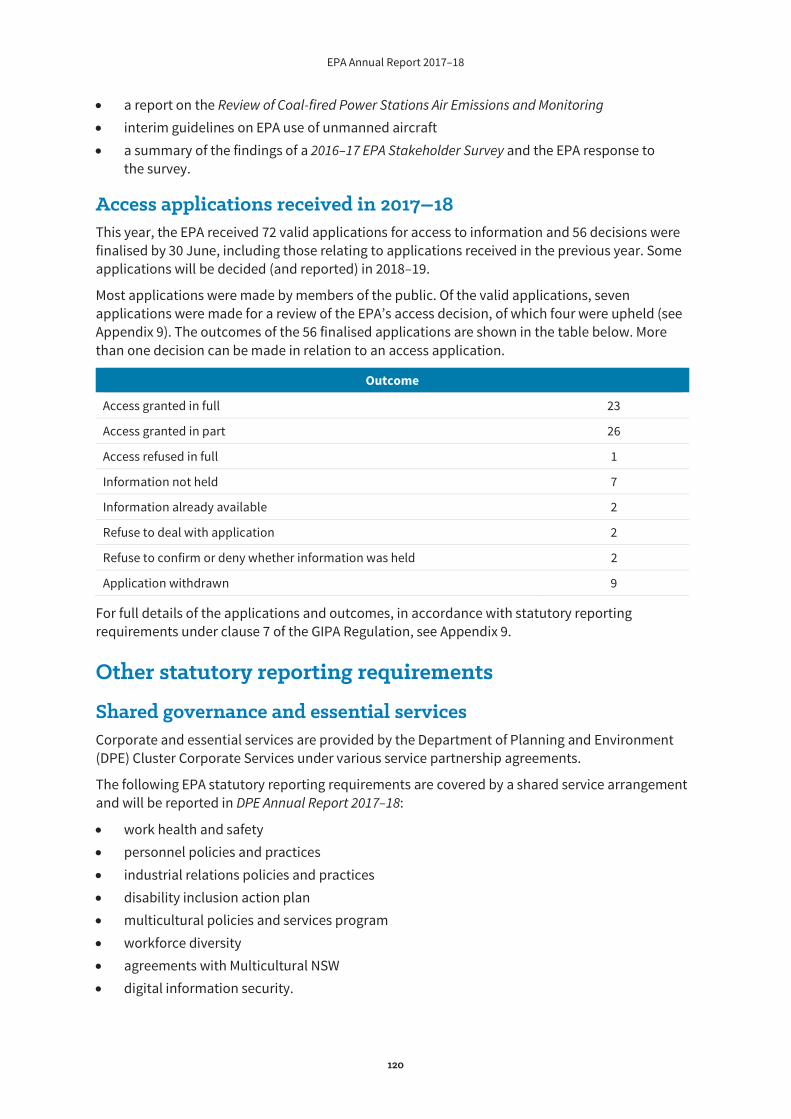
EPA Annual Report 2017–18
120
a report on the Review of Coal-fired Power Stations Air Emissions and Monitoring interim guidelines on EPA use of unmanned aircraft a summary of the findings of a 2016–17 EPA Stakeholder Survey and the EPA response to the survey.
Access applications received in 2017–18 This year, the EPA received 72 valid applications for access to information and 56 decisions were finalised by 30 June, including those relating to applications received in the previous year. Some applications will be decided (and reported) in 2018–19.
Most applications were made by members of the public. Of the valid applications, seven applications were made for a review of the EPA’s access decision, of which four were upheld (see Appendix 9). The outcomes of the 56 finalised applications are shown in the table below. More than one decision can be made in relation to an access application.
Outcome
Access granted in full 23
Access granted in part 26
Access refused in full 1
Information not held 7
Information already available 2
Refuse to deal with application 2
Refuse to confirm or deny whether information was held 2
Application withdrawn 9
For full details of the applications and outcomes, in accordance with statutory reporting requirements under clause 7 of the GIPA Regulation, see Appendix 9.
Other statutory reporting requirements
Shared governance and essential services Corporate and essential services are provided by the Department of Planning and Environment (DPE) Cluster Corporate Services under various service partnership agreements.
The following EPA statutory reporting requirements are covered by a shared service arrangement and will be reported in DPE Annual Report 2017–18:
work health and safety personnel policies and practices industrial relations policies and practices disability inclusion action plan multicultural policies and services program workforce diversity agreements with Multicultural NSW digital information security.
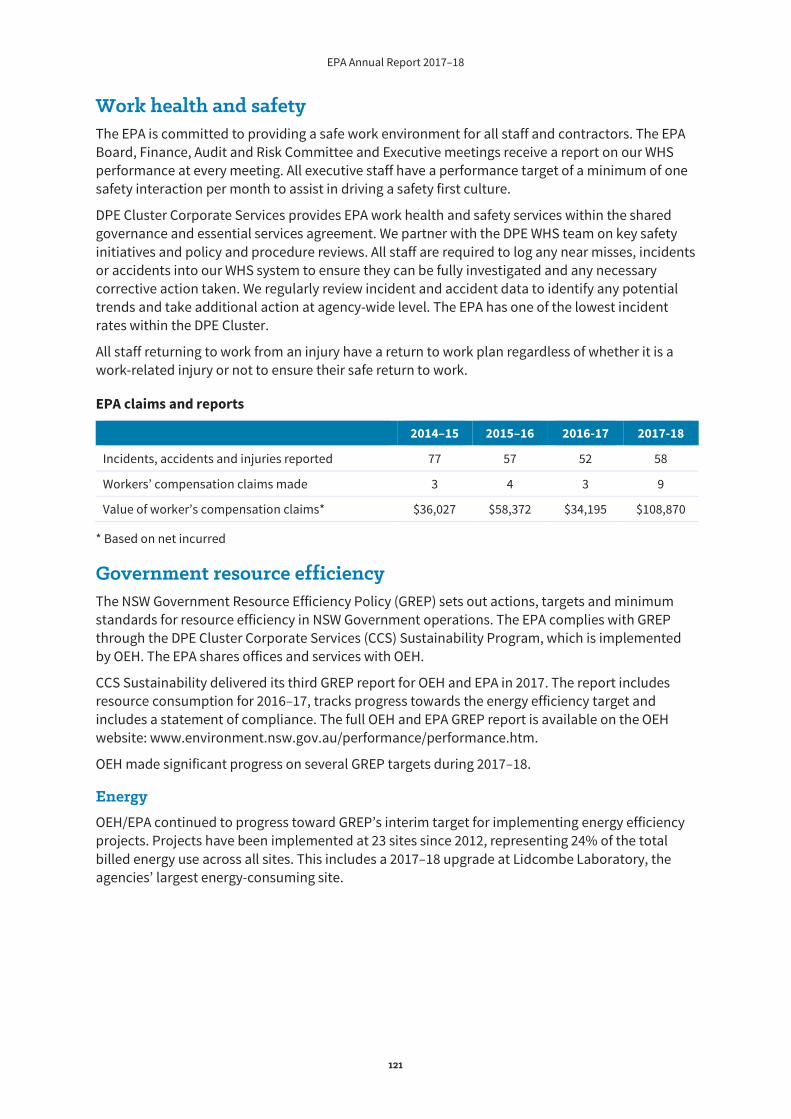
EPA Annual Report 2017–18
121
Work health and safety The EPA is committed to providing a safe work environment for all staff and contractors. The EPA Board, Finance, Audit and Risk Committee and Executive meetings receive a report on our WHS performance at every meeting. All executive staff have a performance target of a minimum of one safety interaction per month to assist in driving a safety first culture.
DPE Cluster Corporate Services provides EPA work health and safety services within the shared governance and essential services agreement. We partner with the DPE WHS team on key safety initiatives and policy and procedure reviews. All staff are required to log any near misses, incidents or accidents into our WHS system to ensure they can be fully investigated and any necessary corrective action taken. We regularly review incident and accident data to identify any potential trends and take additional action at agency-wide level. The EPA has one of the lowest incident rates within the DPE Cluster.
All staff returning to work from an injury have a return to work plan regardless of whether it is a work-related injury or not to ensure their safe return to work.
EPA claims and reports
2014–15 2015–16 2016-17 2017-18
Incidents, accidents and injuries reported 77 57 52 58
Workers’ compensation claims made 3 4 3 9
Value of worker’s compensation claims* $36,027 $58,372 $34,195 $108,870
* Based on net incurred
Government resource efficiency The NSW Government Resource Efficiency Policy (GREP) sets out actions, targets and minimum standards for resource efficiency in NSW Government operations. The EPA complies with GREP through the DPE Cluster Corporate Services (CCS) Sustainability Program, which is implemented by OEH. The EPA shares offices and services with OEH.
CCS Sustainability delivered its third GREP report for OEH and EPA in 2017. The report includes resource consumption for 2016–17, tracks progress towards the energy efficiency target and includes a statement of compliance. The full OEH and EPA GREP report is available on the OEH website: www.environment.nsw.gov.au/performance/performance.htm.
OEH made significant progress on several GREP targets during 2017–18.
Energy OEH/EPA continued to progress toward GREP’s interim target for implementing energy efficiency projects. Projects have been implemented at 23 sites since 2012, representing 24% of the total billed energy use across all sites. This includes a 2017–18 upgrade at Lidcombe Laboratory, the agencies’ largest energy-consuming site.
EPA Annual Report 2017–18
122
NABERS ratings The National Australian Built Environment Scheme (NABERS) ratings help organisations understand and improve their environmental performance. In 2017–18:
OEH/EPA exceeded the GREP 4.5-star minimum requirement at the largest shared offices, with 5 stars at Goulburn Street head office and 5.5 stars at Parramatta OEH became the first NSW Government agency to achieve a NABERS Energy IT equipment rating. The 5 stars received for OEH/EPA data centres exceeded the GREP 4.5-star minimum.
Waste In 2017–18, OEH/EPA built on previous savings of office paper with the implementation of Hold Print technology in head office. A survey of 170 staff found that staff welcomed the initiative.
OEH also:
worked with CCS Procurement to identify potential efficiency gains from placing sites onto government waste contracts participated in a trial of the NABERS Waste Platform at head office – based on the outcomes from this trial, which identified opportunities for improving our waste management, OEH investigated strategies for increasing recycling rates by providing modular waste and recycling terminals across office floors.
Community of practice In addition to GREP compliance, CCS Sustainability initiated a community of practice with other cluster sustainability representatives to help drive more cohesive sustainability initiatives across the cluster. Quarterly meetings help members identify common issues, share learnings and experiences in resource efficiency, and ensure the group is empowered to deliver improved sustainability outcomes across the cluster. The EPA Sustainability Coordinator is a member of this network.
The EPA also conducted several waste reduction initiatives during 2017–18. See Section 2: Our performance – key result area 6 for more information.
Overseas travel There was no overseas travel by EPA staff in 2017– 18.
EPA Annual Report 2017–18
123
Financial overview 124
Budgets 125
Expenditure 125
EPA financial statements 133
EPA Staff Agency financial statements 170
Section 7:
Financial performance
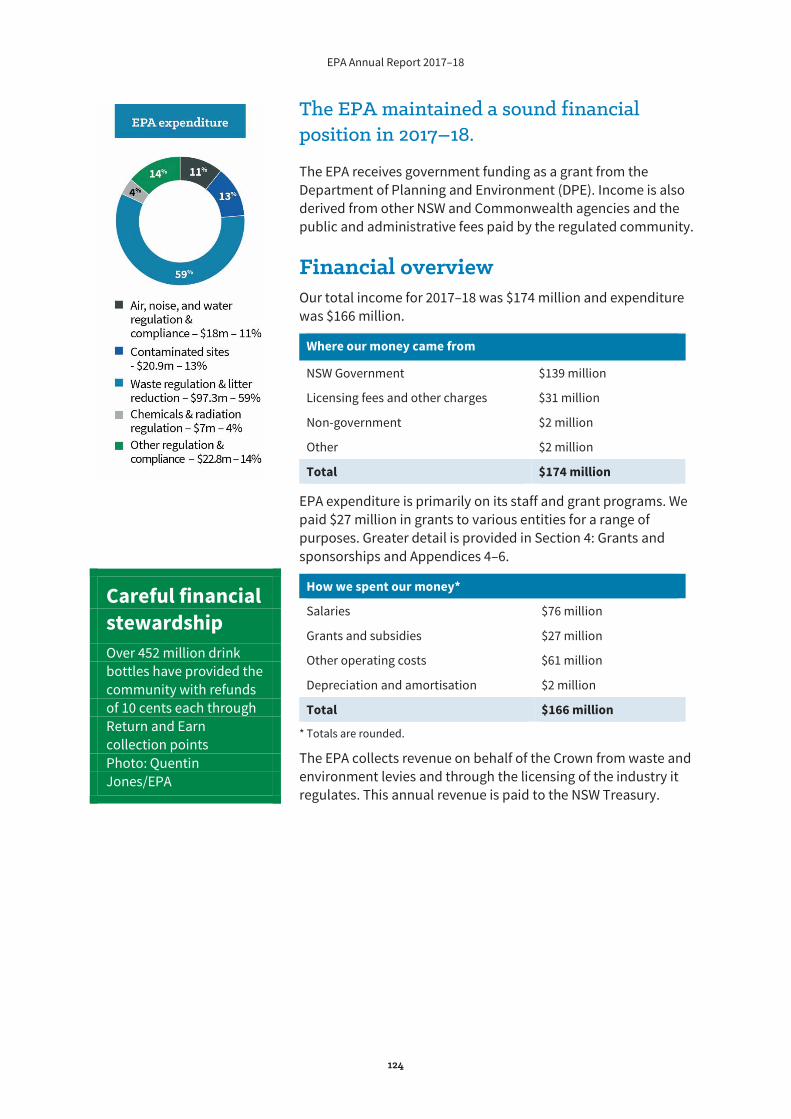
EPA Annual Report 2017–18
124
The EPA maintained a sound financial position in 2017–18.
The EPA receives government funding as a grant from the Department of Planning and Environment (DPE). Income is also derived from other NSW and Commonwealth agencies and the public and administrative fees paid by the regulated community.
Financial overview Our total income for 2017–18 was $174 million and expenditure was $166 million.
Where our money came from
NSW Government $139 million
Licensing fees and other charges $31 million
Non-government $2 million
Other $2 million
Total $174 million
EPA expenditure is primarily on its staff and grant programs. We paid $27 million in grants to various entities for a range of purposes. Greater detail is provided in Section 4: Grants and sponsorships and Appendices 4–6.
How we spent our money*
Salaries $76 million
Grants and subsidies $27 million
Other operating costs $61 million
Depreciation and amortisation $2 million
Total $166 million
* Totals are rounded.
The EPA collects revenue on behalf of the Crown from waste and environment levies and through the licensing of the industry it regulates. This annual revenue is paid to the NSW Treasury.
Careful financial stewardship Over 452 million drink bottles have provided the community with refunds of 10 cents each through Return and Earn collection points Photo: Quentin Jones/EPA
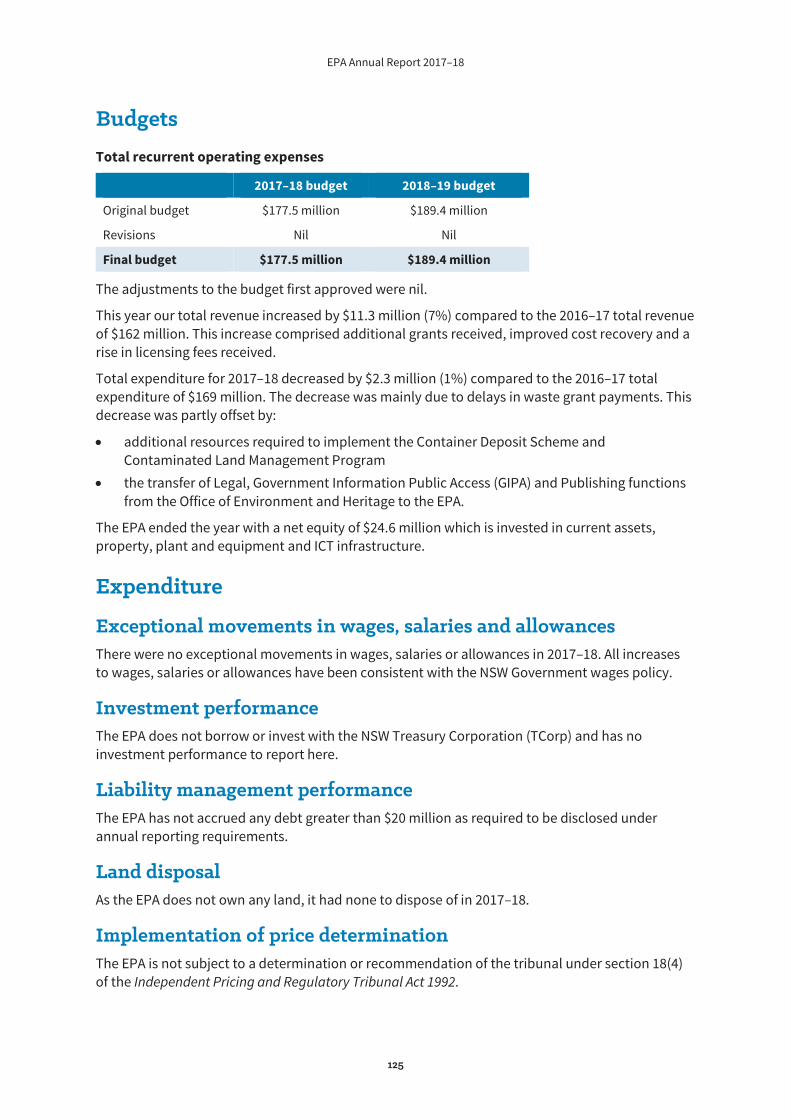
EPA Annual Report 2017–18
125
Budgets Total recurrent operating expenses
2017–18 budget 2018–19 budget
Original budget $177.5 million $189.4 million
Revisions Nil Nil
Final budget $177.5 million $189.4 million
The adjustments to the budget first approved were nil.
This year our total revenue increased by $11.3 million (7%) compared to the 2016–17 total revenue of $162 million. This increase comprised additional grants received, improved cost recovery and a rise in licensing fees received.
Total expenditure for 2017–18 decreased by $2.3 million (1%) compared to the 2016–17 total expenditure of $169 million. The decrease was mainly due to delays in waste grant payments. This decrease was partly offset by:
additional resources required to implement the Container Deposit Scheme and Contaminated Land Management Program the transfer of Legal, Government Information Public Access (GIPA) and Publishing functions from the Office of Environment and Heritage to the EPA.
The EPA ended the year with a net equity of $24.6 million which is invested in current assets, property, plant and equipment and ICT infrastructure.
Expenditure
Exceptional movements in wages, salaries and allowances There were no exceptional movements in wages, salaries or allowances in 2017–18. All increases to wages, salaries or allowances have been consistent with the NSW Government wages policy.
Investment performance The EPA does not borrow or invest with the NSW Treasury Corporation (TCorp) and has no investment performance to report here.
Liability management performance The EPA has not accrued any debt greater than $20 million as required to be disclosed under annual reporting requirements.
Land disposal As the EPA does not own any land, it had none to dispose of in 2017–18.
Implementation of price determination The EPA is not subject to a determination or recommendation of the tribunal under section 18(4) of the Independent Pricing and Regulatory Tribunal Act 1992.

EPA Annual Report 2017–18
126
Consultants
Disclosure of subsidiaries The EPA had no subsidiaries in 2017–18.
Consultancies of $50,000 or more
Consultant Category Consultancy description Cost
PricewaterhouseCoopers Environmental Commercial advice on the setup of the Container Deposit Scheme
$1,295,863
WSP Australia Pty Ltd Environmental James Hardie legacy asbestos management program
$425,354
Marsden Jacob Associates Environmental Preparation of cost-benefit analysis and regulatory impact statement for the remake of the Clean Air Regulation
$128,300
Centre for International Economics
Environmental Economic modelling and cost-benefit analysis for the load-based licensing review
$77,705
Elemental Group Australia Pty Ltd
Environmental Development of a prioritisation framework for assessing industrial chemicals
$74,500
Aurecon Australia Pty Ltd Environmental Economic appraisal of introducing diesel locomotive exhaust emission limits in NSW
$57,035
Ernst & Young Environmental Container Deposit Scheme advisory services
$55,349
Rawtec Pty Ltd Environmental Advice on disaster waste management
$53,550
Centre for International Economics
Environmental Analysis of market issues related to glass recycling
$50,000
Subtotal $2,217,656
Consultancies of less than $50,000
Consultant Number Cost
Environmental 46 $764,373
Organisational review 3 $89,164
Management services 7 $85,098
Legal 3 $39,965
Subtotal $978,600
Total consultancies $3,196,256
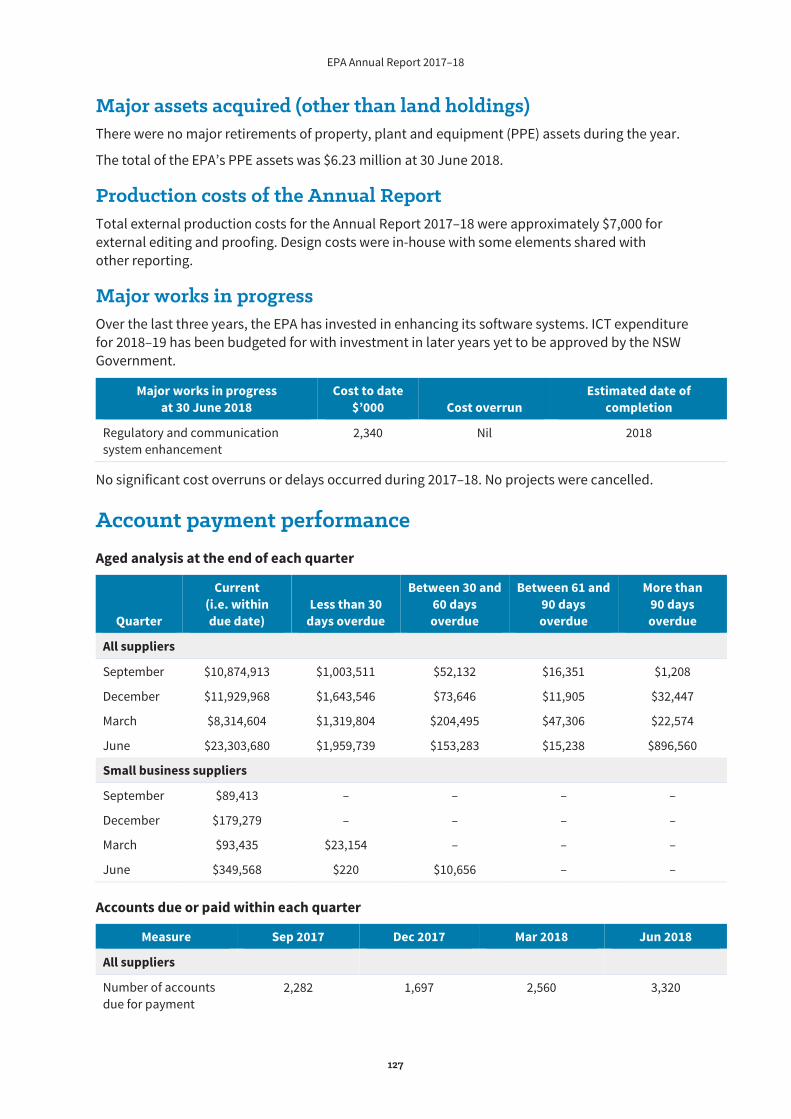
EPA Annual Report 2017–18
127
Major assets acquired (other than land holdings) There were no major retirements of property, plant and equipment (PPE) assets during the year.
The total of the EPA’s PPE assets was $6.23 million at 30 June 2018.
Production costs of the Annual Report Total external production costs for the Annual Report 2017–18 were approximately $7,000 for external editing and proofing. Design costs were in-house with some elements shared with other reporting.
Major works in progress Over the last three years, the EPA has invested in enhancing its software systems. ICT expenditure for 2018–19 has been budgeted for with investment in later years yet to be approved by the NSW Government.
Major works in progress at 30 June 2018
Cost to date $’000 Cost overrun
Estimated date of completion
Regulatory and communication system enhancement
2,340 Nil 2018
No significant cost overruns or delays occurred during 2017–18. No projects were cancelled.
Account payment performance Aged analysis at the end of each quarter
Quarter
Current (i.e. within due date)
Less than 30 days overdue
Between 30 and 60 days overdue
Between 61 and 90 days overdue
More than 90 days overdue
All suppliers
September $10,874,913 $1,003,511 $52,132 $16,351 $1,208
December $11,929,968 $1,643,546 $73,646 $11,905 $32,447
March $8,314,604 $1,319,804 $204,495 $47,306 $22,574
June $23,303,680 $1,959,739 $153,283 $15,238 $896,560
Small business suppliers
September $89,413 – – – –
December $179,279 – – – –
March $93,435 $23,154 – – –
June $349,568 $220 $10,656 – –
Accounts due or paid within each quarter
Measure Sep 2017 Dec 2017 Mar 2018 Jun 2018
All suppliers
Number of accounts due for payment
2,282 1,697 2,560 3,320
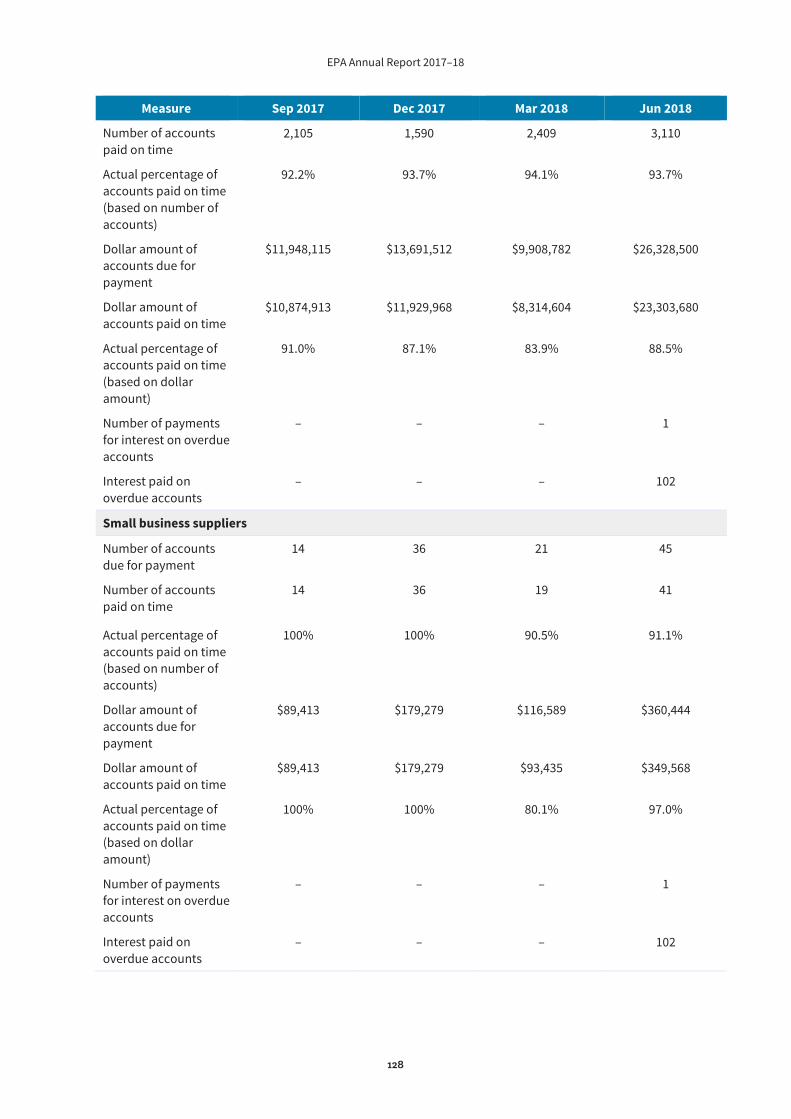
EPA Annual Report 2017–18
128
Measure Sep 2017 Dec 2017 Mar 2018 Jun 2018
Number of accounts paid on time
2,105 1,590 2,409 3,110
Actual percentage of accounts paid on time (based on number of accounts)
92.2% 93.7% 94.1% 93.7%
Dollar amount of accounts due for payment
$11,948,115 $13,691,512 $9,908,782 $26,328,500
Dollar amount of accounts paid on time
$10,874,913 $11,929,968 $8,314,604 $23,303,680
Actual percentage of accounts paid on time (based on dollar amount)
91.0% 87.1% 83.9% 88.5%
Number of payments for interest on overdue accounts
– – – 1
Interest paid on overdue accounts
– – – 102
Small business suppliers
Number of accounts due for payment
14 36 21 45
Number of accounts paid on time
14 36 19
41
Actual percentage of accounts paid on time (based on number of accounts)
100% 100% 90.5% 91.1%
Dollar amount of accounts due for payment
$89,413 $179,279 $116,589 $360,444
Dollar amount of accounts paid on time
$89,413 $179,279 $93,435 $349,568
Actual percentage of accounts paid on time (based on dollar amount)
100% 100% 80.1% 97.0%
Number of payments for interest on overdue accounts
– – – 1
Interest paid on overdue accounts
– – – 102
INDEPENDENT AUDITOR’S REPORTEnvironment Protection Authority
To Members of the New South Wales Parliament
OpinionI have audited the accompanying financial statements of the Environment Protection Authority(the Authority), which comprise the Statement of Comprehensive Income for the year ended 30 June 2018, the Statement of Financial Position as at 30 June 2018, the Statement of Changes in Equity and the Statement of Cash Flows for the year then ended, notes comprising a Summary of Significant Accounting Policies and other explanatory information of the Authority and consolidated entity. The consolidated entity comprises the Authority and the entity it controlled at the year’s end or from time to time during the financial year.
In my opinion, the financial statements:
• give a true and fair view of the financial position of the Authority and consolidated entity as at 30 June 2018, and of their financial performance and their cash flows for the year then ended in accordance with Australian Accounting Standards
• are in accordance with section 41B of the Public Finance and Audit Act 1983 (PF&A Act) and the Public Finance and Audit Regulation 2015.
My opinion should be read in conjunction with the rest of this report.
Basis for OpinionI conducted my audit in accordance with Australian Auditing Standards. My responsibilities under the standards are described in the ‘Auditor’s Responsibilities for the Audit of the Financial Statements’section of my report.
I am independent of the Authority in accordance with the requirements of the:
• Australian Auditing Standards• Accounting Professional and Ethical Standards Board’s APES 110 ‘Code of Ethics for
Professional Accountants’ (APES 110).
I have fulfilled my other ethical responsibilities in accordance with APES 110.
Parliament promotes independence by ensuring the Auditor-General and the Audit Office of New South Wales are not compromised in their roles by:
• providing that only Parliament, and not the executive government, can remove an Auditor-General
• mandating the Auditor-General as auditor of public sector agencies• precluding the Auditor-General from providing non-audit services.
I believe the audit evidence I have obtained is sufficient and appropriate to provide a basis for my audit opinion.
Other InformationOther information comprises the information included in the Authority’s annual report for the year ended 30 June 2018, other than the financial statements and my Independent Auditor’s Report thereon. The members of the Board of the Authority are responsible for the other information. At the date of this Independent Auditor’s Report, the other information I have received comprise the signed Statement pursuant to Section 41C of the PF&A Act.
My opinion on the financial statements does not cover the other information. Accordingly, I do not express any form of assurance conclusion on the other information.
In connection with my audit of the financial statements, my responsibility is to read the other information and, in doing so, consider whether the other information is materially inconsistent with the financial statements or my knowledge obtained in the audit, or otherwise appears to be materially misstated.
If, based on the work I have performed, I conclude there is a material misstatement of the other information, I must report that fact.
I have nothing to report in this regard.
The Board’s Responsibilities for the Financial StatementsThe members of the Board are responsible for the preparation and fair presentation of the financial statements in accordance with Australian Accounting Standards and the PF&A, and for such internal control as the members of the Board determine is necessary to enable the preparation and fair presentation of the financial statements that are free from material misstatement, whether due to fraud or error.
In preparing the financial statements, the members of the Board are responsible for assessing the Authority’s ability to continue as a going concern, disclosing as applicable, matters related to going concern and using the going concern basis of accounting except where the Authority will be dissolved by an Act of Parliament or otherwise cease operations.
Auditor’s Responsibilities for the Audit of the Financial StatementsMy objectives are to:
• obtain reasonable assurance about whether the financial statements as a whole are free from material misstatement, whether due to fraud or error
• issue an Independent Auditor’s Report including my opinion.
Reasonable assurance is a high level of assurance, but does not guarantee an audit conducted in accordance with Australian Auditing Standards will always detect material misstatements. Misstatements can arise from fraud or error. Misstatements are considered material if, individually or in aggregate, they could reasonably be expected to influence the economic decisions users take based on the financial statements.
A description of my responsibilities for the audit of the financial statements is located at the Auditing and Assurance Standards Board website at: www.auasb.gov.au/auditors_responsibilities/ar4.pdf. The description forms part of my auditor’s report.
My opinion does not provide assurance:
• that the Authority carried out its activities effectively, efficiently and economically• about the assumptions used in formulating the budget figures disclosed in the financial
statements• about the security and controls over the electronic publication of the audited financial
statements on any website where they may be presented• about any other information which may have been hyperlinked to/from the financial statements.
Reiky JiangDirector, Financial Audit Services
20 September 2018SYDNEY
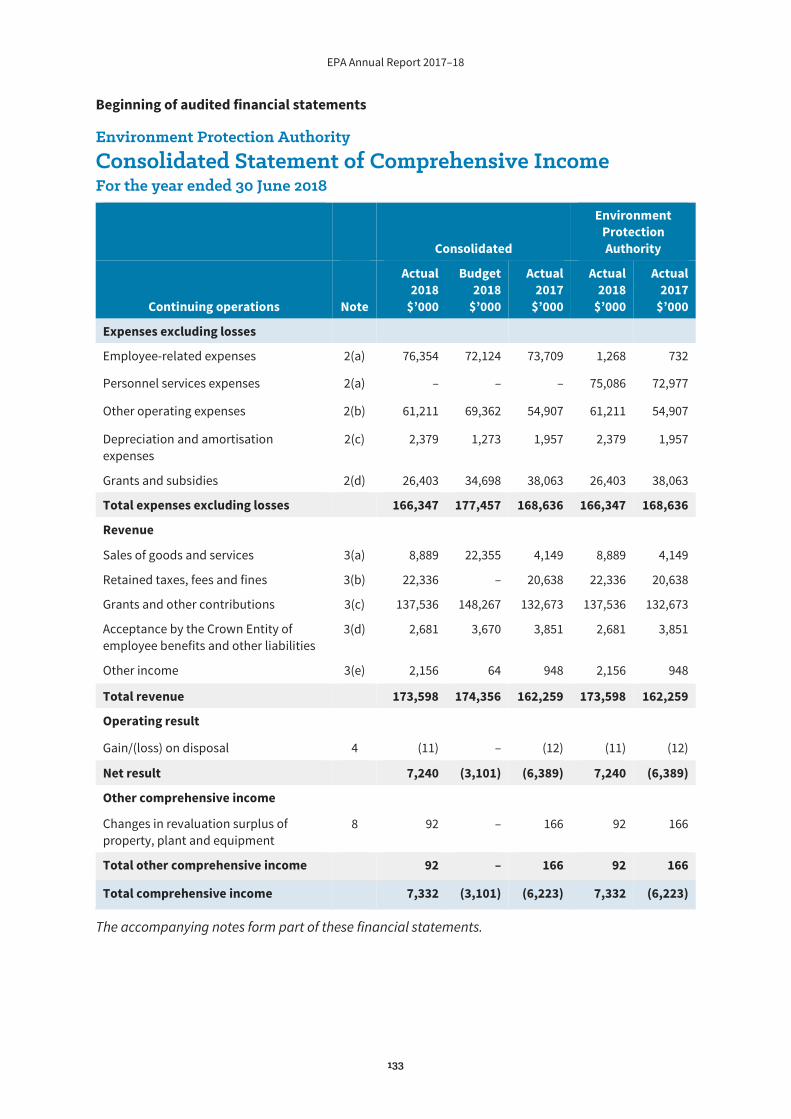
EPA Annual Report 2017–18
133
Beginning of audited financial statements
Environment Protection Authority Consolidated Statement of Comprehensive Income For the year ended 30 June 2018
Consolidated
Environment Protection Authority
Continuing operations Note
Actual 2018
$’000
Budget 2018
$’000
Actual 2017
$’000
Actual 2018
$’000
Actual 2017
$’000
Expenses excluding losses
Employee-related expenses 2(a) 76,354 72,124 73,709 1,268 732
Personnel services expenses 2(a) – – – 75,086 72,977
Other operating expenses 2(b) 61,211 69,362 54,907 61,211 54,907
Depreciation and amortisation expenses
2(c) 2,379 1,273 1,957 2,379 1,957
Grants and subsidies 2(d) 26,403 34,698 38,063 26,403 38,063
Total expenses excluding losses 166,347 177,457 168,636 166,347 168,636
Revenue
Sales of goods and services 3(a) 8,889 22,355 4,149 8,889 4,149
Retained taxes, fees and fines 3(b) 22,336 – 20,638 22,336 20,638
Grants and other contributions 3(c) 137,536 148,267 132,673 137,536 132,673
Acceptance by the Crown Entity of employee benefits and other liabilities
3(d) 2,681 3,670 3,851 2,681 3,851
Other income 3(e) 2,156 64 948 2,156 948
Total revenue 173,598 174,356 162,259 173,598 162,259
Operating result
Gain/(loss) on disposal 4 (11) – (12) (11) (12)
Net result 7,240 (3,101) (6,389) 7,240 (6,389)
Other comprehensive income
Changes in revaluation surplus of property, plant and equipment
8 92 – 166 92 166
Total other comprehensive income 92 – 166 92 166
Total comprehensive income 7,332 (3,101) (6,223) 7,332 (6,223)
The accompanying notes form part of these financial statements.
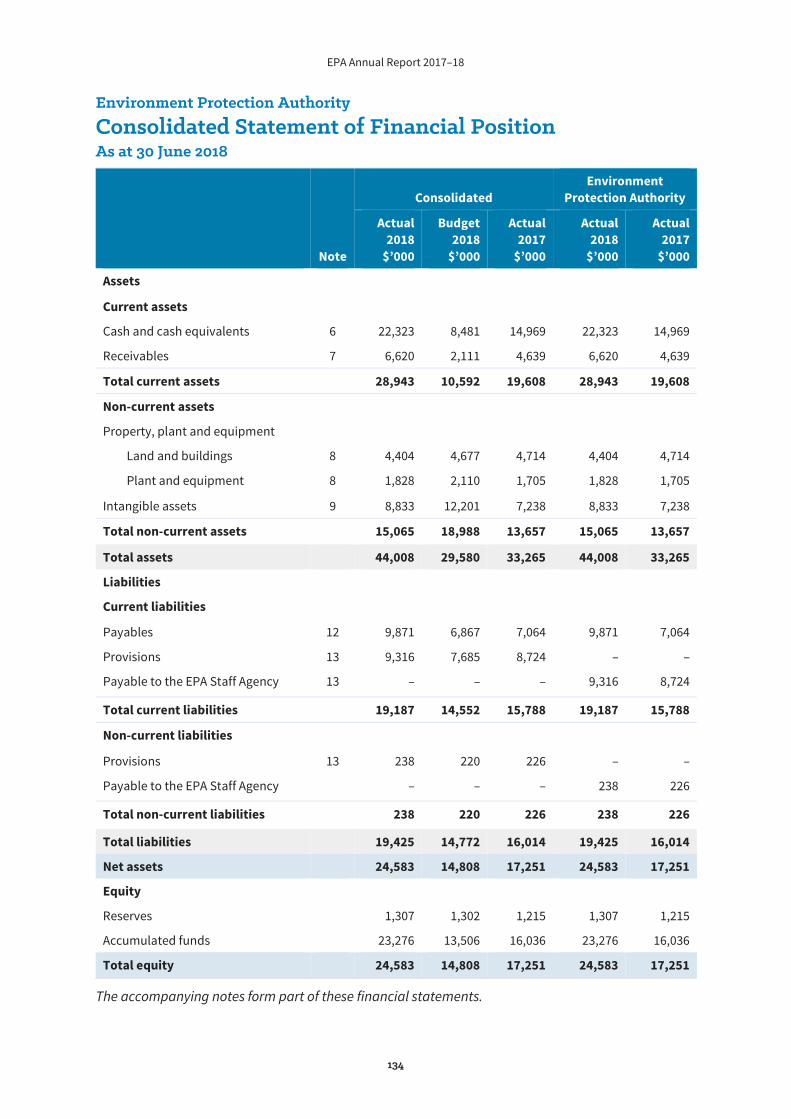
EPA Annual Report 2017–18
134
Environment Protection Authority Consolidated Statement of Financial Position As at 30 June 2018
Note
Consolidated Environment
Protection Authority
Actual 2018
$’000
Budget 2018
$’000
Actual 2017
$’000
Actual 2018
$’000
Actual 2017
$’000
Assets
Current assets
Cash and cash equivalents 6 22,323 8,481 14,969 22,323 14,969
Receivables 7 6,620 2,111 4,639 6,620 4,639
Total current assets 28,943 10,592 19,608 28,943 19,608
Non-current assets
Property, plant and equipment
Land and buildings 8 4,404 4,677 4,714 4,404 4,714
Plant and equipment 8 1,828 2,110 1,705 1,828 1,705
Intangible assets 9 8,833 12,201 7,238 8,833 7,238
Total non-current assets 15,065 18,988 13,657 15,065 13,657
Total assets 44,008 29,580 33,265 44,008 33,265
Liabilities
Current liabilities
Payables 12 9,871 6,867 7,064 9,871 7,064
Provisions 13 9,316 7,685 8,724 – –
Payable to the EPA Staff Agency 13 – – – 9,316 8,724
Total current liabilities 19,187 14,552 15,788 19,187 15,788
Non-current liabilities
Provisions 13 238 220 226 – –
Payable to the EPA Staff Agency – – – 238 226
Total non-current liabilities 238 220 226 238 226
Total liabilities 19,425 14,772 16,014 19,425 16,014
Net assets 24,583 14,808 17,251 24,583 17,251
Equity
Reserves 1,307 1,302 1,215 1,307 1,215
Accumulated funds 23,276 13,506 16,036 23,276 16,036
Total equity 24,583 14,808 17,251 24,583 17,251
The accompanying notes form part of these financial statements.
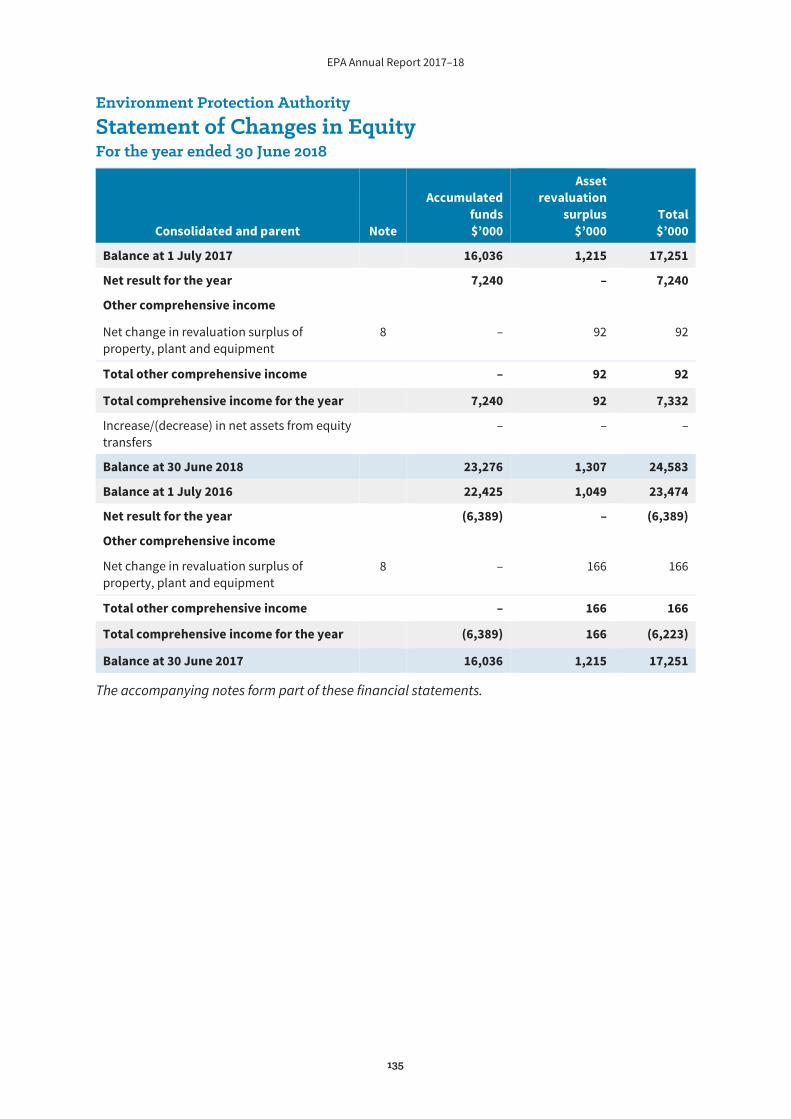
EPA Annual Report 2017–18
135
Environment Protection Authority Statement of Changes in Equity For the year ended 30 June 2018
Consolidated and parent Note
Accumulated funds $’000
Asset revaluation
surplus $’000
Total $’000
Balance at 1 July 2017 16,036 1,215 17,251
Net result for the year 7,240 – 7,240
Other comprehensive income
Net change in revaluation surplus of property, plant and equipment
8 – 92 92
Total other comprehensive income – 92 92
Total comprehensive income for the year 7,240 92 7,332
Increase/(decrease) in net assets from equity transfers
– – –
Balance at 30 June 2018 23,276 1,307 24,583
Balance at 1 July 2016 22,425 1,049 23,474
Net result for the year (6,389) – (6,389)
Other comprehensive income
Net change in revaluation surplus of property, plant and equipment
8 – 166 166
Total other comprehensive income – 166 166
Total comprehensive income for the year (6,389) 166 (6,223)
Balance at 30 June 2017 16,036 1,215 17,251
The accompanying notes form part of these financial statements.
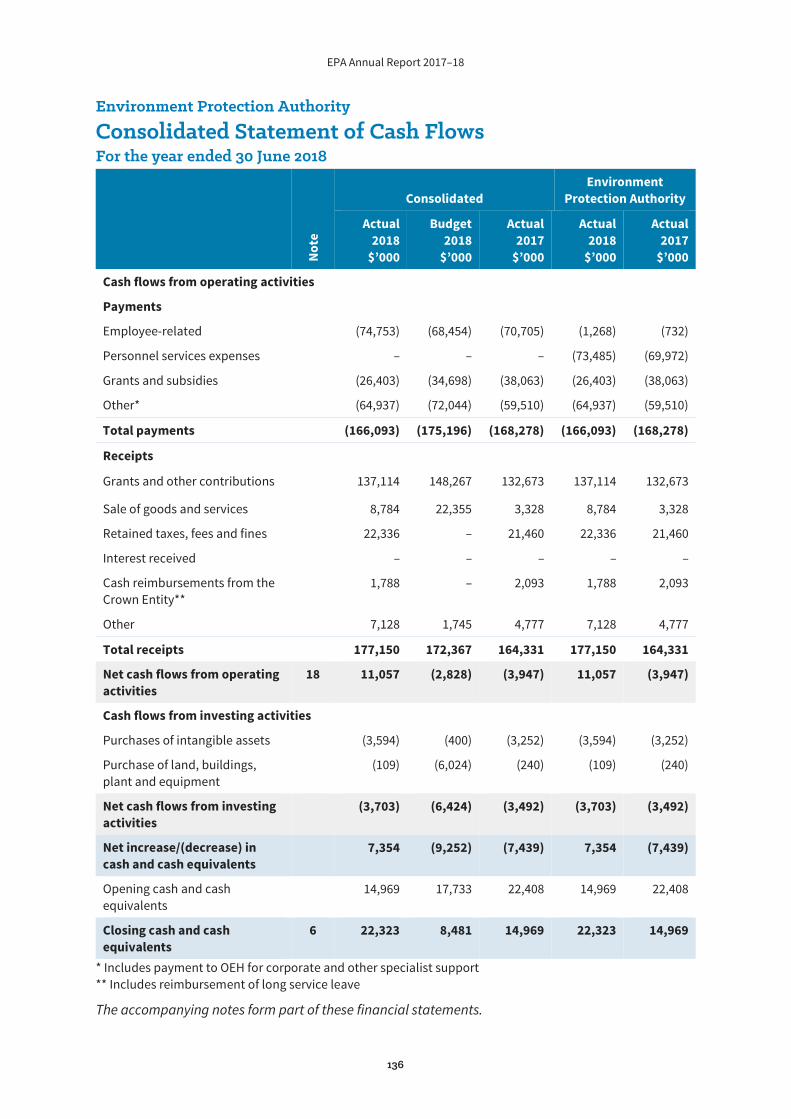
EPA Annual Report 2017–18
136
Environment Protection Authority
Consolidated Statement of Cash Flows For the year ended 30 June 2018
Not
e
Consolidated Environment
Protection Authority
Actual 2018
$’000
Budget 2018
$’000
Actual 2017
$’000
Actual 2018
$’000
Actual 2017
$’000
Cash flows from operating activities
Payments
Employee-related (74,753) (68,454) (70,705) (1,268) (732)
Personnel services expenses – – – (73,485) (69,972)
Grants and subsidies (26,403) (34,698) (38,063) (26,403) (38,063)
Other* (64,937) (72,044) (59,510) (64,937) (59,510)
Total payments (166,093) (175,196) (168,278) (166,093) (168,278)
Receipts
Grants and other contributions 137,114 148,267 132,673 137,114 132,673
Sale of goods and services 8,784 22,355 3,328 8,784 3,328
Retained taxes, fees and fines 22,336 – 21,460 22,336 21,460
Interest received – – – – –
Cash reimbursements from the Crown Entity**
1,788 – 2,093 1,788 2,093
Other 7,128 1,745 4,777 7,128 4,777
Total receipts 177,150 172,367 164,331 177,150 164,331
Net cash flows from operating activities
18 11,057 (2,828) (3,947) 11,057 (3,947)
Cash flows from investing activities
Purchases of intangible assets (3,594) (400) (3,252) (3,594) (3,252)
Purchase of land, buildings, plant and equipment
(109) (6,024) (240) (109) (240)
Net cash flows from investing activities
(3,703) (6,424) (3,492) (3,703) (3,492)
Net increase/(decrease) in cash and cash equivalents
7,354 (9,252) (7,439) 7,354 (7,439)
Opening cash and cash equivalents
14,969 17,733 22,408 14,969 22,408
Closing cash and cash equivalents
6 22,323 8,481 14,969 22,323 14,969
* Includes payment to OEH for corporate and other specialist support ** Includes reimbursement of long service leave
The accompanying notes form part of these financial statements.
EPA Annual Report 2017–18
137
Notes to and forming part of the financial statements for the year ended 30 June 2018
1. Summary of significant accounting policies
(a) Reporting entity The Environment Protection Authority (the ‘EPA’), a NSW Government entity, is constituted under Section 5 of the Protection of the Environment Administration Act 1991 as a statutory body corporate. The EPA is a not-for-profit entity (as profit is not its principal objective) and it has no cash-generating units. The EPA is consolidated as part of the NSW Total State Sector Accounts.
The EPA as a reporting entity comprises the Environment Protection Authority Staff Agency (the ‘Staff Agency’), an entity under its control. The Staff Agency’s objective is to provide personnel services to the EPA.
In the process of preparing the consolidated financial statements for the economic entity, consisting of the controlling and controlled entities, all inter-entity transactions and balances have been eliminated and like transactions and other events are accounted for using uniform accounting policies.
The Staff Agency is a Division of the Government Service responsible to the Minister for the Environment established under the Administrative Arrangements Order 2014 (the ‘Order’), dated 29 January 2014. Under the Order, the former Office of the Environment Protection Authority became the Staff Agency.
The EPA is responsible for licensing and regulating air emissions, contaminated sites, hazardous materials (including dangerous goods), noise, pesticides, forestry activities, waste, water quality and state of the environment reporting.
Administered activities undertaken on behalf of the Crown Entity are consolidated in the Crown Entity Accounts.
These consolidated financial statements for the year ended 30 June 2018 have been authorised for issue by the Acting Chair and Chief Executive Officer of the EPA on 19 September 2018.
(b) Basis of preparation The EPA’s financial statements are general purpose financial statements which have been prepared on an accruals basis and in accordance with:
applicable Australian Accounting Standards (AAS) (which include Australian Accounting Interpretations) the requirements of the Public Finance and Audit Act 1983 and Public Finance and Audit Regulation 2015 the Financial Reporting Directions mandated by the Treasurer.
Property, plant and equipment is measured at fair value. Other financial statement items are prepared in accordance with the historical cost convention, except where specified otherwise.
Judgments, key assumptions and estimations management has made are disclosed in the relevant notes to the financial statements.
All amounts are rounded to the nearest one thousand dollars and are expressed in Australian currency, which is the EPA’s presentation and functional currency.
EPA Annual Report 2017–18
138
(c) Statement of compliance The financial statements and notes comply with Australian Accounting Standards, which include Australian Accounting Interpretations.
(d) Administered activities The EPA administers, but does not control, certain activities on behalf of the Crown Entity. It is accountable for the transactions relating to those administered activities but does not have the discretion to deploy the resources for the achievement of the EPA’s own objectives.
Transactions and balances relating to the administered activities are not recognised as the EPA’s income, expenses, assets and liabilities, but are disclosed in the accompanying schedules as Administered income’, Administered expenses’, Administered assets’ and Administered
liabilities’.
The accrual basis of accounting and applicable accounting standards have been adopted.
(e) Accounting for the goods and services tax (GST) Income, expenses and assets are recognised net of the amount of GST, except that the:
amount of GST incurred by the EPA as a purchaser that is not recoverable from the Australian Taxation Office (ATO) is recognised as part of the cost of acquisition of an asset or as part of an item of expense receivables and payables are stated with the amount of GST included.
Cash flows are included in the Statement of Cash Flows on a gross basis. However, the GST components of cash flows arising from investing and financing activities which are recoverable from, or payable to, the ATO are classified as operating cash flows.
(f) Comparative information Except when an AAS permits or requires otherwise, comparative information is disclosed in respect of the previous period for all amounts reported in the financial statements.
(g) Changes in accounting policy, including new or revised Australian Accounting Standards (AAS)
NSW public sector entities are not permitted to early adopt new AAS, unless Treasury determines otherwise.
Issued but not yet effective
The following new AAS have not been applied and are not yet effective (NSW Treasury mandate TC 18/01):
AASB 9 Financial Instruments
AASB 15, AASB 2014-5, AASB 2015-8 and AASB 2016-3 regarding revenue from contracts with customers AASB 1058 Income of Not-for-profit Entities
AASB 1059 Service Concession Arrangements: Grantors
AASB 2016-7 Amendments to Australian Accounting Standards – Deferral of AASB 1058 Income of Not-for-profit Entities
AASB 2016-8 Amendments to Australian Accounting Standards – Australian Implementation Guidance for Not-for-profit Entities

EPA Annual Report 2017–18
139
These standards have been assessed for their possible impact on the financial statements, if any, in the period of their initial application. The assessment concluded that there will be no material financial impact. However additional disclosures are expected as a result of the application of AASB 1058 Income of Not-for-profit Entities, effective from the 2019–20 financial year. Apart from this, the other new standards are not likely to have any material financial impact.
2. Expenses excluding losses
(a) Employee-related expenses and personnel services
Consolidated
Environment Protection Authority
2018 $’000
2017 $’000
2018 $’000
2017 $’000
Salaries and wages (including annual leave) 63,733 60,132 813 640
Redundancy payments 538 705 369 –
Superannuation – defined benefit plans 1,041 1,178 – –
Superannuation – defined contribution plans 5,082 4,775 32 36
Long service leave 1,742 2,655 – 14
Workers’ compensation insurance 287 526 – –
Payroll tax and fringe benefits tax 3,928 3,734 54 38
Other 3 4 – 4
Personnel services expenses – – 75,086 72,977
Total 76,354 73,709 76,354 73,709
(b) Other operating expenses
Consolidated
Environment Protection Authority
2018 $’000
2017 $’000
2018 $’000
2017 $’000
Contractor – projects 5,602 2,586 5,602 2,586
Consultants 3,196 2,740 3,196 2,740
Maintenance* 1,025 503 1,025 503
Fees and services 19,470 18,004 19,470 18,004
Corporate support from OEH and DPE 15,523 15,174 15,523 15,174
Payments to NSW Government agencies 2,579 1,093 2,579 1,093
Stores and minor assets 1,553 773 1,553 773
Fleet costs 880 967 880 967
Operating lease rental expenses (minimum lease payments)
658 1,894 658 1,894
Insurance 94 120 94 120
Information dissemination 4,771 4,859 4,771 4,859
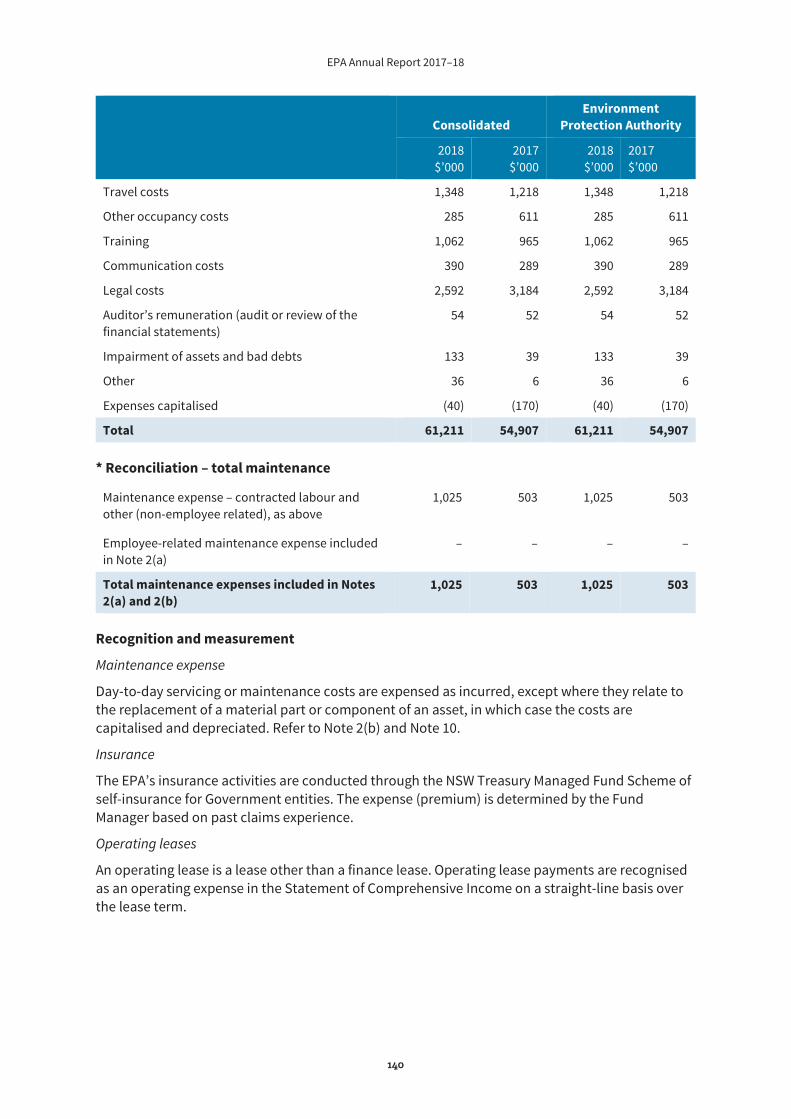
EPA Annual Report 2017–18
140
Consolidated
Environment Protection Authority
2018 $’000
2017 $’000
2018 $’000
2017 $’000
Travel costs 1,348 1,218 1,348 1,218
Other occupancy costs 285 611 285 611
Training 1,062 965 1,062 965
Communication costs 390 289 390 289
Legal costs 2,592 3,184 2,592 3,184
Auditor’s remuneration (audit or review of the financial statements)
54 52 54 52
Impairment of assets and bad debts 133 39 133 39
Other 36 6 36 6
Expenses capitalised (40) (170) (40) (170)
Total 61,211 54,907 61,211 54,907
* Reconciliation – total maintenance
Maintenance expense – contracted labour and other (non-employee related), as above
1,025 503 1,025 503
Employee-related maintenance expense included in Note 2(a)
– – – –
Total maintenance expenses included in Notes 2(a) and 2(b)
1,025 503 1,025 503
Recognition and measurement
Maintenance expense
Day-to-day servicing or maintenance costs are expensed as incurred, except where they relate to the replacement of a material part or component of an asset, in which case the costs are capitalised and depreciated. Refer to Note 2(b) and Note 10.
Insurance
The EPA’s insurance activities are conducted through the NSW Treasury Managed Fund Scheme of self-insurance for Government entities. The expense (premium) is determined by the Fund Manager based on past claims experience.
Operating leases
An operating lease is a lease other than a finance lease. Operating lease payments are recognised as an operating expense in the Statement of Comprehensive Income on a straight-line basis over the lease term.
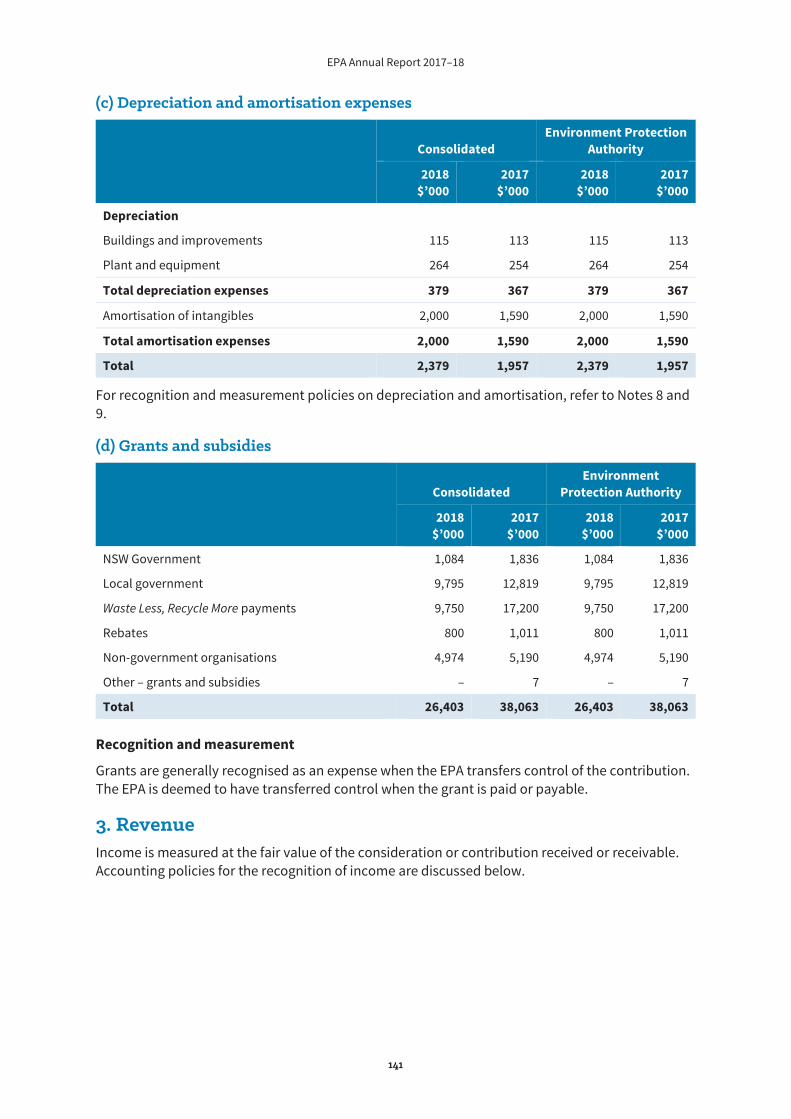
EPA Annual Report 2017–18
141
(c) Depreciation and amortisation expenses
Consolidated
Environment Protection Authority
2018 $’000
2017 $’000
2018 $’000
2017 $’000
Depreciation
Buildings and improvements 115 113 115 113
Plant and equipment 264 254 264 254
Total depreciation expenses 379 367 379 367
Amortisation of intangibles 2,000 1,590 2,000 1,590
Total amortisation expenses 2,000 1,590 2,000 1,590
Total 2,379 1,957 2,379 1,957
For recognition and measurement policies on depreciation and amortisation, refer to Notes 8 and 9.
(d) Grants and subsidies
Consolidated
Environment Protection Authority
2018 $’000
2017 $’000
2018 $’000
2017 $’000
NSW Government 1,084 1,836 1,084 1,836
Local government 9,795 12,819 9,795 12,819
Waste Less, Recycle More payments 9,750 17,200 9,750 17,200
Rebates 800 1,011 800 1,011
Non-government organisations 4,974 5,190 4,974 5,190
Other – grants and subsidies – 7 – 7
Total 26,403 38,063 26,403 38,063
Recognition and measurement
Grants are generally recognised as an expense when the EPA transfers control of the contribution. The EPA is deemed to have transferred control when the grant is paid or payable.
3. Revenue Income is measured at the fair value of the consideration or contribution received or receivable. Accounting policies for the recognition of income are discussed below.
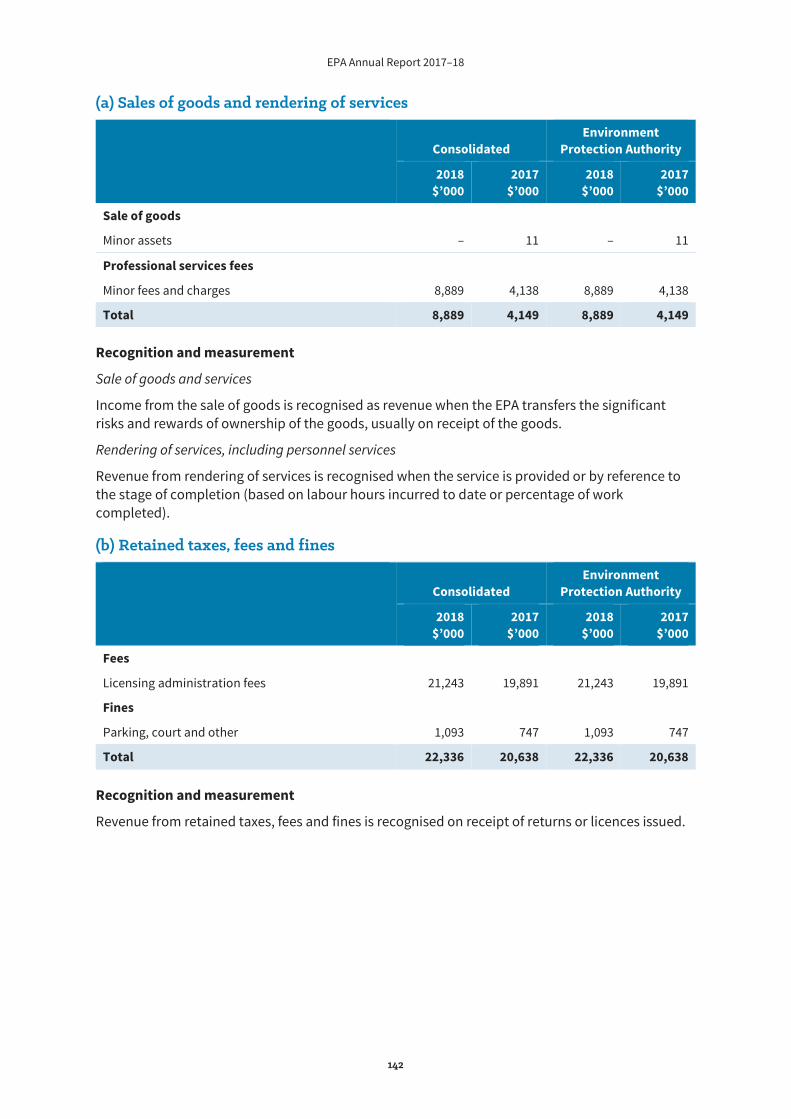
EPA Annual Report 2017–18
142
(a) Sales of goods and rendering of services
Consolidated
Environment Protection Authority
2018 $’000
2017 $’000
2018 $’000
2017 $’000
Sale of goods
Minor assets – 11 – 11
Professional services fees
Minor fees and charges 8,889 4,138 8,889 4,138
Total 8,889 4,149 8,889 4,149
Recognition and measurement
Sale of goods and services
Income from the sale of goods is recognised as revenue when the EPA transfers the significant risks and rewards of ownership of the goods, usually on receipt of the goods.
Rendering of services, including personnel services
Revenue from rendering of services is recognised when the service is provided or by reference to the stage of completion (based on labour hours incurred to date or percentage of work completed).
(b) Retained taxes, fees and fines
Consolidated
Environment Protection Authority
2018 $’000
2017 $’000
2018 $’000
2017 $’000
Fees
Licensing administration fees 21,243 19,891 21,243 19,891
Fines
Parking, court and other 1,093 747 1,093 747
Total 22,336 20,638 22,336 20,638
Recognition and measurement
Revenue from retained taxes, fees and fines is recognised on receipt of returns or licences issued.
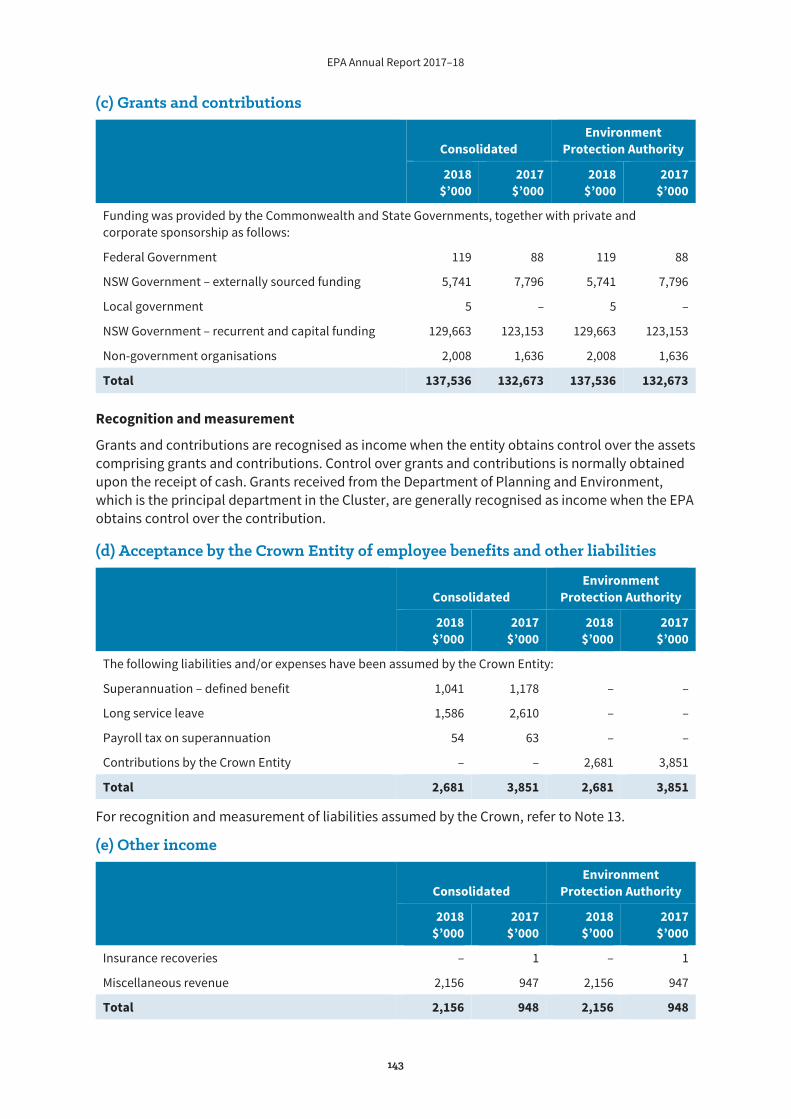
EPA Annual Report 2017–18
143
(c) Grants and contributions
Consolidated
Environment Protection Authority
2018 $’000
2017 $’000
2018 $’000
2017 $’000
Funding was provided by the Commonwealth and State Governments, together with private and corporate sponsorship as follows:
Federal Government 119 88 119 88
NSW Government – externally sourced funding 5,741 7,796 5,741 7,796
Local government 5 – 5 –
NSW Government – recurrent and capital funding 129,663 123,153 129,663 123,153
Non-government organisations 2,008 1,636 2,008 1,636
Total 137,536 132,673 137,536 132,673
Recognition and measurement
Grants and contributions are recognised as income when the entity obtains control over the assets comprising grants and contributions. Control over grants and contributions is normally obtained upon the receipt of cash. Grants received from the Department of Planning and Environment, which is the principal department in the Cluster, are generally recognised as income when the EPA obtains control over the contribution.
(d) Acceptance by the Crown Entity of employee benefits and other liabilities
Consolidated
Environment Protection Authority
2018 $’000
2017 $’000
2018 $’000
2017 $’000
The following liabilities and/or expenses have been assumed by the Crown Entity:
Superannuation – defined benefit 1,041 1,178 – –
Long service leave 1,586 2,610 – –
Payroll tax on superannuation 54 63 – –
Contributions by the Crown Entity – – 2,681 3,851
Total 2,681 3,851 2,681 3,851
For recognition and measurement of liabilities assumed by the Crown, refer to Note 13.
(e) Other income
Consolidated
Environment Protection Authority
2018 $’000
2017 $’000
2018 $’000
2017 $’000
Insurance recoveries – 1 – 1
Miscellaneous revenue 2,156 947 2,156 947
Total 2,156 948 2,156 948
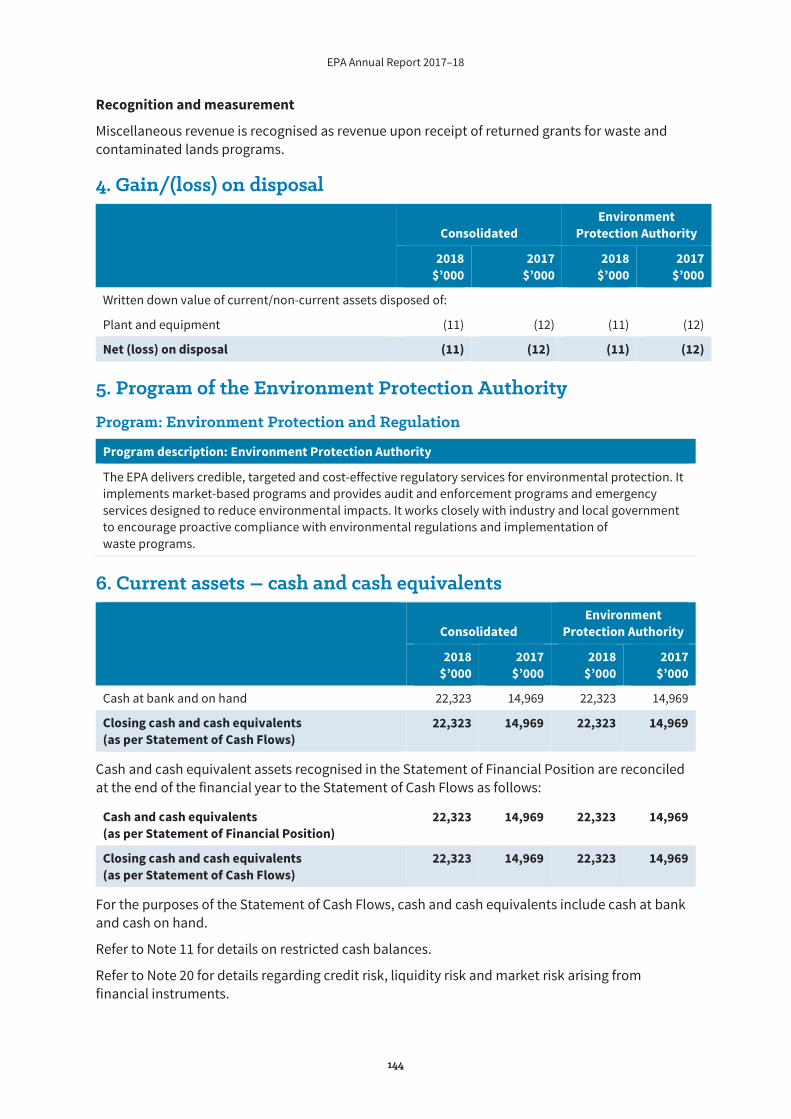
EPA Annual Report 2017–18
144
Recognition and measurement
Miscellaneous revenue is recognised as revenue upon receipt of returned grants for waste and contaminated lands programs.
4. Gain/(loss) on disposal
Consolidated Environment
Protection Authority
2018 $’000
2017 $’000
2018 $’000
2017 $’000
Written down value of current/non-current assets disposed of:
Plant and equipment (11) (12) (11) (12)
Net (loss) on disposal (11) (12) (11) (12)
5. Program of the Environment Protection Authority
Program: Environment Protection and Regulation
Program description: Environment Protection Authority
The EPA delivers credible, targeted and cost-effective regulatory services for environmental protection. It implements market-based programs and provides audit and enforcement programs and emergency services designed to reduce environmental impacts. It works closely with industry and local government to encourage proactive compliance with environmental regulations and implementation of waste programs.
6. Current assets – cash and cash equivalents
Consolidated Environment
Protection Authority
2018 $’000
2017 $’000
2018 $’000
2017 $’000
Cash at bank and on hand 22,323 14,969 22,323 14,969
Closing cash and cash equivalents (as per Statement of Cash Flows)
22,323 14,969 22,323 14,969
Cash and cash equivalent assets recognised in the Statement of Financial Position are reconciled at the end of the financial year to the Statement of Cash Flows as follows:
Cash and cash equivalents (as per Statement of Financial Position)
22,323 14,969 22,323 14,969
Closing cash and cash equivalents (as per Statement of Cash Flows)
22,323 14,969 22,323 14,969
For the purposes of the Statement of Cash Flows, cash and cash equivalents include cash at bank and cash on hand.
Refer to Note 11 for details on restricted cash balances.
Refer to Note 20 for details regarding credit risk, liquidity risk and market risk arising from financial instruments.
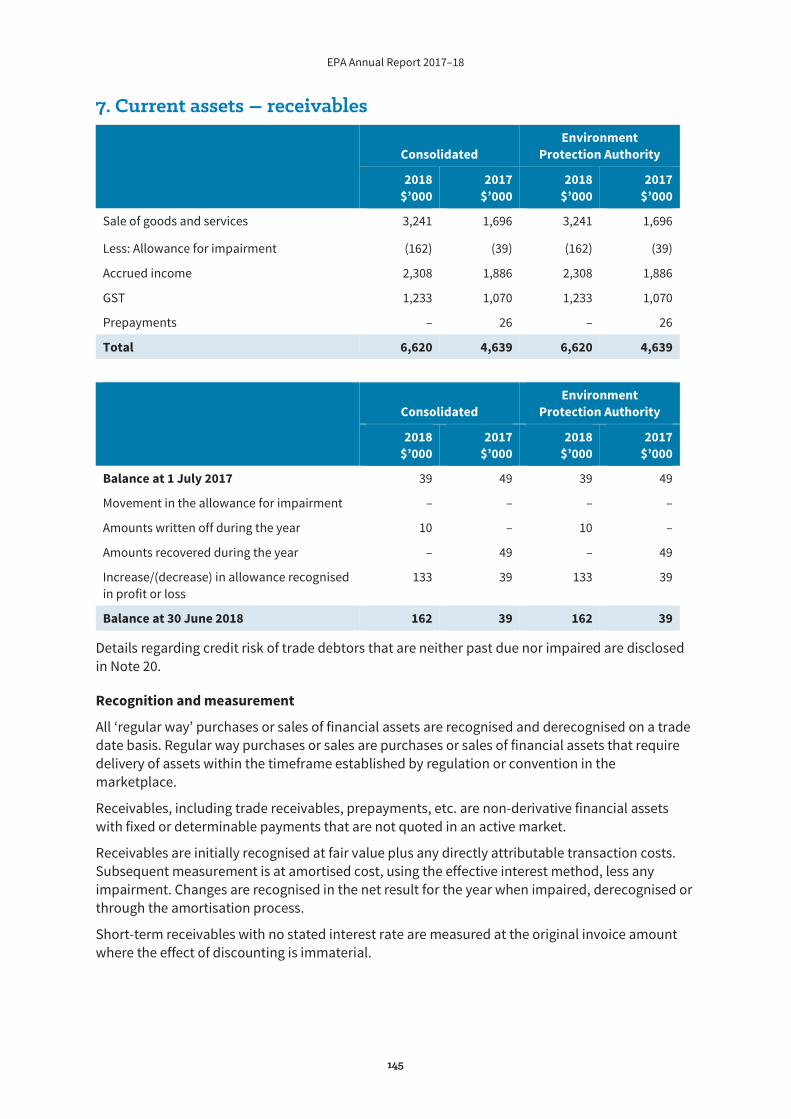
EPA Annual Report 2017–18
145
7. Current assets – receivables
Consolidated Environment
Protection Authority
2018 $’000
2017 $’000
2018 $’000
2017 $’000
Sale of goods and services 3,241 1,696 3,241 1,696
Less: Allowance for impairment (162) (39) (162) (39)
Accrued income 2,308 1,886 2,308 1,886
GST 1,233 1,070 1,233 1,070
Prepayments – 26 – 26
Total 6,620 4,639 6,620 4,639
Consolidated
Environment Protection Authority
2018 $’000
2017 $’000
2018 $’000
2017 $’000
Balance at 1 July 2017 39 49 39 49
Movement in the allowance for impairment – – – –
Amounts written off during the year 10 – 10 –
Amounts recovered during the year – 49 – 49
Increase/(decrease) in allowance recognised in profit or loss
133 39 133 39
Balance at 30 June 2018 162 39 162 39
Details regarding credit risk of trade debtors that are neither past due nor impaired are disclosed in Note 20.
Recognition and measurement
All ‘regular way’ purchases or sales of financial assets are recognised and derecognised on a trade date basis. Regular way purchases or sales are purchases or sales of financial assets that require delivery of assets within the timeframe established by regulation or convention in the marketplace.
Receivables, including trade receivables, prepayments, etc. are non-derivative financial assets with fixed or determinable payments that are not quoted in an active market.
Receivables are initially recognised at fair value plus any directly attributable transaction costs. Subsequent measurement is at amortised cost, using the effective interest method, less any impairment. Changes are recognised in the net result for the year when impaired, derecognised or through the amortisation process.
Short-term receivables with no stated interest rate are measured at the original invoice amount where the effect of discounting is immaterial.
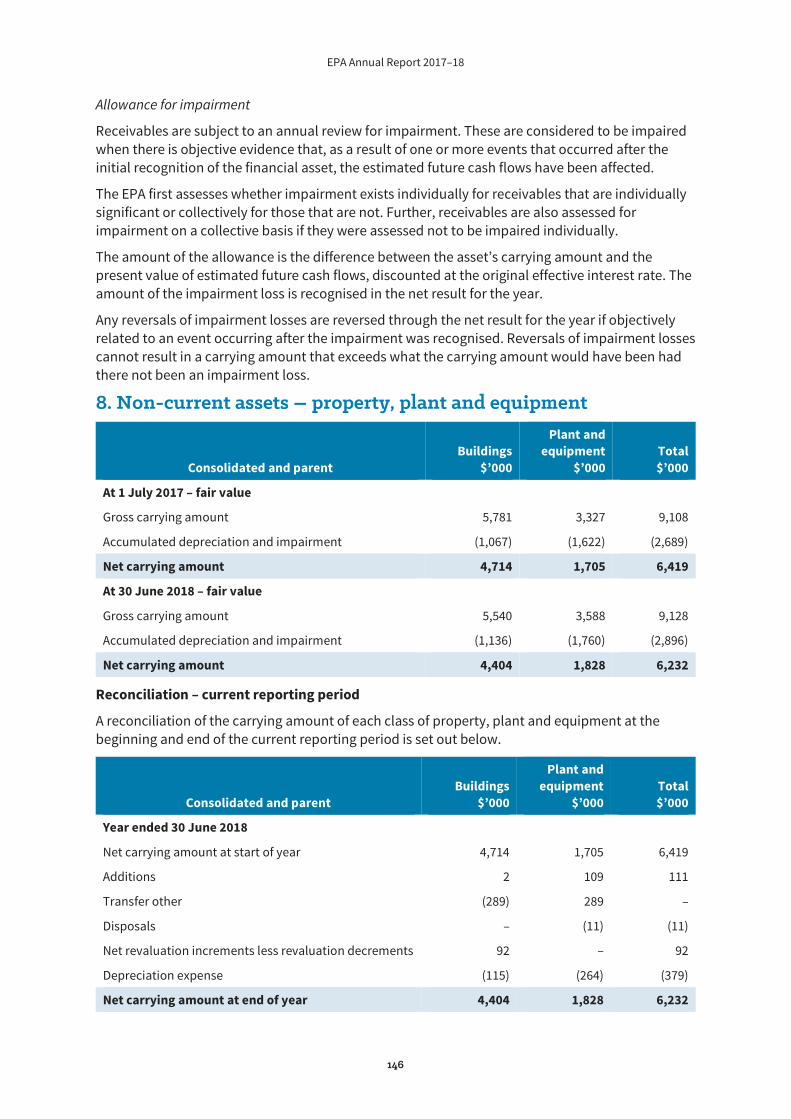
EPA Annual Report 2017–18
146
Allowance for impairment
Receivables are subject to an annual review for impairment. These are considered to be impaired when there is objective evidence that, as a result of one or more events that occurred after the initial recognition of the financial asset, the estimated future cash flows have been affected.
The EPA first assesses whether impairment exists individually for receivables that are individually significant or collectively for those that are not. Further, receivables are also assessed for impairment on a collective basis if they were assessed not to be impaired individually.
The amount of the allowance is the difference between the asset’s carrying amount and the present value of estimated future cash flows, discounted at the original effective interest rate. The amount of the impairment loss is recognised in the net result for the year.
Any reversals of impairment losses are reversed through the net result for the year if objectively related to an event occurring after the impairment was recognised. Reversals of impairment losses cannot result in a carrying amount that exceeds what the carrying amount would have been had there not been an impairment loss.
8. Non-current assets – property, plant and equipment
Consolidated and parent Buildings
$’000
Plant and equipment
$’000 Total $’000
At 1 July 2017 – fair value
Gross carrying amount 5,781 3,327 9,108
Accumulated depreciation and impairment (1,067) (1,622) (2,689)
Net carrying amount 4,714 1,705 6,419
At 30 June 2018 – fair value
Gross carrying amount 5,540 3,588 9,128
Accumulated depreciation and impairment (1,136) (1,760) (2,896)
Net carrying amount 4,404 1,828 6,232
Reconciliation – current reporting period
A reconciliation of the carrying amount of each class of property, plant and equipment at the beginning and end of the current reporting period is set out below.
Consolidated and parent Buildings
$’000
Plant and equipment
$’000 Total $’000
Year ended 30 June 2018
Net carrying amount at start of year 4,714 1,705 6,419
Additions 2 109 111
Transfer other (289) 289 –
Disposals – (11) (11)
Net revaluation increments less revaluation decrements 92 – 92
Depreciation expense (115) (264) (379)
Net carrying amount at end of year 4,404 1,828 6,232
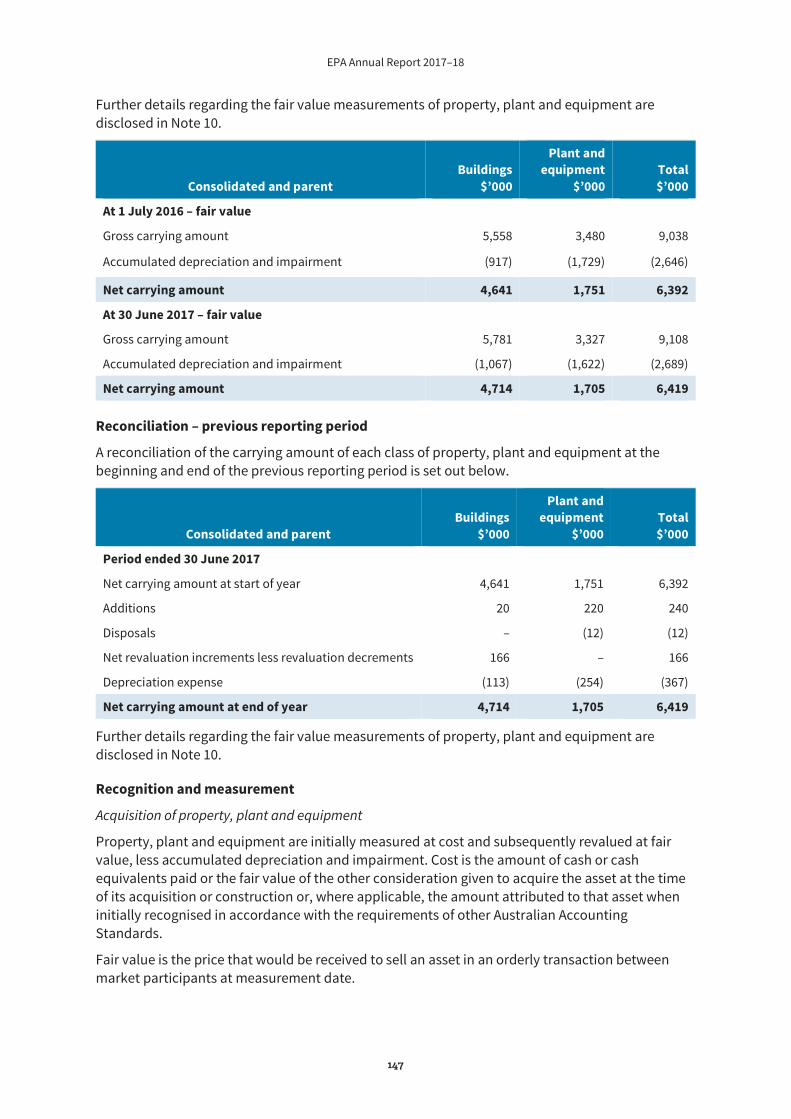
EPA Annual Report 2017–18
147
Further details regarding the fair value measurements of property, plant and equipment are disclosed in Note 10.
Consolidated and parent Buildings
$’000
Plant and equipment
$’000 Total $’000
At 1 July 2016 – fair value
Gross carrying amount 5,558 3,480 9,038
Accumulated depreciation and impairment (917) (1,729) (2,646)
Net carrying amount 4,641 1,751 6,392
At 30 June 2017 – fair value
Gross carrying amount 5,781 3,327 9,108
Accumulated depreciation and impairment (1,067) (1,622) (2,689)
Net carrying amount 4,714 1,705 6,419
Reconciliation – previous reporting period
A reconciliation of the carrying amount of each class of property, plant and equipment at the beginning and end of the previous reporting period is set out below.
Consolidated and parent Buildings
$’000
Plant and equipment
$’000 Total $’000
Period ended 30 June 2017
Net carrying amount at start of year 4,641 1,751 6,392
Additions 20 220 240
Disposals – (12) (12)
Net revaluation increments less revaluation decrements 166 – 166
Depreciation expense (113) (254) (367)
Net carrying amount at end of year 4,714 1,705 6,419
Further details regarding the fair value measurements of property, plant and equipment are disclosed in Note 10.
Recognition and measurement
Acquisition of property, plant and equipment
Property, plant and equipment are initially measured at cost and subsequently revalued at fair value, less accumulated depreciation and impairment. Cost is the amount of cash or cash equivalents paid or the fair value of the other consideration given to acquire the asset at the time of its acquisition or construction or, where applicable, the amount attributed to that asset when initially recognised in accordance with the requirements of other Australian Accounting Standards.
Fair value is the price that would be received to sell an asset in an orderly transaction between market participants at measurement date.

EPA Annual Report 2017–18
148
Where payment for an asset is deferred beyond normal credit terms, its cost is the cash price equivalent, i.e. deferred payment amount is effectively discounted over the period of credit.
Assets acquired at no cost, or for nominal consideration, are initially recognised at their fair value at the date of acquisition.
Capitalisation thresholds
Property, plant and equipment and intangible assets costing $5000 and above individually (or forming part of a network costing more than $5000) are capitalised.
Major inspection costs
When a major inspection is performed, its cost is recognised in the carrying amount of the plant and equipment as a replacement if the recognition criteria are satisfied.
Restoration costs
The present value of the expected cost for the restoration or cost of dismantling of an asset after its use is included in the cost of the respective asset if the recognition criteria for a provision are met.
Depreciation of property, plant and equipment
Depreciation is provided for on a straight-line basis so as to write-off the depreciable amount of each asset as it is consumed over its useful life to the EPA.
All material identifiable components of assets are depreciated separately over their useful lives.
The following depreciation rates have been adopted:
plant and equipment – 10% or 20% buildings – 2%
Amortisation of intangible assets:
software – 25%
Finance leases
A distinction is made between finance leases, which effectively transfer from the lessor to the lessee substantially all the risks and rewards incidental to ownership of the leased assets, and operating leases, under which the lessor does not transfer substantially all the risks and rewards.
Where a non-current asset is acquired by means of a finance lease, at the commencement of the lease term, the asset is recognised at its fair value or, if lower, the present value of the minimum lease payments at the inception of the lease. The corresponding liability is established at the same amount. Lease payments are allocated between the principal component and the interest expense.
Property, plant and equipment acquired under finance leases are depreciated over the asset’s useful life. However, if there is no reasonable certainty that the lessee entity will obtain ownership at the end of the lease term, the asset is depreciated over the shorter of the estimated useful life of the asset and the lease term.
Revaluation of property, plant and equipment
Physical non-current assets are valued in accordance with the Treasury Policy and Guidelines Paper TPP 14-01 Valuation of Physical Non-current Assets at Fair Value. This policy adopts fair value in accordance with AASB 13 Fair Value Measurement and AASB 116 Property, Plant and Equipment.
EPA Annual Report 2017–18
149
Property, plant and equipment is measured at the highest and best use by market participants that is physically possible, legally permissible and financially feasible. The highest and best use must be available at a period that is not remote and take into account the characteristics of the asset being measured, including any socio-political restrictions imposed by government. In most cases, after taking into account these considerations, the highest and best use is the existing use. In limited circumstances, the highest and best use may be a feasible alternative use, where there are no restrictions on use or where there is a feasible higher restricted alternative use.
Fair value of property, plant and equipment is based on a market participants’ perspective, using valuation techniques (market approach or cost approach) that maximise relevant observable inputs and minimise unobservable inputs. Also refer to Note 10 and Note 20 for further information regarding fair value.
Revaluations shall be made with sufficient regularity to ensure the carrying amount of each asset in the class does not differ materially from its fair value at reporting date. The EPA conducts a comprehensive revaluation of its buildings at least every three years. A comprehensive revaluation of buildings was undertaken by Colliers International Valuation & Advisory Services Pty Ltd at 31 March 2018.
Interim revaluations are conducted between comprehensive revaluations where cumulative changes to indicators suggest fair value may differ materially from the carrying value.
Non-specialised assets with short useful lives are measured at depreciated historical cost, as a surrogate for fair value. The entity has assessed that any difference between fair value and depreciated historical cost is unlikely to be material.
When revaluing non-current assets using the cost approach, the gross amount and the related accumulated depreciation are separately restated.
For other assets valued using other valuation techniques, any balances of accumulated depreciation at the revaluation date in respect of those assets are credited to the asset accounts to which they relate. The net asset accounts are then increased or decreased by the revaluation increments or decrements.
Revaluation increments are recognised in ‘Other comprehensive income’ and credited directly to the asset revaluation surplus in equity. However, to the extent that an increment reverses a revaluation decrement in respect of that class of asset previously recognised as a loss in the net result, the increment is recognised immediately as a gain in the net result.
Revaluation decrements are recognised immediately as a loss in the net result, except to the extent that they offset an existing revaluation surplus in respect of the same class of asset, in which case they are debited directly to the revaluation surplus.
As a not-for-profit entity, revaluation increments and decrements are offset against one another within a class of non-current assets, but not otherwise.
Where an asset that has previously been revalued is disposed of, any balance remaining in the asset revaluation surplus in respect of that asset is transferred to accumulated funds.
The useful lives and methods of depreciation of property, plant and equipment are reviewed at each financial year end.
Impairment of property, plant and equipment
As a not-for-profit entity with no cash-generating units, impairment under AASB 136 Impairment of Assets is unlikely to arise. Since property, plant and equipment is carried at fair value or an
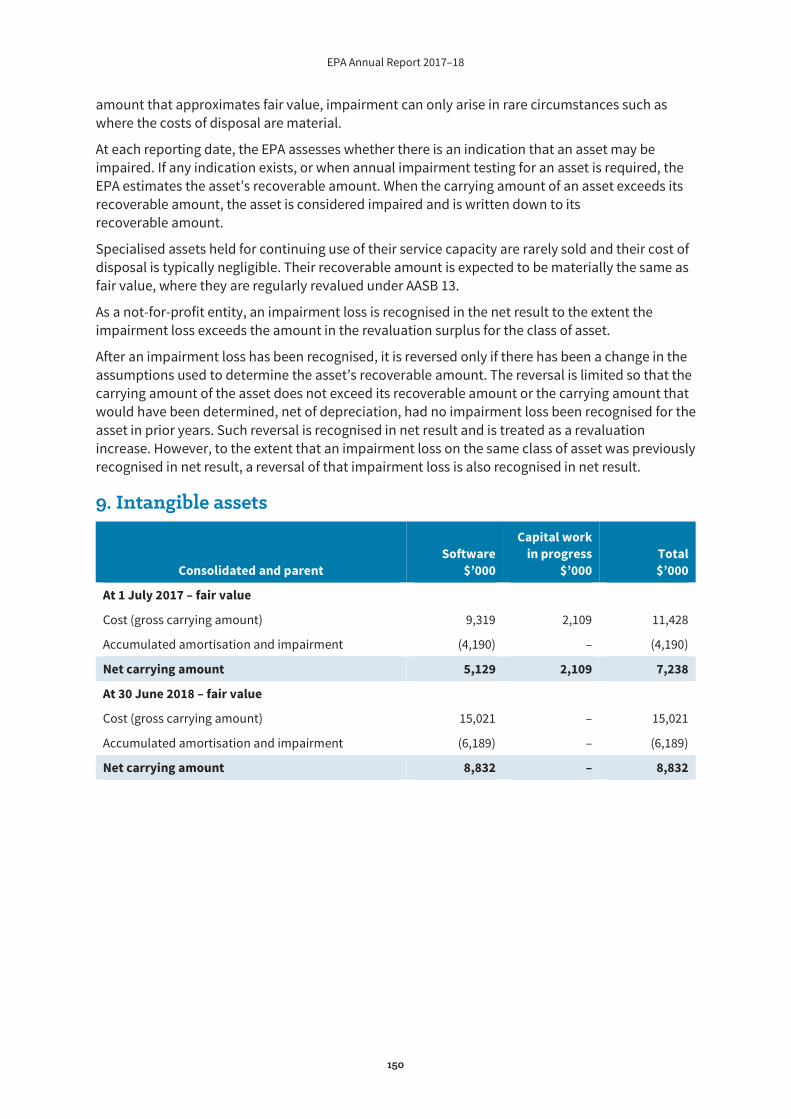
EPA Annual Report 2017–18
150
amount that approximates fair value, impairment can only arise in rare circumstances such as where the costs of disposal are material.
At each reporting date, the EPA assesses whether there is an indication that an asset may be impaired. If any indication exists, or when annual impairment testing for an asset is required, the EPA estimates the asset’s recoverable amount. When the carrying amount of an asset exceeds its recoverable amount, the asset is considered impaired and is written down to its recoverable amount.
Specialised assets held for continuing use of their service capacity are rarely sold and their cost of disposal is typically negligible. Their recoverable amount is expected to be materially the same as fair value, where they are regularly revalued under AASB 13.
As a not-for-profit entity, an impairment loss is recognised in the net result to the extent the impairment loss exceeds the amount in the revaluation surplus for the class of asset.
After an impairment loss has been recognised, it is reversed only if there has been a change in the assumptions used to determine the asset’s recoverable amount. The reversal is limited so that the carrying amount of the asset does not exceed its recoverable amount or the carrying amount that would have been determined, net of depreciation, had no impairment loss been recognised for the asset in prior years. Such reversal is recognised in net result and is treated as a revaluation increase. However, to the extent that an impairment loss on the same class of asset was previously recognised in net result, a reversal of that impairment loss is also recognised in net result.
9. Intangible assets
Consolidated and parent Software
$’000
Capital work in progress
$’000 Total $’000
At 1 July 2017 – fair value
Cost (gross carrying amount) 9,319 2,109 11,428
Accumulated amortisation and impairment (4,190) – (4,190)
Net carrying amount 5,129 2,109 7,238
At 30 June 2018 – fair value
Cost (gross carrying amount) 15,021 – 15,021
Accumulated amortisation and impairment (6,189) – (6,189)
Net carrying amount 8,832 – 8,832
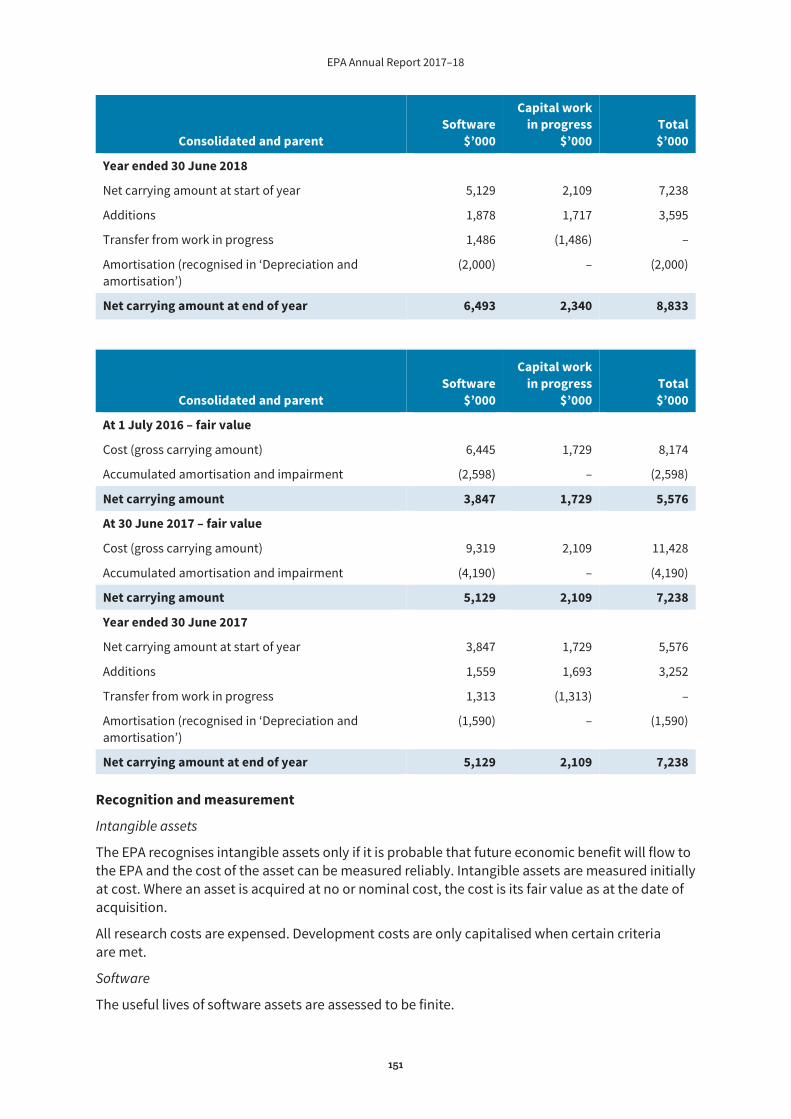
EPA Annual Report 2017–18
151
Consolidated and parent Software
$’000
Capital work in progress
$’000 Total $’000
Year ended 30 June 2018
Net carrying amount at start of year 5,129 2,109 7,238
Additions 1,878 1,717 3,595
Transfer from work in progress 1,486 (1,486) –
Amortisation (recognised in ‘Depreciation and amortisation’)
(2,000) – (2,000)
Net carrying amount at end of year 6,493 2,340 8,833
Consolidated and parent Software
$’000
Capital work in progress
$’000 Total $’000
At 1 July 2016 – fair value
Cost (gross carrying amount) 6,445 1,729 8,174
Accumulated amortisation and impairment (2,598) – (2,598)
Net carrying amount 3,847 1,729 5,576
At 30 June 2017 – fair value
Cost (gross carrying amount) 9,319 2,109 11,428
Accumulated amortisation and impairment (4,190) – (4,190)
Net carrying amount 5,129 2,109 7,238
Year ended 30 June 2017
Net carrying amount at start of year 3,847 1,729 5,576
Additions 1,559 1,693 3,252
Transfer from work in progress 1,313 (1,313) –
Amortisation (recognised in ‘Depreciation and amortisation’)
(1,590) – (1,590)
Net carrying amount at end of year 5,129 2,109 7,238
Recognition and measurement
Intangible assets
The EPA recognises intangible assets only if it is probable that future economic benefit will flow to the EPA and the cost of the asset can be measured reliably. Intangible assets are measured initially at cost. Where an asset is acquired at no or nominal cost, the cost is its fair value as at the date of acquisition.
All research costs are expensed. Development costs are only capitalised when certain criteria are met.
Software
The useful lives of software assets are assessed to be finite.

EPA Annual Report 2017–18
152
Software assets are subsequently measured at fair value only if there is an active market. As there is no active market for the EPA’s intangible software assets, the assets are carried at cost, less any accumulated amortisation and impairment losses.
The EPA’s software assets are amortised using the straight-line method over a period of four years.
Intangible assets are tested for impairment where an indicator of impairment exists. If the recoverable amount is less than its carrying amount, the carrying amount is reduced to recoverable amount and the reduction is recognised as an impairment loss.
10. Fair value measurement of non-financial assets
Fair value measurement and hierarchy Fair value is the price that would be received to sell an asset or paid to transfer a liability in an orderly transaction between market participants at the measurement date. The fair value measurement is based on the presumption that the transaction to sell the asset or transfer the liability takes place either in the principal market for the asset or liability or, in the absence of a principal market, in the most advantageous market for the asset or liability.
When measuring fair value, the valuation technique used maximises the use of relevant observable inputs and minimises the use of unobservable inputs. Under AASB 13, the EPA categorises, for disclosure purposes, the valuation techniques based on the inputs used in the valuation techniques as follows:
Level 1 – quoted prices in active markets for identical assets/liabilities that the EPA can access at the measurement date Level 2 – inputs other than quoted prices included within Level 1 that are observable, either directly or indirectly Level 3 – inputs that are not based on observable market data (unobservable inputs).
The EPA recognises transfers between levels of the fair value hierarchy at the end of the reporting period during which the change has occurred.
Refer to Note 20 for further disclosures on fair value measurements of financial assets.
(a) Fair value hierarchy
Consolidated and parent Level 1
$’000 Level 2
$’000 Level 3
$’000 Total $’000
As at 30 June 2018
Property, plant and equipment (Note 8)
Buildings – – 4,404 4,404
Total – – 4,404 4,404
There were no transfers between Level 1 or 2 during the period.
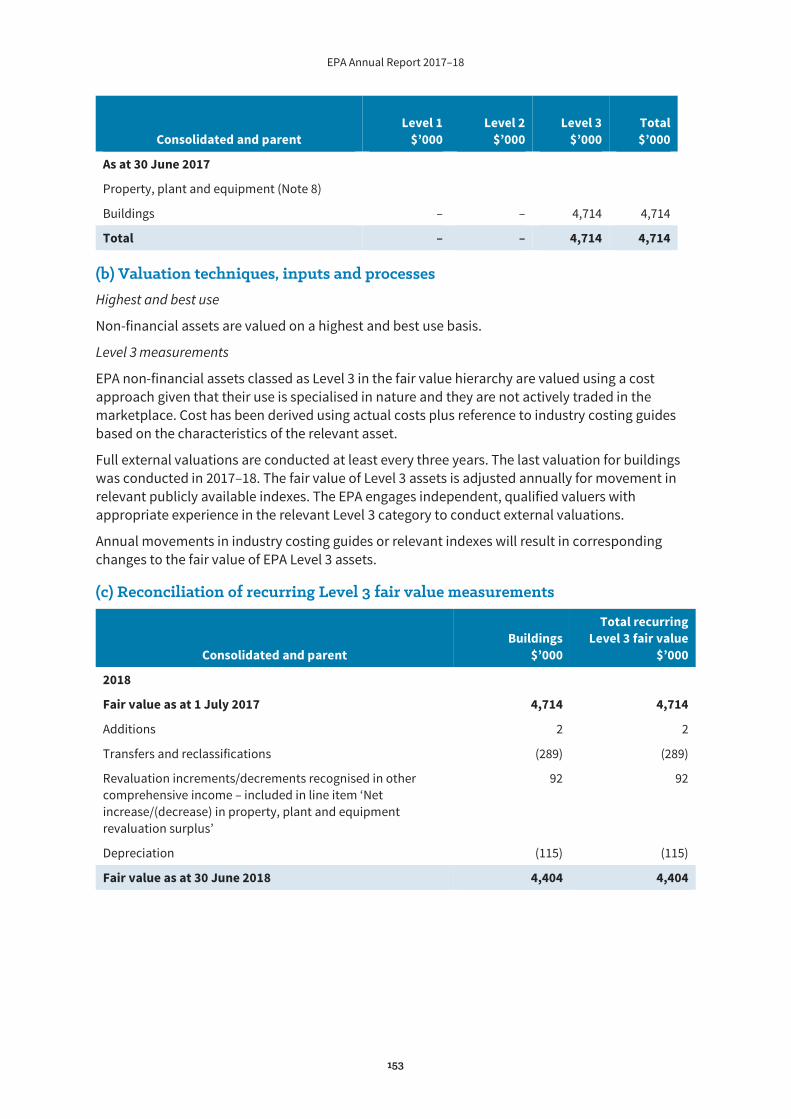
EPA Annual Report 2017–18
153
Consolidated and parent Level 1
$’000 Level 2
$’000 Level 3
$’000 Total $’000
As at 30 June 2017
Property, plant and equipment (Note 8)
Buildings – – 4,714 4,714
Total – – 4,714 4,714
(b) Valuation techniques, inputs and processes Highest and best use
Non-financial assets are valued on a highest and best use basis.
Level 3 measurements
EPA non-financial assets classed as Level 3 in the fair value hierarchy are valued using a cost approach given that their use is specialised in nature and they are not actively traded in the marketplace. Cost has been derived using actual costs plus reference to industry costing guides based on the characteristics of the relevant asset.
Full external valuations are conducted at least every three years. The last valuation for buildings was conducted in 2017–18. The fair value of Level 3 assets is adjusted annually for movement in relevant publicly available indexes. The EPA engages independent, qualified valuers with appropriate experience in the relevant Level 3 category to conduct external valuations.
Annual movements in industry costing guides or relevant indexes will result in corresponding changes to the fair value of EPA Level 3 assets.
(c) Reconciliation of recurring Level 3 fair value measurements
Consolidated and parent Buildings
$’000
Total recurring Level 3 fair value
$’000
2018
Fair value as at 1 July 2017 4,714 4,714
Additions 2 2
Transfers and reclassifications (289) (289)
Revaluation increments/decrements recognised in other comprehensive income – included in line item ‘Net increase/(decrease) in property, plant and equipment revaluation surplus’
92 92
Depreciation (115) (115)
Fair value as at 30 June 2018 4,404 4,404
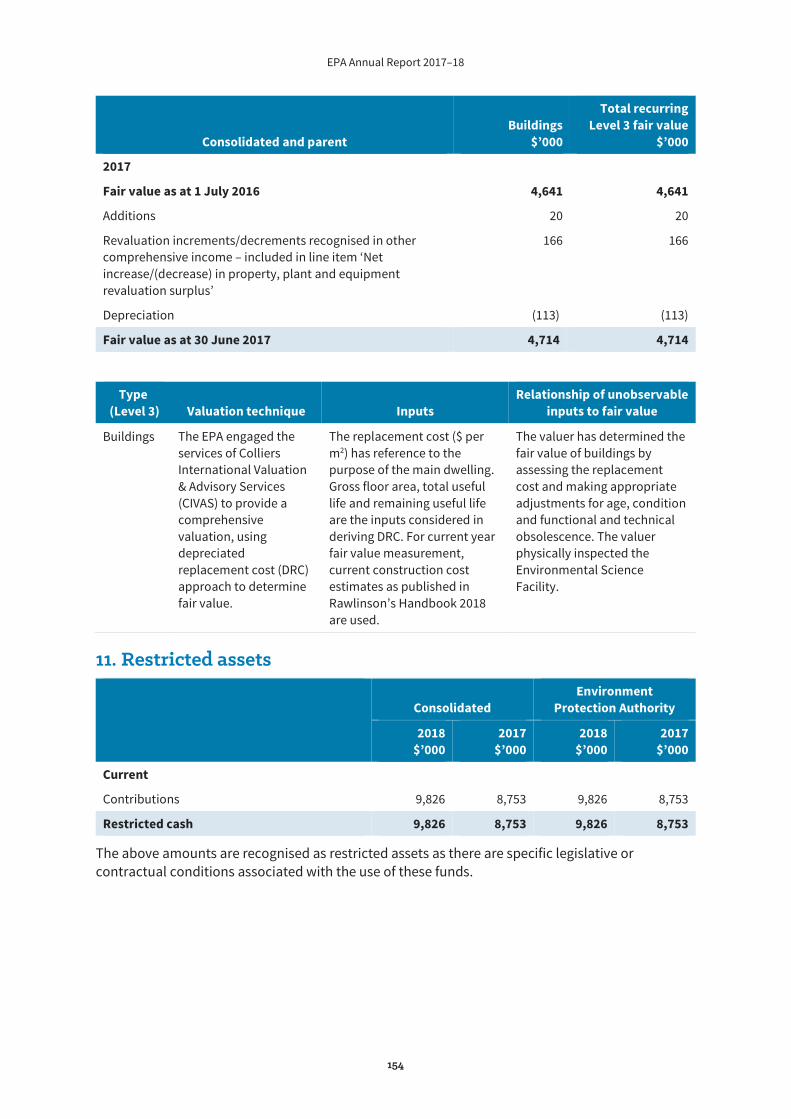
EPA Annual Report 2017–18
154
Consolidated and parent Buildings
$’000
Total recurring Level 3 fair value
$’000
2017
Fair value as at 1 July 2016 4,641 4,641
Additions 20 20
Revaluation increments/decrements recognised in other comprehensive income – included in line item ‘Net increase/(decrease) in property, plant and equipment revaluation surplus’
166 166
Depreciation (113) (113)
Fair value as at 30 June 2017 4,714 4,714
Type (Level 3) Valuation technique Inputs
Relationship of unobservable inputs to fair value
Buildings The EPA engaged the services of Colliers International Valuation & Advisory Services (CIVAS) to provide a comprehensive valuation, using depreciated replacement cost (DRC) approach to determine fair value.
The replacement cost ($ per m2) has reference to the purpose of the main dwelling. Gross floor area, total useful life and remaining useful life are the inputs considered in deriving DRC. For current year fair value measurement, current construction cost estimates as published in Rawlinson’s Handbook 2018 are used.
The valuer has determined the fair value of buildings by assessing the replacement cost and making appropriate adjustments for age, condition and functional and technical obsolescence. The valuer physically inspected the Environmental Science Facility.
11. Restricted assets
Consolidated Environment
Protection Authority
2018 $’000
2017 $’000
2018 $’000
2017 $’000
Current
Contributions 9,826 8,753 9,826 8,753
Restricted cash 9,826 8,753 9,826 8,753
The above amounts are recognised as restricted assets as there are specific legislative or contractual conditions associated with the use of these funds.
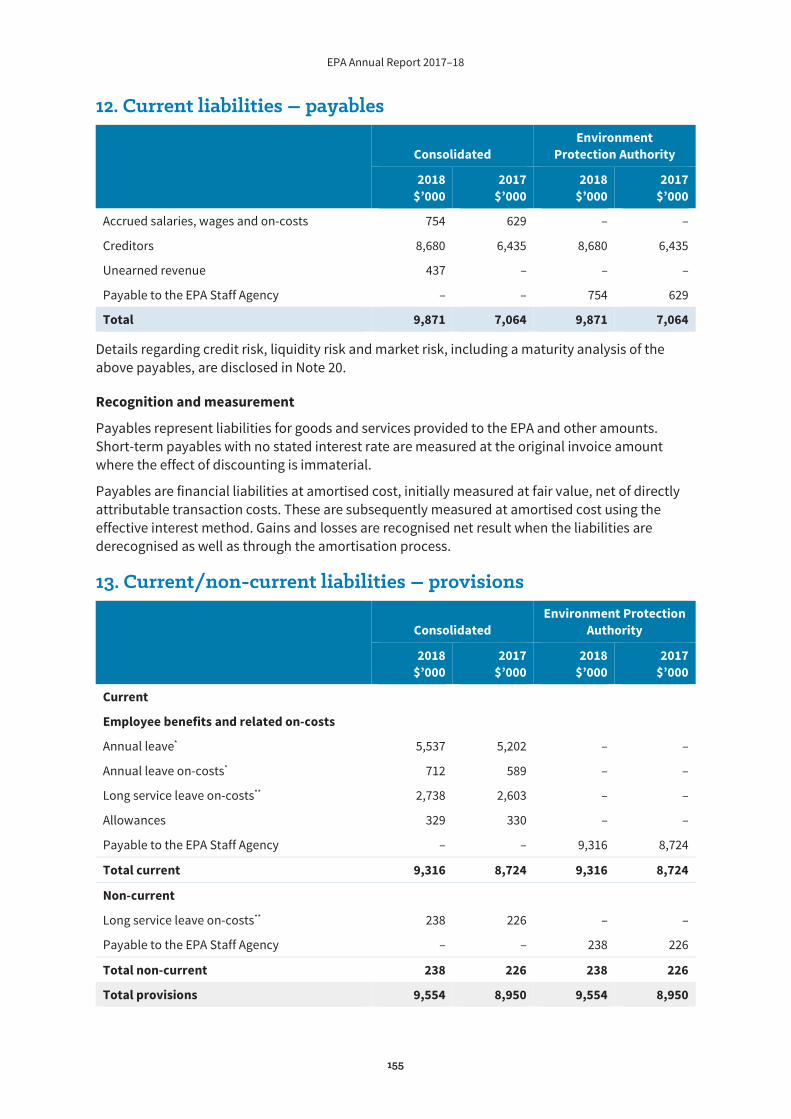
EPA Annual Report 2017–18
155
12. Current liabilities – payables
Consolidated Environment
Protection Authority
2018 $’000
2017 $’000
2018 $’000
2017 $’000
Accrued salaries, wages and on-costs 754 629 – –
Creditors 8,680 6,435 8,680 6,435
Unearned revenue 437 – – –
Payable to the EPA Staff Agency – – 754 629
Total 9,871 7,064 9,871 7,064
Details regarding credit risk, liquidity risk and market risk, including a maturity analysis of the above payables, are disclosed in Note 20.
Recognition and measurement
Payables represent liabilities for goods and services provided to the EPA and other amounts. Short-term payables with no stated interest rate are measured at the original invoice amount where the effect of discounting is immaterial.
Payables are financial liabilities at amortised cost, initially measured at fair value, net of directly attributable transaction costs. These are subsequently measured at amortised cost using the effective interest method. Gains and losses are recognised net result when the liabilities are derecognised as well as through the amortisation process.
13. Current/non-current liabilities – provisions
Consolidated Environment Protection
Authority
2018 $’000
2017 $’000
2018 $’000
2017 $’000
Current
Employee benefits and related on-costs
Annual leave* 5,537 5,202 – –
Annual leave on-costs* 712 589 – –
Long service leave on-costs** 2,738 2,603 – –
Allowances 329 330 – –
Payable to the EPA Staff Agency – – 9,316 8,724
Total current 9,316 8,724 9,316 8,724
Non-current
Long service leave on-costs** 238 226 – –
Payable to the EPA Staff Agency – – 238 226
Total non-current 238 226 238 226
Total provisions 9,554 8,950 9,554 8,950
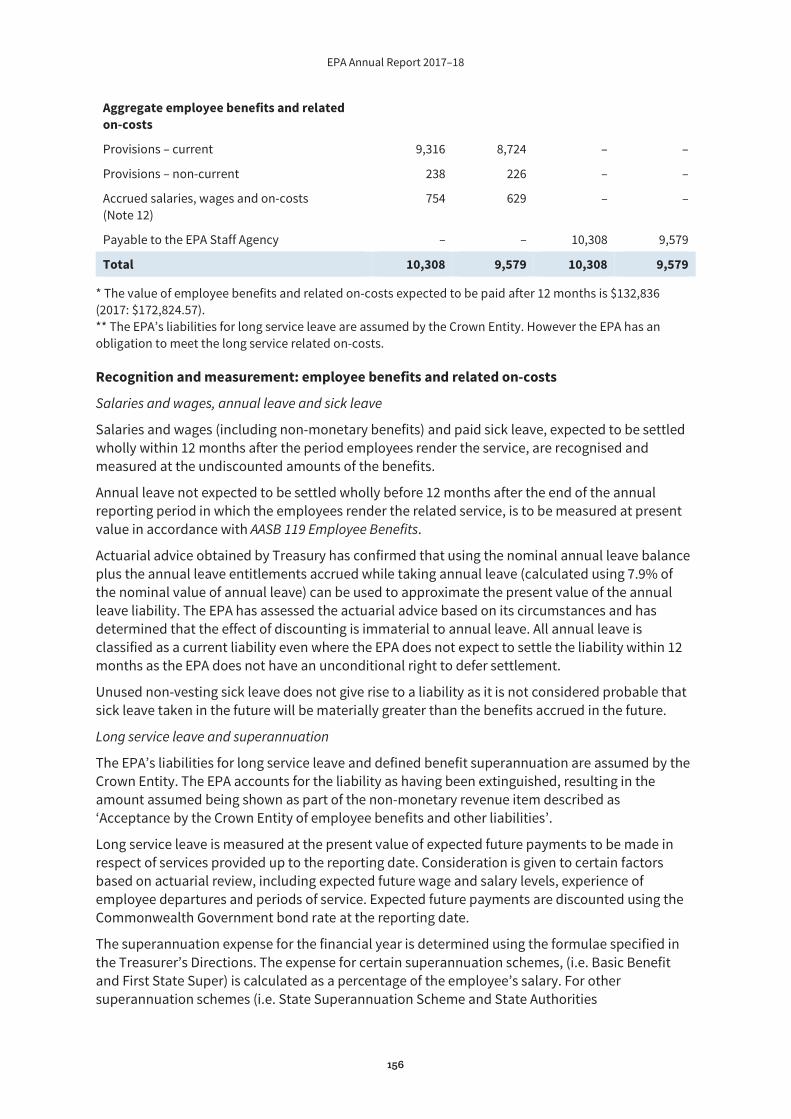
EPA Annual Report 2017–18
156
Aggregate employee benefits and related on-costs
Provisions – current 9,316 8,724 – –
Provisions – non-current 238 226 – –
Accrued salaries, wages and on-costs (Note 12)
754 629 – –
Payable to the EPA Staff Agency – – 10,308 9,579
Total 10,308 9,579 10,308 9,579
* The value of employee benefits and related on-costs expected to be paid after 12 months is $132,836 (2017: $172,824.57). ** The EPA’s liabilities for long service leave are assumed by the Crown Entity. However the EPA has an obligation to meet the long service related on-costs.
Recognition and measurement: employee benefits and related on-costs
Salaries and wages, annual leave and sick leave
Salaries and wages (including non-monetary benefits) and paid sick leave, expected to be settled wholly within 12 months after the period employees render the service, are recognised and measured at the undiscounted amounts of the benefits.
Annual leave not expected to be settled wholly before 12 months after the end of the annual reporting period in which the employees render the related service, is to be measured at present value in accordance with AASB 119 Employee Benefits.
Actuarial advice obtained by Treasury has confirmed that using the nominal annual leave balance plus the annual leave entitlements accrued while taking annual leave (calculated using 7.9% of the nominal value of annual leave) can be used to approximate the present value of the annual leave liability. The EPA has assessed the actuarial advice based on its circumstances and has determined that the effect of discounting is immaterial to annual leave. All annual leave is classified as a current liability even where the EPA does not expect to settle the liability within 12 months as the EPA does not have an unconditional right to defer settlement.
Unused non-vesting sick leave does not give rise to a liability as it is not considered probable that sick leave taken in the future will be materially greater than the benefits accrued in the future.
Long service leave and superannuation
The EPA’s liabilities for long service leave and defined benefit superannuation are assumed by the Crown Entity. The EPA accounts for the liability as having been extinguished, resulting in the amount assumed being shown as part of the non-monetary revenue item described as ‘Acceptance by the Crown Entity of employee benefits and other liabilities’.
Long service leave is measured at the present value of expected future payments to be made in respect of services provided up to the reporting date. Consideration is given to certain factors based on actuarial review, including expected future wage and salary levels, experience of employee departures and periods of service. Expected future payments are discounted using the Commonwealth Government bond rate at the reporting date.
The superannuation expense for the financial year is determined using the formulae specified in the Treasurer’s Directions. The expense for certain superannuation schemes, (i.e. Basic Benefit and First State Super) is calculated as a percentage of the employee’s salary. For other superannuation schemes (i.e. State Superannuation Scheme and State Authorities
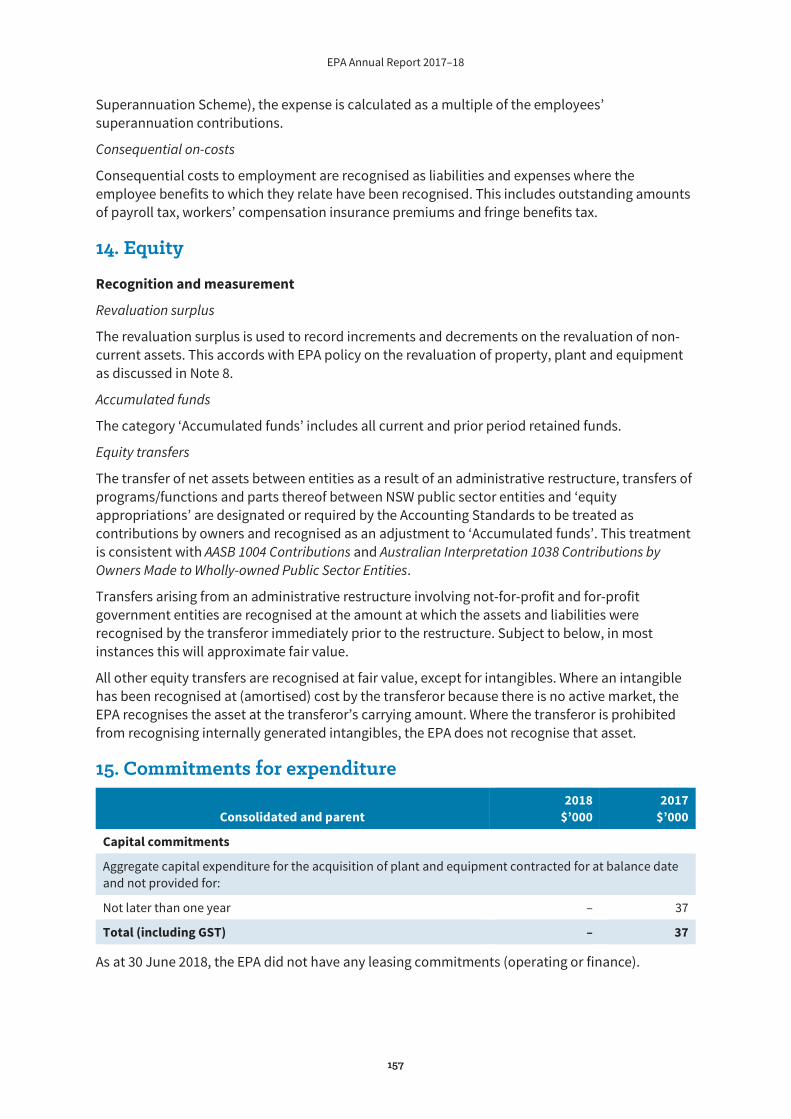
EPA Annual Report 2017–18
157
Superannuation Scheme), the expense is calculated as a multiple of the employees’ superannuation contributions.
Consequential on-costs
Consequential costs to employment are recognised as liabilities and expenses where the employee benefits to which they relate have been recognised. This includes outstanding amounts of payroll tax, workers’ compensation insurance premiums and fringe benefits tax.
14. Equity
Recognition and measurement
Revaluation surplus
The revaluation surplus is used to record increments and decrements on the revaluation of non-current assets. This accords with EPA policy on the revaluation of property, plant and equipment as discussed in Note 8.
Accumulated funds
The category ‘Accumulated funds’ includes all current and prior period retained funds.
Equity transfers
The transfer of net assets between entities as a result of an administrative restructure, transfers of programs/functions and parts thereof between NSW public sector entities and ‘equity appropriations’ are designated or required by the Accounting Standards to be treated as contributions by owners and recognised as an adjustment to ‘Accumulated funds’. This treatment is consistent with AASB 1004 Contributions and Australian Interpretation 1038 Contributions by Owners Made to Wholly-owned Public Sector Entities.
Transfers arising from an administrative restructure involving not-for-profit and for-profit government entities are recognised at the amount at which the assets and liabilities were recognised by the transferor immediately prior to the restructure. Subject to below, in most instances this will approximate fair value.
All other equity transfers are recognised at fair value, except for intangibles. Where an intangible has been recognised at (amortised) cost by the transferor because there is no active market, the EPA recognises the asset at the transferor’s carrying amount. Where the transferor is prohibited from recognising internally generated intangibles, the EPA does not recognise that asset.
15. Commitments for expenditure
Consolidated and parent 2018
$’000 2017
$’000
Capital commitments
Aggregate capital expenditure for the acquisition of plant and equipment contracted for at balance date and not provided for:
Not later than one year – 37
Total (including GST) – 37
As at 30 June 2018, the EPA did not have any leasing commitments (operating or finance).
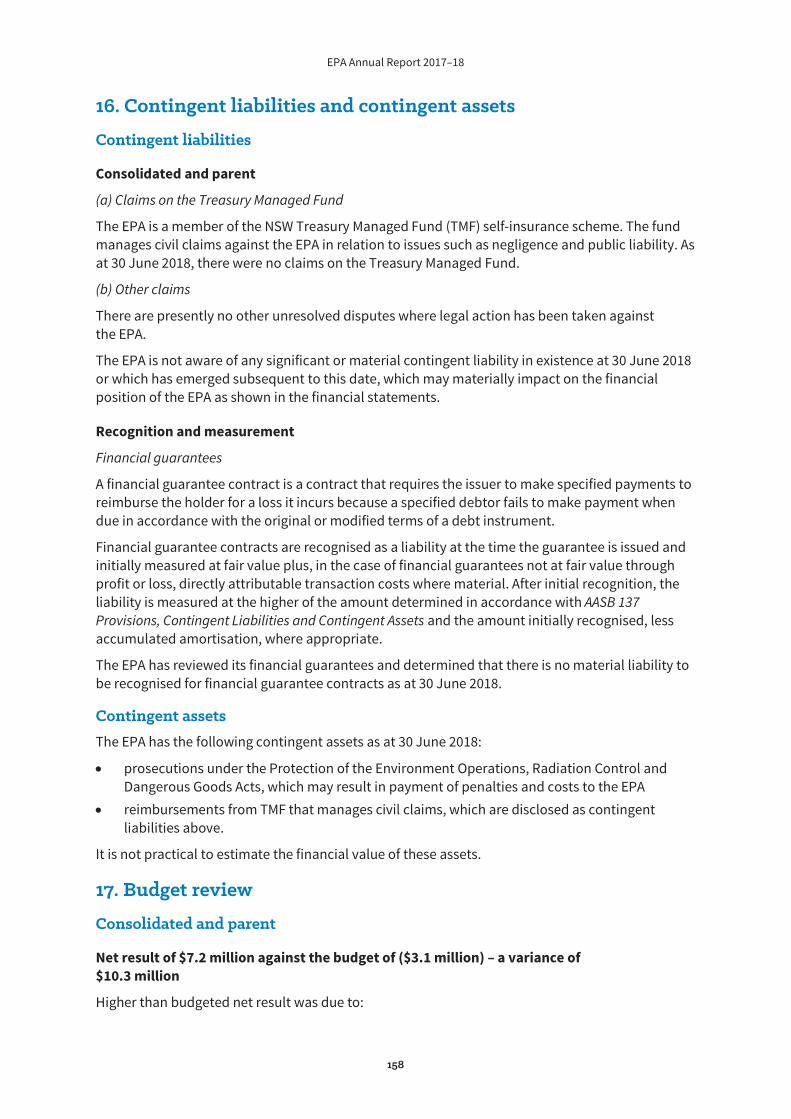
EPA Annual Report 2017–18
158
16. Contingent liabilities and contingent assets
Contingent liabilities
Consolidated and parent
(a) Claims on the Treasury Managed Fund
The EPA is a member of the NSW Treasury Managed Fund (TMF) self-insurance scheme. The fund manages civil claims against the EPA in relation to issues such as negligence and public liability. As at 30 June 2018, there were no claims on the Treasury Managed Fund.
(b) Other claims
There are presently no other unresolved disputes where legal action has been taken against the EPA.
The EPA is not aware of any significant or material contingent liability in existence at 30 June 2018 or which has emerged subsequent to this date, which may materially impact on the financial position of the EPA as shown in the financial statements.
Recognition and measurement
Financial guarantees
A financial guarantee contract is a contract that requires the issuer to make specified payments to reimburse the holder for a loss it incurs because a specified debtor fails to make payment when due in accordance with the original or modified terms of a debt instrument.
Financial guarantee contracts are recognised as a liability at the time the guarantee is issued and initially measured at fair value plus, in the case of financial guarantees not at fair value through profit or loss, directly attributable transaction costs where material. After initial recognition, the liability is measured at the higher of the amount determined in accordance with AASB 137 Provisions, Contingent Liabilities and Contingent Assets and the amount initially recognised, less accumulated amortisation, where appropriate.
The EPA has reviewed its financial guarantees and determined that there is no material liability to be recognised for financial guarantee contracts as at 30 June 2018.
Contingent assets The EPA has the following contingent assets as at 30 June 2018:
prosecutions under the Protection of the Environment Operations, Radiation Control and Dangerous Goods Acts, which may result in payment of penalties and costs to the EPA reimbursements from TMF that manages civil claims, which are disclosed as contingent liabilities above.
It is not practical to estimate the financial value of these assets.
17. Budget review
Consolidated and parent
Net result of $7.2 million against the budget of ($3.1 million) – a variance of $10.3 million
Higher than budgeted net result was due to:
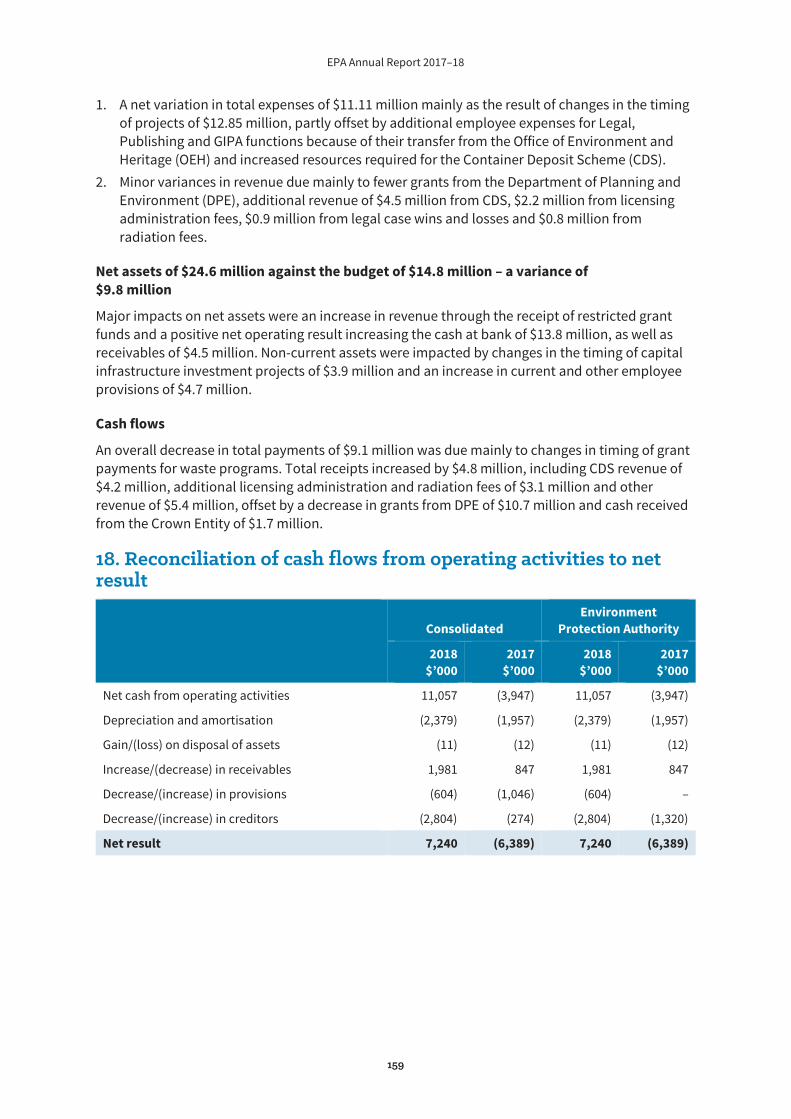
EPA Annual Report 2017–18
159
1. A net variation in total expenses of $11.11 million mainly as the result of changes in the timing of projects of $12.85 million, partly offset by additional employee expenses for Legal, Publishing and GIPA functions because of their transfer from the Office of Environment and Heritage (OEH) and increased resources required for the Container Deposit Scheme (CDS).
2. Minor variances in revenue due mainly to fewer grants from the Department of Planning and Environment (DPE), additional revenue of $4.5 million from CDS, $2.2 million from licensing administration fees, $0.9 million from legal case wins and losses and $0.8 million from radiation fees.
Net assets of $24.6 million against the budget of $14.8 million – a variance of $9.8 million
Major impacts on net assets were an increase in revenue through the receipt of restricted grant funds and a positive net operating result increasing the cash at bank of $13.8 million, as well as receivables of $4.5 million. Non-current assets were impacted by changes in the timing of capital infrastructure investment projects of $3.9 million and an increase in current and other employee provisions of $4.7 million.
Cash flows
An overall decrease in total payments of $9.1 million was due mainly to changes in timing of grant payments for waste programs. Total receipts increased by $4.8 million, including CDS revenue of $4.2 million, additional licensing administration and radiation fees of $3.1 million and other revenue of $5.4 million, offset by a decrease in grants from DPE of $10.7 million and cash received from the Crown Entity of $1.7 million.
18. Reconciliation of cash flows from operating activities to net result
Consolidated
Environment Protection Authority
2018 $’000
2017 $’000
2018 $’000
2017 $’000
Net cash from operating activities 11,057 (3,947) 11,057 (3,947)
Depreciation and amortisation (2,379) (1,957) (2,379) (1,957)
Gain/(loss) on disposal of assets (11) (12) (11) (12)
Increase/(decrease) in receivables 1,981 847 1,981 847
Decrease/(increase) in provisions (604) (1,046) (604) –
Decrease/(increase) in creditors (2,804) (274) (2,804) (1,320)
Net result 7,240 (6,389) 7,240 (6,389)
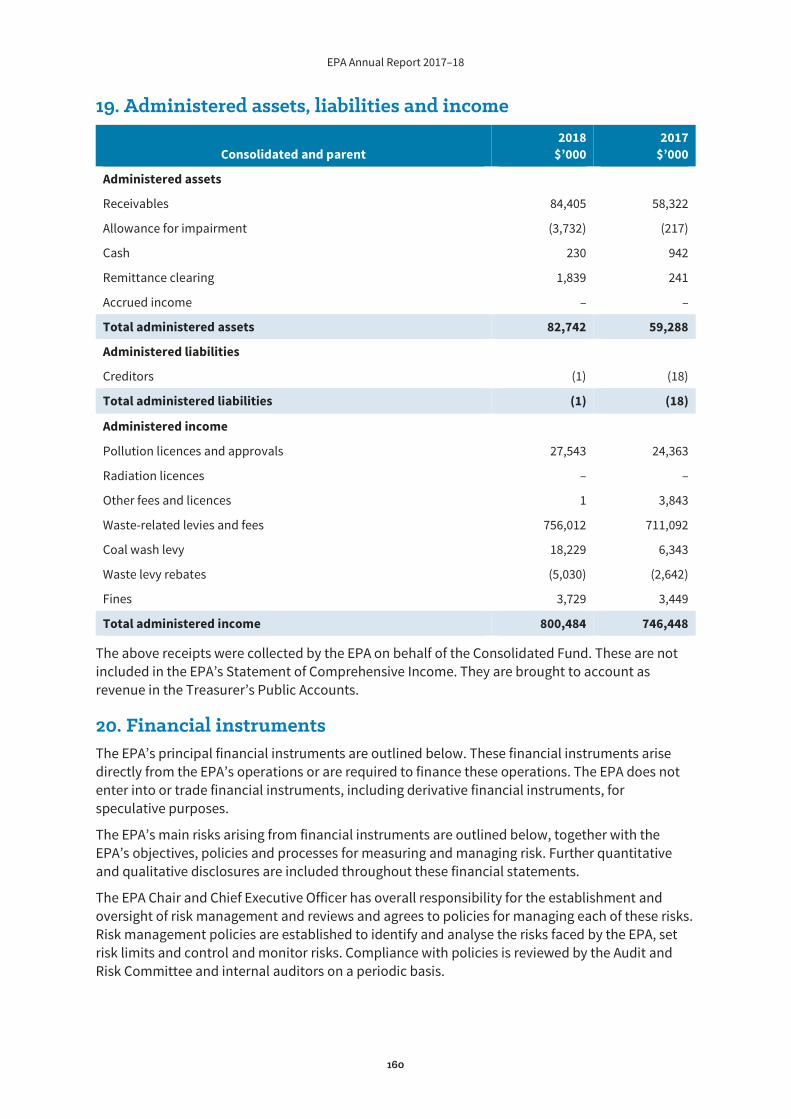
EPA Annual Report 2017–18
160
19. Administered assets, liabilities and income
Consolidated and parent 2018
$’000 2017
$’000
Administered assets
Receivables 84,405 58,322
Allowance for impairment (3,732) (217)
Cash 230 942
Remittance clearing 1,839 241
Accrued income – –
Total administered assets 82,742 59,288
Administered liabilities
Creditors (1) (18)
Total administered liabilities (1) (18)
Administered income
Pollution licences and approvals 27,543 24,363
Radiation licences – –
Other fees and licences 1 3,843
Waste-related levies and fees 756,012 711,092
Coal wash levy 18,229 6,343
Waste levy rebates (5,030) (2,642)
Fines 3,729 3,449
Total administered income 800,484 746,448
The above receipts were collected by the EPA on behalf of the Consolidated Fund. These are not included in the EPA’s Statement of Comprehensive Income. They are brought to account as revenue in the Treasurer’s Public Accounts.
20. Financial instruments The EPA’s principal financial instruments are outlined below. These financial instruments arise directly from the EPA’s operations or are required to finance these operations. The EPA does not enter into or trade financial instruments, including derivative financial instruments, for speculative purposes.
The EPA’s main risks arising from financial instruments are outlined below, together with the EPA’s objectives, policies and processes for measuring and managing risk. Further quantitative and qualitative disclosures are included throughout these financial statements.
The EPA Chair and Chief Executive Officer has overall responsibility for the establishment and oversight of risk management and reviews and agrees to policies for managing each of these risks. Risk management policies are established to identify and analyse the risks faced by the EPA, set risk limits and control and monitor risks. Compliance with policies is reviewed by the Audit and Risk Committee and internal auditors on a periodic basis.
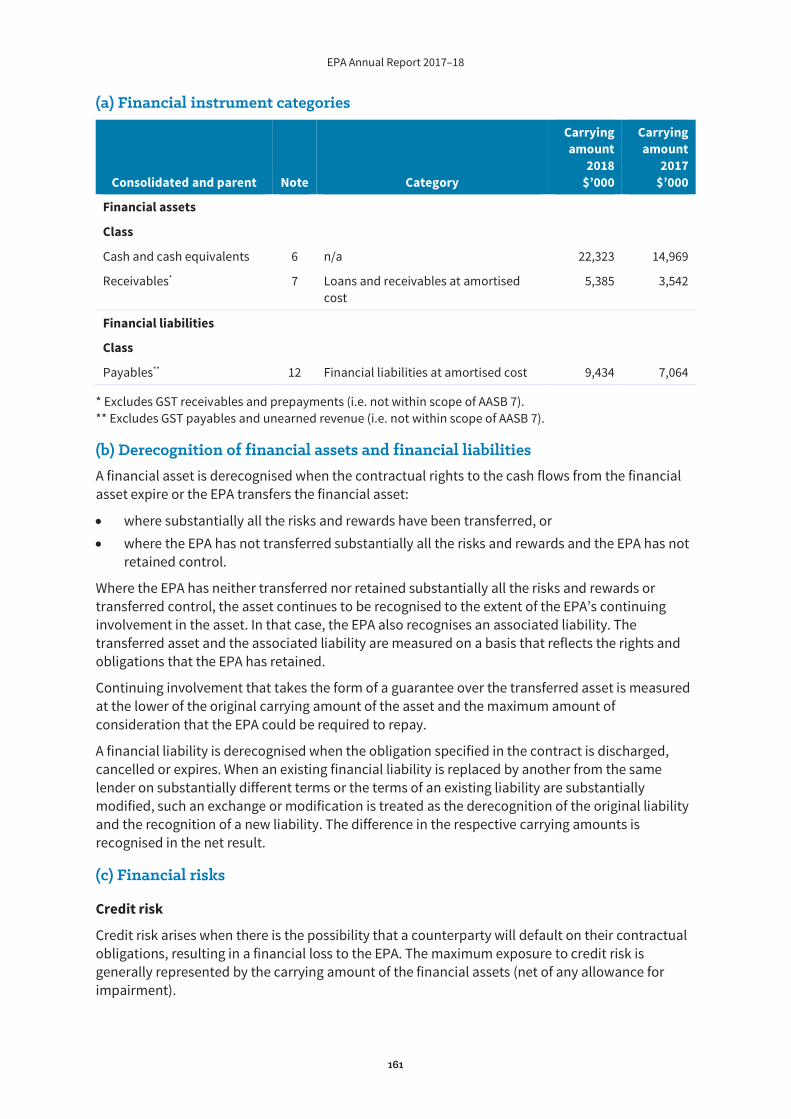
EPA Annual Report 2017–18
161
(a) Financial instrument categories
Consolidated and parent Note Category
Carrying amount
2018 $’000
Carrying amount
2017 $’000
Financial assets
Class
Cash and cash equivalents 6 n/a 22,323 14,969
Receivables* 7 Loans and receivables at amortised cost
5,385 3,542
Financial liabilities
Class
Payables** 12 Financial liabilities at amortised cost 9,434 7,064
* Excludes GST receivables and prepayments (i.e. not within scope of AASB 7). ** Excludes GST payables and unearned revenue (i.e. not within scope of AASB 7).
(b) Derecognition of financial assets and financial liabilities A financial asset is derecognised when the contractual rights to the cash flows from the financial asset expire or the EPA transfers the financial asset:
where substantially all the risks and rewards have been transferred, or where the EPA has not transferred substantially all the risks and rewards and the EPA has not retained control.
Where the EPA has neither transferred nor retained substantially all the risks and rewards or transferred control, the asset continues to be recognised to the extent of the EPA’s continuing involvement in the asset. In that case, the EPA also recognises an associated liability. The transferred asset and the associated liability are measured on a basis that reflects the rights and obligations that the EPA has retained.
Continuing involvement that takes the form of a guarantee over the transferred asset is measured at the lower of the original carrying amount of the asset and the maximum amount of consideration that the EPA could be required to repay.
A financial liability is derecognised when the obligation specified in the contract is discharged, cancelled or expires. When an existing financial liability is replaced by another from the same lender on substantially different terms or the terms of an existing liability are substantially modified, such an exchange or modification is treated as the derecognition of the original liability and the recognition of a new liability. The difference in the respective carrying amounts is recognised in the net result.
(c) Financial risks
Credit risk
Credit risk arises when there is the possibility that a counterparty will default on their contractual obligations, resulting in a financial loss to the EPA. The maximum exposure to credit risk is generally represented by the carrying amount of the financial assets (net of any allowance for impairment).
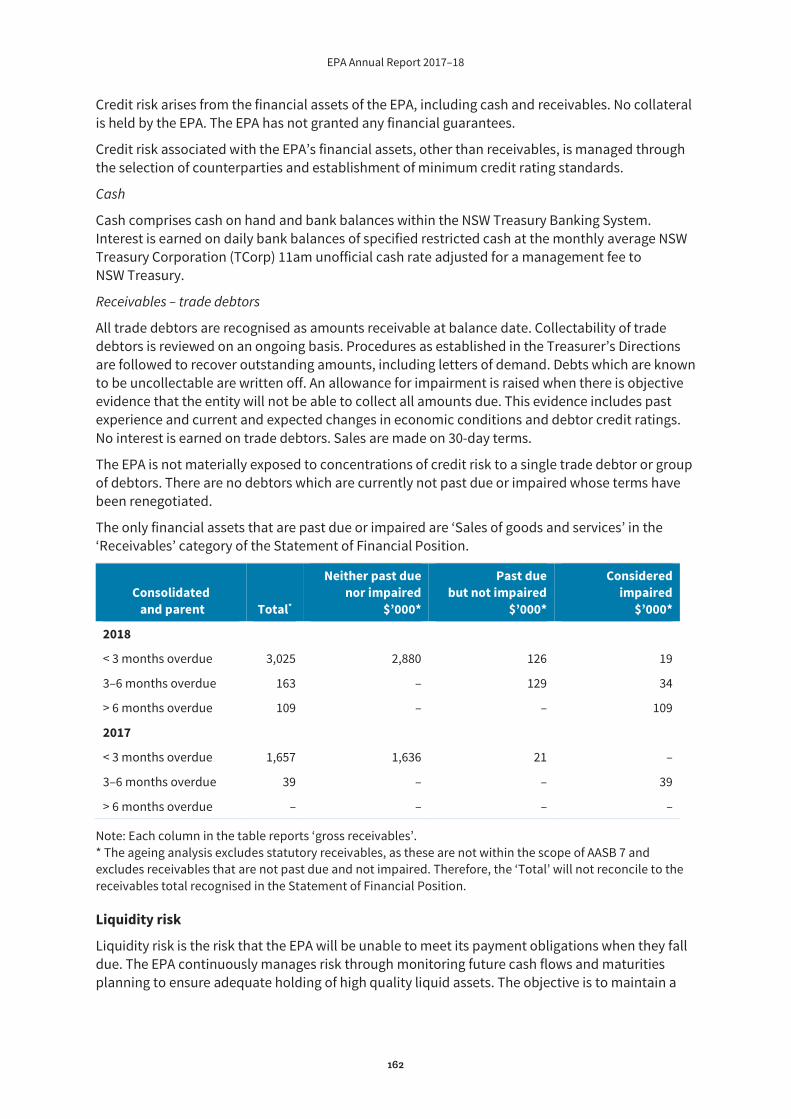
EPA Annual Report 2017–18
162
Credit risk arises from the financial assets of the EPA, including cash and receivables. No collateral is held by the EPA. The EPA has not granted any financial guarantees.
Credit risk associated with the EPA’s financial assets, other than receivables, is managed through the selection of counterparties and establishment of minimum credit rating standards.
Cash
Cash comprises cash on hand and bank balances within the NSW Treasury Banking System. Interest is earned on daily bank balances of specified restricted cash at the monthly average NSW Treasury Corporation (TCorp) 11am unofficial cash rate adjusted for a management fee to NSW Treasury.
Receivables – trade debtors
All trade debtors are recognised as amounts receivable at balance date. Collectability of trade debtors is reviewed on an ongoing basis. Procedures as established in the Treasurer’s Directions are followed to recover outstanding amounts, including letters of demand. Debts which are known to be uncollectable are written off. An allowance for impairment is raised when there is objective evidence that the entity will not be able to collect all amounts due. This evidence includes past experience and current and expected changes in economic conditions and debtor credit ratings. No interest is earned on trade debtors. Sales are made on 30-day terms.
The EPA is not materially exposed to concentrations of credit risk to a single trade debtor or group of debtors. There are no debtors which are currently not past due or impaired whose terms have been renegotiated.
The only financial assets that are past due or impaired are ‘Sales of goods and services’ in the ‘Receivables’ category of the Statement of Financial Position.
Consolidated and parent Total*
Neither past due nor impaired
$’000*
Past due but not impaired
$’000*
Considered impaired
$’000*
2018
< 3 months overdue 3,025 2,880 126 19
3–6 months overdue 163 – 129 34
> 6 months overdue 109 – – 109
2017
< 3 months overdue 1,657 1,636 21 –
3–6 months overdue 39 – – 39
> 6 months overdue – – – –
Note: Each column in the table reports ‘gross receivables’. * The ageing analysis excludes statutory receivables, as these are not within the scope of AASB 7 and excludes receivables that are not past due and not impaired. Therefore, the ‘Total’ will not reconcile to the receivables total recognised in the Statement of Financial Position.
Liquidity risk
Liquidity risk is the risk that the EPA will be unable to meet its payment obligations when they fall due. The EPA continuously manages risk through monitoring future cash flows and maturities planning to ensure adequate holding of high quality liquid assets. The objective is to maintain a
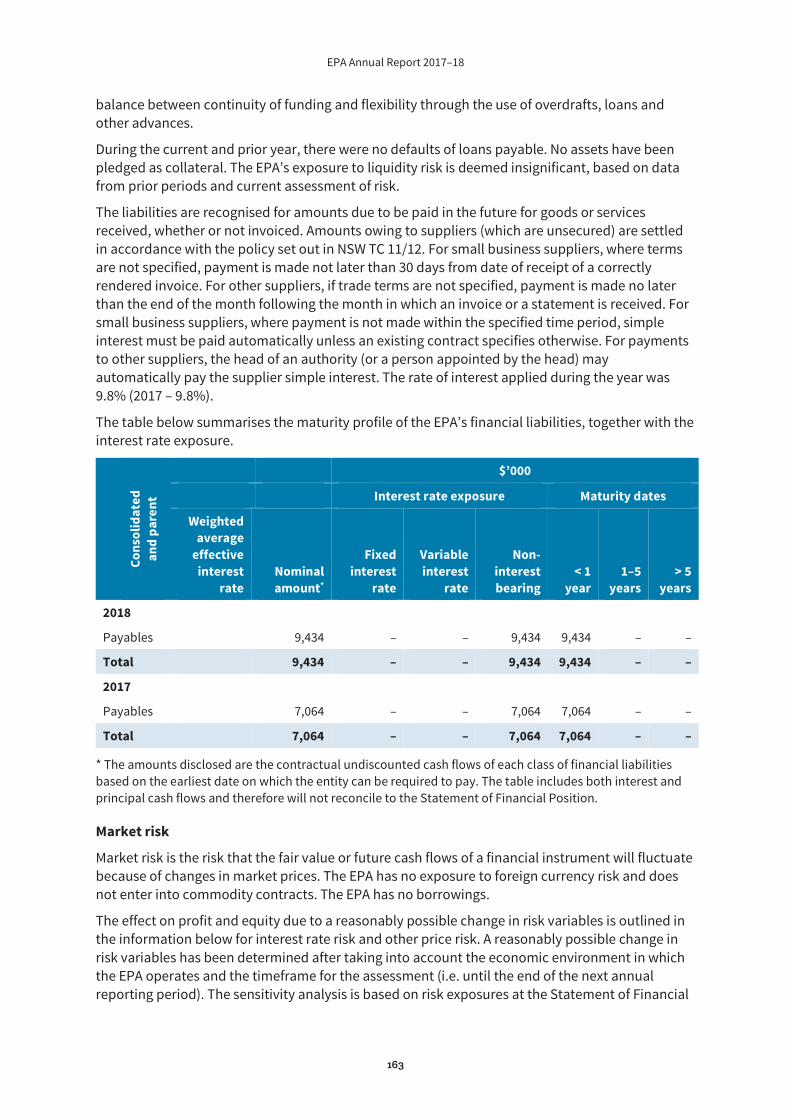
EPA Annual Report 2017–18
163
balance between continuity of funding and flexibility through the use of overdrafts, loans and other advances.
During the current and prior year, there were no defaults of loans payable. No assets have been pledged as collateral. The EPA’s exposure to liquidity risk is deemed insignificant, based on data from prior periods and current assessment of risk.
The liabilities are recognised for amounts due to be paid in the future for goods or services received, whether or not invoiced. Amounts owing to suppliers (which are unsecured) are settled in accordance with the policy set out in NSW TC 11/12. For small business suppliers, where terms are not specified, payment is made not later than 30 days from date of receipt of a correctly rendered invoice. For other suppliers, if trade terms are not specified, payment is made no later than the end of the month following the month in which an invoice or a statement is received. For small business suppliers, where payment is not made within the specified time period, simple interest must be paid automatically unless an existing contract specifies otherwise. For payments to other suppliers, the head of an authority (or a person appointed by the head) may automatically pay the supplier simple interest. The rate of interest applied during the year was 9.8% (2017 – 9.8%).
The table below summarises the maturity profile of the EPA’s financial liabilities, together with the interest rate exposure.
Cons
olid
ated
an
d pa
rent
$’000
Interest rate exposure Maturity dates
Weighted average
effective interest
rate Nominal amount*
Fixed interest
rate
Variable interest
rate
Non-interest bearing
< 1 year
1–5 years
> 5 years
2018
Payables 9,434 – – 9,434 9,434 – –
Total 9,434 – – 9,434 9,434 – –
2017
Payables 7,064 – – 7,064 7,064 – –
Total 7,064 – – 7,064 7,064 – –
* The amounts disclosed are the contractual undiscounted cash flows of each class of financial liabilities based on the earliest date on which the entity can be required to pay. The table includes both interest and principal cash flows and therefore will not reconcile to the Statement of Financial Position.
Market risk
Market risk is the risk that the fair value or future cash flows of a financial instrument will fluctuate because of changes in market prices. The EPA has no exposure to foreign currency risk and does not enter into commodity contracts. The EPA has no borrowings.
The effect on profit and equity due to a reasonably possible change in risk variables is outlined in the information below for interest rate risk and other price risk. A reasonably possible change in risk variables has been determined after taking into account the economic environment in which the EPA operates and the timeframe for the assessment (i.e. until the end of the next annual reporting period). The sensitivity analysis is based on risk exposures at the Statement of Financial

EPA Annual Report 2017–18
164
Position date. The analysis is performed on the same basis as for 2017. The analysis assumes that all other variables remain constant.
Interest rate risk
The EPA does not account for any fixed-rate financial instruments at fair value through profit or loss or as available-for-sale. Therefore, for these financial instruments, a change in interest rates would not affect profit or loss or equity. A reasonably possible change of +/–1% is used, consistent with current trends in interest rates. The basis will be reviewed annually and amended where there is a structural change in the level of interest rate volatility. The EPA’s exposure to interest rate risk is set out below.
Consolidated and parent
$’000
Carrying amount
–1% 1%
Profit Equity Profit Equity
2018
Financial assets
Cash and cash equivalents 22,323 (223) (223) 223 223
Receivables 5,385 (54) (54) 54 54
Financial liabilities
Payables 9,434 94 94 (94) (94)
2017
Financial assets
Cash and cash equivalents 14,969 (150) (150) 150 150
Receivables 3,542 (35) (35) 35 35
Financial liabilities
Payables 7,064 71 71 (71) (71)
(d) Fair value compared to carrying amount Financial instruments are generally recognised at cost.
The amortised cost of financial instruments recognised in the Statement of Financial Position approximates fair value because of the short-term nature of the financial instruments.
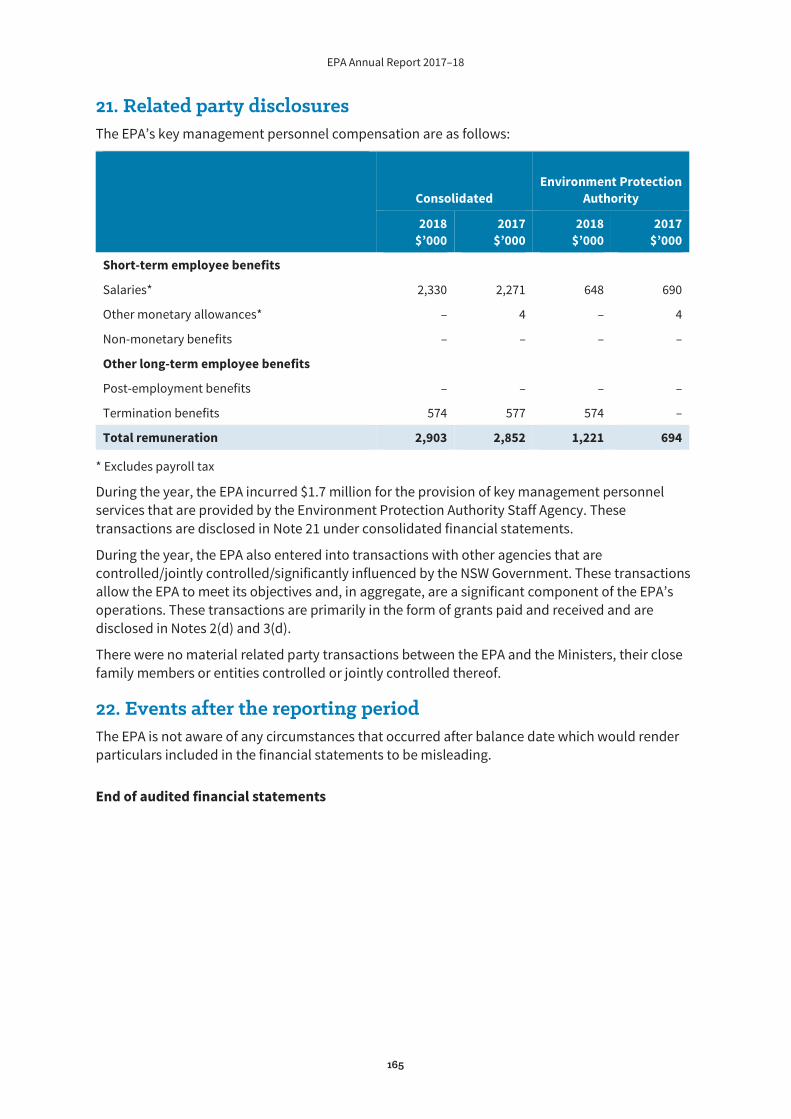
EPA Annual Report 2017–18
165
21. Related party disclosures The EPA’s key management personnel compensation are as follows:
Consolidated Environment Protection
Authority
2018 $’000
2017 $’000
2018 $’000
2017 $’000
Short-term employee benefits
Salaries* 2,330 2,271 648 690
Other monetary allowances* – 4 – 4
Non-monetary benefits – – – –
Other long-term employee benefits
Post-employment benefits – – – –
Termination benefits 574 577 574 –
Total remuneration 2,903 2,852 1,221 694
* Excludes payroll tax
During the year, the EPA incurred $1.7 million for the provision of key management personnel services that are provided by the Environment Protection Authority Staff Agency. These transactions are disclosed in Note 21 under consolidated financial statements.
During the year, the EPA also entered into transactions with other agencies that are controlled/jointly controlled/significantly influenced by the NSW Government. These transactions allow the EPA to meet its objectives and, in aggregate, are a significant component of the EPA’s operations. These transactions are primarily in the form of grants paid and received and are disclosed in Notes 2(d) and 3(d).
There were no material related party transactions between the EPA and the Ministers, their close family members or entities controlled or jointly controlled thereof.
22. Events after the reporting period The EPA is not aware of any circumstances that occurred after balance date which would render particulars included in the financial statements to be misleading.
End of audited financial statements
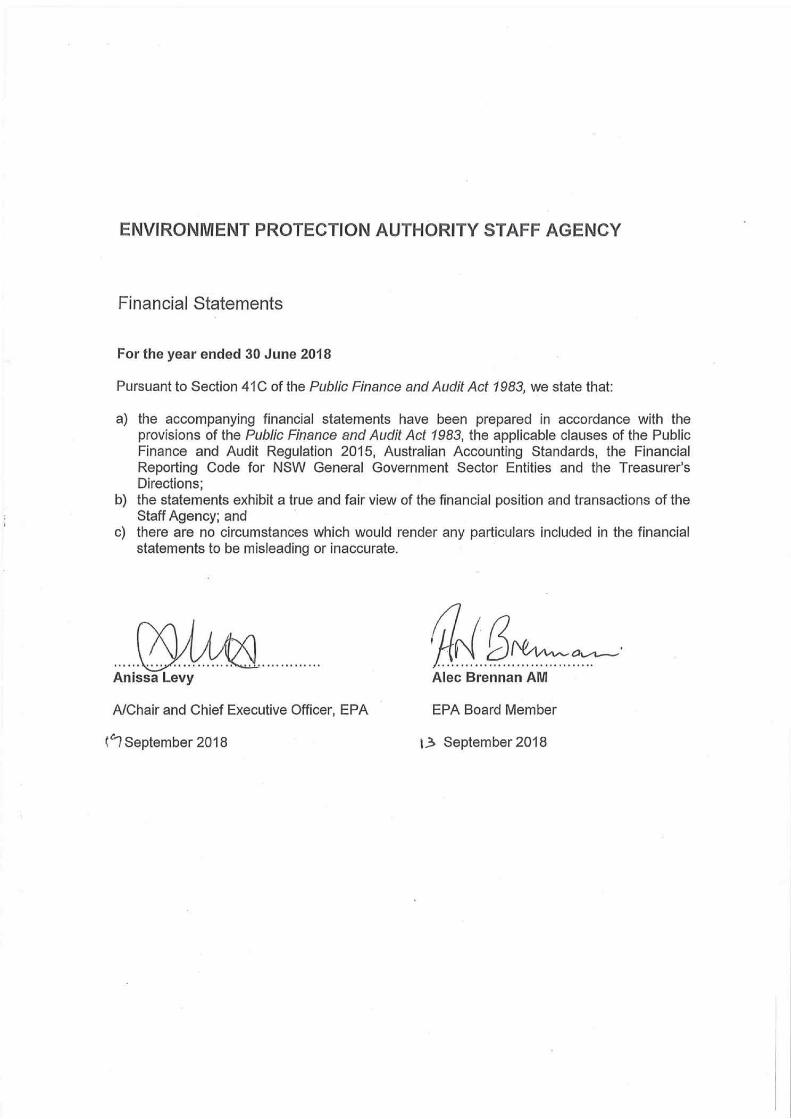
INDEPENDENT AUDITOR’S REPORTEnvironment Protection Authority Staff Agency
To Members of the New South Wales Parliament
OpinionI have audited the accompanying financial statements of the Environment Protection Authority Staff Agency (the Agency), which comprise the Statement of Comprehensive Income for the year ended 30 June 2018, the Statement of Financial Position as at 30 June 2018, the Statement of Changes in Equity and the Statement of Cash Flows for the year then ended, notes comprising a Summary of Significant Accounting Policies and other explanatory information.
In my opinion, the financial statements:
• give a true and fair view of the financial position of the Agency as at 30 June 2018, and of its financial performance and its cash flows for the year then ended in accordance with Australian Accounting Standards
• are in accordance with section 41B of the Public Finance and Audit Act 1983 (PF&A Act) and the Public Finance and Audit Regulation 2015.
My opinion should be read in conjunction with the rest of this report.
Basis for OpinionI conducted my audit in accordance with Australian Auditing Standards. My responsibilities under the standards are described in the ‘Auditor’s Responsibilities for the Audit of the Financial Statements’section of my report.
I am independent of the Agency in accordance with the requirements of the:
• Australian Auditing Standards• Accounting Professional and Ethical Standards Board’s APES 110 ‘Code of Ethics for
Professional Accountants’ (APES 110).
I have fulfilled my other ethical responsibilities in accordance with APES 110.
Parliament promotes independence by ensuring the Auditor-General and the Audit Office of New South Wales are not compromised in their roles by:
• providing that only Parliament, and not the executive government, can remove anAuditor-General
• mandating the Auditor-General as auditor of public sector agencies• precluding the Auditor-General from providing non-audit services.
I believe the audit evidence I have obtained is sufficient and appropriate to provide a basis for my audit opinion.

Other InformationOther information comprises the information included in the Agency’s annual report for the year ended30 June 2018, other than the financial statements and my Independent Auditor’s Report thereon. The members of the Board of the Agency are responsible for the other information. At the date of this Independent Auditor’s Report, the other information I have received comprise the signed Statement pursuant to Section 41C of the PF&A Act.
My opinion on the financial statements does not cover the other information. Accordingly, I do not express any form of assurance conclusion on the other information.
In connection with my audit of the financial statements, my responsibility is to read the other information and, in doing so, consider whether the other information is materially inconsistent with the financial statements or my knowledge obtained in the audit, or otherwise appears to be materially misstated.
If, based on the work I have performed, I conclude there is a material misstatement of the other information, I must report that fact.
I have nothing to report in this regard.
The Board’s Responsibilities for the Financial StatementsThe members of the Board are responsible for the preparation and fair presentation of the financial statements in accordance with Australian Accounting Standards and the PF&A, and for such internal control as the members of the Board determine is necessary to enable the preparation and fair presentation of the financial statements that are free from material misstatement, whether due to fraud or error.
In preparing the financial statements, the members of the Board are responsible for assessing the Agency’s ability to continue as a going concern, disclosing as applicable, matters related to going concern and using the going concern basis of accounting except where the Agency will be dissolved by an Act of Parliament or otherwise cease operations.
Auditor’s Responsibilities for the Audit of the Financial StatementsMy objectives are to:
• obtain reasonable assurance about whether the financial statements as a whole are free from material misstatement, whether due to fraud or error
• issue an Independent Auditor’s Report including my opinion.
Reasonable assurance is a high level of assurance, but does not guarantee an audit conducted in accordance with Australian Auditing Standards will always detect material misstatements. Misstatements can arise from fraud or error. Misstatements are considered material if, individually or in aggregate, they could reasonably be expected to influence the economic decisions users take based on the financial statements.
A description of my responsibilities for the audit of the financial statements is located at the Auditing and Assurance Standards Board website at: www.auasb.gov.au/auditors_responsibilities/ar4.pdf. The description forms part of my auditor’s report.

My opinion does not provide assurance:
• that the Agency carried out its activities effectively, efficiently and economically• about the security and controls over the electronic publication of the audited financial
statements on any website where they may be presented• about any other information which may have been hyperlinked to/from the financial statements.
Reiky JiangDirector, Financial Audit Services
20 September 2018SYDNEY
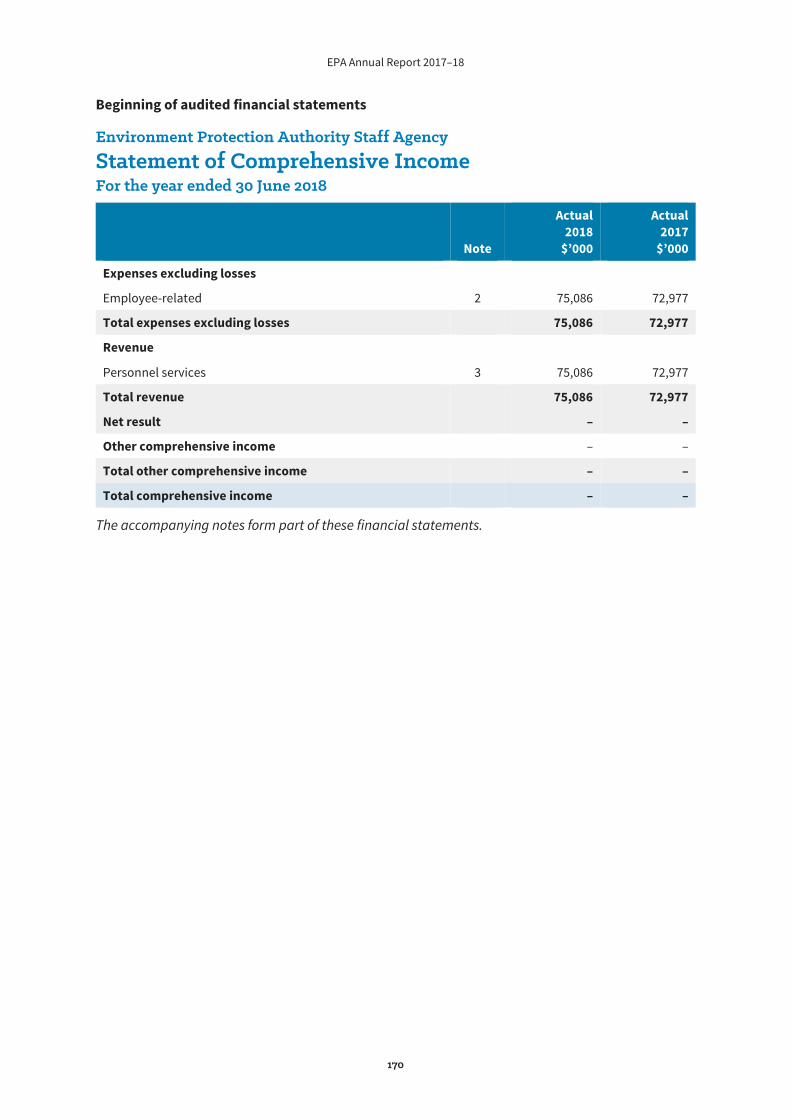
EPA Annual Report 2017–18
170
Beginning of audited financial statements
Environment Protection Authority Staff Agency Statement of Comprehensive Income For the year ended 30 June 2018
Note
Actual 2018
$’000
Actual 2017
$’000
Expenses excluding losses
Employee-related 2 75,086 72,977
Total expenses excluding losses 75,086 72,977
Revenue
Personnel services 3 75,086 72,977
Total revenue 75,086 72,977
Net result – –
Other comprehensive income – –
Total other comprehensive income – –
Total comprehensive income – –
The accompanying notes form part of these financial statements.
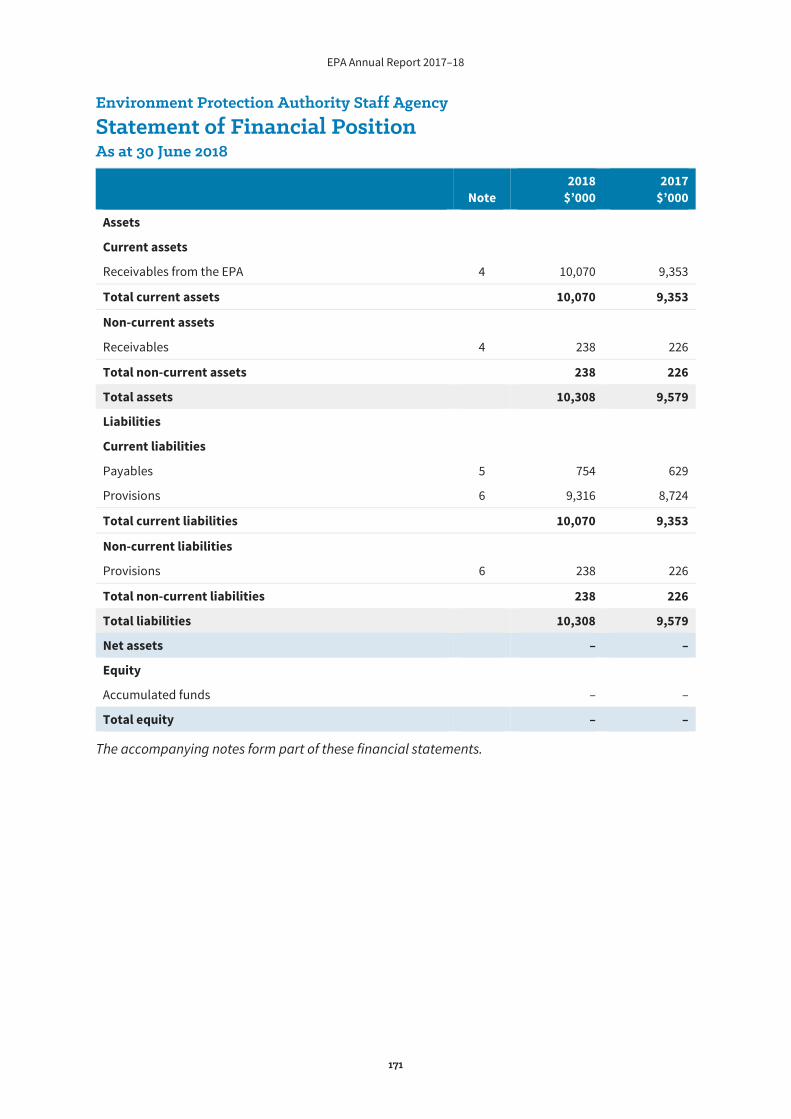
EPA Annual Report 2017–18
171
Environment Protection Authority Staff Agency Statement of Financial Position As at 30 June 2018
Note 2018
$’000 2017
$’000
Assets
Current assets
Receivables from the EPA 4 10,070 9,353
Total current assets 10,070 9,353
Non-current assets
Receivables 4 238 226
Total non-current assets 238 226
Total assets 10,308 9,579
Liabilities
Current liabilities
Payables 5 754 629
Provisions 6 9,316 8,724
Total current liabilities 10,070 9,353
Non-current liabilities
Provisions 6 238 226
Total non-current liabilities 238 226
Total liabilities 10,308 9,579
Net assets – –
Equity
Accumulated funds – –
Total equity – –
The accompanying notes form part of these financial statements.
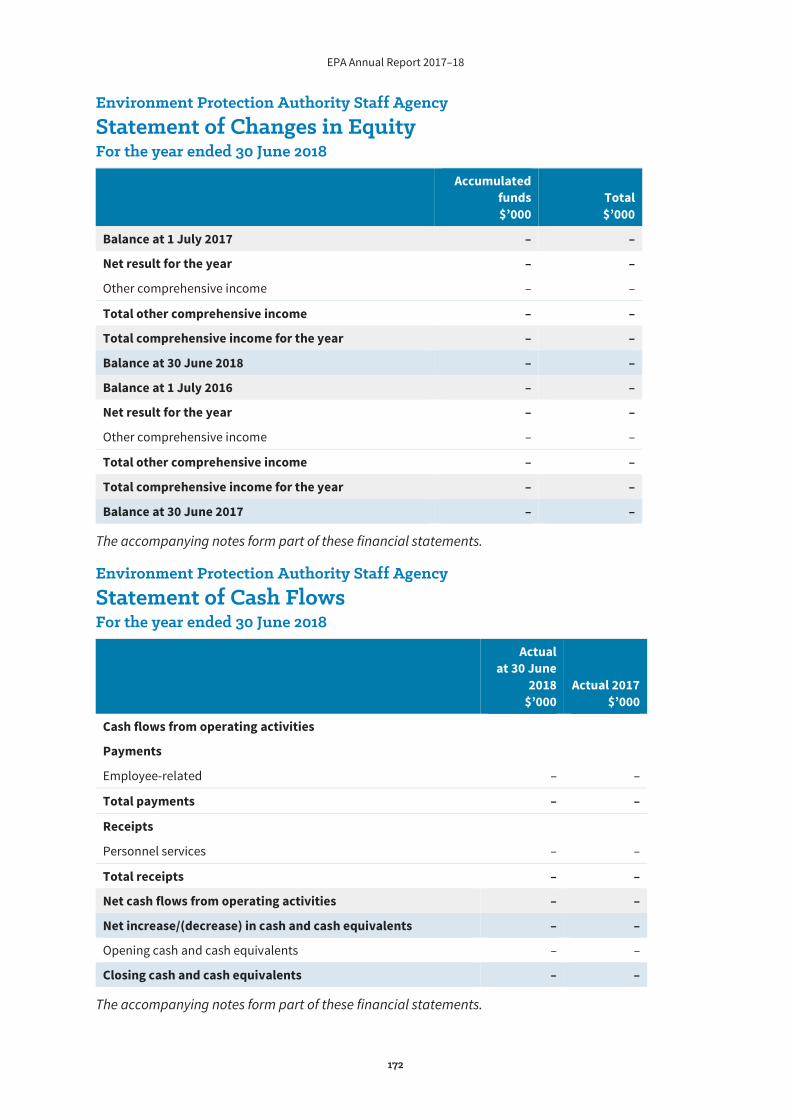
EPA Annual Report 2017–18
172
Environment Protection Authority Staff Agency Statement of Changes in Equity For the year ended 30 June 2018
Accumulated funds $’000
Total $’000
Balance at 1 July 2017 – –
Net result for the year – –
Other comprehensive income – –
Total other comprehensive income – –
Total comprehensive income for the year – –
Balance at 30 June 2018 – –
Balance at 1 July 2016 – –
Net result for the year – –
Other comprehensive income – –
Total other comprehensive income – –
Total comprehensive income for the year – –
Balance at 30 June 2017 – –
The accompanying notes form part of these financial statements.
Environment Protection Authority Staff Agency Statement of Cash Flows For the year ended 30 June 2018
Actual at 30 June
2018 $’000
Actual 2017 $’000
Cash flows from operating activities
Payments
Employee-related – –
Total payments – –
Receipts
Personnel services – –
Total receipts – –
Net cash flows from operating activities – –
Net increase/(decrease) in cash and cash equivalents – –
Opening cash and cash equivalents – –
Closing cash and cash equivalents – –
The accompanying notes form part of these financial statements.
EPA Annual Report 2017–18
173
Notes to and forming part of the financial statements for the year ended 30 June 2018
1. Summary of significant accounting policies
(a) Reporting entity The Environment Protection Authority Staff Agency (the ‘Staff Agency’) is a Division of the Government Service responsible to the Minister for the Environment established under the Administrative Arrangements Order 2014 (the ‘Order’), dated 29 January 2014. Under the Order, the former Office of Environment Protection Authority became the Staff Agency, which is deemed a continuing agency for reporting purposes.
The Staff Agency is a not-for-profit entity with the sole objective of providing personnel services to the Environment Protection Authority (EPA).
The Staff Agency is a controlled entity of the EPA. The Staff Agency is consolidated with the EPA and is part of the NSW total State Sector Accounts.
Apart from employee-related liabilities and provisions and corresponding receivables from the EPA, the Staff Agency does not have any other assets or liabilities under its control.
These financial statements for the year ended 30 June 2018 have been authorised for issue by the Acting Chair and Chief Executive Officer of the EPA on 19 September 2018.
(b) Basis of preparation The Staff Agency’s financial statements are general purpose financial statements which have been prepared on an accruals basis in accordance with:
applicable Australian Accounting Standards (AAS) (which include Australian Accounting Interpretations) the requirements of the Public Finance and Audit Act 1983 and Public Finance and Audit Regulation 2015 the Financial Reporting Directions mandated by the Treasurer.
Generally, the historical cost basis of accounting has been adopted and the financial statements do not take into account the time value of money or current valuation.
Judgements, key assumptions and estimations management has made are disclosed in the relevant notes to the financial statements.
All amounts are rounded to the nearest one thousand dollars and are expressed in Australian currency, which is the Staff Agency’s presentation and functional currency.
(c) Statement of compliance The financial statements and notes comply with Australian Accounting Standards, which include Australian Accounting Interpretations.
(d) Comparative information Except when an Australian Accounting Standard permits or requires otherwise, comparative information is disclosed in respect of the previous period for all amounts reported in the financial statements.
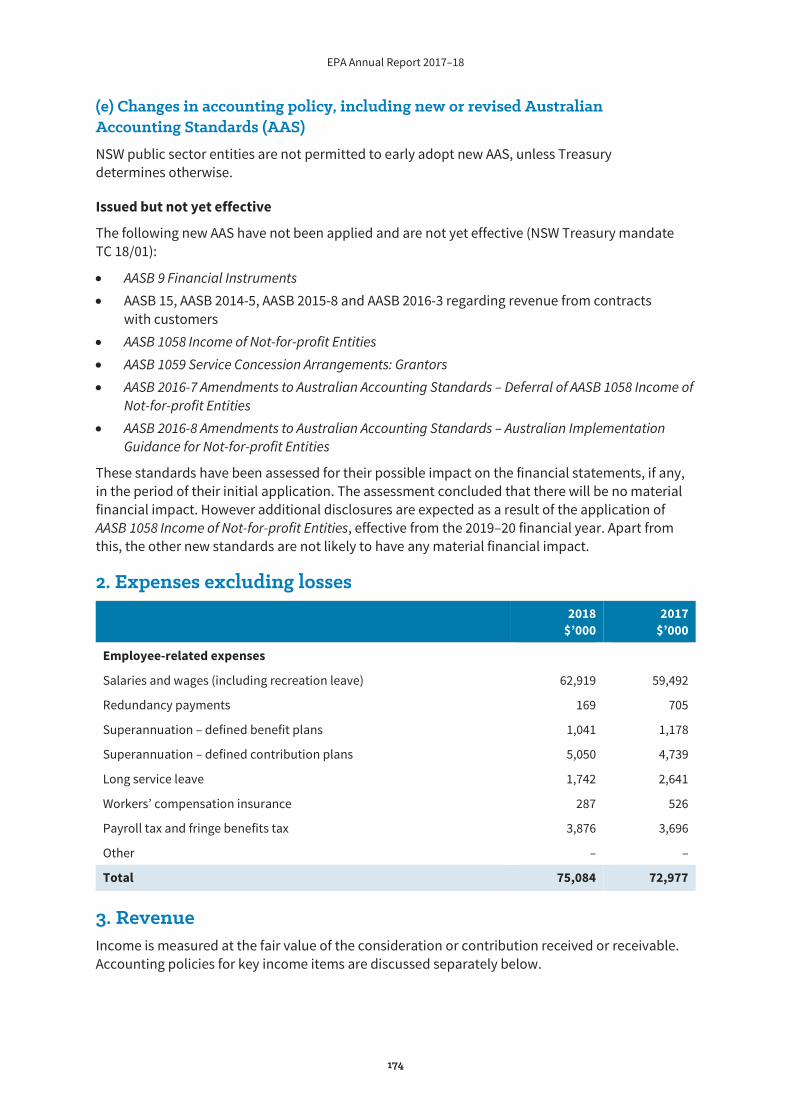
EPA Annual Report 2017–18
174
(e) Changes in accounting policy, including new or revised Australian Accounting Standards (AAS)
NSW public sector entities are not permitted to early adopt new AAS, unless Treasury determines otherwise.
Issued but not yet effective
The following new AAS have not been applied and are not yet effective (NSW Treasury mandate TC 18/01):
AASB 9 Financial Instruments
AASB 15, AASB 2014-5, AASB 2015-8 and AASB 2016-3 regarding revenue from contracts with customers AASB 1058 Income of Not-for-profit Entities
AASB 1059 Service Concession Arrangements: Grantors
AASB 2016-7 Amendments to Australian Accounting Standards – Deferral of AASB 1058 Income of Not-for-profit Entities
AASB 2016-8 Amendments to Australian Accounting Standards – Australian Implementation Guidance for Not-for-profit Entities
These standards have been assessed for their possible impact on the financial statements, if any, in the period of their initial application. The assessment concluded that there will be no material financial impact. However additional disclosures are expected as a result of the application of AASB 1058 Income of Not-for-profit Entities, effective from the 2019–20 financial year. Apart from this, the other new standards are not likely to have any material financial impact.
2. Expenses excluding losses 2018
$’000 2017
$’000
Employee-related expenses
Salaries and wages (including recreation leave) 62,919 59,492
Redundancy payments 169 705
Superannuation – defined benefit plans 1,041 1,178
Superannuation – defined contribution plans 5,050 4,739
Long service leave 1,742 2,641
Workers’ compensation insurance 287 526
Payroll tax and fringe benefits tax 3,876 3,696
Other – –
Total 75,084 72,977
3. Revenue Income is measured at the fair value of the consideration or contribution received or receivable. Accounting policies for key income items are discussed separately below.
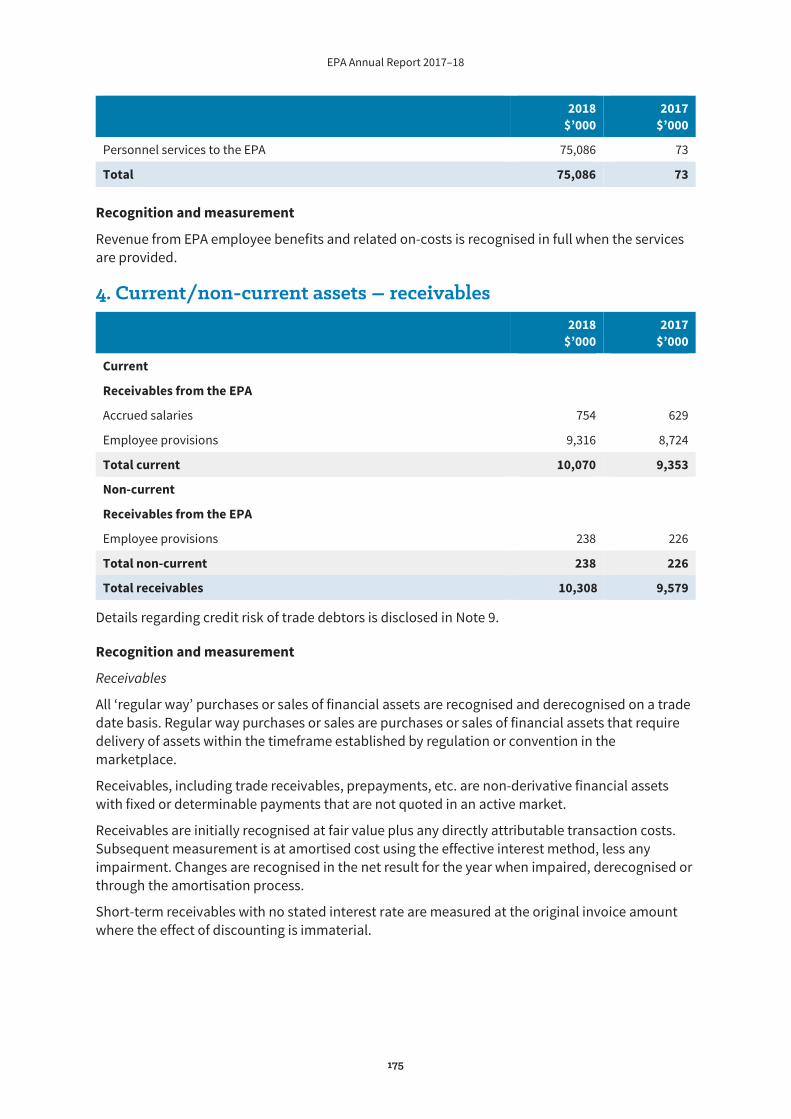
EPA Annual Report 2017–18
175
2018 $’000
2017 $’000
Personnel services to the EPA 75,086 73
Total 75,086 73
Recognition and measurement
Revenue from EPA employee benefits and related on-costs is recognised in full when the services are provided.
4. Current/non-current assets – receivables 2018
$’000 2017
$’000
Current
Receivables from the EPA
Accrued salaries 754 629
Employee provisions 9,316 8,724
Total current 10,070 9,353
Non-current
Receivables from the EPA
Employee provisions 238 226
Total non-current 238 226
Total receivables 10,308 9,579
Details regarding credit risk of trade debtors is disclosed in Note 9.
Recognition and measurement
Receivables
All ‘regular way’ purchases or sales of financial assets are recognised and derecognised on a trade date basis. Regular way purchases or sales are purchases or sales of financial assets that require delivery of assets within the timeframe established by regulation or convention in the marketplace.
Receivables, including trade receivables, prepayments, etc. are non-derivative financial assets with fixed or determinable payments that are not quoted in an active market.
Receivables are initially recognised at fair value plus any directly attributable transaction costs. Subsequent measurement is at amortised cost using the effective interest method, less any impairment. Changes are recognised in the net result for the year when impaired, derecognised or through the amortisation process.
Short-term receivables with no stated interest rate are measured at the original invoice amount where the effect of discounting is immaterial.

EPA Annual Report 2017–18
176
Allowance for impairment
Receivables are subject to an annual review for impairment. These are considered to be impaired when there is objective evidence that, as a result of one or more events that occurred after the initial recognition of the financial asset, the estimated future cash flows have been affected.
The Staff Agency first assesses whether impairment exists individually for receivables that are individually significant or collectively for those that are not individually significant. Further, receivables are assessed for impairment on a collective basis if they were assessed not to be impaired individually.
The amount of the allowance is the difference between the asset’s carrying amount and the present value of estimated future cash flows, discounted at the original effective interest rate. The amount of the impairment loss is recognised in the net result for the year.
Any reversals of impairment losses are reversed through the net result for the year if objectively related to an event occurring after the impairment was recognised. Reversals of impairment losses cannot result in a carrying amount that exceeds what the carrying amount would have been had there not been an impairment loss.
5. Current liabilities – payables 2018
$’000 2017 $’000
Accrued salaries, wages and on-costs 754 629
Total 754 629
Details regarding credit risk, liquidity risk and market risk, including maturity analysis of the above payables are discussed in Note 9.
Recognition and measurement
Payables represent liabilities for goods and services provided to the Staff Agency and other amounts. Short-term payables with no stated interest rate are measured at the original invoice amount where the effect of discounting is immaterial.
Payables are financial liabilities at amortised cost, initially measured at fair value, net of directly attributable transaction costs. These are subsequently measured at amortised cost, using the effective interest method. Gains and losses are recognised net result when the liabilities are derecognised as well as through the amortisation process.
6. Current/non-current liabilities – provisions 2018
$’000 2017
$’000
Current
Employee benefits and related on-costs
Annual leave 5,537 5,202
Annual leave on-costs 712 589
Long service leave on-costs 2,738 2,603
Allowances 329 330
Total current 9,316 8,724
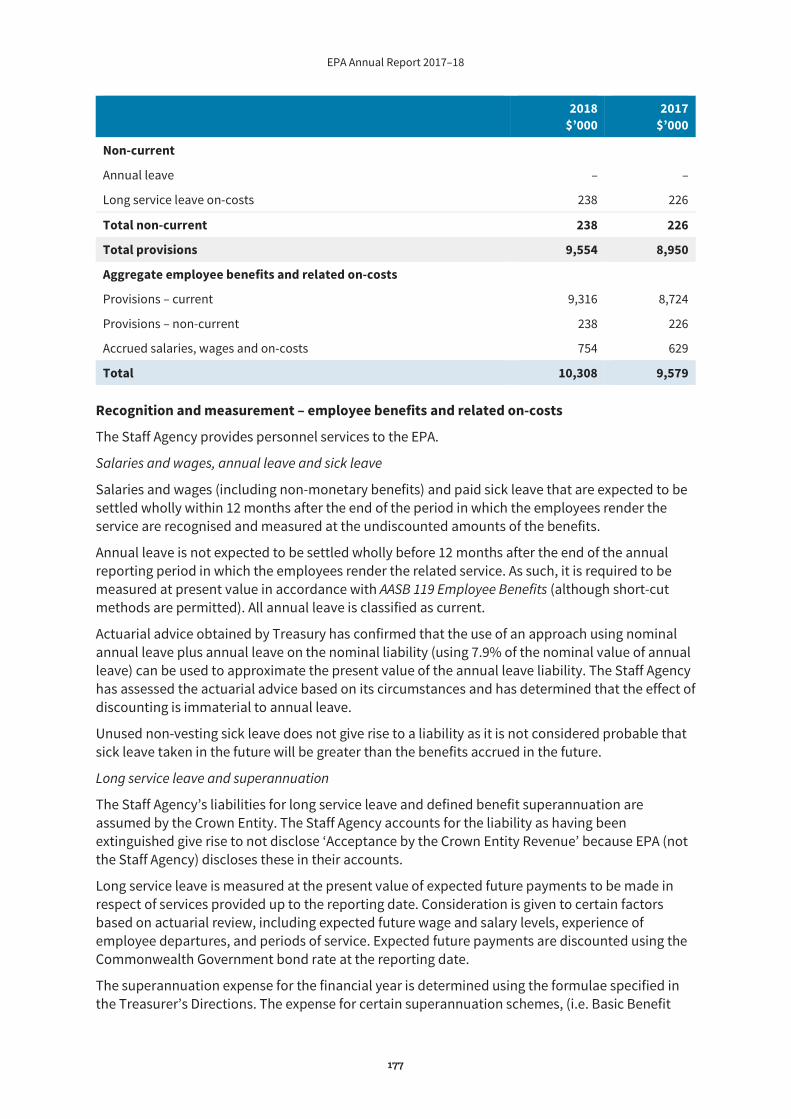
EPA Annual Report 2017–18
177
2018 $’000
2017 $’000
Non-current
Annual leave – –
Long service leave on-costs 238 226
Total non-current 238 226
Total provisions 9,554 8,950
Aggregate employee benefits and related on-costs
Provisions – current 9,316 8,724
Provisions – non-current 238 226
Accrued salaries, wages and on-costs 754 629
Total 10,308 9,579
Recognition and measurement – employee benefits and related on-costs
The Staff Agency provides personnel services to the EPA.
Salaries and wages, annual leave and sick leave
Salaries and wages (including non-monetary benefits) and paid sick leave that are expected to be settled wholly within 12 months after the end of the period in which the employees render the service are recognised and measured at the undiscounted amounts of the benefits.
Annual leave is not expected to be settled wholly before 12 months after the end of the annual reporting period in which the employees render the related service. As such, it is required to be measured at present value in accordance with AASB 119 Employee Benefits (although short-cut methods are permitted). All annual leave is classified as current.
Actuarial advice obtained by Treasury has confirmed that the use of an approach using nominal annual leave plus annual leave on the nominal liability (using 7.9% of the nominal value of annual leave) can be used to approximate the present value of the annual leave liability. The Staff Agency has assessed the actuarial advice based on its circumstances and has determined that the effect of discounting is immaterial to annual leave.
Unused non-vesting sick leave does not give rise to a liability as it is not considered probable that sick leave taken in the future will be greater than the benefits accrued in the future.
Long service leave and superannuation
The Staff Agency’s liabilities for long service leave and defined benefit superannuation are assumed by the Crown Entity. The Staff Agency accounts for the liability as having been extinguished give rise to not disclose ‘Acceptance by the Crown Entity Revenue’ because EPA (not the Staff Agency) discloses these in their accounts.
Long service leave is measured at the present value of expected future payments to be made in respect of services provided up to the reporting date. Consideration is given to certain factors based on actuarial review, including expected future wage and salary levels, experience of employee departures, and periods of service. Expected future payments are discounted using the Commonwealth Government bond rate at the reporting date.
The superannuation expense for the financial year is determined using the formulae specified in the Treasurer’s Directions. The expense for certain superannuation schemes, (i.e. Basic Benefit
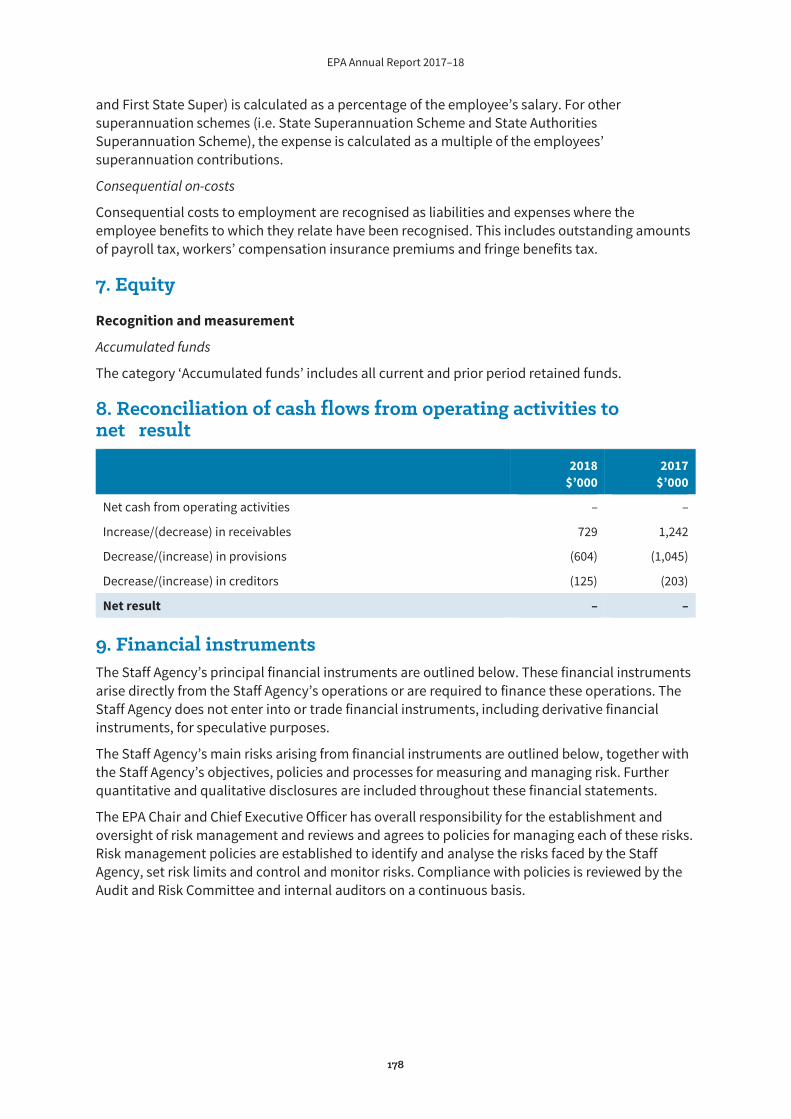
EPA Annual Report 2017–18
178
and First State Super) is calculated as a percentage of the employee’s salary. For other superannuation schemes (i.e. State Superannuation Scheme and State Authorities Superannuation Scheme), the expense is calculated as a multiple of the employees’ superannuation contributions.
Consequential on-costs
Consequential costs to employment are recognised as liabilities and expenses where the employee benefits to which they relate have been recognised. This includes outstanding amounts of payroll tax, workers’ compensation insurance premiums and fringe benefits tax.
7. Equity
Recognition and measurement
Accumulated funds
The category ‘Accumulated funds’ includes all current and prior period retained funds.
8. Reconciliation of cash flows from operating activities to net result
2018 $’000
2017 $’000
Net cash from operating activities – –
Increase/(decrease) in receivables 729 1,242
Decrease/(increase) in provisions (604) (1,045)
Decrease/(increase) in creditors (125) (203)
Net result – –
9. Financial instruments The Staff Agency’s principal financial instruments are outlined below. These financial instruments arise directly from the Staff Agency’s operations or are required to finance these operations. The Staff Agency does not enter into or trade financial instruments, including derivative financial instruments, for speculative purposes.
The Staff Agency’s main risks arising from financial instruments are outlined below, together with the Staff Agency’s objectives, policies and processes for measuring and managing risk. Further quantitative and qualitative disclosures are included throughout these financial statements.
The EPA Chair and Chief Executive Officer has overall responsibility for the establishment and oversight of risk management and reviews and agrees to policies for managing each of these risks. Risk management policies are established to identify and analyse the risks faced by the Staff Agency, set risk limits and control and monitor risks. Compliance with policies is reviewed by the Audit and Risk Committee and internal auditors on a continuous basis.
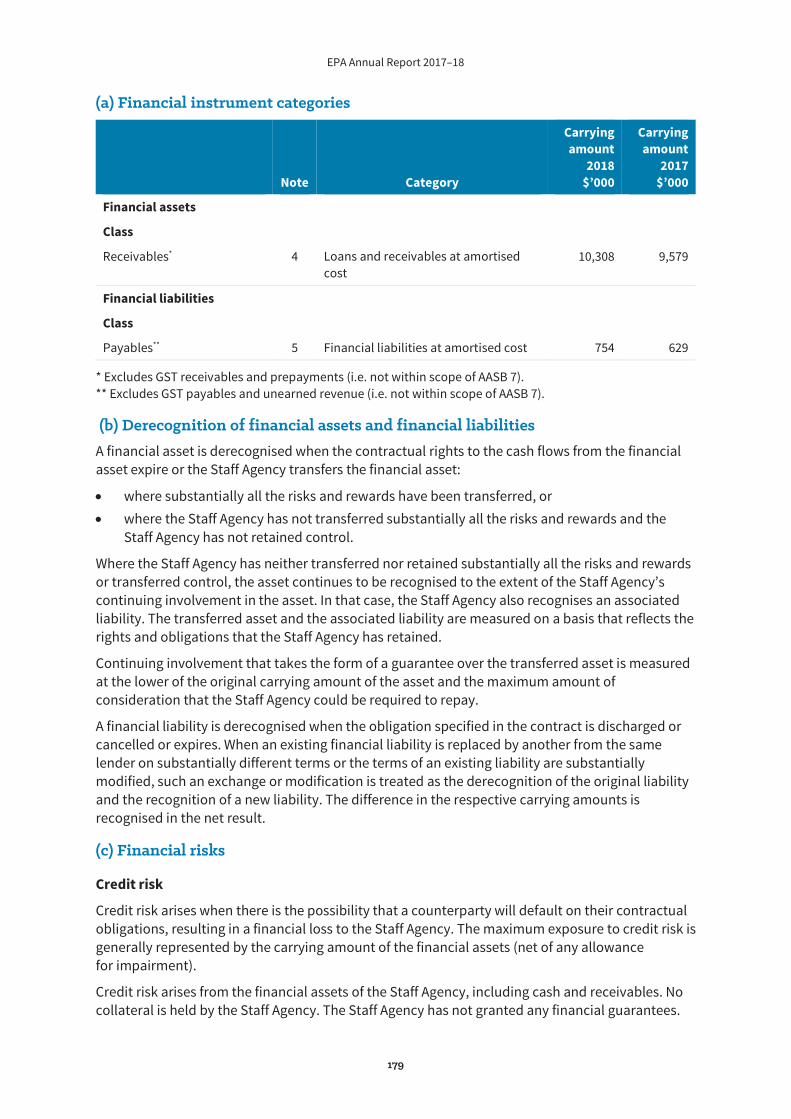
EPA Annual Report 2017–18
179
(a) Financial instrument categories
Note Category
Carrying amount
2018 $’000
Carrying amount
2017 $’000
Financial assets
Class
Receivables* 4 Loans and receivables at amortised cost
10,308 9,579
Financial liabilities
Class
Payables** 5 Financial liabilities at amortised cost 754 629
* Excludes GST receivables and prepayments (i.e. not within scope of AASB 7). ** Excludes GST payables and unearned revenue (i.e. not within scope of AASB 7).
(b) Derecognition of financial assets and financial liabilities A financial asset is derecognised when the contractual rights to the cash flows from the financial asset expire or the Staff Agency transfers the financial asset:
where substantially all the risks and rewards have been transferred, or where the Staff Agency has not transferred substantially all the risks and rewards and the Staff Agency has not retained control.
Where the Staff Agency has neither transferred nor retained substantially all the risks and rewards or transferred control, the asset continues to be recognised to the extent of the Staff Agency’s continuing involvement in the asset. In that case, the Staff Agency also recognises an associated liability. The transferred asset and the associated liability are measured on a basis that reflects the rights and obligations that the Staff Agency has retained.
Continuing involvement that takes the form of a guarantee over the transferred asset is measured at the lower of the original carrying amount of the asset and the maximum amount of consideration that the Staff Agency could be required to repay.
A financial liability is derecognised when the obligation specified in the contract is discharged or cancelled or expires. When an existing financial liability is replaced by another from the same lender on substantially different terms or the terms of an existing liability are substantially modified, such an exchange or modification is treated as the derecognition of the original liability and the recognition of a new liability. The difference in the respective carrying amounts is recognised in the net result.
(c) Financial risks
Credit risk
Credit risk arises when there is the possibility that a counterparty will default on their contractual obligations, resulting in a financial loss to the Staff Agency. The maximum exposure to credit risk is generally represented by the carrying amount of the financial assets (net of any allowance for impairment).
Credit risk arises from the financial assets of the Staff Agency, including cash and receivables. No collateral is held by the Staff Agency. The Staff Agency has not granted any financial guarantees.
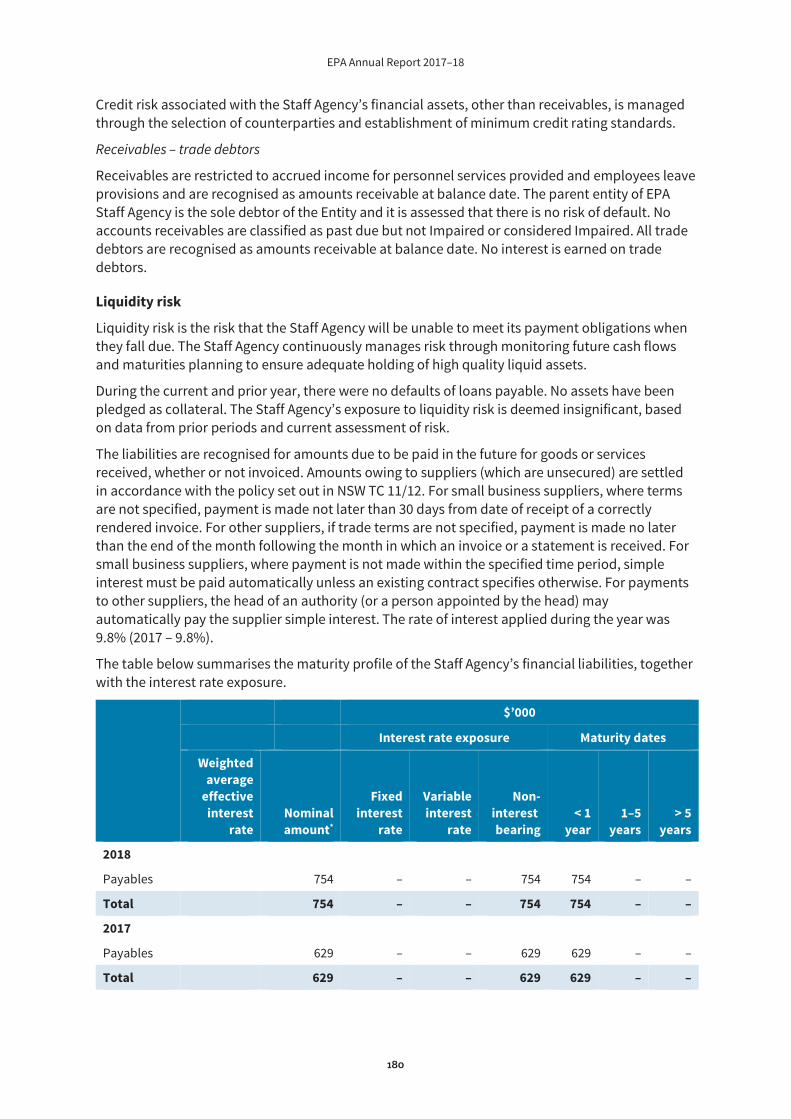
EPA Annual Report 2017–18
180
Credit risk associated with the Staff Agency’s financial assets, other than receivables, is managed through the selection of counterparties and establishment of minimum credit rating standards.
Receivables – trade debtors
Receivables are restricted to accrued income for personnel services provided and employees leave provisions and are recognised as amounts receivable at balance date. The parent entity of EPA Staff Agency is the sole debtor of the Entity and it is assessed that there is no risk of default. No accounts receivables are classified as past due but not Impaired or considered Impaired. All trade debtors are recognised as amounts receivable at balance date. No interest is earned on trade debtors.
Liquidity risk
Liquidity risk is the risk that the Staff Agency will be unable to meet its payment obligations when they fall due. The Staff Agency continuously manages risk through monitoring future cash flows and maturities planning to ensure adequate holding of high quality liquid assets.
During the current and prior year, there were no defaults of loans payable. No assets have been pledged as collateral. The Staff Agency’s exposure to liquidity risk is deemed insignificant, based on data from prior periods and current assessment of risk.
The liabilities are recognised for amounts due to be paid in the future for goods or services received, whether or not invoiced. Amounts owing to suppliers (which are unsecured) are settled in accordance with the policy set out in NSW TC 11/12. For small business suppliers, where terms are not specified, payment is made not later than 30 days from date of receipt of a correctly rendered invoice. For other suppliers, if trade terms are not specified, payment is made no later than the end of the month following the month in which an invoice or a statement is received. For small business suppliers, where payment is not made within the specified time period, simple interest must be paid automatically unless an existing contract specifies otherwise. For payments to other suppliers, the head of an authority (or a person appointed by the head) may automatically pay the supplier simple interest. The rate of interest applied during the year was 9.8% (2017 – 9.8%).
The table below summarises the maturity profile of the Staff Agency’s financial liabilities, together with the interest rate exposure.
$’000
Interest rate exposure Maturity dates
Weighted average
effective interest
rate Nominal amount*
Fixed interest
rate
Variable interest
rate
Non-interest bearing
< 1 year
1–5 years
> 5 years
2018
Payables 754 – – 754 754 – –
Total 754 – – 754 754 – –
2017
Payables 629 – – 629 629 – –
Total 629 – – 629 629 – –
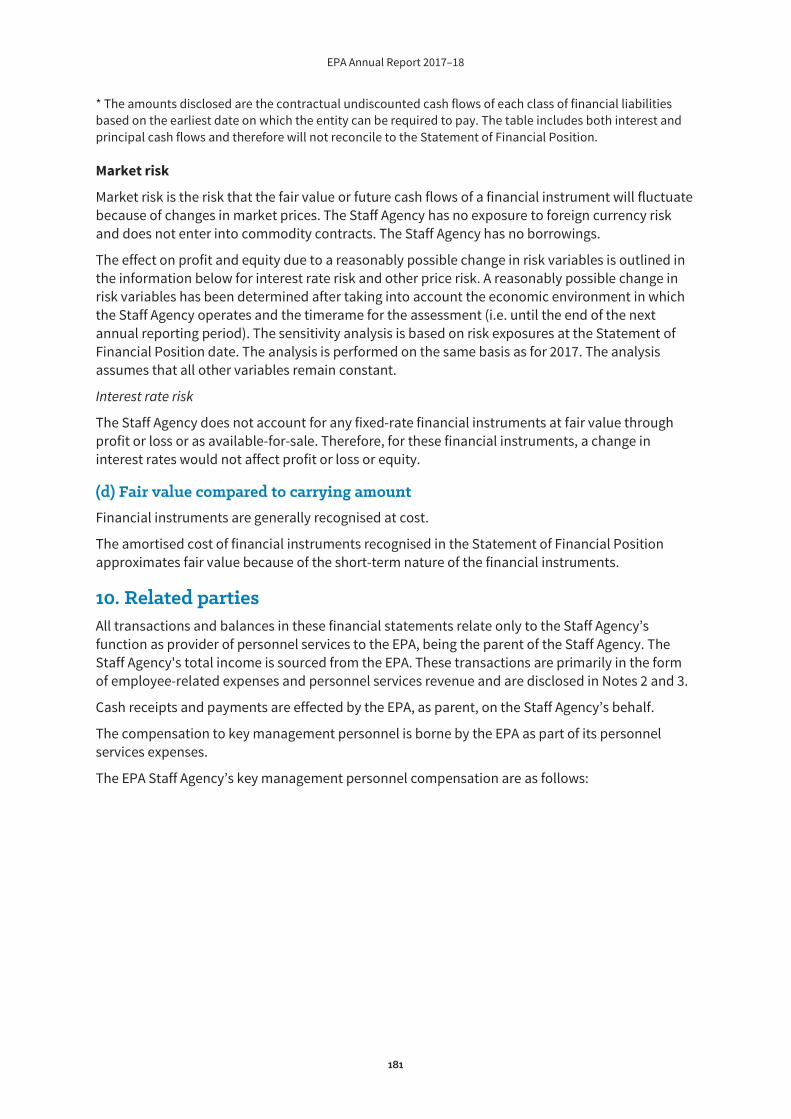
EPA Annual Report 2017–18
181
* The amounts disclosed are the contractual undiscounted cash flows of each class of financial liabilities based on the earliest date on which the entity can be required to pay. The table includes both interest and principal cash flows and therefore will not reconcile to the Statement of Financial Position.
Market risk
Market risk is the risk that the fair value or future cash flows of a financial instrument will fluctuate because of changes in market prices. The Staff Agency has no exposure to foreign currency risk and does not enter into commodity contracts. The Staff Agency has no borrowings.
The effect on profit and equity due to a reasonably possible change in risk variables is outlined in the information below for interest rate risk and other price risk. A reasonably possible change in risk variables has been determined after taking into account the economic environment in which the Staff Agency operates and the timerame for the assessment (i.e. until the end of the next annual reporting period). The sensitivity analysis is based on risk exposures at the Statement of Financial Position date. The analysis is performed on the same basis as for 2017. The analysis assumes that all other variables remain constant.
Interest rate risk
The Staff Agency does not account for any fixed-rate financial instruments at fair value through profit or loss or as available-for-sale. Therefore, for these financial instruments, a change in interest rates would not affect profit or loss or equity.
(d) Fair value compared to carrying amount Financial instruments are generally recognised at cost.
The amortised cost of financial instruments recognised in the Statement of Financial Position approximates fair value because of the short-term nature of the financial instruments.
10. Related parties All transactions and balances in these financial statements relate only to the Staff Agency’s function as provider of personnel services to the EPA, being the parent of the Staff Agency. The Staff Agency's total income is sourced from the EPA. These transactions are primarily in the form of employee-related expenses and personnel services revenue and are disclosed in Notes 2 and 3.
Cash receipts and payments are effected by the EPA, as parent, on the Staff Agency’s behalf.
The compensation to key management personnel is borne by the EPA as part of its personnel services expenses.
The EPA Staff Agency’s key management personnel compensation are as follows:
EPA Annual Report 2017–18
182
2018
$’000 2017
$’000
Short-term employee benefits
Salaries 1,682 1,580
Other monetary allowances – –
Non-monetary benefits – –
Other long-term employee benefits
Post-employment benefits – –
Termination benefits – 577
Total remuneration 1,682 2,157
There were no material related party transactions between the EPA Staff Agency and the Ministers, their close family members or entities controlled or jointly controlled thereof.
11. Contingent liabilities and contingent assets The Staff Agency is not currently involved in any legal cases where costs may be awarded against it. There are no contingent assets as at 30 June 2018 (2017: nil)
12. Events after the reporting period The Staff Agency is not aware of any circumstances that occurred after balance date which would render particulars included in the financial statements to be misleading.
End of audited financial statements
EPA Annual Report 2017–18
183
1: Acts administered by the EPA 184
2: Prosecutions completed under EPA legislation 184
3: Penalty notices 189
4: Grants – waste programs 190
5: Grants – other than for waste programs 210
6: Sponsorships 212
7: Requirements for conflict of interest disclosure 215
8: Public interest disclosures 216
9: Statistical information on access applications 217
Appendices
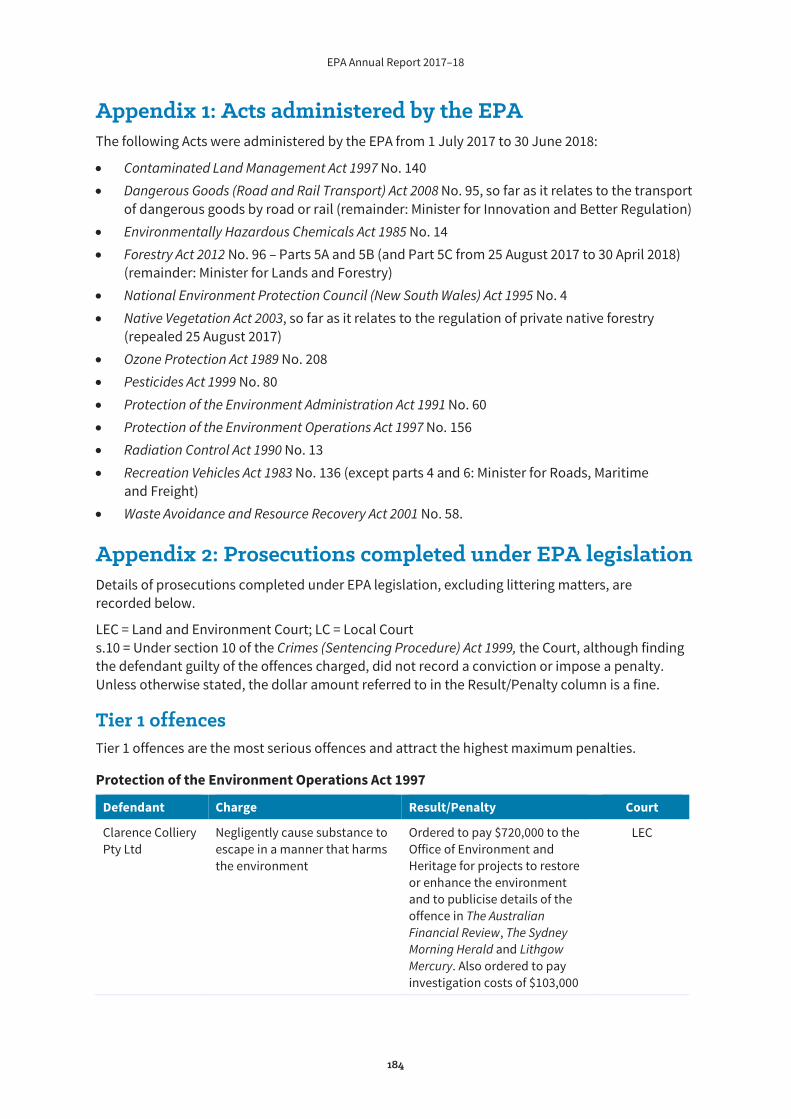
EPA Annual Report 2017–18
184
Appendix 1: Acts administered by the EPA The following Acts were administered by the EPA from 1 July 2017 to 30 June 2018:
Contaminated Land Management Act 1997 No. 140 Dangerous Goods (Road and Rail Transport) Act 2008 No. 95, so far as it relates to the transport of dangerous goods by road or rail (remainder: Minister for Innovation and Better Regulation) Environmentally Hazardous Chemicals Act 1985 No. 14 Forestry Act 2012 No. 96 – Parts 5A and 5B (and Part 5C from 25 August 2017 to 30 April 2018) (remainder: Minister for Lands and Forestry) National Environment Protection Council (New South Wales) Act 1995 No. 4 Native Vegetation Act 2003, so far as it relates to the regulation of private native forestry (repealed 25 August 2017) Ozone Protection Act 1989 No. 208 Pesticides Act 1999 No. 80 Protection of the Environment Administration Act 1991 No. 60 Protection of the Environment Operations Act 1997 No. 156 Radiation Control Act 1990 No. 13 Recreation Vehicles Act 1983 No. 136 (except parts 4 and 6: Minister for Roads, Maritime and Freight) Waste Avoidance and Resource Recovery Act 2001 No. 58.
Appendix 2: Prosecutions completed under EPA legislation Details of prosecutions completed under EPA legislation, excluding littering matters, are recorded below.
LEC = Land and Environment Court; LC = Local Court s.10 = Under section 10 of the Crimes (Sentencing Procedure) Act 1999, the Court, although finding the defendant guilty of the offences charged, did not record a conviction or impose a penalty. Unless otherwise stated, the dollar amount referred to in the Result/Penalty column is a fine.
Tier 1 offences Tier 1 offences are the most serious offences and attract the highest maximum penalties.
Protection of the Environment Operations Act 1997
Defendant Charge Result/Penalty Court
Clarence Colliery Pty Ltd
Negligently cause substance to escape in a manner that harms the environment
Ordered to pay $720,000 to the Office of Environment and Heritage for projects to restore or enhance the environment and to publicise details of the offence in The Australian Financial Review, The Sydney Morning Herald and Lithgow Mercury. Also ordered to pay investigation costs of $103,000
LEC

EPA Annual Report 2017–18
185
Tier 2 offences Protection of the Environment Operations Act 1997
Defendant Charge Result/Penalty Court
Ardent Leisure Ltd
Pollute waters $135,000 Ordered to publicise details of the offence in The Sydney Morning Herald, The Australian Financial Review, Daily Telegraph, The Australian, Waterline and Logbook. Also ordered to pay investigation costs of $6,280
LEC
Ditchfield Contracting Pty Ltd
Pollute waters Ordered to pay $105,000 to the NSW Environmental Trust for general environmental purposes and to publicise details of the offence in The Sydney Morning Herald, The Newcastle Herald and Inside Construction
LEC
Hanna, Dib Hanna Abdallah
Repeat waste offences (five charges relating to four properties)
Three years imprisonment with a non-parole period of two years and three months. Also ordered to publicise details of the offences in the Daily Telegraph, Inside Waste Magazine and The Western Weekender as well as carry out work to remove, or procure the removal of, the waste material from three properties
LEC
JBS Australia Pty Ltd
Pollute waters Ordered to pay $60,000 to the NSW Environmental Trust for general environmental purposes and to publicise details of the offence in The Newcastle Herald and Singleton Argus. Also ordered to pay investigation costs of $701.47
LEC
Laison, Mathew Toheroa Joseph
Provide false and misleading information about waste
Ordered to pay $40,000 to the NSW Environmental Trust for general environmental purposes
LEC
Mark Moore’s Earthmoving Pty Ltd
Pollute waters $5,500 Taree LC
Metropolitan Demolition and Recycling Pty Ltd
Furnish false or misleading information in response to investigative requirement under Chapter 7
$75,000 Downing Centre LC
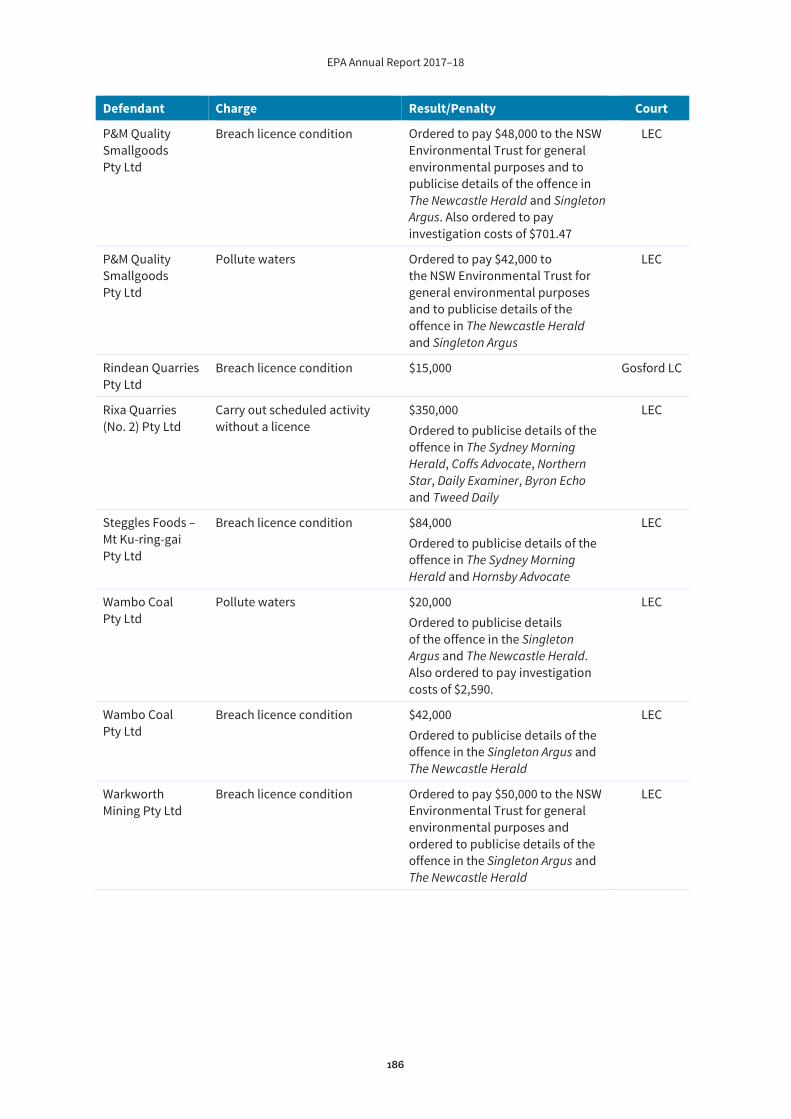
EPA Annual Report 2017–18
186
Defendant Charge Result/Penalty Court
P&M Quality Smallgoods Pty Ltd
Breach licence condition Ordered to pay $48,000 to the NSW Environmental Trust for general environmental purposes and to publicise details of the offence in The Newcastle Herald and Singleton Argus. Also ordered to pay investigation costs of $701.47
LEC
P&M Quality Smallgoods Pty Ltd
Pollute waters Ordered to pay $42,000 to the NSW Environmental Trust for general environmental purposes and to publicise details of the offence in The Newcastle Herald and Singleton Argus
LEC
Rindean Quarries Pty Ltd
Breach licence condition $15,000 Gosford LC
Rixa Quarries (No. 2) Pty Ltd
Carry out scheduled activity without a licence
$350,000 Ordered to publicise details of the offence in The Sydney Morning Herald, Coffs Advocate, Northern Star, Daily Examiner, Byron Echo and Tweed Daily
LEC
Steggles Foods – Mt Ku-ring-gai Pty Ltd
Breach licence condition $84,000 Ordered to publicise details of the offence in The Sydney Morning Herald and Hornsby Advocate
LEC
Wambo Coal Pty Ltd
Pollute waters $20,000 Ordered to publicise details of the offence in the Singleton Argus and The Newcastle Herald. Also ordered to pay investigation costs of $2,590.
LEC
Wambo Coal Pty Ltd
Breach licence condition $42,000 Ordered to publicise details of the offence in the Singleton Argus and The Newcastle Herald
LEC
Warkworth Mining Pty Ltd
Breach licence condition Ordered to pay $50,000 to the NSW Environmental Trust for general environmental purposes and ordered to publicise details of the offence in the Singleton Argus and The Newcastle Herald
LEC

EPA Annual Report 2017–18
187
Protection of the Environment Operations (Clean Air) Regulation 2010
Defendant Charge Result/Penalty Court
Freight Transporter Pty Ltd
Smoky vehicle $1,500 Burwood LC
Hammou, Selwan
Smoky vehicle $1,200 Burwood LC
Morrison, Thomas
Smoky vehicle s.10 Ordered to enter into a six-month good behaviour bond
Burwood LC
Quality Fuels Pty Ltd
Fail to fit control equipment $1,200 Downing Centre LC
Quality Logistics Management Pty Ltd
Smoky vehicle $3,000 Burwood LC
S. Badhan Transport & Logistics Pty Ltd
Smoky vehicle $2,250 Burwood LC
Swift Transport Pty Ltd
Smoky vehicle $6,000 Burwood LC
Swift Transport Pty Ltd
Smoky vehicle $6,000 Burwood LC
Swift Transport Pty Ltd
Smoky vehicle $6,000 Burwood LC
Swift Transport Pty Ltd
Smoky vehicle $6,000 Burwood LC
Protection of the Environment Operations (Noise Control) Regulation 2008
Defendant Charge Result/Penalty Court
Alfonso, Salvatore
Noisy vehicle $770 Waverley LC
Protection of the Environment Operations (Underground Petroleum Storage Systems) Regulation 2014
Defendant Charge Result/Penalty Court
Ardent Leisure Pty Ltd
Failure to include current ‘as built’ drawings for an underground petroleum storage system
$22,950 Ordered to publicise details of the offence in The Sydney Morning Herald, The Australian Financial Review, Daily Telegraph, The Australian, Waterline and Logbook
LEC
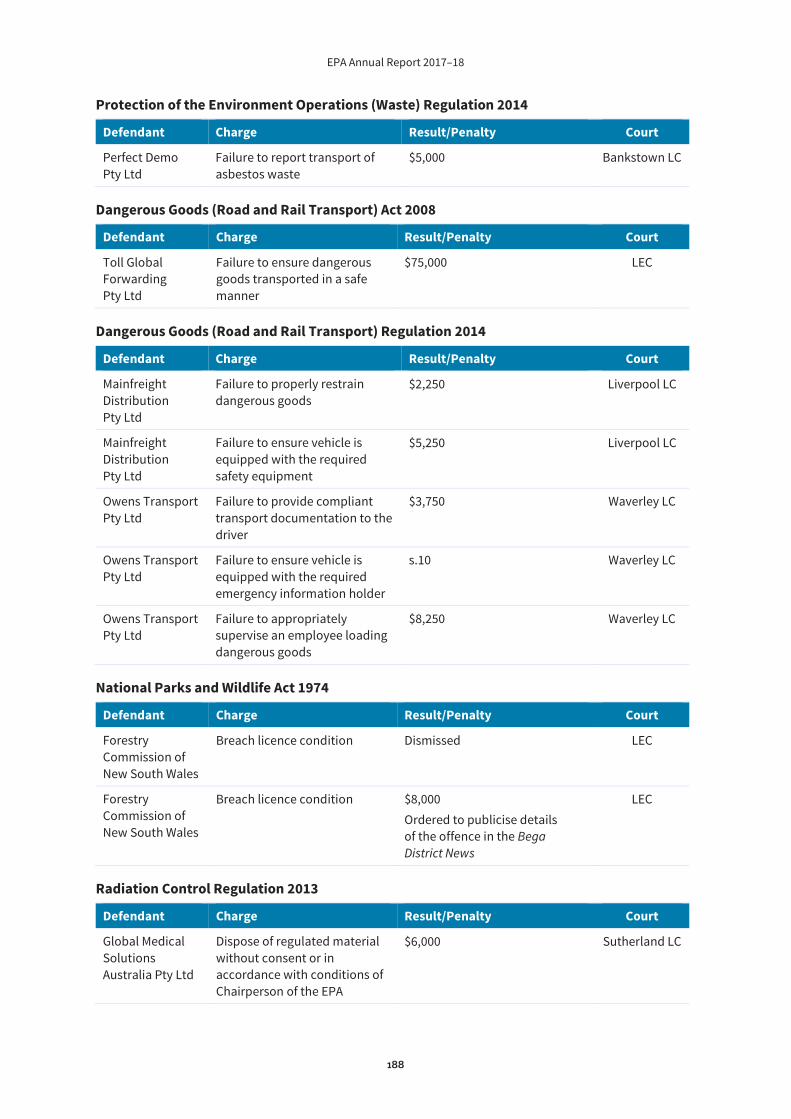
EPA Annual Report 2017–18
188
Protection of the Environment Operations (Waste) Regulation 2014
Defendant Charge Result/Penalty Court
Perfect Demo Pty Ltd
Failure to report transport of asbestos waste
$5,000 Bankstown LC
Dangerous Goods (Road and Rail Transport) Act 2008
Defendant Charge Result/Penalty Court
Toll Global Forwarding Pty Ltd
Failure to ensure dangerous goods transported in a safe manner
$75,000 LEC
Dangerous Goods (Road and Rail Transport) Regulation 2014
Defendant Charge Result/Penalty Court
Mainfreight Distribution Pty Ltd
Failure to properly restrain dangerous goods
$2,250 Liverpool LC
Mainfreight Distribution Pty Ltd
Failure to ensure vehicle is equipped with the required safety equipment
$5,250 Liverpool LC
Owens Transport Pty Ltd
Failure to provide compliant transport documentation to the driver
$3,750 Waverley LC
Owens Transport Pty Ltd
Failure to ensure vehicle is equipped with the required emergency information holder
s.10 Waverley LC
Owens Transport Pty Ltd
Failure to appropriately supervise an employee loading dangerous goods
$8,250 Waverley LC
National Parks and Wildlife Act 1974
Defendant Charge Result/Penalty Court
Forestry Commission of New South Wales
Breach licence condition Dismissed LEC
Forestry Commission of New South Wales
Breach licence condition $8,000 Ordered to publicise details of the offence in the Bega District News
LEC
Radiation Control Regulation 2013
Defendant Charge Result/Penalty Court
Global Medical Solutions Australia Pty Ltd
Dispose of regulated material without consent or in accordance with conditions of Chairperson of the EPA
$6,000 Sutherland LC
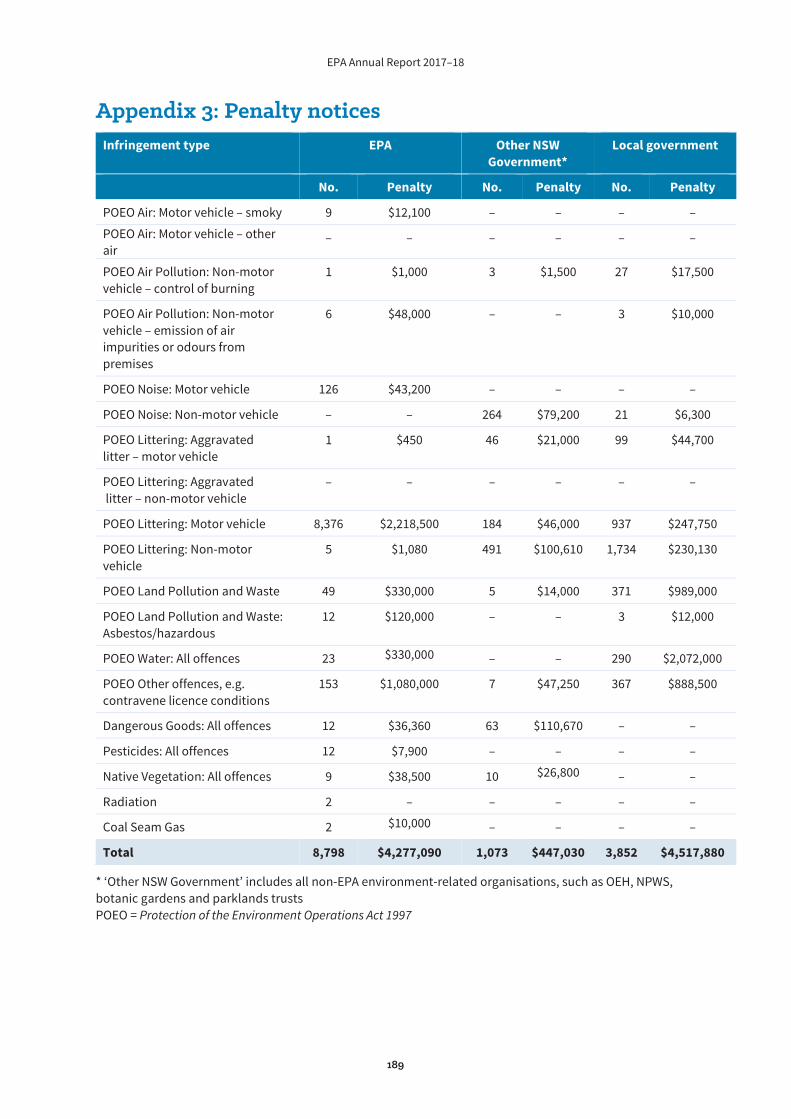
EPA Annual Report 2017–18
189
Appendix 3: Penalty notices Infringement type EPA Other NSW
Government* Local government
No. Penalty No. Penalty No. Penalty
POEO Air: Motor vehicle – smoky 9 $12,100 – – – –
POEO Air: Motor vehicle – other air
– – – – – –
POEO Air Pollution: Non-motor vehicle – control of burning
1 $1,000 3 $1,500 27 $17,500
POEO Air Pollution: Non-motor vehicle – emission of air impurities or odours from premises
6 $48,000 – – 3 $10,000
POEO Noise: Motor vehicle 126 $43,200 – – – –
POEO Noise: Non-motor vehicle – – 264 $79,200 21 $6,300
POEO Littering: Aggravated litter – motor vehicle
1 $450 46 $21,000 99 $44,700
POEO Littering: Aggravated litter – non-motor vehicle
– – – – – –
POEO Littering: Motor vehicle 8,376 $2,218,500 184 $46,000 937 $247,750
POEO Littering: Non-motor vehicle
5 $1,080 491 $100,610 1,734 $230,130
POEO Land Pollution and Waste 49 $330,000 5 $14,000 371 $989,000
POEO Land Pollution and Waste: Asbestos/hazardous
12 $120,000 – – 3 $12,000
POEO Water: All offences 23 $330,000 – – 290 $2,072,000
POEO Other offences, e.g. contravene licence conditions
153 $1,080,000 7 $47,250 367 $888,500
Dangerous Goods: All offences 12 $36,360 63 $110,670 – –
Pesticides: All offences 12 $7,900 – – – –
Native Vegetation: All offences 9 $38,500 10 $26,800 – –
Radiation 2 – – – – –
Coal Seam Gas 2 $10,000 – – – –
Total 8,798 $4,277,090 1,073 $447,030 3,852 $4,517,880
* ‘Other NSW Government’ includes all non-EPA environment-related organisations, such as OEH, NPWS, botanic gardens and parklands trusts POEO = Protection of the Environment Operations Act 1997

EPA Annual Report 2017–18
190
Appendix 4: Grants – waste programs The EPA offers grants to government, business and the community to help reduce waste, combat illegal dumping, increase the capacity for recycling and educate people about best-practice ways of helping the environment. All waste grant funding comes from recurrent EPA funding unless stated otherwise.
Note: Payments summarised below may include grants approved in previous years.
Local Government Program Waste Less, Recycle More is providing local government with $70 million over four years to 30 June 2021 to support local communities to increase recycling and reduce illegal dumping and littering. The fund includes payments to the following programs:
Better Waste and Recycling Fund Regional Coordination and Strategy Support Program Greater Sydney Regional coordination and strategy support for rural and regional NSW Sustainable waste management in discrete Aboriginal communities across NSW.
During 2017–18, total payments of $13,459,700 were made.
Local government grants During 2017–18, total payments to local government were $12,922,000.
Better Waste and Recycling Fund
The Better Waste and Recycling Fund aims to help local councils make it easier for their communities to reduce the waste they send to landfill and recycle more waste. The fund supports projects that improve recycling and community engagement, reduce waste generation, tackle litter and illegal dumping and contribute to achieving the targets in NSW Waste Avoidance and Resource Recovery Strategy 2014–21.
During 2017–18, a total of $9.75 million was paid under the Better Waste and Recycling Fund. Of that, $8,287,500 was paid to local councils and $1,462,500 went to regional groups of councils in the waste levy-paying area.
The two tables show grants approved during 2017–18.
Recipient council Grant approved
Metropolitan Levy Area
Bayside $176,664
Blacktown $326,369
Burwood $77,145
Camden $109,934
Campbelltown $177,506
Canada Bay $120,269
Canterbury–Bankstown $335,593
Central Coast $315,748
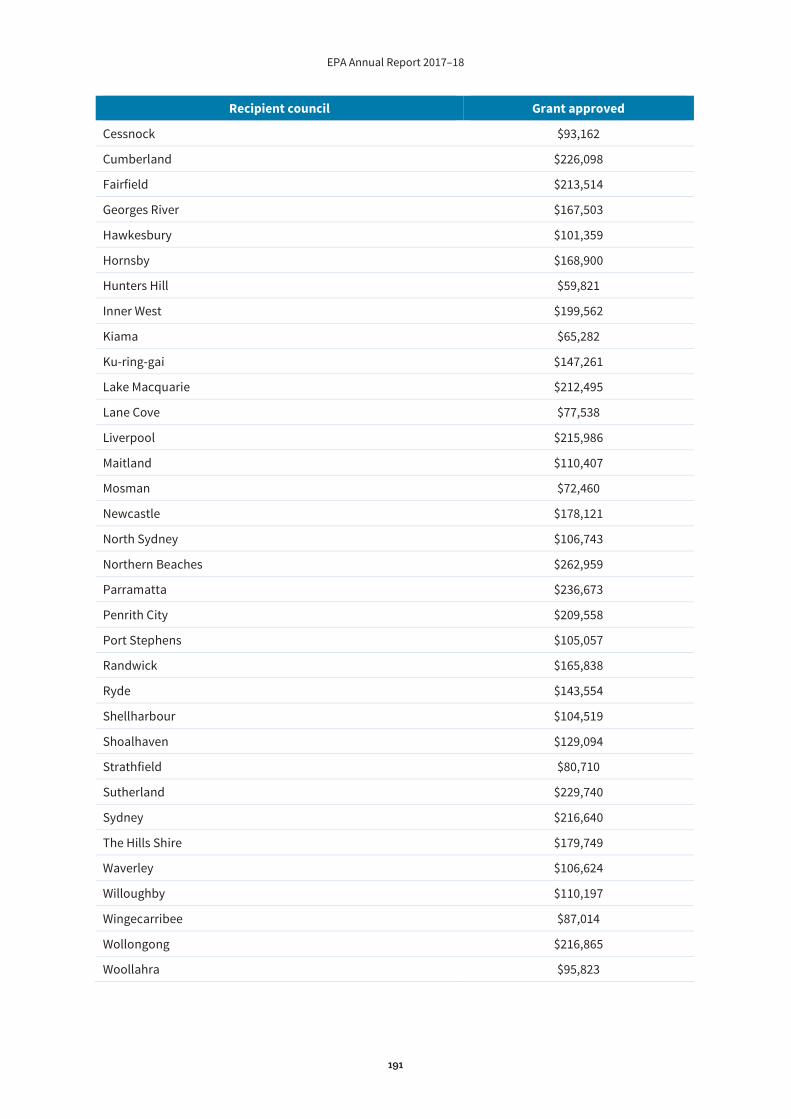
EPA Annual Report 2017–18
191
Recipient council Grant approved
Cessnock $93,162
Cumberland $226,098
Fairfield $213,514
Georges River $167,503
Hawkesbury $101,359
Hornsby $168,900
Hunters Hill $59,821
Inner West $199,562
Kiama $65,282
Ku-ring-gai $147,261
Lake Macquarie $212,495
Lane Cove $77,538
Liverpool $215,986
Maitland $110,407
Mosman $72,460
Newcastle $178,121
North Sydney $106,743
Northern Beaches $262,959
Parramatta $236,673
Penrith City $209,558
Port Stephens $105,057
Randwick $165,838
Ryde $143,554
Shellharbour $104,519
Shoalhaven $129,094
Strathfield $80,710
Sutherland $229,740
Sydney $216,640
The Hills Shire $179,749
Waverley $106,624
Willoughby $110,197
Wingecarribee $87,014
Wollongong $216,865
Woollahra $95,823
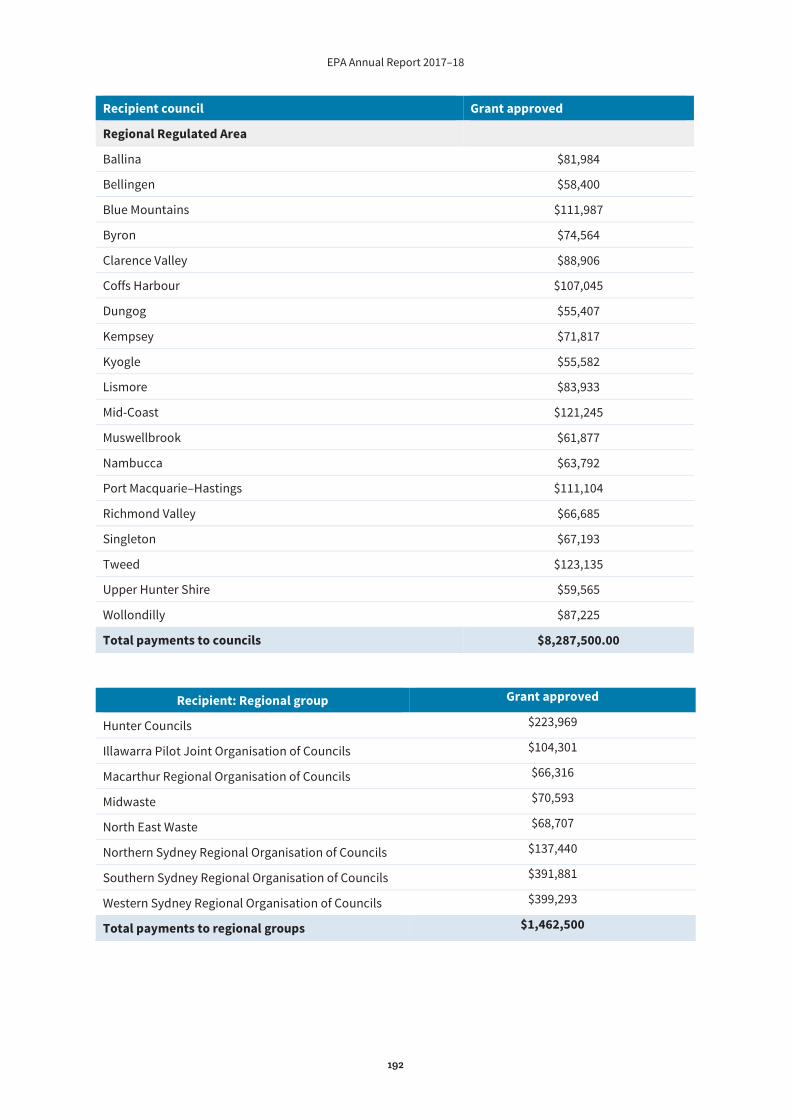
EPA Annual Report 2017–18
192
Recipient council Grant approved
Regional Regulated Area
Ballina $81,984
Bellingen $58,400
Blue Mountains $111,987
Byron $74,564
Clarence Valley $88,906
Coffs Harbour $107,045
Dungog $55,407
Kempsey $71,817
Kyogle $55,582
Lismore $83,933
Mid-Coast $121,245
Muswellbrook $61,877
Nambucca $63,792
Port Macquarie–Hastings $111,104
Richmond Valley $66,685
Singleton $67,193
Tweed $123,135
Upper Hunter Shire $59,565
Wollondilly $87,225
Total payments to councils $8,287,500.00
Recipient: Regional group Grant approved
Hunter Councils $223,969
Illawarra Pilot Joint Organisation of Councils $104,301
Macarthur Regional Organisation of Councils $66,316
Midwaste $70,593
North East Waste $68,707
Northern Sydney Regional Organisation of Councils $137,440
Southern Sydney Regional Organisation of Councils $391,881
Western Sydney Regional Organisation of Councils $399,293
Total payments to regional groups $1,462,500
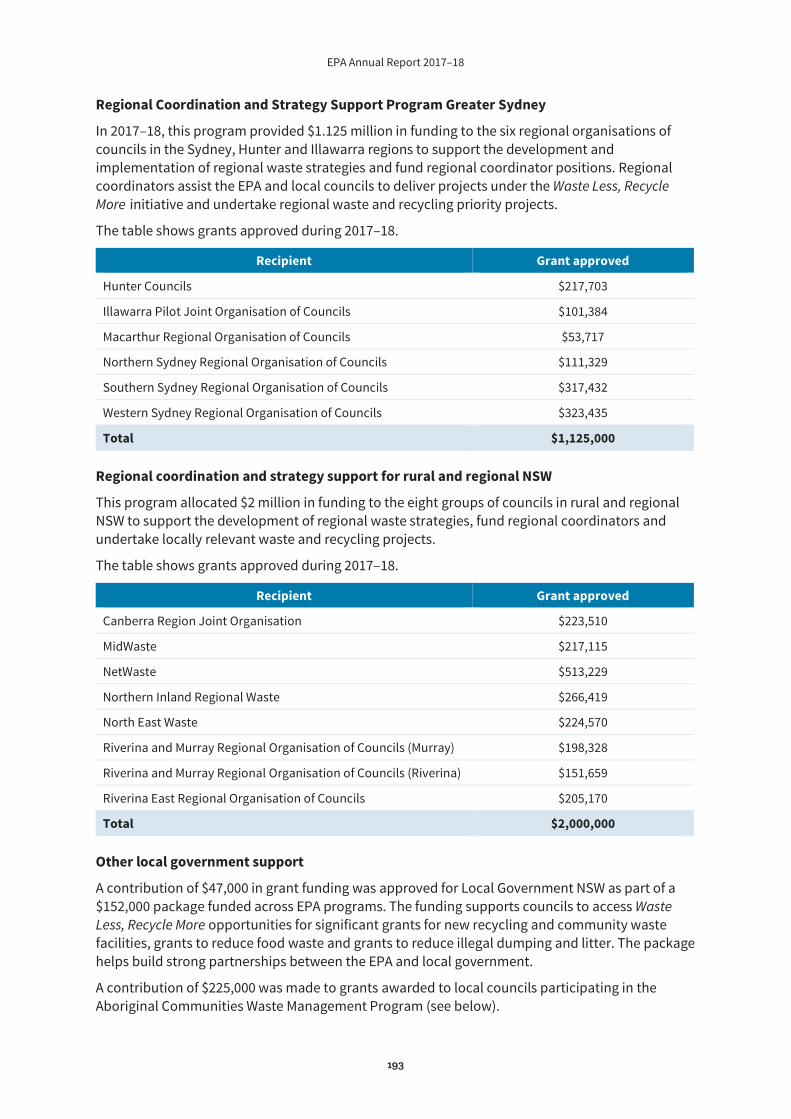
EPA Annual Report 2017–18
193
Regional Coordination and Strategy Support Program Greater Sydney
In 2017–18, this program provided $1.125 million in funding to the six regional organisations of councils in the Sydney, Hunter and Illawarra regions to support the development and implementation of regional waste strategies and fund regional coordinator positions. Regional coordinators assist the EPA and local councils to deliver projects under the Waste Less, Recycle More initiative and undertake regional waste and recycling priority projects.
The table shows grants approved during 2017–18.
Recipient Grant approved
Hunter Councils $217,703
Illawarra Pilot Joint Organisation of Councils $101,384
Macarthur Regional Organisation of Councils $53,717
Northern Sydney Regional Organisation of Councils $111,329
Southern Sydney Regional Organisation of Councils $317,432
Western Sydney Regional Organisation of Councils $323,435
Total $1,125,000
Regional coordination and strategy support for rural and regional NSW
This program allocated $2 million in funding to the eight groups of councils in rural and regional NSW to support the development of regional waste strategies, fund regional coordinators and undertake locally relevant waste and recycling projects.
The table shows grants approved during 2017–18.
Recipient Grant approved
Canberra Region Joint Organisation $223,510
MidWaste $217,115
NetWaste $513,229
Northern Inland Regional Waste $266,419
North East Waste $224,570
Riverina and Murray Regional Organisation of Councils (Murray) $198,328
Riverina and Murray Regional Organisation of Councils (Riverina) $151,659
Riverina East Regional Organisation of Councils $205,170
Total $2,000,000
Other local government support
A contribution of $47,000 in grant funding was approved for Local Government NSW as part of a $152,000 package funded across EPA programs. The funding supports councils to access Waste Less, Recycle More opportunities for significant grants for new recycling and community waste facilities, grants to reduce food waste and grants to reduce illegal dumping and litter. The package helps build strong partnerships between the EPA and local government.
A contribution of $225,000 was made to grants awarded to local councils participating in the Aboriginal Communities Waste Management Program (see below).
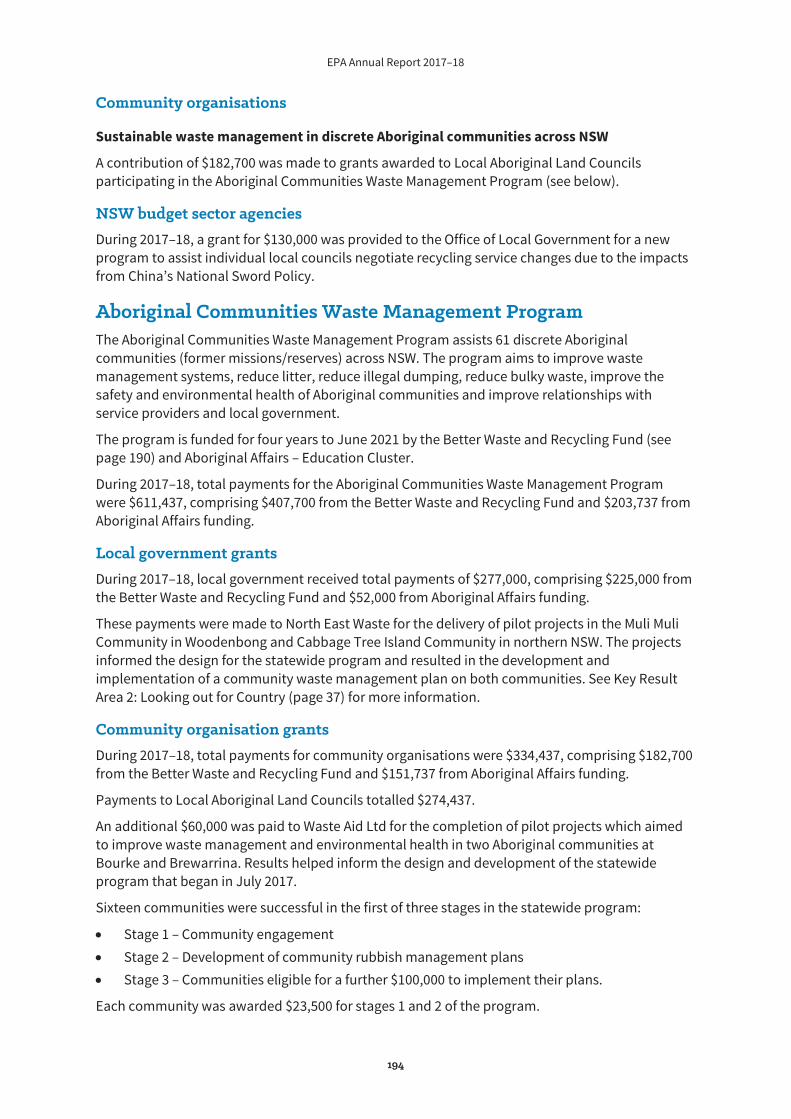
EPA Annual Report 2017–18
194
Community organisations
Sustainable waste management in discrete Aboriginal communities across NSW
A contribution of $182,700 was made to grants awarded to Local Aboriginal Land Councils participating in the Aboriginal Communities Waste Management Program (see below).
NSW budget sector agencies During 2017–18, a grant for $130,000 was provided to the Office of Local Government for a new program to assist individual local councils negotiate recycling service changes due to the impacts from China’s National Sword Policy.
Aboriginal Communities Waste Management Program The Aboriginal Communities Waste Management Program assists 61 discrete Aboriginal communities (former missions/reserves) across NSW. The program aims to improve waste management systems, reduce litter, reduce illegal dumping, reduce bulky waste, improve the safety and environmental health of Aboriginal communities and improve relationships with service providers and local government.
The program is funded for four years to June 2021 by the Better Waste and Recycling Fund (see page 190) and Aboriginal Affairs – Education Cluster.
During 2017–18, total payments for the Aboriginal Communities Waste Management Program were $611,437, comprising $407,700 from the Better Waste and Recycling Fund and $203,737 from Aboriginal Affairs funding.
Local government grants During 2017–18, local government received total payments of $277,000, comprising $225,000 from the Better Waste and Recycling Fund and $52,000 from Aboriginal Affairs funding.
These payments were made to North East Waste for the delivery of pilot projects in the Muli Muli Community in Woodenbong and Cabbage Tree Island Community in northern NSW. The projects informed the design for the statewide program and resulted in the development and implementation of a community waste management plan on both communities. See Key Result Area 2: Looking out for Country (page 37) for more information.
Community organisation grants During 2017–18, total payments for community organisations were $334,437, comprising $182,700 from the Better Waste and Recycling Fund and $151,737 from Aboriginal Affairs funding.
Payments to Local Aboriginal Land Councils totalled $274,437.
An additional $60,000 was paid to Waste Aid Ltd for the completion of pilot projects which aimed to improve waste management and environmental health in two Aboriginal communities at Bourke and Brewarrina. Results helped inform the design and development of the statewide program that began in July 2017.
Sixteen communities were successful in the first of three stages in the statewide program:
Stage 1 – Community engagement Stage 2 – Development of community rubbish management plans Stage 3 – Communities eligible for a further $100,000 to implement their plans.
Each community was awarded $23,500 for stages 1 and 2 of the program.
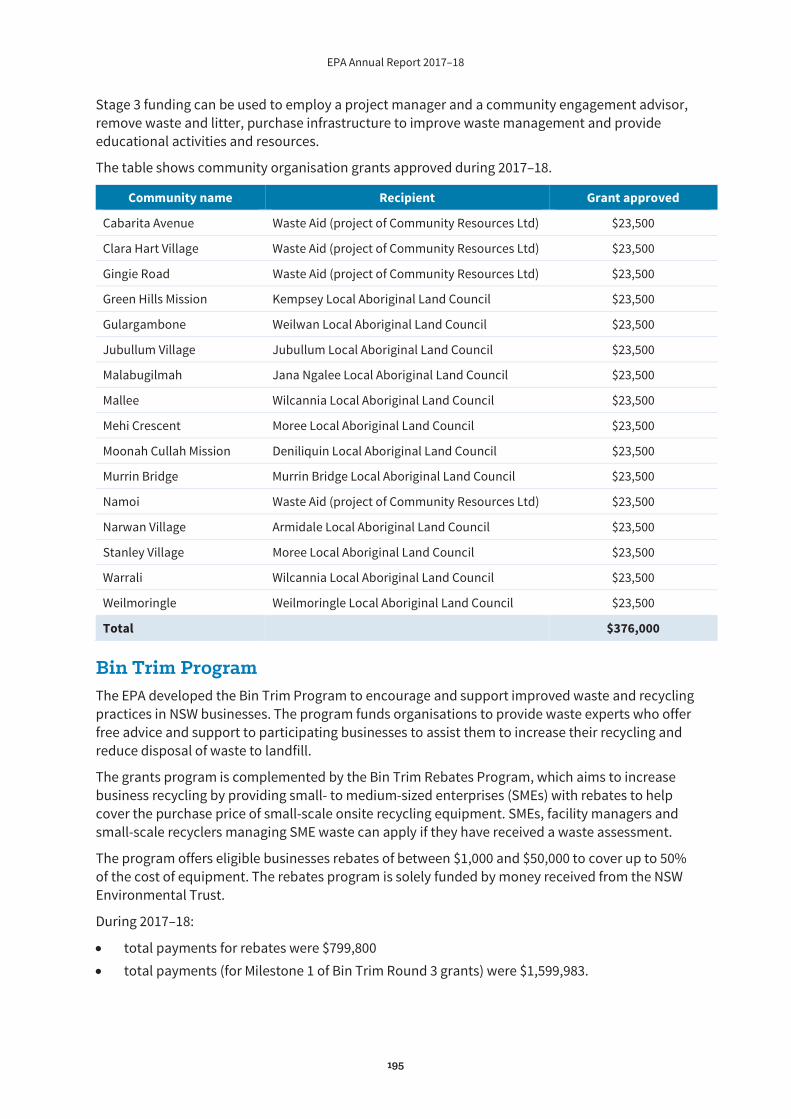
EPA Annual Report 2017–18
195
Stage 3 funding can be used to employ a project manager and a community engagement advisor, remove waste and litter, purchase infrastructure to improve waste management and provide educational activities and resources.
The table shows community organisation grants approved during 2017–18.
Community name Recipient Grant approved
Cabarita Avenue Waste Aid (project of Community Resources Ltd) $23,500
Clara Hart Village Waste Aid (project of Community Resources Ltd) $23,500
Gingie Road Waste Aid (project of Community Resources Ltd) $23,500
Green Hills Mission Kempsey Local Aboriginal Land Council $23,500
Gulargambone Weilwan Local Aboriginal Land Council $23,500
Jubullum Village Jubullum Local Aboriginal Land Council $23,500
Malabugilmah Jana Ngalee Local Aboriginal Land Council $23,500
Mallee Wilcannia Local Aboriginal Land Council $23,500
Mehi Crescent Moree Local Aboriginal Land Council $23,500
Moonah Cullah Mission Deniliquin Local Aboriginal Land Council $23,500
Murrin Bridge Murrin Bridge Local Aboriginal Land Council $23,500
Namoi Waste Aid (project of Community Resources Ltd) $23,500
Narwan Village Armidale Local Aboriginal Land Council $23,500
Stanley Village Moree Local Aboriginal Land Council $23,500
Warrali Wilcannia Local Aboriginal Land Council $23,500
Weilmoringle Weilmoringle Local Aboriginal Land Council $23,500
Total $376,000
Bin Trim Program The EPA developed the Bin Trim Program to encourage and support improved waste and recycling practices in NSW businesses. The program funds organisations to provide waste experts who offer free advice and support to participating businesses to assist them to increase their recycling and reduce disposal of waste to landfill.
The grants program is complemented by the Bin Trim Rebates Program, which aims to increase business recycling by providing small- to medium-sized enterprises (SMEs) with rebates to help cover the purchase price of small-scale onsite recycling equipment. SMEs, facility managers and small-scale recyclers managing SME waste can apply if they have received a waste assessment.
The program offers eligible businesses rebates of between $1,000 and $50,000 to cover up to 50% of the cost of equipment. The rebates program is solely funded by money received from the NSW Environmental Trust.
During 2017–18:
total payments for rebates were $799,800 total payments (for Milestone 1 of Bin Trim Round 3 grants) were $1,599,983.
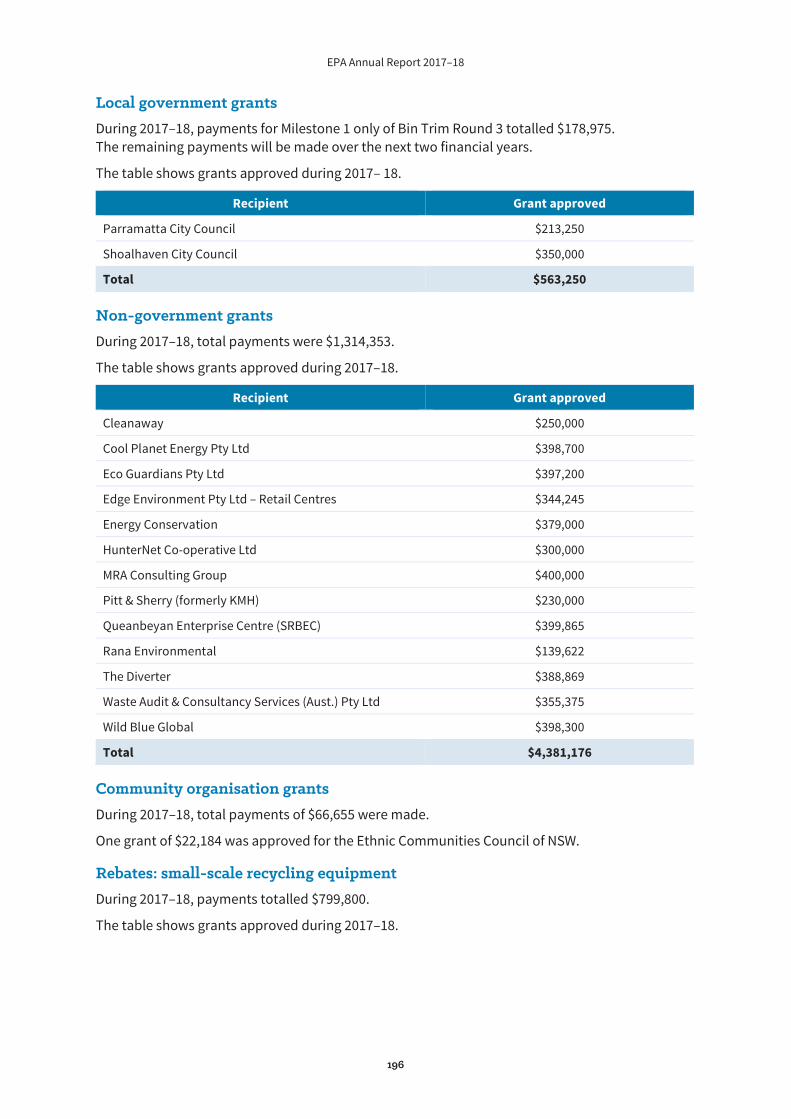
EPA Annual Report 2017–18
196
Local government grants During 2017–18, payments for Milestone 1 only of Bin Trim Round 3 totalled $178,975. The remaining payments will be made over the next two financial years.
The table shows grants approved during 2017– 18.
Recipient Grant approved
Parramatta City Council $213,250
Shoalhaven City Council $350,000
Total $563,250
Non-government grants During 2017–18, total payments were $1,314,353.
The table shows grants approved during 2017–18.
Recipient Grant approved
Cleanaway $250,000
Cool Planet Energy Pty Ltd $398,700
Eco Guardians Pty Ltd $397,200
Edge Environment Pty Ltd – Retail Centres $344,245
Energy Conservation $379,000
HunterNet Co-operative Ltd $300,000
MRA Consulting Group $400,000
Pitt & Sherry (formerly KMH) $230,000
Queanbeyan Enterprise Centre (SRBEC) $399,865
Rana Environmental $139,622
The Diverter $388,869
Waste Audit & Consultancy Services (Aust.) Pty Ltd $355,375
Wild Blue Global $398,300
Total $4,381,176
Community organisation grants During 2017–18, total payments of $66,655 were made.
One grant of $22,184 was approved for the Ethnic Communities Council of NSW.
Rebates: small-scale recycling equipment During 2017–18, payments totalled $799,800.
The table shows grants approved during 2017–18.
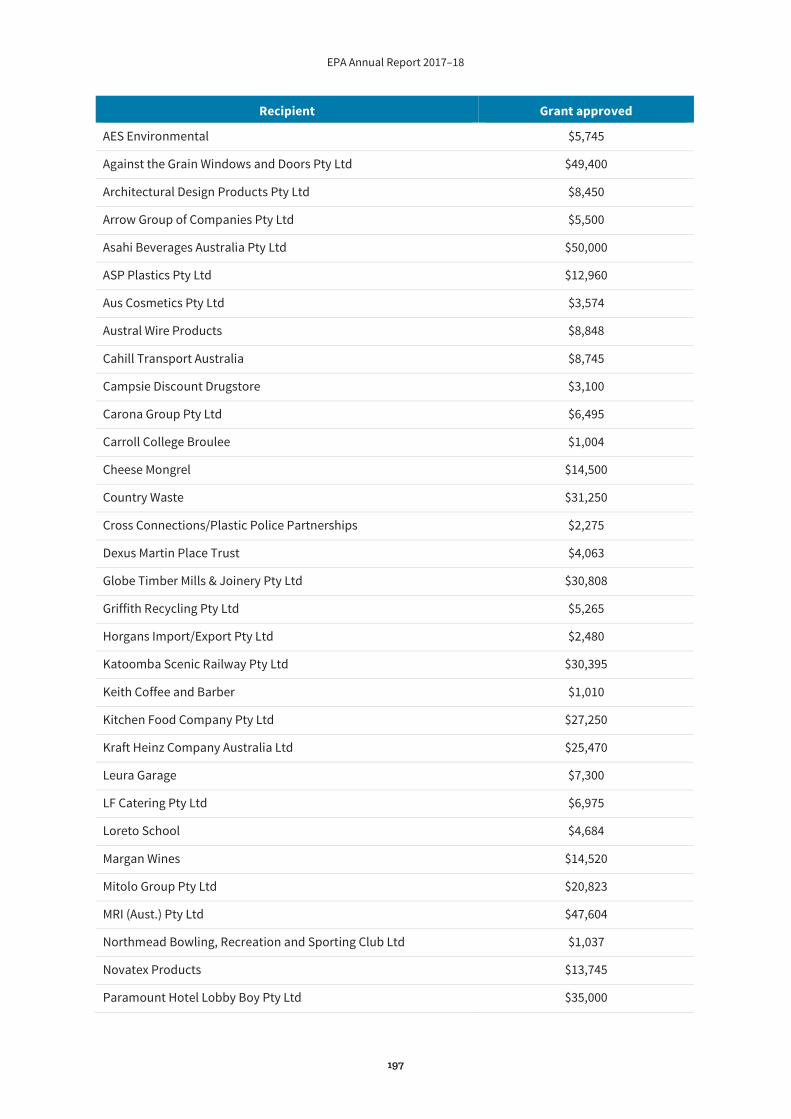
EPA Annual Report 2017–18
197
Recipient Grant approved
AES Environmental $5,745
Against the Grain Windows and Doors Pty Ltd $49,400
Architectural Design Products Pty Ltd $8,450
Arrow Group of Companies Pty Ltd $5,500
Asahi Beverages Australia Pty Ltd $50,000
ASP Plastics Pty Ltd $12,960
Aus Cosmetics Pty Ltd $3,574
Austral Wire Products $8,848
Cahill Transport Australia $8,745
Campsie Discount Drugstore $3,100
Carona Group Pty Ltd $6,495
Carroll College Broulee $1,004
Cheese Mongrel $14,500
Country Waste $31,250
Cross Connections/Plastic Police Partnerships $2,275
Dexus Martin Place Trust $4,063
Globe Timber Mills & Joinery Pty Ltd $30,808
Griffith Recycling Pty Ltd $5,265
Horgans Import/Export Pty Ltd $2,480
Katoomba Scenic Railway Pty Ltd $30,395
Keith Coffee and Barber $1,010
Kitchen Food Company Pty Ltd $27,250
Kraft Heinz Company Australia Ltd $25,470
Leura Garage $7,300
LF Catering Pty Ltd $6,975
Loreto School $4,684
Margan Wines $14,520
Mitolo Group Pty Ltd $20,823
MRI (Aust.) Pty Ltd $47,604
Northmead Bowling, Recreation and Sporting Club Ltd $1,037
Novatex Products $13,745
Paramount Hotel Lobby Boy Pty Ltd $35,000

EPA Annual Report 2017–18
198
Recipient Grant approved
Queen Victoria Building $24,995
Remapak Pty Ltd $12,000
Singleton Council $13,250
Smart Earth Recycling $50,000
Summerland House Farm $14,570
Sustainable Salons Australia $39,288
The Galleries $49,990
Trappers Bakery of Goulburn $12,071
Two Fives Cafe $6,000
Western Suburbs Leagues Club Illawarra Ltd $2,409
Total $714,848
Illegal dumping The Waste Less, Recycle More initiative provides $65 million over five years to 2021 to combat illegal dumping. The EPA’s illegal dumping programs are guided by the NSW Illegal Dumping Strategy 2017–21, which uses education, capacity building, prevention, clean-up and enforcement programs to decrease incidents of illegal dumping.
During 2017–18, total payments of $2,754,528 were made for grant programs under this initiative.
Combatting Illegal Dumping Clean-up and Prevention Program grants help local councils, public land managers and community groups identify local illegal dumping hotspots and prevent and clean up waste on publicly managed land as follows:
funding option 1 is for grants of $50,000–$120,000 for councils and public land managers to carry out illegal dumping clean-up and prevention projects funding option 2 is for grants of up to $20,000 for councils and public land managers to establish illegal dumping baseline data funding option 3 is for grants of up to $50,000 for illegal dumping clean-up and prevention community partnerships.
Regional Illegal Dumping (RID) squads are regionally based teams who work on behalf of participating councils to investigate and manage illegal dumping. Funding for RID squad activities is shared equally by the EPA and member councils.
Aboriginal Land Clean-up and Prevention grants support Local Aboriginal Land Councils to clean up and prevent illegal dumping on privately owned Aboriginal land. Grants ranging from $5,000 to $50,000 are available for individual projects.
Funding for the Garage Sale Trail supports a culture of reuse in NSW and the delivery of a consistent message about illegal dumping and waste avoidance.
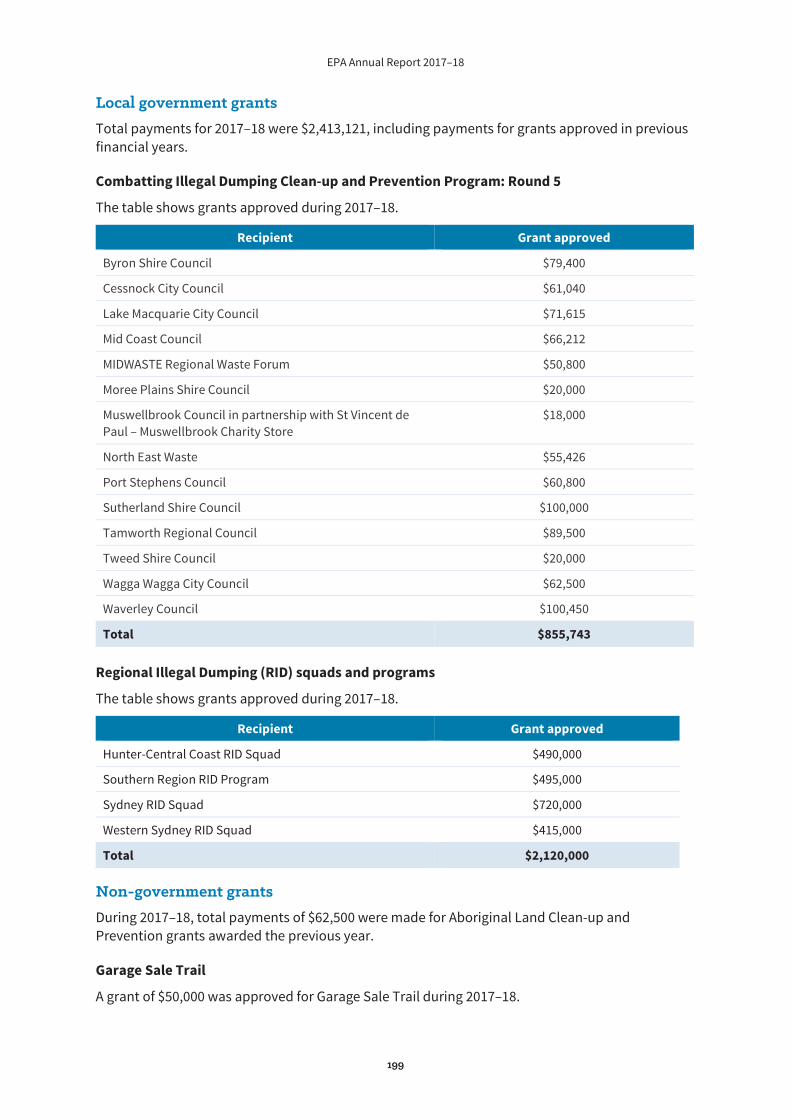
EPA Annual Report 2017–18
199
Local government grants Total payments for 2017–18 were $2,413,121, including payments for grants approved in previous financial years.
Combatting Illegal Dumping Clean-up and Prevention Program: Round 5
The table shows grants approved during 2017–18.
Recipient Grant approved
Byron Shire Council $79,400
Cessnock City Council $61,040
Lake Macquarie City Council $71,615
Mid Coast Council $66,212
MIDWASTE Regional Waste Forum $50,800
Moree Plains Shire Council $20,000
Muswellbrook Council in partnership with St Vincent de Paul – Muswellbrook Charity Store
$18,000
North East Waste $55,426
Port Stephens Council $60,800
Sutherland Shire Council $100,000
Tamworth Regional Council $89,500
Tweed Shire Council $20,000
Wagga Wagga City Council $62,500
Waverley Council $100,450
Total $855,743
Regional Illegal Dumping (RID) squads and programs
The table shows grants approved during 2017–18.
Recipient Grant approved
Hunter-Central Coast RID Squad $490,000
Southern Region RID Program $495,000
Sydney RID Squad $720,000
Western Sydney RID Squad $415,000
Total $2,120,000
Non-government grants During 2017–18, total payments of $62,500 were made for Aboriginal Land Clean-up and Prevention grants awarded the previous year.
Garage Sale Trail
A grant of $50,000 was approved for Garage Sale Trail during 2017–18.
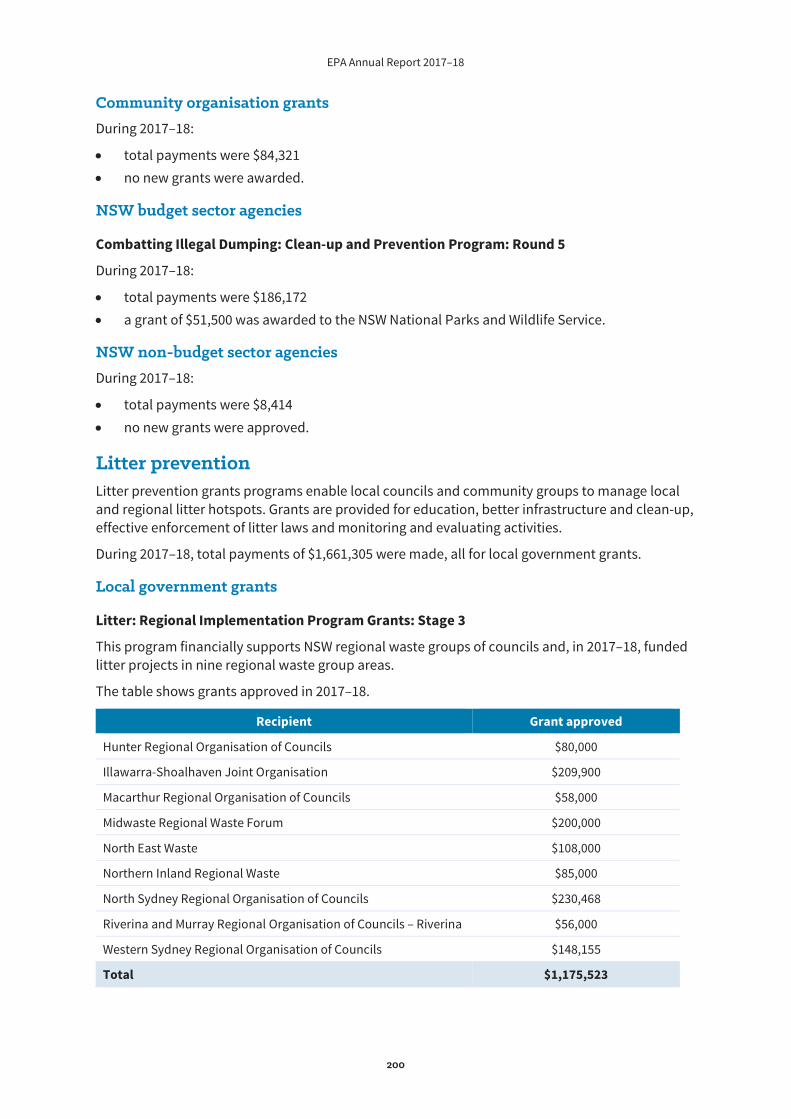
EPA Annual Report 2017–18
200
Community organisation grants During 2017–18:
total payments were $84,321 no new grants were awarded.
NSW budget sector agencies
Combatting Illegal Dumping: Clean-up and Prevention Program: Round 5
During 2017–18:
total payments were $186,172 a grant of $51,500 was awarded to the NSW National Parks and Wildlife Service.
NSW non-budget sector agencies During 2017–18:
total payments were $8,414 no new grants were approved.
Litter prevention Litter prevention grants programs enable local councils and community groups to manage local and regional litter hotspots. Grants are provided for education, better infrastructure and clean-up, effective enforcement of litter laws and monitoring and evaluating activities.
During 2017–18, total payments of $1,661,305 were made, all for local government grants.
Local government grants
Litter: Regional Implementation Program Grants: Stage 3
This program financially supports NSW regional waste groups of councils and, in 2017–18, funded litter projects in nine regional waste group areas.
The table shows grants approved in 2017–18.
Recipient Grant approved
Hunter Regional Organisation of Councils $80,000
Illawarra-Shoalhaven Joint Organisation $209,900
Macarthur Regional Organisation of Councils $58,000
Midwaste Regional Waste Forum $200,000
North East Waste $108,000
Northern Inland Regional Waste $85,000
North Sydney Regional Organisation of Councils $230,468
Riverina and Murray Regional Organisation of Councils – Riverina $56,000
Western Sydney Regional Organisation of Councils $148,155
Total $1,175,523
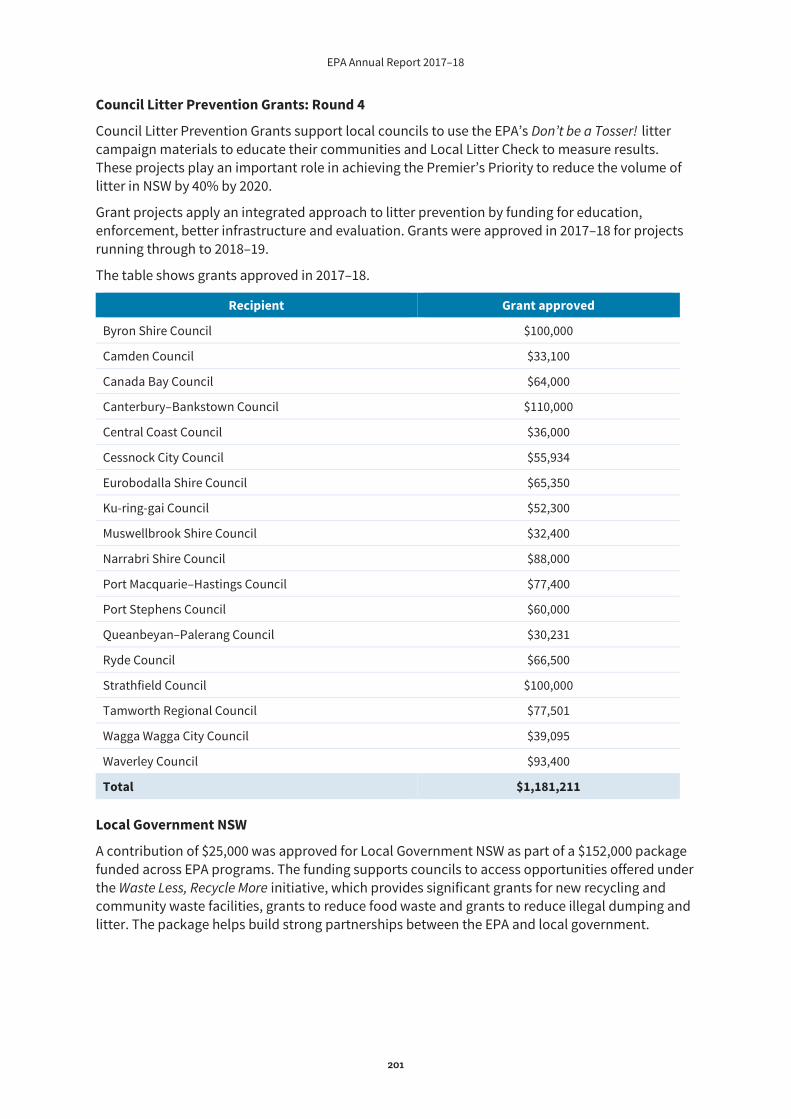
EPA Annual Report 2017–18
201
Council Litter Prevention Grants: Round 4
Council Litter Prevention Grants support local councils to use the EPA’s Don’t be a Tosser! litter campaign materials to educate their communities and Local Litter Check to measure results. These projects play an important role in achieving the Premier’s Priority to reduce the volume of litter in NSW by 40% by 2020.
Grant projects apply an integrated approach to litter prevention by funding for education, enforcement, better infrastructure and evaluation. Grants were approved in 2017–18 for projects running through to 2018–19.
The table shows grants approved in 2017–18.
Recipient Grant approved
Byron Shire Council $100,000
Camden Council $33,100
Canada Bay Council $64,000
Canterbury–Bankstown Council $110,000
Central Coast Council $36,000
Cessnock City Council $55,934
Eurobodalla Shire Council $65,350
Ku-ring-gai Council $52,300
Muswellbrook Shire Council $32,400
Narrabri Shire Council $88,000
Port Macquarie–Hastings Council $77,400
Port Stephens Council $60,000
Queanbeyan–Palerang Council $30,231
Ryde Council $66,500
Strathfield Council $100,000
Tamworth Regional Council $77,501
Wagga Wagga City Council $39,095
Waverley Council $93,400
Total $1,181,211
Local Government NSW
A contribution of $25,000 was approved for Local Government NSW as part of a $152,000 package funded across EPA programs. The funding supports councils to access opportunities offered under the Waste Less, Recycle More initiative, which provides significant grants for new recycling and community waste facilities, grants to reduce food waste and grants to reduce illegal dumping and litter. The package helps build strong partnerships between the EPA and local government.
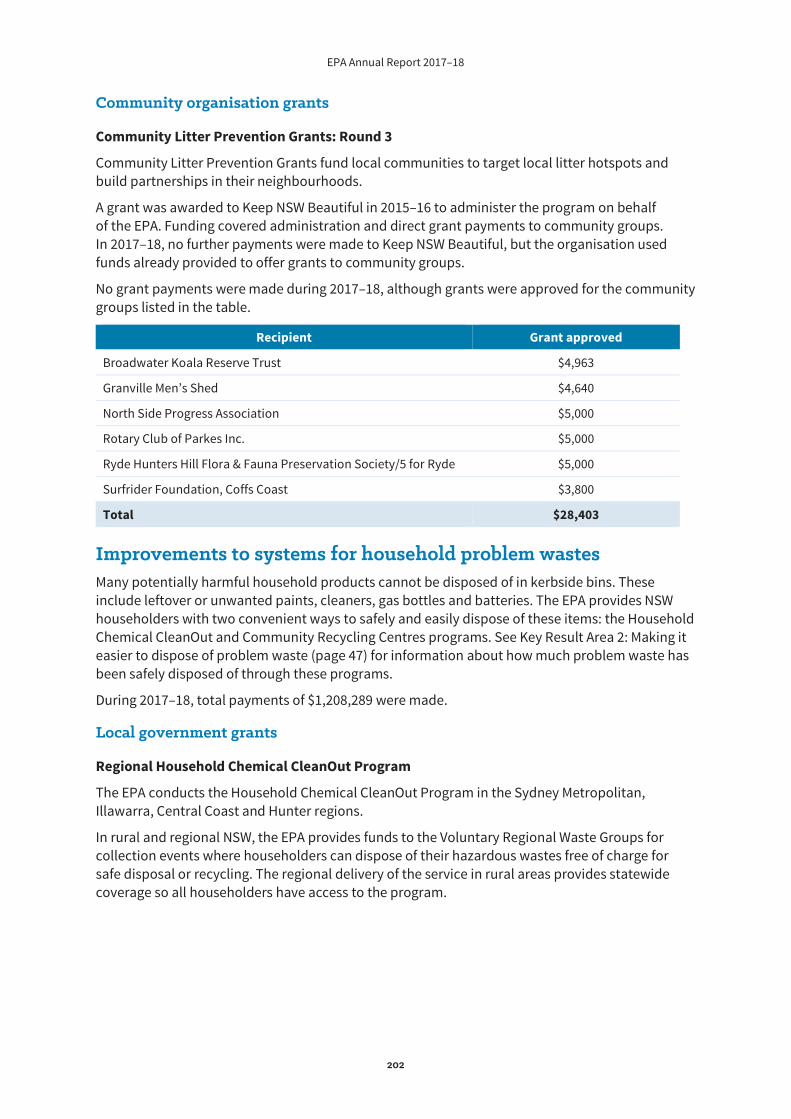
EPA Annual Report 2017–18
202
Community organisation grants
Community Litter Prevention Grants: Round 3
Community Litter Prevention Grants fund local communities to target local litter hotspots and build partnerships in their neighbourhoods.
A grant was awarded to Keep NSW Beautiful in 2015–16 to administer the program on behalf of the EPA. Funding covered administration and direct grant payments to community groups. In 2017–18, no further payments were made to Keep NSW Beautiful, but the organisation used funds already provided to offer grants to community groups.
No grant payments were made during 2017–18, although grants were approved for the community groups listed in the table.
Recipient Grant approved
Broadwater Koala Reserve Trust $4,963
Granville Men’s Shed $4,640
North Side Progress Association $5,000
Rotary Club of Parkes Inc. $5,000
Ryde Hunters Hill Flora & Fauna Preservation Society/5 for Ryde $5,000
Surfrider Foundation, Coffs Coast $3,800
Total $28,403
Improvements to systems for household problem wastes Many potentially harmful household products cannot be disposed of in kerbside bins. These include leftover or unwanted paints, cleaners, gas bottles and batteries. The EPA provides NSW householders with two convenient ways to safely and easily dispose of these items: the Household Chemical CleanOut and Community Recycling Centres programs. See Key Result Area 2: Making it easier to dispose of problem waste (page 47) for information about how much problem waste has been safely disposed of through these programs.
During 2017–18, total payments of $1,208,289 were made.
Local government grants
Regional Household Chemical CleanOut Program
The EPA conducts the Household Chemical CleanOut Program in the Sydney Metropolitan, Illawarra, Central Coast and Hunter regions.
In rural and regional NSW, the EPA provides funds to the Voluntary Regional Waste Groups for collection events where householders can dispose of their hazardous wastes free of charge for safe disposal or recycling. The regional delivery of the service in rural areas provides statewide coverage so all householders have access to the program.
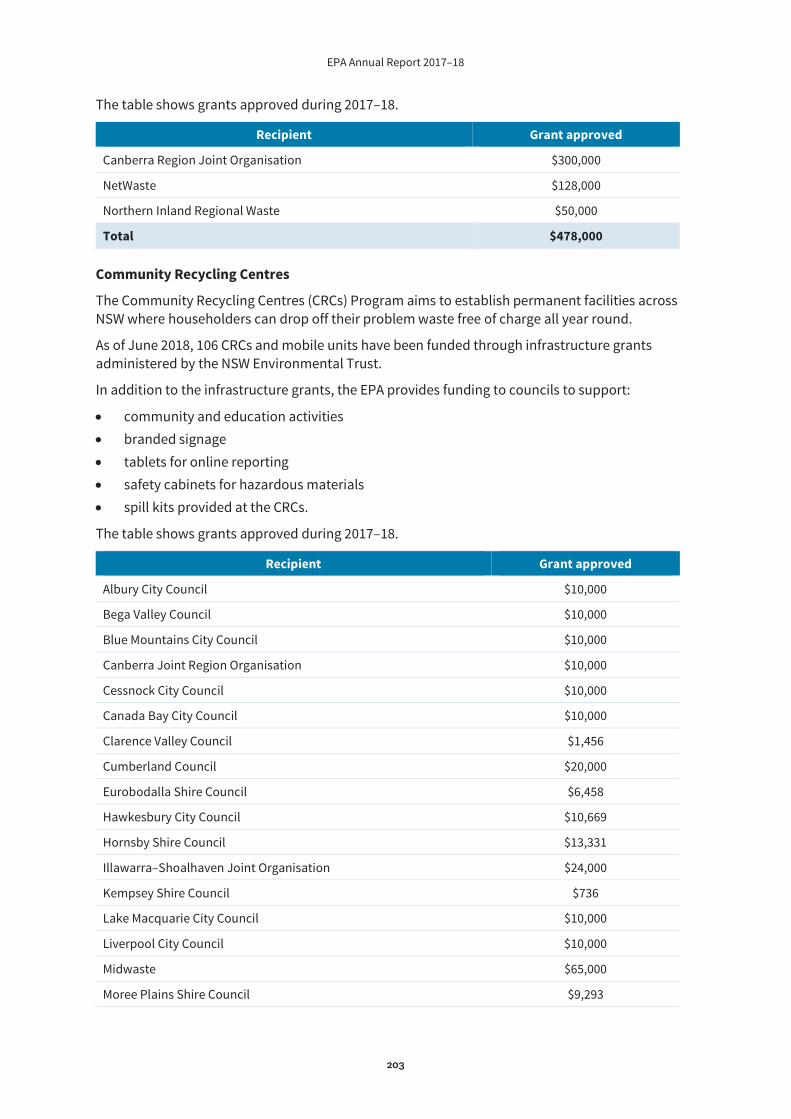
EPA Annual Report 2017–18
203
The table shows grants approved during 2017–18.
Recipient Grant approved
Canberra Region Joint Organisation $300,000
NetWaste $128,000
Northern Inland Regional Waste $50,000
Total $478,000
Community Recycling Centres
The Community Recycling Centres (CRCs) Program aims to establish permanent facilities across NSW where householders can drop off their problem waste free of charge all year round.
As of June 2018, 106 CRCs and mobile units have been funded through infrastructure grants administered by the NSW Environmental Trust.
In addition to the infrastructure grants, the EPA provides funding to councils to support:
community and education activities branded signage tablets for online reporting safety cabinets for hazardous materials spill kits provided at the CRCs.
The table shows grants approved during 2017–18.
Recipient Grant approved
Albury City Council $10,000
Bega Valley Council $10,000
Blue Mountains City Council $10,000
Canberra Joint Region Organisation $10,000
Cessnock City Council $10,000
Canada Bay City Council $10,000
Clarence Valley Council $1,456
Cumberland Council $20,000
Eurobodalla Shire Council $6,458
Hawkesbury City Council $10,669
Hornsby Shire Council $13,331
Illawarra–Shoalhaven Joint Organisation $24,000
Kempsey Shire Council $736
Lake Macquarie City Council $10,000
Liverpool City Council $10,000
Midwaste $65,000
Moree Plains Shire Council $9,293
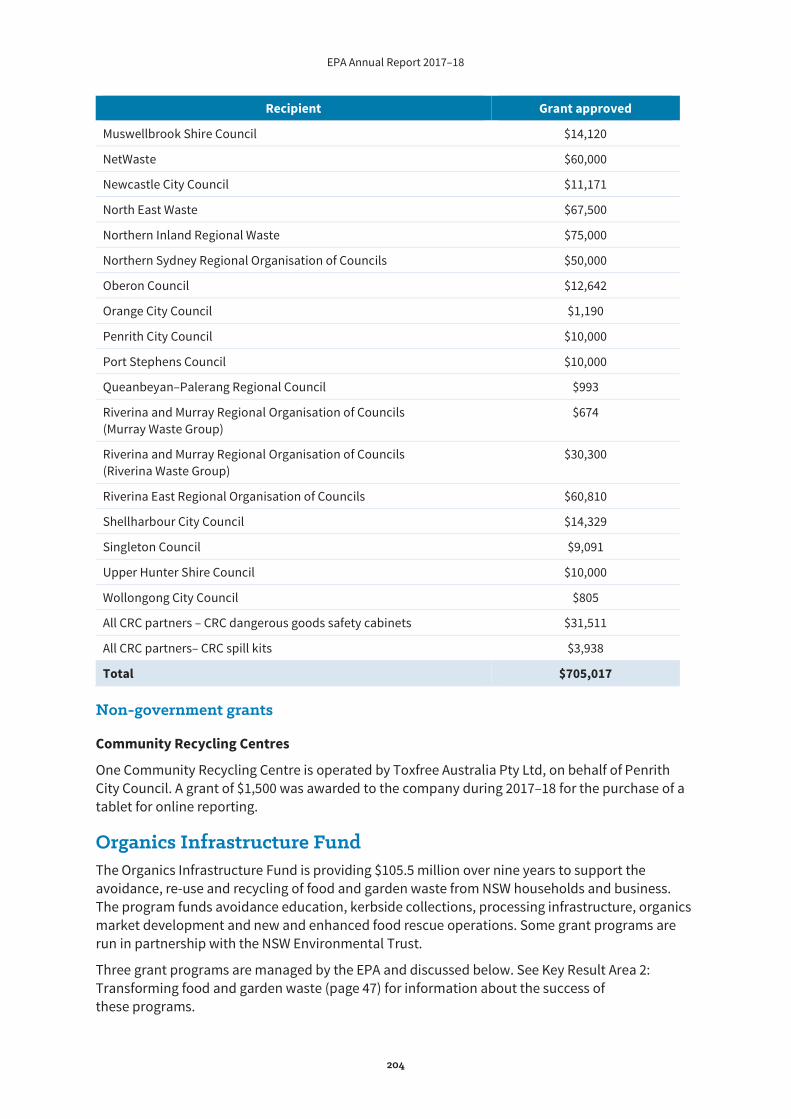
EPA Annual Report 2017–18
204
Recipient Grant approved
Muswellbrook Shire Council $14,120
NetWaste $60,000
Newcastle City Council $11,171
North East Waste $67,500
Northern Inland Regional Waste $75,000
Northern Sydney Regional Organisation of Councils $50,000
Oberon Council $12,642
Orange City Council $1,190
Penrith City Council $10,000
Port Stephens Council $10,000
Queanbeyan–Palerang Regional Council $993
Riverina and Murray Regional Organisation of Councils (Murray Waste Group)
$674
Riverina and Murray Regional Organisation of Councils (Riverina Waste Group)
$30,300
Riverina East Regional Organisation of Councils $60,810
Shellharbour City Council $14,329
Singleton Council $9,091
Upper Hunter Shire Council $10,000
Wollongong City Council $805
All CRC partners – CRC dangerous goods safety cabinets $31,511
All CRC partners– CRC spill kits $3,938
Total $705,017
Non-government grants
Community Recycling Centres
One Community Recycling Centre is operated by Toxfree Australia Pty Ltd, on behalf of Penrith City Council. A grant of $1,500 was awarded to the company during 2017–18 for the purchase of a tablet for online reporting.
Organics Infrastructure Fund The Organics Infrastructure Fund is providing $105.5 million over nine years to support the avoidance, re-use and recycling of food and garden waste from NSW households and business. The program funds avoidance education, kerbside collections, processing infrastructure, organics market development and new and enhanced food rescue operations. Some grant programs are run in partnership with the NSW Environmental Trust.
Three grant programs are managed by the EPA and discussed below. See Key Result Area 2: Transforming food and garden waste (page 47) for information about the success of these programs.

EPA Annual Report 2017–18
205
Projects awarded under the Organics Infrastructure Fund grants programs run over many financial years. Payments are made as milestones are achieved. During 2017–18, total payments were $1,207,392.
Organics Market Development Grants
This program is providing $7.5 million over nine years to support new markets for recycled organics. The aim is to ensure healthy viable markets for the increased supply of recycled food and garden waste being driven by other elements of the program. Round 2 in February–March 2018 provided grants of up to $300,000 for projects that will develop new, or expand existing, markets for compost made from source-separated recycled organics.
Food Donation Education Grants
The Food Donation Education Grants Program is a new program under the Organics Infrastructure Fund and provides $2 million over four years to 2021. Grants of up to $200,000 are available to organisations working in the food relief sector to improve their capacity to sign up more donors, work collaboratively and collect more surplus food for redistribution. The grants complement funding available through the Organics Infrastructure (Large and Small) Program administered by the NSW Environmental Trust, which funds equipment like fridges, freezers and refrigerated vans to increase the capacity of food relief agences to collect, store and manage more donated food.
Love Food Hate Waste Grants
Formerly administered by the NSW Environmental Trust, the Love Food Hate Waste Grants were redesigned and streamlined as an EPA program in 2017–18. They provide grants of up to $60,000 to councils, businesses and community organisations to deliver the new Food Smart education program to households or Your Business is Food education program to food businesses. See Key Result Area 2: Transforming food and garden waste (page 46) for more information about these new ‘off-the-shelf’ education programs.
Local government grants During 2017–18, total payments of $183,629 were made to local government as Love Food Hate Waste grants.
The table shows grants approved during 2017–18.
Recipient Grant approved
Eurobodalla Shire Council Love Food Hate Waste $60,000
Macarthur Regional Council Love Food Hate Waste $19,760
Midwaste Love Food Hate Waste $30,300
NetWaste Food Donation Education $107,662
NetWaste Love Food Hate Waste $11,980
North East Waste Food Donation Education $24,500
North East Waste Love Food Hate Waste $40,480
Queanbeyan–Palerang Regional Council Food Donation Education $70,000
Total $364,682
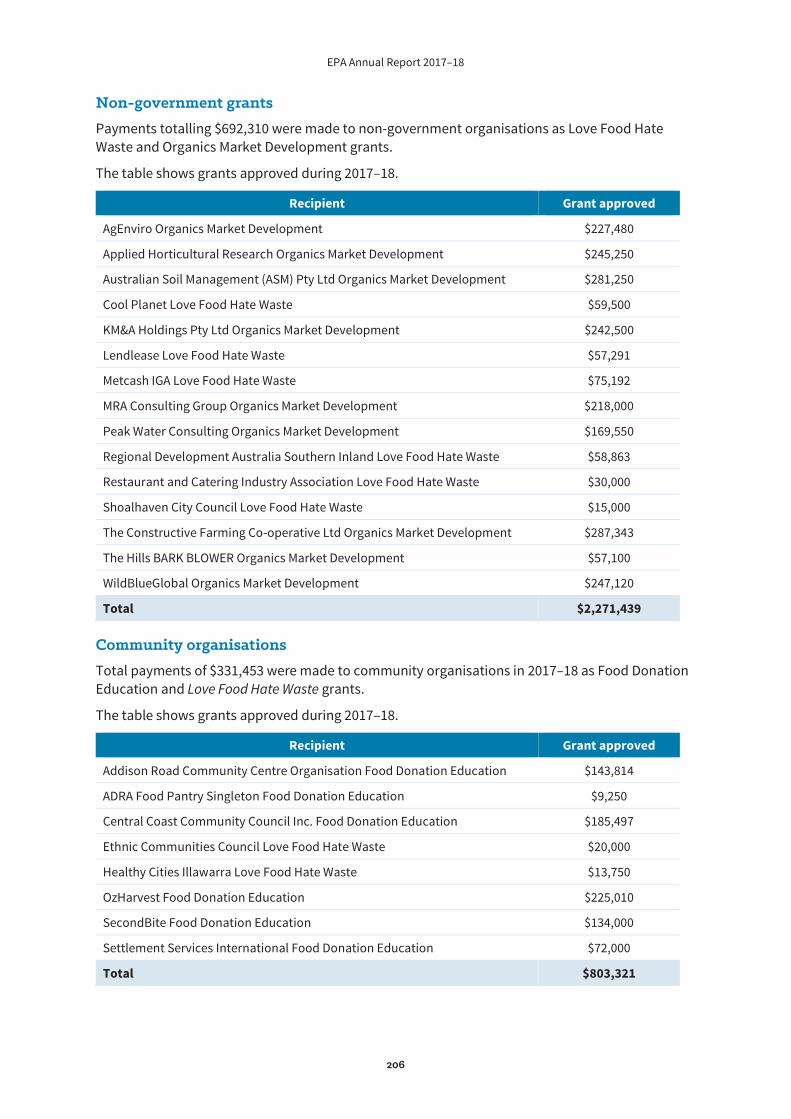
EPA Annual Report 2017–18
206
Non-government grants Payments totalling $692,310 were made to non-government organisations as Love Food Hate Waste and Organics Market Development grants.
The table shows grants approved during 2017–18.
Recipient Grant approved
AgEnviro Organics Market Development $227,480
Applied Horticultural Research Organics Market Development $245,250
Australian Soil Management (ASM) Pty Ltd Organics Market Development $281,250
Cool Planet Love Food Hate Waste $59,500
KM&A Holdings Pty Ltd Organics Market Development $242,500
Lendlease Love Food Hate Waste $57,291
Metcash IGA Love Food Hate Waste $75,192
MRA Consulting Group Organics Market Development $218,000
Peak Water Consulting Organics Market Development $169,550
Regional Development Australia Southern Inland Love Food Hate Waste $58,863
Restaurant and Catering Industry Association Love Food Hate Waste $30,000
Shoalhaven City Council Love Food Hate Waste $15,000
The Constructive Farming Co-operative Ltd Organics Market Development $287,343
The Hills BARK BLOWER Organics Market Development $57,100
WildBlueGlobal Organics Market Development $247,120
Total $2,271,439
Community organisations Total payments of $331,453 were made to community organisations in 2017–18 as Food Donation Education and Love Food Hate Waste grants.
The table shows grants approved during 2017–18.
Recipient Grant approved
Addison Road Community Centre Organisation Food Donation Education $143,814
ADRA Food Pantry Singleton Food Donation Education $9,250
Central Coast Community Council Inc. Food Donation Education $185,497
Ethnic Communities Council Love Food Hate Waste $20,000
Healthy Cities Illawarra Love Food Hate Waste $13,750
OzHarvest Food Donation Education $225,010
SecondBite Food Donation Education $134,000
Settlement Services International Food Donation Education $72,000
Total $803,321
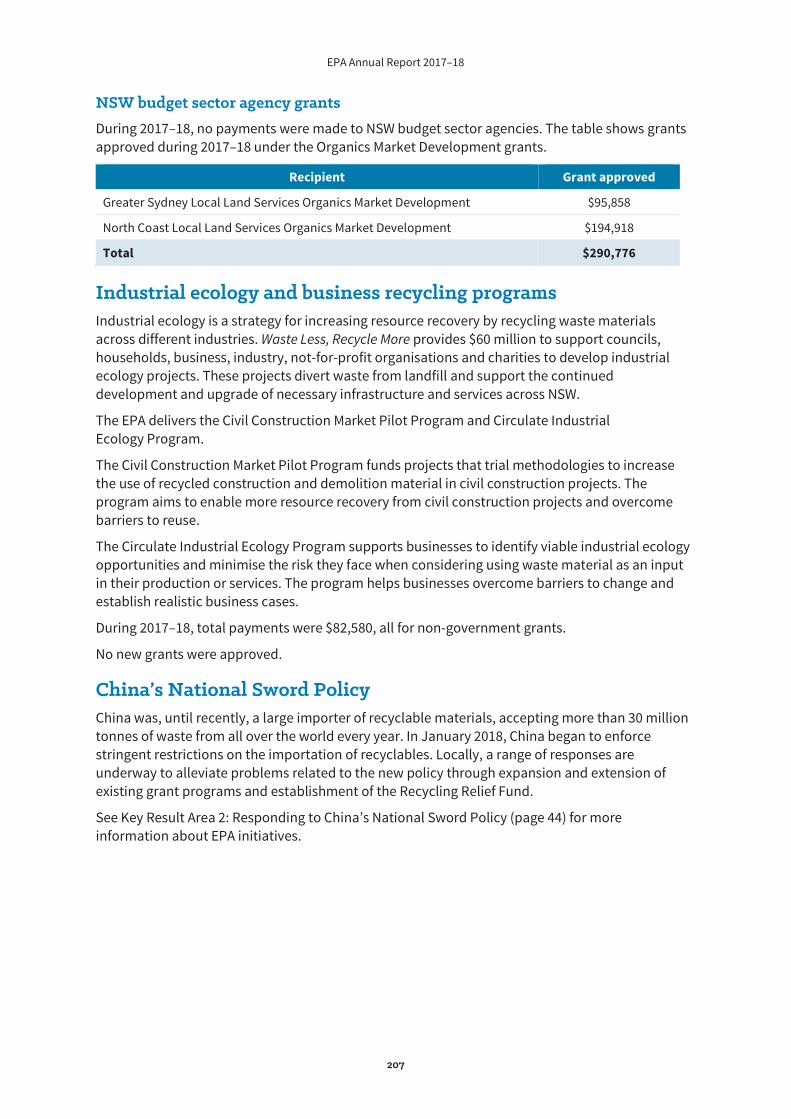
EPA Annual Report 2017–18
207
NSW budget sector agency grants During 2017–18, no payments were made to NSW budget sector agencies. The table shows grants approved during 2017–18 under the Organics Market Development grants.
Recipient Grant approved
Greater Sydney Local Land Services Organics Market Development $95,858
North Coast Local Land Services Organics Market Development $194,918
Total $290,776
Industrial ecology and business recycling programs Industrial ecology is a strategy for increasing resource recovery by recycling waste materials across different industries. Waste Less, Recycle More provides $60 million to support councils, households, business, industry, not-for-profit organisations and charities to develop industrial ecology projects. These projects divert waste from landfill and support the continued development and upgrade of necessary infrastructure and services across NSW.
The EPA delivers the Civil Construction Market Pilot Program and Circulate Industrial Ecology Program.
The Civil Construction Market Pilot Program funds projects that trial methodologies to increase the use of recycled construction and demolition material in civil construction projects. The program aims to enable more resource recovery from civil construction projects and overcome barriers to reuse.
The Circulate Industrial Ecology Program supports businesses to identify viable industrial ecology opportunities and minimise the risk they face when considering using waste material as an input in their production or services. The program helps businesses overcome barriers to change and establish realistic business cases.
During 2017–18, total payments were $82,580, all for non-government grants.
No new grants were approved.
China’s National Sword Policy China was, until recently, a large importer of recyclable materials, accepting more than 30 million tonnes of waste from all over the world every year. In January 2018, China began to enforce stringent restrictions on the importation of recyclables. Locally, a range of responses are underway to alleviate problems related to the new policy through expansion and extension of existing grant programs and establishment of the Recycling Relief Fund.
See Key Result Area 2: Responding to China’s National Sword Policy (page 44) for more information about EPA initiatives.
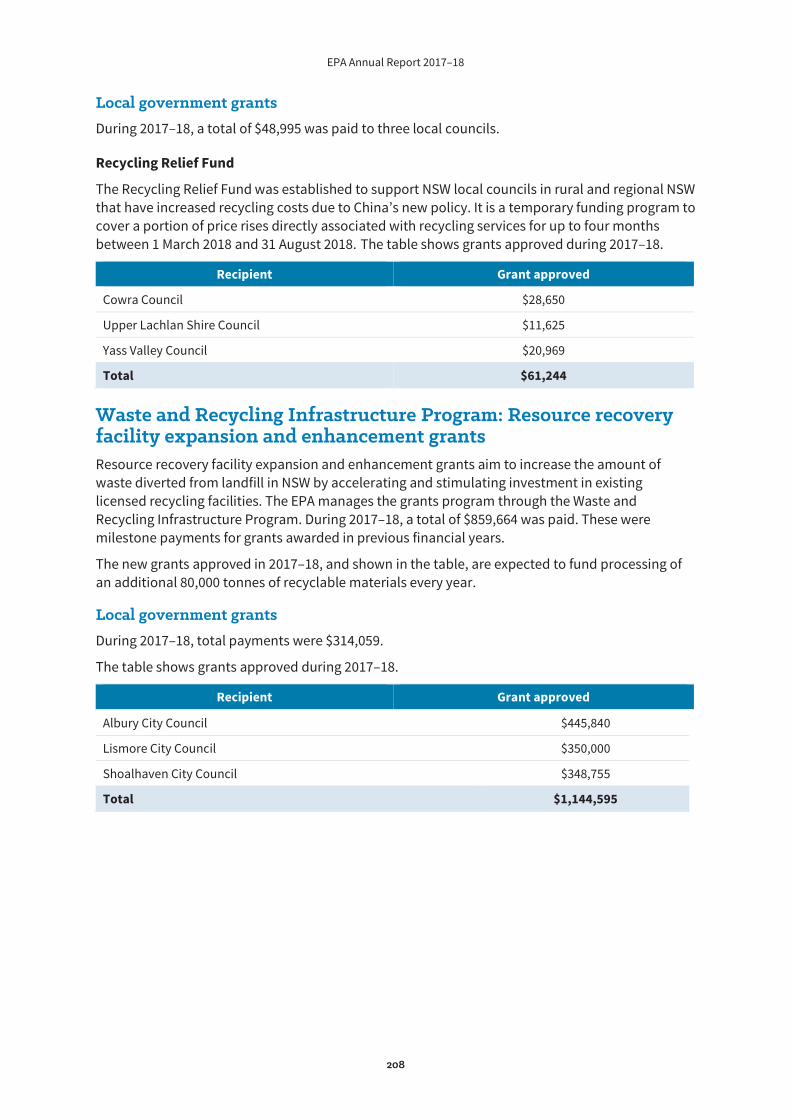
EPA Annual Report 2017–18
208
Local government grants During 2017–18, a total of $48,995 was paid to three local councils.
Recycling Relief Fund
The Recycling Relief Fund was established to support NSW local councils in rural and regional NSW that have increased recycling costs due to China’s new policy. It is a temporary funding program to cover a portion of price rises directly associated with recycling services for up to four months between 1 March 2018 and 31 August 2018. The table shows grants approved during 2017–18.
Recipient Grant approved
Cowra Council $28,650
Upper Lachlan Shire Council $11,625
Yass Valley Council $20,969
Total $61,244
Waste and Recycling Infrastructure Program: Resource recovery facility expansion and enhancement grants Resource recovery facility expansion and enhancement grants aim to increase the amount of waste diverted from landfill in NSW by accelerating and stimulating investment in existing licensed recycling facilities. The EPA manages the grants program through the Waste and Recycling Infrastructure Program. During 2017–18, a total of $859,664 was paid. These were milestone payments for grants awarded in previous financial years.
The new grants approved in 2017–18, and shown in the table, are expected to fund processing of an additional 80,000 tonnes of recyclable materials every year.
Local government grants During 2017–18, total payments were $314,059.
The table shows grants approved during 2017–18.
Recipient Grant approved
Albury City Council $445,840
Lismore City Council $350,000
Shoalhaven City Council $348,755
Total $1,144,595
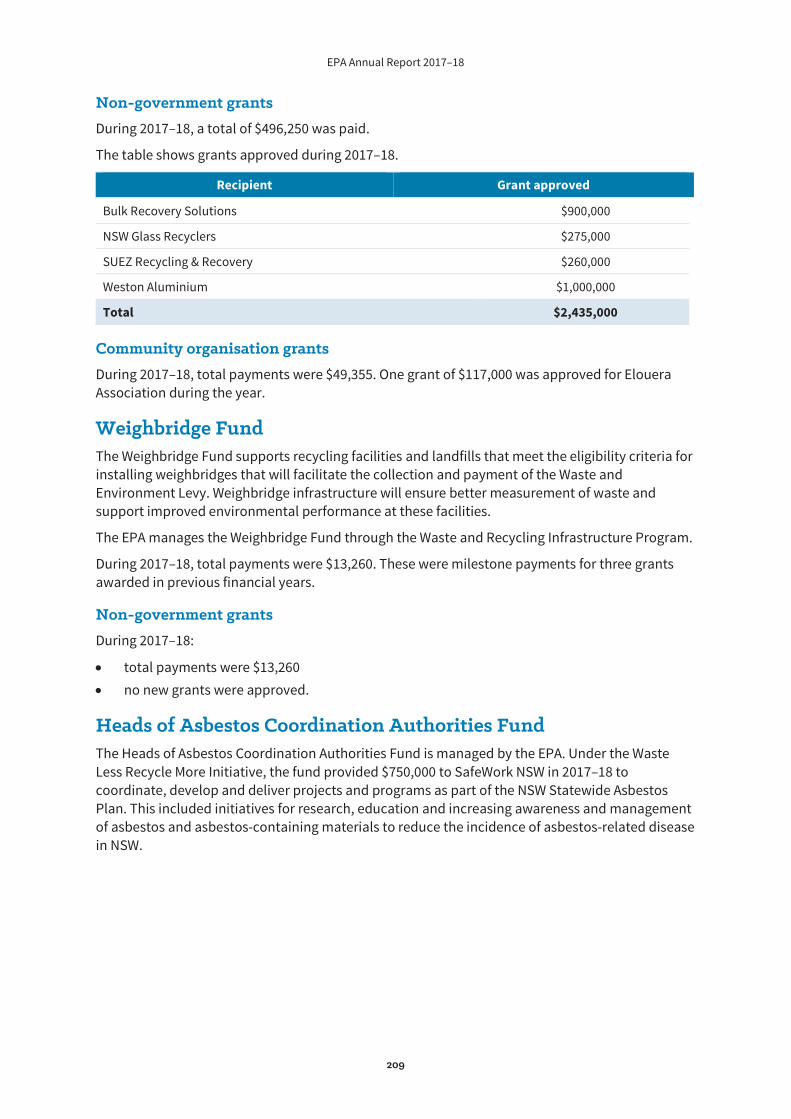
EPA Annual Report 2017–18
209
Non-government grants During 2017–18, a total of $496,250 was paid.
The table shows grants approved during 2017–18.
Recipient Grant approved
Bulk Recovery Solutions $900,000
NSW Glass Recyclers $275,000
SUEZ Recycling & Recovery $260,000
Weston Aluminium $1,000,000
Total $2,435,000
Community organisation grants During 2017–18, total payments were $49,355. One grant of $117,000 was approved for Elouera Association during the year.
Weighbridge Fund The Weighbridge Fund supports recycling facilities and landfills that meet the eligibility criteria for installing weighbridges that will facilitate the collection and payment of the Waste and Environment Levy. Weighbridge infrastructure will ensure better measurement of waste and support improved environmental performance at these facilities.
The EPA manages the Weighbridge Fund through the Waste and Recycling Infrastructure Program.
During 2017–18, total payments were $13,260. These were milestone payments for three grants awarded in previous financial years.
Non-government grants During 2017–18:
total payments were $13,260 no new grants were approved.
Heads of Asbestos Coordination Authorities Fund The Heads of Asbestos Coordination Authorities Fund is managed by the EPA. Under the Waste Less Recycle More Initiative, the fund provided $750,000 to SafeWork NSW in 2017–18 to coordinate, develop and deliver projects and programs as part of the NSW Statewide Asbestos Plan. This included initiatives for research, education and increasing awareness and management of asbestos and asbestos-containing materials to reduce the incidence of asbestos-related disease in NSW.
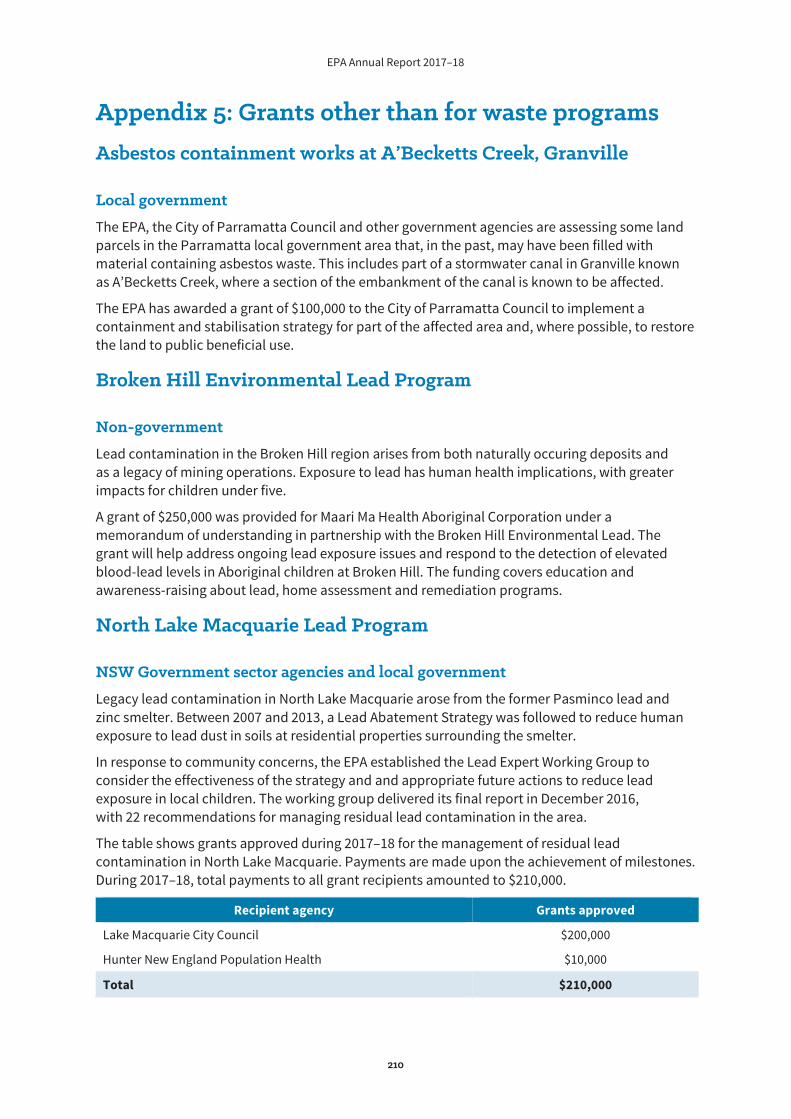
EPA Annual Report 2017–18
210
Appendix 5: Grants other than for waste programs Asbestos containment works at A’Becketts Creek, Granville
Local government
The EPA, the City of Parramatta Council and other government agencies are assessing some land parcels in the Parramatta local government area that, in the past, may have been filled with material containing asbestos waste. This includes part of a stormwater canal in Granville known as A’Becketts Creek, where a section of the embankment of the canal is known to be affected.
The EPA has awarded a grant of $100,000 to the City of Parramatta Council to implement a containment and stabilisation strategy for part of the affected area and, where possible, to restore the land to public beneficial use.
Broken Hill Environmental Lead Program
Non-government
Lead contamination in the Broken Hill region arises from both naturally occuring deposits and as a legacy of mining operations. Exposure to lead has human health implications, with greater impacts for children under five.
A grant of $250,000 was provided for Maari Ma Health Aboriginal Corporation under a memorandum of understanding in partnership with the Broken Hill Environmental Lead. The grant will help address ongoing lead exposure issues and respond to the detection of elevated blood-lead levels in Aboriginal children at Broken Hill. The funding covers education and awareness-raising about lead, home assessment and remediation programs.
North Lake Macquarie Lead Program
NSW Government sector agencies and local government
Legacy lead contamination in North Lake Macquarie arose from the former Pasminco lead and zinc smelter. Between 2007 and 2013, a Lead Abatement Strategy was followed to reduce human exposure to lead dust in soils at residential properties surrounding the smelter.
In response to community concerns, the EPA established the Lead Expert Working Group to consider the effectiveness of the strategy and and appropriate future actions to reduce lead exposure in local children. The working group delivered its final report in December 2016, with 22 recommendations for managing residual lead contamination in the area.
The table shows grants approved during 2017–18 for the management of residual lead contamination in North Lake Macquarie. Payments are made upon the achievement of milestones. During 2017–18, total payments to all grant recipients amounted to $210,000.
Recipient agency Grants approved
Lake Macquarie City Council $200,000
Hunter New England Population Health $10,000
Total $210,000
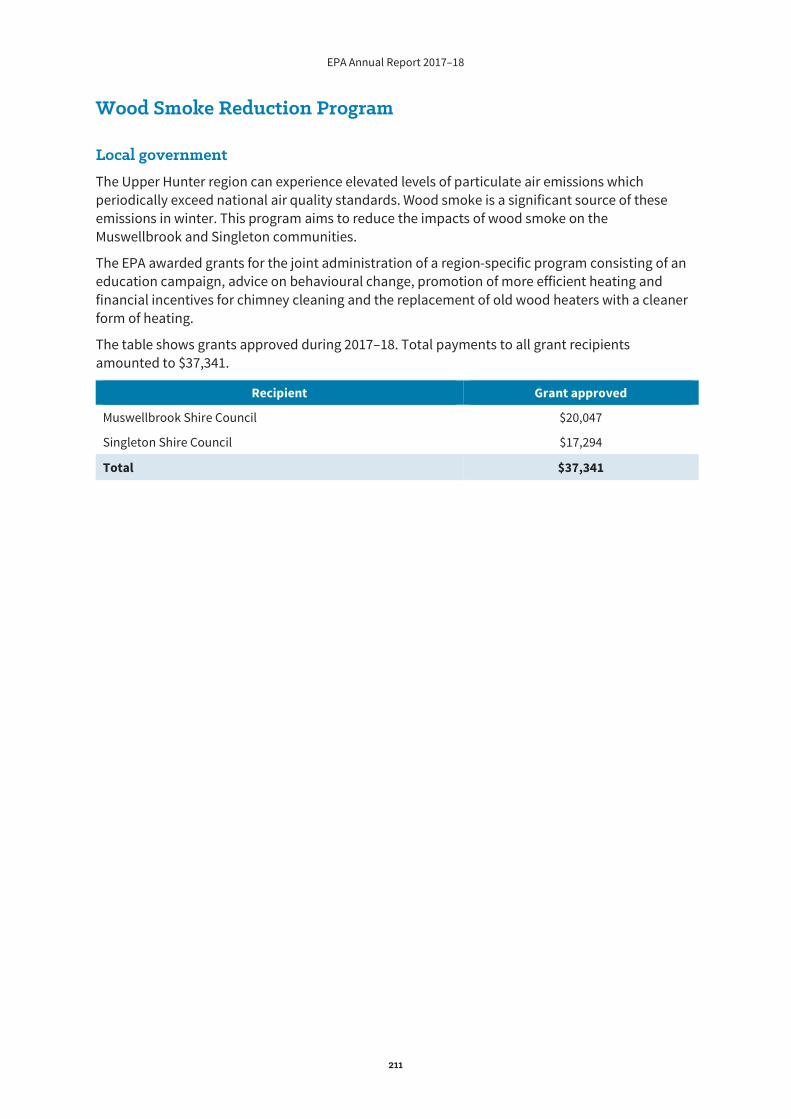
EPA Annual Report 2017–18
211
Wood Smoke Reduction Program
Local government
The Upper Hunter region can experience elevated levels of particulate air emissions which periodically exceed national air quality standards. Wood smoke is a significant source of these emissions in winter. This program aims to reduce the impacts of wood smoke on the Muswellbrook and Singleton communities.
The EPA awarded grants for the joint administration of a region-specific program consisting of an education campaign, advice on behavioural change, promotion of more efficient heating and financial incentives for chimney cleaning and the replacement of old wood heaters with a cleaner form of heating.
The table shows grants approved during 2017–18. Total payments to all grant recipients amounted to $37,341.
Recipient Grant approved
Muswellbrook Shire Council $20,047
Singleton Shire Council $17,294
Total $37,341
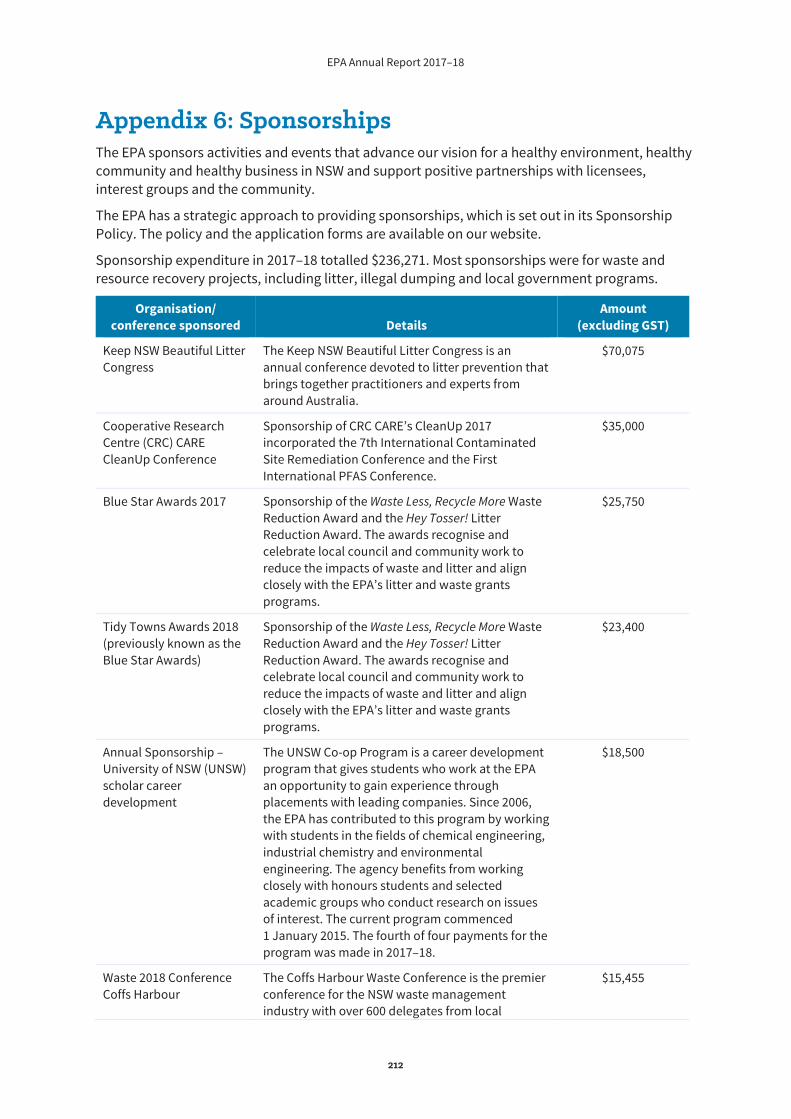
EPA Annual Report 2017–18
212
Appendix 6: Sponsorships The EPA sponsors activities and events that advance our vision for a healthy environment, healthy community and healthy business in NSW and support positive partnerships with licensees, interest groups and the community.
The EPA has a strategic approach to providing sponsorships, which is set out in its Sponsorship Policy. The policy and the application forms are available on our website.
Sponsorship expenditure in 2017–18 totalled $236,271. Most sponsorships were for waste and resource recovery projects, including litter, illegal dumping and local government programs.
Organisation/ conference sponsored Details
Amount (excluding GST)
Keep NSW Beautiful Litter Congress
The Keep NSW Beautiful Litter Congress is an annual conference devoted to litter prevention that brings together practitioners and experts from around Australia.
$70,075
Cooperative Research Centre (CRC) CARE CleanUp Conference
Sponsorship of CRC CARE’s CleanUp 2017 incorporated the 7th International Contaminated Site Remediation Conference and the First International PFAS Conference.
$35,000
Blue Star Awards 2017 Sponsorship of the Waste Less, Recycle More Waste Reduction Award and the Hey Tosser! Litter Reduction Award. The awards recognise and celebrate local council and community work to reduce the impacts of waste and litter and align closely with the EPA’s litter and waste grants programs.
$25,750
Tidy Towns Awards 2018 (previously known as the Blue Star Awards)
Sponsorship of the Waste Less, Recycle More Waste Reduction Award and the Hey Tosser! Litter Reduction Award. The awards recognise and celebrate local council and community work to reduce the impacts of waste and litter and align closely with the EPA’s litter and waste grants programs.
$23,400
Annual Sponsorship – University of NSW (UNSW) scholar career development
The UNSW Co-op Program is a career development program that gives students who work at the EPA an opportunity to gain experience through placements with leading companies. Since 2006, the EPA has contributed to this program by working with students in the fields of chemical engineering, industrial chemistry and environmental engineering. The agency benefits from working closely with honours students and selected academic groups who conduct research on issues of interest. The current program commenced 1 January 2015. The fourth of four payments for the program was made in 2017–18.
$18,500
Waste 2018 Conference Coffs Harbour
The Coffs Harbour Waste Conference is the premier conference for the NSW waste management industry with over 600 delegates from local
$15,455
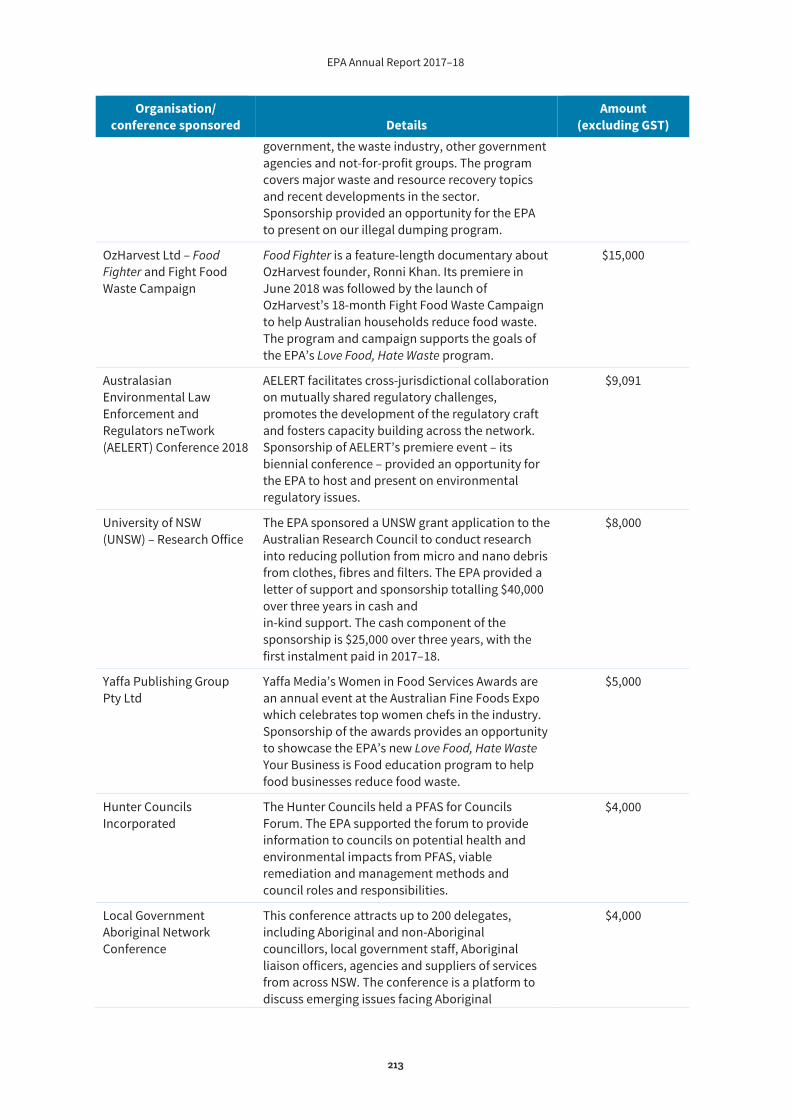
EPA Annual Report 2017–18
213
Organisation/ conference sponsored Details
Amount (excluding GST)
government, the waste industry, other government agencies and not-for-profit groups. The program covers major waste and resource recovery topics and recent developments in the sector. Sponsorship provided an opportunity for the EPA to present on our illegal dumping program.
OzHarvest Ltd – Food Fighter and Fight Food Waste Campaign
Food Fighter is a feature-length documentary about OzHarvest founder, Ronni Khan. Its premiere in June 2018 was followed by the launch of OzHarvest’s 18-month Fight Food Waste Campaign to help Australian households reduce food waste. The program and campaign supports the goals of the EPA’s Love Food, Hate Waste program.
$15,000
Australasian Environmental Law Enforcement and Regulators neTwork (AELERT) Conference 2018
AELERT facilitates cross-jurisdictional collaboration on mutually shared regulatory challenges, promotes the development of the regulatory craft and fosters capacity building across the network. Sponsorship of AELERT’s premiere event – its biennial conference – provided an opportunity for the EPA to host and present on environmental regulatory issues.
$9,091
University of NSW (UNSW) – Research Office
The EPA sponsored a UNSW grant application to the Australian Research Council to conduct research into reducing pollution from micro and nano debris from clothes, fibres and filters. The EPA provided a letter of support and sponsorship totalling $40,000 over three years in cash and in-kind support. The cash component of the sponsorship is $25,000 over three years, with the first instalment paid in 2017–18.
$8,000
Yaffa Publishing Group Pty Ltd
Yaffa Media’s Women in Food Services Awards are an annual event at the Australian Fine Foods Expo which celebrates top women chefs in the industry. Sponsorship of the awards provides an opportunity to showcase the EPA’s new Love Food, Hate Waste Your Business is Food education program to help food businesses reduce food waste.
$5,000
Hunter Councils Incorporated
The Hunter Councils held a PFAS for Councils Forum. The EPA supported the forum to provide information to councils on potential health and environmental impacts from PFAS, viable remediation and management methods and council roles and responsibilities.
$4,000
Local Government Aboriginal Network Conference
This conference attracts up to 200 delegates, including Aboriginal and non-Aboriginal councillors, local government staff, Aboriginal liaison officers, agencies and suppliers of services from across NSW. The conference is a platform to discuss emerging issues facing Aboriginal
$4,000
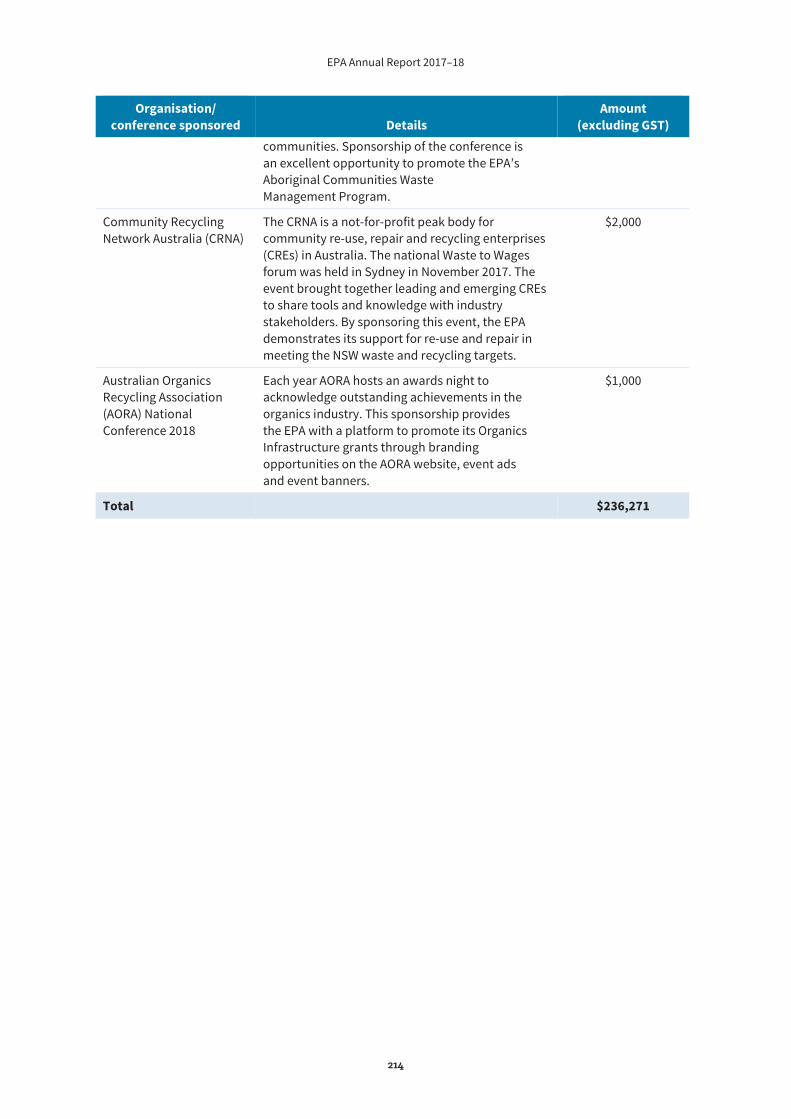
EPA Annual Report 2017–18
214
Organisation/ conference sponsored Details
Amount (excluding GST)
communities. Sponsorship of the conference is an excellent opportunity to promote the EPA’s Aboriginal Communities Waste Management Program.
Community Recycling Network Australia (CRNA)
The CRNA is a not-for-profit peak body for community re-use, repair and recycling enterprises (CREs) in Australia. The national Waste to Wages forum was held in Sydney in November 2017. The event brought together leading and emerging CREs to share tools and knowledge with industry stakeholders. By sponsoring this event, the EPA demonstrates its support for re-use and repair in meeting the NSW waste and recycling targets.
$2,000
Australian Organics Recycling Association (AORA) National Conference 2018
Each year AORA hosts an awards night to acknowledge outstanding achievements in the organics industry. This sponsorship provides the EPA with a platform to promote its Organics Infrastructure grants through branding opportunities on the AORA website, event ads and event banners.
$1,000
Total $236,271
EPA Annual Report 2017–18
215
Appendix 7: Requirements for conflict of interest disclosure by EPA Board members Clause 7 of Schedule 1 to the Protection of the Environment Administration Act 1991 and the provisions of the Protection of the Environment Administration Regulation 2012 contain detailed requirements on:
disclosure of the pecuniary and personal interests of Board members the keeping of publicly available records about disclosures the effect disclosures have on Board members’ participation in Board business.
A member must disclose if they have a direct or indirect pecuniary interest in a matter being considered, or about to be considered, at a meeting of the Board where the interest appears to raise a conflict with the proper performance of the member’s duties because:
they are a member of, or are employed by, a specified company or other body they are a partner of, or are employed by, a specified person they have some other specified interest relating to a specified company or other body or to a specified person a matter being considered or about to be considered at a meeting of the Board relates to the institution of criminal or related proceedings against a person and a member has any personal or financial interest in the matter.
Board members may also need to lodge special disclosures from time to time. Members are given an opportunity at the commencement of each meeting to declare any potential, perceived or actual conflicts of interest and these are recorded in the minutes of each meeting.
In accordance with NSW Treasury directions and Australian Accounting Standards, the EPA has implemented procedures to ensure the requirements of Australian Accounting Standard 124 – Related Party Disclosures are met.
The Protection of the Environment Administration Regulation 2012 is currently due to be automatically repealed on 1 September 2018 under the Subordinate Legislation Act 1989. This will not end the core statutory requirements for disclosures by Board members.
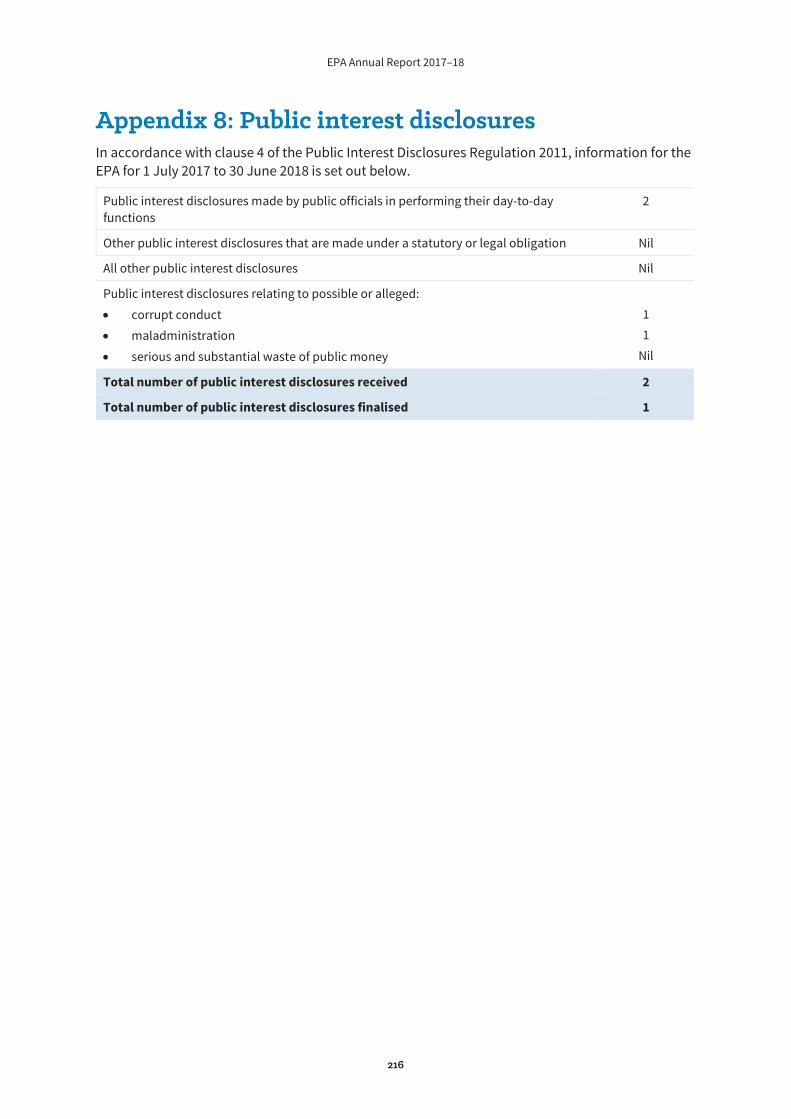
EPA Annual Report 2017–18
216
Appendix 8: Public interest disclosures In accordance with clause 4 of the Public Interest Disclosures Regulation 2011, information for the EPA for 1 July 2017 to 30 June 2018 is set out below.
Public interest disclosures made by public officials in performing their day-to-day functions
2
Other public interest disclosures that are made under a statutory or legal obligation Nil
All other public interest disclosures Nil
Public interest disclosures relating to possible or alleged: corrupt conduct maladministration serious and substantial waste of public money
1 1
Nil
Total number of public interest disclosures received 2
Total number of public interest disclosures finalised 1
EPA Annual Report 2017–18
217
Appendix 9: Statistical information on access applications Under clause 7 of the Government Information (Public Access) Regulation 2009, statistical information must be provided about the formal access applications received by the EPA under section 9 of the Government Information (Public Access) Act 2009 (GIPA Act) during the current reporting year.
Number of access applications received: clause 7(b) During 2017–18, the EPA received 76 applications for access. Twenty-five applications were initially assessed as being invalid. Of these, 21 subsequently became valid and have been included in the total of 72 valid applications. Payment of the application fee was the predominant reason that invalid applications subsequently became valid.
Number of access applications refused under Schedule 1: clause 7(c) Of the valid applications received during the reporting period, the EPA refused four applications in part and one in full because the information requested was either Cabinet information or legal professional privilaged information, both of which are specified in Schedule 1 of the GIPA Act as being against the public interest to disclose (see Table D below).
Statistical information about access applications: clause 7(d) and Schedule 2 Notes
Nine applications received in the previous reporting year were completed in 2017–18 (one was withdrawn) and are included in the following statistics.
More than one decision can be made in relation to an access application and, if this occurs, each decision must be recorded.
More than one public interest consideration may apply in relation to an access application and, if this occurs, each consideration must be recorded (but only once per application).
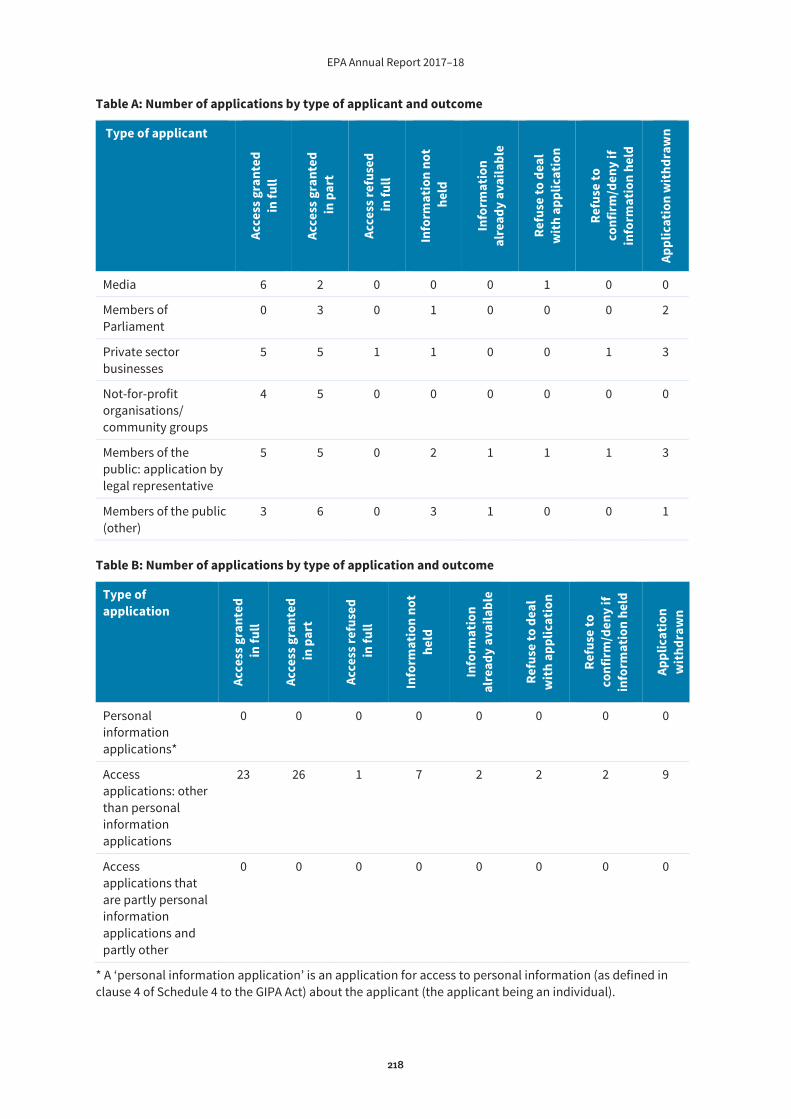
EPA Annual Report 2017–18
218
Table A: Number of applications by type of applicant and outcome
Type of applicant
Acce
ss g
rant
ed
in fu
ll
Acce
ss g
rant
ed
in p
art
Acce
ss re
fuse
d in
full
Info
rmat
ion
not
hel
d
Info
rmat
ion
al
read
y av
aila
ble
Refu
se to
dea
l w
ith
appl
icat
ion
Refu
se to
co
nfir
m/d
eny
if in
form
atio
n he
ld
Appl
icat
ion
wit
hdra
wn
Media 6 2 0 0 0 1 0 0
Members of Parliament
0 3 0 1 0 0 0 2
Private sector businesses
5 5 1 1 0 0 1 3
Not-for-profit organisations/ community groups
4 5 0 0 0 0 0 0
Members of the public: application by legal representative
5 5 0 2 1 1 1 3
Members of the public (other)
3 6 0 3 1 0 0 1
Table B: Number of applications by type of application and outcome
Type of application
Acce
ss g
rant
ed
in fu
ll
Acce
ss g
rant
ed
in p
art
Acce
ss re
fuse
d in
full
Info
rmat
ion
not
held
Info
rmat
ion
alre
ady
avai
labl
e
Refu
se to
dea
l w
ith
appl
icat
ion
Refu
se to
co
nfir
m/d
eny
if in
form
atio
n he
ld
Appl
icat
ion
wit
hdra
wn
Personal information applications*
0 0 0 0 0 0 0 0
Access applications: other than personal information applications
23 26 1 7 2 2 2 9
Access applications that are partly personal information applications and partly other
0 0 0 0 0 0 0 0
* A ‘personal information application’ is an application for access to personal information (as defined in clause 4 of Schedule 4 to the GIPA Act) about the applicant (the applicant being an individual).
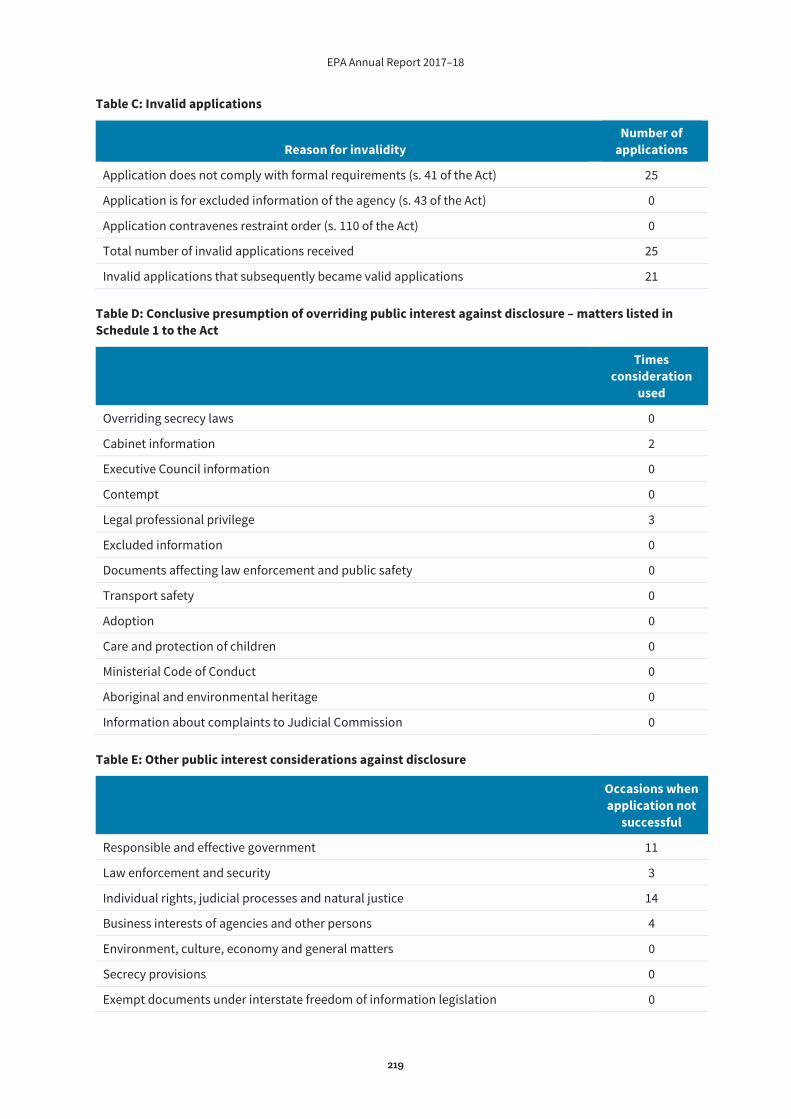
EPA Annual Report 2017–18
219
Table C: Invalid applications
Reason for invalidity Number of
applications
Application does not comply with formal requirements (s. 41 of the Act) 25
Application is for excluded information of the agency (s. 43 of the Act) 0
Application contravenes restraint order (s. 110 of the Act) 0
Total number of invalid applications received 25
Invalid applications that subsequently became valid applications 21
Table D: Conclusive presumption of overriding public interest against disclosure – matters listed in Schedule 1 to the Act
Times consideration
used
Overriding secrecy laws 0
Cabinet information 2
Executive Council information 0
Contempt 0
Legal professional privilege 3
Excluded information 0
Documents affecting law enforcement and public safety 0
Transport safety 0
Adoption 0
Care and protection of children 0
Ministerial Code of Conduct 0
Aboriginal and environmental heritage 0
Information about complaints to Judicial Commission 0
Table E: Other public interest considerations against disclosure
Occasions when application not
successful
Responsible and effective government 11
Law enforcement and security 3
Individual rights, judicial processes and natural justice 14
Business interests of agencies and other persons 4
Environment, culture, economy and general matters 0
Secrecy provisions 0
Exempt documents under interstate freedom of information legislation 0

EPA Annual Report 2017–18
220
Table F: Timeliness
Number of applications
Decided within the statutory timeframe (20 days plus any extensions) 32
Decided after 35 days (by agreement with applicant) 24
Not decided within timeframe (deemed refusal) 0
Total 56
Table G: Number of applications reviewed under Part 5 of the Act (by type of review and outcome)
Type of review Decision varied Decision upheld Total
Internal review 2 3 5
Review by Information Commissioner* 1 1 2
Internal review following recommendation under section 93 of the Act
1 0 1
Review by NCAT** 0 0 0
Total 4 4 8
* The Information Commissioner does not have the authority to vary decisions, but can make recommendations to the original decision maker. The data in this case indicates that a recommendation to vary or uphold the decision has been made. ** NSW Civil and Administrative Tribunal (NCAT)
Table H: Applications for review under Part 5 of the Act (by type of applicant)
Type of application Number of applications
Applications by applicants for access to information 5
Applications by persons to whom information the subject of access application relates (see section 54 of the Act)
2
Table I: Applications transferred to other agencies under Division 2, Part 4 of the Act (by type of transfer)
Type of transfer Number of applications
Agency-initiated transfers 0
Applicant-initiated transfers 2

EPA Annual Report 2017–18
221
Index A Aboriginal waste management programs, 37, 194 access applications received, 120, 217 access applications refused, 217 accounts due or paid, 127 Acts administered, 184 air quality, 25, 211 assets
EPA, 144 EPA Staff Agency, 175
asbestos, 18, 209 audit
audit and risk management attestation statement, 114 EPA internal audit, 116 risk management and insurance activities, 115, 117
Australasian Environment Law Enforcement and Regulators neTwork (AELERT), 78 B backlog program see contaminated land management Better Waste and Recycling Fund, 94, 190 Bin Trim, 195 Board
integrity, 108 meeting schedule, 107 members, 105 terms of appointment, 105
Boral, 29 budgets, 123 C China National Sword Policy, 44, 207 circular economy, 207 Circulate Industrial Ecology Program, 207 Clarence Colliery, 86 Community Recycling Centres, 49, 202 complaints, 118 contact details, inside back cover
container deposit scheme, see Return and Earn contaminated land management, 16 controlled entities, 119 D Dib Hanna, 87 digital information security policy, 120 disability inclusion action plan, 120 diversity and inclusion, 68, 98, 120 E economic factors, 13 employees see staff statistics enforceable undertakings, 89 Environment Line, 118 Environmental Liabilities Project, 54 EPA Board see Board EPA Staff Agency, 117 EPA Strategic Plan 2017–21, 4, 15 executive team, 109 F finance
account payment performance, 127 consultants, 126 Finance, Audit and Risk Committee, 113
financial statements EPA, 133 EPA Staff Agency, 170 independent auditor’s reports, 130, 166 letters of submission, 129, 166
food waste, 47 forestry, 22 freedom of information see Government Information (Public Access) Act 2009 funds granted to non-government community organisations see grants G gas, 24, 56, 73 Government Information (Public Access) Act 2009, 119, 217
EPA Annual Report 2017–18
222
Government Resource Efficiency Policy (GREP), 121 grants, 93, 190, 210 H Hazardous substances, 18, 20, 21 Household Chemical CleanOut Program, 49, 202 I illegal dumping, 36, 198 implementation of price determinations, 125 industrial relations policies and practices, 120 infringements see penalty notices insurance, 117 internal audit, 116 investment performance, 125 J James Hardie, 18 L land disposal, 125 legislative change, 84 legislation, 84, 184 letter of submission, 3, 129, 166 liability management, 125 licence reviews under section 78, 90 litter prevention, 40, 60, 201 M management structure, 110 Muli pilot project, 37 Multicultural NSW, 120 N Narrabri Gas Project, 57 National Sword, see China National Sword Policy noise, 30, 62, 81 non-government grant recipients, 196 O Office of the EPA, see EPA Staff Agency Organics Infrastructure Fund, 47, 204 organisation chart, 110 overseas travel, 122
P Parramatta River, 26 penalty notices, 91, 189 personnel see staff statistics pollution incident response management plans (PIRMPs), 51 Privacy and Personal Information Protection Act 1998, 119 proactive release of information program, 119 prosecutions, 85 public interest disclosures, 216 R Resource recovery facility expansion and enhancement grants, 208 Return and Earn, 41, 58, 60 risk-based licensing, 32 S shared service agreements with Department of Planning and Environment, 120 sponsorships, 94, 212 staff statistics
by category, 97 by location, 97 diversity, 99, 100 salaries and allowances, 113
stakeholder engagement, 60 strategic plan, 4, 15 subsidiaries, 126 summary review of operations, 14 sustainability, 75, 121 T Tathra bushfire, 53 V vision, inside front cover W water quality, 26, 29, 72, 86 Wingecarribee River, see Boral Wollangambe River, see Clarence Colliery wood smoke, 25, 211 work health and safety, 121
EPA Annual Report 2017–18
223
© 2018 State of NSW and the NSW Environment Protection Authority
With the exception of photographs, the State of NSW and the NSW Environment Protection Authority are pleased to allow this material to be reproduced in whole or in part for educational and non-commercial use, provided the meaning is unchanged and its source, publisher and authorship are acknowledged. Specific permission is required for the reproduction of photographs.
All content in this publication is owned by the EPA and is protected by Crown Copyright, unless credited otherwise. It is licensed under the Creative Commons Attribution 4.0 International (CC BY 4.0), subject to the exemptions contained in the licence. The legal code for the licence is available at Creative Commons.
The EPA asserts the right to be attributed as author of the original material in the following manner: © State of New South Wales and the NSW Environment Protection Authority 2018.
Photo credits
Cover: Officers standing in front of a vehicle on road shoulder, John Spencer/EPA.
Appendices (page 183): jetty in Wollongong area, Sarah Ryan/EPA
Published by:
NSW Environment Protection Authority 59 Goulburn Street, Sydney NSW 2000 PO Box A290, Sydney South NSW 1232 Phone: +61 2 9995 5000 (switchboard) Phone: 131 555 (NSW only – environment information and publications requests) Fax: +61 2 9995 5999 TTY users: phone 133 677, then ask for 131 555 Speak and listen users: phone 1300 555 727, then ask for 131 555 Email: [email protected] Website: www.epa.nsw.gov.au
Report pollution and environmental incidents Environment Line: 131 555 (NSW only) or [email protected] See also www.epa.nsw.gov.au
ISSN 2203–2568 EPA 2018P1232 October 2018
Printed on environmentally sustainable paper

EPA Annual Report 2017–18
224
BACK COVER
wwww.epa.nsw.gov.au