annual report 2017–18 - parliament of victoria
TRANSCRIPT

Annual Report2017–18

Published byPublic Transport Development Authority operating as Public Transport Victoria750 Collins Street, Docklands VIC 3008.© Public Transport Victoria 2018This publication is copyright. No part may be reproduced by any process except in accordance with the Provisions of the Copyright Act 1968.ISSN 2202-5375 (Print)Print managed by Finsbury Green, Level 9, 124 Exhibition Street, Melbourne VIC 3000.This document is available in an accessible format at ptv.vic.gov.au
Putting the passenger at the centre of everything we do
1
Public Transport VictoriaAnnual Report 2017–18
2017–18 Annual Report Accountable Officer’s declaration 3
2017–18 Report of operations 4
Section 1Year in review 5
Section 2Governance and organisational structure 33
Section 3Workforce data 43
Section 4Other disclosures 49
Financial Statements 65
Appendix 134

2 Public Transport Victoria Annual Report 2017–18
AbbreviationsAAS Australian Accounting StandardsAASB Australian Accounting Standards BoardAFL Australian Football LeagueANZAC Australia and New Zealand Army CorpsAPTOC Accessible Public Transport Operators
CommitteeAUD Australian dollarATO Australian Taxation OfficeBAU business as usualCALD culturally and linguistically diverseCEO Chief Executive OfficerCNPL Civic Nexus Pty LtdCSO community service obligationcyl cylinderDAP data analytics platformDEDJTR Department of Economic Development,
Jobs, Transport and ResourcesDET Department of Education and TrainingDHHS Department of Health and Human ServicesDTF Department of Treasury and FinanceDWG Designated Working GroupFOI Freedom of InformationFRD Financial Reporting DirectionFTE full time equivalentGPT General Property TrustGST Goods and Services TaxHSR Health and Safety RepresentativeIBAC Independent Broad-based Anti-corruption
CommissionICT information communications technologyIRP Issue Resolution Procedure ISO International Organisation for
StandardisationIT information technologyKMP key management personnelkg kilogramkm kilometreLIDP Local Industry Development Plan
LPG liquefied petroleum gasLSL long service leaveLXRA Level Crossing Removal AuthorityMBSC metropolitan bus service contractsMJ megajouleMMRA Melbourne Metro Rail AuthorityMP Member of Parliamentn/a not applicableNPV net present valueNRL National Rugby LeagueNTS non-transit salesNTT Nippon Telegraph and TelephoneOHS occupational health and safetyOVIC Office of the Victorian
Information CommissionerPPE property, plant and equipmentPPP Public Private PartnershipPS principal scientistPSO Protective Service OfficerPTAC Public Transport Access CommitteePTV Public Transport VictoriaRTW return to workSDA Services and Development AgreementSTS senior technical specialistt CO2 e tonnes of carbon dioxide equivalentUITP Union International des Transports PublicsVAGO Victorian Auditor-General’s OfficeVGV Valuer-General VictoriaVicFleet Victorian State Government vehicle poolVicTrack Victorian Rail Track CorporationVIPP Victorian Industry Participation PolicyV/Line V/Line CorporationVMIA Victorian Managed Insurance AuthorityVPS Victorian Public ServiceVWA Victorian WorkCover Authority
3
2017–18 Annual Report Accountable Officer’s declaration3 September 2018The Hon Jacinta Allan MPMinister for Public Transport1 Spring StreetMelbourne VIC 3000
Dear Minister
Annual Report 2017–18In accordance with provisions of the Financial Management Act 1994 (Vic), I am pleased to present the Public Transport Development Authority’s Annual Report for the year ended 30 June 2018.
Jeroen WeimarChief ExecutivePublic Transport Development Authority operating as Public Transport Victoria

4 Public Transport Victoria Annual Report 2017–18
Report of operations

Section 1 Year in review 5
Section 1Year in review
2017–18 Report of operations Accountable Officer’s declaration 6
Chief Executive’s foreword 8
Purpose and functions 10
Fast facts 12
Achievements this year 14
Every Victorian can connect and participate 15
Victoria is prosperous and sustainable 19
Every Victorian travels safely 23
Delivering value and expertise for Victorians 25
Organisation changes 28
Direct costs attributable to machinery of government changes 28
PTV’s current year financial review 29

6 Public Transport Victoria Annual Report 2017–18
2017–18 Report of operations Accountable Officer’s declarationPublic Transport Victoria – Report on Operations On behalf of the Public Transport Development Authority operating as Public Transport Victoria, I am pleased to submit the Public Transport Victoria’s Report of Operations in accordance with Direction 5.2.3 of the Standing Directions of the Minister for Finance. This report provides information on:
– Year in review – Governance and organisational structure – Workforce data – Other disclosures.
Jeroen WeimarChief ExecutivePublic Transport Development Authority operating as Public Transport Victoria3 September 2018

Section 1 Year in review 7
VisionA public transport service that Victorians value and choose to use.
PurposeWe get people where they want to go by providing a safe, reliable and inclusive public transport network.
ValuesPTV operates according to the Victorian Public Sector Values.
PTV also promotes the values of:
Customer firstWe put the customer first. Customer safety is paramount and we innovate to transform the customer experience.
PassionWe enthusiastically advocate for public transport use.
Delivery excellenceWe uphold high professional standards in how we manage our work, ensuring we achieve results while working safely.
CollaborationWe are united by common goals, not defined by reporting lines and organisational structure.
IntegrityIn our interactions with each other, our partners and our customers we will be reliable, open and transparent.
8 Public Transport Victoria Annual Report 2017–18
While the task of moving a growing population may appear to be a daunting challenge, it is in fact an opportunity to harness this momentum and create a transport network that reaches more people, is intuitive to navigate and runs reliably day in, day out.Transport for Victoria and its agencies are collectively rising to this challenge and delivering a pipeline of projects and upgrades that will overhaul Victoria’s transport network. These ambitious works are already beginning to improve the daily travelling experience for our passengers.The Level Crossing Removal Authority removed 14 level crossings in 2017–18 which has not only created safer and more reliable services, it has provided an opportunity to increase services to some of the busiest train lines to reduce crowding and create a more comfortable journey.Safety upgrades are also being delivered in regional Victoria where 52 level crossings were upgraded with active safety controls and a further 17 were upgraded across the metropolitan network.Works are underway on Metro Tunnel and Regional Rail Revival, along with signalling and track upgrades to prepare for the introduction of High Capacity Metro Trains. Each of these projects involves a significant undertaking to minimise the inevitable short-term inconvenience to passengers that accompanies major works. The application of technology and continuous improvement ensures delays for passengers and motorists are minimised.Another important initiative that will step-change the experience for our passengers are the new seven-year contracts to run Melbourne’s train and tram network. Metro Trains Melbourne and Keolis Downer secured contracts that raise the bar for the on-time running of services, cleanliness of stations and stops, and the delivery of timely information to passengers.
Chief Executive’s forewordPeople are using Victoria’s trains, trams and buses in record high numbers to move around their local area or to connect with the rest of the state. The latest statistics show 70 per cent of Melburnians have used public transport in the last three months. This may be as the cornerstone of their daily commute, as part of a journey involving other modes of transport or as an occasional enabler of their recreational activities.
Jeroen WeimarChief Executive

Section 1 Year in review 9
Negotiations have concluded for new metropolitan bus contracts that will also drive more reliable services and provide greater flexibility to create routes that service the needs of local community.Despite the changing fabric of Victoria, the fundamentals of public transport remain true — it is the ultimate social enabler for people from all backgrounds and of all abilities. For some people it is their means to living an independent and fulfilled life. Each of the six accessible platform stops that were upgraded in 2017–18, along with the arrival of the 65th low-floor E-Class tram marks an important step towards a journey without barriers for people with accessibility needs.It’s not just the physical infrastructure that facilitates these journeys — it’s also the front-line staff. The Scope Communication Access Symbol training and accreditation ensures that our staff have the knowledge and tools at their fingertips to help all people travel confidently.And as the world around us becomes more connected through rapid advances in technology, the way we deliver information to our passengers must also evolve and adapt. We have now introduced real time service information for all three modes of public transport, putting accurate travel information in the hands of our passengers. The PTV website and app are viewed more than 360,000 times per day which underscores the importance of providing timely information to help people choose the best way to complete their journey, particularly during disruptions. Work is underway on a new website that will put travel and ticketing information in an easier and more intuitive format.A major sustainability achievement this year was the announcement that 410 of Melbourne’s trams will soon be powered by solar energy plants. This is a first for Australia and will contribute to Victoria meeting its target of net-zero greenhouse gas emission by 2050.
To rise to the challenge of the growing expectations of passengers, we have placed a strong focus on creating a work environment that generates new and innovative ideas.Passionate, driven and highly capable, PTV staff work tirelessly to improve the experience for passengers and this year we’ve been building on that passion and capability — embracing opportunities to share knowledge with counterparts locally and abroad and fostering the next generation of public transport leaders.The 2017–18 PTV Annual Report gives you a snapshot of the combined efforts of PTV’s work and achievements to provide a service that Victorians value and choose to use.
Jeroen WeimarChief Executive

10 Public Transport Victoria Annual Report 2017–18
Purpose and functionsThe Public Transport Development Authority, operating as Public Transport Victoria (PTV), commenced operations on 2 April 2012 following an amendment to the Transport Integration Act 2010.
The object of PTV is to plan, coordinate, provide, operate and maintain a safe, punctual, reliable and clean public transport system consistent with the vision statement and the transport system objectives.
PTV’s object includes: – Ensuring that the public transport system
operates as part of an integrated transport system which seeks to meet the needs of all transport system users.
– Managing the public transport system to support a sustainable Victoria.
– Contributing to social wellbeing by providing access to opportunities and supporting liveable communities.
– Promoting economic prosperity though efficient and reliable movement of public transport users while also supporting rail freight services.
– Working with its partners to improve the safety of public transport for public transport users.
PTV supports the Minister for Public Transport, Hon. Jacinta Allan MP.

Section 1 Year in review 11

12 Public Transport Victoria Annual Report 2017–18
Fast facts
Metropolitan: 4.8 millionincrease of 2.9% (over 3 years)
Regional: 1.5 millionincrease of 5.2% (over 3 years)
Metropolitan: 565 milliontrain 240.9tram 206.3bus 117.8overall increase of 6.2% (over 5 years)
Regional: 33.3 millionV/Line 20.8 (train & coach) bus 12.5increase of 13.5% (over 5 years)
Digital impressionsWebsite sessions:45 millionApp sessions:87 million
176 million journeys planned
Total visits to PTV Hubs: 0.56 million
Top customer enquiries:myki and ticketing: Wayfinding, Journey planning
Planning: Maps, Timetables, Collateral
myki auto top up growth 14.9%
CONNECTIONSPOPULATION
SAFETY
PATRONAGE
69 public railway crossings upgraded

Section 1 Year in review 13
1362 Special events supported
Metropolitan fare compliance95.3%
Metropolitan services cost recovery from fares 30%
Number of standard weekday services:Metropolitan29,414Regional5,534
ISO 9001:2015 accreditation for contract management and governance
Laptops deployed to enable more productive ways of working
57% of late night travellers useNight Network
300+ staff coached to lift achievement through clarity, feedback and accountability
Workforce diversity:
female 222
Passengers moved during major works disruptions6 million
OPERATIONS
OUR PEOPLE AND OUR SYSTEMS
$
male 282
14 Public Transport Victoria Annual Report 2017–18
Achievements this yearOne of the biggest challenges the Victorian Government now faces is population growth. Victoria’s population is predicted to more than double in the next 30 years and the bulk of this increase will happen in Melbourne.Melbourne is a globally connected and competitive city with strong and healthy communities. It also has higher levels of social and economic participation. For this to continue, the share of trips by public transport, as well as walking and cycling, must increase. Plan Melbourne 2014 indicates that, by 2050, Melbourne’s road and rail network will need to accommodate an extra 10.4 million daily trips, on top of the 14.2 million daily trips recorded in 20141. The Victorian Government aims to provide a productive, competitive and sustainable economy that contributes to a prosperous and inclusive society. To do this successfully, the government has significantly increased investment in transport.
1 Plan Melbourne 2017–2050; https://www.planmelbourne.vic.gov.au/__data/assets/pdf_file/0004/377113/Plan_Melbourne_2017_Outcome_3_PDF.pdf
The government aims to provide a well-designed transport network which meets people’s needs. It also aims to provide people with safe travel. PTV has a role to play in delivering this.PTV’s four outcomes support achieving the government’s objectives are:
– every Victorian can connect and participate – Victoria is prosperous and sustainable – every Victorian travels safely – delivering value and expertise.
Section 1 Year in review 15
Every Victorian can connect and participateAll Victorians benefit from accessible, reliable and connected public transport where services are regular and easy to use, timetables are integrated, interchanges are seamless and service information is available when and where it is needed. Transport is vital to creating a connected, inclusive, liveable community. For people to connect and participate, the whole journey experience is considered including the interface with other transport modes and associated technology.
Our objectivesEnsure the day-to-day passenger experience is reliable and consistent
Deliver a more inclusive transport network
Improve information to aid travel choices and assist passengers to keep moving during disruptions.
Better information for customers PTV has dramatically improved the quality and increased the availability of our data, enabling our passengers to remain updated through a period of great disruptions while the extensive program of infrastructure improvements is underway. Real time arrival and departure data for trains, trams and buses across metropolitan Melbourne, Geelong, Ballarat and Bendigo, is now provided through passenger information displays, our website, apps, and third-party products using our open data. On the electrified network, a significant milestone was reached this year with all train stations linked in to the real-time data connections.The PTV and myki websites remain our most popular passenger information channels. In 2017–18, more than 1.7 million users every month connected through the PTV website, totalling more than 45 million sessions over the year. Additionally, our apps were used by an average 714,000 users per month.
We are now working to integrate the PTV and myki websites into a single site to make it faster, more intuitive to use and more secure. With 65 per cent of users now connecting via mobile phones, the new site is designed for mobile browsers and will provide journey planning, timetable information, real time departures, disruption information and interactive mapping. The design and build of the new website is occurring as a staged project, with user testing an integral part of the process. The first phase was launched in May 2018 and full delivery is planned for mid 2019.The final site will also be accessible to the international Web Content Accessibility Guidelines 2.0 AA standard to make it easier to use for people with a disability, those with low literacy or those with English as a second language.Our new app is also set to launch in the second half of 2019 and will integrate myki services for a consistent experience across all our digital channels.In June 2018, the Night Network Facebook page was incorporated into a PTV page, giving customers another way to engage with us for news, event information, hints and tips and inspiration on travelling by public transport.In June 2018, the design of three animations to communicate information about the public transport network in Victoria to the culturally and linguistically diverse community (CALD) were finalised.The animations help diverse audiences learn about:
– getting started on public transport in Victoria – what ticket I need to travel on public transport
in Victoria – help when I’m travelling on public transport in Victoria.
Released on the PTV website, our YouTube channel and social media in early July, the animations are also being distributed by Victoria Police and through organisations that work with people who are new to Victoria and may have a language barrier.

16 Public Transport Victoria Annual Report 2017–18
Better accessibility for those who need it PTV is providing better access to our public transport services and support to those who need it. Nearly one in five Australians has a disability which is why work is continuing to make Victoria’s public transport network more accessible for passengers.In September 2017, the Public Transport Access Committee (PTAC) was extended by a further two years. The committee provides advice on accessibility for major transport infrastructure projects and works with PTV to make a more accessible public transport network for people with a disability, older persons and vulnerable groups. PTAC has reviewed each transport operator’s Accessibility Implementation Plan and provide independent input to help design accessible transport infrastructure. A range of infrastructure projects to improve accessibility in 2017–18 were delivered, including:
– installing new accessible toilets at Ashburton, Mt Waverley and Altona stations
– automation of accessible toilet doors at Camberwell, Caulfield, Essendon, South Yarra, Oakleigh and Richmond stations
– installing tactile ground surface indicators at Altona, Mt Waverley, Rushall, Windsor and Tooronga stations
– an interim upgrade of the lifts at Watergardens station – building 13 new bus stops and upgrading a further
174 to improve safety and accessibility – raised boarding pads at seven stations.
These projects support the delivery of the State Disability Plan 2017–2020 and work has commenced on developing the Accessible Public Transport in Victoria Action Plan 2018–2022.PTV joined with Guide Dogs Victoria as a charity partner to further raise awareness of accessibility in our community. Our staff volunteered at the 2018 Australian Grand Prix and celebrated International White Cane Day with Guide Dogs Victoria staff.
PTV continues to sponsor Dialogue in the Dark which allows participants to experience simulated environments in complete darkness. Through our support, Guide Dogs Australia was able to create a Dialogue in the Dark facility in Melbourne. The Dialogue in the Dark experience raises the awareness about some of the accessibility challenges faced by those who are either blind or low vision.Travelling in the Shoes of Others is a workshop aimed at giving transport partners the opportunity to experience travelling on the public transport network with a simulated visual or mobility impairment. In 2017–18, 233 staff participated in the workshop which encouraged them to consider what role they can play in their own work to help ensure that the public transport network is accessible to all.Accessibility advocacy groups are regularly engaged to provide feedback, advice and expertise on a range of public transport projects, programs and initiatives. These groups include: All Aboard, Guide Dogs Victoria, Vision Australia, Vicdeaf, Scope, Yooralla and Arthritis Victoria.PTV chairs an Accessible Public Transport Operators Committee (APTOC) to identify, discuss and resolve issues affecting accessibility. APTOC brings together public transport operators (including Metro Trains Melbourne, YarraTrams, V/ Line and bus operators) and other key transport contributors.The annual Try Before You Ride event which gives people of all abilities the opportunity to engage with the public transport system in a safe, informative and non-threatening way was hosted again in 2017–18. Participants experienced getting on and off different vehicles when they are not moving, which aims to boost participants’ confidence and remove a significant barrier to accessing public transport.In addition, all PTV Hubs and the call centre were accredited with the Scope Communication Access Symbol enabling staff to communicate more successfully with people who experience communication difficulties. Passenger information displays, automated and manual announcements continued to be rolled out across the network.

Section 1 Year in review 17
Government commitment PTV
Project and descriptionTotal project budget* ($million) Activity Complete
Bayside rail improvements: Station upgrades to improve shelters, enhance passenger information and disability access, as well as infrastructure enhancements on the Frankston line and upgrades to support deployment of X’Trapolis trains on the Frankston, Werribee and Williamstown lines.
115 Full scope 2018–19
E-Class Trams – Stage 1: Purchase of 50 new high capacity, low-floor trams and investment in supporting infrastructure, including upgrading Preston tram workshops into a tram depot and power supply upgrade.
804.5 Enabling scope: Infrastructure works 2019–20
E-Class Trams – Stage 2: Purchase of 20 new high capacity, low-floor trams and investment in supporting infrastructure including power infrastructure and works to extend the life of existing B-Class trams.
280.2 Enabling scope: Infrastructure works 2019–20
E-Class Trams – Stage 3: Purchase of 10 new high capacity, low-floor trams and investment in supporting infrastructure including power supply, bridge strengthening and associated works.
215.5 Enabling scope: Infrastructure works 2021–22
Flinders Street Station redevelopment: Heritage refurbishment works to repair the building’s exterior and clock tower and repair roofing. Works to enhance amenities including upgrading platforms and entrances to ease passenger crowding, refurbishing toilets and installing new information displays.
100Partial scope: Customer experience improvements
2018–19
Improving public transport accessibility: Oakleigh station upgrade with a new lift and re-grading of ramps; Middle Park tram stop upgrade to an easy access stop.
11.3 Partial scope: Middle Park tram stop 2018–19
Road and rail minor works: Road and public transport initiatives will be delivered to improve and maintain Victoria’s roads and ensure accessible public transport for all Victorians including regional rail and bus projects to improve access, security, car parking and passenger experience at railway stations and bus/coach stops.
28.9 Partial scope: Rail works ✔
Road and rail minor works fund: Road and public transport initiatives will improve and maintain Victoria’s roads and ensure accessible public transport for all Victorians including public transport accessibility upgrades.
43.8 Partial scope: Rail works ✔
* Note: Total project budget is as published in State Budget Papers. Some projects have multiple delivery agencies, hence PTV will only have accountability for part of the total estimated investment.
Table 1.1: Key projects 2017–18

18 Public Transport Victoria Annual Report 2017–18
MeasureUnit of
measure2017–18
actual2017–18
targetPerformance variation (%) Result1
Customer satisfaction index: metropolitan bus score 77 77 0.0 ✔
Customer satisfaction index: metropolitan train score 74 73 0.8 ✔
Customer satisfaction index: tram score 77 76 0.8 ✔
Customer satisfaction index: regional train score 75 78 (3.7) ¡
Customer satisfaction index: coach score 82 84 (2.0) ¡
1 ✔ Performance target achieved or exceeded. ¡ Performance target not achieved – within 5 per cent variance. n Performance target not achieved – exceeds 5 per cent variation.
Table 1.2: Performance

Section 1 Year in review 19
Victoria is prosperous and sustainableTransport is a critical lever for Victoria’s prosperity. Investment in transport infrastructure and the expenditure on transport operations generates broad and positive benefits across the economy. Public transport that is efficient, resilient and sustainable supports Victoria’s social, environmental and economic growth and development.
Our objectivesImprove network performance and coordinate network service changes
Ensure Victoria receives value for money from service contracts
Maintain and improve network assets and align capital investments with network requirements.
Managing disruptions and special events PTV leads the preparation, response and recovery of the transport sector for major planned and unplanned disruptions to normal public transport services. Unplanned disruptions can result from a range of issues including extreme weather, accidents or infrastructure or rolling stock failures. Planned events, such as project works, rail upgrades or the removal of level crossings can also disrupt services.Key priorities during a major disruption are passenger safety, ensuring consistent and accurate information, and the return to full services as fast as possible.During 2017–18, preparation activities included attending quarterly meetings of the Public Transport Coordination Group, delivering Exercise Chimera in March 2018 to test the State Public Transport Disruption Sub Plan, and leading an expert panel to review the Public Transport Emergency Management Plans.Major disruptions during 2017–18 included the Metro control system failure which stopped all trains for over an hour during an afternoon peak in July. There were severe storms and flash flooding in November and December 2017, protests and police operations, and a fire at Terang which closed 3 kilometres of the Warrnambool line for a week during the summer.
On each occasion the focus was on safety and updating customers quickly and accurately, so they could make informed decisions about their travel while operators worked to return to full services. We worked to understand each event to see what could be done to prevent something similar in future, and to enable us to respond even more effectively next time.
Planned disruptionsPTV ensured the disruptions for major public transport projects during 2017–18 were planned and delivered effectively with a focus on good passenger outcomes, including Level Crossing Removals, preparing for the introduction of High Capacity Metro Trains, Metro Tunnel works on St Kilda Road and the Richmond—Camberwell signal upgrade project for Metro Trains Melbourne. During 2017–18, six new stations were built, and 14 level crossings were removed. To allow for these works, passengers took 6 million trips on replacement buses, up from 1.7 million in 2016–17. Of these 6 million trips, 5.4 million took place from January to June 2018. Additional disruptions happened as Metro Trains and Yarra Trams maintained or renewed the assets. PTV also coordinated disruption management on St Kilda Road:
– for 12 days in July 2017 to re-route the Route 58 service
– for 17 days in April 2018 while Route 58 service was realigned, and space was created to build the new ANZAC Station for Metro Tunnel.
Special eventsPublic transport is increasingly relied upon to support many special events. PTV planned for 1,362 special events during 2017–18, 200 more than last year and operators ran an extra 22,716 services.The AFL Grand Final generated a significantly greater demand than previous years on the public transport network, with extra events staged at Punt Oval and the post Grand Final closure of Swan Street for Premiership celebrations which disrupted tram services.
20 Public Transport Victoria Annual Report 2017–18
Some other key public events included: – Commonwealth Games Queens Baton Relay events – Royal Melbourne Show – New Year’s Eve – Cadel Evans Great Ocean Road Race – St Kilda Festival – White Night Melbourne and Ballarat
Additional services and public transport support were provided for Melbourne’s major annual sporting events including the Australian Open, Australian Grand Prix, the Spring Racing Carnival including the Melbourne Cup, cricket season including the Boxing Day Test, the AFL, NRL and A-League seasons and a host of fun runs.
Delivering better value through new contractsThe Victorian Government’s new seven-year contractual arrangements with Melbourne’s train and tram operators started on 30 November 2017. PTV manages the contracts with Metro Trains Melbourne (Metro Trains) and Keolis Downer (Yarra Trams).The new contracts set significantly higher standards for the operators, with higher performance targets and increased penalties for not meeting them.The contracts raise the bar for on-time services, service delivery, passenger experience, maintenance and renewal activity, and accessibility. A greater emphasis is placed on timely, accurate and more user-focused information for passengers. Passenger experience will also be improved through greater restrictions placed on advertising on trains and trams and at stations and stops.To reduce the number of faults in the system, investment in maintenance and renewal of the network infrastructure will increase 37 per cent.For the first time, Metro Trains will face a $10 million penalty if it fails to achieve new higher maintenance standards in the first 2.5 years of the contract. Additionally, if a network failure results in more than 50 per cent of services cancelled or delayed by 30 minutes or more within a 2-hour period, Metro Trains will pay a penalty of up to $700,000.
Meanwhile, the Victorian Government has now signed new contracts with all 12 metropolitan bus operators whose services cover about 70 per cent of the metropolitan bus network. The contracts commenced on 1 July or 1 August 2018. Bus operators were given a choice of contract term options and were able to choose the one that best suited the needs of their business.The contracts provide more flexibility to improve and expand services where they are needed most, paving the way for more attractive services that boost patronage on the network. There is now greater consistency across train, tram and bus contracts, with financial incentives and penalties tied to on-time running to provide passengers with a more professional, reliable service.
Investing in greener tramsMelbourne’s trams will be powered by solar energy in a landmark new project launched this year.Construction is underway on new large-scale solar plants in regional Victoria, near Robinvale and Shepparton as part of the Victorian Government’s $146 million Renewable Energy Action Plan.Around 35 megawatts of the generation capacity from the new solar projects will be linked to Melbourne’s tram network which is enough to power 410 Melbourne trams. The Victorian Government will voluntarily surrender renewable energy certificates matching the amount of electricity used by all Melbourne’s trams.This will reduce Victoria’s greenhouse gas emissions by more than 80,000 tonnes each year and helps Victoria to meet its target of net-zero emissions by 2050.

Section 1 Year in review 21
Table 1.3: Key projects 2017–18
Government commitment PTV
Project and descriptionTotal project budget*
($million) Activity Complete
More train, tram and bus services: Works to improve bus journeys and bus stop safety. 9.7 Full scope 2018–19
Huntingdale Station bus interchange and car parking project: A new bus interchange at Huntingdale Station is improving safety and connectivity, providing a gateway to Monash University, the Clayton Innovation Precinct and Monash Employment Cluster. Monash University contributed to the project’s cost. New car parking at Huntingdale Station supports train services to the city.
11.5 Full scope ✔
Major periodic maintenance on the regional rail network: High priority major periodic maintenance works on the regional rail network to replace network critical assets that affect passenger and freight services.
287.9 Full scope 2020–21
Metropolitan rail infrastructure renewal program: Incorporates all capital funding for metropolitan rail infrastructure renewals from 2016–17 to 2024–25, including funding provided in the 2017–18 Budget Update for the management of the new train and tram franchise agreements that commenced on 30 November 2017.
1,588.3 Full scope 2024–25
Rolling Stock Cascade: Infrastructure works to support new trains on the Cranbourne—Pakenham rail corridor will also free up existing trains to meet demand on other lines
55.0 Full scope 2019–20
Southland Railway Station: A new railway station at Southland Shopping Centre on the Frankston rail line to improve accessibility to the Southland Principal Activity Area.
25.9 Full scope ✔
Fishermans Bend public transport connections: Additional morning and evening peak time services on bus routes 235 and 237. ongoing Full scope ongoing
Ongoing delivery of Night Network: Night Network to provide 24–hour weekend public transport in metropolitan Melbourne and to select regional locations.
ongoing Full scope ongoing
Shepparton Line Upgrade and additional services: New train stabling and a crossing loop to allow for additional train services from January 2020. In the meantime, an additional weekday and two daily coach services will connect Shepparton and Seymour.
ongoing Partial scope – Services ongoing
* Note: Total project budget is as published in State Budget Papers. Some projects have multiple delivery agencies, hence PTV will only have accountability for part of the total estimated investment.

22 Public Transport Victoria Annual Report 2017–18
Table 1.4: Performance
MeasureUnit of
measure2017–18
actual2017–18
targetPerformance variation (%) Result1
Service punctuality: metropolitan bus per cent 80.8 82 (1.5) ¡
Service punctuality: metropolitan train per cent 91.9 92.5 (0.6) ¡
Service punctuality: tram per cent 81.7 82.9 (1.5) ¡
Service punctuality: regional bus per cent 94.1 92 2.3 ✔
Service punctuality: regional train per cent 83.9 92 (8.8) n
Due to infrastructure faults, train faults and heat related speed restrictions. Long-distance regional trains are considered on time if they arrive no more than 10 minutes and 59 seconds late at their destination. Short-distance regional trains are considered on time if they arrive no more than five minutes and 59 seconds late at their destination.
Scheduled services delivered: metropolitan bus per cent 99.9 99.9 0 ✔
Scheduled services delivered: metropolitan train per cent 98.8 99 (0.2) ¡
Scheduled services delivered: tram per cent 98.5 99.2 (0.7) ¡
Scheduled services delivered: regional bus per cent 100 99 1.0 ✔
Scheduled services delivered: regional train per cent 97 98.5 (1.5) ¡
1 ✔ Performance target achieved or exceeded. ¡ Performance target not achieved – within 5 per cent variance. n Performance target not achieved – exceeds 5 per cent variation.

Section 1 Year in review 23
Every Victorian travels safelyA safe network is at the core of the transport service. People expect that when they use Victoria’s transport services they will be safe throughout their journey. People who build the network and support service delivery must be safe at work. And, people’s perception of safety and personal security effects their willingness to use public transport services.
Our objectivesImprove safety and security of the network
Ensure personal security on the public transport network.
Improving safety for all VictoriansWork continued to improve the safety of the public transport network for the benefit of all Victorians during 2017–18.Passengers are benefitting from safer, more reliable train services with upgrades to 22 level crossings on the Warrnambool line connecting to Geelong. The works were completed in December 2017 and all 22 crossings now have boom gates, bells, flashing lights and axle counters.The upgrades have also improved journey times by enabling the removal of temporary speed restrictions instigated in October 2016 when a truck hit a train a Phalps Road in Pirron Yallock. The crossings upgrades were part of the $50 million Safer Country Crossings Program, with an extra $10 million invested following the incident.A new entrance to Flinders Street Station from Riverside Walk to platform 10 was also constructed in 2017–18 to help reduce pedestrian congestion in the Elizabeth underpass. A range of safety initiatives across the metropolitan train and tram network were delivered including:
– raised boarding pads at seven stations – ten shelters at assisted boarding waiting spaces – tactile ground surface indicators improvements
at five stations – safety zone marking at 14 platforms between
Camberwell to Box Hill stations.
Work also started on the second stage of upgrades to safety and security in the 32-year-old City Loop. The $152 million investment will install better trespasser detection, a smoke management system and upgrade sprinkler systems in the four underground tunnels and three underground stationsA new alarm system will also improve reliability and reduce delays for passengers in the City Loop, with an additional 240 closed circuit television cameras and immediate notifications to train operators in the event of a trespasser on the tracks. The project will be completed by the end of 2019.PTV maintains 25,285 route bus stops across Victoria and continually works to improve safety. During 2017–18, 13 new bus stops were built and a further 174 bus stops were upgraded to improve safety and accessibility. In addition, 166 new glass bus shelters were installed and 38 funding grants to third parties to upgrade bus stops and install shelters were provided.PTV joined other Victorian public transport operators in the annual Try Before You Ride event, designed to give people of all abilities the opportunity to familiarise themselves with our public transport system. People with a disability, parents with children and seniors had access to a range of stationary vehicles to boost their confidence getting on and off a tram, bus, train coach and an accessible taxi. This increased confidence means people can participate more safely and contributes to a more connected community.

24 Public Transport Victoria Annual Report 2017–18
Government commitment PTV
Project and descriptionTotal project budget*
($million) Activity Complete
Bus package: Infrastructure works to improve journey experiences and safety at bus stops. 20.2 Full scope 2018–19
City Loop fire and safety upgrade – Stage 1: Fire and emergency equipment upgrades in the Melbourne Underground Rail City Loop, including to water hydrants, emergency lighting, fire detection systems and automation for power shutdown as well as improvements to escalators and platform announcements.
43.2 Full scope ✔
City Loop fire and safety upgrade – Stage 2 (including intruder alarm): New smoke management and fire sprinkler systems installed at Melbourne Central, Flagstaff and Parliament stations, as well as a new intruder detection and alarm system in the City Loop.
151.7 Full scope 2019–20
Enhancing safety on the train network: Expansion of the Train Protection Warning System for compatibility between V/Line and metropolitan trains to improve passenger safety and train reliability, as well as works to reduce platform gaps at priority train stations.
60.6 Full scope 2020–21
Railway crossing upgrade: A continuing program of regional rail crossing upgrades. 42.8 Full scope 2021–22
Safer Country Crossings Program: Regional level crossing safety improvements, with 52 high-risk country level crossings upgraded to add boom gates to flashing lights. In addition, 25 high-risk regional passive rail pedestrian crossings will be upgraded with automatic gates and latches on emergency escape gates for pedestrian safety.
43.3 Full scope 2018–19
Warrnambool Line Level Crossings Upgrade: A further 13 road level crossings on the Warrnambool railway line will be upgraded to enable the removal of current temporary speed restrictions.
9.7 Full scope ✔
* Note: Total project budget is as published in State Budget Papers. Some projects have multiple delivery agencies, hence PTV will only have accountability for part of the total estimated investment.
Table 1.5: Key projects 2017–18
MeasureUnit of
measure2017–18
actual2017–18
targetPerformance variation (%) Result1
Passenger injury per scheduled (million) km number 36.6 38.5 5.0 ✔
1 ✔ Performance target achieved or exceeded. ¡ Performance target not achieved – within 5 per cent variance. n Performance target not achieved – exceeds 5 per cent variation
Table 1.6: Performance

Section 1 Year in review 25
Delivering value and expertise for VictoriansThe Victorian government and the community have confidence that PTV delivers effective and efficient services for Victorians. PTV is committed to delivering value to Victorians through good governance, integrity, planning and risk management. We will do this by developing strong relations with community leaders, by working closely with our colleagues across government to deliver government policies and through developing our people and systems to ensure service excellence.
Our objectivesCollaborating with Transport for Victoria and portfolio agencies to develop the transport business of the future, through:
– delivering for government – capability, culture and service excellence – collaboration and partnerships.
Oversight of public transport network integrityPTV is driving better customer and community outcomes through tangible improvements to the way we manage the integrity of the public transport network.It is vital that our existing network is ready to integrate the major infrastructure program being delivered across Victoria, and that the projects meet our network requirements.In the last financial year, we’ve seen a major capability uplift, especially in engineering, technical safety, assurance, and asset management. PTV is better resourced, enabling us to more effectively meet our obligation to:
– ensure an accessible public transport network that is functionally effective, reliable, maintainable, secure, safe and environmentally compatible as it evolves through future investment
– ensure capital programs are aligned to network requirements and standards
– ensure the readiness of the operating environment to implement investments onto the network.
This capability has enabled PTV to improve the management and oversight of network integrity risks, including establishing and supporting Transport for Victoria’s network integrity governance framework.PTV is also replacing the industry-written network technical standards with a modern, robust and formally-managed set of technical standards, including ensuring our rail operators establish appropriately controlled engineering standards.This is complemented by the establishment of a formal standards governance process within the new train and tram franchise agreements. As part of this process, a governance group including senior representatives of PTV, Metro Trains and Yarra Trams was set up in January 2018. This group will review and approve changes to network standards, any proposed new standards and any processes to be adopted relating to the assessment or acceptance of any non-compliances with a standard.
Showcasing Melbourne’s public transport to the worldMelbourne successfully bid to host the world’s biggest public transport event, the Union International des Transports Publics (UITP) Global Public Transport Summit in 2021. The summit will host some of the brightest minds in transport from around the world and showcase Melbourne’s transport transformation.The UITP Global Public Transport Summit is held every two years and has operated for more than 130 years, with Melbourne’s success marking the first time the event will visit the southern hemisphere in 28 years.The bid – which took several years – was a collaborative effort between Transport for Victoria, Public Transport Victoria, the Melbourne Convention Bureau and the Melbourne Convention and Exhibition Centre on behalf of the Victorian Government. Melbourne was selected ahead of other shortlisted cities including Hamburg and Moscow.The Melbourne 2021 Summit will be held from 6–9 June 2021 at the Melbourne Convention and Exhibition Centre. It is the world’s biggest event dedicated to sustainable mobility and provides opportunities develop new partnerships, investments and innovative projects.It is expected to generate $9.4 million in economic activity for Victoria.

26 Public Transport Victoria Annual Report 2017–18
The most recent UITP Global Public Transport Summit was held in Montreal in 2017 attracting more than 2,500 delegates and their partners from 84 countries, including study tours across North America.The 2021 Global Public Transport Summit will provide a 3-year pathway for Melbourne to build engagement with the wider transport sector on a global scale, providing better opportunities to attract investment and expertise during a time of unprecedented transformation for Victoria’s transport network.
Expertise in public transport PTV is working to broaden its expertise in public transport, including with international partners. This year, a PTV staff member spent time working with Transport for London, and we hosted one of their staff in Melbourne.While the size of our public transport systems differ, Melbourne and London operate similar transport infrastructure and both cities are transforming their systems with the same challenge of merging old with the new.In 2017–18, PTV also participated in the GEN44 program run by the Level Crossing Removal Authority and designed to provide a pipeline of diverse graduates ready for rail and transport careers. PTV hosted four new graduates in 12-week paid internships as part of the program, which will offer 200 graduate placements over the next 5 years with PTV and other partners, including Metro Trains, Yarra Trams, V/Line and the Rail Projects Victoria.Two of PTV’s four interns were engineering students and the other two were law students. The internships provide paid work experience to graduates from marginalised backgrounds. PTV has subsequently employed two of the interns.
Expertise in public transport dataThe ability to analyse Victoria’s public transport data took a big leap forward in 2017–18. The Data Analytics Platform (DAP) gives PTV better insights into the causes of disruption and their impacts on passengers. This information will help PTV work out the best action to take to address those causes and how effective those actions are.The power of DAP comes from an evidence-based understanding of what is happening on the network, rather than relying on assumptions. DAP will help us inform decision makers across the transport network — from service planners and policy makers, to public transport operators, researchers and the public. It will enable integration of information from across the network to develop a holistic view of performance, bringing together patronage, performance and customer satisfaction information.This increased ability to interpret data will allow PTV and the Victorian Government to invest money where it will generate the greater positive impact and help minimise the impact of disruptions on customers.DAP is already monitoring the performance of more than 7.5 million services each year on the metropolitan bus network as part of the new contracts and the regional bus network.In the past, only a month’s worth of data could be formulated because the process was largely manual. PTV aims to be transparent and open with the new data available and will share it across the Victorian Government and provide information to local councils.We will continue to develop the DAP platform in the next few years to provide more accurate and timely digital information to our partners and customers.

Section 1 Year in review 27
Table 1.7: Key projects 2017–18
Project and description Complete
ONBOARD 2020: is a three-year transformation program integrating projects that improve capability and deliver better tools, processes and culture for PTV and our people. 2020–21
Health and Safety plan implementation: PTV’s internal occupational health and safety (OHS) management system was reviewed in July 2017. This mapped PTV’s health and safety legislative obligations against the OHS management system. An action plan was developed, focusing on making sure PTV is taking all reasonable steps to comply with its health and safety obligations. The plan included:– developing a safety and wellbeing policy and strategy (completed)– re-establishing the safety and wellbeing committee including election of Health and Safety Representatives
and Management Representatives (completed)– developing safety and wellbeing incident reporting framework including establishing targets and
key performance measures (completed)– reviewing existing policies and procedures, including the development of an incident management
procedure (completed).
ongoing
Table 1.8: Performance
MeasureUnit of
measure2017–18
actual2017–18
targetPerformance variation (%) Result1
Employee engagement per cent 66.2 65 1.8 ✔
1 ✔ Performance target achieved or exceeded. ¡ Performance target not achieved – within 5 per cent variance. n Performance target not achieved – exceeds 5 per cent variation
28 Public Transport Victoria Annual Report 2017–18
Organisation changesPTV did not have any major organisational change or any changes to objectives or output structure during 2017–18. However, to more efficiently deliver against the objectives, PTV implemented changes to better align resources to functions. From 1 July 2018, PTV chief executive Jeroen Weimar was appointed Chair of the V/Line Board in addition to his PTV responsibilities.
Direct costs attributable to machinery of government changesThere were no direct costs to PTV that were attributable to machinery of government changes in 2017–18.

Section 1 Year in review 29
PTV’s current year financial reviewOverviewThe financial statements presented later in this report are prepared in accordance with the Financial Management Act 1994 and applicable Australian accounting standards.The table below shows PTV’s five-year financial summary.
2018 2017 2016 2015 2014
Group* $M Group* $M Group* $M Group* $M Group* $M
Grants from government 4,784.8 4,304.4 4,080.0 3,868.9 4,048.0
Total income from transactions 5,176.6 4,634.9 4,396.9 4,127.9 4,134.9
Total expenses from transactions (5,099.2) (4,669.7) (4,450.9) (4,152.2) (4,166.1)
Net result from transactions 77.4 (34.9) (53.9) (24.3) (31.2)
Total other economic flows included in net results (4.8) 0.4 (0.9) (45.7) (0.3)
Net results 72.6 (34.4) (54.9) (70.0) (31.5)
Net cash flows from/(used in) operating activities 334.8 95.9 22.9 (17.6) 29.9
Total assets 1,990.8 1,958.5 2,000.3 2,060.0 1,757.3
Total liabilities (1,500.5) (1,423.6) (1,499.6) (1,504.2) (1,330.3)
Net assets 490.3 534.8 500.7 555.8 427.0
*The group result relates to the financial information of PTV and Franchise Asset Holdings.
The 2017–18 Annual Report includes PTV’s sixth full year financial statements. This year’s statements include Franchise Asset Holdings Pty Ltd (AssetCo), an entity established as a result of the bus franchise arrangements with Transdev. As a controlled entity, AssetCo financial information has been consolidated with PTV and is represented in the financial statements.
As a Victorian Government agency, PTV is fully-funded for its operating and capital expenditure, therefore the net operating result will reflect accounting transactions that do not require government funding and where revenue has been received but has been used for capital purposes. For 2017–18, the net result was a profit of $73 million which reflects operating funding received for capital purposes ($130 million), offset by expenses that are not funded by government ($60 million).

30 Public Transport Victoria Annual Report 2017–18
Financial performance – operating statementPTV’s income is primarily sourced from Victorian Government grants, share of fare receipts, licence fees from advertising panels at bus shelters, myki card sales and contributions from the operators for marketing and communications. The increase of $542 million since the prior year is mostly a result of increased grants required to fund increased operating expenditure, in addition to increased fare receipts.PTV’s total operating expenses in 2017–18 were $5.1 billion. The majority of PTV’s expenditure was for payments to the transport service providers including $1.4 billion for metropolitan and regional train services, $0.3 billion for metropolitan tram services, $2 billion for the government’s capital assets charge for rail infrastructure and $1.0 billion for bus services. The increase in total expenses of $429 million is mostly due to the new rail contracts, which provide increased services and improved performance.
Financial position – balance sheetTotal assets increased by $32 million over the year to $1.99 billion, mainly due to an increase in prepayment of $41 million for operator’s maintenance and renewal works. This was partially offset by a decrease in myki card inventory of $9 million. Total liability increased by $77 million to $1.5 billion mainly due to an increase in the deposits repayable to the operators of $125 million, partially offset by the reduction in project cost accruals of $42 million.
Cash flowsThe cash balance was $36 million at 30 June 2018, representing an increase of $1 million compared to the previous year. Net cash inflows from operating activities increased by $239 million compared to the prior year due to additional cash funding received from the Department of Economic Development, Jobs, Transport and Resources (DEDJTR), additional farebox receipts and GST recovered from the Australian Taxation Office (ATO). This was partially offset by an increase in the payments to transport agencies and service providers.
Net cash outflows for investing activities decreased by $252 million and net cash inflows from financing activities decreased by $500 million. Decreases are predominantly due to the transfer of projects to Transport for Victoria, which resulted in lower spend on capital expenditure and therefore lower capital funding required from DEDJTR.
Capital expenditure
PTV’s capital expenditure for 2017–18 was approximately $0.5 billion on major projects, including network renewal and franchisee projects, E-Class trams and supporting infrastructure, city loop fire and safety upgrade, safer country crossings program, railway crossing upgrades, rolling stock cascade and supporting infrastructure, V/Line wheel-wear management, Flinders Street station precinct, bayside rail improvement project and Huntingdale station bus interchange project.Rail assets created by PTV’s capital expenditure are transferred by way of equity (refer to note 4.2.1 to the financial statements) to VicTrack as the entity responsible for reporting the State’s transport infrastructure network.
Subsequent eventsThe Metropolitan Bus Services Contracts expired on 30 June 2018. New contracts were signed with three of the operators of metropolitan buses prior to 30 June 2018. The remaining contracts were signed by 31 July 2018.Jeroen Weimar, Chief Executive of PTV, has been appointed as Chair of the V/Line Board from 1 July 2018. Jeroen will remain Chief Executive of PTV, however to ensure that he has the time to devote to V/Line, Alan Fedda has been appointed to a new position of Deputy Chief Executive of PTV to cover some of Jeroen’s day-to-day responsibilities.

Section 1 Year in review 31

32 Public Transport Victoria Annual Report 2017–18

Section 2 Governance and organisational structure 33
Section 2Governance and organisational structure
Organisation structure 34
Governance committees 36
Occupational health and safety 38
Employment and conduct principles 41

34 Public Transport Victoria Annual Report 2017–18
Organisation structurePTV’s MinisterMinister for Public TransportThe Hon. Jacinta Allan MP was appointed as the Minister for Public Transport in December 2014. She is also the Minister for Major Projects and Leader of the House (Assembly).The Minister for Public Transport oversees the delivery of public transport in Victoria.
PTV’s division responsibilitiesCustomer ServicesDeliver services that are easy to access, use and understand so our customers can get to where they want to go.
– customer information, marketing and digital – media and communications – ticketing services – retail
Franchise Operator ManagementManage the franchisee and service contracts to extract the maximum benefits.
– contract management – franchise governance and risk – asset performance analysis – commercial analysis – asset configuration and drawings
Corporate ServicesProvide professional services to enable an agile, efficient and engaged PTV.
– information and communication technology – corporate operations – financial management – governance and legal – accessibility advice and assurance – human resource management – procurement
Network Integrity, Projects and AssuranceImprove systems and service resilience through prudent asset management, standards and assurance.
– technical services – asset management – project delivery – program monitoring and performance – network integrity assurance
Network Service DeliveryOversee the public transport network’s day-to-day operations.
– overseeing service delivery – assuring readiness for special events – emergency management – implementing service changes – network performance reporting and analysis
Office of Chief Executive OfficerInterface between the Chief Executive and key portfolio stakeholders including the Minister’s office
– ministerial services – stakeholder management

Section 2 Governance and organisational structure 35
Jeroen WeimarChief Executive
Fred CiliaChief Financial Officer
Len NiestChief Engineer
Edward ByrdenDirector, Governance
and Legal
Laura Lo Bianco–Smith/ Dean Purkis
Executive Director (Job share)
Network Service Delivery
Alan FeddaExecutive Director
Franchise Operator Management
Note: Anita Livshiz was Acting Executive Director Franchise Operator Management on 30 June 2018.
PTV’s senior executivesPTV’s organisation structure as at 30 June 2018:
Marika HarveyDirector
Office of the Chief Executive Officer
Dean TillotsonExecutive DirectorCorporate Services
Michael ChadwickExecutive Director
Network Integrity, Projects and Assurance
Fiona AdamsonExecutive DirectorCustomer Service
Note: Philip Askew was Acting Executive Director Customer Service on 30 June 2018.

36 Public Transport Victoria Annual Report 2017–18
Governance committeesThe Chief Executive is accountable for PTV performance and responsible for managing its affairs.
PTV Executive BoardThe Executive Board was established as a senior advisory body that makes recommendations to the Chief Executive on the exercise of a power, duty or function of PTV under the Transport Integration Act 2010 or any other Act, regulation or direction.Members include all Executive direct reports to the Chief Executive. The Executive Board meets monthly.The Executive Board is:
– accountable for setting PTV’s internal governance controls
– responsible for making recommendations to the Chief Executive on the exercise of a power, duty or function of PTV under the Transport Integration Act 2010 or any other Act, regulation or direction.
Audit, Safety, Risk and Assurance CommitteeThe PTV Chief Executive established the Audit, Safety, Risk and Assurance Committee as an independent committee of PTV. The purpose of the committee is to provide independent assurance to the Chief Executive on PTV’s financial and performance reporting responsibilities, safety, risk oversight and management, and systems of internal control.The committee consists of at least three and no more than five members all of whom are non-executive members (independent). ASRAC has authority to have direct access to the Chief Executive to discuss any matters it deems necessary. The committee reports to the Chief Executive and does not have any executive powers to commit the Chief Executive or PTV or management generally.The functions of the committee are to:
– provide oversight of financial reporting, performance reporting, systems of risk oversight and management, systems of internal control and the internal audit function
– review and approve PTV’s annual Standing Directions compliance report, internal audit charter, strategic internal audit plan, annual audit work program and scope documents for internal audits
– periodically review PTV’s governance arrangements as determined by the Chief Executive.

Section 2 Governance and organisational structure 37
Audit, Safety, Risk and Assurance Committee membership and rolesThe Audit, Safety, Risk and Assurance Committee membership consists of the following members:
– Doug Bartley, Chairman (independent member) – Gaye Mason, (independent member) – Eric Mayne, (independent member).
Mr Mayne has since resigned from this position. His last meeting was at an Audit, Safety, Risk and Assurance Committee briefing session, on Monday 21 May 2018.As of 30 June 2018, PTV’s Chief Executive was in the process of recruiting two more independent members.
Table 2.1: Audit, Safety, Risk and Assurance Committee attendance 2017–18
Committee Member
Audit, Safety, Risk and Assurance Committee
Attended Maximum possible
Doug Bartley 7 7
Gaye Mason 7 7
Eric Mayne 6 7

38 Public Transport Victoria Annual Report 2017–18
Occupational health and safetyPTV’s health, safety and wellbeing vision is to build a healthy and safe environment where employees are mentally and physically safe and healthy. During July 2017, a review of PTV’s health and safety legislative obligations against the current health, safety and wellbeing management system was completed, highlighting several opportunities for improvement. A detailed action plan was implemented across the business aimed at enhancing health, safety and wellbeing performance and ensuring safe systems of work. During the 2017–18 financial year, a number of initiatives were implemented to improve the health, safety and wellbeing of staff including:
– the introduction of a new health and wellbeing service provider
– delivering PTV’s vaccination program – rail industry worker medical and employee
assistance programs – ergonomic workstation education and assessments – online induction and refresher training.
The PTV Board also endorsed the Health, Safety and Wellbeing Strategy (2018–2021) which provides a clear pathway to achieving PTV’s vision by focusing on building a safe, respectful and healthy workplace.
Incident managementIncidents per 100 full-time equivalent (FTE) staff across PTV increased by over 400 per cent in 2017–18, up from seven to 38. However this is still significantly below the average of about 200 incidents in similar organisations. Incidents include injuries, near misses and identified workplace hazards. While reported incidents were up, the number of incidents which resulted in injury also increased from three in 2016–17 to 17 in 2017–18.
Incidents
05
10
15
20
25
30
3540
2015–16 2016–17 2017–18
Incidents 12 7 38
Rate per 100 FTE 2.16 1.52 7.8
Incidents Rate per 100 FTE
The increase was driven by the renewed focused on incident reporting, a new reporting procedure and an increased awareness of reporting, which significantly increased reporting across PTV.There was one notifiable incident that occurred at PTV. Notifiable incidents are those which require the Health and Safety Regulator to be notified when they occur.

Section 2 Governance and organisational structure 39
WorkCover claims The total number of WorkCover claims lodged increased by six in 2017–18. The number of standard claims rose by two in 2017–18. This was predicted due to the renewed focused on incident reporting. To address the increase in the number of claims, PTV introduced a number of proactive programs that focus on good posture, reducing sprains and strains and early intervention practices. The average cost per claim decreased from $48,866 to $43,803.
Standard Claims
0
0.5
1.0
1.5
2.0
2.5
3.0
2015–16 2016–17 2017–18
Standard Claims 3 1 3
Rate per 100 FTE 0.64 0.21 0.62
Standard Claims Rate per 100 FTE
Claims Exceeding 13 weeks
0
0.5
1.0
1.5
2.0
2015–16 2016–17 2017–18
Claims > 13 weeks 2 1 2
Rate per 100 FTE 0.36 0.22 0.41
Claims > 13 weeks Rate per 100 FTE
Lost Time Injury Claims
01
2
3
4
5
6
78
2015–16 2016–17 2017–18
Lost Time Injury Claims 1 0 7
Rate per 100 FTE 0.21 0 1.44
Lost Time Injury Claims Rate per 100 FTE
WorkCover premium PTV’s WorkCover premium decreased in 2017–18. This is due to the improvement in PTV’s injury management practices and the adoption of early intervention practices.

40 Public Transport Victoria Annual Report 2017–18
Table 2.2: PTV’s performance against OHS management measures
Measure 2015–16 2016–17 2017–18(vi)
Incidents
No. of reported incidents 12 7 38
Rate per 100 FTE 2.16 1.52 7.80
No. of incidents requiring first aid and or further medical treatment n/a 3 17
Claims(i)
No. of standard claims(ii) 3 1 3
Rate per 100 FTE 0.64 0.21(v) 0.62
No. of claims exceeding 13 weeks(iii) 2 1 2
Rate per 100 FTE 0.36 0.22 0.41
No. of lost time injury claims (iv) 1 0 7
Rate per 100 FTE 0.21 0 1.44
Fatalities
Fatality claims 0 0 0
Claim costs(i)
Average cost per standard claim $22,675 $48,866 $45,730
Return to work
Percentage of claims with RTW plan <30 days – – –
Management commitment
Evidence of OHS policy statement, OHS objectives, regular reporting to senior management of OHS, and OHS plans (signed by CEO or equivalent) completed completed completed
Evidence of OHS criteria in purchasing guidelines (including goods, services and personnel) completed completed completed
Consultation and participation
Evidence of agreed structure of designated workgroups (DWGs), health and safety representatives (HSRs), and issue resolution procedures (IRPs) completed partially
completed completed
Compliance with agreed structure on DWGs, HSRs, and IRPs completed partially completed completed
Risk management
Percentage of issues identified actioned arising from:
– Internal audits 100% 100% 87%
– HSR improvement notices – – –
– WorkSafe Notice – – –
No. of Improvement Notices issued across PTV by WorkSafe Inspector – – –

Section 2 Governance and organisational structure 41
Measure 2015–16 2016–17 2017–18(vi)
Training
Percentage of managers and staff that have received OHS training:
– induction 98% 77% 87%
– management training 92% 77% 87%
– contractors, temps, and visitors. n/a n/a n/a
Percentage of HSRs trained:
– acceptance of role 100% 100% 100%
– re training (refresher) 100% 94% 100%
– reporting of incidents and injuries 0% 0% 100%
Notes: (i) Data sourced from Victorian WorkCover Authority (VWA).(ii) Standard claims are those that have exceeded the employee excess (days or dollars) or are registered as a standard claim and are open with payments at
the time of extraction. Fatality claims are also based on the same definition of standardised claims. Under-threshold claims are excluded from this figure. (iii) Thirteen-week claims is a measure of the number of claims exceeding 13–week compensation based on a derived day count. The 13–week measure
begins at day one (that is: employer excess and VWA payments).(iv) A lost time claim is one with one (1) or more days compensated by the Victorian Work Cover Authority (VWA) Insurer, (that is, once the employer has paid
the 10-day excess) at the time of extraction. Lost time claims are a subset of standardised claims. Under-threshold claims are excluded from this figure. (v) In the 2016–17 PTV Annual Report the value for Claims – rate per FTE was misrepresented as 0.021. The above table shows the correct rate of 0.21.
The number of claims was correct. (vi) Data is for the period 1 June 2017 to 30 June 2017.
Employment and conduct principlesPTV is committed to applying merit and equity principles when appointing staff.The selection processes ensure that applicants are assessed and evaluated fairly and equitably based on the key selection criteria and other accountabilities without discrimination.Employees have been correctly classified in workforce data collections.

42 Public Transport Victoria Annual Report 2017–18

Section 3 Workforce data 43
Section 3Workforce data
Comparative Workforce Data 44
Public administration and employment principles 46

44 Public Transport Victoria Annual Report 2017–18
June 2018 June 2017
All employees Ongoing Fixed term and casual All employees Ongoing Fixed term and casual
Number
(headcount) FTEFull-time
(headcount)Part-time
(headcount) FTENumber
(headcount) FTENumber
(headcount) FTEFull-time
(headcount)Part-time
(headcount) FTENumber
(headcount) FTE
Dem
ogra
phic
dat
a
Gender
Male 282 277 222 2 223 58 54 255 252 179 3 181 73 71
Female 222 209 151 19 165 52 44 224 210 141 23 156 60 54
Self-described n n n n n n n n n n n n n n
Age
15–24 4 4 2 0 2 2 2 5 5 2 1 3 2 2
25–34 109 104 71 6 75 32 28 118 113 72 9 78 37 35
35–44 184 180 140 9 147 35 34 172 165 108 10 114 54 51
45–54 135 131 105 3 107 27 23 124 121 96 4 99 24 23
55–64 64 61 51 3 53 10 8 54 52 37 2 39 15 13
65+ 8 7 4 0 4 4 3 6 6 5 0 5 1 1
Clas
sifi
catio
n da
ta
VPS 1–6 grades 407 392 291 19 305 97 87 408 391 264 25 281 119 111
VPS 1 0 0 0 0 0 0 0 0 0 0 0 0 0 0
VPS 2 1 1 0 0 0 1 1 1 1 0 0 0 1 1
VPS 3 58 50 37 6 41 15 9 64 57 41 7 45 16 11
VPS 4 113 109 85 9 92 19 18 108 102 72 10 80 26 23
VPS 5 113 111 86 1 87 26 24 119 117 85 5 88 29 29
VPS 6 122 121 83 3 86 36 36 116 114 66 3 68 47 47
Senior employees 97 95 82 2 84 13 11 70 70 56 1 57 13 13
STS 41 39 30 0 30 11 9 23 23 13 1 14 9 9
PS 15 15 13 0 13 2 2 16 16 12 0 12 4 4
Executives 41 41 39 2 41 0 0 31 31 31 0 31 0 0
Other 0 0 0 0 0 0 0 1 1 0 0 0 1 1
Total employees 504 487 373 21 389 110 98 479 462 320 26 338 133 125
Note:Figures in accordance with FRD29C and reflect employment levels during the last full pay period in June of each year.Classification ‘Other’ includes staff on agreements/contracts other than the PTV Agreement.FTE numbers are rounded to the nearest whole number therefore minor discrepancies may appear when comparing FTE by gender, age or classification.
Comparative Workforce DataTable 2.3: Details of employment levels in June 2017 and 2018

Section 3 Workforce data 45
June 2018 June 2017
All employees Ongoing Fixed term and casual All employees Ongoing Fixed term and casual
Number
(headcount) FTEFull-time
(headcount)Part-time
(headcount) FTENumber
(headcount) FTENumber
(headcount) FTEFull-time
(headcount)Part-time
(headcount) FTENumber
(headcount) FTE
Dem
ogra
phic
dat
a
Gender
Male 282 277 222 2 223 58 54 255 252 179 3 181 73 71
Female 222 209 151 19 165 52 44 224 210 141 23 156 60 54
Self-described n n n n n n n n n n n n n n
Age
15–24 4 4 2 0 2 2 2 5 5 2 1 3 2 2
25–34 109 104 71 6 75 32 28 118 113 72 9 78 37 35
35–44 184 180 140 9 147 35 34 172 165 108 10 114 54 51
45–54 135 131 105 3 107 27 23 124 121 96 4 99 24 23
55–64 64 61 51 3 53 10 8 54 52 37 2 39 15 13
65+ 8 7 4 0 4 4 3 6 6 5 0 5 1 1
Clas
sifi
catio
n da
ta
VPS 1–6 grades 407 392 291 19 305 97 87 408 391 264 25 281 119 111
VPS 1 0 0 0 0 0 0 0 0 0 0 0 0 0 0
VPS 2 1 1 0 0 0 1 1 1 1 0 0 0 1 1
VPS 3 58 50 37 6 41 15 9 64 57 41 7 45 16 11
VPS 4 113 109 85 9 92 19 18 108 102 72 10 80 26 23
VPS 5 113 111 86 1 87 26 24 119 117 85 5 88 29 29
VPS 6 122 121 83 3 86 36 36 116 114 66 3 68 47 47
Senior employees 97 95 82 2 84 13 11 70 70 56 1 57 13 13
STS 41 39 30 0 30 11 9 23 23 13 1 14 9 9
PS 15 15 13 0 13 2 2 16 16 12 0 12 4 4
Executives 41 41 39 2 41 0 0 31 31 31 0 31 0 0
Other 0 0 0 0 0 0 0 1 1 0 0 0 1 1
Total employees 504 487 373 21 389 110 98 479 462 320 26 338 133 125
Note:Figures in accordance with FRD29C and reflect employment levels during the last full pay period in June of each year.Classification ‘Other’ includes staff on agreements/contracts other than the PTV Agreement.FTE numbers are rounded to the nearest whole number therefore minor discrepancies may appear when comparing FTE by gender, age or classification.

46 Public Transport Victoria Annual Report 2017–18
Public administration and employment principlesPTV recently reviewed all policies with respect to upholding public sector conduct to promote adherence to public sector values on commencement and during employment. PTV’s online mandatory learning modules were reviewed and updated in line with legislation where employees are mandated to complete ongoing refresher training on key policies on an annual basis.
Table 2.4: Annualised total salary by $20,000 bands, for executive and other senior non-executive staff
Income band (salary) Executives
Senior technical
specialistsPrincipal
scientists
< $160,000 2 3 2
$160,000 – $179,999 6 15 8
$180,000 – $199,999 12 11^ 2
$200,000 – $219,999 7 12^^ 3
$220,000 – $239,999 4
$240,000 – $259,999 4^^^
$260,000 – $279,999
$280,000 – $299,999 4
$300,000 – $319,999 1
$320,000 – $339,999
$340,000 – $359,999
$360,000 – $379,999
$380,000 – $399,999
$400,000 – $419,999 1
$420,000 – $439,999
$440,000 – $459,999
$460,000 – $479,999
$480,000 – $499,999
TOTAL 41 41 15
Note: The salaries reported above is for the full financial year, at a 1–FTE rate, and excludes superannuation.^ 1 employee was employed on a part-time basis at a 0.8 FTE rate.^^ 1 employee was employed on a part-time basis at a 0.8 FTE rate, 3
employees were employed on a part-time basis at a 0.6 FTE rate, 1 employee was employed on a part-time basis at a 0.4 FTE rate.
^^^ 2 employees were employed on a part-time basis at a 0.8 FTE rate.

Section 3 Workforce data 47

48 Public Transport Victoria Annual Report 2017–18

Section 4 Other disclosures 49
Section 4Other disclosures
Local Jobs First – Victorian Industry Participation Policy 50
Disclosure of Victorian Government advertising expenditure 51
Consultancy expenditure 52
Information and communications technology expenditure 52
Disclosure of major contracts compliance 52
Protected Disclosure Act 2012 52
Freedom of information summary 53
Compliance with the Building Act 1993 55
Competitive neutrality policy 55
Environment 55
Additional information available 59
Financial Management Compliance Attestation Statement 60

50 Public Transport Victoria Annual Report 2017–18
Local Jobs First – Victorian Industry Participation Policy The Victorian Government is committed to ensuring that local small and medium enterprises are given a full and fair opportunity to compete for government contracts, while still achieving value for money. The Victorian Industry Participation Policy (VIPP) is implemented by Victorian Government departments and agencies to help drive local industry development.The policy applies to government procurement activities, construction activities, major projects, major events, Public Private Partnerships and investment support, business development and community infrastructure grants above the threshold values of $3 million or more in metropolitan Melbourne and $1 million or more in regional Victoria.VIPP also has a Strategic Project Framework that applies to procurement activities valued at $50 million or more, excluding maintenance and operational costs.During 2017–18, PTV commenced and completed seven contracts totalling $84,858,426 to which a VIPP Plan or Local Industry Development Plan (LIDP) was required.During 2017–18, two small- to medium-sized businesses that prepared a VIPP Plan, or LIDP were engaged as Principal Contractor.During 2017–18, four small- to medium-sized businesses were engaged by Principal Contractors on projects.During 2017–18, seven contracts commenced and/or completed, to which a VIPP Plan was required, occurred in metropolitan Melbourne, with an average commitment of 88 per cent local content.
The total VIPP Plan or LIDP commitments achieved as a result of contracts which started included:
– local content of 85.69 per cent of the total value of the contracts
– 13 new jobs and 74 retained jobs – six new apprenticeships or traineeship and six
retained apprenticeship or traineeship.
During 2017–18, six contracts had the minimum formal weighting of 10 per cent applied for local content in the tender evaluation of the VIPP Plan or LIDP.PTV did not commence any grants or design projects during 2017–18.

Section 4 Other disclosures 51
Expenditure (excluding GST)
Name of Campaign Start/End dateAdvertising
(media)
Creative and campaign
development
Research and
evaluation Print and
collateralOther
campaign
Explore the Night with the Night Network 24/01/2018 28/04/2018 $976,621 $580,045 $53,100 $85,380 –
High Capacity Metro Trains 01/07/2017 30/10/2017 $277,585 $35,344 $77,500 $1,665 –
Get to know your bus (Phase 3 and 4) 04/02/2018 28/04/2018 $678,805 $496,965 $69,000 $160,825 $69,526
Supporting users to be ready to travel 10/7/2017 30/6/2018 $788,363 $154,924 – $104,260 –
Campaign summaries:Explore the Night with the Night NetworkThe campaign maintained awareness and encouraged the use of the Night Network, 24-hour public transport on Friday and Saturday nights.
High Capacity Metro TrainsThe campaign informed public transport users about bus replacement services on the Cranbourne–Pakenham rail corridor during 2017. This was due to work done on the railway line for the High Capacity Metro Trains project.
Get to know your busThe second year of the campaign focused on Whitehorse, Manningham, Monash and Geelong. The campaign improved understanding and attitudes to buses. Buses are a vital local connecting service and the campaign reminded people where buses go in their community and encouraged them to explore their local suburbs and towns by bus. It also encouraged non-users to consider buses.
Supporting users to be ready to travelThe campaigns promoted high-readiness ticketing products, myki Auto Top Up and myki Commuter Club. They aimed to address accidental and unintentional fare evasion that occurs when customers are unprepared to travel, with insufficient funds on their myki.
Disclosure of Victorian Government advertising expenditureTable 2.5: Details of PTV advertising expenditure (campaigns with a media spend of $100,000 or greater)
52 Public Transport Victoria Annual Report 2017–18
Consultancy expenditureDetails of consultancies valued at $10,000 or greaterIn 2017–18, there were 103 consultancies where the total fees payable to the consultants were $10,000 or greater. Total expenditure incurred in 2017–18 in relation to these consultancies was $18,394,154 (including GST).
Details of consultancies under $10,000In 2017–18, there were two consultancies where the total fees payable to the consultants were less than $10,000. Total expenditure incurred in 2017–18 in relation to these consultancies was $8399 (including GST).A full list of PTV contractors and consultants engaged in 2017–18, as defined by FRD 22F, can be found in the Additional Information to this annual report, online at ptv.vic.gov.au
Information and communications technology expenditureFor the 2017–18 reporting period, PTV had a total information and communications technology (ICT) expenditure of $47.57 million with the details shown below.
Table 2.6: ICT Expenditure ($ ‘000’s)
Business as usual (BAU) ICT expenditure 18,398.77
Non-Business as usual operational expenditure 4,499.29
Non-business as usual capital expenditure 24,671.87
Total non-business as usual expenditure 29,171.16
ICT expenditure refers to the PTV’s costs in providing business enabling ICT services within the current reporting period. It comprises business as usual (BAU) ICT expenditure and non-business as usual (non-BAU) ICT expenditure. Non-BAU ICT expenditure relates to extending or enhancing the PTV’s current ICT capabilities. BAU ICT expenditure is all remaining ICT expenditure which primarily relates to ongoing activities to operate and maintain the current ICT capability.
Disclosure of major contracts compliancePTV has disclosed, in accordance with the requirements of Victorian Government policy and accompanying guidelines, all contracts greater than $10 million in value that it entered into during the year ended 30 June 2018. Details of contracts that have been disclosed in the Victorian Government contracts publishing system can be viewed online at tenders.vic.gov.au
Protected Disclosure Act 2012The following information is required in the annual report in accordance with the Protected Disclosure Act 2012 (Vic).The Protected Disclosure Act encourages and assists people in making disclosures of improper or corrupt conduct by public officers and public bodies. The Act provides protection to people who make disclosures in accordance with the Act and establishes a system for the matters disclosed to be investigated and rectifying action to be taken.The Independent Broad-based Anti-corruption Commission (IBAC) has a key role in receiving, assessing and investigating disclosures about corrupt or improper conduct and police personnel conduct as well as responsibility for preparing and publishing guidelines to assist public bodies to interpret and comply with the protected disclosures regime.PTV does not tolerate improper conduct by employees, or the taking of reprisals against those who come forward to disclose such conduct. PTV is committed to ensuring transparency and accountability in its administrative and management practices and supports the making of disclosures that reveal corrupt conduct, conduct involving a substantial mismanagement of public resources, or conduct involving a substantial risk to public health and safety, or the environment.PTV will take all reasonable steps to protect people who make such disclosures from any detrimental action in reprisal for making the disclosure. It will also afford natural justice to the person who is the subject of the disclosure to the extent it is legally possible.

Section 4 Other disclosures 53
Reporting proceduresPTV is not authorised to receive protected disclosures.Protected disclosures about PTV or any of its employees and/or officers must be made directly to IBAC:Independent Broad-based Anti-corruption CommissionLevel 1, North Tower, 459 Collins StreetMelbourne VIC 3000Toll free: 1300 735 135Internet: www.ibac.vic.gov.au/general/contact-usEmail: Please see above website. IBAC will determine whether a disclosure is a protected disclosure or not. If IBAC determines that a disclosure is a protected disclosure, it must deal with the disclosure in accordance with the Independent Broad-based Anti-corruption Commission Act 2011.
Further informationWritten procedures outlining the system for reporting disclosures of improper conduct or detrimental action by PTV, or any of its employees and/or officers, are available on PTV’s website.
Freedom of information summaryThe Freedom of Information Act 1982 (Vic) allows the public a right of access to documents held by PTV. The purpose of the Act is to extend as far as possible the right of the community to access information held by government departments, local councils, Ministers and other bodies subject to the Act.An applicant has a right to apply for access to documents held by PTV. This comprises documents both created by PTV or supplied to PTV by an external organisation or individual, and may also include maps, films, microfiche, photographs, computer printouts, computer discs, tape recordings and videotapes. Information about the type of material produced by PTV is available on PTV’s website under its Part II Information Statement.
The Act allows PTV to refuse access, either fully or partially, to certain documents or information. Examples of documents that may not be accessed include: cabinet documents; some internal working documents; law enforcement documents; documents covered by legal professional privilege, such as legal advice; personal information about other people; and information provided to PTV in-confidence.From 1 September 2017, the Act was amended to reduce the Freedom of Information processing time for requests received from 45 to 30 days. In some cases, this time may be extended.If an applicant is not satisfied with a decision made by PTV, they have the right to seek a review by the Office of the Victorian Information Commissioner (OVIC) within 28 days of receiving a decision letter pursuant to section 49A of the Act.Details of PTV’s freedom of information activities over the financial year are provided in the table below.
Making a requestSection 17 of the Act lists the requirements for making a Freedom of Information request. In summary, a Freedom of Information request:
– must be in writing – should identify as clearly as possible which
document is being requested – should be accompanied by the appropriate
application fee (the fee may be waived in certain circumstances).
Requests for documents in the possession of PTV should be addressed to:Freedom of Information OfficerPublic Transport VictoriaPO Box 4724Melbourne VIC 3001Email: [email protected]

54 Public Transport Victoria Annual Report 2017–18
Freedom of Information Activity 2017–18
Requests received(i)
Member of Parliament 7
Media 4
Others(ii) 46
Total 57
Decisions made
Full access 5
Part access 25
Denied access 3
No documents 9
Transferred/Withdrawn(iii) 12
Total 54
Processing time
Average decision time 27 days
Decisions made within the time requirements of section 21 of the FOI Act 52
Decisions made outside the time requirements of section 21 of the FOI Act 2
Office of the Victorian Information Commissioner review/complaints received
Member of Parliament 0
Media 0
Others 1
Total 1
Outcome of Office of the Victorian Information Commissioner review/complaints
Request for review withdrawn by applicant 2
Dismissed/ fresh decision by PTV 2
Original decision affirmed 1
Decision varied – no further material released 1
Decision pending 1
Total 7
Victorian Civil and Administrative Tribunal appeals received
Member of Parliament 0
Media 0
Others 0
Total 0
Victorian Civil and Administrative Tribunal appeals decided
Withdrawn 0
Struck out 0
Original decision confirmed 1
Original decision varied 0
Total 1
(i) Lists all requests received by PTV, including three requests which, after consultation, were transferred to another agency for processing.
(ii) Includes solicitors, companies/organisations, private persons and lobby groups.
(iii) Includes requests transferred, withdrawn, not processed, not proceeded with and where the Freedom of Information Act does not apply.

Section 4 Other disclosures 55
Compliance with the Building Act 1993 PTV does not own or control any government buildings and consequently is exempt from notifying its compliance with the building and maintenance provisions of the Building Act 1993 (Vic).
Competitive neutrality policyCompetitive neutrality requires government businesses to ensure where services compete, or potentially compete with the private sector, any advantage arising solely from their government ownership be removed if it is not in the public interest. Government businesses are required to cost and price these services as if they were privately owned. Competitive neutrality policy supports fair competition between public and private businesses and provides government businesses with a tool to enhance decisions on resource allocation. This policy does not override other policy objectives of government and focuses on efficiency in the provision of service.PTV is working to ensure Victoria fulfils its requirements on competitive neutrality reporting for technological based businesses against the enhanced principles as required under the Competition Principles Agreement.
EnvironmentOffice-based environmental impactsPTV has committed to a number of environmental initiatives as a result of the Victorian Auditor-General’s report, Managing the Environmental Impacts of Transport, published in 2014. PTV has developed an Environment and Sustainability Strategy (2015–2020) to provide broad guidance on key environmental initiatives to be addressed in the medium term in accordance with the PTV Corporate Plan 2014–18.PTV also recognises the emission reduction targets set by the Victorian Government in the Climate Change Act 2017 and is committed to reducing our emissions to achieve zero net emissions by 2050.
Key initiatives to be addressed that are relevant to office-based impacts include:
– developing and implementing an Environmental Management System based on ISO 14001 to be integrated with the Safety Management System
– completing an environmental footprint to understand impacts
– developing and implementing a monitoring and evaluation framework for PTV targeted at understanding the baseline performance of public transport
– integrating whole-of-lifecycle considerations into the procurement process
– promoting energy and transport technologies that have the least impact
– developing and implementing sustainability specifications.
PTV’s Environment Management System was set up to meet Victorian Government expectations and to reduce the impact on the environment. The initial focus is on PTV’s office based activities in the areas of energy consumption, transportation, waste generation, water consumption, and procurement.The Environmental Management System objectives include:
– adopting an environmental management system based on ISO 14001
– communicating environmental performance through regular reporting
– encouraging staff to reduce environmental impacts – reducing the amount of waste, and maximising the
amount reused and recycled – reducing vehicle fleet emissions – making environmentally-sound purchasing decisions
for capital items and consumables.
Improving the sustainability performance and resilience-to-climate change impacts of our transport networks is a key priority for PTV.

56 Public Transport Victoria Annual Report 2017–18
EnergyPTV consumes energy for many different uses including office facilities and customer services (such as PTV Hubs).The data presented was collected through energy retailer billing information for the corporate office and PTV Hubs. PTV is continuing to develop systems to more comprehensively collect data regarding expenditure of natural gas and green power, particularly at operational facilities.
Indicator
2017–18
ElectricityNatural
gasGreen power
Total energy usage segmented by primary source (MJ) 3,725,988 – 0
Greenhouse gas emissions associated with energy use, segmented by primary source and offsets (t CO2 e)
1107 – 0
Percentage of electricity purchased as green power 0 0 0
Units of energy used per FTE (MJ/FTE) 7651 – 0
Units of energy used per unit of office area (MJ/m2) 328 – 0
Actions undertaken
Reducing Energy Use
Communications informing staff of energy saving techniques
Procurement of more energy efficient computer equipment
Centralisation of printing equipment
Target – 10 per cent energy intensity reduction, measured
as MJ/m2, from 2015–16 values (265MJ/m2) by 30 June 2018 — not met
WasteThe waste generated by processes within PTV is divided into four general classes — landfill, organics, paper and card and commingled recycling. Waste at 750 Collins St is managed by the building’s owner and manager, General Property Trust (GPT).The data presented below is derived from GPT Waste Profiling Report — PTV Tenancy.
Indicator
2017–18
LandfillRecycled
waste Organics
Total units of waste disposed of by destination (kg/yr) 20,440 14,235 2300
Units of waste disposed of per FTE by destinations (kg/FTE) 42 29 4.7
Recycling rate (percentage of total waste) 45%
Greenhouse gas emissions associated with waste disposal (t CO2 e)
24.5
Actions undertaken
Avoidance to landfill
Communications to staff assisting them to ensure waste is put into correct bins
Communication to staff around reusable bags and coffee cups to reduce main landfill waste sources
Increased organics waste measures
Target – Increase per cent of waste avoiding landfill to 50 per
cent by 30 June 2018 — not met – Waste to landfill has reduced but not to 50 per cent.
Explanatory notesWaste greenhouse gas emissions calculations have been determined from the National Greenhouse Accounts Factors (2018) for waste disposed to landfill. They are measured in tonnes of carbon dioxide equivalent (t CO2 e). It is believed that the figure above is more than the water use expected to be required by PTV. The likely cause of the high level of water use is difficult to attribute due to the limited water metering in place at 750 Collins Street.

Section 4 Other disclosures 57
Paper
Indicator 2017–18
Total units of copy paper used (reams — 500 sheets per ream) 3,549
Units of copy paper used per FTE (reams/FTE) 7.2
Percentage of 75–100% recycled content copy paper purchased 96
Percentage of 50–75% recycled content copy paper purchased –
Percentage of 0–50% recycled content copy paper purchased 4
Actions undertaken
Reducing paper use
Default setting for paper reduction
Increased reliable data on actual paper use
Target – Reduce total units of A4 equivalent copy paper used
(reams) by 5 per cent based on 2015–16 baseline by 30 June 2018 — met
– Total units of paper used has reduced by greater than 5 per cent.
WaterThis data is based on water meter readings from the tenancy. The building is a five-star rated building.
Indicator 2017–18
Total units of metered water consumed by usage types (kilolitres) 4509
Units of metered water consumed in offices per FTE (kilolitres/FTE) 9.2
Units of metered water consumed in offices per unit of office area (kilolitres/m2) 0.4
Actions undertaken
Water-saving features
Communicated to staff about reducing water use
Target – 10 per cent reduction in water consumption based
on 2015–16 baseline (litres per FTE) by 30 June 2018 — not met
– Water usage has increased.
Explanatory notesWater data is provided by building management team (GPT) as per the lease requirements for the entire 750 Collins Street building. Water usage for PTV is calculated by dividing the total water consumed at 750 Collins Street by the number of floors occupied by PTV.

58 Public Transport Victoria Annual Report 2017–18
TransportIn 2017–18 PTV chose to use VicFleet exclusively for its vehicle use and no longer uses PTV-owned vehicles. This has led to a greater reliability of data and the target will now be benchmarked from the present financial year as it reflects a more accurate picture of fleet emissions.
Actions undertaken
Reduce fleet emissions
Use of VicFleet-only vehicles (greater data reliability and greater percentage of hybrid/non-diesel vehicles).
Encouraged staff travel via public transport with the provision of staff travel passes and the removal of staff car parking spaces at PTV offices.
Target – Investigate efficiencies to reduce consumption
of fuels used by PTV’s passenger vehicle fleet compared with 2016–17 to reduce emissions by 10 per cent by 30 June 2018 — not met.
– Annual fuel use has decreased from previous year but not by 10 per cent.
Reporting period 2017–18
Vehicle type 4 cyl 6 cyl
Total energy consumption by vehicles (Mj) 667,060 317,292
Diesel 213,492 25,570
LPG 0 0
Unleaded 120,458 291,722
Hybrid 333,110 0
Total vehicle travel associated with entity operations (km) 213,758 32,809
Diesel 14,842 6,203
LPG 0 0
Unleaded 33,457 26,606
Hybrid 165,459 0
Total greenhouse gas emissions from vehicle fleet (t CO2 e) 46.69 21.9
Diesel 15.5 1.8
LPG 0 0
Unleaded 8.3 20.1
Hybrid 22.89 0
Greenhouse gas emissions from vehicle fleet per 1,000 km travelled (t CO2 e) 9 4.7
Diesel 6.4 2.4
LPG 0 0
Unleaded 2.3 2.3
Hybrid 0.3 0
Work-related flights
Total distance travelled by
aeroplane (km)Greenhouse gas (t CO2 e)
2017–18 294,878 133

Section 4 Other disclosures 59
Greenhouse gas emissionsThe emissions disclosed below are taken from the previous sections and combined here to show PTV’s greenhouse footprint measured in tonnes of carbon dioxide equivalent (t CO2 e).
Indicator 2017–18
Total greenhouse gas emissions associated with energy use (t CO2 e) 1107
Total greenhouse gas emissions associated with vehicle fleet (t CO2 e) 69
Total greenhouse gas emissions associated with air travel (t CO2 e) 133
Total greenhouse gas emissions associated with waste production (t CO2 e) 24.5
Greenhouse gas emissions offsets purchased (t CO2 e) 1500
Target – To investigate options to reduce PTV’s environmental
footprint — met. Emissions reduced to 1333 t CO2 e. – To offset emissions — met. Offset secured for
actual amount of t CO2 e for 2016–17 financial year. Offsetting is conducted on a previous year’s basis and will be conducted again for 2017–18 in 2018–19.
– PTV intends to offset future years emissions sources in line with the setting of a science-based target to ensure that offsetting and emissions reductions are monitored and planned in line with current best practice.
Explanatory notesPTV has recently assessed its environmental footprint, creating a baseline from which to investigate efficiencies to reduce our carbon footprint. Some emissions sources are managed centrally via our building owner and without increased sub metering in place to provide better data PTV is unable to target resource use as effectively as it could. PTV will be moving to a new building in 2019 and has confirmed that increased sub metering will be in place. This will allow for more accurate PTV energy and water use monitoring, which will better inform future reduction programmes’ effectiveness.
Additional information availableThe Directions of the Minister for Finance, pursuant to the Financial Management Act 1994 (Vic) require a range of information to be prepared in relation to the financial year.This material is itemised below, and where not published in this report, is published on the PTV website as Additional Information, on the same page as the Annual Report:
– a statement that declarations of pecuniary interests have been duly completed by all relevant officers
– details of shares held by a senior officer as nominee or held beneficially in a statutory authority or subsidiary
– details of publications produced by the entity about the entity, and how these can be obtained
– details of changes in prices, fees, charges, rates and levies charged by the entity
– details of any major external reviews carried out on the entity
– details of major research and development activities undertaken by the entity
– details of overseas visits undertaken including a summary of the objectives and outcomes of each visit
– details of major promotional, public relations and marketing activities undertaken by the entity to develop community awareness of the entity and its services
– details of assessments and measures undertaken to improve the occupational health and safety of employees
– general statement on industrial relations within the entity and details of time lost through industrial accidents and disputes
– list of major committees sponsored by the entity, the purposes of each committee and the extent to which the purposes have been achieved
– details of all consultancies and contractors including: – consultants/contractors engaged – services provided, and – expenditure committed to for each engagement.
60 Public Transport Victoria Annual Report 2017–18
Financial Management Compliance Attestation StatementI, Jeroen Weimar, Chief Executive, on behalf of the Responsible Body, certify that Public Transport Victoria has complied with the applicable Standing Directions of the Minister for Finance under the Financial Management Act 1994 and Instructions.
Jeroen WeimarChief ExecutivePublic Transport Victoria 20 August 2018

Section 4 Other disclosures 61

62 Public Transport Victoria Annual Report 2017–18

Section 4 Other disclosures 63

64 Public Transport Victoria Annual Report 2017–18
Section 5 Consolidated financial statements 65
Section 5Consolidated financial statements
Accountable Officer’s and Chief Financial Officer’s Declaration 68
Victorian Auditor – General’s Report 69
Consolidated comprehensive operating statement 71
Consolidated balance sheet 72
Consolidated cash flow statement 73
Consolidated statement of changes in equity 74
Notes to the consolidated financial statements 75
These consolidated financial statements for the year ended 30 June 2018 are prepared for the Public Transport Development Authority (operating as Public Transport Victoria) and its controlled entity.A description of the nature of PTV’s operations and its principal activities are included in the report of operations.For queries in relation to these consolidated financial statements please visit www.ptv.vic.gov.au

66 Public Transport Victoria Annual Report 2017–18
Public Transport Victoria – Consolidated financial statementsHow this report is structuredPublic Transport Victoria (PTV) has presented its audited general purpose consolidated financial statements for the financial year ended 30 June 2018 in the following structure to provide users with information about PTV’s stewardship of resources entrusted to it.
Consolidated Financial StatementsConsolidated comprehensive operating statementConsolidated balance sheetConsolidated cash flow statementConsolidated statement of changes in equity
Notes to the consolidated financial statements 1 About this report The basis on which the financial statements have been prepared
and compliance with reporting regulations 75
2 Funding delivery of services Revenue recognised from grants from the Victorian Government,
provision for services and other sources 772.1 Income that funds the delivery of services 77
3 The cost of delivering services Operating expenses of PTV 783.1 Expenses incurred in delivery of services 783.2 Capital asset charge 823.3 Other operating expenses 83
4 Disaggregated financial information Administered (non-controlled) items, restructuring of administrative
arrangements and other asset transfers 844.1 Administered (non-controlled) items 844.2 Restructuring of administrative arrangements and other asset transfers 85
5 Key assets available to support output delivery Land, buildings, infrastructure, plant and equipment, leasehold improvement,
vehicles, cultural assets and intangible assets 865.1 Property, plant and equipment 865.2 Intangible assets 92
Section 5 Consolidated financial statements 67
6 Other assets and liabilities Working capital balances, and other key assets and liabilities 936.1 Receivables 936.2 Payables 946.3 Inventories 966.4 Other non-financial assets 966.5 Other provisions 96
7 Financing operations Borrowings, cash flow information and leases 977.1 Borrowings 987.2 Leases 1007.3 Cash flow information and balances 1017.4 Commitments for expenditure 102
8 Risks, contingencies and valuation judgements Financial risk management, contingent assets and liabilities and fair value determination 1078.1 Financial instruments specific disclosures 1078.2 Contingent assets and contingent liabilities 1158.3 Fair value determination 116
9 Other disclosures 1229.1 Ex-gratia expenses 1239.2 Other economic flows included in net result 1239.3 Responsible persons 1239.4 Remuneration of executives 1249.5 Related parties 1259.6 Remuneration of auditors 1269.7 Fare and cardholder funds administration 1269.8 Subsequent events 1279.9 Other accounting policies 1279.10 Australian Accounting Standards issued that are not yet effective 1279.11 Glossary of technical terms 1309.12 Style conventions 132

68 Public Transport Victoria Annual Report 2017–18
Accountable Officer’s and Chief Financial Officer’s DeclarationThe attached consolidated financial statements for the Public Transport Development Authority have been prepared in accordance with Direction 5.2 of the Standing Directions of the Minister for Finance under the Financial Management Act 1994, applicable Financial Reporting Directions, Australian Accounting Standards including Interpretations, and other mandatory professional reporting requirements.We further state that, in our opinion, the information set out in the consolidated comprehensive operating statement, consolidated balance sheet, consolidated statement of changes in equity, consolidated cash flow statement and accompanying notes, presents fairly the financial transactions during the year ended 30 June 2018 and financial position of the Public Transport Development Authority and its controlled entity as at 30 June 2018.At the time of signing, we are not aware of any circumstance which would render any particulars included in the financial statements to be misleading or inaccurate.We authorise the attached consolidated financial statements for issue on 3 September 2018.
Jeroen WeimarChief Executive
Melbourne3 September 2018
Fred CiliaChief Financial Officer
Melbourne3 September 2018

Section 5 Consolidated financial statements 69
Victorian Auditor – General’s Report
Independent Auditor’s Report To the Chief Executive Officer of the Public Transport Development Authority
Opinion I have audited the consolidated financial report of the Public Transport Development Authority (the authority) and its controlled entity (together the consolidated entity), which comprises the:
• consolidated balance sheet as at 30 June 2018 • consolidated comprehensive operating statement for the year then ended • consolidated statement of changes in equity for the year then ended • consolidated cash flow statement for the year then ended • notes to the financial statements, including significant accounting policies • accountable officer's and chief financial officer's declaration.
In my opinion, the financial report presents fairly, in all material respects, the financial positions of the consolidated entity and the authority as at 30 June 2018 and their financial performance and cash flows for the year then ended in accordance with the financial reporting requirements of Part 7 of the Financial Management Act 1994 and applicable Australian Accounting Standards.
Basis for Opinion
I have conducted my audit in accordance with the Audit Act 1994 which incorporates the Australian Auditing Standards. I further describe my responsibilities under that Act and those standards in the Auditor’s Responsibilities for the Audit of the Financial Report section of my report.
My independence is established by the Constitution Act 1975. My staff and I are independent of the authority and the consolidated entity in accordance with the ethical requirements of the Accounting Professional and Ethical Standards Board’s APES 110 Code of Ethics for Professional Accountants (the Code) that are relevant to my audit of the financial report in Victoria. My staff and I have also fulfilled our other ethical responsibilities in accordance with the Code.
I believe that the audit evidence I have obtained is sufficient and appropriate to provide a basis for my opinion.
Chief Executive Officer’s responsibilities for the financial report
The Chief Executive Officer of the authority is responsible for the preparation and fair presentation of the financial report in accordance with Australian Accounting Standards and the Financial Management Act 1994, and for such internal control as the Chief Executive Officer determines is necessary to enable the preparation and fair presentation of a financial report that is free from material misstatement, whether due to fraud or error.
In preparing the financial report, the Chief Executive Officer is responsible for assessing the authority and the consolidated entity’s ability to continue as a going concern, disclosing, as applicable, matters related to going concern and using the going concern basis of accounting unless it is inappropriate to do so.
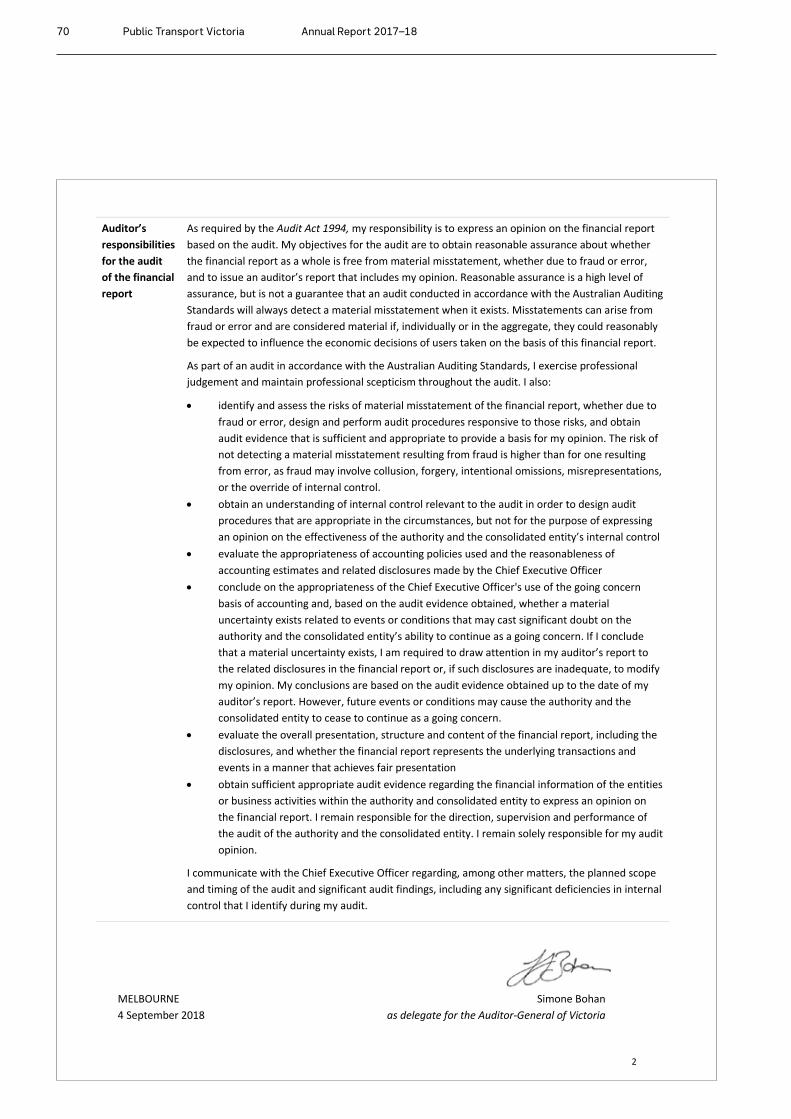
70 Public Transport Victoria Annual Report 2017–18
2
Auditor’s responsibilities for the audit of the financial report
As required by the Audit Act 1994, my responsibility is to express an opinion on the financial report based on the audit. My objectives for the audit are to obtain reasonable assurance about whether the financial report as a whole is free from material misstatement, whether due to fraud or error, and to issue an auditor’s report that includes my opinion. Reasonable assurance is a high level of assurance, but is not a guarantee that an audit conducted in accordance with the Australian Auditing Standards will always detect a material misstatement when it exists. Misstatements can arise from fraud or error and are considered material if, individually or in the aggregate, they could reasonably be expected to influence the economic decisions of users taken on the basis of this financial report.
As part of an audit in accordance with the Australian Auditing Standards, I exercise professional judgement and maintain professional scepticism throughout the audit. I also:
• identify and assess the risks of material misstatement of the financial report, whether due to fraud or error, design and perform audit procedures responsive to those risks, and obtain audit evidence that is sufficient and appropriate to provide a basis for my opinion. The risk of not detecting a material misstatement resulting from fraud is higher than for one resulting from error, as fraud may involve collusion, forgery, intentional omissions, misrepresentations, or the override of internal control.
• obtain an understanding of internal control relevant to the audit in order to design audit procedures that are appropriate in the circumstances, but not for the purpose of expressing an opinion on the effectiveness of the authority and the consolidated entity’s internal control
• evaluate the appropriateness of accounting policies used and the reasonableness of accounting estimates and related disclosures made by the Chief Executive Officer
• conclude on the appropriateness of the Chief Executive Officer's use of the going concern basis of accounting and, based on the audit evidence obtained, whether a material uncertainty exists related to events or conditions that may cast significant doubt on the authority and the consolidated entity’s ability to continue as a going concern. If I conclude that a material uncertainty exists, I am required to draw attention in my auditor’s report to the related disclosures in the financial report or, if such disclosures are inadequate, to modify my opinion. My conclusions are based on the audit evidence obtained up to the date of my auditor’s report. However, future events or conditions may cause the authority and the consolidated entity to cease to continue as a going concern.
• evaluate the overall presentation, structure and content of the financial report, including the disclosures, and whether the financial report represents the underlying transactions and events in a manner that achieves fair presentation
• obtain sufficient appropriate audit evidence regarding the financial information of the entities or business activities within the authority and consolidated entity to express an opinion on the financial report. I remain responsible for the direction, supervision and performance of the audit of the authority and the consolidated entity. I remain solely responsible for my audit opinion.
I communicate with the Chief Executive Officer regarding, among other matters, the planned scope and timing of the audit and significant audit findings, including any significant deficiencies in internal control that I identify during my audit.
MELBOURNE 4 September 2018
Simone Bohan as delegate for the Auditor-General of Victoria

Section 5 Consolidated financial statements 71
Consolidated comprehensive operating statement For the financial year ended 30 June 2018
Note
($ thousand)
2018 2017
Continuing operations Income from transactions
Grants from Victorian Government 2.1.1 4,784,812 4,304,449
Supply of transport services 2.1.2 284,341 226,959
Fair value of assets and resources received free of charge 2.1.3 57,503 55,572
Operators’ contribution for marketing and communications 2.1.4 7,561 9,136
Issuance fee of myki cards 2.1.5 14,135 13,980
Licence fee from advertising panels at bus shelters 2.1.6 21,236 20,185
Interest 2,986 3,041
Other income 4,022 1,589
Total income from transactions 5,176,596 4,634,912
Expenses from transactions
Service providers and transport agencies 3.1.1 (4,844,312) (4,400,198)
Supplies and services 3.3 (71,593) (95,815)
Fair value of assets and services provided free of charge 3.3 (33,433) (30,203)
Employee benefit expenses 3.1.2 (51,223) (45,763)
Depreciation and amortisation 5.1.1 (48,728) (48,845)
Interest expense 7.1 (41,512) (40,752)
Capital asset charge 3.2 (8,355) (8,195)
Total expenses from transactions (5,099,156) (4,669,771)
Net result from transactions (net operating balance) 77,440 (34,859)
Other economic flows included in net result
Net loss on non-financial assets 9.2 (657) (54)
Net gain/(loss) on financial instruments 9.2 (4,097) 241
Other gain/(loss) from other economic flows 9.2 (39) 223
Total other economic flows included in net result (4,793) 411
Net result from continuing operations 72,647 (34,448)
Other economic flows – other comprehensive income
Changes in physical asset revaluation surplus 5.1.2 31,598 –
Total other economic flows – other comprehensive income 31,598 –
Comprehensive result 104,245 (34,448)
The consolidated comprehensive operating statement should be read in conjunction with the notes to the consolidated financial statements.
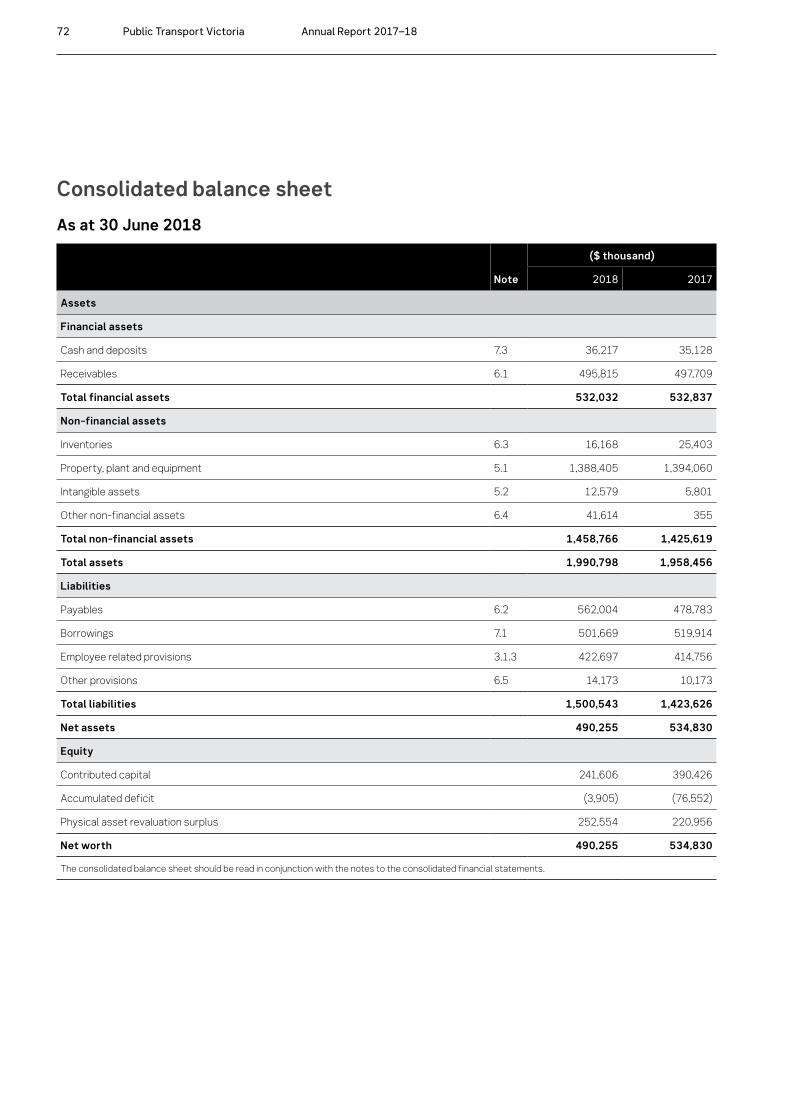
72 Public Transport Victoria Annual Report 2017–18
Consolidated balance sheet As at 30 June 2018
Note
($ thousand)
2018 2017
Assets
Financial assets
Cash and deposits 7.3 36,217 35,128
Receivables 6.1 495,815 497,709
Total financial assets 532,032 532,837
Non-financial assets
Inventories 6.3 16,168 25,403
Property, plant and equipment 5.1 1,388,405 1,394,060
Intangible assets 5.2 12,579 5,801
Other non-financial assets 6.4 41,614 355
Total non-financial assets 1,458,766 1,425,619
Total assets 1,990,798 1,958,456
Liabilities
Payables 6.2 562,004 478,783
Borrowings 7.1 501,669 519,914
Employee related provisions 3.1.3 422,697 414,756
Other provisions 6.5 14,173 10,173
Total liabilities 1,500,543 1,423,626
Net assets 490,255 534,830
Equity
Contributed capital 241,606 390,426
Accumulated deficit (3,905) (76,552)
Physical asset revaluation surplus 252,554 220,956
Net worth 490,255 534,830
The consolidated balance sheet should be read in conjunction with the notes to the consolidated financial statements.

Section 5 Consolidated financial statements 73
Consolidated cash flow statement For the financial year ended 30 June 2018
Note
($ thousand)
2018 2017
Cash flows from operating activities
Receipts
Receipts from Government 4,896,090 4,339,235
Fare receipts 917,413 871,500
Goods and Services Tax recovered from the ATO(i) 364,150 342,499
Receipts from operators 7,561 9,136
Interest received 2,964 2,893
Other receipts 53,516 42,117
Total receipts 6,241,694 5,607,380
Payments
Payments to service providers and transport agencies (3,122,607) (2,886,788)
Fare receipts (remitted to transport operators) (633,057) (642,314)
Payments to suppliers and employees (124,054) (84,058)
Interest and other costs of finance paid (41,512) (40,511)
Capital asset charge (1,985,685) (1,857,794)
Total payments (5,906,915) (5,511,465)
Net cash flows from operating activities 7.3.1 334,779 95,915
Cash flows from investing activities
Payments for non-financial assets (532,516) (785,088)
Proceeds from disposals of non-financial assets 129 180
Net cash flows used in investing activities (532,387) (784,908)
Cash flows from financing activities
Proceeds from capital contributions by DEDJTR 216,943 685,504
Repayment of loans (9,235) (11,097)
Proceeds from loans 4,336 36,307
Repayments of finance lease liabilities (13,347) (11,553)
Net cash flows provided by financing activities 198,697 699,161
Net increase in cash and cash equivalents 1,089 10,168
Cash and cash equivalents at the beginning of the financial year 35,128 24,960
Cash and cash equivalents at the end of the financial year 7.3 36,217 35,128
(i) GST paid to the Australian Taxation Office is presented on a net basis.The consolidated cash flow statement should be read in conjunction with the notes to the consolidated financial statements.

74 Public Transport Victoria Annual Report 2017–18
Consolidated statement of changes in equity For the financial year ended 30 June 2018
Note
($ thousand)
Contributions by Owner
Accumulated Surplus/(Deficit)
Physical Asset Revaluation
Surplus Total
Balance at 30 June 2016 321,813 (42,104) 220,956 500,665
Net result from continuing operations – (34,448) – (34,448)
Capital contributions funding from DEDJTR during the period 705,105 – – 705,105
Capital transfer to DEDJTR (9,636) – – (9,636)
Capital transfer to VicTrack 4.2.1 (626,855) – – (626,855)
Balance at 30 June 2017 390,426 (76,552) 220,956 534,830
Net result from continuing operations – 72,647 – 72,647
Capital contributions funding from DEDJTR during the period 343,741 – – 343,741
Capital transfer to VicTrack 4.2.1 (492,561) – – (492,561)
Other economic flows – other comprehensive income 5.1.2 – – 31,598 31,598
Balance at 30 June 2018 241,606 (3,905) 252,554 490,255
The consolidated statement of changes in equity should be read in conjunction with the notes to the consolidated financial statements.

Section 5 Consolidated financial statements 75
Notes to the consolidated financial statements1. About this reportPublic Transport Development Authority, operating as Public Transport Victoria (PTV) is a statutory authority of the State of Victoria, established under the Transport Integration Act 2010. The legislation to establish the Public Transport Development Authority was passed by the Parliament on 8 November 2011 and received Royal Assent on 15 December 2011. Operations for PTV commenced on 2 April 2012. The Transport Integration Amendment Act 2017, which commenced in April 2017, amended the statutory charter of PTV. This included establishing the Chief Executive Officer of PTV as the Responsible Body and the Accountable Officer.Its principal address is 750 Collins Street, Docklands, Victoria 3008.The financial statements include all the controlled activities of PTV.A description of the nature of PTV’s operations and its principal activities is included in the Report of operations, which does not form part of the consolidated financial statements.
Basis of preparationThese financial statements are in Australian dollars and the historical cost convention is used unless a different measurement basis is specifically disclosed in the note associated with the item measured on a different basis.The accrual basis of accounting has been applied in preparing these financial statements, whereby assets, liabilities, equity, income and expenses are recognised in the reporting period to which they relate, regardless of when cash is received or paid.Consistent with the requirements of AASB 1004 Contributions, contributions by owners (that is, contributed capital and its repayment) are treated as equity transactions and, therefore, do not form part of the income and expenses of PTV.Additions to net assets which have been designated as contributions by owners are recognised as contributed capital. Other transfers that are in the nature of contributions to or distributions by owners have also been designated as contributions by owners.
Judgements, estimates and assumptions are required to be made about financial information being presented. The significant judgements made in the preparation of these financial statements are disclosed in the notes where amounts affected by those judgements are disclosed. Estimates and associated assumptions are based on professional judgements derived from historical experience and various other factors that are believed to be reasonable under the circumstances. Actual results may differ from these estimates.These consolidated financial statements cover PTV as an individual reporting entity and include all the controlled activities of PTV.In accordance with AASB 10 Consolidated Financial Statements, the consolidated financial statements of PTV incorporate assets and liabilities of a reporting entity controlled by PTV as at 30 June 2018, and its income and expenses for that part of the reporting period in which control existed.PTV is considered to have control over Franchise Asset Holdings Pty Ltd (‘Franchise Asset Holdings’) from 4 August 2013. Franchise Asset Holdings is a special purpose entity for the purpose of acquisition and financing of buses and development of bus depots as part of the franchise arrangement with Transdev Melbourne Pty Ltd. The results of Franchise Asset Holdings are included in the consolidated comprehensive operating statement from 4 August 2013, the date on which control commenced. The only reporting entity controlled by PTV as at 30 June 2018 and 30 June 2017 was Franchise Asset Holdings.In the process of preparing consolidated financial statements for PTV, all material transactions and balances between the consolidated entities are eliminated. The consolidated and parent financial statements are the same, with the exception of those items described in section 7.1, 7.2 and 7.3.The financial statements have been prepared on a going concern basis, despite the negative working capital position of $15.6 million (2017: positive working capital position of $41.6 million). The going concern assumption has been made as PTV continues to be fully funded by government grants and capital contributions in accordance with the approved budget. The CEO and management are satisfied that PTV will be able to meet its financial obligations as and when they fall due for 12 months after the signing of the annual report.All amounts in the consolidated financial statements have been rounded to the nearest $1,000 unless otherwise stated.
76 Public Transport Victoria Annual Report 2017–18
Compliance informationThese general purpose financial statements have been prepared in accordance with the Financial Management Act 1994 (Vic) and applicable Australian Accounting Standards (AASs) which include Interpretations, issued by the Australian Accounting Standards Board (AASB). In particular, they are presented in a manner consistent with the requirements of AASB 1049 Whole of Government and General Government Sector Financial Reporting.Where appropriate, those paragraphs in AASs applicable to not-for-profit entities have been applied. Accounting policies selected and applied in these financial statements ensure that the resulting financial information satisfies the concepts of relevance and reliability, thereby ensuring that the substance of the underlying transactions or other events is reported.

Section 5 Consolidated financial statements 77
2. Funding delivery of services
Introduction Structure PagePTV’s overall objective is to coordinate, provide, operate and maintain a safe, punctual, reliable and clean public transport system.To enable PTV to fulfil its objective and provide outputs as described in Section 3, it receives grants from the Department of Economic Development, Jobs, Transport and Resources (DEDJTR).
2.1 Income that funds the delivery of services 77
2.1 Income that funds the delivery of services Income is recognised to the extent it is probable the economic benefits will flow to PTV and the income can be reliably measured at fair value. Where applicable, amounts disclosed as income are net of taxes. All amounts of income over which PTV does not have control are disclosed as administered income (see Note 4.1).
2.1.1 Grants from Victorian GovernmentIncome from grants from Victorian Government is recognised when PTV obtains control over the grants, or the right to receive the grants.
2.1.2 Supply of transport servicesSupply of transport services is recognised when the service is provided. The income is recognised when the amount of income and transaction costs incurred can be reliably measured, and it is probable that the economic benefits associated with the transaction will flow to PTV.
2.1.3 Fair value of assets and resources received free of chargeContributions of resources received free of charge or for nominal consideration are recognised at fair value when control is obtained over them, irrespective of whether these contributions are subject to restrictions or conditions over their use. Contributions in the form of services are only recognised when a fair value can be reliably determined and the services would have been purchased if not received as a donation.
PTV received $54,912,000 (2017: $55,027,000) use of ticketing assets free of charge from VicTrack. Fair value of the use of ticketing assets free of charge is determined as the depreciation and amortisation charge of ticketing assets. In addition, PTV received other assets worth $2,591,000 (2017: $545,000) free of charge.
2.1.4 Operators’ contribution for marketing and communicationsUnder the current franchise agreements in relation to provision for transport services for train and tram, operators are required to make a contribution towards the costs of marketing and communications. The contribution is recognised as revenue when the deduction for the contribution is made from payments to the transport service operators.
2.1.5 Issuance fee of myki cardsIssuance fee of myki cards is recognised at the time of the sale of myki cards.
2.1.6 Licence fee from advertising panels at bus sheltersA license fee is charged for the right to advertise on panels at bus shelters. This fee is paid by the bus shelter provider and is recognised on a straight line basis over the term of the contract.

78 Public Transport Victoria Annual Report 2017–18
3. The cost of delivering services
Introduction Structure PageThis section provides an account of the expenses incurred by PTV in delivering services and outputs. In Section 2, the funds that enable the provision of services were disclosed and in this note the cost associated with provision of services are recorded.
3.1 Expenses incurred in delivery of services 78
3.2 Capital asset charge 82
3.3 Other operating expenses 83
3.1 Expenses incurred in delivery of services
Consolidated Note
($ thousand)
2018 2017
Service providers and transport agencies 3.1.1 4,844,312 4,400,198
Employee benefit expenses 3.1.2 51,223 45,763
Capital asset charges 3.2 8,355 8,195
Other operating expenses 3.3 105,026 126,018
Total expenses incurred in delivery of services 5,008,916 4,580,174
3.1.1 Service providers and transport agencies
Consolidated Note
($ thousand)
2018 2017
Service providers and transport agencies
Rail system operation and related services(i) 1,716,797 1,437,330
Grants for capital asset charge 1,977,330 1,849,599
Total rail services 3,694,127 3,286,929
Bus services 1,035,425 998,611
Ticketing service operating costs 59,848 59,632
Fair value of free use of ticketing assets 2.1.3 54,912 55,027
Service providers and transport agencies 4,844,312 4,400,198
(i) Of the balance in rail system operation and related services, $22,385,000 (2017: $20,354,000) related to operating and maintenance of the Southern Cross Station building contracted under the Public Private Partnership (PPP) arrangement.

Section 5 Consolidated financial statements 79
Payments to service providers and transport agencies are recognised as an expense in the reporting period in which they are paid or payable. They include transactions such as grants, subsidies and other transfer payments to other agencies, such as V/Line.Grant expenses are contributions of PTV’s resources to V/Line for capital asset charge where there is no expectation that the amount will be repaid in equal value. Grant expenses are recognised as an expense in the reporting period in which they are paid or payable. Grants can take the form of money, assets, goods, services or forgiveness of liabilities.
3.1.2 Employee benefit expenses in the comprehensive operating statement
Consolidated
($ thousand)
2018 2017
Salaries and wages 34,840 28,853
Annual leave and long service leave expense 6,182 6,876
Defined contribution superannuation expenses (excluding salary sacrifice) 5,573 5,981
Termination benefits (Workforce reduction payments) 1,218 477
Other on-costs (fringe benefits tax, payroll tax and WorkCover premium) 3,397 3,495
Ex-gratia expense(i) 13 81
Total employee benefit expenses 51,223 45,763
(i) Ex-gratia expense is also presented in Note 9.1.
Employee benefit expenses include all costs related to employment including wages and salaries, fringe benefits tax, leave entitlements, termination payments and WorkCover premiums.The amount recognised in the consolidated comprehensive operating statement in relation to superannuation is employer contributions for members of both defined benefit and defined contribution superannuation plans that are paid or payable during the reporting period. PTV does not recognise any defined benefit liabilities because it has no legal or constructive obligation to pay future benefits relating to its employees. Instead, the Department of Treasury and Finance (DTF) discloses in its annual financial statements the net defined benefit cost related to the members of these plans as an administered liability (on behalf of the State as the sponsoring employer). Termination benefits are payable when employment is terminated before normal retirement date, or when an employee accepts an offer of benefits in exchange for the termination of employment. Termination benefits are recognised when PTV is demonstrably committed to terminating the employment of current employees according to a detailed formal plan without possibility of withdrawal or providing termination benefits as a result of an offer made to encourage voluntary redundancy. Employee benefit expenses arising directly from the construction or acquisition of property, plant and equipment of $19,485,000 (2017: $26,401,000) have been capitalised and have not been included above.
3.1.3 Employee benefits in the balance sheetProvision is made for benefits accruing to employees in respect of wages and salaries, annual leave and long service leave (LSL) for services rendered to the reporting date and recorded as an expense during the period the services are delivered.
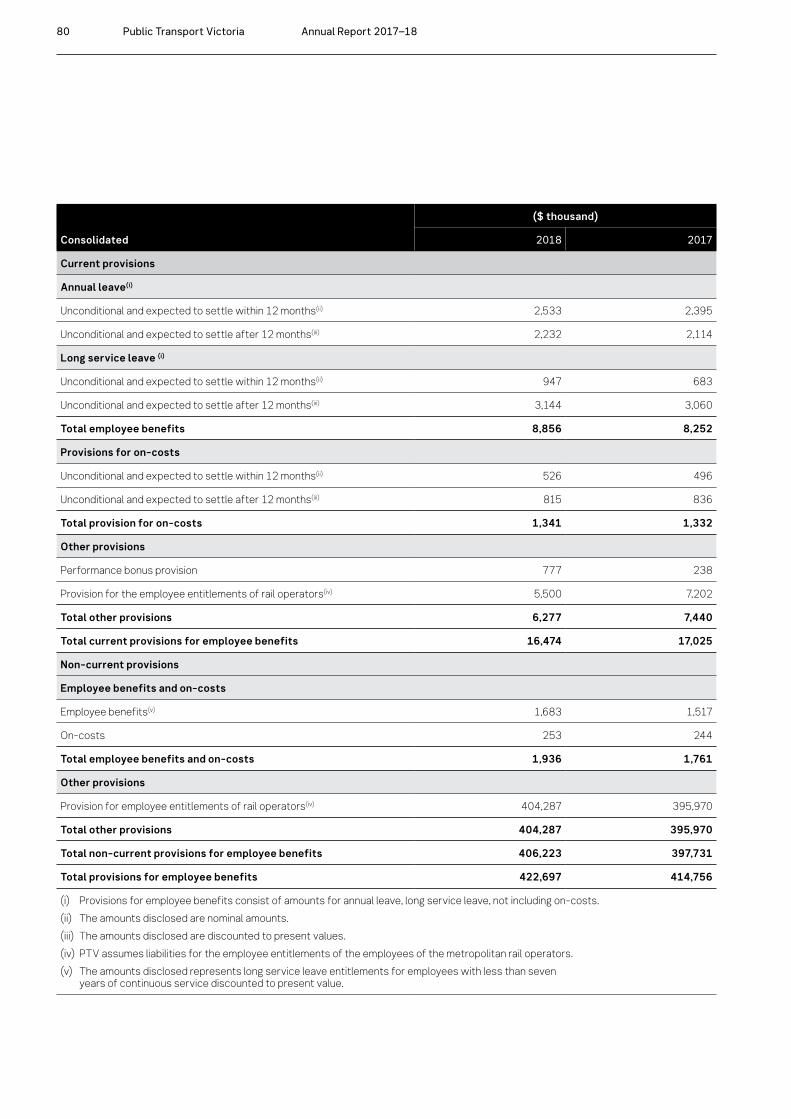
80 Public Transport Victoria Annual Report 2017–18
Consolidated
($ thousand)
2018 2017
Current provisions
Annual leave(i)
Unconditional and expected to settle within 12 months(ii) 2,533 2,395
Unconditional and expected to settle after 12 months(iii) 2,232 2,114
Long service leave (i)
Unconditional and expected to settle within 12 months(ii) 947 683
Unconditional and expected to settle after 12 months(iii) 3,144 3,060
Total employee benefits 8,856 8,252
Provisions for on-costs
Unconditional and expected to settle within 12 months(ii) 526 496
Unconditional and expected to settle after 12 months(iii) 815 836
Total provision for on-costs 1,341 1,332
Other provisions
Performance bonus provision 777 238
Provision for the employee entitlements of rail operators(iv) 5,500 7,202
Total other provisions 6,277 7,440
Total current provisions for employee benefits 16,474 17,025
Non-current provisions
Employee benefits and on-costs
Employee benefits(v) 1,683 1,517
On-costs 253 244
Total employee benefits and on-costs 1,936 1,761
Other provisions
Provision for employee entitlements of rail operators(iv) 404,287 395,970
Total other provisions 404,287 395,970
Total non-current provisions for employee benefits 406,223 397,731
Total provisions for employee benefits 422,697 414,756
(i) Provisions for employee benefits consist of amounts for annual leave, long service leave, not including on-costs.(ii) The amounts disclosed are nominal amounts.(iii) The amounts disclosed are discounted to present values.(iv) PTV assumes liabilities for the employee entitlements of the employees of the metropolitan rail operators.(v) The amounts disclosed represents long service leave entitlements for employees with less than seven
years of continuous service discounted to present value.

Section 5 Consolidated financial statements 81
Reconciliation of movement in provisions
Consolidated
($ thousand)
Annual leave provision
Long service leave
provision On-costs
Performance bonus
provision
Rail operators’ employee
benefits Total
Opening balance at 1 July 2017 4,510 5,260 1,576 238 403,172 414,756
Additional provisions recognised 5,148 1,154 15 1,194 16,715 24,226
Additions due to transfer in 15 95 – – – 110
Reductions transfer out (7) – – – – (7)
Reductions arising from payments/other sacrifices of future economic benefits (4,901) (757) – (655) (10,100) (16,413)
Unwinding of discount and effect of changes in the discount rate – 22 3 – – 25
Closing balance at 30 June 2018 4,765 5,774 1,594 777 409,787 422,697
Current 4,765 4,091 1,341 777 5,500 16,474
Non-current – 1,683 253 – 404,287 406,223
Wages and salaries, annual leave and sick leaveLiabilities for wages and salaries (including non-monetary benefits, annual leave and on-costs) are recognised as part of the employee benefit provision as current liabilities, because PTV does not have an unconditional right to defer settlements of these liabilities.The liability for salaries and wages are recognised in the balance sheet at remuneration rates which are current at the reporting date. As PTV expects the liabilities to be wholly settled within 12 months of reporting date, they are measured at undiscounted amounts.The annual leave liability is classified as a current liability and measured at the undiscounted amount expected to be paid, as PTV does not have an unconditional right to defer settlement of the liability for at least 12 months after the end of the reporting period.No provision has been made for sick leave as all sick leave is non-vesting and it is not considered probable that the average sick leave taken in the future will be greater than the benefits accrued in the future. As sick leave is non-vesting, an expense is recognised in the consolidated comprehensive operating statement as it is taken. Employment on-costs such as payroll tax, workers compensation and superannuation are disclosed separately as a component of the provision for employee benefits when the employment to which they relate has occurred.
Unconditional LSL is disclosed as a current liability; even where PTV does not expect to settle the liability within 12 months because it will not have the unconditional right to defer the settlement of the entitlement should an employee take leave within 12 months.The components of this current LSL liability are measured at:
– undiscounted value – if PTV expects to wholly settle within 12 months; or
– present value – if PTV does not expect to wholly settle within 12 months.
Conditional LSL is disclosed as a non-current liability. There is an unconditional right to defer the settlement of the entitlement until the employee has completed the requisite years of service. This non-current LSL is measured at present value.Any gain or loss following revaluation of the present value of non-current LSL liability is recognised as a transaction, except to the extent that a gain or loss arises due to changes in bond interest rates for which it is then recognised as an ‘other economic flow’ in the net result.

82 Public Transport Victoria Annual Report 2017–18
Provision for employee entitlements of metropolitan rail operators PTV assumes the liabilities for the employee entitlements of the metropolitan rail operators. The current portion of the operator employee entitlements represents amounts expected to be paid to the operators within the next 12 months. The remainder of the operator employee entitlements provision is disclosed as a non-current liability, as the contracts with the public transport operators are not expected to be terminated within the next 12 months. The non-current liability is measured at present value.
Consolidated
($ thousand)
Paid contribution for the year
Contributions outstanding at year end
2018 2017 2018 2017
Defined benefit plans(i)
State Superannuation Fund – revised and new 83 191 1 3
Transport Superannuation Fund 64 77 1 1
Total defined benefit plans 147 268 2 4
Defined contribution plans
VicSuper 2,295 2,560 42 36
Various others 3,023 3,069 64 44
Total defined contribution plans 5,318 5,629 106 80
Total superannuation plans 5,465 5,897 108 84
(i) The basis for determining the level of contributions is determined by the various actuaries of the defined benefit superannuation plans.
3.1.4 Superannuation contributionsEmployees of PTV are entitled to receive superannuation benefits and PTV contributes to both defined benefit and defined contribution plans. The defined benefit plans provide benefits based on years of service and final average salary.As noted before, the defined benefit liability is recognised in DTF as an administered liability. However, superannuation contributions paid or payable for the reporting period are included as part of employee benefits in the comprehensive operating statement of PTV.
3.2 Capital asset chargeA capital asset charge is a charge levied on the written down value of controlled non-current physical asset in an agency’s balance sheet. It aims to attribute to the agency outputs, a cost of capital used in service delivery. Imposing this charge provides incentives for the agency to identify and dispose of underutilised or surplus non-current physical asset.

Section 5 Consolidated financial statements 83
3.3 Other operating expenses
Consolidated
($ thousand)
2018 2017
Supplies and services
Grants for community and social benefits 7,553 7,541
Communications, marketing and information technology 40,969 44,201
Accommodation 6,421 5,521
Insurance, legal and internal audit fees 1,650 1,631
Contractors for services 14,692 36,664
Audit fee 308 256
Total supplies and services 71,593 95,815
Fair value of assets and services provided free of charge 33,433 30,203
Total other operating expenses 105,026 126,018
Other operating expenses generally represent the day-to-day running costs incurred in normal operations. It also includes bad debt expense. Supplies and services are recognised as an expense in the reporting period in which they are incurred. The carrying amounts of any inventories held for distribution are expensed when the inventories are distributed.
Fair value of services provided free of charge or for nominal consideration are recognised at their fair value when the recipient obtains control over the resources, irrespective of whether restrictions or conditions are imposed over the use of the contributions. The exception to this would be when the resource is received from another government department (or agency) as a consequence of a restructuring of administrative arrangements, in which case such a transfer will be recognised at its carrying value in the transferring department or agency. Contributions in the form of services are only recognised when a fair value can be reliably determined and the services would have been purchased if not donated. PTV provided the services of myki ticketing system maintenance free of charge to VicTrack. Fair value of the asset maintenance services $33,433,000 (2017: $30,203,000) is recognised as services provided free of charge.

84 Public Transport Victoria Annual Report 2017–18
4. Disaggregated financial information
Introduction Structure PageThis section provides information on items administered in connection with the provisions of services in relation to public transport and restructuring of administrative arrangements.
4.1 Administered items 84
4.2 Restructuring of administrative arrangements 85
4.1 Administered (non-controlled) itemsIn addition to the specific operations which are included in the consolidated financial statements (consolidated comprehensive operating statement, consolidated balance sheet, consolidated statement of changes in equity and consolidated cash flow statement), PTV administers or manages other activities and resources on behalf of the State. The transactions relating to these State activities are reported as administered items in this note.
Consolidated
($ thousand)
2018 2017
Administered income from transactions
On-the-spot penalty fares – 2,841
Interest revenue – 4
Total administered income from transactions – 2,845
Administered expenses from transactions
Payments into the Consolidated Fund via DEDJTR – (3,233)
Other expenses – (534)
Total administered expenses from transactions – (3,767)
Total administered comprehensive result for the year – (922)
Accumulated administered result at the beginning of the year – 922
Accumulated administered result at the end of the year – –
Administered financial assets
Cash at bank – –
Total administered financial assets – –
Total administered assets – –
PTV administered on-the-spot penalty fares on behalf of the State from 10 August 2014 until 31 December 2016. On-the-spot penalty fares were abolished from December 2016. PTV did not gain control over the assets arising from the on-the-spot penalty fares.

Section 5 Consolidated financial statements 85
4.2 Restructuring of administrative arrangements and other asset transfersPTV had the following asset transfers:
4.2.1 Transfer of rail infrastructure assets from PTV to VicTrackOn 30 June 2018 and 30 June 2017 rail infrastructure assets under construction were transferred from PTV to VicTrack as a capital contribution.
Consolidated
($ thousand)
2018 2017
Assets
Infrastructure assets under construction 492,561 626,855
Net assets transferred to VicTrack(i) 492,561 626,855
(i) Under Transport Integration Act 2010, VicTrack is to act as the custodian and asset manager of the non-operational transport-related land, infrastructure and assets and any other land, infrastructure and assets identified by the Minister.

86 Public Transport Victoria Annual Report 2017–18
5. Key assets available to support output delivery
Introduction Structure PagePTV controls property, plant and equipment, and intangible assets that are utilised in fulfilling its objectives and conducting its activities. They represent the resources that have been entrusted to PTV to be utilised for delivery of those outputs.
5.1 Total property, plant and equipment 86
5.2 Intangible assets 92
5.1 Total property, plant and equipment
Consolidated
($ thousand)
Gross carrying amount Accumulated depreciation Net carrying amount
2018 2017 2018 2017 2018 2017
Land at fair value(i) 512,035 503,734 – – 512,035 503,734
Buildings at fair value(i)(ii) 518,918 535,464 (40,255) (27,252) 478,663 508,212
Infrastructure at fair value(i) 244,558 272,058 (106) (48,962) 244,452 223,096
Plant and equipment at fair value 376 768 (296) (662) 80 106
Leasehold improvement at fair value 4,745 4,745 (3,782) (3,142) 963 1,603
Vehicles at fair value 105,411 102,140 (27,291) (18,896) 78,120 83,244
Cultural assets at fair value 2,238 2,238 (73) (49) 2,165 2,189
Assets under construction at cost 71,927 71,876 – – 71,927 71,876
Net carrying amount 1,460,208 1,493,023 (71,803) (98,963) 1,388,405 1,394,060
(i) PTV conducted a management fair value assessment at the end of the 2017–18 financial year which indicated that the movement in fair value of land and infrastructure assets since the last scheduled revaluation may be material. Therefore, PTV engaged Valuer-General Victoria to conduct an Interim revaluation as at 30 June 2018. Revaluation amounts are included in section 5.1.2.
(ii) Of the balance in buildings, $454,845,000 (2017: $467,107,000) is attributable to the Southern Cross Station building contracted under PPP arrangement.

Section 5 Consolidated financial statements 87
Initial recognition: Items of property, plant and equipment, are measured initially at cost and subsequently revalued at fair value less accumulated depreciation and impairment. Where an asset is acquired for no or nominal cost, the cost is its fair value at the date of acquisition. Assets transferred as part of a machinery of government change are transferred at their carrying amount. The cost of constructed non-financial physical assets includes the cost of all materials used in construction, direct labour on the project and an appropriate proportion of variable and fixed overheads. The cost of leasehold improvements is capitalised and depreciated over the shorter of the remaining term of the lease or their estimated useful lives.The initial cost for non-financial physical assets under a finance lease is measured at amounts equal to the fair value of the leased asset or, if lower, the present value of the minimum lease payments, each determined at the inception of the lease. Also noted that certain assets are acquired under finance leases, which may form part of service concession arrangements (public private partnership).Subsequent measurement: Property, plant and equipment (PPE) are subsequently measured at fair value less accumulated depreciation and impairment. Fair value is determined with regard to the asset’s highest and best use (considering legal or physical restrictions imposed on the asset, public announcements or commitments made in relation to the intended use of the asset) and is summarised above by asset category.
Land and buildings: All PTV land and buildings are specialised. The market approach is used for specialised land, although it is adjusted for the community service obligation (CSO) to reflect the specialised nature of the land being valued. The CSO adjustment is a reflection of the valuer’s assessment of the impact of restrictions associated with an asset to the extent that is also equally applicable to market participants. For PTV’s specialised buildings, the depreciated replacement cost method is used, adjusting for the associated depreciation.
Infrastructure is valued using the depreciated replacement cost method. This cost generally represents the replacement cost of the asset after applying depreciation on a useful life basis.
Cultural assets: For heritage and iconic assets, the cost may be the reproduction cost rather than the replacement cost if those assets’ service potential could only be replaced by reproducing them with the same materials.
Vehicles are valued using the depreciated replacement cost method. PTV acquires new vehicles and at times disposes of them before the end of their economic life. The process of acquisition, use and disposal in the market is managed by experienced fleet managers in PTV who set relevant depreciation rates during use to reflect the utilisation of the vehicles.Refer to Note 8.3 for additional information on fair value determination of property, plant and equipment.
5.1.1 Depreciation and amortisationCharge for the period
Consolidated
($ thousand)
2018 2017
Depreciation and amortisation of property, plant and equipment
Buildings 13,882 13,800
Infrastructure 24,674 24,513
Plant and equipment 26 71
Leasehold improvements 640 691
Vehicles 9,482 9,572
Cultural assets 24 25
Total for property, plant and equipment 48,728 48,672
Amortisation
Intangible assets – 173
Total for intangible assets – 173
Total depreciation and amortisation 48,728 48,845

88 Public Transport Victoria Annual Report 2017–18
All infrastructure assets, buildings, plant and equipment and other non-financial physical assets that have finite useful lives, are depreciated. Depreciation is calculated on a straight-line basis, at rates that allocate the asset’s value, less any estimated residual value, over its estimated useful life. Typical estimated useful lives for the different asset classes for current and prior years are included in the table below:
Asset category
Estimated useful life (years)
2018 2017
Buildings 22–80 22–80
Infrastructure 5–100 5–100
Plant and equipment
– Furniture and fittings 10 10
– Computer equipment 3–4 3–4
– Field plant and scientific equipment 10–30 10–30
– Office machines and equipment 5 5
– IT infrastructure 4 4
Leasehold improvements 5–15 5–15
Vehicles (cars) 3 3
Vehicles (buses) 18 18
Cultural assets 20–100 20–100
The estimated useful lives, residual values and depreciation method are reviewed at the end of each annual reporting period, and adjustments made where appropriate. There have been no changes in the current year.Leasehold improvements are depreciated over the shorter of the lease term and their useful lives.Indefinite life assets: Land, which is considered to have an indefinite life, is not depreciated. Depreciation is not recognised in respect of land because its service potential has not, in any material sense, been consumed during the reporting period.

Section 5 Consolidated financial statements 89

90 Public Transport Victoria Annual Report 2017–18
5.1.2 Reconciliation of movements in carrying amount of property, plant and equipment
Consolidated Note
($ thousand) ($ thousand)
Land Buildings InfrastructurePlant and
equipmentLeasehold
improvement Vehicles Cultural assetsAssets under construction Total
Carrying amount at 30 June 2016 495,451 497,121 241,733 176 2,295 89,608 2,213 71,592 1,400,190
Additions 8,283 24,891 5,399 – – 3,394 – 636,775 678,743
Disposals/write–offs – – – – – (120) – – (120)
Depreciation expense 5.1.1 – (13,800) (24,513) (71) (691) (9,572) (25) – (48,672)
Assets provided as contributed capital 4.2 – – – – – – – (636,492) (636,492)
Assets received free of charge – – 478 – – – – – 478
Assets provided free of charge – – – – – (68) – – (68)
Carrying amount at 30 June 2017 503,734 508,212 223,096 106 1,603 83,244 2,189 71,876 1,394,060
Additions – – 5,018 – – 4,598 – 499,571 509,187
Disposals/write–offs – – (545) – – (240) – (6,958) (7,743)
Depreciation expense 5.1.1 – (13,882) (24,674) (26) (640) (9,482) (24) – (48,728)
Assets provided as contributed capital 4.2 – – – – – – – (492,561) (492,561)
Assets received free of charge – – 2,592 – – – – – 2,592
Net revaluation increments/decrements 8,301 (15,668) 38,965 – – – – – 31,598
Carrying amount at 30 June 2018 512,035 478,663 244,452 80 963 78,120 2,165 71,927 1,388,405

Section 5 Consolidated financial statements 91
5.1.2 Reconciliation of movements in carrying amount of property, plant and equipment
Consolidated Note
($ thousand) ($ thousand)
Land Buildings InfrastructurePlant and
equipmentLeasehold
improvement Vehicles Cultural assetsAssets under construction Total
Carrying amount at 30 June 2016 495,451 497,121 241,733 176 2,295 89,608 2,213 71,592 1,400,190
Additions 8,283 24,891 5,399 – – 3,394 – 636,775 678,743
Disposals/write–offs – – – – – (120) – – (120)
Depreciation expense 5.1.1 – (13,800) (24,513) (71) (691) (9,572) (25) – (48,672)
Assets provided as contributed capital 4.2 – – – – – – – (636,492) (636,492)
Assets received free of charge – – 478 – – – – – 478
Assets provided free of charge – – – – – (68) – – (68)
Carrying amount at 30 June 2017 503,734 508,212 223,096 106 1,603 83,244 2,189 71,876 1,394,060
Additions – – 5,018 – – 4,598 – 499,571 509,187
Disposals/write–offs – – (545) – – (240) – (6,958) (7,743)
Depreciation expense 5.1.1 – (13,882) (24,674) (26) (640) (9,482) (24) – (48,728)
Assets provided as contributed capital 4.2 – – – – – – – (492,561) (492,561)
Assets received free of charge – – 2,592 – – – – – 2,592
Net revaluation increments/decrements 8,301 (15,668) 38,965 – – – – – 31,598
Carrying amount at 30 June 2018 512,035 478,663 244,452 80 963 78,120 2,165 71,927 1,388,405

92 Public Transport Victoria Annual Report 2017–18
5.2 Intangible assets
Consolidated Note
($ thousand)
Capitalised software development
Work in progress (software) Total
2018 2017 2018 2017 2018 2017
Gross carrying amount
Opening balance 8,726 8,726 5,801 5,801 14,527 14,527
Additions – – 12,579 – 12,579 –
Disposals/write-offs – – (5,801) – (5,801) –
Closing balance 8,726 8,726 12,579 5,801 21,305 14,527
Accumulated amortisation and impairment
Opening balance (8,726) (8,553) – – (8,726) (8,553)
Amortisation expense 5.1.1 – (173) – – – (173)
Closing balance (8,726) (8,726) – – (8,726) (8,726)
Net book value at the end of the financial year – – 12,579 5,801 12,579 5,801
Initial recognitionPurchased intangible assets are initially recognised at cost. When the recognition criteria in AASB 138 Intangible Assets is met, internally generated intangible assets are recognised at cost. Subsequently, intangible assets with finite useful lives are carried at cost less accumulated amortisation and accumulated impairment losses. Depreciation and amortisation begins when the asset is available for use, that is, when it is in the location and condition necessary for it to be capable of operating in the manner intended by management.
An internally generated intangible asset arising from development (or from the development phase of an internal project) is recognised if, and only if, all of the following are demonstrated:(a) the technical feasibility of completing the intangible
asset so that it will be available for use or sale;(b) an intention to complete the intangible asset
and use or sell it;(c) the ability to use or sell the intangible asset; (d) the intangible asset will generate probable
future economic benefits;(e) the availability of adequate technical, financial
and other resources to complete the development and to use or sell the intangible asset; and
(f) the ability to measure reliably the expenditure attributable to the intangible asset during its development.
Subsequent measurementIntangible produced assets with finite useful lives, are amortised as an ‘expense from transactions’ on a straight-line basis over their useful lives. Produced intangible assets have useful lives of between 3 and 5 years.
Impairment of intangible assetsIntangible assets with finite useful lives are tested for impairment whenever an indication of impairment is identified.

Section 5 Consolidated financial statements 93
6. Other assets and liabilities
Introduction Structure PageThis section sets out those assets and liabilities that arose from PTV’s controlled operations
6.1 Receivables 93
6.2 Payables 94
6.3 Inventories 96
6.4 Other non-financial assets 96
6.5 Other provisions 96
6.1 Receivables
Consolidated
($ thousand)
2018 2017
Contractual
Amounts owing from government departments and agencies 453,449 459,052
Receivables(i) 17,751 11,693
Provision for doubtful contractual receivables (147) –
Statutory
GST input tax credit recoverable from the ATO 24,762 26,964
Total receivables 495,815 497,709
Represented by
Current receivables 495,815 497,709
(i) The average credit period on sales of goods is 30 days. No interest is charged on receivables.
Contractual receivables are classified as financial instruments and categorised as ‘loans and receivables’. They are initially recognised at fair value plus any directly attributable transaction costs. Subsequent to initial measurement they are measured at amortised cost using the effective interest method, less any impairment. Amounts recognised from the government departments and agencies represent funding for all commitments incurred and are drawn as the commitments fall due.Statutory receivables do not arise from contracts and are recognised and measured similarly to contractual receivables (except for impairment), but are not classified as financial instruments.
Movement in the provision for doubtful debts
Consolidated
($ thousand)
2018 2017
Balance at beginning of the year – –
Increase in provision recognised in the net result (147) –
Balance at end of the year (147) –

94 Public Transport Victoria Annual Report 2017–18
Ageing analysis of contractual receivables
Consolidated
($ thousand)
Carrying amount
Not past due
and not impaired
Past due but not impaired, unless provided
Less than 1 month
1 – 3 months
3 months – 1 year
1 – 5 years
2018
Receivables
Amounts owing from government departments and agencies 453,449 452,504 636 300 9 –
Receivables – current 17,751 16,540 1,102 47 12 50
Total 471,200 469,044 1,738 347 21 50
2017
Receivables
Amounts owing from government departments and agencies 459,052 455,691 1,788 4 1,568 –
Receivables – current 11,693 10,840 570 – 283 –
Total 470,745 466,531 2,358 4 1,851 –
The average credit period for sales of goods/services and for other receivables is 30 days. A provision has been raised for receivables deemed to be impaired. There are no material financial assets that are individually determined to be impaired. Currently PTV does not hold any collateral as security nor credit enhancements relating to any of its financial assets.There are no financial assets that have had their terms renegotiated so as to prevent them from being past due or impaired, and they are stated at the carrying amounts as indicated.
6.2 Payables
Consolidated
($ thousand)
2018 2017
Contractual
Supplies and services 547,078 471,213
Amounts payable to government and agencies 14,889 7,531
Statutory
FBT payable 37 39
Total payables 562,004 478,783
Represented by:
Current payables 562,004 478,783
Payables consist of: – contractual payables, classified as financial
instruments and measured at amortised cost. Accounts payable represent liabilities for goods and services provided to PTV prior to the end of the financial year that are unpaid; and
– statutory payables, that are recognised and measured similarly to contractual payables, but are not classified as financial instruments and not included in the category of financial liabilities at amortised cost, because they do not arise from contracts.
Payables for supplies and services have an average credit period of 30 days, no interest is charged for the first 30 days from the date of the invoice.The terms and conditions of amounts payable to the government departments and agencies vary according to the particular agreements and as they are not legislative payables, they are not classified as financial instruments.

Section 5 Consolidated financial statements 95
Maturity analysis of contractual payables
Consolidated
($ thousand)
Carrying amount
Nominal amount
Maturity dates
Less than 1 month
1 – 3 months
3 months – 1 year
1 – 5 years 5+ years
2018
Payables(i)
Supplies and services 547,078 547,078 547,078 – – – –
Amounts payable to government departments and agencies 14,889 14,889 14,889 – – – –
Total 561,967 561,967 561,967 – – – –
2017
Payables(i)
Supplies and services 471,213 471,213 471,199 14 – – –
Amounts payable to government departments and agencies 7,531 7,531 7,531 – – – –
Total 478,744 478,744 478,730 14 – – –
(i) The amount in payables disclosed excludes statutory payables.

96 Public Transport Victoria Annual Report 2017–18
6.3 Inventories
Consolidated
($ thousand)
2018 2017
Current inventories
Card inventories held for sale at cost 25,394 32,030
Provision for card obsolescence (9,226) (6,627)
Total inventories 16,168 25,403
Inventories are for consumption in the ordinary course of business operations. Inventories are measured at the lower of cost and net realisable value. Cost is assigned to high value, low volume inventory items on a specific identification of cost basis. Basis used in assessing loss of service potential for inventories held for distribution include depreciated replacement cost and technical or functional obsolescence. Technical obsolescence occurs when an item still functions for some or all of the tasks it was originally acquired to do, but no longer matches existing technologies. Functional obsolescence occurs when an item no longer functions the way it did when it was first acquired.
6.4 Other non-financial assets
Consolidated
($ thousand)
2018 2017
Other Current Assets
Prepayments 41,614 355
Total other non-financial assets 41,614 355
Other non-financial assets include prepayments, which represent payments in advance of receipt of goods or services or that part of expenditure made in one accounting period covering a term extending beyond that period. The majority of the prepayments balance above represents contractual payments required for metropolitan train and tram operators where capital works are not yet completed.
6.5 Other provisions
Consolidated
($ thousand)
2018 2017
Other provisions
Current Provision for myki negative card balance 4,000 –
Total current provisions 4,000 –
Non-current provisions
Non-current provision for train replacement 10,173 10,173
Total non-current provisions 10,173 10,173
Total other provisions 14,173 10,173
Other provisions are recognised when PTV has a present obligation, the future sacrifice of economic benefits is probable, and the amount of the provision can be measured reliably. The amount recognised as a provision is the best estimate of the consideration required to settle the present obligation at reporting date, taking into account the risks and uncertainties surrounding the obligation.Where a provision is measured using the cash flows estimated to settle the present obligation, its carrying amount is the present value of those cash flows, using a discount rate that reflects the time, value of money and risks specific to the provision.The provision for myki negative card balances has been calculated based on the balance of expired myki cards with negative balances.
Reconciliation of movement in other provisions
Consolidated
($ thousand)
Train replacement
myki negative
card Total
Opening balance at 30 June 2017 10,173 – 10,173
Additional provisions recognised – 4,000 4,000
Closing balance at 30 June 2018 10,173 4,000 14,173

Section 5 Consolidated financial statements 97
7. Financing operations
Introduction Structure PageThis section provides information on the sources of finance utilised by PTV during its operations, along with interest expenses (the cost of borrowings) and other information related to financing activities of PTV. This section includes disclosure of the balances of the parent, as they are different to the consolidated entity. The differences arise due to treatment of the borrowings for the buses and bus depots held by the controlled entity ‘Franchise Asset Holdings’. There is a finance lease in place between the parent and the controlled entity, and an external loan in the controlled entity. The finance lease is eliminated upon consolidation and therefore the consolidated entity shows only the external loan. The total borrowings of the parent and consolidated entity are the same.This section includes disclosures of balances that are financial instruments (such as borrowings and cash balances). Notes 8.1 provides additional, specific financial instrument disclosures.
7.1 Borrowings 98
7.2 Leases 100
7.3 Cash flow information and balances 101
7.4 Commitments for expenditure 102

98 Public Transport Victoria Annual Report 2017–18
7.1 Borrowings
($ thousand)
Consolidated Parent
2018 2017 2018 2017
Current borrowings
Advances from government(i) 9,903 9,235 9,903 9,235
Loan 8,987 8,983 – –
Motor vehicle and bus depot finance lease liabilities(ii) 200 220 9,187 9,203
Southern Cross Station Transport Interchange Facility finance lease liabilities 3,892 2,740 3,892 2,740
Total current borrowings 22,982 21,178 22,982 21,178
Non-current borrowings
Advances from government(i) – 9,903 – 9,903
Loan 109,745 116,049 – –
Motor vehicle and bus depot finance lease liabilities(ii) 351 301 110,096 116,351
Southern Cross Station Transport Interchange Facility finance lease liabilities 368,591 372,483 368,591 372,483
Total non-current borrowings 478,687 498,736 478,687 498,736
Total borrowings 501,669 519,914 501,669 519,914
(i) These are unsecured loans which bear no interest. The term of a loan is generally agreed by the Minister at the time the advance was provided.
(ii) Secured by the assets leased. Finance leases are effectively secured as the rights to the leased assets revert to the lessor in the event of default.
‘Borrowings’ refer to non-interest bearing liabilities from the Victorian Government and interest bearing liabilities from financial lease arrangements. Borrowings are classified as financial instruments. All interest bearing borrowings are initially recognised at the fair value of the consideration received less directly attributable transaction costs. The measurement basis subsequent to initial recognition depends on whether PTV has categorised its interest bearing liabilities as either ‘financial liabilities designated at fair value through profit or loss’, or financial liabilities at ‘amortised cost’. The classification depends on the nature and purpose of the interest bearing liabilities. PTV determines the classification of its interest bearing liabilities at initial recognition. Defaults and breaches: During the current and prior year, there were no defaults and breaches of any of the loans.
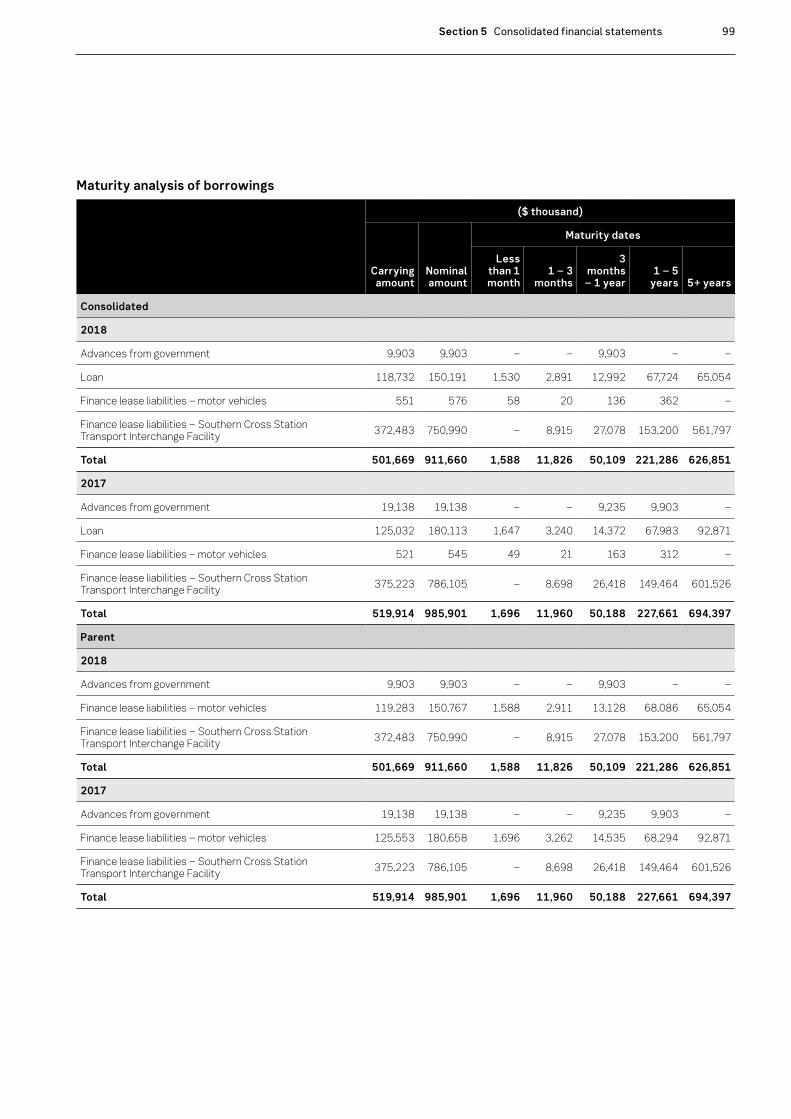
Section 5 Consolidated financial statements 99
Maturity analysis of borrowings
($ thousand)
Carrying amount
Nominal amount
Maturity dates
Less than 1 month
1 – 3 months
3 months
– 1 year1 – 5
years 5+ years
Consolidated
2018
Advances from government 9,903 9,903 – – 9,903 – –
Loan 118,732 150,191 1,530 2,891 12,992 67,724 65,054
Finance lease liabilities – motor vehicles 551 576 58 20 136 362 –
Finance lease liabilities – Southern Cross Station Transport Interchange Facility 372,483 750,990 – 8,915 27,078 153,200 561,797
Total 501,669 911,660 1,588 11,826 50,109 221,286 626,851
2017
Advances from government 19,138 19,138 – – 9,235 9,903 –
Loan 125,032 180,113 1,647 3,240 14,372 67,983 92,871
Finance lease liabilities – motor vehicles 521 545 49 21 163 312 –
Finance lease liabilities – Southern Cross Station Transport Interchange Facility 375,223 786,105 – 8,698 26,418 149,464 601,526
Total 519,914 985,901 1,696 11,960 50,188 227,661 694,397
Parent
2018
Advances from government 9,903 9,903 – – 9,903 – –
Finance lease liabilities – motor vehicles 119,283 150,767 1,588 2,911 13,128 68,086 65,054
Finance lease liabilities – Southern Cross Station Transport Interchange Facility 372,483 750,990 – 8,915 27,078 153,200 561,797
Total 501,669 911,660 1,588 11,826 50,109 221,286 626,851
2017
Advances from government 19,138 19,138 – – 9,235 9,903 –
Finance lease liabilities – motor vehicles 125,553 180,658 1,696 3,262 14,535 68,294 92,871
Finance lease liabilities – Southern Cross Station Transport Interchange Facility 375,223 786,105 – 8,698 26,418 149,464 601,526
Total 519,914 985,901 1,696 11,960 50,188 227,661 694,397

100 Public Transport Victoria Annual Report 2017–18
Interest expenses
($ thousand)
Consolidated Parent
2018 2017 2018 2017
Interest on loan 9,130 8,193 – –
Interest on finance leases(i) 32,382 32,559 41,512 40,752
Total interest expenses 41,512 40,752 41,512 40,752
(i) Of the balance in interest on finance leases, $32,375,000 (2017: $32,556,000) relates to Southern Cross Station contracted under the Public Private Partnership (PPP) arrangement.
‘Interest expense’ includes costs incurred in connection with the borrowing of funds and includes interest on short term and long term borrowings and interest component of finance leases repayments.Interest expense is recognised in the period in which it is incurred.
7.2 Leases7.2.1 Finance lease liabilities (PTV as lessee)
($ thousand)
Minimum future lease payments(i)Present value of minimum
future lease payments
Consolidated Parent Consolidated Parent
2018 2017 2018 2017 2018 2017 2018 2017
Commissioned PPP related finance lease liabilities payable
Not longer than one year 35,993 35,116 35,993 35,116 3,892 2,740 3,892 2,740
Longer than one year and not longer than five years 153,200 149,464 153,200 149,464 29,776 23,791 29,776 23,791
Longer than five years 561,797 601,526 561,797 601,526 338,815 348,692 338,815 348,692
Other finance lease liabilities payable(ii)
Not longer than one year 214 233 17,627 19,471 200 220 9,187 9,201
Longer than one year and not longer than five years 362 312 68,086 67,695 351 301 44,750 37,505
Longer than five years – – 65,054 85,650 – – 65,346 78,846
Minimum future lease payments 751,566 786,650 901,757 958,922 373,034 375,744 491,766 500,776
Less future finance charges (378,532) (410,906) (409,991) (458,146) – – – –
Present value of minimum lease payments 373,034 375,744 491,766 500,776 373,034 375,744 491,766 500,776
Included in the financial statements as:
Current borrowings – – – – 4,092 2,960 13,079 11,942
Non-current borrowings – – – – 368,942 372,784 478,687 488,834
Total interest bearing liabilities – – – – 373,034 375,744 491,766 500,776
(i) Minimum future lease payments include the aggregate of all lease payments and any guaranteed residual.(ii) Other finance lease liabilities include obligations that are recognised on the balance sheet; the future payments
related to operating lease commitments are disclosed in Note 7.4.

Section 5 Consolidated financial statements 101
Leasing arrangements – Commissioned public private partnershipThe Services and Development Agreement for the redevelopment of Southern Cross Station with Civic Nexus Pty Ltd (CNPL) as disclosed in Note 7.4.2 is deemed a finance lease as it effectively transfers the risks and benefits incidental to ownership of the leased assets to the State. Please refer to Note 7.4.2 for details.Up to the last quarter of 2014, the actual cash payments to CNPL were less than the deemed finance lease interest expense. The finance lease liability increased to approximately $378 million at the last quarter of 2014 when the cash payments overtook the value of the finance lease interest. After the last quarter of 2014, the actual cash payments to CNPL are more than the deemed finance lease interest expense.
Other finance lease liabilitiesThe other finance leases entered into by PTV relate to buses with a lease term of the same duration as the franchise term of seven years with an option to extend for a further three years; and motor vehicles with lease terms of three years or 60,000 kilometres, whichever occurs first.
Franchise Asset Holdings as lessorAmount due from PTV as lessee under finance lease is recorded as receivable. Finance lease receivable is initially recorded at amount equal to the present value of the minimum lease payments receivable. Finance lease receipts are apportioned between periodic interest income and reduction of the lease receivable over the term of the lease in order to reflect a constant periodic rate of return on the net investment outstanding in respect of the lease.In preparing the consolidated balance sheet, finance lease receivable and payable between the consolidated entities are eliminated.
7.3 Cash flow information and balancesDue to the State’s investment policy and funding arrangements, PTV does not hold a large cash reserve in its bank accounts. Cash and deposits, including cash equivalents, comprise cash on hand, cash at bank, deposits at call with the Treasury Corporation of Victoria with maturity of three months or less. These are held for meeting short-term cash commitments rather than for investment purposes, and which are readily convertible to known amounts of cash and are subject to an insignificant risk of changes in value.
Consolidated
($ thousand)
2018 2017
Cash and bank deposits 25,991 24,915
Deposits with Treasury Corporation of Victoria 10,226 10,213
Balance as per cash flow statement 36,217 35,128

102 Public Transport Victoria Annual Report 2017–18
7.3.1 Reconciliation of net result for the period to cash flow from operating activities
Consolidated
($ thousand)
2018 2017
Net result from continuing operations for the period 72,647 (34,448)
Non-cash movements
Loss on disposal of non-financial assets 657 54
Depreciation and amortisation of non-financial assets 48,728 48,845
Net fair value of assets and services received and provided free of charge (24,070) (25,301)
Revaluation of long service leave liabilities due to changes in bond rates 39 (223)
Changes in fair value of foreign currency forward contracts – (241)
Movements in assets and liabilities
Decrease in receivables 126,181 52,810
(Increase)/decrease in other non-financial assets (41,259) 152
Decrease in inventories 9,235 12,463
Increase in payables 130,535 24,897
Increase in provisions 12,086 16,907
Net cash flows from operating activities 334,779 95,915
7.3.2 Non-cash financing and investing activities
($ thousand)
Consolidated Parent
2018 2017 2018 2017
Acquisition of property, plant and equipment by means of finance leases
4,598 300 262 36,569
Total non-cash financing and investing activities 4,598 300 262 36,569
7.3.3 Cashflow statement of the parentThe cashflow statement of the parent is the same as the consolidated cashflow statement, with the exception of the following items. The amounts represent the parent cashflow:
Parent
($ thousand)
2018 2017
Proceeds from loans – –
Repayment/ Proceeds of finance lease liability (9,011) 24,754
The net cashflow from financing activities and the net increase in cash is the same for the parent and the consolidated entity.
7.4 Commitments for expenditureCommitments for future expenditure include operating and capital commitments arising from contracts. These commitments are recorded below at their nominal value and inclusive of GST. Where it is considered appropriate and provides additional relevant information to users, the net present values of significant individual projects are stated. These future expenditures cease to be disclosed as commitments once the related liabilities are recognised in the balance sheet.

Section 5 Consolidated financial statements 103
7.4.1 Total commitments payable(i)
Consolidated
($ thousand)
2018 Nominal value 2017 Nominal value
Rail service commitments payable
Less than 1 year 2,053,098 717,958
Longer than 1 year but not longer than 5 years 7,518,135 203,505
5 years or more 2,017,554 43,690
Total rail service commitments 11,588,787 965,153
Bus service commitments payable
Less than 1 year 844,217 1,147,980
Longer than 1 year but not longer than 5 years 1,665,606 815,942
5 years or more 758,129 –
Total bus service commitments 3,267,952 1,963,922
Ticketing and call centre service commitments payable
Less than 1 year 110,392 105,528
Longer than 1 year but not longer than 5 years 484,441 455,049
5 years or more 45,252 167,264
Total ticketing and call centre service commitments 640,085 727,841
Operating lease commitments payable(ii)
Less than 1 year 10,959 10,933
Longer than 1 year but not longer than 5 years 4,607 16,089
5 years or more – 1,351
Total operating lease commitments 15,566 28,372
Capital expenditure commitments payable
Less than 1 year 505,113 555,361
Longer than 1 year but not longer than 5 years 340,815 501,133
5 years or more 37,348 16,652
Total capital expenditure commitments 883,276 1,073,146
PPP operation and maintenance commitments
Minimum lease payments for non-cancellable leases payable
Less than 1 year 20,697 24,685
Longer than 1 year but not longer than 5 years 103,079 101,648
5 years or more 421,315 448,008
Total PPP lease commitments 545,091 574,341
Table continued on next page
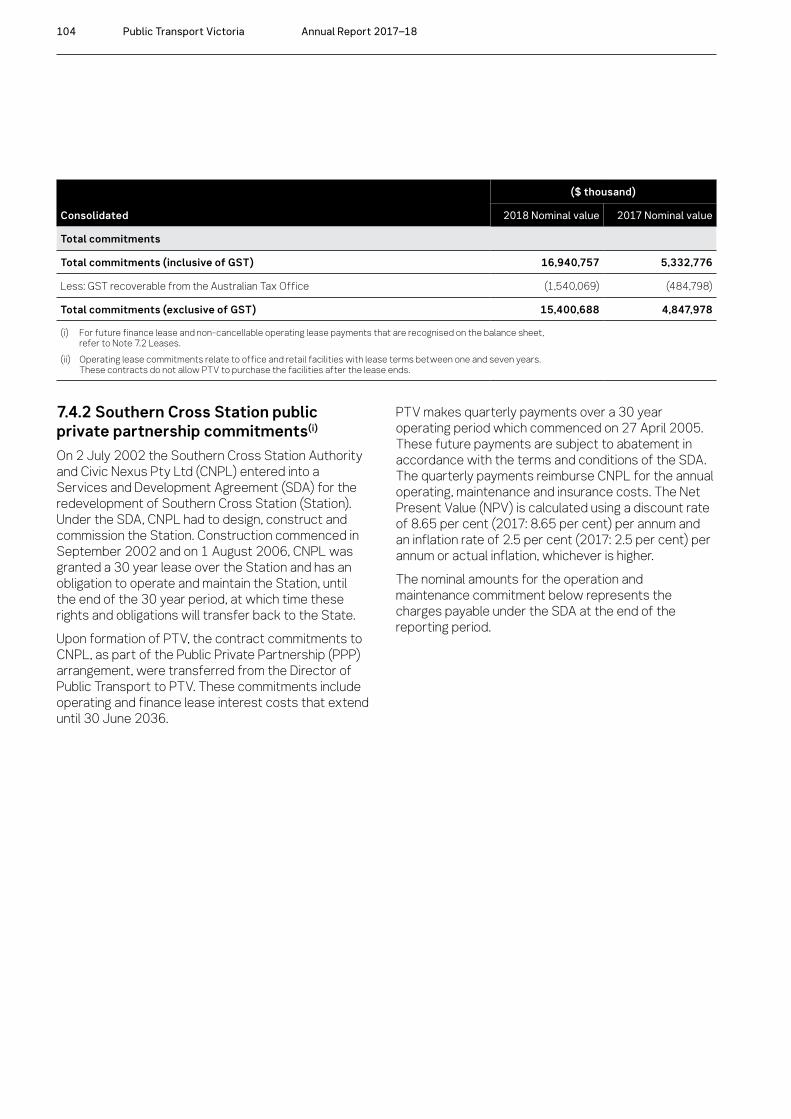
104 Public Transport Victoria Annual Report 2017–18
Consolidated
($ thousand)
2018 Nominal value 2017 Nominal value
Total commitments
Total commitments (inclusive of GST) 16,940,757 5,332,776
Less: GST recoverable from the Australian Tax Office (1,540,069) (484,798)
Total commitments (exclusive of GST) 15,400,688 4,847,978
(i) For future finance lease and non-cancellable operating lease payments that are recognised on the balance sheet, refer to Note 7.2 Leases.
(ii) Operating lease commitments relate to office and retail facilities with lease terms between one and seven years. These contracts do not allow PTV to purchase the facilities after the lease ends.
7.4.2 Southern Cross Station public private partnership commitments(i)
On 2 July 2002 the Southern Cross Station Authority and Civic Nexus Pty Ltd (CNPL) entered into a Services and Development Agreement (SDA) for the redevelopment of Southern Cross Station (Station). Under the SDA, CNPL had to design, construct and commission the Station. Construction commenced in September 2002 and on 1 August 2006, CNPL was granted a 30 year lease over the Station and has an obligation to operate and maintain the Station, until the end of the 30 year period, at which time these rights and obligations will transfer back to the State.Upon formation of PTV, the contract commitments to CNPL, as part of the Public Private Partnership (PPP) arrangement, were transferred from the Director of Public Transport to PTV. These commitments include operating and finance lease interest costs that extend until 30 June 2036.
PTV makes quarterly payments over a 30 year operating period which commenced on 27 April 2005. These future payments are subject to abatement in accordance with the terms and conditions of the SDA. The quarterly payments reimburse CNPL for the annual operating, maintenance and insurance costs. The Net Present Value (NPV) is calculated using a discount rate of 8.65 per cent (2017: 8.65 per cent) per annum and an inflation rate of 2.5 per cent (2017: 2.5 per cent) per annum or actual inflation, whichever is higher.The nominal amounts for the operation and maintenance commitment below represents the charges payable under the SDA at the end of the reporting period.

Section 5 Consolidated financial statements 105
Consolidated
($ thousand)
2018 2017
Commissioned public private partnership(i) (ii) (iii) (iv)Net present
valueNominal
valueNet present
valueNominal
value
Southern Cross Station operation and maintenance commitments 258,337 545,091 262,526 574,341
Total PPP operation and maintenance commitment 258,337 545,091 262,526 574,341
(i) The present values of the minimum lease payments for commissioned PPP are recognised on the balance sheet and are not disclosed as commitments.
(ii) The year on year decrease in the nominal amounts of the commitments mainly reflects the payments made, the additional operating and maintenance requirements, and the impact of changes in estimates of future inflation rates.
(iii) The year on year decrease in the present values of the commitments mainly reflects the payments made, the additional operating and maintenance requirements, the impact of changes in estimates of future inflation rates and the discounting period being one reporting period shorter.
(iv) The total commitments do not equal the sum of the minimum lease payments and other commitments because they are discounted, whereas total commitments are at nominal value.
7.4.3 Commitments other than public private partnership(i)
Consolidated
($ thousand)
2018 Nominal value 2017 Nominal value
Rail service commitments
Transport service provided by rail operators 11,588,787 965,153
Total rail service commitments 11,588,787 965,153
Bus service commitments
Transport service provided by bus operators 3,267,952 1,963,922
Total bus service commitments 3,267,952 1,963,922
Ticketing and call centre service commitments
Ticketing and call centre services provided by operators 640,085 727,841
Total ticketing and call centre service commitments 640,085 727,841
Operating lease commitments
Office and retail 15,566 28,372
Total operating lease commitments 15,566 28,372
Capital expenditure commitments
Transport infrastructure and rolling stock 883,276 1,073,146
Total capital expenditure commitments 883,276 1,073,146
Total commitments other than public private partnerships 16,395,666 4,758,435
(i) Figures presented are inclusive of GST.

106 Public Transport Victoria Annual Report 2017–18
Metropolitan rail and bus commitments
PTV entered into a number of contracts with private operators to provide Victoria’s train, tram and bus services. The current contracts with Metro Trains Melbourne (Metro Trains) and Keolis Downer (Yarra Trams) commenced on 30 November 2017 and have an initial franchise period of seven years (with the possibility of up to three years extension at the option of the State). Under the terms of these franchise contracts, the subsidies are provided for transport services and capital commitments.The commitments with Metro Trains and Yarra Trams have been calculated up to the end of the franchise period with the exception of the rolling stock lease payments for which PTV is legally committed beyond the initial franchise period.Bus services are covered by long term service contracts established with the bus service operators. Commitments of the bus service contracts are determined from the service fees payable during the term of the service contracts. The metropolitan bus services contracts (MBSCs) expired on 30 June 2018. New contracts were signed with three of the operators of metropolitan buses prior to 30 June 2018, and have been included in commitments above. The remaining MBSCs were signed by 31 July 2018 and have been included in section 9.8 subsequent events.
V/Line rail services A new partnership agreement was signed between PTV and V/Line to provide regional train and bus services, effective from 1 January 2018 to 1 January 2023. PTV have the option to extend the agreement for 2 further 5 year periods.
Capital expenditure commitmentsCapital expenditure commitments include contracts for capital projects relating to infrastructure and transport related projects separate and in addition to the commitments entered into through the partnership agreements (which include rolling stock and branding projects). These contracts for commitments were signed prior to 30 June 2018 and have established a legal and binding obligation on PTV to make future payments.
Operating lease commitmentsOperating lease commitments include contracts for office and retail accommodation.
Ticketing and call centre service commitmentsThe new myki ticketing system services contract commenced on 1 January 2017. The new contract will improve service delivery and meet customer demand by providing strong incentives to maximise the availability of the system for customer use, rapidly respond to system outages and focus on system presentation and throughput. In addition, the new contract will also allow for overall public transport growth and the flexibility to implement changes to the ticketing system.

Section 5 Consolidated financial statements 107
8. Risks, contingencies and valuation judgements
Introduction Structure PagePTV is exposed to risk from its activities and outside factors. In addition, it is often necessary to make judgements and estimates associated with recognition and measurement of items in the financial statements. This section sets out financial instrument specific information, (including exposures to financial risks) as well as those items that are contingent in nature or require a higher level of judgement to be applied.
8.1 Financial instruments specific disclosures 107
8.2 Contingent assets and contingent liabilities 115
8.3 Fair value determination 116
8.1 Financial instruments specific disclosuresIntroductionFinancial instruments arise out of contractual agreements that give rise to a financial asset of one entity and a financial liability or equity instrument of another entity. Due to the nature of PTV’s activities, certain financial assets and financial liabilities arise under statute rather than a contract (for example taxes). Such assets and liabilities do not meet the definition of financial instruments in AASB 132 Financial Instruments: Presentation.Guarantees issued on behalf of PTV are financial instruments because, although authorised under statute, terms and conditions for each financial guarantee may vary and are subject to an agreement.
Categories of financial instrumentsLoans, receivables and cash are financial instrument assets with fixed and determinable payments that are not quoted on an active market. These assets and liabilities are initially recognised at fair value plus any directly attributable transaction costs. Subsequent to initial measurement, loans and receivables are measured at amortised cost using the effective interest method (and for assets, less any impairment). PTV recognises the following assets in this category:
– cash and deposits – receivables (excluding statutory receivables); – term deposits.
Financial liabilities at amortised cost are initially recognised on the date they are originated. They are initially measured at fair value plus any directly attributable transaction costs. Subsequent to initial recognition, these financial instruments are measured at amortised cost with any difference between the initial recognised amount and the redemption value being recognised in profit and loss over the period of the interest bearing liability, using the effective interest rate method. PTV recognises the following liabilities in this category:
– payables (excluding statutory payables); and – borrowings (including finance lease liabilities).
Derecognition of financial assets: A financial asset (or, where applicable, a part of a financial asset or part of a group of similar financial assets) is derecognised when:
– the rights to receive cash flows from the asset have expired; or
– PTV has transferred its rights to receive cash flows from the asset and either;
– has transferred substantially all the risks and rewards of the asset; or
– has neither transferred nor retained substantially all the risks and rewards of the asset, but has transferred control of the assets.

108 Public Transport Victoria Annual Report 2017–18
Impairment of financial assets: At the end of each reporting period, PTV assesses whether there is objective evidence that a financial asset or group of financial assets is impaired. All financial instrument assets are subject to annual review for impairment.The allowance is the difference between the financial asset’s carrying amount and the present value of estimated future cash flows, discounted at the effective interest rate. In assessing impairment
8.1.1 Financial instruments: Categorisation(i)
Consolidated
($ thousand)
Contractual financial assets
– loans and receivables
and cash
Contractual financial liabilities at amortised cost Total
2018
Contractual financial assets
Cash and deposits 36,217 36,217
Receivables
Amounts owing from government departments and agencies 453,449 453,449
Receivables – current 17,604 17,604
Total contractual financial assets(ii) 507,270 507,270
Contractual financial liabilities
Payables
Supplies and services 547,078 547,078
Amounts payable to government departments and agencies 14,889 14,889
Borrowings
Advances from government 9,903 9,903
Loan(iv) 118,732 118,732
Finance lease liabilities – motor vehicles 551 551
Finance lease liabilities – Southern Cross Station Transport Interchange Facility 372,483 372,483
Total contractual financial liabilities(iii) (iv) 1,063,636 1,063,636
of statutory (non-contractual) financial assets, which are not financial instruments, professional judgement is applied in assessing materiality using estimates, averages and other computational methods in accordance with AASB 136 Impairment of Assets.Derecognition of financial liabilities: A financial liability is derecognised when the obligation under the liability is discharged, cancelled or expires.

Section 5 Consolidated financial statements 109
Consolidated
($ thousand)
Contractual financial assets
– loans and receivables
and cash
Contractual financial liabilities at amortised cost Total
2017
Contractual financial assets
Cash and deposits 35,128 35,128
Receivables
Amounts owing from government departments and agencies 459,052 459,052
Receivables – current 11,693 11,693
Total contractual financial assets(ii) 505,873 505,873
Contractual financial liabilities
Payables
Supplies and services 471,213 471,213
Amounts payable to government departments and agencies 7,531 7,531
Borrowings
Advances from government 19,138 19,138
Loan(iv) 125,032 125,032
Finance lease liabilities – motor vehicles 521 521
Finance lease liabilities – Southern Cross Station Transport Interchange Facility 375,223 375,223
Total contractual financial liabilities(iii) 998,658 998,658
(i) The amount disclosed represents the carrying amount for the reporting period. (ii) The amount of receivables disclosed excludes statutory receivables (i.e GST input tax credit recoverable).(iii) The amount of payables disclosed excludes statutory payables (i.e. GST output tax payable).(iv) For the parent entity, the amount disclosed as loan above is included within finance lease liabilities (refer to section 7.1).
8.1.2 Financial instruments – net holding gain/(loss) on financial instruments by category
Consolidated
Total interest expense
($ thousand)
2018 2017
Contractual financial assets
Financial assets - cash and deposits 1,055 1,412
Total contractual financial assets 1,055 1,412
Contractual financial liabilities
Financial liabilities at amortised cost(i) (32,382) (32,559)
Total contractual financial liabilities (32,382) (32,559)
(i) Includes interest for Southern Cross Station Transport Interchange Facility.

110 Public Transport Victoria Annual Report 2017–18
The net holding gain/(loss) disclosed above is determined as follows:
– for financial assets – cash and deposit, the net gain is the interest income.
– for financial liabilities measured at amortised cost, the loss is the interest expense.
8.1.3 Financial risk management objectives and policies
Credit risk Liquidity risk Market risk
Financial risks
Interest rate risk
As a whole, PTV’s financial risk management program seeks to manage these risks and the associated volatility of its financial performance. Details of the significant accounting policies and methods adopted, including the criteria for recognition, the basis of measurement, and the basis on which income and expenses are recognised, with respect to each class of financial asset, financial liability and equity instrument above are disclosed in Note 8.3 to the financial statements.The main purpose in holding financial instruments is to prudentially manage PTV’s financial risks within the government policy parameters.PTV’s main financial risks include credit risk, liquidity risk and interest rate risk. PTV manages these financial risks in accordance with its financial risk management policy. PTV uses different methods to measure and manage the different risks to which it is exposed. Primary responsibility for the identification and management of financial risks rests with the Chief Executive Officer of PTV.
Financial instruments: Credit risk Credit risk refers to the possibility that a borrower will default on its financial obligations as and when they fall due. PTV’s exposure to credit risk arises from the potential default of a counter party on their contractual obligations resulting in financial loss to PTV. Credit risk is measured at fair value and is monitored on a regular basis.Credit risk associated with PTV’s contractual financial assets is minimal because the main debtor is the Victorian Government. For debtors other than the Government, it is PTV’s policy to only deal with entities with high credit ratings of a minimum triple-B rating and to obtain sufficient collateral or credit enhancements, where appropriate.In addition, PTV does not engage in hedging for its contractual financial assets and mainly obtains contractual financial assets that are on fixed interest, except for cash and deposits, which are mainly cash at bank. As with the policy for debtors, PTV’s policy is to only deal with banks with high credit ratings.Provision of impairment for contractual financial assets is recognised when there is objective evidence that PTV will not be able to collect a receivable. Objective evidence includes financial difficulties of the debtor, default payments, debts that are more than 60 days overdue, and changes in debtor credit ratings. Except as otherwise detailed in the following table, the carrying amount of contractual financial assets recorded in the financial statements, net of any allowances for losses, represents PTV’s maximum exposure to credit risk without taking account of the value of any collateral obtained.There has been no material change to PTV’s credit risk profile in 2017–18.

Section 5 Consolidated financial statements 111
Credit quality of contractual financial assets that are neither past due nor impaired
Consolidated
($ thousand)
Government agencies (AAA
credit rating)Other (AA credit
rating)
Other (min triple–B credit
rating) Total
2018
Cash and deposits 10,226 25,991 – 36,217
Receivables
Amounts owing from government departments and agencies 453,449 – – 453,449
Receivables – current – – 17,604 17,604
Total contractual financial assets 463,675 25,991 17,604 507,270
2017
Cash and deposits 10,213 24,915 – 35,128
Receivables
Amounts owing from government departments and agencies 459,052 – – 459,052
Receivables – current – – 11,693 11,693
Total contractual financial assets 469,265 24,915 11,693 505,873
Financial instruments: Liquidity risk Liquidity risk arises from being unable to meet financial obligations as they fall due. PTV operates under the Government fair payments policy of settling financial obligations within 30 days and in the event of a dispute, making payments within 30 days from the date of resolution. PTV is exposed to liquidity risk mainly through the financial liabilities as disclosed in the face of the balance sheet and the amounts related to financial guarantees. PTV manages its liquidity risk by:
– close monitoring of its short-term and long-term borrowings by senior management, including monthly reviews on current and future borrowing levels and requirements;
– maintaining an adequate level of uncommitted funds that can be drawn at short notice to meet its short-term obligations;
– careful maturity planning of its financial obligations based on forecasts of future cash flows; and
– a high credit rating for the State of Victoria (Moody’s Investor Services and Standard & Poor’s triple–A, which assists in accessing debt market at a lower interest rate).
PTV’s exposure to liquidity risk is deemed insignificant based on prior periods’ data and current assessment of risk. Cash for unexpected events is generally sourced from DEDJTR.The carrying amount detailed in the maturity analysis of contractual financial liabilities (refer to 6.2) represents PTV’s maximum exposure to liquidity risk.
Financial instruments: Market riskPTV’s exposures to market risk are primarily through interest rate risk. Objectives, policies and processes used to manage each of these risks are disclosed below.
Sensitivity disclosure analysis and assumptionsPTV’s sensitivity to market risk is determined based on the observed range of actual historical data for the preceding 5 year period, with all variables other than the primary risk variable held constant. PTV’s fund managers cannot be expected to predict movements in market rates and prices. Sensitivity analyses shown are for illustrative purposes only. The following movements are ‘reasonably possible’ over the next 12 months:
– a movement of 100 basis points up and down in market interest rates (AUD).

112 Public Transport Victoria Annual Report 2017–18
Interest rate riskFair value interest rate risk is the risk that the fair value of a financial instrument will fluctuate because of changes in market interest rates. PTV does not hold any interest bearing financial instruments that are measured at fair value, therefore has nil exposure to fair value interest rate risk.Cash flow interest rate risk is the risk that the future cash flows of a financial instrument will fluctuate because of changes in market interest rates.
PTV has minimal exposure to cash flow interest rate risks on cash and deposits at floating rate.PTV manages this risk by mainly undertaking fixed rate or non-interest bearing financial instruments with relatively even maturity profiles, with only insignificant amounts of financial instruments at floating rate. The carrying amounts of financial assets and financial liabilities that are exposed to interest rates are set out in the following table.

Section 5 Consolidated financial statements 113
Table continued on next page
Interest rate exposure of financial instruments
Consolidated
($ thousand)
Weighted average
effective interest
rate %Carrying
amount
Interest rate exposure
Fixed interest
rate
Variable interest
rate
Non-interest bearing
2018
Financial assets
Cash and deposits 1.55% 36,217 10,226 25,986 5
Receivable(i)
Amounts owing from government departments and agencies – 453,449 – – 453,449
Receivables – current – 17,604 – – 17,604
– 507,270 10,226 25,986 471,058
Financial liabilities
Payables(i)
Supplies and services – 547,078 – – 547,078
Amounts payable to government departments and agencies – 14,889 – – 14,889
Borrowings
Advances from government – 9,903 – – 9,903
Loan(ii) 5.69% 118,732 118,732 – –
Finance lease liabilities – motor vehicles 3.36% 551 551 – –
Finance lease liabilities – Southern Cross Station Transport Interchange Facility 8.65% 372,483 372,483 – –
– 1,063,636 491,766 – 571,870
2017
Financial assets
Cash and deposits 1.69% 35,128 10,213 24,911 4
Receivable(i)
Amounts owing from government departments and agencies – 459,052 – – 459,052
Receivables – current – 11,693 – – 11,693
– 505,873 10,213 24,911 470,749

114 Public Transport Victoria Annual Report 2017–18
Consolidated
($ thousand)
Weighted average
effective interest
rate %Carrying
amount
Interest rate exposure
Fixed interest
rate
Variable interest
rate
Non-interest bearing
Financial liabilities
Payables(i)
Supplies and services – 471,213 – – 471,213
Amounts payable to government departments and agencies – 7,531 – – 7,531
Borrowings
Advances from government – 19,138 – – 19,138
Loan(ii) 5.87% 125,032 125,032 – –
Finance lease liabilities – motor vehicles 3.69% 521 521 – –
Finance lease liabilities – Southern Cross Station Transport Interchange Facility 8.65% 375,223 375,223 – –
– 998,658 500,776 – 497,882
(i) The carrying amounts disclosed here exclude statutory amounts (e.g. GST input tax credit recoverable).(ii) For the parent entity, the amount disclosed as loan above is included within finance lease liabilities (refer to section 7.1).
Interest rate sensitivityTaking into account past performance, future expectations and economic forecasts, PTV believes that interest rate movements, a parallel shift of +1.0 percent and -1.0 percent in market interest rates from year-end rates, will not have a material impact on its financial position. PTV’s management cannot be expected to predict movement in market rates and prices; sensitivity analysis shown is for illustrative purposes only.The following table discloses the impact on PTV’s net result and equity for each category of financial instrument held by PTV at year-end as presented to key management personnel, if the above movements were to occur.

Section 5 Consolidated financial statements 115
Consolidated
($ thousand)
Carrying amount
Interest rate
-100 basis points +100 basis points
Net result Equity Net result Equity
2018
Contractual financial assets
Cash and deposits(i) 36,212 (362) (362) 362 362
Total impact – (362) (362) 362 362
2017
Contractual financial assets
Cash and deposits(i) 35,124 (351) (351) 351 351
Total impact – (351) (351) 351 351
(i) Cash and deposits include deposits of $36,212 thousand (2017: $35,124 thousand) that is exposed to floating rate movements. Sensitivities to these movements are calculated as follows:
– 2018: $36,212 thousand x -0.01 = -$362 thousand; and $36,212 thousand x 0.01 = $362 thousand; and – 2017: $35,124 thousand x -0.01 = -$351 thousand; and $35,124 thousand x 0.01 = $351 thousand.
8.2 Contingent assets and contingent liabilitiesContingent assets and contingent liabilities are not recognised in the balance sheet but are disclosed and, if quantifiable, are measured at nominal value.Contingent assets and liabilities are presented inclusive of GST receivable or payable respectively.
Contingent liabilities Contingent liabilities are:
– possible obligations that arise from past events. Existence will be confirmed only by the occurrence or non-occurrence of one or more uncertain future events not wholly within the control of the entity; or
– present obligations that arise from past events but are not recognised because:
– it is not probable that an outflow of resources embodying economic benefits will be required to settle the obligations; or
– the amount of the obligations cannot be measured with sufficient reliability.
Contingent liabilities are also classified as either quantifiable or non-quantifiable (2017: nil).
Non-quantifiable contingent liabilitiesPTV has a possible liability relating to a claim from a contractor. This claim is dependent upon the outcome of a market-led development proposal. It is not possible to estimate the financial effect until the proposal has been assessed.
Public transport rail partnership agreementsPTV is party to partnership contractual arrangements with franchisees to operate metropolitan rail transport services in the State, operative from 30 November 2017 until 30 November 2024. The following summarises the major contingent liabilities arising from the contractual arrangements in the event of early termination or expiry of the partnership contractual agreement, which are:
Partnership assetsTo maintain continuity of services, at early termination or expiry of the franchise contract, assets will revert to PTV or a successor. In the case of some assets, a reversion back to PTV would entail those assets being purchased.
Unfunded SuperannuationAt the early termination or expiry of the contract, PTV will assume any unfunded superannuation amounts (apart from contributions the operator is required to pay over the contract term) to the extent that the State becomes the successor operator.

116 Public Transport Victoria Annual Report 2017–18
8.3 Fair value determinationThis section sets out information on how PTV determined fair value for financial reporting purposes. Fair value is the price that would be received to sell an asset or paid to transfer a liability in an orderly transaction between market participants at the measurement date. The following assets and liabilities are carried at fair value:
– financial assets and liabilities at fair value through operating result; and
– land, buildings, infrastructure, plant and equipment.
In addition, the fair values of other assets and liabilities that are carried at amortised cost, also need to be determined for disclosure purposes. PTV determines the policies and procedures for determining fair values for both financial and non-financial assets and liabilities as required.
Fair value hierarchyIn determining fair values a number of inputs are used. To increase consistency and comparability in the financial statements, these inputs are categorised into three levels, also known as the fair value hierarchy. The levels are as follows:
– Level 1 – quoted (unadjusted) market prices in active markets for identical assets or liabilities;
– Level 2 – valuation techniques for which the lowest level input that is significant to the fair value measurement is directly or indirectly observable; and
– Level 3 – valuation techniques for which the lowest level input that is significant to the fair value measurement is unobservable.
PTV determines whether transfers have occurred between levels in the hierarchy by reassessing categorisation (based on the lowest level input that is significant to the fair value measurement as a whole) at the end of each reporting period. The Valuer-General Victoria (VGV), as PTV’s independent valuation agency, monitors changes in the fair value of each asset and liability through relevant data sources to determine whether revaluation is required.
How this section is structuredFor those assets and liabilities for which fair values are determined, the following disclosures are provided:
– carrying amount and the fair value (which would be the same for those assets measured at fair value);
– which level of the fair value hierarchy was used to determine the fair value; and
– in respect of those assets and liabilities subject to fair value determination using Level 3 inputs:
– a reconciliation of the movements in fair values from the beginning of the year to the end; and
– details of significant unobservable inputs used in the fair value determination.
This section is divided between disclosures in connection with fair value determination for financial assets and liabilities (see Note 8.3.1) and non-financial physical assets (see to Note 8.3.2).
8.3.1 Fair value determination of financial assets and liabilitiesThe fair values and net fair values of financial assets and liabilities are determined as follows:
– Level 1 – the fair value of financial instrument with standard terms and conditions and traded in active liquid markets are determined with reference to quoted market prices;
– Level 2 – the fair value is determined using inputs other than quoted prices that are observable for the financial asset or liability, either directly or indirectly; and
– Level 3 – the fair value is determined in accordance with generally accepted pricing models based on discounted cash flow analysis using unobservable market inputs.
PTV currently holds a range of financial instruments that are recorded in the financial statements where the carrying amounts are a reasonable approximation of fair value, either due to their short-term nature or with the expectation that they will be paid in full by the end of the 2018–19 reporting period. Non-current financial liabilities are recorded at fair value (refer to section 7.1).
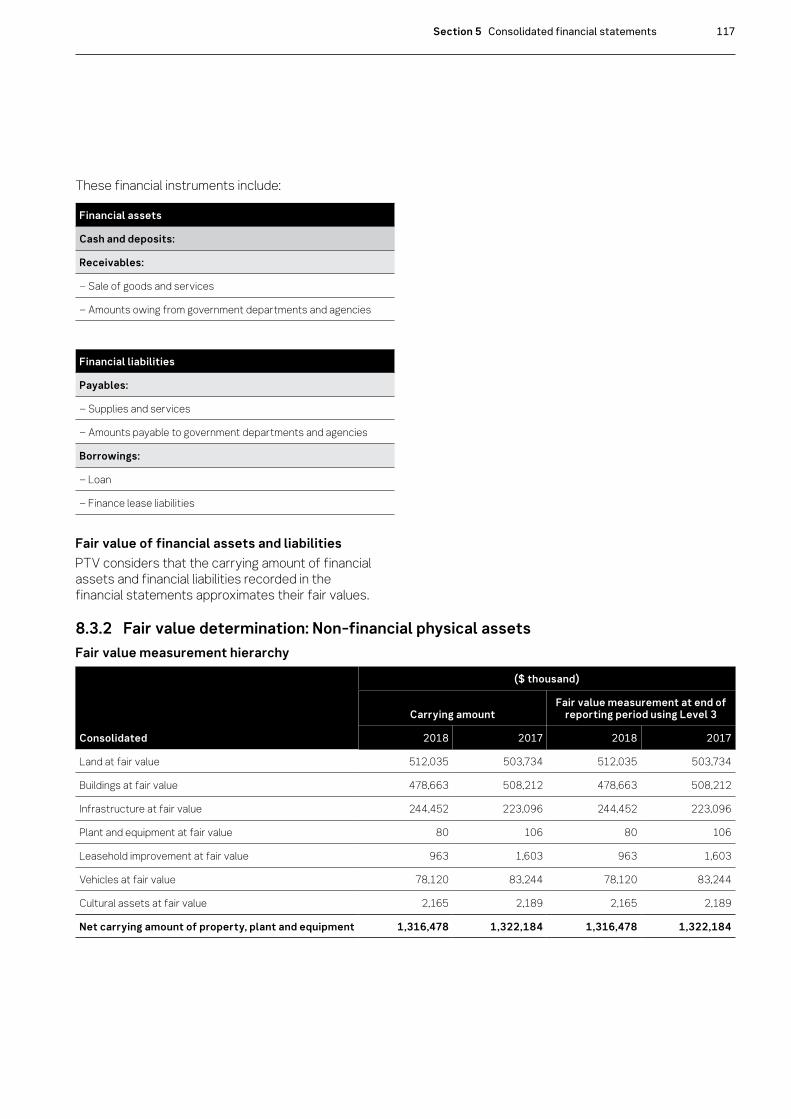
Section 5 Consolidated financial statements 117
These financial instruments include:
Financial assets
Cash and deposits:
Receivables:
– Sale of goods and services
– Amounts owing from government departments and agencies
Financial liabilities
Payables:
– Supplies and services
– Amounts payable to government departments and agencies
Borrowings:
– Loan
– Finance lease liabilities
Fair value of financial assets and liabilities PTV considers that the carrying amount of financial assets and financial liabilities recorded in the financial statements approximates their fair values.
8.3.2 Fair value determination: Non-financial physical assetsFair value measurement hierarchy
Consolidated
($ thousand)
Carrying amountFair value measurement at end of
reporting period using Level 3
2018 2017 2018 2017
Land at fair value 512,035 503,734 512,035 503,734
Buildings at fair value 478,663 508,212 478,663 508,212
Infrastructure at fair value 244,452 223,096 244,452 223,096
Plant and equipment at fair value 80 106 80 106
Leasehold improvement at fair value 963 1,603 963 1,603
Vehicles at fair value 78,120 83,244 78,120 83,244
Cultural assets at fair value 2,165 2,189 2,165 2,189
Net carrying amount of property, plant and equipment 1,316,478 1,322,184 1,316,478 1,322,184

118 Public Transport Victoria Annual Report 2017–18
PTV conducted a management fair value assessment at the end of the 2017–18 financial year which indicated that the movement in fair value of land and infrastructure assets since the last scheduled revaluation may be material. Therefore, PTV engaged Valuer-General Victoria to conduct an Interim revaluation as at 30 June 2018. Revaluation amounts are included in Note 5.1.2.
Land and buildingsAll PTV land and buildings are specialised. The market approach is used for specialised land, although it is adjusted for the community service obligation (CSO) to reflect the specialised nature of the land being valued. The CSO adjustment is a reflection of the valuer’s assessment of the impact of restrictions associated with an asset to the extent that is also equally applicable to market participants. This approach is in light of the highest and best use consideration required for fair value measurement, and takes into account the use of the asset that is physically possible, legally permissible, and financially feasible. As adjustments of CSO are considered as significant unobservable inputs, specialised land would be classified as Level 3 assets. The CSO adjustment for Southern Cross Station was 50 per cent and for other land was between 25 per cent and 50 per cent.For specialised buildings, the depreciated replacement cost method is used, adjusting for the associated depreciations. As depreciation adjustments are considered as significant, unobservable inputs in nature, specialised buildings are classified as
Level 3 fair value measurements.
Infrastructure and cultural assetsInfrastructure and cultural assets are valued using the depreciated replacement cost method. As depreciation adjustments are considered as significant, unobservable inputs in nature, infrastructure and cultural assets are classified as Level 3 fair value measurements.
VehiclesVehicles are valued using the depreciated replacement cost method. PTV obtains control over buses under an arrangement with Transdev Melbourne Pty Ltd and Franchise Asset Holdings Pty Ltd. Depreciation rates of buses are agreed by the parties to the arrangement and the disposal of buses will be at their net book value. As a result, the fair value of vehicles approximates the depreciated replacement cost.
Plant and equipmentPlant and equipment is held at fair value. When plant and equipment is specialised in use, such that it is rarely sold other than as part of a going concern, fair value is determined using the depreciated replacement cost method is used. There were no changes in valuation techniques throughout the year to 30 June 2018.For all assets measured at fair value, the current use is considered the highest and best use.

Section 5 Consolidated financial statements 119
Description of significant unobservable inputs to Level 3 valuations for 2018 and 2017
Category Valuation technique(i) Significant unobservable inputs(i)
Land Market approach Community Service Obligation (CSO) adjustment
Buildings Depreciated replacement costDirect cost per square metreUseful life of buildings
Infrastructure Depreciated replacement costCost per unitUseful life of the infrastructure
Plant and equipment Depreciated replacement costCost per unitUseful life of plant and equipment
Leasehold improvement Depreciated replacement costCost per unitUseful life of leasehold improvement
Vehicles Depreciated replacement costCost per unitUseful life of vehicles
Cultural assets Reproduction costCost per unitUseful life of culture assets
(i) Illustrations on the valuation techniques, significant unobservable inputs and related quantitative range of those inputs are indictive and should not be directly used without consultation with the PTV’s independent valuer.

120 Public Transport Victoria Annual Report 2017–18
Reconciliation of level 3 fair value movements
Consolidated
($ thousand) ($ thousand)
Land Buildings Infrastructure Plant and equipment Leasehold improvement Vehicles Cultural assets Total
Opening Balance 2016 495,451 497,121 241,733 176 2,295 89,608 2,213 1,328,597
Additions 8,283 24,891 5,399 – – 3,394 – 41,967
Disposals/write-offs – – – – – (120) – (120)
Depreciation/amortisation expense – (13,800) (24,513) (71) (691) (9,572) (25) (48,672)
Assets received free of charge – – 478 – – – – 478
Assets provided free of charge – – – – – (68) – (68)
Carrying balance as at 30 June 2017 503,734 508,212 223,096 106 1,603 83,244 2,189 1,322,184
Additions – – 5,018 – – 4,598 – 9,616
Disposals/write-offs – – (545) – – (240) – (785)
Depreciation/amortisation expense – (13,882) (24,674) (26) (640) (9,482) (24) (48,728)
Assets received free of charge – – 2,592 – – – – 2,592
Net revaluation increments/decrements 8,301 (15,668) 38,965 – – – – 31,598
Closing balance as at 30 June 2018 512,035 478,663 244,452 80 963 78,120 2,165 1,316,478

Section 5 Consolidated financial statements 121
Reconciliation of level 3 fair value movements
Consolidated
($ thousand) ($ thousand)
Land Buildings Infrastructure Plant and equipment Leasehold improvement Vehicles Cultural assets Total
Opening Balance 2016 495,451 497,121 241,733 176 2,295 89,608 2,213 1,328,597
Additions 8,283 24,891 5,399 – – 3,394 – 41,967
Disposals/write-offs – – – – – (120) – (120)
Depreciation/amortisation expense – (13,800) (24,513) (71) (691) (9,572) (25) (48,672)
Assets received free of charge – – 478 – – – – 478
Assets provided free of charge – – – – – (68) – (68)
Carrying balance as at 30 June 2017 503,734 508,212 223,096 106 1,603 83,244 2,189 1,322,184
Additions – – 5,018 – – 4,598 – 9,616
Disposals/write-offs – – (545) – – (240) – (785)
Depreciation/amortisation expense – (13,882) (24,674) (26) (640) (9,482) (24) (48,728)
Assets received free of charge – – 2,592 – – – – 2,592
Net revaluation increments/decrements 8,301 (15,668) 38,965 – – – – 31,598
Closing balance as at 30 June 2018 512,035 478,663 244,452 80 963 78,120 2,165 1,316,478

122 Public Transport Victoria Annual Report 2017–18
9 Other disclosures
Introduction Structure PageThis section includes additional material disclosures required by accounting standards or otherwise, for the understanding of this financial report.
9.1 Ex-gratia expenses 123
9.2 Other economic flows included in net result 123
9.3 Responsible persons 123
9.4 Remuneration of executives 124
9.5 Related parties 125
9.6 Remuneration of auditors 126
9.7 Fare and cardholder funds administration 126
9.8 Subsequent events 127
9.9 Other accounting policies 127
9.10 Australian Accounting Standards issued that are not yet effective
127
9.11 Glossary of technical terms 130
9.12 Style conventions 132

Section 5 Consolidated financial statements 123
9.1 Ex-gratia expenses(i)
Consolidated
($ thousand)
2018 2017
Compensation for early termination(ii) 13 81
Total(iii) 13 81
(i) Includes ex-gratia expenses for items that are greater than or equal to $5,000.
(ii) Compensation for early termination of the resignation notice period.
(iii) The total for ex-gratia expenses is also presented in ‘employee benefit expenses in the comprehensive operating statement’ of Note 3.1.2
9.2 Other economic flows included in net resultOther economic flows are changes in the volume or value of an asset or liability that do not result from transactions. Other gains/(losses) from other economic flows include the gains or losses from:
– the revaluation of the present value of the long service leave liability due to changes in the bond interest rates; and
– the impairment of receivables includes the creation of a provision for expired myki cards with negative balances.
Consolidated
($ thousand)
2018 2017
Net loss on non-financial assets
Net loss on disposals of property, plant and equipment (657) (54)
Total net losses on non-financial assets (657) (54)
Net gain/(loss) on financial instruments
Impairment of receivables and provision for myki negative card balances (4,097) –
Changes in fair value of forward contracts for hedging exposure to foreign currency risk – 241
Total net gain/(loss) on financial instruments (4,097) 241
Other gain/(loss) from other economic flows
Net gain/(loss) arising from changes to bond rates in revaluation of long service leave liability (39) 223
Total other gain/(loss) from other economic flows (39) 223
9.3 Responsible persons In accordance with the Ministerial Directions issued by the Minister for Finance under the Financial Management Act 1994, the following disclosures are made regarding responsible persons for the reporting period.
NamesThe persons who held the positions of Ministers, Director of the Board and accountable officer in PTV are as follows:
Responsible Minister:Hon. Jacinta Allan MP, Minister for Public Transport (1 July 2017 to 30 June 2018)
Director of the Board:Mr Jeroen Weimar – Chief Executive Officer (1 July 2017 to 30 June 2018)
Accountable Officer:The Transport Integration Amendment Act 2017 (Head, Transport for Victoria and Other Governance Reforms), which commenced in April 2017, amended the statutory charter of PTV. This included establishing the Chief Executive Officer of PTV as the Responsible Body and the Accountable Officer.Mr Jeroen Weimar – Chief Executive Officer (1 July 2017 to 30 June 2018)
RemunerationThe compensation detailed below excludes the salaries and benefits the Portfolio Minister receives. The Minister’s remuneration and allowances is set by the Parliamentary Salaries and Superannuation Act 1968 and is reported within the Department of Parliamentary Services’ Financial Report.

124 Public Transport Victoria Annual Report 2017–18
Remuneration received or receivable by the responsible persons in connection with the management of PTV during the reporting period were as follows:
Consolidated Total remuneration
Income band 2018 2017
$30,000 – 39,999 – 1
$40,000 – 49,999 – 3
$90,000 – 99,999 – 1
$430,000 – 439,999 1 –
$490,000 – 499,999 – 1
Total numbers 1 6
Total amount $432,953 753,564
The Transport Integration Amendment Act 2017 which commenced in April 2017, amended the statutory charter of PTV. This included establishing the Chief Executive Officer of PTV as the Responsible Body and the Accountable Officer. The number reported in prior year column includes the members of the Board from 1 July 2016 to 11 April 2017:Ms Patricia Faulkner – Chairman Mr Douglas Bartley – Deputy Chairman Ms Virginia Hickey Mr Kevin Norris Mr Tom Sargant
9.4 Remuneration of executives9.4.1 Remuneration of executivesThe number of executive officers, other than the Minister and accountable officers, and their total remuneration during the reporting period is shown in the table below. Total annualised employee equivalents provides a measure of full time equivalent executive officers over the reporting period.Remuneration comprises employee benefits in all forms of consideration paid, payable or provided by the entity, or on behalf of the entity, in exchange for services rendered. Accordingly, remuneration is determined on an accrual basis, and is disclosed in the following categories. Short-term employee benefits include amounts such as wages, salaries, annual leave or sick leave that are usually paid or payable on a regular basis, as well as non-monetary benefits such as allowances and free or subsidised goods or services.Post-employment benefits include pensions and other retirement benefits paid or payable on a discrete basis when employment has ceased. Other long-term benefits include long service leave, other long service benefits or deferred compensation. Termination benefits include termination of employment payments, such as severance packages.
Consolidated ($ thousand)
Remuneration of executive officers (including key management personnel disclosed in (Note 9.5)) 2018 2017
Short-term employee benefits 7,762 8,243
Post-employment benefits 695 675
Other long-term benefits 176 176
Termination benefits 813 414
Total remuneration(i) (ii) 9,446 9,509
Total number of executives 48 54
Total annualised employee equivalents(iii) 35.15 35.25
(i) The total number of executive officers includes persons who meet the definition of Key Management Personnel (KMP) of the entity under AASB 124 Related Party Disclosures and are also reported within the related parties note disclosure (see Note 9.5).
(ii) The total remuneration of executive officers includes the remuneration of executive officers acting in the position of the accountable officer during the reporting period.
(iii) Annualised employee equivalent is based on the time fraction worked over the reporting period.

Section 5 Consolidated financial statements 125
9.5 Related parties PTV is a wholly owned and controlled entity of the State of Victoria. Related parties of PTV include:
– all key management personnel and their close family members and personal business interests (controlled entities, joint ventures and entities they have significant influence over);
– all cabinet ministers and their close family members; and
– all departments and public sector entities that are controlled and consolidated into the whole of state consolidated financial statements.
All related party transactions have been entered into on an arm’s length basis.Significant transactions with government-related entities During 2017–18 financial year, PTV had the following material transactions with other government-related entities with value greater than $1 million (excl. GST):
– DEDJTR: PTV received operating grants of $4.6 billion and capital grants of $343 million. PTV has a payable of $1.1 million for the provision of financial and administrative services based on a service level agreement. PTV also has a grant receivable of $436 million from DEDJTR and other receivables of $600 thousand.
– VicTrack: PTV transferred $492 million of assets to VicTrack, provided grants for capital asset charge of $1.98 billion, provided grants to cover leased rolling stock repayment of $198 million and provided grants to cover various construction works related to rail improvements of $3 million. PTV also used the myki system which is owned by VicTrack therefore PTV received a service provided free of charge of $55 million and PTV has a service provided free of charge to VicTrack of $33 million for the maintenance of the myki system.
– V/Line: PTV made franchise payments of $493 million to V/Line.
– Department of Health and Human Services (DHHS): PTV received $161 million from DHHS relating to fare concession for aged pensioners and health card holders of which $13 million is still a receivable.
– Victorian Managed Insurance Authority (VMIA): PTV paid VMIA $11.5 million in rail insurance premium and $3.3 million in myki asset insurance premium.
– Department of Education and Training (DET): PTV received $13.7 million from DET relating to fare concession for students.
– CenITex (an agency of DTF): PTV paid CenITex $5 million for workplace and application hosting IT services.
– Melbourne Metro Rail Authority (MMRA): PTV has a receivable of $1.7 million and a payable of $1 million for project cost reimbursements to MMRA.
– Level Crossing Removal Authority (LXRA): PTV has a receivable of $1.2 million and a payable of $457 thousand for project cost reimbursements to LXRA.
Key management personnel (KMP):Portfolio Minister, the Hon. Jacinta Allan MP, the Chief Executive Officer, Mr Jeroen Weimar, members of the Senior Executive Board, and some other members from Senior Executive Leadership Team.
Members of the Senior Executive Board: – Executive Director Corporate Services –
Mr Dean Tillotson – Executive Director Network Service Delivery –
Ms Laura Lo Bianco-Smith and Mr Dean Purkis – Executive Director Franchise Operator Management
– Mr Alan Fedda – Executive Director Customer Services –
Ms Fiona Adamson – Executive Director Network Integrity and
Project Assurance – Mr Michael Chadwick – Director, Office of the CEO – Ms Marika Harvey

126 Public Transport Victoria Annual Report 2017–18
Other members from Senior Executive Leadership Team:
– Chief Financial Officer – Mr Fred Cilia – Director, Governance and Legal – Mr Edward Byrden – Director, Enterprise Assurance and Safety and
Environment – Ms Jocelyn Crawford
The compensation detailed below excludes the salaries and benefits of the Portfolio Minister. The Minister’s remuneration and allowances are set by the Parliamentary Salaries and Superannuation Act 1968 and is reported within the Department of Parliamentary Services’ Financial Report.
Consolidated ($ thousand)
Compensation of KMPs 2018 2017
Short-term employee benefits 2,923 1,066
Post-employment benefits 226 71
Other long-term benefits 67 16
Total(i) (ii) (iii) 3,216 1,153
(i) KMPs are also reported in the disclosure of remuneration of executive officers (see Note 9.4.1).
(ii) The temporary higher duties expenses of non-KMP have not been included in the remuneration disclosure, as remuneration of the substantive KMP has already been reported.
(iii) KMPs in the prior year included the accountable officers listed in section 9.3 for the period from 1 July 2016 to 11 April 2017. From 12 April 2017, KMPs included members of the Senior Executive Board.
Transactions and balances with key management personnel and other related partiesGiven the breadth and depth of Victorian Government activities, related parties transact with the Victorian public sector in a manner consistent with other members of the public e.g. stamp duty and other government fees and charges. Further employment of processes within the Victorian public sector occur on terms and conditions consistent with the Public Administration Act 2004 and Codes of Conduct and Standards issued by the Victorian Public Sector Commission. Procurement processes occur on terms and conditions consistent with the Victorian Government Procurement Board requirements. Outside of normal citizen type transactions with PTV, there were no related party transactions that involved key management personnel, their close family members and their personal business interests. No provision has been required, nor any expense recognised, for impairment of receivables from related parties.
9.6 Remuneration of auditors
Consolidated
($ thousand)
2018 2017
Victorian Auditor General’s Office
Audit or review of the financial statements 308 256
Total remuneration of auditors 308 256
9.7 Fare and cardholder funds administrationFor the year ended 30 June 2018, the total metropolitan and regional farebox revenue and non-farebox receipts (Money received by transport operators derived from the sale of goods or services other than NTS tickets including: locker hire, map sales etc.) was $947,998,055 (2017: $891,369,419) of which $633,057,314 (2017: $642,314,460) was distributed from the myki ticketing system to V/Line and franchisees.As at 30 June 2018, the following amounts were held in PTV managed bank accounts:
– for distribution to rail franchisees $12,707,644 (2017: $12,018,629)
– myki cardholder funds $126,671,926 (2017: $110,747,759)
PTV also receives and manages myki customer money balances. These balances come from various channels including ticketing machines, railway stations, retail outlets, the internet and the PTV Hubs. PTV performs the accounts receivable function for the ticketing system and administers the agreement with the contractor NTT Data Payment Services Victoria to ensure cash collection services and payments via the banking system are managed effectively.PTV manages the revenue audit function which focuses on reviewing and reporting on controls around farebox revenue collection and distribution processes within transport operators. Formal planned revenue audits are undertaken by PTV at metropolitan and V/Line train stations, as well as metropolitan and regional bus depots.

Section 5 Consolidated financial statements 127
9.8 Subsequent events The Metropolitan Bus Services Contracts (MBSCs) expired on 30 June 2018. New contracts were signed with three of the operators of metropolitan buses prior to 30 June 2018. The remaining MBSCs were signed by 31 July 2018. The commitments for expenditure in section 7.4 includes contracts signed by 30 June 2018. The commitments for contracts signed after 30 June 2018 is estimated at $1.72 billion.
9.9 Other accounting policiesContributions by ownersConsistent with the requirements of AASB 1004 Contributions, contributions by owners (that is, contributed capital and its repayment) are treated as equity transactions and, therefore, do not form part of the income and expenses of PTV.Additions to net assets that have been designated as contributions by owners are recognised as contributed capital. Other transfers that are in the nature of contributions to or distributions by owners have also been designated as contributions by owners.Transfers of net assets arising from administrative restructurings are treated as distributions to or contributions by owners. Transfers of net liabilities arising from administrative restructurings are treated as distributions to owners.
9.10 Australian Accounting Standards issued that are not yet effectiveThe following AASs become effective for reporting periods commencing after the operative dates stated:Certain new Australian Accounting Standards (AAS) have been published which are not mandatory for the 30 June 2018 reporting period. DTF assesses the impact of all these new standards and advises PTV of their applicability and early adoption where applicable. Please refer to the following table for the detailed list of the AASs issued but are not yet effective for the 2017–18 reporting period.

128 Public Transport Victoria Annual Report 2017–18
Standard/ Interpretation Summary
Applicable for annual reporting periods beginning on Impact on PTV financial statements
AASB 9 Financial Instruments The key changes include the simplified requirements for the classification and measurement of financial assets, a new hedge accounting model and a revised impairment loss model to recognise expected impairment losses earlier, as opposed to the current approach that recognises impairment only when incurred.
1 Jan 2018 The assessment has identified that the amendments are likely to result in earlier recognition of impairment losses and at more regular intervals. The initial application of AASB 9 is not expected to significantly impact the financial position however there will be a change to the way financial instruments are classified and new disclosure requirements.
AASB 15 Revenue from Contracts with Customers
The core principle of AASB 15 requires an entity to recognise revenue when the entity satisfies a performance obligation by transferring a promised good or service to a customer. Note that amending standard AASB 2015-8 Amendments to Australian Accounting Standards – Effective Date of AASB 15 has deferred the effective date of AASB 15 to annual reporting periods beginning on or after 1 January 2018, instead of 1 January 2017.
1 Jan 2019 The changes in revenue recognition requirements in AASB 15 may result in changes to the timing and amount of revenue recorded in the financial statements. The Standard will also require additional disclosures on service revenue and contract modifications.
AASB 16 Leases The key changes introduced by AASB 16 include the recognition of operating leases (which are currently not recognised) on balance sheet.
1 Jan 2019 The assessment has indicated that most operating leases, with the exception of short term and low value leases will come on to the balance sheet and will be recognised as right of use assets with a corresponding lease liability.In the operating statement, the operating lease expense will be replaced by depreciation expense of the asset and an interest charge.There will be no change for lessors as the classification of operating and finance leases remains unchanged.
AASB 1058 Income of Not-for-Profit Entities
AASB 1058 standard will replace the majority of income recognition in relation to government grants and other types of contributions requirements relating to public sector not-for-profit entities, previously in AASB 1004 Contributions. The restructure of administrative arrangement will remain under AASB 1004 and will be restricted to government entities and contributions by owners in a public sector context,AASB 1058 establishes principles for transactions that are not within the scope of AASB 15, where the consideration to acquire an asset is significantly less than fair value to enable not-for-profit entities to further their objective.
1 Jan 2019 The current revenue recognition for grants is to recognise revenue up front upon receipt of the funds.This may change under AASB 1058, as capital grants for the construction of assets will need to be deferred. Income will be recognised over time, upon completion and satisfaction of performance obligations for assets being constructed, or income will be recognised at a point in time for acquisition of assets.The revenue recognition for operating grants will need to be analysed to establish whether the requirements under other applicable standards need to be considered for recognition of liabilities (which will have the effect of deferring the income associated with these grants). Only after that analysis would it be possible to conclude whether there are any changes to operating grants.The impact on current revenue recognition of the changes is the phasing and timing of revenue recorded in the profit and loss statement.
AASB 1059 Service Concession Arrangements: Grantor
This standard applies to arrangements that involve an operator providing a public service on behalf of a public sector grantor. It involves the use of a service concession asset and where the operator manages at least some of the public service at its own direction. An arrangement within the scope of this standard typically involves an operator constructing the asset used to provide the public service or upgrading the assets and operating and maintaining the assets for a specified period of time. The State has 2 types of PPPs:1. Social Infrastructure: A PPP that requires the government to make payments to the
operator upon commencement of services:– Operator finances and constructs the infrastructure; and– State pays unitary service payments over the term.
2. Economic Infrastructure: A PPP that is based on user pays model:– Operator finances and constructs the infrastructure;– State does not pay for the cost of the construction; and– Operator charges asset users and recovers the cost of construction and operation
for the term of the contract.
1 Jan 2019 For an arrangement to be in scope of AASB 1059 all of the following requirements are to be satisfied:– Operator is providing public services using a service concession asset;– Operator manages at ‘least some’ of public services under its own discretion;– The State controls / regulates:
– What services are to be provided;– To whom; and– At what price
– State controls any significant residual interest in the asset.
If the arrangement does not satisfy all the above requirements the recognition will fall under the requirements of another applicable accounting standard. Currently the social infrastructure PPPs are only recognised on the balance sheet at commercial acceptance. The arrangement will need to be progressively recognised as and when the asset is being constructed. This will have the impact of progressively recognising the financial liability and corresponding asset as the asset is being constructed.For economic infrastructure PPP arrangements, that were previously not on balance sheet, the standard will require recognition of these arrangements on balance sheet. There will be no impact to net debt, as a deferred revenue liability will be recognised and amortised over the concession term.

Section 5 Consolidated financial statements 129
Standard/ Interpretation Summary
Applicable for annual reporting periods beginning on Impact on PTV financial statements
AASB 9 Financial Instruments The key changes include the simplified requirements for the classification and measurement of financial assets, a new hedge accounting model and a revised impairment loss model to recognise expected impairment losses earlier, as opposed to the current approach that recognises impairment only when incurred.
1 Jan 2018 The assessment has identified that the amendments are likely to result in earlier recognition of impairment losses and at more regular intervals. The initial application of AASB 9 is not expected to significantly impact the financial position however there will be a change to the way financial instruments are classified and new disclosure requirements.
AASB 15 Revenue from Contracts with Customers
The core principle of AASB 15 requires an entity to recognise revenue when the entity satisfies a performance obligation by transferring a promised good or service to a customer. Note that amending standard AASB 2015-8 Amendments to Australian Accounting Standards – Effective Date of AASB 15 has deferred the effective date of AASB 15 to annual reporting periods beginning on or after 1 January 2018, instead of 1 January 2017.
1 Jan 2019 The changes in revenue recognition requirements in AASB 15 may result in changes to the timing and amount of revenue recorded in the financial statements. The Standard will also require additional disclosures on service revenue and contract modifications.
AASB 16 Leases The key changes introduced by AASB 16 include the recognition of operating leases (which are currently not recognised) on balance sheet.
1 Jan 2019 The assessment has indicated that most operating leases, with the exception of short term and low value leases will come on to the balance sheet and will be recognised as right of use assets with a corresponding lease liability.In the operating statement, the operating lease expense will be replaced by depreciation expense of the asset and an interest charge.There will be no change for lessors as the classification of operating and finance leases remains unchanged.
AASB 1058 Income of Not-for-Profit Entities
AASB 1058 standard will replace the majority of income recognition in relation to government grants and other types of contributions requirements relating to public sector not-for-profit entities, previously in AASB 1004 Contributions. The restructure of administrative arrangement will remain under AASB 1004 and will be restricted to government entities and contributions by owners in a public sector context,AASB 1058 establishes principles for transactions that are not within the scope of AASB 15, where the consideration to acquire an asset is significantly less than fair value to enable not-for-profit entities to further their objective.
1 Jan 2019 The current revenue recognition for grants is to recognise revenue up front upon receipt of the funds.This may change under AASB 1058, as capital grants for the construction of assets will need to be deferred. Income will be recognised over time, upon completion and satisfaction of performance obligations for assets being constructed, or income will be recognised at a point in time for acquisition of assets.The revenue recognition for operating grants will need to be analysed to establish whether the requirements under other applicable standards need to be considered for recognition of liabilities (which will have the effect of deferring the income associated with these grants). Only after that analysis would it be possible to conclude whether there are any changes to operating grants.The impact on current revenue recognition of the changes is the phasing and timing of revenue recorded in the profit and loss statement.
AASB 1059 Service Concession Arrangements: Grantor
This standard applies to arrangements that involve an operator providing a public service on behalf of a public sector grantor. It involves the use of a service concession asset and where the operator manages at least some of the public service at its own direction. An arrangement within the scope of this standard typically involves an operator constructing the asset used to provide the public service or upgrading the assets and operating and maintaining the assets for a specified period of time. The State has 2 types of PPPs:1. Social Infrastructure: A PPP that requires the government to make payments to the
operator upon commencement of services:– Operator finances and constructs the infrastructure; and– State pays unitary service payments over the term.
2. Economic Infrastructure: A PPP that is based on user pays model:– Operator finances and constructs the infrastructure;– State does not pay for the cost of the construction; and– Operator charges asset users and recovers the cost of construction and operation
for the term of the contract.
1 Jan 2019 For an arrangement to be in scope of AASB 1059 all of the following requirements are to be satisfied:– Operator is providing public services using a service concession asset;– Operator manages at ‘least some’ of public services under its own discretion;– The State controls / regulates:
– What services are to be provided;– To whom; and– At what price
– State controls any significant residual interest in the asset.
If the arrangement does not satisfy all the above requirements the recognition will fall under the requirements of another applicable accounting standard. Currently the social infrastructure PPPs are only recognised on the balance sheet at commercial acceptance. The arrangement will need to be progressively recognised as and when the asset is being constructed. This will have the impact of progressively recognising the financial liability and corresponding asset as the asset is being constructed.For economic infrastructure PPP arrangements, that were previously not on balance sheet, the standard will require recognition of these arrangements on balance sheet. There will be no impact to net debt, as a deferred revenue liability will be recognised and amortised over the concession term.

130 Public Transport Victoria Annual Report 2017–18
9.11 Glossary of technical termsThe following is a summary of the major technical terms used in this report.
Administered item generally refers to a public-sector agency lacking the capacity to benefit from that item in the pursuit of the entity’s objectives and to deny or regulate the access of others to that benefit.Amortisation is the expense which results from the consumption, extraction or use over time of a non-produced physical or intangible asset. This expense is classified as an ‘other economic flow’.Borrowings refers to interest bearing liabilities mainly raised from public borrowings raised through the Treasury Corporation of Victoria, finance leases and other interest bearing arrangements. Borrowings also include non-interest bearing advances from government that are acquired for policy purposes. Commitments includes those operating, capital and other outsourcing commitments arising from non-cancellable contractual or statutory sources.Comprehensive result is the amount included in the operating statement representing total change in net worth other than transactions with owners as owners.Capital Asset Charge is levied on the written down value of controlled non current physical assets in a public sector agency’s balance sheet which aims to: attribute to agency outputs the opportunity cost of capital used in service delivery; and provide incentives to agency to identify and dispose of underutilised or surplus assets in a timely manner. Commitments include those operating, capital and other outsourcing commitments arising from non-cancellable contractual or statutory sources.Controlled item generally refers to the capacity of a public sector agency to benefit from that item in the pursuit of the entity’s objectives and to deny or regulate the access of others to that benefit.Current grants are amounts payable or receivable for current purposes for which no economic benefits of equal value are receivable or payable in return.Depreciation is an expense that arises from the consumption through wear or time of a produced physical or intangible asset. This expense is classified as a ‘transaction’ and so reduces the ‘net result from transaction’.
Employee benefits expenses include all costs related to employment including wages and salaries, leave entitlements, redundancy payments and superannuation contributions.Financial asset is any asset that is:(a) cash;(b) an equity instrument of another entity;(c) a contractual right:
– to receive cash or another financial asset from another entity; or
– to exchange financial assets or financial liabilities with another entity under conditions that are potentially favourable to the entity; or
(d) a contract that will or may be settled in the entity’s own equity instruments and is:
– a non-derivative for which the entity is or may be obliged to receive a variable number of the entity’s own equity instruments; or
– a derivative that will or may be settled other than by the exchange of a fixed amount of cash or another financial asset for a fixed number of the entity’s own equity instruments.
Financial instrument is any contract that gives rise to a financial asset of one entity and a financial liability or equity instrument of another entity. Financial liability is any liability that is:
(a) a contractual obligation: – to deliver cash or another financial asset to
another entity; or – to exchange financial assets or financial liabilities
with another entity under conditions that are potentially unfavourable to the entity; or
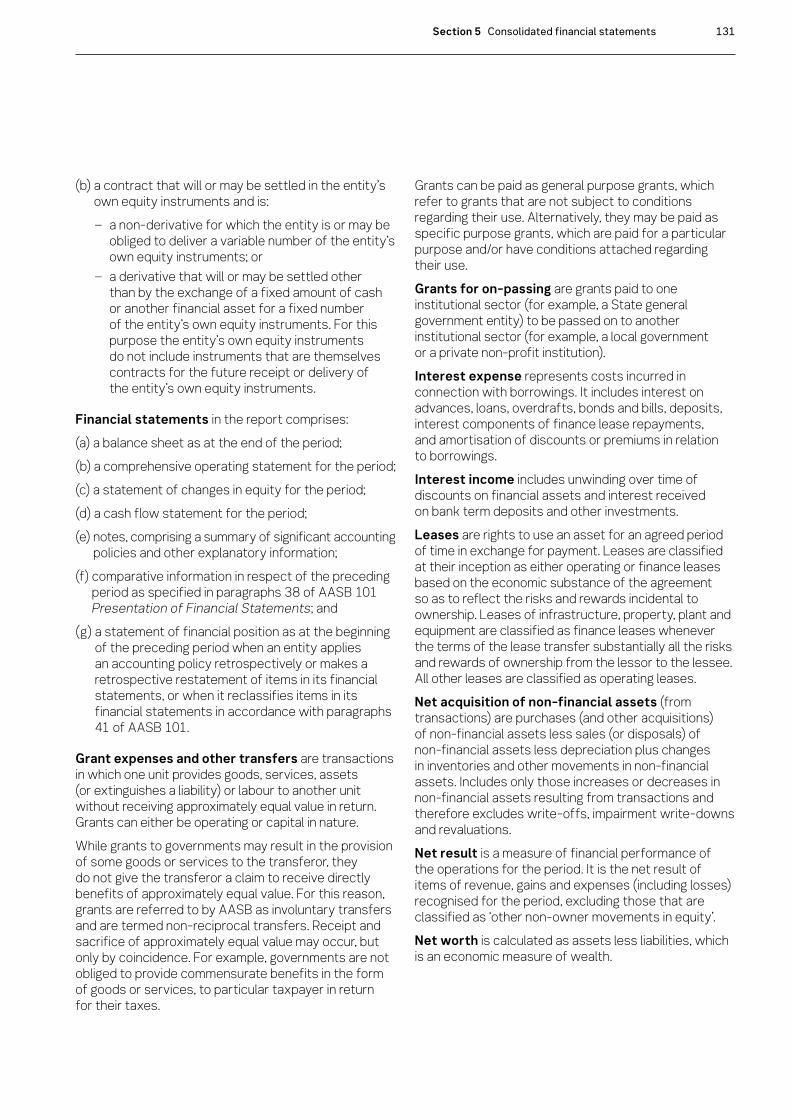
Section 5 Consolidated financial statements 131
(b) a contract that will or may be settled in the entity’s own equity instruments and is:
– a non-derivative for which the entity is or may be obliged to deliver a variable number of the entity’s own equity instruments; or
– a derivative that will or may be settled other than by the exchange of a fixed amount of cash or another financial asset for a fixed number of the entity’s own equity instruments. For this purpose the entity’s own equity instruments do not include instruments that are themselves contracts for the future receipt or delivery of the entity’s own equity instruments.
Financial statements in the report comprises:(a) a balance sheet as at the end of the period;(b) a comprehensive operating statement for the period;(c) a statement of changes in equity for the period;(d) a cash flow statement for the period;(e) notes, comprising a summary of significant accounting
policies and other explanatory information;(f) comparative information in respect of the preceding
period as specified in paragraphs 38 of AASB 101 Presentation of Financial Statements; and
(g) a statement of financial position as at the beginning of the preceding period when an entity applies an accounting policy retrospectively or makes a retrospective restatement of items in its financial statements, or when it reclassifies items in its financial statements in accordance with paragraphs 41 of AASB 101.
Grant expenses and other transfers are transactions in which one unit provides goods, services, assets (or extinguishes a liability) or labour to another unit without receiving approximately equal value in return. Grants can either be operating or capital in nature. While grants to governments may result in the provision of some goods or services to the transferor, they do not give the transferor a claim to receive directly benefits of approximately equal value. For this reason, grants are referred to by AASB as involuntary transfers and are termed non-reciprocal transfers. Receipt and sacrifice of approximately equal value may occur, but only by coincidence. For example, governments are not obliged to provide commensurate benefits in the form of goods or services, to particular taxpayer in return for their taxes.
Grants can be paid as general purpose grants, which refer to grants that are not subject to conditions regarding their use. Alternatively, they may be paid as specific purpose grants, which are paid for a particular purpose and/or have conditions attached regarding their use.Grants for on-passing are grants paid to one institutional sector (for example, a State general government entity) to be passed on to another institutional sector (for example, a local government or a private non-profit institution).Interest expense represents costs incurred in connection with borrowings. It includes interest on advances, loans, overdrafts, bonds and bills, deposits, interest components of finance lease repayments, and amortisation of discounts or premiums in relation to borrowings.Interest income includes unwinding over time of discounts on financial assets and interest received on bank term deposits and other investments.Leases are rights to use an asset for an agreed period of time in exchange for payment. Leases are classified at their inception as either operating or finance leases based on the economic substance of the agreement so as to reflect the risks and rewards incidental to ownership. Leases of infrastructure, property, plant and equipment are classified as finance leases whenever the terms of the lease transfer substantially all the risks and rewards of ownership from the lessor to the lessee. All other leases are classified as operating leases.Net acquisition of non-financial assets (from transactions) are purchases (and other acquisitions) of non-financial assets less sales (or disposals) of non-financial assets less depreciation plus changes in inventories and other movements in non-financial assets. Includes only those increases or decreases in non-financial assets resulting from transactions and therefore excludes write-offs, impairment write-downs and revaluations.Net result is a measure of financial performance of the operations for the period. It is the net result of items of revenue, gains and expenses (including losses) recognised for the period, excluding those that are classified as ‘other non-owner movements in equity’.Net worth is calculated as assets less liabilities, which is an economic measure of wealth.

132 Public Transport Victoria Annual Report 2017–18
Non-financial assets are all assets that are not financial assets. It includes inventories, land, buildings, infrastructure, plant and equipment, cultural and heritage assets and intangibles.Operating result is a measure of financial performance of the operations for the period. It is the net result of items of revenue, gains and expenses (including losses) recognised for the period, excluding those that are classified as ‘other non-owner movement in equity’. Refer also ‘net result’.Other economic flows included in net result are changes in the volume or value of an asset or liability that do not result from transactions. In simple terms, other economic flows are changes arising from market remeasurements. They include gains and losses from disposals, revaluations and impairments of non-current physical and intangible assets; fair value changes of financial instruments and agricultural assets; and depletion of natural assets (non-produced) from their use or removal.Payables includes short and long-term trade debt and accounts payable, grants, taxes and interest payable.Receivables includes amounts owing from government through appropriation receivable, short and long-term trade credit and accounts receivable, accrued investment income, grants, taxes and interest receivable.Sales of goods and services refers to income from the direct provision of goods and services and includes fees and charges for services rendered, sales of goods and services, fees from regulatory services, work done as an agent for private enterprises. It also includes rental income under operating leases and on produced assets such as buildings and entertainment, but excludes rent income from the use of non-produced assets such as land. User charges includes sale of goods and services income.
Supplies and services generally represent cost of goods sold and the day-to-day running costs, including maintenance costs, incurred in the normal operations of PTV. Transactions are those economic flows that are considered to arise as a result of policy decisions, usually an interaction between two entities by mutual agreement. They also include flows into an entity such as depreciation, where the owner is simultaneously acting as the owner of the depreciating asset and as the consumer of the service provided by the asset. Taxation is regarded as mutually agreed interactions between the government and taxpayers. Transactions can be in kind (e.g. assets provided/given free of charge or for nominal consideration) or where the final consideration is cash. In simple terms, transactions arise from the policy decisions of the Government.
9.12 Style conventionsFigures in the tables and in the text have been rounded. Discrepancies in tables between totals and sums of components reflect rounding. Percentage variations in all tables are based on the underlying unrounded amounts.The notions used in the tables is as follows:– zero, or rounded to zero(xxx.x) negative numbers200x year periodThe financial statements and notes are presented based on the illustration for a government department in the 2017–18 Model Report for Victorian Government Departments. The presentation of other disclosures is generally consistent with the other disclosures made in earlier publication of PTV’s annual report.

Section 5 Consolidated financial statements 133

134 Public Transport Victoria Annual Report 2017–18
Appendix
Disclosure indexThe PTV Annual Report is prepared in accordance with all relevant Victorian legislation and pronouncements. This index has been prepared to help identify PTV’s compliance with statutory disclosure requirements.
Ministerial Directions
Legislation Requirement Page
Ministerial Directions and Financial Reporting Directions
Report of operations
Charter and purpose
FRD 22H Manner of establishment and the relevant Ministers 10
FRD 22H Purpose, functions, powers and duties 10
FRD 8D Departmental objectives, indicators and outputs 14–27
FRD 22H Key initiatives and projects 14–27
FRD 22H Nature and range of services provided 14–27
Management and structure
FRD 22H Organisational structure 34–35
Financial and other information
FRD 8D Performance against output performance measures 18, 22
FRD 8D Budget portfolio outcomes 29
FRD 10A Disclosure index 134–135
FRD 12B Disclosure of major contracts 52
FRD 15D Executive officer disclosures 46
FRD 22H Employment and conduct principles 46
FRD 22H Occupational health and safety policy 38
FRD 22H Summary of the financial results for the year 29–30
FRD 22H Significant changes in financial position during the year 29–30
FRD 22H Major changes or factors affecting performance 29–30
FRD 22H Subsequent events 127
FRD 22H Application and operation of Freedom of Information Act 1982 53–54
FRD 22H Compliance with building and maintenance provisions of Building Act 1993 55
FRD 22H Statement on National Competition Policy 55
FRD 22H Application and operation of the Protected Disclosure Act 2012 52–53
FRD 22H Details of consultancies over $10,000 52
FRD 22H Details of consultancies under $10,000 52

Appendix 135
Legislation Requirement Page
Ministerial Directions and Financial Reporting Directions
FRD 22H Disclosure of government advertising expenditure 50
FRD 22H Disclosure of ICT expenditure 52
FRD 22H Statement of availability of other information 59
FRD 24C Reporting of office based environmental impacts 55–59
FRD 25C Victorian Industry Participation Policy disclosures 50
FRD 29B Workforce Data disclosures 44–46
SD 5.2 Specific requirements under Standing Direction 5.2 3, 6, 68
Compliance attestation and declaration
SD 3.7.1 Attestation for compliance with Ministerial Standing Direction 60
SD 5.2.3 Declaration in report of operations 6
Financial statements
Declaration
SD 5.2.2 Declaration in financial statements 68
Other requirements under Standing Directions 5.2
SD 5.2.1(a) Compliance with Australian accounting standards and other authoritative pronouncements 76
SD 5.2.1(a) Compliance with Ministerial Directions 68
SD 5.2.1(b) Compliance with Model Financial Report
Other disclosures as required by FRDs in notes to the financial statements(a)
FRD 9A Departmental Disclosure of Administered Assets and Liabilities by Activity 84
FRD 11A Disclosure of ex gratia expenses 123
FRD 13 Disclosure of Parliamentary Appropriations 77
FRD 21C Disclosures of Responsible Persons, Executive Officers and other personnel (contractors with significant management responsibilities) in the financial report 123
FRD 103F Non-financial physical assets 86
FRD 110A Cash flow statements 73
FRD 112D Defined Benefit Superannuation Obligations 82
Note: (a) References to FRDs have been removed from the Disclosure Index if the specific FRDs do not contain requirements that are of the nature of disclosure.
Legislation
Freedom of Information Act 1982 53–54
Building Act 1993 55
Protected Disclosure Act 2012 52–53
Victorian Industry Participation Policy Act 2003 50
Financial Management Act 1994 3, 29, 59, 60, 68, 76, 123


Public Transport Victoria 750 Collins Street Docklands Victoria 3008 AustraliaOnline: ptv.vic.gov.auTelephone: 1800 800 007International: +61 3 9662 2505Postal address: PO Box 4724 Melbourne Victoria 3001
Contact

For other languages visit ptv.vic.gov.au/languages or call 9321 5450.
For more information visit ptv.vic.gov.au or call 1800 800 007.If you are deaf, or have a hearing or speech impairment, you can contact us directly or through the National Relay Service and request to call 1800 800 007.
PTVH2907/18. Authorised by Transport for Victoria, 1 Spring Street, Melbourne.