piramal enterprises limited - annual report 2017-18
TRANSCRIPT
PIRAMAL ENTERPRISES LIMITED
Annual Report 2017-18
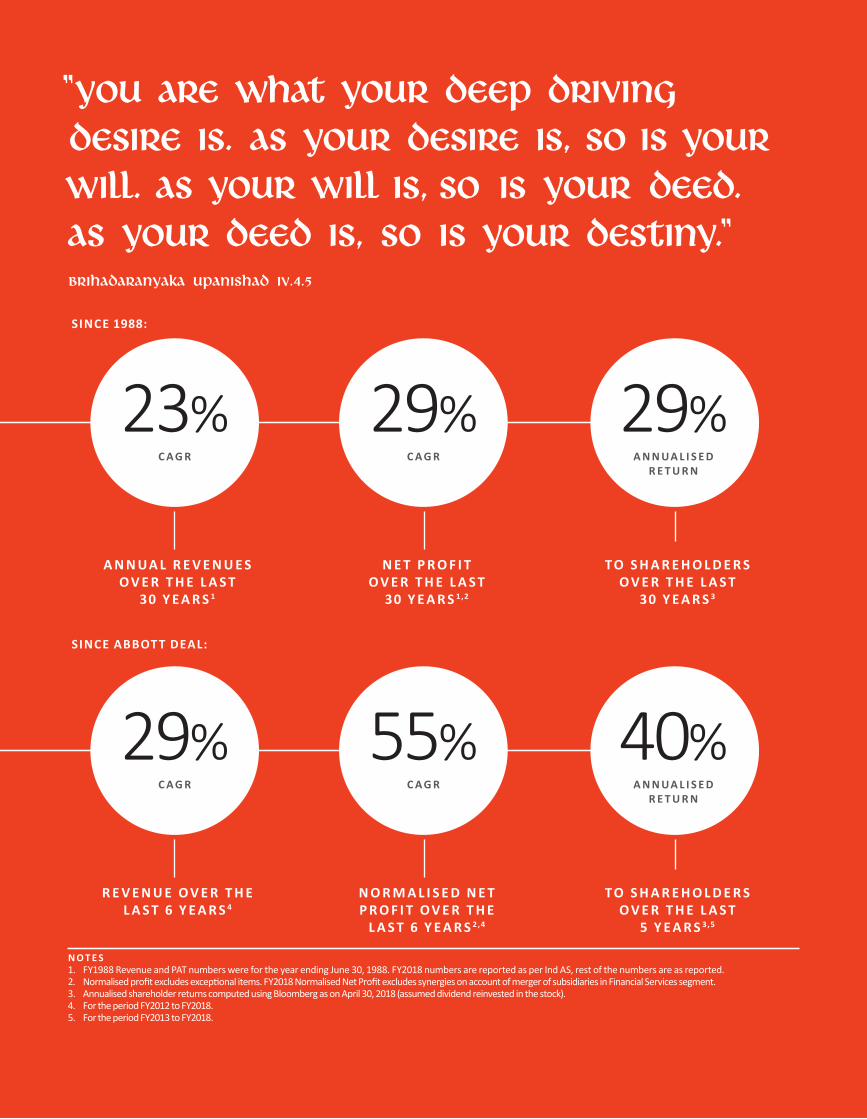
A N N UA L R E V E N U E S O V E R T H E L A S T
30 Y E A R S 1
23%C A G R
"You are what your deep driving desire is. As your desire is, so is your will. As your will is, so is your deed. As your deed is, so is your destiny." Brihadaranyaka Upanishad IV.4.5
N E T P R O F I T O V E R T H E L A S T
30 Y E A R S 1,2
29%C A G R
TO S H A R E H O L D E R S O V E R T H E L A S T
5 Y E A R S 3,5
40%A N N UA L I S E D
R E T U R N
R E V E N U E O V E R T H E L A S T 6 Y E A R S 4
29%C A G R
N O R M A L I S E D N E T P R O F I T O V E R T H E
L A S T 6 Y E A R S 2,4
55%C A G R
TO S H A R E H O L D E R S O V E R T H E L A S T
30 Y E A R S 3
29%A N N UA L I S E D
R E T U R N
N O T E S 1. FY1988 Revenue and PAT numbers were for the year ending June 30, 1988. FY2018 numbers are reported as per Ind AS, rest of the numbers are as reported. 2. Normalisedprofitexcludesexceptionalitems.FY2018NormalisedNetProfitexcludessynergiesonaccountofmergerofsubsidiariesinFinancialServicessegment.3. AnnualisedshareholderreturnscomputedusingBloombergasonApril30,2018(assumeddividendreinvestedinthestock).4. For the period FY2012 to FY2018.5. For the period FY2013 to FY2018.
SINCE 1988:
SINCE ABBOTT DEAL:
CONTENTS
STRATEGIC OVERVIEW ........................................................... 1-41Piramal Enterprises at a Glance ......................................................... 2A Billion Dollar Fund Raise ................................................................. 4Financial Services – Business at a Glance ......................................... 6Pharma and DRG – Business at a Glance ........................................ 10Chairman’s Message ........................................................................ 14Key Performance Indicators ............................................................ 18Key Milestones in the Last 30 Years ................................................ 2030-year Journey of Piramal Enterprises .......................................... 22Integrated Value-creation Model .................................................... 28Values-driven Culture ...................................................................... 30Efficient Capital Allocation ............................................................... 31Constantly Building Businesses ....................................................... 32Building Trusted Partnerships .......................................................... 33Board and Governance .................................................................... 34Innovation Culture ........................................................................... 36Delivering to Our Employees ........................................................... 38Delivering to Our Customers ........................................................... 39Delivering to Our Investors .............................................................. 40Delivering to Our Society ................................................................. 41
MANAGEMENT DISCUSSION & ANALYSIS ........................... 42-117Financial Review ............................................................................... 43Operations Review - Financial Services ........................................... 46Operations Review - Global Pharma ............................................... 66Operations Review - India Consumer Products .............................. 76Operations Review - Healthcare Insight & Analytics ...................... 84Risk Management ............................................................................ 90Human Resources ............................................................................ 94Information Technology & Digital ................................................. 100Data and Analytics ......................................................................... 104Environment, Health & Safety ....................................................... 106Corporate Social Responsibility ..................................................... 108Awards & Recognition ................................................................... 11410-year Financial Highlights .......................................................... 117
BOARD & MANAGEMENT PROFILES .................................118-125Board of Directors ......................................................................... 118Management Team ....................................................................... 124
STATUTORY REPORTS .......................................................126-185Report on Corporate Governance ................................................. 126Board's Report and Annexures ...................................................... 140Business Responsibility Report ...................................................... 176
FINANCIAL STATEMENTS ...................................................186-396StandaloneIndependent Auditor's Report ...................................................... 186Balance Sheet ................................................................................ 192Statement of Profit and Loss ......................................................... 193Cash Flow Statement ..................................................................... 194Statement of Changes in Equity .................................................... 196Notes to Financial Statements ...................................................... 197Form AOC-1 ................................................................................... 272ConsolidatedIndependent Auditor's Report ....................................................... 275Consolidated Balance Sheet .......................................................... 280Consolidated Statement of Profit and Loss ................................... 281Consolidated Cash Flow Statement ............................................... 282Statement of Changes in Equity .................................................... 284Notes to Consolidated Financial Statements ................................ 285
NOTICE ............................................................................397-412
CORPORATE INFORMATION ................................................. 416
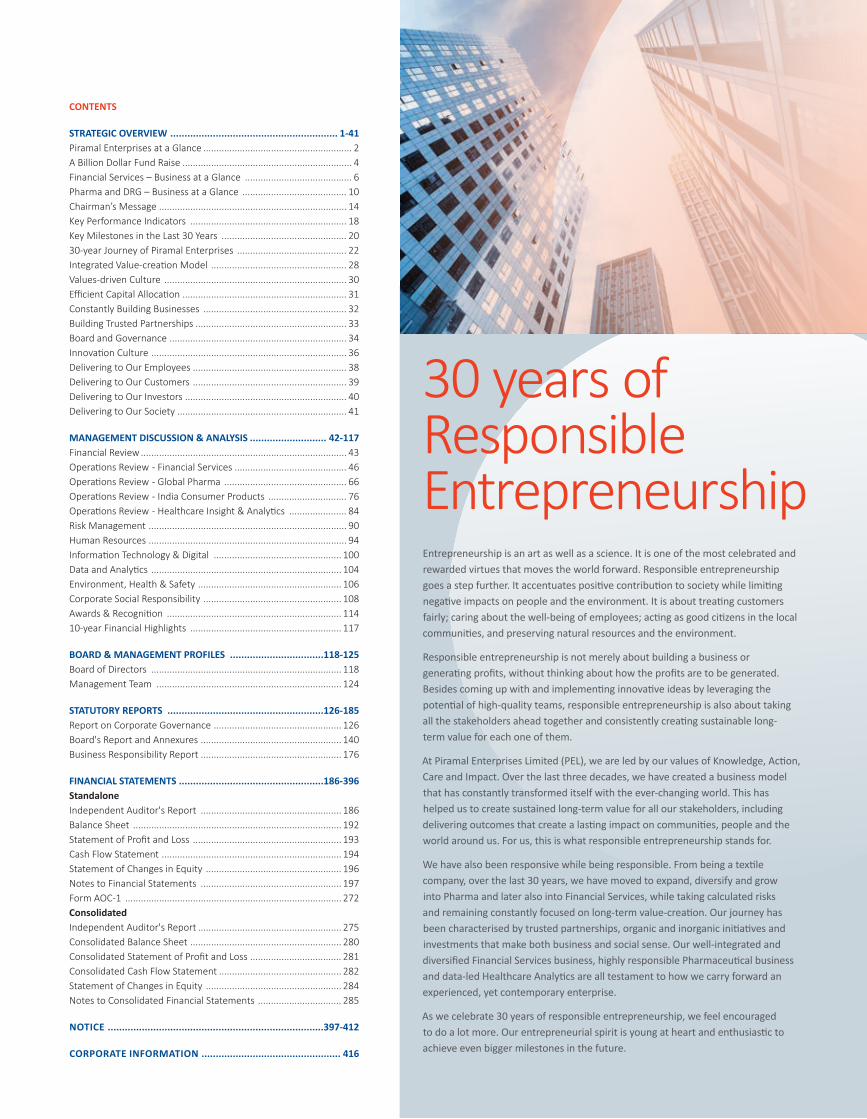
30 years of Responsible EntrepreneurshipEntrepreneurship is an art as well as a science. It is one of the most celebrated and rewarded virtues that moves the world forward. Responsible entrepreneurship goes a step further. It accentuates positive contribution to society while limiting negative impacts on people and the environment. It is about treating customers fairly; caring about the well-being of employees; acting as good citizens in the local communities, and preserving natural resources and the environment.
Responsible entrepreneurship is not merely about building a business or generating profits, without thinking about how the profits are to be generated. Besides coming up with and implementing innovative ideas by leveraging the potential of high-quality teams, responsible entrepreneurship is also about taking all the stakeholders ahead together and consistently creating sustainable long-term value for each one of them.
At Piramal Enterprises Limited (PEL), we are led by our values of Knowledge, Action, Care and Impact. Over the last three decades, we have created a business model that has constantly transformed itself with the ever-changing world. This has helped us to create sustained long-term value for all our stakeholders, including delivering outcomes that create a lasting impact on communities, people and the world around us. For us, this is what responsible entrepreneurship stands for.
We have also been responsive while being responsible. From being a textile company, over the last 30 years, we have moved to expand, diversify and grow into Pharma and later also into Financial Services, while taking calculated risks and remaining constantly focused on long-term value-creation. Our journey has been characterised by trusted partnerships, organic and inorganic initiatives and investments that make both business and social sense. Our well-integrated and diversified Financial Services business, highly responsible Pharmaceutical business and data-led Healthcare Analytics are all testament to how we carry forward an experienced, yet contemporary enterprise.
As we celebrate 30 years of responsible entrepreneurship, we feel encouraged to do a lot more. Our entrepreneurial spirit is young at heart and enthusiastic to achieve even bigger milestones in the future.
2 | Piramal Enterprises Limited
PiramalEnterprisesat a Glance
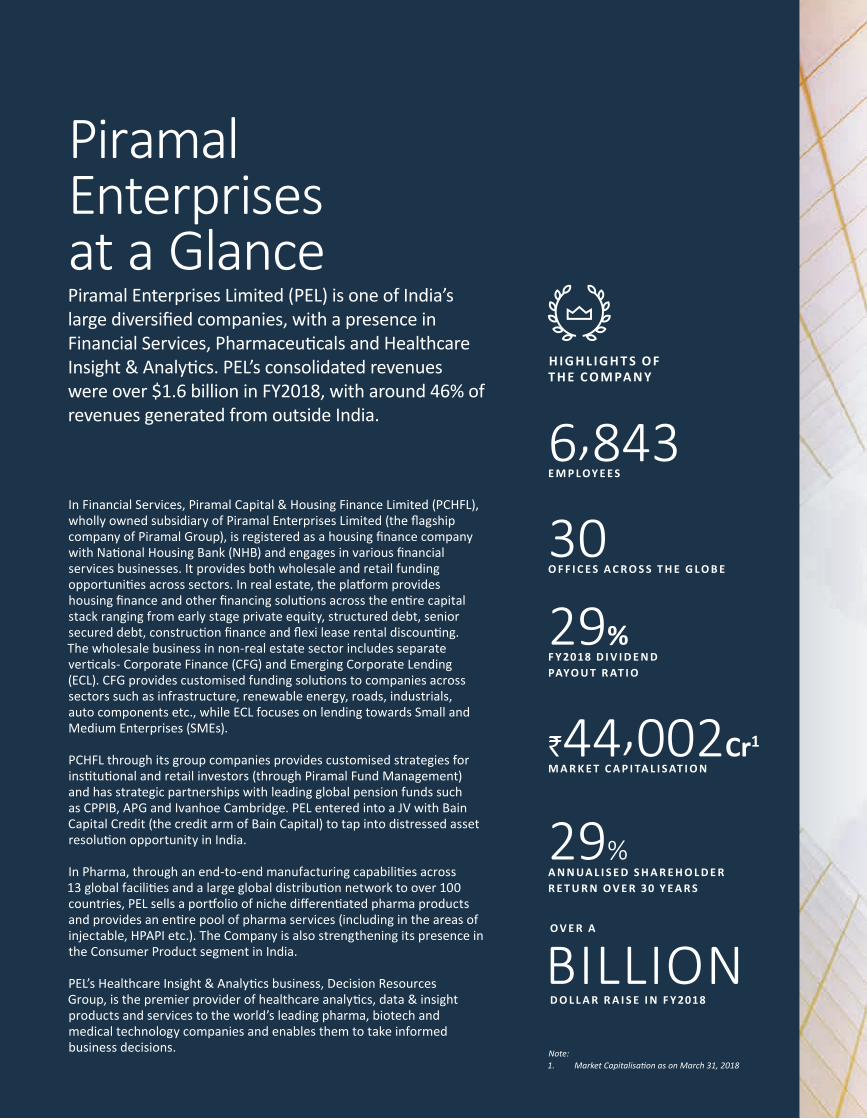
In Financial Services, Piramal Capital & Housing Finance Limited (PCHFL), wholly owned subsidiary of Piramal Enterprises Limited (the flagship company of Piramal Group), is registered as a housing finance company with National Housing Bank (NHB) and engages in various financial services businesses. It provides both wholesale and retail funding opportunities across sectors. In real estate, the platform provides housing finance and other financing solutions across the entire capital stack ranging from early stage private equity, structured debt, senior secured debt, construction finance and flexi lease rental discounting. The wholesale business in non-real estate sector includes separate verticals- Corporate Finance (CFG) and Emerging Corporate Lending (ECL). CFG provides customised funding solutions to companies across sectors such as infrastructure, renewable energy, roads, industrials, auto components etc., while ECL focuses on lending towards Small and Medium Enterprises (SMEs).
PCHFL through its group companies provides customised strategies for institutional and retail investors (through Piramal Fund Management) and has strategic partnerships with leading global pension funds such as CPPIB, APG and Ivanhoe Cambridge. PEL entered into a JV with Bain Capital Credit (the credit arm of Bain Capital) to tap into distressed asset resolution opportunity in India.
In Pharma, through an end-to-end manufacturing capabilities across 13 global facilities and a large global distribution network to over 100 countries, PEL sells a portfolio of niche differentiated pharma products and provides an entire pool of pharma services (including in the areas of injectable, HPAPI etc.). The Company is also strengthening its presence in the Consumer Product segment in India.
PEL’s Healthcare Insight & Analytics business, Decision ResourcesGroup, is the premier provider of healthcare analytics, data & insight products and services to the world’s leading pharma, biotech and medical technology companies and enables them to take informed business decisions.
H I G H L I G H T S O F T H E C O M PA N Y
Note: 1. MarketCapitalisationasonMarch31,2018
Piramal Enterprises Limited (PEL) is one of India’s large diversified companies, with a presence in Financial Services, Pharmaceuticals and Healthcare Insight & Analytics. PEL’s consolidated revenues were over $1.6 billion in FY2018, with around 46% of revenues generated from outside India.
6,843E M P L OY E E S
`44,002Cr1M A R K E T C A P I TA L I S AT I O N
29%A N N UA L I S E D S H A R E H O L D E R R E T U R N O V E R 30 Y E A R S
29%F Y 2018 D I V I D E N D PAYO U T R AT I O
30O F F I C E S A C R O S S T H E G L O B E
BILLIOND O L L A R R A I S E I N F Y 2018
O V E R A
Annual Report 2017-18 | 3
Managem
ent Discussion & Analysis
Strategic Overview
Board &
Managem
ent ProfilesStatutory Reports
Financial Statements
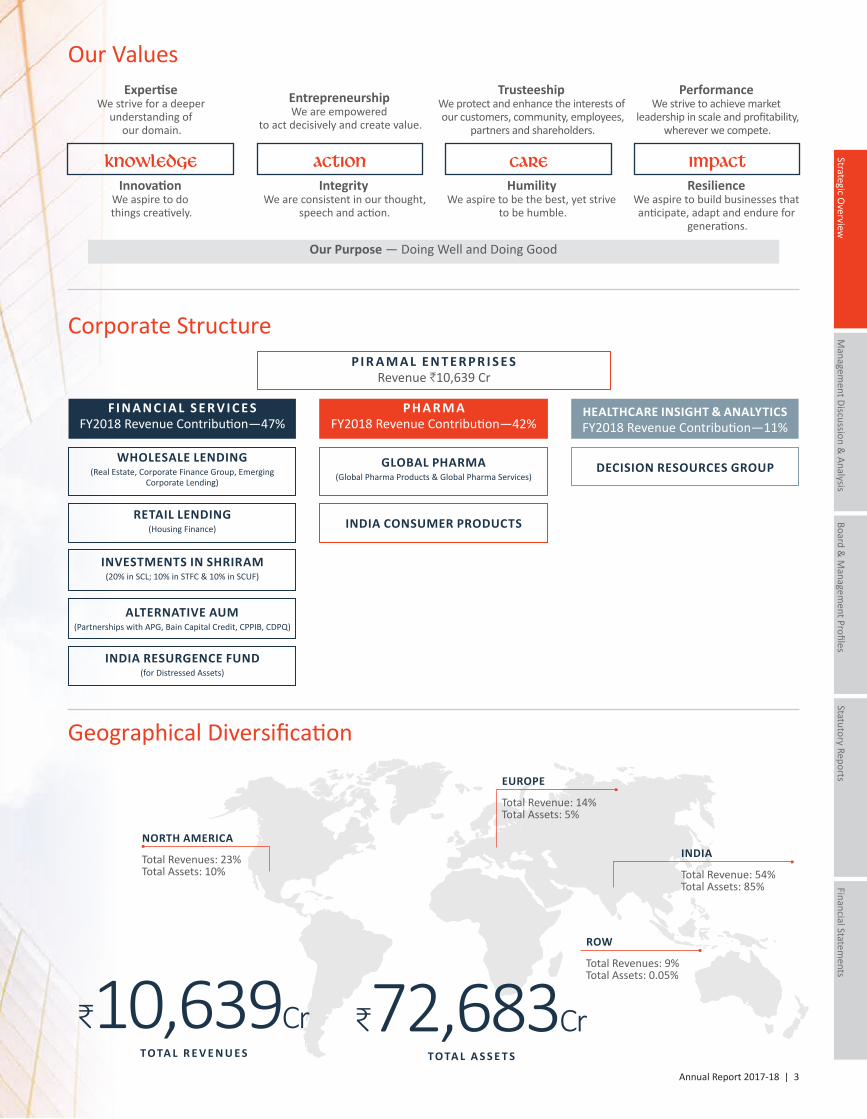
Corporate StructureP I R A M A L E N T E R P R I S E S
Revenue H10,639 Cr
F I N A N C I A L S E R V I C E SFY2018 Revenue Contribution —47%
WHOLESALE LENDING(Real Estate, Corporate Finance Group, Emerging
Corporate Lending)
GLOBAL PHARMA(Global Pharma Products & Global Pharma Services)
DECISION RESOURCES GROUP
INDIA CONSUMER PRODUCTSRETAIL LENDING
(Housing Finance)
INVESTMENTS IN SHRIRAM(20% in SCL; 10% in STFC & 10% in SCUF)
ALTERNATIVE AUM(Partnerships with APG, Bain Capital Credit, CPPIB, CDPQ)
INDIA RESURGENCE FUND(for Distressed Assets)
P H A R M AFY2018 Revenue Contribution —42%
HEALTHCARE INSIGHT & ANALYTICSFY2018 Revenue Contribution —11%
Our Purpose — Doing Well and Doing Good
Humility We aspire to be the best, yet strive
to be humble.
Trusteeship We protect and enhance the interests of our customers, community, employees,
partners and shareholders.
Integrity We are consistent in our thought,
speech and action.
ExpertiseWe strive for a deeper
understanding of our domain.
Entrepreneurship We are empowered
to act decisively and create value.
InnovationWe aspire to dothings creatively.
Resilience We aspire to build businesses that anticipate, adapt and endure for
generations.
Performance We strive to achieve market
leadership in scale and profitability, wherever we compete.
Our Values
Knowledge action care impact
Geographical Diversification
C10,639CrTO TA L R E V E N U E S
C72,683CrTO TA L A S S E T S
NORTH AMERICA
Total Revenues: 23%Total Assets: 10%
INDIA
Total Revenue: 54%Total Assets: 85%
EUROPE
Total Revenue: 14%Total Assets: 5%
ROW
Total Revenues: 9%Total Assets: 0.05%
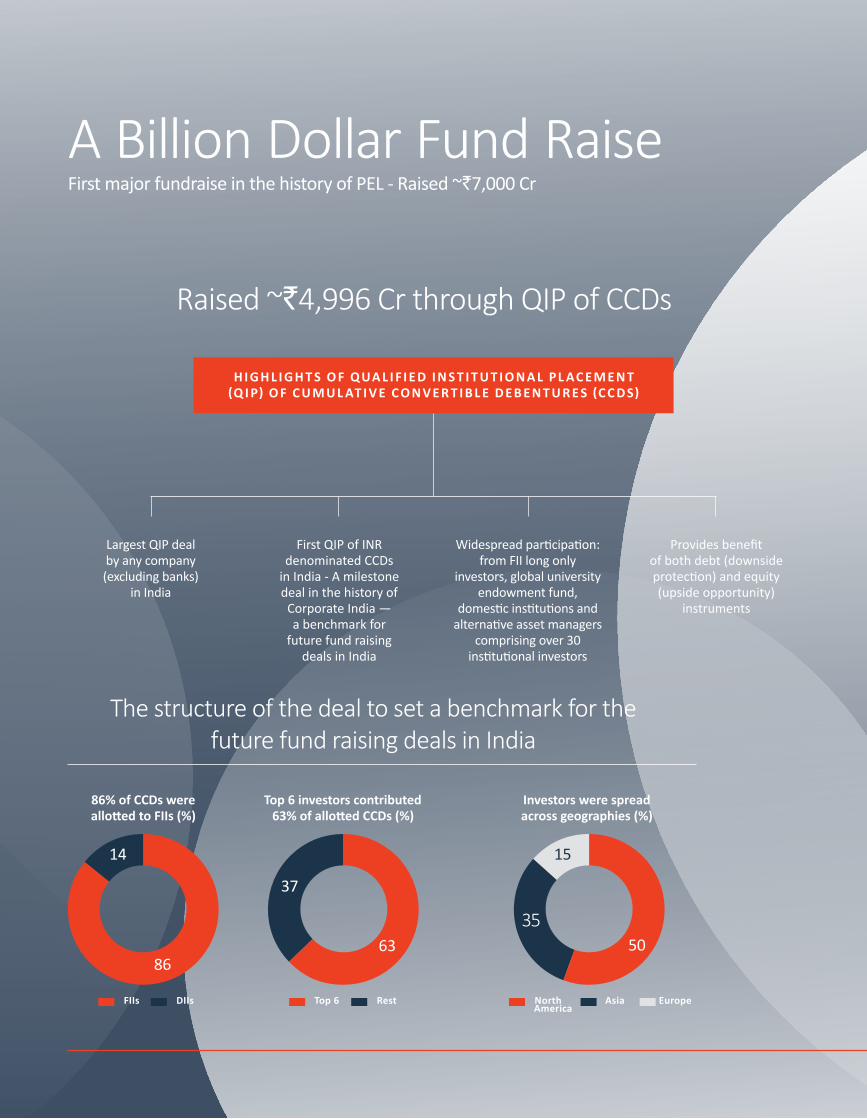
A Billion Dollar Fund Raise
H I G H L I G H T S O F Q UA L I F I E D I N S T I T U T I O N A L P L AC E M E N T (Q I P) O F C U M U L AT I V E C O N V E R T I B L E D E B E N T U R E S (C C D S)
Raised ~`4,996 Cr through QIP of CCDs
The structure of the deal to set a benchmark for the future fund raising deals in India
86% of CCDs were allotted to FIIs (%)
86
14
FIIs DIIs
Top 6 investors contributed 63% of allotted CCDs (%)
37
63
Top 6 Rest
Investors were spread across geographies (%)
5035
15
North America
Asia Europe
First major fundraise in the history of PEL - Raised ~`7,000 Cr
Largest QIP deal by any company (excluding banks)
in India
First QIP of INR denominated CCDs
in India - A milestone deal in the history of
Corporate India —a benchmark for
future fund raisingdeals in India
Widespread participation: from FII long only
investors, global university endowment fund,
domestic institutions and alternative asset managers
comprising over 30 institutional investors
Provides benefitof both debt (downside protection) and equity (upside opportunity)
instruments
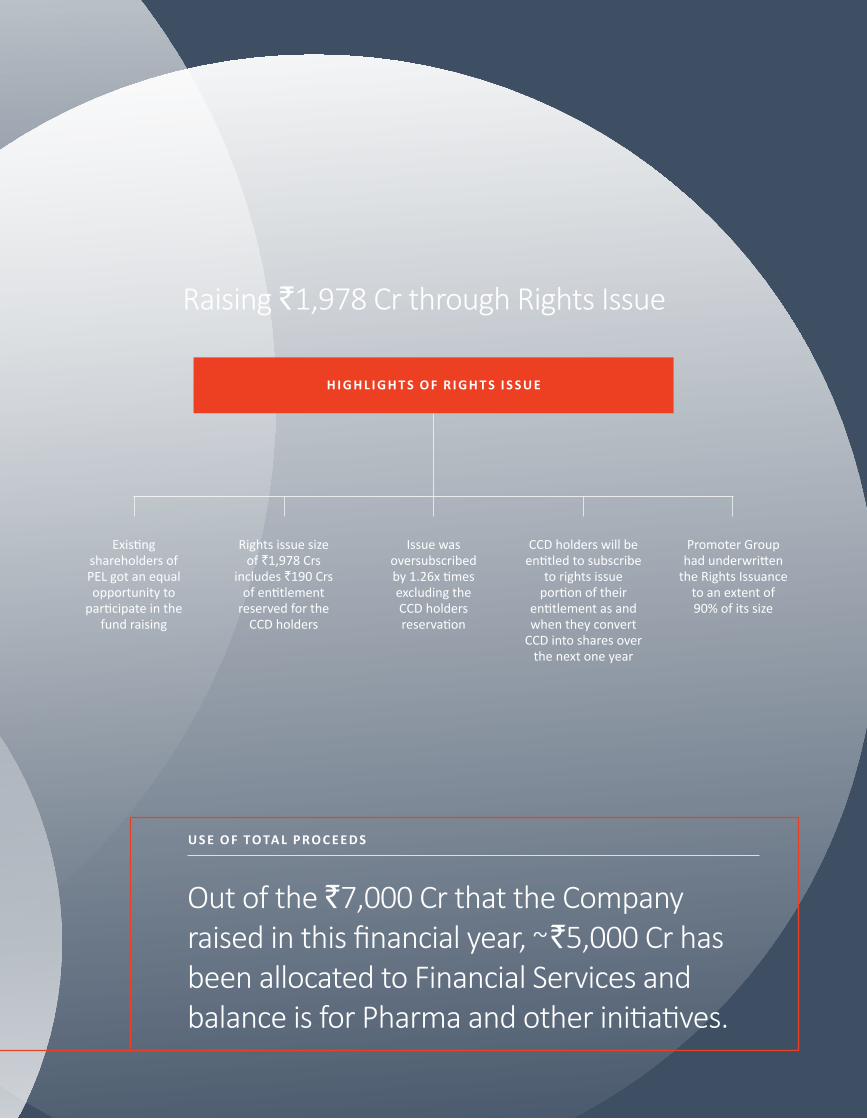
H I G H L I G H T S O F R I G H T S I S S U E
Raising `1,978 Cr through Rights Issue
Existing shareholders of PEL got an equal opportunity to
participate in the fund raising
Rights issue size of `1,978 Crs
includes `190 Crs of entitlement
reserved for the CCD holders
Issue was oversubscribed by 1.26x times excluding the CCD holders reservation
CCD holders will be entitled to subscribe
to rights issue portion of their
entitlement as and when they convert
CCD into shares over the next one year
Promoter Group had underwritten
the Rights Issuance to an extent of 90% of its size
U S E O F T O TA L P R O C E E D S
Out of the `7,000 Cr that the Company raised in this financial year, ~`5,000 Cr has been allocated to Financial Services and balance is for Pharma and other initiatives.
6 | Piramal Enterprises Limited
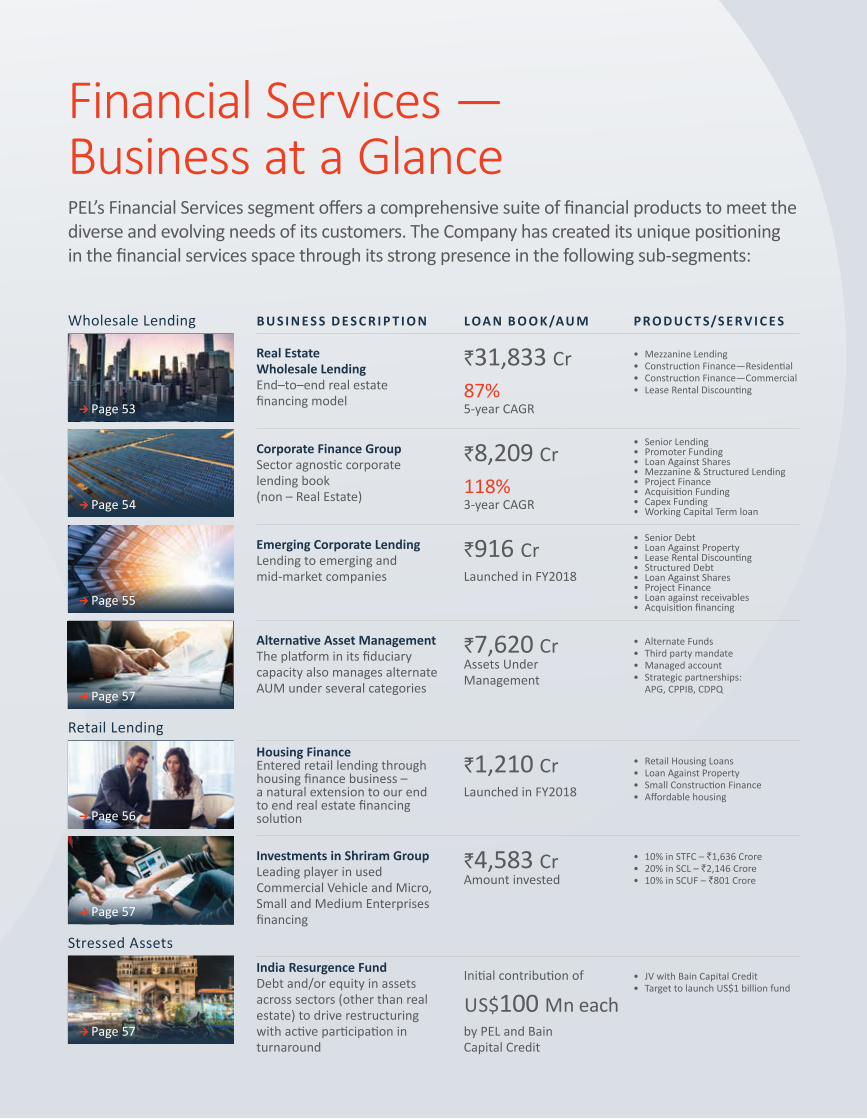
PEL’s Financial Services segment offers a comprehensive suite of financial products to meet the diverse and evolving needs of its customers. The Company has created its unique positioningin the financial services space through its strong presence in the following sub-segments:
Financial Services — Business at a Glance
Wholesale Lending
Retail Lending
Stressed Assets
P R O D U C T S/S E R V I C E SL OA N B O O K /AU MB U S I N E S S D E S C R I P T I O N
• Mezzanine Lending• Construction Finance—Residential• Construction Finance—Commercial• Lease Rental Discounting
• Senior Lending• Promoter Funding• Loan Against Shares• Mezzanine & Structured Lending• Project Finance• Acquisition Funding• Capex Funding• Working Capital Term loan
• Senior Debt• Loan Against Property• Lease Rental Discounting• Structured Debt• Loan Against Shares• Project Finance• Loan against receivables• Acquisition financing
• Alternate Funds• Third party mandate• Managed account• Strategic partnerships:
APG, CPPIB, CDPQ
• Retail Housing Loans• Loan Against Property• Small Construction Finance• Affordable housing
• 10% in STFC – `1,636 Crore• 20% in SCL – `2,146 Crore• 10% in SCUF – `801 Crore
• JV with Bain Capital Credit • Target to launch US$1 billion fund
Real Estate Wholesale LendingEnd–to–end real estate financing model
Corporate Finance GroupSector agnostic corporate lending book (non – Real Estate)
Emerging Corporate LendingLending to emerging and mid-market companies
Alternative Asset ManagementThe platform in its fiduciary capacity also manages alternate AUM under several categories
Housing FinanceEntered retail lending through housing finance business – a natural extension to our end to end real estate financing solution
Investments in Shriram GroupLeading player in used Commercial Vehicle and Micro, Small and Medium Enterprises financing
India Resurgence FundDebt and/or equity in assets across sectors (other than real estate) to drive restructuring with active participation in turnaround
`31,833 Cr87%5-year CAGR
`8,209 Cr118%3-year CAGR
`7,620 CrAssets Under Management
`916 CrLaunched in FY2018
`1,210 CrLaunched in FY2018
`4,583 CrAmount invested
Initial contribution of
US$100 Mn each by PEL and Bain Capital Credit
Page 53
Page 54
Page 55
Page 57
Page 57
Page 56
Page 57
Annual Report 2017-18 | 7
Managem
ent Discussion & Analysis
Strategic Overview
Board &
Managem
ent ProfilesStatutory Reports
Financial Statements
K E Y H I G H L I G H T S
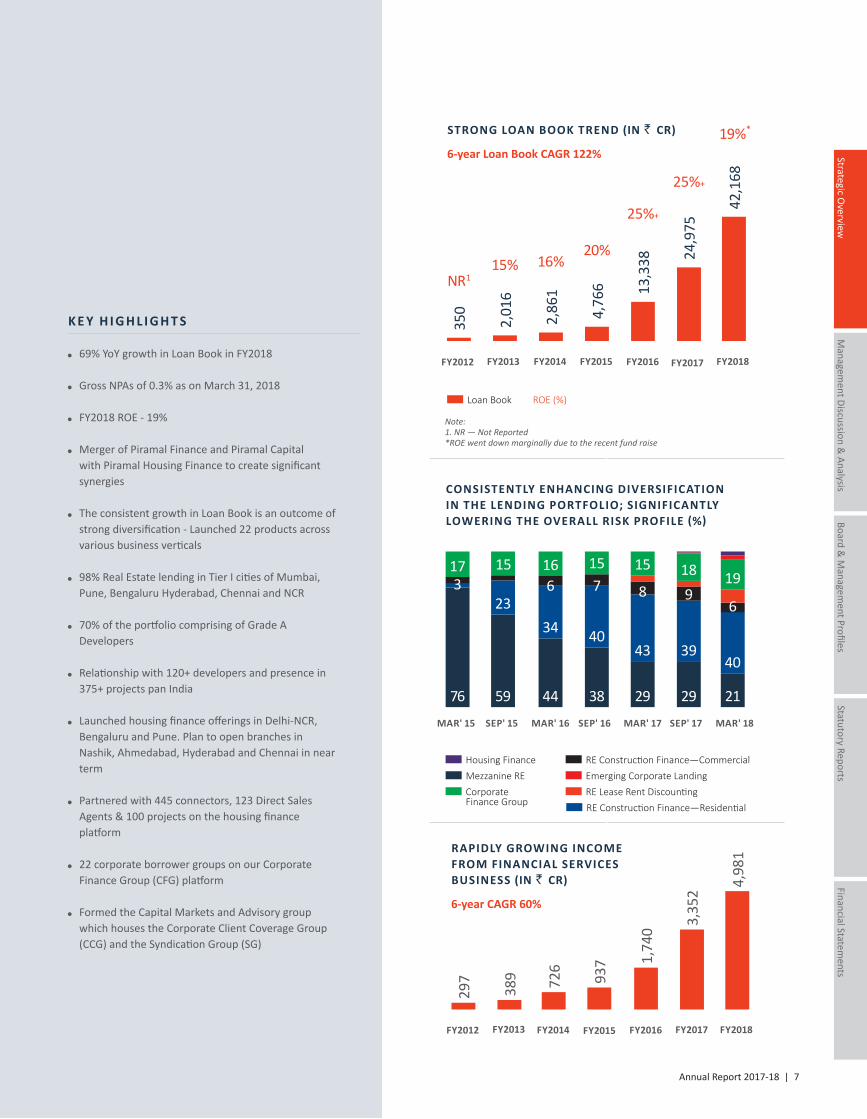
69% YoY growth in Loan Book in FY2018
Gross NPAs of 0.3% as on March 31, 2018
FY2018 ROE - 19%
Merger of Piramal Finance and Piramal Capital with Piramal Housing Finance to create significant synergies
The consistent growth in Loan Book is an outcome of strong diversification - Launched 22 products across various business verticals
98% Real Estate lending in Tier I cities of Mumbai, Pune, Bengaluru Hyderabad, Chennai and NCR
70% of the portfolio comprising of Grade A Developers
Relationship with 120+ developers and presence in 375+ projects pan India
Launched housing finance offerings in Delhi-NCR, Bengaluru and Pune. Plan to open branches in Nashik, Ahmedabad, Hyderabad and Chennai in near term
Partnered with 445 connectors, 123 Direct Sales Agents & 100 projects on the housing finance platform
22 corporate borrower groups on our Corporate Finance Group (CFG) platform
Formed the Capital Markets and Advisory group which houses the Corporate Client Coverage Group (CCG) and the Syndication Group (SG)
Loan Book ROE (%)
STRONG LOAN BOOK TREND (IN ` CR)
FY2012
350
NR1
FY2013
2,01
6
15%
FY2014
2,86
1
16%
FY2015
4,76
6
20%
FY2016
13,3
38
25%+
FY2017
24,9
75
25%+
FY2018
42,1
68
19%*
6-year Loan Book CAGR 122%
Note: 1. NR — Not Reported*ROEwentdownmarginallyduetotherecentfundraise
CONSISTENTLY ENHANCING DIVERSIFICATIONIN THE LENDING PORTFOLIO; SIGNIFICANTLY LOWERING THE OVERALL RISK PROFILE (%)
76
317
MAR' 15
15
59
23
SEP' 15
166
44
34
MAR' 16
157
38
40
SEP' 16
15
8
29
43
MAR' 17
189
29
39
SEP' 17
19
6
21
40
MAR' 18
Housing FinanceMezzanine RE Emerging Corporate LandingCorporate Finance Group
RE Construction Finance—Commercial
RE Lease Rent DiscountingRE Construction Finance—Residential
RAPIDLY GROWING INCOME FROM FINANCIAL SERVICES BUSINESS (IN ` CR)
FY2012
297
FY2013
389
FY2014
726
FY2015
937
FY2016
1,74
0
FY2017
3,35
2
FY2018
4,98
1
6-year CAGR 60%

8 | Piramal Enterprises Limited
• Launched HFC and entered 4 cities – Mumbai, Pune, Delhi – NCR and Bengaluru during FY2018
• Loan Book size of `1,210 Cr in 6 months of launch
• Natural extension to our end – to – end real estate financing platform to help the developers
• B2B2C model wherein the developer relations would play an important role
Expanded presence in retail financing with the launch of Housing Finance Company (HFC)
Created India’s second largest and a high quality real estate developer financing platform
• PEL’s real estate developer financing Loan Book has grown at a robust CAGR of 112% over last 6 years.
• Consistently delivering 50%+ YoY growth in Loan Book in each of the last 12 quarters
• End – to – end real estate developer financing platform offering product solutions right from the time of land purchase to housing finance
• Real Estate lending in Tier I cities of Mumbai, Pune, Bengaluru, Hyderabad, Chennai and NCR
• Strong relations with 120+ developers and has presence in 375+ projects pan India
Annual Report 2017-18 | 9
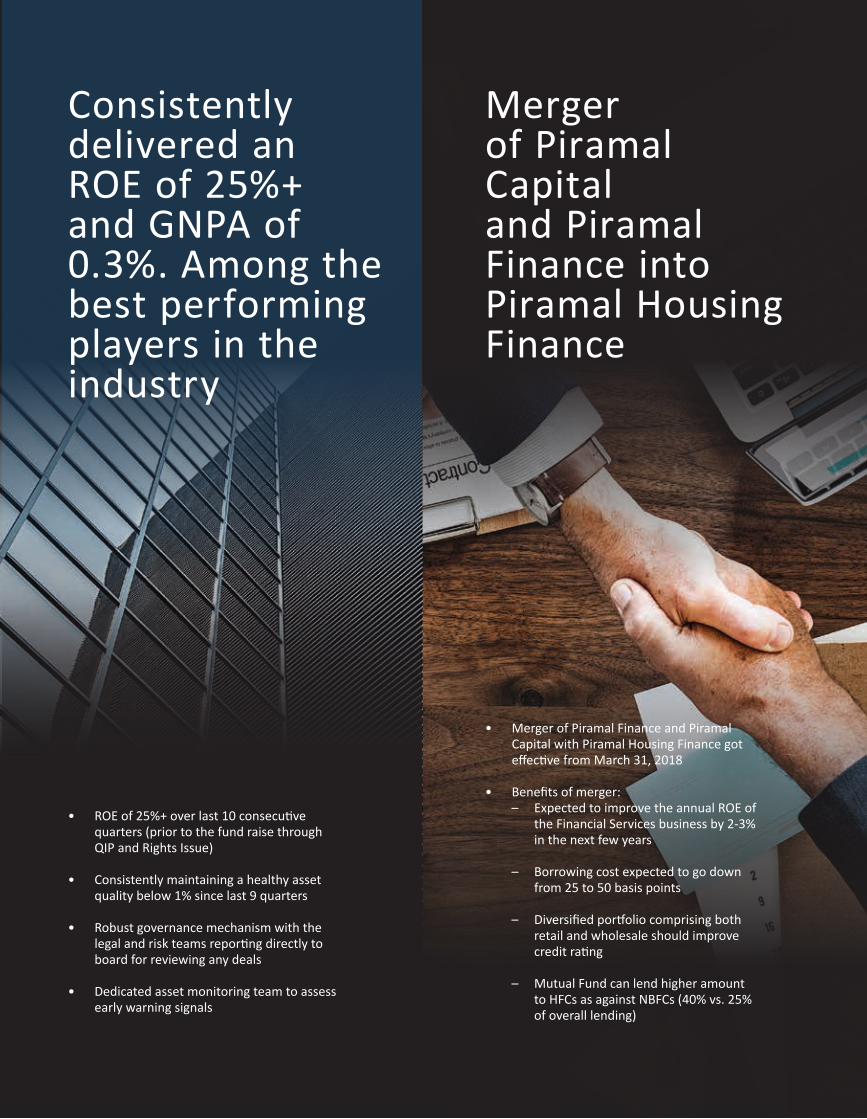
Consistently delivered an ROE of 25%+ and GNPA of 0.3%. Among the best performing players in the industry
Merger of Piramal Capitaland Piramal Finance into Piramal Housing Finance
• ROE of 25%+ over last 10 consecutive quarters (prior to the fund raise through QIP and Rights Issue)
• Consistently maintaining a healthy asset quality below 1% since last 9 quarters
• Robust governance mechanism with the legal and risk teams reporting directly to board for reviewing any deals
• Dedicated asset monitoring team to assess early warning signals
• Merger of Piramal Finance and Piramal Capital with Piramal Housing Finance got effective from March 31, 2018
• Benefits of merger: – Expected to improve the annual ROE of
the Financial Services business by 2-3% in the next few years
– Borrowing cost expected to go down from 25 to 50 basis points
– Diversified portfolio comprising both retail and wholesale should improve credit rating
– Mutual Fund can lend higher amount to HFCs as against NBFCs (40% vs. 25% of overall lending)

10 | Piramal Enterprises Limited
Global Pharma
India Consumer Products
P R O D U C T S/S E R V I C E S
P R O D U C T S/S E R V I C E S
R E V E N U E
R E V E N U E
Services Discovery Services Process R&D Pharmaceutical
Development Services Clinical Trial Supply
Services
• Research & Data Products
• Custom Data & Analytics
• Consulting & Managed Services
• Learning
Segments covered:
• Pharma Companies
• Payer
• Providers
Services Contract Development and Manufacturing Organisation (CDMO) offering end-to-end solutions across the drug life cycle through a globally integrated network of facilities.
Products A strong product portfolio of niche differentiated branded generic products that are difficult to manufacture, sell or distribute.
Decision Resources Group (DRG), is a best-in-class, decision support platform in the healthcare information services space. It provides indispensable insights to life sciences companies, healthcare providers and payers, through a variety of high value-added data and analytics, research reports and knowledge-based services.
It caters to the Indian self-care market. Today, PEL’s OTC range comprises of 18 major brands from the pharmaceutical and personal care space, in diverse product categories like Vitamins & Nutrition, Dermatological & Antacids, Analgesics and Baby Care.
`3,976 Cr16%7-year CAGR
`1,209 Cr
`537 Cr#
18%9-year CAGR
Page 67
Page 67
Page 84
Page 76
Pharma — Business at a Glance
Healthcare Insight & Analytics — Business at a Glance
HPAPI Development and Manufacturing
API Manufacturing Finished Dosage
Manufacturing (Oral Solids, Sterile Injectables)
Antibody Drug Conjugation
Eight brands among India’s top 100 OTC brands • Saridon• Lacto Calamine• I-Pill• Tetmosol• Polycrol• Naturolax• Caladryl• Little’s
Presence in Segments:• Skin care • Pain management• Oral care• Respiratory• Gastro-intestinal• Lifestyle problems• Kids wellbeing
B U S I N E S S D E S C R I P T I O N
B U S I N E S S D E S C R I P T I O N
Products Inhalation Anaesthetics
Sevoflurane Isoflurane Halothane Injectable Anaesthesia /
Pain Management Sublimaze* Sufenta* Rapifen*
Dipidolor* Hypnomidate * ControlledSubstances Intrathecal Severe
Spasticity/Pain Management
Gablofen Others
API Generics Vitamins & Premixes
#Includesophthalmology(AllerganJV)
Annual Report 2017-18 | 11
Managem
ent Discussion & Analysis
Strategic Overview
Board &
Managem
ent ProfilesStatutory Reports
Financial Statements
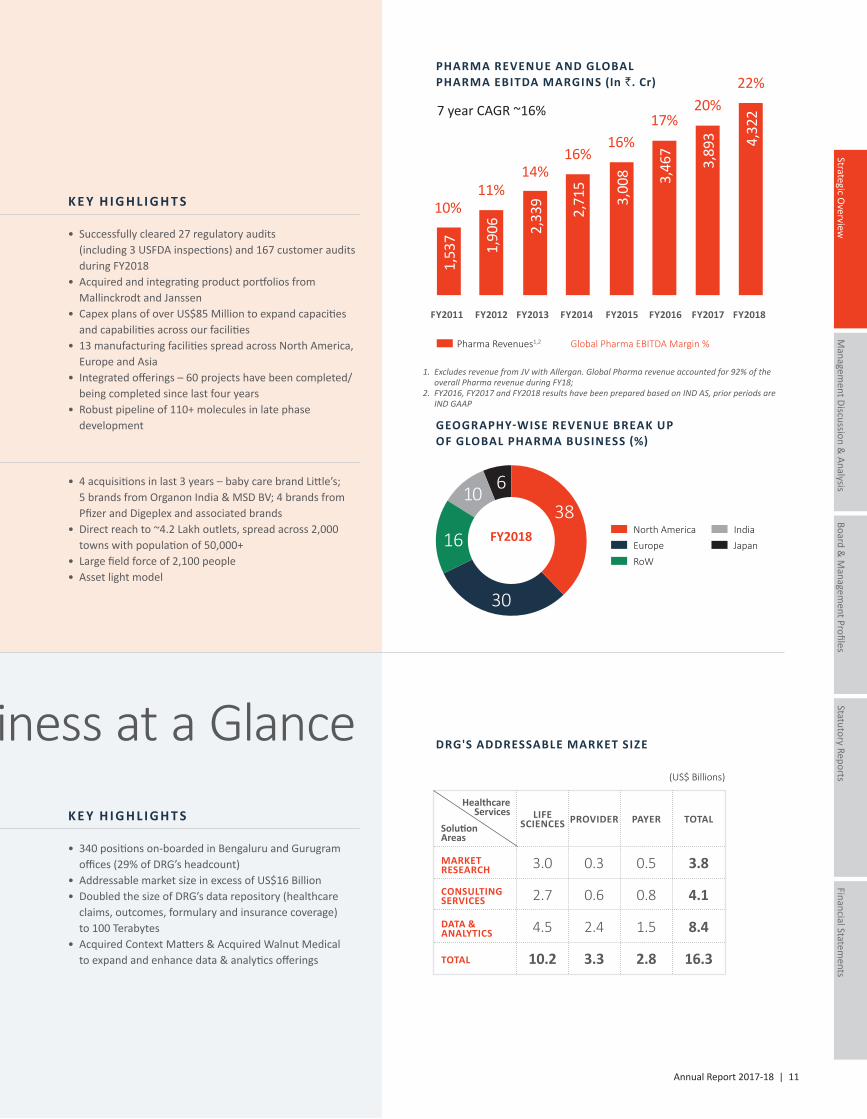
• Successfully cleared 27 regulatory audits (including 3 USFDA inspections) and 167 customer audits during FY2018
• Acquired and integrating product portfolios from Mallinckrodt and Janssen
• Capex plans of over US$85 Million to expand capacities and capabilities across our facilities
• 13 manufacturing facilities spread across North America, Europe and Asia
• Integrated offerings – 60 projects have been completed/ being completed since last four years
• Robust pipeline of 110+ molecules in late phase development
• 340 positions on-boarded in Bengaluru and Gurugram offices (29% of DRG’s headcount)
• Addressable market size in excess of US$16 Billion• Doubled the size of DRG’s data repository (healthcare
claims, outcomes, formulary and insurance coverage) to 100 Terabytes
• Acquired Context Matters & Acquired Walnut Medical to expand and enhance data & analytics offerings
• 4 acquisitions in last 3 years – baby care brand Little’s; 5 brands from Organon India & MSD BV; 4 brands from Pfizer and Digeplex and associated brands
• Direct reach to ~4.2 Lakh outlets, spread across 2,000 towns with population of 50,000+
• Large field force of 2,100 people• Asset light model
Pharma — Business at a Glance
Healthcare Insight & Analytics — Business at a Glance
K E Y H I G H L I G H T S
K E Y H I G H L I G H T S
1. ExcludesrevenuefromJVwithAllergan.GlobalPharmarevenueaccountedfor92%oftheoverallPharmarevenueduringFY18;
2. FY2016,FY2017andFY2018resultshavebeenpreparedbasedonINDAS,priorperiodsare INDGAAP
Pharma Revenues1,2 Global Pharma EBITDA Margin %
PHARMA REVENUE AND GLOBAL PHARMA EBITDA MARGINS (In `. Cr)
7 year CAGR ~16%
FY2011 FY2012 FY2013 FY2014 FY2015 FY2016 FY2017 FY2018
2,71
5
1,53
7
3,00
8
1,90
6
3,46
7
2,33
9
3,89
3 4,32
2
10%11%
14%16%
16%17%
20%22%
North AmericaEuropeRoW
IndiaJapan
GEOGRAPHY-WISE REVENUE BREAK UP OF GLOBAL PHARMA BUSINESS (%)
FY2018
38
30
16
10 6
LIFE SCIENCES PROVIDER PAYER TOTAL
MARKET RESEARCH
DATA & ANALYTICS
CONSULTING SERVICES
TOTAL
Healthcare Services
Solution Areas
(US$ Billions)
3.0
2.7
4.5
10.2 3.3 2.8 16.3
0.3
0.6
2.4
0.5
0.8
1.5
3.8
4.1
8.4
DRG'S ADDRESSABLE MARKET SIZE
12 | Piramal Enterprises Limited
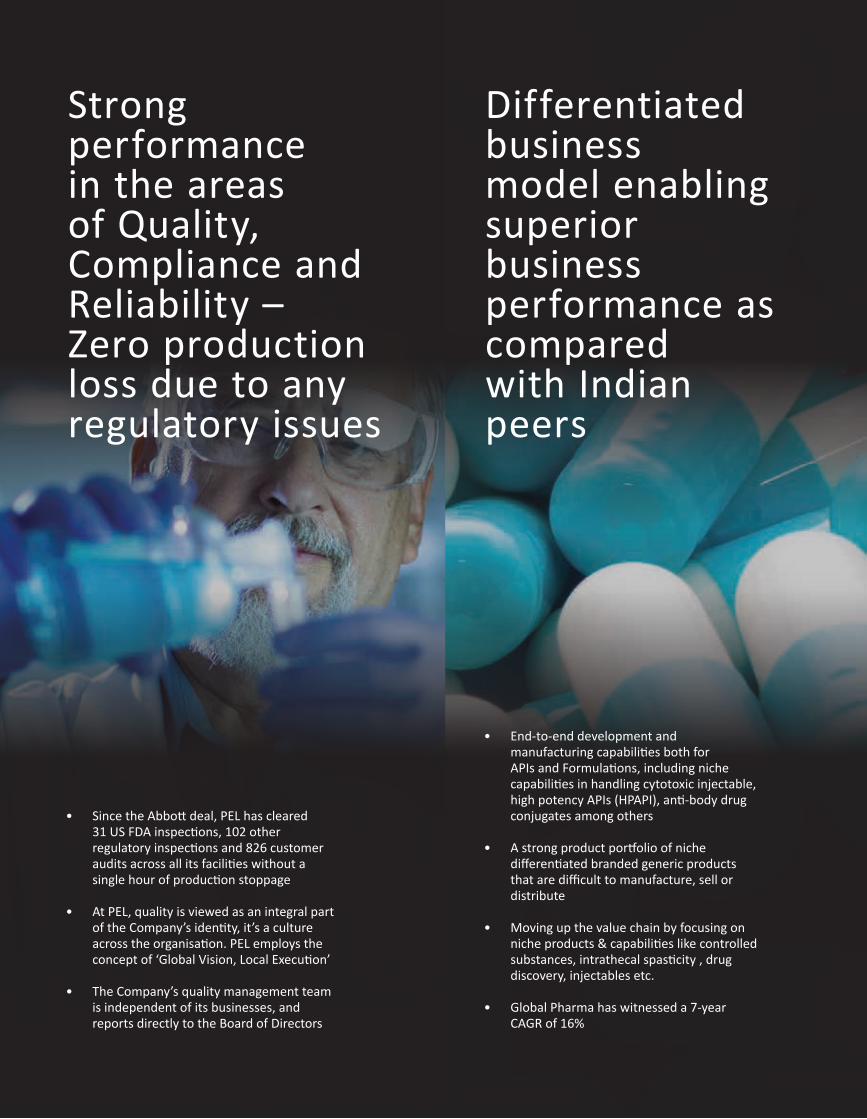
• Since the Abbott deal, PEL has cleared 31 US FDA inspections, 102 other regulatory inspections and 826 customer audits across all its facilities without a single hour of production stoppage
• At PEL, quality is viewed as an integral part of the Company’s identity, it’s a culture across the organisation. PEL employs the concept of ‘Global Vision, Local Execution’
• The Company’s quality management team is independent of its businesses, and reports directly to the Board of Directors
Strong performance in the areas of Quality, Compliance and Reliability – Zero production loss due to any regulatory issues
Differentiated business model enabling superior business performance as comparedwith Indian peers
• End-to-end development and manufacturing capabilities both for APIs and Formulations, including niche capabilities in handling cytotoxic injectable, high potency APIs (HPAPI), anti-body drug conjugates among others
• A strong product portfolio of niche differentiated branded generic products that are difficult to manufacture, sell or distribute
• Moving up the value chain by focusing on niche products & capabilities like controlled substances, intrathecal spasticity , drug discovery, injectables etc.
• Global Pharma has witnessed a 7-year CAGR of 16%
Annual Report 2017-18 | 13
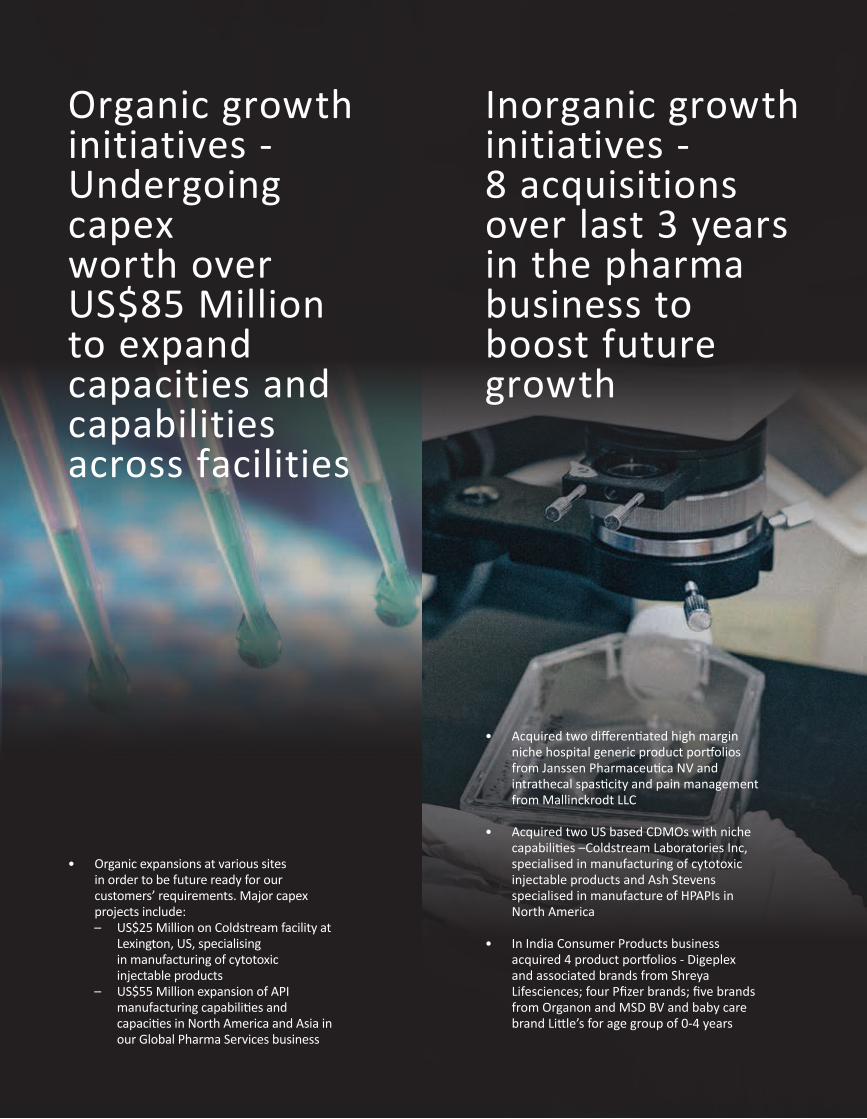
Organic growth initiatives - Undergoing capex worth over US$85 Million to expand capacities and capabilities across facilities
Inorganic growth initiatives -8 acquisitions over last 3 years in the pharma business to boost future growth
• Organic expansions at various sites in order to be future ready for our customers’ requirements. Major capex projects include:
– US$25 Million on Coldstream facility at Lexington, US, specialising in manufacturing of cytotoxic injectable products
– US$55 Million expansion of API manufacturing capabilities and capacities in North America and Asia in our Global Pharma Services business
• Acquired two differentiated high margin niche hospital generic product portfolios from Janssen Pharmaceutica NV and intrathecal spasticity and pain management from Mallinckrodt LLC
• Acquired two US based CDMOs with niche capabilities –Coldstream Laboratories Inc, specialised in manufacturing of cytotoxic injectable products and Ash Stevens specialised in manufacture of HPAPIs in North America
• In India Consumer Products business acquired 4 product portfolios - Digeplex and associated brands from Shreya Lifesciences; four Pfizer brands; five brands from Organon and MSD BV and baby care brand Little’s for age group of 0-4 years
14 | Piramal Enterprises Limited
Chairman's Message
23%30- Y E A R C A G R O F R E V E N U E
29%30- Y E A R C A G R O F N E T P R O F I T
`5,680 CrR E T U R N E D TO I T S S H A R E H O L D E R S I N T H E F O R M O F D I V I D E N D S , S P E C I A L D I V I D E N D A N D B U Y B A C K S I N C E F Y 2011
Annual Report 2017-18 | 15
Managem
ent Discussion & Analysis
Strategic Overview
Board &
Managem
ent ProfilesStatutory Reports
Financial Statements
Dear Shareholders,
My warm greetings to all of you.
Our 30-year journeyThe Company has consistently transformed itself over the last 30 years. In 1988, we entered the pharmaceuticals space and in over a period of two decades, we became one of the top pharma companies in India. Consequent to the sale of our Domestic Formulations business to Abbott in 2010, we have once again transformed our business model. Today, we are a diversified Company with interests across Financial Services, Pharmaceuticals and Healthcare Insight & Analytics. Apart from scaling our existing pharma businesses, both organically and through acquisitions, we entered into new businesses, grew them significantly, and attained leadership position in their respective areas. Over this period of 30 years, the Company has a Revenue CAGR of 23% and Net Profit CAGR of 29%1 . The Company delivered an annualised shareholder return of 29% during this period, a milestone that only a few Indian companies have achieved.
Performance since the Abbott dealSince the Abbott deal in 2010, the Company has delivered Revenue CAGR2 of 29% and a normalised Net Profit CAGR2 (i.e. excluding exceptional gains/losses) of 55%. Over the last five years, the Company delivered an annualised shareholder return of 40% as compared with 14% return by Nifty.
In both the key sectors, Financial Services and Pharma, the Company has been consistently delivering a strong performance since the Abbott deal. In Financial Services, we recorded a ROE of 25%+ over last 10 consecutive quarters prior to the fund raise and has consistently maintained a healthy asset quality with GNPA below 1% since last nine quarters.
The Pharma revenues3 have grown at a seven-year CAGR of 16%. The margins for Global Pharma business (which accounts for ~92% of our Pharma revenues) have improved from 10% in FY2011 to 22% in FY2018, on account of both organic and inorganic initiatives.
Performance for the yearWe have had another year of robust performance. For the year FY2018, the Company has delivered 24% growth in revenues at `10,639 Cr. The reported net profit for the year was at
`5,120 Cr. During the quarter, our Loan Book grew 69% to `42,168 Cr. In addition to this, loans worth `23,300 Cr are approved but yet to get disbursed.
For the financial year 2018, the Board has recommended, subject to your approval, a dividend of `25 per share at a dividend payout ratio of 29%.
Restructuring in Financial Services businessDuring the year FY2018, we had initiated the process of merging Piramal Finance and Piramal Capital into Piramal Housing Finance with an intent of streamlining the Financial Services business, a step in the direction of de-merging Financial Services and Pharma businesses in the future. After obtaining all the necessary regulatory approvals, the merger got effective on May 23, 2018. The merger will result in significant synergies over the coming years.
The Company created a Deferred Tax Asset in its balance sheet that has resulted in an accounting gain of `3,569 Cr. Post adjustment, our normalised Net Profit has grown by 24% at `1,551 Cr for FY2018.
The benefits of these synergies are expected to accrue in the coming years. Our Financial Services ROEs (on cash basis) are expected to go up by around 2-3% for the next few years.
Fund RaiseWe raised around `7,000 Cr over the last few months, of which ~`5,000 Cr was through Qualified Institutional Placement (QIP) of Compulsorily Convertible Debentures (CCDs). This was the first major fund raise in the history of PEL; the largest QIP deal by any company (excluding banks) in India and a unique structure that sets a benchmark for future fundraising deals in this country. CCDs provide benefits of both debt (downside protection) and equity (upside opportunity). We also raised `1,782 Cr through a rights issue. The issue was oversubscribed by 1.26 times (excluding the CCD holders’ reservation). The CCD holders will be entitled to subscribe to the rights issue portion of their entitlement as and when they convert the CCD into shares. The objective of this rights issuance was to give the existing PEL shareholders an equal opportunity to participate in the fundraising process.
The Company delivered an annualised shareholder return of 29% during this period, a milestone that
only a few Indian companies have achieved.
Note:1. FY2018normalisednetprofitexcludessynergiesonaccountofmergerofsubsidiariesinFinancialservicessegment2. 6-yearCAGR3. PharmarevenuesincludeGlobalPharmaandIndiaConsumerProducts
16 | Piramal Enterprises Limited
Out of the total of ~`7,000 Cr of capital that we raised, we have allocated `5,000 Cr to Financial Services and remaining ~`2,000 Cr has been kept for Pharma and other initiatives.
Financial ServicesIndia’s GDP is expected to grow from US$2.6 trillion in 2017 to US$6 trillion in the next 10 years. Our country is expected to become the third-largest economy in the world in a couple of years. A significant pool of capital will be needed to fund this rapid growth in GDP. Higher financial penetration, significant reforms undertaken by the Government and the focus on technology is expected to quadruple the size of the financial services sector. We are very well-positioned to take advantage of this huge opportunity that our country is expected to offer.
The Loan Book grew 69% Y-o-Y to `42,168 Cr as on March 31, 2018. Further, `23,300 Cr of loans have been approved but yet to get disbursed. We saw strong growth across all the verticals of Financial Services: Real Estate Developer Financing, Corporate Finance Lending, Emerging Corporate Lending and Housing Finance business.
Despite these challenging times, over the last six years, quarter after quarter, our Company has been able to deliver a robust CAGR of 122% in the Loan Book. The consistent growth in our Loan Book is also an outcome of our approach of consistently creating innovative solutions for our clients and our high focus on diversification, through the launch of multiple new lower risk products and new business verticals. In March 2015, around 76% of our book constituted of high-yield mezzanine loans in Real Estate. Now, ~46% of our Loan Book is Construction Finance where the risk profile is much lower as the developer already has all approvals and construction is currently ongoing. Our Real Estate Developer Financing Loan Book grew by 50% to `31,833 Cr. During the year, we also forayed into the Hospitality sector by committing `1,200 Cr of loans across marquee hotel assets in Gurugram, Bengaluru and Pune.
Our Corporate Finance Loan Book grew by 118% to `8,209 Cr as on March 31, 2018. Due to our approach of offering customised solutions across the yield range to multiple sectors that we feel comfortable lending to, we see a huge growth opportunity in this space. During the last year, in order to cater to this opportunity, the Corporate Finance business also formed the Corporate Client Coverage Group, which is a dedicated sourcing team to build a relationship-driven lending business and offers customised-financing solutions for all wholesale-funding requirements of corporates across our selected sectors; and the Syndication Group that is responsible for down-selling of underwritten transactions across the real estate and Corporate Financing platforms.
We are now targeting diversification into retail with housing finance. We are well underway to monetise the significant opportunity that our country offers. Over the past few quarters, we have put in place branches and teams across different geographies, technology platforms and a highly-skilled analytics team, among other initiatives. Within a few months of its launch, our Housing Finance Loan Book grew to `1,210 Cr as on March 31, 2018. Additionally, the business has loans approved, but not disbursed at `580 Cr. We launched our offerings in
Delhi-NCR, Bengaluru and Pune and plan to open branches in Nashik, Ahmedabad, Hyderabad and Chennai during the next few months. Apart from Housing Finance, we will continue to explore various opportunities in the retail financing segment.
As we continue to diversify and with the size and scale that our business is aiming for in next few years, we believe that we should be able to deliver 20% ROE on a sustainable basis on a much larger Loan Book in the future. During the year FY2018, the business generated an ROE of 19% as we allocated `5,000 Cr from the fresh capital raised to our Financial Services business.
Our Gross NPA ratio (based on 90 DPD) remained healthy at 0.3% at the end of Q4 FY2018. As a conservative measure, we continue to provide more than the regulatory requirements and maintain the provisioning at around 1.8%. During the year, we received an upward revision in rating outlook from ICRA – from AA Stable to AA Positive. Post the merger into Piramal Housing Finance, we now expect further upgrade in our credit rating.
We had earlier launched India Resurgence Fund, a distressed asset fund in a joint venture with Bain Capital Credit, the credit arm of Bain Capital. The platform is actively participating in acquiring control of good assets with broken balance sheets in growth sectors, recapitalising the capital structure to make the business viable through infusion of capital with controlling stake and driving business turnaround through active participation.
PharmaWe continue to grow well in our Pharma segment despite the tough business environment. Our Pharma business grew during the year to `4,322 Cr. Our business model is different from that of the other large Indian pharma companies. This differentiated business model has ensured that we perform better than the others in this sector.
Quality remains an ongoing concern for many Indian and global pharma companies, with many of them facing scrutiny by regulatory authorities such as the US FDA. Similar to the risk monitoring and assessment framework that we set in the Financial Services business, in Pharma too, we have a high focus on compliance and quality. Since 2011, we successfully cleared all 31 US FDA inspections, 102 other regulatory inspections and 826 customer audits. Quality is a culture at Piramal and we have built an exemplary quality framework that is implemented across our manufacturing facilities. Just as Risk, Legal and Compliance, the Quality function also reports independently to the Board.
Global Pharma revenues for FY2018 grew 13% Y-o-Y to `3,976 Cr on account of robust performance across various facilities, strong order book and good growth in business acquired from Mallinckrodt and Janssen. The transition and integration of acquired products from Mallinckrodt is completed and that of Janssen is progressing as per plan and continue to perform in line with our expectations. The company is undergoing capex plans of ~US$85-90 Mn across our facilities to increase our capabilities and capacities for our customers. The margin profile for this business has improved significantly over the last couple of years. During FY2018 we delivered EBITDA margins of 22% as compared with 20% in FY2017.
Annual Report 2017-18 | 17
Managem
ent Discussion & Analysis
Strategic Overview
Board &
Managem
ent ProfilesStatutory Reports
Financial Statements
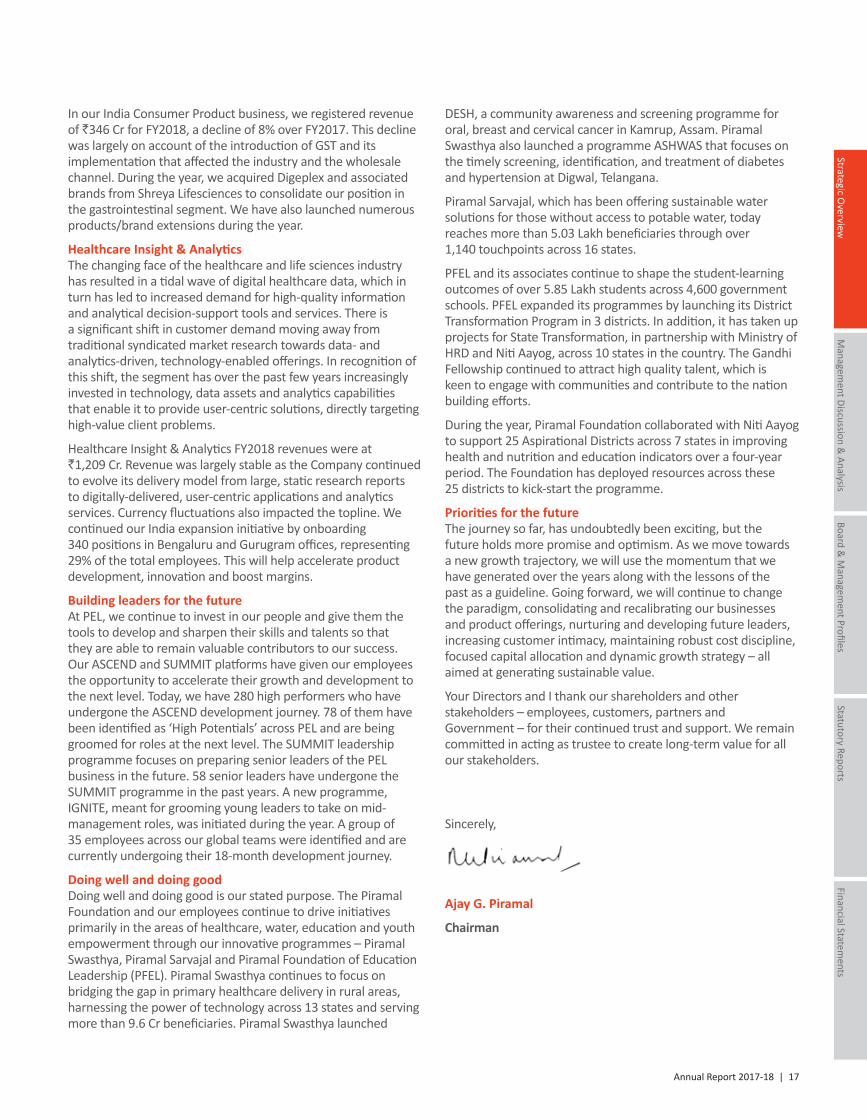
In our India Consumer Product business, we registered revenue of `346 Cr for FY2018, a decline of 8% over FY2017. This decline was largely on account of the introduction of GST and its implementation that affected the industry and the wholesale channel. During the year, we acquired Digeplex and associated brands from Shreya Lifesciences to consolidate our position in the gastrointestinal segment. We have also launched numerous products/brand extensions during the year.
Healthcare Insight & AnalyticsThe changing face of the healthcare and life sciences industry has resulted in a tidal wave of digital healthcare data, which in turn has led to increased demand for high-quality information and analytical decision-support tools and services. There is a significant shift in customer demand moving away from traditional syndicated market research towards data- and analytics-driven, technology-enabled offerings. In recognition of this shift, the segment has over the past few years increasingly invested in technology, data assets and analytics capabilities that enable it to provide user-centric solutions, directly targeting high-value client problems.
Healthcare Insight & Analytics FY2018 revenues were at `1,209 Cr. Revenue was largely stable as the Company continued to evolve its delivery model from large, static research reports to digitally-delivered, user-centric applications and analytics services. Currency fluctuations also impacted the topline. We continued our India expansion initiative by onboarding 340 positions in Bengaluru and Gurugram offices, representing 29% of the total employees. This will help accelerate product development, innovation and boost margins.
Building leaders for the futureAt PEL, we continue to invest in our people and give them the tools to develop and sharpen their skills and talents so that they are able to remain valuable contributors to our success. Our ASCEND and SUMMIT platforms have given our employees the opportunity to accelerate their growth and development to the next level. Today, we have 280 high performers who have undergone the ASCEND development journey. 78 of them have been identified as ‘High Potentials’ across PEL and are being groomed for roles at the next level. The SUMMIT leadership programme focuses on preparing senior leaders of the PEL business in the future. 58 senior leaders have undergone the SUMMIT programme in the past years. A new programme, IGNITE, meant for grooming young leaders to take on mid-management roles, was initiated during the year. A group of 35 employees across our global teams were identified and are currently undergoing their 18-month development journey.
Doing well and doing goodDoing well and doing good is our stated purpose. The Piramal Foundation and our employees continue to drive initiatives primarily in the areas of healthcare, water, education and youth empowerment through our innovative programmes – Piramal Swasthya, Piramal Sarvajal and Piramal Foundation of Education Leadership (PFEL). Piramal Swasthya continues to focus on bridging the gap in primary healthcare delivery in rural areas, harnessing the power of technology across 13 states and serving more than 9.6 Cr beneficiaries. Piramal Swasthya launched
DESH, a community awareness and screening programme for oral, breast and cervical cancer in Kamrup, Assam. Piramal Swasthya also launched a programme ASHWAS that focuses on the timely screening, identification, and treatment of diabetes and hypertension at Digwal, Telangana.
Piramal Sarvajal, which has been offering sustainable water solutions for those without access to potable water, today reaches more than 5.03 Lakh beneficiaries through over 1,140 touchpoints across 16 states.
PFEL and its associates continue to shape the student-learning outcomes of over 5.85 Lakh students across 4,600 government schools. PFEL expanded its programmes by launching its District Transformation Program in 3 districts. In addition, it has taken up projects for State Transformation, in partnership with Ministry of HRD and Niti Aayog, across 10 states in the country. The Gandhi Fellowship continued to attract high quality talent, which is keen to engage with communities and contribute to the nation building efforts.
During the year, Piramal Foundation collaborated with Niti Aayog to support 25 Aspirational Districts across 7 states in improving health and nutrition and education indicators over a four-year period. The Foundation has deployed resources across these 25 districts to kick-start the programme.
Priorities for the futureThe journey so far, has undoubtedly been exciting, but the future holds more promise and optimism. As we move towards a new growth trajectory, we will use the momentum that we have generated over the years along with the lessons of the past as a guideline. Going forward, we will continue to change the paradigm, consolidating and recalibrating our businesses and product offerings, nurturing and developing future leaders, increasing customer intimacy, maintaining robust cost discipline, focused capital allocation and dynamic growth strategy – all aimed at generating sustainable value.
Your Directors and I thank our shareholders and other stakeholders – employees, customers, partners and Government – for their continued trust and support. We remain committed in acting as trustee to create long-term value for all our stakeholders.
Sincerely,
Ajay G. Piramal
Chairman
18 | Piramal Enterprises Limited
Key Performance Indicators
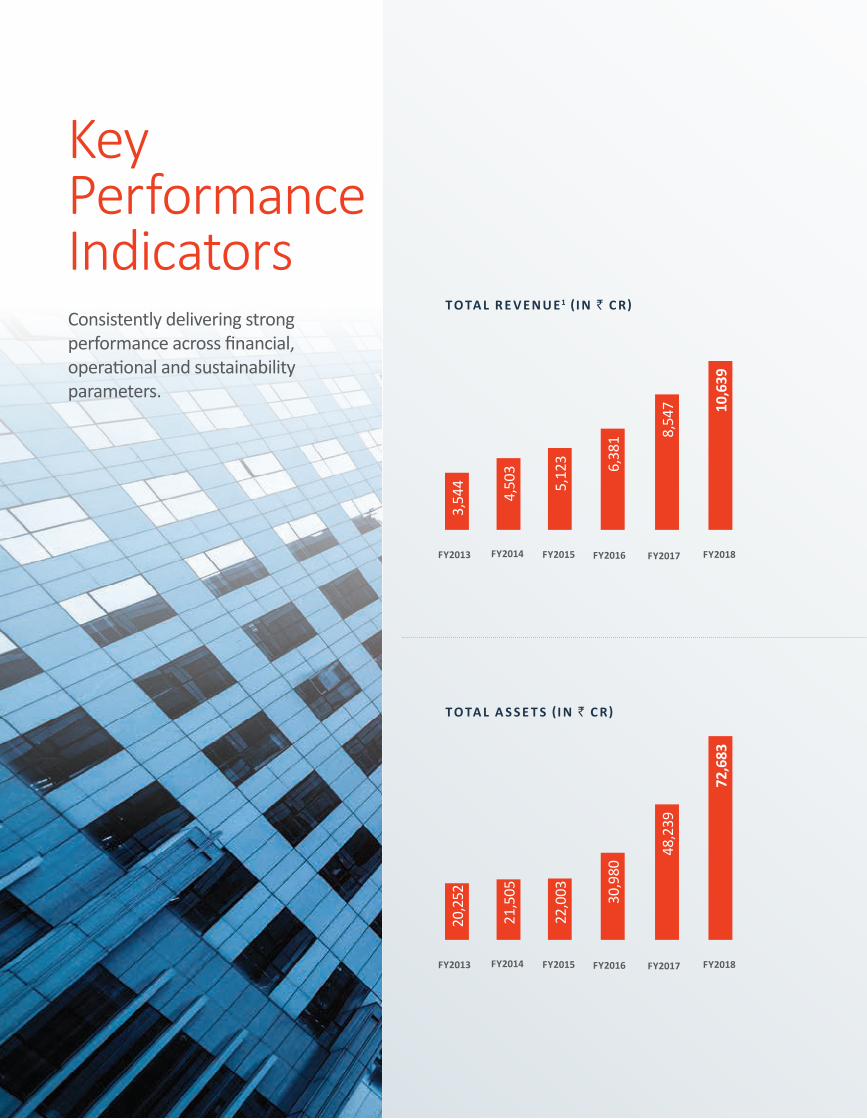
T O TA L R E V E N U E1 ( I N ` C R)
T O TA L A S S E T S (I N ` C R)
FY2014
4,50
3
FY20155,
123
FY2016
6,38
1
FY2013
3,54
4
FY2017
8,54
7
FY2018
10,6
39
FY2014
21,5
05
FY2015
22,0
03
FY2016
30,9
80
FY2013
20,2
52
FY2017
48,2
39
FY2018
72,6
83
Consistently delivering strong performance across financial, operational and sustainability parameters.
Annual Report 2017-18 | 19
Managem
ent Discussion & Analysis
Strategic Overview
Board &
Managem
ent ProfilesStatutory Reports
Financial Statements
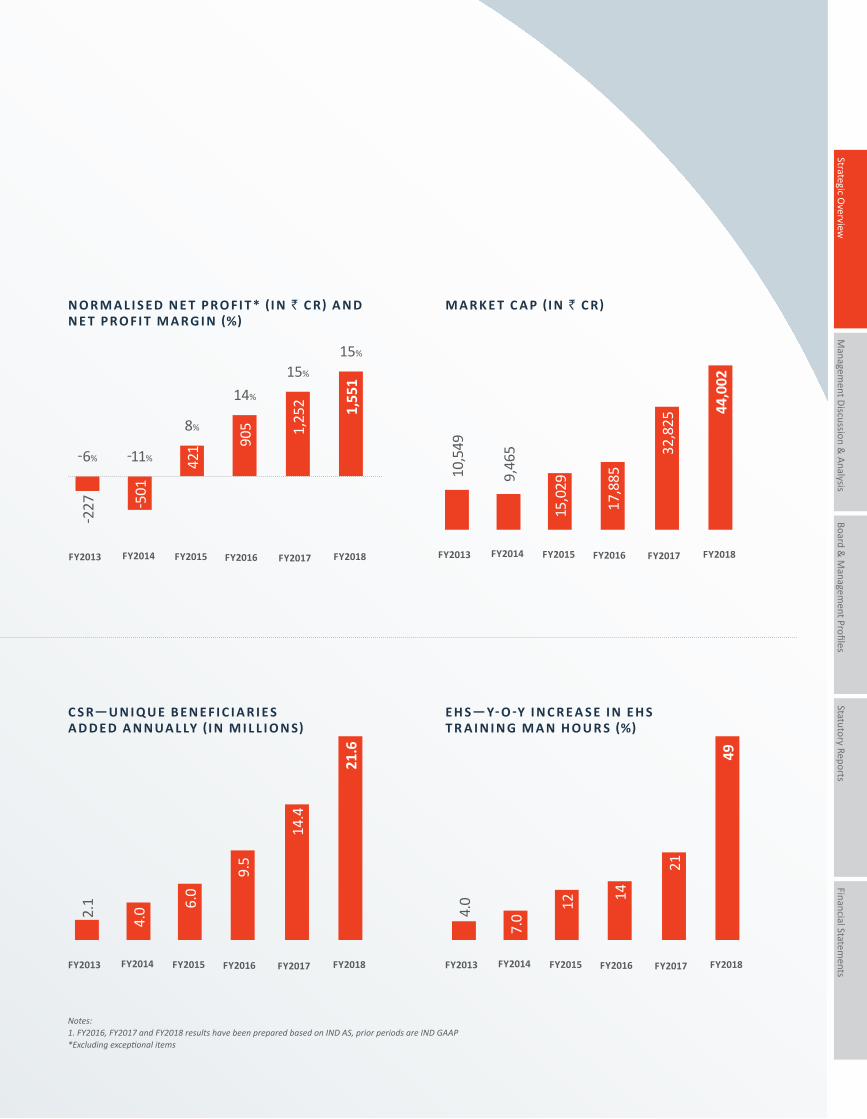
M A R K E T C A P (I N ` C R)
FY2014
9,46
5
FY201515
,029
FY2016
17,8
85
FY2013
10,5
49
FY2017
32,8
25
FY2018
44,0
02
N O R M A L I S E D N E T P R O F I T* (I N ` C R) A N D N E T P R O F I T M A R G I N (%)
FY2014
-501
-11%
FY2015
421
8%
FY2016
905
14%
FY2017
1,25
2
15%
FY2018
1,55
115%
FY2013
-227
-6%
C S R—U N I Q U E B E N E F I C I A R I E S A D D E D A N N UA L LY (I N M I L L I O N S)
FY2014
4.0
FY2015
6.0
FY2016
9.5
FY2013
2.1
FY2017
14.4
FY2018
21.6
E H S— Y- O -Y I N C R E A S E I N E H S T R A I N I N G M A N H O U R S (%)
FY2014
7.0
FY2015
12
FY2016
14
FY2013
4.0
FY2017
21
FY2018
49
Notes:1.FY2016,FY2017andFY2018resultshavebeenpreparedbasedonINDAS,priorperiodsareINDGAAP*Excludingexceptionalitems
20 | Piramal Enterprises Limited
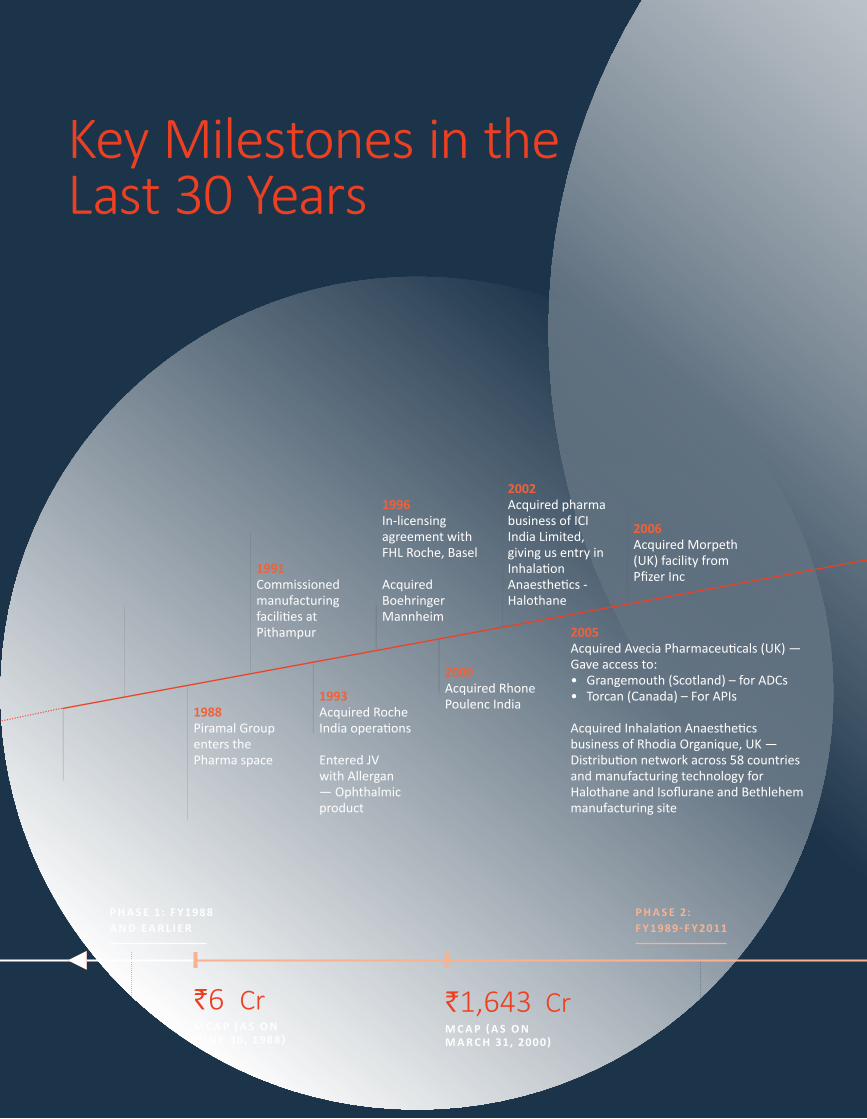
Key Milestones in the Last 30 Years
1988 Piramal Group enters the Pharma space
1991 Commissioned manufacturing facilities at Pithampur
1996 In-licensing agreement with FHL Roche, Basel
Acquired Boehringer Mannheim
2002 Acquired pharma business of ICI India Limited, giving us entry in InhalationAnaesthetics - Halothane
2006Acquired Morpeth (UK) facility from Pfizer Inc
1993 Acquired Roche India operations
Entered JV with Allergan — Ophthalmic product
2000 Acquired Rhone Poulenc India
2005Acquired Avecia Pharmaceuticals (UK) — Gave access to: • Grangemouth (Scotland) – for ADCs • Torcan (Canada) – For APIs
Acquired Inhalation Anaesthetics business of Rhodia Organique, UK — Distribution network across 58 countries and manufacturing technology for Halothane and Isoflurane and Bethlehem manufacturing site
`6 CrM C A P ( A S O N J U N E 30, 1988)
`1,643 CrM C A P ( A S O N M A R C H 31, 2000)
P H A S E 1: F Y 1988 A N D E A R L I E R
P H A S E 2: F Y 1989- F Y 2011
Annual Report 2017-18 | 21
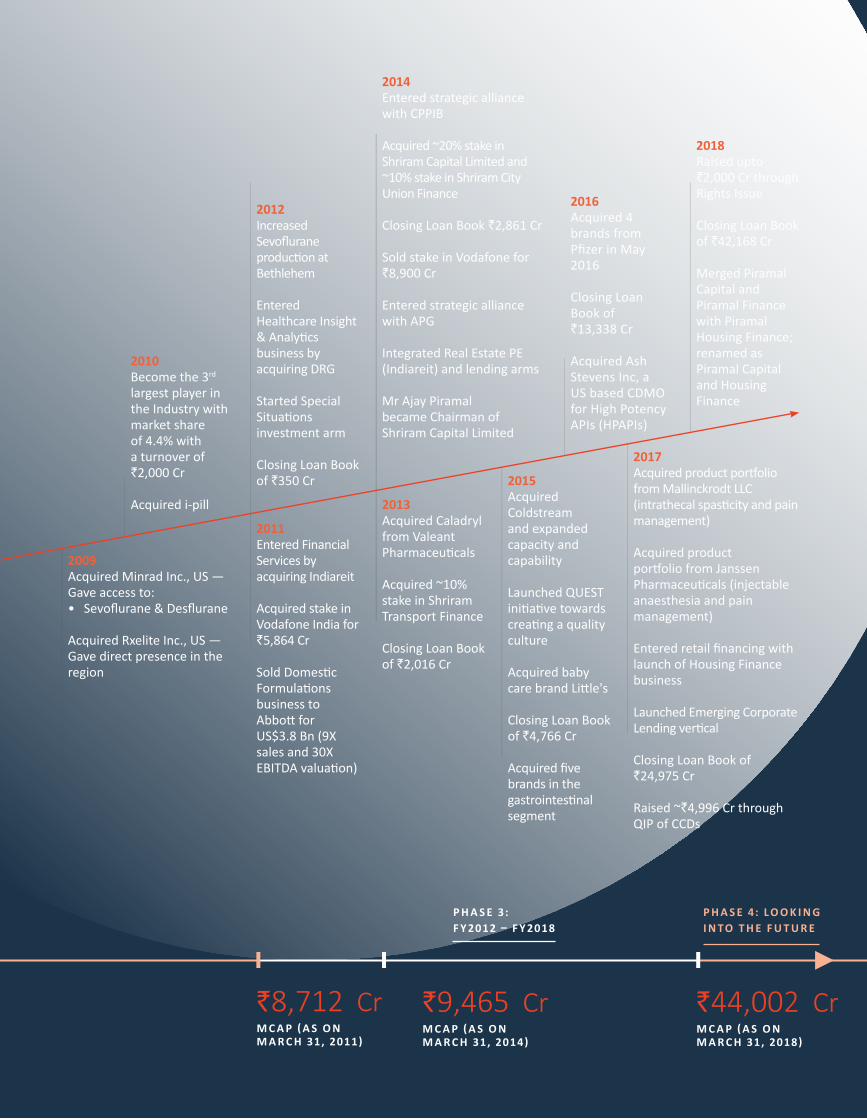
2010 Become the 3rd largest player in the Industry with market share of 4.4% with a turnover of `2,000 Cr
Acquired i-pill
2009Acquired Minrad Inc., US — Gave access to:• Sevoflurane & Desflurane
Acquired Rxelite Inc., US — Gave direct presence in the region
2011Entered Financial Services by acquiring Indiareit
Acquired stake in Vodafone India for `5,864 Cr
Sold Domestic Formulations business to Abbott for US$3.8 Bn (9X sales and 30X EBITDA valuation)
2013 Acquired Caladryl from Valeant Pharmaceuticals Acquired ~10% stake in Shriram Transport Finance
Closing Loan Book of `2,016 Cr
2015 Acquired Coldstream and expanded capacity and capability
Launched QUEST initiative towards creating a quality culture
Acquired baby care brand Little's
Closing Loan Book of `4,766 Cr
Acquired five brands in the gastrointestinal segment
2017Acquired product portfolio from Mallinckrodt LLC(intrathecal spasticity and pain management)
Acquired product portfolio from Janssen Pharmaceuticals (injectable anaesthesia and pain management)
Entered retail financing with launch of Housing Finance business
Launched Emerging Corporate Lending vertical
Closing Loan Book of `24,975 Cr
Raised ~`4,996 Cr through QIP of CCDs
2012 Increased Sevoflurane production at Bethlehem
Entered Healthcare Insight & Analytics business by acquiring DRG
Started Special Situations investment arm Closing Loan Book of `350 Cr
2014Entered strategic alliance with CPPIB
Acquired ~20% stake in Shriram Capital Limited and ~10% stake in Shriram City Union Finance
Closing Loan Book `2,861 Cr
Sold stake in Vodafone for `8,900 Cr
Entered strategic alliance with APG
Integrated Real Estate PE (Indiareit) and lending arms
Mr Ajay Piramal became Chairman of Shriram Capital Limited
2016Acquired 4 brands from Pfizer in May 2016
Closing Loan Book of `13,338 Cr
Acquired Ash Stevens Inc, a US based CDMO for High Potency APIs (HPAPIs)
2018Raised upto `2,000 Cr through Rights Issue
Closing Loan Book of `42,168 Cr
Merged Piramal Capital and Piramal Finance with Piramal Housing Finance; renamed as Piramal Capital and Housing Finance
`8,712 CrM C A P ( A S O N M A R C H 31, 2011)
`44,002 Cr M C A P ( A S O N M A R C H 31, 2018)
`9,465 CrM C A P ( A S O N M A R C H 31, 2014)
P H A S E 3: F Y 2012 – F Y 2018
P H A S E 4: L O O K I N G I N TO T H E F U T U R E
22 | Piramal Enterprises Limited
Prior to 1988, the Group was involved in Textile and other businesses. Since the acquisition of Nicholas Laboratories in 1988, the company reinvented itself multiple times, constantly evolved and grew, with a clear objective of consistently creating significant value for all its stakeholders.The entry into pharmaceuticals was a contrarian move by the Group. This was because at that time, most global pharmaceutical companies were exiting India due to its challenging business environment and unfriendly patent regime. In the last 30 years, PEL has undergone multiple rounds of transformation, which has helped it grow manifold and stand strong in the ever-changing economic environment. The Company had entered the pharma industry, grew from 48th rank in 1988 to one of the Top 3 pharma players by 2010 and sold the Domestic Formulations business for a record valuation; and later also entered the financial services business. Today, apart from growing the remaining Pharma businesses, the Company has also created a large, diversified and high quality financial services platform. Thus, Piramal Enterprises has today emerged as one of the large, well-established and diversified conglomerates of India.
30-year Journey of Piramal Enterprises
Annual Report 2017-18 | 23
Managem
ent Discussion & Analysis
Strategic Overview
Board &
Managem
ent ProfilesStatutory Reports
Financial Statements
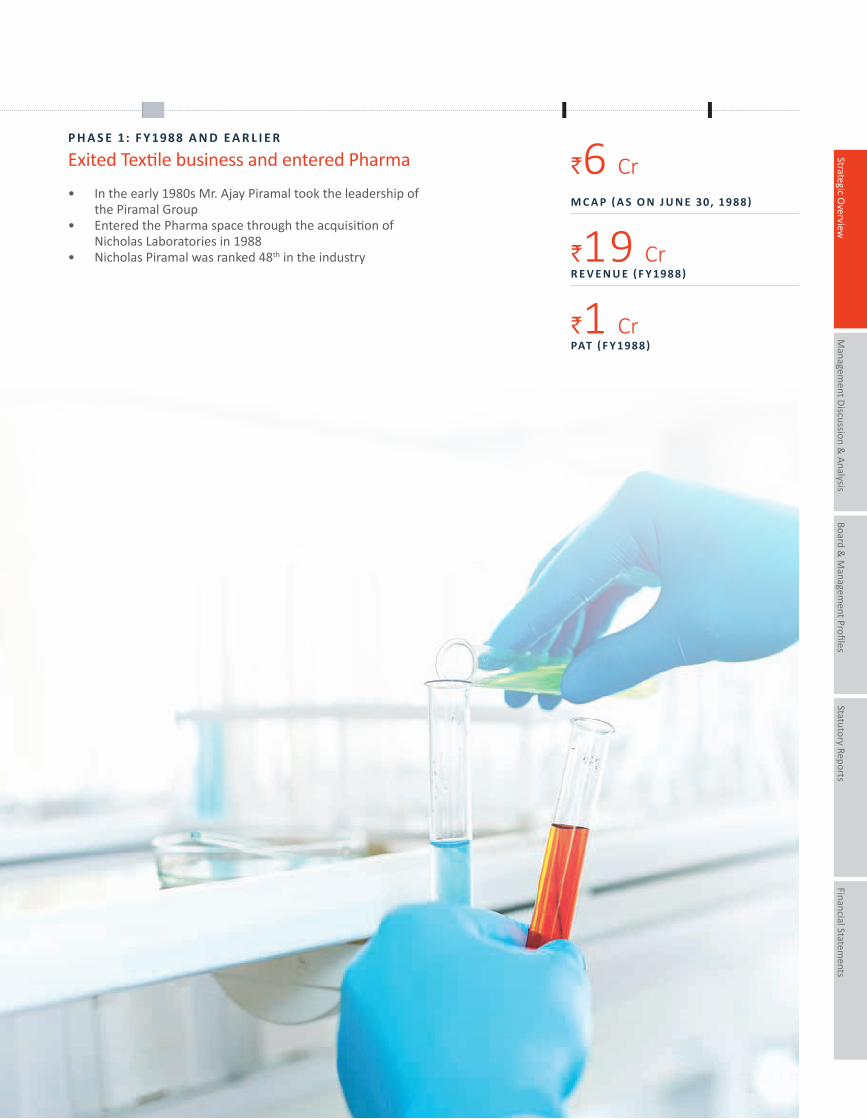
P H A S E 1: F Y 1988 A N D E A R L I E R
Exited Textile business and entered Pharma
• In the early 1980s Mr. Ajay Piramal took the leadership of the Piramal Group
• Entered the Pharma space through the acquisition of Nicholas Laboratories in 1988
• Nicholas Piramal was ranked 48th in the industry
`6 Cr M C A P ( A S O N J U N E 30, 1988)
`19 CrR E V E N U E ( F Y 1988)
`1 CrPAT ( F Y 1988)
24 | Piramal Enterprises Limited
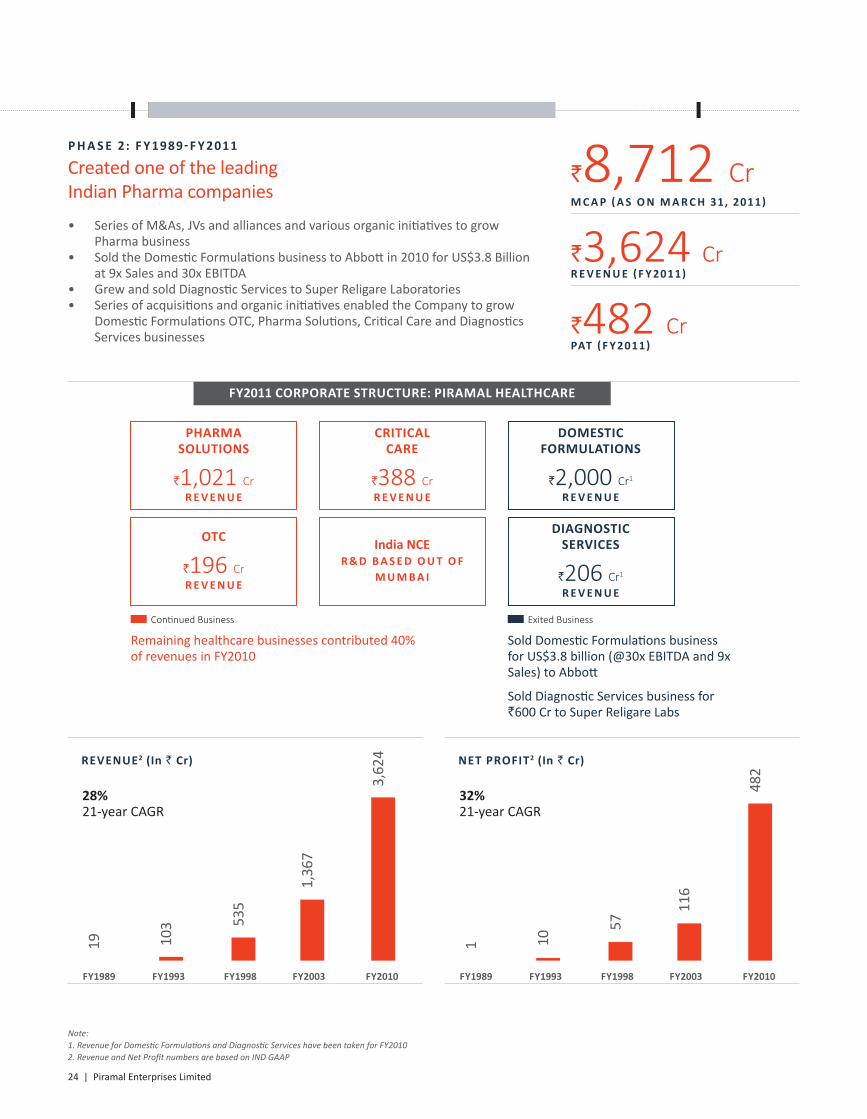
P H A S E 2: F Y 1989- F Y 2011
Created one of the leadingIndian Pharma companies
• Series of M&As, JVs and alliances and various organic initiatives to grow Pharma business
• Sold the Domestic Formulations business to Abbott in 2010 for US$3.8 Billion at 9x Sales and 30x EBITDA
• Grew and sold Diagnostic Services to Super Religare Laboratories• Series of acquisitions and organic initiatives enabled the Company to grow
Domestic Formulations OTC, Pharma Solutions, Critical Care and Diagnostics Services businesses
FY2011 CORPORATE STRUCTURE: PIRAMAL HEALTHCARE
CRITICAL CARE
`388 CrR E V E N U E
DOMESTIC FORMULATIONS
`2,000 Cr1
R E V E N U E
DIAGNOSTIC SERVICES
`206 Cr1
R E V E N U E
PHARMA SOLUTIONS
`1,021 CrR E V E N U E
OTC
`196 CrR E V E N U E
India NCER & D B A S E D O U T O F
M U M B A I
Note: 1.RevenueforDomesticFormulationsandDiagnosticServiceshavebeentakenforFY20102.RevenueandNetProfitnumbersarebasedonINDGAAP
Remaining healthcare businesses contributed 40% of revenues in FY2010
Continued Business Exited Business
Sold Domestic Formulations business for US$3.8 billion (@30x EBITDA and 9x Sales) to Abbott
Sold Diagnostic Services business for `600 Cr to Super Religare Labs
`8,712 Cr M C A P ( A S O N M A R C H 31, 2011)
REVENUE2 (In ` Cr)
28%21-year CAGR
FY1989 FY1993 FY1998 FY2003 FY2010
19 103 53
5
1,36
7
3,62
4 NET PROFIT2 (In ` Cr)
32%21-year CAGR
FY1989
1
FY1993
10
FY1998
57
FY2003
116
FY2010
482
`3,624 CrR E V E N U E ( F Y 2011)
`482 CrPAT ( F Y 2011)
Annual Report 2017-18 | 25
Managem
ent Discussion & Analysis
Strategic Overview
Board &
Managem
ent ProfilesStatutory Reports
Financial Statements
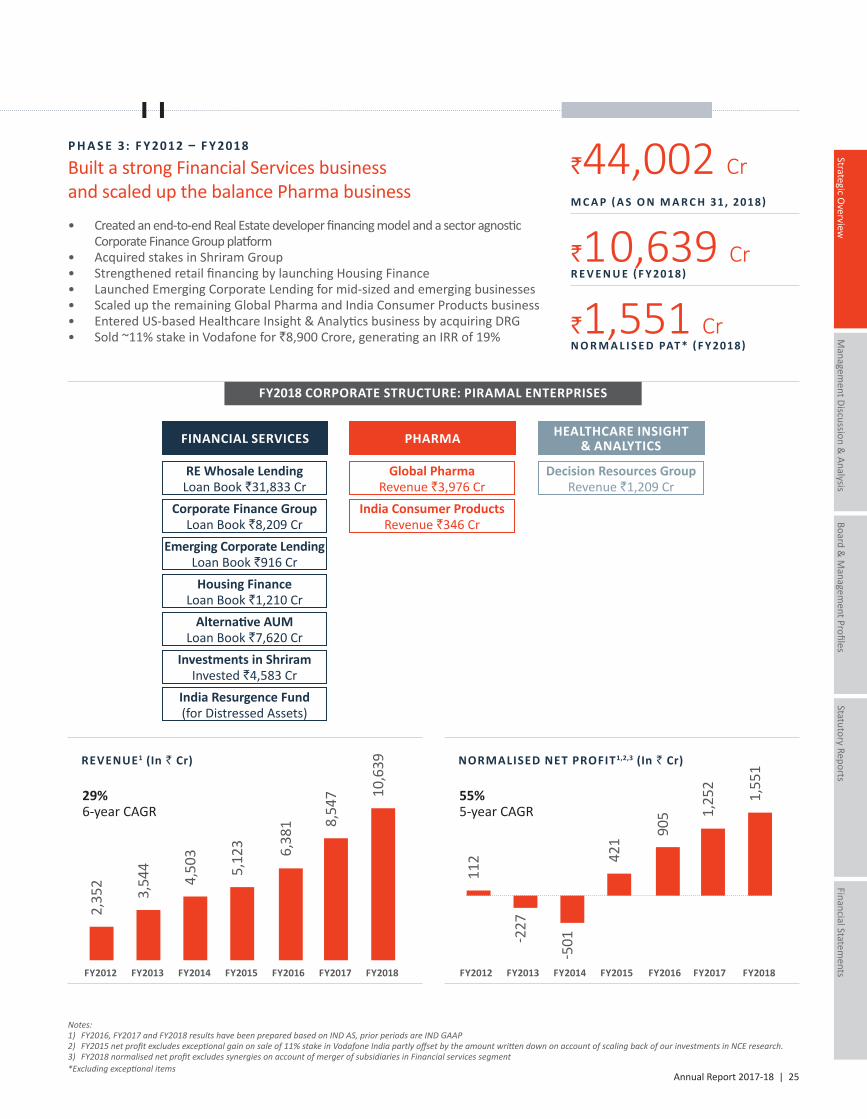
P H A S E 3: F Y 2012 – F Y 2018
Built a strong Financial Services businessand scaled up the balance Pharma business
• Created an end-to-end Real Estate developer financing model and a sector agnostic Corporate Finance Group platform
• Acquired stakes in Shriram Group • Strengthened retail financing by launching Housing Finance• Launched Emerging Corporate Lending for mid-sized and emerging businesses• Scaled up the remaining Global Pharma and India Consumer Products business• Entered US-based Healthcare Insight & Analytics business by acquiring DRG • Sold ~11% stake in Vodafone for `8,900 Crore, generating an IRR of 19%
`44,002 Cr M C A P ( A S O N M A R C H 31, 2018)
REVENUE1 (In ` Cr)
29%6-year CAGR
FY2012
2,35
2
FY2013
3,54
4
FY2014
4,50
3
5,12
3 6,38
1 8,54
7 10,6
39
FY2015 FY2016 FY2017 FY2018
NORMALISED NET PROFIT1,2,3 (In ` Cr)
55%5-year CAGR
FY2012
112
FY2013
-227
FY2014
-501
421
905 1,
252
1,55
1
FY2015 FY2016 FY2017 FY2018
`10,639 CrR E V E N U E ( F Y 2018)
`1,551 CrN O R M A L I S E D PAT * ( F Y 2018)
FY2018 CORPORATE STRUCTURE: PIRAMAL ENTERPRISES
PHARMA HEALTHCARE INSIGHT & ANALYTICSFINANCIAL SERVICES
Notes:1) FY2016,FY2017andFY2018resultshavebeenpreparedbasedonINDAS,priorperiodsareINDGAAP2) FY2015netprofitexcludesexceptionalgainonsaleof11%stakeinVodafoneIndiapartlyoffsetbytheamountwrittendownonaccountofscalingbackofourinvestmentsinNCEresearch.3) FY2018normalisednetprofitexcludessynergiesonaccountofmergerofsubsidiariesinFinancialservicessegment*Excludingexceptionalitems
RE Whosale LendingLoan Book `31,833 Cr
Corporate Finance GroupLoan Book `8,209 Cr
Emerging Corporate LendingLoan Book `916 CrHousing Finance
Loan Book `1,210 Cr Alternative AUM
Loan Book `7,620 CrInvestments in Shriram
Invested `4,583 CrIndia Resurgence Fund(for Distressed Assets)
Global PharmaRevenue `3,976 Cr
India Consumer ProductsRevenue `346 Cr
Decision Resources GroupRevenue `1,209 Cr
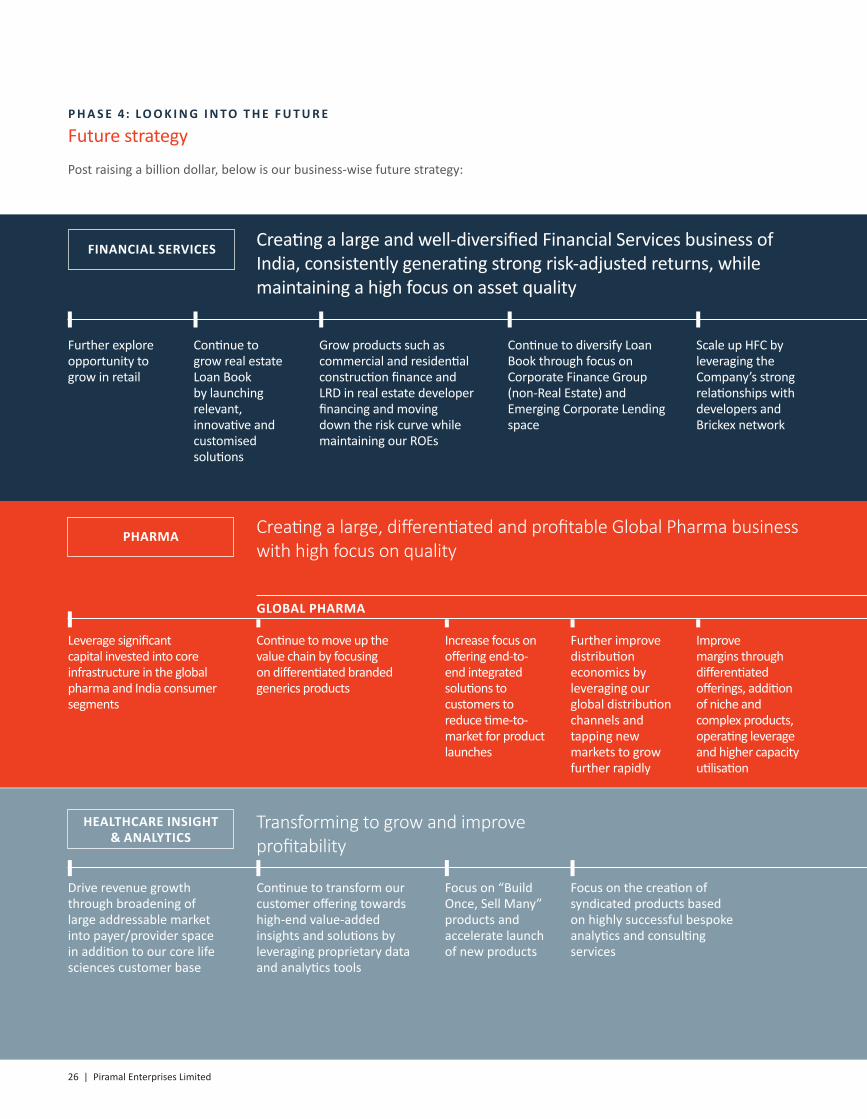
26 | Piramal Enterprises Limited
PHARMA
FINANCIAL SERVICES Creating a large and well-diversified Financial Services business of India, consistently generating strong risk-adjusted returns, while maintaining a high focus on asset quality
Creating a large, differentiated and profitable Global Pharma business with high focus on quality
Transforming to grow and improve profitability
GLOBAL PHARMA
Leverage significant capital invested into core infrastructure in the global pharma and India consumer segments
Increase focus on offering end-to-end integrated solutions to customers to reduce time-to-market for product launches
Drive revenue growth through broadening of large addressable market into payer/provider space in addition to our core life sciences customer base
Continue to move up the value chain by focusing on differentiated branded generics products
Further improve distribution economics by leveraging our global distribution channels and tapping new markets to grow further rapidly
Improve margins through differentiated offerings, addition of niche and complex products, operating leverage and higher capacity utilisation
Continue to transform our customer offering towards high-end value-added insights and solutions by leveraging proprietary data and analytics tools
Focus on “Build Once, Sell Many” products and accelerate launch of new products
Grow products such as commercial and residential construction finance and LRD in real estate developer financing and moving down the risk curve while maintaining our ROEs
Further explore opportunity to grow in retail
Focus on the creation of syndicated products based on highly successful bespoke analytics and consulting services
Scale up HFC by leveraging the Company’s strong relationships with developers and Brickex network
Continue to diversify Loan Book through focus on Corporate Finance Group (non-Real Estate) and Emerging Corporate Lending space
P H A S E 4: L O O K I N G I N TO T H E F U T U R E
Future strategy
Post raising a billion dollar, below is our business-wise future strategy:
Continue to grow real estate Loan Book by launching relevant, innovative and customised solutions
HEALTHCARE INSIGHT & ANALYTICS
Annual Report 2017-18 | 27
Managem
ent Discussion & Analysis
Strategic Overview
Board &
Managem
ent ProfilesStatutory Reports
Financial Statements
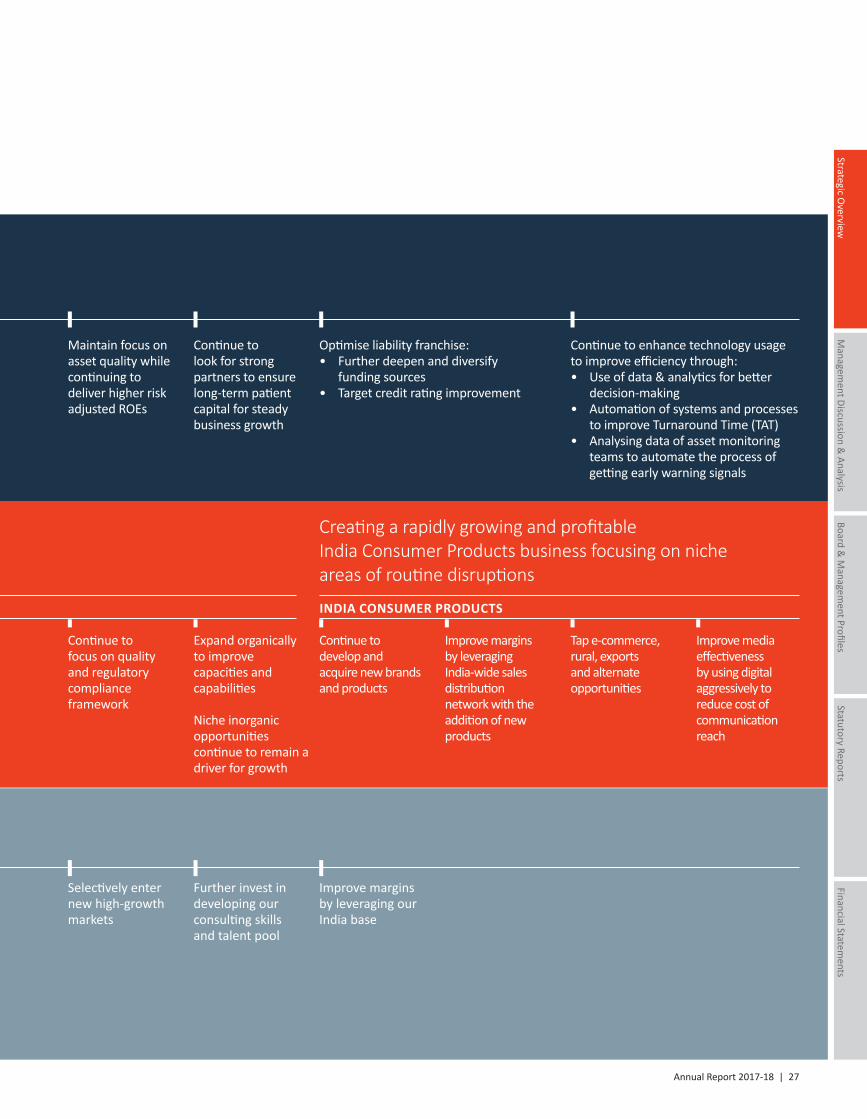
INDIA CONSUMER PRODUCTS
Continue to focus on quality and regulatory compliance framework
Expand organically to improve capacities and capabilities
Niche inorganic opportunities continue to remain a driver for growth
Continue to develop and acquire new brands and products
Improve margins by leveraging India-wide sales distribution network with the addition of new products
Tap e-commerce, rural, exports and alternate opportunities
Improve media effectiveness by using digital aggressively to reduce cost of communication reach
Selectively enter new high-growth markets
Further invest in developing our consulting skills and talent pool
Improve margins by leveraging our India base
Maintain focus on asset quality while continuing to deliver higher risk adjusted ROEs
Continue to look for strong partners to ensure long-term patient capital for steady business growth
Optimise liability franchise: • Further deepen and diversify
funding sources • Target credit rating improvement
Continue to enhance technology usage to improve efficiency through: • Use of data & analytics for better
decision-making • Automation of systems and processes
to improve Turnaround Time (TAT)• Analysing data of asset monitoring
teams to automate the process of getting early warning signals
Creating a rapidly growing and profitable India Consumer Products business focusing on niche areas of routine disruptions
28 | Piramal Enterprises Limited
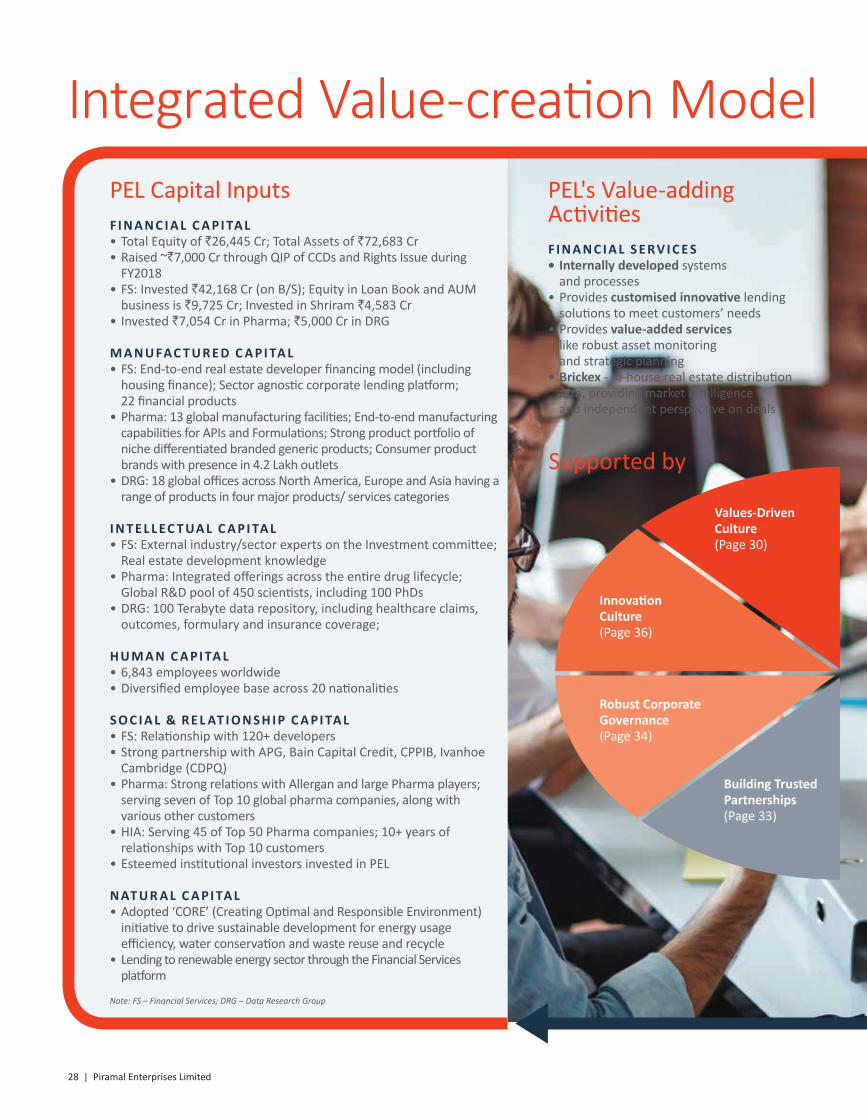
PEL Capital InputsF I N A N C I A L C A P I TA L• Total Equity of `26,445 Cr; Total Assets of `72,683 Cr• Raised ~`7,000 Cr through QIP of CCDs and Rights Issue during
FY2018• FS: Invested `42,168 Cr (on B/S); Equity in Loan Book and AUM
business is `9,725 Cr; Invested in Shriram `4,583 Cr• Invested `7,054 Cr in Pharma; `5,000 Cr in DRG
M A N U FAC T U R E D C A P I TA L• FS: End-to-end real estate developer financing model (including
housing finance); Sector agnostic corporate lending platform; 22 financial products
• Pharma: 13 global manufacturing facilities; End-to-end manufacturing capabilities for APIs and Formulations; Strong product portfolio of niche differentiated branded generic products; Consumer product brands with presence in 4.2 Lakh outlets
• DRG: 18 global offices across North America, Europe and Asia having a range of products in four major products/ services categories
I N T E L L EC T UA L C A P I TA L• FS: External industry/sector experts on the Investment committee;
Real estate development knowledge• Pharma: Integrated offerings across the entire drug lifecycle;
Global R&D pool of 450 scientists, including 100 PhDs• DRG: 100 Terabyte data repository, including healthcare claims,
outcomes, formulary and insurance coverage;
H U M A N C A P I TA L• 6,843 employees worldwide• Diversified employee base across 20 nationalities
S O C I A L & R E L AT I O N S H I P C A P I TA L• FS: Relationship with 120+ developers • Strong partnership with APG, Bain Capital Credit, CPPIB, Ivanhoe
Cambridge (CDPQ)• Pharma: Strong relations with Allergan and large Pharma players;
serving seven of Top 10 global pharma companies, along with various other customers
• HIA: Serving 45 of Top 50 Pharma companies; 10+ years of relationships with Top 10 customers
• Esteemed institutional investors invested in PEL
N AT U R A L C A P I TA L• Adopted ‘CORE’ (Creating Optimal and Responsible Environment)
initiative to drive sustainable development for energy usage efficiency, water conservation and waste reuse and recycle
• Lending to renewable energy sector through the Financial Services platform
Note:FS–FinancialServices;DRG–DataResearchGroup
PEL's Value-adding ActivitiesF I N A N C I A L S E R V I C E S• Internally developed systems
and processes• Provides customised innovative lending
solutions to meet customers’ needs• Provides value-added services
like robust asset monitoring and strategic planning
• Brickex - in-house real estate distribution arm, providing market intelligence and independent perspective on deals
Integrated Value-creation Model
Values-Driven Culture(Page 30)
Building Trusted Partnerships(Page 33)
Robust Corporate Governance(Page 34)
Innovation Culture(Page 36)
Supported by
Annual Report 2017-18 | 29
Managem
ent Discussion & Analysis
Strategic Overview
Board &
Managem
ent ProfilesStatutory Reports
Financial Statements
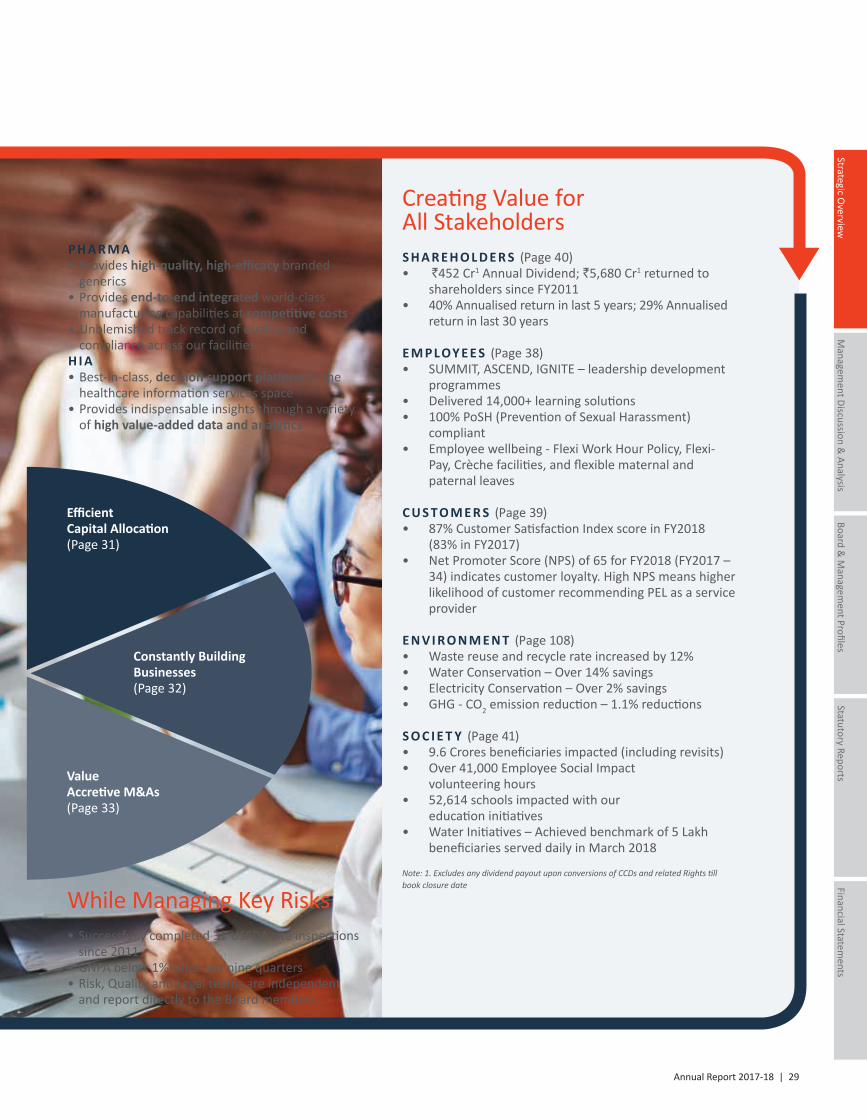
Creating Value for All StakeholdersS H A R E H O L D E R S (Page 40)• `452 Cr1 Annual Dividend; `5,680 Cr1 returned to
shareholders since FY2011• 40% Annualised return in last 5 years; 29% Annualised
return in last 30 years E M P L OY E E S (Page 38)• SUMMIT, ASCEND, IGNITE – leadership development
programmes• Delivered 14,000+ learning solutions• 100% PoSH (Prevention of Sexual Harassment)
compliant• Employee wellbeing - Flexi Work Hour Policy, Flexi-
Pay, Crèche facilities, and flexible maternal and paternal leaves
C U S T O M E R S (Page 39)• 87% Customer Satisfaction Index score in FY2018
(83% in FY2017)• Net Promoter Score (NPS) of 65 for FY2018 (FY2017 –
34) indicates customer loyalty. High NPS means higher likelihood of customer recommending PEL as a service provider
E N V I R O N M E N T (Page 108)• Waste reuse and recycle rate increased by 12% • Water Conservation – Over 14% savings • Electricity Conservation – Over 2% savings • GHG - CO2 emission reduction – 1.1% reductions S O C I E T Y (Page 41)• 9.6 Crores beneficiaries impacted (including revisits) • Over 41,000 Employee Social Impact
volunteering hours • 52,614 schools impacted with our
education initiatives • Water Initiatives – Achieved benchmark of 5 Lakh
beneficiaries served daily in March 2018
Note:1.ExcludesanydividendpayoutuponconversionsofCCDsandrelatedRightstillbookclosuredate
While Managing Key Risks• Successfully completed 31 USFDA site inspections
since 2011• GNPA below 1% since last nine quarters• Risk, Quality and Legal teams are independent
and report directly to the Board members
P H A R M A• Provides high-quality, high-efficacy branded
generics• Provides end-to-end integrated world-class
manufacturing capabilities at competitive costs• Unblemished track record of quality and
compliance across our facilitiesH I A• Best-in-class, decision support platform in the
healthcare information services space• Provides indispensable insights through a variety
of high value-added data and analytics
EfficientCapital Allocation(Page 31)
Constantly Building Businesses(Page 32)
ValueAccretive M&As(Page 33)
30 | Piramal Enterprises Limited
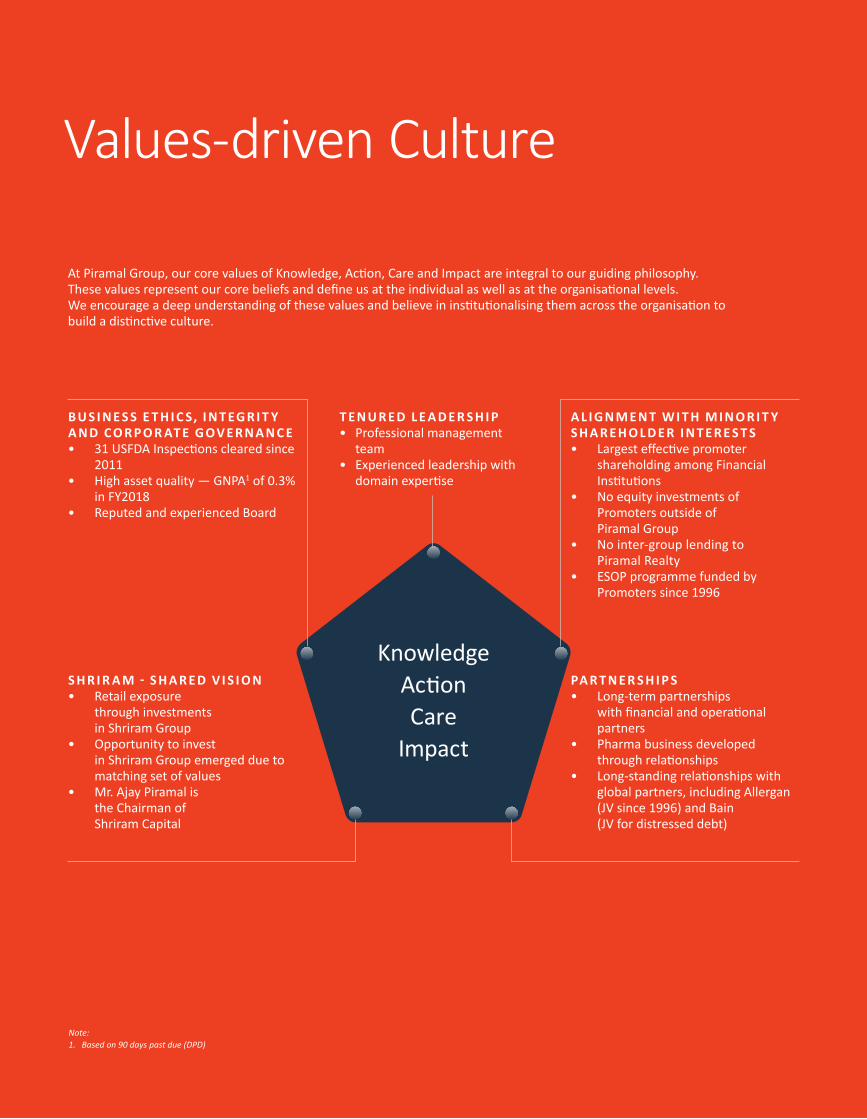
Values-driven Culture
At Piramal Group, our core values of Knowledge, Action, Care and Impact are integral to our guiding philosophy.These values represent our core beliefs and define us at the individual as well as at the organisational levels.We encourage a deep understanding of these values and believe in institutionalising them across the organisation to build a distinctive culture.
A L I G N M E N T W I T H M I N O R I T Y S H A R E H O L D E R I N T E R E S T S• Largest effective promoter
shareholding among Financial Institutions
• No equity investments of Promoters outside of Piramal Group
• No inter-group lending to Piramal Realty
• ESOP programme funded by Promoters since 1996
S H R I R A M - S H A R E D V I S I O N• Retail exposure
through investments in Shriram Group
• Opportunity to invest in Shriram Group emerged due to matching set of values
• Mr. Ajay Piramal is the Chairman of Shriram Capital
B U S I N E S S E T H I C S, I N T EG R I T Y A N D C O R P O R AT E G OV E R N A N C E• 31 USFDA Inspections cleared since
2011• High asset quality — GNPA1 of 0.3%
in FY2018• Reputed and experienced Board
T E N U R E D L E A D E R S H I P• Professional management
team• Experienced leadership with
domain expertise
Note: 1. Basedon90dayspastdue(DPD)
KnowledgeActionCare
Impact
PA R T N E R S H I P S• Long-term partnerships
with financial and operational partners
• Pharma business developed through relationships
• Long-standing relationships with global partners, including Allergan (JV since 1996) and Bain (JV for distressed debt)
Annual Report 2017-18 | 31
Managem
ent Discussion & Analysis
Strategic Overview
Board &
Managem
ent ProfilesStatutory Reports
Financial Statements
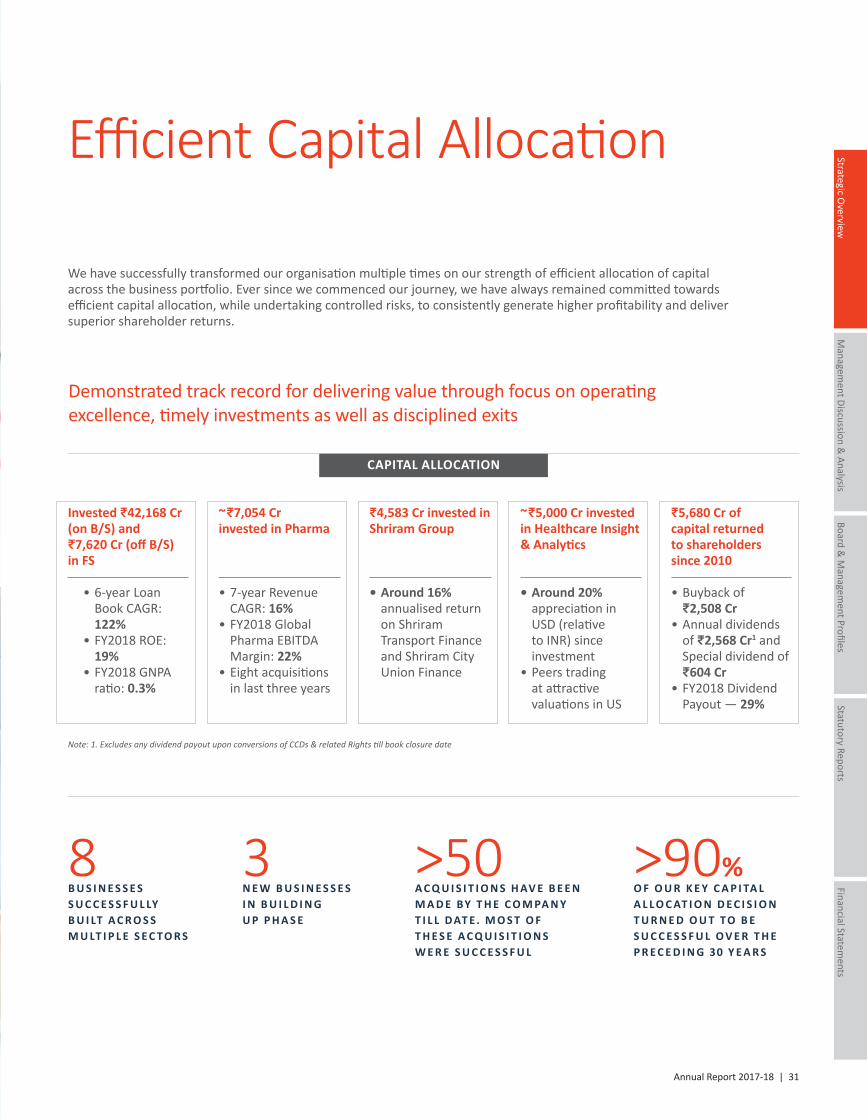
We have successfully transformed our organisation multiple times on our strength of efficient allocation of capital across the business portfolio. Ever since we commenced our journey, we have always remained committed towards efficient capital allocation, while undertaking controlled risks, to consistently generate higher profitability and deliver superior shareholder returns.
Note:1.ExcludesanydividendpayoutuponconversionsofCCDs&relatedRightstillbookclosuredate
8B U S I N E S S E S S U C C E S S F U L LYB U I LT A C R O S SM U LT I P L E S E C TO R S
3N E W B U S I N E S S E SI N B U I L D I N GU P P H A S E
>50A C Q U I S I T I O N S H AV E B E E N M A D E BY T H E C O M PA N Y T I L L D AT E . M O S T O F T H E S E A C Q U I S I T I O N S W E R E S U C C E S S F U L
>90%O F O U R K E Y C A P I TA L A L L O C AT I O N D E C I S I O N T U R N E D O U T TO B E S U C C E S S F U L O V E R T H E P R E C E D I N G 30 Y E A R S
Invested K42,168 Cr (on B/S) and K7,620 Cr (off B/S) in FS
• 6-year Loan Book CAGR: 122%
• FY2018 ROE: 19%
• FY2018 GNPA ratio: 0.3%
~K7,054 Crinvested in Pharma
• 7-year Revenue CAGR: 16%
• FY2018 Global Pharma EBITDA Margin: 22%
• Eight acquisitions in last three years
K4,583 Cr invested in Shriram Group
• Around 16% annualised return on Shriram Transport Finance and Shriram City Union Finance
~K5,000 Cr invested in Healthcare Insight & Analytics
• Around 20% appreciation in USD (relative to INR) since investment
• Peers trading at attractive valuations in US
K5,680 Cr ofcapital returnedto shareholders since 2010
• Buyback of K2,508 Cr
• Annual dividends of K2,568 Cr1 and Special dividend of K604 Cr
• FY2018 Dividend Payout — 29%
Demonstrated track record for delivering value through focus on operating excellence, timely investments as well as disciplined exits
CAPITAL ALLOCATION
Efficient Capital Allocation
32 | Piramal Enterprises Limited
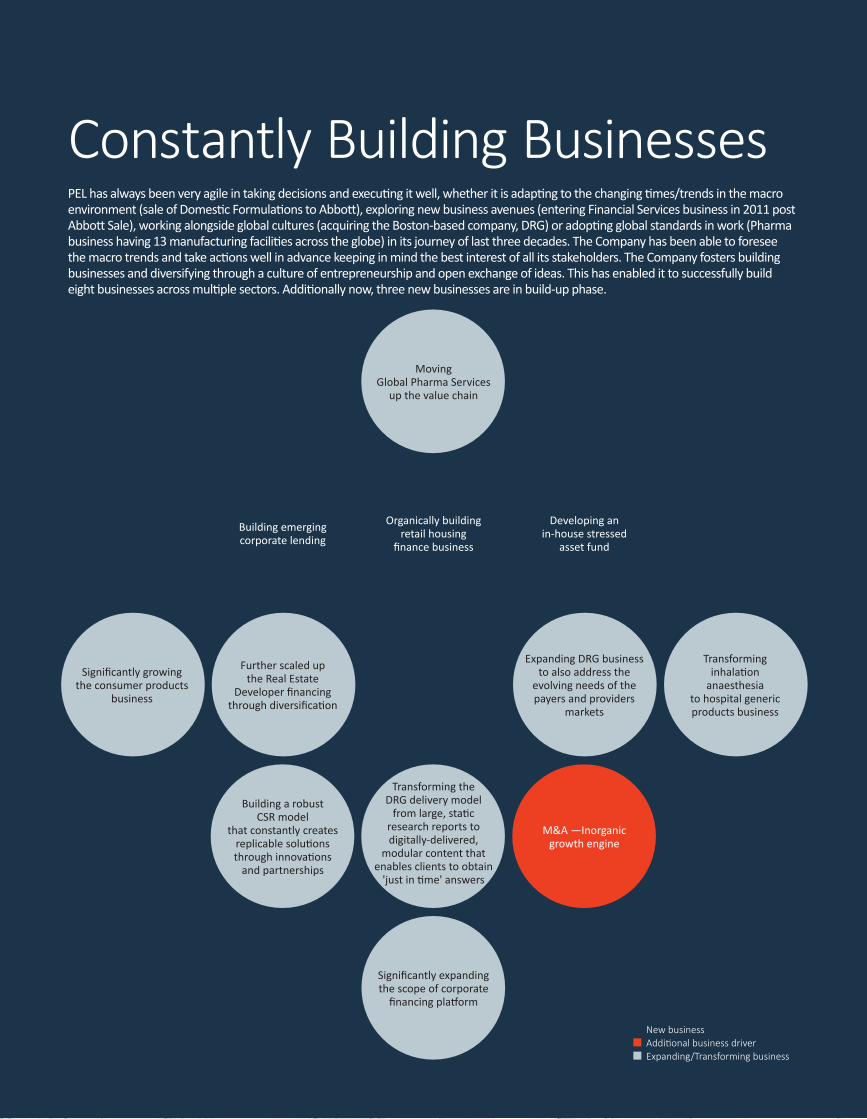
PEL has always been very agile in taking decisions and executing it well, whether it is adapting to the changing times/trends in the macro environment (sale of Domestic Formulations to Abbott), exploring new business avenues (entering Financial Services business in 2011 post Abbott Sale), working alongside global cultures (acquiring the Boston-based company, DRG) or adopting global standards in work (Pharma business having 13 manufacturing facilities across the globe) in its journey of last three decades. The Company has been able to foresee the macro trends and take actions well in advance keeping in mind the best interest of all its stakeholders. The Company fosters building businesses and diversifying through a culture of entrepreneurship and open exchange of ideas. This has enabled it to successfully build eight businesses across multiple sectors. Additionally now, three new businesses are in build-up phase.
Moving Global Pharma Services
up the value chain
Organically building retail housing
finance business
Expanding DRG business to also address the
evolving needs of the payers and providers
markets
M&A —Inorganic growth engine
Building emerging corporate lending
Further scaled up the Real Estate
Developer financing through diversification
Transforming the DRG delivery model
from large, static research reports to digitally-delivered,
modular content that enables clients to obtain
'just in time' answers
Significantly growing the consumer products
business
Developing anin-house stressed
asset fund
Transforming inhalation
anaesthesia to hospital generic products business
Significantly expanding the scope of corporate
financing platform
Building a robust CSR model
that constantly creates replicable solutions through innovations
and partnerships
Constantly Building Businesses
New business Additional business driver Expanding/Transforming business
Annual Report 2017-18 | 33
Managem
ent Discussion & Analysis
Strategic Overview
Board &
Managem
ent ProfilesStatutory Reports
Financial Statements
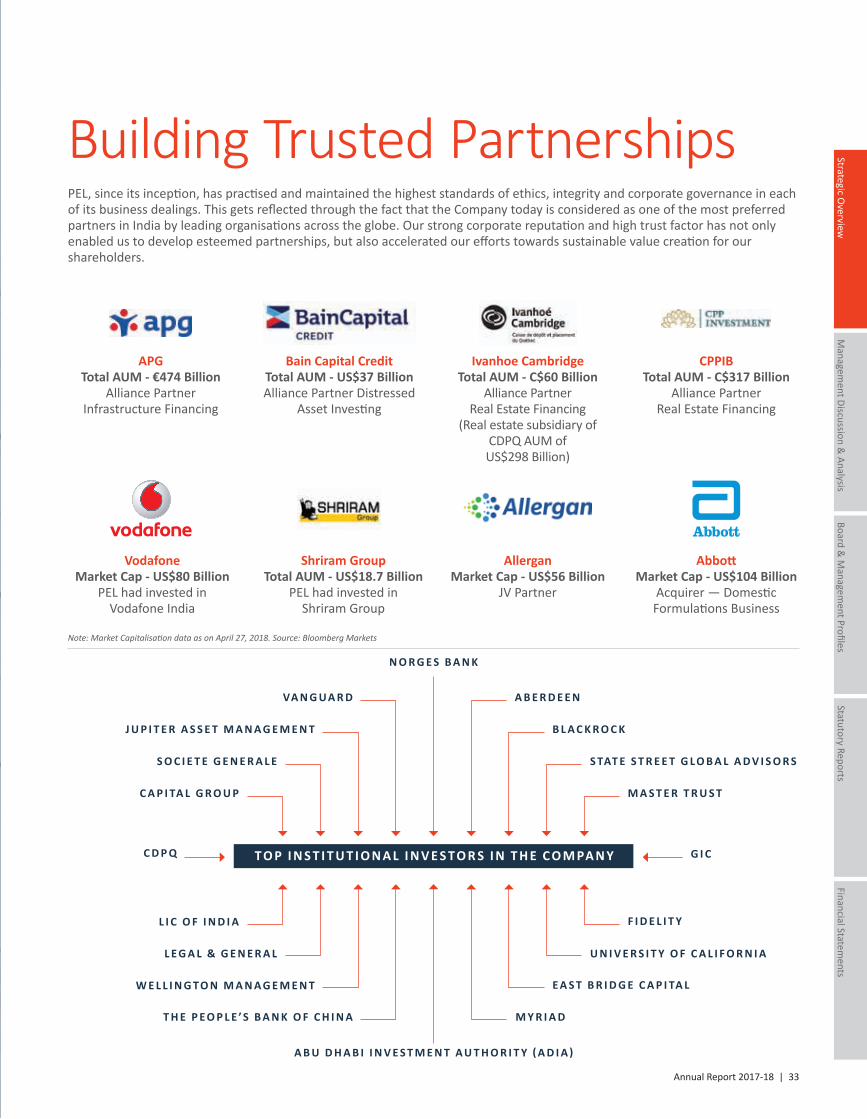
Note:MarketCapitalisationdataasonApril27,2018.Source:BloombergMarkets
T O P I N S T I T U T I O N A L I N V E S T O R S I N T H E C O M PA N Y
A B E R D E E N
N O R G E S B A N K
A B U D H A B I I N V E S T M E N T A U T H O R I T Y ( A D I A )
VA N G UA R D
T H E P E O P L E ’ S B A N K O F C H I N A M Y R I A D
B L A C K R O C KJ U P I T E R A S S E T M A N A G E M E N T
W E L L I N G TO N M A N A G E M E N T E A S T B R I D G E C A P I TA L
S TAT E S T R E E T G L O B A L A D V I S O R SS O C I E T E G E N E R A L E
L E G A L & G E N E R A L U N I V E R S I T Y O F C A L I F O R N I A
M A S T E R T R U S TC A P I TA L G R O U P
L I C O F I N D I A F I D E L I T Y
G I CC D P Q
PEL, since its inception, has practised and maintained the highest standards of ethics, integrity and corporate governance in each of its business dealings. This gets reflected through the fact that the Company today is considered as one of the most preferred partners in India by leading organisations across the globe. Our strong corporate reputation and high trust factor has not only enabled us to develop esteemed partnerships, but also accelerated our efforts towards sustainable value creation for our shareholders.
VodafoneMarket Cap - US$80 Billion
PEL had invested in Vodafone India
AbbottMarket Cap - US$104 Billion
Acquirer — Domestic Formulations Business
AllerganMarket Cap - US$56 Billion
JV Partner
Shriram GroupTotal AUM - US$18.7 Billion
PEL had invested in Shriram Group
APGTotal AUM - €474 Billion
Alliance Partner Infrastructure Financing
Bain Capital CreditTotal AUM - US$37 BillionAlliance Partner Distressed
Asset Investing
CPPIBTotal AUM - C$317 Billion
Alliance Partner Real Estate Financing
Ivanhoe CambridgeTotal AUM - C$60 Billion
Alliance Partner Real Estate Financing
(Real estate subsidiary of CDPQ AUM of US$298 Billion)
Building Trusted Partnerships

34 | Piramal Enterprises Limited
Board of Directors
Independent Director
34 | Piramal Enterprises Limited
Sitting
A J AY P I R A M A LChairmanChairman, Shriram Capital LimitedNon-Executive Director of Tata Sons LimitedCo-Chair, India-UK CEO Forum
Board and Governance
Bottom row (Left to right) G A U TA M B A N E R J E E
Senior MD, Blackstone Group Chairman, Blackstone Singapore
N A N D I N I P I R A M A LExecutive DirectorLeads CPD, HR, Risk & Quality MBA, Stanford
V I J AY S H A HExecutive DirectorTurnaround Businesses 25+ years with Group
A N A N D P I R A M A LNon-Executive DirectorHeads Piramal RealtyMBA, Harvard
D R S WAT I P I R A M A LVice ChairpersonEminent Scientist
N VA G H U L Former Chairman, ICICI Bank Limited
Upper row (Left to right) S R A M A D O R A I
Former Vice Chairman, Tata Consultancy Services
S I D D H A R T H (B O B B Y) M E H TA Former President & CEO, Transunion
D R R M A S H E L K A R Eminent Scientist Former DG, CSIR
P R O F G O V E R D H A N M E H TA Eminent Scientist Former Director, IISc
D E E PA K M S AT WA L E K A R Former MD & CEO, HDFC Standard Life
K E K I D A D I S E T H Former Chairman, Hindustan Unilever Limited
Annual Report 2017-18 | 35
Managem
ent Discussion & Analysis
Strategic Overview
Board &
Managem
ent ProfilesStatutory Reports
Financial Statements
Management Team
Governance and Review Mechanism
M A N AG E M E N T A DV I S O R S
Nitin NohriaDean, Harvard Business SchoolExperience: 25+ years as Harvard faculty
Shikhar GhoshProfessor, Harvard Business SchoolExperience:35+ years
Khushru JijinaMD,Piramal Capital &Housing FinanceExperience:30+ years,17+ years with Piramal Group
Rallis (Tata Group) CA
Shantanu NalavadiMD, Distressed Asset FundExperience:27 years,2 years with Piramal Group
New Silk Route Advisors CA
Peter DeYoungCEO,Piramal Critical CareExperience: 15 years,5 years with Piramal Group
Blackstone, McKinsey & Company BSc Engg - Princeton; MBA - Stanford
Ph.D in Management - Sloan School, MIT, IITB
MBA - HBS
Prior Affiliation Qualification
Annual Report 2017-18 | 35
B OA R D O F D I R EC T O R S
B OA R D S U B- C O M M I T T E E
F I N A N C I A L S E R V I C E SFive Investment Committees for Real Estate Lending, RE Fund Management, Corporate Finance Transactions, Emerging Corporate
Lending and Housing Finance
P H A R M A
Pharma Operations Board
HEALTHCARE INSIGHT & ANALYTICS
Healthcare Insight &Analytics Board
• Executive Directors• Independent Directors• Financial Services CEO• External Experts• Business Vertical Heads
• Executive Directors• Key Business CEOs• External Experts
• Independent Directors• Business CEO• External Experts
Vivek SharmaCEO,Piramal Pharma SolutionsExperience:25+ years,7 years with Piramal Group
THL Partner, Motorola, AMD CA, CPA, MBA
Vivek ValsarajCFO,Piramal Enterprises LimitedExperience:28+ years,17+ years with Piramal Group
Wockhardt Ltd, Bharat Bijlee Ltd.
CMA
Jon SandlerCEO, DRGExperience:31+ years,6+ years with Piramal Group
Kesseler Group, MAC Group BA, MBA - HBS
Kedar RajadnyeCOO,India Consumer ProductsExperience:20+ years,14+ years with Piramal Group
Hindustan Unilever HBS, JBIMS
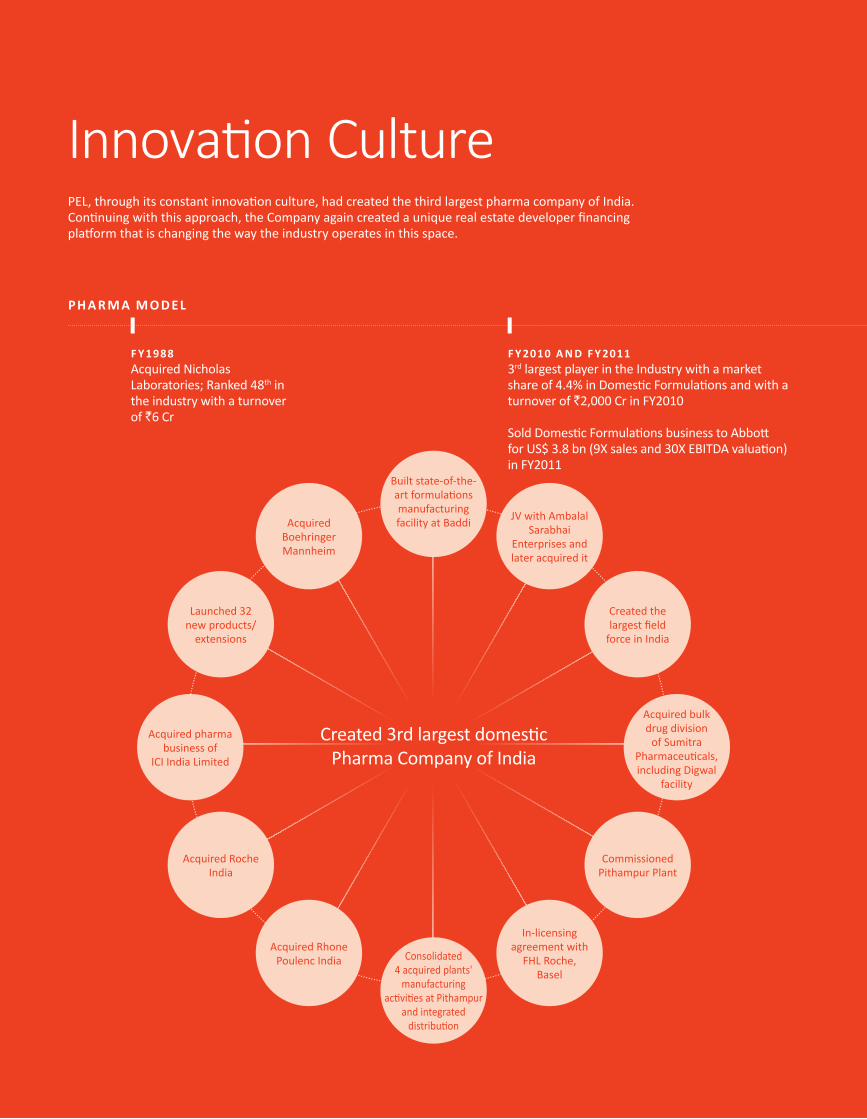
36 | Piramal Enterprises Limited
PEL, through its constant innovation culture, had created the third largest pharma company of India. Continuing with this approach, the Company again created a unique real estate developer financing platform that is changing the way the industry operates in this space.
P H A R M A M O D E L
F Y 2010 A N D F Y 20113rd largest player in the Industry with a market share of 4.4% in Domestic Formulations and with a turnover of `2,000 Cr in FY2010
Sold Domestic Formulations business to Abbott for US$ 3.8 bn (9X sales and 30X EBITDA valuation) in FY2011
F Y 1988Acquired Nicholas Laboratories; Ranked 48th in the industry with a turnover of `6 Cr
Innovation Culture
Created 3rd largest domestic Pharma Company of India
JV with Ambalal Sarabhai
Enterprises and later acquired it
Created the largest field
force in India
Acquired Rhone Poulenc India
Acquired Roche India
Consolidated4 acquired plants'
manufacturing activities at Pithampur
and integrated distribution
Commissioned Pithampur Plant
In-licensing agreement with
FHL Roche, Basel
Built state-of-the-art formulations manufacturing facility at Baddi
Launched 32 new products/
extensions
Acquired Boehringer Mannheim
Acquired pharma business of
ICI India Limited
Acquired bulkdrug division
of Sumitra Pharmaceuticals, including Digwal
facility
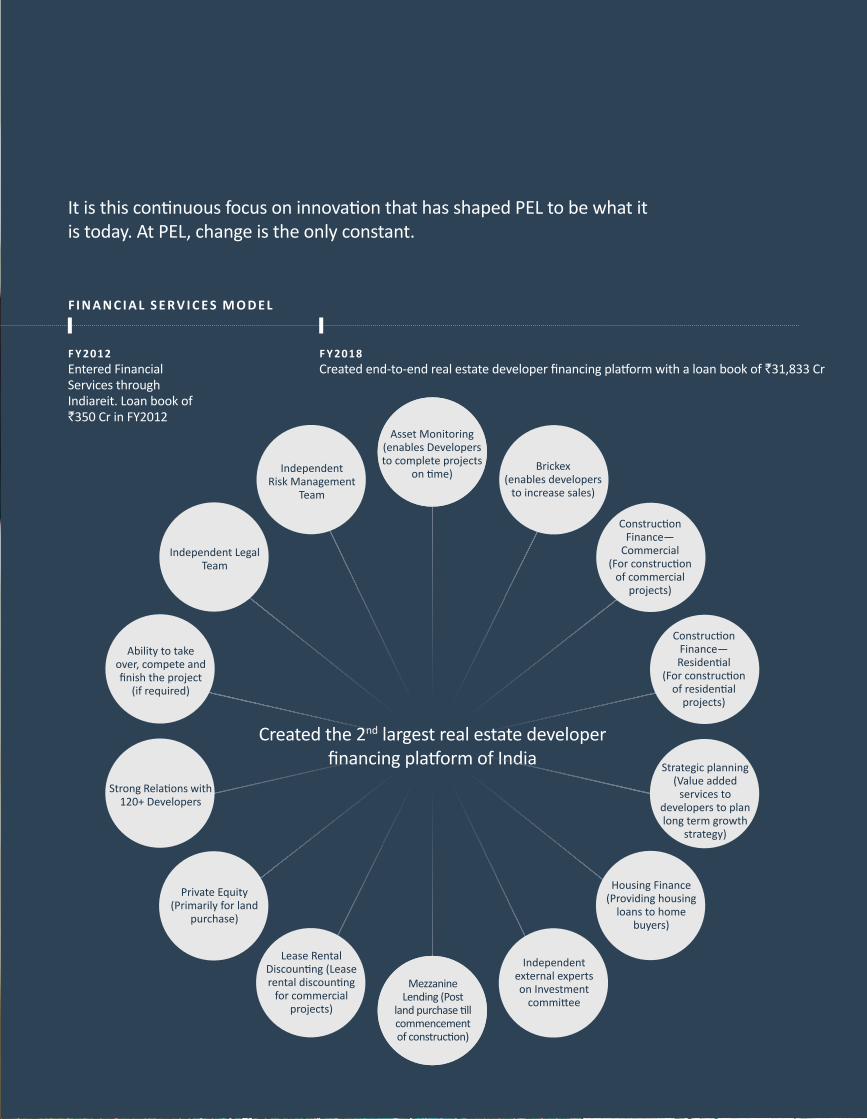
Annual Report 2017-18 | 37
F I N A N C I A L S E R V I C E S M O D E L
It is this continuous focus on innovation that has shaped PEL to be what it is today. At PEL, change is the only constant.
Created the 2nd largest real estate developer financing platform of India
F Y 2018Created end-to-end real estate developer financing platform with a loan book of `31,833 Cr
F Y 2012Entered Financial Services through Indiareit. Loan book of `350 Cr in FY2012
Asset Monitoring(enables Developers to complete projects
on time)Brickex
(enables developers to increase sales)
Construction Finance—
Commercial(For construction
of commercial projects)
Construction Finance— Residential
(For constructionof residential
projects)
Strategic planning (Value added
services to developers to plan long term growth
strategy)
Housing Finance (Providing housing
loans to home buyers)
Independent external experts on Investment
committee
MezzanineLending (Post
land purchase till commencementof construction)
Lease Rental Discounting (Lease rental discounting
for commercial projects)
Private Equity (Primarily for land
purchase)
Strong Relations with 120+ Developers
Ability to take over, compete and finish the project
(if required)
Independent Legal Team
IndependentRisk Management
Team

38 | Piramal Enterprises Limited
Focus on ‘growing our own leaders’, enabling the employees to realise their full potential through world-class leadership development programmes, such as ASCEND, SUMMIT and IGNITE for various levels. Programmes
are conducted in partnership with global experts (McKinsey and Aon Hewitt) to strengthen our leadership pipeline by identifying high-potential employees and providing them differentiated development opportunities, including cross-functional and cross-business projects.
The Piramal Learning University continuesto nurture a world-class integrated learningecosystem at PEL by exponentially increasing its scale and reach with a state-of-the-art
learning facility at Mumbai. The academy drives functional and behavioral excellence, customised learning journeys for every learner and a robust technology-enabled virtual campus.
Young talent initiatives like Launchpad, Future Leaders Program and Business Management Trainee programmes enable the creation of a high quality leadership pipeline for key functional and strategic roles in the organisation. It also provides an opportunity for
the employees to better understand their work environment and culture to progress well in their career path in the Company.
In FY2018, performance management and goal setting became completely an online process on ‘My Piramal’, PEL’s HR Management System. The new system enables vertical and horizontal alignment of goals, enabling a seamless goal
cascading process. It provides employees an option of eliciting online stakeholder feedback to have a holistic performance evaluation process and work towards further improvingtheir performance.
PEL’s focus is on becoming an ‘Employer of Choice’ through consistent efforts to nurture the spirit of entrepreneurship and overall employee wellbeing through policies such as Flexi Work Hour Policy, Flexi-Pay, Crèche facilities,
and flexible maternal and paternal leaves. In alignment with our core Value of ‘Knowledge’, the one of its kind MOOC policy (Massive Open Online Courses) enables employees to avail online learning solutions for their professional development from renowned academic institutions.
PEL strongly believes that sustained business can be delivered only if our employee base is as diverse as our customer base. Diversity can be based on ethnicity, gender, country and thinking styles, among others. It’s also been a
constant endeavour to create a safe and inclusive work culture, beginning this journey by becoming 100% PoSH (Prevention of Sexual Harassment) compliant. Our ‘Zero tolerance policy’ towards sexual harassment has led us to have a robust redressal mechanism with 14 Internal Complaints Committee panels and an Apex committee in India.
Delivering to Our Employees
“The HR function today is playing a far more proactive, forward-looking role in driving our ambitious growth plans. Our investments in building our employer brand are beginning to reap rich returns as we enhance our connect with millennials on premium graduate and postgraduate campuses. We are also supporting business growth through agile, on-demand hiring and robust on-boarding practices. We continue to invest in developing our top talent through our signature leadership development experiences such as IGNITE, ASCEND and SUMMIT. We now have technology-enabled goals and performance management processes through MyPiramal, thus bringing in strong alignment to our organisational goals. The Piramal Learning University also continues to deliver measurable impact through focused capability-building via its Leadership and Functional Academies, as well as its Virtual Campus.”
N A N D I N I P I R A M A L Executive Director, PEL
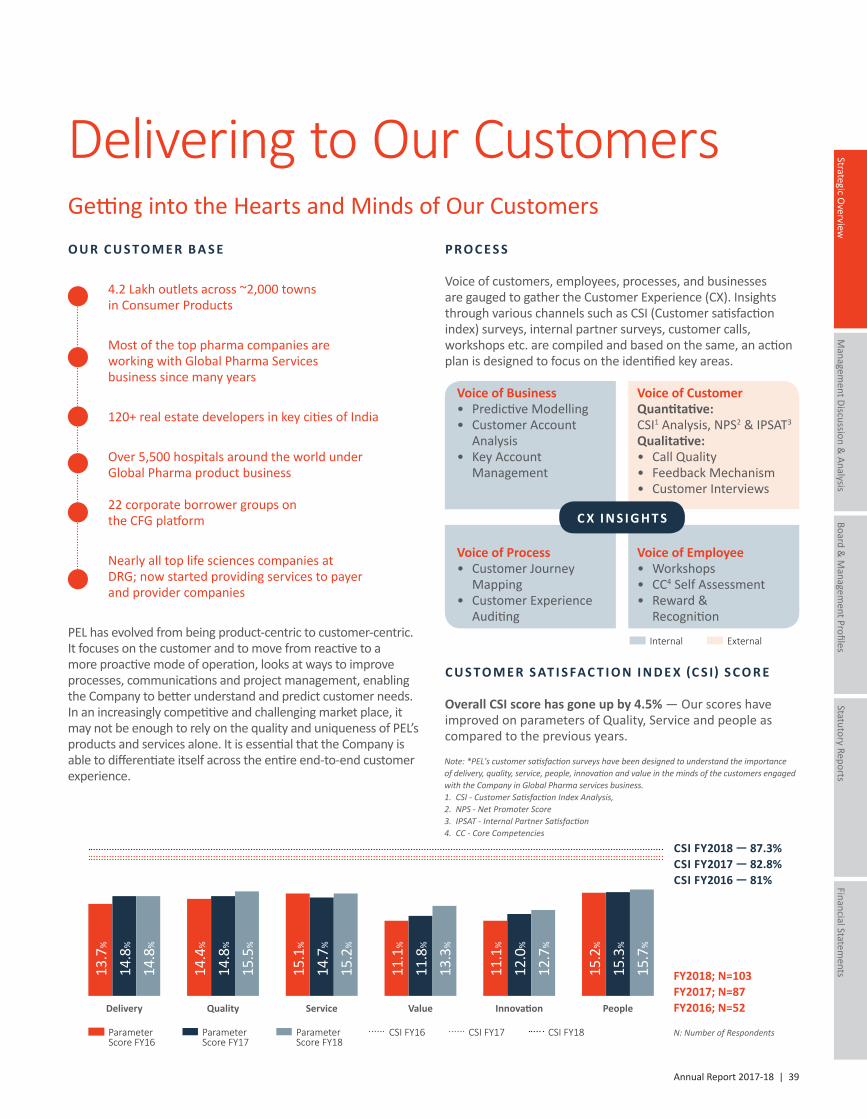
Annual Report 2017-18 | 39
Managem
ent Discussion & Analysis
Strategic Overview
Board &
Managem
ent ProfilesStatutory Reports
Financial Statements
Delivering to Our CustomersGetting into the Hearts and Minds of Our CustomersO U R C U S T O M E R B A S E
PEL has evolved from being product-centric to customer-centric. It focuses on the customer and to move from reactive to a more proactive mode of operation, looks at ways to improve processes, communications and project management, enabling the Company to better understand and predict customer needs. In an increasingly competitive and challenging market place, it may not be enough to rely on the quality and uniqueness of PEL’s products and services alone. It is essential that the Company is able to differentiate itself across the entire end-to-end customer experience.
C U S T O M E R S AT I S FAC T I O N I N D E X (C S I) S C O R E Overall CSI score has gone up by 4.5% — Our scores have improved on parameters of Quality, Service and people as compared to the previous years.
Note:*PEL'scustomersatisfactionsurveyshavebeendesignedtounderstandtheimportanceofdelivery,quality,service,people,innovationandvalueinthemindsofthecustomersengagedwiththeCompanyinGlobalPharmaservicesbusiness.1. CSI-CustomerSatisfactionIndexAnalysis,2. NPS-NetPromoterScore 3. IPSAT-InternalPartnerSatisfaction4. CC-CoreCompetencies
4.2 Lakh outlets across ~2,000 townsin Consumer Products
Most of the top pharma companies areworking with Global Pharma Servicesbusiness since many years
120+ real estate developers in key cities of India
Over 5,500 hospitals around the world under Global Pharma product business
22 corporate borrower groups onthe CFG platform
Nearly all top life sciences companies atDRG; now started providing services to payer and provider companies
P R O C E S S
Voice of customers, employees, processes, and businesses are gauged to gather the Customer Experience (CX). Insights through various channels such as CSI (Customer satisfaction index) surveys, internal partner surveys, customer calls, workshops etc. are compiled and based on the same, an action plan is designed to focus on the identified key areas.
Voice of CustomerQuantitative:CSI1 Analysis, NPS2 & IPSAT3
Qualitative:• Call Quality• Feedback Mechanism• Customer Interviews
Voice of Business• Predictive Modelling• Customer Account
Analysis• Key Account
Management
Voice of Employee• Workshops• CC4 Self Assessment• Reward &
Recognition
Voice of Process • Customer Journey
Mapping• Customer Experience
Auditing
C X I N S I G H T S
Internal External
FY2018; N=103FY2017; N=87FY2016; N=52
CSI FY2018 — 87.3%CSI FY2017 — 82.8%CSI FY2016 — 81%
Delivery Quality Service Value Innovation People
13.7
%
14.4
%
15.1
%
11.1
%
11.1
%
15.2
%
14.8
%
14.8
%
14.7
%
11.8
%
12.0
%
15.3
%
14.8
%
15.5
%
15.2
%
13.3
%
12.7
%
15.7
%
Parameter Score FY16
Parameter Score FY17
CSI FY16 CSI FY17 CSI FY18Parameter Score FY18
N:NumberofRespondents
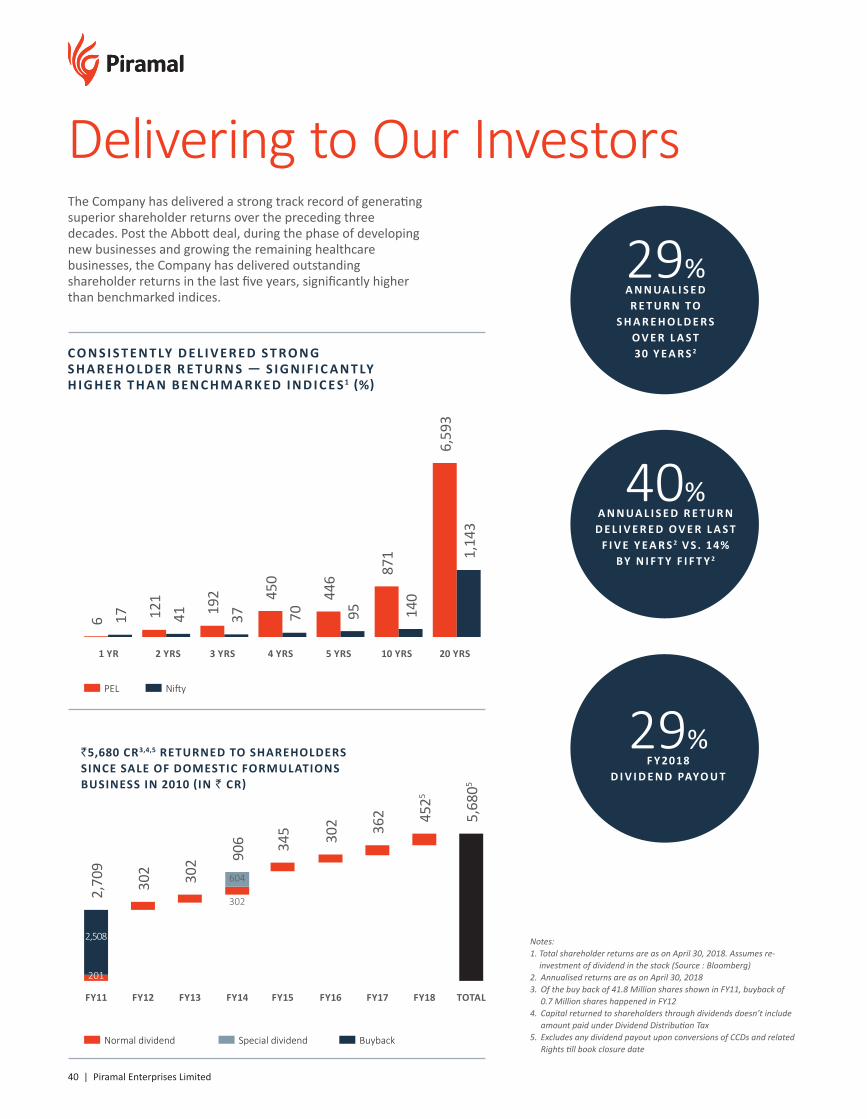
40 | Piramal Enterprises Limited
Delivering to Our InvestorsThe Company has delivered a strong track record of generating superior shareholder returns over the preceding three decades. Post the Abbott deal, during the phase of developing new businesses and growing the remaining healthcare businesses, the Company has delivered outstanding shareholder returns in the last five years, significantly higher than benchmarked indices.
C O N S I S T E N T LY D E L I V E R E D S T R O N G S H A R E H O L D E R R E T U R N S — S I G N I F I C A N T LY H I G H E R T H A N B E N C H M A R K E D I N D I C E S1 (%)
Notes: 1.TotalshareholderreturnsareasonApril30,2018.Assumesre-
investmentofdividendinthestock(Source:Bloomberg)2. AnnualisedreturnsareasonApril30,20183. Ofthebuybackof41.8MillionsharesshowninFY11,buybackof
0.7MillionshareshappenedinFY124. Capitalreturnedtoshareholdersthroughdividendsdoesn’tinclude
amountpaidunderDividendDistributionTax5. ExcludesanydividendpayoutuponconversionsofCCDsandrelated
Rightstillbookclosuredate
1 YR
6 17
2 YRS
121
41
3 YRS
192
37
4 YRS
450
70
5 YRS
446
95
10 YRS
871
140
20 YRS
6,59
31,
143
PEL Nifty
`5,680 CR3,4,5 RETURNED TO SHAREHOLDERS SINCE SALE OF DOMESTIC FORMULATIONS BUSINESS IN 2010 (IN ` CR)
Normal dividend Special dividend Buyback
TOTAL
5,68
05
FY12
302
FY13
302
FY16
302
FY15
345
FY17
362
FY18
4525
FY14
906
604
302
FY11
2,70
9
201
2,508
29%A N N UA L I S E D R E T U R N TO
S H A R E H O L D E R S O V E R L A S T30 Y E A R S 2
29%F Y 2018
D I V I D E N D PAYO U T
40%A N N UA L I S E D R E T U R N
D E L I V E R E D O V E R L A S T F I V E Y E A R S 2 V S . 14%
BY N I F T Y F I F T Y 2
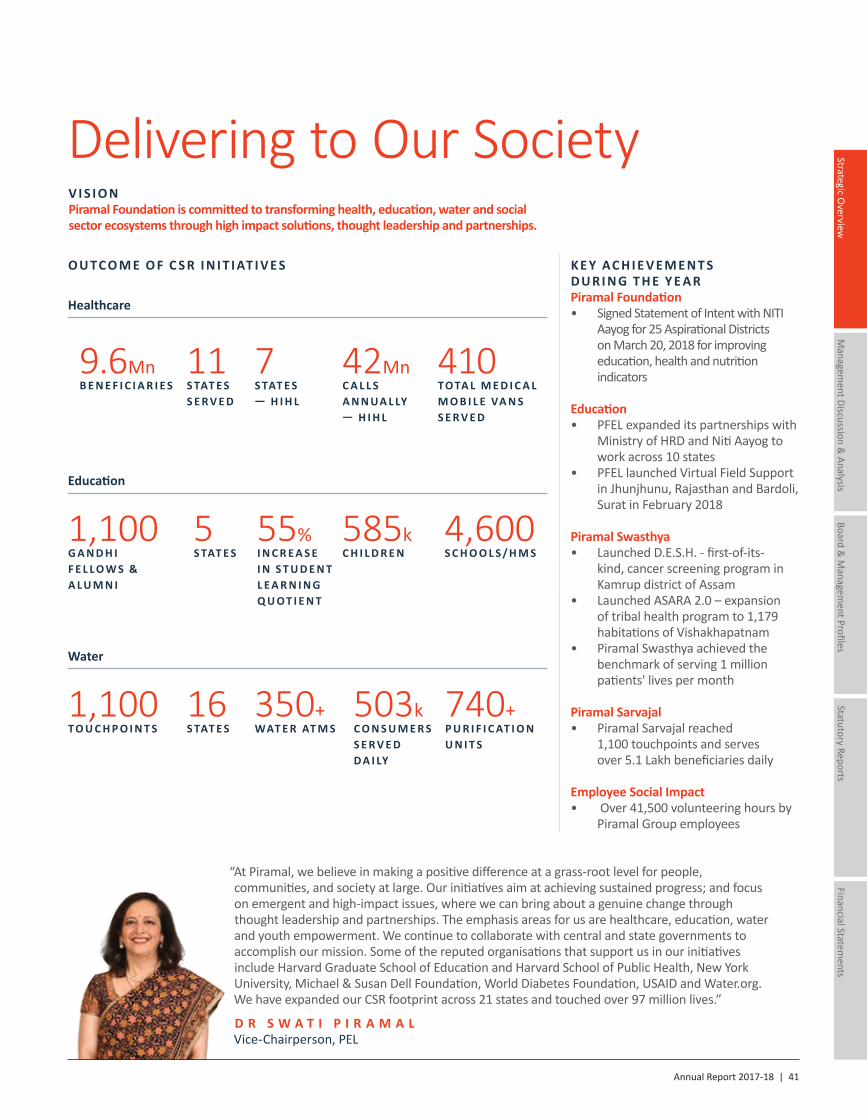
Annual Report 2017-18 | 41
Managem
ent Discussion & Analysis
Strategic Overview
Board &
Managem
ent ProfilesStatutory Reports
Financial Statements
Delivering to Our Society V I S I O NPiramal Foundation is committed to transforming health, education, water and social sector ecosystems through high impact solutions, thought leadership and partnerships.
O U TC O M E O F C S R I N I T I AT I V E S
Healthcare
K E Y AC H I E V E M E N T SD U R I N G T H E Y E A RPiramal Foundation• Signed Statement of Intent with NITI
Aayog for 25 Aspirational Districts on March 20, 2018 for improving education, health and nutrition indicators
Education• PFEL expanded its partnerships with
Ministry of HRD and Niti Aayog to work across 10 states
• PFEL launched Virtual Field Support in Jhunjhunu, Rajasthan and Bardoli, Surat in February 2018
Piramal Swasthya• Launched D.E.S.H. - first-of-its-
kind, cancer screening program in Kamrup district of Assam
• Launched ASARA 2.0 – expansion of tribal health program to 1,179 habitations of Vishakhapatnam
• Piramal Swasthya achieved the benchmark of serving 1 million patients' lives per month
Piramal Sarvajal• Piramal Sarvajal reached
1,100 touchpoints and serves over 5.1 Lakh beneficiaries daily
Employee Social Impact • Over 41,500 volunteering hours by
Piramal Group employees
9.6MnB E N E F I C I A R I E S
11S TAT E S S E R V E D
7S TAT E S— H I H L
410TO TA L M E D I C A L M O B I L E VA N S S E R V E D
Education
Water
42MnC A L L S A N N UA L LY— H I H L
585kC H I L D R E N
5S TAT E S
1,100G A N D H I F E L L O W S & A L U M N I
55%I N C R E A S E I N S T U D E N T L E A R N I N G Q U O T I E N T
4,600S C H O O L S / H M S
503kC O N S U M E R S S E R V E D D A I LY
16S TAT E S
1,100TO U C H P O I N T S
350+WAT E R AT M S
740+P U R I F I C AT I O N U N I T S
“At Piramal, we believe in making a positive difference at a grass-root level for people, communities, and society at large. Our initiatives aim at achieving sustained progress; and focus on emergent and high-impact issues, where we can bring about a genuine change through thought leadership and partnerships. The emphasis areas for us are healthcare, education, water and youth empowerment. We continue to collaborate with central and state governments to accomplish our mission. Some of the reputed organisations that support us in our initiatives include Harvard Graduate School of Education and Harvard School of Public Health, New York University, Michael & Susan Dell Foundation, World Diabetes Foundation, USAID and Water.org. We have expanded our CSR footprint across 21 states and touched over 97 million lives.”
D R S W A T I P I R A M A L Vice-Chairperson, PEL
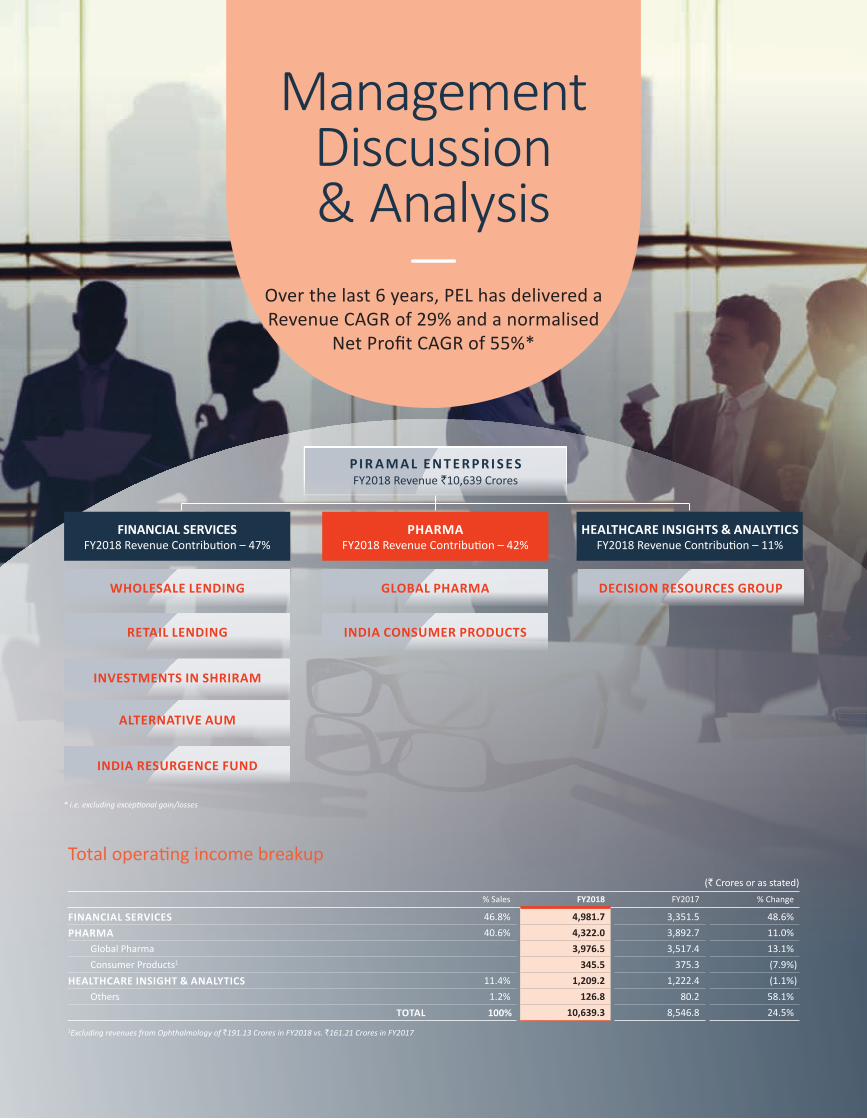
42 | Piramal Enterprises Limited
PI R A M A L E N T E R PR I S E SFY2018 Revenue `10,639 Crores
FINANCIAL SERVICESFY2018 Revenue Contribution – 47%
PHARMAFY2018 Revenue Contribution – 42%
HEALTHCARE INSIGHTS & ANALYTICSFY2018 Revenue Contribution – 11%
WHOLESALE LENDING GLOBAL PHARMA DECISION RESOURCES GROUP
RETAIL LENDING
INVESTMENTS IN SHRIRAM
ALTERNATIVE AUM
INDIA RESURGENCE FUND
INDIA CONSUMER PRODUCTS
Over the last 6 years, PEL has delivered a Revenue CAGR of 29% and a normalised
Net Profit CAGR of 55%*
* i.e. excluding exceptional gain/losses
ManagementDiscussion& Analysis
—
Total operating income breakup(` Crores or as stated)
% Sales FY2018 FY2017 % Change
FINANCIAL SERVICES 46.8% 4,981.7 3,351.5 48.6%
PHARMA 40.6% 4,322.0 3,892.7 11.0%
Global Pharma 3,976.5 3,517.4 13.1%
Consumer Products1 345.5 375.3 (7.9%)
HEALTHCARE INSIGHT & ANALYTICS 11.4% 1,209.2 1,222.4 (1.1%)
Others 1.2% 126.8 80.2 58.1%
TOTAL 100% 10,639.3 8,546.8 24.5%
1Excluding revenues from Ophthalmology of `191.13 Crores in FY2018 vs. `161.21 Crores in FY2017
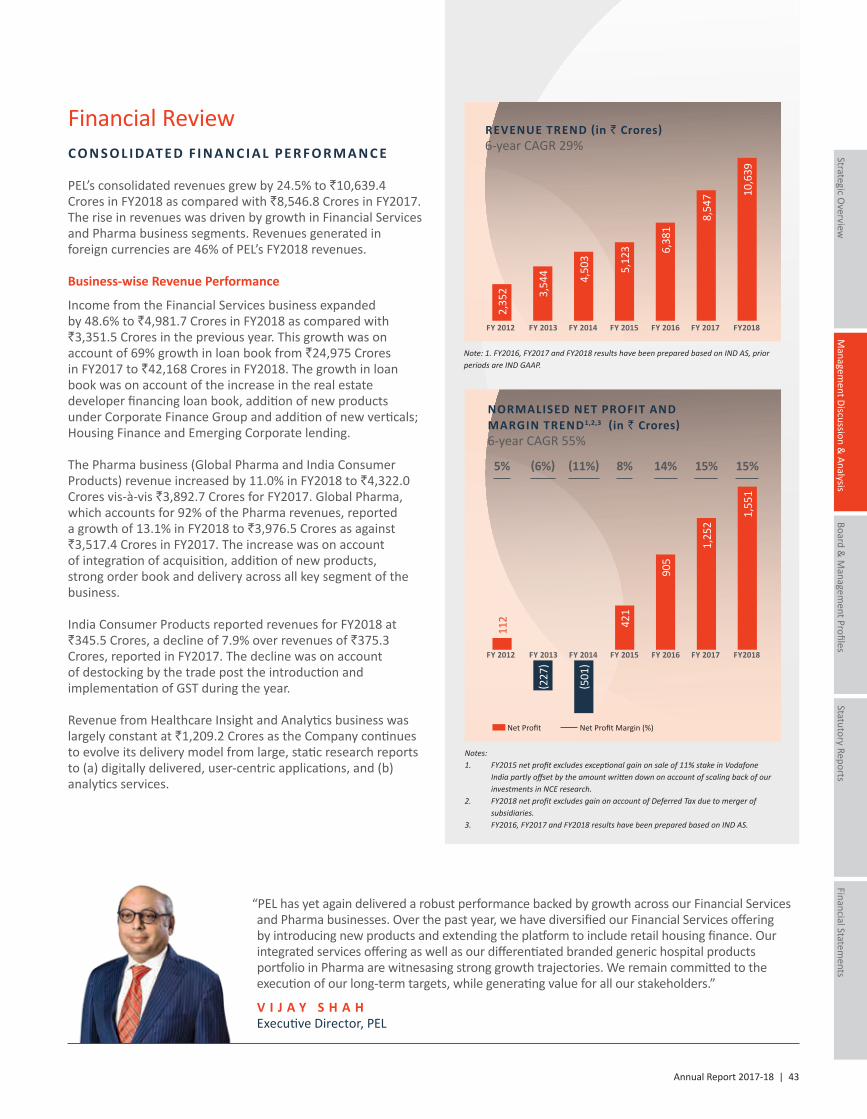
Annual Report 2017-18 | 43
Managem
ent Discussion &
Analysis
Strategic Overview
Board &
Managem
ent ProfilesStatutory Reports
Financial Statements
Financial ReviewC O N S O L I DAT E D F I N A N C I A L PE R F O R M A N C E
PEL’s consolidated revenues grew by 24.5% to `10,639.4 Crores in FY2018 as compared with `8,546.8 Crores in FY2017. The rise in revenues was driven by growth in Financial Services and Pharma business segments. Revenues generated in foreign currencies are 46% of PEL’s FY2018 revenues.
Business-wise Revenue Performance
Income from the Financial Services business expanded by 48.6% to `4,981.7 Crores in FY2018 as compared with `3,351.5 Crores in the previous year. This growth was on account of 69% growth in loan book from `24,975 Crores in FY2017 to `42,168 Crores in FY2018. The growth in loan book was on account of the increase in the real estate developer financing loan book, addition of new products under Corporate Finance Group and addition of new verticals; Housing Finance and Emerging Corporate lending.
The Pharma business (Global Pharma and India Consumer Products) revenue increased by 11.0% in FY2018 to `4,322.0 Crores vis-à-vis `3,892.7 Crores for FY2017. Global Pharma, which accounts for 92% of the Pharma revenues, reported a growth of 13.1% in FY2018 to `3,976.5 Crores as against `3,517.4 Crores in FY2017. The increase was on account of integration of acquisition, addition of new products, strong order book and delivery across all key segment of the business.
India Consumer Products reported revenues for FY2018 at `345.5 Crores, a decline of 7.9% over revenues of `375.3 Crores, reported in FY2017. The decline was on account of destocking by the trade post the introduction and implementation of GST during the year.
Revenue from Healthcare Insight and Analytics business was largely constant at `1,209.2 Crores as the Company continues to evolve its delivery model from large, static research reports to (a) digitally delivered, user-centric applications, and (b) analytics services.
Note: 1. FY2016, FY2017 and FY2018 results have been prepared based on IND AS, prior periods are IND GAAP.
REVENUE TREND (in ` Crores)6-year CAGR 29%
FY 2012 FY 2013 FY 2014 FY 2015 FY 2016 FY 2017 FY2018
10,6
39
8,54
7
6,38
1
5,12
3
4,50
3
3,54
4
2,35
2
Notes:1. FY2015 net profit excludes exceptional gain on sale of 11% stake in Vodafone
India partly offset by the amount written down on account of scaling back of our investments in NCE research.
2. FY2018 net profit excludes gain on account of Deferred Tax due to merger of subsidiaries.
3. FY2016, FY2017 and FY2018 results have been prepared based on IND AS.
Net Profit Net Profit Margin (%)
5% (6%) (11%) 8% 14% 15% 15%
FY 2012 FY 2013 FY 2014 FY 2015 FY 2016 FY 2017 FY2018
1,55
1
1,25
2
905
421
112
(501
)
(227
)
NORMALISED NET PROFIT AND MARGIN TREND1,2,3 (in ` Crores)6-year CAGR 55%
“PEL has yet again delivered a robust performance backed by growth across our Financial Services and Pharma businesses. Over the past year, we have diversified our Financial Services offering by introducing new products and extending the platform to include retail housing finance. Our integrated services offering as well as our differentiated branded generic hospital products portfolio in Pharma are witnesasing strong growth trajectories. We remain committed to the execution of our long-term targets, while generating value for all our stakeholders.”
V I J A Y S H A HExecutive Director, PEL
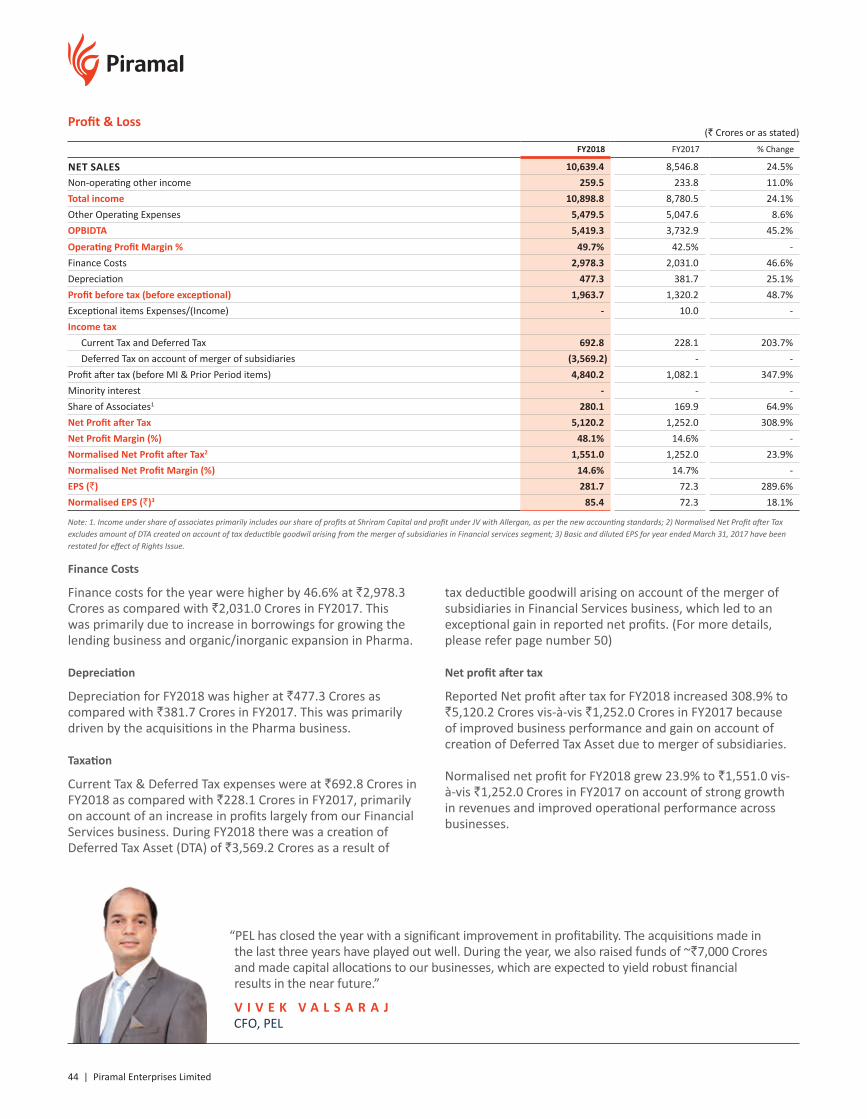
44 | Piramal Enterprises Limited
Profit & Loss(` Crores or as stated)
FY2018 FY2017 % Change
NET SALES 10,639.4 8,546.8 24.5%
Non-operating other income 259.5 233.8 11.0%
Total income 10,898.8 8,780.5 24.1%
Other Operating Expenses 5,479.5 5,047.6 8.6%
OPBIDTA 5,419.3 3,732.9 45.2%
Operating Profit Margin % 49.7% 42.5% -
Finance Costs 2,978.3 2,031.0 46.6%
Depreciation 477.3 381.7 25.1%
Profit before tax (before exceptional) 1,963.7 1,320.2 48.7%
Exceptional items Expenses/(Income) - 10.0 -
Income taxCurrent Tax and Deferred Tax 692.8 228.1 203.7%
Deferred Tax on account of merger of subsidiaries (3,569.2) - -
Profit after tax (before MI & Prior Period items) 4,840.2 1,082.1 347.9%
Minority interest - - -
Share of Associates1 280.1 169.9 64.9%
Net Profit after Tax 5,120.2 1,252.0 308.9%
Net Profit Margin (%) 48.1% 14.6% -
Normalised Net Profit after Tax2 1,551.0 1,252.0 23.9%
Normalised Net Profit Margin (%) 14.6% 14.7% -
EPS (`) 281.7 72.3 289.6%
Normalised EPS (`)3 85.4 72.3 18.1%
Note: 1. Income under share of associates primarily includes our share of profits at Shriram Capital and profit under JV with Allergan, as per the new accounting standards; 2) Normalised Net Profit after Tax excludes amount of DTA created on account of tax deductible goodwil arising from the merger of subsidiaries in Financial services segment; 3) Basic and diluted EPS for year ended March 31, 2017 have been restated for effect of Rights Issue.
Finance Costs
Finance costs for the year were higher by 46.6% at `2,978.3 Crores as compared with `2,031.0 Crores in FY2017. This was primarily due to increase in borrowings for growing the lending business and organic/inorganic expansion in Pharma.
Depreciation
Depreciation for FY2018 was higher at `477.3 Crores as compared with `381.7 Crores in FY2017. This was primarily driven by the acquisitions in the Pharma business.
Taxation
Current Tax & Deferred Tax expenses were at `692.8 Crores in FY2018 as compared with `228.1 Crores in FY2017, primarily on account of an increase in profits largely from our Financial Services business. During FY2018 there was a creation of Deferred Tax Asset (DTA) of `3,569.2 Crores as a result of
tax deductible goodwill arising on account of the merger of subsidiaries in Financial Services business, which led to an exceptional gain in reported net profits. (For more details, please refer page number 50)
Net profit after tax
Reported Net profit after tax for FY2018 increased 308.9% to `5,120.2 Crores vis-à-vis `1,252.0 Crores in FY2017 because of improved business performance and gain on account of creation of Deferred Tax Asset due to merger of subsidiaries.
Normalised net profit for FY2018 grew 23.9% to `1,551.0 vis-à-vis `1,252.0 Crores in FY2017 on account of strong growth in revenues and improved operational performance across businesses.
“PEL has closed the year with a significant improvement in profitability. The acquisitions made in the last three years have played out well. During the year, we also raised funds of ~`7,000 Crores and made capital allocations to our businesses, which are expected to yield robust financial results in the near future.”
V I V E K V A L S A R A J CFO, PEL
Annual Report 2017-18 | 45
Managem
ent Discussion &
Analysis
Strategic Overview
Board &
Managem
ent ProfilesStatutory Reports
Financial Statements
Balance Sheet(` Crores or as stated)
As at March 31, 2018 As at March 31, 2017
Equity Share Capital 36.1 34.5
Other Equity 26,409.1 14,848.1
Non-Controlling Interest 12.0 13.2
Borrowings (Current & Non-Current) 44,160.8 30,451.0
Deferred Tax Liabilities (Net) 29.2 30.8
Other Liabilities 1,900.7 2,674.8
Provisions 135.5 187.1
TOTAL 72,683.3 48,239.4
PPE, Intangibles (incl. Under Development), CWIP 5,740.2 5,425.1
Goodwill on Consolidation 5,632.6 5,427.2
Financial Assets
– Investments 23,526.6 21,716.7
– Others 21,286.8 5,887.1
Other Non-Current Assets 437.5 399.1
Deferred Tax Assets (Net) 4,244.3 625.2
Current Assets
– Inventories 774.0 723.1
– Trade Receivables 1,355.5 1,107.7
– Cash & Cash Equivalents and Other Bank Balances 2,467.0 1,540.9
– Other Financial & Non-Financial Assets 7,218.9 5,387.3
TOTAL 72,683.3 48,239.4
Dividend
The Company paid a final equity dividend of `25 per share. This would entail a payout of `452 Crores (excludes any dividend payout upon conversions of CCDs & related rights till book closure date). The Dividend payout ratio was 29% for FY2018.
Net worth
The Net worth as on March 31, 2018 was `26,445.2 Crores as compared with `14,882.6 Crores as on March 31, 2017. The increase in Net worth is primarily on account of the capital raised via QIP and rights issue during the year, increase in profits (inclusive of the impact of DTA created) and improved business performance.
Loan Funds
Total borrowings as on March 31, 2018 were `44,160.8 Crores as compared with `30,451 Crores as on March 31, 2017. Increase in borrowings during the year was primarily on account of higher investments in the Financial Services segment and organic/inorganic expansion in Pharma.
Fixed Assets
During FY2018, total fixed assets increased by `315 Crores, primarily on account of acquisitions and organic expansions in Pharma business.
Investments
Investment book value (including loan book) as on March 31, 2018 is `28,725 Crores, compared with `25,181 Crores as on March 31, 2017. Increase is mainly on account of increase in size of loan book.
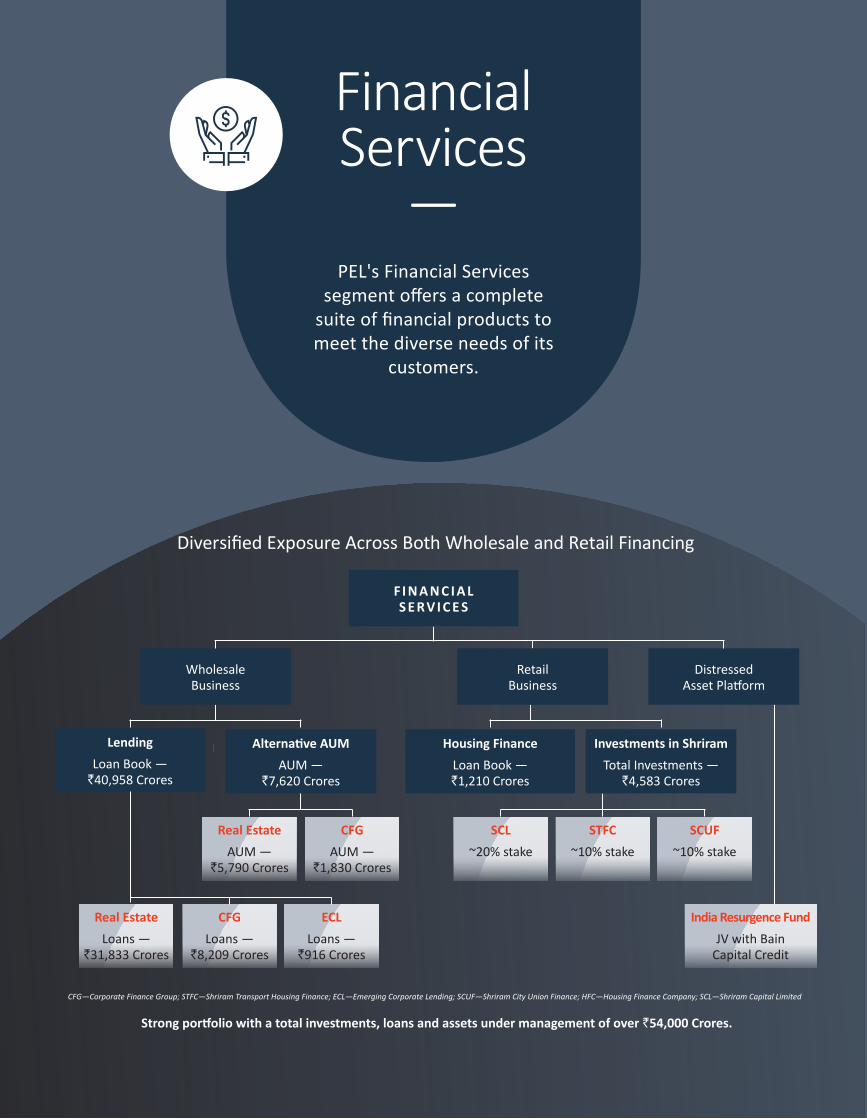
Financial Services
—PEL's Financial Services
segment offers a complete suite of financial products to meet the diverse needs of its
customers.
Diversified Exposure Across Both Wholesale and Retail Financing
CFG—Corporate Finance Group; STFC—Shriram Transport Housing Finance; ECL—Emerging Corporate Lending; SCUF—Shriram City Union Finance; HFC—Housing Finance Company; SCL—Shriram Capital Limited
Strong portfolio with a total investments, loans and assets under management of over `54,000 Crores.
F I N A N C I A L S E RV I C E S
Distressed Asset Platform
RetailBusiness
Wholesale Business
Investments in ShriramTotal Investments —
`4,583 Crores
Housing FinanceLoan Book —`1,210 Crores
Alternative AUMAUM —
`7,620 Crores
LendingLoan Book —
`40,958 Crores
Real EstateAUM —
`5,790 Crores
CFGAUM —
`1,830 Crores
SCL~20% stake
Real EstateLoans —
`31,833 Crores
CFGLoans —
`8,209 Crores
ECLLoans —
`916 Crores
STFC~10% stake
SCUF~10% stake
India Resurgence FundJV with Bain
Capital Credit
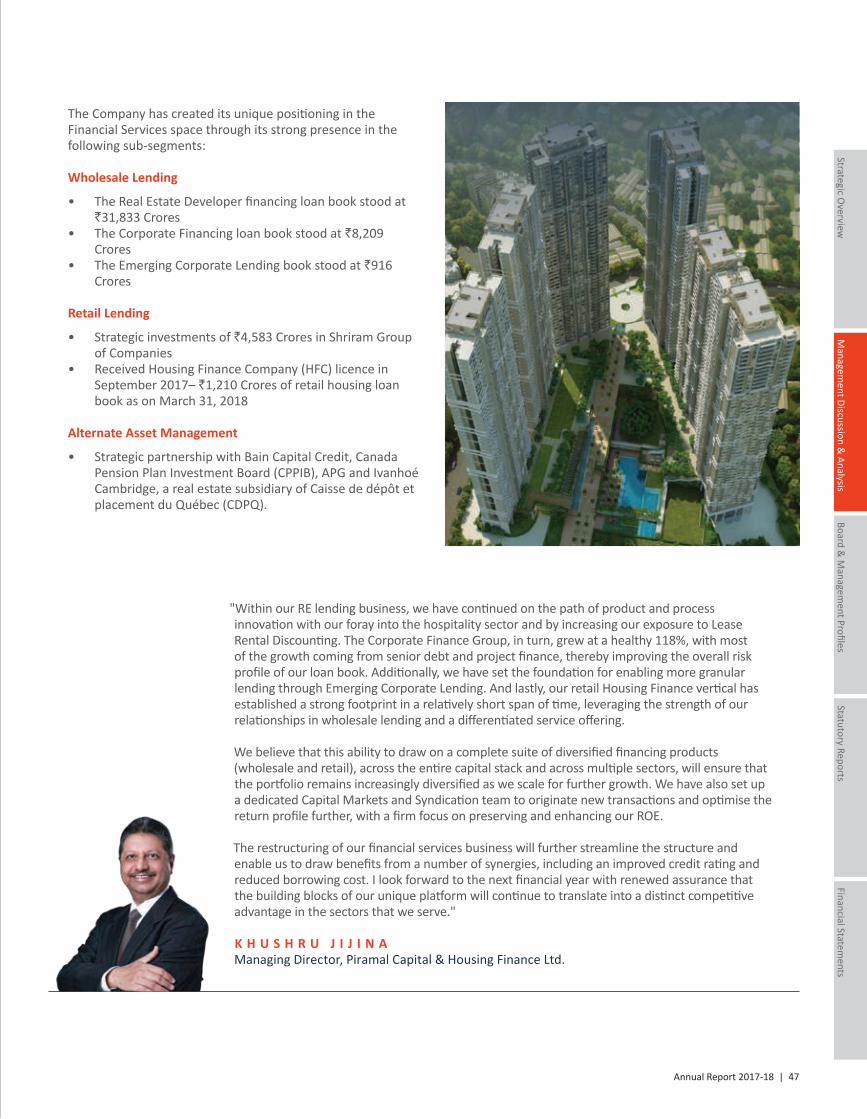
Annual Report 2017-18 | 47
Managem
ent Discussion &
Analysis
Strategic Overview
Board &
Managem
ent ProfilesStatutory Reports
Financial Statements
The Company has created its unique positioning in the Financial Services space through its strong presence in the following sub-segments:
Wholesale Lending
• The Real Estate Developer financing loan book stood at `31,833 Crores
• The Corporate Financing loan book stood at `8,209 Crores
• The Emerging Corporate Lending book stood at `916 Crores
Retail Lending
• Strategic investments of `4,583 Crores in Shriram Group of Companies
• Received Housing Finance Company (HFC) licence in September 2017– `1,210 Crores of retail housing loan book as on March 31, 2018
Alternate Asset Management
• Strategic partnership with Bain Capital Credit, Canada Pension Plan Investment Board (CPPIB), APG and Ivanhoé Cambridge, a real estate subsidiary of Caisse de dépôt et placement du Québec (CDPQ).
"Within our RE lending business, we have continued on the path of product and process innovation with our foray into the hospitality sector and by increasing our exposure to Lease Rental Discounting. The Corporate Finance Group, in turn, grew at a healthy 118%, with most of the growth coming from senior debt and project finance, thereby improving the overall risk profile of our loan book. Additionally, we have set the foundation for enabling more granular lending through Emerging Corporate Lending. And lastly, our retail Housing Finance vertical has established a strong footprint in a relatively short span of time, leveraging the strength of our relationships in wholesale lending and a differentiated service offering.
We believe that this ability to draw on a complete suite of diversified financing products (wholesale and retail), across the entire capital stack and across multiple sectors, will ensure that the portfolio remains increasingly diversified as we scale for further growth. We have also set up a dedicated Capital Markets and Syndication team to originate new transactions and optimise the return profile further, with a firm focus on preserving and enhancing our ROE.
The restructuring of our financial services business will further streamline the structure and enable us to draw benefits from a number of synergies, including an improved credit rating and reduced borrowing cost. I look forward to the next financial year with renewed assurance that the building blocks of our unique platform will continue to translate into a distinct competitive advantage in the sectors that we serve."
K H U S H R U J I J I N AManaging Director, Piramal Capital & Housing Finance Ltd.
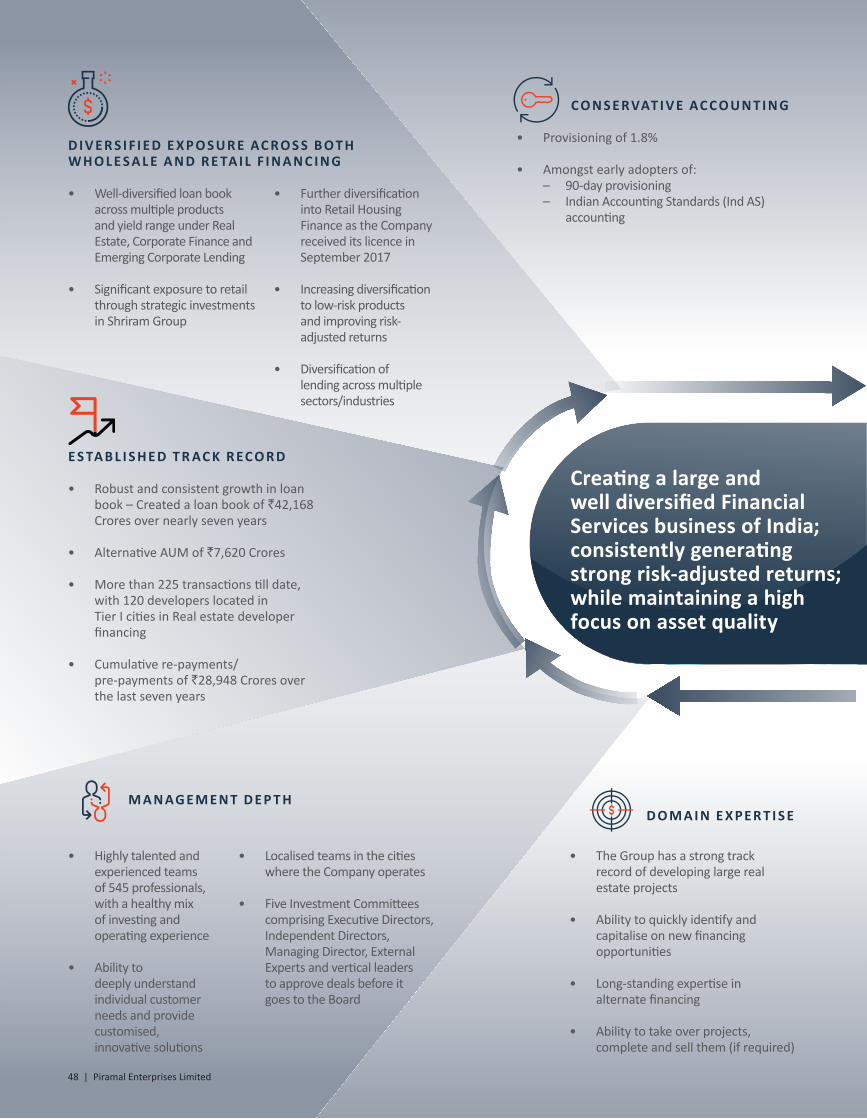
E S TA B L I S H E D T R AC K R EC O R D
• Robust and consistent growth in loan book – Created a loan book of `42,168 Crores over nearly seven years
• Alternative AUM of `7,620 Crores
• More than 225 transactions till date, with 120 developers located in Tier I cities in Real estate developer financing
• Cumulative re-payments/ pre-payments of `28,948 Crores over the last seven years
M A N AG E M E N T D E P T HD O M A I N E X PE R T I S E
D I V E R S I F I E D E X P O S U R E AC R O S S B O T H W H O L E S A L E A N D R E TA I L F I N A N C I N G
C O N S E RVAT I V E AC C O U N T I N G
48 | Piramal Enterprises Limited
• Highly talented and experienced teams of 545 professionals, with a healthy mix of investing and operating experience
• Ability to deeply understand individual customer needs and provide customised, innovative solutions
• Localised teams in the cities where the Company operates
• Five Investment Committees comprising Executive Directors, Independent Directors, Managing Director, External Experts and vertical leaders to approve deals before it goes to the Board
• Well-diversified loan book across multiple products and yield range under Real Estate, Corporate Finance and Emerging Corporate Lending
• Significant exposure to retail through strategic investments in Shriram Group
• Further diversification into Retail Housing Finance as the Company received its licence in September 2017
• Increasing diversification to low-risk products and improving risk-adjusted returns
• Diversification of lending across multiple sectors/industries
• The Group has a strong track record of developing large real estate projects
• Ability to quickly identify and capitalise on new financing opportunities
• Long-standing expertise in alternate financing
• Ability to take over projects, complete and sell them (if required)
• Provisioning of 1.8%
• Amongst early adopters of: – 90-day provisioning – Indian Accounting Standards (Ind AS)
accounting
Creating a large and well diversified Financial Services business of India; consistently generating strong risk-adjusted returns; while maintaining a high focus on asset quality
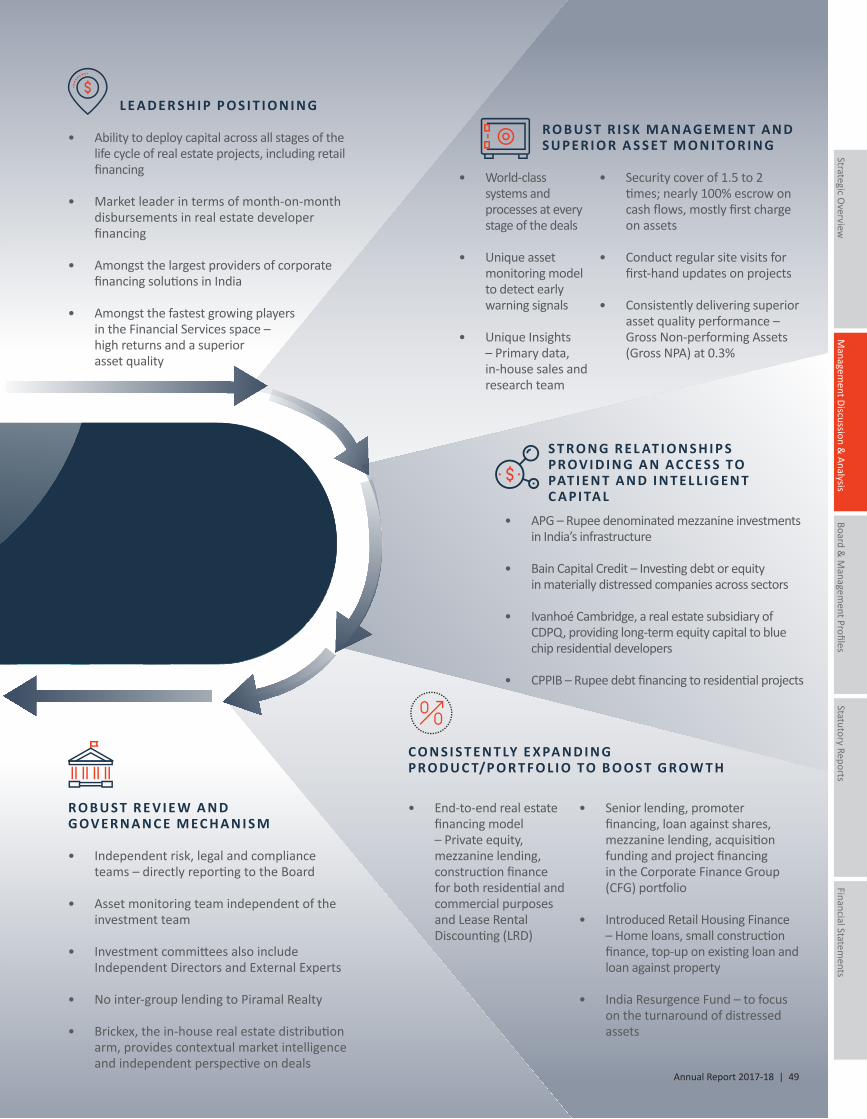
Managem
ent Discussion &
Analysis
Strategic Overview
Board &
Managem
ent ProfilesStatutory Reports
Financial Statements
L E A D E R S H I P P O S I T I O N I N G
R O B U S T R E V I E W A N D G OV E R N A N C E M EC H A N I S M
• Independent risk, legal and compliance teams – directly reporting to the Board
• Asset monitoring team independent of the investment team
• Investment committees also include Independent Directors and External Experts
• No inter-group lending to Piramal Realty
• Brickex, the in-house real estate distribution arm, provides contextual market intelligence and independent perspective on deals
C O N S I S T E N T LY E X PA N D I N G PR O D U C T/P O R T F O L I O TO B O O S T G R OW T H
S T R O N G R E L AT I O N S H I P S PR OV I D I N G A N AC C E S S TO PAT I E N T A N D I N T E L L I G E N T C A PI TA L
R O B U S T R I S K M A N AG E M E N T A N D S U PE R I O R A S S E T M O N I TO R I N G
Annual Report 2017-18 | 49
• End-to-end real estate financing model – Private equity, mezzanine lending, construction finance for both residential and commercial purposes and Lease Rental Discounting (LRD)
• Senior lending, promoter financing, loan against shares, mezzanine lending, acquisition funding and project financing in the Corporate Finance Group (CFG) portfolio
• Introduced Retail Housing Finance – Home loans, small construction finance, top-up on existing loan and loan against property
• India Resurgence Fund – to focus on the turnaround of distressed assets
• APG – Rupee denominated mezzanine investments in India’s infrastructure
• Bain Capital Credit – Investing debt or equity in materially distressed companies across sectors
• Ivanhoé Cambridge, a real estate subsidiary of CDPQ, providing long-term equity capital to blue chip residential developers
• CPPIB – Rupee debt financing to residential projects
• World-class systems and processes at every stage of the deals
• Unique asset monitoring model to detect early warning signals
• Unique Insights – Primary data, in-house sales and research team
• Security cover of 1.5 to 2 times; nearly 100% escrow on cash flows, mostly first charge on assets
• Conduct regular site visits for first-hand updates on projects
• Consistently delivering superior asset quality performance –Gross Non-performing Assets (Gross NPA) at 0.3%
• Ability to deploy capital across all stages of the life cycle of real estate projects, including retail financing
• Market leader in terms of month-on-month disbursements in real estate developer financing
• Amongst the largest providers of corporate financing solutions in India
• Amongst the fastest growing players in the Financial Services space – high returns and a superior asset quality
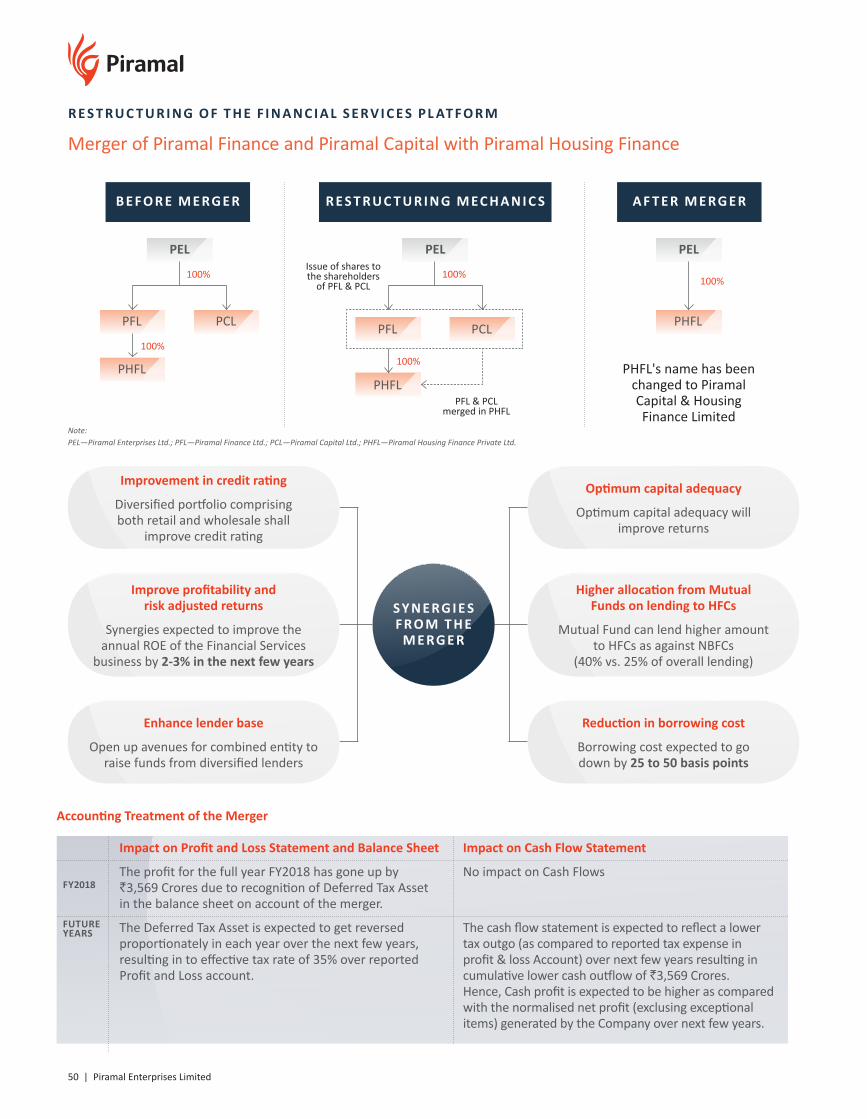
50 | Piramal Enterprises Limited
R E S T RU C T U R I N G O F T H E F I N A N C I A L S E RV I C E S PL AT F O R M
Merger of Piramal Finance and Piramal Capital with Piramal Housing Finance
B E F O R E M E RG E R A F T E R M E RG E RR E S T RU C T U R I N G M EC H A N I C S
Note:PEL—Piramal Enterprises Ltd.; PFL—Piramal Finance Ltd.; PCL—Piramal Capital Ltd.; PHFL—Piramal Housing Finance Private Ltd.
Improvement in credit rating
Diversified portfolio comprising both retail and wholesale shall
improve credit rating
Enhance lender base
Open up avenues for combined entity to raise funds from diversified lenders
Higher allocation from Mutual Funds on lending to HFCs
Mutual Fund can lend higher amount to HFCs as against NBFCs
(40% vs. 25% of overall lending)
Improve profitability and risk adjusted returns
Synergies expected to improve the annual ROE of the Financial Services
business by 2-3% in the next few years
Optimum capital adequacy
Optimum capital adequacy will improve returns
Reduction in borrowing cost
Borrowing cost expected to go down by 25 to 50 basis points
S Y N E RG I E S FR O M T H E
M E RG E R
Accounting Treatment of the Merger
The profit for the full year FY2018 has gone up by `3,569 Crores due to recognition of Deferred Tax Asset in the balance sheet on account of the merger.
Impact on Profit and Loss Statement and Balance Sheet
No impact on Cash Flows
Impact on Cash Flow Statement
The Deferred Tax Asset is expected to get reversed proportionately in each year over the next few years, resulting in to effective tax rate of 35% over reported Profit and Loss account.
The cash flow statement is expected to reflect a lower tax outgo (as compared to reported tax expense in profit & loss Account) over next few years resulting in cumulative lower cash outflow of `3,569 Crores.Hence, Cash profit is expected to be higher as compared with the normalised net profit (exclusing exceptional items) generated by the Company over next few years.
FY2018
FUTURE YEARS
PEL
PFL
PHFL
PCL
100%
100%
PEL
PHFL
PCL
Issue of shares to the shareholders
of PFL & PCL
PFL & PCL merged in PHFL
100%
100%
PFL
PEL
PHFL
PHFL's name has been changed to Piramal Capital & Housing Finance Limited
100%
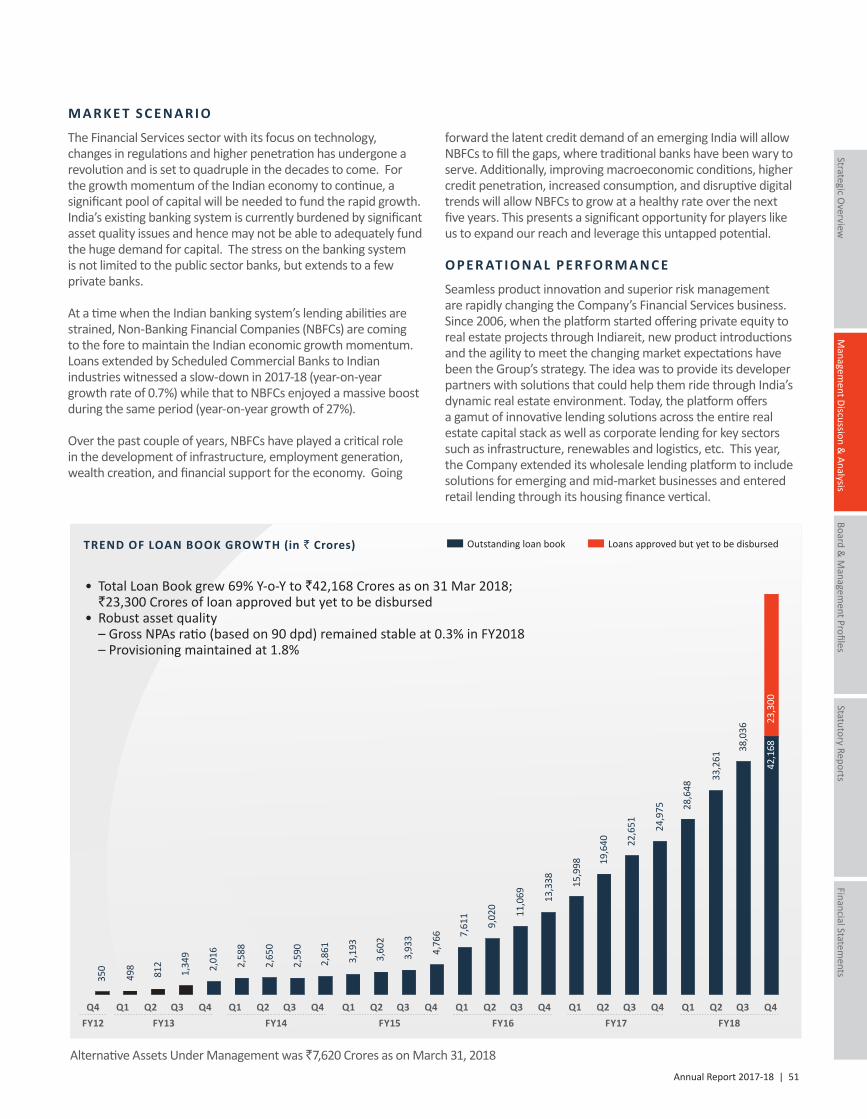
Annual Report 2017-18 | 51
Managem
ent Discussion &
Analysis
Strategic Overview
Board &
Managem
ent ProfilesStatutory Reports
Financial Statements
forward the latent credit demand of an emerging India will allow NBFCs to fill the gaps, where traditional banks have been wary to serve. Additionally, improving macroeconomic conditions, higher credit penetration, increased consumption, and disruptive digital trends will allow NBFCs to grow at a healthy rate over the next five years. This presents a significant opportunity for players like us to expand our reach and leverage this untapped potential.
O PE R AT I O N A L PE R F O R M A N C E
Seamless product innovation and superior risk management are rapidly changing the Company’s Financial Services business. Since 2006, when the platform started offering private equity to real estate projects through Indiareit, new product introductions and the agility to meet the changing market expectations have been the Group’s strategy. The idea was to provide its developer partners with solutions that could help them ride through India’s dynamic real estate environment. Today, the platform offers a gamut of innovative lending solutions across the entire real estate capital stack as well as corporate lending for key sectors such as infrastructure, renewables and logistics, etc. This year, the Company extended its wholesale lending platform to include solutions for emerging and mid-market businesses and entered retail lending through its housing finance vertical.
M A R K E T S C E N A R I O
The Financial Services sector with its focus on technology, changes in regulations and higher penetration has undergone a revolution and is set to quadruple in the decades to come. For the growth momentum of the Indian economy to continue, a significant pool of capital will be needed to fund the rapid growth. India’s existing banking system is currently burdened by significant asset quality issues and hence may not be able to adequately fund the huge demand for capital. The stress on the banking system is not limited to the public sector banks, but extends to a few private banks.
At a time when the Indian banking system’s lending abilities are strained, Non-Banking Financial Companies (NBFCs) are coming to the fore to maintain the Indian economic growth momentum. Loans extended by Scheduled Commercial Banks to Indian industries witnessed a slow-down in 2017-18 (year-on-year growth rate of 0.7%) while that to NBFCs enjoyed a massive boost during the same period (year-on-year growth of 27%).
Over the past couple of years, NBFCs have played a critical role in the development of infrastructure, employment generation, wealth creation, and financial support for the economy. Going
Alternative Assets Under Management was `7,620 Crores as on March 31, 2018
Outstanding loan book Loans approved but yet to be disbursedTREND OF LOAN BOOK GROWTH (in ` Crores)
• Total Loan Book grew 69% Y-o-Y to `42,168 Crores as on 31 Mar 2018; `23,300 Crores of loan approved but yet to be disbursed• Robust asset quality – Gross NPAs ratio (based on 90 dpd) remained stable at 0.3% in FY2018 – Provisioning maintained at 1.8%
42,1
68
28,6
48
19,6
40
7,61
1
38,0
36
24,9
75
15,9
98
4,76
6
33,2
61
22,6
51
9,02
0
13,3
38
3,93
3
11,0
69
3,60
2
2,65
0
3,19
3
2,58
8
812 2,
861
2,01
6
498 2,
590
1,34
9
350
Q1 Q2 Q3 Q4 FY13
Q4 FY12
Q1 Q2 Q3 Q4 FY14
Q1 Q2 Q3 Q4 FY15
Q1 Q2 Q3 Q4 FY16
Q1 Q2 Q3 Q4 FY17
Q1 Q2 Q3 Q4 FY18
23,3
0042
,168
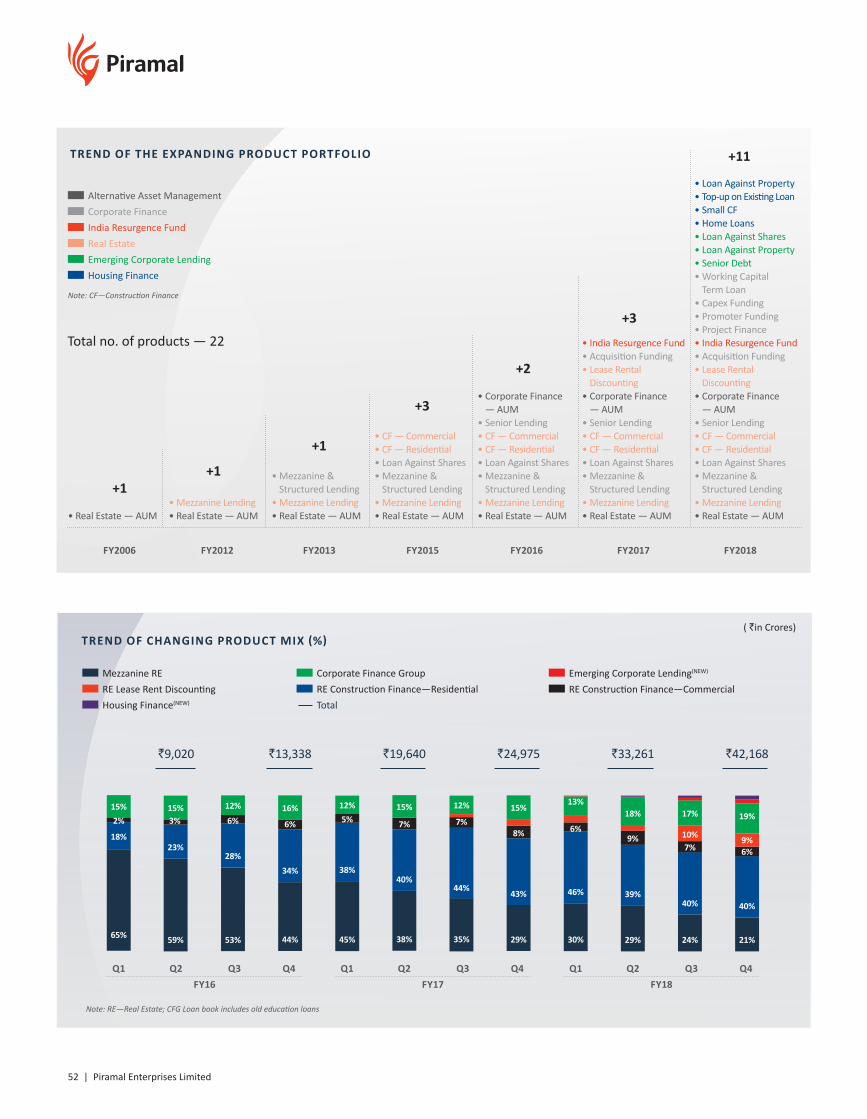
52 | Piramal Enterprises Limited
TREND OF THE EXPANDING PRODUCT PORTFOLIO
Note: CF—Construction Finance
• Real Estate — AUM• Mezzanine Lending• Real Estate — AUM
• Mezzanine & Structured Lending
• Mezzanine Lending• Real Estate — AUM
• CF — Commercial• CF — Residential• Loan Against Shares• Mezzanine &
Structured Lending• Mezzanine Lending• Real Estate — AUM
• Corporate Finance — AUM
• Senior Lending• CF — Commercial• CF — Residential• Loan Against Shares• Mezzanine &
Structured Lending• Mezzanine Lending• Real Estate — AUM
• India Resurgence Fund• Acquisition Funding• Lease Rental
Discounting• Corporate Finance
— AUM• Senior Lending• CF — Commercial• CF — Residential• Loan Against Shares• Mezzanine &
Structured Lending• Mezzanine Lending• Real Estate — AUM
• Loan Against Property• Top-up on Existing Loan• Small CF• Home Loans• Loan Against Shares• Loan Against Property• Senior Debt• Working Capital
Term Loan• Capex Funding• Promoter Funding• Project Finance• India Resurgence Fund• Acquisition Funding• Lease Rental
Discounting• Corporate Finance
— AUM• Senior Lending• CF — Commercial• CF — Residential• Loan Against Shares• Mezzanine &
Structured Lending• Mezzanine Lending• Real Estate — AUM
Total no. of products — 22
+1+1
+1
+3
+2
+3
+11
FY2006 FY2012 FY2013 FY2015 FY2016 FY2017 FY2018
Alternative Asset Management
Real Estate
Corporate Finance
Emerging Corporate Lending
India Resurgence Fund
Housing Finance
Mezzanine RE Corporate Finance Group
Housing Finance(NEW)
Emerging Corporate Lending(NEW)
RE Lease Rent Discounting RE Construction Finance—Residential RE Construction Finance—Commercial
TREND OF CHANGING PRODUCT MIX (%)
Note: RE—Real Estate; CFG Loan book includes old education loans
Total
15%
59%
23%
16%
6%
44%
34%
15%
7%
38%
40%
15%
29%
43%
18%
29%
39%
19%
21%
40%
65%
15%
53%
28%
6%
12%
45%
38%
5%12%
35%
44%
7%
12%
30%
46%
13%
24%
40%
10% 9%
Q1 Q2 Q3 Q4 FY16
Q1 Q2 Q3 Q4 FY17
Q1 Q2 Q3 Q4 FY18
2% 3%
18%
( `in Crores)
8% 6%9%
7% 6%
`9,020 `13,338 `19,640 `24,975 `33,261 `42,168
17%
Annual Report 2017-18 | 53
Managem
ent Discussion &
Analysis
Strategic Overview
Board &
Managem
ent ProfilesStatutory Reports
Financial Statements
The provisions of RERA also led developers to approach the Company for last-mile funding in order to complete their projects and ensure RERA compliance. The Company’s due diligence process that has been developed over the past few years helped tremendously in identifying the right projects to ensure that the health of the book is not compromised. This enabled the platform to fund such deals with the necessary Conditions Precedent (CPs) and customised security structures.
Foray into the Hospitality sector: Identifying a niche in the market and creating uniquely customised funding solutions has always been PEL’s forte. During the year, the Company forayed into Hospitality sector. Hospitality is an evergreen sector with quality assets at good locations that have thrived across business cycles. Hotels are long-gestation projects and require long-term financing partners who can provide tailor-made solutions, which can help the asset ride successfully across business cycles. PEL will be able to service the needs of the Hospitality sector across the capital stack – senior debt opportunities, mezzanine funding, last-mile funding towards completion and acquisition financing (for hotel owners as well as operators) through a combination of PEL’s Wholesale Real Estate Funding platform, the Corporate Finance Group and the Capital Markets Group. In the year, PEL committed `1,200 Crores across marquee hotel assets in Gurugram, Bengaluru and Pune.
New opportunity in Affordable Housing: A renewed focus of the Government on the middle-income population, which had, in the past, stayed away from real estate with its burgeoning prices in urban areas, has given birth to a new growth avenue in the form of Affordable Housing. Most of the developers have either already forayed into the Affordable Housing segment or have started looking at opportunities in the sector. PEL has set up a dedicated team to leverage on the opportunity by focusing on selective transactions within the affordable and mid-income housing projects on the peripheral locations of Mumbai, Delhi-NCR, Bengaluru, Pune, Chennai, Kolkata and Hyderabad. PEL remains selective and has adopted a trademark partnership-based approach to ensure that the right deals are picked as this segment expands and gains credibility.
Wholesale Lending
Real Estate Developer Finance
Market ScenarioDuring the year, GST and Real Estate Regulation (and Development) Act (RERA) reduced the pace of growth in the sector. However, these regulatory changes are expected to contribute positively towards increased transparency and sustained growth in the coming years. RERA, which was introduced to protect the interest of homebuyers and boost investments in the real estate sector, has now been implemented in 27 states. The year saw the Indian consumer hesitant towards making purchase decisions, which led to subdued sales and muted property prices throughout the markets. Under RERA, developers were not permitted to raise initial capital from sales due to registration-related compliances, which presented an opportunity for PEL. RERA also triggered consolidation amongst developers due to the stringent compliance norms, which will result in only a few established players dominating the market going forward. PEL’s portfolio withstood the impact of RERA successfully due to its deep relationships with top developers, ability to fund across the entire real estate capital stack and its robust risk management and monitoring processes.
Operational Performance during the YearSignificant growth in the loan book: The real estate loan book grew from `21,209 Crores as on March 31, 2017 to `31,833 Crores as on March 31, 2018, registering a growth of 50%. During the year, the Company disbursed an incremental of `21,332 Crores as against `13,984 Crores during FY 17. During the year, `11,013 Crores has been repaid/refinanced. Construction Finance contributed 60% to the real estate loan book, whereas Lease Rental Discounting was at `3,623 Crores at the end of the year, representing 11% of the real estate loan book. In terms of composition, the Lease Rental Discounting disbursements as on March 2018 were 2.5 times more than the FY 2017 numbers and have seen significant traction post the product’s launch in November 2016. Lease Rental Discounting has helped us target higher liquidity transactions along with added flexibility for the developers in terms of both serving and repayment, which traditional bank products are unable to provide. Commercial transactions also saw an increase in number with around 39 transactions across markets, aggregating to `5,284 Crores towards Construction Finance.
Leverage on account of RERA:In the pre RERA era, developers would use the funds from the pre-sale of housing units for the early stages of development of projects. With the implementation of RERA in May 2017, pre-sales or the sale of housing units can be undertaken only after securing all the required approvals; this shift in scenario increased the developer’s dependency on external funding. Due to its strong relationships with most of the marquee developers in the market, PEL was able to fill the funding gap with its structured debt solutions. The structured debt portfolio increased from `3,968 Crores in March 2017 to `5,770 Crores in March 2018.
`31,833 CroresR E A L E S TAT E L O A N B O O K
60%C O N S T R U C T I O N F I N A N C E C O N T R I B U T I O N TO T H E R E A L E S TAT E L O A N B O O K
54 | Piramal Enterprises Limited
Corporate Finance Group (CFG)
Market ScenarioIn India, corporate lending covers a wide variety of funding requirements, which were historically catered to by the banking system. However, over the last few years, the banking system has been struggling with non-performing assets and NBFCs have stepped in to fill the gap. Share of NBFCs in total credit across India has consistently increased and is expected to increase further despite the massive recapitalisation programme for public sector banks. PEL’s CFG will continue to grow owing to its ability to offer customised solutions to its customers and expansion in product portfolio and sectors covered. Going forward, credit demand is expected to grow due to an improving macro environment and increased Government spending especially for the Infrastructure sector and other key sectors.
Operational Developments during the Year
The CFG offers lending solutions to corporates and is building a sector-agnostic corporate loan book. The Corporate Finance loan book grew by 118%, to `8,209 Crores in FY2018 from `3,766 Crores in FY2017. Disbursement increased from `1,555 Crores in FY2017 to `7,526 Crores in FY2018.
While CFG started by providing high-yield structured credit solutions, it now operates across the risk curve and provides credit solutions with a yield expectation ranging from 10% to 18%. Its bouquet of products has now expanded from mezzanine and structured debt to promoter funding, senior corporate lending, project financing, capex funding, loan against shares and acquisition funding. CFG continues to focus on creating differentiated product offerings based on client needs: takeover of the entire capital stack, growth funding, construction line, structured repayment profiles, special situations, etc. CFG has strengthened its investment team by expanding the team size and forming dedicated teams to evaluate specific sectors.
The CFG underwriting process has multiple layers to analyse risk–starting with a deep dive sector study for each new sector followed by deal specific due diligence (by independent consulting agencies and consultation with external experts) and analysis. CFG also strengthened its Deal Clearing Committee by on-boarding independent experts with decades of experience in corporate banking, private equity and credit research. The vertical also set up a separate credit operations team and expanded its independent risk assessment and asset monitoring team in FY2018.
The asset monitoring team works closely with portfolio companies to identify potential early-warning signals. Inputs from the asset monitoring and risk teams are used to continuously strengthen the underwriting process.
CFG’s philosophy is to identify particular sectors and work closely with clients to develop credit solutions that tie-in to the underlying cash flows of the business. Accordingly,
the team started with infrastructure and renewable energy in FY2014 and over a period, has added cement, auto components, logistics, entertainment, etc. to its focus area. Within these sectors, the Company provides an entire gamut of credit solutions.
Few sector-specific investment themes are as follows:
1. Renewable energy: Renewable energy continues to be a key focus area for CFG and continues to offer multiple products such as Employee Stock Ownership Plan (ESOP) funding, quasi-equity lending, project funding, etc. As the sector has matured, CFG has focused on lending against value of operating assets and has also expanded into Special Purpose Vehicle (SPV) level project financing. With Government thrust (100 GW policy), established groups (multiple groups with over 1 GW installed capacity), multiple channels of financing (INR bonds and USD bonds) and looming consolidation, CFG sees myriad opportunities in the sector. The underlying dynamics of predictable cash flows provides the ability to offer client-specific solutions.
2. Logistics: The logistics industry will continue to benefit from growth in the Indian economy and industrial output. Positive developments such as Sagarmala, dedicated freight corridor, inland waterways and implementation of the GST will facilitate investment in port infrastructure, reduction in logistics cost and consolidation in the sector. CFG will focus on the organised players who are leading this change.
The Capital Markets and Advisory group was formed in April 2017 to develop deeper relationships with Indian corporates and engage with them on an ongoing basis. The objective of this group is to build a relationship-driven lending business, offering customised financing solutions across the risk curve. This is in line with the vision to make PEL a preferred financial solution provider for all wholesale funding requirements of corporates across various sectors. The Capital Markets and Advisory group houses the Corporate Client Coverage Group (CCG) and the Syndication Group (SG). CCG is responsible for developing and maintaining direct relationships with corporates on a pan-India basis across sectors and works towards originating deals across various products viz. project finance, senior debt, structured debt, loan against shares, mezzanine debt and acquisition finance. SG is responsible for down-selling of the underwritten transactions across the real estate and CFG platforms. SG works with various banks, financial institutions, mutual funds, NBFCs, Alternate Investment Funds (AIFs) and Foreign Portfolio Investments (FPIs) and has a strong network across the market. The syndication capability enables PEL to underwrite large transactions, thereby providing a comprehensive one-stop solution to clients.
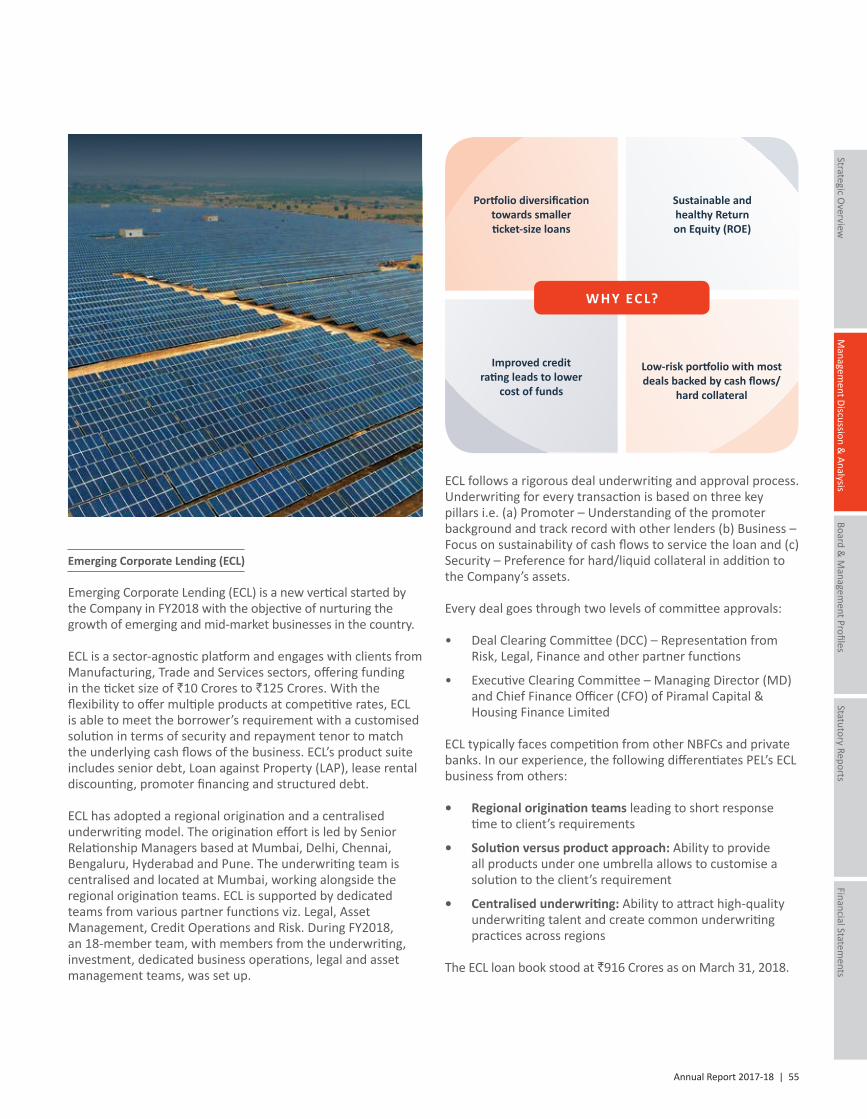
Annual Report 2017-18 | 55
Managem
ent Discussion &
Analysis
Strategic Overview
Board &
Managem
ent ProfilesStatutory Reports
Financial Statements
Emerging Corporate Lending (ECL)
Emerging Corporate Lending (ECL) is a new vertical started by the Company in FY2018 with the objective of nurturing the growth of emerging and mid-market businesses in the country.
ECL is a sector-agnostic platform and engages with clients from Manufacturing, Trade and Services sectors, offering funding in the ticket size of `10 Crores to `125 Crores. With the flexibility to offer multiple products at competitive rates, ECL is able to meet the borrower’s requirement with a customised solution in terms of security and repayment tenor to match the underlying cash flows of the business. ECL’s product suite includes senior debt, Loan against Property (LAP), lease rental discounting, promoter financing and structured debt.
ECL has adopted a regional origination and a centralised underwriting model. The origination effort is led by Senior Relationship Managers based at Mumbai, Delhi, Chennai, Bengaluru, Hyderabad and Pune. The underwriting team is centralised and located at Mumbai, working alongside the regional origination teams. ECL is supported by dedicated teams from various partner functions viz. Legal, Asset Management, Credit Operations and Risk. During FY2018, an 18-member team, with members from the underwriting, investment, dedicated business operations, legal and asset management teams, was set up.
Portfolio diversification towards smaller ticket-size loans
Improved credit rating leads to lower
cost of funds
Low-risk portfolio with most deals backed by cash flows/
hard collateral
Sustainable and healthy Return on Equity (ROE)
W H Y EC L?
Low-risk portfolio with most deals backed by cash flows/
hard collateral
ECL follows a rigorous deal underwriting and approval process. Underwriting for every transaction is based on three key pillars i.e. (a) Promoter – Understanding of the promoter background and track record with other lenders (b) Business – Focus on sustainability of cash flows to service the loan and (c) Security – Preference for hard/liquid collateral in addition to the Company’s assets. Every deal goes through two levels of committee approvals:
• Deal Clearing Committee (DCC) – Representation from Risk, Legal, Finance and other partner functions
• Executive Clearing Committee – Managing Director (MD) and Chief Finance Officer (CFO) of Piramal Capital & Housing Finance Limited
ECL typically faces competition from other NBFCs and private banks. In our experience, the following differentiates PEL’s ECL business from others:
• Regional origination teams leading to short response time to client’s requirements
• Solution versus product approach: Ability to provide all products under one umbrella allows to customise a solution to the client’s requirement
• Centralised underwriting: Ability to attract high-quality underwriting talent and create common underwriting practices across regions
The ECL loan book stood at `916 Crores as on March 31, 2018.
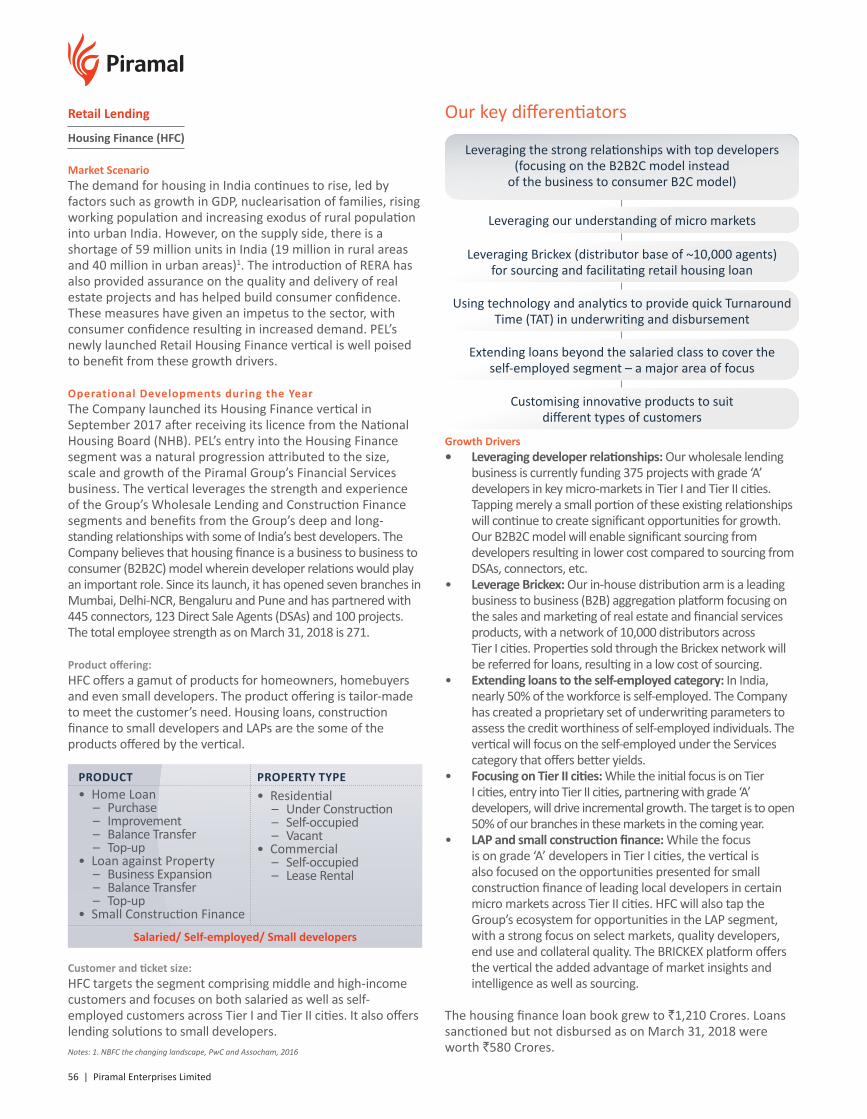
56 | Piramal Enterprises Limited
Retail Lending
Housing Finance (HFC)
Market ScenarioThe demand for housing in India continues to rise, led by factors such as growth in GDP, nuclearisation of families, rising working population and increasing exodus of rural population into urban India. However, on the supply side, there is a shortage of 59 million units in India (19 million in rural areas and 40 million in urban areas)1. The introduction of RERA has also provided assurance on the quality and delivery of real estate projects and has helped build consumer confidence. These measures have given an impetus to the sector, with consumer confidence resulting in increased demand. PEL’s newly launched Retail Housing Finance vertical is well poised to benefit from these growth drivers.
Operational Developments during the YearThe Company launched its Housing Finance vertical in September 2017 after receiving its licence from the National Housing Board (NHB). PEL’s entry into the Housing Finance segment was a natural progression attributed to the size, scale and growth of the Piramal Group’s Financial Services business. The vertical leverages the strength and experience of the Group’s Wholesale Lending and Construction Finance segments and benefits from the Group’s deep and long-standing relationships with some of India’s best developers. The Company believes that housing finance is a business to business to consumer (B2B2C) model wherein developer relations would play an important role. Since its launch, it has opened seven branches in Mumbai, Delhi-NCR, Bengaluru and Pune and has partnered with 445 connectors, 123 Direct Sale Agents (DSAs) and 100 projects. The total employee strength as on March 31, 2018 is 271.
Product offering: HFC offers a gamut of products for homeowners, homebuyers and even small developers. The product offering is tailor-made to meet the customer’s need. Housing loans, construction finance to small developers and LAPs are the some of the products offered by the vertical.
PRODUCT PROPERTY TYPE
Salaried/ Self-employed/ Small developers
• Residential – Under Construction – Self-occupied – Vacant
• Commercial – Self-occupied – Lease Rental
• Home Loan – Purchase – Improvement – Balance Transfer – Top-up
• Loan against Property – Business Expansion – Balance Transfer – Top-up
• Small Construction Finance
Customer and ticket size: HFC targets the segment comprising middle and high-income customers and focuses on both salaried as well as self-employed customers across Tier I and Tier II cities. It also offers lending solutions to small developers.
Our key differentiators
Leveraging the strong relationships with top developers (focusing on the B2B2C model instead
of the business to consumer B2C model)
Leveraging Brickex (distributor base of ~10,000 agents)for sourcing and facilitating retail housing loan
Using technology and analytics to provide quick Turnaround Time (TAT) in underwriting and disbursement
Extending loans beyond the salaried class to cover theself-employed segment – a major area of focus
Customising innovative products to suitdifferent types of customers
Leveraging our understanding of micro markets
Growth Drivers• Leveraging developer relationships: Our wholesale lending
business is currently funding 375 projects with grade ‘A’ developers in key micro-markets in Tier I and Tier II cities. Tapping merely a small portion of these existing relationships will continue to create significant opportunities for growth. Our B2B2C model will enable significant sourcing from developers resulting in lower cost compared to sourcing from DSAs, connectors, etc.
• Leverage Brickex: Our in-house distribution arm is a leading business to business (B2B) aggregation platform focusing on the sales and marketing of real estate and financial services products, with a network of 10,000 distributors across Tier I cities. Properties sold through the Brickex network will be referred for loans, resulting in a low cost of sourcing.
• Extending loans to the self-employed category: In India, nearly 50% of the workforce is self-employed. The Company has created a proprietary set of underwriting parameters to assess the credit worthiness of self-employed individuals. The vertical will focus on the self-employed under the Services category that offers better yields.
• Focusing on Tier II cities: While the initial focus is on Tier I cities, entry into Tier II cities, partnering with grade ‘A’ developers, will drive incremental growth. The target is to open 50% of our branches in these markets in the coming year.
• LAP and small construction finance: While the focus is on grade ‘A’ developers in Tier I cities, the vertical is also focused on the opportunities presented for small construction finance of leading local developers in certain micro markets across Tier II cities. HFC will also tap the Group’s ecosystem for opportunities in the LAP segment, with a strong focus on select markets, quality developers, end use and collateral quality. The BRICKEX platform offers the vertical the added advantage of market insights and intelligence as well as sourcing.
The housing finance loan book grew to `1,210 Crores. Loans sanctioned but not disbursed as on March 31, 2018 were worth `580 Crores.Notes: 1. NBFC the changing landscape, PwC and Assocham, 2016
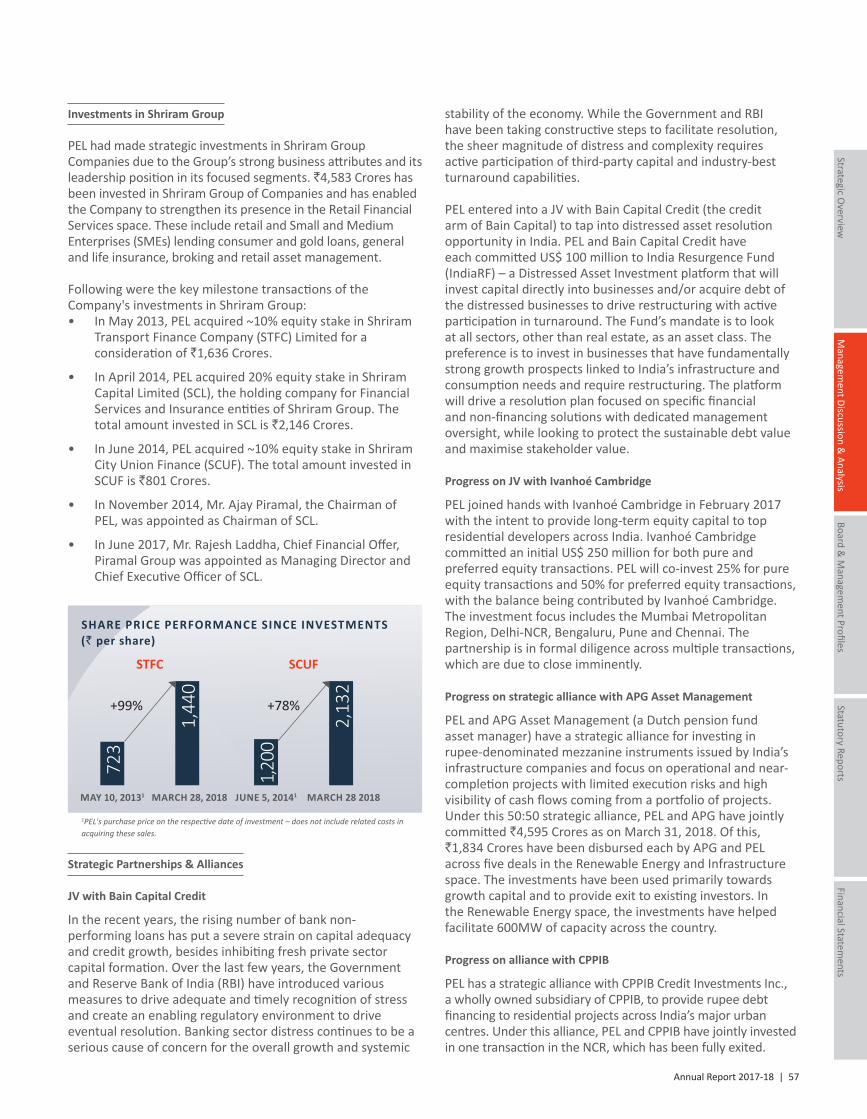
Annual Report 2017-18 | 57
Managem
ent Discussion &
Analysis
Strategic Overview
Board &
Managem
ent ProfilesStatutory Reports
Financial Statements
Investments in Shriram Group
PEL had made strategic investments in Shriram Group Companies due to the Group’s strong business attributes and its leadership position in its focused segments. `4,583 Crores has been invested in Shriram Group of Companies and has enabled the Company to strengthen its presence in the Retail Financial Services space. These include retail and Small and Medium Enterprises (SMEs) lending consumer and gold loans, general and life insurance, broking and retail asset management.
Following were the key milestone transactions of the Company's investments in Shriram Group:• In May 2013, PEL acquired ~10% equity stake in Shriram
Transport Finance Company (STFC) Limited for a consideration of `1,636 Crores.
• In April 2014, PEL acquired 20% equity stake in Shriram Capital Limited (SCL), the holding company for Financial Services and Insurance entities of Shriram Group. The total amount invested in SCL is `2,146 Crores.
• In June 2014, PEL acquired ~10% equity stake in Shriram City Union Finance (SCUF). The total amount invested in SCUF is `801 Crores.
• In November 2014, Mr. Ajay Piramal, the Chairman of PEL, was appointed as Chairman of SCL.
• In June 2017, Mr. Rajesh Laddha, Chief Financial Offer, Piramal Group was appointed as Managing Director and Chief Executive Officer of SCL.
1PEL's purchase price on the respective date of investment – does not include related costs in acquiring these sales.
SHARE PRICE PERFORMANCE SINCE INVESTMENTS(` per share)
+99%
MAY 10, 20131 MARCH 28, 2018
STFC
1,44
0
723
+78%
JUNE 5, 20141
SCUF
2,13
2
1,20
0
MARCH 28 2018
Strategic Partnerships & Alliances
JV with Bain Capital Credit
In the recent years, the rising number of bank non-performing loans has put a severe strain on capital adequacy and credit growth, besides inhibiting fresh private sector capital formation. Over the last few years, the Government and Reserve Bank of India (RBI) have introduced various measures to drive adequate and timely recognition of stress and create an enabling regulatory environment to drive eventual resolution. Banking sector distress continues to be a serious cause of concern for the overall growth and systemic
stability of the economy. While the Government and RBI have been taking constructive steps to facilitate resolution, the sheer magnitude of distress and complexity requires active participation of third-party capital and industry-best turnaround capabilities.
PEL entered into a JV with Bain Capital Credit (the credit arm of Bain Capital) to tap into distressed asset resolution opportunity in India. PEL and Bain Capital Credit have each committed US$ 100 million to India Resurgence Fund (IndiaRF) – a Distressed Asset Investment platform that will invest capital directly into businesses and/or acquire debt of the distressed businesses to drive restructuring with active participation in turnaround. The Fund’s mandate is to look at all sectors, other than real estate, as an asset class. The preference is to invest in businesses that have fundamentally strong growth prospects linked to India’s infrastructure and consumption needs and require restructuring. The platform will drive a resolution plan focused on specific financial and non-financing solutions with dedicated management oversight, while looking to protect the sustainable debt value and maximise stakeholder value.
Progress on JV with Ivanhoé Cambridge
PEL joined hands with Ivanhoé Cambridge in February 2017 with the intent to provide long-term equity capital to top residential developers across India. Ivanhoé Cambridge committed an initial US$ 250 million for both pure and preferred equity transactions. PEL will co-invest 25% for pure equity transactions and 50% for preferred equity transactions, with the balance being contributed by Ivanhoé Cambridge. The investment focus includes the Mumbai Metropolitan Region, Delhi-NCR, Bengaluru, Pune and Chennai. The partnership is in formal diligence across multiple transactions, which are due to close imminently.
Progress on strategic alliance with APG Asset Management
PEL and APG Asset Management (a Dutch pension fund asset manager) have a strategic alliance for investing in rupee-denominated mezzanine instruments issued by India’s infrastructure companies and focus on operational and near-completion projects with limited execution risks and high visibility of cash flows coming from a portfolio of projects. Under this 50:50 strategic alliance, PEL and APG have jointly committed `4,595 Crores as on March 31, 2018. Of this, `1,834 Crores have been disbursed each by APG and PEL across five deals in the Renewable Energy and Infrastructure space. The investments have been used primarily towards growth capital and to provide exit to existing investors. In the Renewable Energy space, the investments have helped facilitate 600MW of capacity across the country.
Progress on alliance with CPPIB
PEL has a strategic alliance with CPPIB Credit Investments Inc., a wholly owned subsidiary of CPPIB, to provide rupee debt financing to residential projects across India’s major urban centres. Under this alliance, PEL and CPPIB have jointly invested in one transaction in the NCR, which has been fully exited.
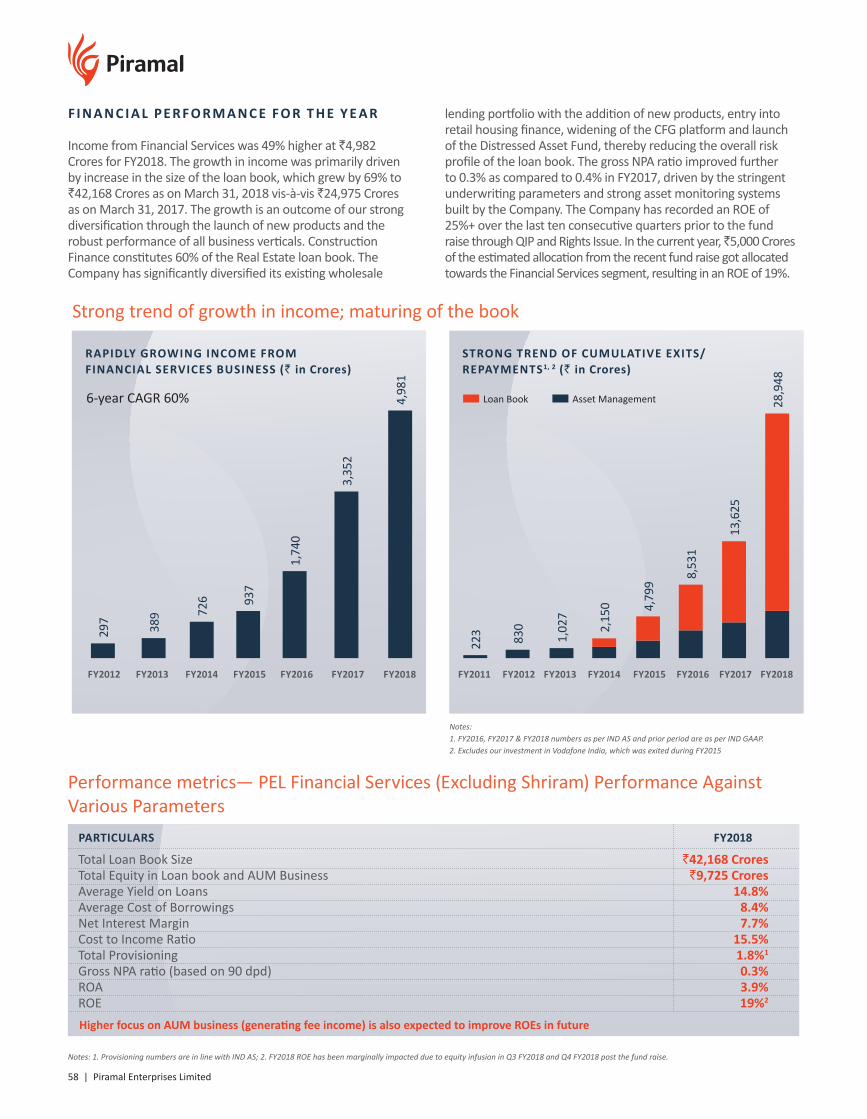
58 | Piramal Enterprises Limited
Strong trend of growth in income; maturing of the book
Notes:1. FY2016, FY2017 & FY2018 numbers as per IND AS and prior period are as per IND GAAP.2. Excludes our investment in Vodafone India, which was exited during FY2015
Loan Book Asset Management
RAPIDLY GROWING INCOME FROMFINANCIAL SERVICES BUSINESS (` in Crores)
STRONG TREND OF CUMULATIVE EXITS/REPAYMENTS1, 2 (` in Crores)
6-year CAGR 60%
FY2011 FY2012 FY2013 FY2014 FY2015 FY2016 FY2017 FY2018FY2014
726
2,15
0
223
FY2015
937
4,79
9
FY2012
297
830
FY2016
1,74
0
8,53
1FY2013
389
1,02
7
FY2017
3,35
2
13,6
25
FY2018
4,98
1
28,9
48
F I N A N C I A L PE R F O R M A N C E F O R T H E Y E A R
Income from Financial Services was 49% higher at `4,982 Crores for FY2018. The growth in income was primarily driven by increase in the size of the loan book, which grew by 69% to `42,168 Crores as on March 31, 2018 vis-à-vis `24,975 Crores as on March 31, 2017. The growth is an outcome of our strong diversification through the launch of new products and the robust performance of all business verticals. Construction Finance constitutes 60% of the Real Estate loan book. The Company has significantly diversified its existing wholesale
lending portfolio with the addition of new products, entry into retail housing finance, widening of the CFG platform and launch of the Distressed Asset Fund, thereby reducing the overall risk profile of the loan book. The gross NPA ratio improved further to 0.3% as compared to 0.4% in FY2017, driven by the stringent underwriting parameters and strong asset monitoring systems built by the Company. The Company has recorded an ROE of 25%+ over the last ten consecutive quarters prior to the fund raise through QIP and Rights Issue. In the current year, ̀ 5,000 Crores of the estimated allocation from the recent fund raise got allocated towards the Financial Services segment, resulting in an ROE of 19%.
Performance metrics— PEL Financial Services (Excluding Shriram) Performance Against Various Parameters
PARTICULARS FY2018
Higher focus on AUM business (generating fee income) is also expected to improve ROEs in future
Total Loan Book Size `42,168 CroresTotal Equity in Loan book and AUM Business `9,725 CroresAverage Yield on Loans 14.8%Average Cost of Borrowings 8.4%Net Interest Margin 7.7%Cost to Income Ratio 15.5%Total Provisioning 1.8%1
Gross NPA ratio (based on 90 dpd) 0.3%ROA 3.9%ROE 19%2
Notes: 1. Provisioning numbers are in line with IND AS; 2. FY2018 ROE has been marginally impacted due to equity infusion in Q3 FY2018 and Q4 FY2018 post the fund raise.
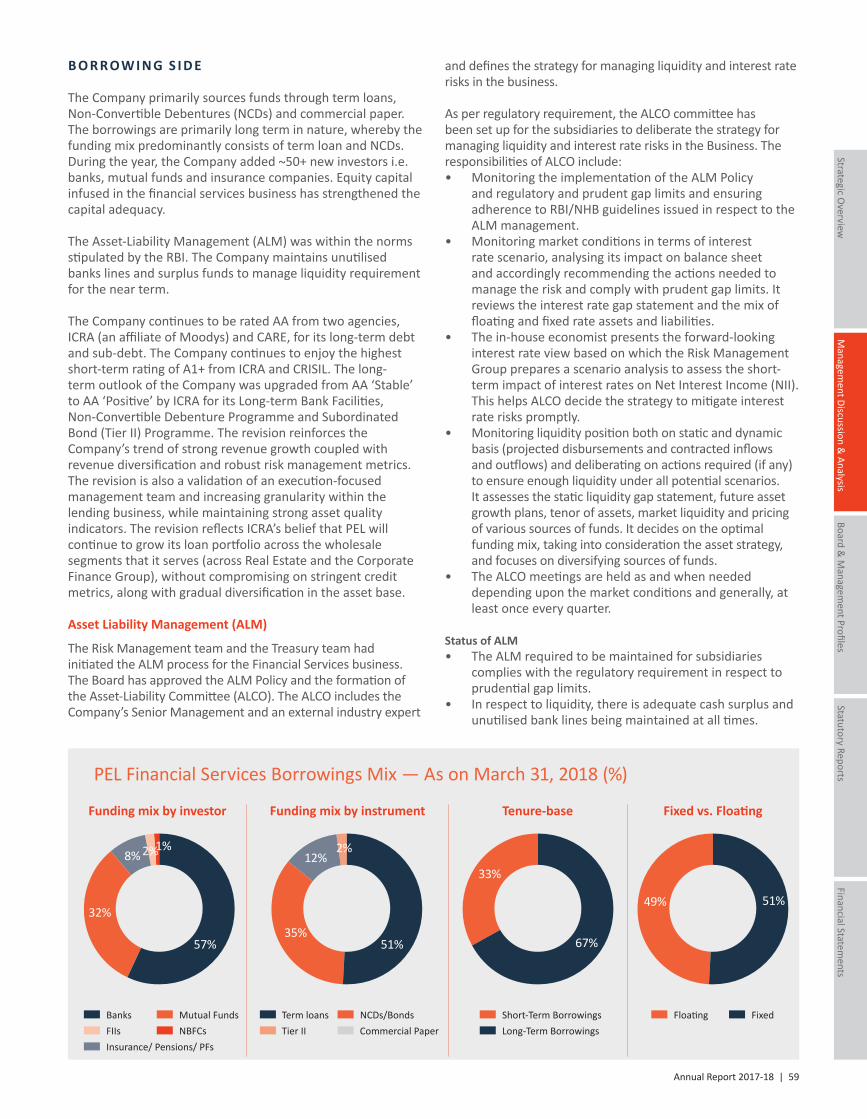
Annual Report 2017-18 | 59
Managem
ent Discussion &
Analysis
Strategic Overview
Board &
Managem
ent ProfilesStatutory Reports
Financial Statements
B O R R OW I N G S I D E
The Company primarily sources funds through term loans, Non-Convertible Debentures (NCDs) and commercial paper. The borrowings are primarily long term in nature, whereby the funding mix predominantly consists of term loan and NCDs.During the year, the Company added ~50+ new investors i.e. banks, mutual funds and insurance companies. Equity capital infused in the financial services business has strengthened the capital adequacy.
The Asset-Liability Management (ALM) was within the norms stipulated by the RBI. The Company maintains unutilised banks lines and surplus funds to manage liquidity requirement for the near term.
The Company continues to be rated AA from two agencies, ICRA (an affiliate of Moodys) and CARE, for its long-term debt and sub-debt. The Company continues to enjoy the highest short-term rating of A1+ from ICRA and CRISIL. The long-term outlook of the Company was upgraded from AA ‘Stable’ to AA ‘Positive’ by ICRA for its Long-term Bank Facilities, Non-Convertible Debenture Programme and Subordinated Bond (Tier II) Programme. The revision reinforces the Company’s trend of strong revenue growth coupled with revenue diversification and robust risk management metrics. The revision is also a validation of an execution-focused management team and increasing granularity within the lending business, while maintaining strong asset quality indicators. The revision reflects ICRA’s belief that PEL will continue to grow its loan portfolio across the wholesale segments that it serves (across Real Estate and the Corporate Finance Group), without compromising on stringent credit metrics, along with gradual diversification in the asset base.
Asset Liability Management (ALM)
The Risk Management team and the Treasury team had initiated the ALM process for the Financial Services business. The Board has approved the ALM Policy and the formation of the Asset-Liability Committee (ALCO). The ALCO includes the Company’s Senior Management and an external industry expert
and defines the strategy for managing liquidity and interest rate risks in the business.
As per regulatory requirement, the ALCO committee has been set up for the subsidiaries to deliberate the strategy for managing liquidity and interest rate risks in the Business. The responsibilities of ALCO include:• Monitoring the implementation of the ALM Policy
and regulatory and prudent gap limits and ensuring adherence to RBI/NHB guidelines issued in respect to the ALM management.
• Monitoring market conditions in terms of interest rate scenario, analysing its impact on balance sheet and accordingly recommending the actions needed to manage the risk and comply with prudent gap limits. It reviews the interest rate gap statement and the mix of floating and fixed rate assets and liabilities.
• The in-house economist presents the forward-looking interest rate view based on which the Risk Management Group prepares a scenario analysis to assess the short-term impact of interest rates on Net Interest Income (NII). This helps ALCO decide the strategy to mitigate interest rate risks promptly.
• Monitoring liquidity position both on static and dynamic basis (projected disbursements and contracted inflows and outflows) and deliberating on actions required (if any) to ensure enough liquidity under all potential scenarios. It assesses the static liquidity gap statement, future asset growth plans, tenor of assets, market liquidity and pricing of various sources of funds. It decides on the optimal funding mix, taking into consideration the asset strategy, and focuses on diversifying sources of funds.
• The ALCO meetings are held as and when needed depending upon the market conditions and generally, at least once every quarter.
Status of ALM• The ALM required to be maintained for subsidiaries
complies with the regulatory requirement in respect to prudential gap limits.
• In respect to liquidity, there is adequate cash surplus and unutilised bank lines being maintained at all times.
PEL Financial Services Borrowings Mix — As on March 31, 2018 (%)
Funding mix by investor
Banks
FIIs NBFCs
Mutual Funds
Insurance/ Pensions/ PFs
57%
32%
8% 2%1%
Funding mix by instrument Tenure-base Fixed vs. Floating
Floating Fixed
51%49%
Short-Term Borrowings
Long-Term Borrowings
67%
33%
Term loans
Tier II
NCDs/Bonds
Commercial Paper
51%35%
12%2%
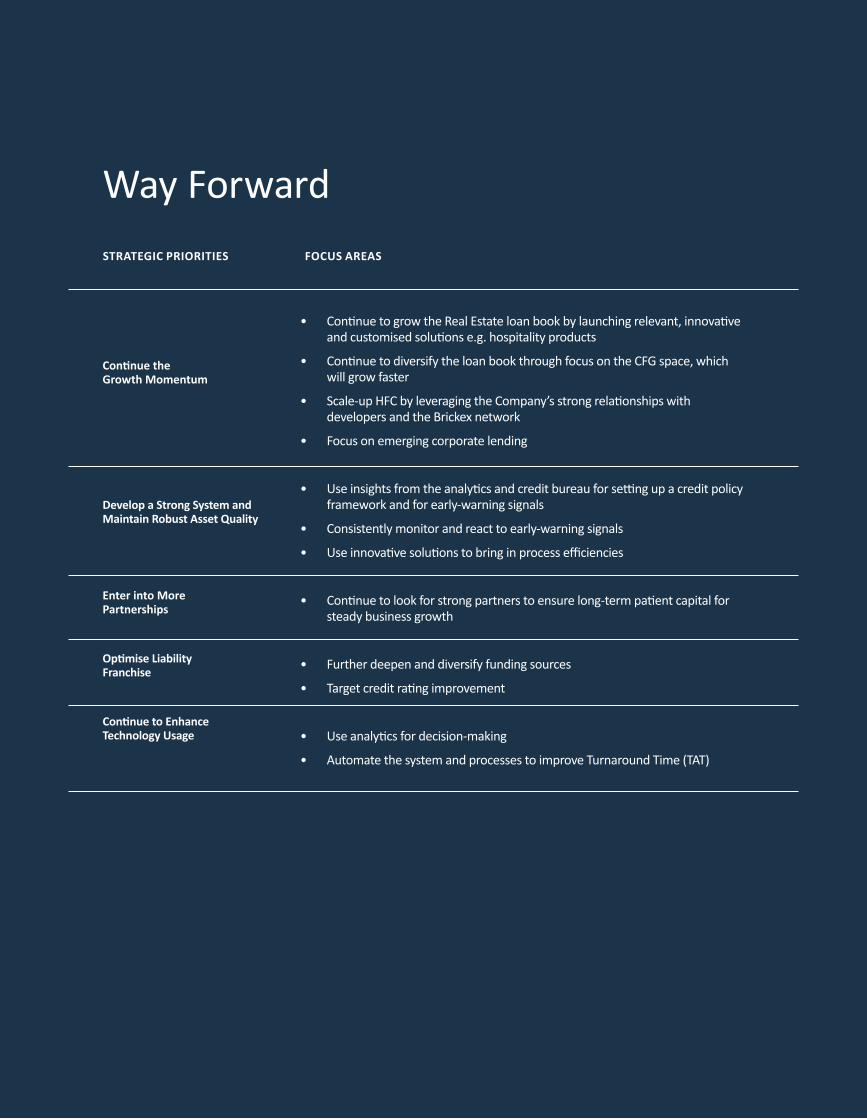
60 | Piramal Enterprises Limited
Way Forward
STRATEGIC PRIORITIES FOCUS AREAS
Continue theGrowth Momentum
Develop a Strong System and Maintain Robust Asset Quality
Optimise Liability Franchise
Continue to Enhance Technology Usage
Enter into More Partnerships
• Continue to grow the Real Estate loan book by launching relevant, innovative and customised solutions e.g. hospitality products
• Continue to diversify the loan book through focus on the CFG space, which will grow faster
• Scale-up HFC by leveraging the Company’s strong relationships with developers and the Brickex network
• Focus on emerging corporate lending
• Use insights from the analytics and credit bureau for setting up a credit policy framework and for early-warning signals
• Consistently monitor and react to early-warning signals
• Use innovative solutions to bring in process efficiencies
• Continue to look for strong partners to ensure long-term patient capital for steady business growth
• Further deepen and diversify funding sources
• Target credit rating improvement
• Use analytics for decision-making
• Automate the system and processes to improve Turnaround Time (TAT)
Annual Report 2017-18 | 61
Managem
ent Discussion &
Analysis
Strategic Overview
Board &
Managem
ent ProfilesStatutory Reports
Financial Statements
Asset Quality and Risk Management
PEL has a strong risk management framework and robust asset monitoring in its financial services business. The risk management framework spans across the pre-qualification and pre-approval stage where as asset monitoring takes place throughout the life cycle of a project.
In FY2018, the Corporate Finance Group (CFG) and Emerging Corporate Lending (ECL) asset monitoring foundation was laid down. Team has hired the right set of people, streamlined the templates for receiving and analysing the data with defined frequency, as well as initiated its own ground presence through multiple site visits. CFG and ECL divisions have also adopted all the best practices that are followed by its already established and experienced real estate asset monitoring team.
Pre-sanction Processes
At the pre-qualification stage of its financing projects, the Company is very selective of the developers or businesses to which it provides funding. It takes into consideration multitude of factors i.e. management risk, business risk, financial risk as well as structural risk. Specifially, factors, such as the promoters track record, market reputation, balance sheet and the status of the projects/ business. It mostly selects projects, which are located in select micro markets in Tier I cities of India. At the pre-approval stage, the Company analyses the potential investment by leveraging on Brickex to verify price, ticket size and sales velocity assumptions. For corporates, detailed due diligence of business & its financials is conducted alongwith detailed market feedback.
Moreover, every potential investment is subject to a standard risk scoring system by the Risk team to measure risks associated with the investment.
PEL believes that its strategic alliances with large funds like CPPIB and APG, who independently assess each investment, also serve as an external validation of its investment thesis and decisions. It structures its financing services and offerings in a manner that links the disbursements of loans to the milestones linked to sales/collection of rental income etc.
The Company maintains independence among the risk, legal and investment teams so that investment decisions can be over-ruled by its risk or legal teams, if required. In addition, its investment committees include independent directors and third party external experts who keep an independent check on the quality of the transactions.
The Company maintains a healthy security and balanced portfolio:
• The Company maintains healthy security and cash cover of 1.5x-2x at all times based on its conservative underwriting assumptions and has the ability to enforce security.
• The Company is constantly de-risking its portfolio by changing overall portfolio mix towards lower risk products like Construction Finance, Lease Rental Discounting, HFC, senior lending in CFG, etc.
Post-sanction Processes
As part of its constant asset monitoring efforts, the business has set up dedicated local teams in cities where it has investments. The local teams constantly assess the performance of each project from the time of its initial investment up to the Company’s exit or completion of such investment. Most importantly this helps the business continuously ‘cure’ its investments by proactively measuring actual progress versus underwriting assumptions and immediately react to any deviation, no matter how small, by taking a range of remedial measures such as increasing
62 | Piramal Enterprises Limited
security, modifying business plan, adopting a new marketing strategy, changing the sweep ratio of the designated escrow accounts or proactively seeking a refinance in some cases. This is the most important ingredient in maintaining a low incidence of Gross NPA ratio.
With corporate lending diversifying into multiple sectors be it renewables, logistics, auto-component, cement, packaging etc., the team also keeps track of key sectoral and regulatory trends. There are sectoral experts who not only help in investments but also in monitoring process.Some measures it adopts in respect of the asset monitoring include:
• Monthly/quarterly site visits to ascertain the physical progress of the project, the quality of the project and to estimate any potential cost overruns and potential delays. Site visit reports are prepared, which include details illustrating the number of labourers on the site, slabs casted approval status among others. Moreover, the reports contain the progress made in respect of each work stream over the course of each site visit;
• Monitoring monthly project escrow accounts and parameters like sales velocity, sales price, collections, and construction costs;
• Automated the monthly processes to ensure a robust and scalable platform;
• Setup an operations team for smooth operational functioning post RERA implementation;
• Monthly computation of cash cover to ensure adherence to minimum stipulated cash cover and to ascertain whether additional security is required; and
• Monthly ‘early warning Signal’ meetings to highlight cases which require management attention;
• Analysis of operating and financial parameters, to understand business performance. The performance is also cross-checked with any movement in credit ratings of the Company/group to analyse the off-us behaviour. In few cases, Board representation along with investment team is done to monitor the key decisions being undertaken at a strategic level.
The Asset Monitoring team also constantly loops in learnings based on existing data set to enhance the underwriting for new deals.
The risk team also periodically assesses the risk levels of its investment portfolio by measuring a project’s performance against certain factors including: sales velocity, pricing of the project, approval timelines, ability to meet principal and interest obligations and site visit findings. Depending on the results of such assessment, the portfolio may fall under one of four categories of performance: namely (i) as per business plan, (ii) closely monitor over next six months, (iii) stress envisaged over next six months or (iv) default. This allows the teams to map and monitor the portfolio risk levels and accordingly adjust overall exposure in each city or region/micro market.
Housing Finance
The Housing Finance vertical has put in place a robust framework for risk management. The responsibility of maintaining a high-quality portfolio is not just limited to the Risk Management team, but also is one of the key responsibility areas of the Sales team, whose performance incentives are linked to the quality of the portfolio.
Annual Report 2017-18 | 63
Managem
ent Discussion &
Analysis
Strategic Overview
Board &
Managem
ent ProfilesStatutory Reports
Financial Statements
The enterprise risk framework uses tech-enabled real-time data gathering. The Data and Analytics team have developed a risk assessment scorecard and tools that flag alerts for underwriters. Additionally, our in-house distribution arm, Brickex, provides high-quality market intelligence for underwriting transaction with realistic price and sales velocity data.
A proprietary credit policy framework, along with an early-warning signal framework, has been developed with insights from the credit bureau by the Data and Analytics team. As a part of its constant asset monitoring efforts, the business has set up a team that regularly meets with the developers and conducts regular site visits. The Company maintains independence amongst functions such as sales, risk, credit, collection and legal teams, which ensures that there are no biases. In addition, the Company consults external experts to independently assess the quality of the transactions, systems and process. These initiatives have helped minimise the incidence of NPAs.
The Company also has in place a cap in its portfolio that limits its exposure to a single property, programme and party.
Data and Analytics
The Company instituted the Data and Analytics team to extract deep and meaningful analysis of the data and is gradually being incorporated into key decisions across various functions. The Financial services business has benefitted from the use Data and Analytics.
During the year, the following initiatives were taken:
Piramal Housing Finance:
The power of data has been effectively used in estimating the possibility of loan defaults on every application received, thereby minimising any probable future Non-Performing Assets (NPAs).
The Data Analytics team has developed an automated proprietary fraud analytical rule engine that has strengthened the loan application screening process and has helped identify fraudulent applications. The engine scrutinises the applications that have been processed through an external database and matches the information in these applications with the Company’s internal data and other public domain information. The applications are scrutinised across 60 parameters and inconsistences are red-flagged. Only those applications that successfully pass the scrutiny move to the next level in the loan approval process.
Further, the team is in the process of implementing its first-generation Piramal credit risk model for retail to minimise risk and provide superior customer experience by improving the turnaround time for loan processing. Since Piramal Housing Finance is a new entrant in the sector, this level of insight is proving to be a game changer for the business.
Real Estate Developer Financing:
The team is developing an early-warning predictive model for asset monitoring in the wholesale business. This model will identify deals that could potentially go into stress in the next six months and minimise NPA risk, leveraging both the Company’s proprietary data as well as the rich external data sources. The team is also in the process of creating a developer worthiness scorecard, which will analyse the credit worthiness of developers for construction finance loans.
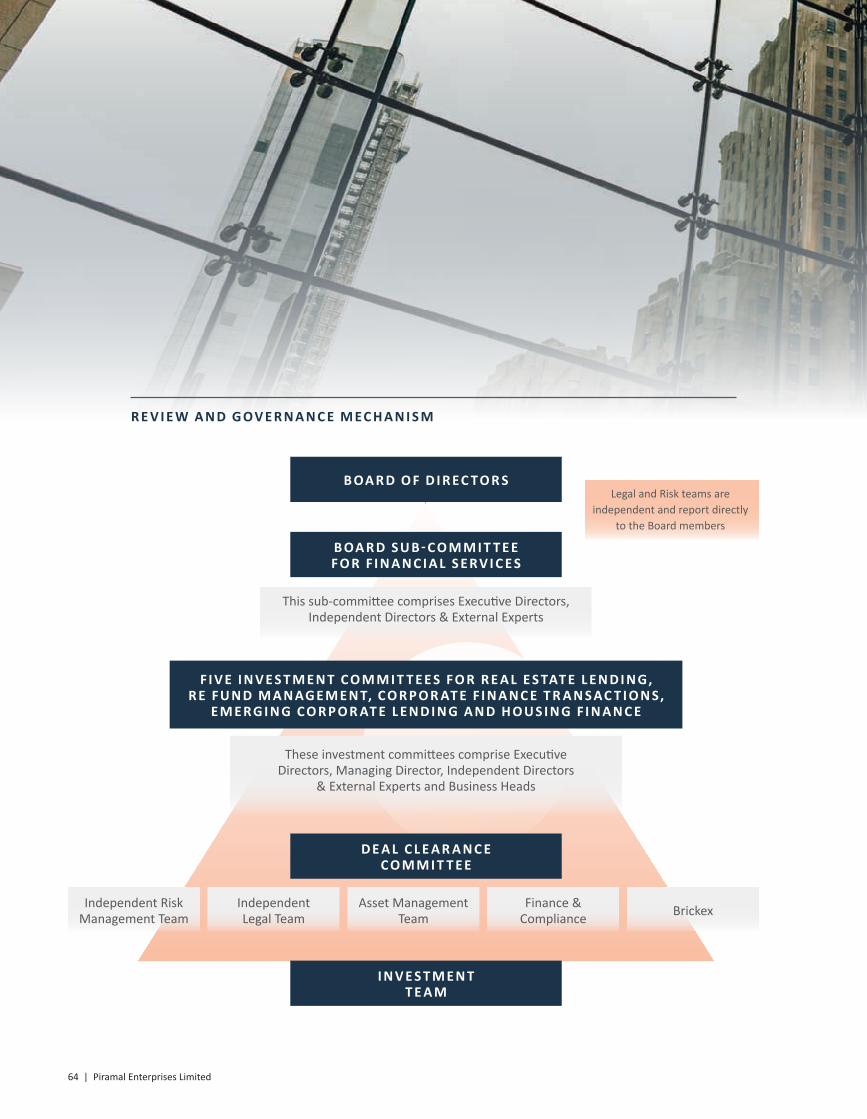
64 | Piramal Enterprises Limited
R E V I E W A N D G OV E R N A N C E M EC H A N I S M
B OA R D O F D I R EC TO R S
This sub-committee comprises Executive Directors, Independent Directors & External Experts
B OA R D S U B- C O M M I T T E E F O R F I N A N C I A L S E RV I C E S
Independent Risk Management Team
Independent Legal Team
Asset Management Team
Finance & Compliance Brickex
D E A L C L E A R A N C E C O M M I T T E E
I N V E S T M E N T T E A M
These investment committees comprise Executive Directors, Managing Director, Independent Directors
& External Experts and Business Heads
F I V E I N V E S T M E N T C O M M I T T E E S F O R R E A L E S TAT E L E N D I N G, R E FU N D M A N AG E M E N T, C O R P O R AT E F I N A N C E T R A N S AC T I O N S,
E M E RG I N G C O R P O R AT E L E N D I N G A N D H O U S I N G F I N A N C E
Legal and Risk teams are independent and report directly
to the Board members
Annual Report 2017-18 | 65
Managem
ent Discussion &
Analysis
Strategic Overview
Board &
Managem
ent ProfilesStatutory Reports
Financial Statements
F O C U S A R E A S O F K E Y FU N C T I O N S
Asset Management Team
• Regular Site Visits• Monitoring the project• Providing real time feedback• Micro-market analysis• Performance review• Ensuring adequate cash cover at
all time
Risk Management Team
• Independent and unbiased assessment of risk
• Provide insights using portfolio analytics
• Analyse and benchmark deal based on proprietary risk ratings model
• Recommended changes to enhance the Risk-Reward pay-off
Legal Team
• Identifying legal risks• Ensuring adequate mitigants• Transaction structuring &
compliance• Legal Checks and Balances• Due diligence and documentation• Legal recourse in the event of
default
Finance & Compliance Team
• Budgeting and forecasting• Continuous tracking of ROE• Proactive monitoring of overdue
accounts and exits• Audits, compliance & Internal controls• Co-investment and down selling
opportunities
Brickex
• Micro-market research to assist price and velocity assumptions
• Support developer in achieving sales velocity
• Sourcing new deals through wide channel partner network
• Supporting Retail Housing Finance
Technology Team
• End-to-end technology solutions• Reducing turnaround time• Centralised analytical capabilities• Standardisation and efficiency in
process• Streamline process

66 | Piramal Enterprises Limited
Global Pharma
—Over the years, PEL has established itself as one of the most recognised and respected names in the global
pharmaceutical industry. The Company has 13 development and manufacturing facilities located across North America,
the UK and India.
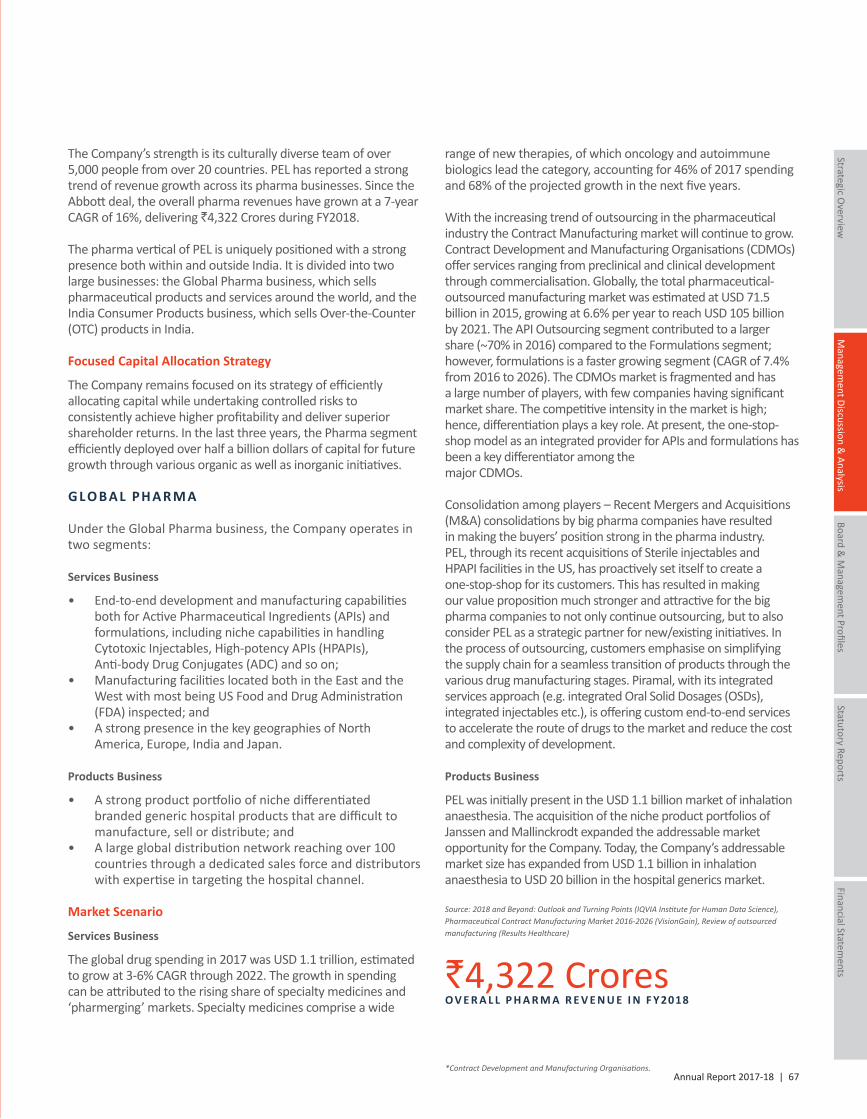
Annual Report 2017-18 | 67
Managem
ent Discussion &
Analysis
Strategic Overview
Board &
Managem
ent ProfilesStatutory Reports
Financial Statements
The Company’s strength is its culturally diverse team of over 5,000 people from over 20 countries. PEL has reported a strong trend of revenue growth across its pharma businesses. Since the Abbott deal, the overall pharma revenues have grown at a 7-year CAGR of 16%, delivering `4,322 Crores during FY2018.
The pharma vertical of PEL is uniquely positioned with a strong presence both within and outside India. It is divided into two large businesses: the Global Pharma business, which sells pharmaceutical products and services around the world, and the India Consumer Products business, which sells Over-the-Counter (OTC) products in India.
Focused Capital Allocation Strategy
The Company remains focused on its strategy of efficiently allocating capital while undertaking controlled risks to consistently achieve higher profitability and deliver superior shareholder returns. In the last three years, the Pharma segment efficiently deployed over half a billion dollars of capital for future growth through various organic as well as inorganic initiatives.
G L O B A L PH A R M A
Under the Global Pharma business, the Company operates in two segments:
Services Business
• End-to-end development and manufacturing capabilities both for Active Pharmaceutical Ingredients (APIs) and formulations, including niche capabilities in handling Cytotoxic Injectables, High-potency APIs (HPAPIs), Anti-body Drug Conjugates (ADC) and so on;
• Manufacturing facilities located both in the East and the West with most being US Food and Drug Administration (FDA) inspected; and
• A strong presence in the key geographies of North America, Europe, India and Japan.
Products Business
• A strong product portfolio of niche differentiated branded generic hospital products that are difficult to manufacture, sell or distribute; and
• A large global distribution network reaching over 100 countries through a dedicated sales force and distributors with expertise in targeting the hospital channel.
Market Scenario
Services Business
The global drug spending in 2017 was USD 1.1 trillion, estimated to grow at 3-6% CAGR through 2022. The growth in spending can be attributed to the rising share of specialty medicines and ‘pharmerging’ markets. Specialty medicines comprise a wide
range of new therapies, of which oncology and autoimmune biologics lead the category, accounting for 46% of 2017 spending and 68% of the projected growth in the next five years.
With the increasing trend of outsourcing in the pharmaceutical industry the Contract Manufacturing market will continue to grow. Contract Development and Manufacturing Organisations (CDMOs) offer services ranging from preclinical and clinical development through commercialisation. Globally, the total pharmaceutical-outsourced manufacturing market was estimated at USD 71.5 billion in 2015, growing at 6.6% per year to reach USD 105 billion by 2021. The API Outsourcing segment contributed to a larger share (~70% in 2016) compared to the Formulations segment; however, formulations is a faster growing segment (CAGR of 7.4% from 2016 to 2026). The CDMOs market is fragmented and has a large number of players, with few companies having significant market share. The competitive intensity in the market is high; hence, differentiation plays a key role. At present, the one-stop-shop model as an integrated provider for APIs and formulations has been a key differentiator among the major CDMOs.
Consolidation among players – Recent Mergers and Acquisitions (M&A) consolidations by big pharma companies have resulted in making the buyers’ position strong in the pharma industry. PEL, through its recent acquisitions of Sterile injectables and HPAPI facilities in the US, has proactively set itself to create a one-stop-shop for its customers. This has resulted in making our value proposition much stronger and attractive for the big pharma companies to not only continue outsourcing, but to also consider PEL as a strategic partner for new/existing initiatives. In the process of outsourcing, customers emphasise on simplifying the supply chain for a seamless transition of products through the various drug manufacturing stages. Piramal, with its integrated services approach (e.g. integrated Oral Solid Dosages (OSDs), integrated injectables etc.), is offering custom end-to-end services to accelerate the route of drugs to the market and reduce the cost and complexity of development.
Products Business
PEL was initially present in the USD 1.1 billion market of inhalation anaesthesia. The acquisition of the niche product portfolios of Janssen and Mallinckrodt expanded the addressable market opportunity for the Company. Today, the Company’s addressable market size has expanded from USD 1.1 billion in inhalation anaesthesia to USD 20 billion in the hospital generics market.
Source: 2018 and Beyond: Outlook and Turning Points (IQVIA Institute for Human Data Science), Pharmaceutical Contract Manufacturing Market 2016-2026 (VisionGain), Review of outsourced manufacturing (Results Healthcare)
*Contract Development and Manufacturing Organisations.
`4,322 CroresO V E R A L L P H A R M A R E V E N U E I N F Y 2018
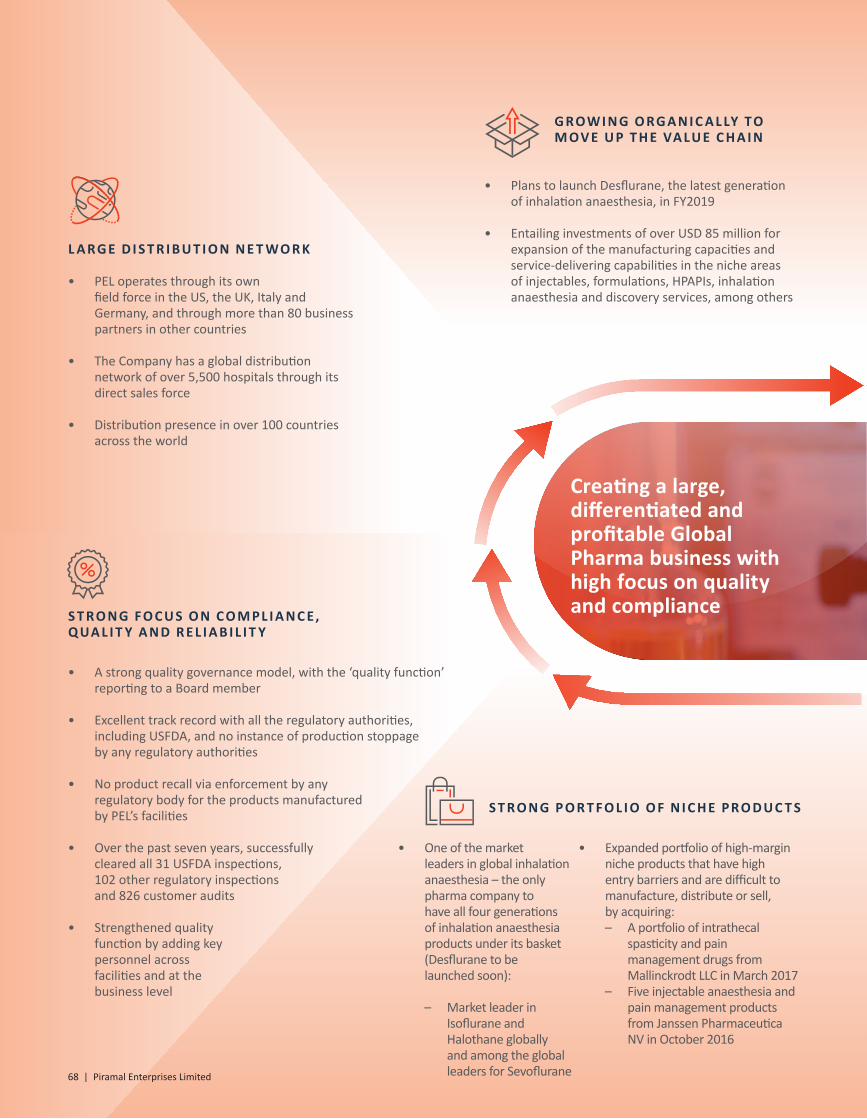
S T R O N G P O R T F O L I O O F N I C H E PR O D U C T S
L A RG E D I S T R I B U T I O N N E T WO R K
• PEL operates through its own field force in the US, the UK, Italy and Germany, and through more than 80 business partners in other countries
• The Company has a global distribution network of over 5,500 hospitals through its direct sales force
• Distribution presence in over 100 countries across the world
G R OW I N G O RG A N I C A L LY TO M OV E U P T H E VA LU E C H A I N
• Plans to launch Desflurane, the latest generation of inhalation anaesthesia, in FY2019
• Entailing investments of over USD 85 million for expansion of the manufacturing capacities and service-delivering capabilities in the niche areas of injectables, formulations, HPAPIs, inhalation anaesthesia and discovery services, among others
• One of the market leaders in global inhalation anaesthesia – the only pharma company to have all four generations of inhalation anaesthesia products under its basket (Desflurane to be launched soon):
– Market leader in Isoflurane and Halothane globally and among the global leaders for Sevoflurane
• Expanded portfolio of high-margin niche products that have high entry barriers and are difficult to manufacture, distribute or sell, by acquiring:
– A portfolio of intrathecal spasticity and pain management drugs from Mallinckrodt LLC in March 2017
– Five injectable anaesthesia and pain management products from Janssen Pharmaceutica NV in October 2016
S T R O N G F O C U S O N C O M PL I A N C E, Q UA L I T Y A N D R E L I A B I L I T Y
• A strong quality governance model, with the ‘quality function’ reporting to a Board member
• Excellent track record with all the regulatory authorities, including USFDA, and no instance of production stoppage by any regulatory authorities
• No product recall via enforcement by any regulatory body for the products manufactured by PEL’s facilities
• Over the past seven years, successfully cleared all 31 USFDA inspections, 102 other regulatory inspections and 826 customer audits
• Strengthened quality function by adding key personnel across facilities and at the business level
68 | Piramal Enterprises Limited
Creating a large, differentiated and profitable Global Pharma business with high focus on quality and compliance
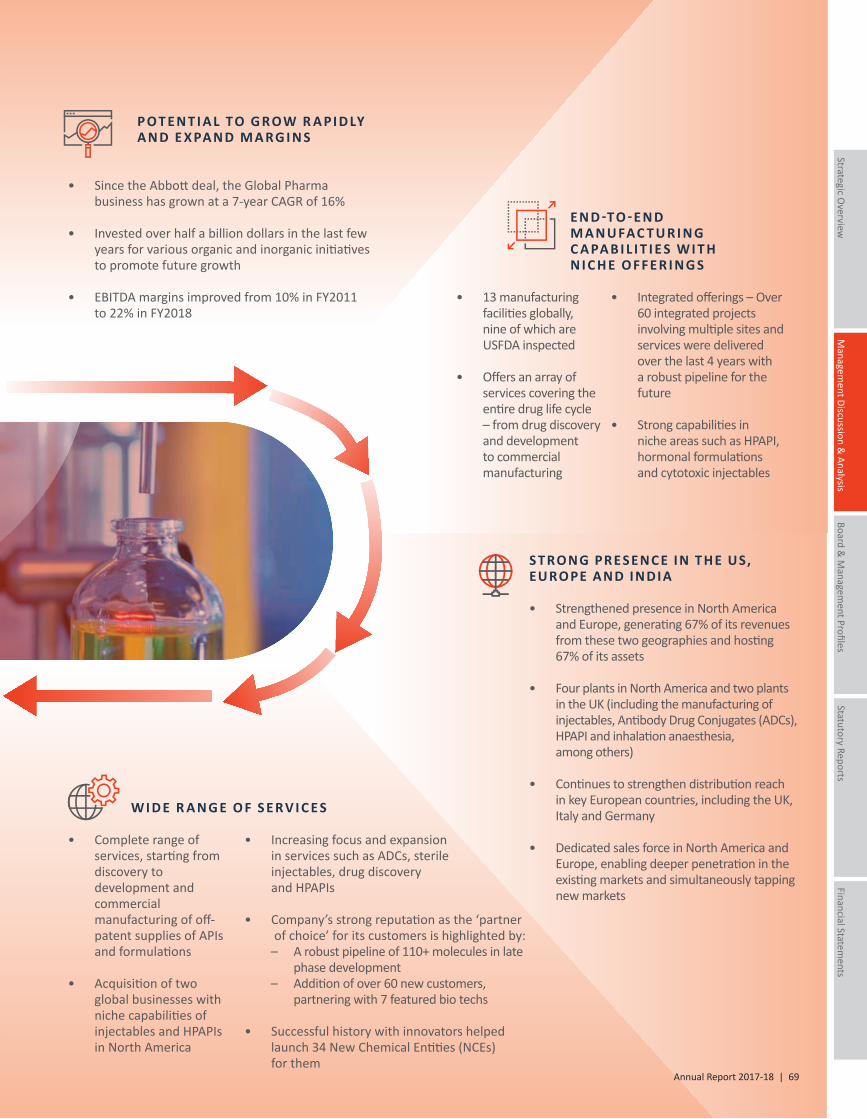
Managem
ent Discussion &
Analysis
Strategic Overview
Board &
Managem
ent ProfilesStatutory Reports
Financial Statements
W I D E R A N G E O F S E RV I C E S
P O T E N T I A L TO G R OW R A PI D LY A N D E X PA N D M A RG I N S
S T RO NG PRE S ENC E IN T HE US, EURO PE AND INDIA
• Strengthened presence in North America and Europe, generating 67% of its revenues from these two geographies and hosting 67% of its assets
• Four plants in North America and two plants in the UK (including the manufacturing of injectables, Antibody Drug Conjugates (ADCs), HPAPI and inhalation anaesthesia, among others)
• Continues to strengthen distribution reach in key European countries, including the UK, Italy and Germany
• Dedicated sales force in North America and Europe, enabling deeper penetration in the existing markets and simultaneously tapping new markets
• 13 manufacturing facilities globally, nine of which are USFDA inspected
• Offers an array of services covering the entire drug life cycle – from drug discovery and development to commercial manufacturing
• Integrated offerings – Over 60 integrated projects involving multiple sites and services were delivered over the last 4 years with a robust pipeline for the future
• Strong capabilities in niche areas such as HPAPI, hormonal formulations and cytotoxic injectables
• Since the Abbott deal, the Global Pharma business has grown at a 7-year CAGR of 16%
• Invested over half a billion dollars in the last few years for various organic and inorganic initiatives to promote future growth
• EBITDA margins improved from 10% in FY2011 to 22% in FY2018
Annual Report 2017-18 | 69
• Complete range of services, starting from discovery to development and commercial manufacturing of off-patent supplies of APIs and formulations
• Acquisition of two global businesses with niche capabilities of injectables and HPAPIs in North America
• Increasing focus and expansion in services such as ADCs, sterile injectables, drug discovery and HPAPIs
• Company’s strong reputation as the ‘partner of choice’ for its customers is highlighted by:
– A robust pipeline of 110+ molecules in late phase development
– Addition of over 60 new customers, partnering with 7 featured bio techs
• Successful history with innovators helped launch 34 New Chemical Entities (NCEs) for them
E N D -TO - E N D M A N U FAC T U R I N G C A PA B I L I T I E S W I T H N I C H E O FFE R I N G S
70 | Piramal Enterprises Limited
KEY INDUSTRY CHALLENGES PEL’S WAY TO DEAL WITH THE CHALLENGES
Regulatory and Compliance Issues Impacting Generic Companies and CDMOs
Generic Drugs Pricing Pressure
With an excellent quality and compliance track record, the Company has been able to grow well in both the Global Pharma Services and Global Pharma Products businesses.
Our choice of the hospital segment and within that our portfolio of products with ‘complexities’ results in lower competition which in turn enables us to experience less intense pricing pressure than the broader generics market.
Integrated offerings and a niche product portfolio
In today’s pharmaceutical industry, innovation and speed-to-market are more critical than ever. Owing to the increasing focus on targeted delivery, niche therapy areas and complexity of drug molecules, pharma companies are forming strategic relationships with CDMOs.
PEL’s Global Services business has undergone a remarkable evolution in the past few years as it pursued its goal of evolving into an integrated service provider for customers across the globe. PEL offers a multitude of services spanning the entire drug life cycle, from drug discovery and development, manufacturing and packaging of clinical trial supplies to commercial manufacturing of APIs and finished dosage forms from our global network of 12 development and manufacturing facilities located in North America, Europe and Asia.
The Company offers a fully-integrated global supply chain, with access to scientific expertise, state-of-the-art technology and modern manufacturing capabilities, along with the experience of working with various global regulatory authorities.
In the area of oncology, the Company has established global leadership as a preferred integrated partner. It can provide end-to-end solutions through the ADC conjugation and the fill finish between its facilities in Europe and North America. Through the recent acquisition of the Ash Stevens high-potency drug substance development and manufacturing facility in Michigan, PEL expects to also supply the active ingredient for the ADC conjugation, thereby completing the integrated supply chain.
PEL’s leading capabilities in both drug substance and drug product development and manufacturing, focus on customer centricity, a stellar record in quality and compliance and a seamless blend of diverse geographic offerings have resulted in over 60 successful integrated projects over the last three to four years. PEL is now a ‘partner of choice’ for large pharmaceuticals and virtual biotech companies in North America, Europe and Japan.
“Pharma Solutions continues to be the 'Partner of Choice' for global pharmaceutical companies as we work alongside to mutually serve patients. We continue to invest in capacities and capabilities across our sites, gearing up for future demand from our customers’ development pipeline and commercial portfolio. I strongly believe that our integrated platform of services, passion to delight customers, robust quality track record and a committed team will continue to positively impact shareholders and create more value for our investors in the years to come.”
V I V E K S H A R M A CEO, Piramal Pharma Solutions
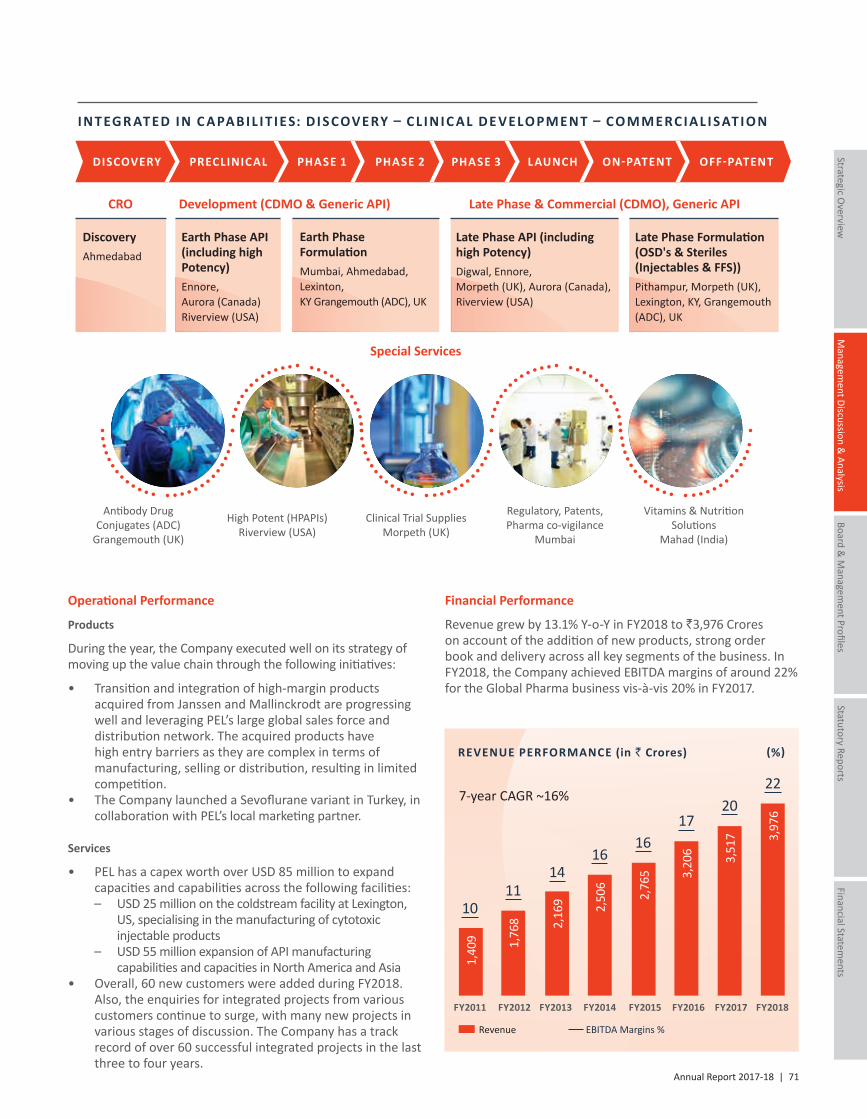
Annual Report 2017-18 | 71
Managem
ent Discussion &
Analysis
Strategic Overview
Board &
Managem
ent ProfilesStatutory Reports
Financial Statements
Operational Performance
Products
During the year, the Company executed well on its strategy of moving up the value chain through the following initiatives:
• Transition and integration of high-margin products acquired from Janssen and Mallinckrodt are progressing well and leveraging PEL’s large global sales force and distribution network. The acquired products have high entry barriers as they are complex in terms of manufacturing, selling or distribution, resulting in limited competition.
• The Company launched a Sevoflurane variant in Turkey, in collaboration with PEL’s local marketing partner.
Services
• PEL has a capex worth over USD 85 million to expand capacities and capabilities across the following facilities:
– USD 25 million on the coldstream facility at Lexington, US, specialising in the manufacturing of cytotoxic injectable products
– USD 55 million expansion of API manufacturing capabilities and capacities in North America and Asia
• Overall, 60 new customers were added during FY2018. Also, the enquiries for integrated projects from various customers continue to surge, with many new projects in various stages of discussion. The Company has a track record of over 60 successful integrated projects in the last three to four years.
REVENUE PERFORMANCE (in ` Crores) (%)
7-year CAGR ~16%
FY2011 FY2012 FY2013 FY2014 FY2015 FY2016 FY2017 FY2018
2,50
6
1,40
9
2,76
5
1,76
8
3,20
6
2,16
9
3,51
7 3,97
6
Revenue EBITDA Margins %
1011
1416
1617
2022
Financial Performance
Revenue grew by 13.1% Y-o-Y in FY2018 to `3,976 Crores on account of the addition of new products, strong order book and delivery across all key segments of the business. In FY2018, the Company achieved EBITDA margins of around 22% for the Global Pharma business vis-à-vis 20% in FY2017.
IN T EGR AT ED IN C APABIL I T IE S: D I S COVERY – C L INIC AL DE VELO PMEN T – CO MMERC IAL I SAT I O N
Antibody Drug Conjugates (ADC)
Grangemouth (UK)
High Potent (HPAPIs) Riverview (USA)
Clinical Trial Supplies Morpeth (UK)
Regulatory, Patents, Pharma co-vigilance
Mumbai
Vitamins & Nutrition Solutions
Mahad (India)
DISCOVERY PRECLINICAL PHASE 1 PHASE 2 PHASE 3 LAUNCH ON-PATENT OFF-PATENT
Special Services
Late Phase & Commercial (CDMO), Generic APIDevelopment (CDMO & Generic API)
DiscoveryAhmedabad
CRO
Earth Phase API (including high Potency)Ennore, Aurora (Canada)Riverview (USA)
Earth Phase FormulationMumbai, Ahmedabad,Lexinton, KY Grangemouth (ADC), UK
Late Phase API (including high Potency)Digwal, Ennore,Morpeth (UK), Aurora (Canada),Riverview (USA)
Late Phase Formulation (OSD's & Steriles (Injectables & FFS))Pithampur, Morpeth (UK), Lexington, KY, Grangemouth (ADC), UK
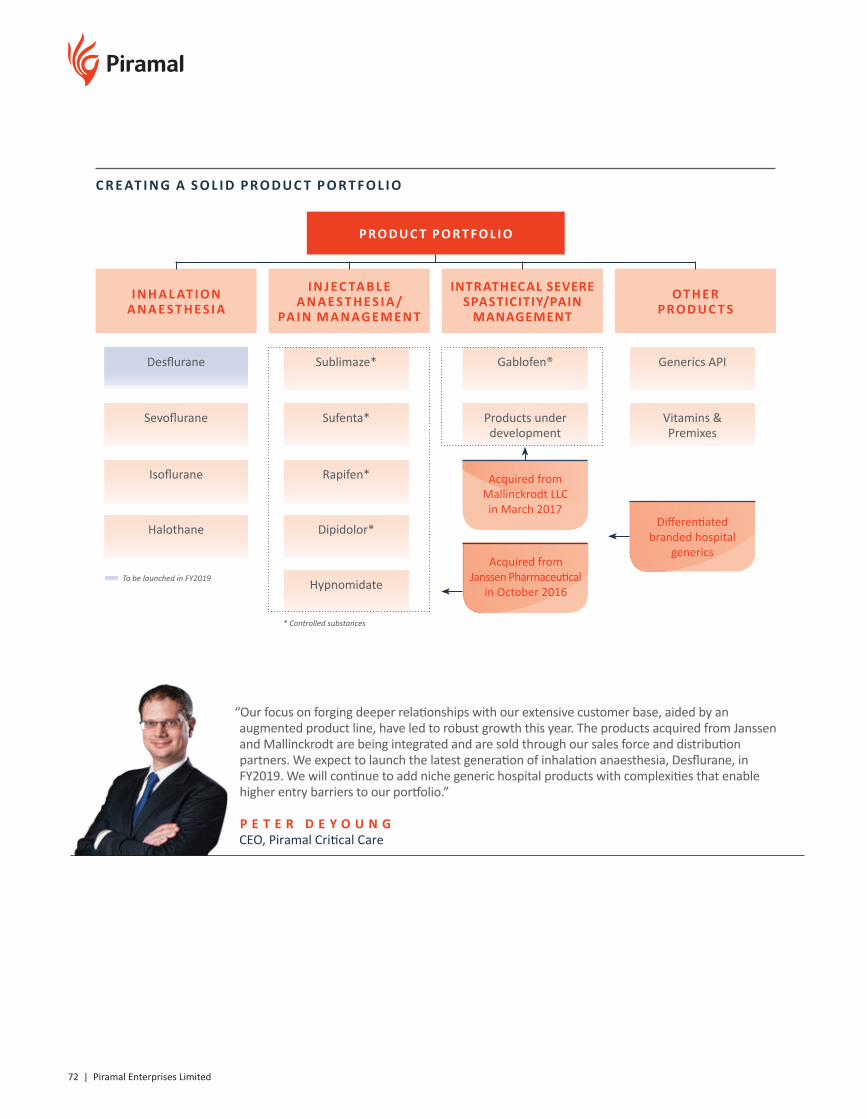
72 | Piramal Enterprises Limited
“Our focus on forging deeper relationships with our extensive customer base, aided by an augmented product line, have led to robust growth this year. The products acquired from Janssen and Mallinckrodt are being integrated and are sold through our sales force and distribution partners. We expect to launch the latest generation of inhalation anaesthesia, Desflurane, in FY2019. We will continue to add niche generic hospital products with complexities that enable higher entry barriers to our portfolio.”
P E T E R D E Y O U N G CEO, Piramal Critical Care
C R E AT I N G A S O L I D PR O D U C T P O R T F O L I O
P R O D U C T P O R T F O L I O
I N H A L AT I O N A N A E S T H E S I A
I N J EC TA B L E A N A E S T H E S I A /
PA I N M A N AG E M E N T
INTRATHECAL SEVERE SPASTICITIY/PAIN
MANAGEMENT
O T H E R P R O D U C T S
Desflurane Sublimaze* Gablofen® Generics API
Sevoflurane Sufenta* Products under development
Vitamins & Premixes
Isoflurane
Halothane
Rapifen*
Dipidolor*
Hypnomidate
Acquired from Mallinckrodt LLC in March 2017
Acquired from Janssen Pharmaceutical
in October 2016
Differentiated branded hospital
generics
* Controlled substances
To be launched in FY2019
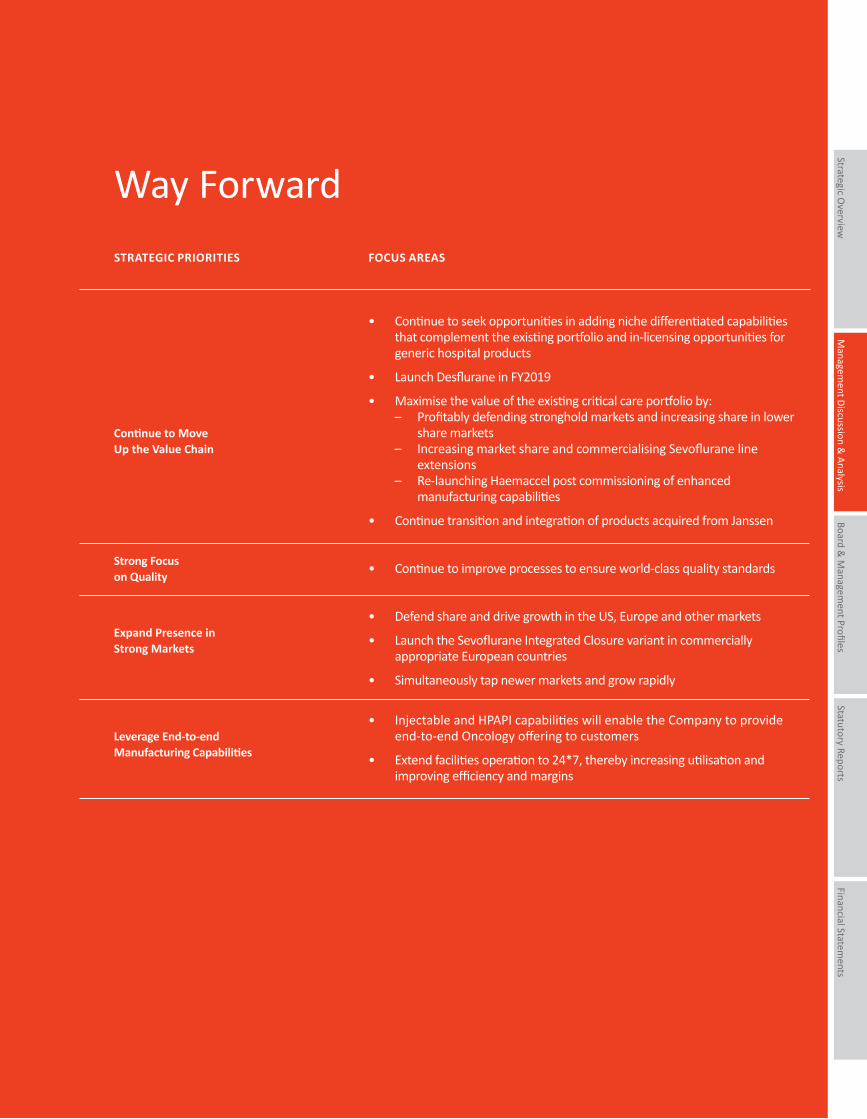
Managem
ent Discussion &
Analysis
Strategic Overview
Board &
Managem
ent ProfilesStatutory Reports
Financial Statements
Way Forward
STRATEGIC PRIORITIES FOCUS AREAS
Continue to Move Up the Value Chain
Strong Focus on Quality
Expand Presence in Strong Markets
Leverage End-to-end Manufacturing Capabilities
• Continue to seek opportunities in adding niche differentiated capabilities that complement the existing portfolio and in-licensing opportunities for generic hospital products
• Launch Desflurane in FY2019
• Maximise the value of the existing critical care portfolio by: – Profitably defending stronghold markets and increasing share in lower
share markets – Increasing market share and commercialising Sevoflurane line
extensions – Re-launching Haemaccel post commissioning of enhanced
manufacturing capabilities
• Continue transition and integration of products acquired from Janssen
• Continue to improve processes to ensure world-class quality standards
• Defend share and drive growth in the US, Europe and other markets
• Launch the Sevoflurane Integrated Closure variant in commercially appropriate European countries
• Simultaneously tap newer markets and grow rapidly
• Injectable and HPAPI capabilities will enable the Company to provide end-to-end Oncology offering to customers
• Extend facilities operation to 24*7, thereby increasing utilisation and improving efficiency and margins
74 | Piramal Enterprises Limited
Quality
QUALITY AS A CULTURE ACROSS THE ORGANISATION
At PEL, quality is viewed as an integral part of the Company’s identity. PEL employs the concept of ‘Global Vision, Local Execution’, which enables each site to customise the customer experience for their locations while incorporating the Company’s global standards for quality.
Over the years, PEL has built an exemplary quality framework that is implemented at 13 manufacturing facilities over three continents, as well as at several contract manufacturing operations from where its products are outsourced. The quality architecture ensures that the Company is both ahead of its competition and has a differentiator that is attractive to customers looking for preferred partners with strong regulatory credentials.
In FY2018, the Company continued to strengthen its quality function by adding key personnel with significant industry experience – across various facilities and overall at the business level. PEL also opened a new office in London, UK, that can handle quality for all its global pharma products, including the controlled drug products obtained from Janssen through acquisition. This office is staffed with quality professionals who can support the European regulation and the business’s new focus on sterile injectable products.
STAYING AHEAD OF REGULATORY REQUIREMENTS
The dynamic regulatory landscape, coupled with greater scrutiny by regulatory authorities, has been a key challenge for a number of pharmaceutical manufacturers. Over the past seven years, the Company has had an excellent track record and cleared 31 USFDA audits, 102 other regulatory inspections and 826 customer inspections. PEL firmly believes that quality should not be limited to inspection clearance and product approvals. It considers patient safety as a key driver for quality.
RISK MITIGATION STRATEGIES
PEL’s quality team has developed a number of proprietary tools for quality health evaluation and
risk minimisation for its various sites. These tools are used within the organisation for quality focus and risk avoidance at the site level. Some of the Company’s proprietary tools include:
• Measuring the quality health of sites and predicting inspection readiness
• Determining compliance against data integrity guidance
• Audit Readiness Scorecard – assesses the probable outcome of regulatory inspections at a site
• Due diligence, transition and integration of acquisitions (sites and products)
• Site-based quality metrics towards sustenance and continuous improvement
QUALITY GOVERNANCE
A strong governance and escalation mechanism is the foundation of PEL’s quality management fabric. The Company’s quality management system is independent of its businesses and reports directly to the Board. This autonomy in the quality organisation ensures that business pressures do not dictate quality standards. IDEATE is an initiative that serves as a guide to building a sustainable governance model at PEL. IDEATE stands for:
• Invest in an experienced quality team • Drive a robust escalation matrix that expedites
quality issues to the management• Empowered and autonomous quality function• Align with quality (as) business strategy• Treat quality and integrity as PEL's core culture
and values• Evolved quality management systems as per
best-in-class practices
SUMMARY
At PEL, quality is a collective responsibility and is woven into the foundation of the organisation. The Company is on a quality advancement journey from 'Quality for Compliance' to 'Quality as a Culture', with a focus on systems, processes and people.
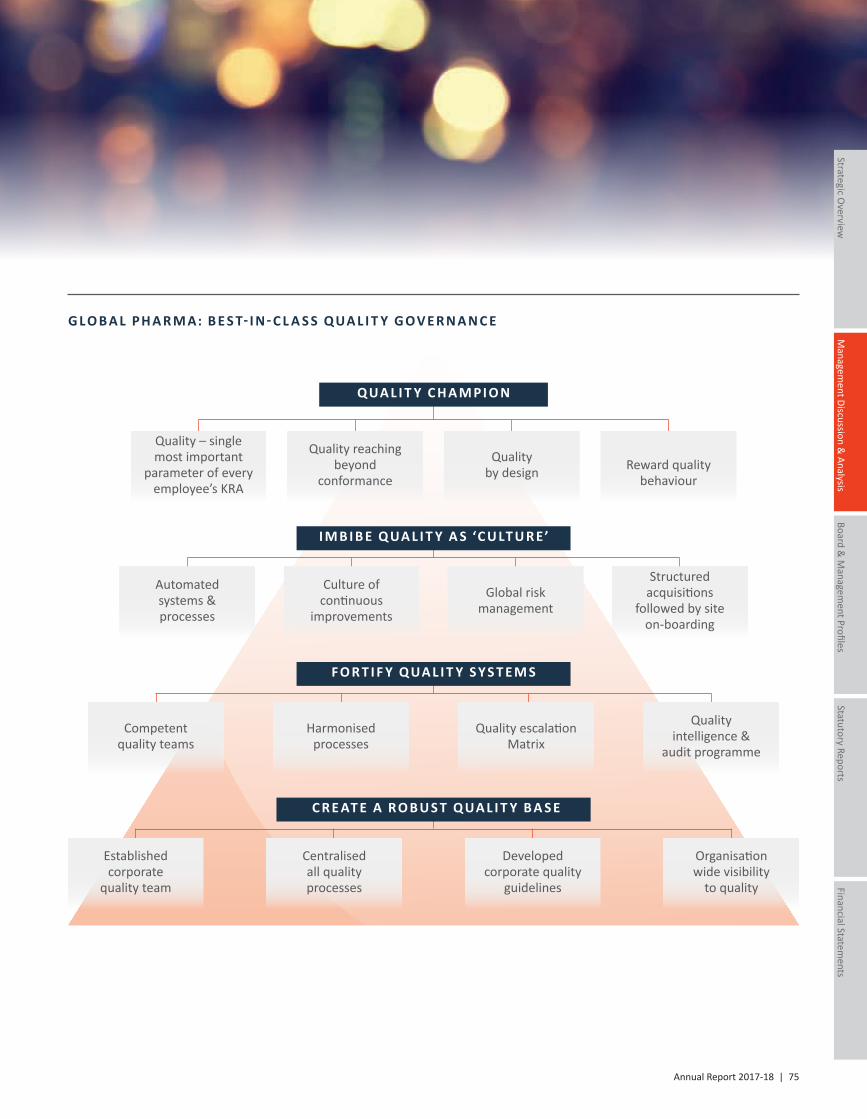
Annual Report 2017-18 | 75
Managem
ent Discussion &
Analysis
Strategic Overview
Board &
Managem
ent ProfilesStatutory Reports
Financial Statements
G L O B A L PH A R M A: B E S T- I N- C L A S S Q UA L I T Y G OV E R N A N C E
Quality by design
Quality – single most important
parameter of every employee’s KRA
Reward quality behaviour
Quality reaching beyond
conformance
Global risk management
Automated systems & processes
Structured acquisitions
followed by site on-boarding
Culture of continuous
improvements
Quality escalationMatrix
Competent quality teams
Quality intelligence &
audit programme
Harmonised processes
Developed corporate quality
guidelines
Established corporate
quality team
Organisation wide visibility
to quality
Centralised all quality processes
Q UA L I T Y C H A M PI O N
C R E AT E A R O B U S T Q UA L I T Y B A S E
F O R T I F Y Q UA L I T Y S Y S T E M S
I M B I B E Q UA L I T Y A S ‘C U LT U R E’
76 | Piramal Enterprises Limited
India ConsumerProducts
—PEL’s India Consumer Products portfolio comprises 18 brands with offerings spanning across multiple categories. It aims to be among the top three over-
the-counter (OTC) product companies in India by 2020.
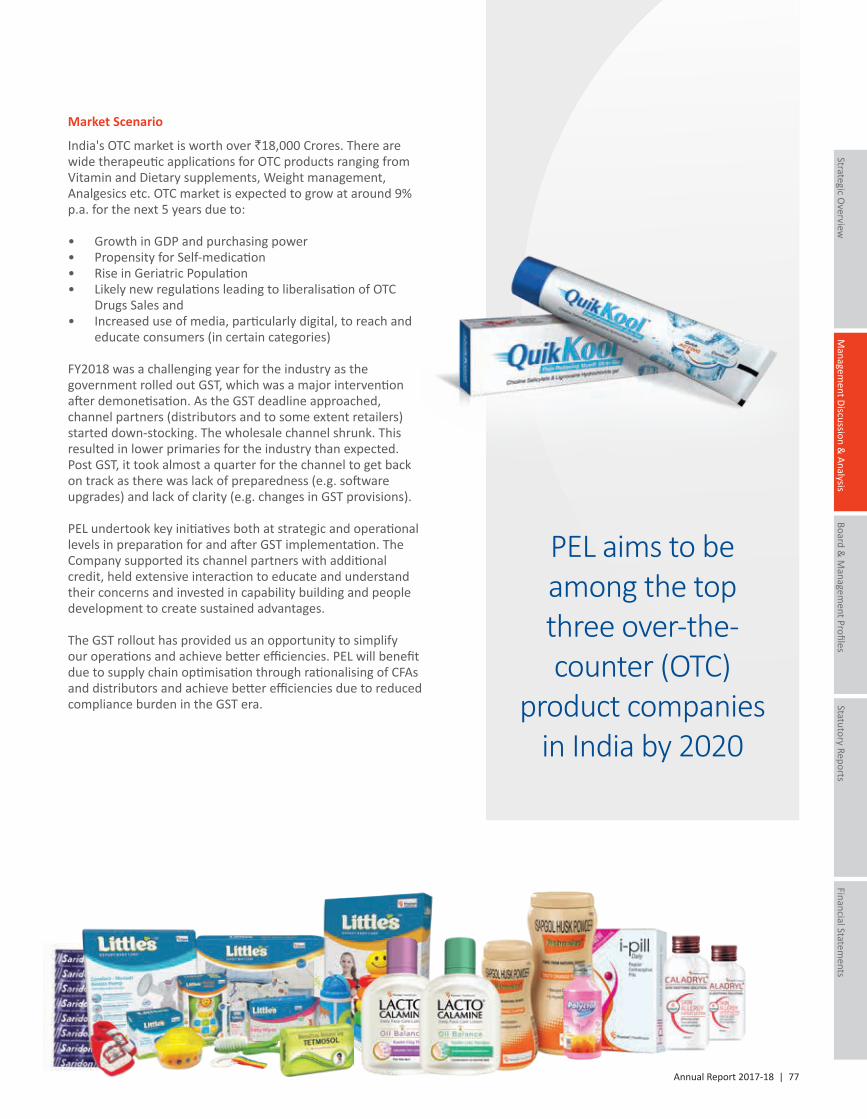
Annual Report 2017-18 | 77
Managem
ent Discussion &
Analysis
Strategic Overview
Board &
Managem
ent ProfilesStatutory Reports
Financial Statements
Market Scenario
India's OTC market is worth over `18,000 Crores. There are wide therapeutic applications for OTC products ranging from Vitamin and Dietary supplements, Weight management, Analgesics etc. OTC market is expected to grow at around 9% p.a. for the next 5 years due to:
• Growth in GDP and purchasing power• Propensity for Self-medication• Rise in Geriatric Population• Likely new regulations leading to liberalisation of OTC
Drugs Sales and • Increased use of media, particularly digital, to reach and
educate consumers (in certain categories)
FY2018 was a challenging year for the industry as the government rolled out GST, which was a major intervention after demonetisation. As the GST deadline approached, channel partners (distributors and to some extent retailers) started down-stocking. The wholesale channel shrunk. This resulted in lower primaries for the industry than expected. Post GST, it took almost a quarter for the channel to get back on track as there was lack of preparedness (e.g. software upgrades) and lack of clarity (e.g. changes in GST provisions).
PEL undertook key initiatives both at strategic and operational levels in preparation for and after GST implementation. The Company supported its channel partners with additional credit, held extensive interaction to educate and understand their concerns and invested in capability building and people development to create sustained advantages.
The GST rollout has provided us an opportunity to simplify our operations and achieve better efficiencies. PEL will benefit due to supply chain optimisation through rationalising of CFAs and distributors and achieve better efficiencies due to reduced compliance burden in the GST era.
PEL aims to be among the top three over-the-counter (OTC)
product companies in India by 2020
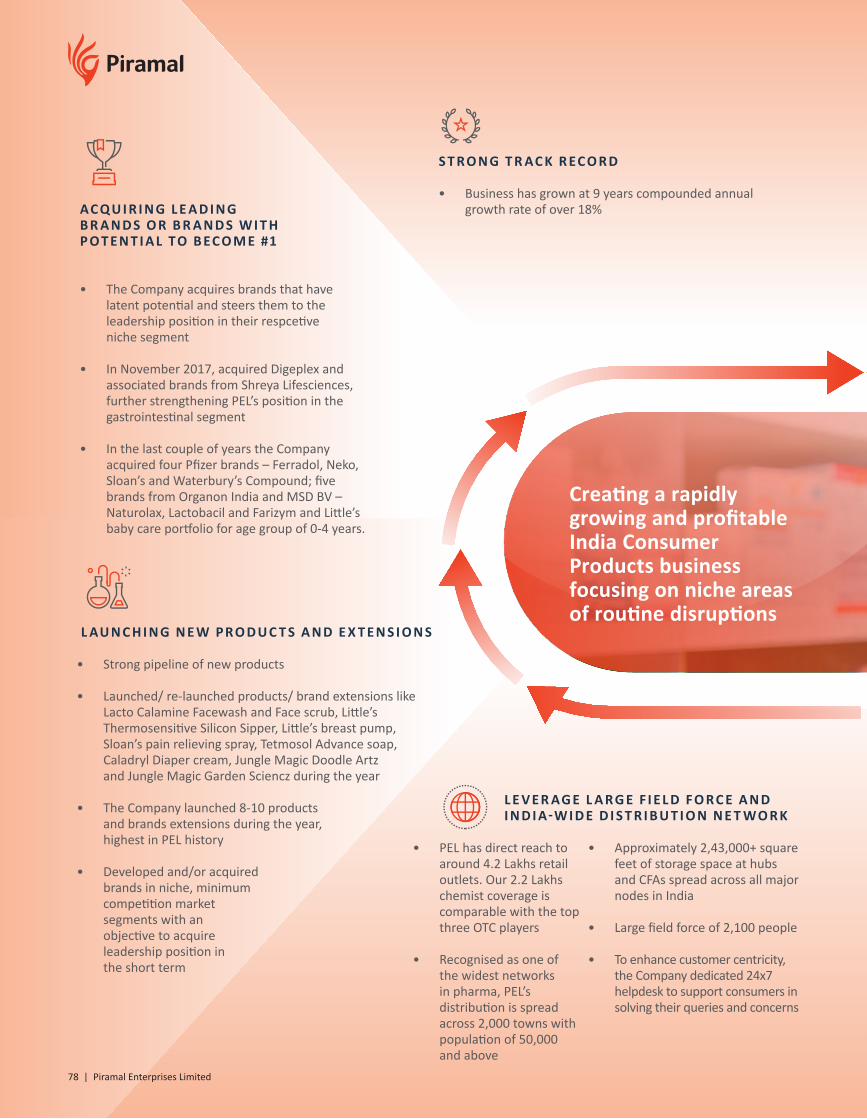
AC Q U I R I N G L E A D I N G B R A N D S O R B R A N D S W I T H P O T E N T I A L TO B EC O M E #1
• The Company acquires brands that have latent potential and steers them to the leadership position in their respcetive niche segment
• In November 2017, acquired Digeplex and associated brands from Shreya Lifesciences, further strengthening PEL’s position in the gastrointestinal segment
• In the last couple of years the Company acquired four Pfizer brands – Ferradol, Neko, Sloan’s and Waterbury’s Compound; five brands from Organon India and MSD BV – Naturolax, Lactobacil and Farizym and Little’s baby care portfolio for age group of 0-4 years.
S T R O N G T R AC K R EC O R D
• Business has grown at 9 years compounded annual growth rate of over 18%
L AU N C H I N G N E W PR O D U C T S A N D E X T E N S I O N S
• Strong pipeline of new products
• Launched/ re-launched products/ brand extensions like Lacto Calamine Facewash and Face scrub, Little’s Thermosensitive Silicon Sipper, Little’s breast pump, Sloan’s pain relieving spray, Tetmosol Advance soap, Caladryl Diaper cream, Jungle Magic Doodle Artz and Jungle Magic Garden Sciencz during the year
• The Company launched 8-10 products and brands extensions during the year, highest in PEL history
• Developed and/or acquired brands in niche, minimum competition market segments with an objective to acquire leadership position in the short term
L E V E R AG E L A RG E F I E L D F O R C E A N D I N D I A-W I D E D I S T R I B U T I O N N E T WO R K
• PEL has direct reach to around 4.2 Lakhs retail outlets. Our 2.2 Lakhs chemist coverage is comparable with the top three OTC players
• Recognised as one of the widest networks in pharma, PEL’s distribution is spread across 2,000 towns with population of 50,000 and above
• Approximately 2,43,000+ square feet of storage space at hubs and CFAs spread across all major nodes in India
• Large field force of 2,100 people
• To enhance customer centricity, the Company dedicated 24x7 helpdesk to support consumers in solving their queries and concerns
Creating a rapidly growing and profitable India Consumer Products business focusing on niche areas of routine disruptions
78 | Piramal Enterprises Limited
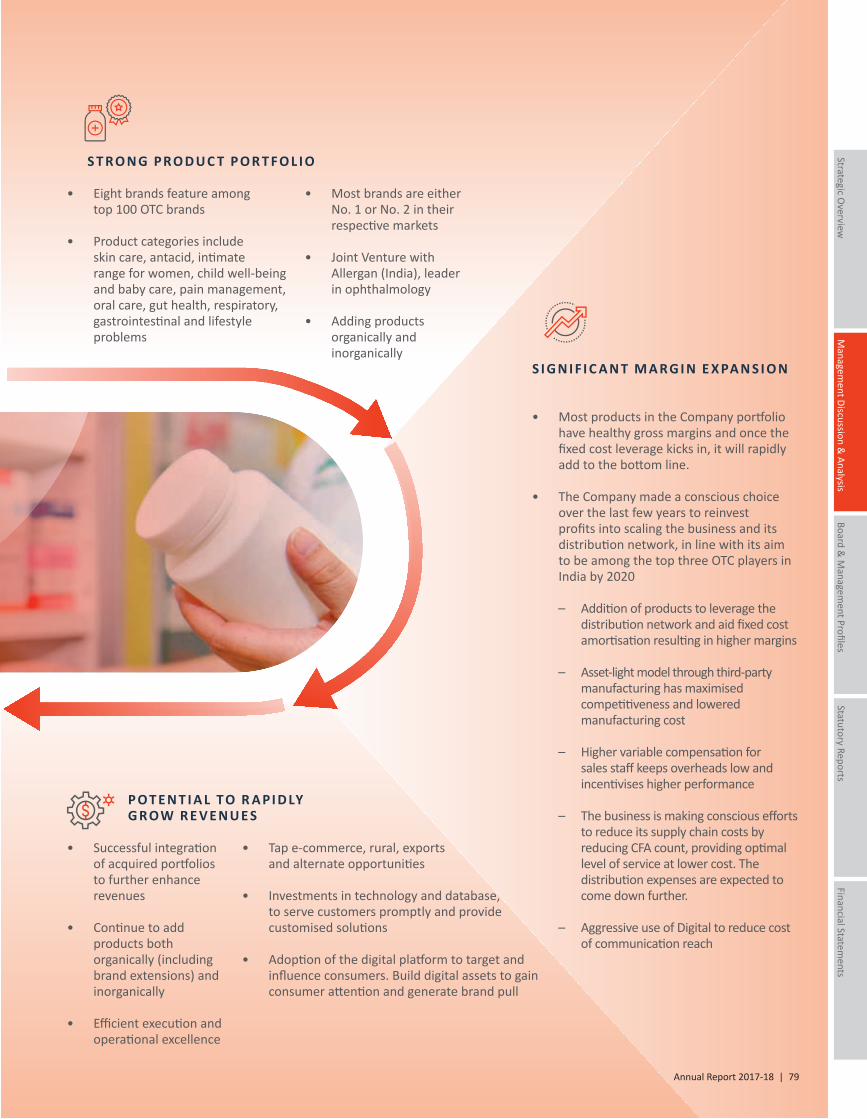
Managem
ent Discussion &
Analysis
Strategic Overview
Board &
Managem
ent ProfilesStatutory Reports
Financial Statements
S I G N I F I C A N T M A RG I N E X PA N S I O N
• Most products in the Company portfolio have healthy gross margins and once the fixed cost leverage kicks in, it will rapidly add to the bottom line.
• The Company made a conscious choice over the last few years to reinvest profits into scaling the business and its distribution network, in line with its aim to be among the top three OTC players in India by 2020
– Addition of products to leverage the distribution network and aid fixed cost amortisation resulting in higher margins
– Asset-light model through third-party manufacturing has maximised competitiveness and lowered manufacturing cost
– Higher variable compensation for sales staff keeps overheads low and incentivises higher performance
– The business is making conscious efforts to reduce its supply chain costs by reducing CFA count, providing optimal level of service at lower cost. The distribution expenses are expected to come down further.
– Aggressive use of Digital to reduce cost of communication reach
P O T E N T I A L TO R A PI D LYG R OW R E V E N U E S
S T R O N G PR O D U C T P O R T F O L I O
• Successful integration of acquired portfolios to further enhance revenues
• Continue to add products both organically (including brand extensions) and inorganically
• Efficient execution and operational excellence
• Eight brands feature among top 100 OTC brands
• Product categories include skin care, antacid, intimate range for women, child well-being and baby care, pain management, oral care, gut health, respiratory, gastrointestinal and lifestyle problems
• Tap e-commerce, rural, exports and alternate opportunities
• Investments in technology and database, to serve customers promptly and provide customised solutions
• Adoption of the digital platform to target and influence consumers. Build digital assets to gain consumer attention and generate brand pull
• Most brands are either No. 1 or No. 2 in their respective markets
• Joint Venture with Allergan (India), leader in ophthalmology
• Adding products organically and inorganically
Annual Report 2017-18 | 79
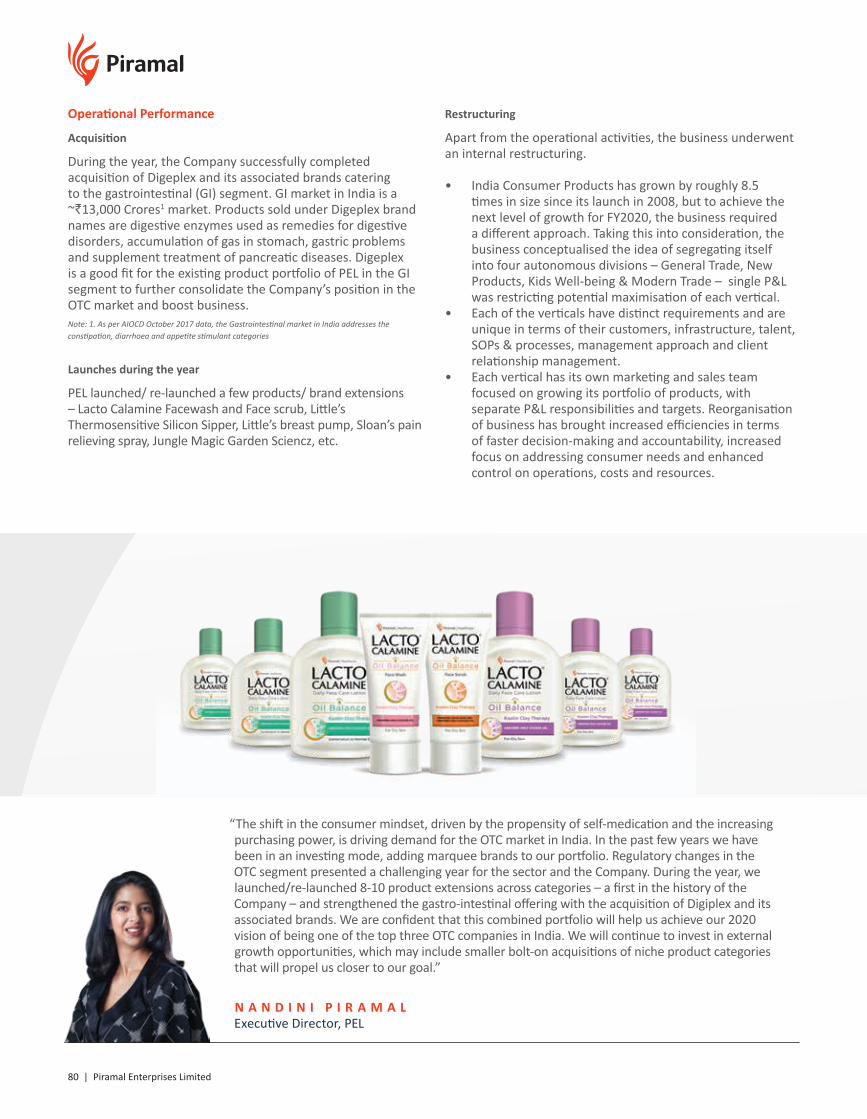
80 | Piramal Enterprises Limited
Operational Performance
Acquisition
During the year, the Company successfully completed acquisition of Digeplex and its associated brands catering to the gastrointestinal (GI) segment. GI market in India is a ~`13,000 Crores1 market. Products sold under Digeplex brand names are digestive enzymes used as remedies for digestive disorders, accumulation of gas in stomach, gastric problems and supplement treatment of pancreatic diseases. Digeplex is a good fit for the existing product portfolio of PEL in the GI segment to further consolidate the Company’s position in the OTC market and boost business.Note: 1. As per AIOCD October 2017 data, the Gastrointestinal market in India addresses the constipation, diarrhoea and appetite stimulant categories
Launches during the year
PEL launched/ re-launched a few products/ brand extensions – Lacto Calamine Facewash and Face scrub, Little’s Thermosensitive Silicon Sipper, Little’s breast pump, Sloan’s pain relieving spray, Jungle Magic Garden Sciencz, etc.
“The shift in the consumer mindset, driven by the propensity of self-medication and the increasing purchasing power, is driving demand for the OTC market in India. In the past few years we have been in an investing mode, adding marquee brands to our portfolio. Regulatory changes in the OTC segment presented a challenging year for the sector and the Company. During the year, we launched/re-launched 8-10 product extensions across categories – a first in the history of the Company – and strengthened the gastro-intestinal offering with the acquisition of Digiplex and its associated brands. We are confident that this combined portfolio will help us achieve our 2020 vision of being one of the top three OTC companies in India. We will continue to invest in external growth opportunities, which may include smaller bolt-on acquisitions of niche product categories that will propel us closer to our goal.”
N A N D I N I P I R A M A L Executive Director, PEL
Restructuring
Apart from the operational activities, the business underwent an internal restructuring.
• India Consumer Products has grown by roughly 8.5 times in size since its launch in 2008, but to achieve the next level of growth for FY2020, the business required a different approach. Taking this into consideration, the business conceptualised the idea of segregating itself into four autonomous divisions – General Trade, New Products, Kids Well-being & Modern Trade – single P&L was restricting potential maximisation of each vertical.
• Each of the verticals have distinct requirements and are unique in terms of their customers, infrastructure, talent, SOPs & processes, management approach and client relationship management.
• Each vertical has its own marketing and sales team focused on growing its portfolio of products, with separate P&L responsibilities and targets. Reorganisation of business has brought increased efficiencies in terms of faster decision-making and accountability, increased focus on addressing consumer needs and enhanced control on operations, costs and resources.
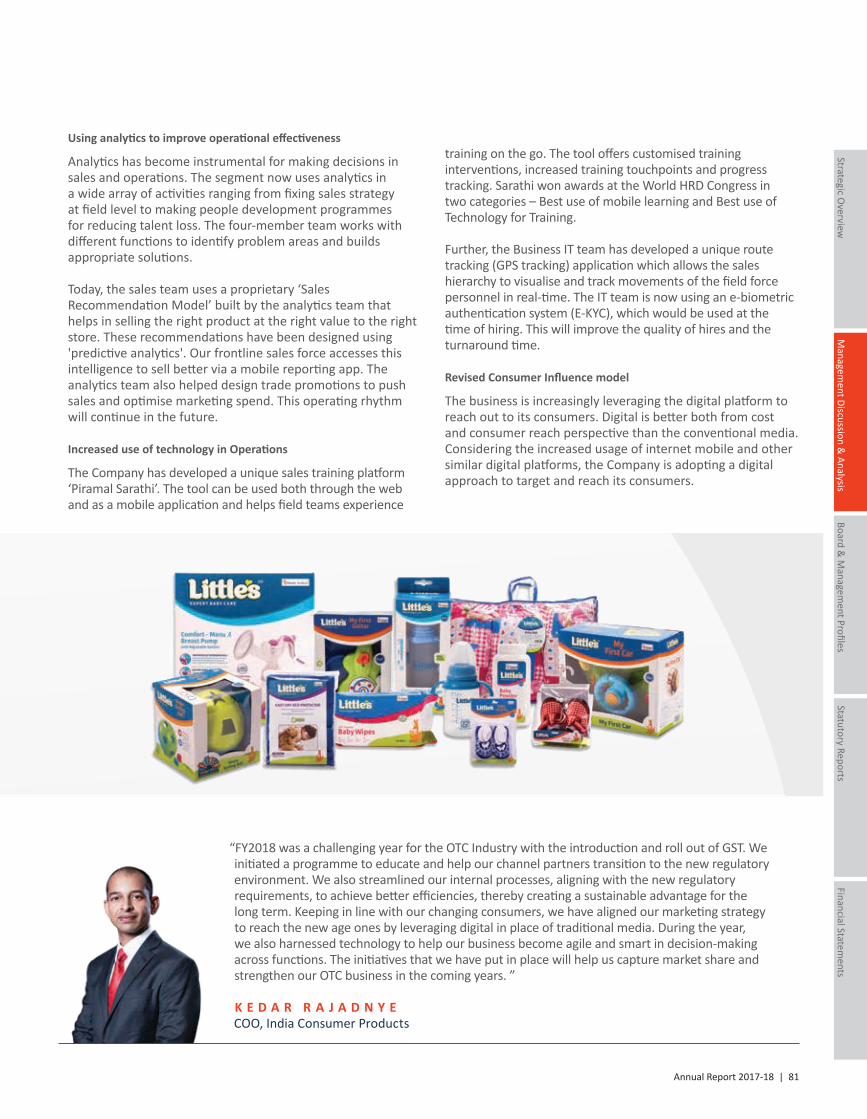
Annual Report 2017-18 | 81
Managem
ent Discussion &
Analysis
Strategic Overview
Board &
Managem
ent ProfilesStatutory Reports
Financial Statements
training on the go. The tool offers customised training interventions, increased training touchpoints and progress tracking. Sarathi won awards at the World HRD Congress in two categories – Best use of mobile learning and Best use of Technology for Training.
Further, the Business IT team has developed a unique route tracking (GPS tracking) application which allows the sales hierarchy to visualise and track movements of the field force personnel in real-time. The IT team is now using an e-biometric authentication system (E-KYC), which would be used at the time of hiring. This will improve the quality of hires and the turnaround time.
Revised Consumer Influence model
The business is increasingly leveraging the digital platform to reach out to its consumers. Digital is better both from cost and consumer reach perspective than the conventional media. Considering the increased usage of internet mobile and other similar digital platforms, the Company is adopting a digital approach to target and reach its consumers.
“FY2018 was a challenging year for the OTC Industry with the introduction and roll out of GST. We initiated a programme to educate and help our channel partners transition to the new regulatory environment. We also streamlined our internal processes, aligning with the new regulatory requirements, to achieve better efficiencies, thereby creating a sustainable advantage for the long term. Keeping in line with our changing consumers, we have aligned our marketing strategy to reach the new age ones by leveraging digital in place of traditional media. During the year, we also harnessed technology to help our business become agile and smart in decision-making across functions. The initiatives that we have put in place will help us capture market share and strengthen our OTC business in the coming years. ”
K E D A R R A J A D N Y E COO, India Consumer Products
Using analytics to improve operational effectiveness
Analytics has become instrumental for making decisions in sales and operations. The segment now uses analytics in a wide array of activities ranging from fixing sales strategy at field level to making people development programmes for reducing talent loss. The four-member team works with different functions to identify problem areas and builds appropriate solutions.
Today, the sales team uses a proprietary ‘Sales Recommendation Model’ built by the analytics team that helps in selling the right product at the right value to the right store. These recommendations have been designed using 'predictive analytics'. Our frontline sales force accesses this intelligence to sell better via a mobile reporting app. The analytics team also helped design trade promotions to push sales and optimise marketing spend. This operating rhythm will continue in the future.
Increased use of technology in Operations
The Company has developed a unique sales training platform ‘Piramal Sarathi’. The tool can be used both through the web and as a mobile application and helps field teams experience

82 | Piramal Enterprises Limited
Financial Performance
The Company’s performance was impacted by GST implementation during the year. Revenue was at `346 Crores for the year.
Total RevenueConsumer Products Allergan JV
FY2014
209
220
FY2011FY2010FY2009
128
125
76
124
FY2012
138
177
FY2016
261
313
FY2013
170
196
FY2017
375
357
FY2018
346
426
537 537
FY2015
271
243
REVENUE PERFORMANCE (in ` Crores)Consumer Products 9-year CAGR ~18%
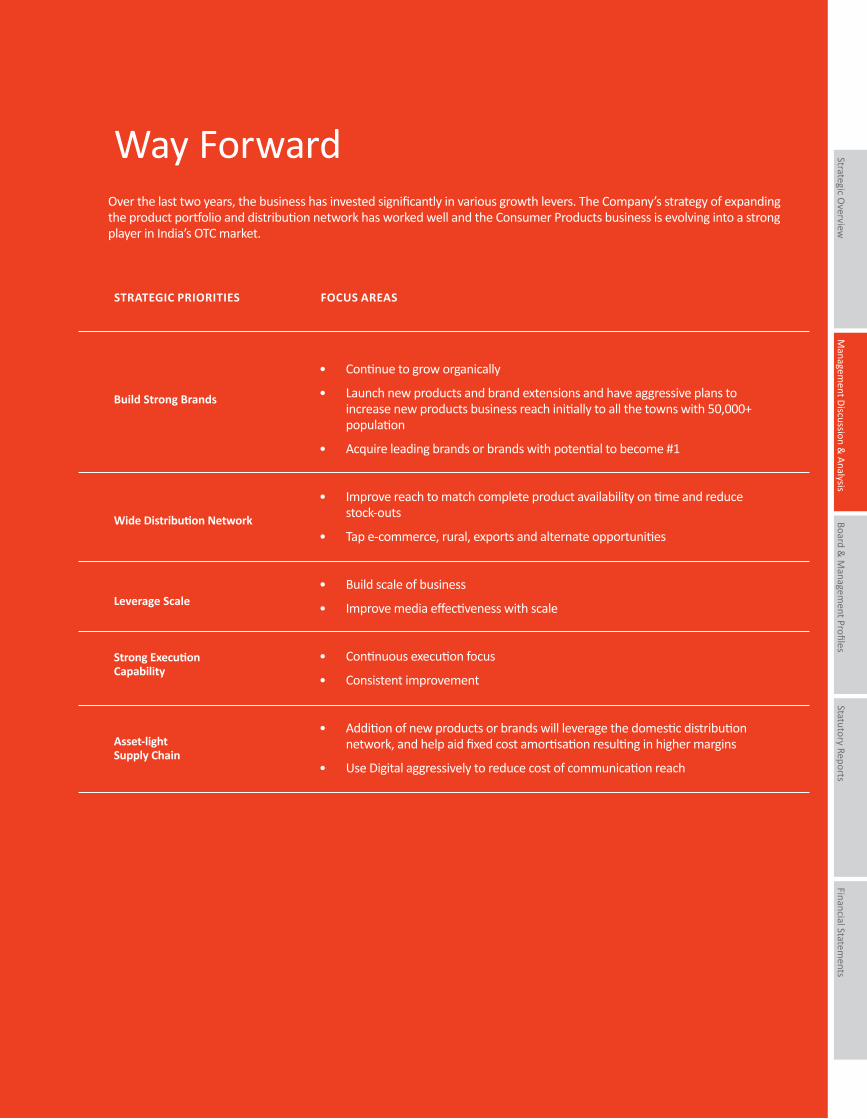
Managem
ent Discussion &
Analysis
Strategic Overview
Board &
Managem
ent ProfilesStatutory Reports
Financial Statements
Way Forward
STRATEGIC PRIORITIES FOCUS AREAS
Build Strong Brands
Wide Distribution Network
Leverage Scale
Strong Execution Capability
Asset-lightSupply Chain
• Continue to grow organically
• Launch new products and brand extensions and have aggressive plans to increase new products business reach initially to all the towns with 50,000+ population
• Acquire leading brands or brands with potential to become #1
• Improve reach to match complete product availability on time and reduce stock-outs
• Tap e-commerce, rural, exports and alternate opportunities
• Build scale of business
• Improve media effectiveness with scale
• Continuous execution focus
• Consistent improvement
• Addition of new products or brands will leverage the domestic distribution network, and help aid fixed cost amortisation resulting in higher margins
• Use Digital aggressively to reduce cost of communication reach
Over the last two years, the business has invested significantly in various growth levers. The Company’s strategy of expanding the product portfolio and distribution network has worked well and the Consumer Products business is evolving into a strong player in India’s OTC market.
84 | Piramal Enterprises Limited
Healthcare Insight and Analytics
—PEL’s Healthcare Insights & Analytics business, Decision Resources Group, is the premier provider of healthcare analytics, data & insight products and
services to the world’s leading pharma, biotech and medical technology
companies and enables them to take informed business decisions.
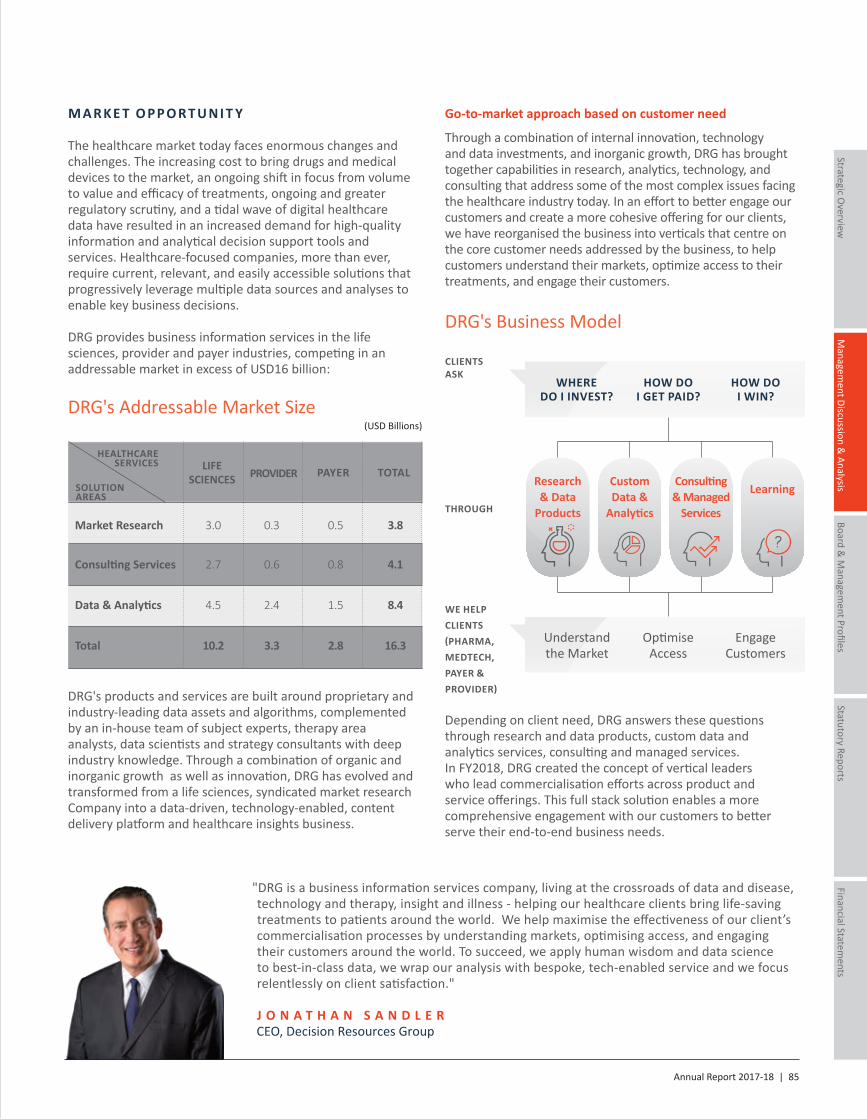
Annual Report 2017-18 | 85
Managem
ent Discussion &
Analysis
Strategic Overview
Board &
Managem
ent ProfilesStatutory Reports
Financial Statements
M A R K E T O PP O R T U N I T Y
The healthcare market today faces enormous changes and challenges. The increasing cost to bring drugs and medical devices to the market, an ongoing shift in focus from volume to value and efficacy of treatments, ongoing and greater regulatory scrutiny, and a tidal wave of digital healthcare data have resulted in an increased demand for high-quality information and analytical decision support tools and services. Healthcare-focused companies, more than ever, require current, relevant, and easily accessible solutions that progressively leverage multiple data sources and analyses to enable key business decisions.
DRG provides business information services in the life sciences, provider and payer industries, competing in an addressable market in excess of USD16 billion:
DRG's Addressable Market Size(USD Billions)
LIFE SCIENCES PROVIDER PAYER TOTAL
HEALTHCARE SERVICES
Market Research 3.0 0.3 0.5 3.8
Consulting Services 2.7 0.6 0.8 4.1
Data & Analytics 4.5 2.4 1.5 8.4
Total 10.2 3.3 2.8 16.3
SOLUTION AREAS
DRG's products and services are built around proprietary and industry-leading data assets and algorithms, complemented by an in-house team of subject experts, therapy area analysts, data scientists and strategy consultants with deep industry knowledge. Through a combination of organic and inorganic growth as well as innovation, DRG has evolved and transformed from a life sciences, syndicated market research Company into a data-driven, technology-enabled, content delivery platform and healthcare insights business.
"DRG is a business information services company, living at the crossroads of data and disease, technology and therapy, insight and illness - helping our healthcare clients bring life-saving treatments to patients around the world. We help maximise the effectiveness of our client’s commercialisation processes by understanding markets, optimising access, and engaging their customers around the world. To succeed, we apply human wisdom and data science to best-in-class data, we wrap our analysis with bespoke, tech-enabled service and we focus relentlessly on client satisfaction."
J O N A T H A N S A N D L E R CEO, Decision Resources Group
Go-to-market approach based on customer need
Through a combination of internal innovation, technology and data investments, and inorganic growth, DRG has brought together capabilities in research, analytics, technology, and consulting that address some of the most complex issues facing the healthcare industry today. In an effort to better engage our customers and create a more cohesive offering for our clients, we have reorganised the business into verticals that centre on the core customer needs addressed by the business, to help customers understand their markets, optimize access to their treatments, and engage their customers.
DRG's Business Model
WHEREDO I INVEST?
HOW DOI GET PAID?
HOW DOI WIN?
Understand the Market
Optimise Access
Engage Customers
CLIENTS ASK
WE HELP CLIENTS(PHARMA, MEDTECH, PAYER & PROVIDER)
THROUGH
Research & Data
Products
Custom Data &
Analytics
Consulting & Managed
Services
Learning
Depending on client need, DRG answers these questions through research and data products, custom data and analytics services, consulting and managed services.In FY2018, DRG created the concept of vertical leaders who lead commercialisation efforts across product and service offerings. This full stack solution enables a more comprehensive engagement with our customers to better serve their end-to-end business needs.
G L O B A L T E A M O F I N D U S T RY E X PE R T S A N D DATA S C I E N T I S T S
• Over 1,300 employees across 17 global offices in North America, Europe and Asia
– World-Class Epidemiologists – Expert Data Scientists and Engineers – Industry Leading Healthcare Market
Forecasters and Predictive Modelers – Digital Behavior Analysts – Internationally Renowned Consultants – Certified Pharmacists, Health
Economists, Health System & Policy Analysts
– Sophisticated Primary Researchers and Team Trainers
86 | Piramal Enterprises Limited
C O M PR E H E N S I V E PR O D U C T S U I T E
• A portfolio comprising Data and Analytics, Research Products and Global Consulting Services
• One of the few players that provides end-to-end expertise, including bespoke solutions, to address its clients’ most complex problems
• Added 24 new products to the DRG portfolio and launched three tech-enabled insights delivery platforms
• Launched DRG Oncology solution suite addressing client needs spanning cancer epidemiology, clinical trial monitoring, competitive landscape assessment and treatment sequencing, backend by a team of oncology experts
N O TA B L E S TAT I S T I C S
• 3,300+ Patient segments covered globally by DRG epidemiologists
• >50 million Overlapping claims and electronic health records in DRG’s repository of de-identified patient data
• 190+ Diseases covered by DRG analysts and delivered in the Company’s Insights platform
• 100% coverage of insured lives of the US population
• 240 Integrated Delivery Network partners who work closely with DRG pharmacists to compile hospital formulary data
Transforming to grow and improve profitabilityS I N G L E, I N T EG R AT E D G L O B A L PL AT F O R M
• Shifted from a portfolio of brands accumulated through a roll-up acquisition strategy to an integrated healthcare insights and analytics services business under 'one' roof with significant opportunity to up-scale
• Investments in global sales and marketing, distributed production technologies and global capacity, cross-functional data and analytic talent, and a new product delivery platform, the business is expected to achieve revenue gains and cost synergies from this consolidation
• Reorganised business around market verticals and transformed broad-market media marketing strategy into a targeted customer engagement strategy to engage directly with a targeted set of keys accounts and prospects
Managem
ent Discussion &
Analysis
Strategic Overview
Board &
Managem
ent ProfilesStatutory Reports
Financial Statements
I N D I A A DVA N TAG E
L O N G-T E R M R E V E N U E & M A RG I N S V I S I B I L I T Y
Annual Report 2017-18 | 87
DATA A N D A N A LY T I C S C A PA B I L I T I E S C O M B I N E D W I T H M A R K E T E X PE R T I S E
T EC H N O L O G Y A N D I N N OVAT I O N
• Products and services delivered through user-centric technology platforms
• Delivery modality has shifted dramatically from large, static research reports to digitally delivered, modular content
• Launched and then evolved our Insights platform to support our MedTech business
• Double the size of DRG's data repository (healthcare claims, outcomes, formulary and insurance coverage) to 100 Terabytes
• Invested in core technology and analytic methods to manage and utilise massive healthcare data assets
• DRG’s data repository covers over 90% of the healthcare ecosystem
and allows deep and contextually relevant insight organised by key areas of client interest, including patient journey, drug, disease, device, and stakeholder dynamic
• Real-world evidence (RWE) repository of healthcare claims is among the largest in the US and matches that of the biggest RWE providers
• Therapy or market experts partner with data analysts to contextualise analysis and provide actionable recommendations
• Of our 1,300+ employees, 340+ are located in India, in DRG’s Bengaluru and Gurugram offices
• Built India-based marketing operations team
• Skill augmentation accelerates growth and increases capabilities beyond existing products and services, enhances customer delivery and response time, and enables cost efficiencies
• Recruitment of critical talent, especially data science and analytical talent, is significantly enhanced by the Piramal brand
• Serving 45 of top 50 pharma companies
• 10+ years of relationships with its top 10 customers
• Data & Analytics and Research Products, which are highly recurring in nature, comprise over 70% of total revenue
• Stable revenue base with
100% retention among top 50 customers, contributing to approximately 66% of revenues
• Total revenue retention by value is ~96% across the entire customer base, and no single client comprises more than 5% of DRG’s annual revenue
• Large foothold in US Payer/Pharmacy Benefit Manager (PBM) market. Relationships with 15 of the top 20 PBMs and 12 of the top 20 Health Plans
• Through a concerted programme of cost containment and efficiency maximisation DRG is driving margin expansion which includes the expansion of DRG's India operations, technology automation and portfolio planning
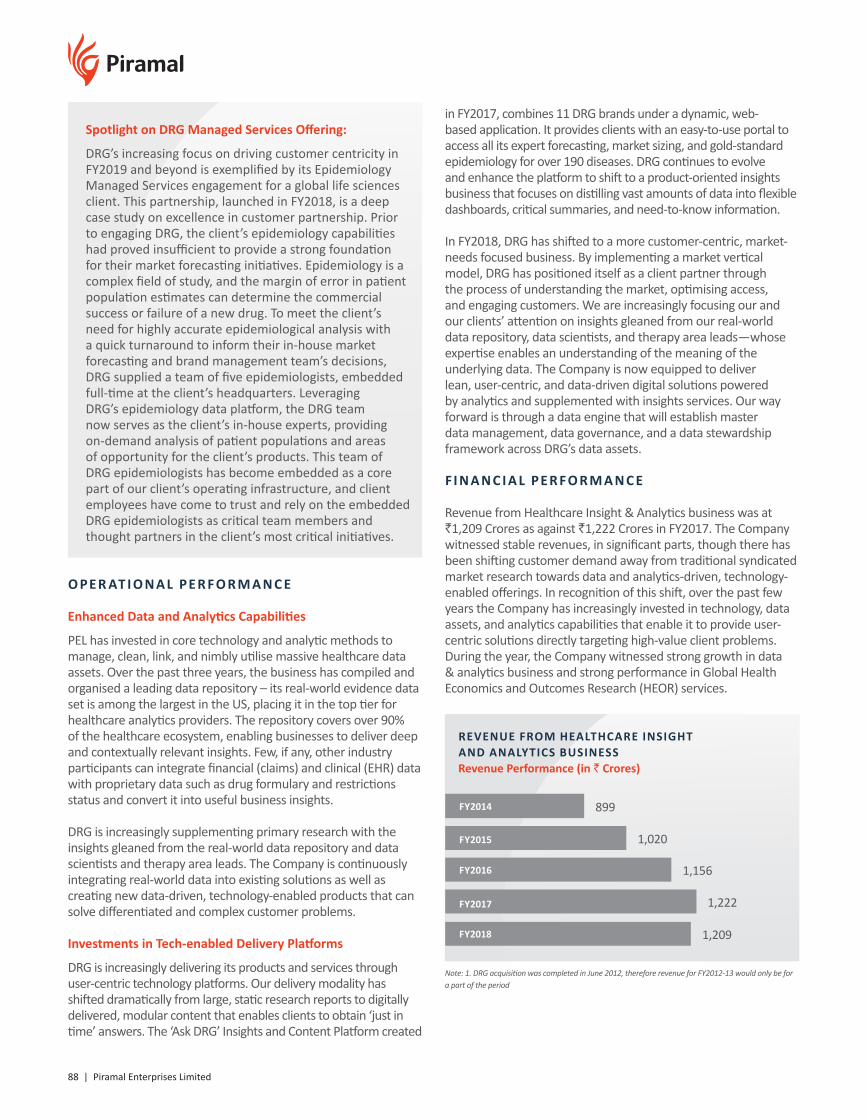
88 | Piramal Enterprises Limited
O PE R AT I O N A L PE R F O R M A N C E
Enhanced Data and Analytics Capabilities
PEL has invested in core technology and analytic methods to manage, clean, link, and nimbly utilise massive healthcare data assets. Over the past three years, the business has compiled and organised a leading data repository – its real-world evidence data set is among the largest in the US, placing it in the top tier for healthcare analytics providers. The repository covers over 90% of the healthcare ecosystem, enabling businesses to deliver deep and contextually relevant insights. Few, if any, other industry participants can integrate financial (claims) and clinical (EHR) data with proprietary data such as drug formulary and restrictions status and convert it into useful business insights.
DRG is increasingly supplementing primary research with the insights gleaned from the real-world data repository and data scientists and therapy area leads. The Company is continuously integrating real-world data into existing solutions as well as creating new data-driven, technology-enabled products that can solve differentiated and complex customer problems.
Investments in Tech-enabled Delivery Platforms
DRG is increasingly delivering its products and services through user-centric technology platforms. Our delivery modality has shifted dramatically from large, static research reports to digitally delivered, modular content that enables clients to obtain ‘just in time’ answers. The ‘Ask DRG’ Insights and Content Platform created
Spotlight on DRG Managed Services Offering:
DRG’s increasing focus on driving customer centricity in FY2019 and beyond is exemplified by its Epidemiology Managed Services engagement for a global life sciences client. This partnership, launched in FY2018, is a deep case study on excellence in customer partnership. Prior to engaging DRG, the client’s epidemiology capabilities had proved insufficient to provide a strong foundation for their market forecasting initiatives. Epidemiology is a complex field of study, and the margin of error in patient population estimates can determine the commercial success or failure of a new drug. To meet the client’s need for highly accurate epidemiological analysis with a quick turnaround to inform their in-house market forecasting and brand management team’s decisions, DRG supplied a team of five epidemiologists, embedded full-time at the client’s headquarters. Leveraging DRG’s epidemiology data platform, the DRG team now serves as the client’s in-house experts, providing on-demand analysis of patient populations and areas of opportunity for the client’s products. This team of DRG epidemiologists has become embedded as a core part of our client’s operating infrastructure, and client employees have come to trust and rely on the embedded DRG epidemiologists as critical team members and thought partners in the client’s most critical initiatives.
in FY2017, combines 11 DRG brands under a dynamic, web-based application. It provides clients with an easy-to-use portal to access all its expert forecasting, market sizing, and gold-standard epidemiology for over 190 diseases. DRG continues to evolve and enhance the platform to shift to a product-oriented insights business that focuses on distilling vast amounts of data into flexible dashboards, critical summaries, and need-to-know information.
In FY2018, DRG has shifted to a more customer-centric, market-needs focused business. By implementing a market vertical model, DRG has positioned itself as a client partner through the process of understanding the market, optimising access, and engaging customers. We are increasingly focusing our and our clients’ attention on insights gleaned from our real-world data repository, data scientists, and therapy area leads—whose expertise enables an understanding of the meaning of the underlying data. The Company is now equipped to deliver lean, user-centric, and data-driven digital solutions powered by analytics and supplemented with insights services. Our way forward is through a data engine that will establish master data management, data governance, and a data stewardship framework across DRG’s data assets.
F I N A N C I A L PE R F O R M A N C E
Revenue from Healthcare Insight & Analytics business was at `1,209 Crores as against `1,222 Crores in FY2017. The Company witnessed stable revenues, in significant parts, though there has been shifting customer demand away from traditional syndicated market research towards data and analytics-driven, technology-enabled offerings. In recognition of this shift, over the past few years the Company has increasingly invested in technology, data assets, and analytics capabilities that enable it to provide user-centric solutions directly targeting high-value client problems. During the year, the Company witnessed strong growth in data & analytics business and strong performance in Global Health Economics and Outcomes Research (HEOR) services.
Note: 1. DRG acquisition was completed in June 2012, therefore revenue for FY2012-13 would only be for a part of the period
899FY2014
FY2015
FY2016
FY2017
FY2018
1,020
1,156
1,222
1,209
REVENUE FROM HEALTHCARE INSIGHTAND ANALYTICS BUSINESS Revenue Performance (in ` Crores)
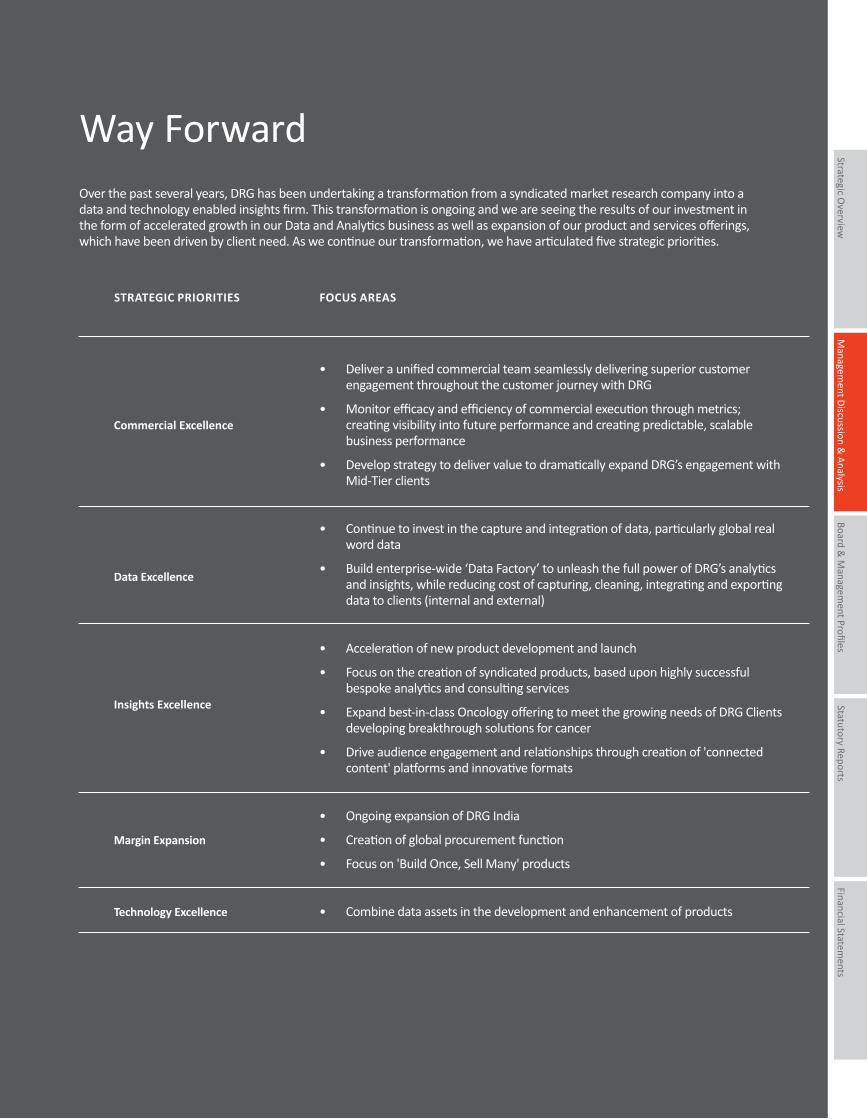
Managem
ent Discussion &
Analysis
Strategic Overview
Board &
Managem
ent ProfilesStatutory Reports
Financial Statements
Way Forward
STRATEGIC PRIORITIES FOCUS AREAS
Commercial Excellence
Data Excellence
Insights Excellence
Margin Expansion
Technology Excellence
• Deliver a unified commercial team seamlessly delivering superior customer engagement throughout the customer journey with DRG
• Monitor efficacy and efficiency of commercial execution through metrics; creating visibility into future performance and creating predictable, scalable business performance
• Develop strategy to deliver value to dramatically expand DRG’s engagement with Mid-Tier clients
• Continue to invest in the capture and integration of data, particularly global real word data
• Build enterprise-wide ‘Data Factory’ to unleash the full power of DRG’s analytics and insights, while reducing cost of capturing, cleaning, integrating and exporting data to clients (internal and external)
• Acceleration of new product development and launch
• Focus on the creation of syndicated products, based upon highly successful bespoke analytics and consulting services
• Expand best-in-class Oncology offering to meet the growing needs of DRG Clients developing breakthrough solutions for cancer
• Drive audience engagement and relationships through creation of 'connected content' platforms and innovative formats
• Ongoing expansion of DRG India
• Creation of global procurement function
• Focus on 'Build Once, Sell Many' products
• Combine data assets in the development and enhancement of products
Over the past several years, DRG has been undertaking a transformation from a syndicated market research company into a data and technology enabled insights firm. This transformation is ongoing and we are seeing the results of our investment in the form of accelerated growth in our Data and Analytics business as well as expansion of our product and services offerings, which have been driven by client need. As we continue our transformation, we have articulated five strategic priorities.
90 | Piramal Enterprises Limited
RiskManagement
—Enterprise Risk Management
A well-defined risk management framework is integral to any business. PEL has an independent and dedicated
Enterprise Risk Management (ERM) system to identify, manage and mitigate
business risks. Risk management, internal controls and assurance processes are embedded into all
activities of the Company.
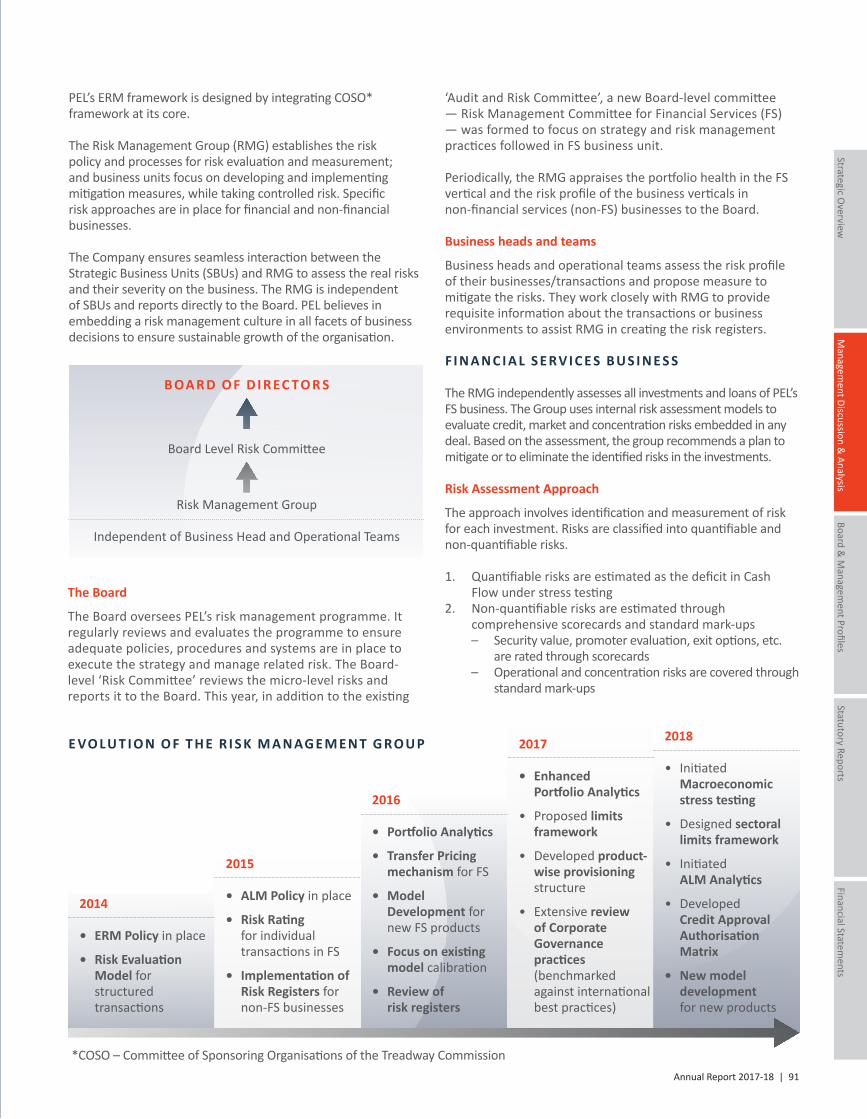
Annual Report 2017-18 | 91
Managem
ent Discussion &
Analysis
Strategic Overview
Board &
Managem
ent ProfilesStatutory Reports
Financial Statements
2014
• ERM Policy in place
• Risk Evaluation Model for structured transactions
2015
• ALM Policy in place
• Risk Rating for individual transactions in FS
• Implementation of Risk Registers for non-FS businesses
2016
• Portfolio Analytics
• Transfer Pricing mechanism for FS
• Model Development for new FS products
• Focus on existing model calibration
• Review of risk registers
2017
• Enhanced Portfolio Analytics
• Proposed limits framework
• Developed product-wise provisioning structure
• Extensive review of Corporate Governance practices (benchmarked against international best practices)
2018
• Initiated Macroeconomic stress testing
• Designed sectoral limits framework
• Initiated ALM Analytics
• Developed Credit Approval Authorisation Matrix
• New model development for new products
E VO LU T I O N O F T H E R I S K M A N AG E M E N T G R O U P
PEL’s ERM framework is designed by integrating COSO* framework at its core.
The Risk Management Group (RMG) establishes the risk policy and processes for risk evaluation and measurement; and business units focus on developing and implementing mitigation measures, while taking controlled risk. Specific risk approaches are in place for financial and non-financial businesses.
The Company ensures seamless interaction between the Strategic Business Units (SBUs) and RMG to assess the real risks and their severity on the business. The RMG is independent of SBUs and reports directly to the Board. PEL believes in embedding a risk management culture in all facets of business decisions to ensure sustainable growth of the organisation.
B OA R D O F D I R EC TO R S
Board Level Risk Committee
Risk Management Group
Independent of Business Head and Operational Teams
The Board
The Board oversees PEL’s risk management programme. It regularly reviews and evaluates the programme to ensure adequate policies, procedures and systems are in place to execute the strategy and manage related risk. The Board-level ‘Risk Committee’ reviews the micro-level risks and reports it to the Board. This year, in addition to the existing
‘Audit and Risk Committee’, a new Board-level committee — Risk Management Committee for Financial Services (FS) — was formed to focus on strategy and risk management practices followed in FS business unit.
Periodically, the RMG appraises the portfolio health in the FS vertical and the risk profile of the business verticals in non-financial services (non-FS) businesses to the Board.
Business heads and teams
Business heads and operational teams assess the risk profile of their businesses/transactions and propose measure to mitigate the risks. They work closely with RMG to provide requisite information about the transactions or business environments to assist RMG in creating the risk registers.
F I N A N C I A L S E RV I C E S B U S I N E S S
The RMG independently assesses all investments and loans of PEL’s FS business. The Group uses internal risk assessment models to evaluate credit, market and concentration risks embedded in any deal. Based on the assessment, the group recommends a plan to mitigate or to eliminate the identified risks in the investments.
Risk Assessment Approach
The approach involves identification and measurement of risk for each investment. Risks are classified into quantifiable and non-quantifiable risks.
1. Quantifiable risks are estimated as the deficit in Cash Flow under stress testing
2. Non-quantifiable risks are estimated through comprehensive scorecards and standard mark-ups
– Security value, promoter evaluation, exit options, etc. are rated through scorecards
– Operational and concentration risks are covered through standard mark-ups
*COSO – Committee of Sponsoring Organisations of the Treadway Commission
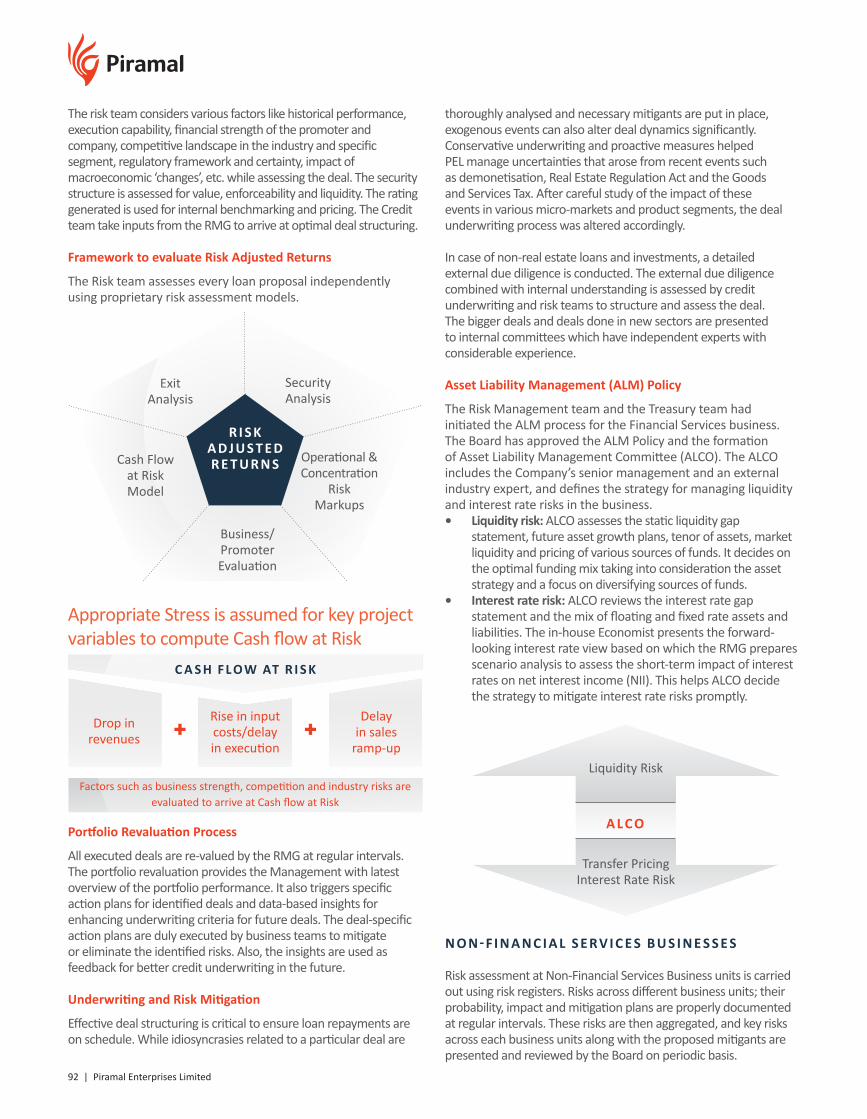
92 | Piramal Enterprises Limited
The risk team considers various factors like historical performance, execution capability, financial strength of the promoter and company, competitive landscape in the industry and specific segment, regulatory framework and certainty, impact of macroeconomic ‘changes’, etc. while assessing the deal. The security structure is assessed for value, enforceability and liquidity. The rating generated is used for internal benchmarking and pricing. The Credit team take inputs from the RMG to arrive at optimal deal structuring.
Framework to evaluate Risk Adjusted Returns
The Risk team assesses every loan proposal independently using proprietary risk assessment models.
Cash Flow at Risk Model
ExitAnalysis
Security Analysis
Operational & Concentration
Risk Markups
Business/Promoter Evaluation
R I S K A D J U S T E D R E T U R N S
Appropriate Stress is assumed for key project variables to compute Cash flow at Risk
C A S H F L OW AT R I S K
Drop in revenues
Rise in input costs/delay in execution
Delay in sales
ramp-up
Factors such as business strength, competition and industry risks are evaluated to arrive at Cash flow at Risk
Portfolio Revaluation Process
All executed deals are re-valued by the RMG at regular intervals. The portfolio revaluation provides the Management with latest overview of the portfolio performance. It also triggers specific action plans for identified deals and data-based insights for enhancing underwriting criteria for future deals. The deal-specific action plans are duly executed by business teams to mitigate or eliminate the identified risks. Also, the insights are used as feedback for better credit underwriting in the future.
Underwriting and Risk Mitigation
Effective deal structuring is critical to ensure loan repayments are on schedule. While idiosyncrasies related to a particular deal are
thoroughly analysed and necessary mitigants are put in place, exogenous events can also alter deal dynamics significantly. Conservative underwriting and proactive measures helped PEL manage uncertainties that arose from recent events such as demonetisation, Real Estate Regulation Act and the Goods and Services Tax. After careful study of the impact of these events in various micro-markets and product segments, the deal underwriting process was altered accordingly.
In case of non-real estate loans and investments, a detailed external due diligence is conducted. The external due diligence combined with internal understanding is assessed by credit underwriting and risk teams to structure and assess the deal. The bigger deals and deals done in new sectors are presented to internal committees which have independent experts with considerable experience.
Asset Liability Management (ALM) Policy
The Risk Management team and the Treasury team had initiated the ALM process for the Financial Services business. The Board has approved the ALM Policy and the formation of Asset Liability Management Committee (ALCO). The ALCO includes the Company’s senior management and an external industry expert, and defines the strategy for managing liquidity and interest rate risks in the business.• Liquidity risk: ALCO assesses the static liquidity gap
statement, future asset growth plans, tenor of assets, market liquidity and pricing of various sources of funds. It decides on the optimal funding mix taking into consideration the asset strategy and a focus on diversifying sources of funds.
• Interest rate risk: ALCO reviews the interest rate gap statement and the mix of floating and fixed rate assets and liabilities. The in-house Economist presents the forward-looking interest rate view based on which the RMG prepares scenario analysis to assess the short-term impact of interest rates on net interest income (NII). This helps ALCO decide the strategy to mitigate interest rate risks promptly.
Liquidity Risk
A L C O
Transfer Pricing Interest Rate Risk
N O N- F I N A N C I A L S E RV I C E S B U S I N E S S E S
Risk assessment at Non-Financial Services Business units is carried out using risk registers. Risks across different business units; their probability, impact and mitigation plans are properly documented at regular intervals. These risks are then aggregated, and key risks across each business units along with the proposed mitigants are presented and reviewed by the Board on periodic basis.
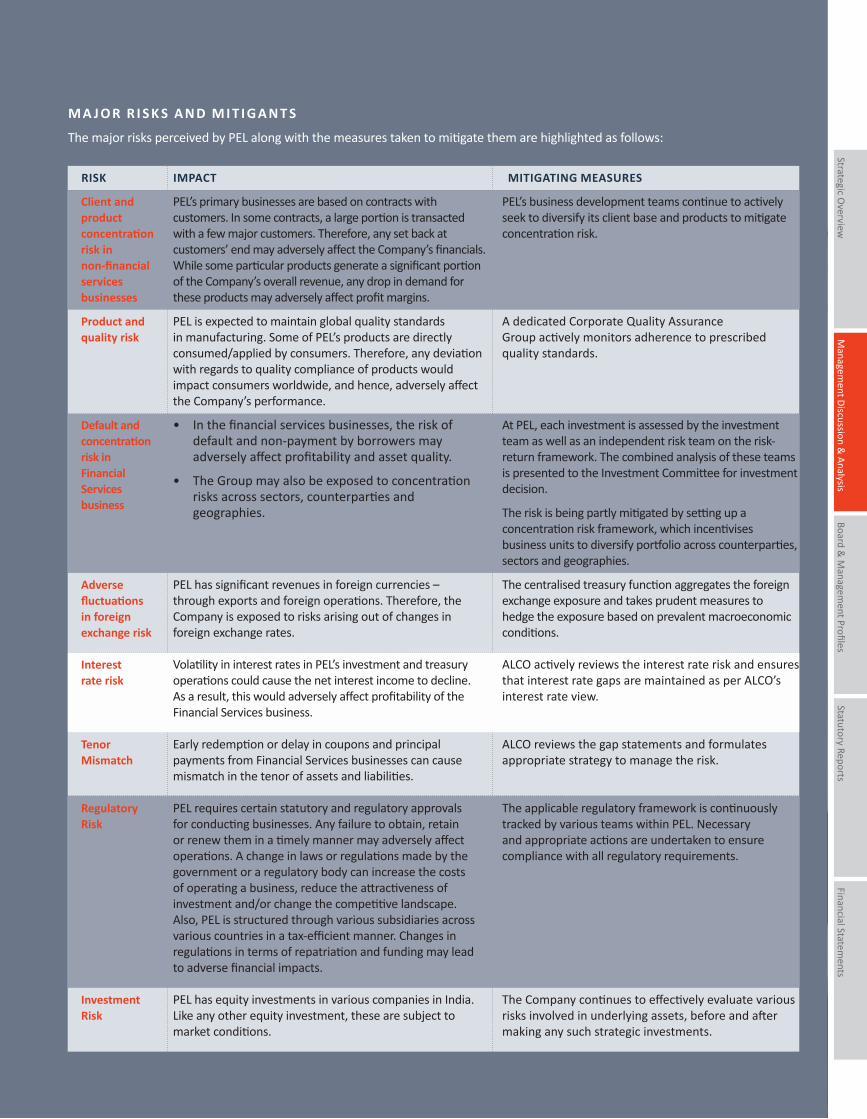
Annual Report 2017-18 | 93
Managem
ent Discussion &
Analysis
Strategic Overview
Board &
Managem
ent ProfilesStatutory Reports
Financial Statements
M A J O R R I S K S A N D M I T I G A N T S
The major risks perceived by PEL along with the measures taken to mitigate them are highlighted as follows:
RISK IMPACT MITIGATING MEASURES
Client and product concentration risk in non-financial services businesses
Product and quality risk
Default and concentration risk in Financial Services business
Adverse fluctuations in foreign exchange risk
Interest rate risk
Tenor Mismatch
Regulatory Risk
Investment Risk
PEL’s primary businesses are based on contracts with customers. In some contracts, a large portion is transacted with a few major customers. Therefore, any set back at customers’ end may adversely affect the Company’s financials. While some particular products generate a significant portion of the Company’s overall revenue, any drop in demand for these products may adversely affect profit margins.
PEL is expected to maintain global quality standards in manufacturing. Some of PEL’s products are directly consumed/applied by consumers. Therefore, any deviation with regards to quality compliance of products would impact consumers worldwide, and hence, adversely affect the Company’s performance.
• In the financial services businesses, the risk of default and non-payment by borrowers may adversely affect profitability and asset quality.
• The Group may also be exposed to concentration risks across sectors, counterparties and geographies.
PEL has significant revenues in foreign currencies –through exports and foreign operations. Therefore, the Company is exposed to risks arising out of changes in foreign exchange rates.
Volatility in interest rates in PEL’s investment and treasury operations could cause the net interest income to decline. As a result, this would adversely affect profitability of the Financial Services business.
Early redemption or delay in coupons and principal payments from Financial Services businesses can cause mismatch in the tenor of assets and liabilities.
PEL requires certain statutory and regulatory approvals for conducting businesses. Any failure to obtain, retain or renew them in a timely manner may adversely affect operations. A change in laws or regulations made by the government or a regulatory body can increase the costs of operating a business, reduce the attractiveness of investment and/or change the competitive landscape. Also, PEL is structured through various subsidiaries across various countries in a tax-efficient manner. Changes in regulations in terms of repatriation and funding may lead to adverse financial impacts.
PEL has equity investments in various companies in India. Like any other equity investment, these are subject to market conditions.
PEL’s business development teams continue to actively seek to diversify its client base and products to mitigate concentration risk.
A dedicated Corporate Quality AssuranceGroup actively monitors adherence to prescribed quality standards.
At PEL, each investment is assessed by the investment team as well as an independent risk team on the risk-return framework. The combined analysis of these teams is presented to the Investment Committee for investment decision.
The risk is being partly mitigated by setting up a concentration risk framework, which incentivises business units to diversify portfolio across counterparties, sectors and geographies.
The centralised treasury function aggregates the foreign exchange exposure and takes prudent measures to hedge the exposure based on prevalent macroeconomic conditions.
ALCO actively reviews the interest rate risk and ensures that interest rate gaps are maintained as per ALCO’s interest rate view.
ALCO reviews the gap statements and formulates appropriate strategy to manage the risk.
The applicable regulatory framework is continuously tracked by various teams within PEL. Necessary and appropriate actions are undertaken to ensure compliance with all regulatory requirements.
The Company continues to effectively evaluate various risks involved in underlying assets, before and after making any such strategic investments.
94 | Piramal Enterprises Limited
HumanResources
—In 2014, PEL’s HR function embarked
on an extensive transformation journey called SEEDS (Strategy for Employee Engagement and
Development Support). Six strategic focus areas were identified to fuel
the HR strategy of ‘creating an environment where employees
can thrive and are enabledto deliver sustainable
performance’.
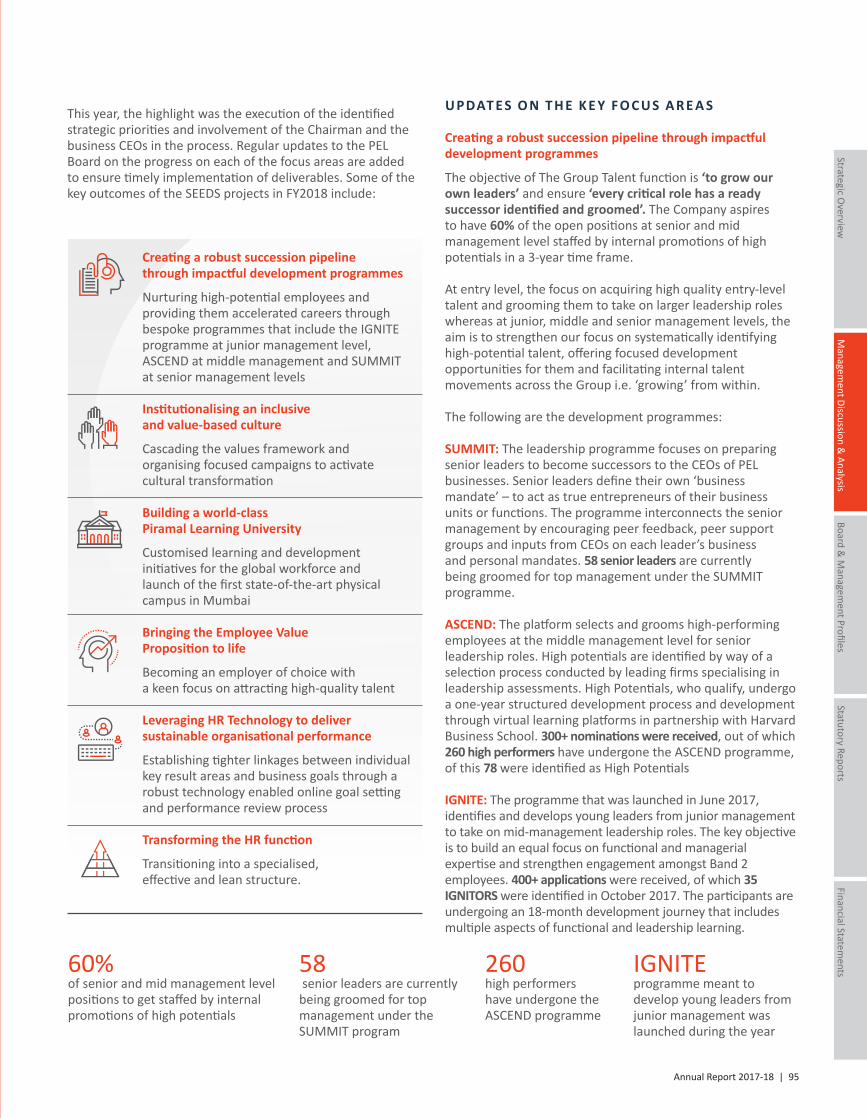
Annual Report 2017-18 | 95
Managem
ent Discussion &
Analysis
Strategic Overview
Board &
Managem
ent ProfilesStatutory Reports
Financial Statements
U PDAT E S O N T H E K E Y F O C U S A R E A S
Creating a robust succession pipeline through impactful development programmes
The objective of The Group Talent function is ‘to grow our own leaders’ and ensure ‘every critical role has a ready successor identified and groomed’. The Company aspires to have 60% of the open positions at senior and mid management level staffed by internal promotions of high potentials in a 3-year time frame.
At entry level, the focus on acquiring high quality entry-level talent and grooming them to take on larger leadership roles whereas at junior, middle and senior management levels, the aim is to strengthen our focus on systematically identifying high-potential talent, offering focused development opportunities for them and facilitating internal talent movements across the Group i.e. ‘growing’ from within.
The following are the development programmes:
SUMMIT: The leadership programme focuses on preparing senior leaders to become successors to the CEOs of PEL businesses. Senior leaders define their own ‘business mandate’ – to act as true entrepreneurs of their business units or functions. The programme interconnects the senior management by encouraging peer feedback, peer support groups and inputs from CEOs on each leader’s business and personal mandates. 58 senior leaders are currently being groomed for top management under the SUMMIT programme.
ASCEND: The platform selects and grooms high-performing employees at the middle management level for senior leadership roles. High potentials are identified by way of a selection process conducted by leading firms specialising in leadership assessments. High Potentials, who qualify, undergo a one-year structured development process and development through virtual learning platforms in partnership with Harvard Business School. 300+ nominations were received, out of which 260 high performers have undergone the ASCEND programme, of this 78 were identified as High Potentials
IGNITE: The programme that was launched in June 2017, identifies and develops young leaders from junior management to take on mid-management leadership roles. The key objective is to build an equal focus on functional and managerial expertise and strengthen engagement amongst Band 2 employees. 400+ applications were received, of which 35 IGNITORS were identified in October 2017. The participants are undergoing an 18-month development journey that includes multiple aspects of functional and leadership learning.
58 senior leaders are currently being groomed for top management under the SUMMIT program
260high performers have undergone the ASCEND programme
IGNITE programme meant to develop young leaders from junior management was launched during the year
Creating a robust succession pipeline through impactful development programmes
Nurturing high-potential employees and providing them accelerated careers through bespoke programmes that include the IGNITE programme at junior management level, ASCEND at middle management and SUMMIT at senior management levels
Institutionalising an inclusive and value-based culture
Cascading the values framework and organising focused campaigns to activate cultural transformation
Building a world-class Piramal Learning University
Customised learning and development initiatives for the global workforce and launch of the first state-of-the-art physical campus in Mumbai
Bringing the Employee Value Proposition to life
Becoming an employer of choice with a keen focus on attracting high-quality talent
Leveraging HR Technology to deliver sustainable organisational performance
Establishing tighter linkages between individual key result areas and business goals through a robust technology enabled online goal setting and performance review process
Transforming the HR function
Transitioning into a specialised, effective and lean structure.
This year, the highlight was the execution of the identified strategic priorities and involvement of the Chairman and the business CEOs in the process. Regular updates to the PEL Board on the progress on each of the focus areas are added to ensure timely implementation of deliverables. Some of the key outcomes of the SEEDS projects in FY2018 include:
60%of senior and mid management level positions to get staffed by internal promotions of high potentials
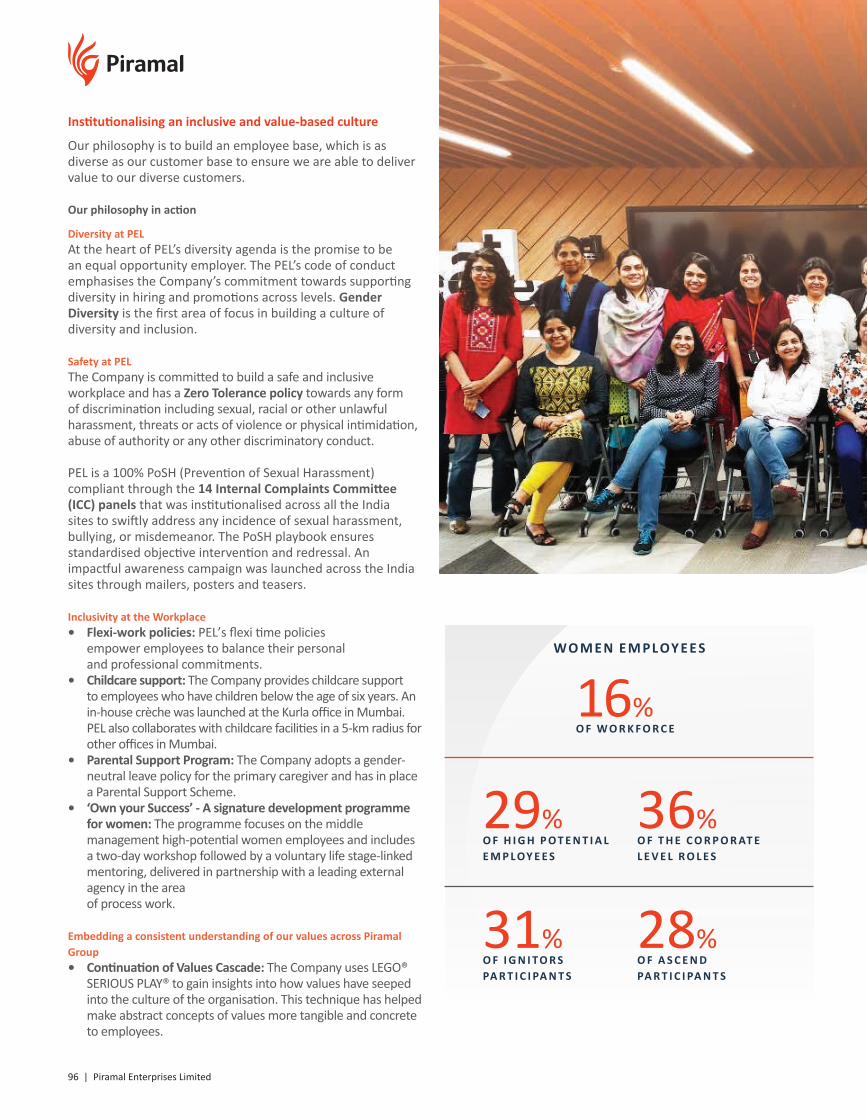
96 | Piramal Enterprises Limited
Institutionalising an inclusive and value-based culture
Our philosophy is to build an employee base, which is as diverse as our customer base to ensure we are able to deliver value to our diverse customers.
Our philosophy in action
Diversity at PELAt the heart of PEL’s diversity agenda is the promise to be an equal opportunity employer. The PEL’s code of conduct emphasises the Company’s commitment towards supporting diversity in hiring and promotions across levels. Gender Diversity is the first area of focus in building a culture of diversity and inclusion.
Safety at PEL The Company is committed to build a safe and inclusive workplace and has a Zero Tolerance policy towards any form of discrimination including sexual, racial or other unlawful harassment, threats or acts of violence or physical intimidation, abuse of authority or any other discriminatory conduct.
PEL is a 100% PoSH (Prevention of Sexual Harassment) compliant through the 14 Internal Complaints Committee (ICC) panels that was institutionalised across all the India sites to swiftly address any incidence of sexual harassment, bullying, or misdemeanor. The PoSH playbook ensures standardised objective intervention and redressal. An impactful awareness campaign was launched across the India sites through mailers, posters and teasers.
Inclusivity at the Workplace• Flexi-work policies: PEL’s flexi time policies
empower employees to balance their personal and professional commitments.
• Childcare support: The Company provides childcare support to employees who have children below the age of six years. An in-house crèche was launched at the Kurla office in Mumbai. PEL also collaborates with childcare facilities in a 5-km radius for other offices in Mumbai.
• Parental Support Program: The Company adopts a gender-neutral leave policy for the primary caregiver and has in place a Parental Support Scheme.
• ‘Own your Success’ - A signature development programme for women: The programme focuses on the middle management high-potential women employees and includes a two-day workshop followed by a voluntary life stage-linked mentoring, delivered in partnership with a leading external agency in the area of process work.
Embedding a consistent understanding of our values across Piramal Group• Continuation of Values Cascade: The Company uses LEGO®
SERIOUS PLAY® to gain insights into how values have seeped into the culture of the organisation. This technique has helped make abstract concepts of values more tangible and concrete to employees.
WO M E N E M PL OY E E S
31%O F I G N I TO R S PA R T I C I PA N T S
16%O F W O R K F O R C E
36%O F T H E C O R P O R AT E L E V E L R O L E S
29%O F H I G H P O T E N T I A L E M P L OY E E S
28%O F A S C E N D PA R T I C I PA N T S
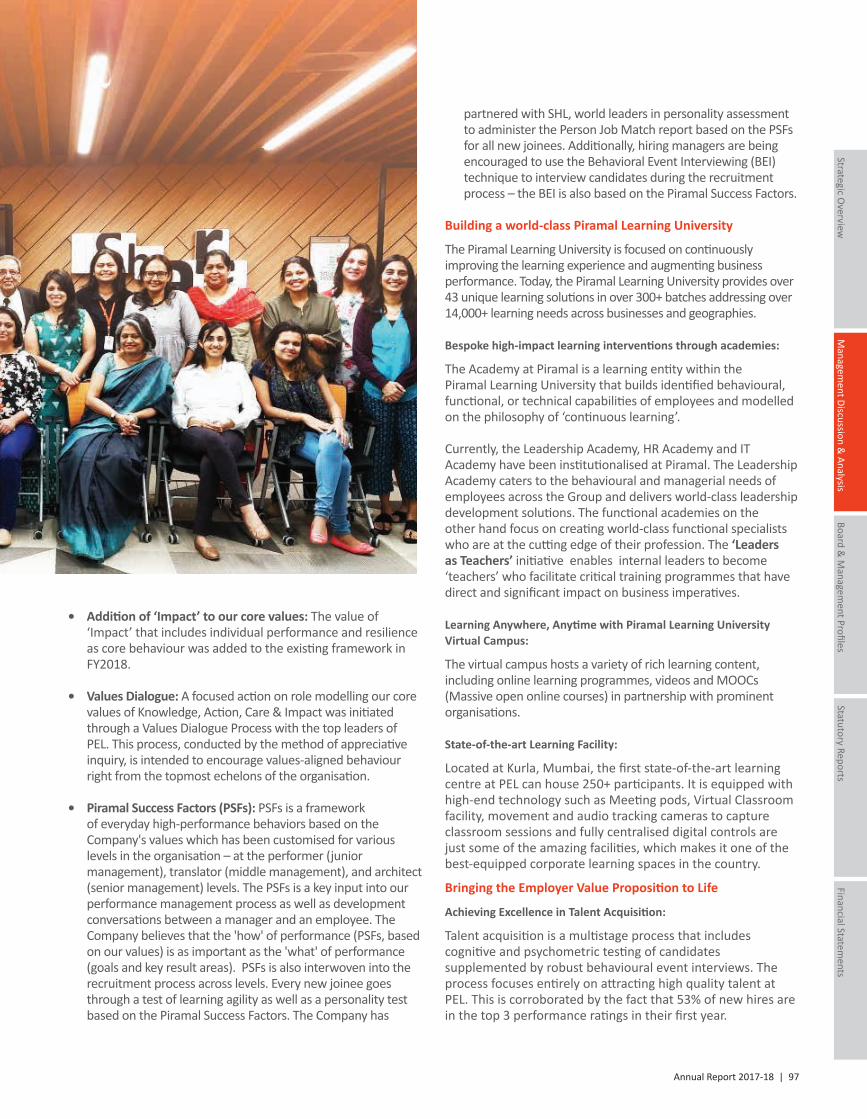
Annual Report 2017-18 | 97
Managem
ent Discussion &
Analysis
Strategic Overview
Board &
Managem
ent ProfilesStatutory Reports
Financial Statements
partnered with SHL, world leaders in personality assessment to administer the Person Job Match report based on the PSFs for all new joinees. Additionally, hiring managers are being encouraged to use the Behavioral Event Interviewing (BEI) technique to interview candidates during the recruitment process – the BEI is also based on the Piramal Success Factors.
Building a world-class Piramal Learning University
The Piramal Learning University is focused on continuously improving the learning experience and augmenting business performance. Today, the Piramal Learning University provides over 43 unique learning solutions in over 300+ batches addressing over 14,000+ learning needs across businesses and geographies.
Bespoke high-impact learning interventions through academies:
The Academy at Piramal is a learning entity within the Piramal Learning University that builds identified behavioural, functional, or technical capabilities of employees and modelled on the philosophy of ‘continuous learning’.
Currently, the Leadership Academy, HR Academy and IT Academy have been institutionalised at Piramal. The Leadership Academy caters to the behavioural and managerial needs of employees across the Group and delivers world-class leadership development solutions. The functional academies on the other hand focus on creating world-class functional specialists who are at the cutting edge of their profession. The ‘Leaders as Teachers’ initiative enables internal leaders to become ‘teachers’ who facilitate critical training programmes that have direct and significant impact on business imperatives.
Learning Anywhere, Anytime with Piramal Learning University Virtual Campus:
The virtual campus hosts a variety of rich learning content, including online learning programmes, videos and MOOCs (Massive open online courses) in partnership with prominent organisations.
State-of-the-art Learning Facility:
Located at Kurla, Mumbai, the first state-of-the-art learning centre at PEL can house 250+ participants. It is equipped with high-end technology such as Meeting pods, Virtual Classroom facility, movement and audio tracking cameras to capture classroom sessions and fully centralised digital controls are just some of the amazing facilities, which makes it one of the best-equipped corporate learning spaces in the country.
Bringing the Employer Value Proposition to Life
Achieving Excellence in Talent Acquisition:
Talent acquisition is a multistage process that includes cognitive and psychometric testing of candidates supplemented by robust behavioural event interviews. The process focuses entirely on attracting high quality talent at PEL. This is corroborated by the fact that 53% of new hires are in the top 3 performance ratings in their first year.
• Addition of ‘Impact’ to our core values: The value of ‘Impact’ that includes individual performance and resilience as core behaviour was added to the existing framework in FY2018.
• Values Dialogue: A focused action on role modelling our core values of Knowledge, Action, Care & Impact was initiated through a Values Dialogue Process with the top leaders of PEL. This process, conducted by the method of appreciative inquiry, is intended to encourage values-aligned behaviour right from the topmost echelons of the organisation.
• Piramal Success Factors (PSFs): PSFs is a framework of everyday high-performance behaviors based on the Company's values which has been customised for various levels in the organisation – at the performer (junior management), translator (middle management), and architect (senior management) levels. The PSFs is a key input into our performance management process as well as development conversations between a manager and an employee. The Company believes that the 'how' of performance (PSFs, based on our values) is as important as the 'what' of performance (goals and key result areas). PSFs is also interwoven into the recruitment process across levels. Every new joinee goes through a test of learning agility as well as a personality test based on the Piramal Success Factors. The Company has
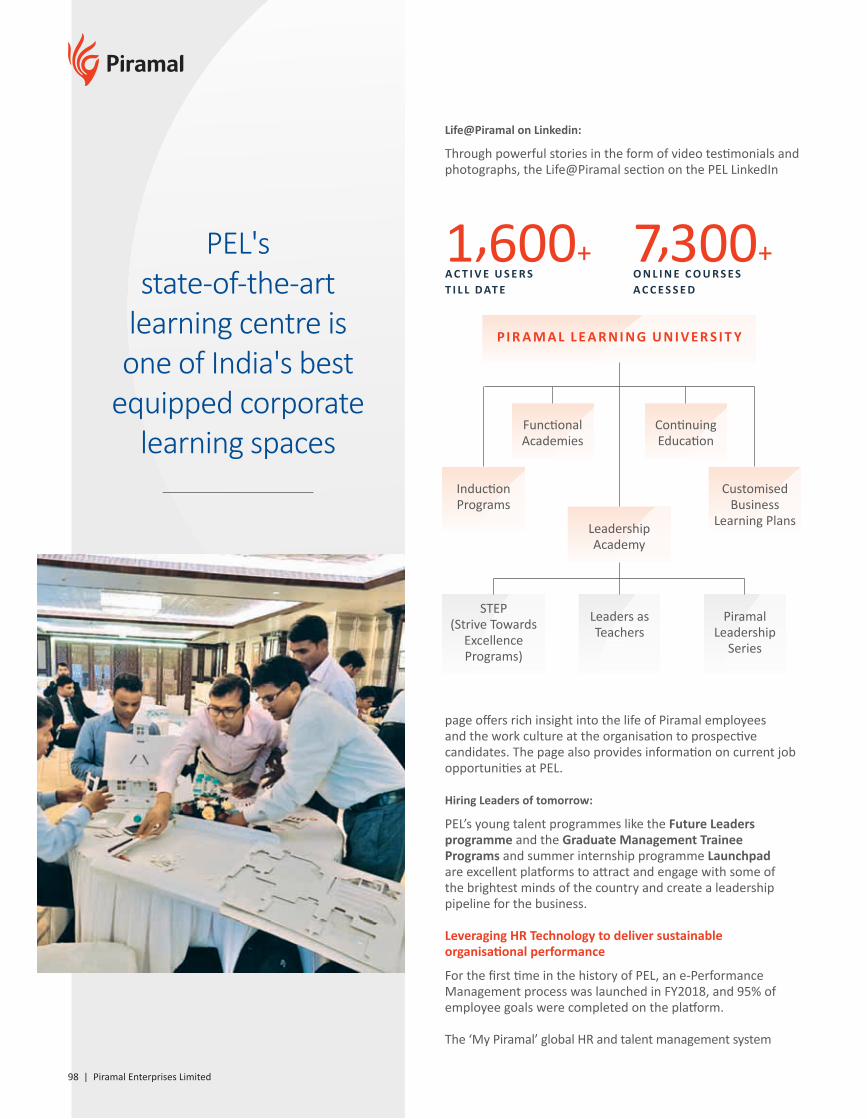
98 | Piramal Enterprises Limited
page offers rich insight into the life of Piramal employees and the work culture at the organisation to prospective candidates. The page also provides information on current job opportunities at PEL.
Hiring Leaders of tomorrow:
PEL’s young talent programmes like the Future Leaders programme and the Graduate Management Trainee Programs and summer internship programme Launchpad are excellent platforms to attract and engage with some of the brightest minds of the country and create a leadership pipeline for the business.
Leveraging HR Technology to deliver sustainable organisational performance
For the first time in the history of PEL, an e-Performance Management process was launched in FY2018, and 95% of employee goals were completed on the platform.
The ‘My Piramal’ global HR and talent management system
PI R A M A L L E A R N I N G U N I V E R S I T Y
Leadership Academy
Leaders as Teachers
Piramal Leadership
Series
STEP(Strive Towards
Excellence Programs)
Induction Programs
Continuing Education
Functional Academies
Customised Business
Learning Plans
1,600+A C T I V E U S E R ST I L L D AT E
7,300+O N L I N E C O U R S E SA C C E S S E D
Life@Piramal on Linkedin:
Through powerful stories in the form of video testimonials and photographs, the Life@Piramal section on the PEL LinkedIn
PEL's state-of-the-art
learning centre is one of India's best
equipped corporate learning spaces
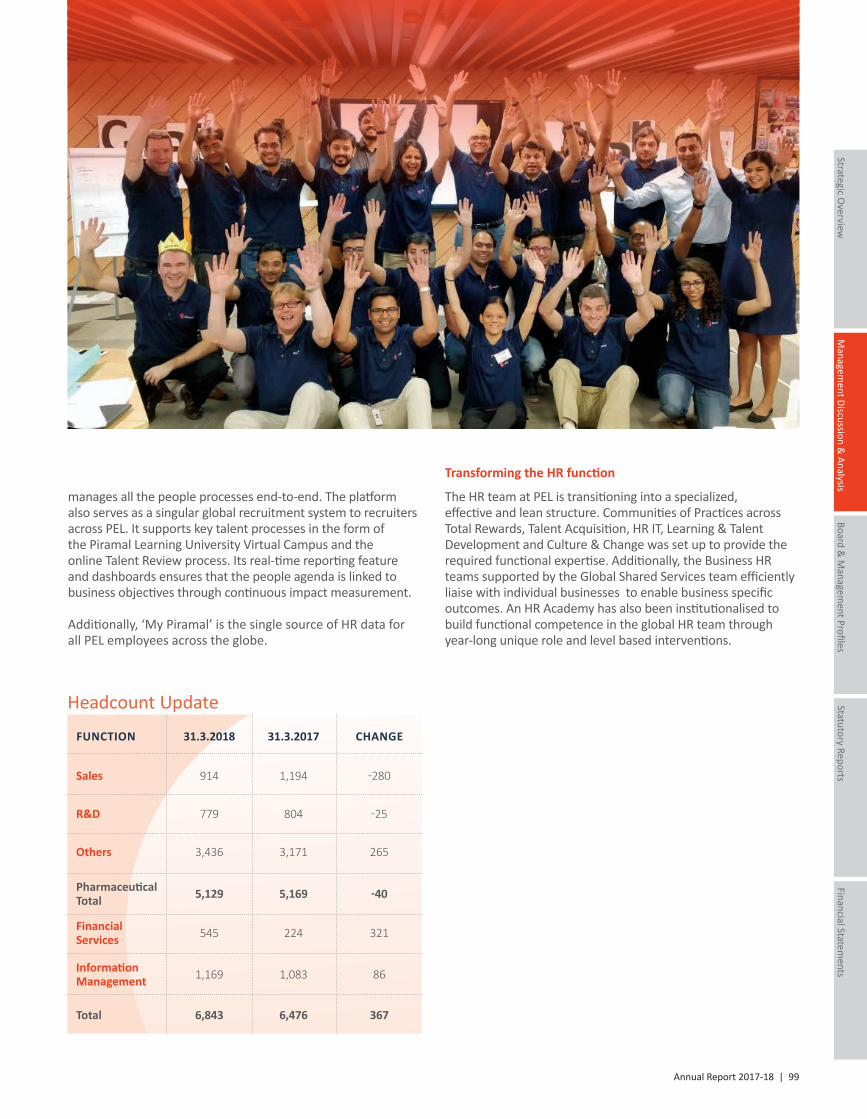
Annual Report 2017-18 | 99
Managem
ent Discussion &
Analysis
Strategic Overview
Board &
Managem
ent ProfilesStatutory Reports
Financial Statements
manages all the people processes end-to-end. The platform also serves as a singular global recruitment system to recruiters across PEL. It supports key talent processes in the form of the Piramal Learning University Virtual Campus and the online Talent Review process. Its real-time reporting feature and dashboards ensures that the people agenda is linked to business objectives through continuous impact measurement.
Additionally, ‘My Piramal’ is the single source of HR data forall PEL employees across the globe.
Headcount Update
31.3.2018 31.3.2017 CHANGE
Sales
R&D
Others
Total
Pharmaceutical Total
Financial Services
Information Management
FUNCTION
914
779
3,436
6,843
5,129
545
1,169
1,194
804
3,171
6,476
5,169
224
1,083
-280
-25
265
367
-40
321
86
Transforming the HR function
The HR team at PEL is transitioning into a specialized, effective and lean structure. Communities of Practices across Total Rewards, Talent Acquisition, HR IT, Learning & Talent Development and Culture & Change was set up to provide the required functional expertise. Additionally, the Business HR teams supported by the Global Shared Services team efficiently liaise with individual businesses to enable business specific outcomes. An HR Academy has also been institutionalised to build functional competence in the global HR team through year-long unique role and level based interventions.
100 | Piramal Enterprises Limited
Information Technology
& Digital—
Vision and StrategyPEL understands that in this
interconnected world, Information Technology (IT) and now Digital
Technology can create and drive market differentiation. Technology is redefining the competitive landscape. It is creating new business models, value chains and
revolutionising the way a company engages with customers, partners and
employees.
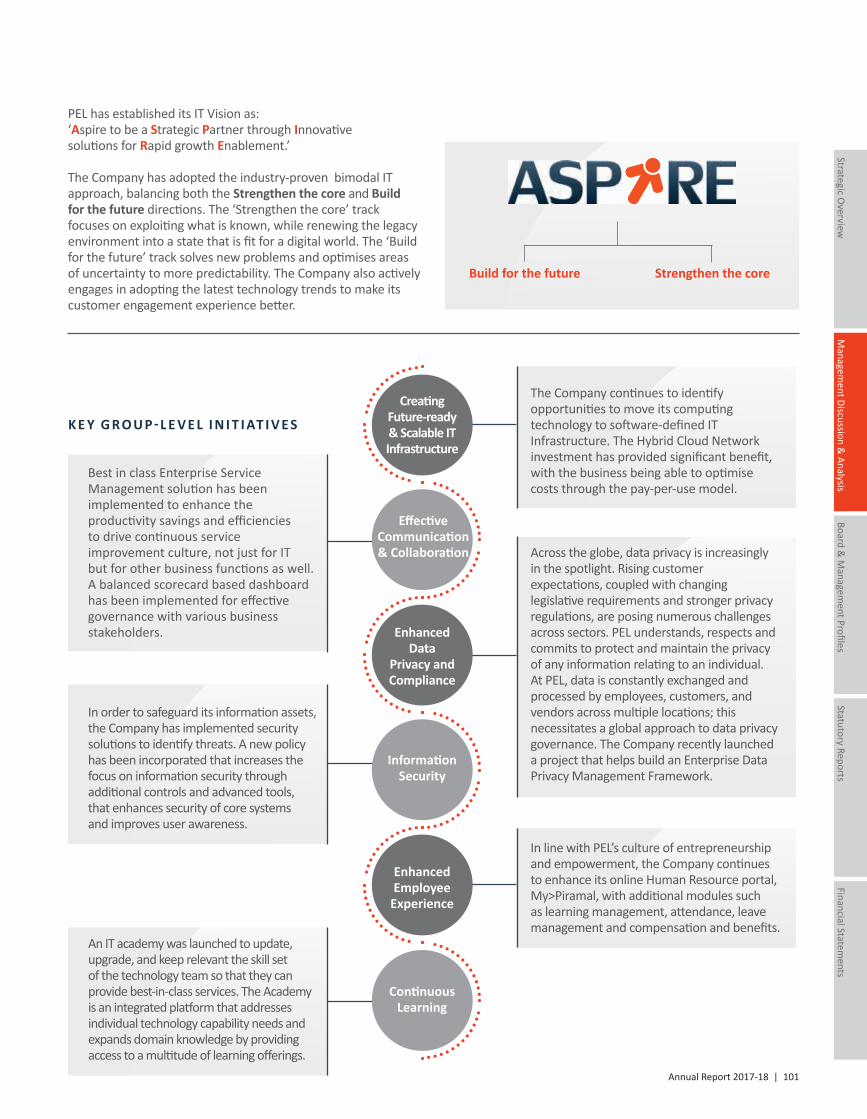
Annual Report 2017-18 | 101
Managem
ent Discussion &
Analysis
Strategic Overview
Board &
Managem
ent ProfilesStatutory Reports
Financial Statements
Best in class Enterprise Service Management solution has been implemented to enhance the productivity savings and efficienciesto drive continuous service improvement culture, not just for ITbut for other business functions as well.A balanced scorecard based dashboard has been implemented for effective governance with various business stakeholders.
In line with PEL’s culture of entrepreneurship and empowerment, the Company continues to enhance its online Human Resource portal, My>Piramal, with additional modules such as learning management, attendance, leave management and compensation and benefits.
PEL has established its IT Vision as:‘Aspire to be a Strategic Partner through Innovativesolutions for Rapid growth Enablement.’
The Company has adopted the industry-proven bimodal IT approach, balancing both the Strengthen the core and Build for the future directions. The ‘Strengthen the core’ track focuses on exploiting what is known, while renewing the legacy environment into a state that is fit for a digital world. The ‘Build for the future’ track solves new problems and optimises areas of uncertainty to more predictability. The Company also actively engages in adopting the latest technology trends to make its customer engagement experience better.
Build for the future Strengthen the core
K E Y G R O U P- L E V E L I N I T I AT I V E S
In order to safeguard its information assets, the Company has implemented security solutions to identify threats. A new policy has been incorporated that increases the focus on information security through additional controls and advanced tools, that enhances security of core systemsand improves user awareness.
An IT academy was launched to update, upgrade, and keep relevant the skill set of the technology team so that they can provide best-in-class services. The Academy is an integrated platform that addresses individual technology capability needs and expands domain knowledge by providing access to a multitude of learning offerings.
Across the globe, data privacy is increasingly in the spotlight. Rising customer expectations, coupled with changing legislative requirements and stronger privacy regulations, are posing numerous challenges across sectors. PEL understands, respects and commits to protect and maintain the privacy of any information relating to an individual. At PEL, data is constantly exchanged and processed by employees, customers, and vendors across multiple locations; this necessitates a global approach to data privacy governance. The Company recently launched a project that helps build an Enterprise Data Privacy Management Framework.
Creating Future-ready & Scalable IT Infrastructure
Effective Communication & Collaboration
Enhanced Employee
Experience
Information Security
Enhanced Data
Privacy and Compliance
Continuous Learning
The Company continues to identify opportunities to move its computing technology to software-defined IT Infrastructure. The Hybrid Cloud Network investment has provided significant benefit, with the business being able to optimise costs through the pay-per-use model.
102 | Piramal Enterprises Limited
B U S I N E S S-S PEC I F I C I N I T I AT I V E S
In addition to taking care of common business needs through the detailed group initiatives listed above, the Company is equally focused on individual business priorities to achieve business-specific goals.
Financial Services
In the Financial Services business, with the presence in both wholesale and retail lending platforms, the Company engages with customers through an end-to-end technology platform that leverages the capabilities of Customer Relationship Management (CRM), Mobility, Loan Origination, Loan Management, Finance & Accounts and Collections.
Key Benefits of the Financial Services initiatives
Superior CustomerExperience
Operational Efficiency
Superior Risk Management
Robust Financial Management
Data Driven Insights for Underwriting
Compliance
Superior Customer Experience: Mobility-first, hub & spoke architecture to seamlessly serve customers over multiple channels and devices
Operational Efficiency: Hub-based underwriting for enhanced consistency in decision-making process, customer experience and better control
Superior Risk Management and Internal Controls: Stronger portfolio-risk management and control, dashboards and data analytics to detect early stresses
Data-Driven Insights for Underwriting: Data architecture and use of analytics across underwriting and portfolio monitoring
Compliance: Zero tolerance approach ensuring we meet strict guidelines set by Regulators
PHARMA
The Company continues to focus on digital and innovative technology solutions considering the business dynamics, regulatory requirements, scalability and its inorganic and organic business growth. Its technology solutions have yielded higher stakeholder value by creating better operational efficiency, improved margins and higher customer satisfaction.
The Company constantly looks for identifying transformative use-cases applying futuristic technologies like Robotic Process Automation, Chatbots, etc. to add value to business.
Some of the key technology initiatives implemented this year that are expected to garner several benefits for the business:
Annual Report 2017-18 | 103
Managem
ent Discussion &
Analysis
Strategic Overview
Board &
Managem
ent ProfilesStatutory Reports
Financial Statements
Key Benefits of the Pharma Initiatives
Enriched customer experiences byusing holistic IT solutions
Strengthen Quality & Regulatorysystems with continued focus on Compliance through digitisation
Improve Process Efficiency usingDigital Technologies
Increase Automation of CoreTransaction of Processing Systems
Enhanced Customer Experience: Integrated Project Management and a dashboard platform for transparent access of information by the customer
Operational Efficiency: Newly acquired entities and products seamlessly integrated into enterprise-wide core systems and processes to increase overall productivity
Regulatory Requirements Compliance: Continued focus on automation of regulatory and quality systems across all locations
Real-Time Decision-making: Automation of advanced business intelligence to enable real-time decision-making
Healthcare Insight & Analytics
• Leveraged prior investments in insights platform to efficiently bring our MedTech reports onto common insights platform and enhance Digital’s product presentation.
• DRG formed a new team focused on building a technology platform for integrating our growing repository of 'real-world data'. The real-world repository comprises large volumes of insurance claims and medical records covering hundreds of millions of lives and several billion healthcare events. The team rapidly implemented a platform that houses over 100 terabytes of source data using a state-of-the-art, cloud-based platform. It today supports over 200 users and is a foundational component of our growth in both our research and analytics business.
• DRG has built and implemented a global intranet populated with company updates and community stories; this platform facilitates cross-business understanding and culture. The Company has also shifted digital communication to a new application that integrates fully with its existing suite of tools and encourages collaboration.
G O I N G F O RWA R D
As we enter a period where technology increasingly redefines traditional business models, Information Technology will continue to play a very important part of PEL’s business transformation journey. Digitisation with disruptive technologies and excellence in operation will continue to be core to the Company’s IT strategy in providing superior experience and convenience to customers.
104 | Piramal Enterprises Limited
Data and Analytics
—Being a large conglomerate with presence
across diverse sectors and geographies, PEL has generated a phenomenal amount
of quality data over the years. The Company leverages this information and
turns it into a competitive advantage.
Annual Report 2017-18 | 105
Managem
ent Discussion &
Analysis
Strategic Overview
Board &
Managem
ent ProfilesStatutory Reports
Financial Statements
The Data and Analytics function is gradually becoming the pulse of the organisation and is being incorporated into all key decisions across sales, product development, marketing, HR, supply chain, customer experience and other core functions. Recognising its importance, the Company has placed its in-house central data and analytics function at the corporate level, creating a standardised and globalised framework with diverse applicability and replicability across the Company’s many businesses.
The Company’s differentiated internal setup has a team of 12 dedicated data scientists and is led by an expert who has two decades of experience in data analytics and machine learning. The team members are a combination of experienced individuals and freshers from top tier colleges across India, such as IITs and IIMs. This expert team takes up projects for various businesses and helps in insightful and informed decision-making.
Key initiatives during the year: F I N A N C I A L S E RV I C E S
Piramal Housing Finance:
The power of data has been effectively used in estimating the possibility of loan defaults on every application received, thereby minimising any probable future Non-Performing Assets (NPAs).
The Data Analytics team has developed an automated proprietary fraud analytical rule engine that has strengthened the loan application screening process and has helped identify fraudulent applications. The engine scrutinises the applications that have been processed through an external database and matches the information in these applications with the Company’s internal data and other public domain information. The applications are scrutinised across 60 parameters and inconsistences are red-flagged. Only those applications that successfully pass the scrutiny move to the next level in the loan approval process.
Further, the team is in the process of implementing its first-generation Piramal credit risk model for retail to minimise risk and provide superior customer experience by improving the turnaround time for loan processing. Since Piramal Housing Finance is a new entrant in the heavily NPA-laden sector, this level of insight is proving to be a game changer for the business.
Real Estate Developer Financing:
The team is developing an early-warning predictive model for asset monitoring. This model will identify deals that could potentially go into stress in the next six months and minimise NPA risk, leveraging both the Company’s proprietary data as well as the rich external data sources. The team is also in the process of creating a developer worthiness scorecard, which will analyse the credit worthiness of developers for construction finance loans.
PH A R M A
Consumer Products
Analytics has become instrumental in making decisions in the Sales and Operations. The segment now uses analytics in a wide array of activities, ranging from fixing the sales strategy at
the field level to making people development programmes for reducing talent loss. The sales team uses a proprietary ‘Sales Recommendation Model’ mobile reporting app, which was designed by the Analytics team using predictive analytics that helps in selling the right product at the right value to the right store. The Analytics team also helped design trade promotions to push sales and optimise marketing spend.
PI R A M A L F O U N DAT I O N (S WA S T H YA)
Piramal Swasthya’s primary focus is on healthcare provision for the needy. Its reach is being widened using data analytics. In fact, the application of data interpretation could be a revolution-in-the-making in India’s healthcare system. Its ability to assist in smart decision-making can potentially help mitigate future epidemics through predictive modelling and trend detection techniques. Similarly, it can provide customised medical counselling for people in the remote and rural areas. The Analytics team is currently creating a unique Intellectual Property that can help in clinical trials and increase efficiencies across initiatives.
Going Ahead
The world around us is changing rapidly and technologies such as analytics, artificial intelligence, machine learning and blockchain, among others, are increasingly becoming commonplace. These technologies will soon determine how organisations function, driven by contemporary business models.
Going forward, data analytics is expected to complement and function in line with the following future trends:
1. Data volumes will continue to grow and ways to analyse data will improve with better tools and greater team experience.
2. Predictive analysis will be built into the current systems with real-time knowledge generation (e.g. Uno integration).
3. Challenges such as human bias and oversight across several businesses will be minimalised.
4. ‘Fast data’ and ‘actionable data’ will replace ‘big data.’ The focus will be on a clear query and response system, with emphasis on asking the right questions and using the different kinds of data available.
Piramal has always recognised that change is the only constant. Now, with analytics gaining ground as an industry standard, the Company is focusing on leveraging this new technology to ensure its continuous success and growth. Within the next couple of years, data-driven decision-making will become an essential part of Piramal’s everyday operations. As the Company adopts and builds on analytics as a fundamental instrument in its business processes, it expects to see the following materialise in the near term:
1. Piramal’s Analytics team members moving in-line functions at different leadership levels so that the data-driven best practices get imbibed seamlessly
2. A quarterly update being presented to the Board on the different analytics, similar to the regular updates on financial and operational parameters
3. A safe guard being created around the Company’s business by leveraging technology, analytics and process enhancements
As an organisation, Piramal is thus strongly pursuing technology-enabled opportunities, adapting contemporary best practices to deliver exceptional business and social value.
Environment,Health & Safety
—
PEL’s determination to enrich lives, preserve the natural environment, and promote
community wellbeing is accompanied by its unwavering commitment to good corporate
governance, business responsibility, operational excellence and employee
wellbeing.
Annual Report 2017-18 | 107
Managem
ent Discussion &
Analysis
Strategic Overview
Board &
Managem
ent ProfilesStatutory Reports
Financial Statements
Health• Health of employees and contractors is monitored through
pre-medical check-ups and periodic medical check-ups• Employees are counselled after every medical check-up by
a factory medical officer• The Company commenced a risk-based employee
assessment programme to assess chemical concentration exposure to employees
SafetyThe Company protects and enhances the wellbeing of its employees, partners and visitors to its offices. A safe working environment is non-negotiable at PEL, for which it follows global safety standards in all its operations. The safety practices at PEL ensure that all possible hazards are identified and eliminated.
The Company has been achieving continuous improvement in safety performance through a combination of systems and processes as well as cooperation, involvement and support of all employees. As a result, the total recorded injury rate witnessed a reduction during the year. To prevent serious injury and fatalities, the Company has implemented the following programmes:
0.37FY2016
FY2017 0.31
FY2018 0.17
Incident Statistics — Total Recordable Injury Rate
N O FATA L I N C I D E N T S A N D N O L O S S T I M E I N J U RY I N F Y2018
• Engagement of DuPont for behaviour-based safety training: A customised behavioural safety framework is being developed and implemented across PEL’s Indian sites to improve risk perception and remove the at-risk behaviour of employees at work
• Contractor safety management • Proactive safety inspection programme• Corporate EHS audit by cross-functional EHS site team• Hazard recognition programme implemented to report
near-miss and unsafe conditions
Identifying and recording near-misses and unsafe conditions, and correcting them, is an efficient indicator of risk reduction and shows the organisational bent towards improving the EHS culture.
Y-o-Y increase in EHS Training Man HoursFY2016
FY2017
FY2018
14%
21%
49%
D E V E L O PI N G A N E H S L E A R N I N G C U LT U R E
The Company invests resources and efforts into training and hardware upgradation to improve its safety performance every year. The total training man hours improved by more than 49% Y-o-Y in FY2018.
Near Miss & Unsafe Condition Reporting Number
FY2016 10%
FY2017 23%
FY2018 38%
S O C I O - E N V I R O N M E N T I M PAC T M E T E R
In PEL, the various sites are working on different initiatives to prevent ecological, economic and social consequences by reducing usage of water, energy & Greenhouse Gases (GHG).
The consolidated results of implementation achieved included savings of 14% in water usage, 2% in electricity usage and 1.1% in GHG usage. This socio-environmental impact meter is an indicator of the performance.
The Environment, Health and Safety (EHS) initiatives are designed to create long-term sustainability and value for the Company and all other stakeholders. The Company has also adopted the ‘CORE’ (Creating Optimal and Responsible Environment) initiative, which has helped contribute to the larger goal of sustainable development.
EnvironmentPEL is committed to conserving resources as it recognises the importance of preserving the environment. The Company has adopted the 'reuse and recycle' mantra for natural resources and has developed adequate infrastructure to treat and reuse waste water. The CORE programme was launched to drive sustainability initiatives across Piramal Pharma Solutions.
Some initiatives under the CORE programme are:
Energy efficiency initiatives such as reduction in the power usages by using energy efficient alternatives, modifications in the utility pipelines, using timers to control light fixtures etc. resulted in reduction of carbon footprint
Water conservation initiatives such as steam condensation to recirculate to boiler, modifications in manufacturing processes and use of efficient alternatives to reduce tap water flow
Waste reuse and recycle rate increased by 12% in FY2018.
• 100% Non-hazardous waste sent for recycling• Increased tree plantation by 3% over the previous year • CO2 offset by various tree plantations increased by 3%
108 | Piramal Enterprises Limited
CorporateSocial
Responsibility—
Piramal Foundation is the philanthropic arm of the Piramal Group. It develops innovative approaches and solutions
to resolve issues that are critical roadblocks towards unlocking India’s
economic potential. The Company believes in collaborating with
like-minded partners and nurtures projects that are scalable and deliver
a sustainable impact.
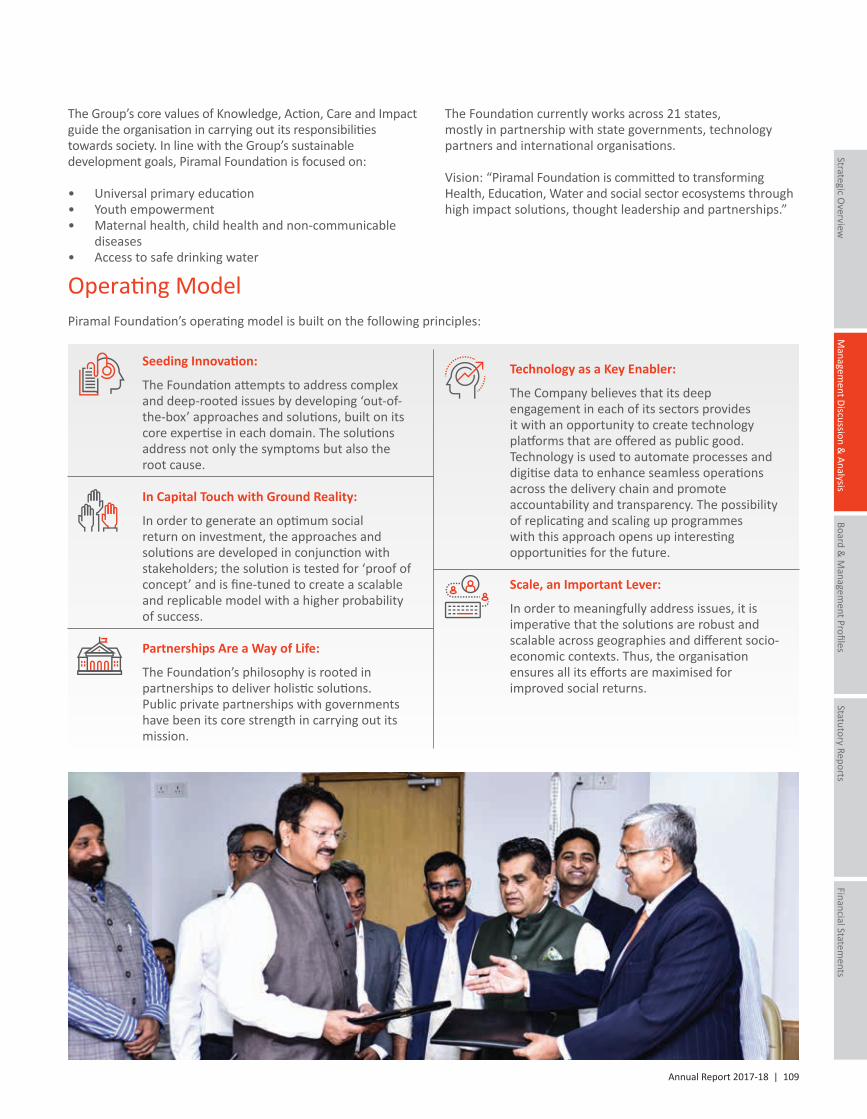
Annual Report 2017-18 | 109
Managem
ent Discussion &
Analysis
Strategic Overview
Board &
Managem
ent ProfilesStatutory Reports
Financial Statements
The Group’s core values of Knowledge, Action, Care and Impact guide the organisation in carrying out its responsibilities towards society. In line with the Group’s sustainable development goals, Piramal Foundation is focused on:
• Universal primary education • Youth empowerment • Maternal health, child health and non-communicable
diseases • Access to safe drinking water
The Foundation currently works across 21 states,mostly in partnership with state governments, technology partners and international organisations.
Vision: “Piramal Foundation is committed to transforming Health, Education, Water and social sector ecosystems through high impact solutions, thought leadership and partnerships.”
Operating Model Piramal Foundation’s operating model is built on the following principles:
Seeding Innovation:
The Foundation attempts to address complex and deep-rooted issues by developing ‘out-of-the-box’ approaches and solutions, built on its core expertise in each domain. The solutions address not only the symptoms but also the root cause.
In Capital Touch with Ground Reality:
In order to generate an optimum social return on investment, the approaches and solutions are developed in conjunction with stakeholders; the solution is tested for ‘proof of concept’ and is fine-tuned to create a scalable and replicable model with a higher probability of success.
Partnerships Are a Way of Life:
The Foundation’s philosophy is rooted in partnerships to deliver holistic solutions. Public private partnerships with governments have been its core strength in carrying out its mission.
Technology as a Key Enabler:
The Company believes that its deep engagement in each of its sectors provides it with an opportunity to create technology platforms that are offered as public good. Technology is used to automate processes and digitise data to enhance seamless operations across the delivery chain and promote accountability and transparency. The possibility of replicating and scaling up programmes with this approach opens up interesting opportunities for the future.
Scale, an Important Lever:
In order to meaningfully address issues, it is imperative that the solutions are robust and scalable across geographies and different socio-economic contexts. Thus, the organisation ensures all its efforts are maximised for improved social returns.
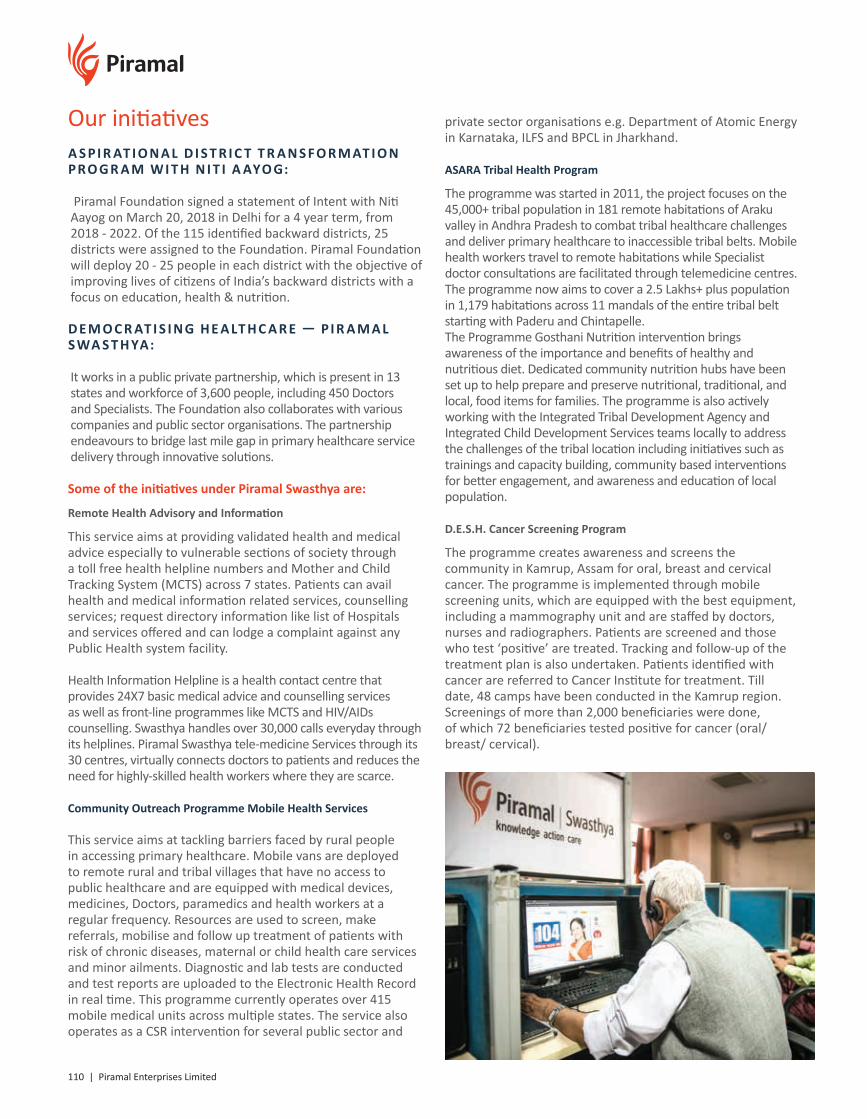
110 | Piramal Enterprises Limited
Our initiatives A S PI R AT I O N A L D I S T R I C T T R A N S F O R M AT I O N PR O G R A M W I T H N I T I A AYO G:
Piramal Foundation signed a statement of Intent with Niti Aayog on March 20, 2018 in Delhi for a 4 year term, from 2018 - 2022. Of the 115 identified backward districts, 25 districts were assigned to the Foundation. Piramal Foundation will deploy 20 - 25 people in each district with the objective of improving lives of citizens of India’s backward districts with a focus on education, health & nutrition.
D E M O C R AT I S I N G H E A LT H C A R E — P I R A M A L S WA S T H YA:
It works in a public private partnership, which is present in 13 states and workforce of 3,600 people, including 450 Doctors and Specialists. The Foundation also collaborates with various companies and public sector organisations. The partnership endeavours to bridge last mile gap in primary healthcare service delivery through innovative solutions.
Some of the initiatives under Piramal Swasthya are:
Remote Health Advisory and Information
This service aims at providing validated health and medical advice especially to vulnerable sections of society through a toll free health helpline numbers and Mother and Child Tracking System (MCTS) across 7 states. Patients can avail health and medical information related services, counselling services; request directory information like list of Hospitals and services offered and can lodge a complaint against any Public Health system facility.
Health Information Helpline is a health contact centre that provides 24X7 basic medical advice and counselling services as well as front-line programmes like MCTS and HIV/AIDs counselling. Swasthya handles over 30,000 calls everyday through its helplines. Piramal Swasthya tele-medicine Services through its 30 centres, virtually connects doctors to patients and reduces the need for highly-skilled health workers where they are scarce.
Community Outreach Programme Mobile Health Services
This service aims at tackling barriers faced by rural people in accessing primary healthcare. Mobile vans are deployed to remote rural and tribal villages that have no access to public healthcare and are equipped with medical devices, medicines, Doctors, paramedics and health workers at a regular frequency. Resources are used to screen, make referrals, mobilise and follow up treatment of patients with risk of chronic diseases, maternal or child health care services and minor ailments. Diagnostic and lab tests are conducted and test reports are uploaded to the Electronic Health Record in real time. This programme currently operates over 415 mobile medical units across multiple states. The service also operates as a CSR intervention for several public sector and
private sector organisations e.g. Department of Atomic Energy in Karnataka, ILFS and BPCL in Jharkhand.
ASARA Tribal Health Program
The programme was started in 2011, the project focuses on the 45,000+ tribal population in 181 remote habitations of Araku valley in Andhra Pradesh to combat tribal healthcare challenges and deliver primary healthcare to inaccessible tribal belts. Mobile health workers travel to remote habitations while Specialist doctor consultations are facilitated through telemedicine centres. The programme now aims to cover a 2.5 Lakhs+ plus population in 1,179 habitations across 11 mandals of the entire tribal belt starting with Paderu and Chintapelle. The Programme Gosthani Nutrition intervention brings awareness of the importance and benefits of healthy and nutritious diet. Dedicated community nutrition hubs have been set up to help prepare and preserve nutritional, traditional, and local, food items for families. The programme is also actively working with the Integrated Tribal Development Agency and Integrated Child Development Services teams locally to address the challenges of the tribal location including initiatives such as trainings and capacity building, community based interventions for better engagement, and awareness and education of local population.
D.E.S.H. Cancer Screening Program
The programme creates awareness and screens the community in Kamrup, Assam for oral, breast and cervical cancer. The programme is implemented through mobile screening units, which are equipped with the best equipment, including a mammography unit and are staffed by doctors, nurses and radiographers. Patients are screened and those who test ‘positive’ are treated. Tracking and follow-up of the treatment plan is also undertaken. Patients identified with cancer are referred to Cancer Institute for treatment. Till date, 48 camps have been conducted in the Kamrup region. Screenings of more than 2,000 beneficiaries were done, of which 72 beneficiaries tested positive for cancer (oral/ breast/ cervical).
Annual Report 2017-18 | 111
Managem
ent Discussion &
Analysis
Strategic Overview
Board &
Managem
ent ProfilesStatutory Reports
Financial Statements
ASHWAS – Non-Communicable Disease Management Program
The programme is a community based Non Communicable Disease (NCDs) intervention programme focused on timely screening, identification and treatment of Diabetic and Hypertensive patients. The programme also aims to reduce the incidence of Diabetes and Hypertension through preventive, predictive and promotive means of Healthcare service delivery. ASHWAS leverages outreach mobile medical unit and a day clinic at Digwal, Telangana to cover 32 villages in the project area. Patients requiring specialist intervention are referred to specialist doctors located in the telemedicine centre at Hyderabad. Mobile vans travel 24 days a month to villages, following a schedule shared with the ASHA/ANMs of the respective villages. Transport is also arranged for patients in need of further consultation.
Mobile Telemedicine Services — Integrated Healthcare Delivery Model
This initiative screens and offers validated healthcare services and specialist consultation through Mobile Telemedicine in the Majuli (Jorhat) region of Assam where the maternal and infant mortality rates are higher than the rest of Assam. The programme seeks to provide remote specialist consultation services for ANC (RMNCH+A), Diabetes and Hypertension (NCDs) through Mobile telemedicine connecting to a Specialist Doctor based Guwahati. Beneficiaries are provided a state-of-the-art innovative communication unit. The Mobile Telemedicine Service (MTMS) unit enables a connect to the specialist remotely through video calling facility. The programme has a potential to be expanded to other districts apart from Majuli in the near future.
Accessible Medical Record via Integrated Technologies (AMRIT) Integrated Electrical Medical Record
The programme is an integrated platform that will soon be ready to store patient medical records with a unique beneficiary ID and capture data for Antenatal, Postnatal care and Non-communicable Diseases (including cervical, breast and oral cancer).
Outcome of Piramal Swasthya
• Served more than 9.6 Crores beneficiaries (including revisits) till March 2018
• More than 4.8 Crores beneficiaries have been provided validated health advice through our remote health advisory and intervention services across 7 states through 252 call centre seats
• 4.5 Crores beneficiaries have been delivered health facilities at their doorstep through community outreach programme in 11 states through 410 Mobile Medical Vans
• 2 Lakh beneficiaries have been provided specialist consultation through telemedicine services spread across 4 states
• Geographic outreach: 13 states
S U S TA I N A B L E WAT E R S O LU T I O N S — P I R A M A L S A RVA JA L
The programme innovates, demonstrates, enables and promotes sustainable water solutions for those lacking access to safe drinking water and focuses on last mile delivery of safe drinking water at affordable prices by installing community-level purification plants and water ATMs. It uses cutting-edge, top-of-the-line technology to operate state-of-the-art water treatment and distribution systems. The programme is a socially conscious model which enables sustainable livelihood opportunities for the communities.
Some of its unique features:
Partnership Solution
The programme offers water purification plants and solar powered, cloud connected Water ATMs for remote and off-grid locations. Remote monitoring of real time field data and vital process parameters leads to better project management and water quality. Field teams provide business support for local entrepreneurs, engage community leaders and lead door to door health awareness campaigns.
Leveraging Technology
The programme has been a pioneer in deploying remotely tracked decentralised drinking water purification systems and solar powered, cloud-connected, smart card based automatic water vending machines, popularised as Water ATMs — both of which were granted patents in USA. Cashless transactions, off-grid capability, pay-per-use methodology, 24x7 service availability, user-level transaction mapping, real-time impact monitoring, and provision for targeted subsidies are the unique advantages offered by this solution.
Increasing Reach
The programme was conceptualised in 2009 in Bagar, Rajasthan. Through the learnings in the subsequent years, Sarvajal adopted a model that placed a village level entrepreneur (VLE) at the centre of the value chain. Today, as many as 220+ VLEs serve ultra-affordable safe drinking water to more than 200,000 consumers daily in large villages and small towns through maintenance and community awareness support from Sarvajal. For smaller villages, donor collaboration model was adopted. The Hub and Spoke model serves areas that may not be well equipped with power or piped water supply. This model was pioneered for the urban slums in Delhi and replicated in Bhubaneshwar, the first Smart City to set-up a 'Hub-N-Spokes' water ATM project.
Outcome of Piramal Sarvajal
• Reaches out to 5,03,000+ consumers on a daily basis through 1,140+ touch-points across 16 states
• Rural entrepreneur model helped seed 400+ entrepreneurs, thereby providing employment to over 1,000+ individuals
• Real-time monitoring and accountability to drinking water solutions
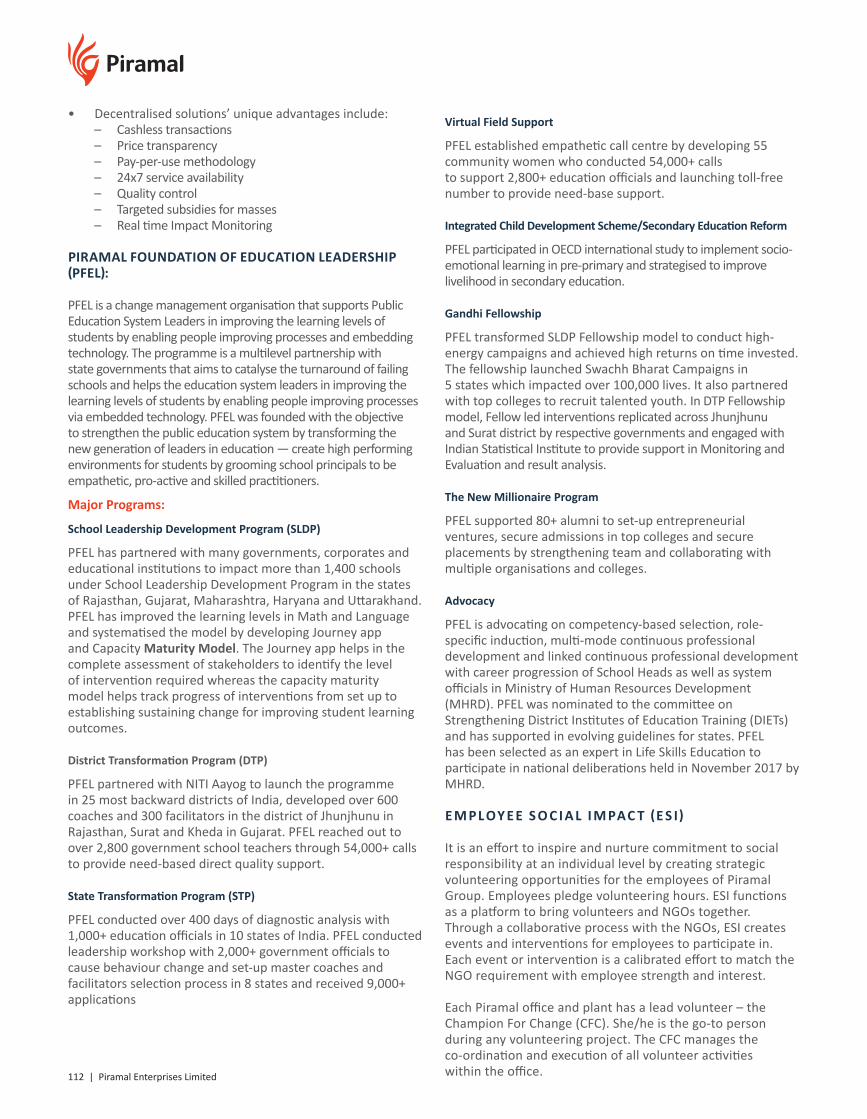
112 | Piramal Enterprises Limited
Virtual Field Support
PFEL established empathetic call centre by developing 55 community women who conducted 54,000+ calls to support 2,800+ education officials and launching toll-free number to provide need-base support.
Integrated Child Development Scheme/Secondary Education Reform
PFEL participated in OECD international study to implement socio-emotional learning in pre-primary and strategised to improve livelihood in secondary education.
Gandhi Fellowship
PFEL transformed SLDP Fellowship model to conduct high-energy campaigns and achieved high returns on time invested. The fellowship launched Swachh Bharat Campaigns in 5 states which impacted over 100,000 lives. It also partnered with top colleges to recruit talented youth. In DTP Fellowship model, Fellow led interventions replicated across Jhunjhunu and Surat district by respective governments and engaged with Indian Statistical Institute to provide support in Monitoring and Evaluation and result analysis. The New Millionaire Program
PFEL supported 80+ alumni to set-up entrepreneurial ventures, secure admissions in top colleges and secure placements by strengthening team and collaborating with multiple organisations and colleges.
Advocacy
PFEL is advocating on competency-based selection, role-specific induction, multi-mode continuous professional development and linked continuous professional development with career progression of School Heads as well as system officials in Ministry of Human Resources Development (MHRD). PFEL was nominated to the committee on Strengthening District Institutes of Education Training (DIETs) and has supported in evolving guidelines for states. PFEL has been selected as an expert in Life Skills Education to participate in national deliberations held in November 2017 by MHRD.
E M PL OY E E S O C I A L I M PAC T (E S I)
It is an effort to inspire and nurture commitment to social responsibility at an individual level by creating strategic volunteering opportunities for the employees of Piramal Group. Employees pledge volunteering hours. ESI functions as a platform to bring volunteers and NGOs together. Through a collaborative process with the NGOs, ESI creates events and interventions for employees to participate in. Each event or intervention is a calibrated effort to match the NGO requirement with employee strength and interest. Each Piramal office and plant has a lead volunteer – the Champion For Change (CFC). She/he is the go-to person during any volunteering project. The CFC manages the co-ordination and execution of all volunteer activities within the office.
• Decentralised solutions’ unique advantages include: – Cashless transactions – Price transparency – Pay-per-use methodology – 24x7 service availability – Quality control – Targeted subsidies for masses – Real time Impact Monitoring
PIRAMAL FOUNDATION OF EDUCATION LEADERSHIP (PFEL):
PFEL is a change management organisation that supports Public Education System Leaders in improving the learning levels of students by enabling people improving processes and embedding technology. The programme is a multilevel partnership with state governments that aims to catalyse the turnaround of failing schools and helps the education system leaders in improving the learning levels of students by enabling people improving processes via embedded technology. PFEL was founded with the objective to strengthen the public education system by transforming the new generation of leaders in education — create high performing environments for students by grooming school principals to be empathetic, pro-active and skilled practitioners.
Major Programs:
School Leadership Development Program (SLDP)
PFEL has partnered with many governments, corporates and educational institutions to impact more than 1,400 schools under School Leadership Development Program in the states of Rajasthan, Gujarat, Maharashtra, Haryana and Uttarakhand. PFEL has improved the learning levels in Math and Language and systematised the model by developing Journey app and Capacity Maturity Model. The Journey app helps in the complete assessment of stakeholders to identify the level of intervention required whereas the capacity maturity model helps track progress of interventions from set up to establishing sustaining change for improving student learning outcomes.
District Transformation Program (DTP)
PFEL partnered with NITI Aayog to launch the programme in 25 most backward districts of India, developed over 600 coaches and 300 facilitators in the district of Jhunjhunu in Rajasthan, Surat and Kheda in Gujarat. PFEL reached out to over 2,800 government school teachers through 54,000+ calls to provide need-based direct quality support.
State Transformation Program (STP)
PFEL conducted over 400 days of diagnostic analysis with 1,000+ education officials in 10 states of India. PFEL conducted leadership workshop with 2,000+ government officials to cause behaviour change and set-up master coaches and facilitators selection process in 8 states and received 9,000+ applications
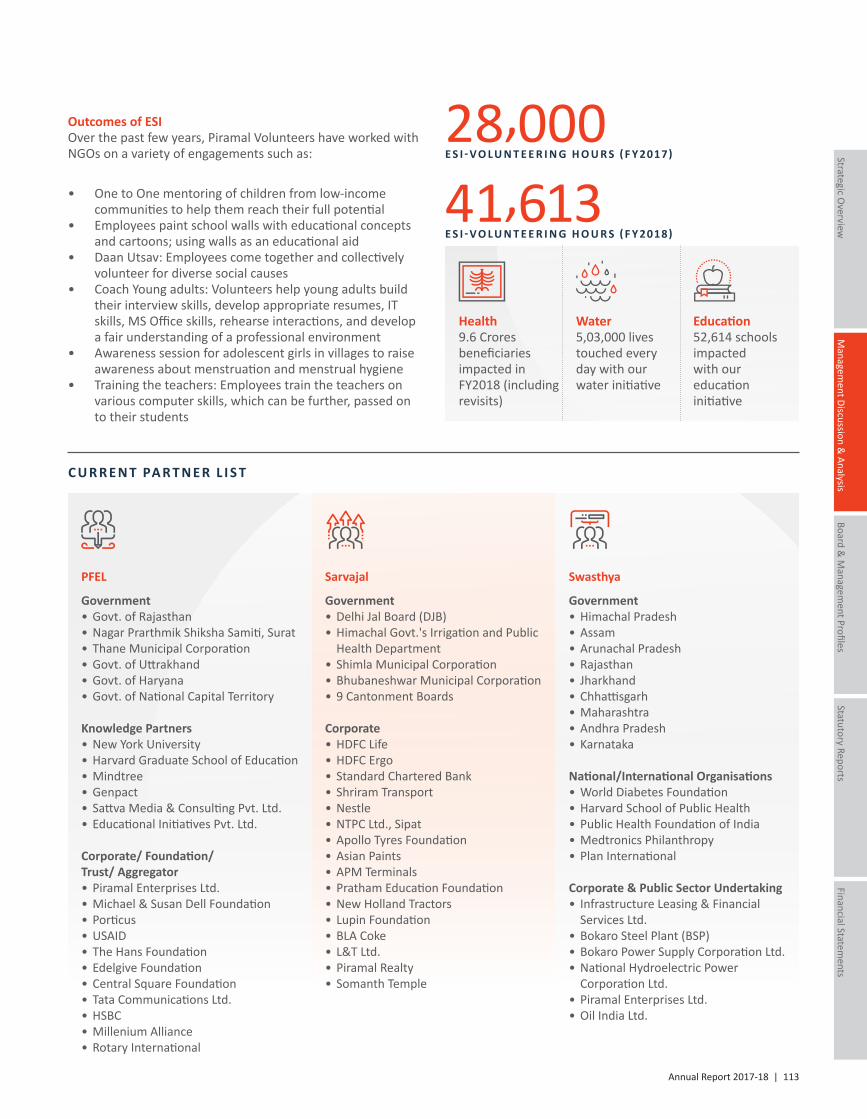
Annual Report 2017-18 | 113
Managem
ent Discussion &
Analysis
Strategic Overview
Board &
Managem
ent ProfilesStatutory Reports
Financial Statements
28,000E S I - V O L U N T E E R I N G H O U R S ( F Y 2017)
41,613E S I - V O L U N T E E R I N G H O U R S ( F Y 2018)
Outcomes of ESI Over the past few years, Piramal Volunteers have worked with NGOs on a variety of engagements such as:
• One to One mentoring of children from low-income communities to help them reach their full potential
• Employees paint school walls with educational concepts and cartoons; using walls as an educational aid
• Daan Utsav: Employees come together and collectively volunteer for diverse social causes
• Coach Young adults: Volunteers help young adults build their interview skills, develop appropriate resumes, IT skills, MS Office skills, rehearse interactions, and develop a fair understanding of a professional environment
• Awareness session for adolescent girls in villages to raise awareness about menstruation and menstrual hygiene
• Training the teachers: Employees train the teachers on various computer skills, which can be further, passed on to their students
Sarvajal
Government• Delhi Jal Board (DJB)• Himachal Govt.'s Irrigation and Public
Health Department• Shimla Municipal Corporation• Bhubaneshwar Municipal Corporation• 9 Cantonment Boards
Corporate• HDFC Life• HDFC Ergo• Standard Chartered Bank• Shriram Transport• Nestle• NTPC Ltd., Sipat• Apollo Tyres Foundation• Asian Paints• APM Terminals• Pratham Education Foundation• New Holland Tractors• Lupin Foundation• BLA Coke• L&T Ltd.• Piramal Realty• Somanth Temple
PFEL
Government• Govt. of Rajasthan• Nagar Prarthmik Shiksha Samiti, Surat• Thane Municipal Corporation• Govt. of Uttrakhand• Govt. of Haryana• Govt. of National Capital Territory
Knowledge Partners• New York University• Harvard Graduate School of Education• Mindtree• Genpact• Sattva Media & Consulting Pvt. Ltd.• Educational Initiatives Pvt. Ltd.
Corporate/ Foundation/ Trust/ Aggregator• Piramal Enterprises Ltd.• Michael & Susan Dell Foundation• Porticus• USAID• The Hans Foundation• Edelgive Foundation• Central Square Foundation• Tata Communications Ltd.• HSBC• Millenium Alliance• Rotary International
Swasthya
Government• Himachal Pradesh• Assam• Arunachal Pradesh• Rajasthan• Jharkhand• Chhattisgarh• Maharashtra• Andhra Pradesh• Karnataka
National/International Organisations• World Diabetes Foundation• Harvard School of Public Health• Public Health Foundation of India• Medtronics Philanthropy• Plan International
Corporate & Public Sector Undertaking• Infrastructure Leasing & Financial
Services Ltd.• Bokaro Steel Plant (BSP)• Bokaro Power Supply Corporation Ltd.• National Hydroelectric Power
Corporation Ltd.• Piramal Enterprises Ltd.• Oil India Ltd.
C U R R E N T PA R T N E R L I S T
Health9.6 Crores beneficiaries impacted in FY2018 (including revisits)
Water5,03,000 lives touched everyday with ourwater initiative
Education52,614 schools impactedwith oureducation initiative

114 | Piramal Enterprises Limited
Awards & Recognition
Ajay Piramal, Chairman, was honoured with CNBC Asia Business Leader of the Year Award, 2017
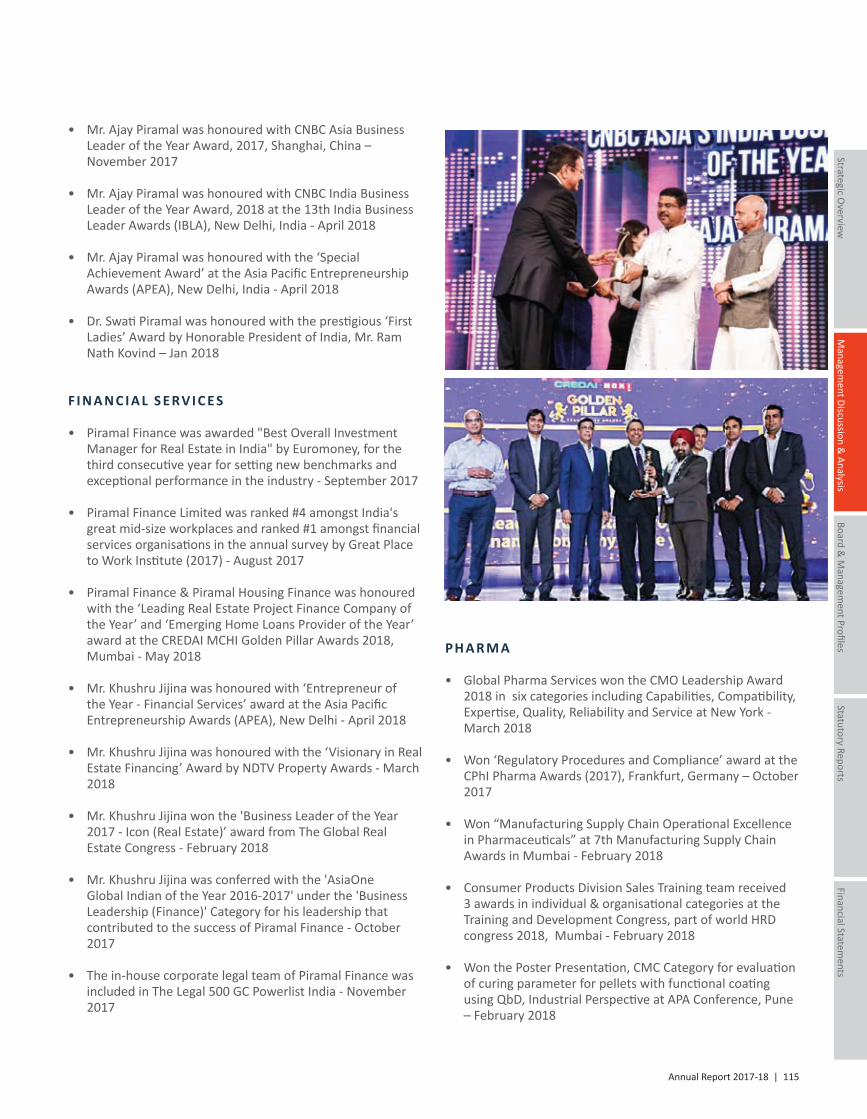
Annual Report 2017-18 | 115
Managem
ent Discussion &
Analysis
Strategic Overview
Board &
Managem
ent ProfilesStatutory Reports
Financial Statements
• Mr. Ajay Piramal was honoured with CNBC Asia Business Leader of the Year Award, 2017, Shanghai, China – November 2017
• Mr. Ajay Piramal was honoured with CNBC India Business Leader of the Year Award, 2018 at the 13th India Business Leader Awards (IBLA), New Delhi, India - April 2018
• Mr. Ajay Piramal was honoured with the ‘Special Achievement Award’ at the Asia Pacific Entrepreneurship Awards (APEA), New Delhi, India - April 2018
• Dr. Swati Piramal was honoured with the prestigious ‘First Ladies’ Award by Honorable President of India, Mr. Ram Nath Kovind – Jan 2018
F I N A N C I A L S E RV I C E S
• Piramal Finance was awarded "Best Overall Investment Manager for Real Estate in India" by Euromoney, for the third consecutive year for setting new benchmarks and exceptional performance in the industry - September 2017
• Piramal Finance Limited was ranked #4 amongst India's great mid-size workplaces and ranked #1 amongst financial services organisations in the annual survey by Great Place to Work Institute (2017) - August 2017
• Piramal Finance & Piramal Housing Finance was honoured with the ‘Leading Real Estate Project Finance Company of the Year’ and ‘Emerging Home Loans Provider of the Year’ award at the CREDAI MCHI Golden Pillar Awards 2018, Mumbai - May 2018
• Mr. Khushru Jijina was honoured with ‘Entrepreneur of the Year - Financial Services’ award at the Asia Pacific Entrepreneurship Awards (APEA), New Delhi - April 2018
• Mr. Khushru Jijina was honoured with the ‘Visionary in Real Estate Financing’ Award by NDTV Property Awards - March 2018
• Mr. Khushru Jijina won the 'Business Leader of the Year 2017 - Icon (Real Estate)’ award from The Global Real Estate Congress - February 2018
• Mr. Khushru Jijina was conferred with the 'AsiaOne Global Indian of the Year 2016-2017' under the 'Business Leadership (Finance)' Category for his leadership that contributed to the success of Piramal Finance - October 2017
• The in-house corporate legal team of Piramal Finance was included in The Legal 500 GC Powerlist India - November 2017
PH A R M A
• Global Pharma Services won the CMO Leadership Award 2018 in six categories including Capabilities, Compatibility, Expertise, Quality, Reliability and Service at New York - March 2018
• Won ‘Regulatory Procedures and Compliance’ award at the CPhI Pharma Awards (2017), Frankfurt, Germany – October 2017
• Won “Manufacturing Supply Chain Operational Excellence in Pharmaceuticals” at 7th Manufacturing Supply Chain Awards in Mumbai - February 2018
• Consumer Products Division Sales Training team received 3 awards in individual & organisational categories at the Training and Development Congress, part of world HRD congress 2018, Mumbai - February 2018
• Won the Poster Presentation, CMC Category for evaluation of curing parameter for pellets with functional coating using QbD, Industrial Perspective at APA Conference, Pune – February 2018
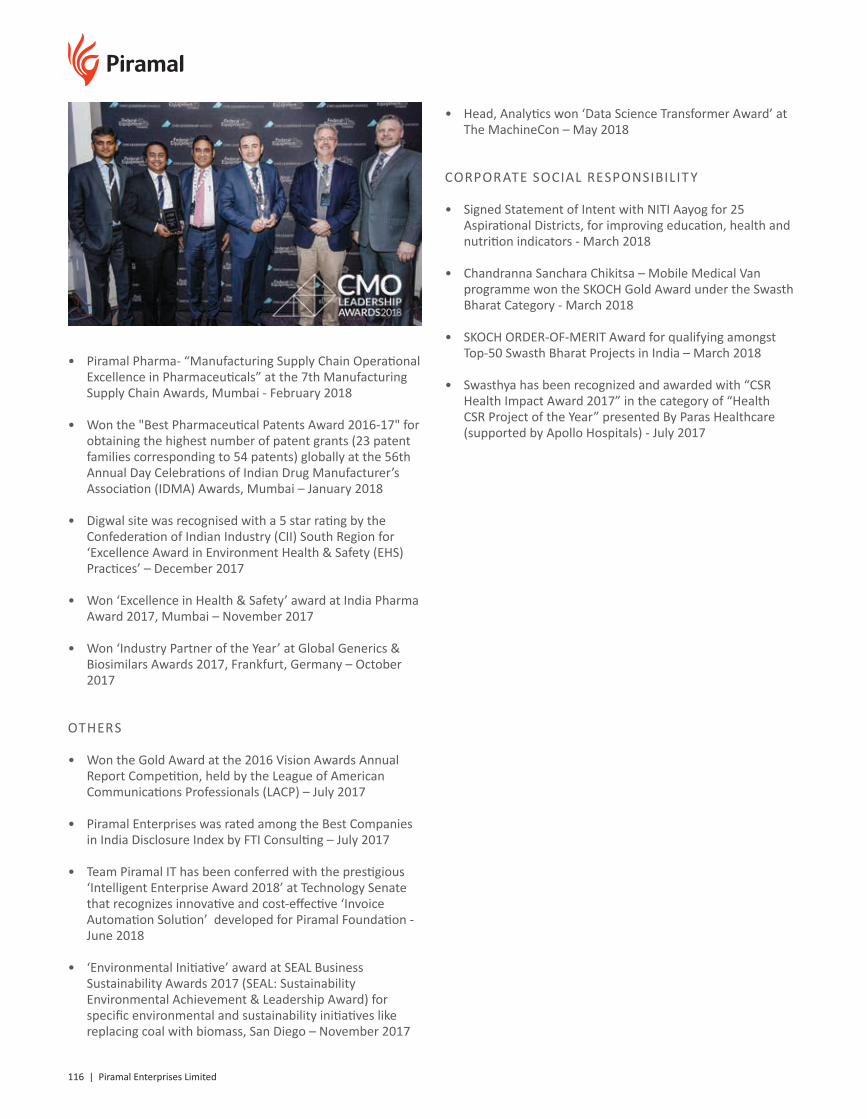
116 | Piramal Enterprises Limited
• Piramal Pharma- “Manufacturing Supply Chain Operational Excellence in Pharmaceuticals” at the 7th Manufacturing Supply Chain Awards, Mumbai - February 2018
• Won the "Best Pharmaceutical Patents Award 2016-17" for obtaining the highest number of patent grants (23 patent families corresponding to 54 patents) globally at the 56th Annual Day Celebrations of Indian Drug Manufacturer’s Association (IDMA) Awards, Mumbai – January 2018
• Digwal site was recognised with a 5 star rating by the Confederation of Indian Industry (CII) South Region for ‘Excellence Award in Environment Health & Safety (EHS) Practices’ – December 2017
• Won ‘Excellence in Health & Safety’ award at India Pharma Award 2017, Mumbai – November 2017
• Won ‘Industry Partner of the Year’ at Global Generics & Biosimilars Awards 2017, Frankfurt, Germany – October 2017
OTHERS
• Won the Gold Award at the 2016 Vision Awards Annual Report Competition, held by the League of American Communications Professionals (LACP) – July 2017
• Piramal Enterprises was rated among the Best Companies in India Disclosure Index by FTI Consulting – July 2017
• Team Piramal IT has been conferred with the prestigious ‘Intelligent Enterprise Award 2018’ at Technology Senate that recognizes innovative and cost-effective ‘Invoice Automation Solution’ developed for Piramal Foundation - June 2018
• ‘Environmental Initiative’ award at SEAL Business Sustainability Awards 2017 (SEAL: Sustainability Environmental Achievement & Leadership Award) for specific environmental and sustainability initiatives like replacing coal with biomass, San Diego – November 2017
• Head, Analytics won ‘Data Science Transformer Award’ at The MachineCon – May 2018
CORPORATE SOCIAL RESPONSIBILIT Y
• Signed Statement of Intent with NITI Aayog for 25 Aspirational Districts, for improving education, health and nutrition indicators - March 2018
• Chandranna Sanchara Chikitsa – Mobile Medical Van programme won the SKOCH Gold Award under the Swasth Bharat Category - March 2018
• SKOCH ORDER-OF-MERIT Award for qualifying amongst Top-50 Swasth Bharat Projects in India – March 2018
• Swasthya has been recognized and awarded with “CSR Health Impact Award 2017” in the category of “Health CSR Project of the Year” presented By Paras Healthcare (supported by Apollo Hospitals) - July 2017
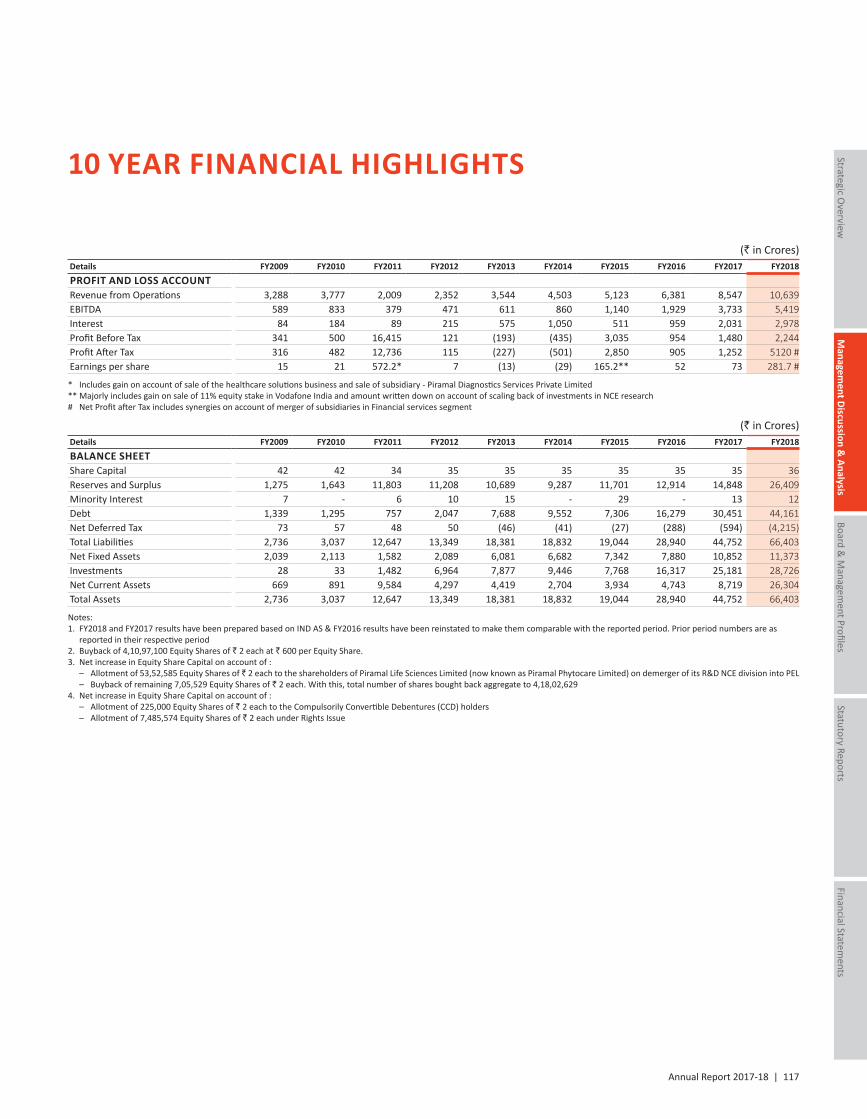
Annual Report 2017-18 | 117
10 YEAR FINANCIAL HIGHLIGHTS
(` in Crores)Details FY2009 FY2010 FY2011 FY2012 FY2013 FY2014 FY2015 FY2016 FY2017 FY2018
PROFIT AND LOSS ACCOUNTRevenue from Operations 3,288 3,777 2,009 2,352 3,544 4,503 5,123 6,381 8,547 10,639EBITDA 589 833 379 471 611 860 1,140 1,929 3,733 5,419Interest 84 184 89 215 575 1,050 511 959 2,031 2,978Profit Before Tax 341 500 16,415 121 (193) (435) 3,035 954 1,480 2,244Profit After Tax 316 482 12,736 115 (227) (501) 2,850 905 1,252 5120 #Earnings per share 15 21 572.2* 7 (13) (29) 165.2** 52 73 281.7 #
* Includes gain on account of sale of the healthcare solutions business and sale of subsidiary - Piramal Diagnostics Services Private Limited** Majorly includes gain on sale of 11% equity stake in Vodafone India and amount written down on account of scaling back of investments in NCE research# Net Profit after Tax includes synergies on account of merger of subsidiaries in Financial services segment
(` in Crores)Details FY2009 FY2010 FY2011 FY2012 FY2013 FY2014 FY2015 FY2016 FY2017 FY2018
BALANCE SHEETShare Capital 42 42 34 35 35 35 35 35 35 36Reserves and Surplus 1,275 1,643 11,803 11,208 10,689 9,287 11,701 12,914 14,848 26,409Minority Interest 7 - 6 10 15 - 29 - 13 12Debt 1,339 1,295 757 2,047 7,688 9,552 7,306 16,279 30,451 44,161Net Deferred Tax 73 57 48 50 (46) (41) (27) (288) (594) (4,215)Total Liabilities 2,736 3,037 12,647 13,349 18,381 18,832 19,044 28,940 44,752 66,403Net Fixed Assets 2,039 2,113 1,582 2,089 6,081 6,682 7,342 7,880 10,852 11,373Investments 28 33 1,482 6,964 7,877 9,446 7,768 16,317 25,181 28,726Net Current Assets 669 891 9,584 4,297 4,419 2,704 3,934 4,743 8,719 26,304Total Assets 2,736 3,037 12,647 13,349 18,381 18,832 19,044 28,940 44,752 66,403
Notes:1. FY2018 and FY2017 results have been prepared based on IND AS & FY2016 results have been reinstated to make them comparable with the reported period. Prior period numbers are as
reported in their respective period2. Buyback of 4,10,97,100 Equity Shares of ` 2 each at ` 600 per Equity Share.3. Net increase in Equity Share Capital on account of : – Allotment of 53,52,585 Equity Shares of ` 2 each to the shareholders of Piramal Life Sciences Limited (now known as Piramal Phytocare Limited) on demerger of its R&D NCE division into PEL – Buyback of remaining 7,05,529 Equity Shares of ` 2 each. With this, total number of shares bought back aggregate to 4,18,02,6294. Net increase in Equity Share Capital on account of : – Allotment of 225,000 Equity Shares of ` 2 each to the Compulsorily Convertible Debentures (CCD) holders – Allotment of 7,485,574 Equity Shares of ` 2 each under Rights Issue
Managem
ent Discussion & Analysis
Strategic Overview
Board &
Managem
ent ProfilesStatutory Reports
Financial Statements
118 | Piramal Enterprises Limited
BOARD OF DIRECTORS
MR. AJAY PIRAMALMr. Ajay Piramal is Chairman of Piramal Group and Shriram Group. Born on August 3, 1955, Mr. Piramal is among India’s leading industrialists, philanthropists and social entrepreneurs. Piramal Group has businesses in healthcare, financial services, real estate, information services, glass packaging, etc. Valued at USD9.5 billion, it has a global footprint with offices in 30 countries, including the US, UK, European Union, Japan, Pacific, South Asia and India, and its products are sold in over 100 countries. He is also the Chairman of Shriram Capital Ltd., the holding company for financial services and insurance entities of Shriram Group. The Shriram Group employs over 75,000 personnel and serves over 19.9+ million customers.
Piramal Group is involved in various Corporate Social Responsibility (CSR) activities in the space of primary education, potable water supply, leadership development, empowerment of women in rural India, rural healthcare and provision of midday meals to school children, among others. Piramal Foundation received the most prestigious ‘Corporate Trailblazer Award’ launched by India Today Group (Safaigiri Awards 2015, as part of the national campaign – Clean India Mission). The Award was presented by the Hon’ble Prime Minister of India, Mr. Narendra Modi. This Award was given in recognition of the excellent work being done by Piramal Sarvajal in the field of social entrepreneurship.
Directorships: Apart from Group Companies, Mr. Piramal serves on Harvard Business School’s Board of Dean’s Advisors. He is Non-Executive Director of Tata Sons Ltd., President and Chairman of the Governing Body of Anant National University, and Chairman of Pratham Education Foundation. Until recently, he was Chairman of the Board of Governors of IIT, Indore.
Mr. Piramal is Co-Chair of UK-India CEO Forum. He is also the Chairman of the Advisory Committee for SEBI Investor Protection and Education Fund. He was a Member of Hon’ble Prime Minister’s Council for Trade and Industry and the Board of Trade, constituted by Ministry of Commerce. In addition, he was Member of Hon’ble Prime Minister’s Task Force on Pharmaceuticals and Knowledge-Based Industries, and served on Central Board of State Bank of India for 10 years.
Awards: Mr. Piramal is the recipient of several national and international awards such as CNBC Asia’s India Business Leader of the Year Award 2018 and CNBC Asia Business Leader of the Year Award 2017. Asia Pacific Entrepreneurship Award (APEA) under the Special Achievement Award Category 2018. Additionally he has also received awards like Corporate Citizen of the Year award by AIMA Managing India Awards (2016); SEN Sustainability Award – Philanthropy– instituted by World Presidents’ Organisation (2015); ‘Forbes Philanthropy Awards’ in the Outstanding Philanthropist category in both 2013 and 2014; ‘Entrepreneur of the Year’ Award of UK Trade and Investment Council (2006); Ernst & Young’s Entrepreneur of the Year in the Healthcare and Life Sciences category (2004) and ‘Business Leader of the Year’ Award instituted by the Indo-
American Chamber of Commerce. He has been attending the annual meetings of World Economic Forum for 20 years.
Education: B. Sc (Hons) from Bombay University, Master’s in Management Studies from Jamnalal Bajaj Institute of Management Studies and Advanced Management Programme from Harvard. Mr. Piramal has been conferred with Honorary Doctorate Degree in Philosophy (D. Phil) by Amity University, India.
DR. SWATI A PIRAMALDr. (Mrs.) Swati Piramal is Vice Chairperson of Piramal Enterprises Ltd and a Whole-time Director. She is among India’s leading scientists and industrialists, and is involved in public health and innovation. She earned a medical degree from Mumbai University and completed Master’s in Public Health from Harvard School of Public Health. She has used her background in medicine, public health and business to change the trajectory of healthcare, education, and public policy in India. Dr. Piramal is Member of Harvard Board of Overseers and Dean’s Advisor to Harvard Business School & Public Health.
In addition to other commitments, Dr. Piramal is deeply committed to Corporate Social Responsibility activities. She is involved in projects across healthcare, education, livelihood creation and youth empowerment. She aims to resolve issues that are critical roadblocks to unlocking India’s economic potential by finding innovative solutions. She also looks at avenues for promoting health in rural India with mobile health services, women’s empowerment projects and supporting community education that creates young leaders.
As the first woman President of India’s apex Chamber of Commerce in 90 years, she helped influence important public policies and governance. She served as an advisor to the Indian Prime Minister in science, technology and economic policy (2006-2014).
Dr. Piramal is a leader who makes positive difference to the community and the world. Her contributions in innovation, new medicines and public health services have touched thousands of lives.
Following are some of her achievements:a. Nominated as one of 25 Most Powerful Women in India, eight times
in succession, from 2003 till 2011b. Awarded BMA Management Woman Achiever of the Year Award
during 2004-05c. Recipient of Lakshmipat Singhania IIM-Lucknow National Leadership
Awardd. Recipient of one of France’s highest honours – ‘Chevalier de l’Ordre
National du Merite’ (Knight of the Order of Merit) – for medicine and trade in 2006
e. In 2006, she also received an award in the field of Science and Technology from the Prime Minister of India, and was the recipient of Chemtech Pharma Award for Biotech Industries
Annual Report 2017-18 | 119
Managem
ent Discussion & Analysis
Strategic Overview
Board &
Managem
ent ProfilesStatutory Reports
Financial Statements
f. Received Rajiv Gandhi Award for Outstanding Woman Achiever, from Rajiv Gandhi Foundation in 2007
g. President of ASSOCHAM and the first woman to be elected President in 90 years of the history of ASSOCHAM, during 2009-10
h. In 2010, Dr. Piramal was conferred with Distinguished Industrialist Award for outstanding contributions to the Pharmaceutical Industry by VIT (Vellore Institute of Technology)
i. In 2011, she was nominated to the Hall of Fame as the Most Powerful Women in Business by Business Today
j. During 2011, she was also awarded by Hon. President of India for contribution to better Corporate Governance, and received Global Empowerment Award - UK, from Her Royal Highness, the Duchess of Kent
k. In 2012, she was honoured with Padmashri, by President of Indial. During 2012, she was also elected as Member of Harvard Board of
Overseers. She received the Alumni Merit Award from Harvard, the highest award bestowed on an Alumni
m. In 2014, she received Kelvinator Stree Shakti Awardn. In 2015, she featured in LinkedIn Power Profile 2015 list for most
viewed CEOs on LinkedIn, Indiao. In 2016, she received IMC Ladies’ Wing’s prestigious Woman of
the Year award for her significant and outstanding contribution to society in the medical field
p. Awarded the “First Ladies Award” by the President of India in 2018 in being the first woman leader of ASSOCHAM –the apex chamber of commerce in 90 years of its history
MR. GAUTAM BANERJEEMr. Gautam Banerjee is Senior Managing Director of Blackstone Group and Chairman of Blackstone Singapore.
Mr. Banerjee’s non-executive corporate roles outside of Blackstone include serving as an Independent Director of Singapore Airlines, GIC (Singapore’s Sovereign Wealth Fund), The Indian Hotels Company, and Piramal Enterprises. He also serves as Vice Chairman of Singapore Business Federation, is a Member of Singapore Legal Service Commission and Chairman of raiSE, Centre for Social Enterprise in Singapore. His other roles in the not-for-profit sector include being a term Trustee of SINDA and a Member of the Governing Board of Yale NUS College.
Previously, Mr. Banerjee served as Executive Chairman of PricewaterhouseCoopers (PwC), Singapore, for nine years until his retirement in December 2012. He spent over 30 years with the firm in various leadership roles in Singapore, India and East Asia. His previous non-executive appointments included serving as a Member of Economic Development Board and National Heritage Board.
He is a Fellow of Institute of Chartered Accountants in England and Wales, Institute of Singapore Chartered Accountants and Singapore Institute of Directors. He graduated with a Bachelor’s of Science (Honours) degree from Warwick University in 1977 and was awarded an Honorary Doctor of Laws (LLD) by the same university in 2014.
He was a nominated Member of Parliament in Singapore from 2007 to 2009 and a Member of Singapore Economic Strategies Committee (2009/2010). He was awarded Public Service Medal by the Singapore Government in 2014.
MR. KEKI DADISETHMr. Keki Dadiseth joined Hindustan Lever Ltd in India in 1973 as Manager in the Audit Department. His tenure in the Company included a three-year secondment to Unilever PLC in London (1984-87) where he held senior financial and commercial positions. On his return to India in 1987, Mr. Dadiseth joined the Board of Hindustan Lever and, until he became Chairman in 1996, headed several businesses (detergents and personal products) and functions (personnel and mergers and acquisitions activities) for the Group in India.
He was appointed Director on the Board of Unilever PLC and Unilever NV in May 2000 and Member of the Executive Committee. On January 1, 2001, he took over as Director, Home and Personal Care, responsible for the HPC business of Unilever worldwide. He retired from Unilever in May 2005. He was also Non-Executive Director of Prudential PLC from 2005- 2013, and Chairman and Senior Advisor to Sony India Ltd. for four years, till early 2013. He retired as Member of the International Advisory Board of Goldman Sachs in October 2012 after serving for six years. Mr. Dadiseth served on the Boards of ICICI Prudential Life Insurance, ICICI Prudential Asset Management Trust till April 2016 and Indian Hotels Co. Ltd. and PIEM Hotels Ltd. till April 2017. He was a Trustee of Sir Ratan Tata Trust till April 2017.
In India, Mr. Dadiseth is closely associated with various industry, educational, management and medical bodies. He is Member of Managing Committee, Breach Candy Hospital Trust. He is on the Boards of Britannia Industries, Piramal Enterprises, Siemens, Godrej Properties Ltd, JM Financial Ltd and JM Financial Services Ltd. He is a Director on the Board of Indian Business School. He is also Chairman/Member of Audit/Remuneration/Corporate Governance committees in most of these companies.
Mr. Dadiseth is Non-Executive Chairman of Omnicom India, and Chairman of the Convening Board of Marsh & McLennan Companies, India. He is also Member of the India Advisory Boards of PricewaterhouseCoopers Pvt. Ltd., Accenture Services Pvt. Ltd., and India Infoline, and Senior Advisor to World Gold Council, India.
DR. RAGHUNATH ANANT MASHELKARDr. R.A. Mashelkar, National Research Professor, is also the President of Global Research Alliance, a network of publicly funded R&D institutes from Asia-Pacific, Europe and USA, with over 60,000 scientists.
Dr. Mashelkar served as Director General of Council of Scientific and Industrial Research (CSIR), which has thirty-eight laboratories and about 20,000 employees, for over 11 years. He was also the President of Indian National Science Academy, and President of Institution of Chemical Engineers (UK).
Thirty eight universities have honored him with honorary doctorates, which include Universities of London, Salford, Pretoria, Wisconsin, Swinburne, Monash and Delhi.
Dr. Mashelkar is only the third Indian engineer to have been elected (1998) as Fellow of Royal Society (FRS), London, in the twentieth century. He was elected Foreign Associate of US National Academy of Science (2005) and National Academy of Engineering (2003), Associate Foreign
120 | Piramal Enterprises Limited
Member of American Academy of Arts & Sciences (2011), Fellow of Royal Academy of Engineering, UK (1996), Foreign Fellow of Australian Technological Science and Engineering Academy (2008), Corresponding Member of Australian Academy of Sciences (2017), Fellow of World Academy of Arts & Science, USA (2000) and Fellow of US National Academy of Inventors (2017), the first Indian citizen to be elected.
Deeply connected with the innovation movement in India, Dr. Mashelkar is Chairman of India’s National Innovation Foundation, Reliance Innovation Council, KPIT Technologies Innovation Council, Persistent Systems Innovation Council and Marico Foundation’s Governing Council. He co-chairs Maharashtra State Innovation Council.
Dr. Mashelkar has been a Member of External Research Advisory Board of Microsoft (USA), Advisory Board of VTT (Finland), Corporate Innovation Board of Michelin (France), Advisory Board of National Research Foundation (Singapore), among others.
In August 1997, Business India named Dr. Mashelkar among the 50 pathbreakers in the post- Independent India. In 1998, Dr. Mashelkar won the JRD Tata Corporate Leadership Award, the first scientist to win it. In June 1999, Business India did a cover story on Dr. Mashelkar as ‘CEO OF CSIR Inc.’, a dream that he had himself articulated, when he took over as Director General of CSIR in July 1995. On 16 November, 2005, he received the Business Week (USA) award of ‘Stars of Asia’ at the hands of George Bush (Sr.), the former President of USA. He was the first Asian Scientist to receive it.
Dr. Mashelkar has been on the Board of Directors of several reputed companies such as Reliance Industries Ltd., Tata Motors Ltd., Hindustan Unilever Ltd., Thermax Ltd., Piramal Enterprises Ltd., KPIT Technologies Ltd., etc. He chairs the Boards of GeneMedix Life Sciences Pvt. Ltd., Vyome Biosciences Pvt. Ltd. and Invictus Oncology Pvt. Ltd.
Dr. Mashelkar’s contributions have been multifarious.
When Dr. Mashelkar took over as DG, CSIR, he enunciated ‘CSIR 2001: Vision & Strategy’. This was a bold attempt to draw out a corporate-like R&D and business plan for a publicly funded R&D institution. This initiative has transformed CSIR into a user-focused, performance-driven and accountable organisation. This tranformation of CSIR has been recently heralded as one of the ten most significant achievements of Indian Science and Technology in the twentieth century.
Dr. Mashelkar has been propagating a culture of innovation and a balanced intellectual property rights regime for over two decades. It was through his sustained and visionary campaign that growing awareness of Intellectual Property Rights (IPR) has dawned on Indian academics, researchers and corporates. He spearheaded the successful challenge to the US patent on the use of turmeric for wound healing and also the patent on Basmati rice. These landmark cases have set new paradigms in the protection of India’s traditional knowledge base, besides leading to the setting up of India’s first Traditional Knowledge Digital Library. At an international level, this has led to the initiation of change in International Patent Classification System to give traditional knowledge its rightful place.
As Chairman of the Standing Committee on Information Technology of World Intellectual Property Organisation (WIPO), as Member of International Intellectual Property Rights Commission of UK Government, and as Vice Chairman on Commission in Intellectual Property Rights, Innovation and Public Health (CIPIH) set up by World Health Organisation (WHO), he brought new perspectives on the issue of IPR, and the developing world’s concerns.
In the post-liberalised India, Dr. Mashelkar has played a critical role in shaping India’s S&T policies. He was Member of Scientific Advisory Council to the Prime Minister and also of Scientific Advisory Committee to the Cabinet set up by successive governments. He has chaired 12 high-powered committees set up to look into diverse issues of higher education, national auto-fuel policy, overhauling the Indian drug regulatory system, dealing with the menace of spurious drugs, reforming Indian agriculture research system, etc. Currently, he is Chairman of Government of India’s two High-Powered Technology Expert Committees on Swachh Bharat Abhiyan set up by Ministry of Rural Development and Ministry of Urban Development.
Dr. Mashelkar has won over 50 awards and medals, which include S.S. Bhatnagar Prize (1982), Pandit Jawaharlal Nehru Technology Award (1991), G.D. Birla Scientific Research Award (1993), Material Scientist of Year Award (2000), IMC Juran Quality Medal (2002), HRD Excellence Award (2002), Lal Bahadur Shastri National Award for Excellence in Public Administration and Management Sciences (2002), Medal of Engineering Excellence by World Federation of Engineering Organisations, Paris (2003), Lifetime Achievement Award by Indian Science Congress (2004), Science medal by Academy of Science for the Developing World (2005), Ashutosh Mookherjee Memorial Award by Indian Science Congress (2005), etc.
The President of India honoured Dr. Mashelkar with Padmashri (1991), with Padmabhushan (2000) and with Padma Vibhushan (2014).
PROF. GOVERDHAN MEHTAProf. Goverdhan Mehta is a leading researcher in Chemical Sciences and is presently a University Distinguished Professor and Dr. Kallam Anji Reddy Chair at University of Hyderabad. He has held positions like Vice Chancellor of University of Hyderabad; Director of the Indian Institute of Science, Bangalore; Srinivas Ramanujam Research Professor of the Indian National Science Academy; CSIR-Bhatnagar Fellow, National Research Professor; and Lilly-Jubilant Chair Professor at University of Hyderabad. He has published over 500 research papers, delivered over 200 named and distinguished lectures worldwide and has received over 100 medals, awards and honorary Doctorate degrees.
Prof. Mehta is a Fellow of Royal Society (FRS), a Foreign Member of Russian Academy of Sciences and a Fellow of all the three Science Academies in India, and the Third World Academy of Sciences (TWAS). He was President of Indian National Science Academy and International Council for Science. He has been conferred ‘Padma’ award by the President of India, ‘Chevalier de la Legion d’Honneur’ by the President of France and ‘Cross of the Order of Merit’ by the President of Germany.
Annual Report 2017-18 | 121
Managem
ent Discussion & Analysis
Strategic Overview
Board &
Managem
ent ProfilesStatutory Reports
Financial Statements
MR. SIDDHARTH N. (BOBBY) MEHTAMr. Siddharth Mehta was the former President and Chief Executive Officer of TransUnion, a global provider of credit information and risk management solutions, from 2007 to 2012. From 1998 to 2007, Mr. Mehta held a variety of positions with HSBC Finance Corporation and HSBC North America Holdings, including as Chairman and Chief Executive Officer of HSBC North America Holdings and Chief Executive Officer of HSBC Finance Corporation. Prior to that, he was Senior Vice-President at The Boston Consulting Group and led their North American Financial Services Practice. He has been on the Board of TransUnion Corporation since 2013. He is also a Member of the Board of Directors of Allstate Corporation, Piramal Enterprises, Avant and Entrust Datacard, and also serves on several not-for-profit Boards, including The Field Museum and The Chicago Public Education Fund.
MR. S. RAMADORAIMr. S. Ramadorai has been in public service since February 2011, having recently completed a five-year stint in the field of Skill Development. During his tenure as Chairman of National Skill Development Agency (NSDA) and the National Skill Development Corporation (NSDC), his approach was to standardise the skilling effort and ensure quality and commonality of outcomes by leveraging technology to create an inclusive environment to cooperate, collaborate and coexist. He strongly believes that empowering youth with the right skills can define the future of the country. Mr. Ramadorai is currently Chairman of the Advisory Board at Tata STRIVE, which is Tata Group’s CSR skill development initiative that aims to address the pressing national need of skilling youth for employment, entrepreneurship and community enterprise.
In addition to the above positions, Mr. Ramadorai continues to be Chairman of AirAsia (India), Tata Advanced Systems Ltd and Tata Technologies Ltd. Recently, in March 2016, he retired as Chairman of Bombay Stock Exchange (BSE Ltd) after serving for six years on the board. He continues to be an Independent Director on the Boards of Hindustan Unilever Ltd, Asian Paints Ltd and Piramal Enterprises Ltdd.
Mr. Ramadorai took over as CEO of Tata Consultancy Services (TCS) in 1996 when the company’s revenues were USD155 million and thereafter led the company through some of its most exciting phases, including its going public in 2004. In October 2009, he retired as CEO, leaving a USD6-billion global IT services company to his successor. He was then appointed as the Vice Chairman and held office until he retired in October 2014, after an association of over four decades with the company.
Given his passion to work for the social sector and community initiatives, he also serves as Chairman on Council of Management at the National Institute of Advanced Studies (NIAS) and Chairman of the Governing Board at Tata Institute of Social Sciences (TISS). He is also President of Society for Rehabilitation of Crippled Children (SRCC), which is building a super speciality children’s hospital in Mumbai.
In recognition of Mr. Ramadorai’s commitment and dedication to the IT industry, he was awarded Padma Bhushan (India’s third-highest civilian honour) in January 2006. In April 2009, he was awarded the CBE (Commander of the Order of the British Empire) by Her Majesty Queen
Elizabeth II for his contribution to Indo-British economic relations. In 2016, he was also awarded The Economic Times Lifetime Achievement Award for his glorious contribution to Tata Consultancy Services.
Mr. Ramadorai’s academic credentials include a Bachelor’s degree in Physics from Delhi University (India), a Bachelor of Engineering degree in Electronics and Telecommunications from Indian Institute of Science, Bengaluru, and a Master’s degree in Computer Science from the University of California – UCLA (USA). In 1993, Mr. Ramadorai attended Sloan School of Management’s highly acclaimed Senior Executive Development Program.
Mr. Ramadorai is a well-recognised global leader and technocrat who has participated in the Indian IT journey from a mere idea in 1960s to a mature industry today. Mr. Ramadorai captured this exciting journey in a wonderfully personalised book titled, ‘The TCS Story...and beyond’, which was published in 2011 and remained on top of the charts for several months.
Among his many interests, Mr. Ramadorai is passionate about photography and Indian classical music.
MR. DEEPAK M. SATWALEKARMr. Deepak M. Satwalekar serves on the India Advisory Board of a large European bank. He is currently active on the Board of Trustees/Advisory Board of a few non-profit organisations that are engaged in primary education for low-income and underprivileged members of society in rural and urban India. He is on the Board of a technology incubator and also advises a venture capital fund. He was Managing Director and CEO of HDFC Standard Life Insurance Co. Ltd. till 2008. He has also been a consultant to World Bank, Asian Development Bank, United States Agency for International Development (USAID) and United Nations Human Settlements Programme (HABITAT).
Mr. Satwalekar is a recipient of ‘Distinguished Alumnus Award’ from Indian Institute of Technology (IIT), Bombay. He is on the Advisory Council of IIT Bombay, and has chaired or been a member of several industry/Government/Reserve Bank of India expert groups. He is the Chairman, Board of Governors, of Indian Institute of Management, Indore.
MR. NARAYANAN VAGHULMr. Narayanan Vaghul is the former Chairman of ICICI Bank Ltd, the second largest commercial bank in the country. He is widely recognised in India for his role in pioneering the concept of Universal Banking Model that laid the foundation for a new era in Indian banking.
Born on August 4, 1936, Mr. Vaghul received his Bachelor of Commerce (Hons) Degree from the University of Madras (now known as Chennai) in 1956. He joined the State Bank of India in 1957 as a Probationary Officer, became the Director in the National Institute of Bank Management, Mumbai in 1976, before assuming charge as Executive Director in Central Bank of India in 1978. He became the Chairman of Bank of India in 1981 and had the distinction of being the youngest ever Chairman in a Public Sector Bank. He joined the ICICI Ltd as Chairman and CEO in 1985 and continued to head the group till April 2009.
122 | Piramal Enterprises Limited
During his tenure in ICICI, Mr. Vaghul created several new institutions, laying the foundation for the development of the Universal Banking model. He started the first venture capital company in India in 1987 and from a small beginning; it has become the leading venture capital company today. He was also instrumental in setting up ICICI Securities, an Investment Banking company. When the banking licence was thrown open to the non-state players, he set up a commercial bank with which ICICI was to merge subsequently to become the first major universal financial institution, catering to the diverse needs of all segments of customers. He also pioneered the concept of credit rating in India by setting up CRISIL. He was the founder Chairman of CRISIL for close to 10 years and helped in evolving the best practices of credit rating in the country.
Mr. Vaghul was deeply interested in education, particularly for the under privileged sections of society. He was the Chairman of ‘Pratham’, a leading NGO in this sector. He is associated with several foundations dedicated to the cause of primary education. He is also deeply committed to the cause of science and technology and was responsible for setting up the first Science and Technology Park in the country known as ICICI Knowledge Park. He is associated with Institute of Technology in Jaipur. He has been the Chairman of IFMR, a business school with an array of research centres engaged in a variety of economic and social research.
Mr. Vaghul is the recipient of numerous awards and honours. He was chosen as the Business Man of the Year by Business India in 1992. He was given Lifetime Achievement Award by the Economic Times in 2006. He was given an award for his contribution to the Corporate Governance by the Institute of Company Secretaries in 2007. He was given the Lifetime Achievement Award by ‘Ernst & Young Entrepreneur of the Year’ Award Programme in 2009. He was awarded ‘Padma Bhushan’ by the Government of India in 2009. He was awarded Life Time Achievement Award by Bombay Management Association in March 2013. He was awarded ‘Lifetime Achievement in Corporate Governance’ by Asian Centre for Corporate Governance & Sustainability in December 2014.
MS. NANDINI PIRAMALNandini Piramal is Executive Director, Piramal Enterprises, and leads the Over-The-Counter (OTC) business of the company. She heads the Human Resources function at Piramal Group and the Quality & Risk functions at Piramal Enterprises.
Under Nandini’s leadership, the OTC business is one of the fastest-growing Indian OTC companies over the last five years. All our brands are either No. 1 or No. 2 in their respective categories. She played a pivotal role in Piramal Healthcare’s branded generic-medicine business sale to Abbott Laboratories at a record 30x EBITDA. Nandini led the transformation of the people agenda across Piramal Group through a renewed focus on strategically supporting the ambitious 2020 vision of the Group. The five-year transformation agenda is currently in its third year, having established top talent identification and development process across levels. She has been instrumental in creating a ‘One Piramal’ culture, and has also led the setup of a technology and Shared Services backbone for the HR function. Under her leadership, Piramal Group won several awards such as SHRM Award for Excellence in
Developing Leaders of Tomorrow, HT Innovation Award for Best L&D Strategy, etc. Piramal Enterprises is also the only Indian company to be part of Willis Towers Watson Global High Performing Norm.
In 2014, World Economic Forum recognised Nandini as a ‘Young Global Leader’.
Nandini is passionately involved with Piramal Foundation, the philanthropic arm of Piramal Group. She directs implementation strategy across Piramal Foundation Education Leadership programs, Piramal Sarvajal and Piramal Swasthya. She graduated with BA (Hons) Politics, Philosophy, and Economics from Oxford University, followed by an MBA from Stanford Graduate School of Business.
In her spare time, Nandini enjoys cooking, travelling and reading.
ANAND PIRAMALAnand Piramal is the Non-Executive Director at Piramal Enterprise Ltd. and he heads Piramal Realty.
Anand has a strong track record of independently starting and building businesses. He founded Piramal Realty, acquired prime land parcels, assembled a great team, designed world class buildings and raised capital from Goldman Sachs and Warburg Pincus, two of the world’s most respected investors.
Anand founded Piramal Realty in 2012. Piramal Realty aspires to be one of India’s most admired developers and has acquired a land bank of over 15 million square feet in Worli, Mahalaxmi, Byculla, Kurla, Thane and Mulund. The Company seeks to set a new benchmark in design, quality and customer-centricity in our country. In 2015, Warburg Pincus and Goldman Sachs committed to invest USD434 million for an entity level stake in the Company.
Prior to his stint at Piramal Realty, Anand founded a rural healthcare start-up called Piramal eSwasthya. At eSwasthya, he spearheaded the acquisition of HMRI (Health Management Research Institute). Today, the merged entity, Piramal Swasthya, is India’s largest private primary healthcare initiative with 4,077 employees and 585 doctors serving 35,000 patients daily across 16 states through its health hotlines, mobile medical units and telemedicine centres. In 2015, it won the ‘Times Social Impact’ Award and in 2013 the Forbes Philanthropy Award. A Harvard Business School case study about the initiative, Piramal eSwasthya: Attempting Big Changes for Small Places, is taught at many leading academic institutions such as Harvard University and IIM.
Anand graduated in Economics from University of Pennsylvania and earned an MBA from Harvard Business School in 2011. He is the youngest President of the Youth Wing of the 100-year-old Indian Merchant Chambers.
MR. VIJAY SHAHMr. Vijay Shah is Executive Director at Piramal Enterprises Ltd. He is also Member of Financial Services Advisory Committee and the Pharma Operations Board at Piramal Enterprises Ltd. He is also Director at Piramal Glass Ltd.
Annual Report 2017-18 | 123
Managem
ent Discussion & Analysis
Strategic Overview
Board &
Managem
ent ProfilesStatutory Reports
Financial Statements
Mr. Shah started his career in 1982 as Senior Consultant with Management Structure & Systems Pvt. Ltd., a management consultancy organisation providing services for large firms such as Larsen & Toubro (L&T), Siemens, etc. He joined Piramal Group’s Strategic Planning function in 1988 and later moved to Piramal Glass as Managing Director. Under his leadership, Piramal Glass’s sales grew from ` 26 crores in FY1992 to `
238 crores in FY2000 (CAGR of 32%). After his successful stint at Piramal Glass, he was entrusted the responsibility of Pharmaceutical formulations business at Piramal Healthcare in 1999. Under his leadership, the company moved from Rank 23 to Rank 4 in Indian Pharma industry,
achieving sales of ` 932 crores in FY2006 (CAGR of ~28% during his tenure). After this turnaround at Piramal Healthcare, he moved back to Piramal Glass as Managing Director in 2006, where again during his tenure the sales grew at CAGR of 20% (between FY2006-11).
Mr. Shah has done B.Com (1980) and is a rank holder of Institute of Chartered Accountants of India (1981). He has also done a Management Education Programme from IIM, Ahmedabad (1987), and Advanced Management Program from the Harvard Business School, Boston, USA (1997).
124 | Piramal Enterprises Limited
MANAGEMENT TEAM
KHUSHRU JIJINAManaging Director – Piramal Capital & Housing Finance Ltd., Piramal EnterprisesKhushru Jijina is the Managing Director, Piramal Capital & Housing Finance Limited (PCHFL). A Chartered Accountant with an illustrious career spanning well over three decades in the field of real estate, corporate finance and treasury management, Mr. Jijina has been with the Piramal Group for around 18 years. He spearheads the financial services arm of Piramal Enterprises, the flagship company of the Piramal Group.
In this role, Mr. Jijina oversees the entire spectrum of activities ranging from origination, investments, asset management, exits and new fund raising performed by a 650+ member management team. Piramal Capital & Housing Finance Ltd. under Mr. Jijina’s leadership, has grown rapidly and provides both wholesale and retail funding opportunities across sectors.
In real estate, the platform provides housing finance and other financing solutions across the entire capital stack ranging from early stage private equity, structured debt, senior secured debt, construction finance and flexi lease rental discounting. The wholesale business in the non-real estate sector includes separate verticals - Corporate Finance (CFG) and Emerging Corporate Lending (ECL). CFG provides customized funding solutions to companies across sectors such as infrastructure, renewable energy, roads, industrials, auto components etc. while ECL focuses on lending towards Small and Medium Enterprises (SMEs). PCHFL through its group companies provides customized strategies for institutional and retail investors such as Mumbai Redevelopment Fund focused on slum rehabilitation and Apartment Fund focused on bulk buying individual units (through Piramal Fund Management) and strategic partnerships with leading global pension funds such as CPPIB, APG and Ivanhoe Cambridge.
Mr. Jijina has been recognized with several leadership accolades namely Asia One: Global India 2017, Business Leader of the Year: Global Real Estate Congress 2017, Visionary in Real Estate Financing – NDTV Property Awards 2017 and Entrepreneur of the Year in the financial services industry by Asia Pacific Entrepreneurship Awards (APEA) in 2017.
Prior to this, Mr. Jijina was the Managing Director of Piramal Realty where he was responsible for a portfolio of real estate development projects and oversaw all aspects of their execution. He was also the Executive Director of Piramal Sunteck Realty. He joined the Piramal Group in 2001 as Vice President, Treasury, and was instrumental in securing debt at the lowest cost for the group, setting new benchmarks in the debt market. Mr. Jijina started his career with Rallis, a TATA Group company, where over a span of more than a decade, he held several pivotal positions in corporate finance and treasury.
PETER DEYOUNGChief Executive Officer, Critical CareMr. Peter DeYoung is the CEO of Piramal Critical Care. He is a member of the Piramal Pharma Operating Board.
Prior to joining Piramal, he worked in a range of investing and consulting roles in healthcare in the US, Europe and India. He joined McKinsey & Company in New York after graduating from Princeton, US, where he worked on a number of projects for pharmaceutical and medical device companies. He was seconded by McKinsey to the World Economic Forum in Geneva, Switzerland, as a Project Manager for the Global Health Initiative. He returned to McKinsey as an Engagement Manger in New York and later in Mumbai, where he focused on the pharmaceutical and healthcare practice. He helped clients address a range of strategic, organisational and operational challenges. He went on to join Blackstone’s Private Equity Group in Mumbai. He was on the deal team for several significant transactions across a variety of industry sectors in India.
Mr. DeYoung has completed Bachelors of Science in Engineering from Princeton University, New Jersey, USA (summa cum laude, phi beta kappa, tau beta pi) and Masters of Business Administration from Stanford University (Arjay Miller Scholar), California, USA.
VIVEK SHARMAChief Executive Officer, Pharma SolutionsMr. Vivek Sharma serves as the CEO of Piramal Pharma Solutions (PPS), a global leader in Contract Research, Development and Manufacturing services for the life sciences industry. PPS offers unique integrated solutions from drug discovery through development and commercialisation, with research and manufacturing facilities in North America, Europe and Asia.
Under Mr. Sharma’s leadership, Piramal has established itself as the ‘partner of choice’ for both large pharma and biotech firms. He has led Piramal Pharma Solutions through rapid growth with a strategy that augments organic growth with synergistic, well-timed acquisitions. Internal investments in fast growing segments such as Antibody Drug Conjugate (ADC) manufacturing and hormonals have been complemented by acquisitions in High Potent Active Pharmaceutical Ingredients (HPAPI) manufacturing, and Injectable Development and Commercialisation Services. He began his stint at the Piramal Group heading the Piramal Critical Care (PCC) business and was instrumental in improving profitability and establishing it as the third largest and the fastest growing Inhalation Anaesthetics company globally.
Prior to Piramal, Mr. Sharma was the Managing Director at THL Partners, a Boston-based global private equity fund, and has held senior leadership positions in Finance and Operations at AMD and Motorola. With over 25 years of global management experience, he was recognised as the global ‘CEO of the Year’, 2015 at CPhI Worldwide in Madrid and has been listed among ‘the top 100 finance professionals in the United States’. He is based out of Boston and is a Chartered Accountant from India, a qualified CPA, and holds a Masters in International Business from Thunderbird School of Management, Arizona, USA.
Annual Report 2017-18 | 125
Managem
ent Discussion & Analysis
Strategic Overview
Board &
Managem
ent ProfilesStatutory Reports
Financial Statements
MR. VIVEK VALSARAJCFO, Piramal Enterprises Ltd.Vivek Valsaraj is the President and Chief Financial Officer for Piramal Enterprises & has over 20 years of overall experience in the field of finance. He has been associated with the Piramal Group for over 17 years and currently oversees the entire Finance & Shared Services function for Piramal Enterprises. In his earlier stints within the group he has been associated with roles in Corporate, the erstwhile Domestic Formulations business and has been the CFO for the Pharma business.
He has extensive experience in the areas of Corporate Finance, Business strategy, mergers and acquisitions, corporate structuring, corporate governance and taxation. Over the last several years he has been closely associated with the Pharma business and has actively participated in the affairs of these businesses including key acquisitions and divestments. He has also been responsible for executing systems and processes and internal controls to bring in financial discipline.
He is a qualified CMA and has been with the Piramal Group for over 17 years in various roles & has had prior stints with companies like Wockhardt Ltd. and Bharat Bijlee Ltd.
JONATHAN SANDLERChairman & CEO – Decision Resources GroupMr. Jonathan Sandler is the Chairman and CEO of Decision Resources Group (DRG), Piramal’s Healthcare Insights and Analytics subsidiary. DRG offers high-value data, analytics and insights products and services to the global healthcare industry. Mr. Sandler joined Piramal in 2011 and served as the Founding Managing Director of IndUS Growth Partners, Piramal’s North American strategic investment affiliate. Mr. Sandler was named Chairman in 2012 after leading Piramal’s acquisition of DRG, and became the CEO in 2016. He also sits on the Boards for Piramal Imaging and Bluebird Aerosystems. Prior to joining Piramal, Mr. Sandler spent 17 years at the Kessler Group, a financial services boutique, where he served as Vice Chairman, Group CFO, founding CEO of Kessler International, and founding CEO of Kessler Capital. In these roles, he was responsible for driving the company’s growth, diversification, global expansion, operating effectiveness and profit expansion. Mr. Sandler began his career as an investment banker at Bankers Trust Company in New York and then as a strategy consultant with the MAC Group in Cambridge. Mr. Sandler holds a BA and MBA from Harvard University.
KEDAR RAJADNYE,Chief Operating Officer, Consumer ProductsMr. Kedar Rajadnye is the COO of the Consumer Products business of Piramal Enterprises, one of the fastest growing self-care businesses in India and is also responsible for the IT function of the Piramal Group.
He joined the Piramal Group in 2004 to head a portfolio of domestic pharmaceutical businesses. Since 2008, he has been responsible for the Consumer Products division, which has grown at 18% CAGR over the last 9 years. Over 7 crore consumers buy a Piramal OTC product every month and with Consumer Offtakes more than 500 crore a year, the business has moved up to 5th rank among the top OTC companies, up from 40th rank in 2007.
Under his stewardship, the business has invested in building world class distribution infrastructure – increasing coverage from only top 16 towns in 2008 to all the 2,000 towns of India which have a population of more than 50,000. He has played an influential role in building a portfolio of 18 strong brands like Saridon, Ipill, Lacto Calamine etc., eight of which feature among the top 100 OTC brands of India. Most of these brands are ranked either no. 1 or no 2 in their respective categories. He was instrumental in acquiring and integrating brands from 5 different companies and all acquisitions are looking set to pay back before the targeted time.
The business has won many reputed Indian and international awards for marketing of i-pill, Saridon and Lacto Calamine over the years.
Prior to joining the Group, Mr. Rajadnye has worked at Hindustan Unilever for 8 years in the sales and marketing division. He is an alumnus of Jamnalal Bajaj Institute of Management Studies and has also completed the Executive Development Program at Harvard Business School.
SHANTANU NALAVADIManaging Director, India Resurgence Asset Management Business Pvt. Ltd.Mr. Shantanu Nalavadi carries with him more than two decades of experience in financial services, investment banking and corporate finance. He currently is the Managing director of IndiaRF (a Piramal Enterprises and Bain Capital Credit Partnership) which focusses on purchase of distressed assets from the large NPL market in growth sectors such as industrials, infrastructure etc., taking control of them and working through a financial and operational turnaround plan.
Prior to joining IndiaRF, he was the co-head of the structured investment group with Piramal Enterprises with over USD 350 million in AUM (Piramal SIG) and before that he was a Partner with New Silk Route Advisors Pvt. Ltd., a private equity fund with over USD 850 million in AUM (NSR PE).
At Piramal SIG, he was focussed on investing across distressed and special situations in India in diverse sectors such as infrastructure, renewable, road, cement etc. through a diverse set of credit products backing a robust and credible business/turnaround plan, which enabled securing returns to all concerned stakeholders.
At NSR PE, he was focussed on investing equity growth capital, creating value and monetising investments across several sectors, including financial services, consumer, infrastructure, media and manufacturing. Of the nine investments he was involved in, three were controlled deals involving active operational management and five were turnaround deals which required active engagement on the business turnaround plan.
His prior work experience includes long working tenors with global MNCs such as ANZ Grindlays Bank, Star TV and Walt Disney, with P/L and business development responsibilities.
Mr. Nalavadi is a Chartered Accountant by qualification and did his Articleship with Arthur Andersen.
126 | Piramal Enterprises Limited
REPORT ON CORPORATE GOVERNANCE
A report for the financial year ended March 31, 2018 on the compliance by the Company with the Corporate Governance requirements under the Securities and Exchange Board of India (Listing Obligations and Disclosure Requirements) Regulations, 2015 (hereinafter referred to as ‘Listing Regulations’), is furnished below.
1. COMPANY’S PHILOSOPHY ON CORPORATE GOVERNANCE Corporate Governance is the combination of voluntary practices and
compliance with laws and regulations leading to effective control and management of the organisation. Good Corporate Governance leads to long-term stakeholder value and enhances interests of all stakeholders. It brings into focus the fiduciary and trusteeship role of the Board to align and direct the actions of the organisation towards creating wealth and stakeholder value.
The Company’s essential character is shaped by the values of transparency, customer satisfaction, integrity, professionalism and accountability. The Company continuously endeavours to
improve on these aspects. The Board views Corporate Governance in its widest sense. The main objective is to create and adhere to a corporate culture of integrity and consciousness. Corporate Governance is a journey for constantly improving sustainable value creation and is an upward moving target. The Company’s philosophy on Corporate Governance is guided by the Company’s philosophy of Knowledge, Action, Care and Impact.
The Board of Directors fully supports and endorses the Corporate Governance practices as envisaged in the Listing Regulations.
2. BOARD OF DIRECTORS As can be seen from the following paragraphs, your Company’s
Board comprises individuals who are reputed in respective fields of general corporate management, science and innovation, public policy, business, finance and financial services. From time to time, members of the Board receive recognition from the Government, industry bodies and business associations.
A. CompositionandSizeoftheBoard The Company’s policy is to maintain an optimum combination of Executive and Non-Executive / Independent Directors. The composition of
your Company’s Board, which comprises 13 Directors, is given in the table below and is in conformity with Regulation 17(1) of the Listing Regulations and other applicable regulatory requirements. About 62% of the Company’s Board comprises Independent Directors. There are no Nominee Directors representing any institution on the Board of the Company.
Name of DirectorOther Directorships1 Membership of other Board
Committees2
as Member as Chairman as Member as ChairmanExecutiveDirectors–PromoterGroupMr. Ajay G. Piramal – Chairman 8 2 1 -Dr. (Mrs.) Swati A. Piramal – Vice Chairperson 8 1 - -Ms. Nandini Piramal 4 - 1 -Non–Executive,NonIndependentDirector–PromoterGroupMr. Anand Piramal 8 - - -ExecutiveDirector–NonPromoterGroupMr. Vijay Shah 4 - - -Non-Executive,IndependentDirectorsMr. Gautam Banerjee 2 - - -Mr. Keki Dadiseth 5 1 3 1Dr. R.A. Mashelkar 7 - 1 -Prof. Goverdhan Mehta - - - -Mr. Siddharth Mehta - - - -Mr. S. Ramadorai 4 5 1 -Mr. Deepak Satwalekar 4 - - -Mr. N. Vaghul 5 1 1 2
Notes: 1 This excludes directorships in foreign companies and companies licensed under Section 8 of the Companies Act, 2013 / Section 25 of the Companies Act, 1956. 2 This relates to membership of Committees referred to in Regulation 26(1) of the Listing Regulations, viz. Audit Committee and Stakeholders Relationship Committee of all public
limited companies, whether listed or not and excludes private limited companies, foreign companies and companies licensed under Section 8 of the Companies Act, 2013 / Section 25 of the Companies Act, 1956.
Annual Report 2017-18 | 127
Managem
ent Discussion & Analysis
Strategic Overview
Board &
Managem
ent ProfilesStatutory Reports
Financial Statements
• RoleofIndependentDirectors Independent Directors play a key role in the decision-
making process of the Board and in shaping various strategic initiatives of the Company. These Directors are committed to act in what they believe to be in the best interests of the Company and its stakeholders. These Directors are professionals, with expertise and experience in general corporate management, science and innovation, realty, public policy, business, finance and financial services. This wide knowledge of their respective fields of expertise and best-in-class boardroom practices helps foster varied, unbiased, independent and experienced perspective.
The Company benefits immensely from their inputs in achieving its strategic direction.
Your Company has several subsidiaries, both in India and overseas. In order to leverage the experience of Independent Directors of the Company for the benefit of and for improved Corporate Governance and better reporting to the Board, some of the Independent Directors also serve on the Boards of subsidiary companies.
An Independent Director is the Chairman of each of the Audit & Risk Management Committee, Nomination & Remuneration Committee, Corporate Social Responsibility Committee and Stakeholders Relationship Committee.
• MeetingofIndependentDirectors The Company’s Independent Directors met on January
30, 2018 without the presence of Executive Directors or members of management. At this meeting the Independent Directors reviewed the following:
1) Performance of the Chairman;
2) Performance of the Independent and Non- Independent Directors;
3) Performance of the Board as a whole and its Non- Administrative Committees.
The Independent Directors also set out the process for Performance Evaluation for the next year and assessed the quality, quantity and timeliness of flow of information between the Company Management and the Board. All the Independent Directors attended the meeting, except for Prof. Goverdhan Mehta who could not attend the meeting owing to compelling personal reasons.
The Chairman of the meeting of the Independent Directors takes appropriate steps to present views of the Independent Directors to the Chairman of the Company.
• FamiliarizationProgrammeforIndependentDirectors The Company has established a Familiarization Programme
for Independent Directors. The framework together with
the details of the Familiarization Programme conducted has been uploaded on the website of the Company. The web-link to this is https://bit.ly/2M3rT6E www.piramal.com/investor/corporate-governance/policies-code-compliances#detailSection.
The familiarization programmes undertaken during the year included, inter alia, a visit to United Kingdom where the Directors visited Morpeth site, London which gave the Board Members a first-hand impression of the site and an in depth understanding of it’s working as well as an update on key customer projects.
The discussions at various Board Meetings provide the Board members with a realistic view of the Company’s businesses, the challenges and its potential.
At the Board Meetings, the following aspects are presented to the Board:
• Nature of the industry in which the Company operates – detailed presentation on the business operations / plans are made by the respective functional heads;
• Business model of the Company including Risks and challenges being faced by the Company;
• Changes in business environment and impact thereof on the working of the Company;
• Strategic future outlook and way forward to achieve Vision 2020.
• Inter-serelationshipsamongDirectors Mr. Ajay G. Piramal and Dr. (Mrs.) Swati A. Piramal are the
parents of Ms. Nandini Piramal and Mr. Anand Piramal. Except for this, there are no inter-se relationships among the Directors.
• BoardEvaluation Evaluation of performance of all Directors is undertaken
annually. The Company has implemented a system of evaluating performance of the Board of Directors as a whole and of its Committees and Non-Executive Directors on the basis of a structured questionnaire which comprises evaluation criteria taking into consideration various performance related aspects. The performance of the Executive Directors is evaluated on the basis of achievements of their Key Result Areas (‘KRAs’).
The Board of Directors has expressed its satisfaction with the evaluation process.
B. BoardMeetingsandProcedures There are a minimum of six Board Meetings held every year.
The yearly calendar for the Board / Committee meetings is
128 | Piramal Enterprises Limited
fixed well in advance and is in confirmation with the availability of the directors, so as to facilitate active and consistent participation of all directors in the Board / Committee meetings. Apart from these, additional Board Meetings are convened to address the specific needs of the Company. In case of business exigencies or matters of urgency, resolutions are passed by circulation, as permitted by law. Video conferencing facilities are provided to enable Directors who are unable to attend the meetings in person, to participate in the meeting via video conferencing.
The Board has unrestricted access to all Company related information. Detailed presentations are made to the Board covering operations, business performance, finance, sales, marketing, global and domestic business environment and related details. All necessary information including but not limited to those mentioned in Part A of Schedule II to the Listing Regulations, are placed before the Board of Directors. The Members of the Board are at liberty to bring up any matter for discussions at the Board Meetings and the functioning is democratic. Members of the senior management team are invited to attend the Board Meetings, which provides additional inputs to the items being discussed by the Board. The Company has a well-established process in place for reporting compliance status of various laws applicable to the Company.
Important decisions taken at Board/Committee meetings are communicated promptly to the concerned departments/ divisions. Update on matters arising from previous meetings are placed at the succeeding meeting of the Board/ Committees for noting.
I. MeetingsHeld Eight Board Meetings were held during the year, as against
the minimum statutory requirement of four meetings and the gap between any two Board Meetings was not more than one hundred and twenty days, thereby complying with applicable statutory requirements.
Dates of meetings held during the year and Attendance of Directors therein is as follows:
Dates of the Board MeetingsNo. of Directors Present
at the MeetingApril 3, 2017 10May 12, 2017 11August 1, 2017 13September 4 - 7, 2017 11October 12, 2017 10November 6, 2017 12December 1, 2017 12January 30, 2018 12
From the above, it can be seen that the Meetings of the Board are well attended.
II. DetailsofDirectorsattendanceatBoardMeetingsheldduringtheyearandatthelastAnnualGeneralMeeting(AGM)heldonAugust1,2017aregiveninthefollowingtable:
Name of DirectorBoard Meetings
Attended last AGMHeld during tenure Attended
Mr. Ajay G. Piramal 8 8 YesDr. (Mrs.) Swati A. Piramal 8 6 Yes Ms. Nandini Piramal 8 8 Yes Mr. Anand Piramal 7 7 YesMr. Vijay Shah 8 7 Yes Mr. Gautam Banerjee 8 8 Yes Mr. Keki Dadiseth 8 7 Yes Dr. R.A. Mashelkar 8 5 Yes Prof. Goverdhan Mehta 8 6 Yes Mr. Siddharth Mehta 8 7 Yes Mr. S. Ramadorai 8 7 Yes Mr. Deepak Satwalekar 8 7 Yes Mr. N. Vaghul 8 8 Yes
Note: Mr. Anand Piramal was appointed as a Non-Executive Director with effect from May 12, 2017.
C. ShareholdingofNon-ExecutiveDirectors The individual shareholding of Non-Executive Directors (including shareholding as joint holder) as on March 31, 2018 is given below:
Name of Director No. of shares held
Mr. Keki Dadiseth 5,217Dr. R.A. Mashelkar 8,125Prof. Goverdhan Mehta 5,000Mr. S. Ramadorai 5,300Mr. Deepak Satwalekar 10,434Mr. N. Vaghul 10,434Mr. Anand Piramal 2,76,945
None of the Non-Executive Directors hold any Compulsorily Convertible Debentures.
Annual Report 2017-18 | 129
Managem
ent Discussion & Analysis
Strategic Overview
Board &
Managem
ent ProfilesStatutory Reports
Financial Statements
3. STATUTORY BOARD COMMITTEES Meetings of Statutory Committees held during the year and Directors’ Attendance
Committees of the CompanyAudit & Risk
Management Committee
Nomination & Remuneration
Committee
Stakeholders Relationship
Committee
Corporate Social Responsibility
CommitteeNumber of Meetings held 7 6 4 3
Directors’AttendanceMr. Ajay G. Piramal - 6 - -Dr. (Mrs.) Swati A. Piramal - - - -Ms. Nandini Piramal - - - 3Mr. Anand Piramal - - - -Mr. S. Ramadorai - 5 - -Mr. Keki Dadiseth 7 5 - -Mr. N. Vaghul 7 6 - -Mr. Deepak Satwalekar - - 4 -Prof. Goverdhan Mehta - - - 3Dr. R.A. Mashelkar 5 - - -Mr. Vijay Shah - - 4 2Mr. Gautam Banerjee - - - -Mr. Siddharth Mehta - - - -
Note: Dr. (Mrs.) Swati A. Piramal, Mr. Anand Piramal, Mr. Gautam Banerjee and Mr. Siddharth Mehta are not members of any Committee.
A. Audit&RiskManagementCommittee I. ConstitutionoftheCommittee The Audit & Risk Management Committee comprises three
Non - Executive Independent Directors, viz: 1. Mr. N. Vaghul – Chairman 2. Mr. Keki Dadiseth 3. Dr. R.A. Mashelkar
All the members of the Committee have sound knowledge of finance, accounts and business management. The Chairman of the Committee, Mr. N. Vaghul has extensive accounting and related financial management expertise.
The composition of this Committee is in compliance with the requirements of Section 177 of the Companies Act, 2013 and Regulations 18 and 21 of the Listing Regulations. Mr. Leonard D’Souza, Company Secretary, is the Secretary to the Committee.
II. TermsofReference The terms of reference of the Audit & Risk Management
Committee are aligned with the terms of reference provided under Section 177(4) of the Companies Act, 2013, Part C of Schedule II and Regulation 21 of the Listing Regulations.
III. MeetingsHeld The Audit & Risk Management Committee met seven
times during the financial year 2017-18, on the following dates, including before finalisation of annual accounts and adoption of quarterly financial results by the Board:
April 3, 2017 May 12, 2017 July 31, 2017November 6, 2017 December 1, 2017 January 30, 2018March 21, 2018
It can be seen from the above table that the frequency of the Committee Meetings was more than the minimum limit prescribed under applicable regulatory requirements and the gap between two Committee Meetings was not more than one hundred and twenty days.
The functional / business representatives also attend the meetings periodically and provide such information and clarifications as required by the Committee, which gives a deeper insight into the respective business and functional areas of operations. The Cost Auditors and the Internal Auditors attend the respective Audit & Risk Management Committee Meetings, where cost audit reports / internal audit reports are discussed.
Mr. N. Vaghul, Chairman of the Audit & Risk Management Committee was present at the last AGM.
B. Nomination&RemunerationCommittee I. ConstitutionoftheCommittee The Nomination & Remuneration Committee (‘NRC’)
comprises four members as per details in the following table:
Name Category
Mr. N. Vaghul – Chairman Non – Executive, IndependentMr. Keki Dadiseth Non – Executive, IndependentMr. S. Ramadorai Non – Executive, IndependentMr. Ajay G. Piramal Executive, Promoter
The composition of this Committee is in compliance with the requirements of Section 178 of the Companies Act, 2013 and Regulation 19 of the Listing Regulations.
130 | Piramal Enterprises Limited
II. TermsofReference The terms of reference of the NRC are aligned with the terms of
reference provided under Section 178 of the Companies Act, 2013 and Para A of Part D of Schedule II of the Listing Regulations.
III. MeetingsHeld The Committee met six times during the financial year
2017- 18 on the following dates:
May 12, 2017 August 1, 2017 September 7, 2017October 12, 2017 November 6, 2017 December 1, 2017
Mr. N. Vaghul, Chairman of the Nomination & Remuneration Committee was present at the last AGM.
IV. PerformanceEvaluationCriteriaforIndependentDirectors
The Performance Evaluation Criteria for Independent Directors comprises certain parameters like professional qualifications, experience, knowledge and competency, active participation at the Board / Committee meetings, ability to function as a team, initiative, availability and attendance at meetings, commitment and contribution to the Board and the Company, integrity, independence from the Company and other Directors and whether there is any conflict of interest, voicing of opinions freely, etc. These are in compliance with applicable laws, regulations and guidelines.
C. StakeholdersRelationshipCommittee I. ConstitutionoftheCommittee The Stakeholders Relationship Committee comprises two
members, as per details in the following table:
Name Category
Mr. Deepak Satwalekar - Chairman Non - Executive, IndependentMr. Vijay Shah Executive
The composition of this Committee is in compliance with the requirements of Section 178 of Companies Act, 2013 and Regulation 20 of the Listing Regulations.
II. TermsofReference The Stakeholders Relationship Committee reviews and
ensures the existence of a proper system for timely resolution of grievances of the security holders of the Company including complaints related to transfer of shares, non receipt of balance sheet and declared dividends.
The terms of reference of the Committee are aligned with the terms of reference provided under Section 178 of the Companies Act, 2013 and Para B of Part D of Schedule II of the Listing Regulations.
III. MeetingsHeld The Committee met four times during the financial year
2017-18, on the following dates:
May 17, 2017 August 1, 2017November 6, 2017 January 30, 2018
Mr. Deepak Satwalekar, Chairman of the Stakeholders Relationship Committee was present at the last AGM.
IV. StakeholdersGrievanceRedressal There was 1 pending complaint at the beginning of the
year. 30 complaints were received and redressed to the satisfaction of shareholders during the year under review. There was 1 outstanding complaint as on March 31, 2018. No requests for transfer and dematerialization were pending for approval as on March 31, 2018.
The Company did not receive any complaints relating to Compulsorily Convertible Debentures during the year.
The Registrar and Share Transfer Agents (RTA), M/s. Link Intime India Private Limited, attend to all grievances of shareholders received directly or through SEBI, Stock Exchanges or the Ministry of Corporate Affairs. Most of the grievances / correspondences are attended within a period of 7 days from the date of receipt of such grievances.
The Company maintains continuous interaction with the RTA and takes proactive steps and actions for resolving shareholder complaints / queries. Likewise, the Company also has regular interaction with the Debenture Trustees to ascertain the grievances, if any, of the Debenture holders. There was no grievance received from the Debenture Trustee or from any of the Debenture holders during financial year 2017-18.
V. ComplianceOfficer Mr. Leonard D’Souza, Company Secretary, is the
Compliance Officer. The Company has designated the email ID [email protected] to enable stakeholders to email their grievances.
D. CorporateSocialResponsibilityCommittee I. ConstitutionoftheCommittee The Corporate Social Responsibility Committee comprises
three members, as per details in the following table:
Name Category
Prof. Goverdhan Mehta - Chairman Non-Executive, IndependentMs. Nandini Piramal Executive, PromoterMr. Vijay Shah Executive
The composition of the Committee is in compliance with Section 135 of the Companies Act, 2013.
II. TermsofReference The terms of reference of the Corporate Social
Responsibility Committee are aligned with the terms of reference provided under Section 135 of the Companies Act, 2013.
III. MeetingsHeld The Committee met three times during the financial year
2017-18 on the following dates:
August 1, 2017 November 6, 2017 March 27, 2018
Annual Report 2017-18 | 131
Managem
ent Discussion & Analysis
Strategic Overview
Board &
Managem
ent ProfilesStatutory Reports
Financial Statements
4. REMUNERATION OF DIRECTORS A. RemunerationtoExecutiveDirectors: Remuneration paid to the Executive Directors is recommended by the Nomination & Remuneration Committee, approved by the Board and is
subject to the overall limits as approved by the shareholders.
Details of remuneration paid / payable to the Executive Directors for the year ended March 31, 2018 are given below:
(`)
Name of Director Designation Salary & PerquisitesPerformance Linked
IncentiveTotal
Mr. Ajay G. Piramal Chairman 8,62,48,800 3,44,99,520 12,07,48,320Dr. (Mrs.) Swati A. Piramal Vice Chairperson 3,95,30,700 1,58,12,280 5,53,42,980Ms. Nandini Piramal Executive Director 2,87,49,600 1,14,99,840 4,02,49,440Mr. Vijay Shah Executive Director 4,78,17,000 1,91,26,800 6,69,43,800
The variable component of remuneration (Performance Linked Incentive) for Executive Directors are determined on the basis of several criteria including their individual performance as measured by achievement of their respective Key Result Areas (KRAs), strategic initiatives taken and being implemented, their respective roles in the organization, fulfillment of their responsibilities and performance of the Company. This is in accordance with the Company’s Remuneration Policy.
B. SittingfeesandcommissionpaidtoIndependentDirectors Details of sitting fees and commission paid / payable to the Independent Directors for the financial year 2017-18 are given below. These are
within the limits prescribed under the Companies Act, 2013:
(`)
Name of Independent Director Sitting Fees Commission Total
Mr. Gautam Banerjee 9,00,000 27,00,000 36,00,000Mr. Keki Dadiseth 17,50,000 27,00,000 44,50,000Mr. S. Ramadorai 10,50,000 27,00,000 37,50,000Mr. Deepak Satwalekar 17,50,000 27,00,000 44,50,000Dr. R.A. Mashelkar 11,00,000 27,00,000 38,00,000Prof. Goverdhan Mehta 7,50,000 27,00,000 34,50,000Mr. Siddharth Mehta 8,00,000 27,00,000 35,00,000Mr. N. Vaghul 23,00,000 27,00,000 50,00,000
Notes for Directors’ Remuneration:
a. Mr. Anand Piramal, Non-Executive Director does not receive any sitting fees or any other remuneration.
b. The terms of appointment of Executive Directors as approved by shareholders, are contained in their respective Agreements entered into with the Company. The tenure of office of the Whole-Time Directors is between three to five years from their respective date of appointment. The Agreements also contain clauses relating to termination of appointment in different circumstances, including for breach of terms, the notice period for which is three months. While there is no specific provision for payment of severance fees for any of the Executive Directors, the Board is empowered to consider the same at its discretion, taking into account attendant facts and circumstances.
c. No amount by way of loan or advance has been given by the Company to any of its Directors.
d. During the year ended March 31, 2018, 10,050 Stock Options were granted to Mr. Vijay Shah, Executive Director at an exercise price of ` 1,890 per Option. In addition to the exercise price, applicable TDS would also be payable at the time of exercising the Stock Options. Out of the Options so granted, the Nomination and Remuneration Committee / Board of Directors would determine the actual number of stock options that would vest, after considering performance and other factors. It may be noted in this regard that since the Company’s ESOP Scheme is implemented through the ESOP Trust and the shares given by the ESOP Trust against exercise of stock options are those that have been acquired by the ESOP Trust from the secondary market and no new shares are issued by the Company, there will not be any increase in the share capital of the Company, nor will there be any impact on the Earnings Per Share or other ratios relating to share capital, as a result of exercise of the Stock Options.
There was no pecuniary relationship or transactions with Non - Executive Directors vis-à-vis the Company other than sitting fees and commission that is paid to the Non - Executive Independent Directors.
132 | Piramal Enterprises Limited
e. During the financial year ended March 31, 2018, Non-Executive Independent members of the Board were paid sitting fees at the rate of ` 1,00,000 per meeting of the Board, Audit & Risk Management Committee and Independent Directors attended by them. The sitting fees paid to Non-Executive Independent Directors for attending meetings of all other Committees is ` 50,000 per meeting. As regards commission to Non-Executive Independent Directors is concerned, the same is determined by the Board on the basis of performance based criteria and other factors.
5. GENERAL BODY MEETINGS A. DetailsoftheAnnualGeneralMeetingsheldduringthepreceding3yearsandSpecialResolutionspassedthereataregivenbelow:
Annual General Meeting (AGM)
Date Time Venue Details of Special Resolutions passed
68th AGM August 6, 2015 3.00 p.m. Yashwantrao Chavan Pratisthan,General Jagannath BhosaleMarg, Opposite Mantralaya,Nariman Point,Mumbai - 400 021.
(i) Re-appointment of Mr. Vijay Shah as Executive Director(ii) Issue of Non-Convertible Debentures on Private Placement basis(iii) Approval under Section 188 of the Companies Act, 2013 for
holding office by Mr. Peter DeYoung in the Company
69th AGM August 1, 2016 3.00 p.m. Walchand Hirachand Hall,Indian Merchants’ ChambersBuilding, 4th Floor, IMC Marg,Churchgate, Mumbai- 400 020.
(i) Inter-Corporate Investments (` 32,500 Crores over and above limit approved by shareholders by Postal Ballot on November 14, 2015)
(ii) Borrowings (` 44,000 Crores over and above the applicable regulatory limit)
(iii) Payment of commission to Non-Executive Directors (upto 1% of net profits of the Company)
(iv) Issue of Non-Convertible Debentures on Private Placement basis70th AGM August 1, 2017 3.00 p.m. Yashwantrao Chavan Pratisthan,
General Jagannath BhosaleMarg, Opposite Mantralaya,Nariman Point,Mumbai - 400 021.
(i) Re-appointment of Mr. Ajay G. Piramal as Chairman of the Company
(ii) Re-appointment of Ms. Nandini Piramal as Executive Director (iii) Issue of Non-Convertible Debentures on Private Placement basis
B. PostalBallot I. DetailsofSpecialResolutionpassedthroughPostalBallotduringFY2017-18
Date of Notice ProposalNo. & % of votes cast in favour
No. & % of votes cast againstDate of passing of the resolutions
May 12, 2017 Special Resolution seeking approval of the members for issuance of equity shares and / or convertible securities for an aggregate amount not exceeding ` 5,000 Crores.
12,98,60,882 3,70,620 June 14, 2017(99.72%) (0.28%)
As will be seen from the above table, the above mentioned resolution was passed by overwhelming requisite majority.
II. PersonwhoconductedthePostalBallotexercise Mr. N.L. Bhatia, Practicing Company Secretary was
appointed as Scrutinizer for the above mentioned Postal Ballot process.
III. ProcedureforPostalBallot The Notice, Explanatory Statement along with the
Postal Ballot Form and self- addressed, postage pre-paid envelope, were dispatched to the members to enable them to consider and vote for or against the proposals within a period of 30 days from the date of dispatch. After the last date of receipt of Postal Ballots, the Scrutinizer, after due verification, submitted his report. Thereafter, the results of the Postal Ballot were declared by Mr. Vijay Shah who was authorised to declare the results on behalf of the Board of Directors. The same were filed with the stock exchanges and posted on the website of the Company and at its Registered Office.
IV. E-votingfacility E-voting facility was offered to all the members to
enable them to cast their votes electronically, instead of dispatching the Postal Ballot Form by post.
V. WhetheranyspecialresolutionisproposedtobeconductedthroughPostalBallot
At present there is no proposal to pass any resolution through postal ballot.
6. DISCLOSURES • RelatedPartyTransactions a) All transactions entered into with Related Parties in
terms of provisions under the Companies Act, 2013 and Regulation 23 of the Listing Regulations during the financial year 2017-18 were undertaken in compliance with the aforesaid regulatory provisions;
b) There were no materially significant transactions with related parties during the financial year which were in conflict with the interest of the Company;
Annual Report 2017-18 | 133
Managem
ent Discussion & Analysis
Strategic Overview
Board &
Managem
ent ProfilesStatutory Reports
Financial Statements
c) Suitable disclosure as required by the Indian Accounting Standards (IND AS 24) has been made in the notes to the Financial Statements;
d) The Board has approved a policy for related party transactions which has been uploaded on the website of the Company and can be accessed at https://bit.ly/2I31GTi www.piramal.com/investor/corporate-governance/policies-code-compliances#detailSection;
e) The Register of Contracts / statement of related party transactions, is placed before the Board / Audit & Risk Management Committee regularly;
f) Transactions with related parties are disclosed in Note No. 38 of the Statement of Accounts, which forms part of this Annual Report.
• Detailsofnon-compliance,penalties,stricturesimposedbytheStockExchange(s)orSEBIoranystatutoryauthorityonanymatterrelatedtocapitalmarketsduringthelast3years
SEBI issued an order dated October 3, 2016 with respect to Piramal Enterprises Limited, Mr. Ajay G. Piramal, Dr. (Mrs.) Swati A. Piramal, Ms. Nandini Piramal and Mr. N. Santhanam (former director) imposing an aggregate penalty of ` 6,00,000 (Rupees Six Lakhs only) in respect of certain technical non – compliances with the Model Code of Conduct prescribed under the SEBI (Prohibition of Insider Trading) Regulations, 1992. An appeal has been filed by the Company, Mr. Ajay G. Piramal, Dr. (Mrs.) Swati A. Piramal, Ms. Nandini Piramal with the Securities Appellate Tribunal against the said Order.
No other penalties or strictures have been imposed on the Company by Stock Exchanges or SEBI or any statutory authority on any matter relating to capital markets during the last 3 years.
• ListingFees Listing fees for financial year 2018-19 have been paid to the
Stock Exchanges on which the shares of the Company are listed.
• VigilMechanism/WhistleBlowerPolicyforDirectorsandemployees
The Company has established a Vigil Mechanism, which includes a Whistle Blower Policy, for its Directors and employees, to provide a framework to facilitate responsible and secure reporting of concerns of unethical behaviour, actual or suspected fraud or violation of the Company’s Code of Conduct & Ethics. The details of establishment of Vigil Mechanism/ Whistle Blower Policy are posted on the website of the Company and the weblink to the same is https://bit.ly/2I31GTi www.piramal.com/investor/corporate-governance/policies-code-compliances#detailSection. No Director/ employee has been denied access to the Audit & Risk Management Committee.
• Compliancewithmandatory/nonmandatoryrequirements a. The Company has complied with all the applicable
mandatory requirements of the Listing Regulations.
b. The Company has also adopted the non mandatory requirement as specified in the Listing Regulations regarding unmodified financial statements.
7. MEANSOFCOMMUNICATION The Company recognizes the importance of two way communication
with shareholders and of giving a balanced reporting of results and progress and responds to questions and issues raised in a timely and consistent manner. Shareholders seeking information may contact the Company directly throughout the year. They also have an opportunity to ask questions in person at the Annual General Meeting. Some of the modes of communication are mentioned below:
A. QuarterlyResults: The approved financial results are forthwith sent to the Stock
Exchanges where the shares are listed and are displayed on the Company’s website www.piramal.com and are generally published in Business Standard (all editions) (English) and Mumbai Lakshadweep (Marathi), within forty eight hours of approval thereof.
B. Presentations: Presentations made to the institutional investors / analysts are
intimated to the Stock Exchanges within the prescribed time period under the Listing Regulations and are simultaneously hosted on the website.
C. Website: The Company’s website www.piramal.com contains a separate
dedicated section for Investors, the link to which is http://www.piramal.com/investor/overview where all information and relevant policies to be provided under applicable regulatory requirements, are available in a user friendly form.
D. AnnualReport: The Annual Report containing inter-alia the Audited Annual
Accounts, Consolidated Financial Statements, Board’s Report, Auditors’ Report, Corporate Governance Report and other important information is circulated to Members and others entitled thereto. The Management Discussion and Analysis Report forms part of the Annual Report. The Annual Report is also posted on the website of the Company.
E. DesignatedExclusiveEmailID: The Company has designated the
Email ID [email protected] exclusively for investor servicing. This Email ID has been displayed on the Company’s website www.piramal.com at https://bit.ly/2K2HNxP www.piramal.com/investor/contacts.
134 | Piramal Enterprises Limited
F. RemindertoInvestorstoclaimunclaimeddividend: Reminders to claim unclaimed dividend are sent to the
shareholders periodically every year.
G. SEBIComplaintsRedressSystem(SCORES): All complaints received through SEBI SCORES are resolved in a
timely manner by the Company, similar to other complaints.
H. NSEElectronicApplicationProcessingSystem(NEAPS)andBSECorporateCompliance&ListingCentre(BSEListingCentre)
NEAPS and BSE Listing Centre are web based application systems for enabling corporates to undertake electronic filing of various periodic compliance related filings like shareholding pattern, results, press releases, etc.
8. GENERALINFORMATIONFORSHAREHOLDERS A. CompanyRegistrationDetails The Company is registered in the State of Maharashtra,
India. The Corporate Identification Number (CIN) allotted to the Company by the Ministry of Corporate Affairs (MCA) is L24110MH1947PLC005719.
B. ChangeinRegisteredOfficeoftheCompany The Registered Office of the Company was shifted within the
local limits of Mumbai from Piramal Tower, Ganpatrao Kadam Marg, Lower Parel, Mumbai – 400 013 to Piramal Ananta, Agastya Corporate Park, Opposite Fire Brigade, Kamani Junction, LBS Marg, Kurla (West) Mumbai 400 070 with effect from November 6, 2017.
C. AnnualGeneralMeeting Day, Date and Time: Monday, July 30, 2018 at 3.00 p.m. Venue: Rangaswar Auditorium, 4th floor, Yashwantrao Chavan
Pratishthan, General Jagannathrao Bhosale Marg, Next to Sachivalaya Gymkhana, Mumbai- 400 021
The Company shall also provide facility of e-voting and ballot voting for the ensuing Annual General Meeting.
D. FinancialCalendar The financial year of the Company starts on April 1 and ends on
March 31 of next year.
Financial reporting for:
Quarter ending June 30, 2018 July 30, 2018Half year ending September 30, 2018 October 25, 2018Quarter ending December 31, 2018 January 28, 2019Year ending March 31, 2019 April 26, 2019Annual General Meeting for the year ending March 31, 2019
July / August, 2019
The above dates are subject to change pursuant to unforeseen circumstances.
E. BookClosurePeriod Monday, July 23, 2018 to Monday, July 30, 2018 (both days
inclusive).
F. DividendPaymentDate During the period from July 31, 2018 to August 4, 2018
G. ListingonStockExchanges EquityShares BSELimited(BSE), [Scrip Code: 500302] Phiroze Jeejeebhoy Towers, Dalal Street, Mumbai - 400 001.
NationalStockExchangeofIndiaLimited(NSE), [Trading Symbol: PEL] “ Exchange Plaza”, Bandra-Kurla Complex, Bandra (E),
Mumbai - 400 051.ISIN : INE140A01024Reuter’scode : PIRA.BO
: PIRA.NSBloombergcode : PIEL:IN
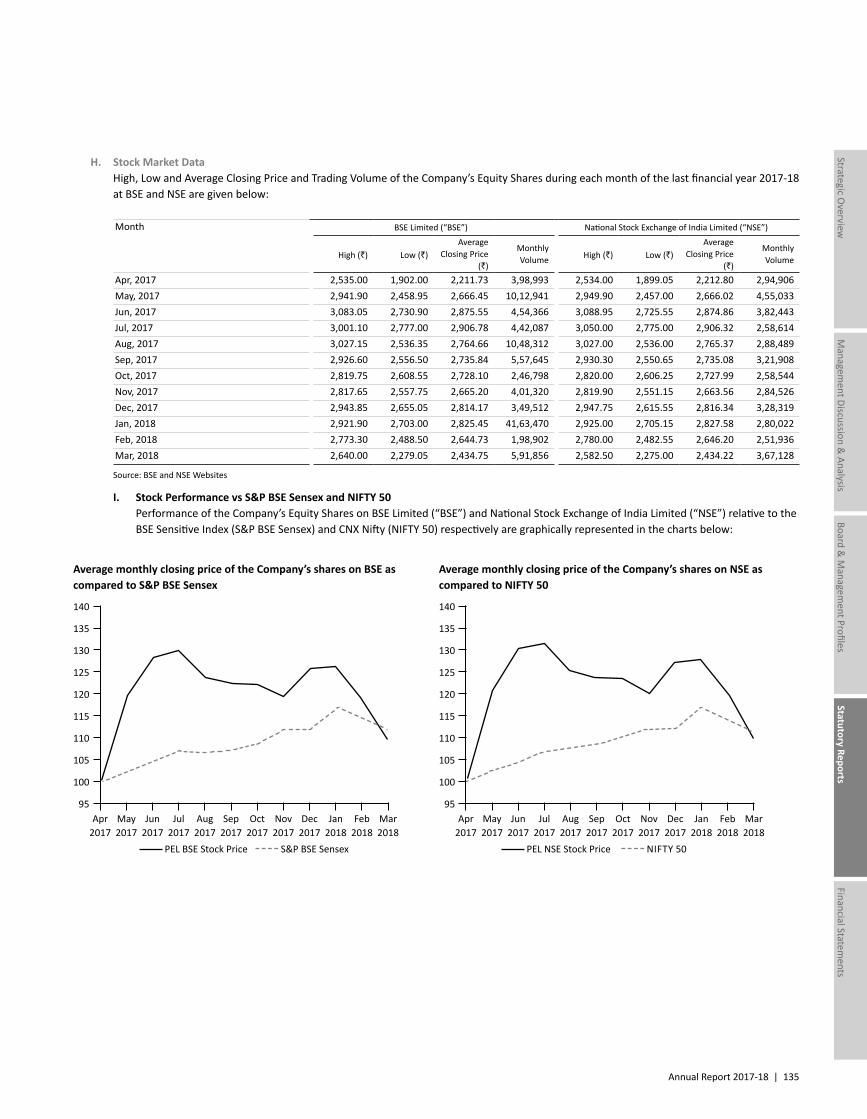
Annual Report 2017-18 | 135
Managem
ent Discussion & Analysis
Strategic Overview
Board &
Managem
ent ProfilesStatutory Reports
Financial Statements
H. StockMarketData High, Low and Average Closing Price and Trading Volume of the Company’s Equity Shares during each month of the last financial year 2017-18
at BSE and NSE are given below:
Month BSE Limited (“BSE”) National Stock Exchange of India Limited (“NSE”)
High (`) Low (`)Average
Closing Price (`)
Monthly Volume High (`) Low (`)
Average Closing Price
(`)
Monthly Volume
Apr, 2017 2,535.00 1,902.00 2,211.73 3,98,993 2,534.00 1,899.05 2,212.80 2,94,906May, 2017 2,941.90 2,458.95 2,666.45 10,12,941 2,949.90 2,457.00 2,666.02 4,55,033Jun, 2017 3,083.05 2,730.90 2,875.55 4,54,366 3,088.95 2,725.55 2,874.86 3,82,443Jul, 2017 3,001.10 2,777.00 2,906.78 4,42,087 3,050.00 2,775.00 2,906.32 2,58,614Aug, 2017 3,027.15 2,536.35 2,764.66 10,48,312 3,027.00 2,536.00 2,765.37 2,88,489Sep, 2017 2,926.60 2,556.50 2,735.84 5,57,645 2,930.30 2,550.65 2,735.08 3,21,908Oct, 2017 2,819.75 2,608.55 2,728.10 2,46,798 2,820.00 2,606.25 2,727.99 2,58,544Nov, 2017 2,817.65 2,557.75 2,665.20 4,01,320 2,819.90 2,551.15 2,663.56 2,84,526Dec, 2017 2,943.85 2,655.05 2,814.17 3,49,512 2,947.75 2,615.55 2,816.34 3,28,319Jan, 2018 2,921.90 2,703.00 2,825.45 41,63,470 2,925.00 2,705.15 2,827.58 2,80,022Feb, 2018 2,773.30 2,488.50 2,644.73 1,98,902 2,780.00 2,482.55 2,646.20 2,51,936Mar, 2018 2,640.00 2,279.05 2,434.75 5,91,856 2,582.50 2,275.00 2,434.22 3,67,128
Source: BSE and NSE Websites
I. StockPerformancevsS&PBSESensexandNIFTY50 Performance of the Company’s Equity Shares on BSE Limited (“BSE”) and National Stock Exchange of India Limited (“NSE”) relative to the
BSE Sensitive Index (S&P BSE Sensex) and CNX Nifty (NIFTY 50) respectively are graphically represented in the charts below:
AveragemonthlyclosingpriceoftheCompany’ssharesonBSEascomparedtoS&PBSESensex
AveragemonthlyclosingpriceoftheCompany’ssharesonNSEascomparedtoNIFTY50
140
135
130
125
120
115
110
105
100
95Apr
2017May 2017
Jun 2017
Jul 2017
Aug 2017
Sep 2017
Oct 2017
Nov 2017
Dec 2017
Jan 2018
Feb 2018
Mar 2018
PEL BSE Stock Price S&P BSE Sensex
140
135
130
125
120
115
110
105
100
95Apr
2017May 2017
Jun 2017
Jul 2017
Aug 2017
Sep 2017
Oct 2017
Nov 2017
Dec 2017
Jan 2018
Feb 2018
Mar 2018
PEL NSE Stock Price NIFTY 50
136 | Piramal Enterprises Limited
• Liquidity Shares of the Company are actively traded on BSE and
NSE as is seen from the volume of shares indicated in the table containing stock market data and hence ensure good liquidity for the investors.
J. ShareTransferAgents M/s. Link Intime India Pvt. Ltd. (“Link Intime”), are the Share
Transfer Agents of the Company. The contact details of Link Intime are given below:
LinkIntimeIndiaPvt.Ltd. C 101, 247 Park, L B S Marg, Vikhroli West, Mumbai 400 083. Tel: +91 22 49186000 / 49186270 Fax: +91 22 49186060 Email ID: [email protected]
K. ShareTransferSystem(inphysicalsegment) For administrative convenience and to facilitate speedy
approvals, authority has been delegated to the Share Transfer
Agents (RTA) and Authorized Executives to approve share transfers in physical form. Share transfers/ transmissions approved by the RTA and/or the authorised executives are placed before the duly empowered Administrative Committee of the Directors / Board Meeting from time to time.
In case of shares in electronic form, the transfers are processed by NSDL / CDSL through respective Depository Participants.
In case of shares held in physical form, all transfers are completed within 15 days from the date of receipt of complete documents. As at March 31, 2018 there were no Equity Shares pending for transfer. Also, there were no demat requests pending as on March 31, 2018.
The Company obtains from a Company Secretary in Practice, half yearly certificate of compliance with share transfer and other formalities as required under Regulation 40 of the Listing Regulations and files a copy of the certificate with the Stock Exchanges.
L. DistributionofShareholdingbysizeasonMarch31,2018
No. of Shares held No. of shareholders% to total no. of
shareholdersNo. of shares
% to total no. of shares
1 to 100 74,064 68.69 1,902,493 1.06101 to 200 10,280 9.53 14,42,475 0.80201 to 500 14,110 13.09 43,88,391 2.43501 to 1000 5,451 5.06 39,19,439 2.171001 to 5000 3,144 2.92 5,813,547 3.225001 to 10000 288 0.26 19,44,740 1.0910001 to 20000 174 0.16 23,92,124 1.3320001 to 30000 63 0.06 15,38,957 0.8530001 to 40000 42 0.04 14,91,241 0.8340001 to 50000 23 0.02 10,48,628 0.5850001 to 100000 74 0.07 55,37,478 3.07Above 100000 106 0.10 14,88,54,161 82.57TOTAL 1,07,819 100.00 18,02,73,674 100.00
M. Dematerialisationofshares As on March 31, 2018, 17,25,53,392 equity shares (95.72% of the total number of shares) are in dematerialized form as compared to
16,41,38,550 equity shares (95.12% of the total number of shares) as on March 31, 2017.
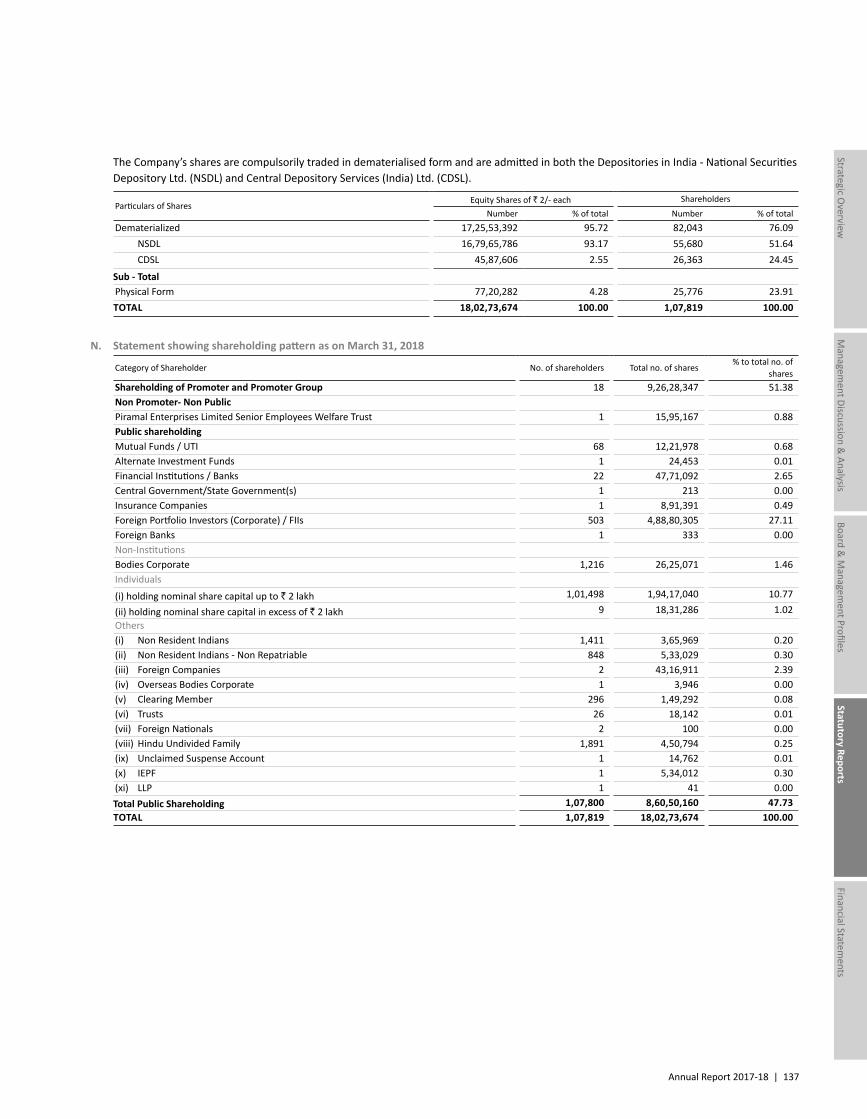
Annual Report 2017-18 | 137
Managem
ent Discussion & Analysis
Strategic Overview
Board &
Managem
ent ProfilesStatutory Reports
Financial Statements
The Company’s shares are compulsorily traded in dematerialised form and are admitted in both the Depositories in India - National Securities Depository Ltd. (NSDL) and Central Depository Services (India) Ltd. (CDSL).
Particulars of SharesEquity Shares of ` 2/- each Shareholders
Number % of total Number % of totalDematerialized 17,25,53,392 95.72 82,043 76.09 NSDL 16,79,65,786 93.17 55,680 51.64 CDSL 45,87,606 2.55 26,363 24.45
Sub-TotalPhysical Form 77,20,282 4.28 25,776 23.91TOTAL 18,02,73,674 100.00 1,07,819 100.00
N. StatementshowingshareholdingpatternasonMarch31,2018
Category of Shareholder No. of shareholders Total no. of shares% to total no. of
sharesShareholdingofPromoterandPromoterGroup 18 9,26,28,347 51.38NonPromoter-NonPublicPiramal Enterprises Limited Senior Employees Welfare Trust 1 15,95,167 0.88PublicshareholdingMutual Funds / UTI 68 12,21,978 0.68Alternate Investment Funds 1 24,453 0.01Financial Institutions / Banks 22 47,71,092 2.65Central Government/State Government(s) 1 213 0.00Insurance Companies 1 8,91,391 0.49Foreign Portfolio Investors (Corporate) / FIIs 503 4,88,80,305 27.11Foreign Banks 1 333 0.00Non-InstitutionsBodies Corporate 1,216 26,25,071 1.46Individuals
(i) holding nominal share capital up to ` 2 lakh 1,01,498 1,94,17,040 10.77
(ii) holding nominal share capital in excess of ` 2 lakh 9 18,31,286 1.02Others(i) Non Resident Indians 1,411 3,65,969 0.20(ii) Non Resident Indians - Non Repatriable 848 5,33,029 0.30(iii) Foreign Companies 2 43,16,911 2.39(iv) Overseas Bodies Corporate 1 3,946 0.00(v) Clearing Member 296 1,49,292 0.08(vi) Trusts 26 18,142 0.01(vii) Foreign Nationals 2 100 0.00(viii) Hindu Undivided Family 1,891 4,50,794 0.25(ix) Unclaimed Suspense Account 1 14,762 0.01(x) IEPF 1 5,34,012 0.30(xi) LLP 1 41 0.00TotalPublicShareholding 1,07,800 8,60,50,160 47.73TOTAL 1,07,819 18,02,73,674 100.00
138 | Piramal Enterprises Limited
O. ConvertibleSecurities During the year the Company has allotted 4,64,330
Compulsorily Convertible Debentures (CCDs) of face value of ` 1,07,600 each for cash at a price of ` 1,07,600 per CCD. The CCDs are convertible into 40 equity shares of face value of ` 2 each on April 19, 2019 or at any time prior to that at the option of the CCD holder.
On November 24, 2017, 5,625 CCDs were converted into 2,25,000 Equity shares of the Company.
Listing details of the CCDs are as under: BSE Limited - Scrip Code: 912459 National Stock Exchange of India Limited - Trading Symbol: PEL ISIN: INE140A08SX5
P. OutstandingGDRs/ADRs/WarrantsoranyconvertibleinstrumentsconversiondateandlikelyimpactonEquity
As on March 31, 2018, 4,58,705 CCDs are outstanding which are convertible into 1,83,48,200 equity shares of ` 2 each of the Company on or before April 19, 2019. Further pursuant to Regulation 53 of the SEBI (Issue of Capital and Disclosure Requirements) Regulations, 2009, the CCD holders, at the time of conversion, will have the option to subscribe to 7,97,748 equity shares of ` 2 each of the Company which have been reserved in favour of them pursuant to the Rights Issue of the Company made vide Letter of Offer dated February 1, 2018.
Q. DebtSecurities Non-Convertible Debentures issued by the Company from
time to time are listed on the Wholesale Debt Market Segment (WDM) of NSE.
DebentureTrustees IDBI Trusteeship Services Limited Asian Building, Ground Floor, 17, R Kamani Marg, Ballard Estate, Mumbai 400001. Tel: +91 22 4080 7007. Fax: +91 22 6631 1776.
R. CommodityPriceRiskorForeignExchangeRiskandhedgingactivities
The Company is exposed to Currency Risk arising from its trade exposures and Capital receipt / payments denominated, in other than the Functional Currency. The Company has a detailed policy which includes setting of the recognition parameters, benchmark targets, the boundaries within which the treasury has to perform
and also lays down the checks and controls to ensure the continuing success of the treasury function.
The Company has defined strategies for addressing the risks for each category of exposures (e.g. for exports, for imports, for loans, etc.). The centralised treasury function aggregates the foreign exchange exposure and takes prudent measures to hedge the exposure based on prevalent macro-economic conditions.
S. PlantLocationsofPELanditsSubsidiaries India: • Plot No. K-1, Additional M.I.D.C, Mahad, District Raigad,
402 302 Maharashtra.
• Plot No. 67-70, Sector II, Pithampur, District Dhar, 454 775, Madhya Pradesh.
• Digwal Village, Kohir Mandal, Sangareddy District, Zaheerabad, 502 321, Telangana.
• Ennore Express Highway, Ernavur Village, Ennore, Chennai 600 057, Tamil Nadu.
• Light Hall, A wing, Hiranandani Business Park, Saki Vihar Road, Chandivali, Andheri (East), Mumbai - 400 072, Maharashtra.
• Plot Nos.18 and 19 - PHARMEZ, Village Matoda, Sarkhejbawala, NH 8A, Taluka Sanand, Ahmedabad - 382 213, Gujarat.
Overseas: Piramal Healthcare UK Limited • Morpeth, Northumberland, UK • Grangemouth, Stirlingshire, UK
Piramal Healthcare (Canada) Limited 110, Industrial Parkway North, Aurora, Ontario, L4G 3H4, Canada.
Piramal Critical Care Inc. 3950 Schelden Circle, Brodhead Road, Bethlehem, PA 18017, USA.
Piramal Pharma Solutions Inc. 1575 McGrathiana Parkway, Lexington, Kentucky, 40511, USA.
Ash Stevens LLC 18655 Krause Street, Riverview, MI 48193, USA
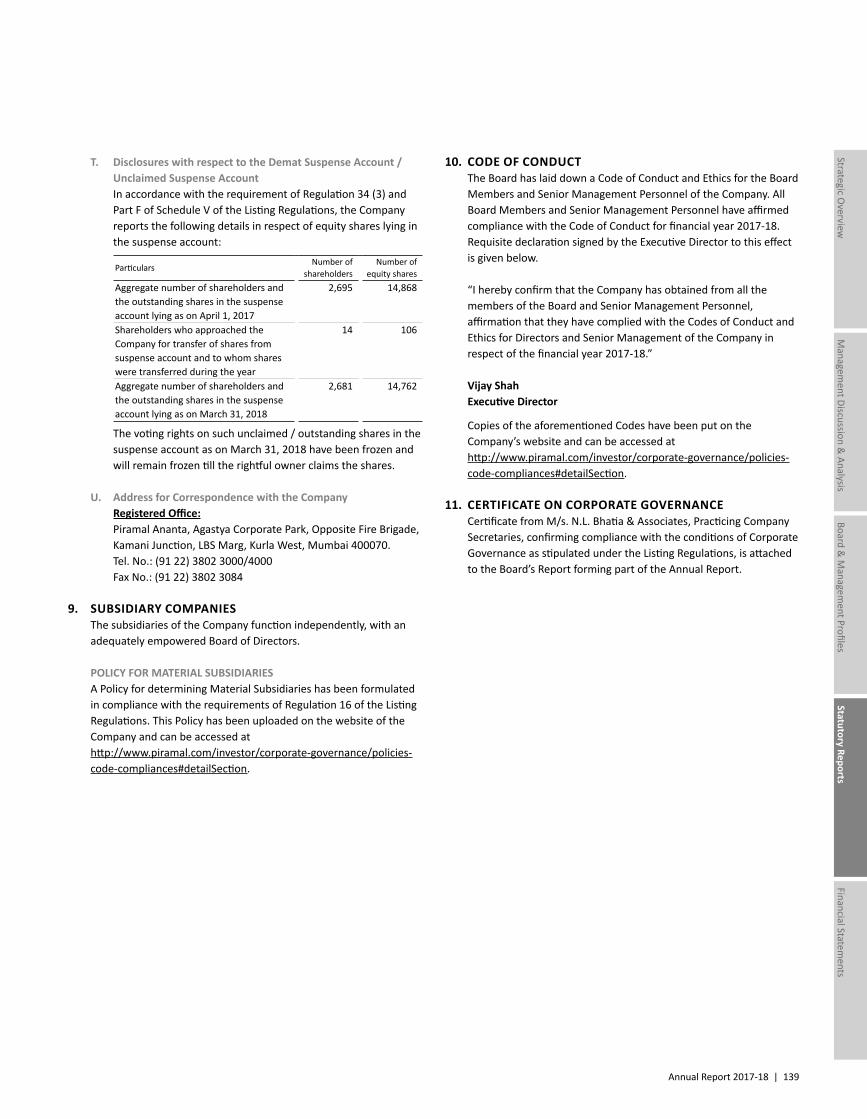
Annual Report 2017-18 | 139
Managem
ent Discussion & Analysis
Strategic Overview
Board &
Managem
ent ProfilesStatutory Reports
Financial Statements
T. DisclosureswithrespecttotheDematSuspenseAccount/UnclaimedSuspenseAccount
In accordance with the requirement of Regulation 34 (3) and Part F of Schedule V of the Listing Regulations, the Company reports the following details in respect of equity shares lying in the suspense account:
Particulars Number of
shareholdersNumber of
equity sharesAggregate number of shareholders and the outstanding shares in the suspense account lying as on April 1, 2017
2,695 14,868
Shareholders who approached the Company for transfer of shares from suspense account and to whom shares were transferred during the year
14 106
Aggregate number of shareholders and the outstanding shares in the suspense account lying as on March 31, 2018
2,681 14,762
The voting rights on such unclaimed / outstanding shares in the suspense account as on March 31, 2018 have been frozen and will remain frozen till the rightful owner claims the shares.
U. AddressforCorrespondencewiththeCompany RegisteredOffice: Piramal Ananta, Agastya Corporate Park, Opposite Fire Brigade,
Kamani Junction, LBS Marg, Kurla West, Mumbai 400070. Tel. No.: (91 22) 3802 3000/4000 Fax No.: (91 22) 3802 3084
9. SUBSIDIARYCOMPANIES The subsidiaries of the Company function independently, with an
adequately empowered Board of Directors.
POLICY FOR MATERIAL SUBSIDIARIES A Policy for determining Material Subsidiaries has been formulated
in compliance with the requirements of Regulation 16 of the Listing Regulations. This Policy has been uploaded on the website of the Company and can be accessed at http://www.piramal.com/investor/corporate-governance/policies-code-compliances#detailSection.
10. CODEOFCONDUCT The Board has laid down a Code of Conduct and Ethics for the Board
Members and Senior Management Personnel of the Company. All Board Members and Senior Management Personnel have affirmed compliance with the Code of Conduct for financial year 2017-18. Requisite declaration signed by the Executive Director to this effect is given below.
“I hereby confirm that the Company has obtained from all the members of the Board and Senior Management Personnel, affirmation that they have complied with the Codes of Conduct and Ethics for Directors and Senior Management of the Company in respect of the financial year 2017-18.”
VijayShah ExecutiveDirector
Copies of the aforementioned Codes have been put on the Company’s website and can be accessed at http://www.piramal.com/investor/corporate-governance/policies-code-compliances#detailSection.
11. CERTIFICATE ON CORPORATE GOVERNANCE Certificate from M/s. N.L. Bhatia & Associates, Practicing Company
Secretaries, confirming compliance with the conditions of Corporate Governance as stipulated under the Listing Regulations, is attached to the Board’s Report forming part of the Annual Report.
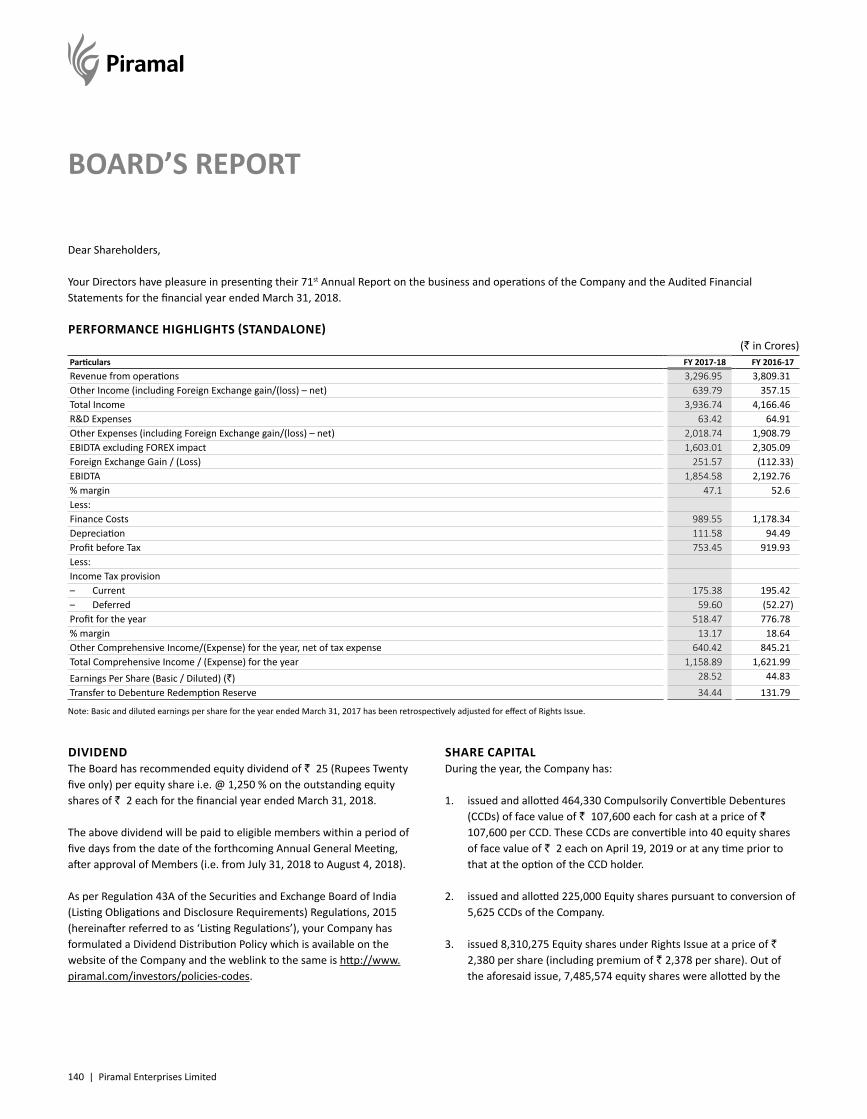
140 | Piramal Enterprises Limited
Dear Shareholders,
Your Directors have pleasure in presenting their 71st Annual Report on the business and operations of the Company and the Audited Financial Statements for the financial year ended March 31, 2018.
PERFORMANCE HIGHLIGHTS (STANDALONE) (` in Crores)
Particulars FY 2017-18 FY 2016-17Revenue from operations 3,296.95 3,809.31Other Income (including Foreign Exchange gain/(loss) – net) 639.79 357.15Total Income 3,936.74 4,166.46R&D Expenses 63.42 64.91Other Expenses (including Foreign Exchange gain/(loss) – net) 2,018.74 1,908.79EBIDTA excluding FOREX impact 1,603.01 2,305.09Foreign Exchange Gain / (Loss) 251.57 (112.33)EBIDTA 1,854.58 2,192.76% margin 47.1 52.6Less:Finance Costs 989.55 1,178.34Depreciation 111.58 94.49Profit before Tax 753.45 919.93Less:Income Tax provision– Current 175.38 195.42– Deferred 59.60 (52.27)Profit for the year 518.47 776.78% margin 13.17 18.64Other Comprehensive Income/(Expense) for the year, net of tax expense 640.42 845.21Total Comprehensive Income / (Expense) for the year 1,158.89 1,621.99Earnings Per Share (Basic / Diluted) (`) 28.52 44.83Transfer to Debenture Redemption Reserve 34.44 131.79
Note: Basic and diluted earnings per share for the year ended March 31, 2017 has been retrospectively adjusted for effect of Rights Issue.
BOARD’S REPORT
DIVIDENDThe Board has recommended equity dividend of ` 25 (Rupees Twenty five only) per equity share i.e. @ 1,250 % on the outstanding equity shares of ` 2 each for the financial year ended March 31, 2018.
The above dividend will be paid to eligible members within a period of five days from the date of the forthcoming Annual General Meeting, after approval of Members (i.e. from July 31, 2018 to August 4, 2018).
As per Regulation 43A of the Securities and Exchange Board of India (Listing Obligations and Disclosure Requirements) Regulations, 2015 (hereinafter referred to as ‘Listing Regulations’), your Company has formulated a Dividend Distribution Policy which is available on the website of the Company and the weblink to the same is http://www.piramal.com/investors/policies-codes.
SHARE CAPITALDuring the year, the Company has:
1. issued and allotted 464,330 Compulsorily Convertible Debentures (CCDs) of face value of ` 107,600 each for cash at a price of ` 107,600 per CCD. These CCDs are convertible into 40 equity shares of face value of ` 2 each on April 19, 2019 or at any time prior to that at the option of the CCD holder.
2. issued and allotted 225,000 Equity shares pursuant to conversion of 5,625 CCDs of the Company.
3. issued 8,310,275 Equity shares under Rights Issue at a price of `
2,380 per share (including premium of ` 2,378 per share). Out of the aforesaid issue, 7,485,574 equity shares were allotted by the
Annual Report 2017-18 | 141
Managem
ent Discussion & Analysis
Strategic Overview
Board &
Managem
ent ProfilesStatutory Reports
Financial Statements
Company on March 8, 2018 and 797,748 Rights Equity shares have been Reserved for CCD Holders [as per Regulation 53 of SEBI (Issue of Capital and Disclosure Requirements) Regulations, 2009] & 26,953 Rights Equity Shares have been kept in abeyance.
UTILISATION OF ISSUE PROCEEDSThere has been no deviation in the utilisation of issue proceeds of Qualified Institutional Placement of CCDs, from the Objects as stated in the Placement Document dated October 17, 2017.
Further, there has been no deviation in the utilisation of Rights Issue proceeds from the Objects as stated in the Letter of Offer dated February 1, 2018.
CHANGES IN SUBSIDIARIES, JOINT VENTURES AND ASSOCIATE COMPANIESChanges in subsidiaries, joint ventures or associate companies during the year under review are listed in Annexure A to this Report.
FINANCIAL DETAILS OF SUBSIDIARIES, JOINT VENTURES AND ASSOCIATE COMPANIESPursuant to the provisions of Section 129(3) of the Companies Act, 2013, a statement containing salient features of financial statements of subsidiaries, associates and joint venture companies in Form AOC-1 is attached to the Accounts. The separate audited financial statements of the subsidiaries shall be kept open for inspection at the Registered Office of the Company during working hours for a period of 21 days before the date of the Annual General Meeting.
The separate financial statements of the subsidiaries are also available on the website of your Company at https://bit.ly/2tWglei www.piramal.com/investors/financial-reports#parentVerticalTab2 and will also be made available upon request of any Member of the Company who is interested in obtaining the same.
SIGNIFICANT EVENTS DURING THE FINANCIAL YEAR 2018Entered Emerging Corporate Lending business by initially committing ~` 400 crores in emerging & mid-market space across eight dealsIn July 2017, Piramal Finance Limited (PFL), a subsidiary of the Company (now merged into Piramal Housing Finance Limited), sanctioned ~` 400 crores through its recently launched vertical – Emerging Corporate Lending (ECL). Within its first few months of operations, ECL provided funding to sectors as diverse as automotive dealerships, auto ancillaries, manufacturing, pharmaceuticals, electronic surveillance and IT services.
Launched Piramal Housing FinanceIn September 2017, Piramal Finance Limited (now merged into Piramal Housing Finance Limited) forayed into the retail housing finance business through a wholly owned subsidiary, Piramal Housing Finance Limited [name is envisaged to be changed to Piramal Capital and Housing Finance Limited]. Under a license received from the National Housing Bank to operate, the housing finance vertical offers home loans as well as loans against property and construction finance to small developers.
Announced expansion of API manufacturing facilitiesIn October 2017, Piramal Pharma Solutions (PPS), a leading Contract Development and Manufacturing Organisation (CDMO) and a step-down wholly-owned subsidiary of the Company, announced investments of USD 55 million across its sites in North America & Asia, to expand its API manufacturing capabilities and capacities.
Fund raising of ` 4,996 Crores through Qualified Institutional Placement (QIP) of Compulsorily Convertible Debentures (CCDs)In October, 2017, the Company raised ` 4,996 Crores through QIP of 464,330 CCDs of face value ` 107,600 each with a coupon of 7.8% p.a. Each CCD is convertible into 40 equity shares of face value ` 2 each, with a maturity period of 18 months, with an option to the CCD holders to convert all or part of the CCDs held by them into equity shares at any time before the maturity date.
Acquired Digeplex and associated brandsIn November 2017, the Company’s Consumer Products division acquired Digeplex and associated brands from Shreya Lifesciences. The acquisition strengthened PEL’s position in the Gastro-Intestinal (GI) segment and is complementary to its existing brands - Polycrol and Naturolax, in the GI segment.
Forayed into Hospitality sectorIn January 2018, Piramal Finance Limited, a subsidiary of the Company (now merged into Piramal Housing Finance Limited), forayed into the hospitality sector with multiple transactions done in quick succession. The platform committed ` 650 Crores towards two marquee hotel assets in North India, followed by another ` 550+ Crores across other two assets in Bangalore and Pune, respectively.
Fund raising of upto ~` 2,000 Crores through Rights IssueThe Company raised ~` 1,781.57 Crores through allotment of 7,485,574 Equity Shares having face value of ` 2 each for cash price of ` 2,380 per Equity Share (including a premium of ` 2,378 per Equity Share) on a rights basis, which excludes 797,748 Equity shares reserved in favour of Compulsorily Convertible Debenture holders (‘CCD holders’) and 26,953 Equity shares kept in abeyance. Pursuant to Regulation 53 of the SEBI (Issue of Capital and Disclosure Requirements) Regulations, 2009, the CCD Holders have the right to participate in the Issue, in proportion to the CCDs held by them.
SIGNIFICANT EVENTS AFTER BALANCE SHEET DATEMerger of Piramal Finance and Piramal Capital with Piramal Housing FinanceIn April 2018, the Mumbai bench of NCLT approved the Scheme of Amalgamation of the Company’s wholly owned subsidiaries, Piramal Finance Limited (PFL) and Piramal Capital Limited with the step down subsidiary Piramal Housing Finance Limited (subsidiary of PFL) [name is envisaged to be changed to Piramal Capital and Housing Finance Limited] and their respective shareholders. The merger got effective on May 23, 2018.
142 | Piramal Enterprises Limited
Approved scheme of Amalgamation between Piramal Enterprises Ltd. (PEL) and Piramal Phytocare Ltd. (PPL)In May 2018, the Board of Directors has approved the draft scheme of Amalgamation between PPL (Transferor Company) and PEL (Transferee Company) and their respective shareholders. PEL will issue and allot 1 (one) fully paid up equity share having face value of ` 2 each to the equity shareholders of PPL on record date, for every 70 (seventy) fully paid up equity shares having face value of ` 10 each held by them. The scheme is subject to the approval of the shareholders, creditors and regulatory authorities.
OPERATIONS REVIEWTotal income from operations on a standalone basis for the year degrew by 13.45% to ` 3,296.95 Crores as compared to ` 3,809.31 Crores in FY 2017. Profit before interest, depreciation and tax (PBITDA) for FY2018 on a standalone basis degrew by 15.42% to ` 1,854.58 Crores as compared to ` 2,192.76 Crores in FY2017. Net Profit for the year was ` 518.47 Crores as compared to ` 776.78 Crores in FY2017. Earnings per share were ` 28.52 for the year as compared to ` 44.83 per share during the previous year.
A detailed discussion of operations for the year ended March 31, 2018 is provided in the Management Discussion and Analysis Report, which is presented in a separate section forming part of this Annual Report.
SUBSIDIARY COMPANIESPiramal Healthcare Inc. [Consolidated]Piramal Healthcare Inc. [consolidated] includes financials of its wholly owned subsidiaries Piramal Critical Care Inc and Piramal Pharma Inc. Net sales of Piramal Healthcare Inc. [consolidated] for FY 2018 were at `
1,040.30 crores. Profit before interest, depreciation and tax for the year was at ` 383.10 crores. Piramal Healthcare Inc. [consolidated] reported a net profit of ` 199.36 crores for the year.
PEL Pharma Inc. [Consolidated]PEL Pharma Inc [consolidated] includes financials of its wholly owned subsidiaries Piramal Pharma Solutions Inc and Ash Stevens LLC. Net sales of PEL Pharma Inc [consolidated] for FY 2018 were at ` 297.34 crores. Profit before interest, depreciation and tax for the year was at ` 34.62 crores. PEL Pharma Inc [consolidated] reported a net loss of ` 33.78 crores for the year.
Piramal Dutch IM Holdco B.V. [Consolidated]Piramal Dutch IM Holdco B.V. [Consolidated] includes financials of its wholly owned subsidiaries PEL-DRG Dutch Holdco B.V. and Decision Resources group. Net sales of this group for FY 2018 were at ` 1,205.88 Crores. Profit before interest, depreciation and tax for the year was at ` 168.86 Crores. Net loss for the year was at ` 206.93 Crores for the year.
Piramal Healthcare UK LimitedNet sales of Piramal Healthcare UK Limited for FY 2018 were at ` 723.40 Crores. Profit before interest, depreciation and tax for the year was at ` 78.13 Crores. Piramal Healthcare UK Limited reported a net profit of ` 96.44 Crores for the year.
Piramal Healthcare (Canada) LimitedNet sales of Piramal Healthcare (Canada) Limited for FY 2018 were at ` 172.60 Crores. Profit before interest, depreciation and tax for the year was at ` 49.26 Crores. Piramal Healthcare (Canada) Limited reported a net profit of ` 44.17 Crores for the year.
Piramal Critical Care Limited [Consolidated]Piramal Critical Care Limited (consolidated) includes financials of its wholly owned subsidiary Piramal Critical Care South Africa (Pty) Ltd.
Net sales of Piramal Critical Care Limited (consolidated) for FY 2018 were at ` 487.44 Crores. Profit before interest, depreciation and tax for the year was at ` 226.34 Crores. Piramal Critical Care Limited (consolidated) reported a net profit of ` 33.43 Crores for the year.
Piramal Critical Care Italia SPANet sales of Piramal Critical Care Italia SPA for FY 2018 were at ` 30.83 Crores. Loss before interest, depreciation and tax for the year was at ` 3.96 Crores. Piramal Critical Care Italia SPA reported a net loss of ` 5.75 Crores for the year.
Piramal Critical Care Deutschland GmbHNet sales of Piramal Critical Care Deutschland GmbH for FY 2018 were at ` 6.58 Crores. Loss before interest, depreciation and tax for the year was at ` 5.75 Crores. Piramal Critical Care Deutschland GmbH reported a net loss of ` 7.10 Crores for the year.
Piramal Imaging SA [Consolidated]Piramal Imaging SA (consolidated) includes financials of its wholly-owned subsidiaries Piramal Imaging GmBh and Piramal Imaging Limited. Net sales of Piramal Imaging SA (consolidated) for FY2018 were at ` 127.48 Crores. Loss before interest, depreciation and tax for the year was at ` 30.31 Crores. Piramal Imaging SA (consolidated) reported a net loss of ` 123.99 Crores for the year.
Piramal Housing Finance LimitedIncome from operations for FY 2018 was at ` 3,706.15 Crores. Profit before depreciation and tax for the year was at ` 1,545.89 Crores. Piramal Housing Finance Limited reported a net profit of ` 1,004.14 Crores for the year.
This includes the effect of merger of Piramal Capital Limited and Piramal Finance Limited with Piramal Housing Finance Limited.
Piramal Fund Management Private Limited [Consolidated]Piramal Fund Management Private Limited (consolidated) includes financials of Indiareit Investment Management Co., Piramal Asset Management Private Limited and Asset Resurgence Mauritious Manager. Income from operations for FY 2018 was at ` 94.31 Crores. Profit before depreciation and tax for the year was at ` 17.88 Crores. Piramal Fund Management Private Limited (consolidated) reported a net profit of ` 17.81 Crores for the year.
Annual Report 2017-18 | 143
Managem
ent Discussion & Analysis
Strategic Overview
Board &
Managem
ent ProfilesStatutory Reports
Financial Statements
JOINT VENTURES AND ASSOCIATE COMPANIESInvestment in Joint ventures and Associates are accounted for using the equity method of accounting. Under the equity method of accounting, the investments are initially recognised at cost and adjusted thereafter to recognise PEL’s share of post acquisition profits or losses and other comprehensive income of joint ventures and associates. Dividends received or receivable from associates or joint ventures are recognised as a reduction in the carrying amount of the investment.
Convergence Chemicals Private Limited is a 51:49 joint venture between PEL and Navin Fluorine International Limited set up to develop, manufacture and sell speciality fluorochemicals. Share of Loss (including consolidation adjustments) considered in consolidation for FY 2018 amounts to ` 6.16 crores.
PEL has an effective 20% equity stake in Shriram Capital Limited. Share of profit of Shriram Capital Limited considered in consolidation for FY 2018 amounts to ` 242.50 crores.
PEL owns 49% equity stake in Allergan India Private Limited. Share of profit of Allergan India Private Limited considered in consolidation for FY 2018 amounts to ` 46.86 crores.
PEL’s share of loss of ` 1.50 crores and ` 0.88 crores in Bluebird Aero Systems Limited and Piramal Phytocare Limited respectively have been considered in consolidation for FY 2018.
India Resurgence ARC Private Limited was a wholly owned subsidiary of the Company till July 18, 2017. On July 19, 2017, it became a joint venture between PEL and Bain Capital Credit India Investments (a company existing under the laws of the Republic of Mauritius). The Share of profit of India Resurgence ARC Private Limited has been considered in consolidation at ` 0.03 crores in FY 2018.
India Resurgence Asset Management Business Private Limited was a wholly owned subsidiary of the Company till February 6, 2018. On February 7, 2018, it became a joint venture between PEL and Bain Capital Credit India Investments (a company existing under the laws of the Republic of Mauritius). The Share of loss for India Resurgence Asset Management Business Private Limited reported has been considered in consolidation to ` 0.76 crores in FY 2018.
DEPOSITSYour Company has not accepted any deposits from the public and as such, no amount of principal or interest was outstanding as on the balance sheet date.
STATUTORY AUDITORS AND AUDITORS’ REPORTThe Auditors Report does not contain any qualification, reservation or adverse remark on the financial statements for the year ended March 31, 2018. The Notes on financial statement referred to in the Auditors’ Report are self-explanatory and do not call for any further comments.
In accordance with Sec 139 of the Companies Act, 2013, M/s Deloitte Haskins & Sells LLP, Chartered Accountants (Firm Registration Number 117366W/W-100018), were appointed by the shareholders of the Company at the Annual General Meeting held on August 1, 2017, as Statutory Auditors for a period of 5 years to hold office until the conclusion of the 75th Annual General Meeting of the Company in calendar year 2022.
The Ministry of Corporate Affairs vide its Notification dated May 7, 2018, has dispensed with the requirement of ratification of Auditor’s appointment by the shareholders, every year. Hence, approval of the Members for the ratification of Auditor’s appointment is not being sought at the ensuing Annual General Meeting.
CORPORATE SOCIAL RESPONSIBILITYThe Annual Report on Corporate Social Responsibility activities for FY 2018 is enclosed as Annexure B to this report.
CONSERVATION OF ENERGY, TECHNOLOGY ABSORPTION AND FOREIGN EXCHANGE EARNINGS AND OUTGOParticulars regarding Conservation of energy, technology absorption and foreign exchange earnings and outgo are given as Annexure C to this Report.
EXTRACT OF ANNUAL RETURNThe extract of the Annual Return in Form MGT-9 is annexed herewith as Annexure D to this report.
DIRECTORS AND KEY MANAGERIAL PERSONNELMr. Rajesh Laddha ceased to be the Chief Financial Officer w.e.f. June 30, 2017 and Mr. Vivek Valsaraj has been appointed as the Chief Financial Officer w.e.f December 1, 2017 at the Board Meeting held on December 1, 2017.
In accordance with the provisions of the Companies Act, 2013 and Articles of Association of the Company, Ms. Nandini Piramal retires by rotation at the ensuing Annual General Meeting and is eligible for re-appointment.
Approval of shareholders is also being sought for the re-appointment of Dr. (Mrs.) Swati A. Piramal, Vice-Chairperson and Mr. Vijay Shah, Executive Director for a further period of 5 years and 3 years with effect from November 20, 2017 and January 1, 2018, respectively, which the Board recommends.
The Independent Directors of the Company viz. Mr. S. Ramadorai, Mr. Narayanan Vaghul, Dr. R.A. Mashelkar, Prof. Goverdhan Mehta, Mr. Keki Dadiseth, Mr. Deepak Satwalekar, Mr. Gautam Banerjee and Mr. Siddharth Mehta were appointed at the Annual General Meeting of the Company held on July 25, 2014 to hold office for a term of five consecutive years up to March 31, 2019, in line with the provisions of Section 149 and other applicable provisions of the Companies Act, 2013 including the rules made thereunder and the erstwhile Listing
144 | Piramal Enterprises Limited
Agreement. It is proposed that these Independent Directors be re-appointed for a second term of 5 (Five) consecutive years to hold office up to March 31, 2024, which the Board recommends.
The Company has received declarations from all its Independent Directors, confirming that they meet the criteria of independence as prescribed under Section 149(6) of the Companies Act, 2013 and Regulation 16(1)(b) of the Securities and Exchange Board of India (Listing Obligations and Disclosure Requirements) Regulations, 2015 ('Listing Regulations').
BOARD EVALUATIONEvaluation of performance of all Directors is undertaken annually. The Company has implemented a system of evaluating performance of the Board of Directors and of its Committees and Directors on the basis of a structured questionnaire which comprises evaluation criteria taking into consideration various performance related aspects.
The Board of Directors has expressed their satisfaction with the evaluation process.
NUMBER OF MEETINGS OF THE BOARD OF DIRECTORSDuring the year, Eight Board Meetings were convened and held, details of which are given in the Report on Corporate Governance forming part of the Annual Report.
VIGIL MECHANISM / WHISTLE BLOWER POLICY FOR DIRECTORS AND EMPLOYEESThe Company has established a Vigil Mechanism, which includes a Whistle Blower Policy, for its Directors and Employees, to provide a framework to facilitate responsible and secure reporting of concerns of unethical behavior, actual or suspected fraud or violation of the Company’s Code of Conduct & Ethics. The details of establishment of Vigil Mechanism/ Whistle Blower Policy are posted on the website of the Company and the weblink to the same is http://www.piramal.com/investors/policies-codes.
AUDIT & RISK MANAGEMENT COMMITTEEThe Audit & Risk Management Committee comprises three members, all of whom are Independent Directors.1. Mr. N. Vaghul – Chairman2. Mr. Keki Dadiseth3. Dr. R.A. Mashelkar
Further details on the Audit & Risk Management Committee are provided in the Report on Corporate Governance forming part of the Annual Report.
NOMINATION AND REMUNERATION POLICIESThe Board of Directors has approved a Policy which lays down a framework for selection and appointment of Directors and Senior Management and for determining qualifications, positive attributes and independence of Directors.
The Board has also approved a Policy relating to remuneration of Directors, members of Senior Management and Key Managerial Personnel.
Details of the Nomination Policy and the Remuneration Policy are given in Annexure E to this report.
PARTICULARS OF LOANS, GUARANTEES OR INVESTMENTSReference may be made to Note nos. 6 and 13 of the financial statements for loans to bodies corporate and to Note no. 38(3) for guarantees provided by the Company.
As regards details of Investments in bodies corporate, details of the same are given in Note no. 4 of the financial statements.
RELATED PARTY TRANSACTIONSDuring the year, the Company had entered into contract/arrangement/ transaction with related parties which were on arms’ length basis but which were considered material in accordance with the definition of materiality as included in the policy of the Company on Related Party Transaction. Accordingly, the disclosure of Related Party Transactions as required under Section 134(3)(h) of the Companies Act, 2013 in Form AOC-2 is enclosed as Annexure F to this report.
Systems are in place for obtaining prior omnibus approval of the Audit & Risk Management Committee on an annual basis for transactions with related parties which are of a foreseeable and repetitive nature. The transactions entered into pursuant to the omnibus approval so granted and a statement giving details of all transactions with related parties are placed before the Audit & Risk Management Committee for their review on a periodic basis.
Your Company has formulated a policy for dealing with related party transactions which is also available on website of the Company at http://www.piramal.com/investors/policies-codes.
Annual Report 2017-18 | 145
Managem
ent Discussion & Analysis
Strategic Overview
Board &
Managem
ent ProfilesStatutory Reports
Financial Statements
MANAGERIAL REMUNERATIONA) Remuneration to Directors and Key Managerial Personnel i. The percentage increase in remuneration of each Director, Chief Financial Officer and Company Secretary during FY 2018, ratio of the
remuneration of each Director to the median remuneration of the employees of the Company for FY 2018 are as under:
Sr. No.
Name of Director / KMP and Designation Remuneration of Director/ KMP for FY
2018 (` in Lakhs)
% increase / decrease in
Remuneration in FY 2018
Ratio of remuneration
of each Whole – Time
Director to median
remuneration of employees
1. Ajay G. Piramal Chairman
1,207.48 8.00% 312.69
2. Swati A. Piramal Vice - Chairperson
553.43 8.00% 143.31
3. Nandini Piramal Executive Director
402.49 8.00% 104.23
4. Vijay Shah Executive Director
650.44 (0.70%) 168.43
5. Anand Piramal$ N.A. N.A. N.A.6. Gautam Banerjee
Independent Director36.00 N.A. N.A.
7. Keki Dadiseth Independent Director
44.50 N.A. N.A.
8. S. Ramadorai Independent Director
37.50 N.A. N.A.
9. Deepak Satwalekar Independent Director
44.50 N.A. N.A.
10. R. A. Mashelkar Independent Director
38.00 N.A. N.A.
11. Goverdhan Mehta Independent Director
34.50 N.A. N.A.
12. Siddharth Mehta Independent Director
35.00 N.A. N.A.
13. N. Vaghul Independent Director
50.00 N.A. N.A.
14. Rajesh Laddha* Chief Financial Officer
85.89 - N.A.
15. Vivek Valsaraj# Chief Financial Officer
161.11 - N.A.
16. Leonard D’Souza Company Secretary
100.82 6.32% N.A.
Note: 1. Independent Directors are entitled to sitting fees and commission as per the statutory provisions and within the limits approved by shareholders. Remuneration details for
Independent Directors, in the above table, comprises sitting fees and commission. Details in the corresponding columns are applicable for Whole-time Directors and KMPs. 2. Mr. Vijay Shah, Mr. Vivek Valsaraj and Mr. Leonard D’Souza also receive ESOPs under the Company’s ESOP Scheme. 3. Mr. Rajesh Laddha also received ESOPs during his employment under the Company’s ESOP Scheme. 4. Mr. Anand Piramal, Non-Executive Director does not receive any sitting fees or any other remuneration. $ Appointed as an Additional Director (Non - Executive) w.e.f May 12, 2017 and re-appointed as Non- Executive Director w.e.f August 1, 2017 at AGM held on that date. * Ceased to be Chief Financial Officer w.e.f. June 30, 2017, Therefore, the percentage increase in remuneration for FY 2018 is not applicable in his case. # Appointed as Chief Financial Officer w.e.f December 1, 2017, Therefore, the percentage increase in remuneration for FY 2018 is not applicable in his case while Remuneration
details are mentioned for entire FY 2017-18.
ii. The median remuneration of employees of the Company during FY 2018 was ` 386,163;
iii. In the financial year, there was no increase in the median remuneration of employees;
iv. There were 3,832 permanent employees on the rolls of the Company as on March 31, 2018;
v. Average percentage increase made in the salaries of employees other than the managerial personnel in the last financial year i.e. FY 2018 was 10%. As regards comparison of Managerial Remuneration of FY 2018 over FY 2017, details of the same are given in the above table at sr. no. (i);
vi. It is hereby affirmed that the remuneration paid is as per the Remuneration Policy for Directors, Key Managerial Personnel and other Employees.
146 | Piramal Enterprises Limited
B) Employee Particulars Details of employee remuneration as required under the provisions
of Section 197 of the Companies Act, 2013 and Rule 5(2) & 5(3) of Companies (Appointment and Remuneration of Managerial Personnel) Rules, 2014 is provided in a separate statement and forms part of the Annual Report. Further, this report is being sent to the Members excluding the said statement. The said statement is available for inspection of members at the Registered Office of the Company during working hours upto the date of the Annual General Meeting and shall be made available to any shareholder on request. The said statement is also available on your Company’s website, the weblink to which is https://bit.ly/2tWglei www.piramal.com/investors/financial-reports#parentVerticalTab2.
I) None of the Whole-Time Directors received any commission nor any remuneration from any of the Company’s subsidiaries.
II) The following details are given in the Report on Corporate Governance forming part of this Annual Report:
(i) all elements of remuneration package of all the Directors;
(ii) details of fixed component and performance linked incentives of Whole-Time Directors along with the performance criteria;
(iii) service contracts, notice period, severance fees of Whole-Time Directors;
(iv) stock option details of Whole-Time Director;
III) Requisite details relating to ESOPs are available on your Company’s website, the weblink to which is https://bit.ly/2tWglei www.piramal.com/investors/financial- reports#parentVerticalTab2.
SECRETARIAL AUDIT REPORTPursuant to the provisions of Section 204 of the Companies Act, 2013, and the Rules made thereunder, the Company has appointed M/s. N. L. Bhatia & Associates, Practicing Company Secretaries as the Secretarial Auditor of the Company. The Secretarial Audit Report is annexed as Annexure G and forms an integral part of this Report. The Secretarial Audit Report does not contain any qualification, reservation or adverse remark.
CORPORATE GOVERNANCE CERTIFICATEThe Report on Corporate Governance as stipulated in the Securities and Exchange Board of India (Listing Obligations and Disclosure Requirements) Regulations, 2015 forms part of the Annual Report. The requisite Certificate from M/s. N.L. Bhatia & Associates, Practicing Company Secretaries, confirming compliance with the conditions of Corporate Governance as stipulated under the Securities and Exchange Board of India (Listing Obligations and Disclosure Requirements) Regulations, 2015 is annexed hereto as Annexure H and forms part of this Report.
RISK MANAGEMENT FRAMEWORKThe Company has a robust Risk Management framework to identify, measure, manage and mitigate business risks and opportunities. This framework seeks to create transparency, minimize adverse impact on the business strategy and enhance the Company’s competitive advantage. This risk framework thus helps in managing market, credit and operational risks and quantifies potential impact at a Company level.
COMPLIANCE WITH SECRETARIAL STANDARDSThe Company complies with applicable secretarial standards.
DIRECTORS’ RESPONSIBILITY STATEMENTYour Directors state that:
(a) in the preparation of the annual financial statements for the year ended March 31, 2018, the applicable accounting standards have been followed with no material departures;
(b) the Directors have selected such accounting policies and applied them consistently and made judgments and estimates that are reasonable and prudent so as to give a true and fair view of the state of affairs of the Company as at March 31, 2018 and of the profit of the Company for the year ended on that date;
(c) the Directors have taken proper and sufficient care for the maintenance of adequate accounting records in accordance with the provisions of the Companies Act, 2013 for safeguarding the assets of the Company and for preventing and detecting fraud and other irregularities;
(d) the Directors have prepared the annual financial statements on a going concern basis;
(e) the Directors have laid down internal financial controls to be followed by the Company and that such internal financial controls are adequate and operating effectively; and
(f) the Directors have devised proper systems to ensure compliance with the provisions of all applicable laws and that such systems are adequate and operating effectively.
COST AUDITM/s. G.R. Kulkarni & Associates, Cost Accountants have been duly appointed as Cost Auditors for conducting Cost Audit in respect of products manufactured by the Company which are covered under the Cost Audit Rules for current financial year ending March 31, 2019. They were also the cost auditors for the previous year ended March 31, 2018. As required by Section 148 of the Companies Act, 2013, necessary resolution has been included in the Notice convening the Annual General Meeting, seeking ratification by Members to the remuneration proposed to be paid to the Cost Auditors for the financial year ending March 31, 2019.
Annual Report 2017-18 | 147
Managem
ent Discussion & Analysis
Strategic Overview
Board &
Managem
ent ProfilesStatutory Reports
Financial Statements
BUSINESS RESPONSIBILITY REPORTThe ‘Business Responsibility Report’ of your Company for the year 2017-18 as required under Regulation 34(2)(f) of the SEBI (Listing Obligations and Disclosure Requirements) Regulations, 2015 is enclosed as Annexure I to this report.
DISCLOSURE UNDER THE SEXUAL HARASSMENT OF WOMEN AT WORKPLACE (PREVENTION, PROHIBITION AND REDRESSAL) ACT, 2013Your Company has always believed in providing a safe and harassment free workplace for every individual working in Company’s premises through various interventions and practices. The Company always endeavors to create and provide an environment that is free from discrimination and harassment including sexual harassment.
The Company has in place robust policy on prevention of sexual harassment at workplace which is in line with the requirements of the Sexual Harassment of Women at Workplace (Prevention, Prohibition and Redressal) Act, 2013. Internal Complaints Committee (‘ICC’) has been set up to redress complaints received regarding sexual harassment. All employees (permanent, contractual, temporary, trainees) are covered under this Policy. ICC has its presence at corporate office as well as at site locations.
The Policy is gender neutral. During the year under review, 1 (One) complaint with allegation of sexual harassment was filed with ICC, detailed investigation was carried out and same was disposed-off as per the provisions of The Sexual Harassment of Women at Workplace (Prevention, Prohibition and Redressal) Act, 2013.
OTHERSYour Directors state that no disclosure or reporting is required in respect of the following items as there were no transactions on these items during the year under review:
1. Details relating to issue of sweat equity shares and shares with differential rights as to dividend, voting or otherwise, since there was no such issue of shares.
2. No significant or material orders were passed by the Regulators or Courts or Tribunals which impact the going concern status and Company’s operations in future.
ACKNOWLEDGEMENTWe take this opportunity to thank the employees for their dedicated service and contribution to the Company.
We also thank our banks, business associates and our shareholders for their continued support to the Company.
For and on behalf of theBoard of Directors
Place: MumbaiDate: May 28, 2018 Chairman
148 | Piramal Enterprises Limited
Annual Report on Corporate Social Responsibility activities for the financial year 2017-18
1. BRIEF OUTLINE OF THE COMPANY’S CORPORATE SOCIAL RESPONSIBILITY (‘CSR’) POLICY, INCLUDING OVERVIEW OF PROJECTS OR PROGRAMS PROPOSED TO BE UNDERTAKEN AND A REFERENCE TO THE WEB-LINK TO THE CSR POLICY AND PROJECTS OR PROGRAMS.
The CSR initiatives of the Company are either undertaken as projects or programmes or activities, whether new or ongoing, in line with the CSR Policy, or by way of providing donations, contributions or financial assistance to such projects or to other CSR companies or entities undertaking such projects, as may be permitted under the Companies Act, 2013 and applicable Rules prescribed thereunder.
During the year ended March 31, 2018, Piramal Foundation, Piramal Foundation for Education Leadership, Piramal Udgam Data Management Solutions (“CSR Subsidiaries”) and Piramal Swasthya Management and Research Institute were desubsidiarised/
ANNEXURE B
Changes in Company’s Subsidiaries, Joint Ventures or Associate Companies during FY 2018:
COMPANIES WHICH HAVE BECOME SUBSIDIARIES:a) Context Matters, Inc.
b) Piramal Critical Care B.V.
c) Piramal Critical Care Pty. Ltd
d) Sharp Insight Limited
e) Piramal Housing Finance Limited (formerly known as Piramal Housing Finance Private Limited)
COMPANIES WHICH HAVE CEASED TO BE SUBSIDIARIES OF THE COMPANY:a) India Resurgence ARC Private Limited (formerly known as Piramal
Assets Reconstruction Private Limited)
b) India Resurgence Asset Management Business Private Limited (formerly known as PEL Asset Resurgence Advisory Private Limited)
ANNEXURE A
c) Piramal Udgam Data Management Solutions
d) Piramal Foundation for Education Leadership
e) Piramal Foundation (formerly known as Piramal Healthcare Foundation)
COMPANIES WHICH HAVE BECOME A JOINT VENTURE OF THE COMPANY:a) India Resurgence ARC Private Limited (formerly known as Piramal
Assets Reconstruction Private Limited)
b) India Resurgence Asset Management Business Private Limited (formerly known as PEL Asset Resurgence Advisory Private Limited)
ENTITIES WHICH HAVE CEASED TO BE AN ASSOCIATE OF THE COMPANY:a) Context Matters, Inc.
No entity has ceased to be a Joint Venture during FY 2018.
No entity has become an Associate Company during FY 2018.
decontrolled with effect from March 21, 2018 with a view to bring all entities under one umbrella. Further PEL will continue funding the CSR activities of the above entities as a part of its CSR obligations and considering the long association that PEL enjoyed with the CSR entities it will continue to facilitate their activities.
Piramal Foundation through its initiatives develops innovative solutions to resolve issues that are critical roadblocks towards improving India’s health and education issues. The Foundation believes that considerable positive change can occur, when we collaborate with likeminded partners and nurture projects that are scalable ensuring a long term impact.
Each social project that is chosen to be funded and nurtured lies within one of the broad areas of healthcare and education. These projects are implemented through Piramal Swasthya Management & Research Institute (‘Piramal Swasthya’) and Piramal Foundation of Education Leadership (‘PFEL’).
Annual Report 2017-18 | 149
Managem
ent Discussion & Analysis
Strategic Overview
Board &
Managem
ent ProfilesStatutory Reports
Financial Statements
Piramal Foundation for Education Leadership (PFEL), provides quality education in the government educational system, the objective being to shape the leaders who will dedicate themselves to making a positive difference in society.
It believes in creating positive interventions at every level of the education ecosystem - from headmasters, teachers, community leaders, government education officials to motivated youth from India’s leading colleges and policy makers in the education department.
PFEL also provides employment to rural women in Bagar, Rajasthan who operate in the back office and call center of PFEL.
During FY 2018 PFEL reached more than 2800 government school teachers through more than 54,000 calls to provide need based direct quality support through District Transformation Program. In Training and Management Program recruited 197 fellows in 10th batch and partnered with more than 15 top colleges for campus recruitments and attracting talented youth.
Key Achievements of PFEL during the year were:
– Supported 80+ Alumni to setup entrepreneurial ventures, secure admission in top colleges and secure placements in NGOs, CSRs and govt bodies;
– Launched Swachh Bharat Campaign in 5 states, 300+ communities and impacted over 1 Lakh people.
The CSR Policy is posted on the Company’s website, the web link to which is: http://www.piramal.com/investors/policies-codes.
2. COMPOSITION OF THE CSR COMMITTEEName Category
Prof. Goverdhan Mehta – Chairman
Non - Executive, Independent Director
Ms. Nandini Piramal Executive, Promoter DirectorMr. Vijay Shah Executive Director
The composition of the Committee is in compliance with Section 135 of the Companies Act, 2013.
3. AVERAGE NET PROFIT OF THE COMPANY FOR LAST THREE FINANCIAL YEARS
Average Net Profits of ` 702.82 Crores
4. PRESCRIBED CSR EXPENDITURE CSR Expenditure of ` 14.06 Crores
5. DETAILS OF CSR SPENT DURING THE FINANCIAL YEAR: a) Total amount spent for the financial year – ` 28.31 Crores b) Amount unspent, if any – Not Applicable
Piramal Swasthya, strives to provide accessible and affordable healthcare across demographics with a stress on the most vulnerable in society.
To implement this on the ground and make sure the healthcare services reach the remotest sections of the country, Piramal Swasthya provides three clinically certified services, starting with the Health Information Helpline - which is essentially a health contact centre – that acts as an all-in-one medical advisor, counsellor and grievance addresser. The Telemedicine service brings the healthcare specialists closer to the patient by providing round the clock access to the patient’s medical data via an electronic health record; and Mobile Health Services are essentially a deployment of Mobile Medical Units where paramedics, healthcare experts, travel to remote locations and try and address the humongous challenge of accessibility of healthcare in rural India.
Key achievements during FY 2018:
– Piramal Swasthya continued its outreach program with 286 Mobile Medical Units across 13 districts of Andhra Pradesh, in collaboration with Government of Andhra Pradesh. The objective is to extend the services of Public Health system by using resources, where possible, in screening, making referrals, mobilizing and following up people with risk of chronic diseases, those requiring Maternal or Child Healthcare services and addressing minor ailment.
– This year an electronic platform ‘Integrated Electronic Medical Record’ was introduced wherein each beneficiary is provided a Unique Identification Number and his/her Electronic Health Record is created, which immensely helps in clinical management of diseases and conditions. This in primary healthcare is a boon as the beneficiaries will not have to worry about carrying their health records. Accessible Medical Records via Integrated Technologies (AMRIT) as a platform is built to capture data for Antenatal Care, Postnatal Care, Non Communicable Diseases (including cervical, breast and oral cancer).
– Piramal Swasthya has launched its community-based screening programme – Detect Early and Save Her & Him (D.E.S.H.) for oral, breast and cervical cancers in Kamrup in the financial year 2017-18. The programme components include creating community awareness, screening for the cancer of oral cavity, breast and cervix through mobile cancer screening units, mobility for the patients detected positive to a treatment centre and tracking and follow-up. Equipped with the best equipment, including a mammography unit and staffed by doctors, nurses and radiographers, the Mobile Cancer Screening Unit screens the local population for oral, breast and cervical cancer. Patients identified with cancer are referred to Dr. B. Borooah Cancer Institute, Guwahati for treatment.
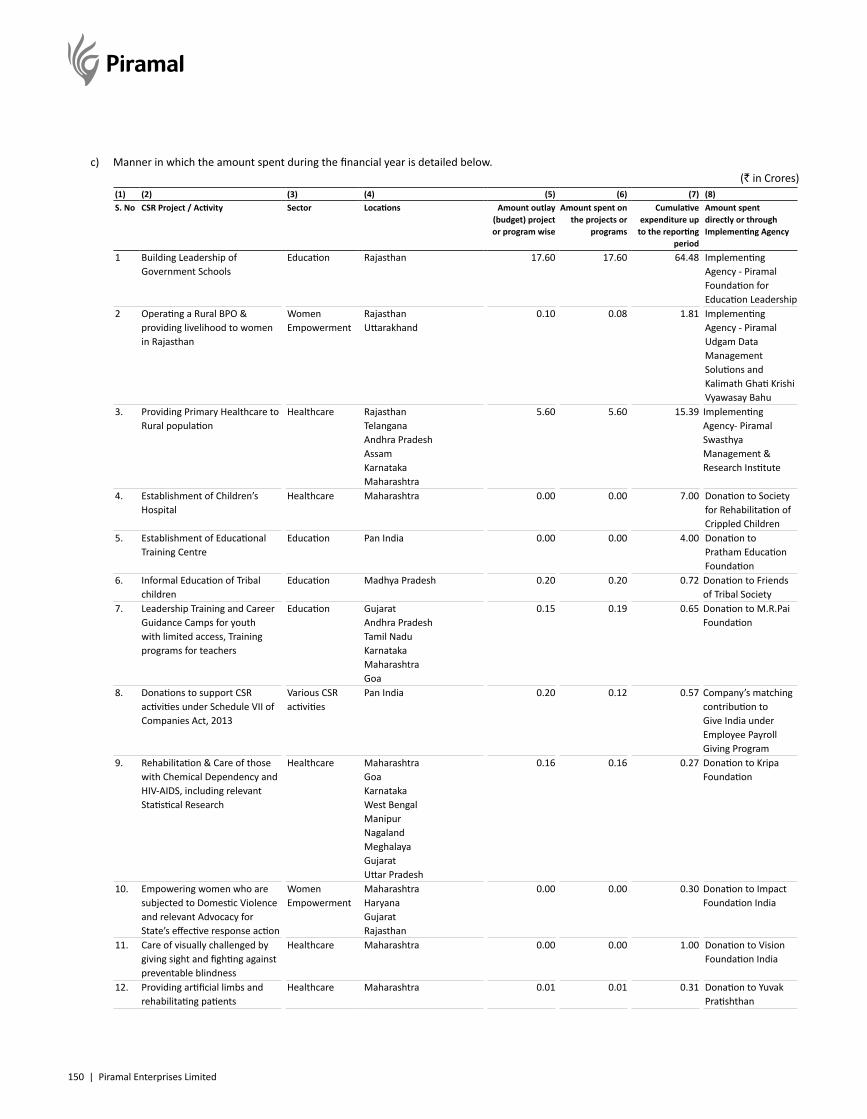
150 | Piramal Enterprises Limited
c) Manner in which the amount spent during the financial year is detailed below.(` in Crores)
(1) (2) (3) (4) (5) (6) (7) (8)S. No CSR Project / Activity Sector Locations Amount outlay
(budget) project or program wise
Amount spent on the projects or
programs
Cumulative expenditure up
to the reporting period
Amount spent directly or through Implementing Agency
1 Building Leadership of Government Schools
Education Rajasthan 17.60 17.60 64.48 Implementing Agency - Piramal Foundation for Education Leadership
2 Operating a Rural BPO & providing livelihood to women in Rajasthan
Women Empowerment
RajasthanUttarakhand
0.10 0.08 1.81 Implementing Agency - Piramal Udgam Data Management Solutions and Kalimath Ghati Krishi Vyawasay Bahu
3. Providing Primary Healthcare to Rural population
Healthcare RajasthanTelanganaAndhra Pradesh AssamKarnatakaMaharashtra
5.60 5.60 15.39 Implementing Agency- Piramal Swasthya Management & Research Institute
4. Establishment of Children’s Hospital
Healthcare Maharashtra 0.00 0.00 7.00 Donation to Society for Rehabilitation of Crippled Children
5. Establishment of Educational Training Centre
Education Pan India 0.00 0.00 4.00 Donation to Pratham Education Foundation
6. Informal Education of Tribal children
Education Madhya Pradesh 0.20 0.20 0.72 Donation to Friends of Tribal Society
7. Leadership Training and Career Guidance Camps for youth with limited access, Training programs for teachers
Education GujaratAndhra PradeshTamil NaduKarnatakaMaharashtraGoa
0.15 0.19 0.65 Donation to M.R.Pai Foundation
8. Donations to support CSR activities under Schedule VII of Companies Act, 2013
Various CSR activities
Pan India 0.20 0.12 0.57 Company’s matching contribution to Give India under Employee Payroll Giving Program
9. Rehabilitation & Care of those with Chemical Dependency and HIV-AIDS, including relevant Statistical Research
Healthcare MaharashtraGoaKarnatakaWest BengalManipurNagalandMeghalayaGujaratUttar Pradesh
0.16 0.16 0.27 Donation to Kripa Foundation
10. Empowering women who are subjected to Domestic Violence and relevant Advocacy for State’s effective response action
Women Empowerment
MaharashtraHaryanaGujaratRajasthan
0.00 0.00 0.30 Donation to Impact Foundation India
11. Care of visually challenged by giving sight and fighting against preventable blindness
Healthcare Maharashtra 0.00 0.00 1.00 Donation to Vision Foundation India
12. Providing artificial limbs and rehabilitating patients
Healthcare Maharashtra 0.01 0.01 0.31 Donation to Yuvak Pratishthan
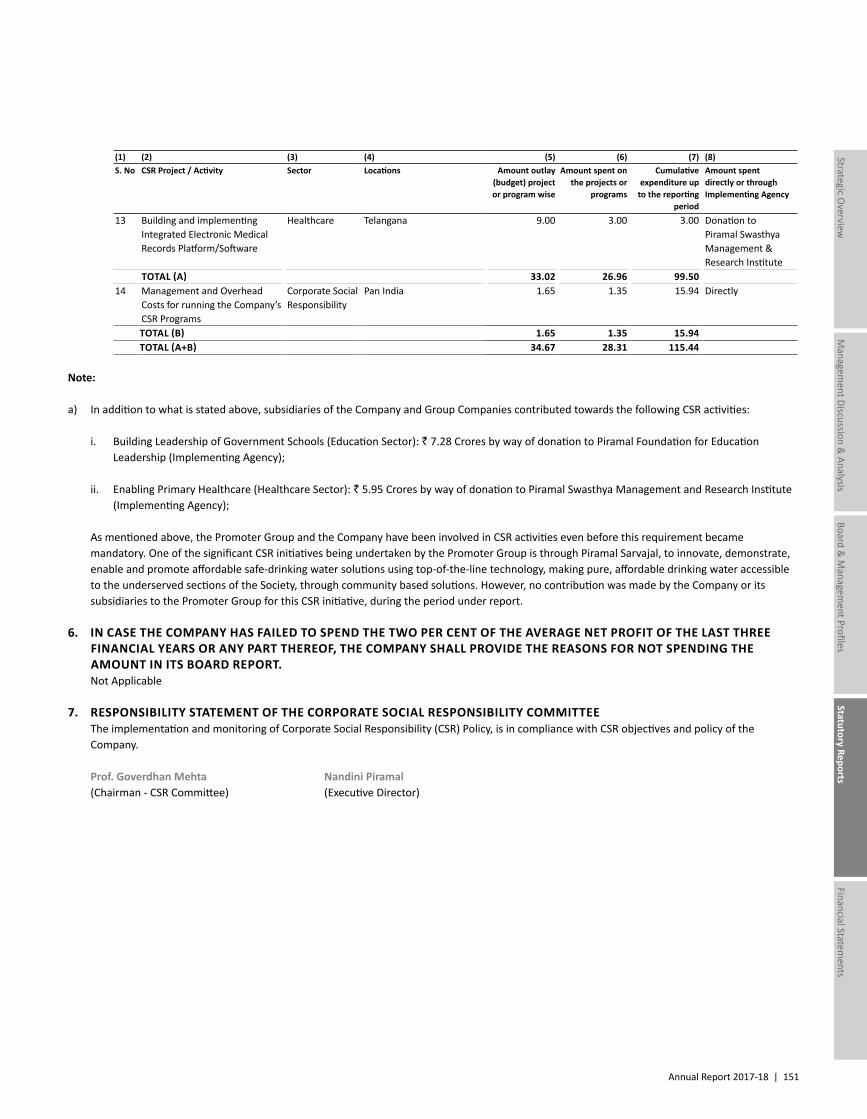
Annual Report 2017-18 | 151
Managem
ent Discussion & Analysis
Strategic Overview
Board &
Managem
ent ProfilesStatutory Reports
Financial Statements
(1) (2) (3) (4) (5) (6) (7) (8)S. No CSR Project / Activity Sector Locations Amount outlay
(budget) project or program wise
Amount spent on the projects or
programs
Cumulative expenditure up
to the reporting period
Amount spent directly or through Implementing Agency
13 Building and implementing Integrated Electronic Medical Records Platform/Software
Healthcare Telangana 9.00 3.00 3.00 Donation to Piramal Swasthya Management & Research Institute
TOTAL (A) 33.02 26.96 99.5014 Management and Overhead
Costs for running the Company’s CSR Programs
Corporate Social Responsibility
Pan India 1.65 1.35 15.94 Directly
TOTAL (B) 1.65 1.35 15.94TOTAL (A+B) 34.67 28.31 115.44
Note:
a) In addition to what is stated above, subsidiaries of the Company and Group Companies contributed towards the following CSR activities:
i. Building Leadership of Government Schools (Education Sector): ` 7.28 Crores by way of donation to Piramal Foundation for Education Leadership (Implementing Agency);
ii. Enabling Primary Healthcare (Healthcare Sector): ` 5.95 Crores by way of donation to Piramal Swasthya Management and Research Institute (Implementing Agency);
As mentioned above, the Promoter Group and the Company have been involved in CSR activities even before this requirement became mandatory. One of the significant CSR initiatives being undertaken by the Promoter Group is through Piramal Sarvajal, to innovate, demonstrate, enable and promote affordable safe-drinking water solutions using top-of-the-line technology, making pure, affordable drinking water accessible to the underserved sections of the Society, through community based solutions. However, no contribution was made by the Company or its subsidiaries to the Promoter Group for this CSR initiative, during the period under report.
6. IN CASE THE COMPANY HAS FAILED TO SPEND THE TWO PER CENT OF THE AVERAGE NET PROFIT OF THE LAST THREE FINANCIAL YEARS OR ANY PART THEREOF, THE COMPANY SHALL PROVIDE THE REASONS FOR NOT SPENDING THE AMOUNT IN ITS BOARD REPORT.
Not Applicable
7. RESPONSIBILITY STATEMENT OF THE CORPORATE SOCIAL RESPONSIBILITY COMMITTEE The implementation and monitoring of Corporate Social Responsibility (CSR) Policy, is in compliance with CSR objectives and policy of the
Company.
Prof. Goverdhan Mehta Nandini Piramal(Chairman - CSR Committee) (Executive Director)
152 | Piramal Enterprises Limited
Particulars of Conservation of Energy, Technology Absorption and Foreign Exchange Earnings and Outgo required under the Companies (Accounts) Rules, 2014 for the year ended March 31, 2018.
A. CONSERVATION OF ENERGY(i) Steps taken for conservation of energy During the year, the Company introduced the following measures at
its plant locations to conserve energy:
Pithampur 1. Installation of energy efficient centrifugal chiller which operates
on Eco-friendly refrigerant and is capable of catering to peak requirements in future. This has resulted in reduced power consumption and minimum maintenance and operating costs.
2. Installation of hot water coils and automatic controls for Air Handling Systems of Tablet Block to enhance Safety and ensure compliance with current Good Manufacturing Practice (cGMP). This has reduced energy consumption.
3. Modification of Chilled Water distribution system to improve efficiency, resulting in reduced power consumption.
4. Modification and automation for Pure Steam Generator to operate on Purified Water in place of Water for Injection. This has led to reduced water & steam consumption.
5. Replacement of more than 80% Conventional lights with Light Emitting Diode (LED) Lights resulting in energy saving.
Ennore 1. Replacement of Plug in lamp (PL) fixture with Light Emitting
Diode (LED) fixture and Compact Fluorescent Light (CFL) with LED lamps resulting in reduced power consumption.
2. Installation of variable frequency drive for Centrifuge and Air Handling Unit (AHU) in production block and powder processing unit for reduced energy consumption.
3. Replacement of belt driven worm wheel gear box with helical drive energy efficient gear box for 2 reactors.
4. FCI2806 –Dichloromethane work up is eliminated leading to reduction in cycle time and consequently, energy saving.
Mahad 1. Replacement of Conventional Compact Fluorescent Light (CFL) /
Streets lights with Light Emitting Diode (LED) lights resulting in reduced energy consumption.
ANNEXURE C
2. Replacement of centrifugal type 10 horsepower (HP) jockey pump with energy efficient 3 HP jockey pump resulting in saving of power.
3. Installation of Sprinkler system, drip irrigation system for gardening leading to saving of water.
4. Replacement of reciprocating chillers with energy efficient screw type chillers. This has resulted in reduced power consumption.
5. Installation of new stretch wrapping machine in order to improve palletization process of export consignment and saving on the consumption of shrink film.
Digwal 1. Utilization of variable frequency drives for Air Handling Units
(AHU’s) and Axial pump motors which led to energy saving.
2. Energy efficient motors are installed in place of motors having capacity of 30HP and above. This has resulted in reduced power consumption.
3. Installation of timer switches for all vessel lamp fixtures in production blocks, Servo stabilizer for zero liquid discharge systems transformer and LED lights have also been installed for increased energy savings.
4. Replacement of water ring / ejector vacuum pumps with Dry vacuum pumps, V belt drives with Flat belt drives for AHU’s (Phase 1) leading to reduced power consumption.
Ahmedabad 1. Reduction of power consumption through installation of LEDs
and spreading awareness regarding energy conservation.
2. Installation of 34 Eco-aerators for water conservation in the faucets in all wash rooms and the cafeteria leading to reduced water consumption.
3. Replacement of old two -20 C deep fridges with new energy efficient double door fridge resulting in energy savings.
The Company’s Plants have collectively made capital investments in energy conservation equipment aggregating to ` 1.46 Crores.
(ii) Steps taken by the Company for utilizing alternate sources of energy
The Company continuously explores avenues for using alternate sources of energy keeping in mind several parameters including environment, production and cost efficiencies. The Company is
Annual Report 2017-18 | 153
Managem
ent Discussion & Analysis
Strategic Overview
Board &
Managem
ent ProfilesStatutory Reports
Financial Statements
currently exploring initiatives for generating solar power energy for some of its plants.
B. TECHNOLOGY ABSORPTION Pithampur 1. Pilot plant is upgraded with incremental capabilities of Top
Spray Granulation, Pallet coating, Roll compaction in such way that multiple products can be handled at a time.
2. Installation of customized air showers at personnel entry of non-sterile blocks which is a best practice and has led to improved compliance with applicable regulatory requirements.
3. Implementation of various automation initiatives such as installation of alarm system for power failure indication, GPS clocks for synchronized time and indicator for air handling units operation.
4. Introduction of Ultra Performance Liquid Chromatography (UPLC) in conformity with the regulatory requirements has resulted in enhancement of QC capability and has also increased the capacity of stability section by introduction of new stability chambers without increasing the existing footprint.
5. Adoption of Isolation Insertion Technology with BFS (IIT) at site, the products which launched from this technology, are highly appreciated by both customer and end users (leading ophthalmologists).
6. Serialization for US market was successfully implemented for 2 major customers.
Ennore 1. Conventional aeration system is replaced with diffuser aeration
system in order to improve the dissolved oxygen in the aeration tank.
Mahad 1. Installation of hot well and cold well system for chillers for
improving the performance of Heating, ventilation and air conditioning (HVAC).
2. Installation of combined slitting and printing machine in Human Nutrition & Health (‘HNH’) to reduce the cycle time.
3. New High-Performance Liquid Chromatographs (HPLC) installed in quality control lab complying with requirements of the Food and Drug Administration, USA.
Digwal 1. Developed and validated a product in Asymmetric route
on pilot scale, resulting in improved yield and considerable reduction in effluent waste for one of our customer.
2. Added cryogenic capability at site to handle reactions at -80°C temperature at commercial scale.
3. All the 17 chromatographic instruments were made 21 CFR part 11 compliant. These instruments are hooked to “Empower 3” and QCMS (Quality Control Management System) Software (Server and Client architecture) for online data saving and protecting data generated.
Ahmedabad 1. Enhancement of Lab capacity by addition of Fluid Bed
Processor.
2. Installed statistical design software (Design expert®) which would support Quality by Design (QbD) principles in product development.
3. Up-gradation of ENSUR® documentation control system which is used for Standard Operating Procedure (SOP) management resulting in better traceability and compliance.
4. Separation of Empower server for Quality Control (QC) laboratory.
5. Addition of stability sample management software (Tangent).
Expenditure on R&D The Company incurred an expenditure of ` 63.42 Crores on
Research and Development during FY2018.
C. FOREIGN EXCHANGE EARNINGS AND OUTGO During the year, foreign exchange earnings were ` 1,511 Crores as
against outgo of ` 429.75 Crores.
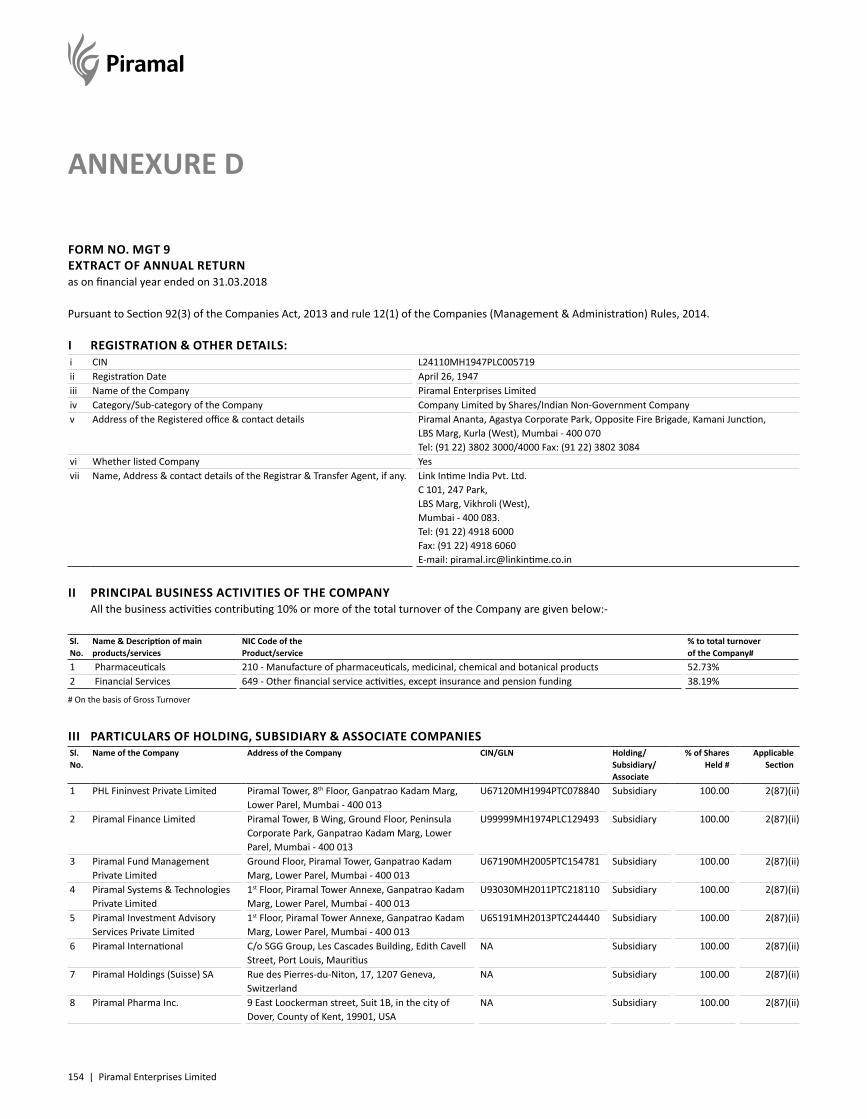
154 | Piramal Enterprises Limited
ANNEXURE D
FORM NO. MGT 9EXTRACT OF ANNUAL RETURNas on financial year ended on 31.03.2018
Pursuant to Section 92(3) of the Companies Act, 2013 and rule 12(1) of the Companies (Management & Administration) Rules, 2014.
I REGISTRATION & OTHER DETAILS:i CIN L24110MH1947PLC005719ii Registration Date April 26, 1947iii Name of the Company Piramal Enterprises Limitediv Category/Sub-category of the Company Company Limited by Shares/Indian Non-Government Companyv Address of the Registered office & contact details Piramal Ananta, Agastya Corporate Park, Opposite Fire Brigade, Kamani Junction,
LBS Marg, Kurla (West), Mumbai - 400 070 Tel: (91 22) 3802 3000/4000 Fax: (91 22) 3802 3084
vi Whether listed Company Yesvii Name, Address & contact details of the Registrar & Transfer Agent, if any. Link Intime India Pvt. Ltd.
C 101, 247 Park, LBS Marg, Vikhroli (West), Mumbai - 400 083. Tel: (91 22) 4918 6000 Fax: (91 22) 4918 6060 E-mail: [email protected]
II PRINCIPAL BUSINESS ACTIVITIES OF THE COMPANY All the business activities contributing 10% or more of the total turnover of the Company are given below:-
Sl. No.
Name & Description of main products/services
NIC Code of the Product/service
% to total turnover of the Company#
1 Pharmaceuticals 210 - Manufacture of pharmaceuticals, medicinal, chemical and botanical products 52.73%2 Financial Services 649 - Other financial service activities, except insurance and pension funding 38.19%
# On the basis of Gross Turnover
III PARTICULARS OF HOLDING, SUBSIDIARY & ASSOCIATE COMPANIESSl. No.
Name of the Company Address of the Company CIN/GLN Holding/ Subsidiary/ Associate
% of Shares Held #
Applicable Section
1 PHL Fininvest Private Limited Piramal Tower, 8th Floor, Ganpatrao Kadam Marg, Lower Parel, Mumbai - 400 013
U67120MH1994PTC078840 Subsidiary 100.00 2(87)(ii)
2 Piramal Finance Limited Piramal Tower, B Wing, Ground Floor, Peninsula Corporate Park, Ganpatrao Kadam Marg, Lower Parel, Mumbai - 400 013
U99999MH1974PLC129493 Subsidiary 100.00 2(87)(ii)
3 Piramal Fund Management Private Limited
Ground Floor, Piramal Tower, Ganpatrao Kadam Marg, Lower Parel, Mumbai - 400 013
U67190MH2005PTC154781 Subsidiary 100.00 2(87)(ii)
4 Piramal Systems & Technologies Private Limited
1st Floor, Piramal Tower Annexe, Ganpatrao Kadam Marg, Lower Parel, Mumbai - 400 013
U93030MH2011PTC218110 Subsidiary 100.00 2(87)(ii)
5 Piramal Investment Advisory Services Private Limited
1st Floor, Piramal Tower Annexe, Ganpatrao Kadam Marg, Lower Parel, Mumbai - 400 013
U65191MH2013PTC244440 Subsidiary 100.00 2(87)(ii)
6 Piramal International C/o SGG Group, Les Cascades Building, Edith Cavell Street, Port Louis, Mauritius
NA Subsidiary 100.00 2(87)(ii)
7 Piramal Holdings (Suisse) SA Rue des Pierres-du-Niton, 17, 1207 Geneva, Switzerland
NA Subsidiary 100.00 2(87)(ii)
8 Piramal Pharma Inc. 9 East Loockerman street, Suit 1B, in the city of Dover, County of Kent, 19901, USA
NA Subsidiary 100.00 2(87)(ii)
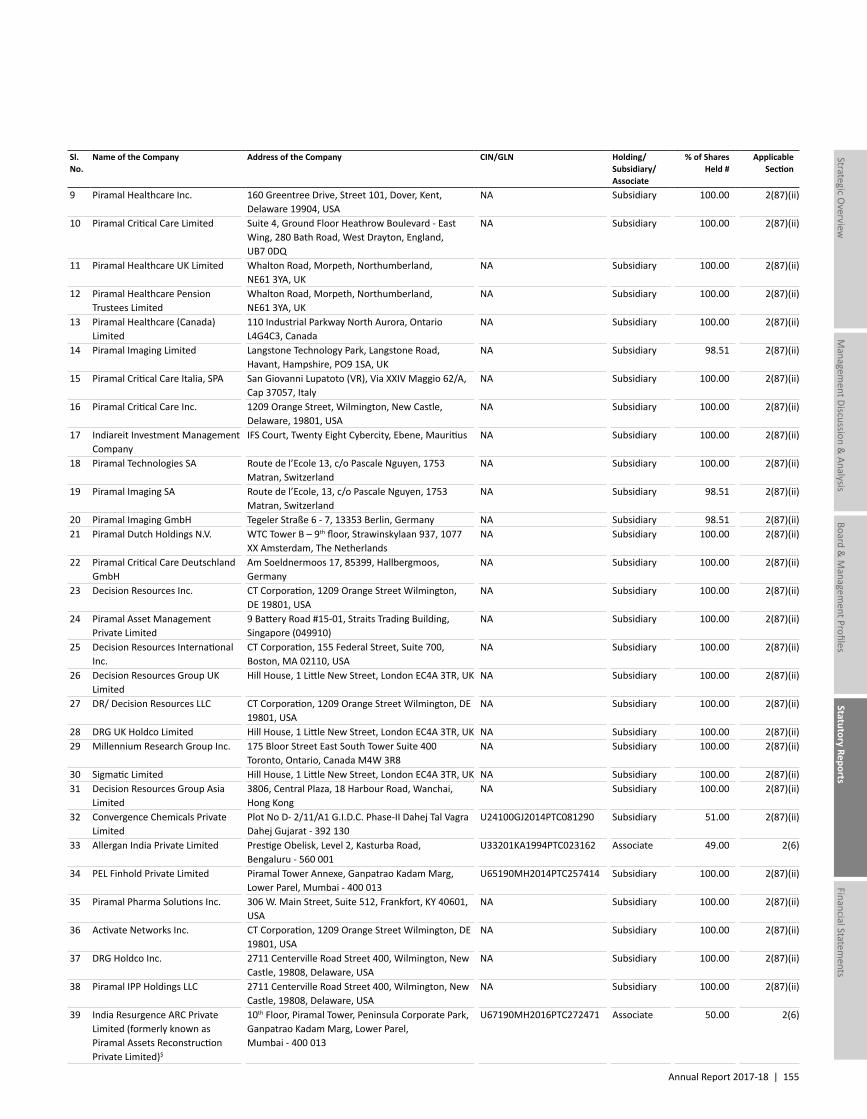
Annual Report 2017-18 | 155
Managem
ent Discussion & Analysis
Strategic Overview
Board &
Managem
ent ProfilesStatutory Reports
Financial Statements
Sl. No.
Name of the Company Address of the Company CIN/GLN Holding/ Subsidiary/ Associate
% of Shares Held #
Applicable Section
9 Piramal Healthcare Inc. 160 Greentree Drive, Street 101, Dover, Kent, Delaware 19904, USA
NA Subsidiary 100.00 2(87)(ii)
10 Piramal Critical Care Limited Suite 4, Ground Floor Heathrow Boulevard - East Wing, 280 Bath Road, West Drayton, England, UB7 0DQ
NA Subsidiary 100.00 2(87)(ii)
11 Piramal Healthcare UK Limited Whalton Road, Morpeth, Northumberland, NE61 3YA, UK
NA Subsidiary 100.00 2(87)(ii)
12 Piramal Healthcare Pension Trustees Limited
Whalton Road, Morpeth, Northumberland, NE61 3YA, UK
NA Subsidiary 100.00 2(87)(ii)
13 Piramal Healthcare (Canada) Limited
110 Industrial Parkway North Aurora, Ontario L4G4C3, Canada
NA Subsidiary 100.00 2(87)(ii)
14 Piramal Imaging Limited Langstone Technology Park, Langstone Road, Havant, Hampshire, PO9 1SA, UK
NA Subsidiary 98.51 2(87)(ii)
15 Piramal Critical Care Italia, SPA San Giovanni Lupatoto (VR), Via XXIV Maggio 62/A, Cap 37057, Italy
NA Subsidiary 100.00 2(87)(ii)
16 Piramal Critical Care Inc. 1209 Orange Street, Wilmington, New Castle, Delaware, 19801, USA
NA Subsidiary 100.00 2(87)(ii)
17 Indiareit Investment Management Company
IFS Court, Twenty Eight Cybercity, Ebene, Mauritius NA Subsidiary 100.00 2(87)(ii)
18 Piramal Technologies SA Route de l’Ecole 13, c/o Pascale Nguyen, 1753 Matran, Switzerland
NA Subsidiary 100.00 2(87)(ii)
19 Piramal Imaging SA Route de l’Ecole, 13, c/o Pascale Nguyen, 1753 Matran, Switzerland
NA Subsidiary 98.51 2(87)(ii)
20 Piramal Imaging GmbH Tegeler Straße 6 - 7, 13353 Berlin, Germany NA Subsidiary 98.51 2(87)(ii)21 Piramal Dutch Holdings N.V. WTC Tower B – 9th floor, Strawinskylaan 937, 1077
XX Amsterdam, The NetherlandsNA Subsidiary 100.00 2(87)(ii)
22 Piramal Critical Care Deutschland GmbH
Am Soeldnermoos 17, 85399, Hallbergmoos, Germany
NA Subsidiary 100.00 2(87)(ii)
23 Decision Resources Inc. CT Corporation, 1209 Orange Street Wilmington, DE 19801, USA
NA Subsidiary 100.00 2(87)(ii)
24 Piramal Asset Management Private Limited
9 Battery Road #15-01, Straits Trading Building, Singapore (049910)
NA Subsidiary 100.00 2(87)(ii)
25 Decision Resources International Inc.
CT Corporation, 155 Federal Street, Suite 700, Boston, MA 02110, USA
NA Subsidiary 100.00 2(87)(ii)
26 Decision Resources Group UK Limited
Hill House, 1 Little New Street, London EC4A 3TR, UK NA Subsidiary 100.00 2(87)(ii)
27 DR/ Decision Resources LLC CT Corporation, 1209 Orange Street Wilmington, DE 19801, USA
NA Subsidiary 100.00 2(87)(ii)
28 DRG UK Holdco Limited Hill House, 1 Little New Street, London EC4A 3TR, UK NA Subsidiary 100.00 2(87)(ii)29 Millennium Research Group Inc. 175 Bloor Street East South Tower Suite 400
Toronto, Ontario, Canada M4W 3R8NA Subsidiary 100.00 2(87)(ii)
30 Sigmatic Limited Hill House, 1 Little New Street, London EC4A 3TR, UK NA Subsidiary 100.00 2(87)(ii)31 Decision Resources Group Asia
Limited 3806, Central Plaza, 18 Harbour Road, Wanchai, Hong Kong
NA Subsidiary 100.00 2(87)(ii)
32 Convergence Chemicals Private Limited
Plot No D- 2/11/A1 G.I.D.C. Phase-II Dahej Tal Vagra Dahej Gujarat - 392 130
U24100GJ2014PTC081290 Subsidiary 51.00 2(87)(ii)
33 Allergan India Private Limited Prestige Obelisk, Level 2, Kasturba Road, Bengaluru - 560 001
U33201KA1994PTC023162 Associate 49.00 2(6)
34 PEL Finhold Private Limited Piramal Tower Annexe, Ganpatrao Kadam Marg, Lower Parel, Mumbai - 400 013
U65190MH2014PTC257414 Subsidiary 100.00 2(87)(ii)
35 Piramal Pharma Solutions Inc. 306 W. Main Street, Suite 512, Frankfort, KY 40601, USA
NA Subsidiary 100.00 2(87)(ii)
36 Activate Networks Inc. CT Corporation, 1209 Orange Street Wilmington, DE 19801, USA
NA Subsidiary 100.00 2(87)(ii)
37 DRG Holdco Inc. 2711 Centerville Road Street 400, Wilmington, New Castle, 19808, Delaware, USA
NA Subsidiary 100.00 2(87)(ii)
38 Piramal IPP Holdings LLC 2711 Centerville Road Street 400, Wilmington, New Castle, 19808, Delaware, USA
NA Subsidiary 100.00 2(87)(ii)
39 India Resurgence ARC Private Limited (formerly known as Piramal Assets Reconstruction Private Limited)$
10th Floor, Piramal Tower, Peninsula Corporate Park, Ganpatrao Kadam Marg, Lower Parel, Mumbai - 400 013
U67190MH2016PTC272471 Associate 50.00 2(6)
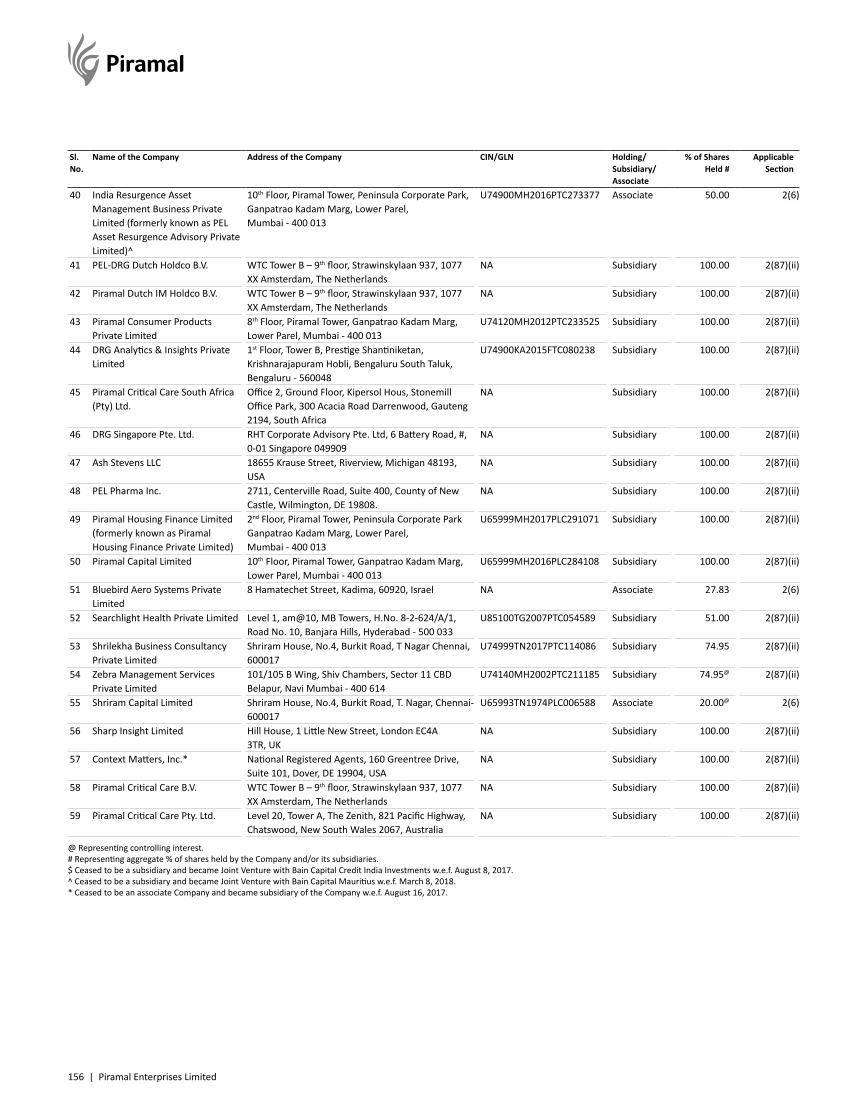
156 | Piramal Enterprises Limited
Sl. No.
Name of the Company Address of the Company CIN/GLN Holding/ Subsidiary/ Associate
% of Shares Held #
Applicable Section
40 India Resurgence Asset Management Business Private Limited (formerly known as PEL Asset Resurgence Advisory Private Limited)^
10th Floor, Piramal Tower, Peninsula Corporate Park, Ganpatrao Kadam Marg, Lower Parel, Mumbai - 400 013
U74900MH2016PTC273377 Associate 50.00 2(6)
41 PEL-DRG Dutch Holdco B.V. WTC Tower B – 9th floor, Strawinskylaan 937, 1077 XX Amsterdam, The Netherlands
NA Subsidiary 100.00 2(87)(ii)
42 Piramal Dutch IM Holdco B.V. WTC Tower B – 9th floor, Strawinskylaan 937, 1077 XX Amsterdam, The Netherlands
NA Subsidiary 100.00 2(87)(ii)
43 Piramal Consumer Products Private Limited
8th Floor, Piramal Tower, Ganpatrao Kadam Marg, Lower Parel, Mumbai - 400 013
U74120MH2012PTC233525 Subsidiary 100.00 2(87)(ii)
44 DRG Analytics & Insights Private Limited
1st Floor, Tower B, Prestige Shantiniketan, Krishnarajapuram Hobli, Bengaluru South Taluk, Bengaluru - 560048
U74900KA2015FTC080238 Subsidiary 100.00 2(87)(ii)
45 Piramal Critical Care South Africa (Pty) Ltd.
Office 2, Ground Floor, Kipersol Hous, Stonemill Office Park, 300 Acacia Road Darrenwood, Gauteng 2194, South Africa
NA Subsidiary 100.00 2(87)(ii)
46 DRG Singapore Pte. Ltd. RHT Corporate Advisory Pte. Ltd, 6 Battery Road, #, 0-01 Singapore 049909
NA Subsidiary 100.00 2(87)(ii)
47 Ash Stevens LLC 18655 Krause Street, Riverview, Michigan 48193, USA
NA Subsidiary 100.00 2(87)(ii)
48 PEL Pharma Inc. 2711, Centerville Road, Suite 400, County of New Castle, Wilmington, DE 19808.
NA Subsidiary 100.00 2(87)(ii)
49 Piramal Housing Finance Limited (formerly known as Piramal Housing Finance Private Limited)
2nd Floor, Piramal Tower, Peninsula Corporate Park Ganpatrao Kadam Marg, Lower Parel, Mumbai - 400 013
U65999MH2017PLC291071 Subsidiary 100.00 2(87)(ii)
50 Piramal Capital Limited 10th Floor, Piramal Tower, Ganpatrao Kadam Marg, Lower Parel, Mumbai - 400 013
U65999MH2016PLC284108 Subsidiary 100.00 2(87)(ii)
51 Bluebird Aero Systems Private Limited
8 Hamatechet Street, Kadima, 60920, Israel NA Associate 27.83 2(6)
52 Searchlight Health Private Limited Level 1, am@10, MB Towers, H.No. 8-2-624/A/1, Road No. 10, Banjara Hills, Hyderabad - 500 033
U85100TG2007PTC054589 Subsidiary 51.00 2(87)(ii)
53 Shrilekha Business Consultancy Private Limited
Shriram House, No.4, Burkit Road, T Nagar Chennai, 600017
U74999TN2017PTC114086 Subsidiary 74.95 2(87)(ii)
54 Zebra Management Services Private Limited
101/105 B Wing, Shiv Chambers, Sector 11 CBD Belapur, Navi Mumbai - 400 614
U74140MH2002PTC211185 Subsidiary 74.95@ 2(87)(ii)
55 Shriram Capital Limited Shriram House, No.4, Burkit Road, T. Nagar, Chennai- 600017
U65993TN1974PLC006588 Associate 20.00@ 2(6)
56 Sharp Insight Limited Hill House, 1 Little New Street, London EC4A 3TR, UK
NA Subsidiary 100.00 2(87)(ii)
57 Context Matters, Inc.* National Registered Agents, 160 Greentree Drive, Suite 101, Dover, DE 19904, USA
NA Subsidiary 100.00 2(87)(ii)
58 Piramal Critical Care B.V. WTC Tower B – 9th floor, Strawinskylaan 937, 1077 XX Amsterdam, The Netherlands
NA Subsidiary 100.00 2(87)(ii)
59 Piramal Critical Care Pty. Ltd. Level 20, Tower A, The Zenith, 821 Pacific Highway, Chatswood, New South Wales 2067, Australia
NA Subsidiary 100.00 2(87)(ii)
@ Representing controlling interest.# Representing aggregate % of shares held by the Company and/or its subsidiaries.$ Ceased to be a subsidiary and became Joint Venture with Bain Capital Credit India Investments w.e.f. August 8, 2017.^ Ceased to be a subsidiary and became Joint Venture with Bain Capital Mauritius w.e.f. March 8, 2018.* Ceased to be an associate Company and became subsidiary of the Company w.e.f. August 16, 2017.
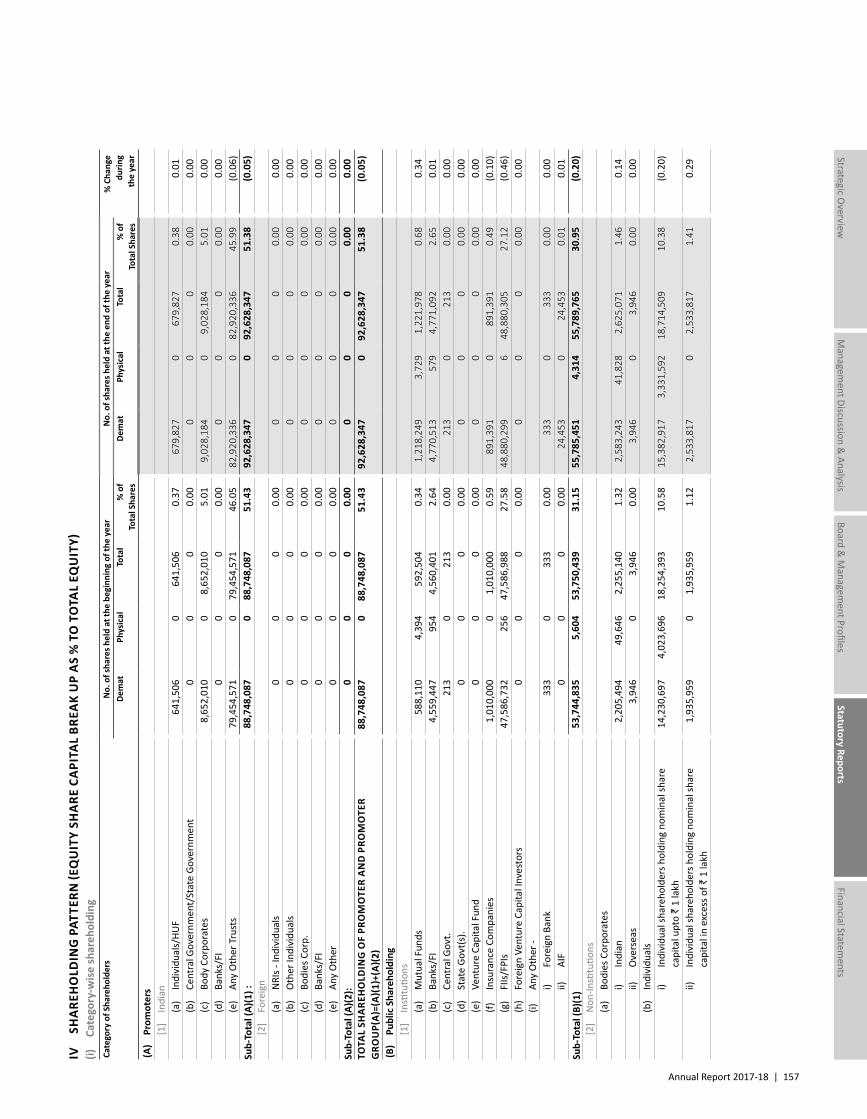
Annual Report 2017-18 | 157
Managem
ent Discussion & Analysis
Strategic Overview
Board &
Managem
ent ProfilesStatutory Reports
Financial Statements
IV
SH
ARE
HO
LDIN
G P
ATTE
RN (E
QU
ITY
SHA
RE C
API
TAL
BREA
K U
P A
S %
TO
TO
TAL
EQU
ITY)
(i)
Cate
gory
-wis
e sh
areh
oldi
ngCa
tego
ry o
f Sha
reho
lder
sN
o. o
f sha
res h
eld
at th
e be
ginn
ing
of th
e ye
arN
o. o
f sha
res h
eld
at th
e en
d of
the
year
% C
hang
edu
ring
the
year
Dem
atPh
ysic
alTo
tal
% o
fTo
tal S
hare
sDe
mat
Ph
ysic
al
Tota
l %
of
Tota
l Sha
res
(A)
Prom
oter
s
[1]
Indi
an
(a
) In
divi
dual
s/HU
F 6
41,5
06
0 6
41,5
06
0.37
679
,827
0
679
,827
0.
380.
01
(b
) Ce
ntra
l Gov
ernm
ent/
Stat
e Go
vern
men
t0
00
0.00
00
00.
000.
00
(c
) Bo
dy C
orpo
rate
s 8
,652
,010
0
8,6
52,0
10
5.01
9,0
28,1
84
0 9
,028
,184
5.
010.
00
(d
) Ba
nks/
FI0
00
0.00
00
00.
000.
00
(e
) An
y O
ther
Tru
sts
79,
454,
571
0 7
9,45
4,57
1 46
.05
82,
920,
336
0 8
2,92
0,33
6 45
.99
(0.0
6)Su
b-To
tal (
A)(1
) : 8
8,74
8,08
7 0
88,
748,
087
51.4
3 9
2,62
8,34
7 0
9
2,62
8,34
7 5
1.38
(0
.05)
[2
] Fo
reig
n
(a
) N
RIs -
Indi
vidu
als
00
00.
000
00
0.00
0.00
(b)
Oth
er In
divi
dual
s0
00
0.00
00
00.
000.
00
(c
) Bo
dies
Cor
p.0
00
0.00
00
00.
000.
00
(d
) Ba
nks/
FI0
00
0.00
00
00.
000.
00
(e
) An
y O
ther
00
00.
000
00
0.00
0.00
Sub-
Tota
l (A)
(2):
00
00.
000
00
0.00
0.00
TOTA
L SH
ARE
HO
LDIN
G O
F PR
OM
OTE
R A
ND
PRO
MO
TER
GRO
UP(
A)=(
A)(1
)+(A
)(2)
88,
748,
087
0 8
8,74
8,08
7 51
.43
92,
628,
347
0
92,
628,
347
51.
38
(0.0
5)
(B)
Publ
ic S
hare
hold
ing
[1
] In
stitu
tions
(a)
Mut
ual F
unds
5
88,1
10
4,3
94
592
,504
0.
34 1
,218
,249
3
,729
1
,221
,978
0.
680.
34
(b
) Ba
nks/
FI 4
,559
,447
9
54
4,5
60,4
01
2.64
4,7
70,5
13
579
4
,771
,092
2.
650.
01
(c
) Ce
ntra
l Gov
t. 2
13
0 2
13
0.00
213
0
213
0.
000.
00
(d
) St
ate
Govt
(s).
00
00.
000
0 0
0.
000.
00
(e
) Ve
ntur
e Ca
pita
l Fun
d0
00
0.00
00
0
0.00
0.00
(f)
Insu
ranc
e Co
mpa
nies
1,0
10,0
00
0 1
,010
,000
0.
59 8
91,3
91
0 8
91,3
91
0.49
(0.1
0)
(g
) FI
Is/F
PIs
47,
586,
732
256
4
7,58
6,98
8 27
.58
48,
880,
299
6
48,
880,
305
27.1
2(0
.46)
(h)
Fore
ign
Vent
ure
Capi
tal I
nves
tors
00
00.
000
00
0.00
0.00
(i)
Any
Oth
er -
i)
Fore
ign
Bank
333
0
333
0.
00 3
33
0
333
0.
000.
00
ii)
AIF
0
0 0
0.
00 2
4,45
3 0
2
4,45
3 0.
010.
01Su
b-To
tal (
B)(1
) 5
3,74
4,83
5 5
,604
5
3,75
0,43
9 31
.15
55,
785,
451
4,3
14
55,
789,
765
30.9
5(0
.20)
[2
] N
on-In
stitu
tions
(a)
Bodi
es C
orpo
rate
s
i) In
dian
2,2
05,4
94
49,
646
2,2
55,1
40
1.32
2,5
83,2
43
41,
828
2,6
25,0
71
1.46
0.14
ii)
O
vers
eas
3,9
46
0
3,9
46
0.00
3,9
46
0
3,9
46
0.00
0.00
(b)
Indi
vidu
als
i)
Indi
vidu
al sh
areh
olde
rs h
oldi
ng n
omin
al sh
are
capi
tal u
pto
` 1
lakh
14,
230,
697
4,0
23,6
96
18,
254,
393
10.5
8 1
5,38
2,91
7 3
,331
,592
1
8,71
4,50
9 10
.38
(0.2
0)
ii)
In
divi
dual
shar
ehol
ders
hol
ding
nom
inal
shar
e ca
pita
l in
exce
ss o
f ` 1
lakh
1,9
35,9
59
0
1,9
35,9
59
1.12
2,5
33,8
17
0
2,5
33,8
17
1.41
0.29
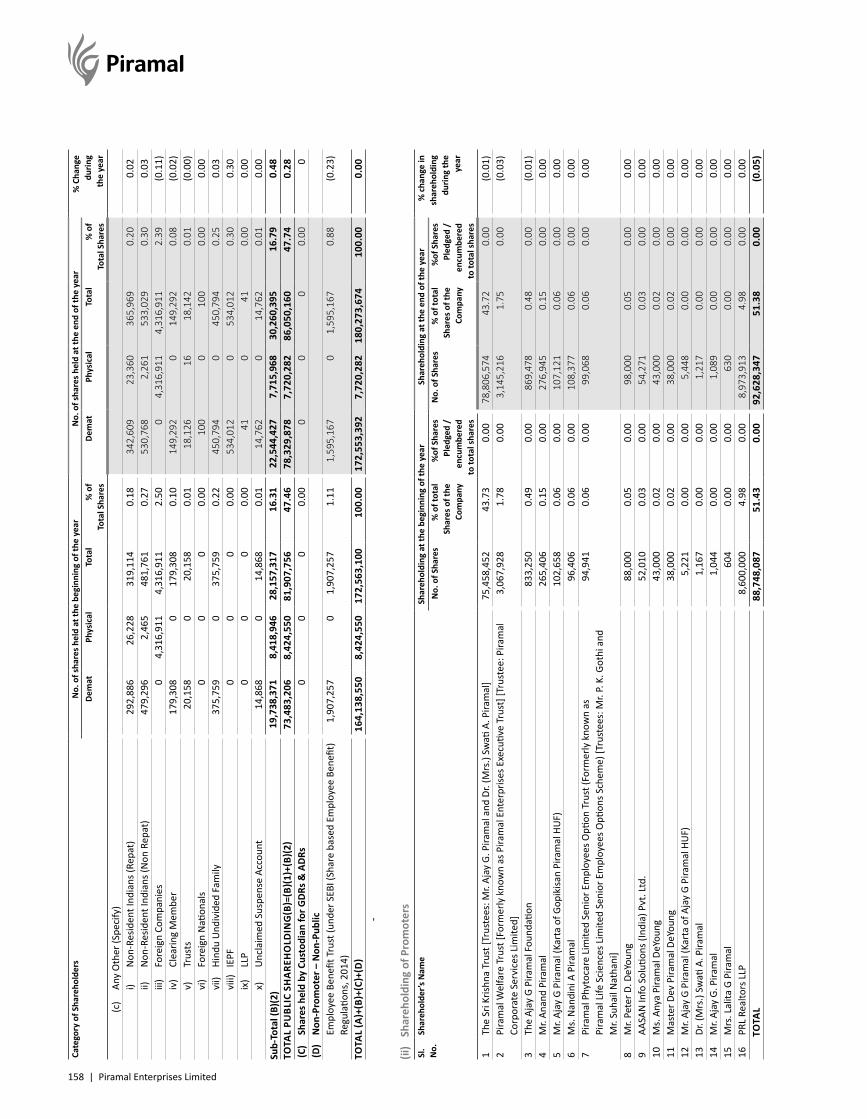
158 | Piramal Enterprises Limited
Cate
gory
of S
hare
hold
ers
No.
of s
hare
s hel
d at
the
begi
nnin
g of
the
year
No.
of s
hare
s hel
d at
the
end
of th
e ye
ar%
Cha
nge
durin
gth
e ye
arDe
mat
Phys
ical
Tota
l%
of
Tota
l Sha
res
Dem
at
Phys
ical
To
tal
% o
fTo
tal S
hare
s
(c)
Any
Oth
er (S
peci
fy)
i)
Non
-Res
iden
t Ind
ians
(Rep
at)
292
,886
2
6,22
8 3
19,1
14
0.18
342
,609
2
3,36
0 3
65,9
69
0.20
0.02
ii)
N
on-R
esid
ent I
ndia
ns (N
on R
epat
) 4
79,2
96
2,4
65
481
,761
0.
27 5
30,7
68
2,2
61
533
,029
0.
300.
03
iii)
Fore
ign
Com
pani
es 0
4
,316
,911
4
,316
,911
2.
50 0
4
,316
,911
4
,316
,911
2.
39(0
.11)
iv
) Cl
earin
g M
embe
r17
9,30
80
179,
308
0.10
149
,292
0
1
49,2
92
0.08
(0.0
2)
v)
Trus
ts 2
0,15
8 0
20,
158
0.01
18,
126
16
18,
142
0.01
(0.0
0)
vi)
Fore
ign
Nati
onal
s0
00
0.00
100
0
1
00
0.00
0.00
vi
i) Hi
ndu
Und
ivid
ed F
amily
375
,759
0
375
,759
0.
22 4
50,7
94
0
450
,794
0.
250.
03
viii)
IE
PF0
00
0.00
534
,012
0
5
34,0
12
0.30
0.30
ix
) LL
P0
00
0.00
41
0
41
0.00
0.00
x)
U
ncla
imed
Sus
pens
e Ac
coun
t 1
4,86
8 0
1
4,86
8 0.
01 1
4,76
2 0
1
4,76
2 0.
010.
00Su
b-To
tal (
B)(2
) 1
9,73
8,37
1 8
,418
,946
2
8,15
7,31
7 16
.31
22,
544,
427
7,7
15,9
68
30,
260,
395
16.7
90.
48TO
TAL
PUBL
IC S
HA
REH
OLD
ING
(B)=
(B)(1
)+(B
)(2)
73,
483,
206
8,4
24,5
50
81,
907,
756
47.4
6 7
8,32
9,87
8 7
,720
,282
8
6,05
0,16
0 47
.74
0.2
8(C
) Sh
ares
hel
d by
Cus
todi
an fo
r GDR
s & A
DRs
00
00.
000
00
0.00
0(D
) N
on-P
rom
oter
– N
on-P
ublic
Em
ploy
ee B
enefi
t Tru
st (u
nder
SEB
I (Sh
are
base
d Em
ploy
ee B
enefi
t)
Regu
latio
ns, 2
014)
1,9
07,2
57
0 1
,907
,257
1.
11 1
,595
,167
0
1,5
95,1
67
0.88
(0.2
3)
TOTA
L (A
)+(B
)+(C
)+(D
) 1
64,1
38,5
50
8,4
24,5
50
172
,563
,100
10
0.00
172
,553
,392
7
,720
,282
1
80,2
73,6
74
100.
000.
00
-
(ii)
Shar
ehol
ding
of P
rom
oter
sSl
. N
o.Sh
areh
olde
r’s N
ame
Shar
ehol
ding
at t
he b
egin
ning
of t
he y
ear
Shar
ehol
ding
at t
he e
nd o
f the
yea
r%
cha
nge
insh
areh
oldi
ngdu
ring
the
year
No.
of S
hare
s%
of t
otal
Shar
es o
f the
Com
pany
%of
Sha
res
Pled
ged
/en
cum
bere
d to
tota
l sha
res
No.
of S
hare
s%
of t
otal
Shar
es o
f the
Com
pany
%of
Sha
res
Pled
ged
/en
cum
bere
d to
tota
l sha
res
1Th
e Sr
i Kris
hna
Trus
t [Tr
uste
es: M
r. Aj
ay G
. Pira
mal
and
Dr.
(Mrs
.) Sw
ati A
. Pira
mal
] 7
5,45
8,45
2 43
.73
0.00
78,
806,
574
43.7
20.
00(0
.01)
2 Pi
ram
al W
elfa
re T
rust
[For
mer
ly k
now
n as
Pira
mal
Ent
erpr
ises E
xecu
tive
Trus
t] [T
rust
ee: P
iram
al
Corp
orat
e Se
rvic
es L
imite
d] 3
,067
,928
1.
780.
00 3
,145
,216
1.
750.
00(0
.03)
3Th
e Aj
ay G
Pira
mal
Fou
ndati
on 8
33,2
50
0.49
0.00
869
,478
0.
480.
00(0
.01)
4M
r. An
and
Pira
mal
265
,406
0.
150.
00 2
76,9
45
0.15
0.00
0.00
5M
r. Aj
ay G
Pira
mal
(Kar
ta o
f Gop
ikisa
n Pi
ram
al H
UF)
102
,658
0.
060.
00 1
07,1
21
0.06
0.00
0.00
6M
s. N
andi
ni A
Pira
mal
96,
406
0.06
0.00
108
,377
0.
060.
000.
007
Pira
mal
Phy
toca
re L
imite
d Se
nior
Em
ploy
ees O
ption
Tru
st (F
orm
erly
kno
wn
as
Pira
mal
Life
Sci
ence
s Lim
ited
Seni
or E
mpl
oyee
s Opti
ons S
chem
e) [T
rust
ees:
Mr.
P. K
. Got
hi a
nd
Mr.
Suha
il N
atha
ni]
94,
941
0.06
0.00
99,
068
0.06
0.00
0.00
8M
r. Pe
ter D
. DeY
oung
88,
000
0.05
0.00
98,
000
0.05
0.00
0.00
9AA
SAN
Info
Sol
ution
s (In
dia)
Pvt
. Ltd
. 5
2,01
0 0.
030.
00 5
4,27
1 0.
030.
000.
0010
Ms.
Any
a Pi
ram
al D
eYou
ng 4
3,00
0 0.
020.
00 4
3,00
0 0.
020.
000.
0011
Mas
ter D
ev P
iram
al D
eYou
ng 3
8,00
0 0.
020.
00 3
8,00
0 0.
020.
000.
0012
Mr.
Ajay
G P
iram
al (K
arta
of A
jay
G Pi
ram
al H
UF)
5,2
21
0.00
0.00
5,4
48
0.00
0.00
0.00
13Dr
. (M
rs.)
Swati
A. P
iram
al 1
,167
0.
000.
00 1
,217
0.
000.
000.
0014
Mr.
Ajay
G. P
iram
al 1
,044
0.
000.
00 1
,089
0.
000.
000.
0015
Mrs
. Lal
ita G
Pira
mal
604
0.
000.
00 6
30
0.00
0.00
0.00
16PR
L Re
alto
rs L
LP 8
,600
,000
4.
980.
00 8
,973
,913
4.
980.
000.
00TO
TAL
88,
748,
087
51.4
30.
00 9
2,62
8,34
7 51
.38
0.00
(0.0
5)
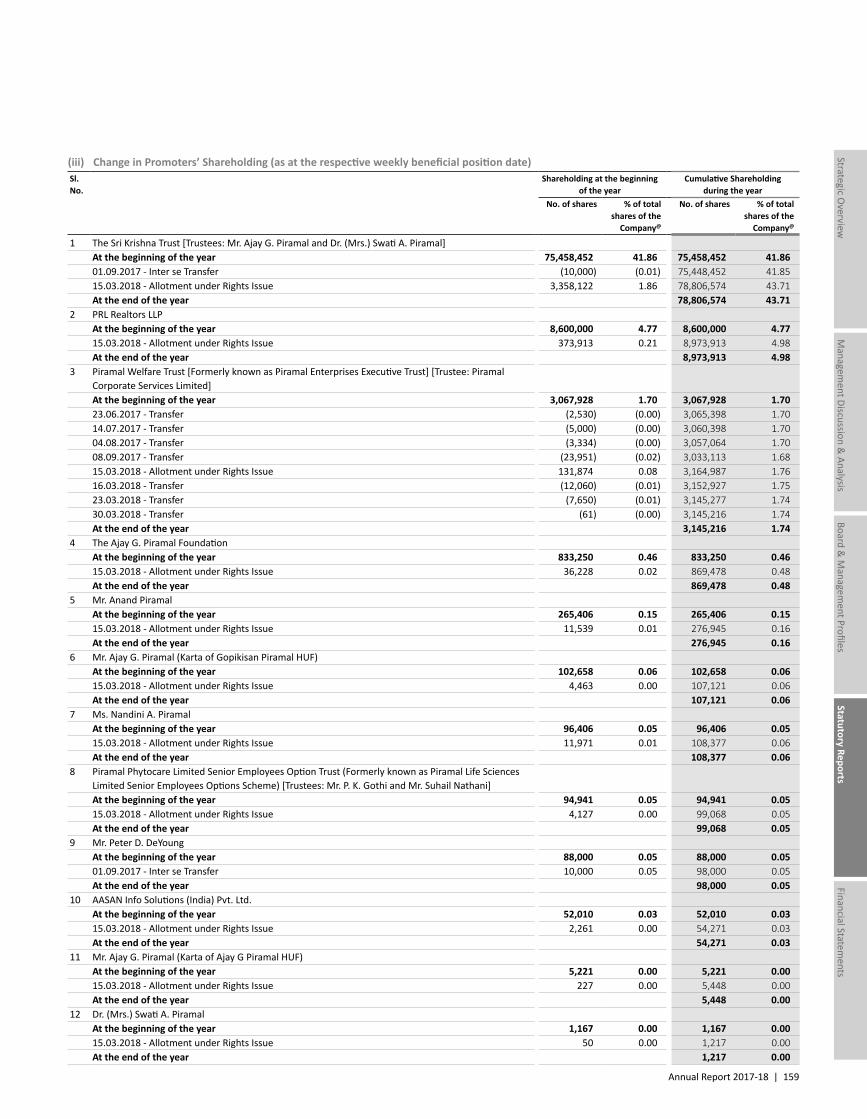
Annual Report 2017-18 | 159
Managem
ent Discussion & Analysis
Strategic Overview
Board &
Managem
ent ProfilesStatutory Reports
Financial Statements
(iii) Change in Promoters’ Shareholding (as at the respective weekly beneficial position date)Sl. No.
Shareholding at the beginning of the year
Cumulative Shareholding during the year
No. of shares % of total shares of the
Company@
No. of shares % of total shares of the
Company@
1 The Sri Krishna Trust [Trustees: Mr. Ajay G. Piramal and Dr. (Mrs.) Swati A. Piramal]At the beginning of the year 75,458,452 41.86 75,458,452 41.8601.09.2017 - Inter se Transfer (10,000) (0.01) 75,448,452 41.8515.03.2018 - Allotment under Rights Issue 3,358,122 1.86 78,806,574 43.71At the end of the year 78,806,574 43.71
2 PRL Realtors LLPAt the beginning of the year 8,600,000 4.77 8,600,000 4.7715.03.2018 - Allotment under Rights Issue 373,913 0.21 8,973,913 4.98At the end of the year 8,973,913 4.98
3 Piramal Welfare Trust [Formerly known as Piramal Enterprises Executive Trust] [Trustee: Piramal Corporate Services Limited]At the beginning of the year 3,067,928 1.70 3,067,928 1.7023.06.2017 - Transfer (2,530) (0.00) 3,065,398 1.7014.07.2017 - Transfer (5,000) (0.00) 3,060,398 1.7004.08.2017 - Transfer (3,334) (0.00) 3,057,064 1.7008.09.2017 - Transfer (23,951) (0.02) 3,033,113 1.6815.03.2018 - Allotment under Rights Issue 131,874 0.08 3,164,987 1.7616.03.2018 - Transfer (12,060) (0.01) 3,152,927 1.7523.03.2018 - Transfer (7,650) (0.01) 3,145,277 1.7430.03.2018 - Transfer (61) (0.00) 3,145,216 1.74At the end of the year 3,145,216 1.74
4 The Ajay G. Piramal FoundationAt the beginning of the year 833,250 0.46 833,250 0.4615.03.2018 - Allotment under Rights Issue 36,228 0.02 869,478 0.48At the end of the year 869,478 0.48
5 Mr. Anand PiramalAt the beginning of the year 265,406 0.15 265,406 0.1515.03.2018 - Allotment under Rights Issue 11,539 0.01 276,945 0.16At the end of the year 276,945 0.16
6 Mr. Ajay G. Piramal (Karta of Gopikisan Piramal HUF)At the beginning of the year 102,658 0.06 102,658 0.0615.03.2018 - Allotment under Rights Issue 4,463 0.00 107,121 0.06At the end of the year 107,121 0.06
7 Ms. Nandini A. PiramalAt the beginning of the year 96,406 0.05 96,406 0.0515.03.2018 - Allotment under Rights Issue 11,971 0.01 108,377 0.06At the end of the year 108,377 0.06
8 Piramal Phytocare Limited Senior Employees Option Trust (Formerly known as Piramal Life Sciences Limited Senior Employees Options Scheme) [Trustees: Mr. P. K. Gothi and Mr. Suhail Nathani]At the beginning of the year 94,941 0.05 94,941 0.0515.03.2018 - Allotment under Rights Issue 4,127 0.00 99,068 0.05At the end of the year 99,068 0.05
9 Mr. Peter D. DeYoungAt the beginning of the year 88,000 0.05 88,000 0.0501.09.2017 - Inter se Transfer 10,000 0.05 98,000 0.05At the end of the year 98,000 0.05
10 AASAN Info Solutions (India) Pvt. Ltd.At the beginning of the year 52,010 0.03 52,010 0.0315.03.2018 - Allotment under Rights Issue 2,261 0.00 54,271 0.03At the end of the year 54,271 0.03
11 Mr. Ajay G. Piramal (Karta of Ajay G Piramal HUF)At the beginning of the year 5,221 0.00 5,221 0.0015.03.2018 - Allotment under Rights Issue 227 0.00 5,448 0.00At the end of the year 5,448 0.00
12 Dr. (Mrs.) Swati A. PiramalAt the beginning of the year 1,167 0.00 1,167 0.0015.03.2018 - Allotment under Rights Issue 50 0.00 1,217 0.00At the end of the year 1,217 0.00
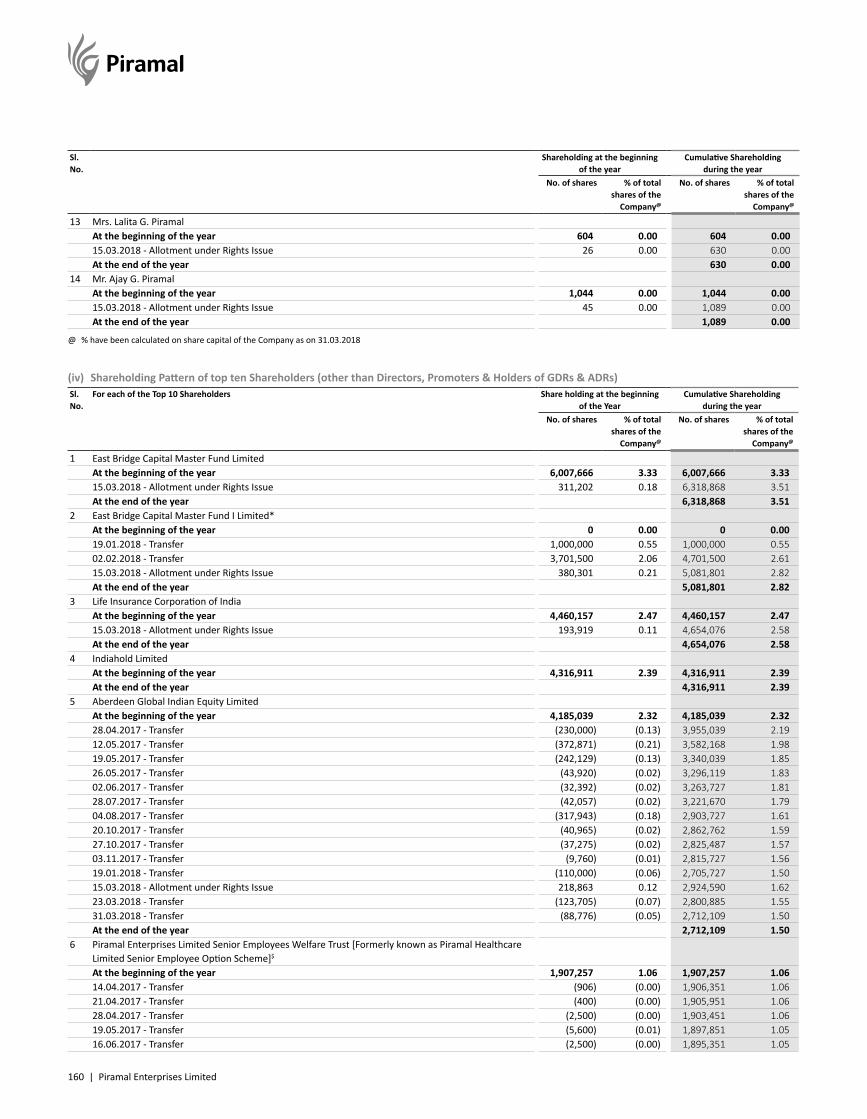
160 | Piramal Enterprises Limited
Sl. No.
Shareholding at the beginning of the year
Cumulative Shareholding during the year
No. of shares % of total shares of the
Company@
No. of shares % of total shares of the
Company@
13 Mrs. Lalita G. PiramalAt the beginning of the year 604 0.00 604 0.0015.03.2018 - Allotment under Rights Issue 26 0.00 630 0.00At the end of the year 630 0.00
14 Mr. Ajay G. PiramalAt the beginning of the year 1,044 0.00 1,044 0.0015.03.2018 - Allotment under Rights Issue 45 0.00 1,089 0.00At the end of the year 1,089 0.00
@ % have been calculated on share capital of the Company as on 31.03.2018
(iv) Shareholding Pattern of top ten Shareholders (other than Directors, Promoters & Holders of GDRs & ADRs)Sl. No.
For each of the Top 10 Shareholders Share holding at the beginning of the Year
Cumulative Shareholding during the year
No. of shares % of total shares of the
Company@
No. of shares % of total shares of the
Company@
1 East Bridge Capital Master Fund LimitedAt the beginning of the year 6,007,666 3.33 6,007,666 3.3315.03.2018 - Allotment under Rights Issue 311,202 0.18 6,318,868 3.51At the end of the year 6,318,868 3.51
2 East Bridge Capital Master Fund I Limited*At the beginning of the year 0 0.00 0 0.0019.01.2018 - Transfer 1,000,000 0.55 1,000,000 0.5502.02.2018 - Transfer 3,701,500 2.06 4,701,500 2.6115.03.2018 - Allotment under Rights Issue 380,301 0.21 5,081,801 2.82At the end of the year 5,081,801 2.82
3 Life Insurance Corporation of IndiaAt the beginning of the year 4,460,157 2.47 4,460,157 2.4715.03.2018 - Allotment under Rights Issue 193,919 0.11 4,654,076 2.58At the end of the year 4,654,076 2.58
4 Indiahold LimitedAt the beginning of the year 4,316,911 2.39 4,316,911 2.39At the end of the year 4,316,911 2.39
5 Aberdeen Global Indian Equity LimitedAt the beginning of the year 4,185,039 2.32 4,185,039 2.3228.04.2017 - Transfer (230,000) (0.13) 3,955,039 2.1912.05.2017 - Transfer (372,871) (0.21) 3,582,168 1.9819.05.2017 - Transfer (242,129) (0.13) 3,340,039 1.8526.05.2017 - Transfer (43,920) (0.02) 3,296,119 1.8302.06.2017 - Transfer (32,392) (0.02) 3,263,727 1.8128.07.2017 - Transfer (42,057) (0.02) 3,221,670 1.7904.08.2017 - Transfer (317,943) (0.18) 2,903,727 1.6120.10.2017 - Transfer (40,965) (0.02) 2,862,762 1.5927.10.2017 - Transfer (37,275) (0.02) 2,825,487 1.5703.11.2017 - Transfer (9,760) (0.01) 2,815,727 1.5619.01.2018 - Transfer (110,000) (0.06) 2,705,727 1.5015.03.2018 - Allotment under Rights Issue 218,863 0.12 2,924,590 1.6223.03.2018 - Transfer (123,705) (0.07) 2,800,885 1.5531.03.2018 - Transfer (88,776) (0.05) 2,712,109 1.50At the end of the year 2,712,109 1.50
6 Piramal Enterprises Limited Senior Employees Welfare Trust [Formerly known as Piramal Healthcare Limited Senior Employee Option Scheme]$
At the beginning of the year 1,907,257 1.06 1,907,257 1.0614.04.2017 - Transfer (906) (0.00) 1,906,351 1.0621.04.2017 - Transfer (400) (0.00) 1,905,951 1.0628.04.2017 - Transfer (2,500) (0.00) 1,903,451 1.0619.05.2017 - Transfer (5,600) (0.01) 1,897,851 1.0516.06.2017 - Transfer (2,500) (0.00) 1,895,351 1.05
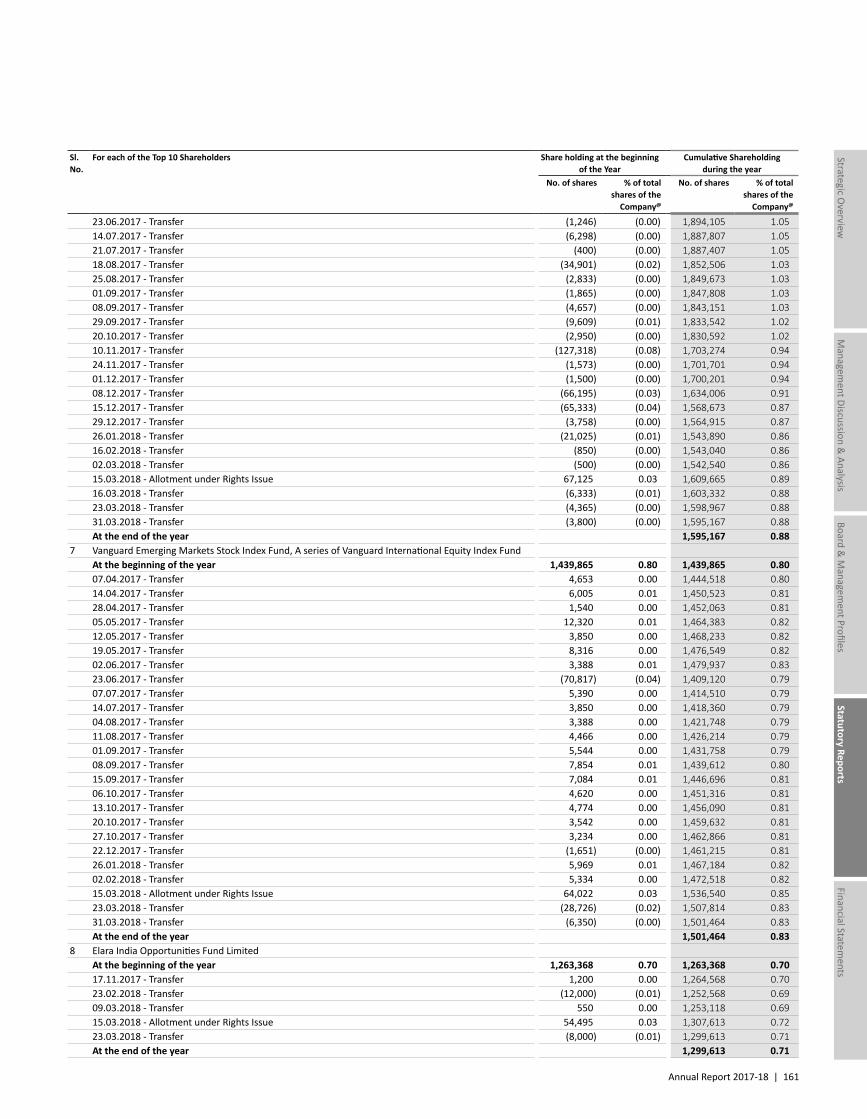
Annual Report 2017-18 | 161
Managem
ent Discussion & Analysis
Strategic Overview
Board &
Managem
ent ProfilesStatutory Reports
Financial Statements
Sl. No.
For each of the Top 10 Shareholders Share holding at the beginning of the Year
Cumulative Shareholding during the year
No. of shares % of total shares of the
Company@
No. of shares % of total shares of the
Company@
23.06.2017 - Transfer (1,246) (0.00) 1,894,105 1.0514.07.2017 - Transfer (6,298) (0.00) 1,887,807 1.0521.07.2017 - Transfer (400) (0.00) 1,887,407 1.0518.08.2017 - Transfer (34,901) (0.02) 1,852,506 1.0325.08.2017 - Transfer (2,833) (0.00) 1,849,673 1.0301.09.2017 - Transfer (1,865) (0.00) 1,847,808 1.0308.09.2017 - Transfer (4,657) (0.00) 1,843,151 1.0329.09.2017 - Transfer (9,609) (0.01) 1,833,542 1.0220.10.2017 - Transfer (2,950) (0.00) 1,830,592 1.0210.11.2017 - Transfer (127,318) (0.08) 1,703,274 0.9424.11.2017 - Transfer (1,573) (0.00) 1,701,701 0.9401.12.2017 - Transfer (1,500) (0.00) 1,700,201 0.9408.12.2017 - Transfer (66,195) (0.03) 1,634,006 0.9115.12.2017 - Transfer (65,333) (0.04) 1,568,673 0.8729.12.2017 - Transfer (3,758) (0.00) 1,564,915 0.8726.01.2018 - Transfer (21,025) (0.01) 1,543,890 0.8616.02.2018 - Transfer (850) (0.00) 1,543,040 0.8602.03.2018 - Transfer (500) (0.00) 1,542,540 0.8615.03.2018 - Allotment under Rights Issue 67,125 0.03 1,609,665 0.8916.03.2018 - Transfer (6,333) (0.01) 1,603,332 0.8823.03.2018 - Transfer (4,365) (0.00) 1,598,967 0.8831.03.2018 - Transfer (3,800) (0.00) 1,595,167 0.88At the end of the year 1,595,167 0.88
7 Vanguard Emerging Markets Stock Index Fund, A series of Vanguard International Equity Index FundAt the beginning of the year 1,439,865 0.80 1,439,865 0.8007.04.2017 - Transfer 4,653 0.00 1,444,518 0.8014.04.2017 - Transfer 6,005 0.01 1,450,523 0.8128.04.2017 - Transfer 1,540 0.00 1,452,063 0.8105.05.2017 - Transfer 12,320 0.01 1,464,383 0.8212.05.2017 - Transfer 3,850 0.00 1,468,233 0.8219.05.2017 - Transfer 8,316 0.00 1,476,549 0.8202.06.2017 - Transfer 3,388 0.01 1,479,937 0.8323.06.2017 - Transfer (70,817) (0.04) 1,409,120 0.7907.07.2017 - Transfer 5,390 0.00 1,414,510 0.7914.07.2017 - Transfer 3,850 0.00 1,418,360 0.7904.08.2017 - Transfer 3,388 0.00 1,421,748 0.7911.08.2017 - Transfer 4,466 0.00 1,426,214 0.7901.09.2017 - Transfer 5,544 0.00 1,431,758 0.7908.09.2017 - Transfer 7,854 0.01 1,439,612 0.8015.09.2017 - Transfer 7,084 0.01 1,446,696 0.8106.10.2017 - Transfer 4,620 0.00 1,451,316 0.8113.10.2017 - Transfer 4,774 0.00 1,456,090 0.8120.10.2017 - Transfer 3,542 0.00 1,459,632 0.8127.10.2017 - Transfer 3,234 0.00 1,462,866 0.8122.12.2017 - Transfer (1,651) (0.00) 1,461,215 0.8126.01.2018 - Transfer 5,969 0.01 1,467,184 0.8202.02.2018 - Transfer 5,334 0.00 1,472,518 0.8215.03.2018 - Allotment under Rights Issue 64,022 0.03 1,536,540 0.8523.03.2018 - Transfer (28,726) (0.02) 1,507,814 0.8331.03.2018 - Transfer (6,350) (0.00) 1,501,464 0.83At the end of the year 1,501,464 0.83
8 Elara India Opportunities Fund LimitedAt the beginning of the year 1,263,368 0.70 1,263,368 0.7017.11.2017 - Transfer 1,200 0.00 1,264,568 0.7023.02.2018 - Transfer (12,000) (0.01) 1,252,568 0.6909.03.2018 - Transfer 550 0.00 1,253,118 0.6915.03.2018 - Allotment under Rights Issue 54,495 0.03 1,307,613 0.7223.03.2018 - Transfer (8,000) (0.01) 1,299,613 0.71At the end of the year 1,299,613 0.71
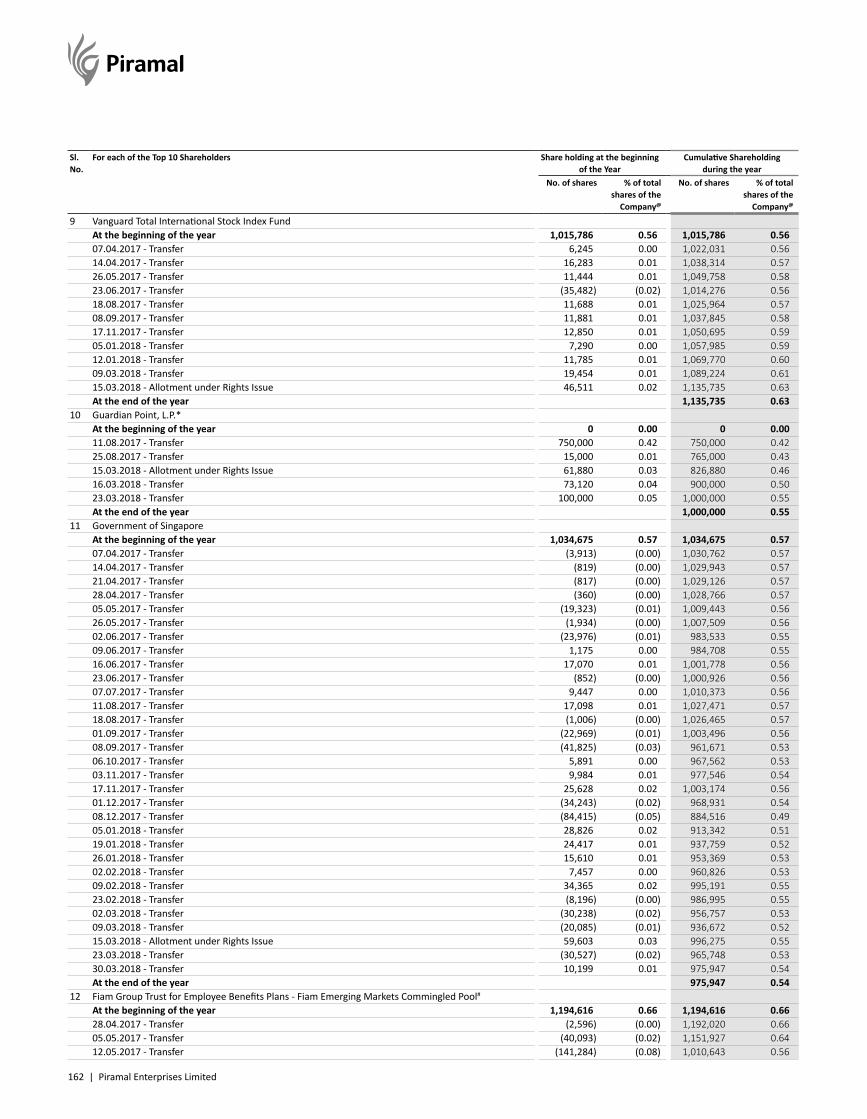
162 | Piramal Enterprises Limited
Sl. No.
For each of the Top 10 Shareholders Share holding at the beginning of the Year
Cumulative Shareholding during the year
No. of shares % of total shares of the
Company@
No. of shares % of total shares of the
Company@
9 Vanguard Total International Stock Index FundAt the beginning of the year 1,015,786 0.56 1,015,786 0.5607.04.2017 - Transfer 6,245 0.00 1,022,031 0.5614.04.2017 - Transfer 16,283 0.01 1,038,314 0.5726.05.2017 - Transfer 11,444 0.01 1,049,758 0.5823.06.2017 - Transfer (35,482) (0.02) 1,014,276 0.5618.08.2017 - Transfer 11,688 0.01 1,025,964 0.5708.09.2017 - Transfer 11,881 0.01 1,037,845 0.5817.11.2017 - Transfer 12,850 0.01 1,050,695 0.5905.01.2018 - Transfer 7,290 0.00 1,057,985 0.5912.01.2018 - Transfer 11,785 0.01 1,069,770 0.6009.03.2018 - Transfer 19,454 0.01 1,089,224 0.6115.03.2018 - Allotment under Rights Issue 46,511 0.02 1,135,735 0.63At the end of the year 1,135,735 0.63
10 Guardian Point, L.P.*At the beginning of the year 0 0.00 0 0.0011.08.2017 - Transfer 750,000 0.42 750,000 0.4225.08.2017 - Transfer 15,000 0.01 765,000 0.4315.03.2018 - Allotment under Rights Issue 61,880 0.03 826,880 0.4616.03.2018 - Transfer 73,120 0.04 900,000 0.5023.03.2018 - Transfer 100,000 0.05 1,000,000 0.55At the end of the year 1,000,000 0.55
11 Government of SingaporeAt the beginning of the year 1,034,675 0.57 1,034,675 0.5707.04.2017 - Transfer (3,913) (0.00) 1,030,762 0.5714.04.2017 - Transfer (819) (0.00) 1,029,943 0.5721.04.2017 - Transfer (817) (0.00) 1,029,126 0.5728.04.2017 - Transfer (360) (0.00) 1,028,766 0.5705.05.2017 - Transfer (19,323) (0.01) 1,009,443 0.5626.05.2017 - Transfer (1,934) (0.00) 1,007,509 0.5602.06.2017 - Transfer (23,976) (0.01) 983,533 0.5509.06.2017 - Transfer 1,175 0.00 984,708 0.5516.06.2017 - Transfer 17,070 0.01 1,001,778 0.5623.06.2017 - Transfer (852) (0.00) 1,000,926 0.5607.07.2017 - Transfer 9,447 0.00 1,010,373 0.5611.08.2017 - Transfer 17,098 0.01 1,027,471 0.5718.08.2017 - Transfer (1,006) (0.00) 1,026,465 0.5701.09.2017 - Transfer (22,969) (0.01) 1,003,496 0.5608.09.2017 - Transfer (41,825) (0.03) 961,671 0.5306.10.2017 - Transfer 5,891 0.00 967,562 0.5303.11.2017 - Transfer 9,984 0.01 977,546 0.5417.11.2017 - Transfer 25,628 0.02 1,003,174 0.5601.12.2017 - Transfer (34,243) (0.02) 968,931 0.5408.12.2017 - Transfer (84,415) (0.05) 884,516 0.4905.01.2018 - Transfer 28,826 0.02 913,342 0.5119.01.2018 - Transfer 24,417 0.01 937,759 0.5226.01.2018 - Transfer 15,610 0.01 953,369 0.5302.02.2018 - Transfer 7,457 0.00 960,826 0.5309.02.2018 - Transfer 34,365 0.02 995,191 0.5523.02.2018 - Transfer (8,196) (0.00) 986,995 0.5502.03.2018 - Transfer (30,238) (0.02) 956,757 0.5309.03.2018 - Transfer (20,085) (0.01) 936,672 0.5215.03.2018 - Allotment under Rights Issue 59,603 0.03 996,275 0.5523.03.2018 - Transfer (30,527) (0.02) 965,748 0.5330.03.2018 - Transfer 10,199 0.01 975,947 0.54At the end of the year 975,947 0.54
12 Fiam Group Trust for Employee Benefits Plans - Fiam Emerging Markets Commingled Pool#
At the beginning of the year 1,194,616 0.66 1,194,616 0.6628.04.2017 - Transfer (2,596) (0.00) 1,192,020 0.6605.05.2017 - Transfer (40,093) (0.02) 1,151,927 0.6412.05.2017 - Transfer (141,284) (0.08) 1,010,643 0.56
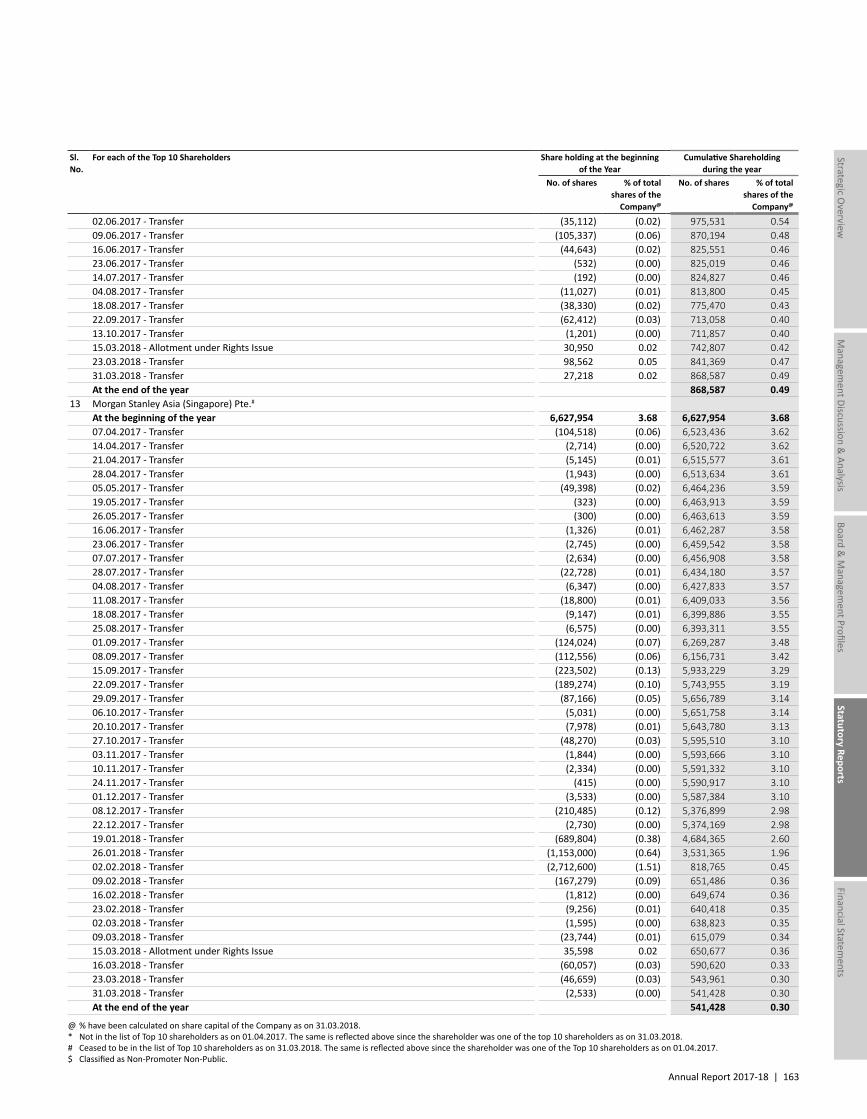
Annual Report 2017-18 | 163
Managem
ent Discussion & Analysis
Strategic Overview
Board &
Managem
ent ProfilesStatutory Reports
Financial Statements
Sl. No.
For each of the Top 10 Shareholders Share holding at the beginning of the Year
Cumulative Shareholding during the year
No. of shares % of total shares of the
Company@
No. of shares % of total shares of the
Company@
02.06.2017 - Transfer (35,112) (0.02) 975,531 0.5409.06.2017 - Transfer (105,337) (0.06) 870,194 0.4816.06.2017 - Transfer (44,643) (0.02) 825,551 0.4623.06.2017 - Transfer (532) (0.00) 825,019 0.4614.07.2017 - Transfer (192) (0.00) 824,827 0.4604.08.2017 - Transfer (11,027) (0.01) 813,800 0.4518.08.2017 - Transfer (38,330) (0.02) 775,470 0.4322.09.2017 - Transfer (62,412) (0.03) 713,058 0.4013.10.2017 - Transfer (1,201) (0.00) 711,857 0.4015.03.2018 - Allotment under Rights Issue 30,950 0.02 742,807 0.4223.03.2018 - Transfer 98,562 0.05 841,369 0.4731.03.2018 - Transfer 27,218 0.02 868,587 0.49At the end of the year 868,587 0.49
13 Morgan Stanley Asia (Singapore) Pte.#
At the beginning of the year 6,627,954 3.68 6,627,954 3.6807.04.2017 - Transfer (104,518) (0.06) 6,523,436 3.6214.04.2017 - Transfer (2,714) (0.00) 6,520,722 3.6221.04.2017 - Transfer (5,145) (0.01) 6,515,577 3.6128.04.2017 - Transfer (1,943) (0.00) 6,513,634 3.6105.05.2017 - Transfer (49,398) (0.02) 6,464,236 3.5919.05.2017 - Transfer (323) (0.00) 6,463,913 3.5926.05.2017 - Transfer (300) (0.00) 6,463,613 3.5916.06.2017 - Transfer (1,326) (0.01) 6,462,287 3.5823.06.2017 - Transfer (2,745) (0.00) 6,459,542 3.5807.07.2017 - Transfer (2,634) (0.00) 6,456,908 3.5828.07.2017 - Transfer (22,728) (0.01) 6,434,180 3.5704.08.2017 - Transfer (6,347) (0.00) 6,427,833 3.5711.08.2017 - Transfer (18,800) (0.01) 6,409,033 3.5618.08.2017 - Transfer (9,147) (0.01) 6,399,886 3.5525.08.2017 - Transfer (6,575) (0.00) 6,393,311 3.5501.09.2017 - Transfer (124,024) (0.07) 6,269,287 3.4808.09.2017 - Transfer (112,556) (0.06) 6,156,731 3.4215.09.2017 - Transfer (223,502) (0.13) 5,933,229 3.2922.09.2017 - Transfer (189,274) (0.10) 5,743,955 3.1929.09.2017 - Transfer (87,166) (0.05) 5,656,789 3.1406.10.2017 - Transfer (5,031) (0.00) 5,651,758 3.1420.10.2017 - Transfer (7,978) (0.01) 5,643,780 3.1327.10.2017 - Transfer (48,270) (0.03) 5,595,510 3.1003.11.2017 - Transfer (1,844) (0.00) 5,593,666 3.1010.11.2017 - Transfer (2,334) (0.00) 5,591,332 3.1024.11.2017 - Transfer (415) (0.00) 5,590,917 3.1001.12.2017 - Transfer (3,533) (0.00) 5,587,384 3.1008.12.2017 - Transfer (210,485) (0.12) 5,376,899 2.9822.12.2017 - Transfer (2,730) (0.00) 5,374,169 2.9819.01.2018 - Transfer (689,804) (0.38) 4,684,365 2.6026.01.2018 - Transfer (1,153,000) (0.64) 3,531,365 1.9602.02.2018 - Transfer (2,712,600) (1.51) 818,765 0.4509.02.2018 - Transfer (167,279) (0.09) 651,486 0.3616.02.2018 - Transfer (1,812) (0.00) 649,674 0.3623.02.2018 - Transfer (9,256) (0.01) 640,418 0.3502.03.2018 - Transfer (1,595) (0.00) 638,823 0.3509.03.2018 - Transfer (23,744) (0.01) 615,079 0.3415.03.2018 - Allotment under Rights Issue 35,598 0.02 650,677 0.3616.03.2018 - Transfer (60,057) (0.03) 590,620 0.3323.03.2018 - Transfer (46,659) (0.03) 543,961 0.3031.03.2018 - Transfer (2,533) (0.00) 541,428 0.30At the end of the year 541,428 0.30
@ % have been calculated on share capital of the Company as on 31.03.2018.* Not in the list of Top 10 shareholders as on 01.04.2017. The same is reflected above since the shareholder was one of the top 10 shareholders as on 31.03.2018.# Ceased to be in the list of Top 10 shareholders as on 31.03.2018. The same is reflected above since the shareholder was one of the Top 10 shareholders as on 01.04.2017.$ Classified as Non-Promoter Non-Public.
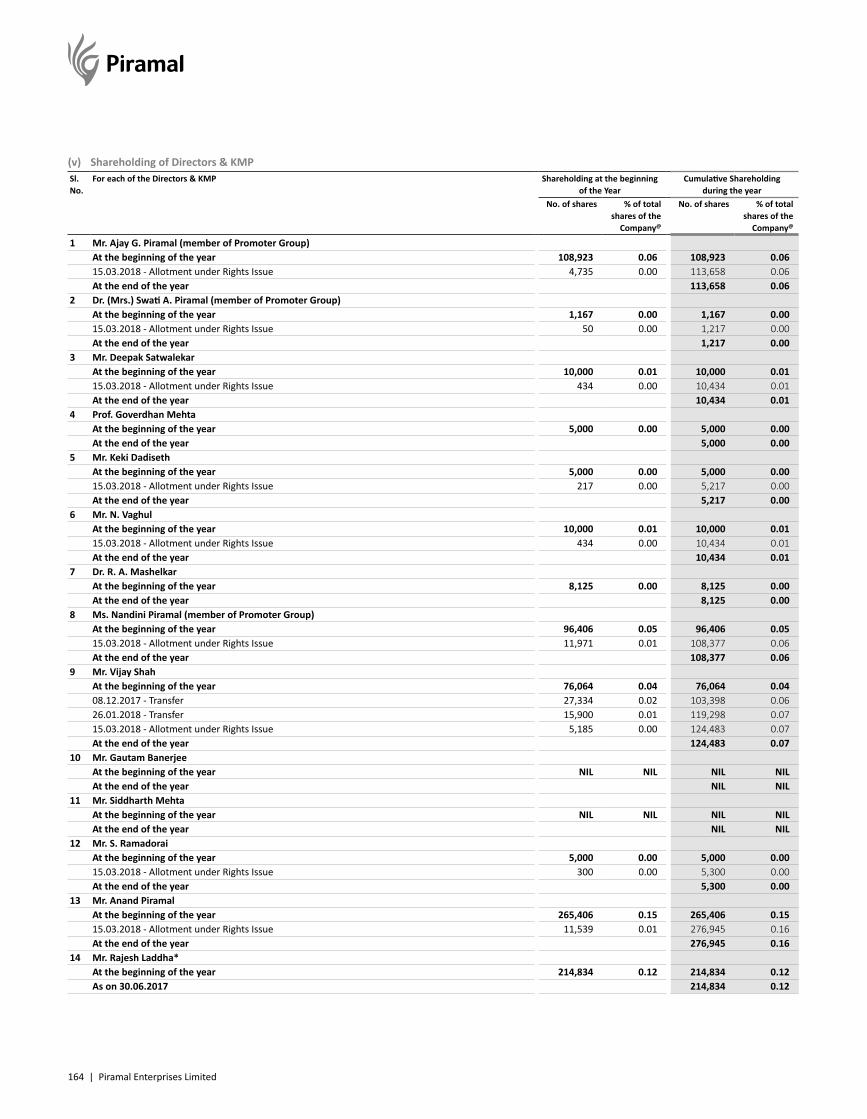
164 | Piramal Enterprises Limited
(v) Shareholding of Directors & KMPSl. No.
For each of the Directors & KMP Shareholding at the beginning of the Year
Cumulative Shareholding during the year
No. of shares % of total shares of the
Company@
No. of shares % of total shares of the
Company@
1 Mr. Ajay G. Piramal (member of Promoter Group)At the beginning of the year 108,923 0.06 108,923 0.0615.03.2018 - Allotment under Rights Issue 4,735 0.00 113,658 0.06At the end of the year 113,658 0.06
2 Dr. (Mrs.) Swati A. Piramal (member of Promoter Group)At the beginning of the year 1,167 0.00 1,167 0.0015.03.2018 - Allotment under Rights Issue 50 0.00 1,217 0.00At the end of the year 1,217 0.00
3 Mr. Deepak SatwalekarAt the beginning of the year 10,000 0.01 10,000 0.0115.03.2018 - Allotment under Rights Issue 434 0.00 10,434 0.01At the end of the year 10,434 0.01
4 Prof. Goverdhan MehtaAt the beginning of the year 5,000 0.00 5,000 0.00At the end of the year 5,000 0.00
5 Mr. Keki DadisethAt the beginning of the year 5,000 0.00 5,000 0.0015.03.2018 - Allotment under Rights Issue 217 0.00 5,217 0.00At the end of the year 5,217 0.00
6 Mr. N. VaghulAt the beginning of the year 10,000 0.01 10,000 0.0115.03.2018 - Allotment under Rights Issue 434 0.00 10,434 0.01At the end of the year 10,434 0.01
7 Dr. R. A. MashelkarAt the beginning of the year 8,125 0.00 8,125 0.00At the end of the year 8,125 0.00
8 Ms. Nandini Piramal (member of Promoter Group)At the beginning of the year 96,406 0.05 96,406 0.0515.03.2018 - Allotment under Rights Issue 11,971 0.01 108,377 0.06At the end of the year 108,377 0.06
9 Mr. Vijay ShahAt the beginning of the year 76,064 0.04 76,064 0.0408.12.2017 - Transfer 27,334 0.02 103,398 0.0626.01.2018 - Transfer 15,900 0.01 119,298 0.0715.03.2018 - Allotment under Rights Issue 5,185 0.00 124,483 0.07At the end of the year 124,483 0.07
10 Mr. Gautam BanerjeeAt the beginning of the year NIL NIL NIL NILAt the end of the year NIL NIL
11 Mr. Siddharth MehtaAt the beginning of the year NIL NIL NIL NILAt the end of the year NIL NIL
12 Mr. S. RamadoraiAt the beginning of the year 5,000 0.00 5,000 0.0015.03.2018 - Allotment under Rights Issue 300 0.00 5,300 0.00At the end of the year 5,300 0.00
13 Mr. Anand PiramalAt the beginning of the year 265,406 0.15 265,406 0.1515.03.2018 - Allotment under Rights Issue 11,539 0.01 276,945 0.16At the end of the year 276,945 0.16
14 Mr. Rajesh Laddha*At the beginning of the year 214,834 0.12 214,834 0.12As on 30.06.2017 214,834 0.12
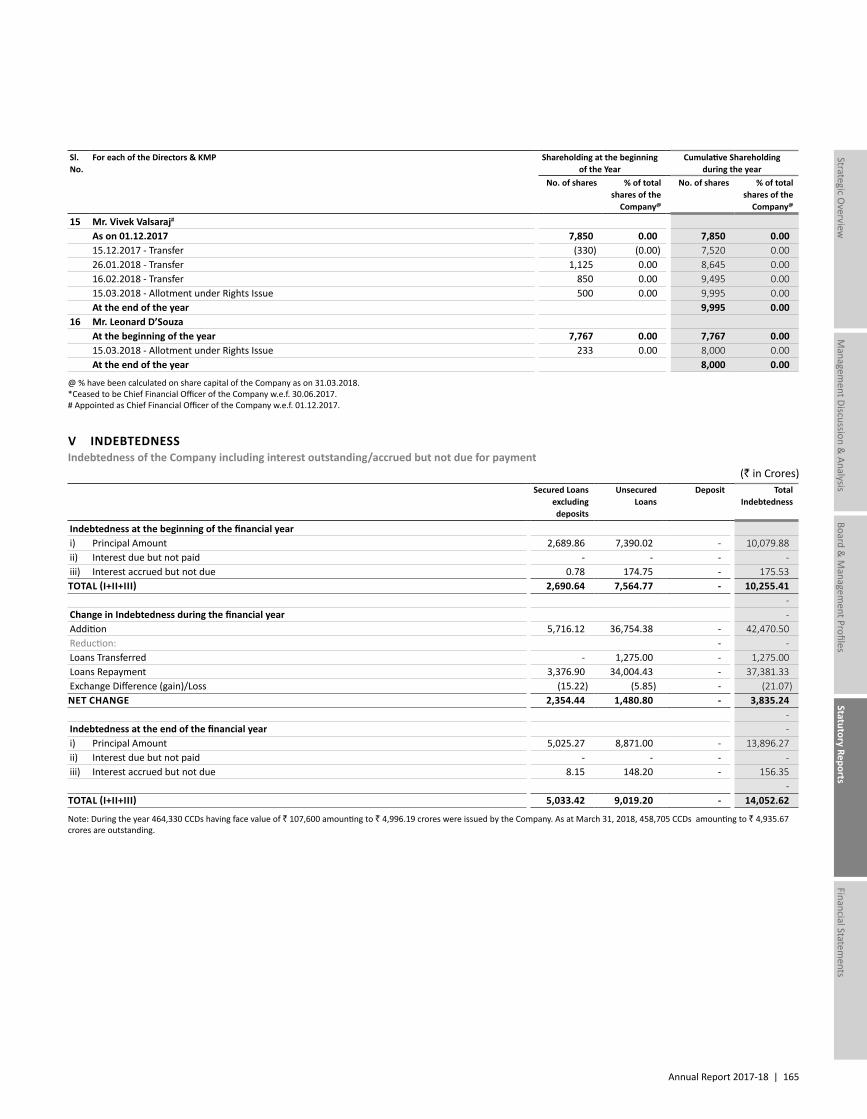
Annual Report 2017-18 | 165
Managem
ent Discussion & Analysis
Strategic Overview
Board &
Managem
ent ProfilesStatutory Reports
Financial Statements
Sl. No.
For each of the Directors & KMP Shareholding at the beginning of the Year
Cumulative Shareholding during the year
No. of shares % of total shares of the
Company@
No. of shares % of total shares of the
Company@
15 Mr. Vivek Valsaraj#
As on 01.12.2017 7,850 0.00 7,850 0.0015.12.2017 - Transfer (330) (0.00) 7,520 0.0026.01.2018 - Transfer 1,125 0.00 8,645 0.0016.02.2018 - Transfer 850 0.00 9,495 0.0015.03.2018 - Allotment under Rights Issue 500 0.00 9,995 0.00At the end of the year 9,995 0.00
16 Mr. Leonard D’SouzaAt the beginning of the year 7,767 0.00 7,767 0.0015.03.2018 - Allotment under Rights Issue 233 0.00 8,000 0.00At the end of the year 8,000 0.00
@ % have been calculated on share capital of the Company as on 31.03.2018.*Ceased to be Chief Financial Officer of the Company w.e.f. 30.06.2017.# Appointed as Chief Financial Officer of the Company w.e.f. 01.12.2017.
V INDEBTEDNESSIndebtedness of the Company including interest outstanding/accrued but not due for payment
(` in Crores)Secured Loans
excluding deposits
Unsecured Loans
Deposit Total Indebtedness
Indebtedness at the beginning of the financial yeari) Principal Amount 2,689.86 7,390.02 - 10,079.88ii) Interest due but not paid - - - -iii) Interest accrued but not due 0.78 174.75 - 175.53TOTAL (I+II+III) 2,690.64 7,564.77 - 10,255.41
-Change in Indebtedness during the financial year -Addition 5,716.12 36,754.38 - 42,470.50Reduction: - -Loans Transferred - 1,275.00 - 1,275.00Loans Repayment 3,376.90 34,004.43 - 37,381.33Exchange Difference (gain)/Loss (15.22) (5.85) - (21.07)NET CHANGE 2,354.44 1,480.80 - 3,835.24
-Indebtedness at the end of the financial year -i) Principal Amount 5,025.27 8,871.00 - 13,896.27ii) Interest due but not paid - - - -iii) Interest accrued but not due 8.15 148.20 - 156.35
-TOTAL (I+II+III) 5,033.42 9,019.20 - 14,052.62
Note: During the year 464,330 CCDs having face value of ` 107,600 amounting to ` 4,996.19 crores were issued by the Company. As at March 31, 2018, 458,705 CCDs amounting to ` 4,935.67 crores are outstanding.
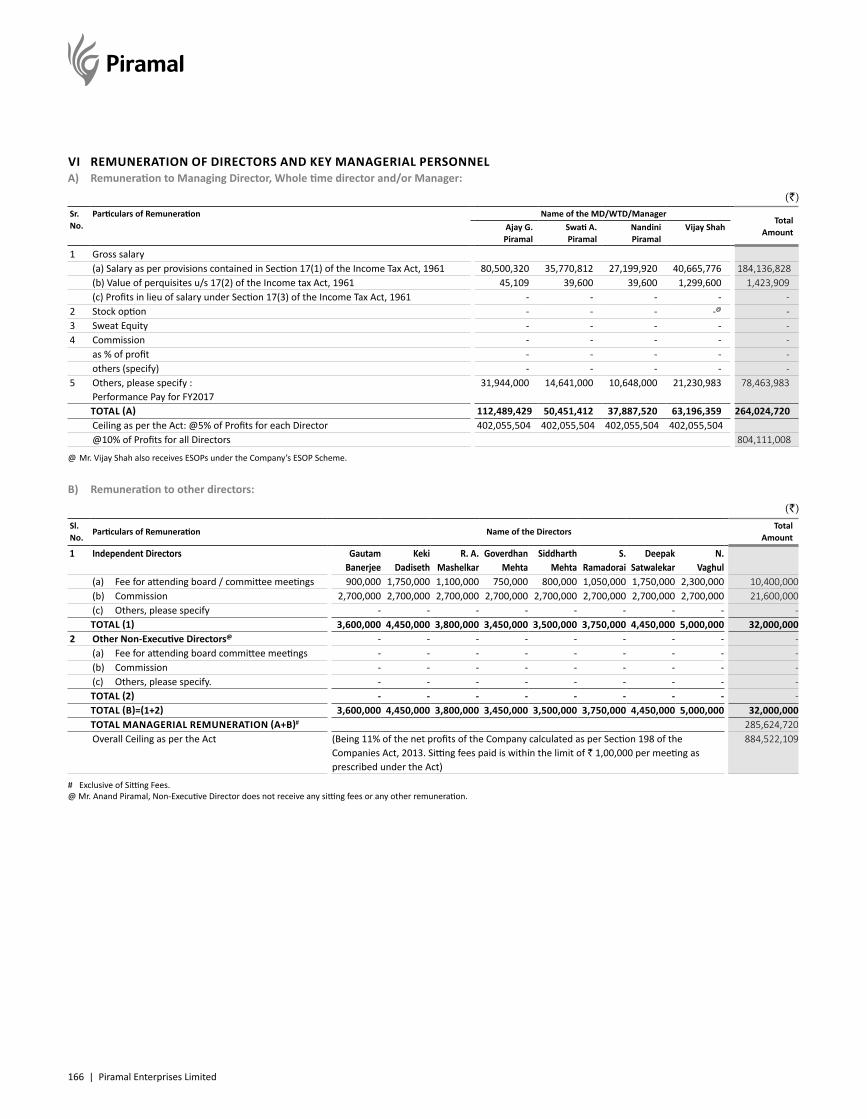
166 | Piramal Enterprises Limited
VI REMUNERATION OF DIRECTORS AND KEY MANAGERIAL PERSONNELA) Remuneration to Managing Director, Whole time director and/or Manager:
(`)Sr. No.
Particulars of Remuneration Name of the MD/WTD/ManagerTotal
AmountAjay G. Piramal
Swati A. Piramal
Nandini Piramal
Vijay Shah
1 Gross salary(a) Salary as per provisions contained in Section 17(1) of the Income Tax Act, 1961 80,500,320 35,770,812 27,199,920 40,665,776 184,136,828(b) Value of perquisites u/s 17(2) of the Income tax Act, 1961 45,109 39,600 39,600 1,299,600 1,423,909(c) Profits in lieu of salary under Section 17(3) of the Income Tax Act, 1961 - - - - -
2 Stock option - - - -@ -3 Sweat Equity - - - - -4 Commission - - - - -
as % of profit - - - - -others (specify) - - - - -
5 Others, please specify : Performance Pay for FY2017
31,944,000 14,641,000 10,648,000 21,230,983 78,463,983
TOTAL (A) 112,489,429 50,451,412 37,887,520 63,196,359 264,024,720Ceiling as per the Act: @5% of Profits for each Director 402,055,504 402,055,504 402,055,504 402,055,504@10% of Profits for all Directors 804,111,008
@ Mr. Vijay Shah also receives ESOPs under the Company’s ESOP Scheme.
B) Remuneration to other directors:
(`)Sl. No.
Particulars of Remuneration Name of the DirectorsTotal
Amount
1 Independent Directors Gautam Banerjee
Keki Dadiseth
R. A. Mashelkar
Goverdhan Mehta
Siddharth Mehta
S. Ramadorai
Deepak Satwalekar
N. Vaghul
(a) Fee for attending board / committee meetings 900,000 1,750,000 1,100,000 750,000 800,000 1,050,000 1,750,000 2,300,000 10,400,000(b) Commission 2,700,000 2,700,000 2,700,000 2,700,000 2,700,000 2,700,000 2,700,000 2,700,000 21,600,000(c) Others, please specify - - - - - - - - -TOTAL (1) 3,600,000 4,450,000 3,800,000 3,450,000 3,500,000 3,750,000 4,450,000 5,000,000 32,000,000
2 Other Non-Executive Directors@ - - - - - - - - -(a) Fee for attending board committee meetings - - - - - - - - -(b) Commission - - - - - - - - -(c) Others, please specify. - - - - - - - - -TOTAL (2) - - - - - - - - -TOTAL (B)=(1+2) 3,600,000 4,450,000 3,800,000 3,450,000 3,500,000 3,750,000 4,450,000 5,000,000 32,000,000TOTAL MANAGERIAL REMUNERATION (A+B)# 285,624,720Overall Ceiling as per the Act (Being 11% of the net profits of the Company calculated as per Section 198 of the
Companies Act, 2013. Sitting fees paid is within the limit of ` 1,00,000 per meeting as prescribed under the Act)
884,522,109
# Exclusive of Sitting Fees.@ Mr. Anand Piramal, Non-Executive Director does not receive any sitting fees or any other remuneration.
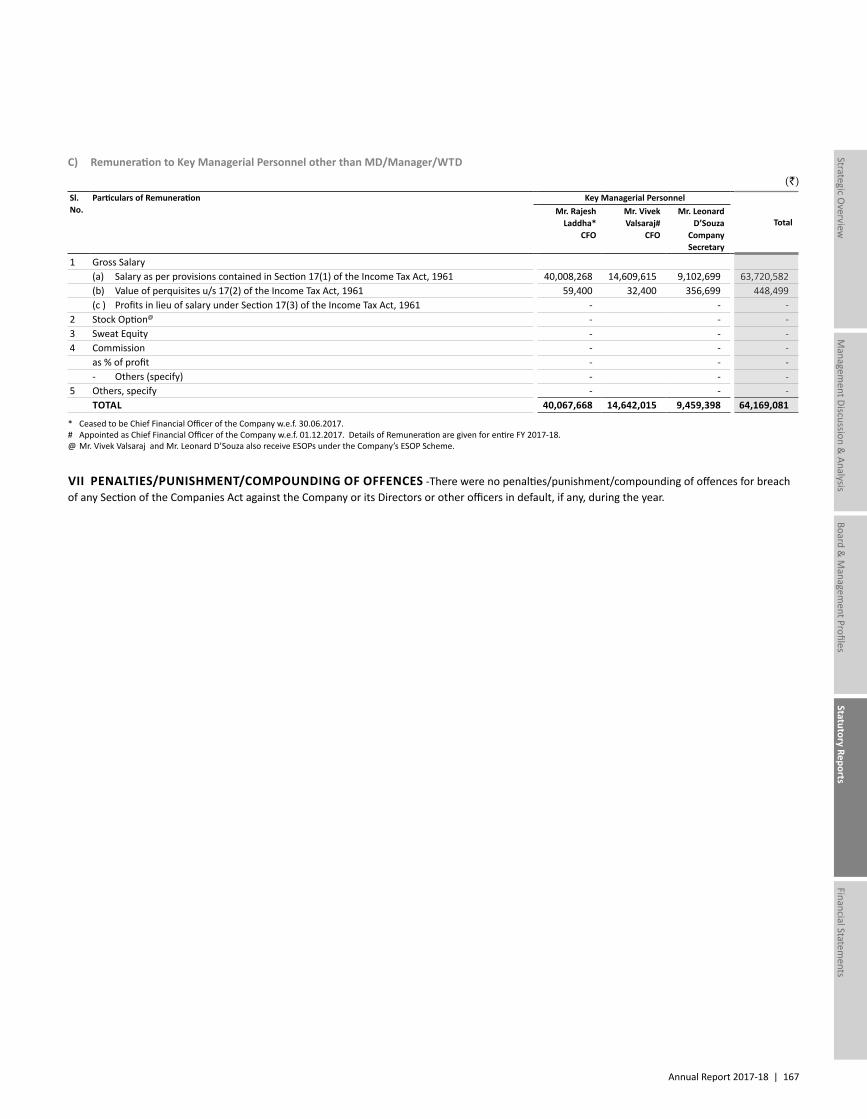
Annual Report 2017-18 | 167
Managem
ent Discussion & Analysis
Strategic Overview
Board &
Managem
ent ProfilesStatutory Reports
Financial Statements
C) Remuneration to Key Managerial Personnel other than MD/Manager/WTD
(`)Sl. No.
Particulars of Remuneration Key Managerial Personnel
TotalMr. Rajesh
Laddha* CFO
Mr. Vivek Valsaraj#
CFO
Mr. Leonard D’Souza
Company Secretary
1 Gross Salary(a) Salary as per provisions contained in Section 17(1) of the Income Tax Act, 1961 40,008,268 14,609,615 9,102,699 63,720,582(b) Value of perquisites u/s 17(2) of the Income Tax Act, 1961 59,400 32,400 356,699 448,499(c ) Profits in lieu of salary under Section 17(3) of the Income Tax Act, 1961 - - -
2 Stock Option@ - - -3 Sweat Equity - - -4 Commission - - -
as % of profit - - -- Others (specify) - - -
5 Others, specify - - -TOTAL 40,067,668 14,642,015 9,459,398 64,169,081
* Ceased to be Chief Financial Officer of the Company w.e.f. 30.06.2017.# Appointed as Chief Financial Officer of the Company w.e.f. 01.12.2017. Details of Remuneration are given for entire FY 2017-18.@ Mr. Vivek Valsaraj and Mr. Leonard D’Souza also receive ESOPs under the Company’s ESOP Scheme.
VII PENALTIES/PUNISHMENT/COMPOUNDING OF OFFENCES -There were no penalties/punishment/compounding of offences for breach of any Section of the Companies Act against the Company or its Directors or other officers in default, if any, during the year.
168 | Piramal Enterprises Limited
NOMINATION POLICYI. Preamble The Nomination and Remuneration Committee (‘NRC’) of Piramal
Enterprises Limited (the ‘Company’), has adopted the following policy and procedures with regard to identification and nomination of persons who are qualified to become directors and who maybe appointed in senior management.
This policy is framed in compliance with the applicable provisions of Regulation 19 read with Part D of the Schedule II of the SEBI (Listing Obligations and Disclosures Requirements) Regulations, 2015 (‘the Regulations’) and Section 178 and other applicable provisions of the Companies Act, 2013.
II. Criteria for identifying persons for appointment as Directors and Senior Management:
A. Directors 1. Candidates for Directorship should possess appropriate
qualifications, skills and expertise in one or more fields of finance, law, general corporate management, information management, science and innovation, public policy, financial services, sales & marketing and other disciplines as may be identified by the NRC and/or the Board from time to time, that may be relevant to the Company’s business.
2. Such candidates should also have a proven record of professional success.
3 Every candidate for Directorship on the Board should have the following positive attributes:
a) Possesses a high level of integrity, ethics, credibility and trustworthiness;
b) Ability to handle conflict constructively and possess the willingness to address critical issues proactively;
c) Is familiar with the business of the Company and the industry in which it operates and displays a keen interest in contributing at the Board level to the Company’s growth in these areas;
d) Possesses the ability to bring independent judgment to bear on the Board’s deliberations especially on issues of strategy, performance, risk management and resource planning;
e) Displays willingness to devote sufficient time and attention to the Company’s affairs;
ANNEXURE E
f) Values Corporate Governance and possesses the skills and ability to assist the Company in implementing good corporate governance practices;
g) Possesses leadership skills and is a team player.
4. Criteria for Independence applicable for selection of Independent Directors:
a) Candidates for Independent Directors on the Board of the Company should comply with the criteria for Independence as stipulated in the Companies Act, 2013 and the Regulations, as amended or re-enacted or notified from time to time. Such candidates should also comply with other applicable regulatory requirements relating to Independence or as may be laid down by the Board from time to time.
b) Such Candidates shall submit a Declaration of Independence to the NRC / Board, initially and thereafter, annually, based upon which, the NRC / Board shall evaluate compliance with this criteria for Independence.
5. Change in status of Independence
Every Independent Director shall be required to inform the NRC / Board immediately in case of any change in circumstances that may put his or her independence in doubt, based upon which, the NRC / Board may take such steps as it may deem fit in the best interest of the organization.
6. Extension of existing term of Independent Directors
Upon the expiry of the prevailing term and subject to the eligibility of the Independent Director (‘ID’), under the applicable provisions of the Act, Rules, Listing Regulations and other applicable law(s), as prevailing from time to time, the Board may, on the recommendations of the NRC and subject to the outcome of performance evaluation and in compliance with applicable regulatory requirements, at its discretion, recommend to the shareholders an extension or renewal of the ID’s existing term for such period as it may deem fit and proper, in the best interest of the organization.
B. Members of Senior Management 1. For the purpose of this Policy, the term ‘Senior Management’
shall have the same meaning as defined in the Companies Act, 2013 and the Regulations, as amended from time to time.
2. The eligibility criteria for appointments to Senior Management and continuity thereof shall include integrity and ethics, in
Annual Report 2017-18 | 169
Managem
ent Discussion & Analysis
Strategic Overview
Board &
Managem
ent ProfilesStatutory Reports
Financial Statements
addition to possessing qualifications, expertise, experience and special competencies relevant to the position for which purpose the executive is being or has been appointed.
3. Any candidate being considered for the post of senior management should be willing to comply fully with the PEL – Code of Conduct for senior management, PEL – Code of Conduct for Prevention of Insider Trading and other applicable policies, in force from time to time.
III. Process for identification & shortlisting of candidatesA. Directors 1. The NRC shall identify the need for appointment of new
Directors on the Board on the basis of the evaluation process for Board as a whole and of individual Directors or as it may otherwise determine.
2. Candidates for Board membership may be identified from a number of sources, including but not limited to past and present members of the Board and Directors database.
3. NRC shall evaluate proposals for appointment of new Directors on the basis of qualification criteria and positive attributes referred to hereinabove and make its recommendations to the Board.
B. Members of Senior Management 1. The NRC shall consider the recommendations of the
management while evaluating the selection of executives in senior management. The NRC may also identity potential candidates for appointment to Senior Management through referrals and recommendations from past and present members of the Board or from such other sources as it may deem fit and proper.
2. The NRC shall evaluate proposals for appointments to Senior Management on the basis of eligibility criteria referred to hereinabove and such other criteria as it may deem appropriate.
3. Based on such evaluation, the NRC shall shortlist the desired candidate and make its recommendations to the Board for appointment.
IV. RemovalA. Directors 1. If a Director incurs any disqualification mentioned under the
Companies Act, 2013 or any other applicable law, regulations, statutory requirement, the NRC may recommend to the Board with reasons recorded in writing, the removal of the said Director subject to the provisions of and compliance with the statutory provisions.
2. Such recommendations may also be made on the basis of performance evaluation of the Directors or as may otherwise be thought fit by the NRC.
B. Members of Senior Management 1. The NRC shall consider the recommendations of the
management while making recommendations to the Board for dismissal / removal of those in Senior Management.
2. Such recommendations may also be made on the basis of performance evaluation of members of Senior Management to the extent applicable or as may otherwise be thought fit by the NRC.
V. Review The NRC shall periodically review the effectiveness of this Policy and
recommend any revisions that maybe required to this Policy to the Board for consideration and approval.
REMUNERATION POLICY1. Preamble1.1. The Nomination and Remuneration Committee (‘NRC’) of Piramal
Enterprises Limited (the “Company”), has adopted the following policy and procedures with regard to remuneration of Directors, Key Managerial Personnel and other employees.
1.2. The Remuneration Policy (‘Policy’) is framed in compliance with the applicable provisions of Regulation 19 read with Part D of the Schedule II of the SEBI (Listing Obligations and Disclosures Requirements) Regulations, 2015 (‘the Regulations’) entered by the Company with the Stock Exchanges and Section 178 and other applicable provisions of the Companies Act, 2013.
1.3. This Policy reflects the Company’s core values viz. Knowledge, Action, Care and Impact.
2. Designing of Remuneration Packages2.1. While designing remuneration packages, the following factors are
taken into consideration:
a. Ability to attract, motivate and retain the best talent in the industries in which the Company operates;
b. Current industry benchmarks;
c. Cost of living;
d. Maintenance of an appropriate balance between fixed, performance linked variable pay and long term incentives reflecting long and short term performance objectives aligned to the working of the company and its goals;
e. Achievement of Key Result Areas (KRAs) of the employee, the concerned department / function and of the Company.
3. Remuneration to DirectorsA. Non- Executive/ Independent Directors: The Non- Executive / Independent directors are entitled to the
following:
170 | Piramal Enterprises Limited
i. Sitting Fees: The Non- Executive / Independent Director receive remuneration in the form of sitting fees for attending meetings of Board or Committee thereof of the Company and its subsidiaries where such Director maybe so appointed. The Independent Directors also receive sitting fees for attending separate meetings of the Independent Directors. Provided that the amount of such fees shall not exceed such amount per meeting as may be prescribed by the Central Government from time to time.
ii. Commission: Commission may be paid within the monetary limit approved by shareholders subject to compliance with applicable regulatory requirements.
B. Remuneration to Whole – Time Directors i. The remuneration to be paid to the Whole – Time Directors
shall be in compliance with the applicable regulatory requirements, including such requisite approvals as required by law.
ii. Increments may be recommended by the Committee to the Board which shall be within applicable regulatory limits.
iii. The Board may at the recommendation of the NRC and its discretion, may consider the payment of such additional remuneration within the framework of applicable laws and regulatory requirements.
4. Remuneration to Key Managerial Personnel and Senior Management
Remuneration to Key Managerial Personnel and other Senior Management shall be as per the HR Policy of the Company in force from time to time and in compliance with applicable regulatory requirements. Total remuneration comprises of:
A fixed Basic Salary;
Perquisites as per Company Policy;
Retirement benefits as per Company Rules and statutory requirements;
Performance linked incentive (on an annual basis) based on the achievement of pre-set KRAs and long term incentives based on value creation.
In addition to the above mentioned remuneration package, Key Managerial Personnel and Senior Management may also be provided Employee Stock Options (ESOPs) in compliance with applicable regulatory requirements.
5. Remuneration to Other Employees The remuneration packages of other employees are also formulated
in accordance with HR Policy of the Company in force from time to time. In addition to basic salary and other components forming part of overall salary package, employees are also provided with perquisites and retirement benefits as per the HR Policy of the Company and statutory requirements, where applicable.
6. Disclosure As per existing Applicable Regulatory Requirements, the
Remuneration Policy shall be disclosed in the Board’s Report.
7. Review The NRC shall periodically review the effectiveness of this Policy and
recommend any revisions that maybe required to this Policy to the Board for consideration and approval.
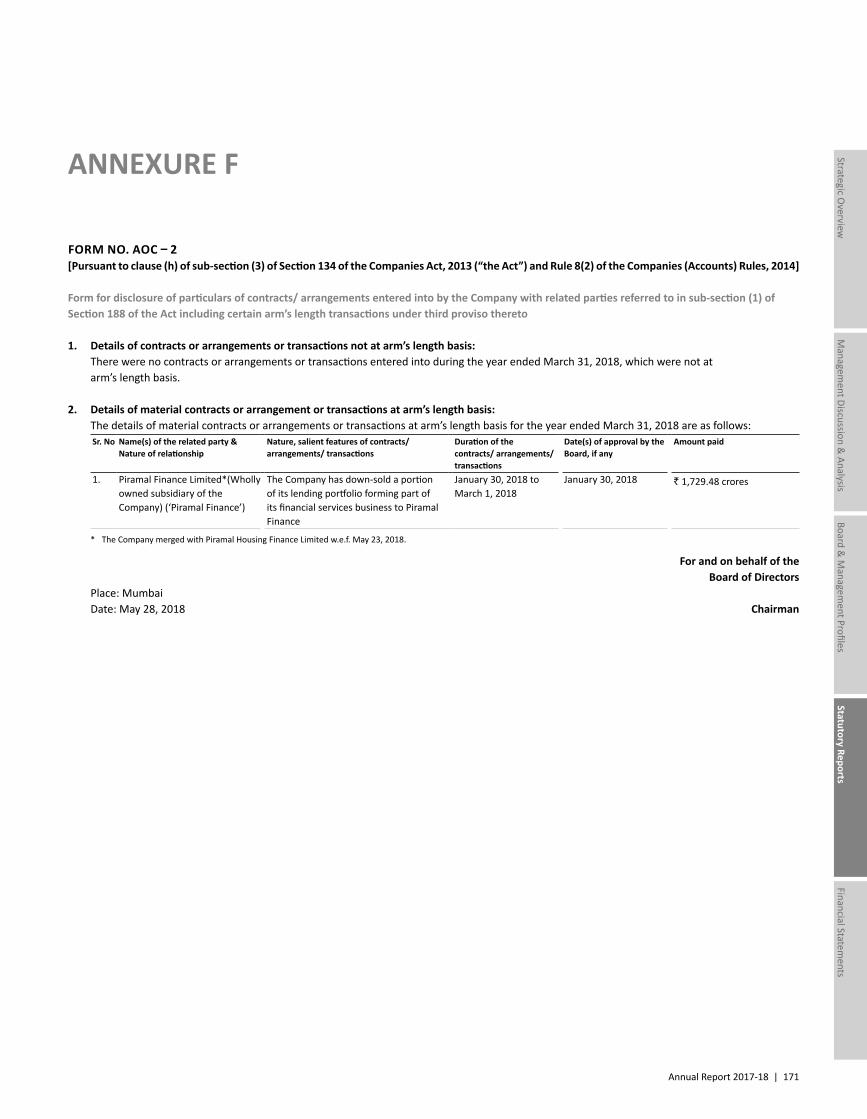
Annual Report 2017-18 | 171
Managem
ent Discussion & Analysis
Strategic Overview
Board &
Managem
ent ProfilesStatutory Reports
Financial Statements
ANNEXURE F
FORM NO. AOC – 2[Pursuant to clause (h) of sub-section (3) of Section 134 of the Companies Act, 2013 (“the Act”) and Rule 8(2) of the Companies (Accounts) Rules, 2014]
Form for disclosure of particulars of contracts/ arrangements entered into by the Company with related parties referred to in sub-section (1) of Section 188 of the Act including certain arm’s length transactions under third proviso thereto
1. Details of contracts or arrangements or transactions not at arm’s length basis: There were no contracts or arrangements or transactions entered into during the year ended March 31, 2018, which were not at
arm’s length basis.
2. Details of material contracts or arrangement or transactions at arm’s length basis: The details of material contracts or arrangements or transactions at arm’s length basis for the year ended March 31, 2018 are as follows:
Sr. No Name(s) of the related party & Nature of relationship
Nature, salient features of contracts/ arrangements/ transactions
Duration of the contracts/ arrangements/ transactions
Date(s) of approval by the Board, if any
Amount paid
1. Piramal Finance Limited*(Wholly owned subsidiary of the Company) (‘Piramal Finance’)
The Company has down-sold a portion of its lending portfolio forming part of its financial services business to Piramal Finance
January 30, 2018 to March 1, 2018
January 30, 2018 ` 1,729.48 crores
* The Company merged with Piramal Housing Finance Limited w.e.f. May 23, 2018.
For and on behalf of theBoard of Directors
Place: MumbaiDate: May 28, 2018 Chairman
172 | Piramal Enterprises Limited
ANNEXURE G
To,The Members,Piramal Enterprises Limited
Our report of even date is to be read along with this letter.
1. Maintenance of Secretarial records is the responsibility of the Management of the Company. Our responsibility is to express an opinion on these Secretarial records based on our audit.
2. We have followed the audit practices and processes as were appropriate to obtain reasonable assurance about the correctness of the contents of the Secretarial records. The verification was done on test basis to ensure that correct facts are reflected in the Secretarial records. We believe that the processes and practices, we followed provide a reasonable basis for our opinion.
3. We have not verified the correctness and appropriateness of financial records and Books of Account of the Company.
4. Where ever required, we have obtained the Management representation about the compliance of Laws, Rules and Regulations and happening of events, etc.
5. The compliance of the provisions of Corporate and other applicable Laws, Rules, Regulations, standards is the responsibility of the Management. Our examination was limited to the verification of procedures on test basis.
6. The Secretarial Audit report is neither an assurance as to the future viability of the Company nor the efficacy or effectiveness with which the Management has conducted the affairs of the Company.
For N.L. Bhatia & AssociatesUIN: P1996MH055800
Practicing Company Secretaries
N.L. BhatiaManaging Partner
Place: Mumbai FCS No: 1176Date: May 28, 2018 CP No.: 422
Annual Report 2017-18 | 173
Managem
ent Discussion & Analysis
Strategic Overview
Board &
Managem
ent ProfilesStatutory Reports
Financial Statements
To,The Members,Piramal Enterprises Limited
We have conducted the Secretarial Audit of the compliance of applicable statutory provisions and the adherence to good corporate practices by Piramal Enterprises Limited (herein after called ‘the Company’). Secretarial Audit was conducted in a manner that provided us a reasonable basis for evaluating the corporate conducts/statutory compliances and expressing our opinion thereon.
Based on our verification of the Company’s books, papers, minute books, forms and returns filed and other records maintained by the Company and also the information provided by the Company, its officers, agents and authorized representatives during the conduct of Secretarial Audit, we hereby report that in our opinion, the Company has, during the audit period covering the financial year ended on March 31, 2018 complied with the statutory provisions listed hereunder and also that the Company has proper Board-processes and compliance-mechanism in place to the extent, in the manner and subject to the reporting made hereinafter:
We have examined the books, papers, minute books, forms and returns filed and other records maintained by the Company for the financial year ended on March 31, 2018 according to the provisions of:
i. The Companies Act, 2013 (‘the Act’) and the Rules made thereunder;
ii. The Securities Contracts (Regulation) Act, 1956 (‘SCRA’) and the Rules made thereunder;
iii. The Depositories Act, 1996 and the Regulations and Bye-laws framed thereunder;
iv. Foreign Exchange Management Act, 1999 (‘FEMA’) and the Rules and Regulations made thereunder to the extent of Foreign Direct Investment, Overseas Direct Investment and External Commercial Borrowings;
v. The following Regulations and Guidelines prescribed under the Securities and Exchange Board of India Act, 1992 (‘SEBI Act’):-
a. The Securities and Exchange Board of India (Substantial Acquisition of Shares and Takeovers) Regulations, 2011;
b. The Securities and Exchange Board of India (Prohibition of Insider Trading) Regulations, 2015;
c. The Securities and Exchange Board of India (Issue of Capital and Disclosure Requirements) Regulations, 2009;
SECRETARIAL AUDIT REPORT FOR THE FINANCIAL YEAR ENDED MARCH 31, 2018[Pursuant to section 204(1) of the Companies Act, 2013 and Rule No.9 of the Companies (Appointment and Remuneration of Managerial Personnel) Rules, 2014]
d. The Securities and Exchange Board of India (Share Based Employee Benefits) Regulations, 2014;
e. The Securities and Exchange Board of India (Issue and Listing of Debt Securities) Regulations, 2008;
f. The Securities and Exchange Board of India (Registrars to an Issue and Share Transfer Agents) Regulations, 1993 regarding the Act and dealing with client;
g. The Securities and Exchange Board of India (Delisting of Equity Shares) Regulations, 2009;- Not Applicable for the financial year ended March 31, 2018;
h. The Securities and Exchange Board of India (Buyback of Securities) Regulations, 1998;-Not Applicable for the financial year ended March 31, 2018; and
i. The Securities and Exchange Board of India (Listing Obligations and Disclosure Requirements) Regulations, 2015.
Amongst the various laws which are applicable to the Company, following are the laws which are specifically applicable to the Company:
i. Central Goods and Services Tax Act, 2017
ii. Integrated Goods and Services Tax Act, 2017
iii. Drugs and Cosmetics Act, 1940 and Drugs and Cosmetics Rules, 1940
iv. Drugs (Price Control) Order, 2013
v. Pharmaceutical Policy, 2002
vi. Good Clinical Practice Guidelines
vii. NABL Accreditation India Requirements
viii. Foods Standard & Safety Act (FSSA), 2006, Food Safety and Standards Rules, 2011, Food Safety and Standards (Licensing and Registration of Food Businesses), Regulations, 2011
ix. The Narcotic Drugs and Psychotropic Substances Act, 1985
x. The Legal Metrology Act & Legal Metrology (Packaged Commodities) Rules, 2011
174 | Piramal Enterprises Limited
xi. The Drugs and Magic Remedies (Objectionable Advertisements) Act, 1954 and Rules, 1955
xii. Gujarat Special Economic Zone Act, 2004
xiii. Maharashtra Prohibition Act, 1949 (Bombay Act No. XXV of 1949)
xiv. Tamil Nadu Spirituous Preparations (Control) Rules, 1984
xv. National Ambient Air Quality Standards (NAAQS), 2009
xvi. Hazardous Wastes (Management, Handling and Transboundary Movement) Rules, 2008
xvii. Manufacture, Storage and Import of Hazardous Chemical Rules, 1989
xviii. Bio-Medical Waste (Management and Handling) Rules, 1998
xix. The Chemical Weapons Convention Act, 2000
xx. Ozone Depleting Substance (R&C) Rules, 2000
xxi. Maharashtra Non-Biodegradable Wastes Act, 2006
We have also examined compliance with the applicable clauses of the Secretarial Standards issued by The Institute of Company Secretaries of India (ICSI)
During the period under review the Company has complied with the provisions of the Act, Rules, Regulations, Guidelines, Standards, etc. mentioned above.
We further report that, The Board of Directors of the Company is duly constituted with proper balance of Executive Directors, Non-Executive Directors and Independent Directors. The changes in the composition of Board of Directors that took place during the period under review were carried out in compliance with the provisions of the Act.
Adequate notice is given to all directors to schedule the Board Meetings and Board Committee Meetings, agenda and detailed notes on agenda were sent at least seven days in advance, and a system exists for seeking and obtaining further information and clarifications on the agenda items before the meeting and for meaningful participation at the meeting.
Majority decision is carried through while the dissenting members’ views are captured and recorded as part of the minutes where applicable. All the decisions at the Board Meetings were passed unanimously and with requisite majority in General Meetings.
We further report that, there are adequate systems and processes in the Company commensurate with the size and operations of the Company to monitor and ensure compliance with applicable laws, Rules, Regulations and Guidelines. All the notices and orders received by the Company pursuant to the abovementioned laws have been adequately dealt with/ duly replied/ complied with.
We further report that, during the period under review,
a. The Administrative Committee at its meeting held on October 25, 2017 approved the allotment of 4,64,330 Compulsory Convertible Debentures (‘CCDs’) of face value of ` 1,07,600/- each to Qualified Institutional Buyers aggregating to ` 4,99,619. 08 Lakhs.
b. The Administrative Committee at its meeting held on November 24, 2017 approved the allotment of 2,25,000 equity shares of ̀ 2/- each at a conversion premium of ` 2,688/- per share pursuant to conversion of 5,625 CCDs of face value of ` 1,07,600/- each aggregating to ` 60,52,50,000/-
c. The Committee of Directors (Rights Issue), at its meeting held on March 8, 2018, considered and approved the allotment of 74,85,574 equity shares of face value of ` 2/- each at an issue price of ` 2,380/- per equity share including a premium of ` 2,378/- per equity share.
d. The Company has transferred the Financial Business of the Company to Piramal Finance Limited (erstwhile Piramal Finance Private Limited), wholly owned subsidiary of the Company. Since the proposed transaction was less than 20% of the net value of the financial services business in the books of the Company as at the last financial year, no other approvals were required.
e. The Members, at the Annual General Meeting held on August 1, 2017, approved and authorised the Board to:
e.1 Issue secured / unsecured redeemable non-convertible debentures (NCDs) on private placement, up to an aggregate amount which shall be within the overall borrowing limit approved by the shareholders under Section 180(1)(c) of the Companies Act, 2013.
f. Pursuant to the approval under clause e.1 above, the Administrative Committee has allotted:
f.1 1,250 rated, listed, redeemable, unsecured NCDs of the nominal value of ` 10,00,000 each aggregating to ` 125 crores; and
f.2 22,900 rated, listed, redeemable, secured NCDs of the nominal value of ` 10,00,000 each aggregating to ` 2,290 crores.
For N.L. Bhatia & AssociatesUIN: P1996MH055800
Practicing Company Secretaries
N.L. BhatiaManaging Partner
Place: Mumbai FCS No: 1176Date: May 28, 2018 CP No.: 422
Annual Report 2017-18 | 175
Managem
ent Discussion & Analysis
Strategic Overview
Board &
Managem
ent ProfilesStatutory Reports
Financial Statements
ANNEXURE H
CERTIFICATE ON CORPORATE GOVERNANCE
To,The Members ofPiramal Enterprises Limited
We have examined all the relevant records of Piramal Enterprises Limited (“the Company”) for the purpose of certifying compliance of the conditions of the Corporate Governance under Chapter IV to the Securities and Exchange Board of India (Listing Obligations And Disclosure Requirements) Regulations, 2015 (Listing Regulations) for the period from April 01, 2017 to March 31, 2018. We have obtained all the information and explanations which to the best of our knowledge and belief were necessary for the purpose of certification.
The compliance of conditions of Corporate Governance is the responsibility of the Management. Our examination was limited to procedures and implementation process adopted by the Company for ensuring the compliance of the conditions of the Corporate Governance. This certificate is neither an audit nor an expression of opinion on the financial statements of the Company.
In our opinion and to the best of our information and according to the explanations and information furnished to us, we certify that the Company has complied with all the conditions of Corporate Governance as stipulated in the said Listing Regulations.
We further state that such compliance is neither an assurance as to the future viability of the Company nor the efficiency or effectiveness with which the Management has conducted the affairs of the Company.
For N.L. Bhatia & AssociatesUIN: P1996MH055800
Practicing Company Secretaries
N.L. BhatiaManaging Partner
Place: Mumbai FCS No: 1176Date: May 28, 2018 CP No.: 422
176 | Piramal Enterprises Limited
BUSINESS RESPONSIBILITY REPORT
SECTION A: GENERAL INFORMATION ABOUT THE COMPANY1. CorporateIdentityNumber(CIN)oftheCompany: L24110MH1947PLC005719
2. NameoftheCompany: Piramal Enterprises Limited
3. Registered Address: Piramal Ananta, Agastya Corporate Park, Opposite Fire Brigade,
Kamani Junction, Kurla (West), Mumbai – 400 070 (former registered address: Piramal Tower, Ganpatrao Kadam Marg, Lower Parel, Mumbai - 400 013).
4. Website: www.piramal.com
5. E-mailID: [email protected]
6. FinancialYearReported: Financial year 2017-18
7. Sector(s)thattheCompanyisengagedin(industrialactivitycode-wise):
210: Manufacturing of pharmaceuticals, medicinal, chemical and botanical products
649: Other Financial service activities, except insurance and pension funding
8. Listthreekeyproducts/servicesthattheCompanymanufactures/provides(asinbalancesheet)
– Pharmaceutical – Financial Services – Healthcare Insight and Analytics
9. TotalnumberoflocationswherebusinessactivityisundertakenbytheCompany:
i. Number of International Locations: We have 7 locations of which 2 are in UK, 4 are in USA and 1 in Canada
ii. Number of National Locations: We have 9 locations spread across Mumbai (3) & Mahad (1) in Maharashtra, Pithampur (1) in Madhya Pradesh, Digwal (1) in Telangana, Chennai (1) in Tamil Nadu and Ahmedabad (2) in Gujarat
10. MarketsservedbytheCompany–Local/State/National/International:
We serve Local/State/National/International markets.
SECTIONB:FINANCIALDETAILSOFTHECOMPANY
1. Paid-UpCapital(`) ` 36.05 Crores
2. TotalTurnover(`) ` 3,296.95 Crores
3. TotalProfitafterTaxes(`) ` 518.47 Crores
4. TotalSpendingonCorporateSocialResponsibility(CSR)aspercentageofProfitafterTax(%)
` 28.31 Crores (5.5% of PAT)
5. Listofactivitiesinwhichtheexpenditurein4abovehasbeenincurred:
a) Children Education b) Youth Leadership c) Women Empowerment d) Healthcare e) Rural Development f) Donation
SECTIONC:OTHERDETAILS1. DoestheCompanyhaveanySubsidiaryCompany/Companies? Yes, PEL has subsidiary companies in India and overseas.
2. DotheSubsidiaryCompany/CompaniesparticipateintheBusinessResponsibility(‘BR’)Initiativesoftheparentcompany?Ifyes,thenindicatethenumberofsuchsubsidiarycompany(s)
Subsidiary companies of PEL conduct their standalone BR initiatives. All of PEL’s CSR initiatives which are conducted through Piramal
Foundation, Piramal Foundation for Education Leadership (‘PFEL’), Piramal Udgam Data Management Solutions (‘Piramal Udgam’) and Piramal Swasthya Management Research Institute (‘Piramal Swasthya’) are included in this report. Apart from this all other initiatives are reported on a standalone basis.
(As of March 21, 2018, Piramal Foundation, PFEL, Piramal Udgam and Piramal Swasthya, the philanthropic arms of the Piramal Group which were subsidiaries/controlled entities of the Piramal Group became separate entities.)
3. Doanyotherentity/entities(e.g.Supplier,distributoretc.)thattheCompanydoesbusinesswith,participateintheBRinitiativesoftheCompany?Ifyes,indicatethepercentageofsuchentities?(Lessthan30%,30–60%andMorethan60%)
Yes, Less than 30%. Business Responsibility at PEL is not limited to the Company but
extends to our value chain partners. In its endeavour to create awareness on responsible business practices, PEL utilises various platforms to engage with its vendors and suppliers. ‘Creating Optimal and Responsible Environment’ (CORE) which is the Sustainability Drive at PEL is one such intervention wherein we encourage and enable our supply chain to implement sustainable business practices. Apart from this, we also conduct Suppliers Meet, through which we foster stronger relationships across the supply chain.
Annual Report 2017-18 | 177
Managem
ent Discussion & Analysis
Strategic Overview
Board &
Managem
ent ProfilesStatutory Reports
Financial Statements
SECTIOND:BRINFORMATION1. DetailsofDirector/DirectorsresponsibleforBR a) DetailsoftheDirector/Director'sresponsiblefor
implementationoftheBusinessResponsibilitypolicy/policiesName DIN Number DesignationMr. Vijay Shah 00021276 Executive Director
b) DetailsoftheBusinessResponsibilityHeadDIN Number (if applicable)
NA
Name Mr. Bharat LondheDesignation Head – Environment, Health and Safety, CorporateTelephone number 022 38023630E-mail ID [email protected]
2. Principle-wise(asperNVGs)BRPolicy/Policies a) Detailsofcompliance(ReplyinY/N)
No. Questions P1 P2 P3 P4 P5 P6 P7 P8 P91 Do you have policy/policies for… Y Y Y Y Y Y Y Y Y2 Has the policy been formulated in consultation with relevant
stakeholders? Y Y Y Y Y Y Y Y Y
All the policies have been formulated in consultation with the Management of the Company.
3 Does the policy conform to any national/international standards? If yes, specify? (50 words)
Y Y Y Y Y Y Y Y YThe policies are in line with the applicable national and international standards and compliant with the principles of the National Voluntary Guidelines (NVG).
4 Has the policy been approved by the Board?If yes, has it been signed by the MD/owner/CEO/appropriate Board Director?
Y Y Y Y Y Y Y Y YAll the policies have been approved by the Board and have been signed by the Executive Director responsible for implementation of BR policies.
5 Does the Company have a specified committee of the Board/ Director/Official to oversee the implementation of the policy?
PEL has appointed an Executive Director who is responsible for implementation of BR policies and a BR head to oversee the BR performance.
6 Indicate the link to view the policy online? Y Y Y Y Y Y Y Y YThe policies can be viewed on http://www.piramal.com/investors/policies-codes
7 Has the policy been formally communicated to all relevant internal and external stakeholders?
Y Y Y Y Y Y Y Y Y
8 Does the Company have in-house structure to implement its policy/policies?
Y Y Y Y Y Y Y Y Y
9 Does the Company have a grievance redressal mechanism related to the policy/policies to address stakeholders’ grievances related to policy/policies?
The queries regarding BR polices can be sent to [email protected]
10 Has the Company carried out independent audit/evaluation of the working of this policy by an internal or external agency?
Y Y Y Y Y Y Y Y Y
3. GovernancerelatedtoBR a) IndicatethefrequencywithwhichtheBoardofDirectors,
CommitteeoftheBoardorCEOtoassesstheBRperformanceoftheCompany.Within3months,3-6months,Annually,Morethan1year.
BR performance is reviewed annually by the Board of Directors.
b) DoestheCompanypublishaBRoraSustainabilityReport?Whatisthehyperlinkforviewingthisreport?Howfrequentlyitispublished?
Yes, the Business Responsibility Report has been published along with annual report of PEL for Financial year 2017-18. Previous report can be viewed at: https://bit.ly/2lDxOUR www.piramal.com/assets/pdf/financial_annual_reports/Piramal-AR2017-Final-For-Web.pdf
SECTION E: PRINCIPAL WISE PERFORMANCEPrinciple 1: Businesses should conduct and govern themselves with Ethics, Transparency and Accountability1. Doesthepolicyrelatingtoethics,briberyandcorruptioncover
onlytheCompany?Yes/No.DoesitextendtotheGroup/JointVentures/Suppliers/Contractors/NGOs/Others?
No, coverage of the policies on ethics, bribery and corruption is not limited to the Company. PEL carries a rich legacy built on the core values of Knowledge, Action, Care & Impact. Our philosophy of ‘Doing Well and Doing Good’ steers our way ahead as a responsible corporate. Ethics and integrity is at the very heart of the work culture at PEL. The PEL Code of Conduct for Board of Directors, PEL Code of Conduct for Senior Management as well as the PEL Vigil Mechanism and Whistle Blower Policy ensure that highest standards of personal and professional integrity are maintained within the organisation. These policies lay down the guiding principles with
178 | Piramal Enterprises Limited
respect to issues such as conflict of interest, unethical conduct, abuse of authority etc. It also defines duties of the senior management and the Board in order to maintain a healthy work culture. Our culture also trickles down through our value chain and we are guided by our purpose to identify the right partners to create mutual, enduring value. The Business Code for Contractors is a mechanism to ensure that all vendors and sub-vendors associated with PEL comply with the norms of the Company.
2. Howmanystakeholdercomplaintshavebeenreceivedinthepastfinancialyearandwhatpercentagewassatisfactorilyresolvedbythemanagement?Ifso,providedetailsthereof,inabout50wordsor so.
In the reporting period there were 2 cases pertaining to conflict of interest which were raised. These matters were related to Vendors associated with PEL. The cases were investigated thoroughly and resolved.
No complaints under PEL Vigil Mechanism were received during the year.
Principle 2: Businesses should provide goods and services that are safe and contribute to sustainability throughout their life cycle1. Listupto3productsorserviceswhosedesignhasincorporated
socialorenvironmentalconcerns,risks,and/oropportunities. At PEL we believe in delivering the finest innovations to our
customers. The products which have incorporated environmental or social concerns, risks and opportunities in design are:
a) Trazadone b) Mebeverine Hydrogen Chloride c) Vitamins
2. Foreachproduct,providethefollowingdetailsinrespectofresources(energy,water,rawmaterialetc.)perunitofproduct.
(i) Reductionduringsourcing/production/distributionachievedsincethepreviousyearthroughoutthevaluechain?
(ii) Reductionduringusagebyconsumers(energy,water)hasbeenachievedsincethepreviousyear?
Resource optimisation to reduce environmental footprint is one of the significant focus areas that drives innovation in the manufacturing of products at PEL.
a) Trazadone An antidepressant medication used to treat major
depressive disorders, anxiety disorders and alcohol dependence. It is a phenylpiperazine compound of the serotonin antagonist and reuptake inhibitor (SARI) class.
Significant capacity enhancement was achieved by debottlenecking equipment and increased capacity by 77% from 4.5 to 8 MT per month which helped in reducing power and fuel cost.
b) Mebeverine HCl An anti-spasmodic medication used to treat Irritable
Bowel Syndrome (IBS), relapsing disorder characterised by abdominal pain/discomfort and altered bowel habits.
Intestinal motility impairment and visceral hypersensitivity are the key factors among its multifactorial pathogenesis, both of which require effective treatment.
Significant process improvements have been done to enhance the capacity of Mebeverine HCl, which have reduced power and fuel cost.
c) Vitamins Vitamins are organic compounds and vital nutrients that
an organism requires in limited amounts. Vitamins have been produced as commodity chemicals and made widely available as inexpensive semisynthetic and synthetic-source multivitamin dietary and food supplements and additives.
Significant improvements have been done in manufacturing this API (Active Pharmaceutical Ingredient), Vitamin A Palmitate Solvent Hexane recovery improved by 14 % and eliminated IPA (Isopropyl Alcohol) which helped in reducing raw material consumption, power and fuel cost.
3. DoestheCompanyhaveproceduresinplaceforsustainablesourcing(includingtransportation)?Ifyes,whatpercentageofyourinputswassourcedsustainably?Providedetailsthereof,inabout50wordsorso.
Yes, sustainability at PEL extends to our supply chain partners and we encourage them to implement practices that optimise operations. Supply Chain at PEL, is guided by the Sustainable Procurement Policy as well as the Standard Operating Process (SOP) for procurement process which is based on inclusive growth and goes beyond income to involve capacity building. CORE is a Corporate programme launched in the reporting period which is inclusive of our supply chain partners. This fiscal marks the preliminary phase of the programme wherein we set the context of Green Procurement and EHS amongst our vendors. Certain activities with respect to avoiding unsafe working conditions as well as reducing carbon footprint have been conceptualised for our vendor base which will be monitored. The vendor evaluation process is a comprehensive exercise that assesses design, materials, manufacturing process, production, logistics, service delivery, operations, maintenance, recycling and disposal. Upto 60% of our materials are sourced sustainably.
4. HastheCompanytakenanystepstoprocuregoodsandservicesfromlocal&smallproducers,includingcommunitiessurroundingtheirplaceofwork?Ifyes,whatstepshavebeentakentoimprovetheircapacityandcapabilityoflocalandsmallvendors?
Yes, local sourcing is an important facet of sustainable procurement and we take efforts to encourage and enable our suppliers to meet quality norms and standards. Proximity to our operations makes logistical sense to our business and provides a mutual benefit to the local suppliers. Thus, our packing materials, commodity items, raw materials are sourced primarily from the local small producers.
Annual Report 2017-18 | 179
Managem
ent Discussion & Analysis
Strategic Overview
Board &
Managem
ent ProfilesStatutory Reports
Financial Statements
In order to streamline and ensure that processes are in place our suppliers are audited regularly. During these audits and other visits we discuss with the vendors on upgrading the facility, the process, recycling, disposal and ETP requirements. Suppliers are given recommendations and suggestions to comply with. The technology function assists in making processes more efficient, improve yields and recover solvents. Through Creating Optimal and Responsible Environment ("CORE"), we engaged with vendors for Environmental Sustainability Initiatives. During supplier meets we focus on EHS interventions and relevant expectations from our suppliers.
5. DoestheCompanyhavemechanismtorecycleproductsandwaste?Ifyes,whatisthepercentageofrecyclingwasteandproducts?
Yes, PEL has a mechanism to recycle wastes generated. Being in the pharmaceutical sectors, recycled products cannot be used in production as only virgin materials can be used for production.
About 20% of all wastes are recycled as follows:
– Solvents: These materials are sent to solvent recyclers who are authorised by the Pollution Control Board to treat such materials. We have a large vendor base for solvents in order to avoid storage of solvents.
– Fly ash is sent to brick manufacturers as raw material in the mix which is later added in pavement blocks or used for road development.
– Metal waste generated as scrap is sold to authorized vendors, for recycling.
– Paper waste is sent to authorized dealers for recycling.
Principle 3: Businesses should promote the wellbeing of all employees1. Pleaseindicatethetotalnumberofemployees PEL has a total of 3832 employees as on March 31, 2018.
2. Pleaseindicatethetotalnumberofemployeeshiredontemporary/contractual/casualbasis
PEL hired 1385 employees on temporary/contractual/casual basis for the year 2017-18.
3. Pleaseindicatethenumberofpermanentwomenemployees PEL has 317 permanent women employees as on March 31, 2018.
4. Pleaseindicatethenumberofpermanentemployeeswithdisability
PEL has 4 permanent employees with disability as on March 31, 2018.
5. Doyouhaveanemployeeassociationthatisrecognisedbymanagement?
Yes, we have recognized trade unions at Pithampur, Digwal & Mahad sites.
6. Whatpercentageofyourpermanentemployeesareamemberofthisrecognizedemployeeassociation?
At PEL, 16% of permanent employees are members of recognized employee associations.
7. PleaseindicatetheNumberofcomplaintsrelatingtochildlabour,forcedlabour,involuntarylabour,sexualharassmentinthelastfinancialyearandpending,asontheendofthefinancialyear.
Neither does the Company have any child labour, forced labour and involuntary labour nor does it tolerate sexual harassment. PEL has a robust grievance handling mechanism to address the cases against child labour, forced labour, sexual harassment and others. PEL is very firm on these issues and incase any violation is found, strict action is taken by the Company.
Category No. of complaints during financial year
No. of complaints pending at the end of the financial year
Child Labour/Forced Labour/Involuntary Labour
Nil Nil
Sexual Harassment 1 0Discriminatory employment
Nil Nil
8. Whatpercentageofyourundermentionedemployeesweregivensafety&skillupgradationtraininginthelastyear?
We at PEL, emphasise on staying well-informed and encourage capability and knowledge building at work. A plethora of training programmes are conducted to enhance various skill sets amongst our employees. Piramal Learning University (PLU) is the central training platform for the entire group providing behavioural and functional training programmes as needed.
Employee category % Employees that were given safety training
% Employees that were given skill upgradation training
Permanent employees 100% 95%Number of Temporary/ contractual/casual Employees
100% 70%
Number of permanent women employees
100% 100%
Number of employees with disabilities
100% 100%
At PEL we are committed to creating a robust succession pipeline through impactful development programmes:
PEL Talent function was constituted with an objective "to grow our own leaders" and ensure "every critical role has a ready successor identified and groomed". To support this vision, the SUMMIT, ASCEND and IGNITE programmes were launched to identify and develop high potential talent across senior, mid and junior levels by PEL. We aspire to have 60% of our open positions at senior and mid management staffed by internal promotions of high potentials in a 3 year time frame.
180 | Piramal Enterprises Limited
At entry level, we aim to augment the talent pipeline with fresh, high quality external talent and groom them to take on larger leadership roles. At junior, middle and senior management levels, we aim to strengthen our focus on systematically identifying our high potentials, offering focused development opportunities for them and facilitating internal talent movements across PEL.
Principle 4: Businesses should respect the interests of, and be responsive to the needs of all stakeholders, especially those who are disadvantage, vulnerable, and marginalised.1. HastheCompanymappeditsinternalandexternalstakeholders?
Yes/No Yes, PEL has mapped its internal and external stakeholders.
Our stakeholders both internal and external, play a significant role in expressing our values, carrying out our mission, developing strategies, implementing processes and fostering long-term relationships.
Internal and external stakeholders mapped are: Employees Customers Shareholders Investors Regulatory bodies Suppliers Vendors Distributors CSR beneficiaries Governments Knowledge partners
2. Outoftheabove,hastheCompanyidentifiedthedisadvantaged,vulnerable&marginalisedstakeholders?
Yes, PEL has identified disadvantaged, vulnerable and marginalized stakeholders as follows:
Young mothers Adolescent girls Infants, neonates and children under 5 years Pregnant women in tribal setups Beneficiaries of age group 30-60 years who are already
suffering from diabetes and/or hypertension or are at a risk of such diseases
Students studying in government schools
3. ArethereanyspecialinitiativestakenbytheCompanytoengagewiththedisadvantaged,vulnerableandmarginalizedstakeholders?Ifso,providedetailsthereof,inabout50wordsorso.
Yes, special initiatives are taken by the Company to engage with the disadvantaged, vulnerable and marginalized stakeholders. Details of these initiatives are as follows:
1. Healthcare: a) For young mothers, adolescent girls, infants, neonates,
children under 5 years, pregnant women in tribal setups
and beneficiaries of age-group 30-60 years who are already suffering from diabetes and hypertension or have a risk of having such diseases:
Provision of Service: Healthcare facilities are made available and accessible to remote and vulnerable populations through cost effective technology based solutions.
Extending Government reach: Our solutions like Remote Health Advisory and Intervention Services and community outreach models are complementing and supplementing the Government Healthcare system.
Information, Education and Communication: Awareness regarding the services is provided in the communities by door to door interaction, through ASHAs (Accredited Social Health Activities) / ANMs (Auxiliary Nurse Midwifery) and other community volunteers.
Community involvement: Pregnant women and family members are also being educated on healthy practices and nutrition, immunisation and nearest health facilities available.
b) We conduct awareness sessions for community leaders and influential leaders on services provided by Piramal Swasthya as well as healthy practices to be followed and encourage them to motivate the community (including mothers, young children, etc.) to avail the services.
c) Training and capacity building is provided to ASHAs, ANMs, Government/Non-Government field staff for service delivery on field.
2. Education:
For education officials: The engagement initiatives include personal, instructional, organization and social leadership, process re-engineering, identification of needs to technology, solutions to improve efficiency in education administration.
For school heads: In addition to personal, instructional, organization and social leadership, the engagement initiatives include school development planning, capacity building of school staff as well as holding dialogues with community members, etc.
For school teachers: These initiatives involve classroom teaching plans and identifying scope of improvement areas in classroom teaching delivery.
For parents and community members: These initiatives focus on understanding the importance of education and relevance of government schools as well as getting involved in school development activities.
Annual Report 2017-18 | 181
Managem
ent Discussion & Analysis
Strategic Overview
Board &
Managem
ent ProfilesStatutory Reports
Financial Statements
Principle 5: Businesses should respect and promote human rights1. DoesthepolicyoftheCompanyonhumanrightscoveronly
thecompanyorextendtotheGroup/JointVentures/Suppliers/Contractors/NGOs/Others?
Yes, the Code of Conduct at PEL incorporates clauses on human rights as part of the annexure which is applicable to all group companies/suppliers/vendors/NGOs associated with PEL.
We at PEL respect the dignity of all individuals and communities and adhere to the principles of Human Rights.
The policy has been formulated so as to safeguard the interest of all individuals who are directly or indirectly associated with the Group. All the agreements with suppliers and vendors set out the minimum requirements of compliance with these clauses failing which PEL reserves the right to terminate any purchase or other agreement with the Contractor without incurring any liability towards the Contractor.
2. Howmanystakeholdercomplaintshavebeenreceivedinthepastfinancialyearandwhatpercentwassatisfactorilyresolvedbythemanagement?
There have been no complaints against breach of human rights aspects in the reporting period.
Principle 6: Business should respect, protect, and make efforts to restore the environment1. DoesthepolicyrelatedtoPrinciple6coveronlythecompanyor
extendtotheGroup/JointVentures/Suppliers/Contractors/NGOs/Others.
PEL strives to preserve environmental sustainability at all levels of operations – in its own practice and as a participant in the community. Policies that correspond to Principle 6 are:
Environment Health & Safety Policy Sustainable Development Policy
These policies are applicable to all employees including full-time, partial and contractual employees as well as our suppliers and vendors.
2. DoestheCompanyhavestrategies/initiativestoaddressglobalenvironmentalissuessuchasclimatechange,globalwarming,etc.?Y/N.Ifyes,pleasegivehyperlinkforwebpageetc.
Yes, PEL is cognizant of the catastrophic effects of continued depletion of natural resources and we believe in utilising our business intelligence in developing strategies to address these concerns. During the reporting period we took another stride in integrating sustainability in our business practices by launching ‘CORE – Creating Optimal and Responsible Environment’. CORE program forms the lynchpin of all the sustainability initiatives at PEL. A robust governance framework comprising a Governance Committee, Global Sustainability Coordinator, Site Sustainability Sponsor, Site Sustainability Lead and Site Sustainability Champions shall ensure effective implementation of various initiatives. Details on CORE can be found on our website: http://piramalpharmasolutions.com/environment-health-safety
Certain specific initiatives undertaken at PEL are as follows:
a) During the reporting period PEL continued implementation of a tree census programme to capture data regarding tree species and tree numbers.
b) Increasing carbon footprint being one of the most serious environmental concerns today, PEL has developed internal systems to capture scope 1 and 2 & Green House Gas (GHG) emissions. The emission sources are identified and GHG emissions are measured, managed and reported periodically. The methodology implemented for calculating the GHG emissions is the international accounting framework provided by the GHG Protocol.
c) In the last few years we at PEL have upgraded equipment and technology in order to reduce our carbon footprint effectively. Energy conservation and efficiency initiatives are the cornerstone of these initiatives. For instance, at our Pithampur plant an energy efficient centrifugal chiller has been installed. It operates on eco-friendly refrigerant and is capable of catering to peak requirements in future. This has resulted in reduced power consumption and minimum maintenance and operating costs.
d) With the aim to reinforce positive and safe behavior at the workplace and achieve our safety and health goals, Safety Week was organised in the office premises during the reporting period. The initiative included awareness programme on health & safety, safety training as well as fire drills and some initiatives for creating awareness among employees and their family members. At the corporate office, Emergency Responders were identified and trained on handling emergencies including fire, first-aid, rescue techniques and evacuation actions in case of emergencies.
3. DoestheCompanyidentifyandassesspotentialenvironmentalrisks?Y/N
Yes, climate change and environmental risks are identified as potential business risks at PEL posing threat to business continuity as well as important factors that can influence future growth plans. Erratic weather patterns, rising temperatures and extreme climate events disrupt logistics and raw material sourcing. Among other concerns are, the availability of energy and costs fluctuation. In the last three years, PEL has been capturing direct and indirect energy consumption data. An initiative was implemented to reduce fossil fuel consumption, such as agro briquette which is reducing the GHG emissions. Improving energy efficiency in the existing plants and its processes is also one of the key focus areas for the Company.
4. DoestheCompanyhaveanyprojectrelatedtoCleanDevelopmentMechanism?Ifso,providedetailsthereof,inabout50wordsorso.Also,ifYes,whetheranyenvironmentalcompliancereportisfiled?
No, so far we have not registered any projects under Clean Development Mechanism (CDM). However, under the CORE programme we have undertaken internal targets to reduce our water consumption, energy consumption, hydrocarbon usage as
182 | Piramal Enterprises Limited
well as implemented initiatives related to Green Chemistry and Life Cycle Assessment. We have taken several other initiatives to reduce our GHG emissions.
5. HastheCompanyundertakenanyotherinitiativeson–cleantechnology,energyefficiency,renewableenergy,etc.Y/N.Ifyes,pleasegivehyperlinkforwebpage,etc.
Yes, we established Energy Efficiency Guidelines to improve energy management and efficiency and utilise renewable energy technology. The Company continuously explores avenues for using alternate sources of energy keeping in mind several parameters including environment, production and cost efficiencies. In different site locations, PEL has taken several initiatives on clean technology, energy efficiency, renewable energy, etc.
The measures introduced by PEL for conservation of energy at its plant locations is contained in the Report on Conservation of Energy and Technology Absorption which forms part of the Board’s Report. The weblink to the same is:
http://piramal.com/investor/financial-reports/annual-reports
6. AretheEmissions/WastegeneratedbytheCompanywithinthepermissiblelimitsgivenbyCPCB/SPCBforthefinancialyearbeingreported?
Yes, PEL always monitors its waste generation limits and ensures that waste generation is within the permissible limits given by Central Pollution Control Board (CPCB)/State Pollution Control Board (SPCB).
7. Numberofshowcause/legalnoticesreceivedfromCPCB/SPCBwhicharepending(i.e.notresolvedtosatisfaction)asonendofFinancialYear.
PEL has no pending notices from CPCB/SPCB as on March 31, 2018.
Principle 7: Businesses, when engaged in influencing public and regulatory policy, should do so in a responsible manner1. IsyourCompanyamemberofanytradeandchamberor
association?IfYes,Nameonlythosemajoronesthatyourbusinessdealswith:
Yes, PEL is a member of various industry associations in India including:
All India Organisation of Chemists & Druggists – (AIOCD) Confederation of Indian Industry – (CII) Associated Chamber of Commerce and Industry – (ASSOCHAM) World Economic Forum Bulk Drug Manufacturers Association India National Safety Council Federation of Indian Chambers of Commerce & Industry –
(FICCI)
2. Haveyouadvocated/lobbiedthroughaboveassociationsfortheadvancementorimprovementofpublicgood? Yes/No;ifyesspecifythebroadareas(dropbox:GovernanceandAdministration,EconomicReforms,InclusiveDevelopment
Policies,Energysecurity,Water,FoodSecurity,SustainableBusinessPrinciples,Others)
Yes, PEL through its association with industrial chambers advocates issues related to societal causes. We work towards the advancement/improvement of public good through our CSR activities. The Senior Management represents PEL in various industry forums and is cognizant of the responsibility they shoulder as they engage in constructive dialogues and discussions. They ensure that they refrain from influencing public policy with vested interests.
Principle 8: Businesses should support inclusive growth and equitable development1. DoestheCompanyhavespecifiedprogrammes/initiatives/projects
inpursuitofthepolicyrelatedtoPrinciple8?Ifyesdetailsthereof. Yes, the Company has specified programmes in pursuit of the policy
related to Principle 8.
At PEL we believe that business growth is meaningful only when it is inclusive of the communities and environment that are associated with the corporate. Corporate Social Responsibility is the mainstay of our sustainability initiatives and is driven by our CSR policy. The major focus areas of our CSR initiatives include:
Healthcare Education Gender equality Environment sustainability Rural development Women empowerment
We encourage our workforce to actively participate in the CSR initiatives under the Employee Social Impact (ESI) programme. ESI is an effort within the Piramal Foundation, dedicated to inspire and nurture commitment to social responsibility at an individual level by creating opportunities for strategic volunteering for the employees of PEL. In FY 2017-18 the total number of volunteering hours contributed through our employees were 41,613.
2. Aretheprogrammes/projectsundertakenthroughin-houseteam/ownfoundation/externalNGO/governmentstructures/anyotherorganization?
CSR initiatives have been primarily conceptualised or driven by our in-house CSR team, till March 21, 2018. However, these initiatives may be undertaken by PEL either directly by itself or through any of the following entities that have been established and may be established by it:
a) Any one or more companies established by the Company or its subsidiary or associate company under Section 8 of the Companies Act, 2013.
b) Registered Trust
c) Registered Society
Annual Report 2017-18 | 183
Managem
ent Discussion & Analysis
Strategic Overview
Board &
Managem
ent ProfilesStatutory Reports
Financial Statements
CSR initiatives under PEL conducted through Piramal Foundation, PFEL, Piramal Udgam and Piramal Swasthya are included in this Report.
(As mentioned previously, from March 21, 2018, Piramal Foundation, PFEL, Piramal Udgam and Piramal Swasthya which were subsidiaries/controlled entities of the Piramal Group became separate entities.)
Our associations with respect to specific initiatives are as follows: Remote Health Advisory & Intervention Services – Government
bodies Community Outreach Programme (Mobile Medical Vans) –
Government bodies, External NGOs Telemedicine – Piramal Swasthya, Government bodies, External
NGOs ASARA Tribal Health Program – Piramal Swasthya DESH (Cancer Screening Program) – Piramal Swasthya AMRIT - Piramal Swasthya District Transformation Programme – PFEL State Transformation Programme – PFEL School Leadership Development Program – PFEL
3. Haveyoudoneanyimpactassessmentofyourinitiative? Yes, impact assessment of a number of CSR initiatives is conducted
at PEL. The initiatives are designed to be high impact solutions and endeavor to positively impact the programme indicators at the community level. Programmes under healthcare are tracked for performance through beneficiary registrations, number of consultations provided and individual patient disease management through personalised patient care. Improvement in health education and status of the beneficiaries is also measured through healthy practices, increase in number of institutional deliveries, visits made to health facility centres which is finally leading to reduction in Maternal Mortality and Infant Mortality Rates (MMR and IMR) in the target regions. Third party Assessments and advanced analytical engines help lead the journey for desired outcomes.
4. WhatisyourCompany’sdirectcontributiontocommunitydevelopmentprojectsAmountin`andthedetailsoftheprojectsundertaken
The total CSR expenditure for FY 2017-18 was ` 28.31 Crores
A] Healthcare:Piramal Swasthya endeavours to bridge the last mile gap in primary healthcare service delivery through its innovative solutions. It is one of the largest implementer of Public Private Partnerships (PPP) programmes in India and has a presence across 13 states with a strong workforce of more than 3,600 that comprises 450 doctors and specialists. The existing collaboration with various corporates and public sector organisations is increasing the reach and deepening the traction within communities, thereby impacting beneficiaries on a large scale.
1. RemoteHealthAdvisory&InterventionServices Remote Health Advisory & Intervention Service provides
24x7 health helpline providing healthcare advice to beneficiaries anywhere in a given state. ‘104’ toll free helpline service is a 24x7 contact centre that aims to
reduce the minor ailment load on the public health system by offering medical information and advice virtually.
A patient can avail counselling services, request directory information like list of hospitals and services offered and can lodge a complaint against any public health system facility. Comprehensive health information related to HIV/AIDS and Sexually Transmitted Infections (STIs), professional counselling services are also provided as part of Piramal Swasthya’s 1097 HIV/AIDS Helpline which is also India’s first multilingual HIV/AIDS counselling helpline.
2. CommunityOutreachProgram(MobileMedicalVans) Mobile Medical Units as part of Community Outreach
Program aim at tackling barriers faced by rural people in accessing primary healthcare. As part of this day mobile outreach, medical vans with doctors and paramedic team visit a community/village at a regular frequency, conduct diagnostic and lab testing and test reports are uploaded to the Electronic Health Record in real time. Mobile vans are equipped with medical devices, medicines and health workers and are deployed to the remotest rural and tribal villages with no access to public healthcare system. Each beneficiary is provided a Unique Identification Number and Electronic Health Record is created, which helps immensely in clinical management of diseases and conditions.
In addition, the mobile health services are also operated as a CSR intervention for several public sector and private sector organizations e.g.: Department of Atomic Energy in Karnataka, Infrastructure Leasing & Financial Services Limited, Bokaro Power Supply Company Private Limited in Jharkhand, etc. These services aim at enabling access to primary healthcare to the employees and their families around their major manufacturing facilities and often cover tough terrains and far flung habitations with communities that are vulnerable and in need of quality healthcare services.
3. Telemedicine Telemedicine services offer specialist advice to the
remotest regions through wifi, fixed and/or wireless internet and video switch on open source platform. It focuses upon bringing much needed specialist healthcare to remote locations where there are very few or no health workers. Medically validated equipment and digital interface supported by our software provides an easy and accurate data flow between a patient in a remote location and the specialist operating in an urban area/city. Medical data required by the specialist doctor to understand the patient’s condition is uploaded to the software by trained paramedics from the patient’s end. Basis the test reports and information provided, the patient is advised through video conferencing and medicines are prescribed. The prescription is printed remotely at the patient’s end. In case of high risk cases, patient is referred to nearest public health facility.
184 | Piramal Enterprises Limited
4. ASARATribalHealthProgram This intervention caters to the tribal areas of Araku,
Andhra Pradesh called "ASARA" to combat the stubbornly high Maternal Mortality and Infant Mortality Rates (MMR/IMR) in the region. "ASARA" project is an initiative to provide free maternal healthcare services to the pregnant women in Araku Mandal through community outreach programme & specialist services. Started in 2010, ASARA is a unique model ending preventable deaths in extremely remote, hilly and difficult to access terrain of Araku valley, Andhra Pradesh. The model aims to provide access to specialist consultation in remotest of the areas where there is no or limited availability of healthcare resources.
The project has now been expanded to Paderu and Chintapalle mandals. The expansion aims to cover the 2.5 lakh-plus population, including women, children and adolescents in 1179 hard-to-reach habitations across the entire tribal belt of Visakhapatnam district, starting with Paderu and Chintapalle.
5. DESH(CancerScreeningProgramme) Our oral, breast and cervical cancer screening program
- D.E.S.H. is contributing to the overall reduction in cancer incidence in Assam. The state-of-the-art mobile cancer screening unit staffed by trained doctors, nurses and radiographers screens the local population for oral, breast and cervical cancer and refers positively diagnosed patients for further treatment.
6. AMRIT Accessible Medical Record via Integrated Technologies
("AMRIT") is an integrated platform which stores the patients’ medical records with unique beneficiary ID. This is a boon in primary healthcare as the beneficiaries will not have to worry about carrying their health records. AMRIT as a platform is built to capture data for ANC (Antenatal Care), PNC (Postnatal Care), NCD (Non-Communicable Diseases) including cervical, breast and oral cancer.
B] Education: Interventions that focus on educational needs in the various segments of society are as follows:
1. DistrictTransformation District Transformation Program aims to improve student
learning outcomes by strengthening teachers’ capabilities by building capacity of coaches and facilitators.
2. StateTransformationProgram State Transformation Program aims to transform state
education by developing a strong cadre of coaches & facilitators by developing leadership skills of District Managers.
3. SchoolLeadershipProgram The programme aims to improve student learning
outcome by developing leadership skills of school heads,
improving teaching skills of teachers and by engaging the community in school development process.
5. Haveyoutakenstepstoensurethatthiscommunitydevelopmentinitiativeissuccessfullyadoptedbythecommunity?Pleaseexplainin50words,orso.
Yes, PEL has undertaken steps to ensure that the community development initiatives are adopted successfully by the community. The details of these initiatives are as follows:
a) Healthcareprogrammes: The strength of Piramal Swasthya lies in its ‘beneficiary focus’
approach and ‘Sevabhav’ towards the cause without being sidetracked. Under the Remote Health Advisory & Intervention Services, our Information, Education and Communication activities create awareness regarding our services. Door to door interactions are conducted by our field staff for other healthcare programmes like Community Outreach Program – Mobile Medical Vans, ASARA Tribal Health Program and DESH-Cancer Screening Program.
Communities are made aware about telemedicine and specialists services through our community outreach program and with the help of ‘104’ helpline they are informed about tele-health services and their benefits.
B] Education Under the District Transformation Program, State
Transformation Program and School Leadership Program, the concerned stakeholders are given detailed orientation regarding the engagement/partnership to achieve a common purpose.
Principle 9: Businesses should engage with and provide value to their customers and consumers in a responsible manner1. Whatpercentageofcustomercomplaints/consumercasesare
pendingasontheendoffinancialyear? PEL values its consumers and their grievances are taken with utmost
seriousness. Our robust consumer products division is one-of-a-kind and also the pioneer in the pharmaceutical sector to initiate a 24x7 customer care center that is equipped with a fully functional automated routing and recording system. The system addresses both, queries and grievances of the stakeholders. The escalation matrix is designed to deliver resolution within a defined Turn Around Time (TAT). Our customer relationship model is essentially based on 2 approaches:
In-case of query: Customer Care Associate (CCA) is furnished with a robust and a dynamic FAQ (Frequently Asked Questions) to address the query. In case the query is not part of the FAQs, a revert confirmation is provided within 24 hrs to the stakeholder as per the escalation matrix. In-case of complaints: CCA records the complaint and collects the required data regarding the same to take corrective actions. In case of unsatisfactory response, a three level escalation matrix is developed to enable speedy and satisfactory response to the stakeholder.
Annual Report 2017-18 | 185
Managem
ent Discussion & Analysis
Strategic Overview
Board &
Managem
ent ProfilesStatutory Reports
Financial Statements
Both in case of query or complaint, a Customer Satisfaction (C-Sat) Score is obtained from the stakeholder to rate the experience level and consent is undertaken from the stakeholder for the complaint closure.
Less than 1% of the complaints/cases are pending as on the end of the financial year. These are the complaints/cases that were raised in the last quarter and are within resolution timeline.
2. Doesthecompanydisplayproductinformationontheproductlabel,overandabovewhatismandatedasperlocallaws?Yes/No/N.A./Remarks(additionalinformation)
Yes. The PEL consumer products division follows all applicable mandatory laws & regulations related to product information and labelling. The Company proactively displays the toll free consumer care number on the packaging of the product and regularly monitors it for any query or grievance. We provide information about product, usage instructions and precautions either on the product packaging or include patient information leaflet as part of our product packaging. Additional information is also communicated through means such as leaflets, etc.
3. IsthereanycasefiledbyanystakeholderagainsttheCompanyregardingunfairtradepractices,irresponsibleadvertisingand/oranti-competitivebehaviourduringthelastfiveyearsandpendingasonendoffinancialyear.Ifso,providedetailsthereof,inabout50 words or so.
There are no cases pending against PEL by any stakeholder regarding unfair trade practices, irresponsible advertising and/or anti-competitive behavior as on March 31, 2018.
4. DidyourCompanycarryoutanyconsumersurvey/consumersatisfactiontrends?
Yes.
PharmaceuticalDivision Customer Centricity is the evolution from being "Product centric"
to "Customer centric". At PEL, it is a function that focuses on the customer and what it takes to move beyond the reactive and into the proactive mode of operation by looking at ways to improve processes, communication and project management. Thus we are not only able to better understand and predict customer needs, but are also able to implement and leverage solutions that allow for automated and prompt insights about entire customer segments. We believe that we exist because our customer has a need for product or services to service end customers (patients).
We have instilled a robust feedback mechanism using NPS (Net Promoter Score) metrics. This helps us gauge customer loyalty and the first of its kind in CRAMS business.
We also measure CES (Customer Effort Score). This is the indicator of how much effort did the customer have to put to get his/her work done. Again, more positive CES score means that we have made it easy for our customers to get the services.
We have also implemented mechanism to generate Customer Experience (CX) Insights via voice of customer (VOC) which was designed & rolled out as a centralised automated customer satisfaction survey using AQSCI (Assurance, Quality, Service, Value, Innovation and People) model for all businesses on Qualtrics platform in line with the customer needs. Platform to improve CSI (such as Customer Satisfaction Index Score & reporting gaps, area ownership, action planning, etc.) designed and implemented. Customer involvement throughout the Customer Satisfaction process is a key differentiator, we validate our survey responses with the customer, develop a plan of action and close the feedback loop, involving customer at every stage.
We have made significant strides in our journey towards a customer centric culture with an emphasis on execution and scientific excellence while building an organization with a broad portfolio of services that appeal to our global customers. With our growth, investments and strong financials, our customers have now begun to view PEL as the ‘Partner-of-Choice’ for their external needs, from Discovery through Commercialisation.
Our Internal partner satisfaction survey is meant for internal functions i.e. for internal stakeholders or cross-functional customers. A comprehensive site wise analysis is done under the survey.
To address customer issues on call, the call quality is assessed in terms of technical issues understanding of the customer grievance, usage of correct language, listening to the grievance attentively as well as joining calls on time. Customer centricity workshops are conducted for customer facing teams to enhance their capabilities in running an efficient grievance cell.
ConsumerProductsDivision(CPD) At PEL, CPD consumer feedback and satisfaction is an important
metrics to gauge our performance as a consumer centric company. Consumer surveys are conducted in the form of a feedback mechanism for our services and are utilised to determine the satisfaction levels based on the C-Sat metrics. Consumer care focuses on giving timely resolutions to all the stakeholders and the consumers within the TAT.
186 | Piramal Enterprises Limited
STANDALONE FINANCIAL STATEMENTS
INDEPENDENT AUDITOR’S REPORT
To The Members of Piramal Enterprises Limited
Report on the Standalone Financial StatementsWe have audited the accompanying standalone financial statements of Piramal Enterprises Limited ("the Company"), which comprise the Balance Sheet as at March 31, 2018, and the Statement of Profit and Loss (including Other Comprehensive Income), the Statement of Changes in Equity and the Cash Flow Statement for the year then ended, and a summary of the significant accounting policies and other explanatory information.
Management’s Responsibility for the Standalone Financial StatementsThe Company’s Board of Directors is responsible for the matters stated in Section 134(5) of the Companies Act, 2013 ("the Act") with respect to the preparation of these standalone financial statements that give a true and fair view of the financial position, financial performance including other comprehensive income, cash flows and changes in equity of the Company in accordance with the Indian Accounting Standards (Ind AS) prescribed under section 133 of the Act read with the Companies (Indian Accounting Standards) Rules, 2015, as amended, and other accounting principles generally accepted in India.
This responsibility also includes maintenance of adequate accounting records in accordance with the provisions of the Act for safeguarding the assets of the Company and for preventing and detecting frauds and other irregularities; selection and application of appropriate accounting policies; making judgements and estimates that are reasonable and prudent; and design, implementation and maintenance of adequate internal financial controls, that were operating effectively for ensuring the accuracy and completeness of the accounting records, relevant to the preparation and presentation of the standalone financial statements that give a true and fair view and are free from material misstatement, whether due to fraud or error.
Auditor’s ResponsibilityOur responsibility is to express an opinion on these standalone financial statements based on our audit.
In conducting our audit, we have taken into account the provisions of the Act, the accounting and auditing standards and matters which are required to be included in the audit report under the provisions of the Act and the Rules made thereunder and the Order issued under section 143(11) of the Act.
We conducted our audit of the standalone financial statements in accordance with the Standards on Auditing specified under Section 143(10) of the Act. Those Standards require that we comply with ethical requirements and plan and perform the audit to obtain reasonable assurance about whether the standalone financial statements are free from material misstatement.
An audit involves performing procedures to obtain audit evidence about the amounts and the disclosures in the standalone financial statements. The procedures selected depend on the auditor’s judgement including the assessment of the risks of material misstatement of the standalone financial statements, whether due to fraud or error. In making those risk assessments, the auditor considers internal financial control relevant to the Company’s preparation of the standalone financial statements that give a true and fair view in order to design audit procedures that are appropriate in the circumstances. An audit also includes evaluating the appropriateness of the accounting policies used and the reasonableness of the accounting estimates made by the Company’s Directors, as well as evaluating the overall presentation of the standalone financial statements.
We believe that the audit evidence obtained by us is sufficient and appropriate to provide a basis for our audit opinion on the standalone financial statements.
OpinionIn our opinion and to the best of our information and according to the explanations given to us, the aforesaid standalone financial statements give the information required by the Act in the manner so required and give a true and fair view in conformity with the accounting principles generally accepted in India, of the state of affairs of the Company as at March 31, 2018, and its profit, total comprehensive income, its cash flows and the changes in equity for the year ended on that date.
Annual Report 2017-18 | 187
Managem
ent Discussion & Analysis
Strategic Overview
Board &
Managem
ent ProfilesStatutory Reports
Financial Statements
Report on Other Legal and Regulatory Requirements1. As required by Section 143(3) of the Act, based on our audit we report that:
a) we have sought and obtained all the information and explanations which to the best of our knowledge and belief were necessary for the purposes of our audit.
b) in our opinion, proper books of account as required by law have been kept by the Company so far as it appears from our examination of those books.
c) the Balance Sheet, the Statement of Profit and Loss including Other Comprehensive Income, the Cash Flow Statement and Statement of Changes in Equity dealt with by this Report are in agreement with the books of account.
d) in our opinion, the aforesaid standalone Ind AS financial statements comply with the Indian Accounting Standards prescribed under section 133 of the Act.
e) on the basis of the written representations received from the directors of the Company as on March 31, 2018 taken on record by the Board of Directors, none of the directors is disqualified as on March 31, 2018 from being appointed as a director in terms of Section 164(2) of the Act.
f) with respect to the adequacy of the internal financial controls over financial reporting of the Company and the operating effectiveness of such controls, refer to our separate Report in "Annexure A". Our report expresses an unmodified opinion on the adequacy and operating effectiveness of the Company’s internal financial controls over financial reporting.
g) with respect to the other matters to be included in the Auditor’s Report in accordance with Rule 11 of the Companies (Audit and Auditors) Rules, 2014, as amended, in our opinion and to the best of our information and according to the explanations given to us:
i. The Company has disclosed the impact of pending litigations on its financial position in its standalone financial statements;
ii. The Company has made provision, as required under the applicable law or accounting standards, for material foreseeable losses, if any, on long-term contracts. The Company did not have any derivative contracts for which there were any material foreseeable losses.
iii. There has been no delay in transferring amounts, required to be transferred, to the Investor Education and Protection Fund by the Company, except for delays upto 56 days in respect of transfer of 534,012 equity shares, in terms of Investor Education and Protection Fund Authority (Accounting, Audit, Transfer and Refund) Rules, 2016 as amended from time to time, to the Investor Education and Protection Fund by the Company.
2. As required by the Companies (Auditor’s Report) Order, 2016 (“the Order”) issued by the Central Government in terms of Section 143(11) of the Act, we give in "Annexure B" a statement on the matters specified in paragraphs 3 and 4 of the Order.
For Deloitte Haskins & Sells LLPChartered Accountants
(Firm Registration No. 117366W/W-100018)
Rupen K. Bhatt
Partner
Mumbai, May 28, 2018 (Membership No. 046930)
188 | Piramal Enterprises Limited
STANDALONE FINANCIAL STATEMENTS
ANNEXURE “A” TO THE INDEPENDENT AUDITOR’S REPORT(Referred to in paragraph 1(f) under ‘Report on Other Legal and Regulatory Requirements’ section of our report to the members of Piramal Enterprises Limited of even date)
Report on the Internal Financial Controls Over Financial Reporting under Clause (i) of sub-section 3 of Section 143 of the Companies Act, 2013 ("the Act")We have audited the internal financial controls over financial reporting of Piramal Enterprises Limited ("the Company") as of March 31, 2018 in conjunction with our audit of the standalone financial statements of the Company for the year ended on that date.
Management’s Responsibility for Internal Financial ControlsThe Board of Directors of the Company is responsible for establishing and maintaining internal financial controls based on the internal control over financial reporting criteria established by the Company considering the essential components of internal control stated in the Guidance Note on Audit of Internal Financial Controls Over Financial Reporting issued by the Institute of Chartered Accountants of India. These responsibilities include the design, implementation and maintenance of adequate internal financial controls that were operating effectively for ensuring the orderly and efficient conduct of its business, the safeguarding of its assets, the prevention and detection of frauds and errors, the accuracy and completeness of the accounting records, and the timely preparation of reliable financial information, as required under the Companies Act, 2013.
Auditor’s ResponsibilityOur responsibility is to express an opinion on the internal financial controls over financial reporting of the Company based on our audit. We conducted our audit in accordance with the Guidance Note on Audit of Internal Financial Controls Over Financial Reporting (the "Guidance Note") issued by the Institute of Chartered Accountants of India and the Standards on Auditing prescribed under Section 143(10) of the Companies Act, 2013, to the extent applicable to an audit of internal financial controls. Those Standards and the Guidance Note require that we comply with ethical requirements and plan and perform the audit to obtain reasonable assurance about whether adequate internal financial controls over financial reporting was established and maintained and if such controls operated effectively in all material respects.
Our audit involves performing procedures to obtain audit evidence about the adequacy of the internal financial controls system over financial reporting and their operating effectiveness. Our audit of internal financial controls over financial reporting included obtaining an understanding of internal financial controls over financial reporting, assessing the risk that a material weakness exists, and testing and evaluating the design and operating effectiveness of internal control based on the assessed risk. The procedures selected depend on the auditor’s judgement, including the assessment of the risks of material misstatement of the financial statements, whether due to fraud or error.
We believe that the audit evidence we have obtained, is sufficient and appropriate to provide a basis for our audit opinion on the Company’s internal financial controls system over financial reporting.
Meaning of Internal Financial Controls Over Financial ReportingA company’s internal financial control over financial reporting is a process designed to provide reasonable assurance regarding the reliability of financial reporting and the preparation of financial statements for external purposes in accordance with generally accepted accounting principles. A company’s internal financial control over financial reporting includes those policies and procedures that (1) pertain to the maintenance of records that, in reasonable detail, accurately and fairly reflect the transactions and dispositions of the assets of the company; (2) provide reasonable assurance that transactions are recorded as necessary to permit preparation of financial statements in accordance with generally accepted accounting principles, and that receipts and expenditures of the company are being made only in accordance with authorisations of management and directors of the company; and (3) provide reasonable assurance regarding prevention or timely detection of unauthorised acquisition, use, or disposition of the company’s assets that could have a material effect on the financial statements.
INDEPENDENT AUDITOR’S REPORT
Annual Report 2017-18 | 189
Managem
ent Discussion & Analysis
Strategic Overview
Board &
Managem
ent ProfilesStatutory Reports
Financial Statements
Limitations of Internal Financial Controls Over Financial ReportingBecause of the inherent limitations of internal financial controls over financial reporting, including the possibility of collusion or improper management override of controls, material misstatements due to error or fraud may occur and not be detected. Also, projections of any evaluation of the internal financial controls over financial reporting to future periods are subject to the risk that the internal financial control over financial reporting may become inadequate because of changes in conditions, or that the degree of compliance with the policies or procedures may deteriorate.
OpinionIn our opinion, to the best of our information and according to the explanations given to us, the Company has, in all material respects, an adequate internal financial controls system over financial reporting and such internal financial controls over financial reporting were operating effectively as at March 31, 2018, based on the internal control over financial reporting criteria established by the Company considering the essential components of internal control stated in the Guidance Note on Audit of Internal Financial Controls Over Financial Reporting issued by the Institute of Chartered Accountants of India.
For Deloitte Haskins & Sells LLPChartered Accountants
(Firm Registration No. 117366W/W-100018)
Rupen K. Bhatt
Partner
Mumbai, May 28, 2018 (Membership No. 046930)
190 | Piramal Enterprises Limited
STANDALONE FINANCIAL STATEMENTS
ANNEXURE “B” TO THE INDEPENDENT AUDITOR’S REPORT(Referred to in paragraph 2 under 'Report on Other Legal and Regulatory Requirements' section of our report of even date to the Members of Piramal Enterprises Limited)
(i) In respect of its property, plant and equipment:
(a) The Company has maintained proper records showing full particulars, including quantitative details and situation of property, plant and equipment.
(b) The Company has a program of verification of fixed assets to cover all the items in a phased manner over a period of three years which, in our opinion, is reasonable having regard to the size of the Company and the nature of its assets. Pursuant to the program, certain fixed assets were physically verified by the Management during the year. According to the information and explanation given to us, no material discrepancies were noticed on physical verification of fixed assets.
(c) According to the information and explanations given to us and the records examined by us and based on the examination of the registered sale deed/conveyance deed/confirmation from custodians/Court Orders approving scheme of arrangements/amalgamations provided to us, we report that, the title deeds, comprising all the immovable properties of land and buildings, which are Freehold are held in the name of the Company as at the balance sheet date.
(ii) As explained to us, the inventories excluding stocks with third parties were physically verified during the year by the Management at reasonable intervals and no material discrepancies were noticed on physical verification. In respect of inventory lying with third parties, confirmations were obtained by management for substantial portions of stocks held by them at the year-end.
(iii) According to the information and explanations given to us, the Company has not granted any secured loans to companies, firms, or other parties covered in the Register maintained under Section 189 of the Companies Act, 2013. In respect of unsecured loans to companies covered in the Register maintained under Section 189 of the Companies Act,2013:
(a) The terms and conditions of the grant of such loans are, in our opinion, prima facie, not prejudicial to the Company’s interest.
(b) The schedule of repayment of principal and payment of interest has been stipulated and repayments or receipts of principal amounts and interest have been regular as per stipulations.
(c) There is no overdue amount remaining outstanding as at the balance sheet date.
(iv) In our opinion and according to the information and explanations given to us, the Company has complied with the provisions of Sections 185 and 186 of the Companies Act, 2013 in respect of grant of loans, making investments and providing guarantees and securities, as applicable.
(v) According to the information and explanations given to us, the Company has not accepted any deposit during the year in terms of provisions of Sections 73 to 76 or any other relevant provisions of the Companies Act, 2013.
(vi) The maintenance of cost records has been specified by the Central Government under Section 148(1) of the Companies Act, 2013 in respect of its products. We have broadly reviewed the cost records maintained by the Company pursuant to the Companies (cost records and audit) Rules, 2014 and amended Companies (cost records and audit) Amendment Rules, 2016 as prescribed by the Central Government under sub-section (1) of Section 148 of the Companies Act, 2013, and are of the opinion that, prima facie, the prescribed cost records have been made and maintained. We have, however, not made a detailed examination of the cost records with a view to determine whether they are accurate or complete.
(vii) According to the information and explanations given to us, in respect of statutory dues:
(a) The Company has generally been regular in depositing undisputed statutory dues, including Provident Fund, Employees’ State Insurance, Income-tax, Goods and Service Tax, Sales Tax, Service Tax, Customs Duty, Excise Duty, Value added Tax, Cess and other material statutory dues applicable to it with the appropriate authorities.
(b) There were no undisputed amounts payable in respect of Provident Fund, Employees’ State Insurance, Income-tax, Sales Tax, Service Tax, Customs Duty, Excise Duty, Value Added Tax, Cess and other material statutory dues in arrears as at March 31, 2018 for a period of more than six months from the date they became payable.
(c) Details of dues of Income-tax, Sales Tax, Service Tax, Customs Duty and Excise Duty which have not been deposited as at March 31, 2018 on account of disputes are given below:
INDEPENDENT AUDITOR’S REPORT
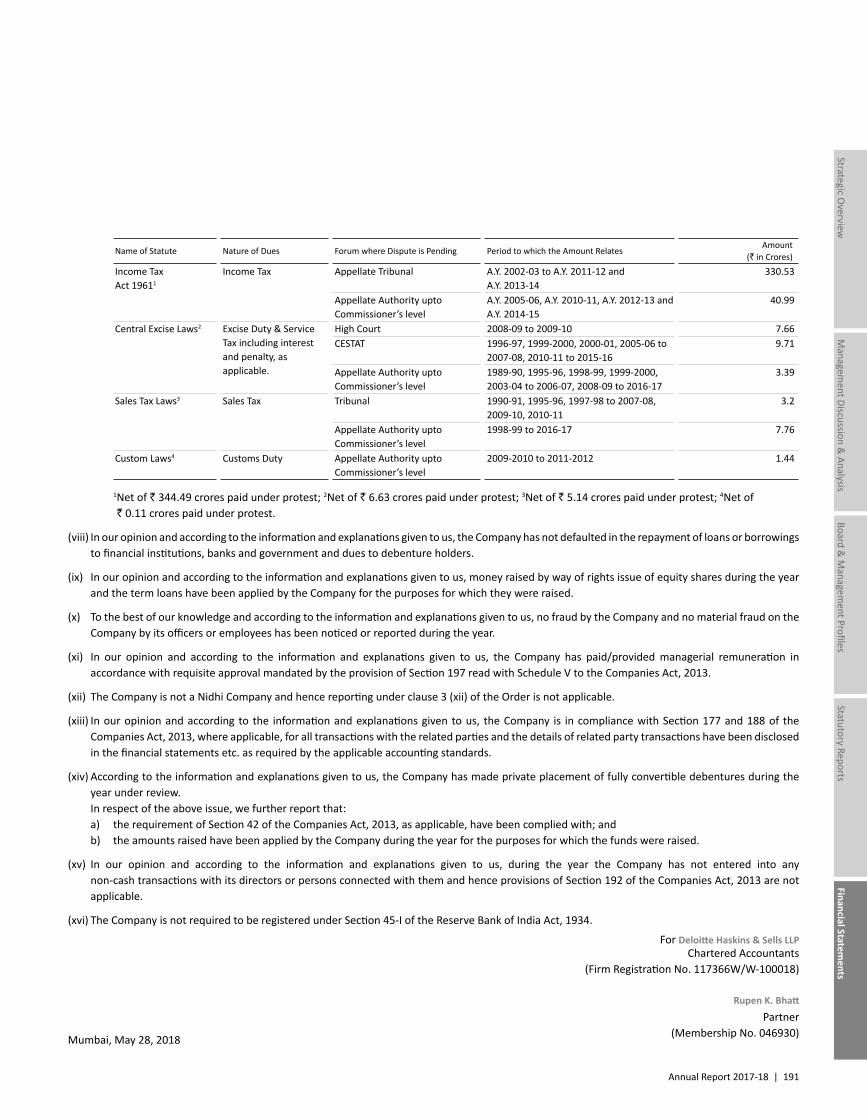
Annual Report 2017-18 | 191
Managem
ent Discussion & Analysis
Strategic Overview
Board &
Managem
ent ProfilesStatutory Reports
Financial Statements
Name of Statute Nature of Dues Forum where Dispute is Pending Period to which the Amount RelatesAmount
(` in Crores)
Income Tax Act 19611
Income Tax Appellate Tribunal A.Y. 2002-03 to A.Y. 2011-12 and A.Y. 2013-14
330.53
Appellate Authority upto Commissioner’s level
A.Y. 2005-06, A.Y. 2010-11, A.Y. 2012-13 and A.Y. 2014-15
40.99
Central Excise Laws2 Excise Duty & Service Tax including interest and penalty, as applicable.
High Court 2008-09 to 2009-10 7.66CESTAT 1996-97, 1999-2000, 2000-01, 2005-06 to
2007-08, 2010-11 to 2015-169.71
Appellate Authority upto Commissioner’s level
1989-90, 1995-96, 1998-99, 1999-2000, 2003-04 to 2006-07, 2008-09 to 2016-17
3.39
Sales Tax Laws3 Sales Tax Tribunal 1990-91, 1995-96, 1997-98 to 2007-08, 2009-10, 2010-11
3.2
Appellate Authority upto Commissioner’s level
1998-99 to 2016-17 7.76
Custom Laws4 Customs Duty Appellate Authority upto Commissioner’s level
2009-2010 to 2011-2012 1.44
1 Net of ` 344.49 crores paid under protest; 2Net of ` 6.63 crores paid under protest; 3Net of ` 5.14 crores paid under protest; 4Net of ` 0.11 crores paid under protest.
(viii) In our opinion and according to the information and explanations given to us, the Company has not defaulted in the repayment of loans or borrowings to financial institutions, banks and government and dues to debenture holders.
(ix) In our opinion and according to the information and explanations given to us, money raised by way of rights issue of equity shares during the year and the term loans have been applied by the Company for the purposes for which they were raised.
(x) To the best of our knowledge and according to the information and explanations given to us, no fraud by the Company and no material fraud on the Company by its officers or employees has been noticed or reported during the year.
(xi) In our opinion and according to the information and explanations given to us, the Company has paid/provided managerial remuneration in accordance with requisite approval mandated by the provision of Section 197 read with Schedule V to the Companies Act, 2013.
(xii) The Company is not a Nidhi Company and hence reporting under clause 3 (xii) of the Order is not applicable.
(xiii) In our opinion and according to the information and explanations given to us, the Company is in compliance with Section 177 and 188 of the Companies Act, 2013, where applicable, for all transactions with the related parties and the details of related party transactions have been disclosed in the financial statements etc. as required by the applicable accounting standards.
(xiv) According to the information and explanations given to us, the Company has made private placement of fully convertible debentures during the year under review.
In respect of the above issue, we further report that: a) the requirement of Section 42 of the Companies Act, 2013, as applicable, have been complied with; and b) the amounts raised have been applied by the Company during the year for the purposes for which the funds were raised.
(xv) In our opinion and according to the information and explanations given to us, during the year the Company has not entered into any non-cash transactions with its directors or persons connected with them and hence provisions of Section 192 of the Companies Act, 2013 are not applicable.
(xvi) The Company is not required to be registered under Section 45-I of the Reserve Bank of India Act, 1934.
For Deloitte Haskins & Sells LLPChartered Accountants
(Firm Registration No. 117366W/W-100018)
Rupen K. Bhatt
Partner
Mumbai, May 28, 2018 (Membership No. 046930)
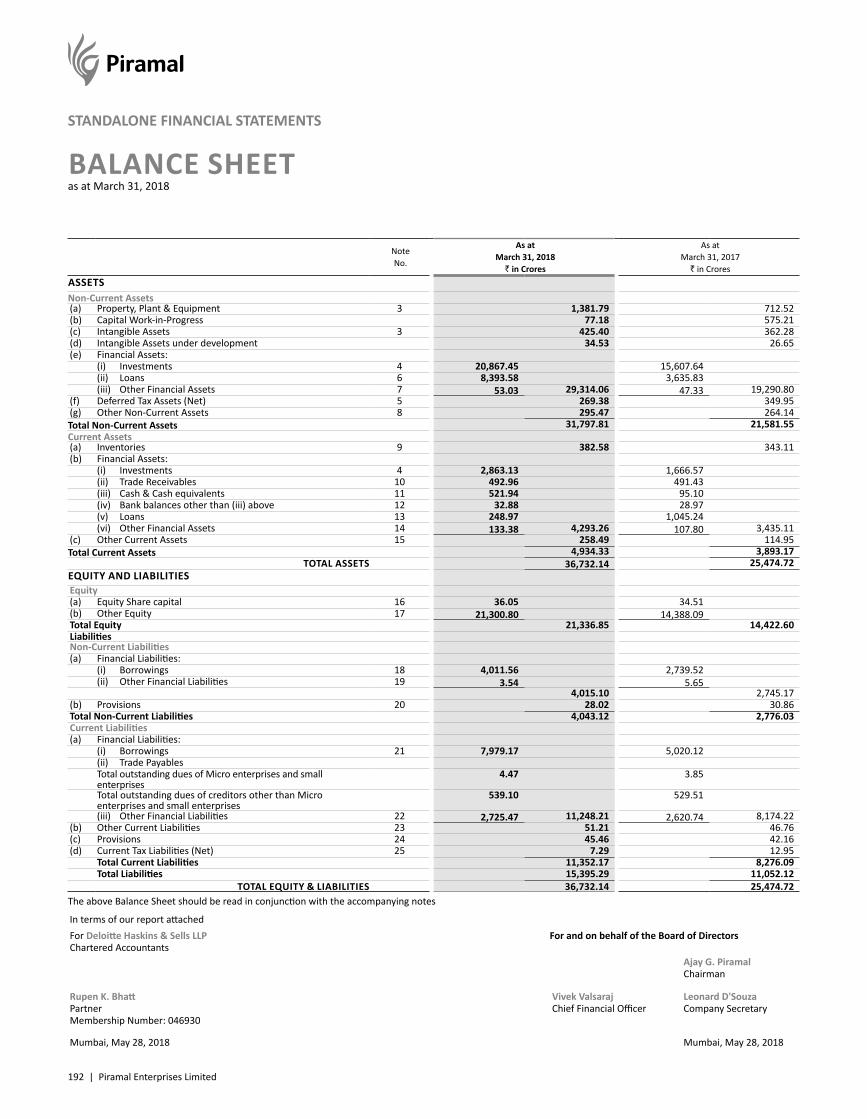
192 | Piramal Enterprises Limited
STANDALONE FINANCIAL STATEMENTS
Note No.
As at March 31, 2018
` in Crores
As at March 31, 2017
` in Crores ASSETSNon-Current Assets(a) Property, Plant & Equipment 3 1,381.79 712.52 (b) Capital Work-in-Progress 77.18 575.21 (c) Intangible Assets 3 425.40 362.28 (d) Intangible Assets under development 34.53 26.65 (e) Financial Assets:
(i) Investments 4 20,867.45 15,607.64 (ii) Loans 6 8,393.58 3,635.83 (iii) Other Financial Assets 7 53.03 29,314.06 47.33 19,290.80
(f) Deferred Tax Assets (Net) 5 269.38 349.95 (g) Other Non-Current Assets 8 295.47 264.14 Total Non-Current Assets 31,797.81 21,581.55 Current Assets(a) Inventories 9 382.58 343.11 (b) Financial Assets:
(i) Investments 4 2,863.13 1,666.57 (ii) Trade Receivables 10 492.96 491.43 (iii) Cash & Cash equivalents 11 521.94 95.10 (iv) Bank balances other than (iii) above 12 32.88 28.97 (v) Loans 13 248.97 1,045.24 (vi) Other Financial Assets 14 133.38 4,293.26 107.80 3,435.11
(c) Other Current Assets 15 258.49 114.95 Total Current Assets 4,934.33 3,893.17
TOTAL ASSETS 36,732.14 25,474.72 EQUITY AND LIABILITIESEquity(a) Equity Share capital 16 36.05 34.51 (b) Other Equity 17 21,300.80 14,388.09 Total Equity 21,336.85 14,422.60 LiabilitiesNon-Current Liabilities(a) Financial Liabilities:
(i) Borrowings 18 4,011.56 2,739.52 (ii) Other Financial Liabilities 19 3.54 5.65
4,015.10 2,745.17 (b) Provisions 20 28.02 30.86 Total Non-Current Liabilities 4,043.12 2,776.03 Current Liabilities(a) Financial Liabilities:
(i) Borrowings 21 7,979.17 5,020.12 (ii) Trade PayablesTotal outstanding dues of Micro enterprises and small enterprises
4.47 3.85
Total outstanding dues of creditors other than Micro enterprises and small enterprises
539.10 529.51
(iii) Other Financial Liabilities 22 2,725.47 11,248.21 2,620.74 8,174.22 (b) Other Current Liabilities 23 51.21 46.76 (c) Provisions 24 45.46 42.16 (d) Current Tax Liabilities (Net) 25 7.29 12.95
Total Current Liabilities 11,352.17 8,276.09 Total Liabilities 15,395.29 11,052.12
TOTAL EQUITY & LIABILITIES 36,732.14 25,474.72 The above Balance Sheet should be read in conjunction with the accompanying notes
In terms of our report attachedFor Deloitte Haskins & Sells LLPChartered Accountants
For and on behalf of the Board of Directors
Ajay G. Piramal Chairman
Rupen K. BhattPartnerMembership Number: 046930
Vivek Valsaraj Chief Financial Officer
Leonard D'Souza Company Secretary
Mumbai, May 28, 2018 Mumbai, May 28, 2018
BALANCE SHEET as at March 31, 2018
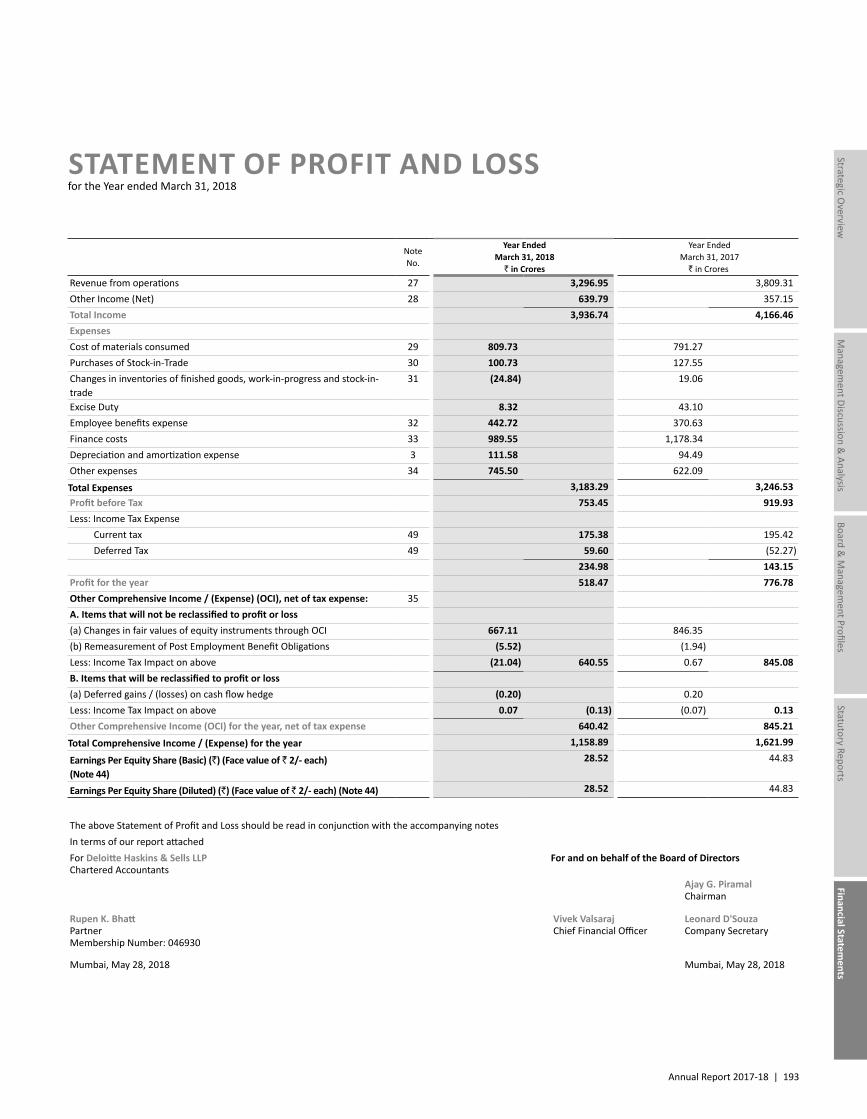
Annual Report 2017-18 | 193
Managem
ent Discussion & Analysis
Strategic Overview
Board &
Managem
ent ProfilesStatutory Reports
Financial Statements
The above Statement of Profit and Loss should be read in conjunction with the accompanying notesIn terms of our report attachedFor Deloitte Haskins & Sells LLPChartered Accountants
For and on behalf of the Board of Directors
Ajay G. Piramal Chairman
Rupen K. BhattPartnerMembership Number: 046930
Vivek Valsaraj Chief Financial Officer
Leonard D'Souza Company Secretary
Mumbai, May 28, 2018 Mumbai, May 28, 2018
STATEMENT OF PROFIT AND LOSS for the Year ended March 31, 2018
NoteNo.
Year Ended March 31, 2018
` in Crores
Year Ended March 31, 2017
` in Crores Revenue from operations 27 3,296.95 3,809.31Other Income (Net) 28 639.79 357.15Total Income 3,936.74 4,166.46ExpensesCost of materials consumed 29 809.73 791.27Purchases of Stock-in-Trade 30 100.73 127.55Changes in inventories of finished goods, work-in-progress and stock-in-trade
31 (24.84) 19.06
Excise Duty 8.32 43.10Employee benefits expense 32 442.72 370.63Finance costs 33 989.55 1,178.34Depreciation and amortization expense 3 111.58 94.49Other expenses 34 745.50 622.09
Total Expenses 3,183.29 3,246.53Profit before Tax 753.45 919.93Less: Income Tax Expense Current tax 49 175.38 195.42 Deferred Tax 49 59.60 (52.27)
234.98 143.15Profit for the year 518.47 776.78Other Comprehensive Income / (Expense) (OCI), net of tax expense: 35A. Items that will not be reclassified to profit or loss(a) Changes in fair values of equity instruments through OCI 667.11 846.35(b) Remeasurement of Post Employment Benefit Obligations (5.52) (1.94)Less: Income Tax Impact on above (21.04) 640.55 0.67 845.08B. Items that will be reclassified to profit or loss(a) Deferred gains / (losses) on cash flow hedge (0.20) 0.20Less: Income Tax Impact on above 0.07 (0.13) (0.07) 0.13Other Comprehensive Income (OCI) for the year, net of tax expense 640.42 845.21
Total Comprehensive Income / (Expense) for the year 1,158.89 1,621.99
Earnings Per Equity Share (Basic) (`) (Face value of ` 2/- each) (Note 44)
28.52 44.83
Earnings Per Equity Share (Diluted) (`) (Face value of ` 2/- each) (Note 44) 28.52 44.83
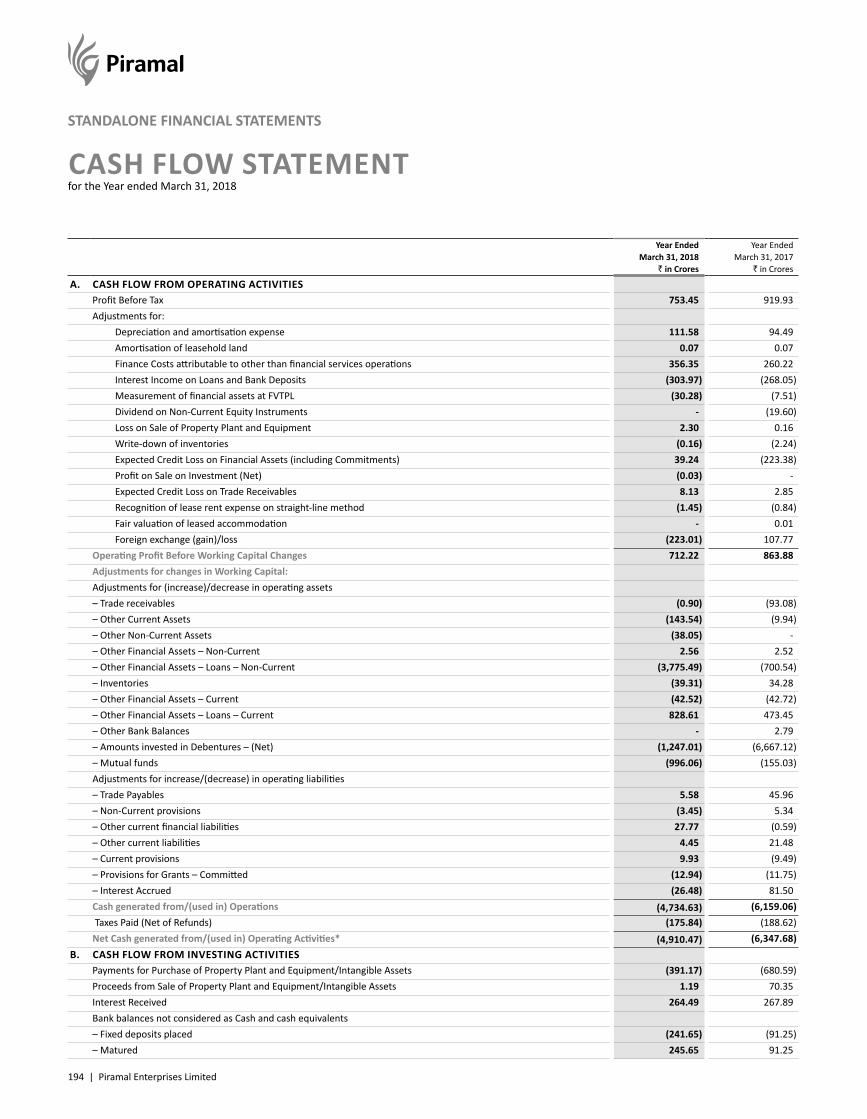
194 | Piramal Enterprises Limited
STANDALONE FINANCIAL STATEMENTS
CASH FLOW STATEMENT for the Year ended March 31, 2018
Year Ended March 31, 2018
` in Crores
Year Ended March 31, 2017
` in Crores
A. CASH FLOW FROM OPERATING ACTIVITIESProfit Before Tax 753.45 919.93Adjustments for: Depreciation and amortisation expense 111.58 94.49 Amortisation of leasehold land 0.07 0.07 Finance Costs attributable to other than financial services operations 356.35 260.22 Interest Income on Loans and Bank Deposits (303.97) (268.05) Measurement of financial assets at FVTPL (30.28) (7.51) Dividend on Non-Current Equity Instruments - (19.60) Loss on Sale of Property Plant and Equipment 2.30 0.16 Write-down of inventories (0.16) (2.24) Expected Credit Loss on Financial Assets (including Commitments) 39.24 (223.38) Profit on Sale on Investment (Net) (0.03) - Expected Credit Loss on Trade Receivables 8.13 2.85 Recognition of lease rent expense on straight-line method (1.45) (0.84) Fair valuation of leased accommodation - 0.01 Foreign exchange (gain)/loss (223.01) 107.77Operating Profit Before Working Capital Changes 712.22 863.88Adjustments for changes in Working Capital:Adjustments for (increase)/decrease in operating assets– Trade receivables (0.90) (93.08)– Other Current Assets (143.54) (9.94)– Other Non-Current Assets (38.05) -– Other Financial Assets – Non-Current 2.56 2.52– Other Financial Assets – Loans – Non-Current (3,775.49) (700.54)– Inventories (39.31) 34.28– Other Financial Assets – Current (42.52) (42.72)– Other Financial Assets – Loans – Current 828.61 473.45– Other Bank Balances - 2.79– Amounts invested in Debentures – (Net) (1,247.01) (6,667.12)– Mutual funds (996.06) (155.03)Adjustments for increase/(decrease) in operating liabilities– Trade Payables 5.58 45.96– Non-Current provisions (3.45) 5.34– Other current financial liabilities 27.77 (0.59)– Other current liabilities 4.45 21.48– Current provisions 9.93 (9.49)– Provisions for Grants – Committed (12.94) (11.75)– Interest Accrued (26.48) 81.50Cash generated from/(used in) Operations (4,734.63) (6,159.06) Taxes Paid (Net of Refunds) (175.84) (188.62)Net Cash generated from/(used in) Operating Activities* (4,910.47) (6,347.68)
B. CASH FLOW FROM INVESTING ACTIVITIESPayments for Purchase of Property Plant and Equipment/Intangible Assets (391.17) (680.59)Proceeds from Sale of Property Plant and Equipment/Intangible Assets 1.19 70.35Interest Received 264.49 267.89Bank balances not considered as Cash and cash equivalents– Fixed deposits placed (241.65) (91.25)– Matured 245.65 91.25
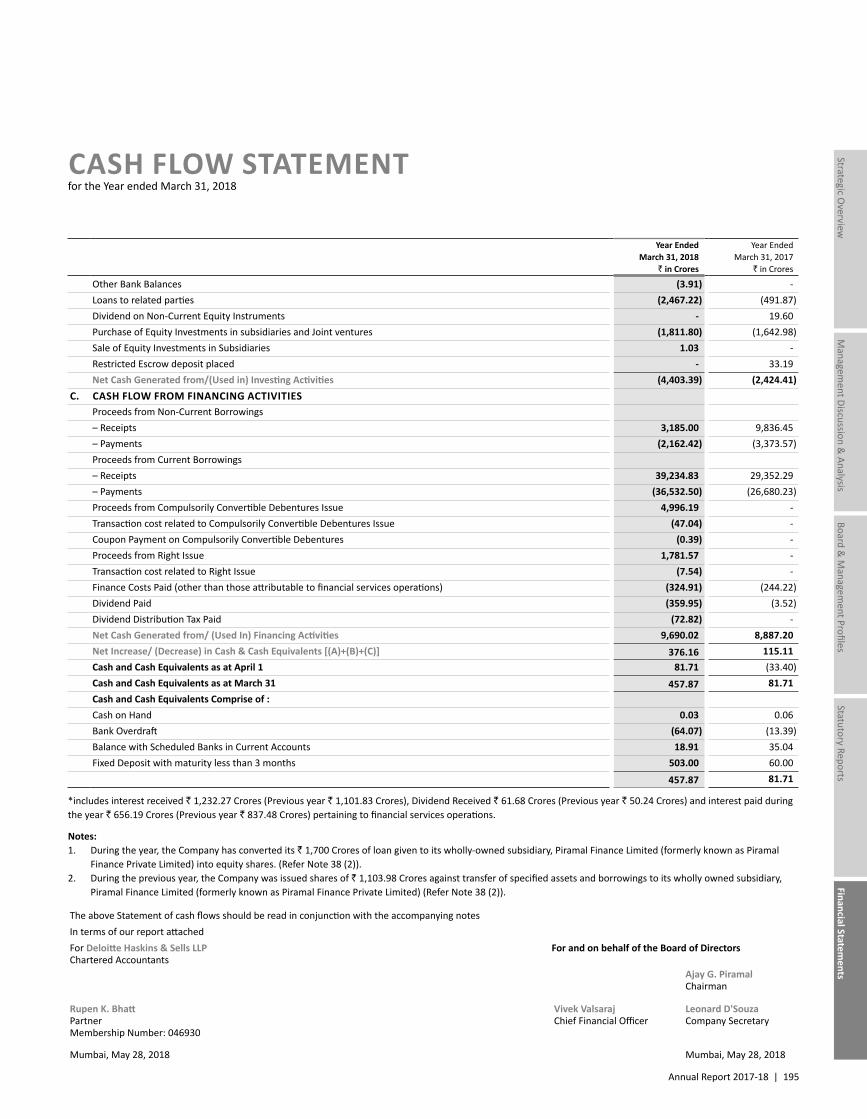
Annual Report 2017-18 | 195
Managem
ent Discussion & Analysis
Strategic Overview
Board &
Managem
ent ProfilesStatutory Reports
Financial Statements
CASH FLOW STATEMENT for the Year ended March 31, 2018
Year Ended March 31, 2018
` in Crores
Year Ended March 31, 2017
` in Crores
Other Bank Balances (3.91) -Loans to related parties (2,467.22) (491.87)Dividend on Non-Current Equity Instruments - 19.60Purchase of Equity Investments in subsidiaries and Joint ventures (1,811.80) (1,642.98)Sale of Equity Investments in Subsidiaries 1.03 -Restricted Escrow deposit placed - 33.19Net Cash Generated from/(Used in) Investing Activities (4,403.39) (2,424.41)
C. CASH FLOW FROM FINANCING ACTIVITIESProceeds from Non-Current Borrowings– Receipts 3,185.00 9,836.45– Payments (2,162.42) (3,373.57)Proceeds from Current Borrowings– Receipts 39,234.83 29,352.29– Payments (36,532.50) (26,680.23)Proceeds from Compulsorily Convertible Debentures Issue 4,996.19 -Transaction cost related to Compulsorily Convertible Debentures Issue (47.04) -Coupon Payment on Compulsorily Convertible Debentures (0.39) -Proceeds from Right Issue 1,781.57 -Transaction cost related to Right Issue (7.54) -Finance Costs Paid (other than those attributable to financial services operations) (324.91) (244.22)Dividend Paid (359.95) (3.52)Dividend Distribution Tax Paid (72.82) -Net Cash Generated from/ (Used In) Financing Activities 9,690.02 8,887.20Net Increase/ (Decrease) in Cash & Cash Equivalents [(A)+(B)+(C)] 376.16 115.11Cash and Cash Equivalents as at April 1 81.71 (33.40)Cash and Cash Equivalents as at March 31 457.87 81.71Cash and Cash Equivalents Comprise of :Cash on Hand 0.03 0.06Bank Overdraft (64.07) (13.39)Balance with Scheduled Banks in Current Accounts 18.91 35.04Fixed Deposit with maturity less than 3 months 503.00 60.00
457.87 81.71
*includes interest received ` 1,232.27 Crores (Previous year ` 1,101.83 Crores), Dividend Received ` 61.68 Crores (Previous year ` 50.24 Crores) and interest paid during the year ` 656.19 Crores (Previous year ` 837.48 Crores) pertaining to financial services operations.
Notes:1. During the year, the Company has converted its ` 1,700 Crores of loan given to its wholly-owned subsidiary, Piramal Finance Limited (formerly known as Piramal
Finance Private Limited) into equity shares. (Refer Note 38 (2)).2. During the previous year, the Company was issued shares of ` 1,103.98 Crores against transfer of specified assets and borrowings to its wholly owned subsidiary,
Piramal Finance Limited (formerly known as Piramal Finance Private Limited) (Refer Note 38 (2)).
The above Statement of cash flows should be read in conjunction with the accompanying notesIn terms of our report attachedFor Deloitte Haskins & Sells LLPChartered Accountants
For and on behalf of the Board of Directors
Ajay G. Piramal Chairman
Rupen K. BhattPartnerMembership Number: 046930
Vivek Valsaraj Chief Financial Officer
Leonard D'Souza Company Secretary
Mumbai, May 28, 2018 Mumbai, May 28, 2018
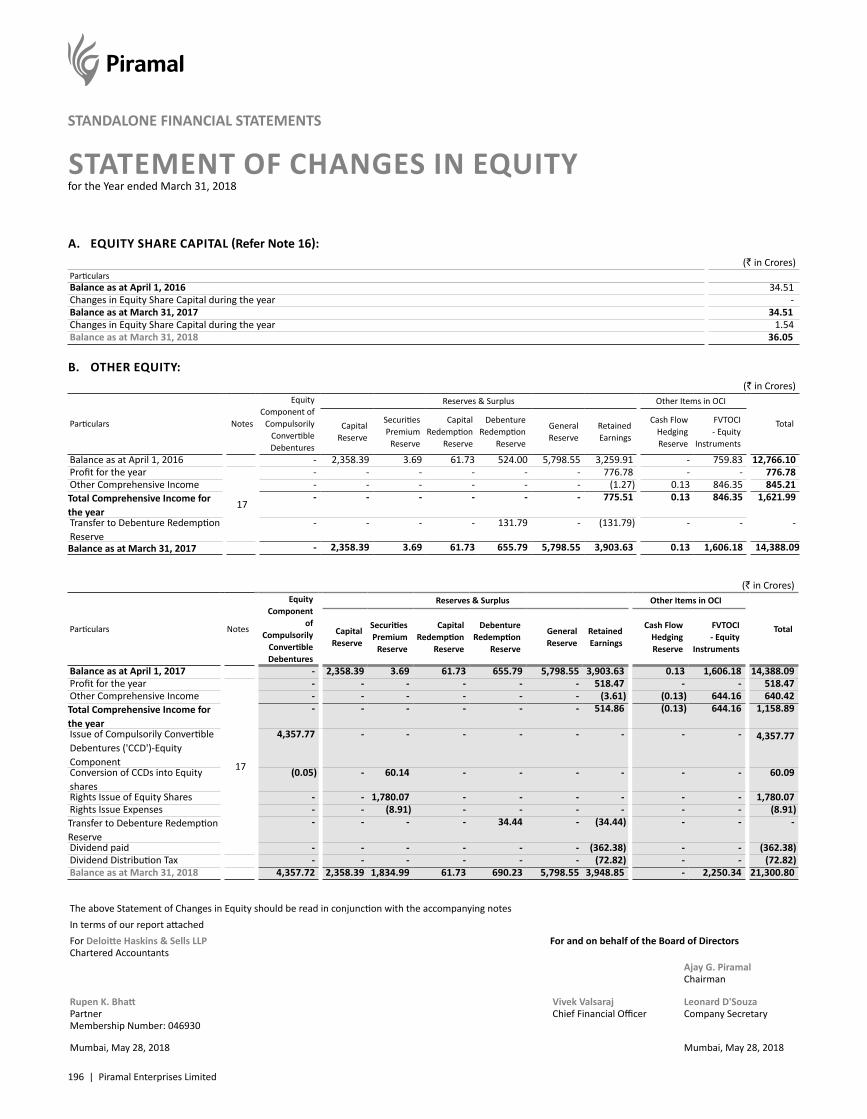
196 | Piramal Enterprises Limited
STANDALONE FINANCIAL STATEMENTS
STATEMENT OF CHANGES IN EQUITY for the Year ended March 31, 2018
A. EQUITY SHARE CAPITAL (Refer Note 16):(` in Crores)
ParticularsBalance as at April 1, 2016 34.51 Changes in Equity Share Capital during the year - Balance as at March 31, 2017 34.51 Changes in Equity Share Capital during the year 1.54 Balance as at March 31, 2018 36.05
B. OTHER EQUITY:(` in Crores)
Particulars Notes
Equity Component of
Compulsorily Convertible Debentures
Reserves & Surplus Other Items in OCI
TotalCapital Reserve
Securities Premium
Reserve
Capital Redemption
Reserve
Debenture Redemption
Reserve
General Reserve
Retained Earnings
Cash Flow Hedging Reserve
FVTOCI - Equity
Instruments
Balance as at April 1, 2016 - 2,358.39 3.69 61.73 524.00 5,798.55 3,259.91 - 759.83 12,766.10 Profit for the year
17
- - - - - - 776.78 - - 776.78 Other Comprehensive Income - - - - - - (1.27) 0.13 846.35 845.21 Total Comprehensive Income for the year
- - - - - - 775.51 0.13 846.35 1,621.99
Transfer to Debenture Redemption Reserve
- - - - 131.79 - (131.79) - - -
Balance as at March 31, 2017 - 2,358.39 3.69 61.73 655.79 5,798.55 3,903.63 0.13 1,606.18 14,388.09
(` in Crores)
Particulars Notes
Equity Component
of Compulsorily
Convertible Debentures
Reserves & Surplus Other Items in OCI
TotalCapital Reserve
Securities Premium
Reserve
Capital Redemption
Reserve
Debenture Redemption
Reserve
General Reserve
Retained Earnings
Cash Flow Hedging Reserve
FVTOCI - Equity
Instruments
Balance as at April 1, 2017 - 2,358.39 3.69 61.73 655.79 5,798.55 3,903.63 0.13 1,606.18 14,388.09 Profit for the year
17
- - - - - - 518.47 - - 518.47 Other Comprehensive Income - - - - - - (3.61) (0.13) 644.16 640.42 Total Comprehensive Income for the year
- - - - - - 514.86 (0.13) 644.16 1,158.89
Issue of Compulsorily Convertible Debentures ('CCD')-Equity Component
4,357.77 - - - - - - - - 4,357.77
Conversion of CCDs into Equity shares
(0.05) - 60.14 - - - - - - 60.09
Rights Issue of Equity Shares - - 1,780.07 - - - - - - 1,780.07 Rights Issue Expenses - - (8.91) - - - - - - (8.91)Transfer to Debenture Redemption Reserve
- - - - 34.44 - (34.44) - - -
Dividend paid - - - - - - (362.38) - - (362.38)Dividend Distribution Tax - - - - - - (72.82) - - (72.82)Balance as at March 31, 2018 4,357.72 2,358.39 1,834.99 61.73 690.23 5,798.55 3,948.85 - 2,250.34 21,300.80
The above Statement of Changes in Equity should be read in conjunction with the accompanying notesIn terms of our report attachedFor Deloitte Haskins & Sells LLPChartered Accountants
For and on behalf of the Board of Directors
Ajay G. Piramal Chairman
Rupen K. BhattPartnerMembership Number: 046930
Vivek Valsaraj Chief Financial Officer
Leonard D'Souza Company Secretary
Mumbai, May 28, 2018 Mumbai, May 28, 2018
Annual Report 2017-18 | 197
Managem
ent Discussion & Analysis
Strategic Overview
Board &
Managem
ent ProfilesStatutory Reports
Financial Statements
1. GENERAL INFORMATION Piramal Enterprises Limited (PEL) (including its subsidiaries) is one of India’s large diversified companies, with a presence in Healthcare, Healthcare
Insights & Analytics business and Financial Services.
In Pharmaceuticals, through an end-to-end manufacturing capabilities across its manufacturing facilities and a large global distribution network, the Company sells a portfolio of niche differentiated pharma products and provides an entire pool of pharma services (including in the areas of injectable, HPAPI etc.). The Company is also strengthening its presence in the Consumer Product segment in India.
In Financial Services, PEL provides comprehensive financing solutions to real estate companies. Corporate Finance Group (CFG) provides senior and mezzanine growth capital to various businesses across varied sectors that are integral part of India’s growth story. The Company has also launched Distressed Asset Investing platform that will invest in equity and/or debt in assets across sectors (other than real estate) to drive restructuring with active participation in turnaround. The Company has recently launched a retail housing finance vertical. The Company also has strategic alliances with top global funds such as APG Asset Management, Bain Capital Credit, CPPIB Credit Investment Inc. and Ivanhoé Cambridge (CDPQ). The Company has long-term equity investments in Shriram Group, a leading financial conglomerate in India.
Healthcare Insights & Analytics business, Decision Resources Group, is the premier provider of healthcare analytics, data & insight products and services to the world’s leading pharma, biotech and medical technology companies and enables them to take informed business decisions
PEL is a public limited Company incorporated and domiciled in India and has its registered office at Mumbai, India. It is listed on the BSE Limited and the National Stock Exchange of India Limited in India.
2a. SIGNIFICANT ACCOUNTING POLICIES i) Basis of preparation of financial statements Compliance with Ind AS The standalone financial statements comply in all material aspects with Indian Accounting Standards (Ind AS) notified under Section 133 of the
Companies Act, 2013 (the Act) [Companies (Indian Accounting Standards) Rules, 2015] and other relevant provisions of the Act.
Effective April 1, 2016, the Company has adopted all the Ind AS standards and the adoption was carried out in accordance with Ind AS 101 First Time adoption of Indian Accounting Standards, with April 1, 2015 as the transition date. The transition was carried out from the Indian Accounting Principle generally accepted in India as prescribed under Section 133 of the Act read with Rule 7 of the Companies (Accounts) Rules, 2014 (IGAAP), which was the previous GAAP.
Accounting policies have been consistently applied except where a newly issued accounting standard is initially adopted or a revision to the existing accounting standard requires a change in the accounting policy hitherto in use.
Amounts for the year ended and as at March 31, 2017 were audited by previous auditors – Price Waterhouse.
Historical Cost convention The standalone financial statements have been prepared on the historical cost basis except for certain financial instruments and plan assets of
defined benefit plans, which are measured at fair value.
ii) Investments in subsidiaries, associates, joint operations and joint ventures Subsidiaries Subsidiaries are all entities (including structured entities) over which the group has control. The Company controls an entity when the Company
is exposed to, or has rights to, variable returns from its involvement with the entity and has the ability to affect those returns through its power to direct the relevant activities of the entity.
Associates An associate is an entity over which the Company has significant influence. Significant influence is the power to participate in the financial and
operating policy decisions of the investee but is not control or joint control over those policies.
NOTES TO FINANCIAL STATEMENTSfor the Year ended March 31, 2018
198 | Piramal Enterprises Limited
NOTES TO FINANCIAL STATEMENTS (Contd.)for the Year ended March 31, 2018
STANDALONE FINANCIAL STATEMENTS
Joint Arrangements Under Ind AS 111 Joint Arrangements, investments in joint arrangements are classified as either joint operations or joint ventures. The
classification depends on the contractual rights and obligations of each investor, rather than the legal structure of the joint arrangement. The Company has both joint operations and joint ventures.
A joint operation is a joint arrangement whereby the parties that have joint control of the arrangement have rights to the assets and obligations for the liabilities relating to the arrangement.
A joint venture is a joint arrangement whereby the parties that have joint control of the arrangement have rights to the net assets of the joint arrangement.
The Company recognises its direct right to the assets, liabilities, revenues and expenses of joint operations and its share of any jointly held or incurred assets, liabilities, revenues and expenses. These have been incorporated in the financial statements under the appropriate headings.
Investments in Subsidiaries, Associates and Joint ventures are accounted at cost.
iii) Property, Plant and Equipment Freehold Land is carried at historical cost. All other items of Property Plant & Equipment are stated at cost of acquisition, less accumulated
depreciation and accumulated impairment losses, if any. Direct costs are capitalised until the assets are ready for use and includes freight, duties, taxes and expenses incidental to acquisition and installation. The carrying amount of any component accounted for as a separate asset is derecognised when replaced. All other repairs and maintenance are charged to profit or loss during the reporting period in which they are incurred. Subsequent expenditures related to an item of Property Plant & Equipment are added to its carrying value only when it is probable that the future economic benefits from the asset will flow to the Company and cost can be reliably measured.
Losses arising from the retirement of, and gains or losses arising from disposal of Property, Plant and Equipment are recognised in the Statement of Profit and Loss.
Depreciation Depreciation is provided on a pro-rata basis on the straight line method ('SLM') over the estimated useful lives of the assets specified in
Schedule II of the Companies Act, 2013 which are as follows:
Asset Class Useful life
Buildings 10 years - 60 yearsCarpeted Roads 10 yearsFurniture & Fixtures 3 years - 15 yearsPlant & Machinery 3 years - 20 yearsContinuous Process Plant 25 yearsOffice Equipment 3 years - 15 yearsVehicles 8 yearsHelicopter 20 yearsShips/Yachts 13 years/28 Years
The assets’ residual values and useful lives are reviewed, and adjusted if appropriate, at the end of each reporting period.
iv) Intangible Assets Intangible assets are stated at acquisition cost, net of accumulated amortisation and accumulated impairment losses, if any.
Gains or losses arising from the retirement or disposal of an intangible asset are determined as the difference between the disposal proceeds and the carrying amount of the asset and are recognised as income or expense in the Statement of Profit and Loss.
The research and development (R&D) cost is accounted in accordance with Ind AS - 38 ‘Intangibles’.
Annual Report 2017-18 | 199
Managem
ent Discussion & Analysis
Strategic Overview
Board &
Managem
ent ProfilesStatutory Reports
Financial Statements
NOTES TO FINANCIAL STATEMENTS (Contd.)for the Year ended March 31, 2018
Research Research costs, including patent filing charges, technical know-how fees, testing charges on animal and expenses incurred on development of
a molecule till the stage of Pre-clinical studies and till the receipt of regulatory approval for commencing phase I trials are treated as revenue expenses and charged off to the Statement of Profit and Loss of respective year.
Development Development costs relating to design and testing of new or improved materials, products or processes are recognised as intangible assets and
are carried forward under Intangible Assets under Development until the completion of the project when they are capitalised as Intangible assets, if the following conditions are satisfied:
• it is technically feasible to complete the asset so that it will be available for use; • management intends to complete the asset and use or sell it; • there is an ability to use or sell the asset; • it can be demonstrated how the asset will generate probable future economic benefits; • adequate technical, financial and other resources to complete the development and to use or sell the asset are available; and • the expenditure attributable to the asset during its development can be reliably measured.
Intangible Assets with finite useful lives are amortised on a straight-line basis over the following period:
Asset Class Useful life
Brands and Trademarks 10 - 15 yearsCopyrights, Know-how (including qualifying Product Development Cost) and Intellectual property rights 4 - 15 yearsComputer Software 3 - 6 years
The assets’ residual values and useful lives are reviewed, and adjusted if appropriate, at the end of each reporting period.
v) Impairment of Assets The Company assesses at each Balance Sheet date whether there is any indication that an asset may be impaired. For the purposes of assessing
impairment, the smallest identifiable group of assets that generates cash inflows from continuing use that are largely independent of the cash inflows from other assets or group of assets, is considered as a cash generating unit. If any such indication exists, the Company estimates the recoverable amount of the asset. The recoverable amount is the higher of an asset’s fair value less costs of disposal and value in use. If such recoverable amount of the asset or the recoverable amount of the cash generating unit to which the asset belongs is less than its carrying amount, the carrying amount is reduced to its recoverable amount. The reduction is treated as an impairment loss and is recognised in the Statement of Profit and Loss. If at the Balance Sheet date there is an indication that a previously assessed impairment loss no longer exists or may have decreased, the recoverable amount is reassessed and the asset is reflected at the recoverable amount.
vi) Financial instruments Financial assets and financial liabilities are recognised when the Company becomes a party to the contractual provisions of the instruments.
Financial assets and financial liabilities are initially measured at fair value. Transaction costs that are directly attributable to the acquisition or issue of financial assets and financial liabilities (other than financial assets and financial liabilities at fair value through profit or loss) are added to or deducted from the fair value of the financial assets or financial liabilities, as appropriate, on initial recognition. Transaction costs directly attributable to the acquisition of financial assets or financial liabilities at fair value through profit or loss are recognised immediately in profit or loss.
Financial assets with embedded derivatives are considered in their entirety when determining whether their cash flows are solely payment of principal and interest.
200 | Piramal Enterprises Limited
NOTES TO FINANCIAL STATEMENTS (Contd.)for the Year ended March 31, 2018
STANDALONE FINANCIAL STATEMENTS
Investments and Other Financial Assets Classification The Company classifies its financial assets in the following measurement categories: ● those to be measured subsequently at fair value (either through other comprehensive income, or through profit or loss), and ● those measured at amortised cost.
The classification depends on the entity’s business model for managing the financial assets and the contractual terms of the cash flows.
Initial Measurement At initial recognition, the Company measures a financial asset at its fair value plus, in the case of a financial asset not at fair value through profit
or loss, transaction costs that are directly attributable to the acquisition of the financial asset. Transaction costs of financial assets carried at fair value through profit or loss are expensed in profit or loss.
Financial assets with embedded derivatives are considered in their entirety when determining whether their cash flows are solely payment of principal and interest.
Subsequent Measurement For assets measured at fair value, gains and losses will either be recorded in profit or loss or other comprehensive income. For investments
in debt instruments, this will depend on the business model in which the investment is held. For investments in equity instruments, this will depend on whether the Company has made an irrevocable election at the time of initial recognition to account for the equity investment at fair value through other comprehensive income.
The Company reclassifies debt investments when and only when its business model for managing those assets changes.
Debt instruments Subsequent measurement of debt instruments depends on the Group’s business model for managing the asset and the cash flow characteristics
of the asset. There are three measurement categories into which the group classifies its debt instruments:
Amortised cost Assets that are held for collection of contractual cash flows where those cash flows represent solely payments of principal and interest are
measured at amortised cost. A gain or loss on a debt investment that is subsequently measured at amortised cost and is not part of a hedging relationship is recognised in profit or loss when the asset is derecognised or impaired. Interest income from these financial assets is included in finance income using the effective interest rate method. Subsequently, these are measured at amortised cost using the Effective Interest Method less any impairment losses.
Fair value through other comprehensive income (FVTOCI) Assets that are held for collection of contractual cash flows and for selling the financial assets, where the assets’ cash flows represent solely
payments of principal and interest, are measured at fair value through other comprehensive income (FVTOCI). Movements in the carrying amount are taken through OCI, except for the recognition of impairment gains or losses, interest revenue and foreign exchange gains and losses which are recognised in profit and loss. When the financial asset is derecognised, the cumulative gain or loss previously recognised in OCI is reclassified from equity to profit or loss and recognised in other gains/ (losses). Interest income from these financial assets is included in other income using the effective interest rate method.
Fair value through profit or loss (FVTPL) Assets that do not meet the criteria for amortised cost or FVTOCI are measured at fair value through profit or loss. A gain or loss on a debt
investment that is subsequently measured at fair value through profit or loss and is not part of a hedging relationship is recognised in profit or loss and presented net in the statement of profit and loss within other gains/(losses) in the period in which it arises. Interest income from these financial assets is included in other income.
Annual Report 2017-18 | 201
Managem
ent Discussion & Analysis
Strategic Overview
Board &
Managem
ent ProfilesStatutory Reports
Financial Statements
NOTES TO FINANCIAL STATEMENTS (Contd.)for the Year ended March 31, 2018
Equity instruments The Company subsequently measures all equity investments at fair value. Where the Company’s management has elected to present fair
value gains and losses on equity investments in other comprehensive income, there is no subsequent reclassification on derecognition of fair value gains and losses to profit or loss. Dividends from such investments are recognised in profit or loss when the Company’s right to receive payments is established.
Changes in the fair value of financial assets at fair value through profit or loss are recognised in the statement of profit and loss.
Impairment of financial assets The Company applies the expected credit loss model for recognising impairment loss on financial assets measured at amortised cost, loan
commitments, trade receivables and other contractual rights to receive cash or other financial asset.
For trade receivables or any contractual right to receive cash or another financial asset that result from transactions that are within the scope of Ind AS 18, the Company always measures the loss allowance at an amount equal to lifetime expected credit losses.
Further, for the purpose of measuring lifetime expected credit loss ('ECL') allowance for trade receivables, the Company has used a practical expedient as permitted under Ind AS 109. This expected credit loss allowance is computed based on a provision matrix which takes into account historical credit loss experience and adjusted for forward-looking information.
In case of other than trade receivables, the expected credit loss is a product of exposure at default, probability of default and loss given default. The Company has devised an internal model to evaluate the probability of default and loss given default based on the parameters set out in Ind AS 109. Accordingly, the financial instruments are classified into Stage 1 – Standard Assets with zero to thirty days past due (DPD), Stage 2 – Significant Credit Deterioration or overdue between 31 to 90 days and Stage 3 – Default Assets with overdue for more than 90 days. The Company also takes into account the below qualitative parameters in determining the increase in credit risk for the financial assets:
1) Significant negative deviation in the business plan of the borrower 2) Internal rating downgrade for the borrower or the project 3) Current and expected financial performance of the borrower 4) Need for refinance of loan due to change in cash flow of the project 5) Significant decrease in the value of collateral 6) Change in market conditions and industry trends
For recognition of impairment loss on other financial assets and risk exposure (including off Balance Sheet Commitments), the Company determines that whether there has been a significant increase in the credit risk since initial recognition. If credit risk has not increased significantly, 12-month ECL is used to provide for impairment loss. However, if credit risk has increased significantly, lifetime ECL is used. If, in a subsequent period, credit quality of the instrument improves such that there is no longer a significant increase in credit risk since initial recognition, then the entity reverts to recognising impairment loss allowance based on 12-month ECL.
Lifetime ECL are the expected credit losses resulting from all possible default events over the expected life of a financial instrument. The 12-month ECL is a portion of the lifetime ECL which results from default events that are possible within 12 months after the reporting date.
Default Assets wherein the management does not expect any realistic prospect of recovery are written off to the Statement of Profit and Loss.
Derecognition of financial assets A financial asset is derecognised only when:
● The Company has transferred the rights to receive cash flows from the financial asset or ● retains the contractual rights to receive the cash flows of the financial asset, but assumes a contractual obligation to pay the cash flows
to one or more recipients.
202 | Piramal Enterprises Limited
NOTES TO FINANCIAL STATEMENTS (Contd.)for the Year ended March 31, 2018
STANDALONE FINANCIAL STATEMENTS
Where the entity has transferred an asset, the Company evaluates whether it has transferred substantially all risks and rewards of ownership of the financial asset. In such cases, the financial asset is derecognised. Where the entity has not transferred substantially all risks and rewards of ownership of the financial asset, the financial asset is not derecognised.
Foreign exchange gains and losses The fair value of financial assets denominated in a foreign currency is determined in that foreign currency and translated at the spot rate at
the end of each reporting period. For foreign currency denominated financial assets measured at amortised cost and FVTPL, the exchange differences are recognised in profit or loss except for those which are designated as hedging instruments in a hedging relationship.
Financial liabilities and equity instruments Classification as debt or equity Debt and equity instruments issued by a Company entity are classified as either financial liabilities or as equity in accordance with the substance
of the contractual arrangements and the definitions of a financial liability and an equity instrument.
Equity Instrument An equity instrument is any contract that evidences a residual interest in the assets of an entity after deducting all of its liabilities. Equity
instruments issued are recognised at the proceeds received, net of direct issue costs.
Compulsorily Convertible Debenture Convertible instruments are separated into liability and equity components based on the terms of the contract. On issuance of the convertible
debentures, the fair value of the liability component is determined using a market rate for an equivalent non-convertible instrument. This amount is classified as a financial liability measured at amortised cost (net of transaction costs) until it is extinguished on conversion or redemption. The remainder of the proceeds is allocated to the conversion option that is recognised and included in equity since conversion option meets Ind AS 32 criteria for fixed to fixed classification. Transaction costs are apportioned between the liability and equity components of the convertible debentures based on the allocation of proceeds to the liability and equity components when the instruments are initially recognised.
Financial liabilities All financial liabilities are subsequently measured at amortised cost using the effective interest method or at FVTPL.
Financial liabilities are classified as at FVTPL when the financial liability is either contingent consideration recognised by the Company as an acquirer in a business combination to which Ind AS 103 applies or is held for trading or it is designated as at FVTPL.
Financial liabilities that are not held-for-trading and are not designated as at FVTPL are measured at amortised cost. The carrying amounts of financial liabilities that are subsequently measured at amortised cost are determined based on the effective interest method.
The effective interest method is a method of calculating the amortised cost of a financial liability and of allocating interest expense over the relevant period. The effective interest rate is the rate that exactly discounts estimated future cash payments (including all fees paid or received that form an integral part of the effective interest rate, transaction costs and other premiums or discounts) through the expected life of the financial liability, or (where appropriate) a shorter period, to the amortised cost of a financial liability.
Borrowings are classified as current liabilities unless the Company has an unconditional right to defer settlement of the liability for at least 12 months after the reporting period. Where there is a breach of a material provision of a long-term loan arrangement on or before the end of the reporting period with the effect that the liability becomes payable on demand on the reporting date, the Company does not classify the liability as current, if the lender agreed, after the reporting period and before the approval of the financial statements for issue, not to demand payment as a consequence of the breach.
Foreign exchange gains and losses For financial liabilities that are denominated in a foreign currency and are measured at amortised cost at the end of each reporting period, the
foreign exchange gains and losses are determined based on the amortised cost of the instruments.
Annual Report 2017-18 | 203
Managem
ent Discussion & Analysis
Strategic Overview
Board &
Managem
ent ProfilesStatutory Reports
Financial Statements
NOTES TO FINANCIAL STATEMENTS (Contd.)for the Year ended March 31, 2018
Financial Guarantee Contracts Financial guarantee contracts are recognised as a financial liability at the time the guarantee is issued. The liability is initially measured at
fair value and subsequently at the higher of the amount determined in accordance with Ind AS 37 and the amount initially recognised less cumulative amortisation, where appropriate.
The fair value of financial guarantees is determined as the present value of the difference in net cash flows between the contractual payments under the debt instrument and the payments that would be required without the guarantee, or the estimated amount that would be payable to a third party for assuming the obligations.
Where guarantees in relation to loans or other payables of subsidiaries are provided for no compensation, the fair values are accounted for as contributions and recognised as part of the cost of the investment.
Derecognition of financial liabilities The Company derecognises financial liabilities when, and only when, the Company’s obligations are discharged, cancelled or have expired. An
exchange between with a lender of debt instruments with substantially different terms is accounted for as an extinguishment of the original financial liability and the recognition of a new financial liability.
Derivatives and hedging activities Derivatives are initially recognised at fair value on the date a derivative contract is entered into and are subsequently re-measured to their fair
value at the end of each reporting period. The accounting for subsequent changes in fair value depends on whether the derivative is designated as a hedging instrument, and if so, the nature of the item being hedged and the type of hedge relationship designated.
The full fair value of a hedging derivative is classified as a non-current asset or liability when the remaining maturity of the hedged item is more than 12 months; it is classified as a current asset or liability when the remaining maturity of the hedged item is less than 12 months. Trading derivatives are classified as a current asset or liability
(i) Cash flow hedges that qualify for hedge accounting: The effective portion of changes in the fair value of derivatives that are designated and qualify as cash flow hedges is recognised in the
other comprehensive income in cash flow hedging reserve within equity, limited to the cumulative change in fair value of the hedged item on a present value basis from the inception of the hedge. The gain or loss relating to the ineffective portion is recognised immediately in profit or loss, within other gains/(losses).
(ii) Derivatives that are not designated as hedges: The group enters into certain derivative contracts to hedge risks which are not designated as hedges. Such contracts are accounted for at
fair value through profit or loss.
Embedded derivatives Derivatives embedded in a host contract that is an asset within the scope of Ind AS 109 are not separated. Financial assets with embedded
derivatives are considered in their entirety when determining whether their cash flows are solely payment of principal and interest.
Derivatives embedded in all other host contract are separated only if the economic characteristics and risks of the embedded derivative are not closely related to the economic characteristics and risks of the host and are measured at fair value through profit or loss. Embedded derivatives closely related to the host contracts are not separated.
Offsetting Financial Instruments Financial Assets and Liabilities are offset and the net amount is reflected in the balance sheet where there is a legally enforceable right to offset
the recognised amounts and there is an intention to settle the liability simultaneously. The legally enforceable right must not be contingent on future events and must be enforceable in the normal course of business and in the event of default, insolvency or bankruptcy of the Company or counterparty.
204 | Piramal Enterprises Limited
NOTES TO FINANCIAL STATEMENTS (Contd.)for the Year ended March 31, 2018
STANDALONE FINANCIAL STATEMENTS
vii) Trade Receivables Trade receivables are recognised initially at fair value and subsequently measured at amortised cost using the effective interest method, less
provision for impairment.
viii) Inventories Inventories comprise of Raw and Packing Materials, Work-in-Progress, Finished Goods (Manufactured and Traded) and Stores and Spares.
Inventories are valued at the lower of cost and the net realisable value after providing for obsolescence and other losses, where considered necessary. Cost is determined on Weighted Average basis. Cost includes all charges in bringing the goods to their present location and condition, including octroi and other levies, transit insurance and receiving charges. The cost of Work-in-progress and Finished Goods comprises of materials, direct labour, other direct costs and related production overheads and Excise duty as applicable. Net realisable value is the estimated selling price in the ordinary course of business less the estimated costs of completion and the estimated costs necessary to make the sale.
ix) Employee Benefits (i) Short-term obligations Liabilities for wages and salaries, including non-monetary benefits that are expected to be settled wholly within 12 months after the end
of the period in which the employees render the related service are recognised in respect of employees’ services up to the end of the reporting period and are measured at the amounts expected to be paid when the liabilities are settled. The liabilities are presented as current employee benefit obligations in the balance sheet.
(ii) Other long-term employee benefit obligations The liabilities for earned leave are not expected to be settled wholly within 12 months after the end of the period in which the employees
render the related service. They are therefore measured as the present value of expected future payments to be made in respect of services provided by employees up to the end of the reporting period using the projected unit credit method. The benefits are discounted using the market yields at the end of the reporting period that have terms approximating to the terms of the related obligation. Remeasurements as a result of experience adjustments and changes in actuarial assumptions are recognised in profit or loss.
The obligations are presented as current liabilities in the balance sheet if the entity does not have an unconditional right to defer settlement for at least twelve months after the reporting period, regardless of when the actual settlement is expected to occur. Long Term Service Awards are recognised as a liability at the present value of the defined benefit obligation as at the balance sheet date.
(iii) Post-employment obligations The Company operates the following post-employment schemes: - Defined Contribution plans such as provident fund, superannuation, pension, employee state insurance scheme - Defined Benefit plans such as provident fund and Gratuity In case of Provident fund, contributions are made to a Trust administered by the Company, except in case of certain employees, where the
Contributions are made to the Regional Provident Fund Office.
Defined Contribution Plans The Company's contribution to provident fund (in case of contributions to the Regional Provident Fund office), pension and employee state
insurance scheme are considered as defined contribution plans, as the Company does not carry any further obligations apart from the contributions made on a monthly basis and are charged as an expense based on the amount of contribution required to be made.
Defined Benefit Plan The liability or asset recognised in the balance sheet in respect of defined benefit provident and gratuity plans is the present value of the
defined benefit obligation at the end of the reporting period less the fair value of plan assets. The defined benefit obligation is calculated annually by actuaries using the projected unit credit method.
The present value of the defined benefit obligation denominated in INR is determined by discounting the estimated future cash outflows by reference to market yields at the end of the reporting period on government bonds that have terms approximating to the terms of the related obligation.
Annual Report 2017-18 | 205
Managem
ent Discussion & Analysis
Strategic Overview
Board &
Managem
ent ProfilesStatutory Reports
Financial Statements
NOTES TO FINANCIAL STATEMENTS (Contd.)for the Year ended March 31, 2018
The net interest cost is calculated by applying the discount rate to the net balance of the defined benefit obligation and the fair value of plan assets. This cost is included in employee benefit expense in the statement of profit and loss.
Remeasurement gains and losses arising from experience adjustments, changes in actuarial assumptions and return on plan assets (excluding interest income) are recognised in the period in which they occur, directly in other comprehensive income. They are included in retained earnings in the statement of changes in equity and in the balance sheet.
Changes in the present value of the defined benefit obligation resulting from plan amendments or curtailments are recognised immediately in profit or loss as past service cost.
Bonus Plans The Company recognises a liability and an expense for bonuses. The Company recognises a provision where contractually obliged or where
there is a past practice that has created a constructive obligation.
x) Provisions and Contingent Liabilities Provisions are recognised when there is a present obligation (legal or constructive) as a result of a past event, it is probable that an outflow of
resources embodying economic benefits will be required to settle the obligation and there is a reliable estimate of the amount of the obligation. When a provision is measured using the cash flows estimated to settle the present obligation, its carrying amount is the present value of those cash flows (when the effect of the time value of money is material). The discount rate used to determine the present value is a pre-tax rate that reflects current market assessments of the time value of money and the risks specific to the liability. The increase in the provision due to the passage of time is recognised as interest expense.
Contingent liabilities are disclosed when there is a possible obligation arising from past events, the existence of which will be confirmed only by the occurrence or non occurrence of one or more uncertain future events not wholly within the control of the Company or a present obligation that arises from past events where it is either not probable that an outflow of resources will be required to settle the obligation or a reliable estimate of the amount cannot be made.
xi) Revenue recognition Revenue is measured at the fair value of the consideration received or receivable.
Sale of goods: Revenue from the sale of goods is recognised when the significant risks and rewards of ownership of the goods have passed to the buyer, based on the applicable incoterms. Amounts disclosed as revenue are inclusive of excise duty and net of returns, trade allowances, rebates, goods and service tax, value added taxes and amounts collected on behalf of third parties. The Company recognises revenue when the amount of revenue can be reliably measured, it is probable that future economic benefits will flow to the Company and the revenue recognition criteria have been complied.
Sale of Services: In contracts involving the rendering of services/development contracts, revenue is measured using the proportionate completion method and is recognised net of service tax and goods and service tax (provided that it is probable that the economic benefits will flow to the Company and the amount of income can be measured reliably).
Interest: Interest income from a financial asset is recognised when it is probable that the economic benefits will flow to the Company and the amount of income can be measured reliably. Interest income is accrued on a time basis, by reference to the amortised cost and at the effective interest rate applicable.
Dividend: Dividend income from investments is recognised when the shareholder's right to receive payment has been established (provided that it is probable that the economic benefits will flow to the Company and the amount of income can be measured reliably).
206 | Piramal Enterprises Limited
NOTES TO FINANCIAL STATEMENTS (Contd.)for the Year ended March 31, 2018
STANDALONE FINANCIAL STATEMENTS
xii) Foreign Currency Transactions In preparing the financial statements of the Company, transactions in currencies other than the Company’s functional currency viz. Indian
Rupee are recognised at the rates of exchange prevailing at the dates of the transactions. Foreign exchange gains and losses resulting from the settlement of such transactions and from the translation of monetary assets and liabilities denominated in foreign currencies at year end exchange rates are generally recognised in profit or loss. Non-monetary items carried at fair value that are denominated in foreign currencies are translated at the rates prevailing at the date when the fair value was determined. Non-monetary items that are measured in terms of historical cost in a foreign currency are not retranslated.
Exchange differences on monetary items are recognised in profit or loss in the period in which they arise.
xiii) Exceptional Items When items of income and expense within profit or loss from ordinary activities are of such size, nature or incidence that their disclosure is
relevant to explain the performance of the enterprise for the period, the nature and amount of such items is disclosed separately as Exceptional items.
xiv) Excise Duty The excise duty in respect of closing inventory of finished goods was included as part of inventory upto June 30, 2017. From July 1, 2017 Excise
duty has been subsumed into Goods and Service tax and hence closing inventory does not include excise duty. The excise duty charged to the Statement of Profit and Loss includes the difference between the Excise duty on opening stock and closing stock as on June 30, 2017.
xv) Leases Operating Leases Leases in which a significant portion of the risks and rewards of ownership are not transferred to the Company as lessee are classified as
operating leases.
In the event that lease incentives are received to enter into operating leases, such incentives are recognised as a liability. Payments made under operating leases (net of any incentives received from the lessor) are charged to profit or loss on a straight-line basis over the period of the lease unless the payments are structured to increase in line with expected general inflation to compensate for the lessor’s expected inflationary cost increases.
xvi) Taxes on Income Tax expense for the period, comprising current tax and deferred tax, are included in the determination of the net profit or loss for the period.
Current tax is measured at the amount expected to be paid to the tax authorities in accordance with the Income Tax Act, 1961.
Deferred tax is recognised on temporary differences between the carrying amounts of assets and liabilities in the separate financial statements and the corresponding tax bases used in the computation of taxable profit. Deferred tax liabilities are generally recognised for all taxable temporary differences. Deferred tax assets are generally recognised for all deductible temporary differences to the extent that it is probable that taxable profits will be available against which those deductible temporary differences can be utilised. Such deferred tax assets and liabilities are not recognised if the temporary difference arises from the initial recognition (other than in a business combination) of assets and liabilities in a transaction that affects neither the taxable profit nor the accounting profit. In addition, deferred tax liabilities are not recognised if the temporary difference arises from the initial recognition of goodwill.
The carrying amount of deferred tax assets is reviewed at the end of each reporting period and reduced to the extent that it is no longer probable that sufficient taxable profits will be available to allow all or part of the asset to be recovered.
Deferred tax liabilities and assets are measured at the tax rates that are expected to apply in the period in which the liability is settled or the asset realised, based on tax rates (and tax laws) that have been enacted or substantively enacted by the end of the reporting period.
Annual Report 2017-18 | 207
Managem
ent Discussion & Analysis
Strategic Overview
Board &
Managem
ent ProfilesStatutory Reports
Financial Statements
NOTES TO FINANCIAL STATEMENTS (Contd.)for the Year ended March 31, 2018
Current and deferred tax are recognised in profit or loss, except when they relate to items that are recognised in other comprehensive income or directly in equity, in which case, the current and deferred tax are also recognised in other comprehensive income or directly in equity respectively. Where current tax or deferred tax arises from the initial accounting for a business combination, the tax effect is included in the accounting for the business combination.
Current tax assets and current tax liabilities are offset when there is a legally enforceable right to set off the recognised amounts and there is an intention to settle the asset and the liability on a net basis. Deferred tax assets and deferred tax liabilities are offset when there is a legally enforceable right to set off assets against liabilities representing current tax and where the deferred tax assets and the deferred tax liabilities relate to taxes on income levied by the same governing taxation laws.
xvii) Cash and Cash Equivalents In the cash flow statement, cash and cash equivalents includes cash on hand, demand deposits with banks, other short-term highly liquid
investments with original maturities of three months or less that are readily convertible to known amounts of cash and which are subject to an insignificant risk of changes in value, and bank overdrafts. Bank overdrafts are shown within borrowings in current liabilities in the balance sheet.
xviii) Borrowing Costs General and specific borrowing costs directly attributable to acquisition or construction of qualifying assets (i.e. those Property Plant &
Equipments which necessarily take a substantial period of time to get ready for their intended use) are capitalised. Other borrowing costs are recognised as an expense in the period in which they are incurred.
xix) Deferred Revenue and Unbilled Revenue Amounts received from customers or billed to customers, in advance of services performed are recorded as deferred revenue under Other
Current Liabilities. Unbilled revenue included in Other Financial Assets, represents amounts recognised in respect of services performed in accordance with contract terms, not yet billed to customers as at the year end.
xx) Segment Reporting The Chairman of the Company has been identified as the Chief Operating Decision Maker (CODM) as defined by Ind AS 108, 'Operating
Segments.'
Operating segments are reported in a manner consistent with the internal reporting provided to the CODM. The accounting policies adopted for segment reporting are in conformity with the accounting policies adopted for the Company. Revenue and expenses have been identified to segments on the basis of their relationship to the operating activities of the segment. Income / Costs which relate to the Company as a whole and are not allocable to segments on a reasonable basis, have been included under Unallocated Income / Costs. Interest income and expense are not allocated to respective segments (except in case of Financial Services segment).
In accordance with Ind AS 108 ‘Operating Segments’, segment information has been given in the consolidated financial statements of the Company, which are presented in the same annual report and therefore, no separate disclosure on segment information is given in these financial statements.
xxi) Dividends Provision is made for the amount of any dividend declared, being appropriately authorised and no longer at the discretion of the entity, on or
before the end of the reporting period but not distributed at the end of the reporting period.
xxii) Standards issued but not yet effective On March 28, 2018, Ministry of Corporate Affairs ('MCA') has amongst others notified the Companies (Indian Accounting Standards) Amendment
Rules, 2018. The amendments and the new standard are applicable to the Company from April 1, 2018.
208 | Piramal Enterprises Limited
NOTES TO FINANCIAL STATEMENTS (Contd.)for the Year ended March 31, 2018
STANDALONE FINANCIAL STATEMENTS
Amendment to Ind AS 21 The Amendment to Ind AS 21 clarifies the date of the transaction for the purpose of determining the exchange rate to use on initial recognition
of the related asset, expense or income, when an entity has received or paid advance consideration in a foreign currency. The Company is evaluating the requirements of the amendment and its effect on the financial statements.
Amendment to Ind AS 12 The amendment to Ind AS clarifies that determining temporary differences and estimating probable future taxable profit against which
deductible temporary differences are assessed for utilisation are two separate steps and the carrying amount of an asset is relevant only to determine temporary differences. The carrying amount of an asset does not limit the estimation of probable inflow of taxable economic benefits that results from recovering an asset. The Company is evaluating the requirements of the amendment and its effect on the financial statements.
Notification of new standard Ind AS 115 The new standard replaces existing revenue recognition standards Ind AS 11, 'Construction Contracts', Ind AS 18, 'Revenue' and revised guidance
note of the Institute of Chartered Accountants of India on Accounting for Real Estate Transactions for Ind AS entities issued in 2016.The core principle of the new standard is that an entity should recognise revenue to depict the transfer of promised goods or services to customers in an amount that reflects the consideration to which the entity expects to be entitled in exchange for those goods or services. Further the new standard requires enhanced disclosures about the nature, amount, timing and uncertainty of revenue and cash flows arising from the entity’s contracts with customers. The Company is evaluating the requirements of the amendment and its effect on the financial statements
xxiii) Rounding of amounts All amounts disclosed in the financial statements and notes have been rounded off to the nearest Crores as per the requirement of Schedule
III, unless otherwise stated.
2b. Critical accounting judgements and key sources of estimation uncertainties The preparation of the financial statements in conformity with Ind AS requires the Management to make estimates and assumptions considered
in the reported amounts of assets and liabilities (including contingent liabilities) and the reported income and expenses during the year. The Management believes that the estimates used in preparation of the financial statements are prudent and reasonable. Future results could differ due to these estimates and the differences between the actual results and the estimates are recognised in the periods in which the results are known / materialise.
Fair Valuation Some of the Company’s assets and liabilities are measured at fair value for financial reporting purposes. In estimating the fair value of an asset
and liability, the Company uses market observable data to the extent it is available. When Level 1 inputs are not available, the Company engages third party qualified external valuer to establish the appropriate valuation techniques and inputs to the valuation model.
Information about the valuation techniques and inputs used in determining the fair value of various assets and liabilities are disclosed in Note 50.
Expected Credit Loss When determining whether the risk of default on a financial instrument has increased significantly since initial recognition, the Company
considers reasonable and supportable information that is relevant and available without undue cost or effort. This includes both quantitative and qualitative information and analysis, based on the Company’s historical experience and credit assessment and including forward-looking information.
The inputs used and process followed by the Company in determining the increase in credit risk have been detailed in Note 46f.
Impairment loss in Investments carried at cost The Company conducts impairment reviews of investments in subsidiaries/ associates/ joint arrangements whenever events or changes in
circumstances indicate that their carrying amounts may not be recoverable or tests for impairment annually. Determining whether an asset
Annual Report 2017-18 | 209
Managem
ent Discussion & Analysis
Strategic Overview
Board &
Managem
ent ProfilesStatutory Reports
Financial Statements
NOTES TO FINANCIAL STATEMENTS (Contd.)for the Year ended March 31, 2018
is impaired requires an estimation of the recoverable amount, which requires the Company to estimate the value in use which base on future cash flows and a suitable discount rate in order to calculate the present value.
Useful life of Assets Property, plant and equipment and Intangible Assets represent a significant proportion of the assets of the Company. Depreciation and
amortisation is derived after determining an estimate of an asset’s expected useful life and the expected residual value at the end of its life. The useful lives and residual values of Company's assets are determined by management at the time the asset is acquired and reviewed periodically, including at each financial year end. The lives are based on historical experience with similar assets as well as anticipation of future events, which may impact their life, such as changes in technology.
Deferred Taxes Deferred tax is recorded on temporary differences between the tax bases of assets and liabilities and their carrying amounts, at the rates
that have been enacted or substantively enacted at the reporting date. The ultimate realisation of deferred tax assets is dependent upon the generation of future taxable profits during the periods in which those temporary differences and tax loss carry-forwards become deductible. The Company considers the expected reversal of deferred tax liabilities and projected future taxable income in making this assessment. The amount of the deferred tax assets considered realisable, however, could be reduced in the near term if estimates of future taxable income during the carry-forward period are reduced.
Defined benefit plans The cost of the defined benefit plans and the present value of the defined benefit obligation are based on actuarial valuation using the
projected unit credit method. An actuarial valuation involves making various assumptions that may differ from actual developments in the future. These include the determination of the discount rate, future salary increases and mortality rates. Due to the complexities involved in the valuation and its long-term nature, a defined benefit obligation is highly sensitive to changes in these assumptions. All assumptions are reviewed at each reporting date.
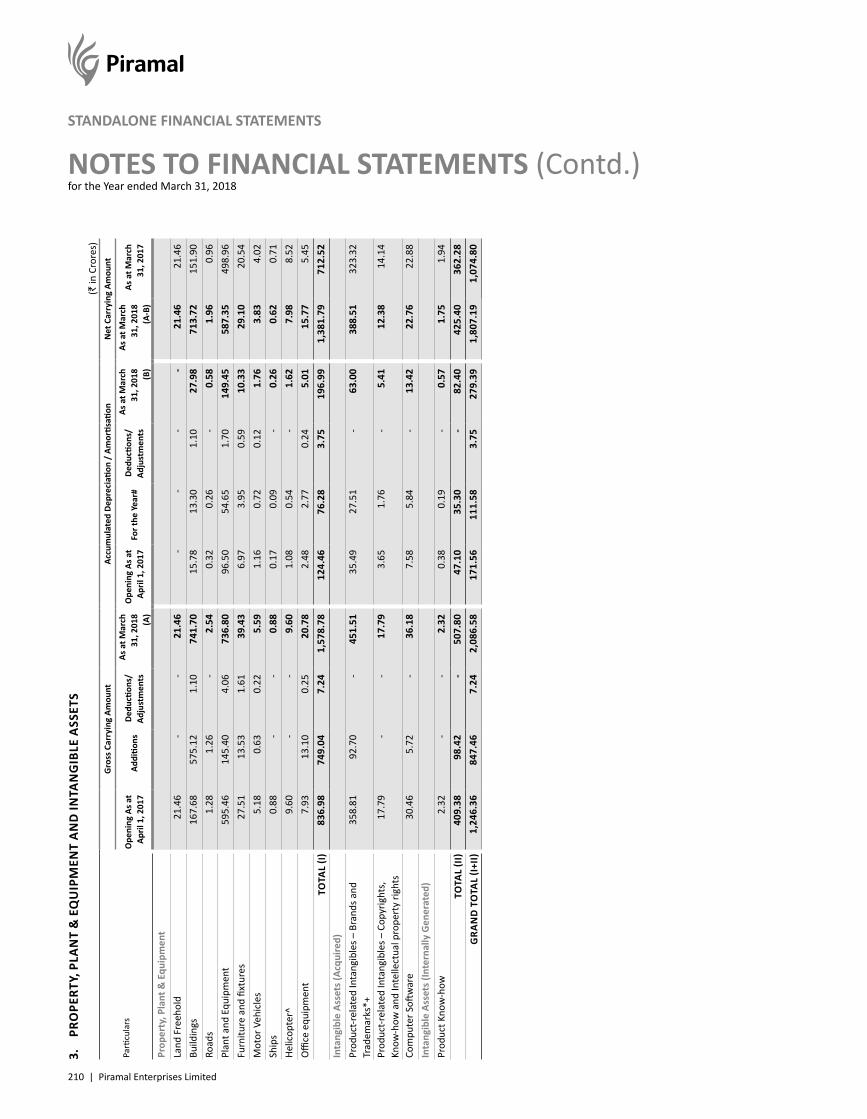
210 | Piramal Enterprises Limited
NOTES TO FINANCIAL STATEMENTS (Contd.)for the Year ended March 31, 2018
STANDALONE FINANCIAL STATEMENTS
3.
PRO
PERT
Y, P
LAN
T &
EQ
UIP
MEN
T A
ND
INTA
NG
IBLE
ASS
ETS
(` in
Cro
res)
Parti
cula
rs
Gro
ss C
arry
ing
Amou
ntAc
cum
ulat
ed D
epre
ciati
on /
Am
ortis
ation
Net
Car
ryin
g Am
ount
Ope
ning
As a
t Ap
ril 1
, 201
7Ad
ditio
nsDe
ducti
ons/
Ad
just
men
ts
As a
t Mar
ch
31, 2
018
(A)
Ope
ning
As a
t Ap
ril 1
, 201
7 F
or th
e Ye
ar#
Dedu
ction
s/
Adju
stm
ents
As a
t Mar
ch
31, 2
018
(B)
As a
t Mar
ch
31, 2
018
(A-B
)
As a
t Mar
ch
31, 2
017
Prop
erty
, Pla
nt &
Equ
ipm
ent
Land
Fre
ehol
d 2
1.46
- -
21.
46 -
- -
- 2
1.46
21.
46Bu
ildin
gs 1
67.6
8 5
75.1
2 1
.10
741
.70
15.
78 1
3.30
1.1
0 2
7.98
713
.72
151
.90
Road
s 1
.28
1.2
6 -
2.5
4 0
.32
0.2
6 -
0.5
8 1
.96
0.9
6Pl
ant a
nd E
quip
men
t 5
95.4
6 1
45.4
0 4
.06
736
.80
96.
50 5
4.65
1.7
0 1
49.4
5 5
87.3
5 4
98.9
6Fu
rnitu
re a
nd fi
xtur
es 2
7.51
13.
53 1
.61
39.
43 6
.97
3.9
5 0
.59
10.
33 2
9.10
20.
54M
otor
Veh
icle
s 5
.18
0.6
3 0
.22
5.5
9 1
.16
0.7
2 0
.12
1.7
6 3
.83
4.0
2Sh
ips
0.8
8 -
- 0
.88
0.1
7 0
.09
- 0
.26
0.6
2 0
.71
Helic
opte
r^ 9
.60
- -
9.6
0 1
.08
0.5
4 -
1.6
2 7
.98
8.5
2O
ffice
equ
ipm
ent
7.9
3 1
3.10
0.2
5 2
0.78
2.4
8 2
.77
0.2
4 5
.01
15.
77 5
.45
TOTA
L (I)
836
.98
749
.04
7.2
4 1
,578
.78
124
.46
76.
28 3
.75
196
.99
1,3
81.7
9 7
12.5
2In
tang
ible
Ass
ets (
Acqu
ired)
Prod
uct-r
elat
ed In
tang
ible
s – B
rand
s and
Tr
adem
arks
*+ 3
58.8
1 9
2.70
- 4
51.5
1 3
5.49
27.
51 -
63.
00 3
88.5
1 3
23.3
2
Prod
uct-r
elat
ed In
tang
ible
s – C
opyr
ight
s,
Know
-how
and
Inte
llect
ual p
rope
rty
right
s 1
7.79
- -
17.
79 3
.65
1.7
6 -
5.4
1 1
2.38
14.
14
Com
pute
r Soft
war
e 3
0.46
5.7
2 -
36.
18 7
.58
5.8
4 -
13.
42 2
2.76
22.
88In
tang
ible
Ass
ets (
Inte
rnal
ly G
ener
ated
)Pr
oduc
t Kno
w-h
ow 2
.32
- -
2.3
2 0
.38
0.1
9 -
0.5
7 1
.75
1.9
4TO
TAL
(II)
409
.38
98.
42 -
507
.80
47.
10 3
5.30
- 8
2.40
425
.40
362
.28
GRA
ND
TO
TAL
(I+II)
1,2
46.3
6 8
47.4
6 7
.24
2,0
86.5
8 1
71.5
6 1
11.5
8 3
.75
279
.39
1,8
07.1
9 1
,074
.80
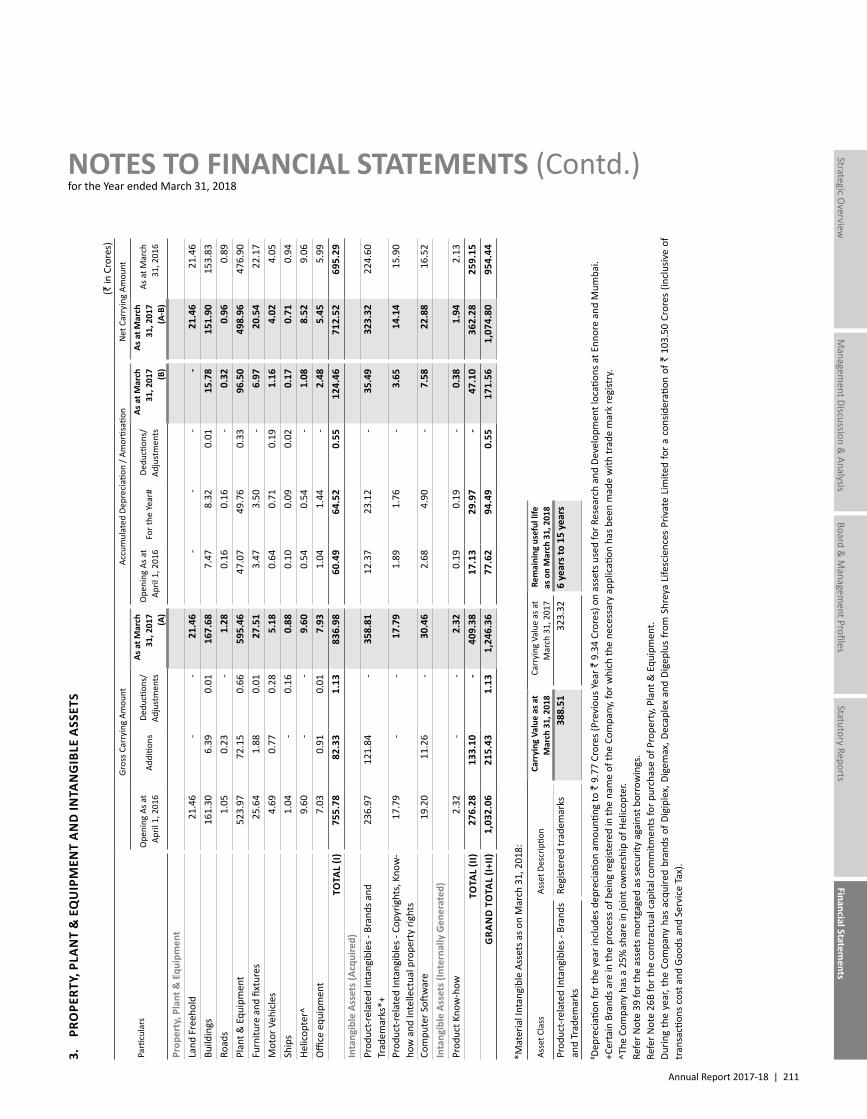
Annual Report 2017-18 | 211
Managem
ent Discussion & Analysis
Strategic Overview
Board &
Managem
ent ProfilesStatutory Reports
Financial Statements
NOTES TO FINANCIAL STATEMENTS (Contd.)for the Year ended March 31, 2018
(` in
Cro
res)
Parti
cula
rs
Gros
s Car
ryin
g Am
ount
Accu
mul
ated
Dep
reci
ation
/ Am
ortis
ation
Net
Car
ryin
g Am
ount
Ope
ning
As a
t Ap
ril 1
, 201
6Ad
ditio
nsDe
ducti
ons/
Ad
just
men
ts
As a
t Mar
ch
31, 2
017
(A)
Ope
ning
As a
t Ap
ril 1
, 201
6 F
or th
e Ye
ar#
Dedu
ction
s/
Adju
stm
ents
As a
t Mar
ch
31, 2
017
(B)
As a
t Mar
ch
31, 2
017
(A-B
)
As a
t Mar
ch
31, 2
016
Prop
erty
, Pla
nt &
Equ
ipm
ent
Land
Fre
ehol
d 2
1.46
- -
21.
46 -
- -
- 2
1.46
21.
46Bu
ildin
gs 1
61.3
0 6
.39
0.0
1 1
67.6
8 7
.47
8.3
2 0
.01
15.
78 1
51.9
0 1
53.8
3Ro
ads
1.0
5 0
.23
- 1
.28
0.1
6 0
.16
- 0
.32
0.9
6 0
.89
Plan
t & E
quip
men
t 5
23.9
7 7
2.15
0.6
6 5
95.4
6 4
7.07
49.
76 0
.33
96.
50 4
98.9
6 4
76.9
0Fu
rnitu
re a
nd fi
xtur
es 2
5.64
1.8
8 0
.01
27.
51 3
.47
3.5
0 -
6.9
7 2
0.54
22.
17M
otor
Veh
icle
s 4
.69
0.7
7 0
.28
5.1
8 0
.64
0.7
1 0
.19
1.1
6 4
.02
4.0
5Sh
ips
1.0
4 -
0.1
6 0
.88
0.1
0 0
.09
0.0
2 0
.17
0.7
1 0
.94
Helic
opte
r^ 9
.60
- -
9.6
0 0
.54
0.5
4 -
1.0
8 8
.52
9.0
6O
ffice
equ
ipm
ent
7.0
3 0
.91
0.0
1 7
.93
1.0
4 1
.44
- 2
.48
5.4
5 5
.99
TOTA
L (I)
755
.78
82.
33 1
.13
836
.98
60.
49 6
4.52
0.5
5 1
24.4
6 7
12.5
2 6
95.2
9In
tang
ible
Ass
ets (
Acqu
ired)
Prod
uct-r
elat
ed In
tang
ible
s - B
rand
s and
Tr
adem
arks
*+ 2
36.9
7 1
21.8
4 -
358
.81
12.
37 2
3.12
- 3
5.49
323
.32
224
.60
Prod
uct-r
elat
ed In
tang
ible
s - C
opyr
ight
s, K
now
-ho
w a
nd In
telle
ctua
l pro
pert
y rig
hts
17.
79 -
- 1
7.79
1.8
9 1
.76
- 3
.65
14.
14 1
5.90
Com
pute
r Soft
war
e 1
9.20
11.
26 -
30.
46 2
.68
4.9
0 -
7.5
8 2
2.88
16.
52In
tang
ible
Ass
ets (
Inte
rnal
ly G
ener
ated
)Pr
oduc
t Kno
w-h
ow 2
.32
- -
2.3
2 0
.19
0.1
9 -
0.3
8 1
.94
2.1
3TO
TAL
(II)
276
.28
133
.10
- 4
09.3
8 1
7.13
29.
97 -
47.
10 3
62.2
8 2
59.1
5G
RAN
D T
OTA
L (I+
II) 1
,032
.06
215
.43
1.1
3 1
,246
.36
77.
62 9
4.49
0.5
5 1
71.5
6 1
,074
.80
954
.44
*Mat
eria
l Int
angi
ble
Asse
ts a
s on
Mar
ch 3
1, 2
018:
Asse
t Cla
ssAs
set D
escr
iptio
nCa
rryi
ng V
alue
as a
t M
arch
31,
201
8Ca
rryi
ng V
alue
as a
t M
arch
31,
201
7Re
mai
ning
use
ful l
ife
as o
n M
arch
31,
201
8Pr
oduc
t-rel
ated
Inta
ngib
les -
Bra
nds
and
Trad
emar
ksRe
gist
ered
trad
emar
ks 3
88.5
132
3.32
6 ye
ars t
o 15
yea
rs
# Depr
ecia
tion
for t
he y
ear i
nclu
des d
epre
ciati
on a
mou
nting
to `
9.7
7 Cr
ores
(Pre
viou
s Yea
r ` 9
.34
Cror
es) o
n as
sets
use
d fo
r Res
earc
h an
d De
velo
pmen
t loc
ation
s at E
nnor
e an
d M
umba
i.+C
erta
in B
rand
s are
in th
e pr
oces
s of b
eing
regi
ster
ed in
the
nam
e of
the
Com
pany
, for
whi
ch th
e ne
cess
ary
appl
icati
on h
as b
een
mad
e w
ith tr
ade
mar
k re
gist
ry.
^The
Com
pany
has
a 2
5% sh
are
in jo
int o
wne
rshi
p of
Hel
icop
ter.
Refe
r Not
e 39
for t
he a
sset
s mor
tgag
ed a
s sec
urity
aga
inst
bor
row
ings
.Re
fer N
ote
26B
for t
he c
ontr
actu
al c
apita
l com
mitm
ents
for p
urch
ase
of P
rope
rty,
Plan
t & E
quip
men
t.Du
ring
the
year
, the
Com
pany
has
acq
uire
d br
ands
of D
igip
lex,
Dig
emax
, Dec
aple
x an
d Di
gepl
us fr
om S
hrey
a Li
fesc
ienc
es P
rivat
e Li
mite
d fo
r a
cons
ider
ation
of `
103
.50
Cror
es (i
nclu
sive
of
tran
sacti
ons c
ost a
nd G
oods
and
Ser
vice
Tax
).
3.
PRO
PERT
Y, P
LAN
T &
EQ
UIP
MEN
T A
ND
INTA
NG
IBLE
ASS
ETS
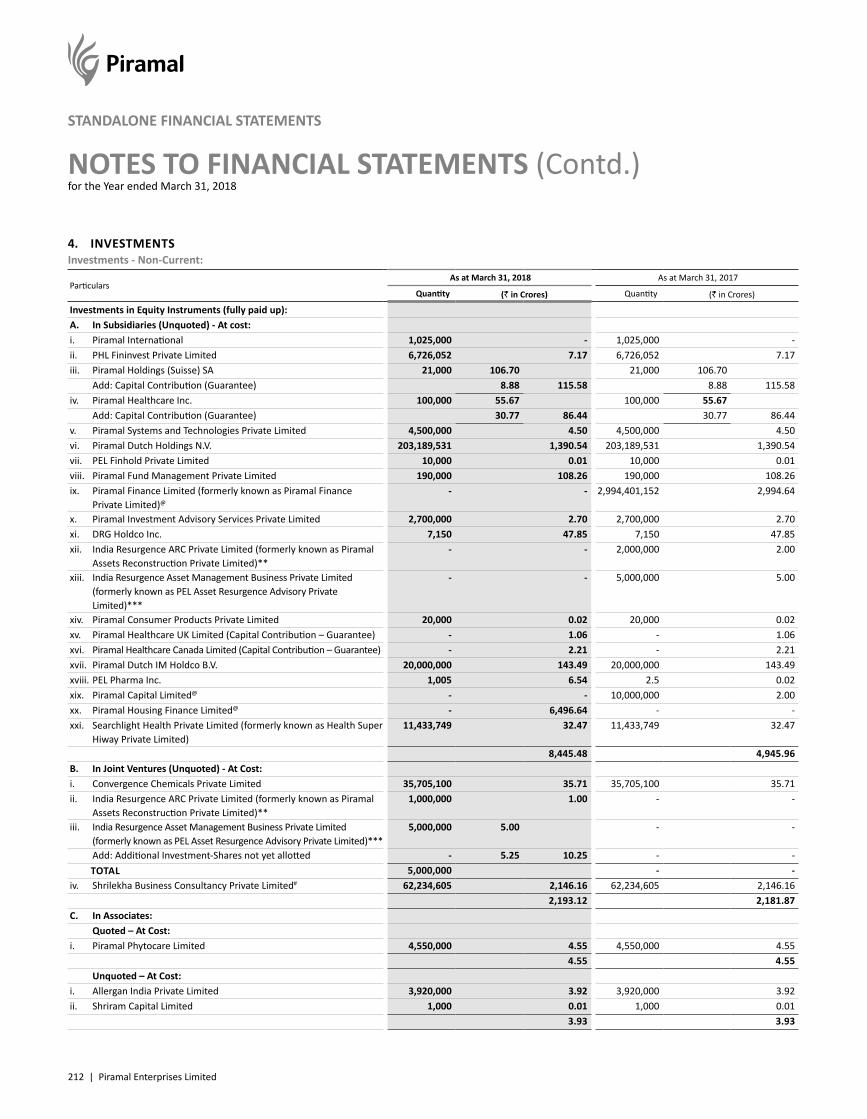
212 | Piramal Enterprises Limited
NOTES TO FINANCIAL STATEMENTS (Contd.)for the Year ended March 31, 2018
STANDALONE FINANCIAL STATEMENTS
4. INVESTMENTSInvestments - Non-Current:
Particulars As at March 31, 2018 As at March 31, 2017
Quantity (` in Crores) Quantity (` in Crores)
Investments in Equity Instruments (fully paid up):A. In Subsidiaries (Unquoted) - At cost:i. Piramal International 1,025,000 - 1,025,000 -ii. PHL Fininvest Private Limited 6,726,052 7.17 6,726,052 7.17iii. Piramal Holdings (Suisse) SA 21,000 106.70 21,000 106.70
Add: Capital Contribution (Guarantee) 8.88 115.58 8.88 115.58iv. Piramal Healthcare Inc. 100,000 55.67 100,000 55.67
Add: Capital Contribution (Guarantee) 30.77 86.44 30.77 86.44v. Piramal Systems and Technologies Private Limited 4,500,000 4.50 4,500,000 4.50vi. Piramal Dutch Holdings N.V. 203,189,531 1,390.54 203,189,531 1,390.54vii. PEL Finhold Private Limited 10,000 0.01 10,000 0.01viii. Piramal Fund Management Private Limited 190,000 108.26 190,000 108.26ix. Piramal Finance Limited (formerly known as Piramal Finance
Private Limited)@
- - 2,994,401,152 2,994.64
x. Piramal Investment Advisory Services Private Limited 2,700,000 2.70 2,700,000 2.70xi. DRG Holdco Inc. 7,150 47.85 7,150 47.85xii. India Resurgence ARC Private Limited (formerly known as Piramal
Assets Reconstruction Private Limited)** - - 2,000,000 2.00
xiii. India Resurgence Asset Management Business Private Limited (formerly known as PEL Asset Resurgence Advisory Private Limited)***
- - 5,000,000 5.00
xiv. Piramal Consumer Products Private Limited 20,000 0.02 20,000 0.02xv. Piramal Healthcare UK Limited (Capital Contribution – Guarantee) - 1.06 - 1.06xvi. Piramal Healthcare Canada Limited (Capital Contribution – Guarantee) - 2.21 - 2.21xvii. Piramal Dutch IM Holdco B.V. 20,000,000 143.49 20,000,000 143.49xviii. PEL Pharma Inc. 1,005 6.54 2.5 0.02xix. Piramal Capital Limited@ - - 10,000,000 2.00xx. Piramal Housing Finance Limited@ - 6,496.64 - -xxi. Searchlight Health Private Limited (formerly known as Health Super
Hiway Private Limited)11,433,749 32.47 11,433,749 32.47
8,445.48 4,945.96B. In Joint Ventures (Unquoted) - At Cost:i. Convergence Chemicals Private Limited 35,705,100 35.71 35,705,100 35.71ii. India Resurgence ARC Private Limited (formerly known as Piramal
Assets Reconstruction Private Limited)**1,000,000 1.00 - -
iii. India Resurgence Asset Management Business Private Limited (formerly known as PEL Asset Resurgence Advisory Private Limited)***
5,000,000 5.00 - -
Add: Additional Investment-Shares not yet allotted - 5.25 10.25 - -TOTAL 5,000,000 - -
iv. Shrilekha Business Consultancy Private Limited# 62,234,605 2,146.16 62,234,605 2,146.16 2,193.12 2,181.87
C. In Associates:Quoted – At Cost:
i. Piramal Phytocare Limited 4,550,000 4.55 4,550,000 4.55 4.55 4.55
Unquoted – At Cost:i. Allergan India Private Limited 3,920,000 3.92 3,920,000 3.92ii. Shriram Capital Limited 1,000 0.01 1,000 0.01
3.93 3.93
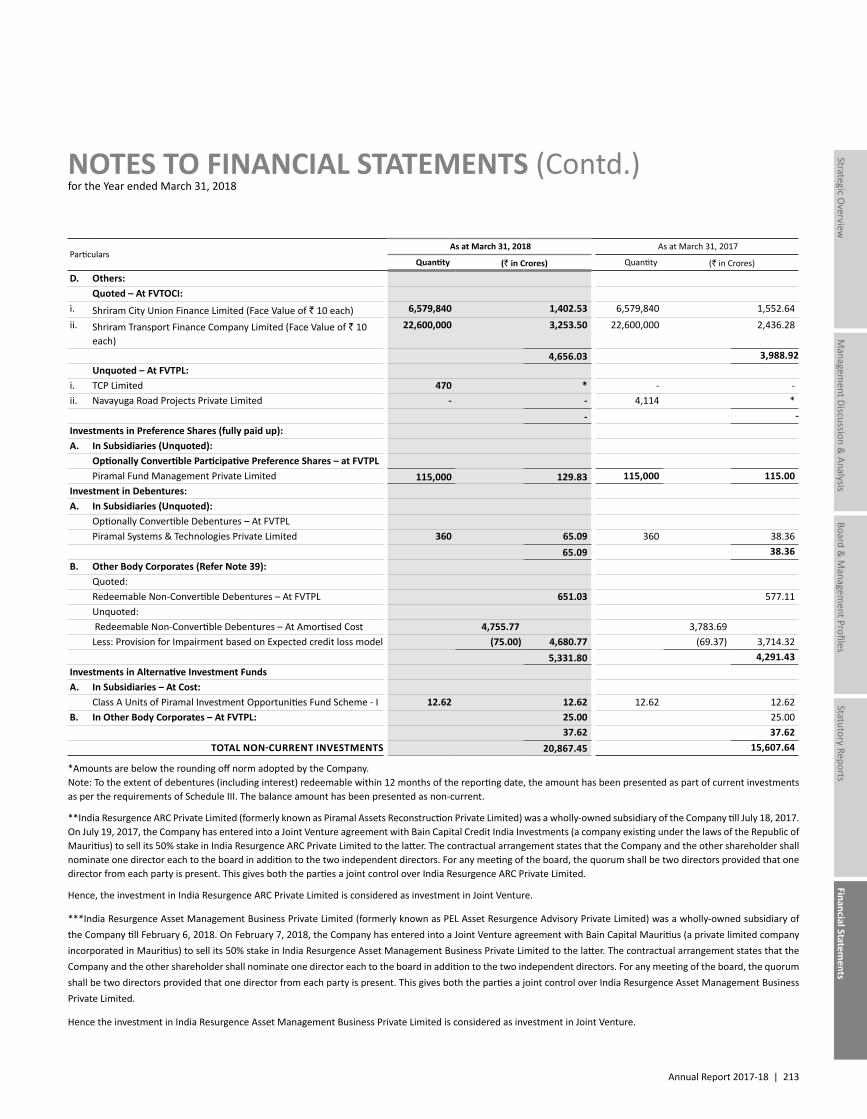
Annual Report 2017-18 | 213
Managem
ent Discussion & Analysis
Strategic Overview
Board &
Managem
ent ProfilesStatutory Reports
Financial Statements
NOTES TO FINANCIAL STATEMENTS (Contd.)for the Year ended March 31, 2018
Particulars As at March 31, 2018 As at March 31, 2017
Quantity (` in Crores) Quantity (` in Crores)
D. Others:Quoted – At FVTOCI:
i. Shriram City Union Finance Limited (Face Value of ` 10 each) 6,579,840 1,402.53 6,579,840 1,552.64ii. Shriram Transport Finance Company Limited (Face Value of ` 10
each)22,600,000 3,253.50 22,600,000 2,436.28
4,656.03 3,988.92Unquoted – At FVTPL:
i. TCP Limited 470 * - -ii. Navayuga Road Projects Private Limited - - 4,114 *
- -Investments in Preference Shares (fully paid up):A. In Subsidiaries (Unquoted):
Optionally Convertible Participative Preference Shares – at FVTPLPiramal Fund Management Private Limited 115,000 129.83 115,000 115.00
Investment in Debentures:A. In Subsidiaries (Unquoted):
Optionally Convertible Debentures – At FVTPLPiramal Systems & Technologies Private Limited 360 65.09 360 38.36
65.09 38.36B. Other Body Corporates (Refer Note 39):
Quoted:Redeemable Non-Convertible Debentures – At FVTPL 651.03 577.11Unquoted: Redeemable Non-Convertible Debentures – At Amortised Cost 4,755.77 3,783.69Less: Provision for Impairment based on Expected credit loss model (75.00) 4,680.77 (69.37) 3,714.32
5,331.80 4,291.43Investments in Alternative Investment FundsA. In Subsidiaries – At Cost:
Class A Units of Piramal Investment Opportunities Fund Scheme - I 12.62 12.62 12.62 12.62B. In Other Body Corporates – At FVTPL: 25.00 25.00
37.62 37.62TOTAL NON-CURRENT INVESTMENTS 20,867.45 15,607.64
*Amounts are below the rounding off norm adopted by the Company.Note: To the extent of debentures (including interest) redeemable within 12 months of the reporting date, the amount has been presented as part of current investments as per the requirements of Schedule III. The balance amount has been presented as non-current.
**India Resurgence ARC Private Limited (formerly known as Piramal Assets Reconstruction Private Limited) was a wholly-owned subsidiary of the Company till July 18, 2017. On July 19, 2017, the Company has entered into a Joint Venture agreement with Bain Capital Credit India Investments (a company existing under the laws of the Republic of Mauritius) to sell its 50% stake in India Resurgence ARC Private Limited to the latter. The contractual arrangement states that the Company and the other shareholder shall nominate one director each to the board in addition to the two independent directors. For any meeting of the board, the quorum shall be two directors provided that one director from each party is present. This gives both the parties a joint control over India Resurgence ARC Private Limited.
Hence, the investment in India Resurgence ARC Private Limited is considered as investment in Joint Venture.
***India Resurgence Asset Management Business Private Limited (formerly known as PEL Asset Resurgence Advisory Private Limited) was a wholly-owned subsidiary of the Company till February 6, 2018. On February 7, 2018, the Company has entered into a Joint Venture agreement with Bain Capital Mauritius (a private limited company incorporated in Mauritius) to sell its 50% stake in India Resurgence Asset Management Business Private Limited to the latter. The contractual arrangement states that the Company and the other shareholder shall nominate one director each to the board in addition to the two independent directors. For any meeting of the board, the quorum shall be two directors provided that one director from each party is present. This gives both the parties a joint control over India Resurgence Asset Management Business Private Limited.
Hence the investment in India Resurgence Asset Management Business Private Limited is considered as investment in Joint Venture.
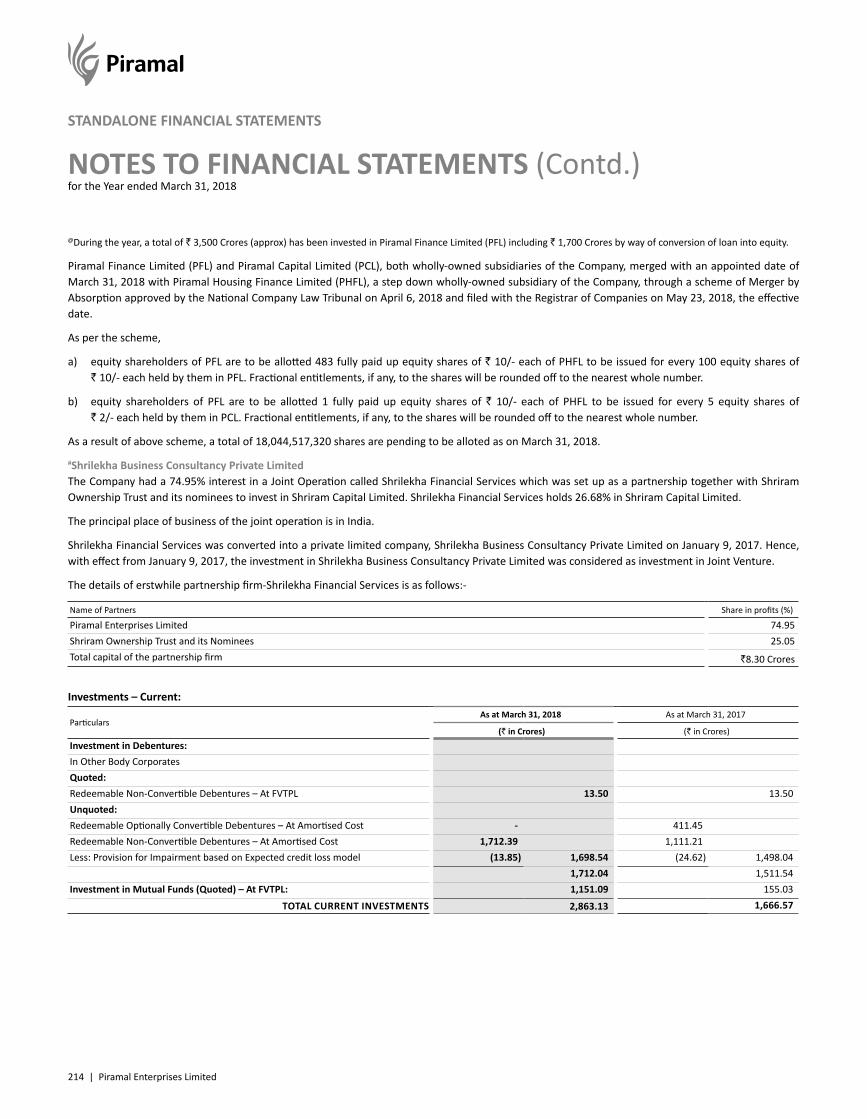
214 | Piramal Enterprises Limited
NOTES TO FINANCIAL STATEMENTS (Contd.)for the Year ended March 31, 2018
STANDALONE FINANCIAL STATEMENTS
@During the year, a total of ` 3,500 Crores (approx) has been invested in Piramal Finance Limited (PFL) including ` 1,700 Crores by way of conversion of loan into equity.
Piramal Finance Limited (PFL) and Piramal Capital Limited (PCL), both wholly-owned subsidiaries of the Company, merged with an appointed date of March 31, 2018 with Piramal Housing Finance Limited (PHFL), a step down wholly-owned subsidiary of the Company, through a scheme of Merger by Absorption approved by the National Company Law Tribunal on April 6, 2018 and filed with the Registrar of Companies on May 23, 2018, the effective date.
As per the scheme,
a) equity shareholders of PFL are to be allotted 483 fully paid up equity shares of ` 10/- each of PHFL to be issued for every 100 equity shares of ` 10/- each held by them in PFL. Fractional entitlements, if any, to the shares will be rounded off to the nearest whole number.
b) equity shareholders of PFL are to be allotted 1 fully paid up equity shares of ` 10/- each of PHFL to be issued for every 5 equity shares of ` 2/- each held by them in PCL. Fractional entitlements, if any, to the shares will be rounded off to the nearest whole number.
As a result of above scheme, a total of 18,044,517,320 shares are pending to be alloted as on March 31, 2018.
#Shrilekha Business Consultancy Private LimitedThe Company had a 74.95% interest in a Joint Operation called Shrilekha Financial Services which was set up as a partnership together with Shriram Ownership Trust and its nominees to invest in Shriram Capital Limited. Shrilekha Financial Services holds 26.68% in Shriram Capital Limited.
The principal place of business of the joint operation is in India.
Shrilekha Financial Services was converted into a private limited company, Shrilekha Business Consultancy Private Limited on January 9, 2017. Hence, with effect from January 9, 2017, the investment in Shrilekha Business Consultancy Private Limited was considered as investment in Joint Venture.
The details of erstwhile partnership firm-Shrilekha Financial Services is as follows:-
Name of Partners Share in profits (%)
Piramal Enterprises Limited 74.95Shriram Ownership Trust and its Nominees 25.05Total capital of the partnership firm `8.30 Crores
Investments – Current:
ParticularsAs at March 31, 2018 As at March 31, 2017
(` in Crores) (` in Crores) Investment in Debentures:In Other Body CorporatesQuoted:Redeemable Non-Convertible Debentures – At FVTPL 13.50 13.50Unquoted:Redeemable Optionally Convertible Debentures – At Amortised Cost - 411.45 Redeemable Non-Convertible Debentures – At Amortised Cost 1,712.39 1,111.21 Less: Provision for Impairment based on Expected credit loss model (13.85) 1,698.54 (24.62) 1,498.04
1,712.04 1,511.54Investment in Mutual Funds (Quoted) – At FVTPL: 1,151.09 155.03
TOTAL CURRENT INVESTMENTS 2,863.13 1,666.57
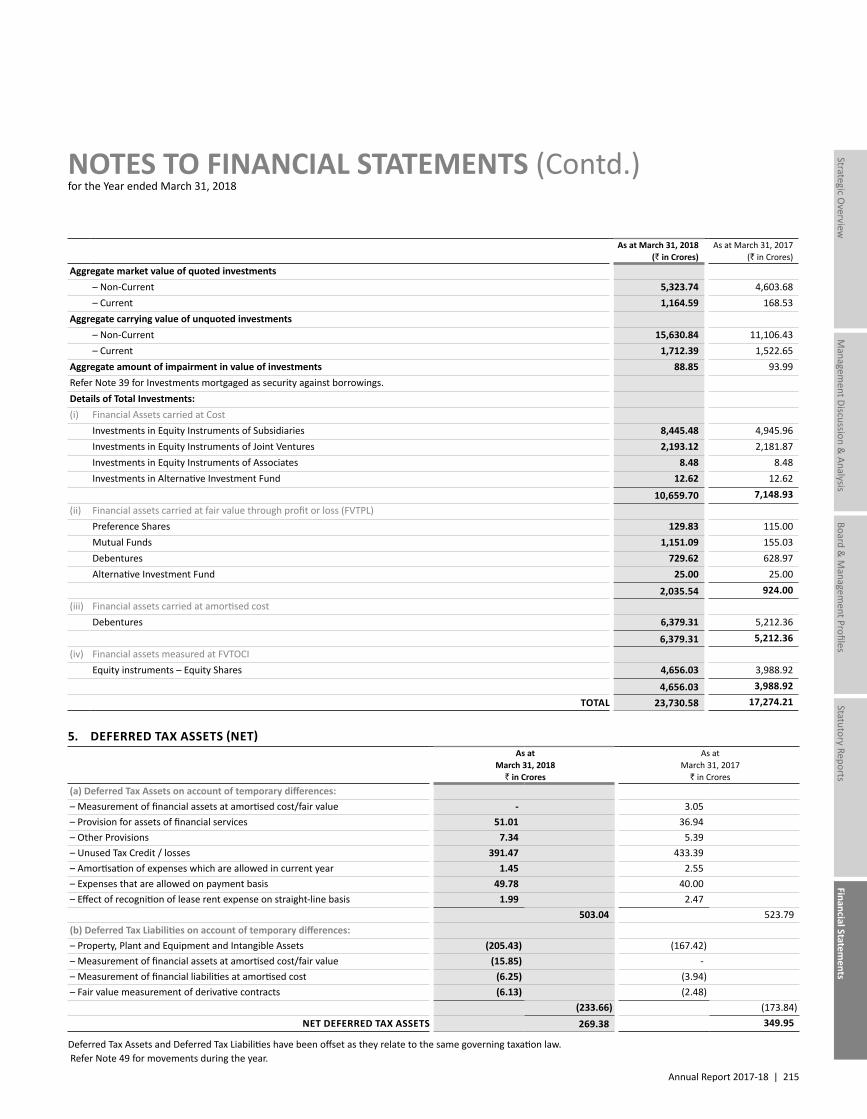
Annual Report 2017-18 | 215
Managem
ent Discussion & Analysis
Strategic Overview
Board &
Managem
ent ProfilesStatutory Reports
Financial Statements
NOTES TO FINANCIAL STATEMENTS (Contd.)for the Year ended March 31, 2018
As at March 31, 2018 (` in Crores)
As at March 31, 2017 (` in Crores)
Aggregate market value of quoted investments– Non-Current 5,323.74 4,603.68– Current 1,164.59 168.53
Aggregate carrying value of unquoted investments– Non-Current 15,630.84 11,106.43– Current 1,712.39 1,522.65
Aggregate amount of impairment in value of investments 88.85 93.99Refer Note 39 for Investments mortgaged as security against borrowings.Details of Total Investments:(i) Financial Assets carried at Cost
Investments in Equity Instruments of Subsidiaries 8,445.48 4,945.96Investments in Equity Instruments of Joint Ventures 2,193.12 2,181.87Investments in Equity Instruments of Associates 8.48 8.48Investments in Alternative Investment Fund 12.62 12.62
10,659.70 7,148.93(ii) Financial assets carried at fair value through profit or loss (FVTPL)
Preference Shares 129.83 115.00Mutual Funds 1,151.09 155.03Debentures 729.62 628.97Alternative Investment Fund 25.00 25.00
2,035.54 924.00(iii) Financial assets carried at amortised cost
Debentures 6,379.31 5,212.36
6,379.31 5,212.36(iv) Financial assets measured at FVTOCI
Equity instruments – Equity Shares 4,656.03 3,988.92
4,656.03 3,988.92TOTAL 23,730.58 17,274.21
5. DEFERRED TAX ASSETS (NET) As at
March 31, 2018 ` in Crores
As at March 31, 2017
` in Crores(a) Deferred Tax Assets on account of temporary differences:– Measurement of financial assets at amortised cost/fair value - 3.05– Provision for assets of financial services 51.01 36.94– Other Provisions 7.34 5.39– Unused Tax Credit / losses 391.47 433.39– Amortisation of expenses which are allowed in current year 1.45 2.55– Expenses that are allowed on payment basis 49.78 40.00– Effect of recognition of lease rent expense on straight-line basis 1.99 2.47
503.04 523.79(b) Deferred Tax Liabilities on account of temporary differences:– Property, Plant and Equipment and Intangible Assets (205.43) (167.42)– Measurement of financial assets at amortised cost/fair value (15.85) -– Measurement of financial liabilities at amortised cost (6.25) (3.94)– Fair value measurement of derivative contracts (6.13) (2.48)
(233.66) (173.84) NET DEFERRED TAX ASSETS 269.38 349.95
Deferred Tax Assets and Deferred Tax Liabilities have been offset as they relate to the same governing taxation law. Refer Note 49 for movements during the year.
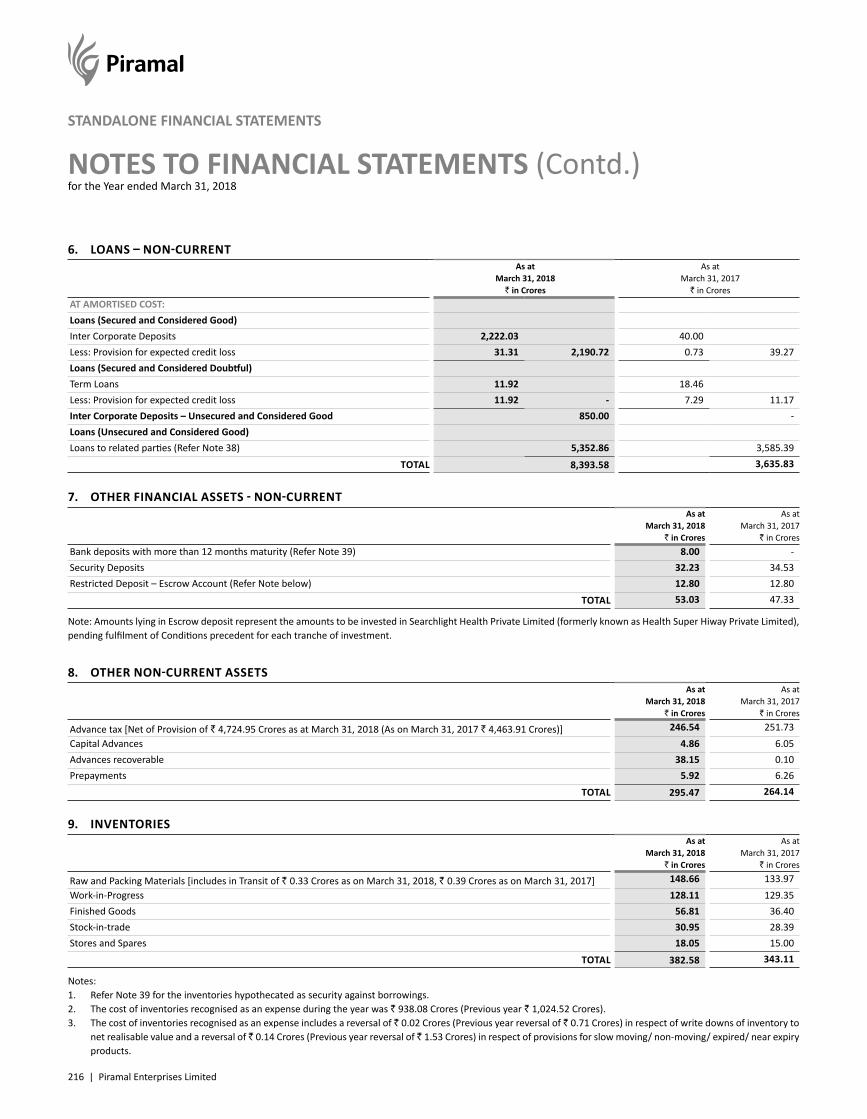
216 | Piramal Enterprises Limited
NOTES TO FINANCIAL STATEMENTS (Contd.)for the Year ended March 31, 2018
STANDALONE FINANCIAL STATEMENTS
6. LOANS – NON-CURRENT As at
March 31, 2018 ` in Crores
As at March 31, 2017
` in CroresAT AMORTISED COST:Loans (Secured and Considered Good)Inter Corporate Deposits 2,222.03 40.00Less: Provision for expected credit loss 31.31 2,190.72 0.73 39.27Loans (Secured and Considered Doubtful)Term Loans 11.92 18.46Less: Provision for expected credit loss 11.92 - 7.29 11.17Inter Corporate Deposits – Unsecured and Considered Good 850.00 -Loans (Unsecured and Considered Good)Loans to related parties (Refer Note 38) 5,352.86 3,585.39
TOTAL 8,393.58 3,635.83
7. OTHER FINANCIAL ASSETS - NON-CURRENT As at
March 31, 2018 ` in Crores
As at March 31, 2017
` in CroresBank deposits with more than 12 months maturity (Refer Note 39) 8.00 -Security Deposits 32.23 34.53Restricted Deposit – Escrow Account (Refer Note below) 12.80 12.80
TOTAL 53.03 47.33
Note: Amounts lying in Escrow deposit represent the amounts to be invested in Searchlight Health Private Limited (formerly known as Health Super Hiway Private Limited), pending fulfilment of Conditions precedent for each tranche of investment.
8. OTHER NON-CURRENT ASSETS As at
March 31, 2018 ` in Crores
As at March 31, 2017
` in Crores
Advance tax [Net of Provision of ` 4,724.95 Crores as at March 31, 2018 (As on March 31, 2017 ` 4,463.91 Crores)] 246.54 251.73Capital Advances 4.86 6.05Advances recoverable 38.15 0.10Prepayments 5.92 6.26
TOTAL 295.47 264.14
9. INVENTORIES As at
March 31, 2018 ` in Crores
As at March 31, 2017
` in Crores
Raw and Packing Materials [includes in Transit of ` 0.33 Crores as on March 31, 2018, ` 0.39 Crores as on March 31, 2017] 148.66 133.97Work-in-Progress 128.11 129.35Finished Goods 56.81 36.40Stock-in-trade 30.95 28.39Stores and Spares 18.05 15.00
TOTAL 382.58 343.11
Notes:1. Refer Note 39 for the inventories hypothecated as security against borrowings.2. The cost of inventories recognised as an expense during the year was ` 938.08 Crores (Previous year ` 1,024.52 Crores).3. The cost of inventories recognised as an expense includes a reversal of ` 0.02 Crores (Previous year reversal of ` 0.71 Crores) in respect of write downs of inventory to
net realisable value and a reversal of ` 0.14 Crores (Previous year reversal of ` 1.53 Crores) in respect of provisions for slow moving/ non-moving/ expired/ near expiry products.
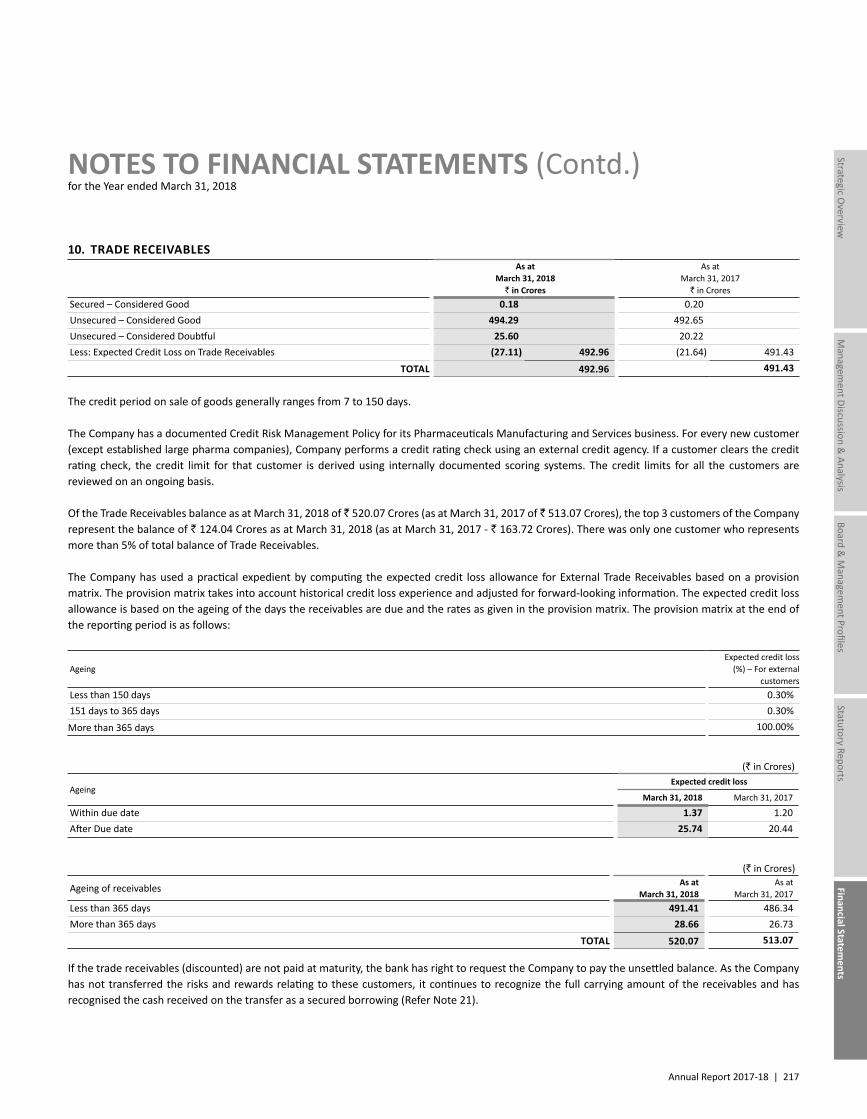
Annual Report 2017-18 | 217
Managem
ent Discussion & Analysis
Strategic Overview
Board &
Managem
ent ProfilesStatutory Reports
Financial Statements
NOTES TO FINANCIAL STATEMENTS (Contd.)for the Year ended March 31, 2018
10. TRADE RECEIVABLES As at
March 31, 2018 ` in Crores
As at March 31, 2017
` in CroresSecured – Considered Good 0.18 0.20Unsecured – Considered Good 494.29 492.65Unsecured – Considered Doubtful 25.60 20.22Less: Expected Credit Loss on Trade Receivables (27.11) 492.96 (21.64) 491.43
TOTAL 492.96 491.43
The credit period on sale of goods generally ranges from 7 to 150 days.
The Company has a documented Credit Risk Management Policy for its Pharmaceuticals Manufacturing and Services business. For every new customer (except established large pharma companies), Company performs a credit rating check using an external credit agency. If a customer clears the credit rating check, the credit limit for that customer is derived using internally documented scoring systems. The credit limits for all the customers are reviewed on an ongoing basis.
Of the Trade Receivables balance as at March 31, 2018 of ` 520.07 Crores (as at March 31, 2017 of ` 513.07 Crores), the top 3 customers of the Company represent the balance of ` 124.04 Crores as at March 31, 2018 (as at March 31, 2017 - ` 163.72 Crores). There was only one customer who represents more than 5% of total balance of Trade Receivables.
The Company has used a practical expedient by computing the expected credit loss allowance for External Trade Receivables based on a provision matrix. The provision matrix takes into account historical credit loss experience and adjusted for forward-looking information. The expected credit loss allowance is based on the ageing of the days the receivables are due and the rates as given in the provision matrix. The provision matrix at the end of the reporting period is as follows:
Ageing Expected credit loss
(%) – For external customers
Less than 150 days 0.30%151 days to 365 days 0.30%More than 365 days 100.00%
(` in Crores)
Ageing Expected credit loss
March 31, 2018 March 31, 2017
Within due date 1.37 1.20After Due date 25.74 20.44
(` in Crores)
Ageing of receivables As at March 31, 2018
As at March 31, 2017
Less than 365 days 491.41 486.34More than 365 days 28.66 26.73
TOTAL 520.07 513.07
If the trade receivables (discounted) are not paid at maturity, the bank has right to request the Company to pay the unsettled balance. As the Company has not transferred the risks and rewards relating to these customers, it continues to recognize the full carrying amount of the receivables and has recognised the cash received on the transfer as a secured borrowing (Refer Note 21).
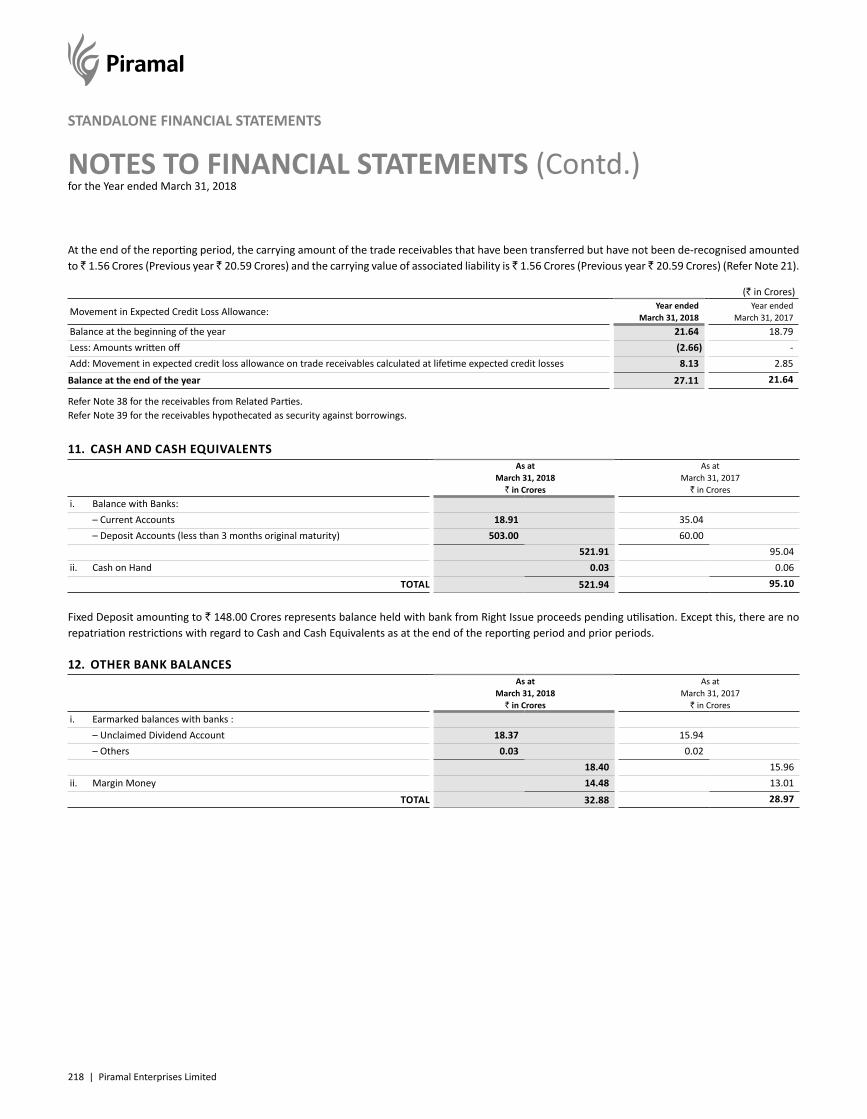
218 | Piramal Enterprises Limited
NOTES TO FINANCIAL STATEMENTS (Contd.)for the Year ended March 31, 2018
STANDALONE FINANCIAL STATEMENTS
At the end of the reporting period, the carrying amount of the trade receivables that have been transferred but have not been de-recognised amounted to ̀ 1.56 Crores (Previous year ̀ 20.59 Crores) and the carrying value of associated liability is ̀ 1.56 Crores (Previous year ̀ 20.59 Crores) (Refer Note 21).
(` in Crores)
Movement in Expected Credit Loss Allowance: Year ended March 31, 2018
Year ended March 31, 2017
Balance at the beginning of the year 21.64 18.79Less: Amounts written off (2.66) -Add: Movement in expected credit loss allowance on trade receivables calculated at lifetime expected credit losses 8.13 2.85Balance at the end of the year 27.11 21.64
Refer Note 38 for the receivables from Related Parties.Refer Note 39 for the receivables hypothecated as security against borrowings.
11. CASH AND CASH EQUIVALENTS As at
March 31, 2018 ` in Crores
As at March 31, 2017
` in Croresi. Balance with Banks: – Current Accounts 18.91 35.04 – Deposit Accounts (less than 3 months original maturity) 503.00 60.00
521.91 95.04ii. Cash on Hand 0.03 0.06
TOTAL 521.94 95.10
Fixed Deposit amounting to ` 148.00 Crores represents balance held with bank from Right Issue proceeds pending utilisation. Except this, there are no repatriation restrictions with regard to Cash and Cash Equivalents as at the end of the reporting period and prior periods.
12. OTHER BANK BALANCES As at
March 31, 2018 ` in Crores
As at March 31, 2017
` in Croresi. Earmarked balances with banks : – Unclaimed Dividend Account 18.37 15.94 – Others 0.03 0.02
18.40 15.96ii. Margin Money 14.48 13.01
TOTAL 32.88 28.97
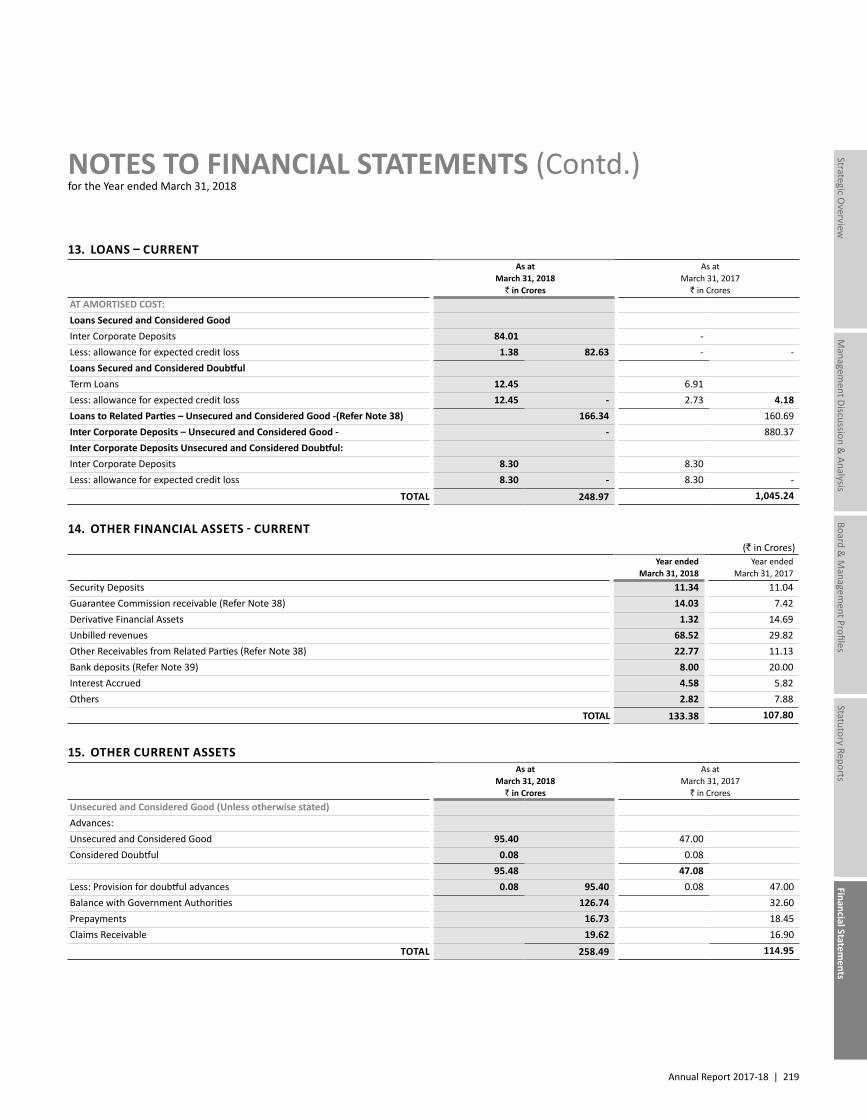
Annual Report 2017-18 | 219
Managem
ent Discussion & Analysis
Strategic Overview
Board &
Managem
ent ProfilesStatutory Reports
Financial Statements
NOTES TO FINANCIAL STATEMENTS (Contd.)for the Year ended March 31, 2018
13. LOANS – CURRENT As at
March 31, 2018 ` in Crores
As at March 31, 2017
` in CroresAT AMORTISED COST:Loans Secured and Considered GoodInter Corporate Deposits 84.01 -Less: allowance for expected credit loss 1.38 82.63 - -Loans Secured and Considered DoubtfulTerm Loans 12.45 6.91Less: allowance for expected credit loss 12.45 - 2.73 4.18Loans to Related Parties – Unsecured and Considered Good -(Refer Note 38) 166.34 160.69Inter Corporate Deposits – Unsecured and Considered Good - - 880.37Inter Corporate Deposits Unsecured and Considered Doubtful:Inter Corporate Deposits 8.30 8.30Less: allowance for expected credit loss 8.30 - 8.30 -
TOTAL 248.97 1,045.24
14. OTHER FINANCIAL ASSETS - CURRENT (` in Crores)
Year ended March 31, 2018
Year ended March 31, 2017
Security Deposits 11.34 11.04Guarantee Commission receivable (Refer Note 38) 14.03 7.42Derivative Financial Assets 1.32 14.69Unbilled revenues 68.52 29.82Other Receivables from Related Parties (Refer Note 38) 22.77 11.13Bank deposits (Refer Note 39) 8.00 20.00Interest Accrued 4.58 5.82Others 2.82 7.88
TOTAL 133.38 107.80
15. OTHER CURRENT ASSETS As at
March 31, 2018 ` in Crores
As at March 31, 2017
` in CroresUnsecured and Considered Good (Unless otherwise stated)Advances:Unsecured and Considered Good 95.40 47.00Considered Doubtful 0.08 0.08
95.48 47.08Less: Provision for doubtful advances 0.08 95.40 0.08 47.00Balance with Government Authorities 126.74 32.60Prepayments 16.73 18.45Claims Receivable 19.62 16.90
TOTAL 258.49 114.95
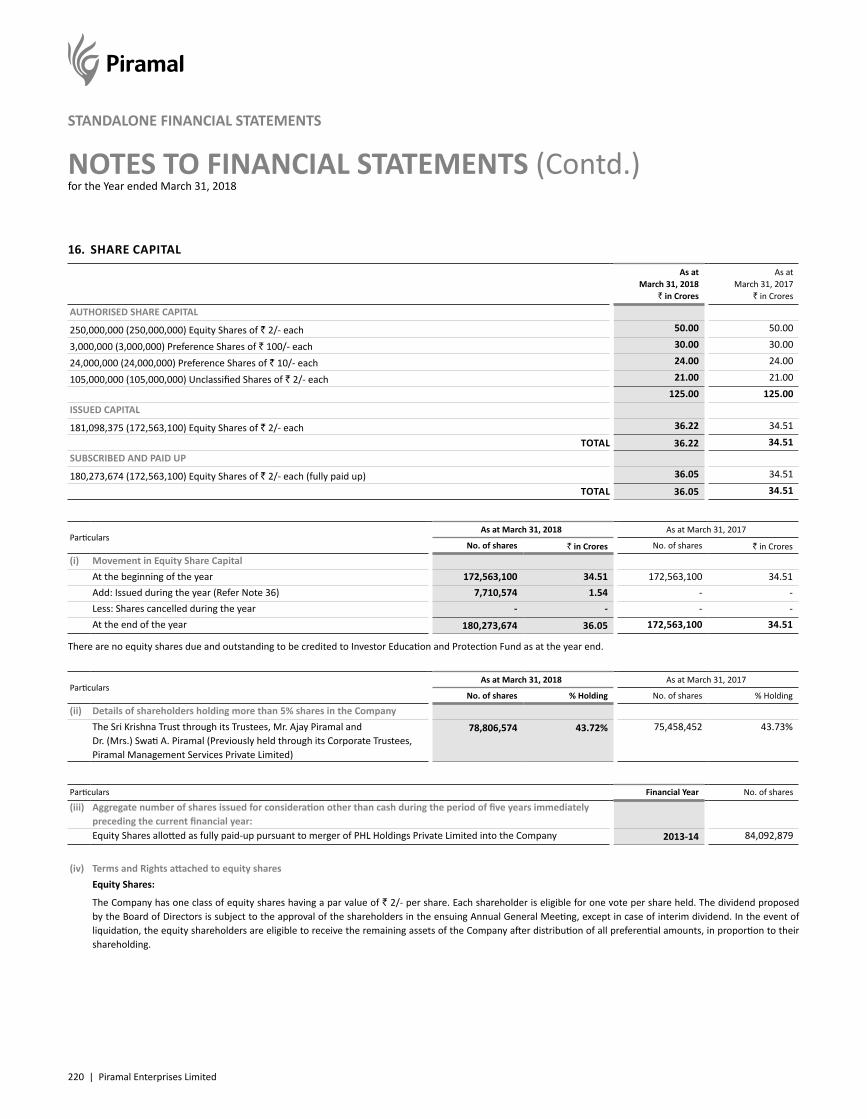
220 | Piramal Enterprises Limited
NOTES TO FINANCIAL STATEMENTS (Contd.)for the Year ended March 31, 2018
STANDALONE FINANCIAL STATEMENTS
16. SHARE CAPITAL
As at March 31, 2018
` in Crores
As at March 31, 2017
` in Crores
AUTHORISED SHARE CAPITAL
250,000,000 (250,000,000) Equity Shares of ` 2/- each 50.00 50.00
3,000,000 (3,000,000) Preference Shares of ` 100/- each 30.00 30.00
24,000,000 (24,000,000) Preference Shares of ` 10/- each 24.00 24.00
105,000,000 (105,000,000) Unclassified Shares of ` 2/- each 21.00 21.00 125.00 125.00
ISSUED CAPITAL
181,098,375 (172,563,100) Equity Shares of ` 2/- each 36.22 34.51
TOTAL 36.22 34.51SUBSCRIBED AND PAID UP
180,273,674 (172,563,100) Equity Shares of ` 2/- each (fully paid up) 36.05 34.51
TOTAL 36.05 34.51
Particulars As at March 31, 2018 As at March 31, 2017
No. of shares ` in Crores No. of shares ` in Crores(i) Movement in Equity Share Capital
At the beginning of the year 172,563,100 34.51 172,563,100 34.51Add: Issued during the year (Refer Note 36) 7,710,574 1.54 - -Less: Shares cancelled during the year - - - -At the end of the year 180,273,674 36.05 172,563,100 34.51
There are no equity shares due and outstanding to be credited to Investor Education and Protection Fund as at the year end.
Particulars As at March 31, 2018 As at March 31, 2017
No. of shares % Holding No. of shares % Holding
(ii) Details of shareholders holding more than 5% shares in the CompanyThe Sri Krishna Trust through its Trustees, Mr. Ajay Piramal and Dr. (Mrs.) Swati A. Piramal (Previously held through its Corporate Trustees, Piramal Management Services Private Limited)
78,806,574 43.72% 75,458,452 43.73%
Particulars Financial Year No. of shares
(iii) Aggregate number of shares issued for consideration other than cash during the period of five years immediately preceding the current financial year:Equity Shares allotted as fully paid-up pursuant to merger of PHL Holdings Private Limited into the Company 2013-14 84,092,879
(iv) Terms and Rights attached to equity sharesEquity Shares:
The Company has one class of equity shares having a par value of ` 2/- per share. Each shareholder is eligible for one vote per share held. The dividend proposed by the Board of Directors is subject to the approval of the shareholders in the ensuing Annual General Meeting, except in case of interim dividend. In the event of liquidation, the equity shareholders are eligible to receive the remaining assets of the Company after distribution of all preferential amounts, in proportion to their shareholding.
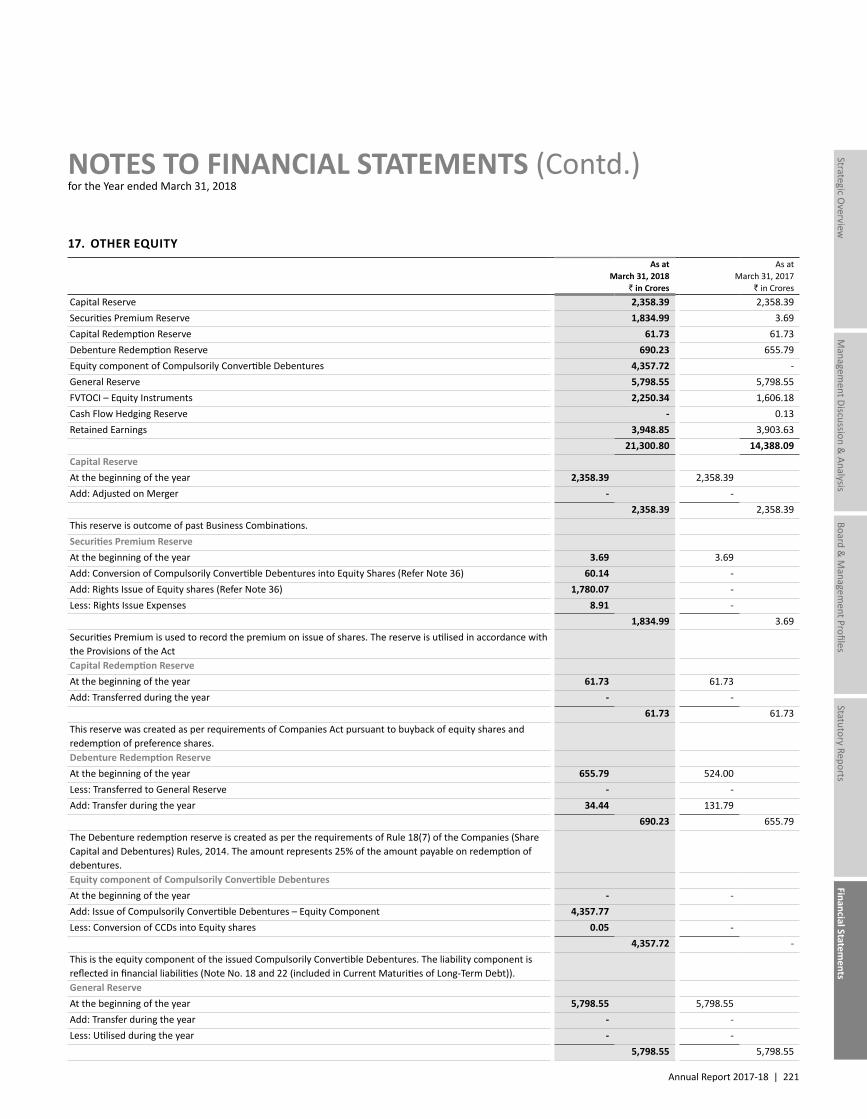
Annual Report 2017-18 | 221
Managem
ent Discussion & Analysis
Strategic Overview
Board &
Managem
ent ProfilesStatutory Reports
Financial Statements
NOTES TO FINANCIAL STATEMENTS (Contd.)for the Year ended March 31, 2018
17. OTHER EQUITY As at
March 31, 2018 ` in Crores
As at March 31, 2017
` in CroresCapital Reserve 2,358.39 2,358.39Securities Premium Reserve 1,834.99 3.69Capital Redemption Reserve 61.73 61.73Debenture Redemption Reserve 690.23 655.79Equity component of Compulsorily Convertible Debentures 4,357.72 -General Reserve 5,798.55 5,798.55FVTOCI – Equity Instruments 2,250.34 1,606.18Cash Flow Hedging Reserve - 0.13Retained Earnings 3,948.85 3,903.63
21,300.80 14,388.09Capital ReserveAt the beginning of the year 2,358.39 2,358.39Add: Adjusted on Merger - -
2,358.39 2,358.39This reserve is outcome of past Business Combinations.Securities Premium ReserveAt the beginning of the year 3.69 3.69Add: Conversion of Compulsorily Convertible Debentures into Equity Shares (Refer Note 36) 60.14 -Add: Rights Issue of Equity shares (Refer Note 36) 1,780.07 -Less: Rights Issue Expenses 8.91 -
1,834.99 3.69Securities Premium is used to record the premium on issue of shares. The reserve is utilised in accordance with the Provisions of the ActCapital Redemption ReserveAt the beginning of the year 61.73 61.73Add: Transferred during the year - -
61.73 61.73This reserve was created as per requirements of Companies Act pursuant to buyback of equity shares and redemption of preference shares.Debenture Redemption ReserveAt the beginning of the year 655.79 524.00Less: Transferred to General Reserve - -Add: Transfer during the year 34.44 131.79
690.23 655.79The Debenture redemption reserve is created as per the requirements of Rule 18(7) of the Companies (Share Capital and Debentures) Rules, 2014. The amount represents 25% of the amount payable on redemption of debentures.Equity component of Compulsorily Convertible DebenturesAt the beginning of the year - -Add: Issue of Compulsorily Convertible Debentures – Equity Component 4,357.77Less: Conversion of CCDs into Equity shares 0.05 -
4,357.72 -This is the equity component of the issued Compulsorily Convertible Debentures. The liability component is reflected in financial liabilities (Note No. 18 and 22 (included in Current Maturities of Long-Term Debt)).General ReserveAt the beginning of the year 5,798.55 5,798.55Add: Transfer during the year - -Less: Utilised during the year - -
5,798.55 5,798.55
222 | Piramal Enterprises Limited
NOTES TO FINANCIAL STATEMENTS (Contd.)for the Year ended March 31, 2018
STANDALONE FINANCIAL STATEMENTS
As at March 31, 2018
` in Crores
As at March 31, 2017
` in Crores
FVTOCI – Equity InstrumentsAt the beginning of the year 1,606.18 759.83Add: Changes in Fair value of FVTOCI Equity instruments (net of tax) 644.16 2,250.34 846.35 1,606.18The Company has elected to recognise changes in the fair value of certain investments in equity securities in other comprehensive income. These changes are accumulated within the FVTOCI equity investments reserve within equity. The Company transfers amounts from this reserve to retained earnings when the relevant equity securities are derecognised.Cash Flow Hedging ReserveAt the beginning of the year 0.13 -Add: Transfer during the year (0.13) 0.13
- 0.13The Company uses hedging instruments as part of its management of foreign currency risk associated with its Foreign Currency Non-repatriable loans. To the extent these hedges are effective, the change in the fair value of hedging instrument is recognised in the cash flow hedging reserve.Retained EarningsAt the beginning of the year 3,903.63 3,259.91Add: Profit for the year 518.47 776.78Less: Remeasurement of Post Employment Benefit Obligations (net of tax) 3.61 1.27Less: Transfer to Debenture Redemption Reserve 34.44 131.79Less: Dividends paid (including Dividend Distribution Tax) 435.20 -
3,948.85 3,903.63TOTAL 21,300.80 14,388.09
On August 1, 2017, a Dividend of ` 21 per equity share (total dividend of ` 362.38 Crores and dividend distribution tax of ` 72.82 Crores) was paid to holders of fully paid equity shares.
On May 28, 2018, a Dividend of ` 25 per equity share (Face value of ` 2/- each) amounting to ` 451.48 Crores (Dividend Distribution Tax thereon of ` 92.80 Crores) has been recommended by the Board of Directors which is subject to approval of the Shareholders. The amounts calculated are based on the shares existing as on May 28, 2018.
18. BORROWINGS – NON-CURRENT
As at March 31, 2018
` in Crores
As at March 31, 2017
` in Crores
Secured - at amortised costTerm Loan From Banks:Rupee Loans 171.23 719.12Foreign Currency Non-Repatriable Loans (FCNR) 529.14 -Redeemable Non Convertible Debentures 3,010.78 1,112.79Unsecured - at amortised costTerm Loan From Banks - -Redeemable Non Convertible Debentures 124.84 907.61Liability component of Compulsorily Convertible debentures (Refer Note 17) 175.57 -
TOTAL 4,011.56 2,739.52
Annual Report 2017-18 | 223
Managem
ent Discussion & Analysis
Strategic Overview
Board &
Managem
ent ProfilesStatutory Reports
Financial Statements
NOTES TO FINANCIAL STATEMENTS (Contd.)for the Year ended March 31, 2018
Terms of repayment, nature of security & rate of interest in case of Secured Loans (includes amount included in Current Maturities of Long-Term Debt-Refer Note no 22)
A. Term Loan from Banks -Rupee Loans
(` in Crores)
Nature of Security Terms of repayment
Principal Outstanding as at March
31, 2018
Principal Outstanding as at March
31, 2017Hypothecation of all movable properties of the Company i.e. plant and machinery (excluding Current Assets and Intangible Assets) both present and future at the below locations:(a) Pithampur, Madhya Pradesh (b) Ennore, Chennai (c) Digwal Village, Medak District, Andhra Pradesh (d) Mahad District Raigad, Maharashtra and the Equitable Mortgage on the immovable properties, both leasehold and freehold of the Company, both present and future at the below locations: (a) Pithampur, Madhya Pradesh (b) Mahad District Raigad, Maharashtra. The charge will be on pari passu basis with existing Term Lenders with a minimum Financial Asset Cover (FACR) of 1.15 times.
Repayment in 5 Half Yearly instalments of ` 40 Crores each commencing 24 months after the first disbursement.
160.00 200.00
First pari passu charge by way of hypothecation over receivables of entire secured financial services investments of borrower (excluding investments in Shriram group) whether current or in future with a minimum cover of 1.10 x of the principal and accrued interest.
Moratorium of 18 months and repayment in 2 equal quarterly instalments
150.00 150.00
Charge on brands acquired on exclusive basis Total Tenor of 30 months from date of first drawdown with 1 year moratorium and thereafter repayable in three equal half yearly instalments
175.00 175.00
Charge on brands acquired on exclusive basis Total Tenor of 30 months from date of first drawdown with 1 year moratorium and thereafter repayable in three equal half yearly instalments
100.00 100.00
First Charge on the present and future Property Plant & Equipment of the company with a minimum security cover of 1.15 times.
Repayment in 10 semi annual instalments - 174.99
First pari passu Charge on all movable and immovable Property Plant & Equipment of the borrower for ` 100 Crores with a minimum Financial Asset Cover (FACR) of 1.15 times.
Repayment in seven semi annual instalments - 71.43
The effective costs for the above loans are in the range of 7.95 % to 9.95 % per annum (Previous Year: 8.60% to 10.15% per annum).
Refer Note 39 for assets hypothecated/mortgaged as securities against the Secured Borrowings.
B. Term Loan from Banks- FCNR Loan#
(` in Crores)
Nature of Security Terms of repayment
Principal Outstanding as at March
31, 2018
Principal Outstanding as at March
31, 2017First pari passu charge on the underlying assets/fixed assets of the Company, with a minimum fixed assets cover 1.1X cover
Facility can be either repaid (bullet repayment) or converted into rupee term loan after 24 months from the date of first disbursement
226.14 -
First pari passu charge on the underlying assets/fixed assets of the Company, with a minimum fixed assets cover 1.1X cover
Facility can be either repaid (bullet repayment) or converted into rupee term loan after 24 months from the date of first disbursement
305.19 -
The effective costs for the above loans are in the range of 3.83% to 4.44 % per annum (Previous Year: Nil).#Creation of charges in respect of certain loans are in process.
Refer Note 39 for assets hypothecated/mortgaged as securities against the Secured Borrowings.
224 | Piramal Enterprises Limited
NOTES TO FINANCIAL STATEMENTS (Contd.)for the Year ended March 31, 2018
STANDALONE FINANCIAL STATEMENTS
C. Redeemable Non-Convertible Debentures:
(` in Crores)
Particulars Nature of Security Terms of Repayment
Principal Outstanding as at March
31, 2018
Principal Outstanding as at March
31, 2017
50 (Previous Year: 50) (payable annually) 9.75% Secured Rated Listed Redeemable Non-Convertible Debentures of ` 1,000,000 each
Secured by a First pari passu mortgage over specifically Mortgaged Premises and a first pari passu hypothecation over portions of specific identified Receivables as set out in the Debenture Trust Deed and the Deed of Hypothecation.
The amount of ` 5 Crores redeemable at par at the end of 3,650 days from the date of allotment.
5.00 5.00
350 (Previous Year: 350) (payable annually) 9.75% Secured Rated Listed Redeemable Non-Convertible Debentures of ` 1,000,000 each
Secured by a First pari passu mortgage over specifically Mortgaged Premises and a first pari passu hypothecation over portions of specific identified Receivables as set out in the Debenture Trust Deed and the Deed of Hypothecation.
The amount of ` 35 Crores redeemable at par at the end of 3,652 days from the date of allotment.
35.00 35.00
100 (Previous Year: 100) (payable annually) 9.57% Secured Rated Listed Redeemable Non Convertible Debentures of ` 1,000,000 each
Secured by a First pari passu mortgage over specifically Mortgaged Premises and a first pari passu hypothecation over portions of specific identified Receivables as set out in the Debenture Trust Deed and the Deed of Hypothecation.
The amount of ` 10 Crores redeemable at par at the end of 1,826 days from the date of allotment
10.00 10.00
2,000 (Previous Year: NIL) (payable annually) Secured Rated Listed Redeemable Non Convertible Debentures (7.90%) of ` 1,000,000 each
Secured through a First pari passu charge by hypothecation over the identified Receivables and a first ranking pari passu mortgage over specifically mortgaged premises or such other property as may be identified by the company as set out in the Debenture Trust deed and the Deed of Hypothecation
The amount of ` 200 Crores redeemable at par at the end of 1,096 days from the date of allotment
200.00 -
500 (Previous Year: NIL) (payable annually) Secured Rated Listed Redeemable Non Convertible Debentures (7.90%) of ` 1,000,000 each
Secured through a First pari passu charge by hypothecation over the identified Receivables and a first ranking pari passu mortgage over specifically mortgaged premises or such other property as may be identified by the company as set out in the Debenture Trust deed and the Deed of Hypothecation
The amount of ` 50 Crores redeemable at par at the end of 1,096 days from the date of allotment
50.00 -
400 (Previous Year: NIL) (payable annually) Secured Rated Listed Redeemable Non Convertible Debentures (7.90%) of ` 1,000,000 each
Secured through a First pari passu charge by hypothecation over the identified Receivables and a first ranking pari passu mortgage over specifically mortgaged premises or such other property as may be identified by the company as set out in the Debenture Trust deed and the Deed of Hypothecation
The amount of ` 40 Crores redeemable at par at the end of 1,096 days from the date of allotment
40.00 -
150 (Previous Year: NIL) (payable annually) Secured Rated Listed Redeemable Non Convertible Debentures (7.90%) of ` 1,000,000 each
Secured through a First pari passu charge by hypothecation over the identified Receivables and a first ranking pari passu mortgage over specifically mortgaged premises or such other property as may be identified by the company as set out in the Debenture Trust deed and the Deed of Hypothecation
The amount of ` 15 Crores redeemable at par at the end of 1,096 days from the date of allotment
15.00 -
100 (Previous Year: NIL) (payable annually) Secured Rated Listed Redeemable Non Convertible Debentures (7.90%) of ` 1,000,000 each
Secured through a First pari passu charge by hypothecation over the identified Receivables and a first ranking pari passu mortgage over specifically mortgaged premises or such other property as may be identified by the company as set out in the Debenture Trust deed and the Deed of Hypothecation
The amount of ` 10 Crores redeemable at par at the end of 1,096 days from the date of allotment
10.00 -
Annual Report 2017-18 | 225
Managem
ent Discussion & Analysis
Strategic Overview
Board &
Managem
ent ProfilesStatutory Reports
Financial Statements
NOTES TO FINANCIAL STATEMENTS (Contd.)for the Year ended March 31, 2018
(` in Crores)
Particulars Nature of Security Terms of Repayment
Principal Outstanding as at March
31, 2018
Principal Outstanding as at March
31, 2017
100 (Previous Year: NIL) (payable annually) Secured Rated Listed Redeemable Non Convertible Debentures (7.90%) of ` 1,000,000 each
Secured through a First pari passu charge by hypothecation over the identified Receivables and a first ranking pari passu mortgage over specifically mortgaged premises or such other property as may be identified by the company as set out in the Debenture Trust deed and the Deed of Hypothecation
The amount of ` 10 Crores redeemable at par at the end of 1096 days from the date of allotment
10.00 -
50 (Previous Year: NIL) (payable annually) Secured Rated Listed Redeemable Non Convertible Debentures (7.90%) of ` 1,000,000 each
Secured through a First pari passu charge by hypothecation over the identified Receivables and a first ranking pari passu mortgage over specifically mortgaged premises or such other property as may be identified by the company as set out in the Debenture Trust deed and the Deed of Hypothecation
The amount of ` 5 Crores redeemable at par at the end of 1,096 days from the date of allotment
5.00 -
550 (Previous Year: NIL) (payable annually) Secured Rated Listed Redeemable Non Convertible Debentures (7.90%) of ` 1,000,000 each
Secured through a First pari passu charge by hypothecation over the identified Receivables and a first ranking pari passu mortgage over specifically mortgaged premises or such other property as may be identified by the company as set out in the Debenture Trust deed cum Deed of Mortgage and the Deed of Hypothecation
The amount of ` 55 Crores redeemable at par at the end of 1,096 days from the date of allotment
55.00 -
250 (Previous Year: NIL) (payable annually) Secured Rated Listed Redeemable Non Convertible Debentures (7.90%) of ` 1,000,000 each
Secured through a First pari passu charge by hypothecation over the identified Receivables and a first ranking pari passu mortgage over specifically mortgaged premises or such other property as may be identified by the company as set out in the Debenture Trust deed cum Deed of Mortgage and the Deed of Hypothecation
The amount of ` 25 Crores redeemable at par at the end of 1,096 days from the date of allotment
25.00 -
200 (Previous Year: NIL) (payable annually) Secured Rated Listed Redeemable Non Convertible Debentures (7.90%) of ` 1,000,000 each
Secured through a First pari passu charge by hypothecation over the identified Receivables and a first ranking pari passu mortgage over specifically mortgaged premises or such other property as may be identified by the company as set out in the Debenture Trust deed cum Deed of Mortgage and the Deed of Hypothecation
The amount of ` 20 Crores redeemable at par at the end of 1,096 days from the date of allotment
20.00 -
150 (Previous Year: 150) (payable annually) 9.38% Secured Rated Listed Redeemable Non Convertible Debentures of ` 1,000,000 each
Secured by a First pari passu mortgage over specifically Mortgaged Premises and a first pari passu hypothecation over portions of specific identified Receivables as set out in the Debenture Trust Deed and the Deed of Hypothecation.
The amount of ` 15 Crores redeemable at par at the end of 1,109 days from the date of allotment.
15.00 15.00
1,500 (Previous Year: 1,500) (payable annually) 9.45% Secured Rated Listed Redeemable Non Convertible Debentures of ` 1,000,000 each
Secured by a First pari passu mortgage over specifically Mortgaged Premises and a first pari passu hypothecation over portions of specific identified Receivables as set out in the Debenture Trust Deed and the Deed of Hypothecation.
Option I – ` 50 Crores redeemable at par at the end of 1,092 days from the date of allotment and Option II – ` 100 Crores redeemable at par at the end of 1,107 days from the date of allotment.
150.00 150.00
3,000 (Previous Year: 3,000) (payable annually) 9.45% Secured Rated Listed Redeemable Non Convertible Debentures of ` 1,000,000 each
Secured by a First pari passu mortgage over specifically Mortgaged Premises and a first pari passu hypothecation over portions of specific identified Receivables as set out in the Debenture Trust Deed and the Deed of Hypothecation.
Series I – The amount of ` 150 Crores redeemable at par at the end of 1,050 days from the date of allotment. Series II – The amount of ` 150 Crores redeemable at the end of 1,090 days from the date of allotment.
300.00 300.00
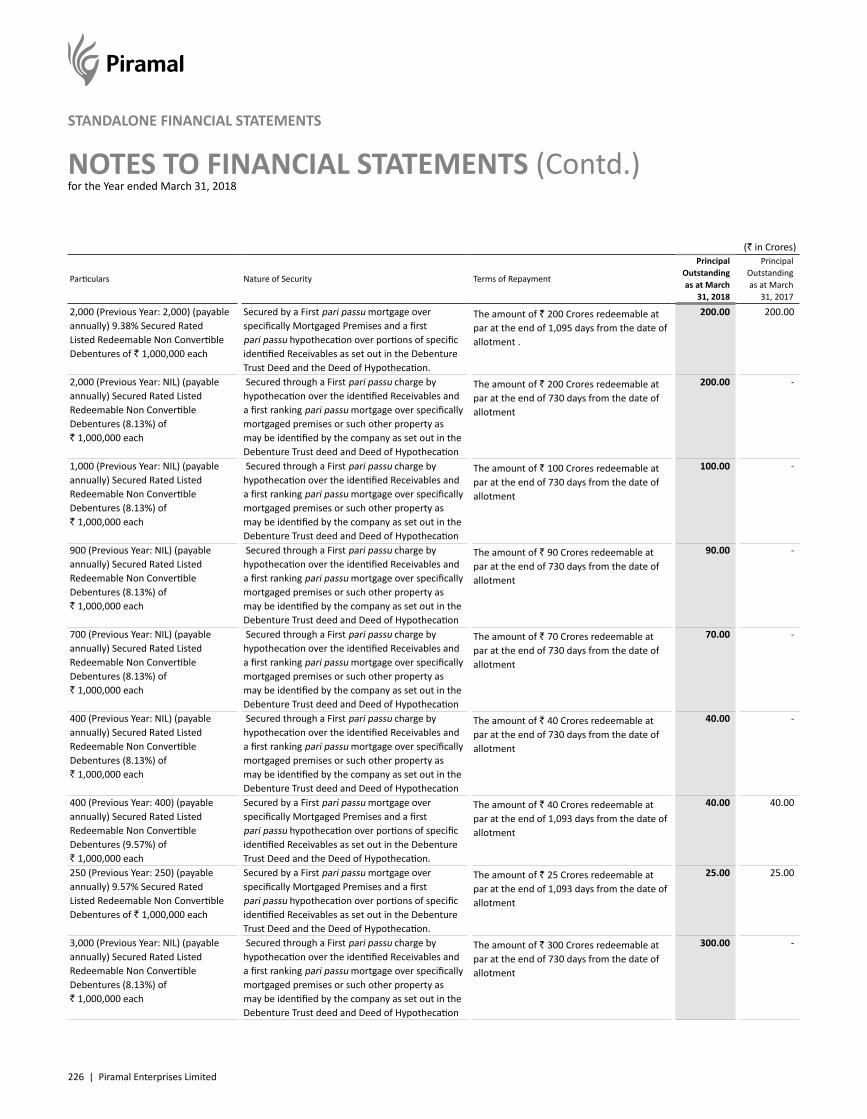
226 | Piramal Enterprises Limited
NOTES TO FINANCIAL STATEMENTS (Contd.)for the Year ended March 31, 2018
STANDALONE FINANCIAL STATEMENTS
(` in Crores)
Particulars Nature of Security Terms of Repayment
Principal Outstanding as at March
31, 2018
Principal Outstanding as at March
31, 2017
2,000 (Previous Year: 2,000) (payable annually) 9.38% Secured Rated Listed Redeemable Non Convertible Debentures of ` 1,000,000 each
Secured by a First pari passu mortgage over specifically Mortgaged Premises and a first pari passu hypothecation over portions of specific identified Receivables as set out in the Debenture Trust Deed and the Deed of Hypothecation.
The amount of ` 200 Crores redeemable at par at the end of 1,095 days from the date of allotment .
200.00 200.00
2,000 (Previous Year: NIL) (payable annually) Secured Rated Listed Redeemable Non Convertible Debentures (8.13%) of ` 1,000,000 each
Secured through a First pari passu charge by hypothecation over the identified Receivables and a first ranking pari passu mortgage over specifically mortgaged premises or such other property as may be identified by the company as set out in the Debenture Trust deed and Deed of Hypothecation
The amount of ` 200 Crores redeemable at par at the end of 730 days from the date of allotment
200.00 -
1,000 (Previous Year: NIL) (payable annually) Secured Rated Listed Redeemable Non Convertible Debentures (8.13%) of ` 1,000,000 each
Secured through a First pari passu charge by hypothecation over the identified Receivables and a first ranking pari passu mortgage over specifically mortgaged premises or such other property as may be identified by the company as set out in the Debenture Trust deed and Deed of Hypothecation
The amount of ` 100 Crores redeemable at par at the end of 730 days from the date of allotment
100.00 -
900 (Previous Year: NIL) (payable annually) Secured Rated Listed Redeemable Non Convertible Debentures (8.13%) of ` 1,000,000 each
Secured through a First pari passu charge by hypothecation over the identified Receivables and a first ranking pari passu mortgage over specifically mortgaged premises or such other property as may be identified by the company as set out in the Debenture Trust deed and Deed of Hypothecation
The amount of ` 90 Crores redeemable at par at the end of 730 days from the date of allotment
90.00 -
700 (Previous Year: NIL) (payable annually) Secured Rated Listed Redeemable Non Convertible Debentures (8.13%) of ` 1,000,000 each
Secured through a First pari passu charge by hypothecation over the identified Receivables and a first ranking pari passu mortgage over specifically mortgaged premises or such other property as may be identified by the company as set out in the Debenture Trust deed and Deed of Hypothecation
The amount of ` 70 Crores redeemable at par at the end of 730 days from the date of allotment
70.00 -
400 (Previous Year: NIL) (payable annually) Secured Rated Listed Redeemable Non Convertible Debentures (8.13%) of ` 1,000,000 each
Secured through a First pari passu charge by hypothecation over the identified Receivables and a first ranking pari passu mortgage over specifically mortgaged premises or such other property as may be identified by the company as set out in the Debenture Trust deed and Deed of Hypothecation
The amount of ` 40 Crores redeemable at par at the end of 730 days from the date of allotment
40.00 -
400 (Previous Year: 400) (payable annually) Secured Rated Listed Redeemable Non Convertible Debentures (9.57%) of ` 1,000,000 each
Secured by a First pari passu mortgage over specifically Mortgaged Premises and a first pari passu hypothecation over portions of specific identified Receivables as set out in the Debenture Trust Deed and the Deed of Hypothecation.
The amount of ` 40 Crores redeemable at par at the end of 1,093 days from the date of allotment
40.00 40.00
250 (Previous Year: 250) (payable annually) 9.57% Secured Rated Listed Redeemable Non Convertible Debentures of ` 1,000,000 each
Secured by a First pari passu mortgage over specifically Mortgaged Premises and a first pari passu hypothecation over portions of specific identified Receivables as set out in the Debenture Trust Deed and the Deed of Hypothecation.
The amount of ` 25 Crores redeemable at par at the end of 1,093 days from the date of allotment
25.00 25.00
3,000 (Previous Year: NIL) (payable annually) Secured Rated Listed Redeemable Non Convertible Debentures (8.13%) of ` 1,000,000 each
Secured through a First pari passu charge by hypothecation over the identified Receivables and a first ranking pari passu mortgage over specifically mortgaged premises or such other property as may be identified by the company as set out in the Debenture Trust deed and Deed of Hypothecation
The amount of ` 300 Crores redeemable at par at the end of 730 days from the date of allotment
300.00 -
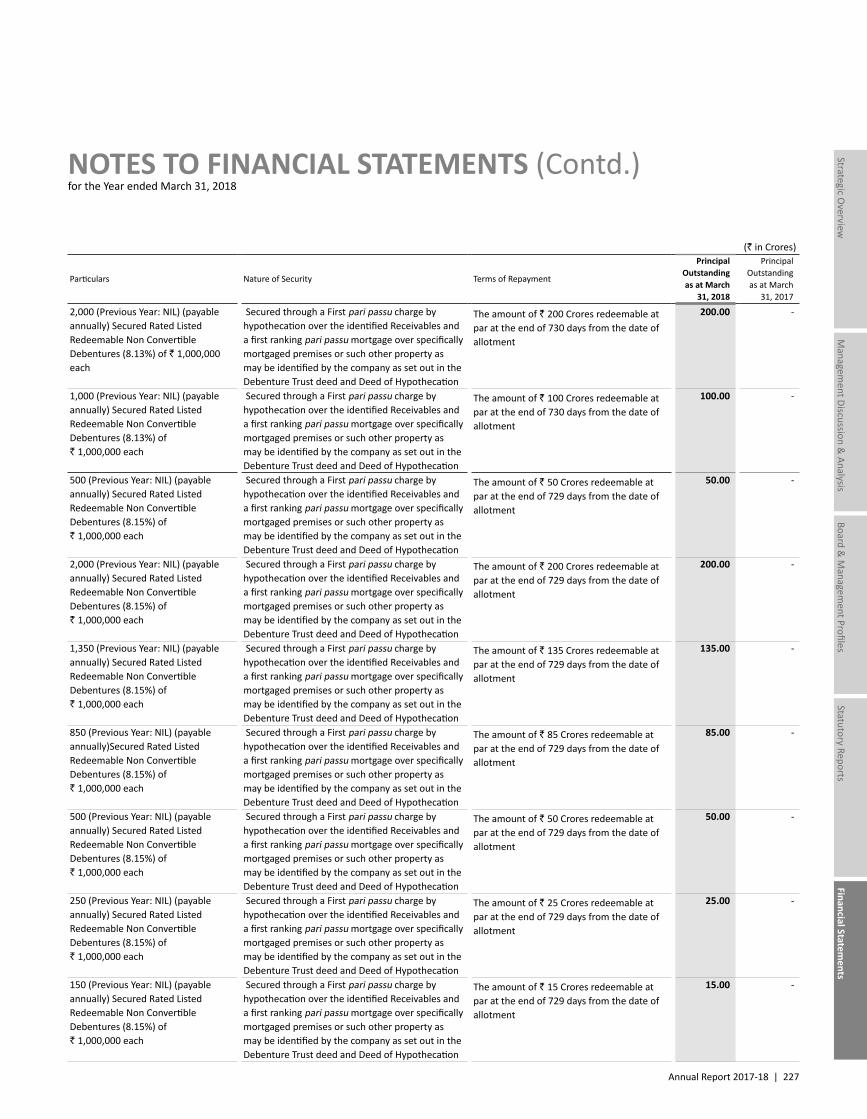
Annual Report 2017-18 | 227
Managem
ent Discussion & Analysis
Strategic Overview
Board &
Managem
ent ProfilesStatutory Reports
Financial Statements
NOTES TO FINANCIAL STATEMENTS (Contd.)for the Year ended March 31, 2018
(` in Crores)
Particulars Nature of Security Terms of Repayment
Principal Outstanding as at March
31, 2018
Principal Outstanding as at March
31, 2017
2,000 (Previous Year: NIL) (payable annually) Secured Rated Listed Redeemable Non Convertible Debentures (8.13%) of ` 1,000,000 each
Secured through a First pari passu charge by hypothecation over the identified Receivables and a first ranking pari passu mortgage over specifically mortgaged premises or such other property as may be identified by the company as set out in the Debenture Trust deed and Deed of Hypothecation
The amount of ` 200 Crores redeemable at par at the end of 730 days from the date of allotment
200.00 -
1,000 (Previous Year: NIL) (payable annually) Secured Rated Listed Redeemable Non Convertible Debentures (8.13%) of ` 1,000,000 each
Secured through a First pari passu charge by hypothecation over the identified Receivables and a first ranking pari passu mortgage over specifically mortgaged premises or such other property as may be identified by the company as set out in the Debenture Trust deed and Deed of Hypothecation
The amount of ` 100 Crores redeemable at par at the end of 730 days from the date of allotment
100.00 -
500 (Previous Year: NIL) (payable annually) Secured Rated Listed Redeemable Non Convertible Debentures (8.15%) of ` 1,000,000 each
Secured through a First pari passu charge by hypothecation over the identified Receivables and a first ranking pari passu mortgage over specifically mortgaged premises or such other property as may be identified by the company as set out in the Debenture Trust deed and Deed of Hypothecation
The amount of ` 50 Crores redeemable at par at the end of 729 days from the date of allotment
50.00 -
2,000 (Previous Year: NIL) (payable annually) Secured Rated Listed Redeemable Non Convertible Debentures (8.15%) of ` 1,000,000 each
Secured through a First pari passu charge by hypothecation over the identified Receivables and a first ranking pari passu mortgage over specifically mortgaged premises or such other property as may be identified by the company as set out in the Debenture Trust deed and Deed of Hypothecation
The amount of ` 200 Crores redeemable at par at the end of 729 days from the date of allotment
200.00 -
1,350 (Previous Year: NIL) (payable annually) Secured Rated Listed Redeemable Non Convertible Debentures (8.15%) of ` 1,000,000 each
Secured through a First pari passu charge by hypothecation over the identified Receivables and a first ranking pari passu mortgage over specifically mortgaged premises or such other property as may be identified by the company as set out in the Debenture Trust deed and Deed of Hypothecation
The amount of ` 135 Crores redeemable at par at the end of 729 days from the date of allotment
135.00 -
850 (Previous Year: NIL) (payable annually)Secured Rated Listed Redeemable Non Convertible Debentures (8.15%) of ` 1,000,000 each
Secured through a First pari passu charge by hypothecation over the identified Receivables and a first ranking pari passu mortgage over specifically mortgaged premises or such other property as may be identified by the company as set out in the Debenture Trust deed and Deed of Hypothecation
The amount of ` 85 Crores redeemable at par at the end of 729 days from the date of allotment
85.00 -
500 (Previous Year: NIL) (payable annually) Secured Rated Listed Redeemable Non Convertible Debentures (8.15%) of ` 1,000,000 each
Secured through a First pari passu charge by hypothecation over the identified Receivables and a first ranking pari passu mortgage over specifically mortgaged premises or such other property as may be identified by the company as set out in the Debenture Trust deed and Deed of Hypothecation
The amount of ` 50 Crores redeemable at par at the end of 729 days from the date of allotment
50.00 -
250 (Previous Year: NIL) (payable annually) Secured Rated Listed Redeemable Non Convertible Debentures (8.15%) of ` 1,000,000 each
Secured through a First pari passu charge by hypothecation over the identified Receivables and a first ranking pari passu mortgage over specifically mortgaged premises or such other property as may be identified by the company as set out in the Debenture Trust deed and Deed of Hypothecation
The amount of ` 25 Crores redeemable at par at the end of 729 days from the date of allotment
25.00 -
150 (Previous Year: NIL) (payable annually) Secured Rated Listed Redeemable Non Convertible Debentures (8.15%) of ` 1,000,000 each
Secured through a First pari passu charge by hypothecation over the identified Receivables and a first ranking pari passu mortgage over specifically mortgaged premises or such other property as may be identified by the company as set out in the Debenture Trust deed and Deed of Hypothecation
The amount of ` 15 Crores redeemable at par at the end of 729 days from the date of allotment
15.00 -
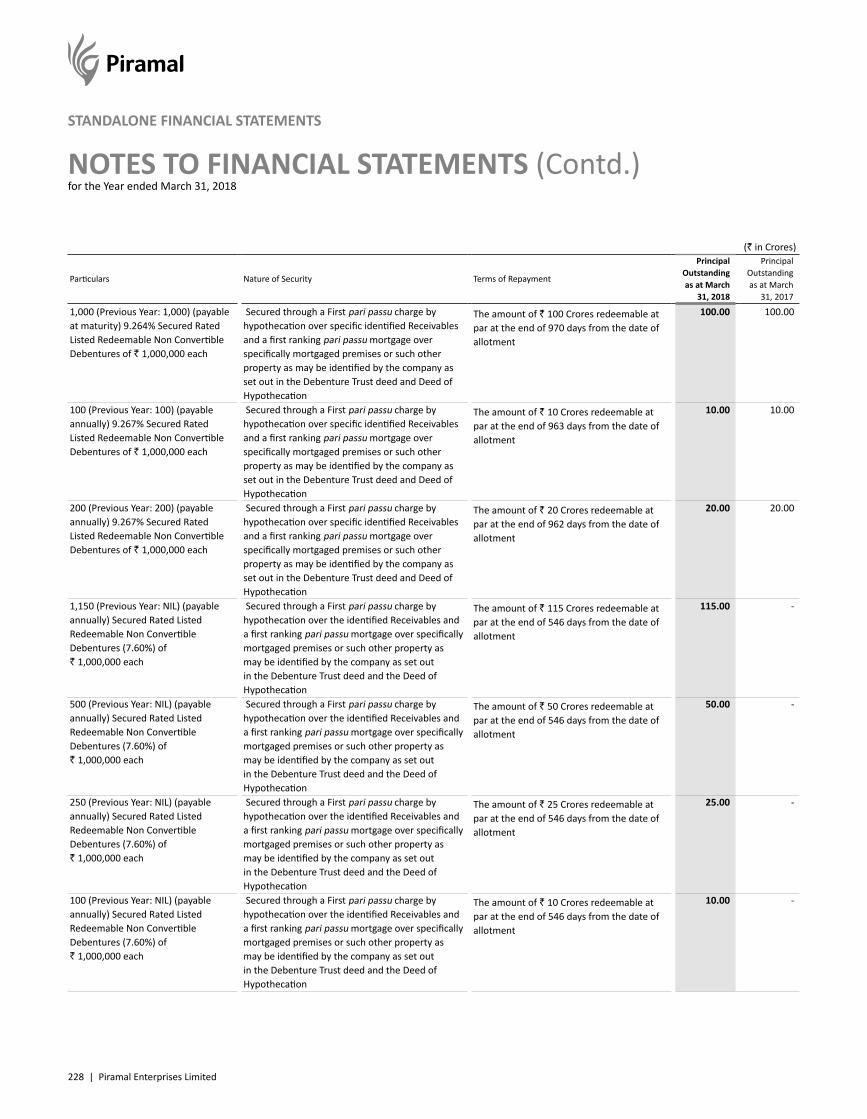
228 | Piramal Enterprises Limited
NOTES TO FINANCIAL STATEMENTS (Contd.)for the Year ended March 31, 2018
STANDALONE FINANCIAL STATEMENTS
(` in Crores)
Particulars Nature of Security Terms of Repayment
Principal Outstanding as at March
31, 2018
Principal Outstanding as at March
31, 2017
1,000 (Previous Year: 1,000) (payable at maturity) 9.264% Secured Rated Listed Redeemable Non Convertible Debentures of ` 1,000,000 each
Secured through a First pari passu charge by hypothecation over specific identified Receivables and a first ranking pari passu mortgage over specifically mortgaged premises or such other property as may be identified by the company as set out in the Debenture Trust deed and Deed of Hypothecation
The amount of ` 100 Crores redeemable at par at the end of 970 days from the date of allotment
100.00 100.00
100 (Previous Year: 100) (payable annually) 9.267% Secured Rated Listed Redeemable Non Convertible Debentures of ` 1,000,000 each
Secured through a First pari passu charge by hypothecation over specific identified Receivables and a first ranking pari passu mortgage over specifically mortgaged premises or such other property as may be identified by the company as set out in the Debenture Trust deed and Deed of Hypothecation
The amount of ` 10 Crores redeemable at par at the end of 963 days from the date of allotment
10.00 10.00
200 (Previous Year: 200) (payable annually) 9.267% Secured Rated Listed Redeemable Non Convertible Debentures of ` 1,000,000 each
Secured through a First pari passu charge by hypothecation over specific identified Receivables and a first ranking pari passu mortgage over specifically mortgaged premises or such other property as may be identified by the company as set out in the Debenture Trust deed and Deed of Hypothecation
The amount of ` 20 Crores redeemable at par at the end of 962 days from the date of allotment
20.00 20.00
1,150 (Previous Year: NIL) (payable annually) Secured Rated Listed Redeemable Non Convertible Debentures (7.60%) of ` 1,000,000 each
Secured through a First pari passu charge by hypothecation over the identified Receivables and a first ranking pari passu mortgage over specifically mortgaged premises or such other property as may be identified by the company as set out in the Debenture Trust deed and the Deed of Hypothecation
The amount of ` 115 Crores redeemable at par at the end of 546 days from the date of allotment
115.00 -
500 (Previous Year: NIL) (payable annually) Secured Rated Listed Redeemable Non Convertible Debentures (7.60%) of ` 1,000,000 each
Secured through a First pari passu charge by hypothecation over the identified Receivables and a first ranking pari passu mortgage over specifically mortgaged premises or such other property as may be identified by the company as set out in the Debenture Trust deed and the Deed of Hypothecation
The amount of ` 50 Crores redeemable at par at the end of 546 days from the date of allotment
50.00 -
250 (Previous Year: NIL) (payable annually) Secured Rated Listed Redeemable Non Convertible Debentures (7.60%) of ` 1,000,000 each
Secured through a First pari passu charge by hypothecation over the identified Receivables and a first ranking pari passu mortgage over specifically mortgaged premises or such other property as may be identified by the company as set out in the Debenture Trust deed and the Deed of Hypothecation
The amount of ` 25 Crores redeemable at par at the end of 546 days from the date of allotment
25.00 -
100 (Previous Year: NIL) (payable annually) Secured Rated Listed Redeemable Non Convertible Debentures (7.60%) of ` 1,000,000 each
Secured through a First pari passu charge by hypothecation over the identified Receivables and a first ranking pari passu mortgage over specifically mortgaged premises or such other property as may be identified by the company as set out in the Debenture Trust deed and the Deed of Hypothecation
The amount of ` 10 Crores redeemable at par at the end of 546 days from the date of allotment
10.00 -
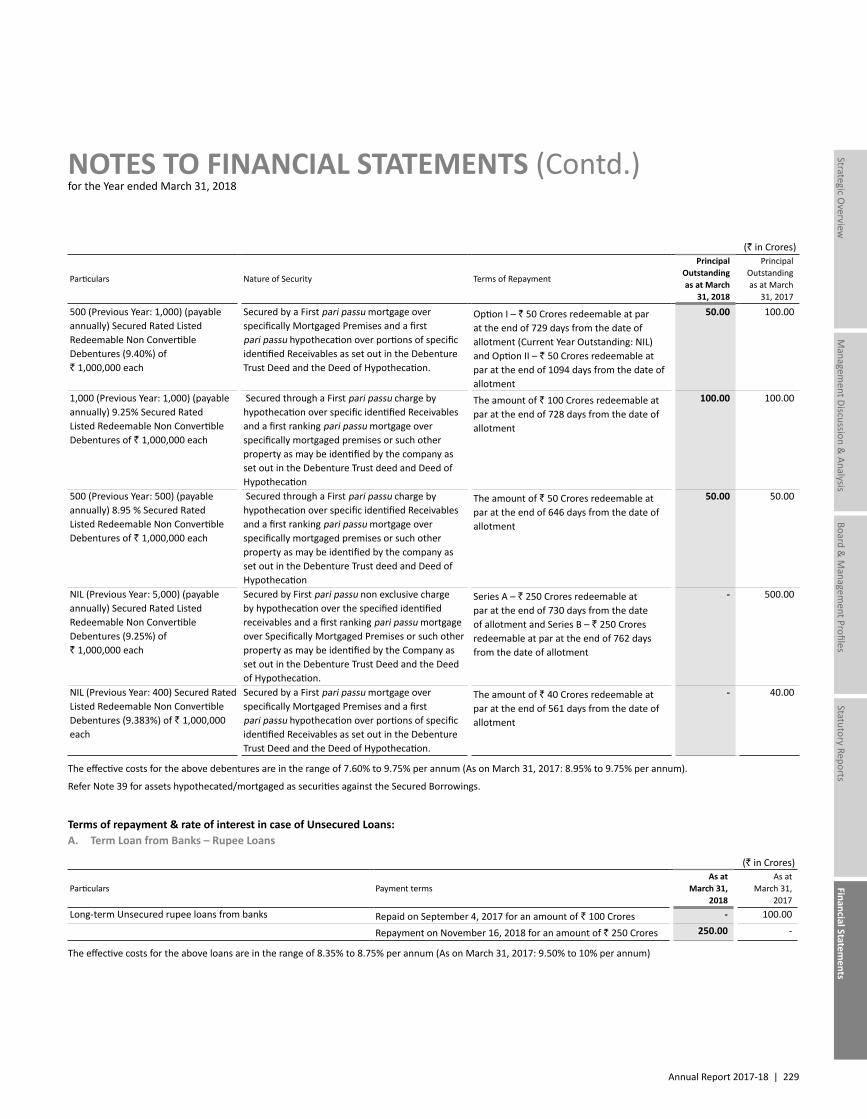
Annual Report 2017-18 | 229
Managem
ent Discussion & Analysis
Strategic Overview
Board &
Managem
ent ProfilesStatutory Reports
Financial Statements
NOTES TO FINANCIAL STATEMENTS (Contd.)for the Year ended March 31, 2018
(` in Crores)
Particulars Nature of Security Terms of Repayment
Principal Outstanding as at March
31, 2018
Principal Outstanding as at March
31, 2017
500 (Previous Year: 1,000) (payable annually) Secured Rated Listed Redeemable Non Convertible Debentures (9.40%) of ` 1,000,000 each
Secured by a First pari passu mortgage over specifically Mortgaged Premises and a first pari passu hypothecation over portions of specific identified Receivables as set out in the Debenture Trust Deed and the Deed of Hypothecation.
Option I – ` 50 Crores redeemable at par at the end of 729 days from the date of allotment (Current Year Outstanding: NIL) and Option II – ` 50 Crores redeemable at par at the end of 1094 days from the date of allotment
50.00 100.00
1,000 (Previous Year: 1,000) (payable annually) 9.25% Secured Rated Listed Redeemable Non Convertible Debentures of ` 1,000,000 each
Secured through a First pari passu charge by hypothecation over specific identified Receivables and a first ranking pari passu mortgage over specifically mortgaged premises or such other property as may be identified by the company as set out in the Debenture Trust deed and Deed of Hypothecation
The amount of ` 100 Crores redeemable at par at the end of 728 days from the date of allotment
100.00 100.00
500 (Previous Year: 500) (payable annually) 8.95 % Secured Rated Listed Redeemable Non Convertible Debentures of ` 1,000,000 each
Secured through a First pari passu charge by hypothecation over specific identified Receivables and a first ranking pari passu mortgage over specifically mortgaged premises or such other property as may be identified by the company as set out in the Debenture Trust deed and Deed of Hypothecation
The amount of ` 50 Crores redeemable at par at the end of 646 days from the date of allotment
50.00 50.00
NIL (Previous Year: 5,000) (payable annually) Secured Rated Listed Redeemable Non Convertible Debentures (9.25%) of ` 1,000,000 each
Secured by First pari passu non exclusive charge by hypothecation over the specified identified receivables and a first ranking pari passu mortgage over Specifically Mortgaged Premises or such other property as may be identified by the Company as set out in the Debenture Trust Deed and the Deed of Hypothecation.
Series A – ` 250 Crores redeemable at par at the end of 730 days from the date of allotment and Series B – ` 250 Crores redeemable at par at the end of 762 days from the date of allotment
- 500.00
NIL (Previous Year: 400) Secured Rated Listed Redeemable Non Convertible Debentures (9.383%) of ` 1,000,000 each
Secured by a First pari passu mortgage over specifically Mortgaged Premises and a first pari passu hypothecation over portions of specific identified Receivables as set out in the Debenture Trust Deed and the Deed of Hypothecation.
The amount of ` 40 Crores redeemable at par at the end of 561 days from the date of allotment
- 40.00
The effective costs for the above debentures are in the range of 7.60% to 9.75% per annum (As on March 31, 2017: 8.95% to 9.75% per annum).
Refer Note 39 for assets hypothecated/mortgaged as securities against the Secured Borrowings.
Terms of repayment & rate of interest in case of Unsecured Loans:A. Term Loan from Banks – Rupee Loans
(` in Crores)
Particulars Payment termsAs at
March 31, 2018
As atMarch 31,
2017Long-term Unsecured rupee loans from banks Repaid on September 4, 2017 for an amount of ` 100 Crores - 100.00
Repayment on November 16, 2018 for an amount of ` 250 Crores 250.00 -
The effective costs for the above loans are in the range of 8.35% to 8.75% per annum (As on March 31, 2017: 9.50% to 10% per annum)
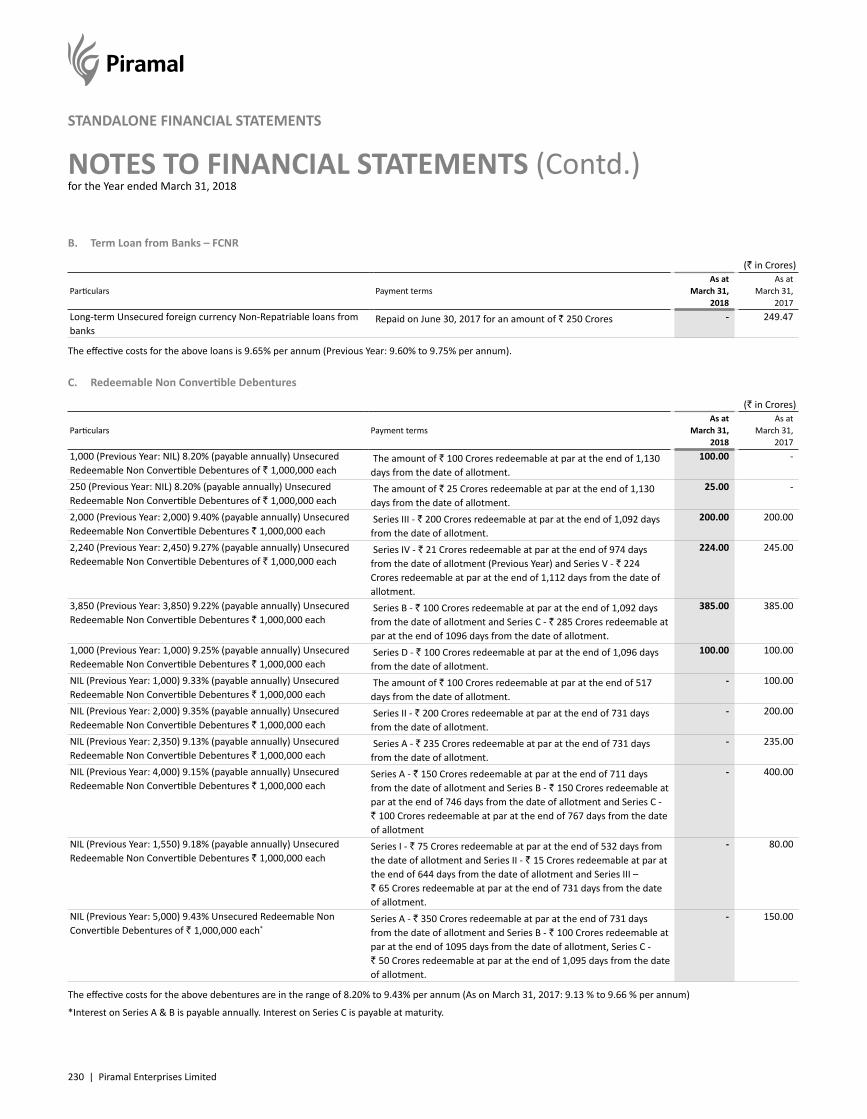
230 | Piramal Enterprises Limited
NOTES TO FINANCIAL STATEMENTS (Contd.)for the Year ended March 31, 2018
STANDALONE FINANCIAL STATEMENTS
B. Term Loan from Banks – FCNR
(` in Crores)
Particulars Payment termsAs at
March 31, 2018
As atMarch 31,
2017Long-term Unsecured foreign currency Non-Repatriable loans from banks
Repaid on June 30, 2017 for an amount of ` 250 Crores - 249.47
The effective costs for the above loans is 9.65% per annum (Previous Year: 9.60% to 9.75% per annum).
C. Redeemable Non Convertible Debentures
(` in Crores)
Particulars Payment termsAs at
March 31, 2018
As atMarch 31,
20171,000 (Previous Year: NIL) 8.20% (payable annually) Unsecured Redeemable Non Convertible Debentures of ` 1,000,000 each
The amount of ` 100 Crores redeemable at par at the end of 1,130 days from the date of allotment.
100.00 -
250 (Previous Year: NIL) 8.20% (payable annually) Unsecured Redeemable Non Convertible Debentures of ` 1,000,000 each
The amount of ` 25 Crores redeemable at par at the end of 1,130 days from the date of allotment.
25.00 -
2,000 (Previous Year: 2,000) 9.40% (payable annually) Unsecured Redeemable Non Convertible Debentures ` 1,000,000 each
Series III - ` 200 Crores redeemable at par at the end of 1,092 days from the date of allotment.
200.00 200.00
2,240 (Previous Year: 2,450) 9.27% (payable annually) Unsecured Redeemable Non Convertible Debentures of ` 1,000,000 each
Series IV - ` 21 Crores redeemable at par at the end of 974 days from the date of allotment (Previous Year) and Series V - ` 224 Crores redeemable at par at the end of 1,112 days from the date of allotment.
224.00 245.00
3,850 (Previous Year: 3,850) 9.22% (payable annually) Unsecured Redeemable Non Convertible Debentures ` 1,000,000 each
Series B - ` 100 Crores redeemable at par at the end of 1,092 days from the date of allotment and Series C - ` 285 Crores redeemable at par at the end of 1096 days from the date of allotment.
385.00 385.00
1,000 (Previous Year: 1,000) 9.25% (payable annually) Unsecured Redeemable Non Convertible Debentures ` 1,000,000 each
Series D - ` 100 Crores redeemable at par at the end of 1,096 days from the date of allotment.
100.00 100.00
NIL (Previous Year: 1,000) 9.33% (payable annually) Unsecured Redeemable Non Convertible Debentures ` 1,000,000 each
The amount of ` 100 Crores redeemable at par at the end of 517 days from the date of allotment.
- 100.00
NIL (Previous Year: 2,000) 9.35% (payable annually) Unsecured Redeemable Non Convertible Debentures ` 1,000,000 each
Series II - ` 200 Crores redeemable at par at the end of 731 days from the date of allotment.
- 200.00
NIL (Previous Year: 2,350) 9.13% (payable annually) Unsecured Redeemable Non Convertible Debentures ` 1,000,000 each
Series A - ` 235 Crores redeemable at par at the end of 731 days from the date of allotment.
- 235.00
NIL (Previous Year: 4,000) 9.15% (payable annually) Unsecured Redeemable Non Convertible Debentures ` 1,000,000 each
Series A - ` 150 Crores redeemable at par at the end of 711 days from the date of allotment and Series B - ` 150 Crores redeemable at par at the end of 746 days from the date of allotment and Series C - ` 100 Crores redeemable at par at the end of 767 days from the date of allotment
- 400.00
NIL (Previous Year: 1,550) 9.18% (payable annually) Unsecured Redeemable Non Convertible Debentures ` 1,000,000 each
Series I - ` 75 Crores redeemable at par at the end of 532 days from the date of allotment and Series II - ` 15 Crores redeemable at par at the end of 644 days from the date of allotment and Series III – ` 65 Crores redeemable at par at the end of 731 days from the date of allotment.
- 80.00
NIL (Previous Year: 5,000) 9.43% Unsecured Redeemable Non Convertible Debentures of ` 1,000,000 each*
Series A - ` 350 Crores redeemable at par at the end of 731 days from the date of allotment and Series B - ` 100 Crores redeemable at par at the end of 1095 days from the date of allotment, Series C - ` 50 Crores redeemable at par at the end of 1,095 days from the date of allotment.
- 150.00
The effective costs for the above debentures are in the range of 8.20% to 9.43% per annum (As on March 31, 2017: 9.13 % to 9.66 % per annum)
*Interest on Series A & B is payable annually. Interest on Series C is payable at maturity.
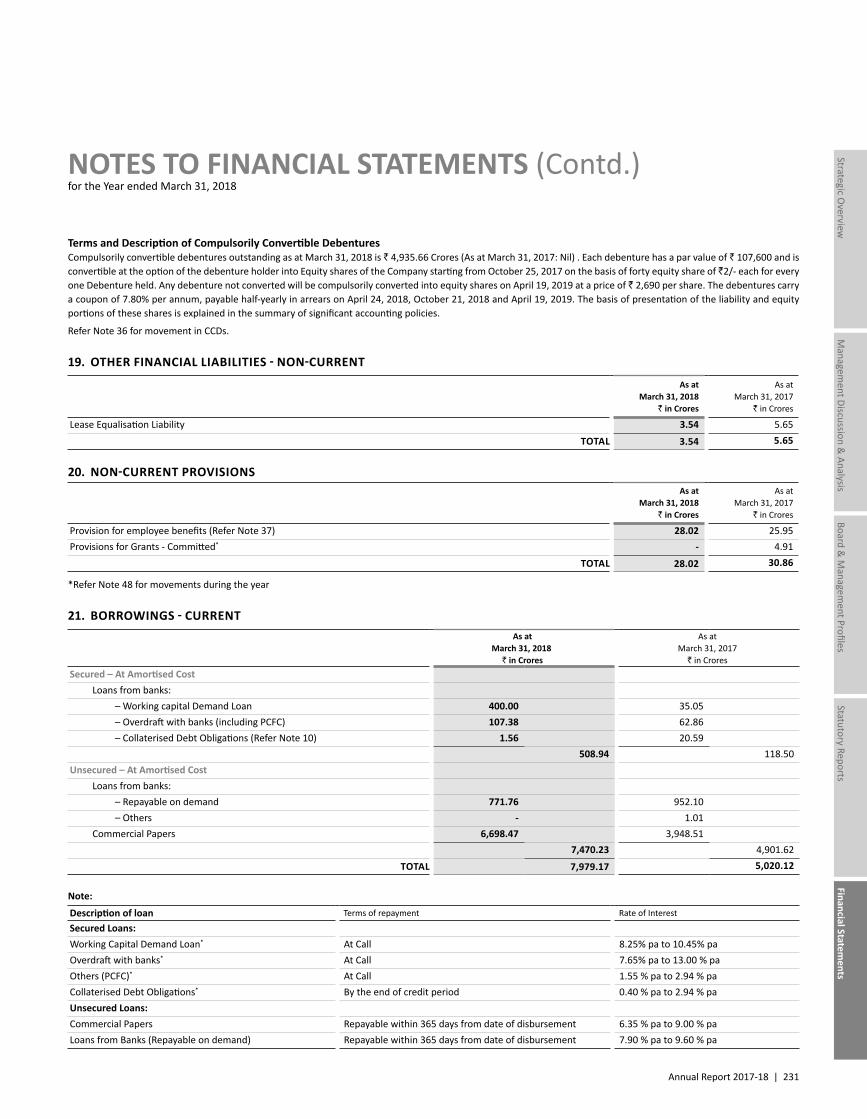
Annual Report 2017-18 | 231
Managem
ent Discussion & Analysis
Strategic Overview
Board &
Managem
ent ProfilesStatutory Reports
Financial Statements
NOTES TO FINANCIAL STATEMENTS (Contd.)for the Year ended March 31, 2018
Terms and Description of Compulsorily Convertible DebenturesCompulsorily convertible debentures outstanding as at March 31, 2018 is ` 4,935.66 Crores (As at March 31, 2017: Nil) . Each debenture has a par value of ` 107,600 and is convertible at the option of the debenture holder into Equity shares of the Company starting from October 25, 2017 on the basis of forty equity share of `2/- each for every one Debenture held. Any debenture not converted will be compulsorily converted into equity shares on April 19, 2019 at a price of ` 2,690 per share. The debentures carry a coupon of 7.80% per annum, payable half-yearly in arrears on April 24, 2018, October 21, 2018 and April 19, 2019. The basis of presentation of the liability and equity portions of these shares is explained in the summary of significant accounting policies.
Refer Note 36 for movement in CCDs.
19. OTHER FINANCIAL LIABILITIES - NON-CURRENT
As at March 31, 2018
` in Crores
As at March 31, 2017
` in Crores
Lease Equalisation Liability 3.54 5.65 TOTAL 3.54 5.65
20. NON-CURRENT PROVISIONS As at
March 31, 2018 ` in Crores
As at March 31, 2017
` in Crores
Provision for employee benefits (Refer Note 37) 28.02 25.95Provisions for Grants - Committed* - 4.91
TOTAL 28.02 30.86
*Refer Note 48 for movements during the year
21. BORROWINGS - CURRENT As at
March 31, 2018 ` in Crores
As at March 31, 2017
` in CroresSecured – At Amortised Cost Loans from banks: – Working capital Demand Loan 400.00 35.05 – Overdraft with banks (including PCFC) 107.38 62.86 – Collaterised Debt Obligations (Refer Note 10) 1.56 20.59
508.94 118.50Unsecured – At Amortised Cost Loans from banks: – Repayable on demand 771.76 952.10 – Others - 1.01 Commercial Papers 6,698.47 3,948.51
7,470.23 4,901.62TOTAL 7,979.17 5,020.12
Note:
Description of loan Terms of repayment Rate of Interest
Secured Loans:Working Capital Demand Loan* At Call 8.25% pa to 10.45% paOverdraft with banks* At Call 7.65% pa to 13.00 % paOthers (PCFC)* At Call 1.55 % pa to 2.94 % paCollaterised Debt Obligations* By the end of credit period 0.40 % pa to 2.94 % paUnsecured Loans:Commercial Papers Repayable within 365 days from date of disbursement 6.35 % pa to 9.00 % paLoans from Banks (Repayable on demand) Repayable within 365 days from date of disbursement 7.90 % pa to 9.60 % pa
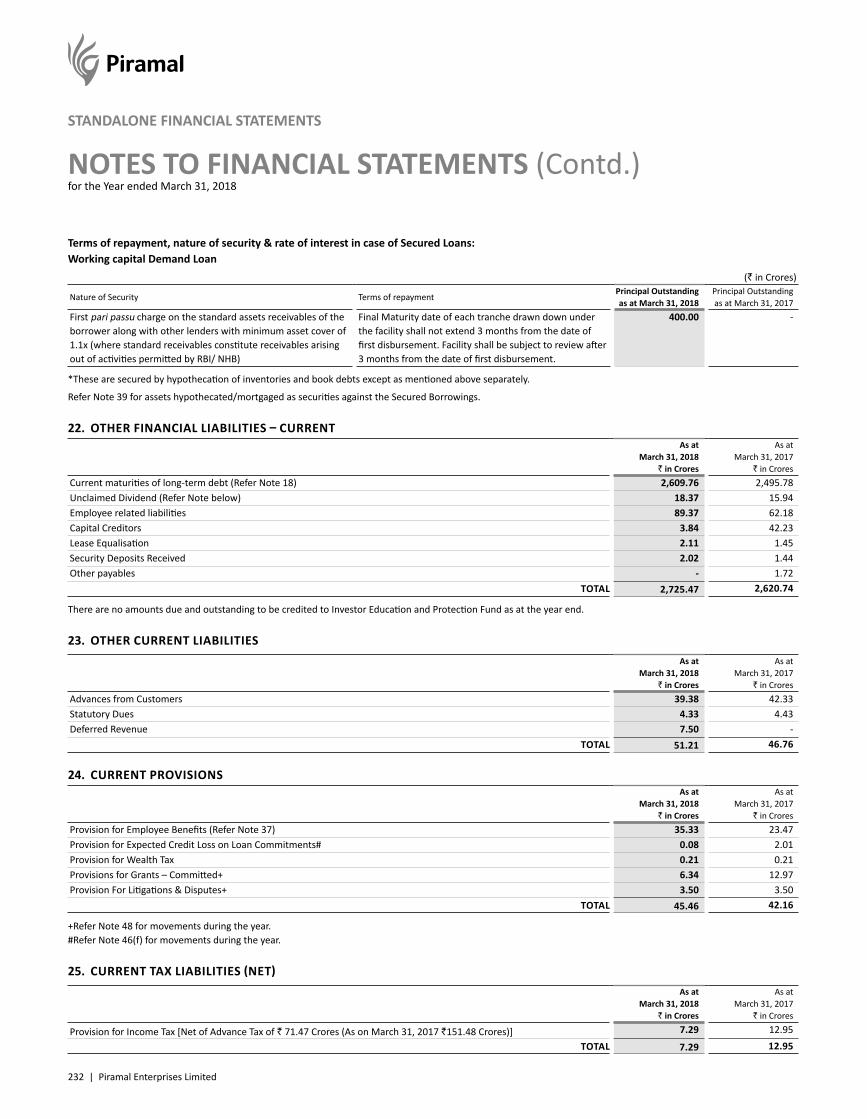
232 | Piramal Enterprises Limited
NOTES TO FINANCIAL STATEMENTS (Contd.)for the Year ended March 31, 2018
STANDALONE FINANCIAL STATEMENTS
Terms of repayment, nature of security & rate of interest in case of Secured Loans:Working capital Demand Loan
(` in Crores)
Nature of Security Terms of repaymentPrincipal Outstanding as at March 31, 2018
Principal Outstanding as at March 31, 2017
First pari passu charge on the standard assets receivables of the borrower along with other lenders with minimum asset cover of 1.1x (where standard receivables constitute receivables arising out of activities permitted by RBI/ NHB)
Final Maturity date of each tranche drawn down under the facility shall not extend 3 months from the date of first disbursement. Facility shall be subject to review after 3 months from the date of first disbursement.
400.00 -
*These are secured by hypothecation of inventories and book debts except as mentioned above separately.
Refer Note 39 for assets hypothecated/mortgaged as securities against the Secured Borrowings.
22. OTHER FINANCIAL LIABILITIES – CURRENT As at
March 31, 2018 ` in Crores
As at March 31, 2017
` in CroresCurrent maturities of long-term debt (Refer Note 18) 2,609.76 2,495.78Unclaimed Dividend (Refer Note below) 18.37 15.94Employee related liabilities 89.37 62.18Capital Creditors 3.84 42.23Lease Equalisation 2.11 1.45Security Deposits Received 2.02 1.44Other payables - 1.72
TOTAL 2,725.47 2,620.74
There are no amounts due and outstanding to be credited to Investor Education and Protection Fund as at the year end.
23. OTHER CURRENT LIABILITIES As at
March 31, 2018 ` in Crores
As at March 31, 2017
` in CroresAdvances from Customers 39.38 42.33Statutory Dues 4.33 4.43Deferred Revenue 7.50 -
TOTAL 51.21 46.76
24. CURRENT PROVISIONS As at
March 31, 2018 ` in Crores
As at March 31, 2017
` in CroresProvision for Employee Benefits (Refer Note 37) 35.33 23.47Provision for Expected Credit Loss on Loan Commitments# 0.08 2.01Provision for Wealth Tax 0.21 0.21Provisions for Grants – Committed+ 6.34 12.97Provision For Litigations & Disputes+ 3.50 3.50
TOTAL 45.46 42.16
+Refer Note 48 for movements during the year.#Refer Note 46(f) for movements during the year.
25. CURRENT TAX LIABILITIES (NET) As at
March 31, 2018 ` in Crores
As at March 31, 2017
` in Crores
Provision for Income Tax [Net of Advance Tax of ` 71.47 Crores (As on March 31, 2017 `151.48 Crores)] 7.29 12.95
TOTAL 7.29 12.95
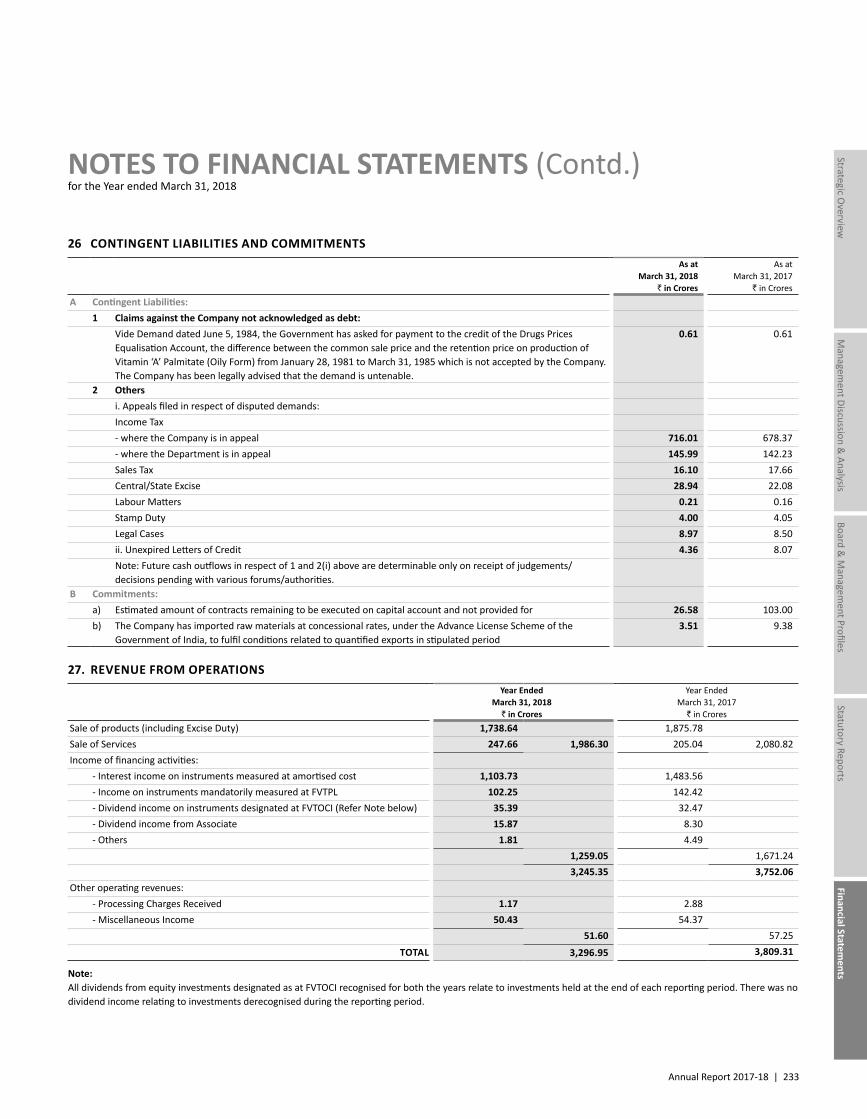
Annual Report 2017-18 | 233
Managem
ent Discussion & Analysis
Strategic Overview
Board &
Managem
ent ProfilesStatutory Reports
Financial Statements
NOTES TO FINANCIAL STATEMENTS (Contd.)for the Year ended March 31, 2018
26 CONTINGENT LIABILITIES AND COMMITMENTS As at
March 31, 2018 ` in Crores
As at March 31, 2017
` in CroresA Contingent Liabilities:
1 Claims against the Company not acknowledged as debt:Vide Demand dated June 5, 1984, the Government has asked for payment to the credit of the Drugs Prices Equalisation Account, the difference between the common sale price and the retention price on production of Vitamin ‘A’ Palmitate (Oily Form) from January 28, 1981 to March 31, 1985 which is not accepted by the Company. The Company has been legally advised that the demand is untenable.
0.61 0.61
2 Othersi. Appeals filed in respect of disputed demands:Income Tax- where the Company is in appeal 716.01 678.37- where the Department is in appeal 145.99 142.23Sales Tax 16.10 17.66Central/State Excise 28.94 22.08Labour Matters 0.21 0.16Stamp Duty 4.00 4.05Legal Cases 8.97 8.50ii. Unexpired Letters of Credit 4.36 8.07Note: Future cash outflows in respect of 1 and 2(i) above are determinable only on receipt of judgements/decisions pending with various forums/authorities.
B Commitments:a) Estimated amount of contracts remaining to be executed on capital account and not provided for 26.58 103.00b) The Company has imported raw materials at concessional rates, under the Advance License Scheme of the
Government of India, to fulfil conditions related to quantified exports in stipulated period3.51 9.38
27. REVENUE FROM OPERATIONS Year Ended
March 31, 2018 ` in Crores
Year Ended March 31, 2017
` in CroresSale of products (including Excise Duty) 1,738.64 1,875.78Sale of Services 247.66 1,986.30 205.04 2,080.82Income of financing activities: - Interest income on instruments measured at amortised cost 1,103.73 1,483.56 - Income on instruments mandatorily measured at FVTPL 102.25 142.42 - Dividend income on instruments designated at FVTOCI (Refer Note below) 35.39 32.47 - Dividend income from Associate 15.87 8.30 - Others 1.81 4.49
1,259.05 1,671.24 3,245.35 3,752.06
Other operating revenues: - Processing Charges Received 1.17 2.88 - Miscellaneous Income 50.43 54.37
51.60 57.25 TOTAL 3,296.95 3,809.31
Note:All dividends from equity investments designated as at FVTOCI recognised for both the years relate to investments held at the end of each reporting period. There was no dividend income relating to investments derecognised during the reporting period.
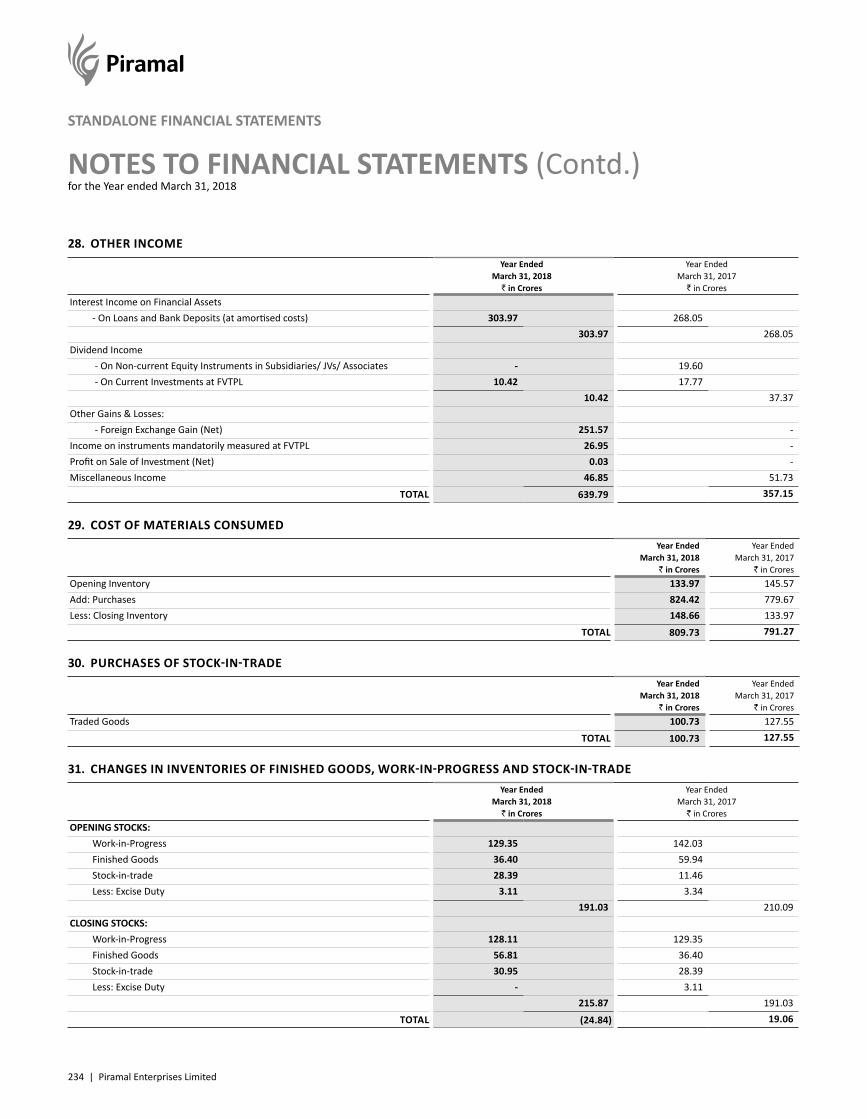
234 | Piramal Enterprises Limited
NOTES TO FINANCIAL STATEMENTS (Contd.)for the Year ended March 31, 2018
STANDALONE FINANCIAL STATEMENTS
28. OTHER INCOME Year Ended
March 31, 2018 ` in Crores
Year Ended March 31, 2017
` in CroresInterest Income on Financial Assets - On Loans and Bank Deposits (at amortised costs) 303.97 268.05
303.97 268.05Dividend Income - On Non-current Equity Instruments in Subsidiaries/ JVs/ Associates - 19.60 - On Current Investments at FVTPL 10.42 17.77
10.42 37.37Other Gains & Losses: - Foreign Exchange Gain (Net) 251.57 -Income on instruments mandatorily measured at FVTPL 26.95 -Profit on Sale of Investment (Net) 0.03 -Miscellaneous Income 46.85 51.73
TOTAL 639.79 357.15
29. COST OF MATERIALS CONSUMED Year Ended
March 31, 2018 ` in Crores
Year Ended March 31, 2017
` in CroresOpening Inventory 133.97 145.57Add: Purchases 824.42 779.67Less: Closing Inventory 148.66 133.97
TOTAL 809.73 791.27
30. PURCHASES OF STOCK-IN-TRADE Year Ended
March 31, 2018 ` in Crores
Year Ended March 31, 2017
` in CroresTraded Goods 100.73 127.55
TOTAL 100.73 127.55
31. CHANGES IN INVENTORIES OF FINISHED GOODS, WORK-IN-PROGRESS AND STOCK-IN-TRADE Year Ended
March 31, 2018 ` in Crores
Year Ended March 31, 2017
` in CroresOPENING STOCKS: Work-in-Progress 129.35 142.03 Finished Goods 36.40 59.94 Stock-in-trade 28.39 11.46 Less: Excise Duty 3.11 3.34
191.03 210.09CLOSING STOCKS: Work-in-Progress 128.11 129.35 Finished Goods 56.81 36.40 Stock-in-trade 30.95 28.39 Less: Excise Duty - 3.11
215.87 191.03TOTAL (24.84) 19.06
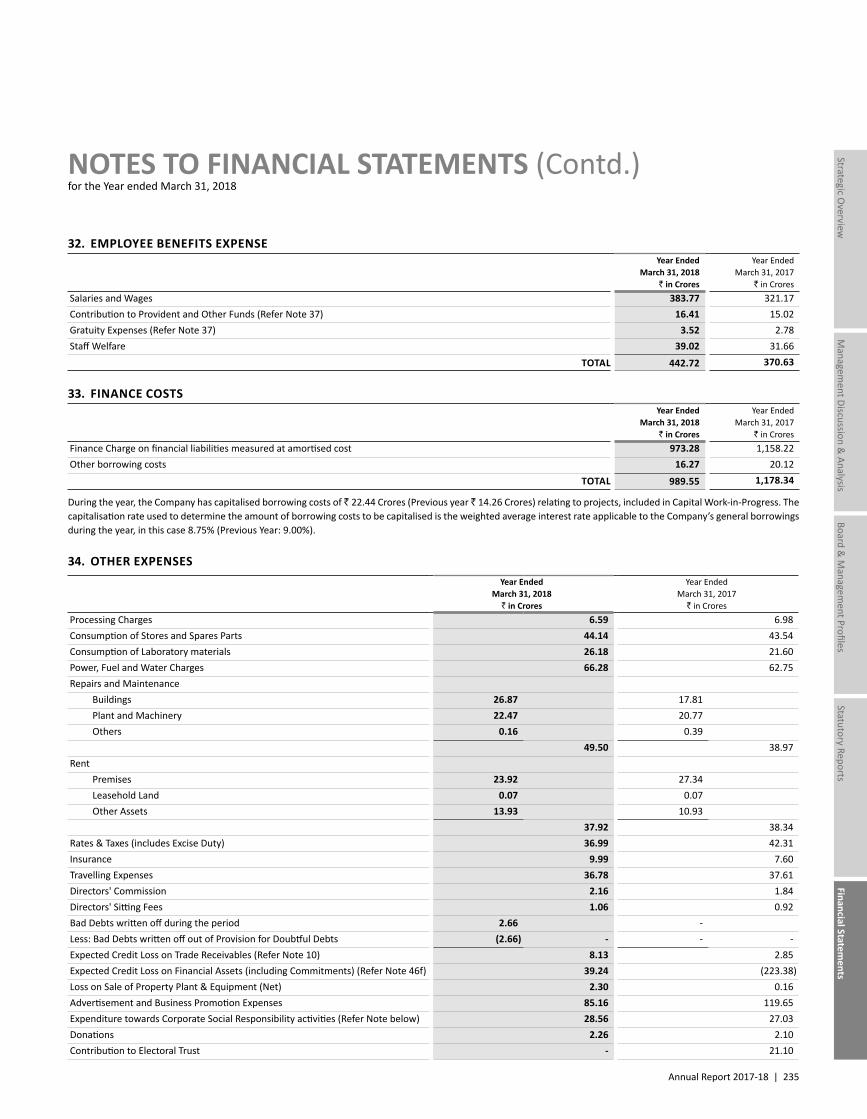
Annual Report 2017-18 | 235
Managem
ent Discussion & Analysis
Strategic Overview
Board &
Managem
ent ProfilesStatutory Reports
Financial Statements
NOTES TO FINANCIAL STATEMENTS (Contd.)for the Year ended March 31, 2018
32. EMPLOYEE BENEFITS EXPENSE Year Ended
March 31, 2018 ` in Crores
Year Ended March 31, 2017
` in CroresSalaries and Wages 383.77 321.17Contribution to Provident and Other Funds (Refer Note 37) 16.41 15.02Gratuity Expenses (Refer Note 37) 3.52 2.78Staff Welfare 39.02 31.66
TOTAL 442.72 370.63
33. FINANCE COSTS Year Ended
March 31, 2018 ` in Crores
Year Ended March 31, 2017
` in CroresFinance Charge on financial liabilities measured at amortised cost 973.28 1,158.22Other borrowing costs 16.27 20.12
TOTAL 989.55 1,178.34
During the year, the Company has capitalised borrowing costs of ` 22.44 Crores (Previous year ` 14.26 Crores) relating to projects, included in Capital Work-in-Progress. The capitalisation rate used to determine the amount of borrowing costs to be capitalised is the weighted average interest rate applicable to the Company’s general borrowings during the year, in this case 8.75% (Previous Year: 9.00%).
34. OTHER EXPENSES Year Ended
March 31, 2018 ` in Crores
Year Ended March 31, 2017
` in CroresProcessing Charges 6.59 6.98Consumption of Stores and Spares Parts 44.14 43.54Consumption of Laboratory materials 26.18 21.60Power, Fuel and Water Charges 66.28 62.75Repairs and Maintenance Buildings 26.87 17.81 Plant and Machinery 22.47 20.77 Others 0.16 0.39
49.50 38.97Rent Premises 23.92 27.34 Leasehold Land 0.07 0.07 Other Assets 13.93 10.93
37.92 38.34Rates & Taxes (includes Excise Duty) 36.99 42.31Insurance 9.99 7.60Travelling Expenses 36.78 37.61Directors' Commission 2.16 1.84Directors' Sitting Fees 1.06 0.92Bad Debts written off during the period 2.66 -Less: Bad Debts written off out of Provision for Doubtful Debts (2.66) - - -Expected Credit Loss on Trade Receivables (Refer Note 10) 8.13 2.85Expected Credit Loss on Financial Assets (including Commitments) (Refer Note 46f) 39.24 (223.38)Loss on Sale of Property Plant & Equipment (Net) 2.30 0.16Advertisement and Business Promotion Expenses 85.16 119.65Expenditure towards Corporate Social Responsibility activities (Refer Note below) 28.56 27.03Donations 2.26 2.10Contribution to Electoral Trust - 21.10
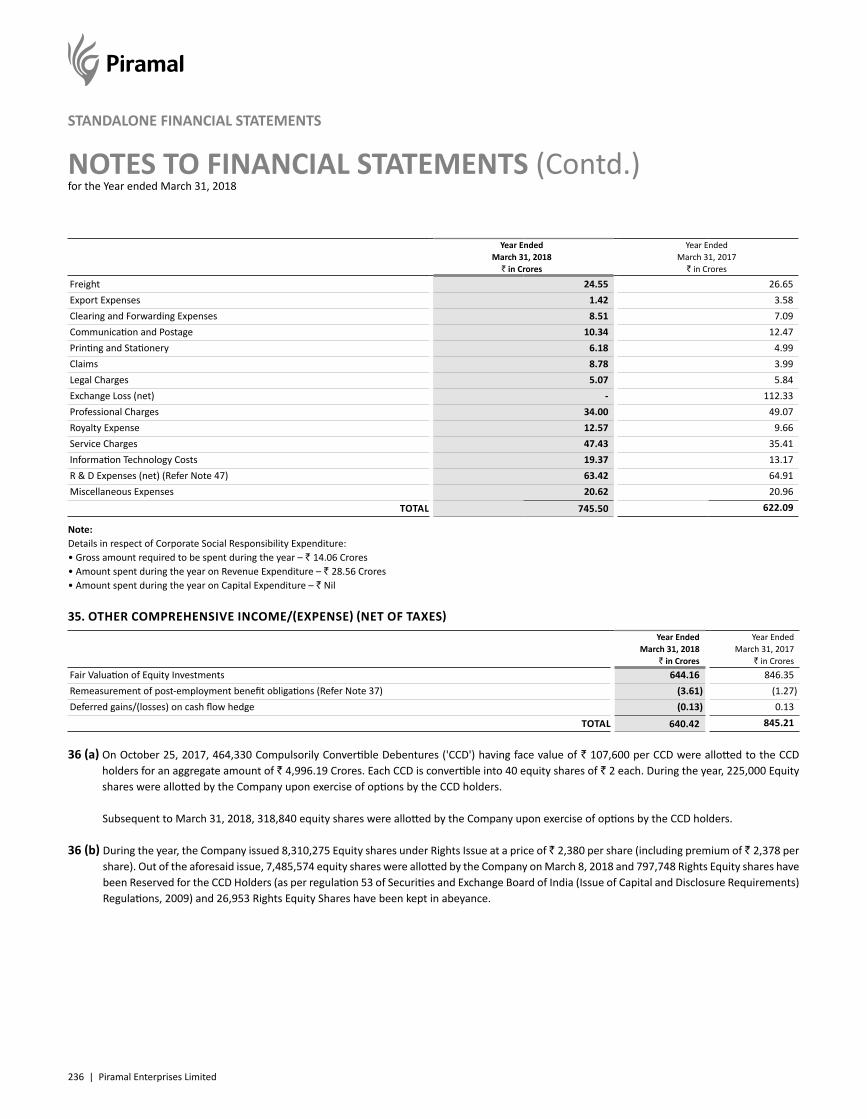
236 | Piramal Enterprises Limited
NOTES TO FINANCIAL STATEMENTS (Contd.)for the Year ended March 31, 2018
STANDALONE FINANCIAL STATEMENTS
Year Ended March 31, 2018
` in Crores
Year Ended March 31, 2017
` in Crores
Freight 24.55 26.65Export Expenses 1.42 3.58Clearing and Forwarding Expenses 8.51 7.09Communication and Postage 10.34 12.47Printing and Stationery 6.18 4.99Claims 8.78 3.99Legal Charges 5.07 5.84Exchange Loss (net) - 112.33Professional Charges 34.00 49.07Royalty Expense 12.57 9.66Service Charges 47.43 35.41Information Technology Costs 19.37 13.17R & D Expenses (net) (Refer Note 47) 63.42 64.91Miscellaneous Expenses 20.62 20.96
TOTAL 745.50 622.09
Note:Details in respect of Corporate Social Responsibility Expenditure:• Gross amount required to be spent during the year – ` 14.06 Crores• Amount spent during the year on Revenue Expenditure – ` 28.56 Crores • Amount spent during the year on Capital Expenditure – ` Nil
35. OTHER COMPREHENSIVE INCOME/(EXPENSE) (NET OF TAXES) Year Ended
March 31, 2018 ` in Crores
Year Ended March 31, 2017
` in CroresFair Valuation of Equity Investments 644.16 846.35Remeasurement of post-employment benefit obligations (Refer Note 37) (3.61) (1.27)Deferred gains/(losses) on cash flow hedge (0.13) 0.13
TOTAL 640.42 845.21
36 (a) On October 25, 2017, 464,330 Compulsorily Convertible Debentures ('CCD') having face value of ` 107,600 per CCD were allotted to the CCD holders for an aggregate amount of ` 4,996.19 Crores. Each CCD is convertible into 40 equity shares of ` 2 each. During the year, 225,000 Equity shares were allotted by the Company upon exercise of options by the CCD holders.
Subsequent to March 31, 2018, 318,840 equity shares were allotted by the Company upon exercise of options by the CCD holders.
36 (b) During the year, the Company issued 8,310,275 Equity shares under Rights Issue at a price of ` 2,380 per share (including premium of ` 2,378 per share). Out of the aforesaid issue, 7,485,574 equity shares were allotted by the Company on March 8, 2018 and 797,748 Rights Equity shares have been Reserved for the CCD Holders (as per regulation 53 of Securities and Exchange Board of India (Issue of Capital and Disclosure Requirements) Regulations, 2009) and 26,953 Rights Equity Shares have been kept in abeyance.
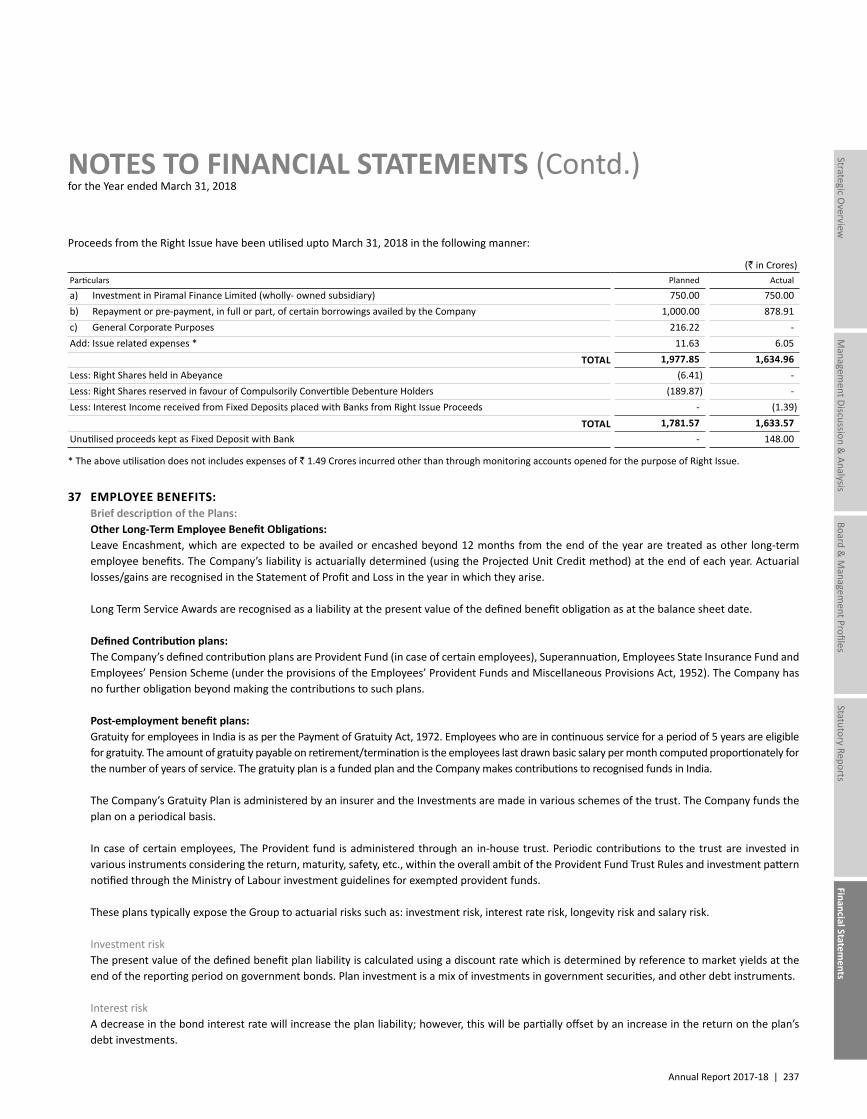
Annual Report 2017-18 | 237
Managem
ent Discussion & Analysis
Strategic Overview
Board &
Managem
ent ProfilesStatutory Reports
Financial Statements
NOTES TO FINANCIAL STATEMENTS (Contd.)for the Year ended March 31, 2018
Proceeds from the Right Issue have been utilised upto March 31, 2018 in the following manner:
(` in Crores)Particulars Planned Actual
a) Investment in Piramal Finance Limited (wholly- owned subsidiary) 750.00 750.00b) Repayment or pre-payment, in full or part, of certain borrowings availed by the Company 1,000.00 878.91c) General Corporate Purposes 216.22 -Add: Issue related expenses * 11.63 6.05
TOTAL 1,977.85 1,634.96Less: Right Shares held in Abeyance (6.41) -Less: Right Shares reserved in favour of Compulsorily Convertible Debenture Holders (189.87) -Less: Interest Income received from Fixed Deposits placed with Banks from Right Issue Proceeds - (1.39)
TOTAL 1,781.57 1,633.57Unutilised proceeds kept as Fixed Deposit with Bank - 148.00
* The above utilisation does not includes expenses of ` 1.49 Crores incurred other than through monitoring accounts opened for the purpose of Right Issue.
37 EMPLOYEE BENEFITS: Brief description of the Plans: Other Long-Term Employee Benefit Obligations: Leave Encashment, which are expected to be availed or encashed beyond 12 months from the end of the year are treated as other long-term
employee benefits. The Company’s liability is actuarially determined (using the Projected Unit Credit method) at the end of each year. Actuarial losses/gains are recognised in the Statement of Profit and Loss in the year in which they arise.
Long Term Service Awards are recognised as a liability at the present value of the defined benefit obligation as at the balance sheet date.
Defined Contribution plans: The Company’s defined contribution plans are Provident Fund (in case of certain employees), Superannuation, Employees State Insurance Fund and
Employees’ Pension Scheme (under the provisions of the Employees’ Provident Funds and Miscellaneous Provisions Act, 1952). The Company has no further obligation beyond making the contributions to such plans.
Post-employment benefit plans: Gratuity for employees in India is as per the Payment of Gratuity Act, 1972. Employees who are in continuous service for a period of 5 years are eligible
for gratuity. The amount of gratuity payable on retirement/termination is the employees last drawn basic salary per month computed proportionately for the number of years of service. The gratuity plan is a funded plan and the Company makes contributions to recognised funds in India.
The Company’s Gratuity Plan is administered by an insurer and the Investments are made in various schemes of the trust. The Company funds the plan on a periodical basis.
In case of certain employees, The Provident fund is administered through an in-house trust. Periodic contributions to the trust are invested in various instruments considering the return, maturity, safety, etc., within the overall ambit of the Provident Fund Trust Rules and investment pattern notified through the Ministry of Labour investment guidelines for exempted provident funds.
These plans typically expose the Group to actuarial risks such as: investment risk, interest rate risk, longevity risk and salary risk.
Investment risk The present value of the defined benefit plan liability is calculated using a discount rate which is determined by reference to market yields at the
end of the reporting period on government bonds. Plan investment is a mix of investments in government securities, and other debt instruments.
Interest risk A decrease in the bond interest rate will increase the plan liability; however, this will be partially offset by an increase in the return on the plan’s
debt investments.
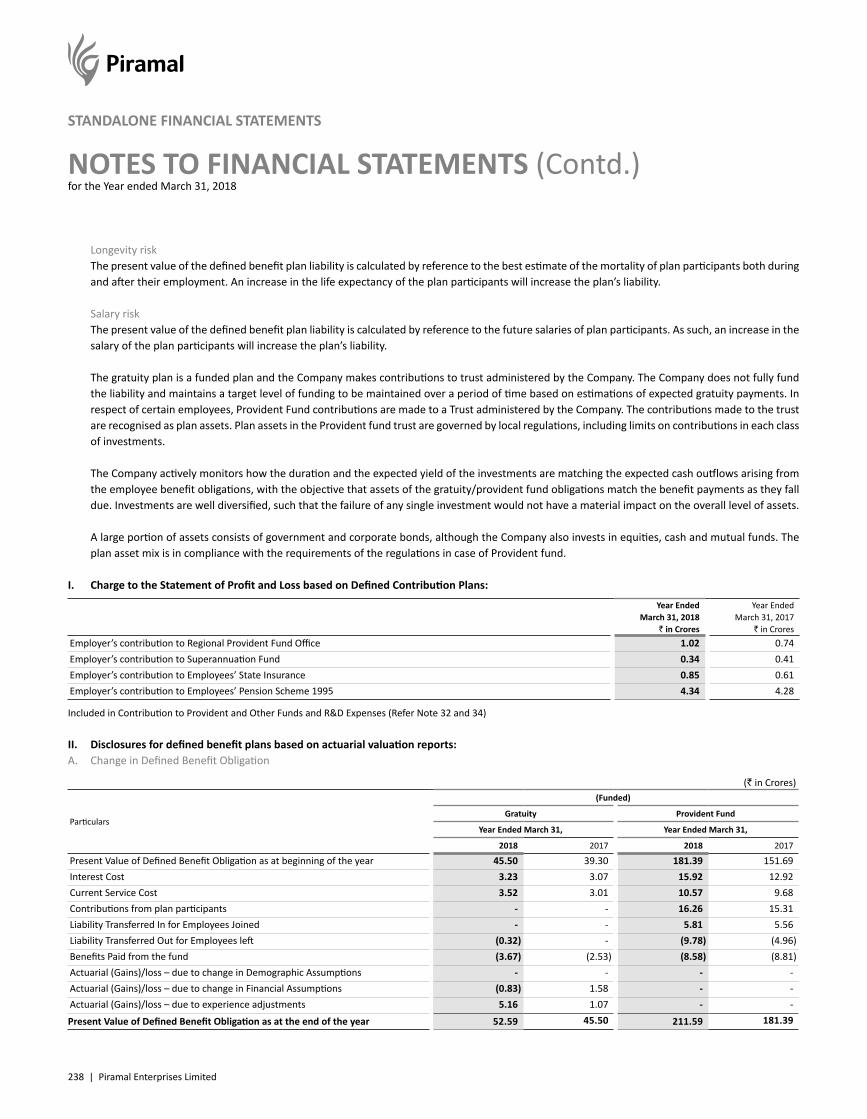
238 | Piramal Enterprises Limited
NOTES TO FINANCIAL STATEMENTS (Contd.)for the Year ended March 31, 2018
STANDALONE FINANCIAL STATEMENTS
Longevity risk The present value of the defined benefit plan liability is calculated by reference to the best estimate of the mortality of plan participants both during
and after their employment. An increase in the life expectancy of the plan participants will increase the plan’s liability.
Salary risk The present value of the defined benefit plan liability is calculated by reference to the future salaries of plan participants. As such, an increase in the
salary of the plan participants will increase the plan’s liability.
The gratuity plan is a funded plan and the Company makes contributions to trust administered by the Company. The Company does not fully fund the liability and maintains a target level of funding to be maintained over a period of time based on estimations of expected gratuity payments. In respect of certain employees, Provident Fund contributions are made to a Trust administered by the Company. The contributions made to the trust are recognised as plan assets. Plan assets in the Provident fund trust are governed by local regulations, including limits on contributions in each class of investments.
The Company actively monitors how the duration and the expected yield of the investments are matching the expected cash outflows arising from the employee benefit obligations, with the objective that assets of the gratuity/provident fund obligations match the benefit payments as they fall due. Investments are well diversified, such that the failure of any single investment would not have a material impact on the overall level of assets.
A large portion of assets consists of government and corporate bonds, although the Company also invests in equities, cash and mutual funds. The plan asset mix is in compliance with the requirements of the regulations in case of Provident fund.
I. Charge to the Statement of Profit and Loss based on Defined Contribution Plans:
Year Ended March 31, 2018
` in Crores
Year Ended March 31, 2017
` in CroresEmployer’s contribution to Regional Provident Fund Office 1.02 0.74Employer’s contribution to Superannuation Fund 0.34 0.41Employer’s contribution to Employees’ State Insurance 0.85 0.61Employer’s contribution to Employees’ Pension Scheme 1995 4.34 4.28
Included in Contribution to Provident and Other Funds and R&D Expenses (Refer Note 32 and 34)
II. Disclosures for defined benefit plans based on actuarial valuation reports:A. Change in Defined Benefit Obligation
(` in Crores)
Particulars
(Funded)
Gratuity Provident Fund
Year Ended March 31, Year Ended March 31,
2018 2017 2018 2017
Present Value of Defined Benefit Obligation as at beginning of the year 45.50 39.30 181.39 151.69Interest Cost 3.23 3.07 15.92 12.92Current Service Cost 3.52 3.01 10.57 9.68Contributions from plan participants - - 16.26 15.31Liability Transferred In for Employees Joined - - 5.81 5.56Liability Transferred Out for Employees left (0.32) - (9.78) (4.96)Benefits Paid from the fund (3.67) (2.53) (8.58) (8.81)Actuarial (Gains)/loss – due to change in Demographic Assumptions - - - -Actuarial (Gains)/loss – due to change in Financial Assumptions (0.83) 1.58 - -Actuarial (Gains)/loss – due to experience adjustments 5.16 1.07 - -
Present Value of Defined Benefit Obligation as at the end of the year 52.59 45.50 211.59 181.39
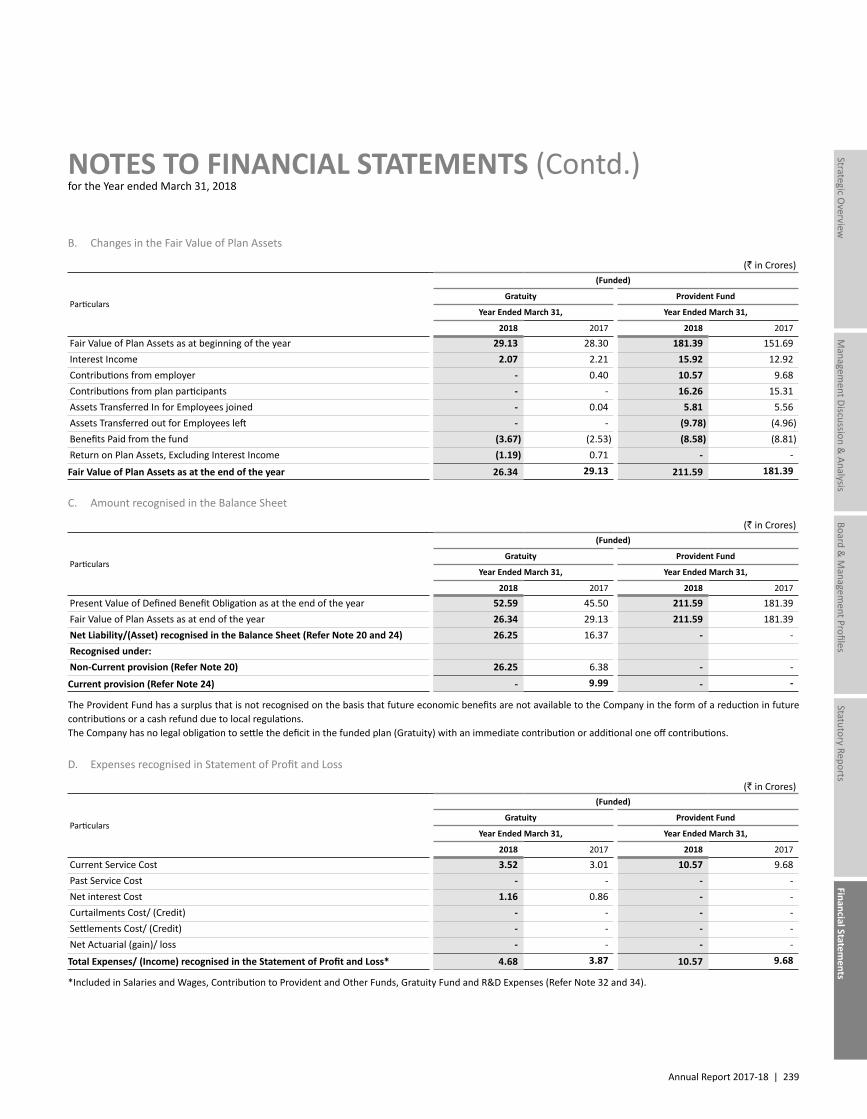
Annual Report 2017-18 | 239
Managem
ent Discussion & Analysis
Strategic Overview
Board &
Managem
ent ProfilesStatutory Reports
Financial Statements
NOTES TO FINANCIAL STATEMENTS (Contd.)for the Year ended March 31, 2018
B. Changes in the Fair Value of Plan Assets
(` in Crores)
Particulars
(Funded)
Gratuity Provident Fund
Year Ended March 31, Year Ended March 31,
2018 2017 2018 2017
Fair Value of Plan Assets as at beginning of the year 29.13 28.30 181.39 151.69Interest Income 2.07 2.21 15.92 12.92Contributions from employer - 0.40 10.57 9.68Contributions from plan participants - - 16.26 15.31Assets Transferred In for Employees joined - 0.04 5.81 5.56Assets Transferred out for Employees left - - (9.78) (4.96)Benefits Paid from the fund (3.67) (2.53) (8.58) (8.81)Return on Plan Assets, Excluding Interest Income (1.19) 0.71 - -
Fair Value of Plan Assets as at the end of the year 26.34 29.13 211.59 181.39
C. Amount recognised in the Balance Sheet
(` in Crores)
Particulars
(Funded)
Gratuity Provident Fund
Year Ended March 31, Year Ended March 31,
2018 2017 2018 2017
Present Value of Defined Benefit Obligation as at the end of the year 52.59 45.50 211.59 181.39Fair Value of Plan Assets as at end of the year 26.34 29.13 211.59 181.39Net Liability/(Asset) recognised in the Balance Sheet (Refer Note 20 and 24) 26.25 16.37 - -Recognised under:Non-Current provision (Refer Note 20) 26.25 6.38 - -
Current provision (Refer Note 24) - 9.99 - -
The Provident Fund has a surplus that is not recognised on the basis that future economic benefits are not available to the Company in the form of a reduction in future contributions or a cash refund due to local regulations.The Company has no legal obligation to settle the deficit in the funded plan (Gratuity) with an immediate contribution or additional one off contributions.
D. Expenses recognised in Statement of Profit and Loss
(` in Crores)
Particulars
(Funded)
Gratuity Provident Fund
Year Ended March 31, Year Ended March 31,
2018 2017 2018 2017
Current Service Cost 3.52 3.01 10.57 9.68Past Service Cost - - - -Net interest Cost 1.16 0.86 - -Curtailments Cost/ (Credit) - - - -Settlements Cost/ (Credit) - - - -Net Actuarial (gain)/ loss - - - -
Total Expenses/ (Income) recognised in the Statement of Profit and Loss* 4.68 3.87 10.57 9.68
*Included in Salaries and Wages, Contribution to Provident and Other Funds, Gratuity Fund and R&D Expenses (Refer Note 32 and 34).
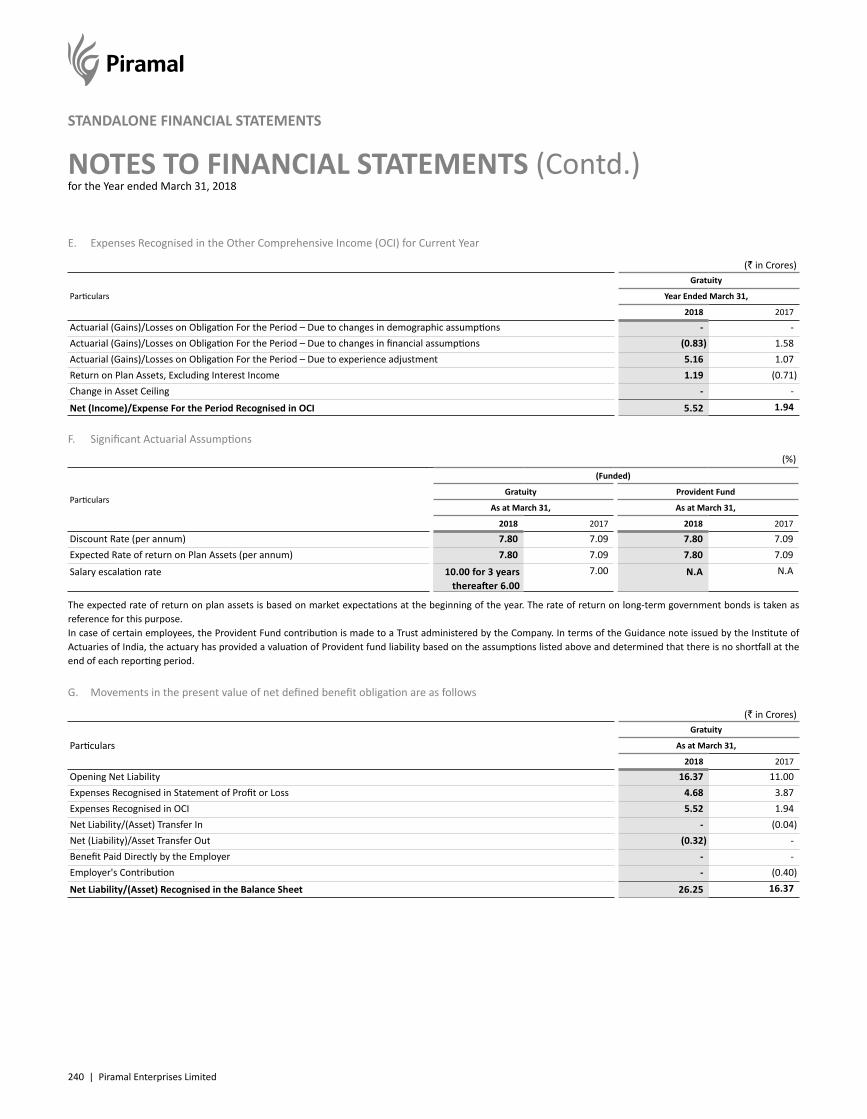
240 | Piramal Enterprises Limited
NOTES TO FINANCIAL STATEMENTS (Contd.)for the Year ended March 31, 2018
STANDALONE FINANCIAL STATEMENTS
E. Expenses Recognised in the Other Comprehensive Income (OCI) for Current Year
(` in Crores)
Particulars
Gratuity
Year Ended March 31,
2018 2017
Actuarial (Gains)/Losses on Obligation For the Period – Due to changes in demographic assumptions - -Actuarial (Gains)/Losses on Obligation For the Period – Due to changes in financial assumptions (0.83) 1.58Actuarial (Gains)/Losses on Obligation For the Period – Due to experience adjustment 5.16 1.07Return on Plan Assets, Excluding Interest Income 1.19 (0.71)Change in Asset Ceiling - -
Net (Income)/Expense For the Period Recognised in OCI 5.52 1.94
F. Significant Actuarial Assumptions
(%)
Particulars
(Funded)
Gratuity Provident Fund
As at March 31, As at March 31,
2018 2017 2018 2017
Discount Rate (per annum) 7.80 7.09 7.80 7.09Expected Rate of return on Plan Assets (per annum) 7.80 7.09 7.80 7.09
Salary escalation rate 10.00 for 3 years thereafter 6.00
7.00 N.A N.A
The expected rate of return on plan assets is based on market expectations at the beginning of the year. The rate of return on long-term government bonds is taken as reference for this purpose.In case of certain employees, the Provident Fund contribution is made to a Trust administered by the Company. In terms of the Guidance note issued by the Institute of Actuaries of India, the actuary has provided a valuation of Provident fund liability based on the assumptions listed above and determined that there is no shortfall at the end of each reporting period.
G. Movements in the present value of net defined benefit obligation are as follows
(` in Crores)
ParticularsGratuity
As at March 31,
2018 2017
Opening Net Liability 16.37 11.00Expenses Recognised in Statement of Profit or Loss 4.68 3.87Expenses Recognised in OCI 5.52 1.94Net Liability/(Asset) Transfer In - (0.04)Net (Liability)/Asset Transfer Out (0.32) -Benefit Paid Directly by the Employer - -Employer's Contribution - (0.40)
Net Liability/(Asset) Recognised in the Balance Sheet 26.25 16.37
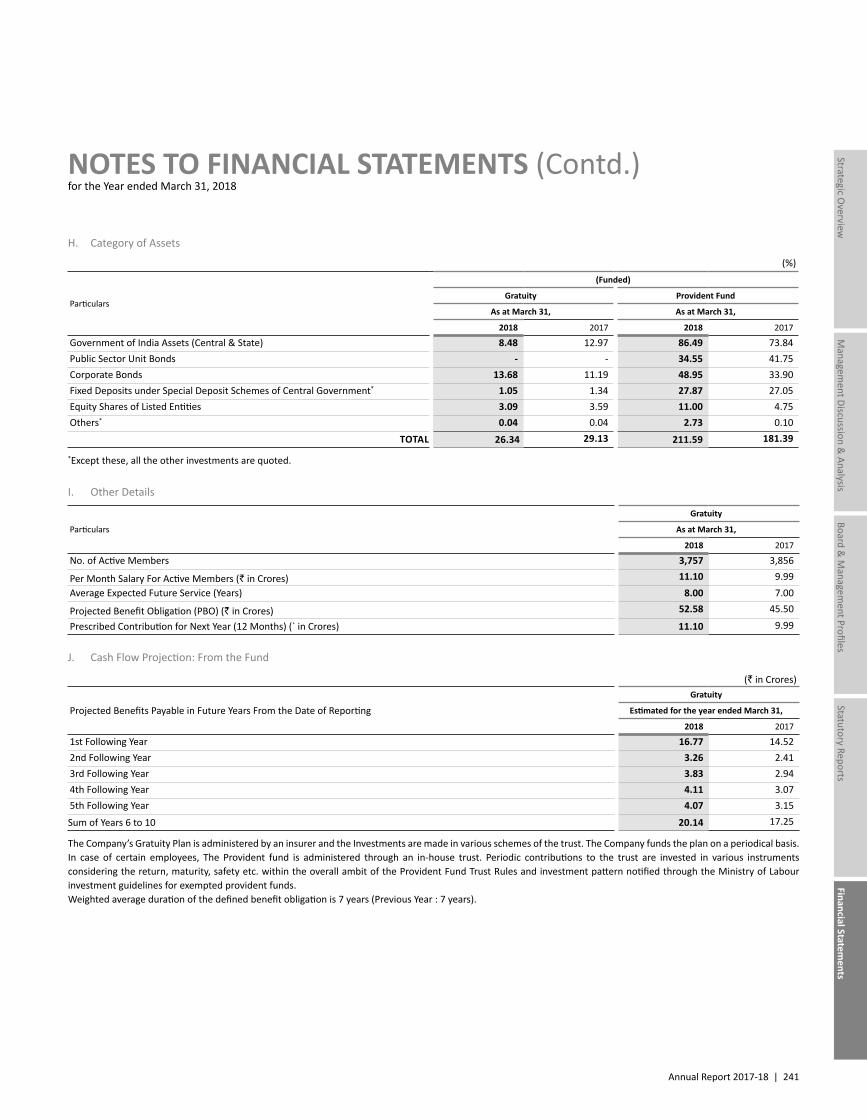
Annual Report 2017-18 | 241
Managem
ent Discussion & Analysis
Strategic Overview
Board &
Managem
ent ProfilesStatutory Reports
Financial Statements
NOTES TO FINANCIAL STATEMENTS (Contd.)for the Year ended March 31, 2018
H. Category of Assets
(%)
Particulars
(Funded)
Gratuity Provident Fund
As at March 31, As at March 31,
2018 2017 2018 2017
Government of India Assets (Central & State) 8.48 12.97 86.49 73.84Public Sector Unit Bonds - - 34.55 41.75Corporate Bonds 13.68 11.19 48.95 33.90Fixed Deposits under Special Deposit Schemes of Central Government* 1.05 1.34 27.87 27.05Equity Shares of Listed Entities 3.09 3.59 11.00 4.75Others* 0.04 0.04 2.73 0.10
TOTAL 26.34 29.13 211.59 181.39
*Except these, all the other investments are quoted.
I. Other Details
Particulars
Gratuity
As at March 31,
2018 2017
No. of Active Members 3,757 3,856
Per Month Salary For Active Members (` in Crores) 11.10 9.99Average Expected Future Service (Years) 8.00 7.00
Projected Benefit Obligation (PBO) (` in Crores) 52.58 45.50
Prescribed Contribution for Next Year (12 Months) (` in Crores) 11.10 9.99
J. Cash Flow Projection: From the Fund
(` in Crores)
Projected Benefits Payable in Future Years From the Date of ReportingGratuity
Estimated for the year ended March 31,
2018 2017
1st Following Year 16.77 14.522nd Following Year 3.26 2.413rd Following Year 3.83 2.944th Following Year 4.11 3.075th Following Year 4.07 3.15
Sum of Years 6 to 10 20.14 17.25
The Company’s Gratuity Plan is administered by an insurer and the Investments are made in various schemes of the trust. The Company funds the plan on a periodical basis.In case of certain employees, The Provident fund is administered through an in-house trust. Periodic contributions to the trust are invested in various instruments considering the return, maturity, safety etc. within the overall ambit of the Provident Fund Trust Rules and investment pattern notified through the Ministry of Labour investment guidelines for exempted provident funds.Weighted average duration of the defined benefit obligation is 7 years (Previous Year : 7 years).
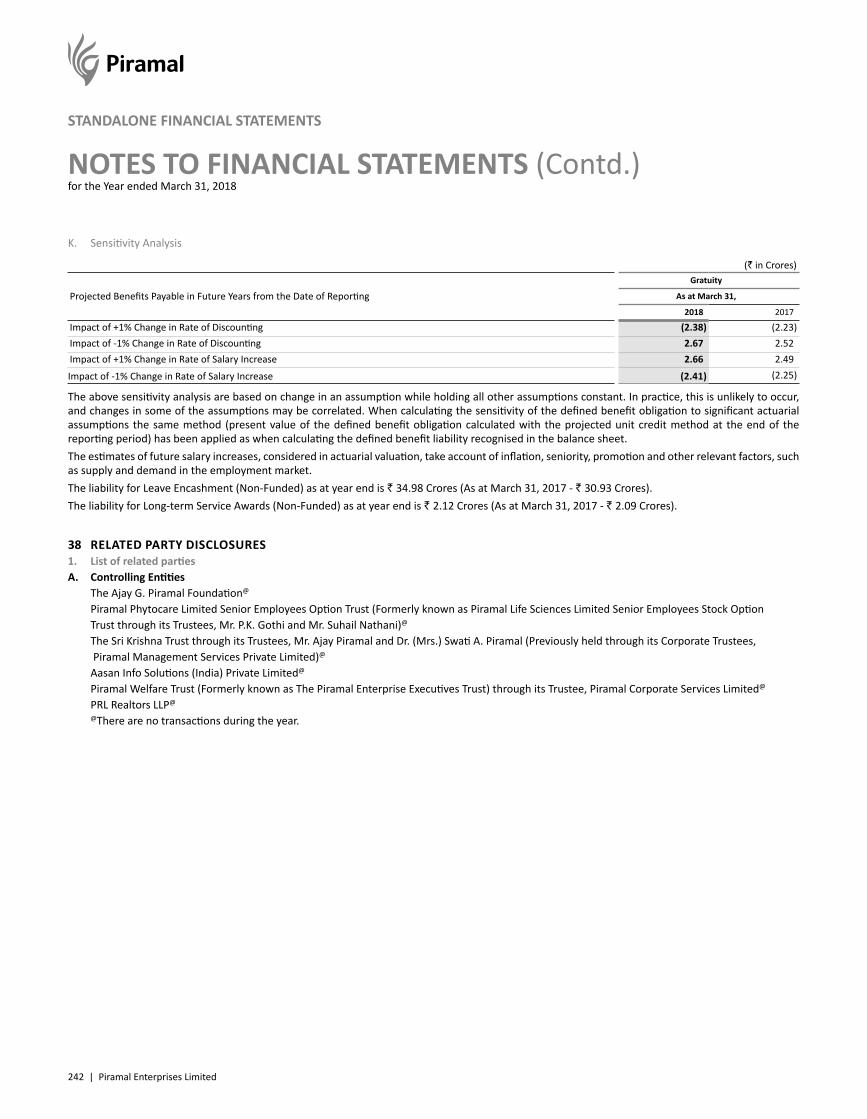
242 | Piramal Enterprises Limited
NOTES TO FINANCIAL STATEMENTS (Contd.)for the Year ended March 31, 2018
STANDALONE FINANCIAL STATEMENTS
K. Sensitivity Analysis
(` in Crores)
Projected Benefits Payable in Future Years from the Date of ReportingGratuity
As at March 31,
2018 2017
Impact of +1% Change in Rate of Discounting (2.38) (2.23)Impact of -1% Change in Rate of Discounting 2.67 2.52Impact of +1% Change in Rate of Salary Increase 2.66 2.49
Impact of -1% Change in Rate of Salary Increase (2.41) (2.25)
The above sensitivity analysis are based on change in an assumption while holding all other assumptions constant. In practice, this is unlikely to occur, and changes in some of the assumptions may be correlated. When calculating the sensitivity of the defined benefit obligation to significant actuarial assumptions the same method (present value of the defined benefit obligation calculated with the projected unit credit method at the end of the reporting period) has been applied as when calculating the defined benefit liability recognised in the balance sheet.The estimates of future salary increases, considered in actuarial valuation, take account of inflation, seniority, promotion and other relevant factors, such as supply and demand in the employment market.The liability for Leave Encashment (Non-Funded) as at year end is ` 34.98 Crores (As at March 31, 2017 - ` 30.93 Crores).The liability for Long-term Service Awards (Non-Funded) as at year end is ` 2.12 Crores (As at March 31, 2017 - ` 2.09 Crores).
38 RELATED PARTY DISCLOSURES1. List of related partiesA. Controlling Entities The Ajay G. Piramal Foundation@
Piramal Phytocare Limited Senior Employees Option Trust (Formerly known as Piramal Life Sciences Limited Senior Employees Stock Option Trust through its Trustees, Mr. P.K. Gothi and Mr. Suhail Nathani)@
The Sri Krishna Trust through its Trustees, Mr. Ajay Piramal and Dr. (Mrs.) Swati A. Piramal (Previously held through its Corporate Trustees, Piramal Management Services Private Limited)@
Aasan Info Solutions (India) Private Limited@
Piramal Welfare Trust (Formerly known as The Piramal Enterprise Executives Trust) through its Trustee, Piramal Corporate Services Limited@
PRL Realtors LLP@
@There are no transactions during the year.
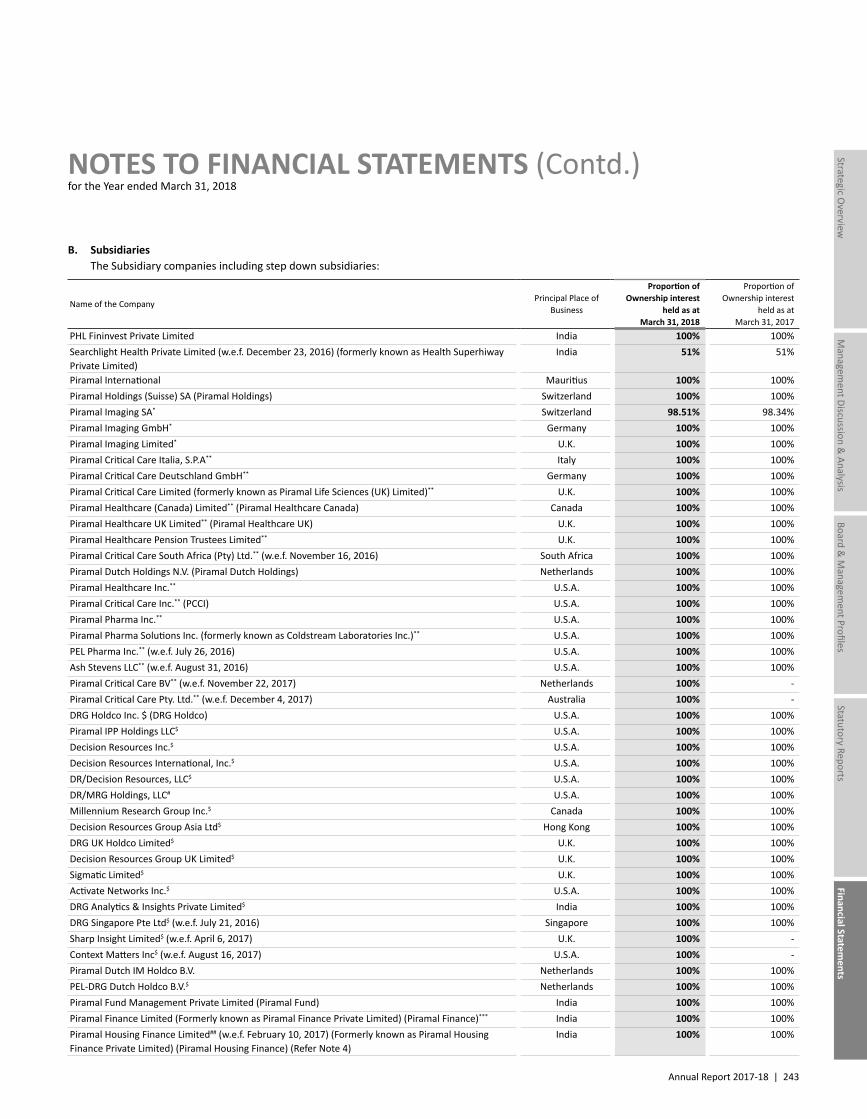
Annual Report 2017-18 | 243
Managem
ent Discussion & Analysis
Strategic Overview
Board &
Managem
ent ProfilesStatutory Reports
Financial Statements
NOTES TO FINANCIAL STATEMENTS (Contd.)for the Year ended March 31, 2018
B. Subsidiaries The Subsidiary companies including step down subsidiaries:
Name of the CompanyPrincipal Place of
Business
Proportion of Ownership interest
held as atMarch 31, 2018
Proportion of Ownership interest
held as atMarch 31, 2017
PHL Fininvest Private Limited India 100% 100%Searchlight Health Private Limited (w.e.f. December 23, 2016) (formerly known as Health Superhiway Private Limited)
India 51% 51%
Piramal International Mauritius 100% 100%Piramal Holdings (Suisse) SA (Piramal Holdings) Switzerland 100% 100%Piramal Imaging SA* Switzerland 98.51% 98.34%Piramal Imaging GmbH* Germany 100% 100%Piramal Imaging Limited* U.K. 100% 100%Piramal Critical Care Italia, S.P.A** Italy 100% 100%Piramal Critical Care Deutschland GmbH** Germany 100% 100%Piramal Critical Care Limited (formerly known as Piramal Life Sciences (UK) Limited)** U.K. 100% 100%Piramal Healthcare (Canada) Limited** (Piramal Healthcare Canada) Canada 100% 100%Piramal Healthcare UK Limited** (Piramal Healthcare UK) U.K. 100% 100%Piramal Healthcare Pension Trustees Limited** U.K. 100% 100%Piramal Critical Care South Africa (Pty) Ltd.** (w.e.f. November 16, 2016) South Africa 100% 100%Piramal Dutch Holdings N.V. (Piramal Dutch Holdings) Netherlands 100% 100%Piramal Healthcare Inc.** U.S.A. 100% 100%Piramal Critical Care Inc.** (PCCI) U.S.A. 100% 100%Piramal Pharma Inc.** U.S.A. 100% 100%Piramal Pharma Solutions Inc. (formerly known as Coldstream Laboratories Inc.)** U.S.A. 100% 100%PEL Pharma Inc.** (w.e.f. July 26, 2016) U.S.A. 100% 100%Ash Stevens LLC** (w.e.f. August 31, 2016) U.S.A. 100% 100%Piramal Critical Care BV** (w.e.f. November 22, 2017) Netherlands 100% -Piramal Critical Care Pty. Ltd.** (w.e.f. December 4, 2017) Australia 100% -DRG Holdco Inc. $ (DRG Holdco) U.S.A. 100% 100%Piramal IPP Holdings LLC$ U.S.A. 100% 100%Decision Resources Inc.$ U.S.A. 100% 100%Decision Resources International, Inc.$ U.S.A. 100% 100%DR/Decision Resources, LLC$ U.S.A. 100% 100%DR/MRG Holdings, LLC# U.S.A. 100% 100%Millennium Research Group Inc.$ Canada 100% 100%Decision Resources Group Asia Ltd$ Hong Kong 100% 100%DRG UK Holdco Limited$ U.K. 100% 100%Decision Resources Group UK Limited$ U.K. 100% 100%Sigmatic Limited$ U.K. 100% 100%Activate Networks Inc.$ U.S.A. 100% 100%DRG Analytics & Insights Private Limited$ India 100% 100%DRG Singapore Pte Ltd$ (w.e.f. July 21, 2016) Singapore 100% 100%Sharp Insight Limited$ (w.e.f. April 6, 2017) U.K. 100% -Context Matters Inc$ (w.e.f. August 16, 2017) U.S.A. 100% -Piramal Dutch IM Holdco B.V. Netherlands 100% 100%PEL-DRG Dutch Holdco B.V.$ Netherlands 100% 100%Piramal Fund Management Private Limited (Piramal Fund) India 100% 100%Piramal Finance Limited (Formerly known as Piramal Finance Private Limited) (Piramal Finance)*** India 100% 100%Piramal Housing Finance Limited## (w.e.f. February 10, 2017) (Formerly known as Piramal Housing Finance Private Limited) (Piramal Housing Finance) (Refer Note 4)
India 100% 100%
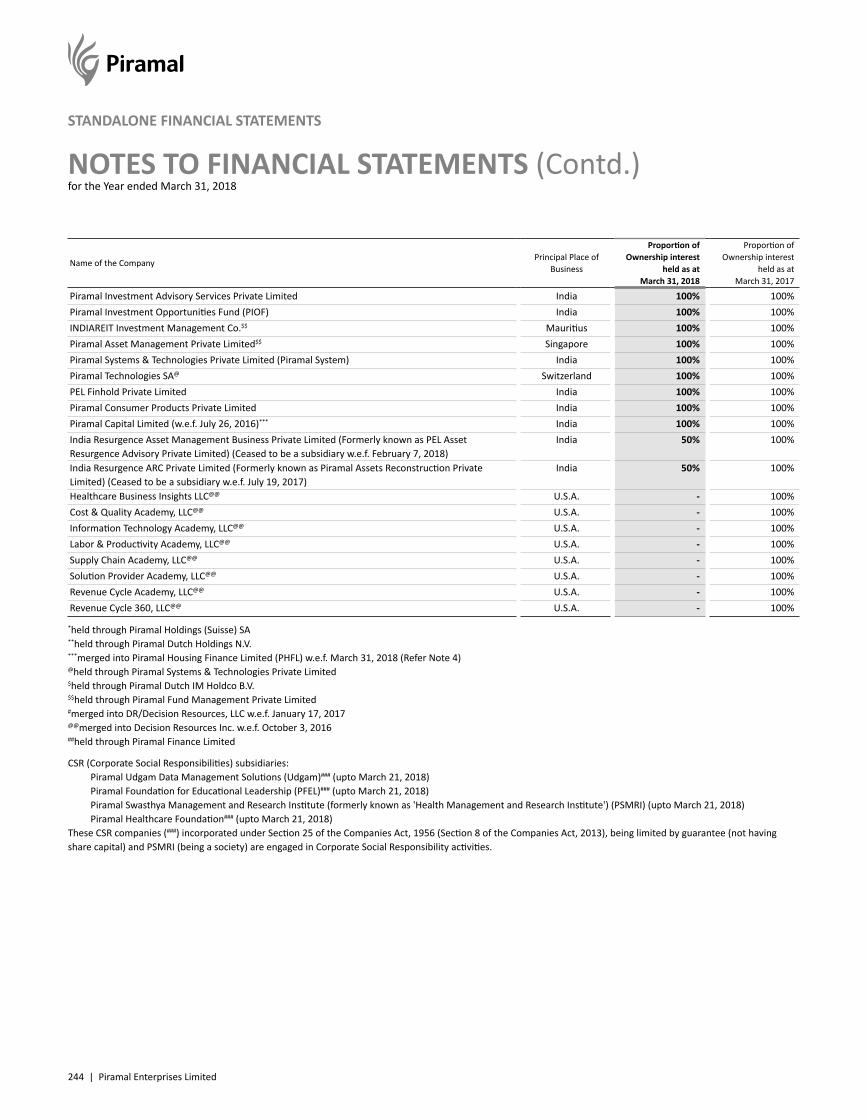
244 | Piramal Enterprises Limited
NOTES TO FINANCIAL STATEMENTS (Contd.)for the Year ended March 31, 2018
STANDALONE FINANCIAL STATEMENTS
Name of the CompanyPrincipal Place of
Business
Proportion of Ownership interest
held as atMarch 31, 2018
Proportion of Ownership interest
held as atMarch 31, 2017
Piramal Investment Advisory Services Private Limited India 100% 100%Piramal Investment Opportunities Fund (PIOF) India 100% 100%INDIAREIT Investment Management Co.$$ Mauritius 100% 100%Piramal Asset Management Private Limited$$ Singapore 100% 100%Piramal Systems & Technologies Private Limited (Piramal System) India 100% 100%Piramal Technologies SA@ Switzerland 100% 100%PEL Finhold Private Limited India 100% 100%Piramal Consumer Products Private Limited India 100% 100%Piramal Capital Limited (w.e.f. July 26, 2016)*** India 100% 100%India Resurgence Asset Management Business Private Limited (Formerly known as PEL Asset Resurgence Advisory Private Limited) (Ceased to be a subsidiary w.e.f. February 7, 2018)
India 50% 100%
India Resurgence ARC Private Limited (Formerly known as Piramal Assets Reconstruction Private Limited) (Ceased to be a subsidiary w.e.f. July 19, 2017)
India 50% 100%
Healthcare Business Insights LLC@@ U.S.A. - 100%Cost & Quality Academy, LLC@@ U.S.A. - 100%Information Technology Academy, LLC@@ U.S.A. - 100%Labor & Productivity Academy, LLC@@ U.S.A. - 100%Supply Chain Academy, LLC@@ U.S.A. - 100%Solution Provider Academy, LLC@@ U.S.A. - 100%Revenue Cycle Academy, LLC@@ U.S.A. - 100%Revenue Cycle 360, LLC@@ U.S.A. - 100%
*held through Piramal Holdings (Suisse) SA**held through Piramal Dutch Holdings N.V.***merged into Piramal Housing Finance Limited (PHFL) w.e.f. March 31, 2018 (Refer Note 4)@held through Piramal Systems & Technologies Private Limited$held through Piramal Dutch IM Holdco B.V.$$held through Piramal Fund Management Private Limited#merged into DR/Decision Resources, LLC w.e.f. January 17, 2017@@merged into Decision Resources Inc. w.e.f. October 3, 2016##held through Piramal Finance Limited
CSR (Corporate Social Responsibilities) subsidiaries: Piramal Udgam Data Management Solutions (Udgam)### (upto March 21, 2018) Piramal Foundation for Educational Leadership (PFEL)### (upto March 21, 2018) Piramal Swasthya Management and Research Institute (formerly known as 'Health Management and Research Institute') (PSMRI) (upto March 21, 2018) Piramal Healthcare Foundation### (upto March 21, 2018)These CSR companies (###) incorporated under Section 25 of the Companies Act, 1956 (Section 8 of the Companies Act, 2013), being limited by guarantee (not having share capital) and PSMRI (being a society) are engaged in Corporate Social Responsibility activities.
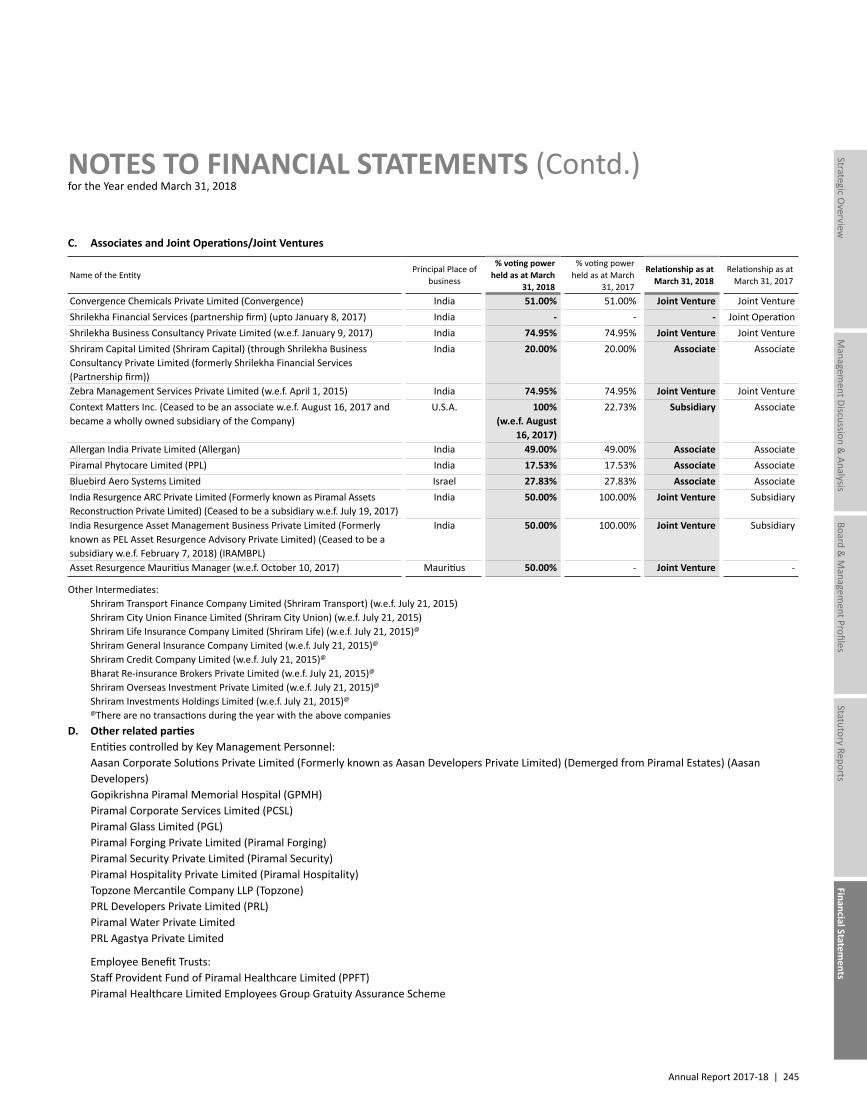
Annual Report 2017-18 | 245
Managem
ent Discussion & Analysis
Strategic Overview
Board &
Managem
ent ProfilesStatutory Reports
Financial Statements
NOTES TO FINANCIAL STATEMENTS (Contd.)for the Year ended March 31, 2018
C. Associates and Joint Operations/Joint Ventures
Name of the EntityPrincipal Place of
business
% voting power held as at March
31, 2018
% voting power held as at March
31, 2017
Relationship as at March 31, 2018
Relationship as at March 31, 2017
Convergence Chemicals Private Limited (Convergence) India 51.00% 51.00% Joint Venture Joint Venture Shrilekha Financial Services (partnership firm) (upto January 8, 2017) India - - - Joint Operation Shrilekha Business Consultancy Private Limited (w.e.f. January 9, 2017) India 74.95% 74.95% Joint Venture Joint Venture Shriram Capital Limited (Shriram Capital) (through Shrilekha Business Consultancy Private Limited (formerly Shrilekha Financial Services (Partnership firm))
India 20.00% 20.00% Associate Associate
Zebra Management Services Private Limited (w.e.f. April 1, 2015) India 74.95% 74.95% Joint Venture Joint Venture Context Matters Inc. (Ceased to be an associate w.e.f. August 16, 2017 and became a wholly owned subsidiary of the Company)
U.S.A. 100%(w.e.f. August
16, 2017)
22.73% Subsidiary Associate
Allergan India Private Limited (Allergan) India 49.00% 49.00% Associate Associate Piramal Phytocare Limited (PPL) India 17.53% 17.53% Associate Associate Bluebird Aero Systems Limited Israel 27.83% 27.83% Associate Associate India Resurgence ARC Private Limited (Formerly known as Piramal Assets Reconstruction Private Limited) (Ceased to be a subsidiary w.e.f. July 19, 2017)
India 50.00% 100.00% Joint Venture Subsidiary
India Resurgence Asset Management Business Private Limited (Formerly known as PEL Asset Resurgence Advisory Private Limited) (Ceased to be a subsidiary w.e.f. February 7, 2018) (IRAMBPL)
India 50.00% 100.00% Joint Venture Subsidiary
Asset Resurgence Mauritius Manager (w.e.f. October 10, 2017) Mauritius 50.00% - Joint Venture -
Other Intermediates: Shriram Transport Finance Company Limited (Shriram Transport) (w.e.f. July 21, 2015) Shriram City Union Finance Limited (Shriram City Union) (w.e.f. July 21, 2015) Shriram Life Insurance Company Limited (Shriram Life) (w.e.f. July 21, 2015)@
Shriram General Insurance Company Limited (w.e.f. July 21, 2015)@
Shriram Credit Company Limited (w.e.f. July 21, 2015)@
Bharat Re-insurance Brokers Private Limited (w.e.f. July 21, 2015)@
Shriram Overseas Investment Private Limited (w.e.f. July 21, 2015)@
Shriram Investments Holdings Limited (w.e.f. July 21, 2015)@
@There are no transactions during the year with the above companiesD. Other related parties Entities controlled by Key Management Personnel: Aasan Corporate Solutions Private Limited (Formerly known as Aasan Developers Private Limited) (Demerged from Piramal Estates) (Aasan
Developers) Gopikrishna Piramal Memorial Hospital (GPMH) Piramal Corporate Services Limited (PCSL) Piramal Glass Limited (PGL) Piramal Forging Private Limited (Piramal Forging) Piramal Security Private Limited (Piramal Security) Piramal Hospitality Private Limited (Piramal Hospitality) Topzone Mercantile Company LLP (Topzone) PRL Developers Private Limited (PRL) Piramal Water Private Limited PRL Agastya Private Limited
Employee Benefit Trusts: Staff Provident Fund of Piramal Healthcare Limited (PPFT) Piramal Healthcare Limited Employees Group Gratuity Assurance Scheme
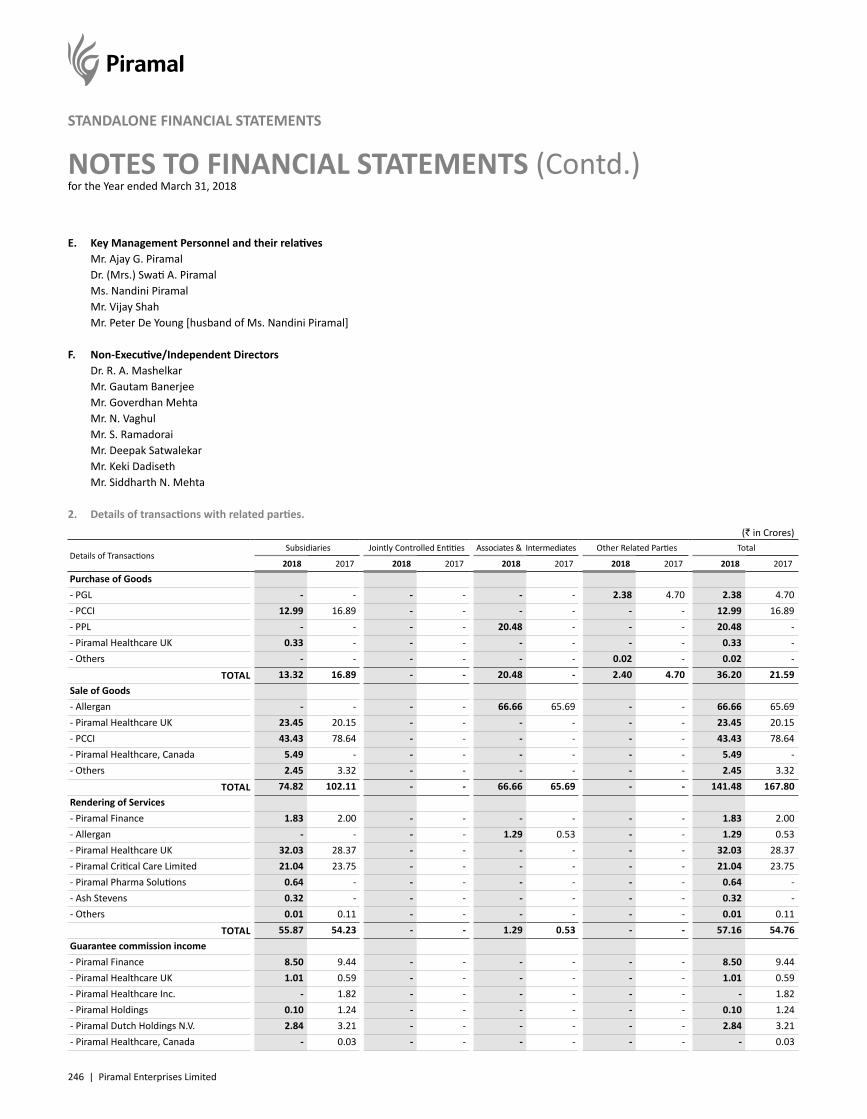
246 | Piramal Enterprises Limited
NOTES TO FINANCIAL STATEMENTS (Contd.)for the Year ended March 31, 2018
STANDALONE FINANCIAL STATEMENTS
E. Key Management Personnel and their relatives Mr. Ajay G. Piramal Dr. (Mrs.) Swati A. Piramal Ms. Nandini Piramal Mr. Vijay Shah Mr. Peter De Young [husband of Ms. Nandini Piramal]
F. Non-Executive/Independent Directors Dr. R. A. Mashelkar Mr. Gautam Banerjee Mr. Goverdhan Mehta Mr. N. Vaghul Mr. S. Ramadorai Mr. Deepak Satwalekar Mr. Keki Dadiseth Mr. Siddharth N. Mehta
2. Details of transactions with related parties.(` in Crores)
Details of Transactions Subsidiaries Jointly Controlled Entities Associates & Intermediates Other Related Parties Total
2018 2017 2018 2017 2018 2017 2018 2017 2018 2017
Purchase of Goods- PGL - - - - - - 2.38 4.70 2.38 4.70- PCCI 12.99 16.89 - - - - - - 12.99 16.89- PPL - - - - 20.48 - - - 20.48 -- Piramal Healthcare UK 0.33 - - - - - - - 0.33 -- Others - - - - - - 0.02 - 0.02 -
TOTAL 13.32 16.89 - - 20.48 - 2.40 4.70 36.20 21.59Sale of Goods- Allergan - - - - 66.66 65.69 - - 66.66 65.69- Piramal Healthcare UK 23.45 20.15 - - - - - - 23.45 20.15- PCCI 43.43 78.64 - - - - - - 43.43 78.64- Piramal Healthcare, Canada 5.49 - - - - - - - 5.49 -- Others 2.45 3.32 - - - - - - 2.45 3.32
TOTAL 74.82 102.11 - - 66.66 65.69 - - 141.48 167.80Rendering of Services- Piramal Finance 1.83 2.00 - - - - - - 1.83 2.00- Allergan - - - - 1.29 0.53 - - 1.29 0.53- Piramal Healthcare UK 32.03 28.37 - - - - - - 32.03 28.37- Piramal Critical Care Limited 21.04 23.75 - - - - - - 21.04 23.75- Piramal Pharma Solutions 0.64 - - - - - - - 0.64 -- Ash Stevens 0.32 - - - - - - - 0.32 -- Others 0.01 0.11 - - - - - - 0.01 0.11
TOTAL 55.87 54.23 - - 1.29 0.53 - - 57.16 54.76Guarantee commission income- Piramal Finance 8.50 9.44 - - - - - - 8.50 9.44- Piramal Healthcare UK 1.01 0.59 - - - - - - 1.01 0.59- Piramal Healthcare Inc. - 1.82 - - - - - - - 1.82- Piramal Holdings 0.10 1.24 - - - - - - 0.10 1.24- Piramal Dutch Holdings N.V. 2.84 3.21 - - - - - - 2.84 3.21- Piramal Healthcare, Canada - 0.03 - - - - - - - 0.03
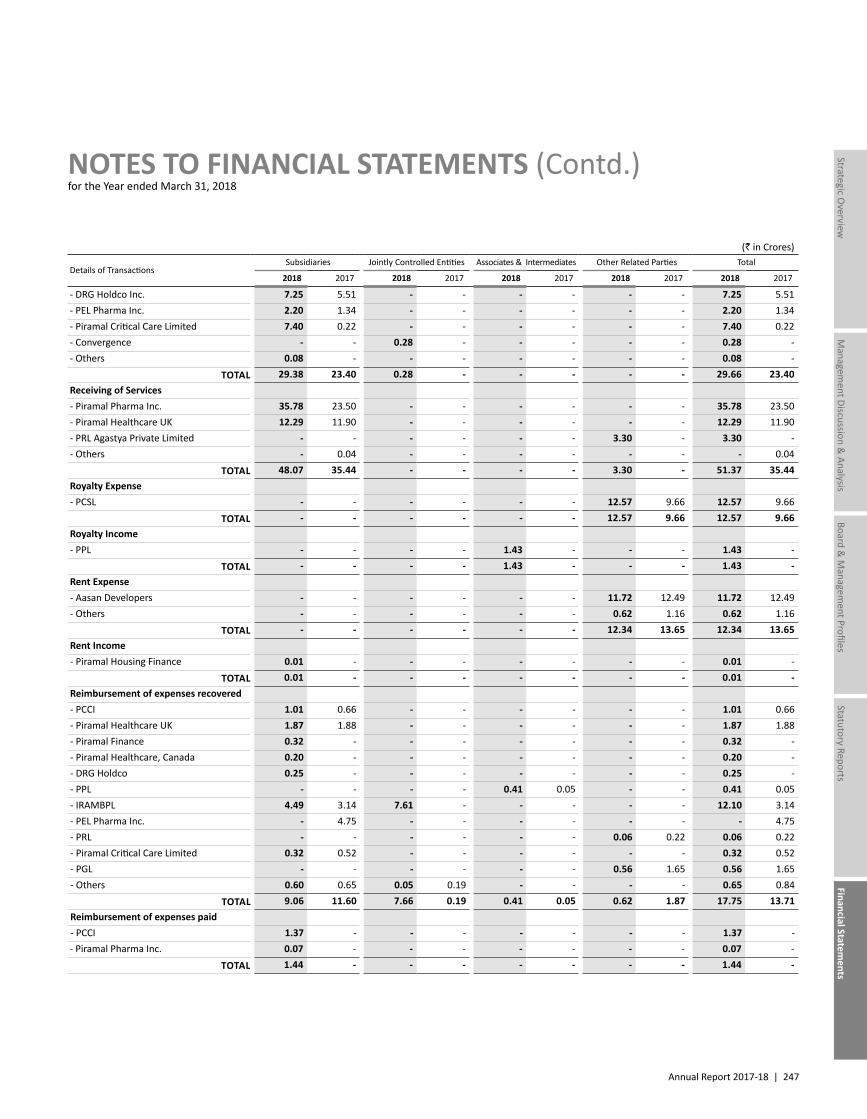
Annual Report 2017-18 | 247
Managem
ent Discussion & Analysis
Strategic Overview
Board &
Managem
ent ProfilesStatutory Reports
Financial Statements
NOTES TO FINANCIAL STATEMENTS (Contd.)for the Year ended March 31, 2018
(` in Crores)
Details of Transactions Subsidiaries Jointly Controlled Entities Associates & Intermediates Other Related Parties Total
2018 2017 2018 2017 2018 2017 2018 2017 2018 2017
- DRG Holdco Inc. 7.25 5.51 - - - - - - 7.25 5.51- PEL Pharma Inc. 2.20 1.34 - - - - - - 2.20 1.34- Piramal Critical Care Limited 7.40 0.22 - - - - - - 7.40 0.22- Convergence - - 0.28 - - - - - 0.28 -- Others 0.08 - - - - - - - 0.08 -
TOTAL 29.38 23.40 0.28 - - - - - 29.66 23.40Receiving of Services- Piramal Pharma Inc. 35.78 23.50 - - - - - - 35.78 23.50- Piramal Healthcare UK 12.29 11.90 - - - - - - 12.29 11.90- PRL Agastya Private Limited - - - - - - 3.30 - 3.30 -- Others - 0.04 - - - - - - - 0.04
TOTAL 48.07 35.44 - - - - 3.30 - 51.37 35.44Royalty Expense- PCSL - - - - - - 12.57 9.66 12.57 9.66
TOTAL - - - - - - 12.57 9.66 12.57 9.66Royalty Income- PPL - - - - 1.43 - - - 1.43 -
TOTAL - - - - 1.43 - - - 1.43 -Rent Expense- Aasan Developers - - - - - - 11.72 12.49 11.72 12.49- Others - - - - - - 0.62 1.16 0.62 1.16
TOTAL - - - - - - 12.34 13.65 12.34 13.65Rent Income- Piramal Housing Finance 0.01 - - - - - - - 0.01 -
TOTAL 0.01 - - - - - - - 0.01 -Reimbursement of expenses recovered- PCCI 1.01 0.66 - - - - - - 1.01 0.66- Piramal Healthcare UK 1.87 1.88 - - - - - - 1.87 1.88- Piramal Finance 0.32 - - - - - - - 0.32 -- Piramal Healthcare, Canada 0.20 - - - - - - - 0.20 -- DRG Holdco 0.25 - - - - - - - 0.25 -- PPL - - - - 0.41 0.05 - - 0.41 0.05- IRAMBPL 4.49 3.14 7.61 - - - - - 12.10 3.14- PEL Pharma Inc. - 4.75 - - - - - - - 4.75- PRL - - - - - - 0.06 0.22 0.06 0.22- Piramal Critical Care Limited 0.32 0.52 - - - - - - 0.32 0.52- PGL - - - - - - 0.56 1.65 0.56 1.65- Others 0.60 0.65 0.05 0.19 - - - - 0.65 0.84
TOTAL 9.06 11.60 7.66 0.19 0.41 0.05 0.62 1.87 17.75 13.71Reimbursement of expenses paid- PCCI 1.37 - - - - - - - 1.37 -- Piramal Pharma Inc. 0.07 - - - - - - - 0.07 -
TOTAL 1.44 - - - - - - - 1.44 -
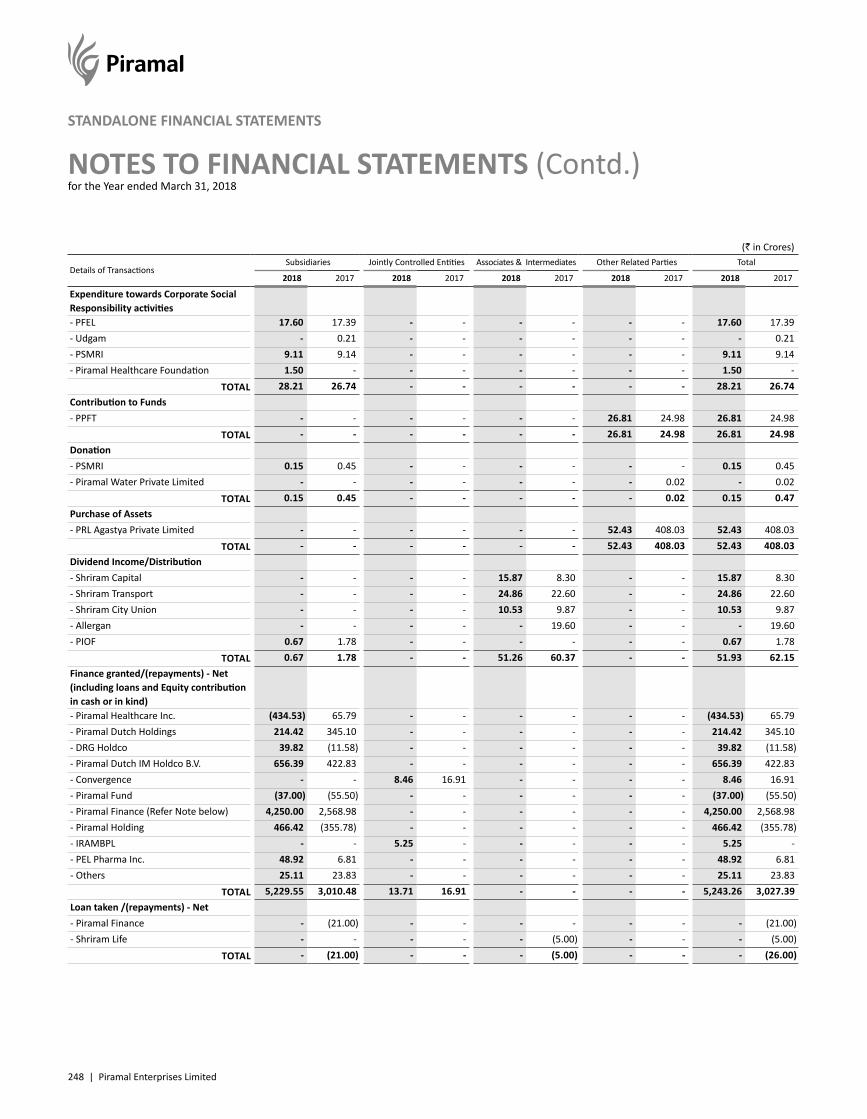
248 | Piramal Enterprises Limited
NOTES TO FINANCIAL STATEMENTS (Contd.)for the Year ended March 31, 2018
STANDALONE FINANCIAL STATEMENTS
(` in Crores)
Details of Transactions Subsidiaries Jointly Controlled Entities Associates & Intermediates Other Related Parties Total
2018 2017 2018 2017 2018 2017 2018 2017 2018 2017
Expenditure towards Corporate Social Responsibility activities- PFEL 17.60 17.39 - - - - - - 17.60 17.39- Udgam - 0.21 - - - - - - - 0.21- PSMRI 9.11 9.14 - - - - - - 9.11 9.14- Piramal Healthcare Foundation 1.50 - - - - - - - 1.50 -
TOTAL 28.21 26.74 - - - - - - 28.21 26.74Contribution to Funds- PPFT - - - - - - 26.81 24.98 26.81 24.98
TOTAL - - - - - - 26.81 24.98 26.81 24.98Donation- PSMRI 0.15 0.45 - - - - - - 0.15 0.45- Piramal Water Private Limited - - - - - - - 0.02 - 0.02
TOTAL 0.15 0.45 - - - - - 0.02 0.15 0.47Purchase of Assets- PRL Agastya Private Limited - - - - - - 52.43 408.03 52.43 408.03
TOTAL - - - - - - 52.43 408.03 52.43 408.03Dividend Income/Distribution- Shriram Capital - - - - 15.87 8.30 - - 15.87 8.30- Shriram Transport - - - - 24.86 22.60 - - 24.86 22.60- Shriram City Union - - - - 10.53 9.87 - - 10.53 9.87- Allergan - - - - - 19.60 - - - 19.60- PIOF 0.67 1.78 - - - - - - 0.67 1.78
TOTAL 0.67 1.78 - - 51.26 60.37 - - 51.93 62.15Finance granted/(repayments) - Net (including loans and Equity contribution in cash or in kind)- Piramal Healthcare Inc. (434.53) 65.79 - - - - - - (434.53) 65.79- Piramal Dutch Holdings 214.42 345.10 - - - - - - 214.42 345.10- DRG Holdco 39.82 (11.58) - - - - - - 39.82 (11.58)- Piramal Dutch IM Holdco B.V. 656.39 422.83 - - - - - - 656.39 422.83- Convergence - - 8.46 16.91 - - - - 8.46 16.91- Piramal Fund (37.00) (55.50) - - - - - - (37.00) (55.50)- Piramal Finance (Refer Note below) 4,250.00 2,568.98 - - - - - - 4,250.00 2,568.98- Piramal Holding 466.42 (355.78) - - - - - - 466.42 (355.78)- IRAMBPL - - 5.25 - - - - - 5.25 -- PEL Pharma Inc. 48.92 6.81 - - - - - - 48.92 6.81- Others 25.11 23.83 - - - - - - 25.11 23.83
TOTAL 5,229.55 3,010.48 13.71 16.91 - - - - 5,243.26 3,027.39Loan taken /(repayments) - Net- Piramal Finance - (21.00) - - - - - - - (21.00)- Shriram Life - - - - - (5.00) - - - (5.00)
TOTAL - (21.00) - - - (5.00) - - - (26.00)
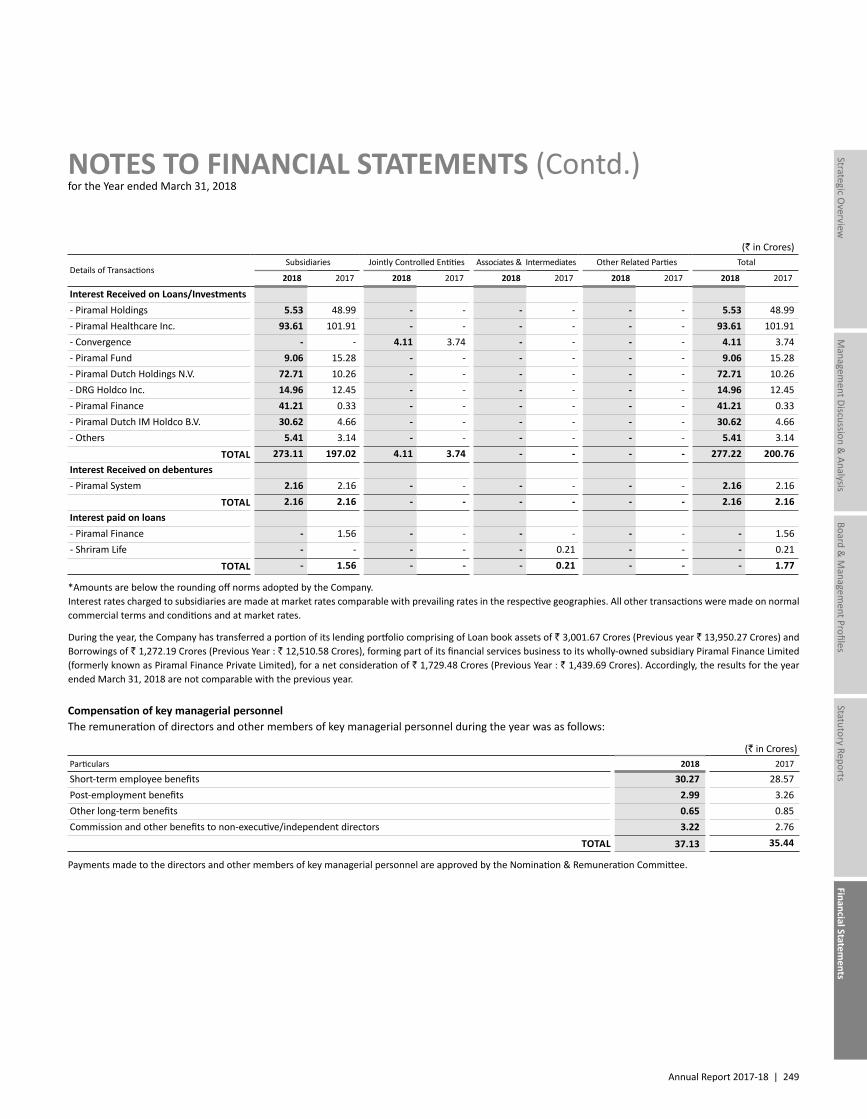
Annual Report 2017-18 | 249
Managem
ent Discussion & Analysis
Strategic Overview
Board &
Managem
ent ProfilesStatutory Reports
Financial Statements
NOTES TO FINANCIAL STATEMENTS (Contd.)for the Year ended March 31, 2018
(` in Crores)
Details of Transactions Subsidiaries Jointly Controlled Entities Associates & Intermediates Other Related Parties Total
2018 2017 2018 2017 2018 2017 2018 2017 2018 2017
Interest Received on Loans/Investments- Piramal Holdings 5.53 48.99 - - - - - - 5.53 48.99- Piramal Healthcare Inc. 93.61 101.91 - - - - - - 93.61 101.91- Convergence - - 4.11 3.74 - - - - 4.11 3.74- Piramal Fund 9.06 15.28 - - - - - - 9.06 15.28- Piramal Dutch Holdings N.V. 72.71 10.26 - - - - - - 72.71 10.26- DRG Holdco Inc. 14.96 12.45 - - - - - - 14.96 12.45- Piramal Finance 41.21 0.33 - - - - - - 41.21 0.33- Piramal Dutch IM Holdco B.V. 30.62 4.66 - - - - - - 30.62 4.66- Others 5.41 3.14 - - - - - - 5.41 3.14
TOTAL 273.11 197.02 4.11 3.74 - - - - 277.22 200.76Interest Received on debentures- Piramal System 2.16 2.16 - - - - - - 2.16 2.16
TOTAL 2.16 2.16 - - - - - - 2.16 2.16Interest paid on loans- Piramal Finance - 1.56 - - - - - - - 1.56- Shriram Life - - - - - 0.21 - - - 0.21
TOTAL - 1.56 - - - 0.21 - - - 1.77
*Amounts are below the rounding off norms adopted by the Company.Interest rates charged to subsidiaries are made at market rates comparable with prevailing rates in the respective geographies. All other transactions were made on normal commercial terms and conditions and at market rates.
During the year, the Company has transferred a portion of its lending portfolio comprising of Loan book assets of ` 3,001.67 Crores (Previous year ` 13,950.27 Crores) and Borrowings of ` 1,272.19 Crores (Previous Year : ` 12,510.58 Crores), forming part of its financial services business to its wholly-owned subsidiary Piramal Finance Limited (formerly known as Piramal Finance Private Limited), for a net consideration of ` 1,729.48 Crores (Previous Year : ` 1,439.69 Crores). Accordingly, the results for the year ended March 31, 2018 are not comparable with the previous year.
Compensation of key managerial personnelThe remuneration of directors and other members of key managerial personnel during the year was as follows:
(` in Crores)Particulars 2018 2017
Short-term employee benefits 30.27 28.57Post-employment benefits 2.99 3.26Other long-term benefits 0.65 0.85Commission and other benefits to non-executive/independent directors 3.22 2.76
TOTAL 37.13 35.44
Payments made to the directors and other members of key managerial personnel are approved by the Nomination & Remuneration Committee.
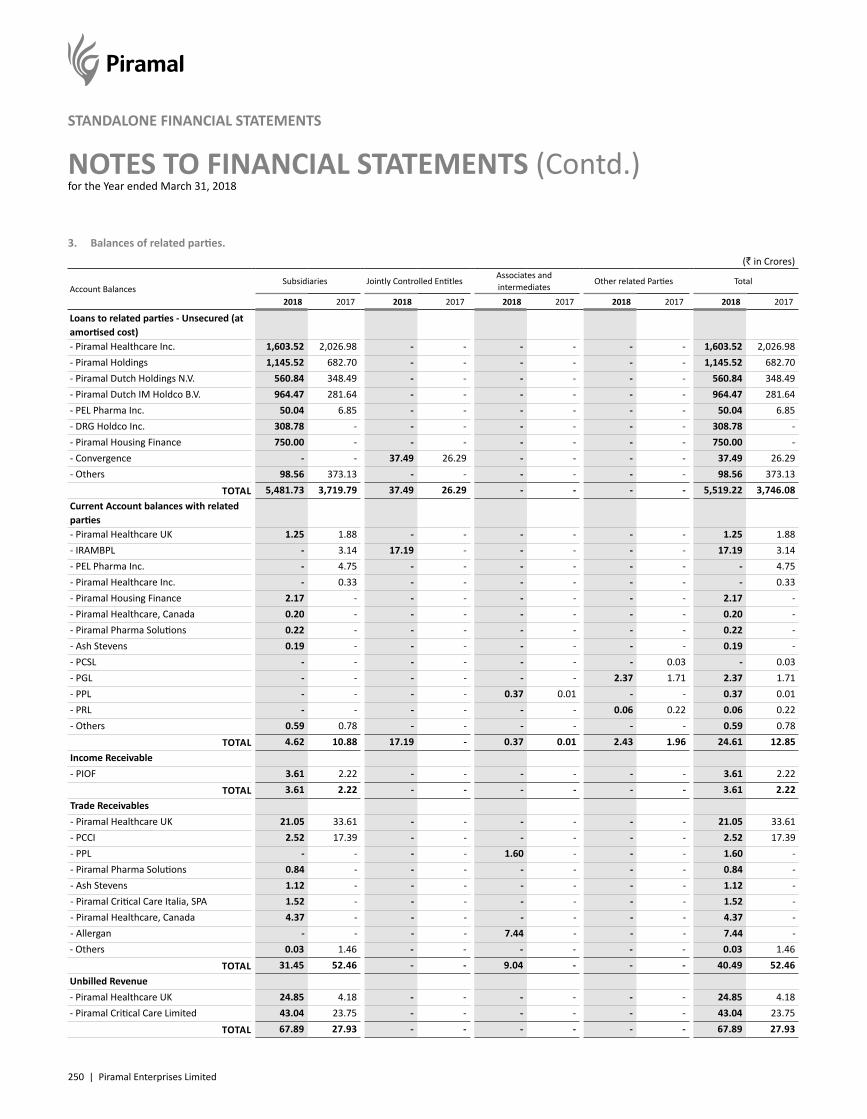
250 | Piramal Enterprises Limited
NOTES TO FINANCIAL STATEMENTS (Contd.)for the Year ended March 31, 2018
STANDALONE FINANCIAL STATEMENTS
3. Balances of related parties.(` in Crores)
Account BalancesSubsidiaries Jointly Controlled Entitles
Associates and intermediates
Other related Parties Total
2018 2017 2018 2017 2018 2017 2018 2017 2018 2017
Loans to related parties - Unsecured (at amortised cost)- Piramal Healthcare Inc. 1,603.52 2,026.98 - - - - - - 1,603.52 2,026.98- Piramal Holdings 1,145.52 682.70 - - - - - - 1,145.52 682.70- Piramal Dutch Holdings N.V. 560.84 348.49 - - - - - - 560.84 348.49- Piramal Dutch IM Holdco B.V. 964.47 281.64 - - - - - - 964.47 281.64- PEL Pharma Inc. 50.04 6.85 - - - - - - 50.04 6.85- DRG Holdco Inc. 308.78 - - - - - - - 308.78 -- Piramal Housing Finance 750.00 - - - - - - - 750.00 -- Convergence - - 37.49 26.29 - - - - 37.49 26.29- Others 98.56 373.13 - - - - - - 98.56 373.13
TOTAL 5,481.73 3,719.79 37.49 26.29 - - - - 5,519.22 3,746.08Current Account balances with related parties- Piramal Healthcare UK 1.25 1.88 - - - - - - 1.25 1.88- IRAMBPL - 3.14 17.19 - - - - - 17.19 3.14- PEL Pharma Inc. - 4.75 - - - - - - - 4.75- Piramal Healthcare Inc. - 0.33 - - - - - - - 0.33- Piramal Housing Finance 2.17 - - - - - - - 2.17 -- Piramal Healthcare, Canada 0.20 - - - - - - - 0.20 -- Piramal Pharma Solutions 0.22 - - - - - - - 0.22 -- Ash Stevens 0.19 - - - - - - - 0.19 -- PCSL - - - - - - - 0.03 - 0.03- PGL - - - - - - 2.37 1.71 2.37 1.71- PPL - - - - 0.37 0.01 - - 0.37 0.01- PRL - - - - - - 0.06 0.22 0.06 0.22- Others 0.59 0.78 - - - - - - 0.59 0.78
TOTAL 4.62 10.88 17.19 - 0.37 0.01 2.43 1.96 24.61 12.85Income Receivable- PIOF 3.61 2.22 - - - - - - 3.61 2.22
TOTAL 3.61 2.22 - - - - - - 3.61 2.22Trade Receivables- Piramal Healthcare UK 21.05 33.61 - - - - - - 21.05 33.61- PCCI 2.52 17.39 - - - - - - 2.52 17.39- PPL - - - - 1.60 - - - 1.60 -- Piramal Pharma Solutions 0.84 - - - - - - - 0.84 -- Ash Stevens 1.12 - - - - - - - 1.12 -- Piramal Critical Care Italia, SPA 1.52 - - - - - - - 1.52 -- Piramal Healthcare, Canada 4.37 - - - - - - - 4.37 -- Allergan - - - - 7.44 - - - 7.44 -- Others 0.03 1.46 - - - - - - 0.03 1.46
TOTAL 31.45 52.46 - - 9.04 - - - 40.49 52.46Unbilled Revenue- Piramal Healthcare UK 24.85 4.18 - - - - - - 24.85 4.18- Piramal Critical Care Limited 43.04 23.75 - - - - - - 43.04 23.75
TOTAL 67.89 27.93 - - - - - - 67.89 27.93
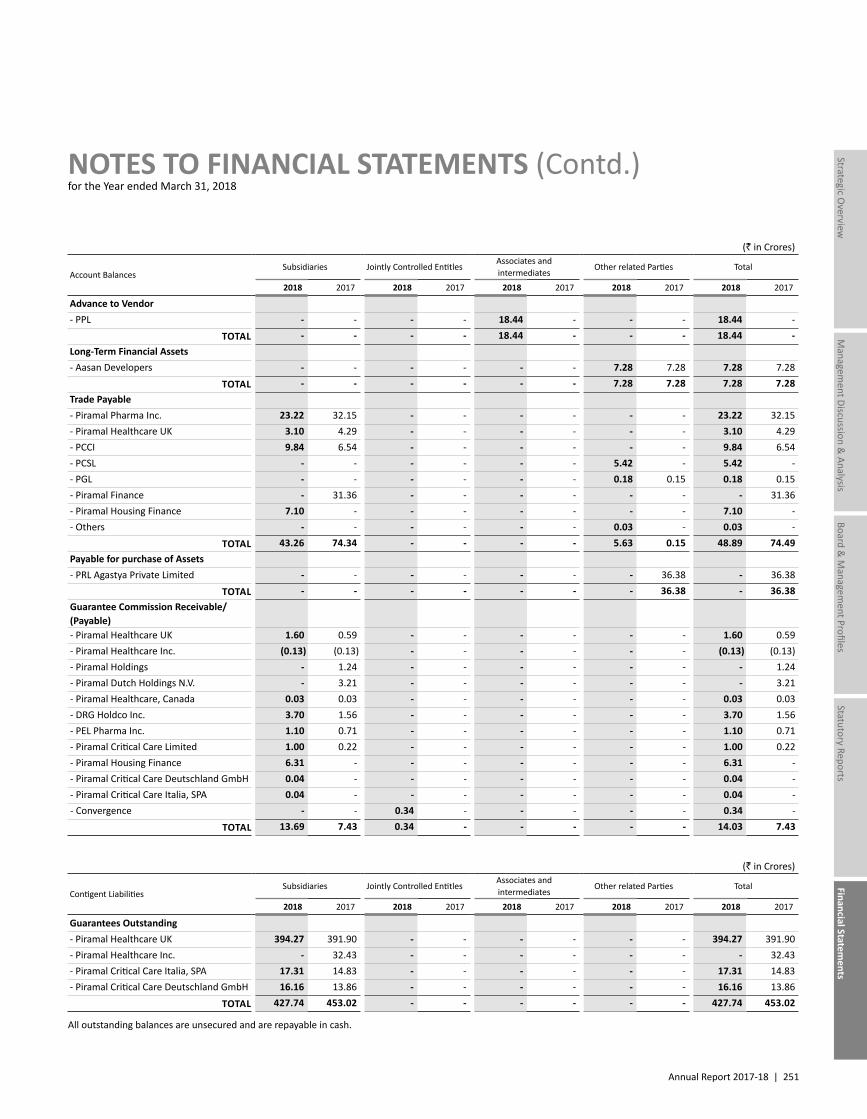
Annual Report 2017-18 | 251
Managem
ent Discussion & Analysis
Strategic Overview
Board &
Managem
ent ProfilesStatutory Reports
Financial Statements
NOTES TO FINANCIAL STATEMENTS (Contd.)for the Year ended March 31, 2018
(` in Crores)
Account BalancesSubsidiaries Jointly Controlled Entitles
Associates and intermediates
Other related Parties Total
2018 2017 2018 2017 2018 2017 2018 2017 2018 2017
Advance to Vendor- PPL - - - - 18.44 - - - 18.44 -
TOTAL - - - - 18.44 - - - 18.44 -Long-Term Financial Assets- Aasan Developers - - - - - - 7.28 7.28 7.28 7.28
TOTAL - - - - - - 7.28 7.28 7.28 7.28Trade Payable- Piramal Pharma Inc. 23.22 32.15 - - - - - - 23.22 32.15- Piramal Healthcare UK 3.10 4.29 - - - - - - 3.10 4.29- PCCI 9.84 6.54 - - - - - - 9.84 6.54- PCSL - - - - - - 5.42 - 5.42 -- PGL - - - - - - 0.18 0.15 0.18 0.15- Piramal Finance - 31.36 - - - - - - - 31.36- Piramal Housing Finance 7.10 - - - - - - - 7.10 -- Others - - - - - - 0.03 - 0.03 -
TOTAL 43.26 74.34 - - - - 5.63 0.15 48.89 74.49Payable for purchase of Assets- PRL Agastya Private Limited - - - - - - - 36.38 - 36.38
TOTAL - - - - - - - 36.38 - 36.38Guarantee Commission Receivable/(Payable)- Piramal Healthcare UK 1.60 0.59 - - - - - - 1.60 0.59- Piramal Healthcare Inc. (0.13) (0.13) - - - - - - (0.13) (0.13)- Piramal Holdings - 1.24 - - - - - - - 1.24- Piramal Dutch Holdings N.V. - 3.21 - - - - - - - 3.21- Piramal Healthcare, Canada 0.03 0.03 - - - - - - 0.03 0.03- DRG Holdco Inc. 3.70 1.56 - - - - - - 3.70 1.56- PEL Pharma Inc. 1.10 0.71 - - - - - - 1.10 0.71- Piramal Critical Care Limited 1.00 0.22 - - - - - - 1.00 0.22- Piramal Housing Finance 6.31 - - - - - - - 6.31 -- Piramal Critical Care Deutschland GmbH 0.04 - - - - - - - 0.04 -- Piramal Critical Care Italia, SPA 0.04 - - - - - - - 0.04 -- Convergence - - 0.34 - - - - - 0.34 -
TOTAL 13.69 7.43 0.34 - - - - - 14.03 7.43
(` in Crores)
Contigent LiabilitiesSubsidiaries Jointly Controlled Entitles
Associates and intermediates
Other related Parties Total
2018 2017 2018 2017 2018 2017 2018 2017 2018 2017
Guarantees Outstanding- Piramal Healthcare UK 394.27 391.90 - - - - - - 394.27 391.90- Piramal Healthcare Inc. - 32.43 - - - - - - - 32.43- Piramal Critical Care Italia, SPA 17.31 14.83 - - - - - - 17.31 14.83- Piramal Critical Care Deutschland GmbH 16.16 13.86 - - - - - - 16.16 13.86
TOTAL 427.74 453.02 - - - - - - 427.74 453.02
All outstanding balances are unsecured and are repayable in cash.
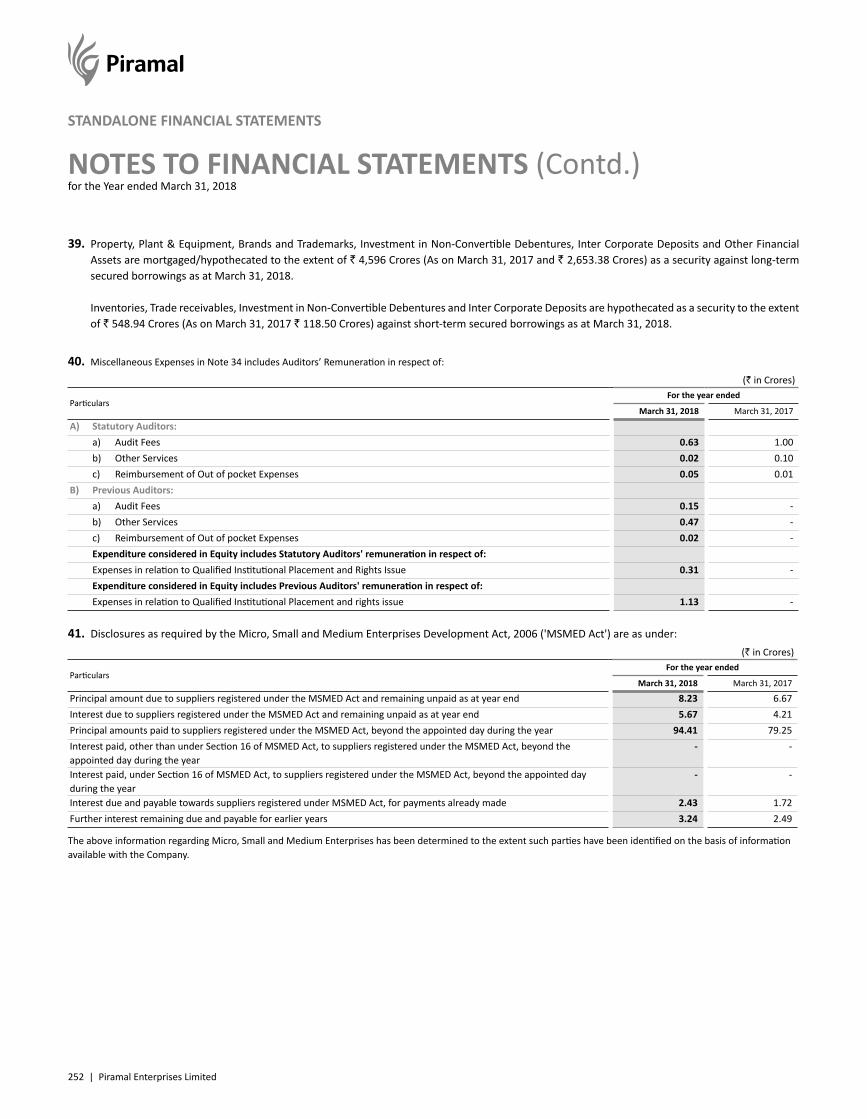
252 | Piramal Enterprises Limited
NOTES TO FINANCIAL STATEMENTS (Contd.)for the Year ended March 31, 2018
STANDALONE FINANCIAL STATEMENTS
39. Property, Plant & Equipment, Brands and Trademarks, Investment in Non-Convertible Debentures, Inter Corporate Deposits and Other Financial Assets are mortgaged/hypothecated to the extent of ` 4,596 Crores (As on March 31, 2017 and ` 2,653.38 Crores) as a security against long-term secured borrowings as at March 31, 2018.
Inventories, Trade receivables, Investment in Non-Convertible Debentures and Inter Corporate Deposits are hypothecated as a security to the extent of ` 548.94 Crores (As on March 31, 2017 ` 118.50 Crores) against short-term secured borrowings as at March 31, 2018.
40. Miscellaneous Expenses in Note 34 includes Auditors’ Remuneration in respect of:
(` in Crores)
ParticularsFor the year ended
March 31, 2018 March 31, 2017
A) Statutory Auditors: a) Audit Fees 0.63 1.00 b) Other Services 0.02 0.10 c) Reimbursement of Out of pocket Expenses 0.05 0.01B) Previous Auditors: a) Audit Fees 0.15 - b) Other Services 0.47 - c) Reimbursement of Out of pocket Expenses 0.02 - Expenditure considered in Equity includes Statutory Auditors' remuneration in respect of: Expenses in relation to Qualified Institutional Placement and Rights Issue 0.31 - Expenditure considered in Equity includes Previous Auditors' remuneration in respect of: Expenses in relation to Qualified Institutional Placement and rights issue 1.13 -
41. Disclosures as required by the Micro, Small and Medium Enterprises Development Act, 2006 ('MSMED Act') are as under:(` in Crores)
ParticularsFor the year ended
March 31, 2018 March 31, 2017
Principal amount due to suppliers registered under the MSMED Act and remaining unpaid as at year end 8.23 6.67Interest due to suppliers registered under the MSMED Act and remaining unpaid as at year end 5.67 4.21Principal amounts paid to suppliers registered under the MSMED Act, beyond the appointed day during the year 94.41 79.25Interest paid, other than under Section 16 of MSMED Act, to suppliers registered under the MSMED Act, beyond the appointed day during the year
- -
Interest paid, under Section 16 of MSMED Act, to suppliers registered under the MSMED Act, beyond the appointed day during the year
- -
Interest due and payable towards suppliers registered under MSMED Act, for payments already made 2.43 1.72Further interest remaining due and payable for earlier years 3.24 2.49
The above information regarding Micro, Small and Medium Enterprises has been determined to the extent such parties have been identified on the basis of information available with the Company.
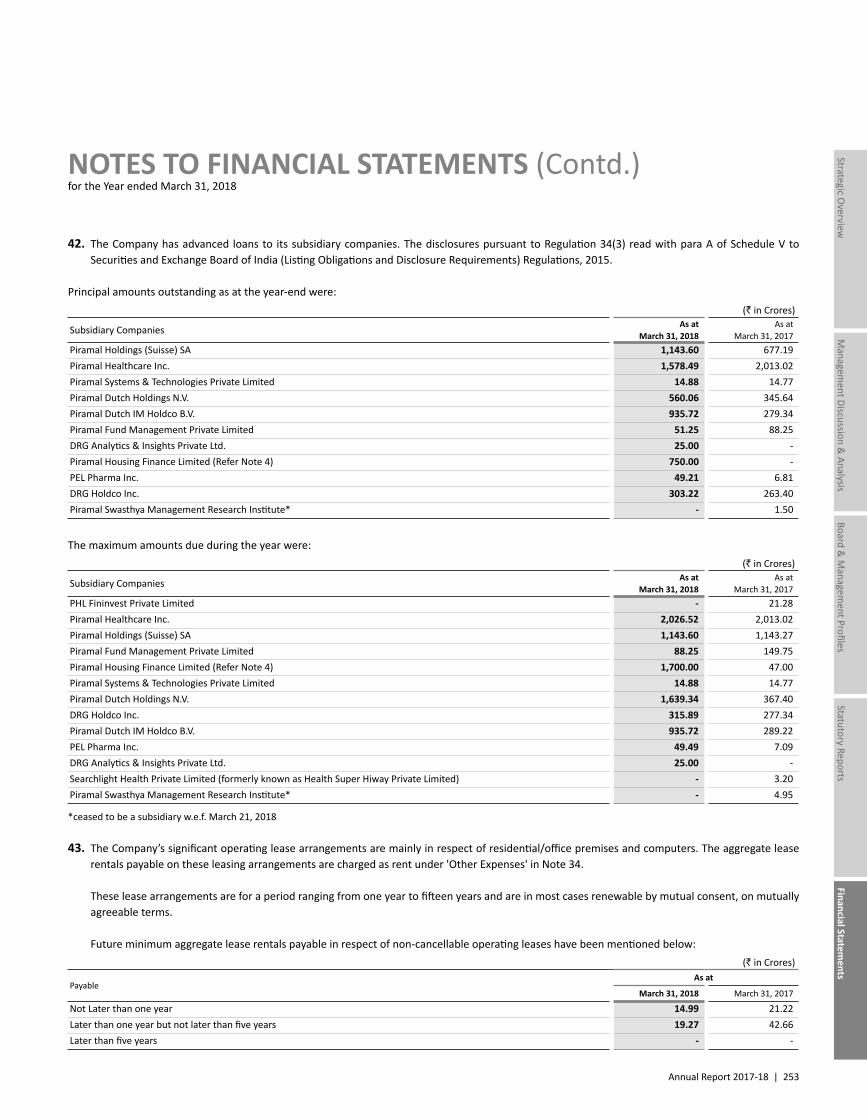
Annual Report 2017-18 | 253
Managem
ent Discussion & Analysis
Strategic Overview
Board &
Managem
ent ProfilesStatutory Reports
Financial Statements
NOTES TO FINANCIAL STATEMENTS (Contd.)for the Year ended March 31, 2018
42. The Company has advanced loans to its subsidiary companies. The disclosures pursuant to Regulation 34(3) read with para A of Schedule V to Securities and Exchange Board of India (Listing Obligations and Disclosure Requirements) Regulations, 2015.
Principal amounts outstanding as at the year-end were:(` in Crores)
Subsidiary Companies As at March 31, 2018
As at March 31, 2017
Piramal Holdings (Suisse) SA 1,143.60 677.19Piramal Healthcare Inc. 1,578.49 2,013.02Piramal Systems & Technologies Private Limited 14.88 14.77Piramal Dutch Holdings N.V. 560.06 345.64Piramal Dutch IM Holdco B.V. 935.72 279.34Piramal Fund Management Private Limited 51.25 88.25DRG Analytics & Insights Private Ltd. 25.00 -Piramal Housing Finance Limited (Refer Note 4) 750.00 -PEL Pharma Inc. 49.21 6.81DRG Holdco Inc. 303.22 263.40Piramal Swasthya Management Research Institute* - 1.50
The maximum amounts due during the year were:(` in Crores)
Subsidiary Companies As at March 31, 2018
As at March 31, 2017
PHL Fininvest Private Limited - 21.28Piramal Healthcare Inc. 2,026.52 2,013.02Piramal Holdings (Suisse) SA 1,143.60 1,143.27Piramal Fund Management Private Limited 88.25 149.75Piramal Housing Finance Limited (Refer Note 4) 1,700.00 47.00Piramal Systems & Technologies Private Limited 14.88 14.77Piramal Dutch Holdings N.V. 1,639.34 367.40DRG Holdco Inc. 315.89 277.34Piramal Dutch IM Holdco B.V. 935.72 289.22PEL Pharma Inc. 49.49 7.09DRG Analytics & Insights Private Ltd. 25.00 -Searchlight Health Private Limited (formerly known as Health Super Hiway Private Limited) - 3.20Piramal Swasthya Management Research Institute* - 4.95
*ceased to be a subsidiary w.e.f. March 21, 2018
43. The Company’s significant operating lease arrangements are mainly in respect of residential/office premises and computers. The aggregate lease rentals payable on these leasing arrangements are charged as rent under 'Other Expenses' in Note 34.
These lease arrangements are for a period ranging from one year to fifteen years and are in most cases renewable by mutual consent, on mutually agreeable terms.
Future minimum aggregate lease rentals payable in respect of non-cancellable operating leases have been mentioned below:(` in Crores)
PayableAs at
March 31, 2018 March 31, 2017
Not Later than one year 14.99 21.22Later than one year but not later than five years 19.27 42.66Later than five years - -
254 | Piramal Enterprises Limited
NOTES TO FINANCIAL STATEMENTS (Contd.)for the Year ended March 31, 2018
STANDALONE FINANCIAL STATEMENTS
44. Earnings Per Share (EPS) – EPS is calculated by dividing the profit attributable to the equity shareholders by the weighted average number of equity shares outstanding during the year. The earnings and weighted average numbers of equity shares used in calculating basic and diluted earnings per equity share are as follows:
ParticularsFor the year ended
March 31, 2018 March 31, 2017
1. Profit after tax (` in Crores) 518.47 776.782. Weighted Average Number of Equity Shares for calculating Basic EPS (nos.) 181,766,747 173,281,5353. Weighted Average Potential Equity Shares in respect of right issue shares reserved for CCD holders and right shares held in
abeyance (nos.)54,227 -
4. Total Weighted Average Number of Equity Shares for calculating Diluted EPS (nos.) (2+3) 181,820,974 173,281,535
5. Earnings Per Share - Basic attributable to Equity Shareholders (`) (1/2) 28.52 44.83
6. Earnings Per Share - Diluted attributable to Equity Shareholders (`) (1/4) 28.52 44.83
7. Face value per share (`) 2.00 2.00
Basic and diluted earnings per share for year ended March 31, 2017 have been retrospectively adjusted for effect of Rights Issue. Further, considering the effect of conversion of CCDs into equity shares, the Earnings Per Share (Basic and Diluted) for the year ended March 31, 2018 is not comparable with that of the earlier period.
45. CAPITAL RISK MANAGEMENT The Company manages its capital to ensure that it will be able to continue as going concern while maximising the return to stakeholders through
the optimisation of the debt and equity balance. The capital structure of the Company consists of net debt (borrowings as detailed in notes 18, 21 and 22 offset by cash and bank balances) and total equity of the Company.
The Company determines the amount of capital required on the basis of annual as well as long-term operating plans and other strategic investment plans. The funding requirements are met through non-convertible debt securities or other long-term/short-term borrowings. The Company monitors the capital structure on the basis of total debt to equity ratio and maturity profile of the overall debt portfolio of the Company.
The capital components of the Company are as given below:(` in Crores)
As at March 31, 2018
As at March 31, 2017
Equity 21,336.85 14,422.60
Total Equity 21,336.85 14,422.60Borrowings – Non–Current 4,011.56 2,739.52Borrowings – Current 7,979.17 5,020.12Current Maturities of Long-Term Debt 2,609.76 2,495.78
Total Debt 14,600.49 10,255.42Cash & Cash equivalents (521.94) (95.10)
Net Debt 14,078.55 10,160.32
Debt/Equity Ratio 0.66 0.70
The terms of the Secured and unsecured loans and borrowings contain certain financial covenants primarily requiring the Company to maintain certain financial ratios like Total Debt to Total Net Worth, Interest Coverage Ratio, Fixed Asset Cover ratio, Minimum net worth conditions, etc. The Company is broadly in compliance with the said covenants and the banks have generally waived/condoned such covenants.
46. RISK MANAGEMENT The Company’s activities expose it to market risk, liquidity risk and credit risk.
The Company has an independent and dedicated Enterprise Risk Management (ERM) system to identify, manage and mitigate business risks.
Board has approved the Asset Liability Management Policy and the formation of Asset Liability Management Committee (ALCO). The ALCO includes the Company’s senior management and an external industry expert. It defines the strategy for managing liquidity and interest rate risks in the business.
Annual Report 2017-18 | 255
Managem
ent Discussion & Analysis
Strategic Overview
Board &
Managem
ent ProfilesStatutory Reports
Financial Statements
NOTES TO FINANCIAL STATEMENTS (Contd.)for the Year ended March 31, 2018
This note explains the sources of risk which the entity is exposed to and how the entity manages the risk and the impact of hedge accounting in the financial statements
Risk Exposure arising from Management
Liquidity risk Borrowings and other liabilities ALCO deliberates on the static liquidity gap statement, future asset growth plans, tenor of assets, market liquidity and pricing of various sources of funds. It decides on the optimal funding mix taking into consideration the asset strategy and a focus on diversifying sources of funds.
Market risk – Interest rate Long-term borrowings at variable rates ALCO reviews the interest rate gap statement and the mix of floating and fixed rate assets and liabilities. The Risk Management Group has also initiated a scenario analysis to assess the short-term impact of interest rates on net interest income (NII).
Market risk – Securities price risks Equity Investment The Company continue to effectively evaluate various risks involved in underlying assets, before and after making any such strategic investments.
Market risk – Foreign exchange Transactions denominated in foreign currency The centralised treasury function aggregates the foreign exchange exposure and takes measures to hedge the exposure based on prevalent macroeconomic conditions.
Credit risk Cash and cash equivalents, trade receivables, derivative financial instruments, financial assets measured at amortised cost.
Diversification of bank deposits, credit limits and letters of credit.Each investment in financial services is assessed by the investment team as well as independent risk team on the risk-return framework. The combined analysis of these teams is presented to the Investment Committee for investment decision. The risk is being partly mitigated by setting up a concentration risk framework, which incentivises business units to diversify portfolio across counterparties, sectors and geographies.
a) Liquidity Risk Management Liquidity Risk refers to insufficiency of funds to meet the financial obligations. Liquidity Risk Management implies maintenance of sufficient cash and
marketable securities and the availability of funding through an adequate amount of committed credit lines to meet obligations when due.
The Company has formulated an Asset Liability Management Policy. The Asset Liability Management Committee (ALCO) is responsible for the management of the Company's short-term, medium-term and long-term funding and liquidity management requirements. The Company manages liquidity risk by maintaining adequate reserves, banking facilities and by continuously monitoring forecast and actual cash flows, and by assessing the maturity profiles of financial assets and liabilities. The Company has access to undrawn borrowing facilities at the end of each reporting period, as detailed below:
The Company has the following undrawn credit lines available as at the end of the reporting period:(` in Crores)
Particulars March 31, 2018 March 31, 2017
– Expiring within one year 6,814.50 8,198.56 – Expiring beyond one year - -
6,814.50 8,198.56
Note: This includes Non-Convertible Debentures and Commercial Papers where only credit rating has been obtained and which can be issued, if required, within a short period of time. Further, the facilities related to Commercial Papers are generally rolled over.
The following tables detail the Company's remaining contractual maturity for its non-derivative financial liabilities with agreed repayment periods. The tables have been drawn up based on the undiscounted cash flows of financial liabilities based on the earliest date on which the Company can be required to pay. The tables include both interest and principal cash flows. To the extent that interest flows are floating rate, the rate applicable as of reporting period ends respectively has been considered.
(` in Crores)
Maturities of Financial LiabilitiesMarch 31, 2018
Upto 1 year 1 to 3 years 3 to 5 years 5 years & above
Borrowings 10,916.95 4,319.91 18.75 55.60Trade Payables 543.57 - - -Other Financial Liabilities 115.71 3.54 - -
11,576.23 4,323.45 18.75 55.60
256 | Piramal Enterprises Limited
NOTES TO FINANCIAL STATEMENTS (Contd.)for the Year ended March 31, 2018
STANDALONE FINANCIAL STATEMENTS
(` in Crores)
Maturities of Financial LiabilitiesMarch 31, 2017
Upto 1 year 1 to 3 years 3 to 5 years 5 years & above
Borrowings 7,731.98 3,013.44 19.70 59.49Trade Payables 533.36 - - -Other Financial Liabilities 124.96 4.90 0.74 -
8,390.30 3,018.34 20.44 59.49
The following table details the Company's expected maturity for its non-derivative financial assets. The table has been drawn up based on the undiscounted contractual maturities of the financial assets including interest that will be earned on those assets. The inclusion of information on non-derivative financial assets is necessary in order to understand the Company's liquidity risk management as the liquidity is managed on a net asset and liability basis. Hence, maturities of the relevant assets have been considered below.
(` in Crores)
Maturities of Financial AssetsMarch 31, 2018
Upto 1 year 1 to 3 years 3 to 5 years 5 years & above
Investments & Loans 3,823.52 6,789.12 2,297.71 4,000.63Loans to related parties 341.12 1,225.29 475.29 5,378.66Trade Receivables 520.07 - - -
4,684.71 8,014.41 2,773.00 9,379.29
(` in Crores)
Maturities of Financial AssetsMarch 31, 2017
Upto 1 year 1 to 3 years 3 to 5 years 5 years & above
Investments & Loans 3,125.58 4,099.23 1,021.50 850.13Loans to related parties 327.08 385.78 385.78 4,164.07Trade Receivables 513.07 - - -
3,965.73 4,485.01 1,407.28 5,014.20
The balances disclosed in the table above are the contractual undiscounted cash flows. Balances due within 12 months equal their carrying balances as the impact of discounting is not significant.
In case of loan commitments, the expected maturities are as under:(` in Crores)
ParticularsMarch 31, 2018 March 31, 2017
Upto 1 year Upto 1 year
Commitment to invest in non-convertible debentures - 106.45Commitment to invest in Inter Company Deposits 5.00 -
TOTAL 5.00 106.45
(` in Crores)
ParticularsMarch 31, 2018 March 31, 2017
1 to 3 years 1 to 3 years
Commitment to invest in AIF 75.00 75.00TOTAL 75.00 75.00
Annual Report 2017-18 | 257
Managem
ent Discussion & Analysis
Strategic Overview
Board &
Managem
ent ProfilesStatutory Reports
Financial Statements
NOTES TO FINANCIAL STATEMENTS (Contd.)for the Year ended March 31, 2018
b) Interest Rate Risk Management The Company is exposed to interest rate risk as it has assets and liabilities based on floating interest rates as well. The Company has an approved
Asset and Liability Management Policy which empowers the Asset and Liability Management Committee (ALCO) to assess the interest rate risk run by it and provide appropriate guidelines to the Treasury to manage the risk. The ALCO reviews the interest rate risk on periodic basis and decides on the asset profile and the appropriate funding mix. The ALCO reviews the interest rate gap statement and the interest rate sensitivity analysis.
The exposure of the Company's borrowings to the interest rate risk at the end of the reporting period is mentioned below:
(` in Crores)Particulars March 31, 2018 March 31, 2017
Variable rate borrowings 2,275.28 1,071.43Fixed rate borrowings 12,168.90 9,007.80
14,444.18 10,079.23
The sensitivity analyses below have been determined based on the exposure to interest rates for assets and liabilities at the end of the reporting period. For floating rate assets and liabilities, the analysis is prepared assuming the amount of the liabilities/assets outstanding at the end of the reporting period was outstanding for the whole year and the rates are reset as per the applicable reset dates. The basis risk between various benchmarks used to reset the floating rate assets and liabilities has been considered to be insignificant.
If interest rates related to borrowings had been 100 basis points higher/lower and all other variables were held constant, the Company's
- Profit before tax for the year ended/Other Equity (pre-tax) as on March 31, 2018 would decrease/increase by ` 22.75 Crores (Previous year ` 10.71 Crores) respectively. This is attributable to the Company’s exposure to borrowings at floating interest rates.
If interest rates related to loans given/debentures invested had been 100 basis points higher/lower and all other variables were held constant, the Company's
- Profit before tax for the year ended/Other Equity (pre-tax) as on March 31, 2018 would increase/decrease by ` 84.50 Crores (Previous year ` 47.84 Crores). This is attributable to the Company’s exposure to lendings at floating interest rates.
c) Other price risks The Company is exposed to equity price risks arising from equity investments and classified in the Balance Sheet at fair value through Other
Comprehensive Income.
Equity price sensitivity analysis: The table below summarises the impact of increases/decreases (pre-tax) on the Company's Equity and OCI for the period. Analysis is based on the
assumption that equity index had increased/decreased by 5% with all the other variables held constant, and these investments moved in the line with the index.
(` in Crores)
ParticularsImpact on OCI
March 31, 2018 March 31, 2017
NSE Nifty 100, Increase by 5% 232.80 199.46NSE Nifty 100, Decrease by 5% (232.80) (199.46)
The Company has designated the following securities as FVTOCI Investments:Shriram City Union Finance LimitedShriram Transport Finance Company Limited
The Company chose this presentation alternative because the investment were made for strategic purposes rather than with a view to make profit on subsequent sale, and there are no plans to dispose of these investments.
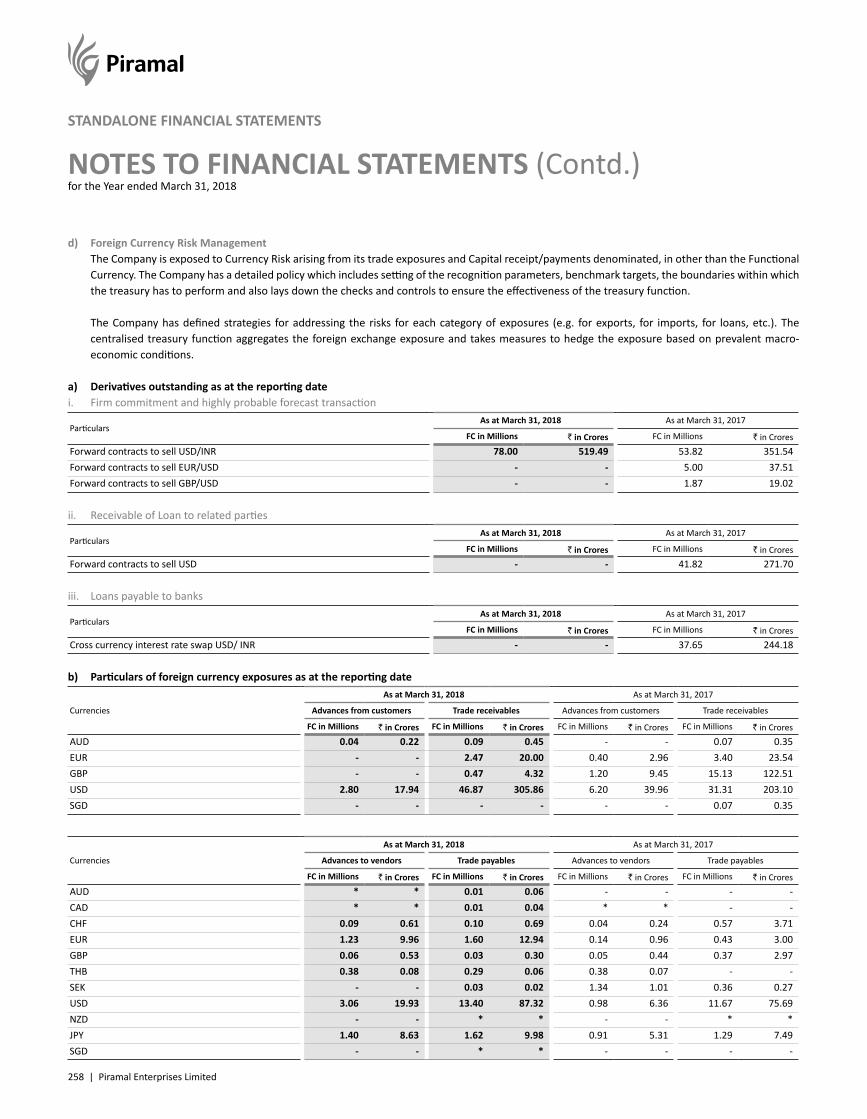
258 | Piramal Enterprises Limited
NOTES TO FINANCIAL STATEMENTS (Contd.)for the Year ended March 31, 2018
STANDALONE FINANCIAL STATEMENTS
d) Foreign Currency Risk Management The Company is exposed to Currency Risk arising from its trade exposures and Capital receipt/payments denominated, in other than the Functional
Currency. The Company has a detailed policy which includes setting of the recognition parameters, benchmark targets, the boundaries within which the treasury has to perform and also lays down the checks and controls to ensure the effectiveness of the treasury function.
The Company has defined strategies for addressing the risks for each category of exposures (e.g. for exports, for imports, for loans, etc.). The centralised treasury function aggregates the foreign exchange exposure and takes measures to hedge the exposure based on prevalent macro-economic conditions.
a) Derivatives outstanding as at the reporting datei. Firm commitment and highly probable forecast transaction
ParticularsAs at March 31, 2018 As at March 31, 2017
FC in Millions ` in Crores FC in Millions ` in CroresForward contracts to sell USD/INR 78.00 519.49 53.82 351.54Forward contracts to sell EUR/USD - - 5.00 37.51Forward contracts to sell GBP/USD - - 1.87 19.02
ii. Receivable of Loan to related parties
ParticularsAs at March 31, 2018 As at March 31, 2017
FC in Millions ` in Crores FC in Millions ` in CroresForward contracts to sell USD - - 41.82 271.70
iii. Loans payable to banks
ParticularsAs at March 31, 2018 As at March 31, 2017
FC in Millions ` in Crores FC in Millions ` in CroresCross currency interest rate swap USD/ INR - - 37.65 244.18
b) Particulars of foreign currency exposures as at the reporting date
Currencies
As at March 31, 2018 As at March 31, 2017
Advances from customers Trade receivables Advances from customers Trade receivables
FC in Millions ` in Crores FC in Millions ` in Crores FC in Millions ` in Crores FC in Millions ` in CroresAUD 0.04 0.22 0.09 0.45 - - 0.07 0.35EUR - - 2.47 20.00 0.40 2.96 3.40 23.54GBP - - 0.47 4.32 1.20 9.45 15.13 122.51USD 2.80 17.94 46.87 305.86 6.20 39.96 31.31 203.10SGD - - - - - - 0.07 0.35
Currencies
As at March 31, 2018 As at March 31, 2017
Advances to vendors Trade payables Advances to vendors Trade payables
FC in Millions ` in Crores FC in Millions ` in Crores FC in Millions ` in Crores FC in Millions ` in CroresAUD * * 0.01 0.06 - - - -CAD * * 0.01 0.04 * * - -CHF 0.09 0.61 0.10 0.69 0.04 0.24 0.57 3.71EUR 1.23 9.96 1.60 12.94 0.14 0.96 0.43 3.00GBP 0.06 0.53 0.03 0.30 0.05 0.44 0.37 2.97THB 0.38 0.08 0.29 0.06 0.38 0.07 - -SEK - - 0.03 0.02 1.34 1.01 0.36 0.27USD 3.06 19.93 13.40 87.32 0.98 6.36 11.67 75.69NZD - - * * - - * *JPY 1.40 8.63 1.62 9.98 0.91 5.31 1.29 7.49SGD - - * * - - - -
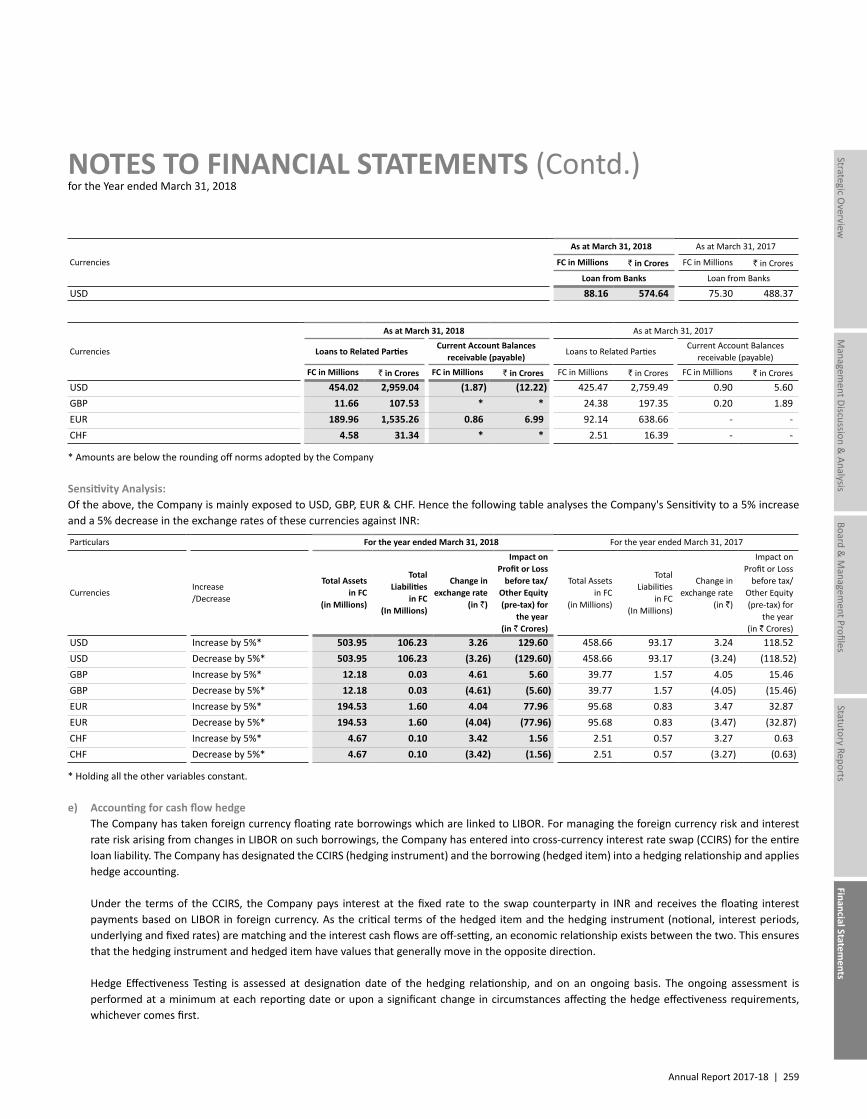
Annual Report 2017-18 | 259
Managem
ent Discussion & Analysis
Strategic Overview
Board &
Managem
ent ProfilesStatutory Reports
Financial Statements
NOTES TO FINANCIAL STATEMENTS (Contd.)for the Year ended March 31, 2018
Currencies
As at March 31, 2018 As at March 31, 2017
FC in Millions ` in Crores FC in Millions ` in Crores
Loan from Banks Loan from Banks
USD 88.16 574.64 75.30 488.37
Currencies
As at March 31, 2018 As at March 31, 2017
Loans to Related PartiesCurrent Account Balances
receivable (payable)Loans to Related Parties
Current Account Balances receivable (payable)
FC in Millions ` in Crores FC in Millions ` in Crores FC in Millions ` in Crores FC in Millions ` in CroresUSD 454.02 2,959.04 (1.87) (12.22) 425.47 2,759.49 0.90 5.60GBP 11.66 107.53 * * 24.38 197.35 0.20 1.89EUR 189.96 1,535.26 0.86 6.99 92.14 638.66 - -CHF 4.58 31.34 * * 2.51 16.39 - -
* Amounts are below the rounding off norms adopted by the Company
Sensitivity Analysis:Of the above, the Company is mainly exposed to USD, GBP, EUR & CHF. Hence the following table analyses the Company's Sensitivity to a 5% increase and a 5% decrease in the exchange rates of these currencies against INR:
Particulars For the year ended March 31, 2018 For the year ended March 31, 2017
CurrenciesIncrease/Decrease
Total Assets in FC
(in Millions)
Total Liabilities
in FC (In Millions)
Change in exchange rate
(in `)
Impact on Profit or Loss
before tax/Other Equity (pre-tax) for
the year(in ` Crores)
Total Assets in FC
(in Millions)
Total Liabilities
in FC (In Millions)
Change in exchange rate
(in `)
Impact on Profit or Loss
before tax/Other Equity (pre-tax) for
the year(in ` Crores)
USD Increase by 5%* 503.95 106.23 3.26 129.60 458.66 93.17 3.24 118.52USD Decrease by 5%* 503.95 106.23 (3.26) (129.60) 458.66 93.17 (3.24) (118.52)GBP Increase by 5%* 12.18 0.03 4.61 5.60 39.77 1.57 4.05 15.46GBP Decrease by 5%* 12.18 0.03 (4.61) (5.60) 39.77 1.57 (4.05) (15.46)EUR Increase by 5%* 194.53 1.60 4.04 77.96 95.68 0.83 3.47 32.87EUR Decrease by 5%* 194.53 1.60 (4.04) (77.96) 95.68 0.83 (3.47) (32.87)CHF Increase by 5%* 4.67 0.10 3.42 1.56 2.51 0.57 3.27 0.63CHF Decrease by 5%* 4.67 0.10 (3.42) (1.56) 2.51 0.57 (3.27) (0.63)
* Holding all the other variables constant.
e) Accounting for cash flow hedge The Company has taken foreign currency floating rate borrowings which are linked to LIBOR. For managing the foreign currency risk and interest
rate risk arising from changes in LIBOR on such borrowings, the Company has entered into cross-currency interest rate swap (CCIRS) for the entire loan liability. The Company has designated the CCIRS (hedging instrument) and the borrowing (hedged item) into a hedging relationship and applies hedge accounting.
Under the terms of the CCIRS, the Company pays interest at the fixed rate to the swap counterparty in INR and receives the floating interest payments based on LIBOR in foreign currency. As the critical terms of the hedged item and the hedging instrument (notional, interest periods, underlying and fixed rates) are matching and the interest cash flows are off-setting, an economic relationship exists between the two. This ensures that the hedging instrument and hedged item have values that generally move in the opposite direction.
Hedge Effectiveness Testing is assessed at designation date of the hedging relationship, and on an ongoing basis. The ongoing assessment is performed at a minimum at each reporting date or upon a significant change in circumstances affecting the hedge effectiveness requirements, whichever comes first.
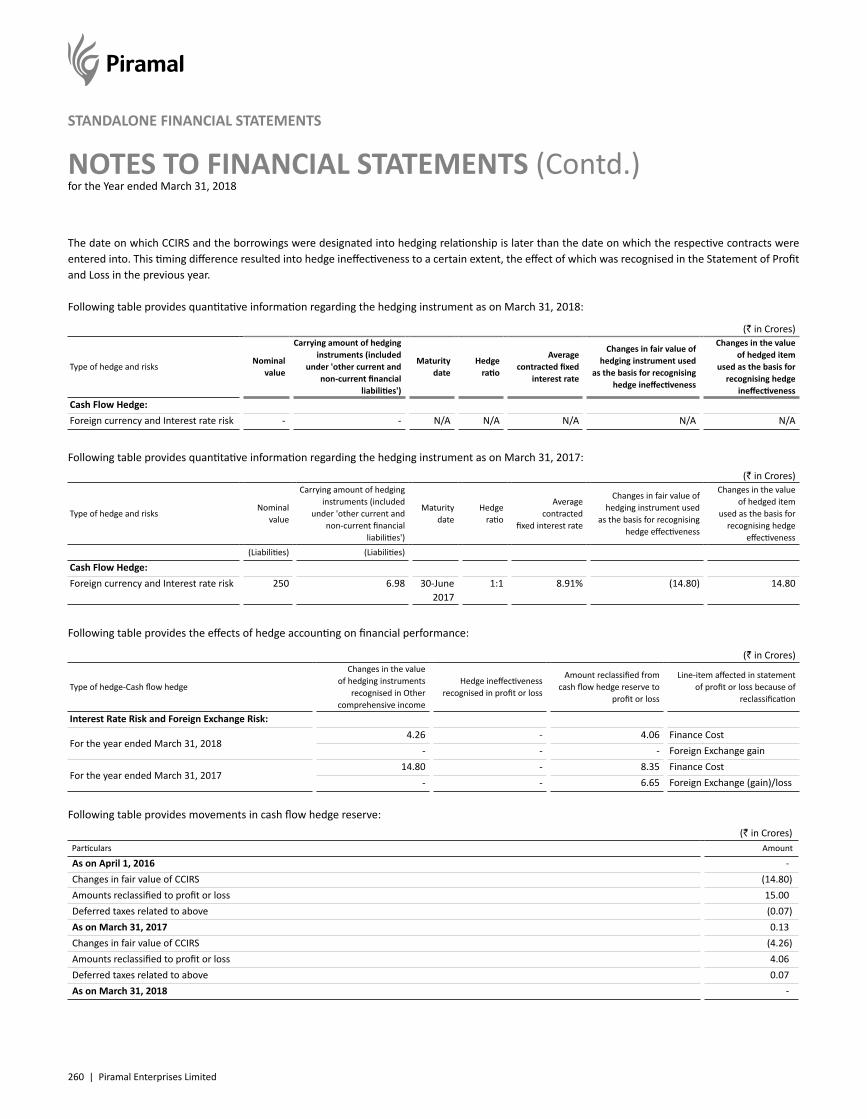
260 | Piramal Enterprises Limited
NOTES TO FINANCIAL STATEMENTS (Contd.)for the Year ended March 31, 2018
STANDALONE FINANCIAL STATEMENTS
The date on which CCIRS and the borrowings were designated into hedging relationship is later than the date on which the respective contracts were entered into. This timing difference resulted into hedge ineffectiveness to a certain extent, the effect of which was recognised in the Statement of Profit and Loss in the previous year.
Following table provides quantitative information regarding the hedging instrument as on March 31, 2018:
(` in Crores)
Type of hedge and risksNominal
value
Carrying amount of hedging instruments (included
under 'other current and non-current financial
liabilities')
Maturity date
Hedge ratio
Average contracted fixed
interest rate
Changes in fair value of hedging instrument used
as the basis for recognising hedge ineffectiveness
Changes in the value of hedged item
used as the basis for recognising hedge
ineffectivenessCash Flow Hedge:Foreign currency and Interest rate risk - - N/A N/A N/A N/A N/A
Following table provides quantitative information regarding the hedging instrument as on March 31, 2017: (` in Crores)
Type of hedge and risksNominal
value
Carrying amount of hedging instruments (included
under 'other current and non-current financial
liabilities')
Maturity date
Hedge ratio
Average contracted
fixed interest rate
Changes in fair value of hedging instrument used
as the basis for recognising hedge effectiveness
Changes in the value of hedged item
used as the basis for recognising hedge
effectiveness(Liabilities) (Liabilities)
Cash Flow Hedge:Foreign currency and Interest rate risk 250 6.98 30-June
20171:1 8.91% (14.80) 14.80
Following table provides the effects of hedge accounting on financial performance:
(` in Crores)
Type of hedge-Cash flow hedge
Changes in the value of hedging instruments
recognised in Other comprehensive income
Hedge ineffectiveness recognised in profit or loss
Amount reclassified from cash flow hedge reserve to
profit or loss
Line-item affected in statement of profit or loss because of
reclassification
Interest Rate Risk and Foreign Exchange Risk:
For the year ended March 31, 2018 4.26 - 4.06 Finance Cost
- - - Foreign Exchange gain
For the year ended March 31, 2017 14.80 - 8.35 Finance Cost
- - 6.65 Foreign Exchange (gain)/loss
Following table provides movements in cash flow hedge reserve: (` in Crores)
Particulars Amount
As on April 1, 2016 - Changes in fair value of CCIRS (14.80) Amounts reclassified to profit or loss 15.00 Deferred taxes related to above (0.07) As on March 31, 2017 0.13 Changes in fair value of CCIRS (4.26) Amounts reclassified to profit or loss 4.06 Deferred taxes related to above 0.07 As on March 31, 2018 -
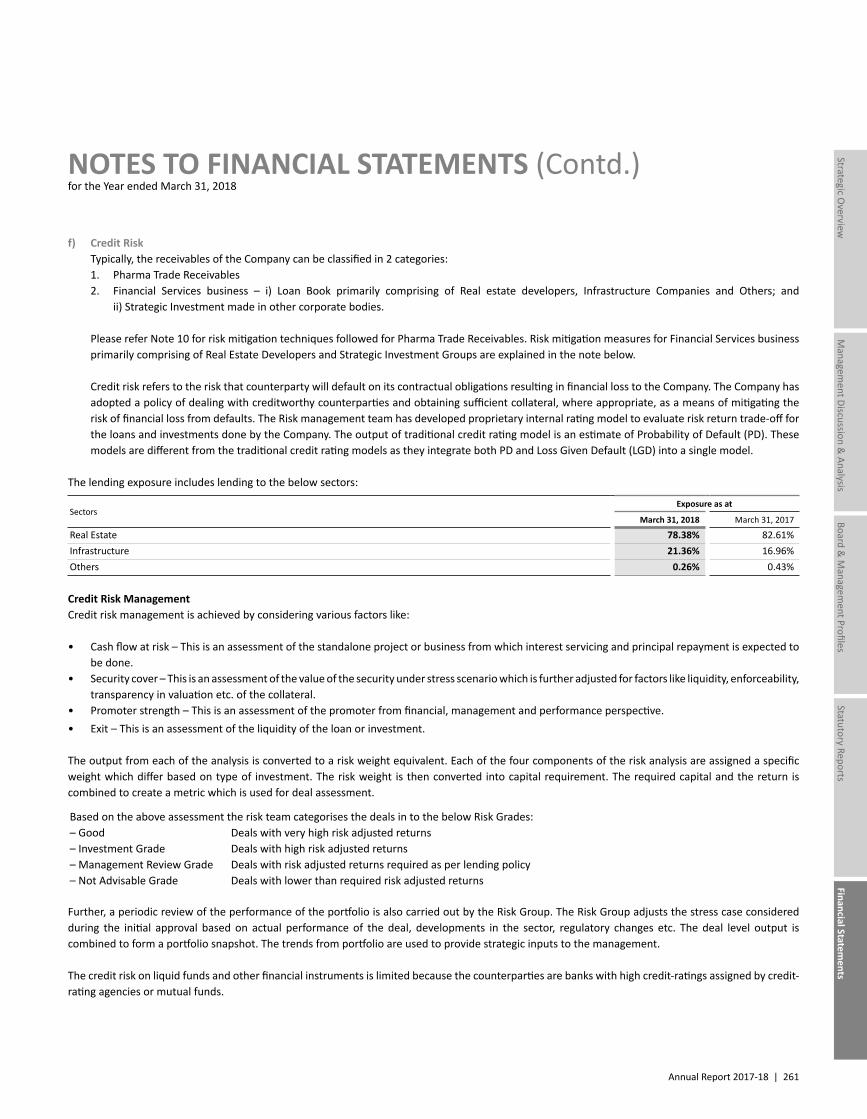
Annual Report 2017-18 | 261
Managem
ent Discussion & Analysis
Strategic Overview
Board &
Managem
ent ProfilesStatutory Reports
Financial Statements
NOTES TO FINANCIAL STATEMENTS (Contd.)for the Year ended March 31, 2018
f) Credit Risk Typically, the receivables of the Company can be classified in 2 categories: 1. Pharma Trade Receivables 2. Financial Services business – i) Loan Book primarily comprising of Real estate developers, Infrastructure Companies and Others; and
ii) Strategic Investment made in other corporate bodies.
Please refer Note 10 for risk mitigation techniques followed for Pharma Trade Receivables. Risk mitigation measures for Financial Services business primarily comprising of Real Estate Developers and Strategic Investment Groups are explained in the note below.
Credit risk refers to the risk that counterparty will default on its contractual obligations resulting in financial loss to the Company. The Company has adopted a policy of dealing with creditworthy counterparties and obtaining sufficient collateral, where appropriate, as a means of mitigating the risk of financial loss from defaults. The Risk management team has developed proprietary internal rating model to evaluate risk return trade-off for the loans and investments done by the Company. The output of traditional credit rating model is an estimate of Probability of Default (PD). These models are different from the traditional credit rating models as they integrate both PD and Loss Given Default (LGD) into a single model.
The lending exposure includes lending to the below sectors:
SectorsExposure as at
March 31, 2018 March 31, 2017
Real Estate 78.38% 82.61%Infrastructure 21.36% 16.96%Others 0.26% 0.43%
Credit Risk ManagementCredit risk management is achieved by considering various factors like:
• Cash flow at risk – This is an assessment of the standalone project or business from which interest servicing and principal repayment is expected to be done.
• Security cover – This is an assessment of the value of the security under stress scenario which is further adjusted for factors like liquidity, enforceability, transparency in valuation etc. of the collateral.
• Promoter strength – This is an assessment of the promoter from financial, management and performance perspective.• Exit – This is an assessment of the liquidity of the loan or investment.
The output from each of the analysis is converted to a risk weight equivalent. Each of the four components of the risk analysis are assigned a specific weight which differ based on type of investment. The risk weight is then converted into capital requirement. The required capital and the return is combined to create a metric which is used for deal assessment.
Based on the above assessment the risk team categorises the deals in to the below Risk Grades:– Good Deals with very high risk adjusted returns– Investment Grade Deals with high risk adjusted returns– Management Review Grade Deals with risk adjusted returns required as per lending policy– Not Advisable Grade Deals with lower than required risk adjusted returns
Further, a periodic review of the performance of the portfolio is also carried out by the Risk Group. The Risk Group adjusts the stress case considered during the initial approval based on actual performance of the deal, developments in the sector, regulatory changes etc. The deal level output is combined to form a portfolio snapshot. The trends from portfolio are used to provide strategic inputs to the management.
The credit risk on liquid funds and other financial instruments is limited because the counterparties are banks with high credit-ratings assigned by credit-rating agencies or mutual funds.
262 | Piramal Enterprises Limited
NOTES TO FINANCIAL STATEMENTS (Contd.)for the Year ended March 31, 2018
STANDALONE FINANCIAL STATEMENTS
Provision for Expected Credit LossThe Company considers the probability of default upon initial recognition of asset and whether there has been a significant increase in credit risk on an ongoing basis throughout each reporting period. To assess whether there is a significant increase in credit risk the Company compares the risk of a default occurring on the asset as at the reporting date with the risk of default as at the date of initial recognition. It considers available reasonable and supportive forwarding looking parameters, which are both qualitative and quantitative. These parameters have been detailed in Note no. vi of Significant Accounting Policies. Based on the result yielded by the above assessment the Financial assets are classified into (1) Standard (Performing) Asset, (2) Significant Credit Deteriorated (Under-Performing) Asset (3) Default (Non-Performing) Asset (Credit Impaired).Macroeconomic information (such as regulatory changes, market interest rate or growth rates) is incorporated as part of the internal rating model.In general, it is presumed that credit risk has significantly increased since initial recognition if the payments are more than 30 days past due.For the purpose of expected credit loss analysis the Company defines default as any asset with more than 90 days overdues. This is also as per the rebuttable presumption provided by the standard.
The Company provides for expected credit loss based on the following:Category – Description Basis for Recognition of Expected Credit LossStage 1 – Standard (Performing) Assets 12 month ECLStage 2 – Significant Credit Deteriorated Assets Life time ECLStage 3 – Default (Non-Performing) Assets (Credit Impaired) Life time ECL
The Company has developed a PD Matrix consisting of various parameters suitably tailored for various facilities like grade of the borrower, past overdue history, status from monthly asset monitoring report, deal IRR, deal tenure remaining etc.
Based on these parameters the Company has computed the PD. The Company has also built in model scorecards to determine the internal LGD. However, since there has been no default history to substantiate the internal LGD, the Company has made use of a combination of both internal as well as external LGD.
Expected Credit Loss as at end of the Reporting period:
As at March 31, 2018 (` in Crores)
Particulars Asset GroupGross Carrying
Amount (Exposure)Expected Credit Loss
Carrying Amount net of impairment
provision
Very High quality liquid assets/Related party loansReceivable from Related Parties 5,556.00 - 5,556.00Other Financial Assets & Loans 999.61 - 999.61
Assets for which credit risk has not significantly increased from initial recognition
Investments at amortised cost 6,200.06 78.78 6,121.28Loans at amortised cost 2,306.04 32.69 2,273.35
Assets for which credit risk has increased significantly and assets which are credit impaired
Investments at amortised cost 268.09 10.07 258.02Loans at amortised cost 32.67 32.67 -
TOTAL 15,362.47 154.21 15,208.26
As at March 31, 2017 (` in Crores)
Particulars Asset GroupGross Carrying
Amount (Exposure)Expected Credit Loss
Carrying Amount net of impairment
provision
Very High quality liquid assets/Related party loansReceivable from Related Parties 3,764.63 - 3,764.63Other Financial Assets & Loans 1016.95 - 1,016.95
Assets for which credit risk has not significantly increased from initial recognition
Investments at amortised cost 5,306.34 93.99 5,212.35Loans at amortised cost 40.00 0.73 39.27
Assets for which credit risk has increased significantly and assets which are credit impaired
Loans at amortised cost 33.67 18.32 15.35
TOTAL 10,161.59 113.04 10,048.55
Annual Report 2017-18 | 263
Managem
ent Discussion & Analysis
Strategic Overview
Board &
Managem
ent ProfilesStatutory Reports
Financial Statements
NOTES TO FINANCIAL STATEMENTS (Contd.)for the Year ended March 31, 2018
i) Reconciliation of Loss AllowanceFor the year ended March 31, 2018 (` in Crores)
Investments and Loans Loss allowance
measured at 12 month expected losses
Loss allowance measured at life-time expected losses Financial assets for which credit
risk has increased significantly and not credit-impaired
Financial assets which are credit-impaired
Balance at the beginning of the year 94.72 - 18.32Transferred to 12-month ECL - - -Transferred to Lifetime ECL not credit impaired (5.75) 5.75 -Transferred to Lifetime ECL credit impaired – collective provision - - -Charge to Statement of Profit and Loss On Account of Rate Change (18.37) 4.32 14.35 On Account of Disbursements 162.32 - - On Account of Repayments/Transfers* (121.45) - -
Balance at the end of the year 111.47 10.07 32.67
For the year ended March 31, 2017 (` in Crores)
Investments and Loans Loss allowance
measured at 12 month expected losses
Loss allowance measured at life-time expected losses Financial assets for which credit
risk has increased significantly and not credit-impaired
Financial assets which are credit-impaired
Balance at the beginning of the year 264.05 4.02 32.99Transferred to 12-month ECL - - -Transferred to Lifetime ECL not credit impaired - - -Transferred to Lifetime ECL credit impaired - collective provision - - -Charge to Statement of Profit and Loss On Account of Rate Change (51.67) - (1.09) On Account of Disbursements 153.82 - - On Account of Repayments/Transfers * (271.48) (4.02) (13.58)
Balance at the end of the year 94.72 - 18.32
* The reduction in provision is on account of repayments and transfer of portfolio during the year (Refer Note 38(2)).
ii) Movement in Expected Credit Loss on undrawn loan commitments:(` in Crores)
ParticularsExpected Credit Loss on Loan Commitments
as at March 31,2018 2017
Balances as at the beginning of the year 2.01 37.37Additions 0.08 2.01Amount used/reversed (2.01) (37.37)Balances as at the end of the year 0.08 2.01Classified as Non-current - -Classified as Current (Refer Note 24) 0.08 2.01
TOTAL 0.08 2.01
264 | Piramal Enterprises Limited
NOTES TO FINANCIAL STATEMENTS (Contd.)for the Year ended March 31, 2018
STANDALONE FINANCIAL STATEMENTS
iii) The amounts of Financial Assets outstanding in the Balance Sheet along with the undrawn loan commitments (Refer Note 46(a) ) as at the end of the reporting period represent the maximum exposure to credit risk.
Description of Collateral held as security and other credit enhancements The Company generally ensures a security cover of 100-200% of the proposed facility amount. The Company periodically monitors the quality as
well as the value of the security to meet the prescribed limits. The collateral held by the Company varies on case to case basis and includes:
i) First/Subservient charge on the Land and/or Building of the project or other projects ii) First/Subservient charge on the fixed and current assets of the borrower iii) Hypothecation over receivables from funded project or other projects of the borrower iv) Pledge on Shares of the borrower or their related parties v) Guarantees of Promoters/Promoter Undertakings vi) Post dated/Undated cheques vii) Pledge on investment in shares made by borrower entity
As at the reporting date, the ratio of value of the collateral held as security for the credit impaired financial assets to the exposure at default for these assets is assessed as Nil.
iv) The credit impaired assets as at the reporting dates were secured by charge on land and building and project receivables amounting to:(` in Crores)
Particulars As atMarch 31, 2018
As atMarch 31, 2017
Value of Security - 15.35
47. The Company conducts research and development to find new sustainable chemical routes for pharmaceutical & herbal products. The Company is undertaking development activities for Oral Solids and Sterile Injectables, apart from other Active Pharmaceutical Ingredients.
The Company has research and development centers in Mumbai, Ennore and Ahmedabad.
Details of additions to Property Plant & Equipments & Intangibles under Development and qualifying Revenue Expenditure for Department of Scientific & Industrial Research (DSIR) approved research and development facilities/division of the Company at Mumbai, Ennore and Ahmedabad for the year are as follows:
(` in Crores)
DescriptionFor the year ended
March 31, 2018For the year ended
March 31, 2017Revenue Expenditure* 89.81 43.39
TOTAL 89.81 43.39Capital Expenditure, NetAdditions to Property Plant & Equipment 12.37 7.11Additions to Intangibles under Development 11.68 11.55
TOTAL 24.05 18.66
*The amount included in Note 34, under R & D Expenses (Net) does not include ` 57.40 Crores (Previous Year ` 27.93 Crores) relating to Ahmedabad location.
Annual Report 2017-18 | 265
Managem
ent Discussion & Analysis
Strategic Overview
Board &
Managem
ent ProfilesStatutory Reports
Financial Statements
NOTES TO FINANCIAL STATEMENTS (Contd.)for the Year ended March 31, 2018
48. MOVEMENT IN PROVISIONS:(` in Crores)
ParticularsLitigations/Disputes
Provisions for Grants – Committed
Onerous Contracts
2018 2017 2018 2017 2018 2017
Balances as at the beginning of the year 3.50 13.39 17.88 28.83 - 1.06Additions - - - - - -Unwinding of Discount - - 1.38 2.72 - -Revaluation of closing balances - - 0.02 (0.42) - -Amount used - - (12.94) (13.25) - -Unused amounts reversed - (9.89) - - - (1.06)
Balances as at the end of the year 3.50 3.50 6.34 17.88 - -Classified as Non-current (Refer Note 20) - - - 4.91 - -Classified as Current (Refer Note 24) 3.50 3.50 6.34 12.97 - -
TOTAL 3.50 3.50 6.34 17.88 - -Provision for Onerous contracts for the previous year represents the amounts provided for contracts where the unavoidable costs of meeting the obligations under the contract exceed the economic benefits expected to be received under it.
Provision for Grants – Committed represent expected contributions to be paid in FY 2018-19.
Provision for litigation/disputes represents claims against the Company not acknowledged as debts that are expected to materialise in respect of matters under litigation. Future cash outflows are determinable only on receipt of judgements/decisions pending with various forums/authorities.
49. INCOME TAXES RELATING TO OPERATIONSa) Tax expense recognised in statement of profit and loss
(`in Crores)
ParticularsYear ended
March 31, 2018Year ended
March 31, 2017Current tax:In respect of the current year 152.48 146.82In respect of prior years 22.90 48.60
175.38 195.42Deferred tax:In respect of the current year 59.60 (52.27)
59.60 (52.27)TOTAL TAX EXPENSE RECOGNISED 234.98 143.15
b) Tax expense recognised in other comprehensive income(` in Crores)
ParticularsYear ended
March 31, 2018Year ended
March 31, 2017Current tax: - -Deferred tax:Arising on income and expenses recognised in other comprehensive income:Fair value Remeasurement of hedging instruments entered into for cash flow hedges (0.07) 0.07Changes in fair values of equity instruments 22.95 -Remeasurement of defined benefit obligation (1.91) (0.67)
TOTAL TAX EXPENSE RECOGNISED 20.97 (0.60)
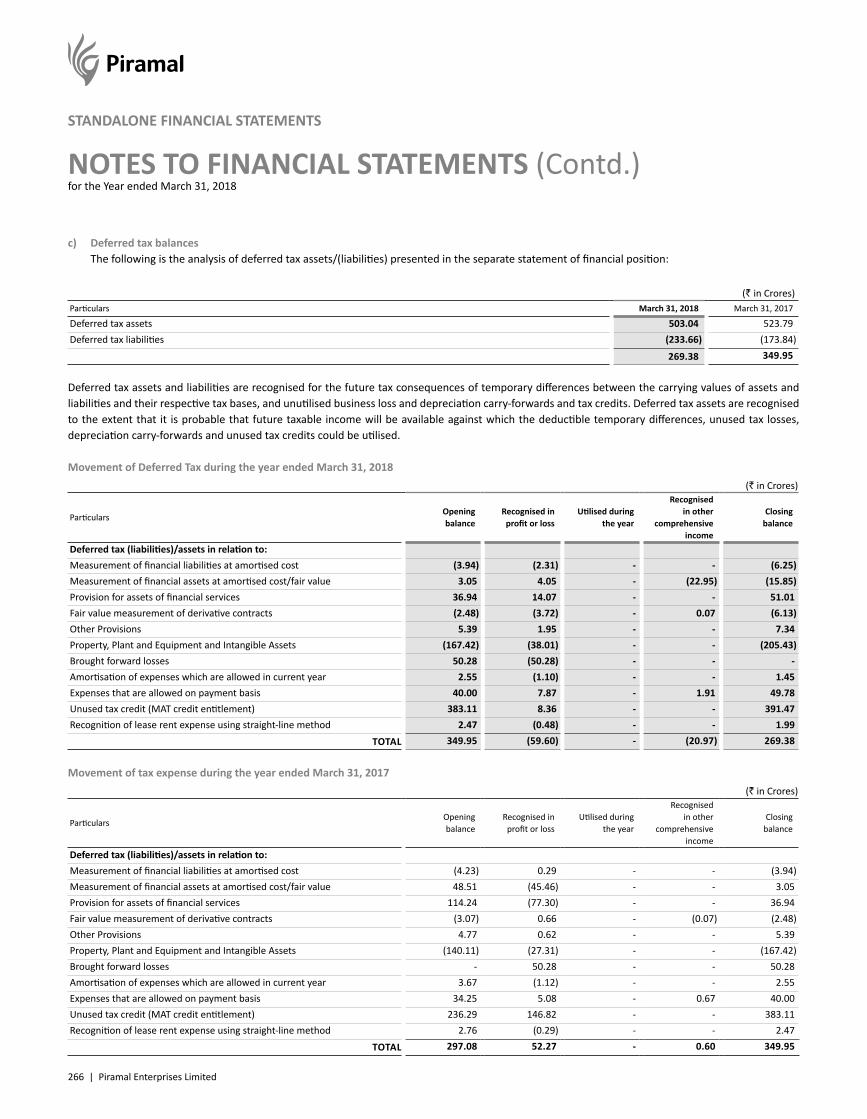
266 | Piramal Enterprises Limited
NOTES TO FINANCIAL STATEMENTS (Contd.)for the Year ended March 31, 2018
STANDALONE FINANCIAL STATEMENTS
c) Deferred tax balances The following is the analysis of deferred tax assets/(liabilities) presented in the separate statement of financial position:
(` in Crores)Particulars March 31, 2018 March 31, 2017
Deferred tax assets 503.04 523.79Deferred tax liabilities (233.66) (173.84)
269.38 349.95
Deferred tax assets and liabilities are recognised for the future tax consequences of temporary differences between the carrying values of assets and liabilities and their respective tax bases, and unutilised business loss and depreciation carry-forwards and tax credits. Deferred tax assets are recognised to the extent that it is probable that future taxable income will be available against which the deductible temporary differences, unused tax losses, depreciation carry-forwards and unused tax credits could be utilised.
Movement of Deferred Tax during the year ended March 31, 2018(` in Crores)
ParticularsOpening balance
Recognised in profit or loss
Utilised during the year
Recognised in other
comprehensive income
Closing balance
Deferred tax (liabilities)/assets in relation to:Measurement of financial liabilities at amortised cost (3.94) (2.31) - - (6.25)Measurement of financial assets at amortised cost/fair value 3.05 4.05 - (22.95) (15.85)Provision for assets of financial services 36.94 14.07 - - 51.01Fair value measurement of derivative contracts (2.48) (3.72) - 0.07 (6.13)Other Provisions 5.39 1.95 - - 7.34Property, Plant and Equipment and Intangible Assets (167.42) (38.01) - - (205.43)Brought forward losses 50.28 (50.28) - - -Amortisation of expenses which are allowed in current year 2.55 (1.10) - - 1.45Expenses that are allowed on payment basis 40.00 7.87 - 1.91 49.78Unused tax credit (MAT credit entitlement) 383.11 8.36 - - 391.47Recognition of lease rent expense using straight-line method 2.47 (0.48) - - 1.99
TOTAL 349.95 (59.60) - (20.97) 269.38
Movement of tax expense during the year ended March 31, 2017(` in Crores)
ParticularsOpening balance
Recognised in profit or loss
Utilised during the year
Recognised in other
comprehensive income
Closing balance
Deferred tax (liabilities)/assets in relation to:Measurement of financial liabilities at amortised cost (4.23) 0.29 - - (3.94)Measurement of financial assets at amortised cost/fair value 48.51 (45.46) - - 3.05Provision for assets of financial services 114.24 (77.30) - - 36.94Fair value measurement of derivative contracts (3.07) 0.66 - (0.07) (2.48)Other Provisions 4.77 0.62 - - 5.39Property, Plant and Equipment and Intangible Assets (140.11) (27.31) - - (167.42)Brought forward losses - 50.28 - - 50.28Amortisation of expenses which are allowed in current year 3.67 (1.12) - - 2.55Expenses that are allowed on payment basis 34.25 5.08 - 0.67 40.00Unused tax credit (MAT credit entitlement) 236.29 146.82 - - 383.11Recognition of lease rent expense using straight-line method 2.76 (0.29) - - 2.47
TOTAL 297.08 52.27 - 0.60 349.95
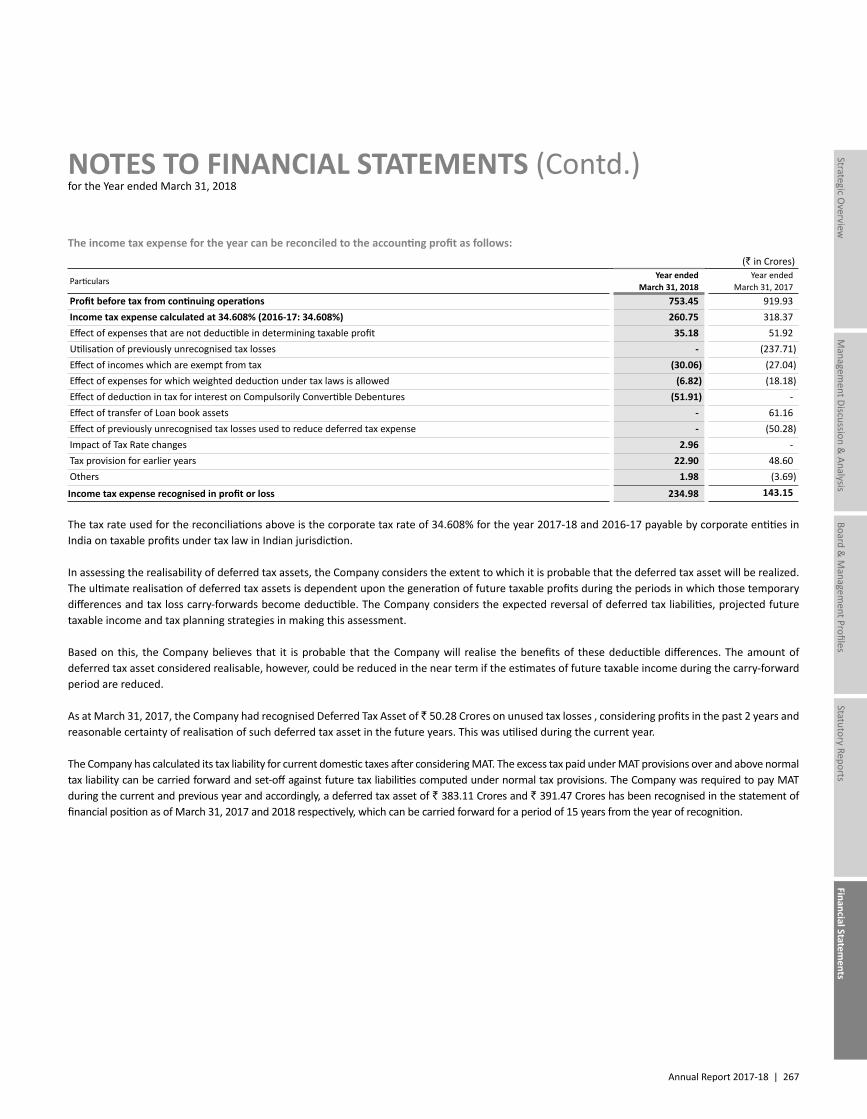
Annual Report 2017-18 | 267
Managem
ent Discussion & Analysis
Strategic Overview
Board &
Managem
ent ProfilesStatutory Reports
Financial Statements
NOTES TO FINANCIAL STATEMENTS (Contd.)for the Year ended March 31, 2018
The income tax expense for the year can be reconciled to the accounting profit as follows:(` in Crores)
ParticularsYear ended
March 31, 2018Year ended
March 31, 2017Profit before tax from continuing operations 753.45 919.93Income tax expense calculated at 34.608% (2016-17: 34.608%) 260.75 318.37Effect of expenses that are not deductible in determining taxable profit 35.18 51.92Utilisation of previously unrecognised tax losses - (237.71)Effect of incomes which are exempt from tax (30.06) (27.04)Effect of expenses for which weighted deduction under tax laws is allowed (6.82) (18.18)Effect of deduction in tax for interest on Compulsorily Convertible Debentures (51.91) -Effect of transfer of Loan book assets - 61.16Effect of previously unrecognised tax losses used to reduce deferred tax expense - (50.28)Impact of Tax Rate changes 2.96 -Tax provision for earlier years 22.90 48.60Others 1.98 (3.69)
Income tax expense recognised in profit or loss 234.98 143.15
The tax rate used for the reconciliations above is the corporate tax rate of 34.608% for the year 2017-18 and 2016-17 payable by corporate entities in India on taxable profits under tax law in Indian jurisdiction.
In assessing the realisability of deferred tax assets, the Company considers the extent to which it is probable that the deferred tax asset will be realized. The ultimate realisation of deferred tax assets is dependent upon the generation of future taxable profits during the periods in which those temporary differences and tax loss carry-forwards become deductible. The Company considers the expected reversal of deferred tax liabilities, projected future taxable income and tax planning strategies in making this assessment.
Based on this, the Company believes that it is probable that the Company will realise the benefits of these deductible differences. The amount of deferred tax asset considered realisable, however, could be reduced in the near term if the estimates of future taxable income during the carry-forward period are reduced.
As at March 31, 2017, the Company had recognised Deferred Tax Asset of ` 50.28 Crores on unused tax losses , considering profits in the past 2 years and reasonable certainty of realisation of such deferred tax asset in the future years. This was utilised during the current year.
The Company has calculated its tax liability for current domestic taxes after considering MAT. The excess tax paid under MAT provisions over and above normal tax liability can be carried forward and set-off against future tax liabilities computed under normal tax provisions. The Company was required to pay MAT during the current and previous year and accordingly, a deferred tax asset of ` 383.11 Crores and ` 391.47 Crores has been recognised in the statement of financial position as of March 31, 2017 and 2018 respectively, which can be carried forward for a period of 15 years from the year of recognition.
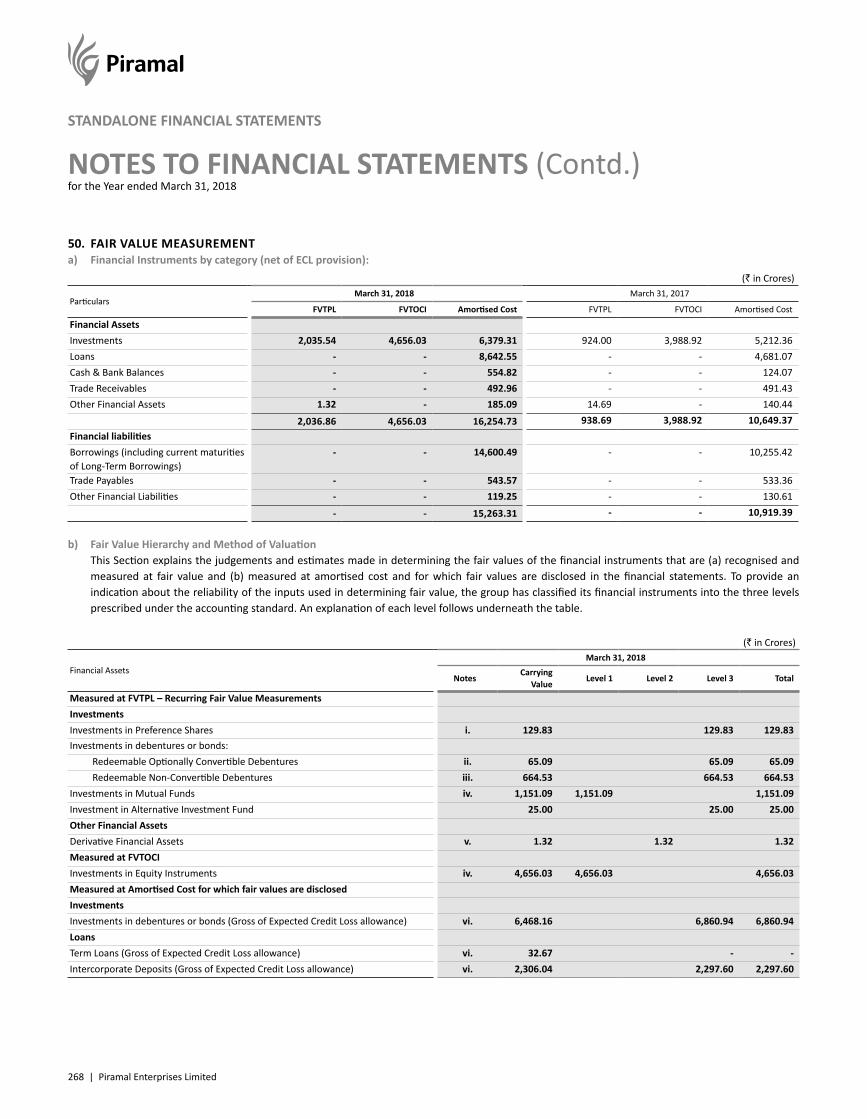
268 | Piramal Enterprises Limited
NOTES TO FINANCIAL STATEMENTS (Contd.)for the Year ended March 31, 2018
STANDALONE FINANCIAL STATEMENTS
50. FAIR VALUE MEASUREMENTa) Financial Instruments by category (net of ECL provision):
(` in Crores)
ParticularsMarch 31, 2018 March 31, 2017
FVTPL FVTOCI Amortised Cost FVTPL FVTOCI Amortised Cost
Financial AssetsInvestments 2,035.54 4,656.03 6,379.31 924.00 3,988.92 5,212.36Loans - - 8,642.55 - - 4,681.07Cash & Bank Balances - - 554.82 - - 124.07Trade Receivables - - 492.96 - - 491.43Other Financial Assets 1.32 - 185.09 14.69 - 140.44
2,036.86 4,656.03 16,254.73 938.69 3,988.92 10,649.37Financial liabilitiesBorrowings (including current maturities of Long-Term Borrowings)
- - 14,600.49 - - 10,255.42
Trade Payables - - 543.57 - - 533.36Other Financial Liabilities - - 119.25 - - 130.61
- - 15,263.31 - - 10,919.39
b) Fair Value Hierarchy and Method of Valuation This Section explains the judgements and estimates made in determining the fair values of the financial instruments that are (a) recognised and
measured at fair value and (b) measured at amortised cost and for which fair values are disclosed in the financial statements. To provide an indication about the reliability of the inputs used in determining fair value, the group has classified its financial instruments into the three levels prescribed under the accounting standard. An explanation of each level follows underneath the table.
(` in Crores)
Financial AssetsMarch 31, 2018
NotesCarrying
ValueLevel 1 Level 2 Level 3 Total
Measured at FVTPL – Recurring Fair Value MeasurementsInvestmentsInvestments in Preference Shares i. 129.83 129.83 129.83Investments in debentures or bonds: Redeemable Optionally Convertible Debentures ii. 65.09 65.09 65.09 Redeemable Non-Convertible Debentures iii. 664.53 664.53 664.53Investments in Mutual Funds iv. 1,151.09 1,151.09 1,151.09Investment in Alternative Investment Fund 25.00 25.00 25.00Other Financial AssetsDerivative Financial Assets v. 1.32 1.32 1.32Measured at FVTOCIInvestments in Equity Instruments iv. 4,656.03 4,656.03 4,656.03Measured at Amortised Cost for which fair values are disclosedInvestmentsInvestments in debentures or bonds (Gross of Expected Credit Loss allowance) vi. 6,468.16 6,860.94 6,860.94LoansTerm Loans (Gross of Expected Credit Loss allowance) vi. 32.67 - -Intercorporate Deposits (Gross of Expected Credit Loss allowance) vi. 2,306.04 2,297.60 2,297.60
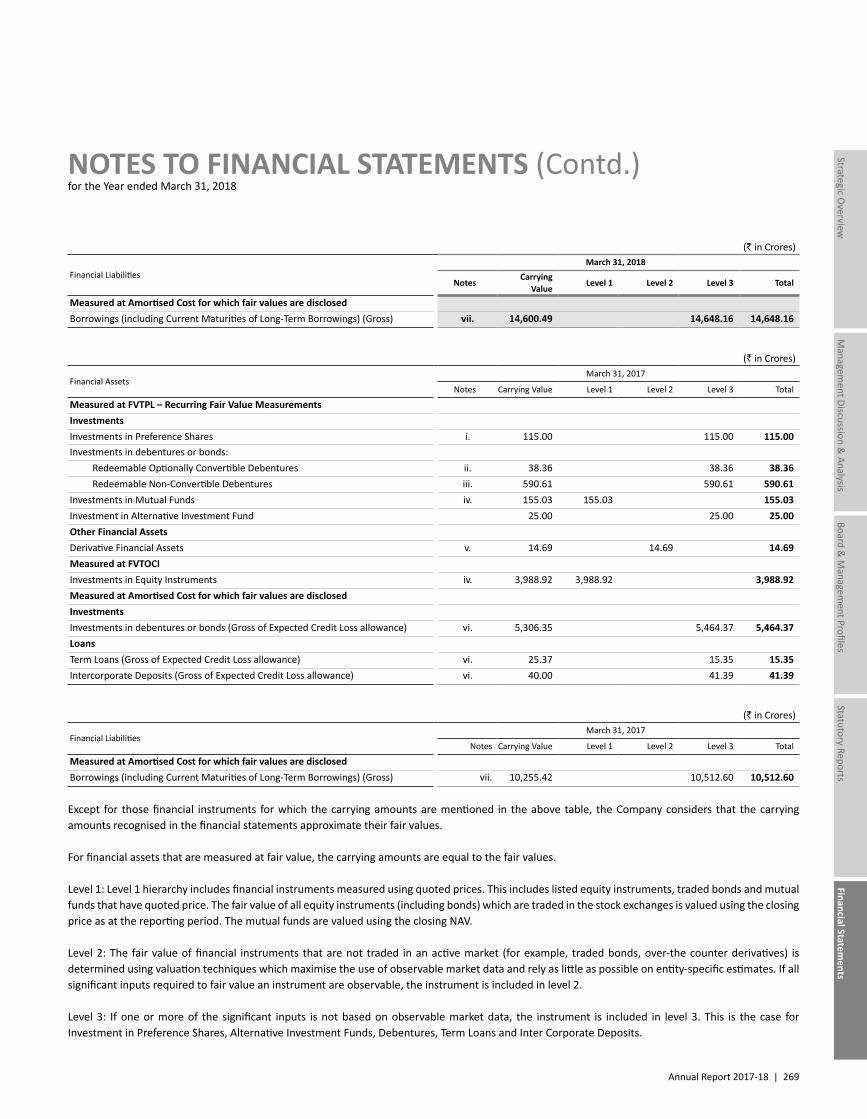
Annual Report 2017-18 | 269
Managem
ent Discussion & Analysis
Strategic Overview
Board &
Managem
ent ProfilesStatutory Reports
Financial Statements
NOTES TO FINANCIAL STATEMENTS (Contd.)for the Year ended March 31, 2018
(` in Crores)
Financial LiabilitiesMarch 31, 2018
NotesCarrying
ValueLevel 1 Level 2 Level 3 Total
Measured at Amortised Cost for which fair values are disclosedBorrowings (including Current Maturities of Long-Term Borrowings) (Gross) vii. 14,600.49 14,648.16 14,648.16
(` in Crores)
Financial AssetsMarch 31, 2017
Notes Carrying Value Level 1 Level 2 Level 3 Total
Measured at FVTPL – Recurring Fair Value MeasurementsInvestmentsInvestments in Preference Shares i. 115.00 115.00 115.00Investments in debentures or bonds: Redeemable Optionally Convertible Debentures ii. 38.36 38.36 38.36 Redeemable Non-Convertible Debentures iii. 590.61 590.61 590.61Investments in Mutual Funds iv. 155.03 155.03 155.03Investment in Alternative Investment Fund 25.00 25.00 25.00Other Financial AssetsDerivative Financial Assets v. 14.69 14.69 14.69Measured at FVTOCIInvestments in Equity Instruments iv. 3,988.92 3,988.92 3,988.92Measured at Amortised Cost for which fair values are disclosedInvestmentsInvestments in debentures or bonds (Gross of Expected Credit Loss allowance) vi. 5,306.35 5,464.37 5,464.37LoansTerm Loans (Gross of Expected Credit Loss allowance) vi. 25.37 15.35 15.35Intercorporate Deposits (Gross of Expected Credit Loss allowance) vi. 40.00 41.39 41.39
(` in Crores)
Financial LiabilitiesMarch 31, 2017
Notes Carrying Value Level 1 Level 2 Level 3 Total
Measured at Amortised Cost for which fair values are disclosedBorrowings (including Current Maturities of Long-Term Borrowings) (Gross) vii. 10,255.42 10,512.60 10,512.60
Except for those financial instruments for which the carrying amounts are mentioned in the above table, the Company considers that the carrying amounts recognised in the financial statements approximate their fair values.
For financial assets that are measured at fair value, the carrying amounts are equal to the fair values.
Level 1: Level 1 hierarchy includes financial instruments measured using quoted prices. This includes listed equity instruments, traded bonds and mutual funds that have quoted price. The fair value of all equity instruments (including bonds) which are traded in the stock exchanges is valued using the closing price as at the reporting period. The mutual funds are valued using the closing NAV.
Level 2: The fair value of financial instruments that are not traded in an active market (for example, traded bonds, over-the counter derivatives) is determined using valuation techniques which maximise the use of observable market data and rely as little as possible on entity-specific estimates. If all significant inputs required to fair value an instrument are observable, the instrument is included in level 2.
Level 3: If one or more of the significant inputs is not based on observable market data, the instrument is included in level 3. This is the case for Investment in Preference Shares, Alternative Investment Funds, Debentures, Term Loans and Inter Corporate Deposits.
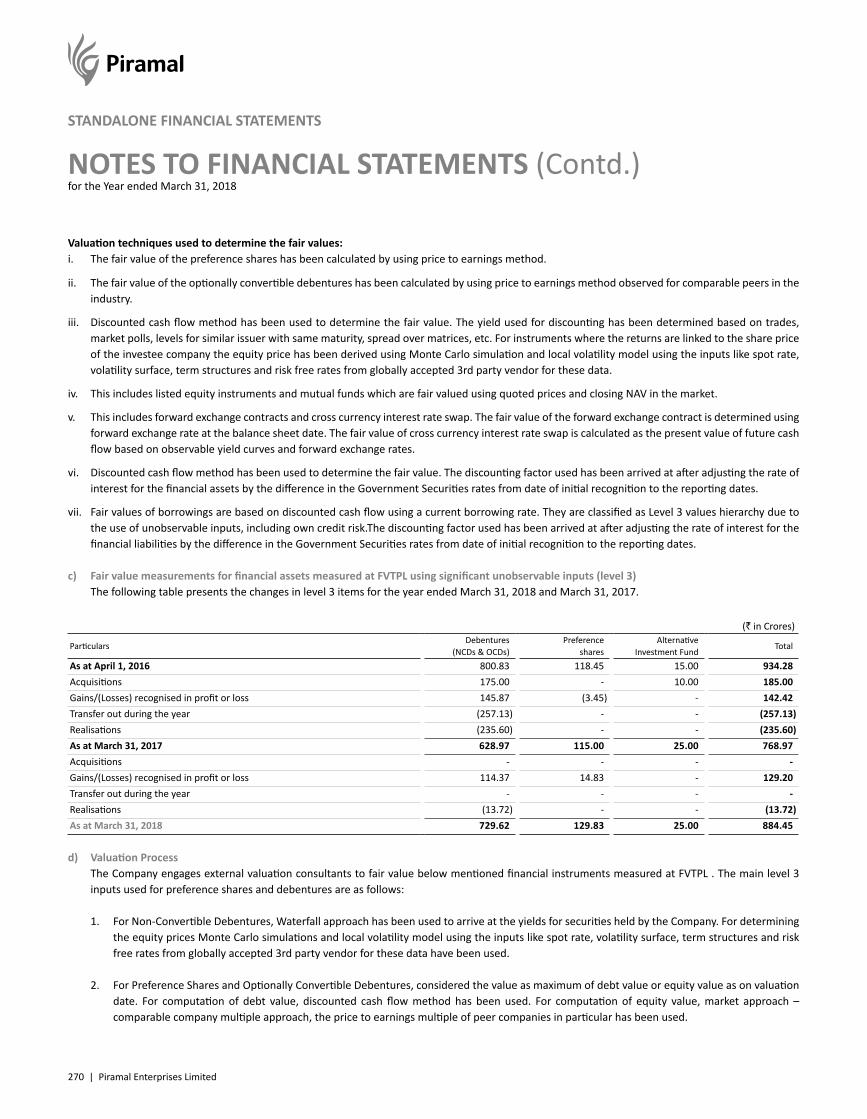
270 | Piramal Enterprises Limited
NOTES TO FINANCIAL STATEMENTS (Contd.)for the Year ended March 31, 2018
STANDALONE FINANCIAL STATEMENTS
Valuation techniques used to determine the fair values:i. The fair value of the preference shares has been calculated by using price to earnings method.
ii. The fair value of the optionally convertible debentures has been calculated by using price to earnings method observed for comparable peers in the industry.
iii. Discounted cash flow method has been used to determine the fair value. The yield used for discounting has been determined based on trades, market polls, levels for similar issuer with same maturity, spread over matrices, etc. For instruments where the returns are linked to the share price of the investee company the equity price has been derived using Monte Carlo simulation and local volatility model using the inputs like spot rate, volatility surface, term structures and risk free rates from globally accepted 3rd party vendor for these data.
iv. This includes listed equity instruments and mutual funds which are fair valued using quoted prices and closing NAV in the market.
v. This includes forward exchange contracts and cross currency interest rate swap. The fair value of the forward exchange contract is determined using forward exchange rate at the balance sheet date. The fair value of cross currency interest rate swap is calculated as the present value of future cash flow based on observable yield curves and forward exchange rates.
vi. Discounted cash flow method has been used to determine the fair value. The discounting factor used has been arrived at after adjusting the rate of interest for the financial assets by the difference in the Government Securities rates from date of initial recognition to the reporting dates.
vii. Fair values of borrowings are based on discounted cash flow using a current borrowing rate. They are classified as Level 3 values hierarchy due to the use of unobservable inputs, including own credit risk.The discounting factor used has been arrived at after adjusting the rate of interest for the financial liabilities by the difference in the Government Securities rates from date of initial recognition to the reporting dates.
c) Fair value measurements for financial assets measured at FVTPL using significant unobservable inputs (level 3) The following table presents the changes in level 3 items for the year ended March 31, 2018 and March 31, 2017.
(` in Crores)
ParticularsDebentures
(NCDs & OCDs)Preference
sharesAlternative
Investment FundTotal
As at April 1, 2016 800.83 118.45 15.00 934.28Acquisitions 175.00 - 10.00 185.00Gains/(Losses) recognised in profit or loss 145.87 (3.45) - 142.42Transfer out during the year (257.13) - - (257.13)Realisations (235.60) - - (235.60)As at March 31, 2017 628.97 115.00 25.00 768.97Acquisitions - - - -Gains/(Losses) recognised in profit or loss 114.37 14.83 - 129.20Transfer out during the year - - - -Realisations (13.72) - - (13.72)As at March 31, 2018 729.62 129.83 25.00 884.45
d) Valuation Process The Company engages external valuation consultants to fair value below mentioned financial instruments measured at FVTPL . The main level 3
inputs used for preference shares and debentures are as follows:
1. For Non-Convertible Debentures, Waterfall approach has been used to arrive at the yields for securities held by the Company. For determining the equity prices Monte Carlo simulations and local volatility model using the inputs like spot rate, volatility surface, term structures and risk free rates from globally accepted 3rd party vendor for these data have been used.
2. For Preference Shares and Optionally Convertible Debentures, considered the value as maximum of debt value or equity value as on valuation date. For computation of debt value, discounted cash flow method has been used. For computation of equity value, market approach – comparable company multiple approach, the price to earnings multiple of peer companies in particular has been used.
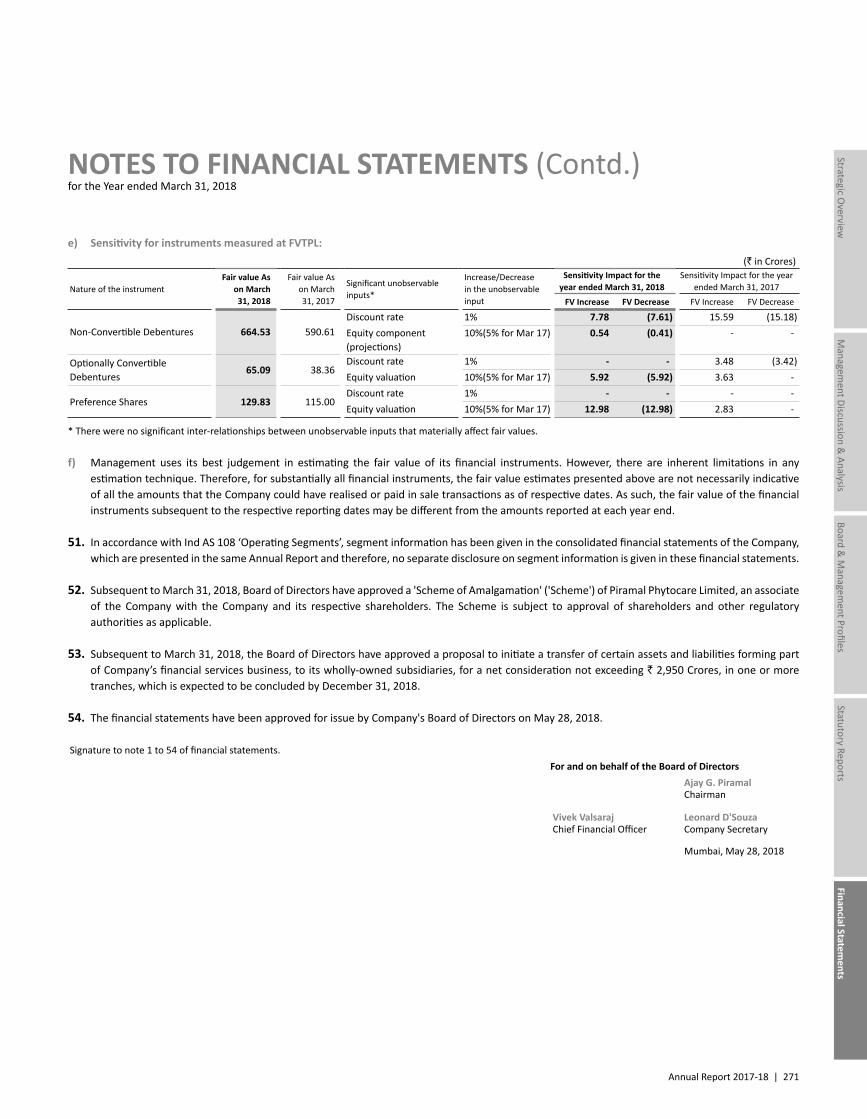
Annual Report 2017-18 | 271
Managem
ent Discussion & Analysis
Strategic Overview
Board &
Managem
ent ProfilesStatutory Reports
Financial Statements
NOTES TO FINANCIAL STATEMENTS (Contd.)for the Year ended March 31, 2018
e) Sensitivity for instruments measured at FVTPL:(` in Crores)
Nature of the instrumentFair value As
on March 31, 2018
Fair value As on March 31, 2017
Significant unobservable inputs*
Increase/Decrease in the unobservable input
Sensitivity Impact for the year ended March 31, 2018
Sensitivity Impact for the year ended March 31, 2017
FV Increase FV Decrease FV Increase FV Decrease
Non-Convertible Debentures 664.53 590.61Discount rate 1% 7.78 (7.61) 15.59 (15.18)Equity component (projections)
10%(5% for Mar 17) 0.54 (0.41) - -
Optionally Convertible Debentures
65.09 38.36Discount rate 1% - - 3.48 (3.42)Equity valuation 10%(5% for Mar 17) 5.92 (5.92) 3.63 -
Preference Shares 129.83 115.00Discount rate 1% - - - -Equity valuation 10%(5% for Mar 17) 12.98 (12.98) 2.83 -
* There were no significant inter-relationships between unobservable inputs that materially affect fair values.
f) Management uses its best judgement in estimating the fair value of its financial instruments. However, there are inherent limitations in any estimation technique. Therefore, for substantially all financial instruments, the fair value estimates presented above are not necessarily indicative of all the amounts that the Company could have realised or paid in sale transactions as of respective dates. As such, the fair value of the financial instruments subsequent to the respective reporting dates may be different from the amounts reported at each year end.
51. In accordance with Ind AS 108 ‘Operating Segments’, segment information has been given in the consolidated financial statements of the Company, which are presented in the same Annual Report and therefore, no separate disclosure on segment information is given in these financial statements.
52. Subsequent to March 31, 2018, Board of Directors have approved a 'Scheme of Amalgamation' ('Scheme') of Piramal Phytocare Limited, an associate of the Company with the Company and its respective shareholders. The Scheme is subject to approval of shareholders and other regulatory authorities as applicable.
53. Subsequent to March 31, 2018, the Board of Directors have approved a proposal to initiate a transfer of certain assets and liabilities forming part of Company’s financial services business, to its wholly-owned subsidiaries, for a net consideration not exceeding ` 2,950 Crores, in one or more tranches, which is expected to be concluded by December 31, 2018.
54. The financial statements have been approved for issue by Company's Board of Directors on May 28, 2018.
Signature to note 1 to 54 of financial statements.For and on behalf of the Board of Directors
Ajay G. Piramal Chairman
Vivek Valsaraj Chief Financial Officer
Leonard D'Souza Company Secretary
Mumbai, May 28, 2018
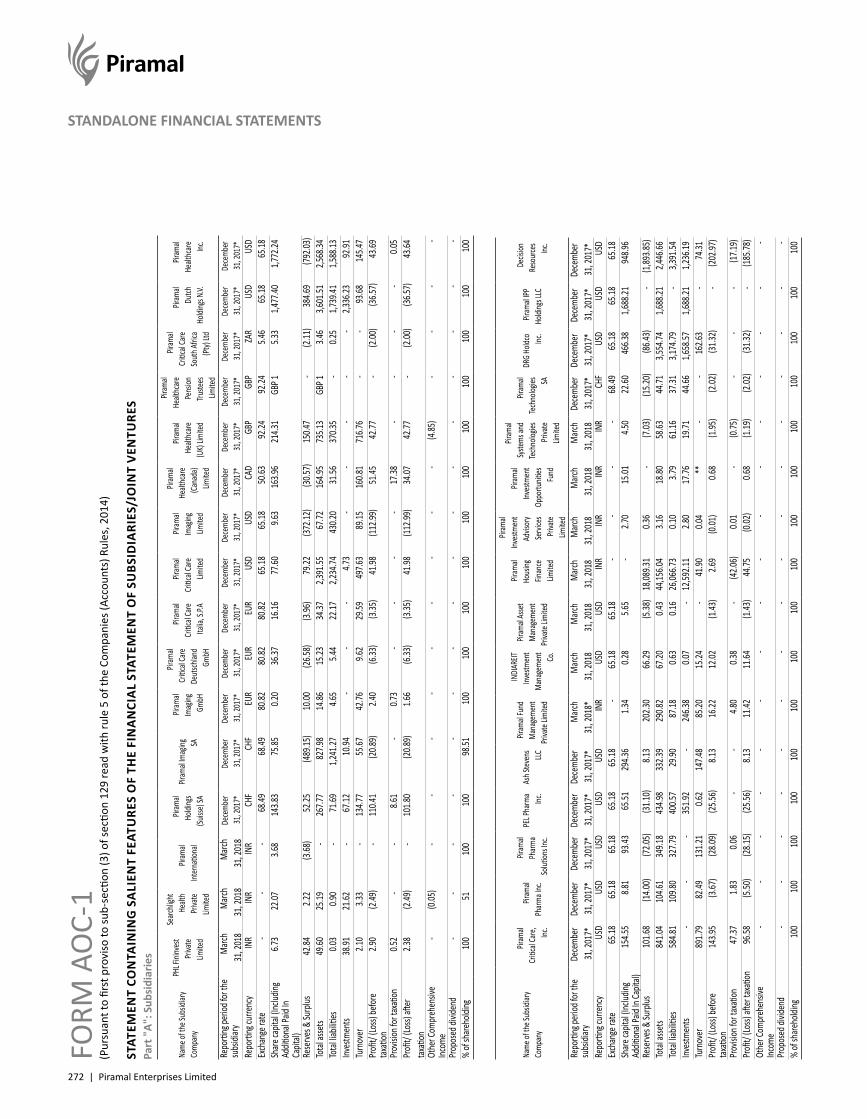
272 | Piramal Enterprises Limited
STANDALONE FINANCIAL STATEMENTSST
ATEM
ENT
CON
TAIN
ING
SA
LIEN
T FE
ATU
RES
OF
THE
FIN
AN
CIA
L ST
ATEM
ENT
OF
SUBS
IDIA
RIES
/JO
INT
VEN
TURE
SPa
rt "
A": S
ubsi
diar
ies
Name
of th
e Sub
sidiar
y Co
mpan
y
PHL F
ininv
est
Priva
te Lim
ited
Searc
hligh
t He
alth
Priva
te Lim
ited
Piram
al Int
erna
tiona
l
Piram
al Ho
lding
s (Su
isse)
SA
Piram
al Im
aging
SA
Piram
al Im
aging
Gm
bH
Piram
al Cr
itical
Care
Deut
schlan
d Gm
bH
Piram
al Cr
itical
Care
Italia
, S.P.
A
Piram
al Cr
itical
Care
Limite
d
Piram
al Im
aging
Lim
ited
Piram
al He
althc
are
(Cana
da)
Limite
d
Piram
al He
althc
are
(UK)
Limite
d
Piram
al He
althc
are
Pens
ion
Truste
es
Limite
d
Piram
al Cr
itical
Care
Sout
h Afri
ca
(Pty)
Ltd
Piram
alDu
tchHo
lding
s N.V.
Piram
al He
althc
are
Inc.
Repo
rting
perio
d for
the
subs
idiary
Marc
h 31
, 201
8M
arch
31, 2
018
Marc
h 31
, 201
8De
cemb
er
31, 2
017*
Dece
mber
31
, 201
7*De
cemb
er
31, 2
017*
Dece
mber
31
, 201
7*De
cemb
er
31, 2
017*
Dece
mber
31
, 201
7*De
cemb
er
31, 2
017*
Dece
mber
31
, 201
7*De
cemb
er
31, 2
017*
Dece
mber
31
, 201
7*De
cemb
er
31, 2
017*
Dece
mber
31
, 201
7*De
cemb
er
31, 2
017*
Repo
rting
curre
ncy
INR
INR
INR
CHF
CHF
EUR
EUR
EUR
USD
USD
CAD
GBP
GBP
ZAR
USD
USD
Exch
ange
rate
- -
- 68
.49 68
.49 80
.82 80
.82 80
.82 65
.18 65
.18 50
.63 92
.24 92
.24 5.
46 65
.18 65
.18Sh
are ca
pital
(Inclu
ding
Additi
onal
Paid
In Ca
pital)
6.73
22.07
3.68
143.8
3 75
.85 0.
20 36
.37 16
.16 77
.60 9.
63 16
3.96
214.3
1 G
BP 1
5.33
1,47
7.40
1,77
2.24
Rese
rves &
Surp
lus 42
.84 2.
22 (3
.68)
52.25
(489
.15)
10.00
(26.5
8) (3
.96)
79.22
(372
.12)
(30.5
7) 15
0.47
- (2
.11)
384.6
9 (7
92.03
)To
tal as
sets
49.60
25.19
- 26
7.77
827.9
8 14
.86 15
.23 34
.37 2,
391.5
5 67
.72 16
4.95
735.1
3 G
BP 1
3.46
3,60
1.51
2,56
8.34
Total
liabil
ities
0.03
0.90
- 71
.69 1,
241.2
7 4.
65 5.
44 22
.17 2,
234.7
4 43
0.20
31.56
370.3
5 -
0.25
1,73
9.41
1,58
8.13
Inves
tmen
ts 38
.91 21
.62 -
67.12
10.94
- -
- 4.
73 -
- -
- -
2,33
6.23
92.91
Turn
over
2.10
3.33
- 13
4.77
55.67
42.76
9.62
29.59
497.6
3 89
.15 16
0.81
716.7
6 -
- 93
.68 14
5.47
Profi
t/ (Lo
ss) be
fore
taxati
on 2.
90 (2
.49)
- 11
0.41
(20.8
9) 2.
40 (6
.33)
(3.35
) 41
.98 (1
12.99
) 51
.45 42
.77 -
(2.00
) (3
6.57)
43.69
Prov
ision
for t
axati
on 0.
52 -
- 8.
61 -
0.73
- -
- -
17.38
- -
- -
0.05
Profi
t/ (Lo
ss) aft
er
taxati
on 2.
38 (2
.49)
- 10
1.80
(20.8
9) 1.
66 (6
.33)
(3.35
) 41
.98 (1
12.99
) 34
.07 42
.77 -
(2.00
) (3
6.57)
43.64
Othe
r Com
preh
ensiv
e Inc
ome
- (0
.05)
- -
- -
- -
- -
- (4
.85)
- -
- -
Prop
osed
divid
end
- -
- -
- -
- -
- -
- -
- -
- -
% of
share
holdi
ng10
051
100
100
98.51
100
100
100
100
100
100
100
100
100
100
100
Name
of th
e Sub
sidiar
y Co
mpan
y
Piram
al Cr
itical
Care,
Inc
.
Piram
al Ph
arma I
nc.
Piram
al Ph
arma
Soluti
ons I
nc.
PEL P
harm
a Inc
.As
h Stev
ens
LLC
Piram
al Fu
nd
Man
agem
ent
Priva
te Lim
ited
INDI
AREIT
Inv
estm
ent
Man
agem
ent
Co.
Piram
al As
set
Man
agem
ent
Priva
te Lim
ited
Piram
al Ho
using
Fin
ance
Lim
ited
Piram
al Inv
estm
ent
Advis
ory
Servi
ces
Priva
te Lim
ited
Piram
al Inv
estm
ent
Oppo
rtuniti
es
Fund
Piram
al Sy
stems
and
Tech
nolog
ies
Priva
te Lim
ited
Piram
al Te
chno
logies
SA
DRG
Holdc
o Inc
.Pir
amal
IPP
Holdi
ngs L
LC
Decis
ion
Reso
urce
s Inc
.
Repo
rting
perio
d for
the
subs
idiary
Dece
mber
31
, 201
7*De
cemb
er
31, 2
017*
Dece
mber
31
, 201
7*De
cemb
er
31, 2
017*
Dece
mber
31
, 201
7*M
arch
31, 2
018*
Marc
h 31
, 201
8M
arch
31, 2
018
Marc
h 31
, 201
8M
arch
31, 2
018
Marc
h 31
, 201
8M
arch
31, 2
018
Dece
mber
31
, 201
7*De
cemb
er
31, 2
017*
Dece
mber
31
, 201
7*De
cemb
er
31, 2
017*
Repo
rting
curre
ncy
USD
USD
USD
USD
USD
INR
USD
USD
INR
INR
INR
INR
CHF
USD
USD
USD
Exch
ange
rate
65.18
65.18
65.18
65.18
65.18
- 65
.18 65
.18 -
- -
- 68
.49 65
.18 65
.18 65
.18Sh
are ca
pital
(Inclu
ding
Additi
onal
Paid
In Ca
pital)
154.5
5 8.
81 93
.43 65
.51 29
4.36
1.34
0.28
5.65
- 2.
70 15
.01 4.
50 22
.60 46
6.38
1,68
8.21
948.9
6
Rese
rves &
Surp
lus 10
1.68
(14.0
0) (7
2.05)
(31.1
0) 8.
13 20
2.30
66.29
(5.38
) 18
,089.3
1 0.
36 -
(7.03
) (1
5.20)
(86.4
3) -
(1,89
3.85)
Total
asse
ts 84
1.04
104.6
1 34
9.18
434.9
8 33
2.39
290.8
2 67
.20 0.
43 44
,156.0
4 3.
16 18
.80 58
.63 44
.71 3,
554.7
4 1,
688.2
1 2,
446.6
6To
tal lia
bilitie
s 58
4.81
109.8
032
7.79
400.5
7 29
.90 87
.18 0.
63 0.
16 26
,066.7
3 0.
10 3.
79 61
.16 37
.31 3,
174.7
9 -
3,39
1.54
Inves
tmen
ts -
- -
351.9
2 -
246.3
8 0.
07 -
12,59
2.11
2.80
17.76
19.71
44.66
1,65
8.57
1,68
8.21
1,23
6.19
Turn
over
891.7
9 82
.49 13
1.21
0.62
147.4
8 85
.20 15
.24 -
41.90
0.04
** -
- 16
2.63
- 74
.31Pr
ofit/
(Loss)
befor
e tax
ation
143.9
5 (3
.67)
(28.0
9) (2
5.56)
8.13
16.22
12.02
(1.43
)2.6
9 (0
.01)
0.68
(1.95
) (2
.02)
(31.3
2) -
(202
.97)
Prov
ision
for t
axati
on 47
.37 1.
830.0
6 -
- 4.
80 0.
38 -
(42.0
6) 0.
01 -
(0.75
) -
- -
(17.1
9)Pr
ofit/
(Loss)
after
taxa
tion
96.58
(5.50
) (2
8.15)
(25.5
6) 8.
13 11
.42 11
.64 (1
.43)
44.75
(0.02
) 0.
68 (1
.19)
(2.02
) (3
1.32)
- (1
85.78
)Ot
her C
ompr
ehen
sive
Incom
e -
- -
- -
- -
- -
- -
- -
- -
-
Prop
osed
divid
end
- -
- -
- -
- -
- -
- -
- -
- -
% of
share
holdi
ng10
010
010
010
010
010
010
010
010
010
010
010
010
010
010
010
0
FORM
AO
C-1
(Pur
suan
t to
first
pro
viso
to su
b-se
ction
(3) o
f sec
tion
129
read
with
rule
5 o
f the
Com
pani
es (A
ccou
nts)
Rul
es, 2
014)
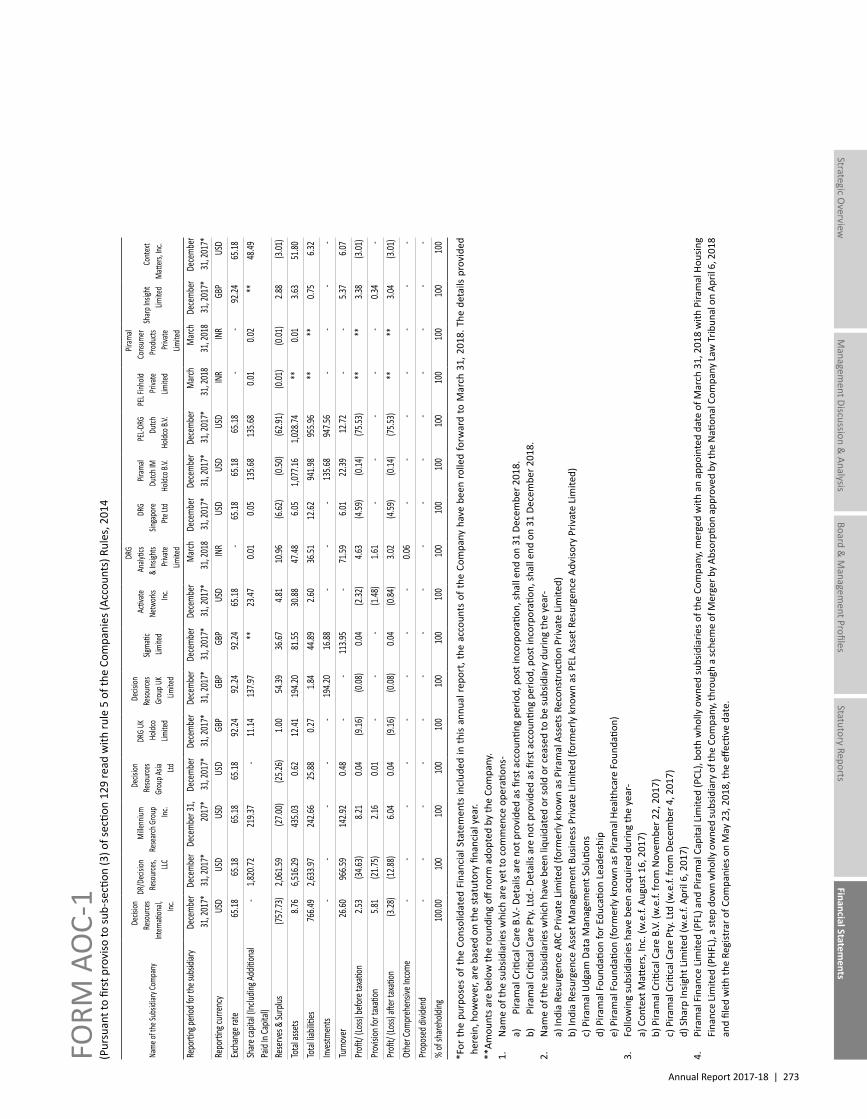
Annual Report 2017-18 | 273
Managem
ent Discussion & Analysis
Strategic Overview
Board &
Managem
ent ProfilesStatutory Reports
Financial Statements
Name
of th
e Sub
sidiar
y Com
pany
Decis
ion
Reso
urce
s Int
erna
tiona
l, Inc
.
DR/D
ecisi
on
Reso
urce
s, LLC
Mille
nnium
Re
searc
h Gro
up
Inc.
Decis
ion
Reso
urce
s Gr
oup A
sia
Ltd
DRG
UK
Holdc
o Lim
ited
Decis
ion
Reso
urce
s Gr
oup U
K Lim
ited
Sigma
tic
Limite
d
Activ
ate
Netw
orks Inc
.
DRG
Analy
tics
& Ins
ights
Priva
te Lim
ited
DRG
Singa
pore
Pte L
td
Piram
al Du
tch IM
Ho
ldco B
.V.
PEL-D
RG
Dutch
Ho
ldco B
.V.
PEL F
inhold
Pr
ivate
Limite
d
Piram
al Co
nsum
er
Prod
ucts
Priva
te Lim
ited
Sharp
Insig
ht
Limite
dCo
ntext
Matt
ers, In
c.
Repo
rting
perio
d for
the su
bsidi
aryDe
cemb
er
31, 2
017*
Dece
mber
31
, 201
7*De
cemb
er 31
, 20
17*
Dece
mber
31
, 201
7*De
cemb
er
31, 2
017*
Dece
mber
31
, 201
7*De
cemb
er
31, 2
017*
Dece
mber
31
, 201
7*M
arch
31, 2
018
Dece
mber
31
, 201
7*De
cemb
er
31, 2
017*
Dece
mber
31
, 201
7*M
arch
31, 2
018
Marc
h 31
, 201
8De
cemb
er
31, 2
017*
Dece
mber
31
, 201
7*Re
porti
ng cu
rrenc
yUS
DUS
DUS
DUS
DGB
PGB
PGB
PUS
DIN
RUS
DUS
DUS
DIN
RIN
RGB
PUS
DEx
chan
ge ra
te 65
.18 65
.18 65
.18 65
.18 92
.24 92
.24 92
.24 65
.18 -
65.18
65.18
65.18
- -
92.24
65.18
Share
capit
al (In
cludin
g Add
itiona
l Pa
id In
Capit
al) -
1,82
0.72
219.3
7 -
11.14
137.9
7 **
23.47
0.01
0.05
135.6
8 13
5.68
0.01
0.02
** 48
.49
Rese
rves &
Surp
lus (7
57.73
) 2,
061.5
9 (2
7.00)
(25.2
6) 1.
00 54
.39 36
.67 4.
81 10
.96 (6
.62)
(0.50
) (6
2.91)
(0.01
) (0
.01)
2.88
(3.01
)To
tal as
sets
8.76
6,51
6.29
435.0
3 0.
62 12
.41 19
4.20
81.55
30.88
47.48
6.05
1,07
7.16
1,02
8.74
** 0.
01 3.
63 51
.80To
tal lia
bilitie
s 76
6.49
2,63
3.97
242.6
6 25
.88 0.
27 1.
84 44
.89 2.
60 36
.51 12
.62 94
1.98
955.9
6 **
** 0.
75 6.
32Inv
estm
ents
- -
- -
- 19
4.20
16.88
- -
- 13
5.68
947.5
6 -
- -
-Tu
rnov
er 26
.60 96
6.59
142.9
2 0.
48 -
- 11
3.95
- 71
.59 6.
01 22
.39 12
.72 -
- 5.
37 6.
07Pr
ofit/
(Loss)
befor
e tax
ation
2.53
(34.6
3) 8.
21 0.
04 (9
.16)
(0.08
) 0.
04 (2
.32)
4.63
(4.59
) (0
.14)
(75.5
3) **
** 3.
38 (3
.01)
Prov
ision
for t
axati
on 5.
81 (2
1.75)
2.16
0.01
- -
- (1
.48)
1.61
- -
- -
- 0.
34 -
Profi
t/ (Lo
ss) aft
er ta
xatio
n (3
.28)
(12.8
8) 6.
04 0.
04 (9
.16)
(0.08
) 0.
04 (0
.84)
3.02
(4.59
) (0
.14)
(75.5
3) **
** 3.
04 (3
.01)
Othe
r Com
preh
ensiv
e Inc
ome
- -
- -
- -
- -
0.06
- -
- -
- -
-Pr
opos
ed di
viden
d -
- -
- -
- -
- -
--
- -
- -
-%
of sh
areho
lding
100.0
010
010
010
010
010
010
010
010
010
010
010
010
010
010
010
0
* For
the
purp
oses
of t
he C
onso
lidat
ed F
inan
cial
Sta
tem
ents
incl
uded
in th
is an
nual
repo
rt, t
he a
ccou
nts
of th
e Co
mpa
ny h
ave
been
rolle
d fo
rwar
d to
Mar
ch 3
1, 2
018.
The
det
ails
prov
ided
he
rein
, how
ever
, are
bas
ed o
n th
e st
atut
ory
finan
cial
yea
r.**
Amou
nts a
re b
elow
the
roun
ding
off
norm
ado
pted
by
the
Com
pany
.1.
N
ame
of th
e su
bsid
iarie
s whi
ch a
re y
et to
com
men
ce o
pera
tions
-
a)
Pira
mal
Criti
cal C
are
B.V.
- Det
ails
are
not p
rovi
ded
as fi
rst a
ccou
nting
per
iod,
pos
t inc
orpo
ratio
n, sh
all e
nd o
n 31
Dec
embe
r 201
8.
b)
Pira
mal
Criti
cal C
are
Pty.
Ltd.
- Det
ails
are
not p
rovi
ded
as fi
rst a
ccou
nting
per
iod,
pos
t inc
orpo
ratio
n, sh
all e
nd o
n 31
Dec
embe
r 201
8.2.
N
ame
of th
e su
bsid
iarie
s whi
ch h
ave
been
liqu
idat
ed o
r sol
d or
cea
sed
to b
e su
bsid
iary
dur
ing
the
year
-
a) In
dia
Resu
rgen
ce A
RC P
rivat
e Li
mite
d (fo
rmer
ly k
now
n as
Pira
mal
Ass
ets R
econ
stru
ction
Priv
ate
Lim
ited)
b)
Indi
a Re
surg
ence
Ass
et M
anag
emen
t Bus
ines
s Priv
ate
Lim
ited
(form
erly
kno
wn
as P
EL A
sset
Res
urge
nce
Advi
sory
Priv
ate
Lim
ited)
c)
Pira
mal
Udg
am D
ata
Man
agem
ent S
oluti
ons
d)
Pira
mal
Fou
ndati
on fo
r Edu
catio
n Le
ader
ship
e)
Pira
mal
Fou
ndati
on (f
orm
erly
kno
wn
as P
iram
al H
ealth
care
Fou
ndati
on)
3.
Follo
win
g su
bsid
iarie
s hav
e be
en a
cqui
red
durin
g th
e ye
ar-
a)
Con
text
Matt
ers,
Inc.
(w.e
.f. A
ugus
t 16,
201
7)
b) P
iram
al C
ritica
l Car
e B.
V. (w
.e.f.
from
Nov
embe
r 22,
201
7)
c) P
iram
al C
ritica
l Car
e Pt
y. Lt
d (w
.e.f.
from
Dec
embe
r 4, 2
017)
d)
Sha
rp In
sight
Lim
ited
(w.e
.f. A
pril
6, 2
017)
4.
Pira
mal
Fin
ance
Lim
ited
(PFL
) and
Pira
mal
Cap
ital L
imite
d (P
CL),
both
who
lly o
wne
d su
bsid
iarie
s of t
he C
ompa
ny, m
erge
d w
ith a
n ap
poin
ted
date
of M
arch
31,
201
8 w
ith P
iram
al H
ousin
g Fi
nanc
e Li
mite
d (P
HFL)
, a st
ep d
own
who
lly o
wne
d su
bsid
iary
of t
he C
ompa
ny, t
hrou
gh a
sche
me
of M
erge
r by
Abso
rptio
n ap
prov
ed b
y th
e N
ation
al C
ompa
ny La
w Tr
ibun
al o
n Ap
ril 6
, 201
8 an
d fil
ed w
ith th
e Re
gist
rar o
f Com
pani
es o
n M
ay 2
3, 2
018,
the
effec
tive
date
.
FORM
AO
C-1
(Pur
suan
t to
first
pro
viso
to su
b-se
ction
(3) o
f sec
tion
129
read
with
rule
5 o
f the
Com
pani
es (A
ccou
nts)
Rul
es, 2
014
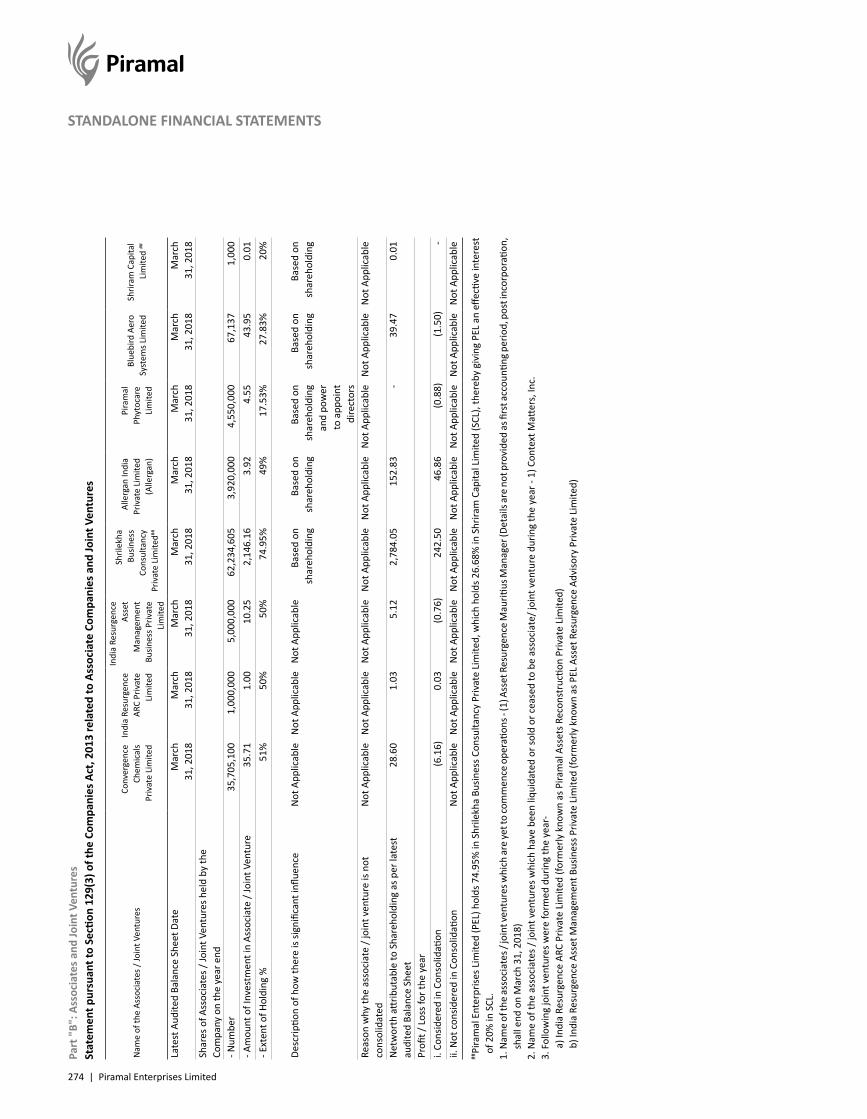
274 | Piramal Enterprises Limited
STANDALONE FINANCIAL STATEMENTS
Part
"B"
: Ass
ocia
tes a
nd Jo
int V
entu
res
Stat
emen
t pur
suan
t to
Secti
on 1
29(3
) of t
he C
ompa
nies
Act
, 201
3 re
late
d to
Ass
ocia
te C
ompa
nies
and
Join
t Ven
ture
s
Nam
e of
the
Asso
ciat
es /
Join
t Ven
ture
sCo
nver
genc
e Ch
emic
als
Priv
ate
Lim
ited
Indi
a Re
surg
ence
AR
C Pr
ivat
e Li
mite
d
Indi
a Re
surg
ence
As
set
Man
agem
ent
Busin
ess P
rivat
e Li
mite
d
Shril
ekha
Bu
sines
s Co
nsul
tanc
y Pr
ivat
e Li
mite
d##
Alle
rgan
Indi
a Pr
ivat
e Li
mite
d (A
llerg
an)
Pira
mal
Ph
ytoc
are
Lim
ited
Blue
bird
Aer
o Sy
stem
s Lim
ited
Shrir
am C
apita
l Li
mite
d ##
Late
st A
udite
d Ba
lanc
e Sh
eet D
ate
Mar
ch
31, 2
018
Mar
ch
31, 2
018
Mar
ch
31, 2
018
Mar
ch
31, 2
018
Mar
ch
31, 2
018
Mar
ch
31, 2
018
Mar
ch
31, 2
018
Mar
ch
31, 2
018
Shar
es o
f Ass
ocia
tes /
Join
t Ven
ture
s hel
d by
the
Com
pany
on
the
year
end
- Num
ber
35,
705,
100
1,0
00,0
00 5
,000
,000
62,
234,
605
3,9
20,0
00 4
,550
,000
67,
137
1,0
00- A
mou
nt o
f Inv
estm
ent i
n As
soci
ate
/ Joi
nt V
entu
re 3
5.71
1.0
0 1
0.25
2,1
46.1
6 3
.92
4.5
5 4
3.95
0.0
1- E
xten
t of H
oldi
ng %
51%
50%
50%
74.9
5%49
%17
.53%
27.8
3%20
%
Desc
riptio
n of
how
ther
e is
signi
fican
t infl
uenc
eN
ot A
pplic
able
Not
App
licab
leN
ot A
pplic
able
Base
d on
sh
areh
oldi
ngBa
sed
on
shar
ehol
ding
Base
d on
sh
areh
oldi
ng
and
pow
er
to a
ppoi
nt
dire
ctor
s
Base
d on
sh
areh
oldi
ngBa
sed
on
shar
ehol
ding
Reas
on w
hy th
e as
soci
ate
/ joi
nt v
entu
re is
not
co
nsol
idat
edN
ot A
pplic
able
Not
App
licab
leN
ot A
pplic
able
Not
App
licab
leN
ot A
pplic
able
Not
App
licab
leN
ot A
pplic
able
Not
App
licab
le
Net
wor
th a
ttrib
utab
le to
Sha
reho
ldin
g as
per
late
st
audi
ted
Bala
nce
Shee
t 2
8.60
1.0
3 5
.12
2,7
84.0
5 1
52.8
3 -
39.
47 0
.01
Profi
t / L
oss f
or th
e ye
ari.
Cons
ider
ed in
Con
solid
ation
(6.1
6) 0
.03
(0.7
6) 2
42.5
0 4
6.86
(0.8
8) (1
.50)
-ii.
Not
con
sider
ed in
Con
solid
ation
Not
App
licab
leN
ot A
pplic
able
Not
App
licab
leN
ot A
pplic
able
Not
App
licab
leN
ot A
pplic
able
Not
App
licab
leN
ot A
pplic
able
## Pi
ram
al E
nter
prise
s Lim
ited
(PEL
) hol
ds 7
4.95
% in
Shr
ilekh
a Bu
sines
s Con
sulta
ncy
Priv
ate
Lim
ited,
whi
ch h
olds
26.
68%
in S
hrira
m C
apita
l Lim
ited
(SCL
), th
ereb
y gi
ving
PEL
an
effec
tive
inte
rest
of
20%
in S
CL.
1. N
ame
of th
e as
soci
ates
/ jo
int v
entu
res w
hich
are
yet t
o co
mm
ence
ope
ratio
ns - (
1) A
sset
Res
urge
nce
Mau
ritius
Man
ager
(Det
ails
are
not p
rovi
ded
as fi
rst a
ccou
nting
per
iod,
pos
t inc
orpo
ratio
n,
shal
l end
on
Mar
ch 3
1, 2
018)
2. N
ame
of th
e as
soci
ates
/ jo
int v
entu
res w
hich
hav
e be
en li
quid
ated
or s
old
or c
ease
d to
be
asso
ciat
e/ jo
int v
entu
re d
urin
g th
e ye
ar -
1) C
onte
xt M
atter
s, In
c.3.
Fol
low
ing
join
t ven
ture
s wer
e fo
rmed
dur
ing
the
year
-a)
Indi
a Re
surg
ence
ARC
Priv
ate
Lim
ited
(form
erly
kno
wn
as P
iram
al A
sset
s Rec
onst
ructi
on P
rivat
e Li
mite
d)b)
Indi
a Re
surg
ence
Ass
et M
anag
emen
t Bus
ines
s Priv
ate
Lim
ited
(form
erly
kno
wn
as P
EL A
sset
Res
urge
nce
Advi
sory
Priv
ate
Lim
ited)
Annual Report 2017-18 | 275
Managem
ent Discussion & Analysis
Strategic Overview
Board &
Managem
ent ProfilesStatutory Reports
Financial Statements
INDEPENDENT AUDITOR’S REPORT
TO THE MEMBERS OF PIRAMAL ENTERPRISES LIMITED
Report on the Consolidated Ind AS Financial StatementsWe have audited the accompanying consolidated Ind AS financial statements of Piramal Enterprises Limited (hereinafter referred to as 'the Company') and its subsidiaries (the Company and its subsidiaries together referred to as 'the Group'), which includes Group’s share of profit/loss in its associates and its joint ventures, comprising the Consolidated Balance Sheet as at March 31, 2018, the Consolidated Statement of Profit and Loss (including other comprehensive income), the Consolidated Cash Flow Statement, the Consolidated Statement of Changes in Equity, for the year then ended, and a summary of the significant accounting policies and other explanatory information (hereinafter referred to as 'the consolidated Ind AS financial statements').
Management's Responsibility for the Consolidated Ind AS Financial StatementsThe Company's Board of Directors is responsible for the preparation of these consolidated Ind AS financial statements in terms of the requirements of the Companies Act, 2013 (hereinafter referred to as 'the Act') that give a true and fair view of the consolidated financial position, consolidated financial performance including other comprehensive income, consolidated cash flows and consolidated statement of changes in equity of the Group including its Associates and Joint ventures in accordance with the Indian Accounting Standards (Ind AS) prescribed under Section 133 of the Act read with the Companies (Indian Accounting Standards) Rules, 2015, as amended, and other accounting principles generally accepted in India. The respective Board of Directors of the companies included in the Group and of its associates and joint ventures are responsible for maintenance of adequate accounting records in accordance with the provisions of the Act for safeguarding the assets of the Group, its associates and its joint ventures and for preventing and detecting frauds and other irregularities; the selection and application of appropriate accounting policies; making judgements and estimates that are reasonable and prudent; and the design, implementation and maintenance of adequate internal financial controls, that were operating effectively for ensuring the accuracy and completeness of the accounting records, relevant to the preparation and presentation of the consolidated Ind AS financial statements that give a true and fair view and are free from material misstatement, whether due to fraud or error, which have been used for the purpose of preparation of the consolidated Ind AS financial statements by the Directors of the Company, as aforesaid.
Auditor's ResponsibilityOur responsibility is to express an opinion on these consolidated Ind AS financial statements based on our audit. In conducting our audit, we have taken into account the provisions of the Act, the accounting and auditing standards and matters which are required to be included in the audit report under the provisions of the Act and the Rules made thereunder.
We conducted our audit in accordance with the Standards on Auditing specified under Section 143(10) of the Act. Those Standards require that we comply with ethical requirements and plan and perform the audit to obtain reasonable assurance about whether the consolidated Ind AS financial statements are free from material misstatement.
An audit involves performing procedures to obtain audit evidence about the amounts and the disclosures in the consolidated Ind AS financial statements. The procedures selected depend on the auditor's judgement, including the assessment of the risks of material misstatement of the consolidated Ind AS financial statements, whether due to fraud or error. In making those risk assessments, the auditor considers internal financial control relevant to the Company's preparation of the consolidated Ind AS financial statements that give a true and fair view in order to design audit procedures that are appropriate in the circumstances. An audit also includes evaluating the appropriateness of the accounting policies used and the reasonableness of the accounting estimates made by the Company's Board of Directors, as well as evaluating the overall presentation of the consolidated Ind AS financial statements.
We believe that the audit evidence obtained by us and the audit evidence obtained by the other auditors in terms of their reports referred to in sub-paragraph (a) of the Other Matters paragraph below, is sufficient and appropriate to provide a basis for our audit opinion on the consolidated Ind AS financial statements.
OpinionIn our opinion and to the best of our information and according to the explanations given to us and based on the consideration of reports of the other auditors on separate financial statements/ financial information of the subsidiaries, associates and joint ventures referred to below in the Other Matters paragraph, the aforesaid consolidated Ind AS financial statements give the information required by the Act in the manner so required and give a true and fair view in conformity with the Ind AS and other accounting principles generally accepted in India, of the consolidated state of affairs of the Group as at
276 | Piramal Enterprises Limited
CONSOLIDATED FINANCIAL STATEMENTS
INDEPENDENT AUDITOR’S REPORT
March 31, 2018, and their consolidated profit, consolidated total comprehensive income, their consolidated cash flows and consolidated statement of changes in equity for the year ended on that date.
Other Matters(a) We did not audit the financial statements/financial information of 29 subsidiaries, whose financial statements/financial information reflect total
assets of ` 47,110.80 Crores at March 31, 2018, total revenues of ` 7,384.96 Crores and net cash inflows amounting to ` 406.50 Crores for the year ended on that date, as considered in the consolidated Ind AS financial statements. The consolidated Ind AS financial statements also include the Group's share of net profit of ` 235.46 Crores for the year ended March 31, 2018, as considered in the consolidated Ind AS financial statements, in respect of 2 associates and 3 joint ventures, whose financial statements/financial information have not been audited by us. These financial statements/financial information have been audited by other auditors whose reports have been furnished to us by the Management and our opinion on the consolidated Ind AS financial statements, in so far as it relates to the amounts and disclosures included in respect of these subsidiaries, joint ventures and associates, and our report in terms of sub-section (3) of Section 143 of the Act, in so far as it relates to the aforesaid subsidiaries, joint ventures and associate is based solely on the reports of the other auditors.
(b) We did not audit the financial statements/financial information of 23 subsidiaries, whose financial statements/financial information reflect total assets of ` 5,275.89 Crores as at March 31, 2018, total revenues of ` 512.53 Crores and net cash inflows amounting to ` 77.60 Crores for the year ended on that date, as considered in the consolidated Ind AS financial statements. The consolidated Ind AS financial statements also include the Group's share of net profit of ` 46.13 Crores for the year ended March 31, 2018, as considered in the consolidated Ind AS financial statements, in respect of 2 associates and 2 joint ventures, whose financial statements/financial information have not been audited by us. These financial statements/financial information are unaudited and have been furnished to us by the Management and our opinion on the consolidated Ind AS financial statements, in so far as it relates to the amounts and disclosures included in respect of these subsidiaries, joint ventures and associates, is based solely on such unaudited financial statements/financial information. In our opinion and according to the information and explanations given to us by the Management, these financial statements/financial information are not material to the Group.
Our opinion on the consolidated Ind AS financial statements above and our report on Other Legal and Regulatory Requirements below, is not modified in respect of the above matters with respect to our reliance on the work done and the reports of the other auditors and the financial statements/financial information certified by the Management.
Report on Other Legal and Regulatory RequirementsAs required by Section 143(3) of the Act, based on our audit and on the consideration of the report of the other auditors on separate financial statements and the other financial information of subsidiaries, associates and joint venture companies incorporated in India, referred in the Other Matters paragraph above we report, to the extent applicable, that:
(a) We have sought and obtained all the information and explanations which to the best of our knowledge and belief were necessary for the purposes of our audit of the aforesaid consolidated Ind AS financial statements.
(b) In our opinion, proper books of account as required by law relating to preparation of the aforesaid consolidated Ind AS financial statements have been kept so far as it appears from our examination of those books, returns and the reports of the other auditors.
(c) The Consolidated Balance Sheet, the Consolidated Statement of Profit and Loss (including Other Comprehensive Income), the Consolidated Cash Flow Statement and Consolidated Statement of Changes in Equity dealt with by this Report are in agreement with the relevant books of account maintained for the purpose of preparation of the consolidated Ind AS financial statements.
(d) In our opinion, the aforesaid consolidated Ind AS financial statements comply with the Indian Accounting Standards prescribed under Section 133 of the Act.
(e) On the basis of the written representations received from the directors of the Company as on March 31, 2018 taken on record by the Board of Directors of the Company and the reports of the statutory auditors of its subsidiary companies, associate companies and joint venture companies incorporated in India, none of the directors of the Group companies, its associate companies and joint venture companies incorporated in India is disqualified as on March 31, 2018 from being appointed as a director in terms of Section 164 (2) of the Act.
Annual Report 2017-18 | 277
Managem
ent Discussion & Analysis
Strategic Overview
Board &
Managem
ent ProfilesStatutory Reports
Financial Statements
(f) With respect to the adequacy of the internal financial controls over financial reporting and the operating effectiveness of such controls, refer to our separate Report in 'Annexure A', which is based on the auditors’ reports of the Company, subsidiary companies, associate companies and jointly controlled companies incorporated in India to whom internal financial controls over financial reporting is applicable. Our report expresses an unmodified opinion on the adequacy and operating effectiveness of internal financial controls over financial reporting of those companies, for the reasons stated therein.
(g) With respect to the other matters to be included in the Auditor's Report in accordance with Rule 11 of the Companies (Audit and Auditor's) Rules, 2014, as amended, in our opinion and to the best of our information and according to the explanations given to us:
i. The consolidated Ind AS financial statements disclose the impact of pending litigations on the consolidated financial position of the Group, its associates and joint ventures.
ii. Provision has been made in the consolidated Ind AS financial statements, as required under the applicable law or accounting standards, for material foreseeable losses, if any, on long-term contracts including derivative contracts.
iii. There has been no delay in transferring amounts required to be transferred, to the Investor Education and Protection Fund by the Company and its subsidiary companies, associate companies and joint venture companies incorporated in India, except for delays upto 56 days in respect of transfer of 534,012 equity shares, in terms of Investor Education and Protection Fund Authority (Accounting, Audit, Transfer and Refund) Rules, 2016 as amended from time to time, to the Investor Education and Protection Fund by the Company.
For Deloitte Haskins & Sells LLP
Chartered Accountants(Firm's Registration No. 117366W/W-100018)
Rupen K. Bhatt
PartnerMumbai, May 28, 2018 (Membership No. 046930)
INDEPENDENT AUDITOR’S REPORT
278 | Piramal Enterprises Limited
CONSOLIDATED FINANCIAL STATEMENTS
INDEPENDENT AUDITOR’S REPORT
ANNEXURE 'A' TO THE INDEPENDENT AUDITOR’S REPORT(Referred to in paragraph (f) under ‘Report on Other Legal and Regulatory Requirements’ section of our report of even date)
Report on the Internal Financial Controls Over Financial Reporting under Clause (i) Of Sub-section 3 of Section 143 of the Companies Act, 2013 ("the Act")In conjunction with our audit of the consolidated Ind AS financial statements of the Company as of and for the year ended March 31, 2018, we have audited the internal financial controls over financial reporting of Piramal Enterprises Limited (hereinafter referred to as 'the Company') and its subsidiary companies, its associate companies and joint ventures, which are companies incorporated in India, as of that date.
Management’s Responsibility for Internal Financial ControlsThe respective Board of Directors of the Company, its subsidiary companies, its associate companies and joint ventures, which are companies incorporated in India, are responsible for establishing and maintaining internal financial controls based on the internal control over financial reporting criteria established by the respective Companies considering the essential components of internal control stated in the Guidance Note on Audit of Internal Financial Controls Over Financial Reporting issued by the Institute of Chartered Accountants of India (ICAI). These responsibilities include the design, implementation and maintenance of adequate internal financial controls that were operating effectively for ensuring the orderly and efficient conduct of its business, including adherence to the respective company’s policies, the safeguarding of its assets, the prevention and detection of frauds and errors, the accuracy and completeness of the accounting records, and the timely preparation of reliable financial information, as required under the Companies Act, 2013.
Auditor’s ResponsibilityOur responsibility is to express an opinion on the internal financial controls over financial reporting of the Company, its subsidiary companies, its associate companies and its joint ventures, which are companies incorporated in India, based on our audit. We conducted our audit in accordance with the Guidance Note on Audit of Internal Financial Controls Over Financial Reporting (the 'Guidance Note') issued by the Institute of Chartered Accountants of India and the Standards on Auditing, prescribed under Section 143(10) of the Companies Act, 2013, to the extent applicable to an audit of internal financial controls. Those Standards and the Guidance Note require that we comply with ethical requirements and plan and perform the audit to obtain reasonable assurance about whether adequate internal financial controls over financial reporting was established and maintained and if such controls operated effectively in all material respects.
Our audit involves performing procedures to obtain audit evidence about the adequacy of the internal financial controls system over financial reporting and their operating effectiveness. Our audit of internal financial controls over financial reporting included obtaining an understanding of internal financial controls over financial reporting, assessing the risk that a material weakness exists, and testing and evaluating the design and operating effectiveness of internal control based on the assessed risk. The procedures selected depend on the auditor’s judgement, including the assessment of the risks of material misstatement of the financial statements, whether due to fraud or error.
We believe that the audit evidence we have obtained and the audit evidence obtained by other auditors of the subsidiary companies, associate companies and joint ventures, which are companies incorporated in India, in terms of their reports referred to in the Other Matters paragraph below, is sufficient and appropriate to provide a basis for our audit opinion on the internal financial controls system over financial reporting of the Company, its subsidiary companies, its associate companies and its joint ventures, which are companies incorporated in India.
Meaning of Internal Financial Controls Over Financial ReportingA company's internal financial control over financial reporting is a process designed to provide reasonable assurance regarding the reliability of financial reporting and the preparation of financial statements for external purposes in accordance with generally accepted accounting principles. A company's internal financial control over financial reporting includes those policies and procedures that (1) pertain to the maintenance of records that, in reasonable detail, accurately and fairly reflect the transactions and dispositions of the assets of the Company; (2) provide reasonable assurance that transactions are recorded as necessary to permit preparation of financial statements in accordance with generally accepted accounting principles, and that receipts and expenditures of the Company are being made only in accordance with authorisations of management and directors of the company; and (3) provide reasonable assurance regarding prevention or timely detection of unauthorised acquisition, use, or disposition of the company's assets that could have a material effect on the financial statements.
Annual Report 2017-18 | 279
Managem
ent Discussion & Analysis
Strategic Overview
Board &
Managem
ent ProfilesStatutory Reports
Financial Statements
Inherent Limitations of Internal Financial Controls Over Financial ReportingBecause of the inherent limitations of internal financial controls over financial reporting, including the possibility of collusion or improper management override of controls, material misstatements due to error or fraud may occur and not be detected. Also, projections of any evaluation of the internal financial controls over financial reporting to future periods are subject to the risk that the internal financial control over financial reporting may become inadequate because of changes in conditions, or that the degree of compliance with the policies or procedures may deteriorate.
OpinionIn our opinion to the best of our information and according to the explanations given to us and based on the consideration of the reports of the other auditors referred to in the Other Matters paragraph below, the Company, its subsidiary companies, its associate companies and joint ventures, which are companies incorporated in India, have, in all material respects, an adequate internal financial controls system over financial reporting and such internal financial controls over financial reporting were operating effectively as at March 31, 2018, based on the criteria for internal financial control over financial reporting established by the respective companies considering the essential components of internal control stated in the Guidance Note on Audit of Internal Financial Controls Over Financial Reporting issued by the Institute of Chartered Accountants of India.
Other MattersOur aforesaid report under Section 143(3)(i) of the Act on the adequacy and operating effectiveness of the internal financial controls over financial reporting insofar as it relates to 4 subsidiary companies, 3 associate companies and 2 joint ventures, which are companies incorporated in India, is based solely on the corresponding reports of the auditors of such companies incorporated in India.
Our opinion is not modified in respect of the above matters.
For Deloitte Haskins & Sells LLP
Chartered Accountants(Firm's Registration No. 117366W/W-100018)
Rupen K. Bhatt
PartnerMumbai, May 28, 2018 (Membership No. 046930)
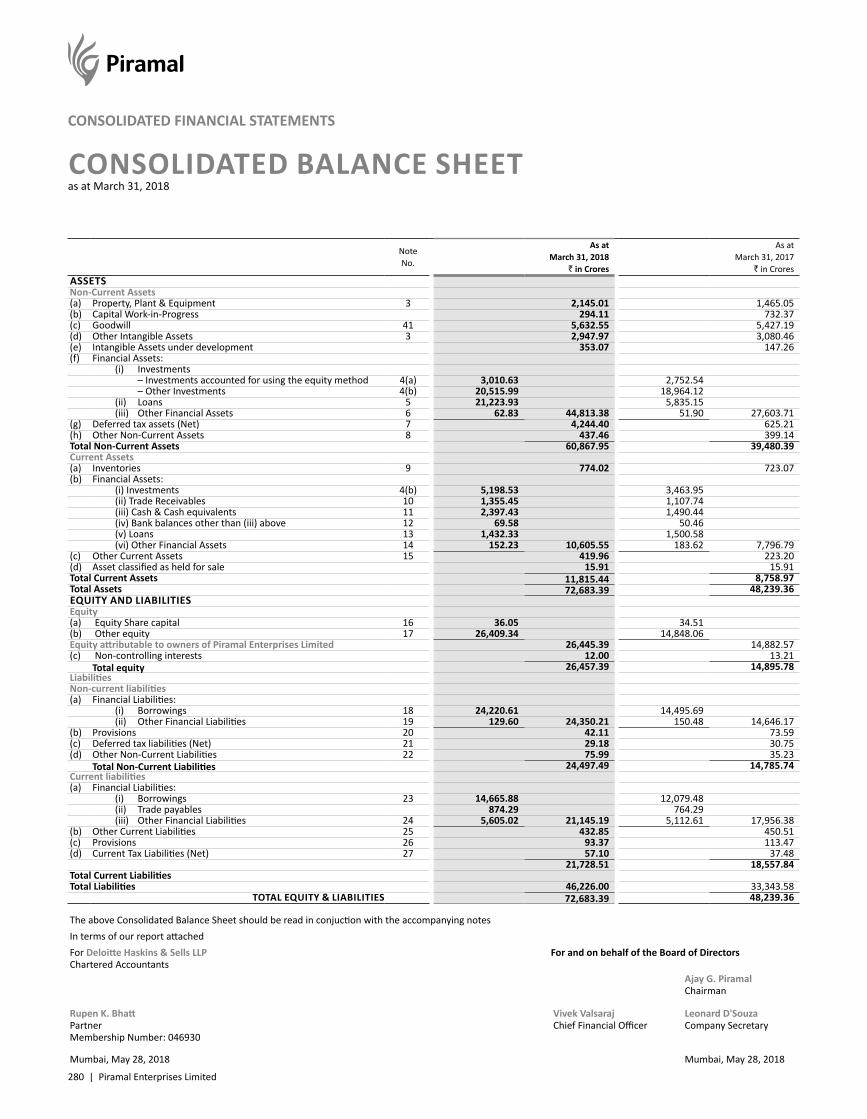
280 | Piramal Enterprises Limited
CONSOLIDATED FINANCIAL STATEMENTS
The above Consolidated Balance Sheet should be read in conjuction with the accompanying notesIn terms of our report attachedFor Deloitte Haskins & Sells LLPChartered Accountants
For and on behalf of the Board of Directors
Ajay G. PiramalChairman
Rupen K. BhattPartnerMembership Number: 046930
Vivek Valsaraj Chief Financial Officer
Leonard D'SouzaCompany Secretary
Mumbai, May 28, 2018 Mumbai, May 28, 2018
CONSOLIDATED BALANCE SHEETas at March 31, 2018
Note No.
As at March 31, 2018
` in Crores
As at March 31, 2017
` in CroresASSETSNon-Current Assets(a) Property, Plant & Equipment 3 2,145.01 1,465.05(b) Capital Work-in-Progress 294.11 732.37(c) Goodwill 41 5,632.55 5,427.19(d) Other Intangible Assets 3 2,947.97 3,080.46(e) Intangible Assets under development 353.07 147.26(f) Financial Assets:
(i) Investments – Investments accounted for using the equity method 4(a) 3,010.63 2,752.54 – Other Investments 4(b) 20,515.99 18,964.12 (ii) Loans 5 21,223.93 5,835.15 (iii) Other Financial Assets 6 62.83 44,813.38 51.90 27,603.71
(g) Deferred tax assets (Net) 7 4,244.40 625.21(h) Other Non-Current Assets 8 437.46 399.14Total Non-Current Assets 60,867.95 39,480.39Current Assets(a) Inventories 9 774.02 723.07(b) Financial Assets:
(i) Investments 4(b) 5,198.53 3,463.95 (ii) Trade Receivables 10 1,355.45 1,107.74 (iii) Cash & Cash equivalents 11 2,397.43 1,490.44 (iv) Bank balances other than (iii) above 12 69.58 50.46 (v) Loans 13 1,432.33 1,500.58 (vi) Other Financial Assets 14 152.23 10,605.55 183.62 7,796.79
(c) Other Current Assets 15 419.96 223.20(d) Asset classified as held for sale 15.91 15.91Total Current Assets 11,815.44 8,758.97Total Assets 72,683.39 48,239.36EQUITY AND LIABILITIESEquity(a) Equity Share capital 16 36.05 34.51(b) Other equity 17 26,409.34 14,848.06Equity attributable to owners of Piramal Enterprises Limited 26,445.39 14,882.57(c) Non-controlling interests 12.00 13.21
Total equity 26,457.39 14,895.78LiabilitiesNon-current liabilities(a) Financial Liabilities:
(i) Borrowings 18 24,220.61 14,495.69 (ii) Other Financial Liabilities 19 129.60 24,350.21 150.48 14,646.17
(b) Provisions 20 42.11 73.59(c) Deferred tax liabilities (Net) 21 29.18 30.75(d) Other Non-Current Liabilities 22 75.99 35.23
Total Non-Current Liabilities 24,497.49 14,785.74Current liabilities(a) Financial Liabilities:
(i) Borrowings 23 14,665.88 12,079.48 (ii) Trade payables 874.29 764.29 (iii) Other Financial Liabilities 24 5,605.02 21,145.19 5,112.61 17,956.38
(b) Other Current Liabilities 25 432.85 450.51(c) Provisions 26 93.37 113.47(d) Current Tax Liabilities (Net) 27 57.10 37.48
21,728.51 18,557.84Total Current LiabilitiesTotal Liabilities 46,226.00 33,343.58
TOTAL EQUITY & LIABILITIES 72,683.39 48,239.36
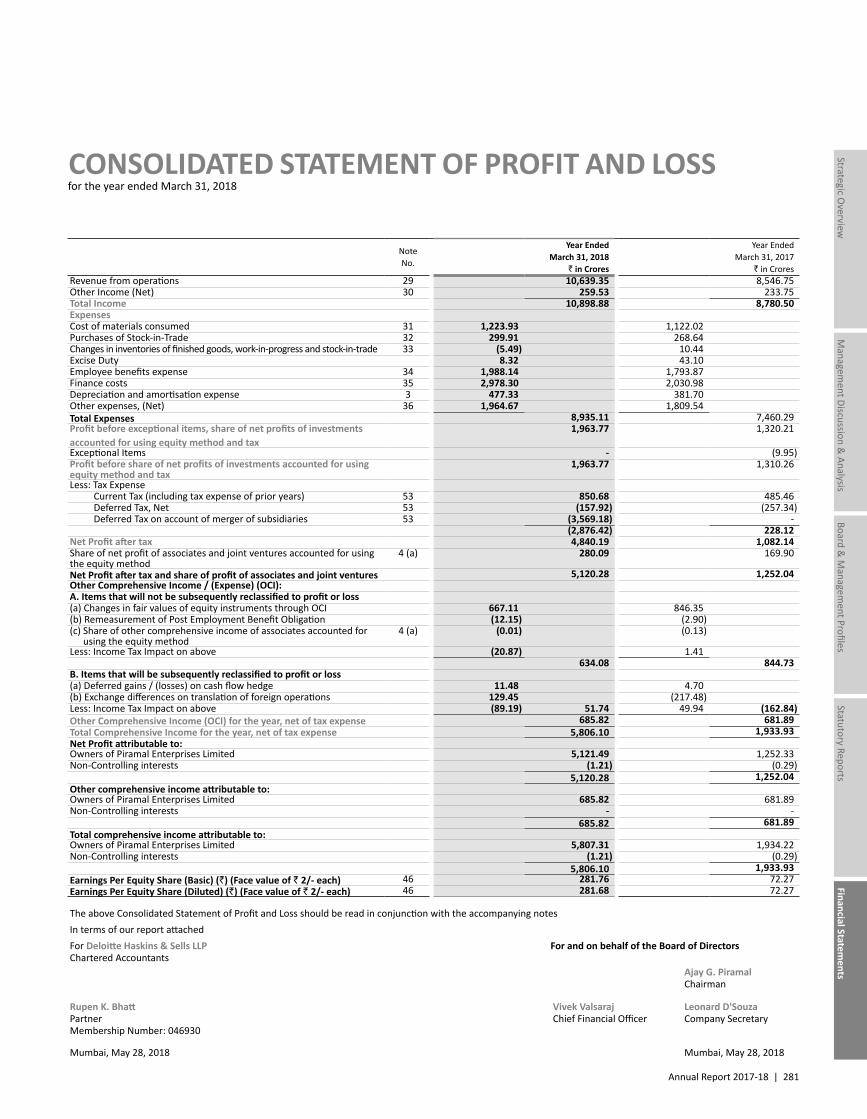
Annual Report 2017-18 | 281
Managem
ent Discussion & Analysis
Strategic Overview
Board &
Managem
ent ProfilesStatutory Reports
Financial Statements
CONSOLIDATED STATEMENT OF PROFIT AND LOSSfor the year ended March 31, 2018
NoteNo.
Year Ended March 31, 2018
` in Crores
Year Ended March 31, 2017
` in CroresRevenue from operations 29 10,639.35 8,546.75Other Income (Net) 30 259.53 233.75Total Income 10,898.88 8,780.50ExpensesCost of materials consumed 31 1,223.93 1,122.02Purchases of Stock-in-Trade 32 299.91 268.64Changes in inventories of finished goods, work-in-progress and stock-in-trade 33 (5.49) 10.44Excise Duty 8.32 43.10Employee benefits expense 34 1,988.14 1,793.87Finance costs 35 2,978.30 2,030.98Depreciation and amortisation expense 3 477.33 381.70Other expenses, (Net) 36 1,964.67 1,809.54Total Expenses 8,935.11 7,460.29Profit before exceptional items, share of net profits of investments accounted for using equity method and tax
1,963.77 1,320.21
Exceptional Items - (9.95)Profit before share of net profits of investments accounted for using equity method and tax
1,963.77 1,310.26
Less: Tax Expense Current Tax (including tax expense of prior years) 53 850.68 485.46 Deferred Tax, Net 53 (157.92) (257.34) Deferred Tax on account of merger of subsidiaries 53 (3,569.18) -
(2,876.42) 228.12Net Profit after tax 4,840.19 1,082.14Share of net profit of associates and joint ventures accounted for using the equity method
4 (a) 280.09 169.90
Net Profit after tax and share of profit of associates and joint ventures 5,120.28 1,252.04Other Comprehensive Income / (Expense) (OCI):A. Items that will not be subsequently reclassified to profit or loss(a) Changes in fair values of equity instruments through OCI 667.11 846.35(b) Remeasurement of Post Employment Benefit Obligation (12.15) (2.90)(c) Share of other comprehensive income of associates accounted for
using the equity method4 (a) (0.01) (0.13)
Less: Income Tax Impact on above (20.87) 1.41 634.08 844.73
B. Items that will be subsequently reclassified to profit or loss(a) Deferred gains / (losses) on cash flow hedge 11.48 4.70(b) Exchange differences on translation of foreign operations 129.45 (217.48)Less: Income Tax Impact on above (89.19) 51.74 49.94 (162.84)Other Comprehensive Income (OCI) for the year, net of tax expense 685.82 681.89Total Comprehensive Income for the year, net of tax expense 5,806.10 1,933.93Net Profit attributable to:Owners of Piramal Enterprises Limited 5,121.49 1,252.33Non-Controlling interests (1.21) (0.29)
5,120.28 1,252.04Other comprehensive income attributable to:Owners of Piramal Enterprises Limited 685.82 681.89Non-Controlling interests - -
685.82 681.89Total comprehensive income attributable to:Owners of Piramal Enterprises Limited 5,807.31 1,934.22Non-Controlling interests (1.21) (0.29)
5,806.10 1,933.93Earnings Per Equity Share (Basic) (`) (Face value of ` 2/- each) 46 281.76 72.27Earnings Per Equity Share (Diluted) (`) (Face value of ` 2/- each) 46 281.68 72.27
The above Consolidated Statement of Profit and Loss should be read in conjunction with the accompanying notesIn terms of our report attachedFor Deloitte Haskins & Sells LLPChartered Accountants
For and on behalf of the Board of Directors
Ajay G. PiramalChairman
Rupen K. BhattPartnerMembership Number: 046930
Vivek Valsaraj Chief Financial Officer
Leonard D'SouzaCompany Secretary
Mumbai, May 28, 2018 Mumbai, May 28, 2018
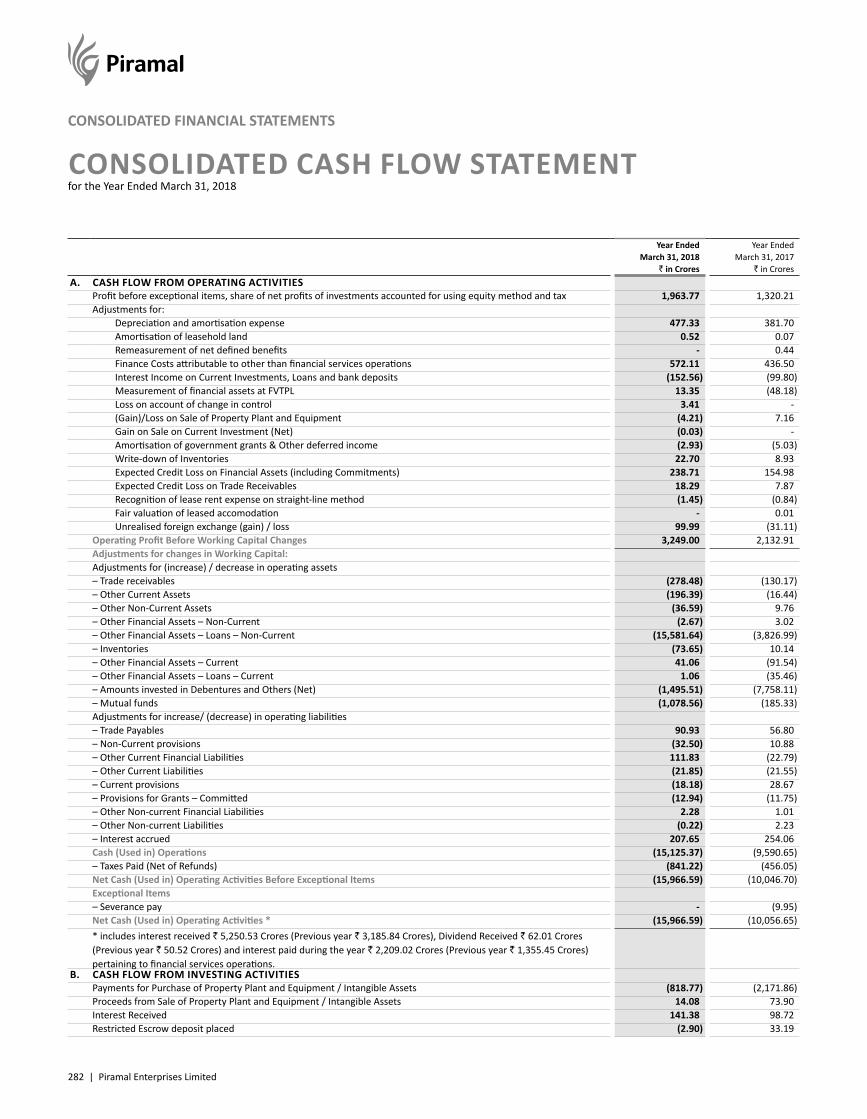
282 | Piramal Enterprises Limited
CONSOLIDATED FINANCIAL STATEMENTS
CONSOLIDATED CASH FLOW STATEMENTfor the Year Ended March 31, 2018
Year Ended March 31, 2018
` in Crores
Year Ended March 31, 2017
` in CroresA. CASH FLOW FROM OPERATING ACTIVITIES
Profit before exceptional items, share of net profits of investments accounted for using equity method and tax 1,963.77 1,320.21Adjustments for: Depreciation and amortisation expense 477.33 381.70 Amortisation of leasehold land 0.52 0.07 Remeasurement of net defined benefits - 0.44 Finance Costs attributable to other than financial services operations 572.11 436.50 Interest Income on Current Investments, Loans and bank deposits (152.56) (99.80) Measurement of financial assets at FVTPL 13.35 (48.18) Loss on account of change in control 3.41 - (Gain)/Loss on Sale of Property Plant and Equipment (4.21) 7.16 Gain on Sale on Current Investment (Net) (0.03) - Amortisation of government grants & Other deferred income (2.93) (5.03) Write-down of Inventories 22.70 8.93 Expected Credit Loss on Financial Assets (including Commitments) 238.71 154.98 Expected Credit Loss on Trade Receivables 18.29 7.87 Recognition of lease rent expense on straight-line method (1.45) (0.84) Fair valuation of leased accomodation - 0.01 Unrealised foreign exchange (gain) / loss 99.99 (31.11)Operating Profit Before Working Capital Changes 3,249.00 2,132.91Adjustments for changes in Working Capital:Adjustments for (increase) / decrease in operating assets– Trade receivables (278.48) (130.17)– Other Current Assets (196.39) (16.44)– Other Non-Current Assets (36.59) 9.76– Other Financial Assets – Non-Current (2.67) 3.02– Other Financial Assets – Loans – Non-Current (15,581.64) (3,826.99)– Inventories (73.65) 10.14– Other Financial Assets – Current 41.06 (91.54)– Other Financial Assets – Loans – Current 1.06 (35.46)– Amounts invested in Debentures and Others (Net) (1,495.51) (7,758.11)– Mutual funds (1,078.56) (185.33)Adjustments for increase/ (decrease) in operating liabilities– Trade Payables 90.93 56.80– Non-Current provisions (32.50) 10.88– Other Current Financial Liabilities 111.83 (22.79)– Other Current Liabilities (21.85) (21.55)– Current provisions (18.18) 28.67– Provisions for Grants – Committed (12.94) (11.75)– Other Non-current Financial Liabilities 2.28 1.01– Other Non-current Liabilities (0.22) 2.23– Interest accrued 207.65 254.06Cash (Used in) Operations (15,125.37) (9,590.65)– Taxes Paid (Net of Refunds) (841.22) (456.05)Net Cash (Used in) Operating Activities Before Exceptional Items (15,966.59) (10,046.70)Exceptional Items– Severance pay - (9.95)Net Cash (Used in) Operating Activities * (15,966.59) (10,056.65)* includes interest received ` 5,250.53 Crores (Previous year ` 3,185.84 Crores), Dividend Received ` 62.01 Crores (Previous year ` 50.52 Crores) and interest paid during the year ` 2,209.02 Crores (Previous year ` 1,355.45 Crores) pertaining to financial services operations.
B. CASH FLOW FROM INVESTING ACTIVITIESPayments for Purchase of Property Plant and Equipment / Intangible Assets (818.77) (2,171.86)Proceeds from Sale of Property Plant and Equipment / Intangible Assets 14.08 73.90Interest Received 141.38 98.72Restricted Escrow deposit placed (2.90) 33.19
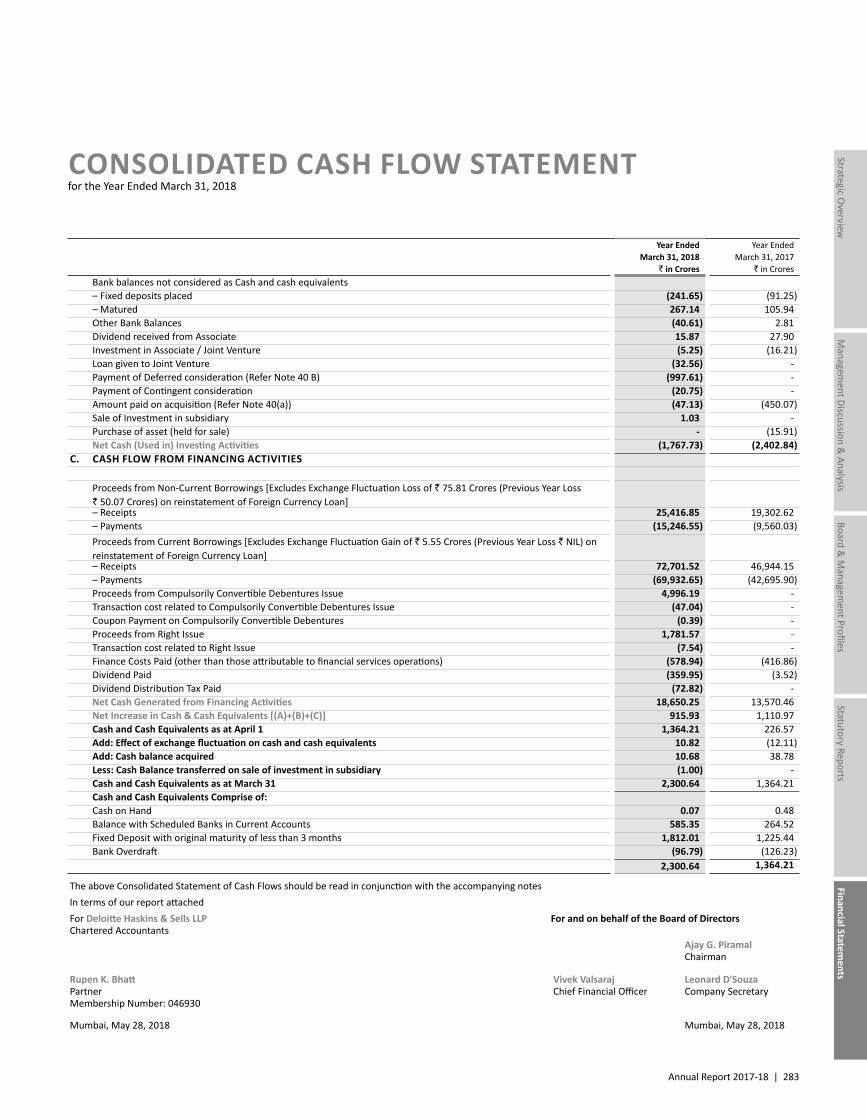
Annual Report 2017-18 | 283
Managem
ent Discussion & Analysis
Strategic Overview
Board &
Managem
ent ProfilesStatutory Reports
Financial Statements
CONSOLIDATED CASH FLOW STATEMENTfor the Year Ended March 31, 2018
Year Ended March 31, 2018
` in Crores
Year Ended March 31, 2017
` in CroresBank balances not considered as Cash and cash equivalents– Fixed deposits placed (241.65) (91.25)– Matured 267.14 105.94Other Bank Balances (40.61) 2.81Dividend received from Associate 15.87 27.90Investment in Associate / Joint Venture (5.25) (16.21)Loan given to Joint Venture (32.56) -Payment of Deferred consideration (Refer Note 40 B) (997.61) -Payment of Contingent consideration (20.75) -Amount paid on acquisition (Refer Note 40(a)) (47.13) (450.07)Sale of Investment in subsidiary 1.03 -Purchase of asset (held for sale) - (15.91)Net Cash (Used in) Investing Activities (1,767.73) (2,402.84)
C. CASH FLOW FROM FINANCING ACTIVITIES
Proceeds from Non-Current Borrowings [Excludes Exchange Fluctuation Loss of ` 75.81 Crores (Previous Year Loss ` 50.07 Crores) on reinstatement of Foreign Currency Loan]– Receipts 25,416.85 19,302.62– Payments (15,246.55) (9,560.03)Proceeds from Current Borrowings [Excludes Exchange Fluctuation Gain of ` 5.55 Crores (Previous Year Loss ` NIL) on reinstatement of Foreign Currency Loan]– Receipts 72,701.52 46,944.15– Payments (69,932.65) (42,695.90)Proceeds from Compulsorily Convertible Debentures Issue 4,996.19 -Transaction cost related to Compulsorily Convertible Debentures Issue (47.04) -Coupon Payment on Compulsorily Convertible Debentures (0.39) -Proceeds from Right Issue 1,781.57 -Transaction cost related to Right Issue (7.54) -Finance Costs Paid (other than those attributable to financial services operations) (578.94) (416.86)Dividend Paid (359.95) (3.52)Dividend Distribution Tax Paid (72.82) -Net Cash Generated from Financing Activities 18,650.25 13,570.46Net Increase in Cash & Cash Equivalents [(A)+(B)+(C)] 915.93 1,110.97Cash and Cash Equivalents as at April 1 1,364.21 226.57Add: Effect of exchange fluctuation on cash and cash equivalents 10.82 (12.11)Add: Cash balance acquired 10.68 38.78Less: Cash Balance transferred on sale of investment in subsidiary (1.00) -Cash and Cash Equivalents as at March 31 2,300.64 1,364.21Cash and Cash Equivalents Comprise of:Cash on Hand 0.07 0.48Balance with Scheduled Banks in Current Accounts 585.35 264.52Fixed Deposit with original maturity of less than 3 months 1,812.01 1,225.44Bank Overdraft (96.79) (126.23)
2,300.64 1,364.21
The above Consolidated Statement of Cash Flows should be read in conjunction with the accompanying notesIn terms of our report attachedFor Deloitte Haskins & Sells LLPChartered Accountants
For and on behalf of the Board of Directors
Ajay G. PiramalChairman
Rupen K. BhattPartnerMembership Number: 046930
Vivek Valsaraj Chief Financial Officer
Leonard D'SouzaCompany Secretary
Mumbai, May 28, 2018 Mumbai, May 28, 2018
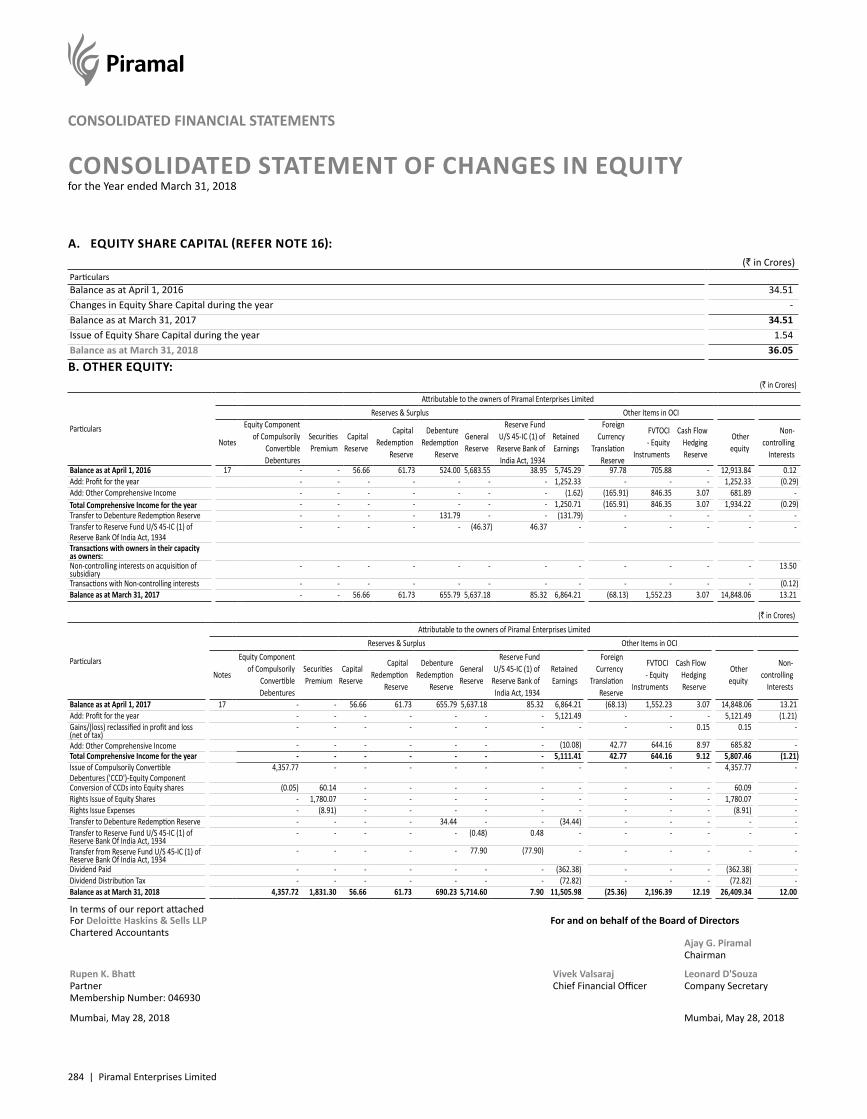
284 | Piramal Enterprises Limited
CONSOLIDATED FINANCIAL STATEMENTS
A. EQUITY SHARE CAPITAL (REFER NOTE 16):(` in Crores)
ParticularsBalance as at April 1, 2016 34.51Changes in Equity Share Capital during the year -Balance as at March 31, 2017 34.51Issue of Equity Share Capital during the year 1.54Balance as at March 31, 2018 36.05
B. OTHER EQUITY:(` in Crores)
Particulars
Attributable to the owners of Piramal Enterprises LimitedReserves & Surplus Other Items in OCI
Notes
Equity Component of Compulsorily
Convertible Debentures
Securities Premium
Capital Reserve
Capital Redemption
Reserve
Debenture Redemption
Reserve
General Reserve
Reserve Fund U/S 45-IC (1) of
Reserve Bank of India Act, 1934
Retained Earnings
Foreign Currency
Translation Reserve
FVTOCI - Equity
Instruments
Cash Flow Hedging Reserve
Other equity
Non-controlling
Interests
Balance as at April 1, 2016 17 - - 56.66 61.73 524.00 5,683.55 38.95 5,745.29 97.78 705.88 - 12,913.84 0.12Add: Profit for the year - - - - - - - 1,252.33 - - - 1,252.33 (0.29)Add: Other Comprehensive Income - - - - - - - (1.62) (165.91) 846.35 3.07 681.89 -Total Comprehensive Income for the year - - - - - - - 1,250.71 (165.91) 846.35 3.07 1,934.22 (0.29)Transfer to Debenture Redemption Reserve - - - - 131.79 - - (131.79) - - - - -Transfer to Reserve Fund U/S 45-IC (1) of Reserve Bank Of India Act, 1934
- - - - - (46.37) 46.37 - - - - - -
Transactions with owners in their capacity as owners:Non-controlling interests on acquisition of subsidiary
- - - - - - - - - - - - 13.50
Transactions with Non-controlling interests - - - - - - - - - - - - (0.12)Balance as at March 31, 2017 - - 56.66 61.73 655.79 5,637.18 85.32 6,864.21 (68.13) 1,552.23 3.07 14,848.06 13.21
(` in Crores)
Particulars
Attributable to the owners of Piramal Enterprises LimitedReserves & Surplus Other Items in OCI
Notes
Equity Component of Compulsorily
Convertible Debentures
Securities Premium
Capital Reserve
Capital Redemption
Reserve
Debenture Redemption
Reserve
General Reserve
Reserve Fund U/S 45-IC (1) of
Reserve Bank of India Act, 1934
Retained Earnings
Foreign Currency
Translation Reserve
FVTOCI - Equity
Instruments
Cash Flow Hedging Reserve
Other equity
Non-controlling
Interests
Balance as at April 1, 2017 17 - - 56.66 61.73 655.79 5,637.18 85.32 6,864.21 (68.13) 1,552.23 3.07 14,848.06 13.21Add: Profit for the year - - - - - - - 5,121.49 - - - 5,121.49 (1.21)Gains/(loss) reclassified in profit and loss (net of tax)
- - - - - - - - - - 0.15 0.15 -
Add: Other Comprehensive Income - - - - - - - (10.08) 42.77 644.16 8.97 685.82 -Total Comprehensive Income for the year - - - - - - - 5,111.41 42.77 644.16 9.12 5,807.46 (1.21)Issue of Compulsorily Convertible Debentures ('CCD')-Equity Component
4,357.77 - - - - - - - - - - 4,357.77 -
Conversion of CCDs into Equity shares (0.05) 60.14 - - - - - - - - - 60.09 -Rights Issue of Equity Shares - 1,780.07 - - - - - - - - - 1,780.07 -Rights Issue Expenses - (8.91) - - - - - - - - - (8.91) -Transfer to Debenture Redemption Reserve - - - - 34.44 - - (34.44) - - - - -Transfer to Reserve Fund U/S 45-IC (1) of Reserve Bank Of India Act, 1934
- - - - - (0.48) 0.48 - - - - - -
Transfer from Reserve Fund U/S 45-IC (1) of Reserve Bank Of India Act, 1934
- - - - - 77.90 (77.90) - - - - - -
Dividend Paid - - - - - - - (362.38) - - - (362.38) -Dividend Distribution Tax - - - - - - - (72.82) - - - (72.82) -Balance as at March 31, 2018 4,357.72 1,831.30 56.66 61.73 690.23 5,714.60 7.90 11,505.98 (25.36) 2,196.39 12.19 26,409.34 12.00
In terms of our report attachedFor Deloitte Haskins & Sells LLPChartered Accountants
For and on behalf of the Board of Directors
Ajay G. PiramalChairman
Rupen K. BhattPartnerMembership Number: 046930
Vivek Valsaraj Chief Financial Officer
Leonard D'SouzaCompany Secretary
Mumbai, May 28, 2018 Mumbai, May 28, 2018
CONSOLIDATED STATEMENT OF CHANGES IN EQUITYfor the Year ended March 31, 2018
Annual Report 2017-18 | 285
Managem
ent Discussion & Analysis
Strategic Overview
Board &
Managem
ent ProfilesStatutory Reports
Financial Statements
1. GENERAL INFORMATION Piramal Enterprises Limited (PEL), (the Company), along with its subsidiaries (collectively referred to as the Group) is one of India’s large diversified
Group, with a presence in Pharmaceuticals, Healthcare Insights and Analytics and Financial Services.
In Pharmaceuticals, through an end-to-end manufacturing capabilities across its manufacturing facilities and a large global distribution network, the Group sells a portfolio of niche differentiated pharmaceutical products and provides an entire pool of pharmaceutical services (including in the areas of injectable, HPAPI etc.). The Group is also strengthening its presence in the Consumer Product segment in India.
Group’s Healthcare Insights and Analytics business, Decision Resources Group, is the premier provider of healthcare analytics, data & insight products and services to the world’s leading pharma, biotech and medical technology companies and enables them to take informed business decisions.
In Financial Services, Group provides comprehensive financing solutions to real estate companies. Corporate Finance Group (CFG) provides senior and mezzanine growth capital to various businesses across varied sectors that are integral part of India’s growth story. The Group has also launched Distressed Asset Investing platform that will invest in equity and/or debt in assets across sectors (other than real estate) to drive restructuring with active participation in turnaround. The Group has recently launched a retail housing finance vertical. The Group also has strategic alliances with top global funds such as APG Asset Management, Bain Capital Credit, CPPIB Credit Investment Inc. and Ivanhoé Cambridge (CDPQ). The Group has long-term equity investments in Shriram Group, a leading financial conglomerate in India.
PEL is listed on the BSE Limited and the National Stock Exchange of India Limited in India.
2A. SIGNIFICANT ACCOUNTING POLICIES i) Basis of preparation Compliance with Ind AS The Consolidated financial statements comply in all material aspects with Indian Accounting Standards (Ind AS) notified under Section 133 of
the Companies Act, 2013 (the Act) [Companies (Indian Accounting Standards) Rules, 2015] and other relevant provisions of the Act.
Effective April 1, 2016, the Company has adopted all the Ind AS standards and the adoption was carried out in accordance with Ind AS 101 'First Time adoption of Indian Accounting Standards', with April 1, 2015 as the transition date. The transition was carried out from the Indian Accounting Principle generally accepted in India as prescribed under Section 133 of the Act read with Rule 7 of the Companies (Accounts) Rules, 2014 (IGAAP), which was the previous GAAP.
Accounting policies have been consistently applied except where a newly issued accounting standard is initially adopted or a revision to the existing accounting standard requires a change in the accounting policy hitherto in use.
Amounts for the year ended and as at March 31, 2017 were audited by previous auditors - Price Waterhouse.
The Separate financial statements are presented in addition to the consolidated financial statements presented by the Group.
Historical Cost convention The Consolidated financial statements have been prepared on the historical cost basis except for the following:
a) certain financial instruments and contingent consideration – measured at fair value b) assets classified as held for sale – measured at fair value less cost to sell c) cash settled stock appreciation rights – measured at fair value d) plan assets of defined benefit plans, which are measured at fair value
ii) Principles of consolidation and equity accounting a) Subsidiaries: Subsidiaries are all entities (including Structured entities) over which the group has control. Control is achieved when the Group has power
over the investee, is exposed, or has rights, to variable returns from its involvement with the investee and has the ability to use its power to affect its returns. Subsidiaries are fully consolidated from the date on which control is transferred to the group. They are deconsolidated from the date that control ceases.
NOTES TO THE CONSOLIDATED FINANCIAL STATEMENTSfor the Year ended March 31, 2018
286 | Piramal Enterprises Limited
NOTES TO THE CONSOLIDATED FINANCIAL STATEMENTS (Contd.)for the Year ended March 31, 2018
CONSOLIDATED FINANCIAL STATEMENTS
The acquisition method of accounting is used to account for business combinations by the group.
The group combines the financial statements of the parent and its subsidiaries line by line adding together like items of assets, liabilities, equity, income and expenses. Inter Company transactions, balances and unrealised gains on transactions between group companies are eliminated. Unrealised losses are also eliminated unless the transaction provides evidence of an impairment of the transferred asset. Accounting policies of subsidiaries have been changed where necessary to ensure consistency with the policies adopted by the group.
Non-controlling interests in the results and equity of subsidiaries are shown separately in the consolidated statement of profit and loss, consolidated statement of changes in equity and balance sheet respectively.
b) Associates: An associate is an entity over which the Group has significant influence. Significant influence is the power to participate in the financial and
operating policy decisions of the investee but is not control or joint control over those policies. Investments in associates are accounted for using the equity method of accounting (see (d) below), after initially being recognised at cost.
c) Joint Arrangements: Under Ind AS 111 Joint Arrangements, investments in joint arrangements are classified as either joint operations or joint ventures. The
classification depends on the contractual rights and obligations of each investor, rather than the legal structure of the joint arrangement. The Group has both joint operations and joint ventures.
A joint operation is a joint arrangement whereby the parties that have joint control of the arrangement have rights to the assets and obligations for the liabilities relating to the arrangement.
A joint venture is a joint arrangement whereby the parties that have joint control of the arrangement have rights to the net assets of the joint arrangement.
Joint control is the contractually agreed sharing of control of an arrangement, which exists only when decisions about the relevant activities require unanimous consent of the parties sharing control.
The Group recognises its direct right to the assets, liabilities, revenues and expenses of joint operations and its share of any jointly held or incurred assets, liabilities, revenues and expenses. These have been incorporated in the financial statements under the appropriate headings.
Interests in joint ventures are accounted for using the equity method (see (d) below), after initially being recognised at cost in the consolidated balance sheet.
d) Equity method: Under the equity method of accounting, the investments are initially recognised at cost and adjusted thereafter to recognise the Group's
share of post acquisition profits or losses of the investee in profit and loss, and the group's share of other comprehensive income of the investee in other comprehensive income. Dividends received or receivable from associates or joint ventures are recognised as a reduction in the carrying amount of the investment.
Unrealised gains on transactions between the group and its associates and joint ventures are eliminated to the extent of the group's interest in these entities. Unrealised losses are also eliminated unless the transaction provides evidence of an impairment of the asset transferred.
The carrying amount of equity accounted investments are tested for impairment in accordance with the policy mentioned in Note 2a (vi) below.
Annual Report 2017-18 | 287
Managem
ent Discussion & Analysis
Strategic Overview
Board &
Managem
ent ProfilesStatutory Reports
Financial Statements
NOTES TO THE CONSOLIDATED FINANCIAL STATEMENTS (Contd.)for the Year ended March 31, 2018
e) Changes in ownership interests The group treats transactions with non-controlling interests that do not result in loss of control as transactions with equity owners of the
group. A change in the ownership interest results in an adjustment between the carrying amounts of the controlling and non-controlling interests to reflect their relative interests in the subsidiary. Any difference between the amount of the adjustment to non-controlling interests and any consideration paid or received is recognised within equity.
iii) Business Combinations The acquisition method of accounting is used to account for all business combinations, regardless of whether equity instruments or other
assets are acquired. The consideration transferred for the acquisition of a subsidiary comprises the: – fair values of the assets transferred; – liabilities incurred to the former owners of the acquired business; – equity interests issued by the group; and – fair value of any asset or liability resulting from a contingent consideration arrangement.
Identifiable assets acquired and liabilities and contingent liabilities assumed in a business combination are, with limited exceptions, measured initially at their fair values at the acquisition date. The group recognises any non-controlling interest in the acquired entity on an acquisition-by-acquisition basis at the non-controlling interest’s proportionate share of the acquired entity’s net identifiable assets.
Acquisition-related costs are expensed as incurred. The excess of the – consideration transferred; – amount of any non-controlling interest in the acquired entity, and – acquisition-date fair value of any previous equity interest in the acquired entity
over the fair value of the net identifiable assets acquired is recorded as goodwill. If those amounts are less than the fair value of the net identifiable assets of the business acquired, the difference is recognised in other comprehensive income and accumulated in equity as capital reserve provided there is clear evidence of the underlying reasons for classifying the business combination as a bargain purchase. In other cases, the bargain purchase gain is recognised directly in equity as capital reserve.
Where settlement of any part of cash consideration is deferred, the amounts payable in the future are discounted to their present value as at the date of exchange. The discount rate used is the entity’s incremental borrowing rate, being the rate at which a similar borrowing could be obtained from an independent financier under comparable terms and conditions.
Contingent consideration is classified either as equity or a financial liability. Amounts classified as a financial liability are subsequently remeasured to fair value with changes in fair value recognised in profit or loss.
If the business combination is achieved in stages, the acquisition date carrying value of the acquirer’s previously held equity interest in the acquiree is remeasured to fair value at the acquisition date. Any gains or losses arising from such remeasurement are recognised in profit or loss or other comprehensive income, as appropriate.
Common control transactions Business combinations involving entities that are controlled by the group are accounted for using the pooling of interests method as follows:
1) The assets and liabilities of the combining entities are reflected at their carrying amounts.
2) No adjustments are made to reflect fair values, or recognise any new assets or liabilities. Adjustments are only made to harmonise accounting policies.
288 | Piramal Enterprises Limited
NOTES TO THE CONSOLIDATED FINANCIAL STATEMENTS (Contd.)for the Year ended March 31, 2018
CONSOLIDATED FINANCIAL STATEMENTS
3) The balance of the retained earnings appearing in the financial statements of the transferor is aggregated with the corresponding balance appearing in the financial statements of the transferee or is adjusted against general reserve.
4) The identity of the reserves are preserved and the reserves of the transferor become the reserves of the transferee.
5) The difference, if any, between the amounts recorded as share capital issued plus any additional consideration in the form of cash or other assets and the amount of share capital of the transferor is transferred to capital reserve and is presented separately from other capital reserves.
6) The financial information in the financial statements in respect of prior periods is restated as if the business combination had occurred from the beginning of the preceding period in the financial statements, irrespective of the actual date of combination. However, where the business combination had occured after that date, the prior period information is restated only from that date.
(iv) (a) Property, Plant and Equipment Freehold Land is carried at historical cost. All other items of Property Plant & Equipments are stated at cost of acquisition, less accumulated
depreciation and accumulated impairment losses, if any. Direct costs are capitalised until the assets are ready for use and includes freight, duties, taxes and expenses incidental to acquisition and installation.
The carrying amount of any component accounted for as a separate asset is derecognised when replaced. All other repairs and maintenance are charged to profit or loss during the reporting period in which they are incurred.
Subsequent expenditures related to an item of Property Plant & Equipment are added to its carrying value only when it is probable that the future economic benefits from the asset will flow to the Company & cost can be reliably measured.
Losses arising from the retirement of, and gains or loss arising from disposal of Property, Plant and Equipment are recognised in the Statement of Profit and Loss.
Depreciation Depreciation is provided on a pro-rata basis on the straight-line method ('SLM') over the estimated useful lives of the assets specified in
Schedule II of the Companies Act, 2013 / estimated useful lives as determined by the management of respective subsidiaries based on technical evaluation. The assets’ residual values and useful lives are reviewed, and adjusted if appropriate, at the end of each reporting period.
The estimated useful lives of Property, Plant & Equipment are as stated below:
Asset Class Useful life
Buildings (including leasehold improvements) 3 years - 60 yearsCarpeted Roads 10 yearsPlant & Machinery 3 - 20 yearsContinuous Process Plant 25 yearsOffice Equipment 3 years - 15 yearsVehicles 4 - 8 yearsHelicopter 20 yearsShips/Yachts 13 years/28 YearsFurniture & fixtures 3 - 15 years
(iv) (b) Non-current assets held for sale Non-current assets are classified as held for sale if their carrying amount will be recovered principally through a sale transaction rather than
through continuing use and a sale is considered highly probable. They are measured at the lower of their carrying amount and fair values less cost to sell, except for assets such as deferred tax assets, assets arising from employee benefits and financial assets which are specifically exempt from this requirement.
Annual Report 2017-18 | 289
Managem
ent Discussion & Analysis
Strategic Overview
Board &
Managem
ent ProfilesStatutory Reports
Financial Statements
NOTES TO THE CONSOLIDATED FINANCIAL STATEMENTS (Contd.)for the Year ended March 31, 2018
(v) (a) Intangible Assets Intangible assets are stated at acquisition cost, net of accumulated amortisation and accumulated impairment losses, if any. Gains or losses arising from the retirement or disposal of an intangible asset are determined as the difference between the disposal proceeds
and the carrying amount of the asset and are recognised as income or expense in the Consolidated Statement of Profit and Loss.
The research and development (R&D) cost is accounted in accordance with Ind AS - 38 ‘Intangibles’.
Research Research costs, including patent filing charges, technical know-how fees, testing charges on animal and expenses incurred on development of
a molecule till the stage of Pre-clinical studies and till the receipt of regulatory approval for commencing phase I trials are treated as revenue expenses and charged off to the Statement of Profit and Loss of respective year.
Development Development costs relating to design and testing of new or improved materials, products or processes are recognised as intangible assets and
are carried forward under Intangible Assets under Development until the completion of the project when they are capitalised as Intangible assets, if the following conditions are satisfied:
• it is technically feasible to complete the asset so that it will be available for use; • management intends to complete the asset and use or sell it; • there is an ability to use or sell the asset; • it can be demonstrated how the asset will generate probable future economic benefits; • adequate technical, financial and other resources to complete the development and to use or sell the asset are available; and • the expenditure attributable to the asset during its development can be reliably measured.
Intangible Assets with finite useful lives are amortised on a straight-line basis over the following period:
Asset Class Useful life
Brands and Trademarks 5 - 25 yearsCopyrights, Know-how (including qualifying Product Development Cost) and Intellectual property rights 4 - 25 yearsComputer Software (including acquired database) 2 - 9 yearsCustomer relationships 8 - 14 years
The assets’ residual values and useful lives are reviewed, and adjusted if appropriate, at the end of each reporting period.
Certain trademarks are assessed as Intangible Assets with indefinite useful lives.
(v) (b) Goodwill Goodwill on acquisition is included in intangible assets. Goodwill and intangible assets that have an indefinite useful life are not subject to
amortisation and are tested annually for impairment, or more frequently if events or changes in circumstances indicate that they might be impaired.
Goodwill is carried at cost less accumulated impairment losses.
vi) Impairment of Assets The Group assesses at each Balance Sheet date whether there is any indication that an asset may be impaired. For the purposes of assessing
impairment, the smallest identifiable group of assets that generates cash inflows from continuing use that are largely independent of the cash inflows from other assets or groups of assets, is considered as a cash generating unit. If any such indication exists, the Group estimates the recoverable amount of the asset. The recoverable amount is the higher of an asset’s fair value less costs of disposal and value in use. If such recoverable amount of the asset or the recoverable amount of the cash generating unit to which the asset belongs is less than its carrying amount, the carrying amount is reduced to its recoverable amount. The reduction is treated as an impairment loss and is recognised in the Consolidated Statement of Profit and Loss. If at the Balance Sheet date there is an indication that if a previously assessed impairment loss no longer exists or may have decreased, the recoverable amount is reassessed and the asset is reflected at the recoverable amount.
290 | Piramal Enterprises Limited
NOTES TO THE CONSOLIDATED FINANCIAL STATEMENTS (Contd.)for the Year ended March 31, 2018
CONSOLIDATED FINANCIAL STATEMENTS
vii) Financial instruments Financial assets and financial liabilities are recognised when a Group entity becomes a party to the contractual provisions of the instruments.
Financial assets and financial liabilities are initially measured at fair value. Transaction costs that are directly attributable to the acquisition or issue of financial assets and financial liabilities (other than financial assets and financial liabilities at fair value through profit or loss) are added to or deducted from the fair value of the financial assets or financial liabilities, as appropriate, on initial recognition. Transaction costs directly attributable to the acquisition of financial assets or financial liabilities at fair value through profit or loss are recognised immediately in profit or loss. Financial assets with embedded derivatives are considered in their entirety when determining whether their cash flows are solely payment of principal and interest.
Investments and Other Financial assets Classification: The Group classifies its financial assets in the following measurement categories: ● those to be measured subsequently at fair value (either through other comprehensive income, or through profit or loss), and ● those measured at amortised cost.
The classification depends on the entity’s business model for managing the financial assets and the contractual terms of the cash flows.
For assets measured at fair value, gains and losses will either be recorded in profit or loss or other comprehensive income. For investments in debt instruments, this will depend on the business model in which the investment is held. For investments in equity instruments, this will depend on whether the Group has made an irrevocable election at the time of initial recognition to account for the equity investment at fair value through other comprehensive income.
The Group reclassifies debt investments when and only when its business model for managing those assets changes.
Measurement At initial recognition, the Group measures a financial asset at its fair value plus, in the case of a financial asset not at fair value through profit or
loss, transaction costs that are directly attributable to the acquisition of the financial asset. Transaction costs of financial assets carried at fair value through profit or loss are expensed in profit or loss.
Financial assets with embedded derivatives are considered in their entirety when determining whether their cash flows are solely payment of principal and interest.
Debt instruments Subsequent measurement of debt instruments depends on the Group’s business model for managing the asset and the cash flow characteristics
of the asset. There are three measurement categories into which the group classifies its debt instruments:
Amortised cost Assets that are held for collection of contractual cash flows where those cash flows represent solely payments of principal and interest are
measured at amortised cost. A gain or loss on a debt investment that is subsequently measured at amortised cost and is not part of a hedging relationship is recognised in profit or loss when the asset is derecognised or impaired. Interest income from these financial assets is included in finance income using the effective interest rate method. Subsequently, these are measured at amortised cost using the Effective Interest Method less any impairment losses.
Fair value through other comprehensive income (FVTOCI): Assets that are held for collection of contractual cash flows and for selling the financial assets, where the assets’ cash flows represent solely
payments of principal and interest, are measured at fair value through other comprehensive income (FVTOCI). Movements in the carrying amount are taken through OCI, except for the recognition of impairment gains or losses, interest revenue and foreign exchange gains and losses which are recognised in profit and loss. When the financial asset is derecognised, the cumulative gain or loss previously recognised in OCI is reclassified from equity to profit or loss and recognised in other gains/ (losses). Interest income from these financial assets is included in other income using the effective interest rate method.
Annual Report 2017-18 | 291
Managem
ent Discussion & Analysis
Strategic Overview
Board &
Managem
ent ProfilesStatutory Reports
Financial Statements
NOTES TO THE CONSOLIDATED FINANCIAL STATEMENTS (Contd.)for the Year ended March 31, 2018
Fair value through profit or loss (FVTPL): Assets that do not meet the criteria for amortised cost or FVTOCI are measured at fair value through profit or loss. A gain or loss on a debt
investment that is subsequently measured at fair value through profit or loss and is not part of a hedging relationship is recognised in profit or loss and presented net in the statement of profit and loss within other gains/(losses) in the period in which it arises. Interest income from these financial assets is included in other income.
Equity instruments The Group subsequently measures all equity investments at fair value. Where the Group’s management has elected to present fair value gains
and losses on equity investments in other comprehensive income, there is no subsequent reclassification of fair value gains and losses to profit or loss. Dividends from such investments are recognised in profit or loss when the Group’s right to receive payments is established.
Changes in the fair value of financial assets at fair value through profit or loss are recognised in the consolidated statement of profit and loss.
Impairment of financial assets The Company applies the expected credit loss model for recognising impairment loss on financial assets measured at amortised cost, loan
commitments, trade receivables and other contractual rights to receive cash or other financial asset.
For trade receivables or any contractual right to receive cash or another financial asset that result from transactions that are within the scope of Ind AS 18, the Company always measures the loss allowance at an amount equal to lifetime expected credit losses. Further, for the purpose of measuring lifetime expected credit loss ('ECL') allowance for trade receivables, the Company has used a practical expedient as permitted under Ind AS 109. This expected credit loss allowance is computed based on a provision matrix which takes into account historical credit loss experience and adjusted for forward-looking information.
In case of other than trade receivables, the expected credit loss is a product of exposure at default, probability of default and loss given default. The Company has devised an internal model to evaluate the probability of default and loss given default based on the parameters set out in Ind AS 109. Accordingly, the financial instruments are classified into Stage 1 – Standard Assets with zero to thirty days past due (DPD), Stage 2 – Significant Credit Deterioration or overdue between 31 to 90 days and Stage 3 – Default Assets with overdue for more than 90 days. The Company also takes into account the below qualitative parameters in determining the increase in credit risk for the financial assets:
1) Significant negative deviation in the business plan of the borrower 2) Internal rating downgrade for the borrower or the project 3) Current and expected financial performance of the borrower 4) Need for refinance of loan due to change in cash flow of the project 5) Significant decrease in the value of collateral 6) Change in market conditions and industry trends
For recognition of impairment loss on other financial assets and risk exposure (including off Balance Sheet commitments), the Group determines that whether there has been a significant increase in the credit risk since initial recognition. If credit risk has not increased significantly, 12-month ECL is used to provide for impairment loss. However, if credit risk has increased significantly, lifetime ECL is used. If, in a subsequent period, credit quality of the instrument improves such that there is no longer a significant increase in credit risk since initial recognition, then the entity reverts to recognising impairment loss allowance based on 12-month ECL.
Lifetime ECL are the expected credit losses resulting from all possible default events over the expected life of a financial instrument. The 12-month ECL is a portion of the lifetime ECL which results from default events that are possible within 12 months after the reporting date.
Default Assets wherein the management does not expect any realistic prospect of recovery are written off to the Statement of Profit and Loss.
292 | Piramal Enterprises Limited
NOTES TO THE CONSOLIDATED FINANCIAL STATEMENTS (Contd.)for the Year ended March 31, 2018
CONSOLIDATED FINANCIAL STATEMENTS
Derecognition of financial assets A financial asset is derecognised only when: ● The Group has transferred the rights to receive cash flows from the financial asset or ● retains the contractual rights to receive the cash flows of the financial asset, but assumes a contractual obligation to pay the cash flows
to one or more recipients.
Where the entity has transferred an asset, the Group evaluates whether it has transferred substantially all risks and rewards of ownership of the financial asset. In such cases, the financial asset is derecognised. Where the entity has not transferred substantially all risks and rewards of ownership of the financial asset, the financial asset is not derecognised.
Foreign exchange gains and losses The fair value of financial assets denominated in a foreign currency is determined in that foreign currency and translated at the spot rate at
the end of each reporting period. For foreign currency denominated financial assets measured at amortised cost and FVTPL, the exchange differences are recognised in profit or loss except for those which are designated as hedging instruments in a hedging relationship.
Financial liabilities and equity instruments Classification as debt or equity Debt and equity instruments issued by a Group entity are classified as either financial liabilities or as equity in accordance with the substance
of the contractual arrangements and the definitions of a financial liability and an equity instrument.
Equity Instrument An equity instrument is any contract that evidences a residual interest in the assets of an entity after deducting all of its liabilities. Equity
instruments issued are recognised at the proceeds received, net of direct issue costs.
Compulsorily Convertible Debenture Convertible instruments are separated into liability and equity components based on the terms of the contract. On issuance of the convertible
debentures, the fair value of the liability component is determined using a market rate for an equivalent non-convertible instrument. This amount is classified as a financial liability measured at amortised cost (net of transaction costs) until it is extinguished on conversion or redemption. The remainder of the proceeds is allocated to the conversion option that is recognised and included in equity since conversion option meets Ind AS 32 criteria for fixed to fixed classification. Transaction costs are apportioned between the liability and equity components of the convertible debentures based on the allocation of proceeds to the liability and equity components when the instruments are initially recognised.
Financial liabilities All financial liabilities are subsequently measured at amortised cost using the effective interest method or at FVTPL.
Financial liabilities are classified as at FVTPL when the financial liability is either contingent consideration recognised by the Group as an acquirer in a business combination to which Ind AS 103 applies or is held for trading or it is designated as at FVTPL.
Financial liabilities that are not held-for-trading and are not designated as at FVTPL are measured at amortised cost at the end of subsequent accounting periods. The carrying amounts of financial liabilities that are subsequently measured at amortised cost are determined based on the effective interest method.
The effective interest method is a method of calculating the amortised cost of a financial liability and of allocating interest expense over the relevant period. The effective interest rate is the rate that exactly discounts estimated future cash payments (including all fees paid or received that form an integral part of the effective interest rate, transaction costs and other premiums or discounts) through the expected life of the financial liability, or (where appropriate) a shorter period, to the amortised cost of a financial liability.
Borrowings are classified as current liabilities unless the Group has an unconditional right to defer settlement of the liability for at least 12 months after the reporting period. Where there is a breach of a material provision of a long-term loan arrangement on or before the end of the reporting period with the effect that the liability becomes payable on demand on the reporting date, the Group does not classify the liability as current, if the lender agreed, after the reporting period and before the approval of the financial statements for issue, not to demand payment as a consequence of the breach.
Annual Report 2017-18 | 293
Managem
ent Discussion & Analysis
Strategic Overview
Board &
Managem
ent ProfilesStatutory Reports
Financial Statements
NOTES TO THE CONSOLIDATED FINANCIAL STATEMENTS (Contd.)for the Year ended March 31, 2018
Foreign exchange gains and losses For financial liabilities that are denominated in a foreign currency and are measured at amortised cost at the end of each reporting period, the
foreign exchange gains and losses are determined based on the amortised cost of the instruments.
Financial Guarantee Contracts A financial guarantee contract is a contract that requires the issuer to make specified payments to reimburse the holder for a loss it incurs
because a specified debtor fails to make payments when due in accordance with the terms of a debt instrument.
Financial guarantee contracts issued by the Group are initially measured at their fair values and are subsequently measured at the higher of: • the amount of the loss allowance determined in accordance with Ind AS 109; and • the amount initially recognised less, where appropriate, cumulative amortisation recognised in accordance with the revenue recognition
policies.
Derecognition of financial liabilities The Group derecognises financial liabilities when, and only when, the Group’s obligations are discharged, cancelled or have expired. An
exchange between with a lender of debt instruments with substantially different terms is accounted for as an extinguishment of the original financial liability and the recognition of a new financial liability.
Derivatives and hedging activities Derivatives are initially recognised at fair value on the date a derivative contract is entered into and are subsequently re-measured to their fair
value at the end of each reporting period. The accounting for subsequent changes in fair value depends on whether the derivative is designated as a hedging instrument, and if so, the nature of the item being hedged and the type of hedge relationship designated.
The full fair value of a hedging derivative is classified as a non-current asset or liability when the remaining maturity of the hedged item is more than 12 months; it is classified as a current asset or liability when the remaining maturity of the hedged item is less than 12 months. Trading derivatives are classified as a current asset or liability.
(i) Cash flow hedges that qualify for hedge accounting: The effective portion of changes in the fair value of derivatives that are designated and qualify as cash flow hedges is recognised in the
other comprehensive income in cash flow hedging reserve within equity, limited to the cumulative change in fair value of the hedged item on a present value basis from the inception of the hedge. The gain or loss relating to the ineffective portion is recognised immediately in profit or loss, within other gains/(losses).
(ii) Derivatives that are not designated as hedges: The group enters into certain derivative contracts to hedge risks which are not designated as hedges. Such contracts are accounted for at
fair value through profit or loss.
Embedded derivatives Derivatives embedded in a host contract that is an asset within the scope of Ind AS 109 are not separated. Financial assets with embedded
derivatives are considered in their entirety when determining whether their cash flows are solely payment of principal and interest.
Derivatives embedded in all other host contract are separated only if the economic characteristics and risks of the embedded derivative are not closely related to the economic characteristics and risks of the host and are measured at fair value through profit or loss. Embedded derivatives closely related to the host contracts are not separated.
Offsetting Financial Instruments Financial Assets and Liabilities are offset and the net amount is reflected in the balance sheet where there is a legally enforceable right to offset
the recognised amounts and there is an intention to settle the liability simultaneously. The legally enforceable right must not be contingent on future events and must be enforceable in the normal course of business and in the event of default, insolvency or bankruptcy of the Group or counterparty.
294 | Piramal Enterprises Limited
NOTES TO THE CONSOLIDATED FINANCIAL STATEMENTS (Contd.)for the Year ended March 31, 2018
CONSOLIDATED FINANCIAL STATEMENTS
viii) Trade Receivables Trade receivables are recognised initially at fair value and subsequently measured at amortised cost using the effective interest method, less
provision for impairment.
ix) Inventories Inventories comprise of Raw and Packing Materials, Work-in-Progress, Finished Goods (Manufactured and Traded) and Stores and Spares.
Inventories are valued at the lower of cost and the net realisable value after providing for obsolescence and other losses, where considered necessary. Cost is determined on Weighted Average basis. Cost includes all charges in bringing the goods to their present location and condition, including octroi and other levies, transit insurance and receiving charges. The cost of Work-in-progress and Finished Goods comprises of materials, direct labour, other direct costs and related production overheads and Excise duty as applicable.
Net realisable value is the estimated selling price in the ordinary course of business less the estimated costs of completion and the estimated costs necessary to make the sale.
x) Employee Benefits (i) Short-term obligations Liabilities for wages and salaries, including non-monetary benefits that are expected to be settled wholly within 12 months after the end
of the period in which the employees render the related service are recognised in respect of employees’ services up to the end of the reporting period and are measured at the amounts expected to be paid when the liabilities are settled. The liabilities are presented as current employee benefit obligations in the balance sheet.
(ii) Other long-term employee benefit obligations The liabilities for earned leave are not expected to be settled wholly within 12 months after the end of the period in which the employees
render the related service. They are therefore measured as the present value of expected future payments to be made in respect of services provided by employees up to the end of the reporting period using the projected unit credit method. The benefits are discounted using the market yields at the end of the reporting period that have terms approximating to the terms of the related obligation. Remeasurements as a result of experience adjustments and changes in actuarial assumptions are recognised in profit or loss.
The obligations are presented as current liabilities in the balance sheet if the entity does not have an unconditional right to defer settlement for at least twelve months after the reporting period, regardless of when the actual settlement is expected to occur. Long Term Service Awards are recognised as a liability at the present value of the defined benefit obligation as at the balance sheet date.
(iii) Post-employment obligations The Group operates the following post-employment schemes: - Defined Contribution plans such as provident fund, superannuation, pension, employee state insurance scheme and other social security
schemes in overseas jurisdictions - Defined Benefit plans such as provident fund and Gratuity, Pension fund (in case of a subsidiary)
In case of Provident fund, contributions are made to a Trust administered by the Group, except in case of certain employees, where the Contributions are made to the Regional Provident Fund Office.
Defined Contribution Plans The Group's contribution to provident fund (in case of contributions to the Regional Provident Fund office), pension and employee state
insurance scheme and other social security schemes in overseas jurisdictions are considered as defined contribution plans, as the Group does not carry any further obligations apart from the contributions made on a monthly basis and are charged as an expense based on the amount of contribution required to be made.
In case of 401(k) contribution plan (in case of US subsidiaries), contribution by the Group is discretionary. Any contribution made is charged to the Statement of Profit and Loss.
Annual Report 2017-18 | 295
Managem
ent Discussion & Analysis
Strategic Overview
Board &
Managem
ent ProfilesStatutory Reports
Financial Statements
NOTES TO THE CONSOLIDATED FINANCIAL STATEMENTS (Contd.)for the Year ended March 31, 2018
Defined Benefit Plan The liability or asset recognised in the balance sheet in respect of defined benefit provident and gratuity plans is the present value of the
defined benefit obligation at the end of the reporting period less the fair value of plan assets. The defined benefit obligation is calculated annually by actuaries using the projected unit credit method.
Except in case of an overseas subsidiary, the present value of the defined benefit obligation denominated in INR is determined by discounting the estimated future cash outflows by reference to market yields at the end of the reporting period on government bonds that have terms approximating to the terms of the related obligation.
The net interest cost is calculated by applying the discount rate to the net balance of the defined benefit obligation and the fair value of plan assets. This cost is included in employee benefit expense in the statement of profit and loss.
In case of an overseas subsidiary, where pension is classified as a Defined Benefit Scheme, assets are measured using market values and liabilities are measured using a Projected Unit Credit method and discounted using market yields determined by reference to high-quality corporate bonds that are denominated in the currency in which benefits will be paid, and that have terms approximating to the terms of the related obligation. Shortfall, if any, is provided for in the financial statements.
Remeasurement gains and losses arising from experience adjustments, changes in actuarial assumptions and return on plan assets (excluding interest income) are recognised in the period in which they occur, directly in other comprehensive income. They are included in retained earnings in the statement of changes in equity and in the balance sheet.
Changes in the present value of the defined benefit obligation resulting from plan amendments or curtailments are recognised immediately in profit or loss as past service cost.
Bonus Plans – The Group recognises a liability and an expense for bonuses. The group recognises a provision where contractually obliged or where there is a past practice that has created a constructive obligation.
xi) Provisions and Contingent Liabilities Provisions are recognised when there is a present obligation (legal or constructive) as a result of a past event, it is probable that an outflow of
resources embodying economic benefits will be required to settle the obligation and there is a reliable estimate of the amount of the obligation. When a provision is measured using the cash flows estimated to settle the present obligation, its carrying amount is the present value of those cash flows (when the effect of the time value of money is material). The discount rate used to determine the present value is a pre-tax rate that reflects current market assessments of the time value of money and the risks specific to the liability. The increase in the provision due to the passage of time is recognised as interest expense.
Contingent liabilities are disclosed when there is a possible obligation arising from past events, the existence of which will be confirmed only by the occurrence or non occurence of one or more uncertain future events not wholly within the control of the Group or a present obligation that arises from past events where it is either not probable that an outflow of resources will be required to settle the obligation or a reliable estimate of the amount cannot be made.
xii) Revenue recognition Revenue is measured at the fair value of the consideration received or receivable.
Sale of goods: Revenue from the sale of goods is recognised when the significant risks and rewards of ownership of the goods have passed to the buyer, based on the applicable incoterms. Amounts disclosed as revenue are inclusive of excise duty and net of returns, trade allowances, rebates, value added taxes, goods and service tax and amounts collected on behalf of third parties. The Group recognises revenue when the amount of revenue can be reliably measured, it is probable that future economic benefits will flow to the Group and the revenue recognition criteria have been complied.
296 | Piramal Enterprises Limited
NOTES TO THE CONSOLIDATED FINANCIAL STATEMENTS (Contd.)for the Year ended March 31, 2018
CONSOLIDATED FINANCIAL STATEMENTS
Sale of Services: In contracts involving the rendering of services/development contracts, revenue is measured using the proportionate completion method and is recognised net of indirect taxes (provided that it is probable that the economic benefits will flow to the Group and the amount of income can be measured reliably). Advisory fees are accounted on an accrual basis in accordance with the Investment Management Agreement and Advisory Services Agreement.
Interest: Interest income from a financial asset is recognised when it is probable that the economic benefits will flow to the Group and the amount of income can be measured reliably. Interest income is accrued on a time basis, by reference to the amortised cost and at the effective interest rate applicable.
Dividend: Dividend income from investments is recognised when the shareholder's right to receive payment has been established (provided that it is probable that the economic benefits will flow to the Group and the amount of income can be measured reliably).
xiii) Foreign Currency Transactions In preparing the financial statements of each individual Company entity, transactions in currencies other than the entity’s functional currency
(foreign currencies) are recognised at the rates of exchange prevailing at the dates of the transactions. Foreign exchange gains and losses resulting from the settlement of such transactions and from the translation of monetary assets and liabilities denominated in foreign currencies at year end exchange rates are generally recognised in profit or loss. Non-monetary items carried at fair value that are denominated in foreign currencies are translated at the rates prevailing at the date when the fair value was determined. Non-monetary items that are measured in terms of historical cost in a foreign currency are not retranslated.
Exchange differences on monetary items are recognised in profit or loss in the period in which they arise.
For the purpose of presenting consolidated financial statements, the assets and liabilities of the Company’s foreign operations that have a functional currency other than presentation currency i.e. Indian Rupees are translated using exchange rates prevailing at the reporting date. Income and expense items are translated at the average exchange rates for the period. Exchange differences arising, if any, are recognized in other comprehensive income and held in foreign currency translation reserve (FCTR), a component of equity, except to the extent that the translation difference is allocated to non-controlling interest. When a foreign operation is disposed off, the relevant amount recognized in FCTR is transferred to the statement of income as part of the profit or loss on disposal. Goodwill and fair value adjustments arising on the acquisition of a foreign operation are treated as assets and liabilities of the foreign operation and translated at the exchange rate prevailing at the reporting date.
Foreign currency differences arising from translation of inter Company receivables or payables relating to foreign operations, the settlement of which is neither planned nor likely in the foreseeable future, are considered to form part of net investment in foreign operation and are recognized in FCTR.
xiv) Exceptional Items When items of income and expense within profit or loss from ordinary activities are of such size, nature or incidence that their disclosure is relevant
to explain the performance of the enterprise for the period, the nature and amount of such items is disclosed separately as Exceptional items.
xv) Excise Duty The excise duty in respect of closing inventory of finished goods is included as part of inventory. The material consumed is net of Central
Value Added Tax (CENVAT) credits. The difference between the Excise duty on opening stock and closing stock is charged to the Consolidated Statement of Profit and Loss.
xvi) Government Grants Grants from the government are recognised at their fair value where there is a reasonable assurance that the grant will be received and the
group will comply with all attached conditions.
Government grants relating to income are deferred and recognised in the profit or loss over the period necessary to match them with the costs that they are intended to compensate and presented within other income.
Annual Report 2017-18 | 297
Managem
ent Discussion & Analysis
Strategic Overview
Board &
Managem
ent ProfilesStatutory Reports
Financial Statements
NOTES TO THE CONSOLIDATED FINANCIAL STATEMENTS (Contd.)for the Year ended March 31, 2018
Government grants relating to purchase of property, plant and equipment are included in non-current liabilities as deferred income and are credited to profit or loss on a straight-line basis over the expected lives of the related assets and presented within other income.
xvii) Leases Operating Leases Leases in which a significant portion of the risks and rewards of ownership are not transferred to the Company as lessee are classified as
operating leases. In the event that lease incentives are received to enter into operating leases, such incentives are recognised as a liability. Payments made under
operating leases (net of any incentives received from the lessor) are charged to profit or loss on a straight-line basis over the period of the lease unless the payments are structured to increase in line with expected general inflation to compensate for the lessor’s expected inflationary cost increases.
xviii) Taxes on Income Tax expense for the period, comprising current tax and deferred tax, are included in the determination of the net profit or loss for the period.
Current tax is measured at the amount expected to be paid to the tax authorities in accordance with the taxation laws prevailing in the respective jurisdictions.
Deferred tax is recognised on temporary differences between the carrying amounts of assets and liabilities and the corresponding tax bases used in the computation of taxable profit. Deferred tax liabilities are generally recognised for all taxable temporary differences. Deferred tax assets are generally recognised for all deductible temporary differences to the extent that it is probable that taxable profits will be available against which those deductible temporary differences can be utilised. Such deferred tax assets and liabilities are not recognised if the temporary difference arises from the initial recognition (other than in a business combination) of assets and liabilities in a transaction that affects neither the taxable profit nor the accounting profit. In addition, deferred tax liabilities are not recognised if the temporary difference arises from the initial recognition of goodwill.
The carrying amount of deferred tax assets is reviewed at the end of each reporting period and reduced to the extent that it is no longer probable that sufficient taxable profits will be available to allow all or part of the asset to be recovered.
Deferred tax liabilities and assets are measured at the tax rates that are expected to apply in the period in which the liability is settled or the asset realised, based on tax rates (and tax laws) that have been enacted or substantively enacted by the end of the reporting period.
Current and deferred tax are recognised in profit or loss, except when they relate to items that are recognised in other comprehensive income or directly in equity, in which case, the current and deferred tax are also recognised in other comprehensive income or directly in equity respectively. Where current tax or deferred tax arises from the initial accounting for a business combination, the tax effect is included in the accounting for the business combination.
Current tax assets and current tax liabilities are offset when there is a legally enforceable right to set off the recognised amounts and there is an intention to settle the asset and the liability on a net basis. Deferred tax assets and deferred tax liabilities are offset when there is a legally enforceable right to set off assets against liabilities representing current tax and where the deferred tax assets and the deferred tax liabilities relate to taxes on income levied by the same governing taxation laws.
Deferred tax liabilities are not recognised for temporary differences between the carrying amount and tax bases of investments in subsidiaries, associates and interest in joint arrangements where the group is able to control the timing of the reversal of the temporary differences and it is probable that the differences will not reverse in the foreseeable future.
Deferred tax assets are not recognised for temporary differences between the carrying amount and tax bases of investments in subsidiaries, associates and interest in joint arrangements where it is not probable that the differences will reverse in the foreseeable future and taxable profit will not be available against which the temporary difference can be utilised.
298 | Piramal Enterprises Limited
NOTES TO THE CONSOLIDATED FINANCIAL STATEMENTS (Contd.)for the Year ended March 31, 2018
CONSOLIDATED FINANCIAL STATEMENTS
xix) Cash and Cash Equivalents In the cash flow statement, cash and cash equivalents includes cash on hand, demand deposits with banks, other short-term highly liquid
investments with original maturities of three months or less that are readily convertible to known amounts of cash and which are subject to an insignificant risk of changes in value, and bank overdrafts. Bank overdrafts are shown within borrowings in current liabilities in the balance sheet.
xx) Borrowing Costs General and specific borrowing costs directly attributable to acquisition or construction of qualifying assets (i.e. those Property, Plant &
Equipments which necessarily take a substantial period of time to get ready for their intended use) are capitalised. Other borrowing costs are recognised as an expense in the period in which they are incurred.
xxi) Deferred Revenue and Unbilled Revenue Amounts received from customers or billed to customers, in advance of services performed are recorded as deferred revenue under Other
Current Liabilities. Unbilled revenue included in Other Financial Assets, represents amounts recognised in respect of services performed in accordance with contract terms, not yet billed to customers as at the year end.
xxii) Segment Reporting The Chairman has been identified as the Chief Operating Decision Maker (CODM) as defined by Ind AS 108, 'Operating Segments.'
Operating segments are reported in a manner consistent with the internal reporting provided to the chief operating decision makers.
The accounting policies adopted for segment reporting are in conformity with the accounting policies adopted for the Group. Revenue and expenses have been identified to segments on the basis of their relationship to the operating activities of the segment. Income / Costs which relate to the Group as a whole and are not allocable to segments on a reasonable basis, have been included under Unallocated Income / Costs. Interest income and expense are not allocated to respective segments (except in case of Financial Services segment).
xxiii) Dividends Provision is made for the amount of any dividend declared, being appropriately authorised and no longer at the discretion of the entity, on or
before the end of the reporting period but not distributed at the end of the reporting period.
xxiv) Share appreciation rights Liabilities for the group’s share appreciation rights are recognised as employee benefit expense over the relevant service period. The liabilities
are remeasured to fair value at each reporting date and are presented as employee benefit obligations in the balance sheet.
xxv) Rounding of amounts All amounts disclosed in the financial statements and notes have been rounded off to the nearest Crores as per the requirement of Schedule
III, unless otherwise stated.
xxvi) Standards issued but not yet effective On March 28, 2018, Ministry of Corporate Affairs ('MCA') has amongst others notified the Companies (Indian Accounting Standards) Amendment
Rules, 2018. The amendments and the new standard are applicable to the Company from April 1, 2018.
Amendment to Ind AS 21: The Amendment to Ind AS 21 clarifies the date of the transaction for the purpose of determining the exchange rate to use on initial recognition
of the related asset, expense or income, when an entity has received or paid advance consideration in a foreign currency. The Company is evaluating the requirements of the amendment and its effect on the financial statements.
Amendment to Ind AS 12: The amendment to Ind AS 12 clarifies that determining temporary differences and estimating probable future taxable profit against which
deductible temporary differencs are assessed for utilisation are two separate steps and the carrying amount of an asset is relevant only to determine temporary differences. The carrying amount of an asset does not limit the estimation of probable inflow of taxable economic
Annual Report 2017-18 | 299
Managem
ent Discussion & Analysis
Strategic Overview
Board &
Managem
ent ProfilesStatutory Reports
Financial Statements
NOTES TO THE CONSOLIDATED FINANCIAL STATEMENTS (Contd.)for the Year ended March 31, 2018
benefits that results from recovering an asset. The Company is evaluating the requirements of the amendment and its effect on the financial statements.
Notification of new standard Ind AS 115 The new standard replaces existing revenue recognition standards Ind AS 11, 'Construction Contracts', Ind AS 18, 'Revenue' and revised guidance
note of the Institute of Chartered Accountants of India on Accounting for Real Estate Transactions for Ind AS entities issued in 2016. The core principle of the new standard is that an entity should recognise revenue to depict the transfer of promised goods or services to customers in an amount that reflects the consideration to which the entity expects to be entitled in exchange for those goods or services. Further the new standard requires enhanced disclosures about the nature, amount, timing and uncertainty of revenue and cash flows arising from the entity’s contracts with customers. The Company is evaluating the requirements of the amendment and its effect on the financial statements.
2B. CRITICAL ACCOUNTING JUDGEMENTS AND KEY SOURCES OF ESTIMATION UNCERTAINTIES The preparation of the financial statements in conformity with Ind AS requires the Management to make estimates and assumptions considered
in the reported amounts of assets and liabilities (including contingent liabilities) and the reported income and expenses during the year. The Management believes that the estimates used in preparation of the financial statements are prudent and reasonable. Future results could differ due to these estimates and the differences between the actual results and the estimates are recognised in the periods in which the results are known/materialise.
Fair Valuation: Some of the Group’s assets and liabilities are measured at fair value for financial reporting purposes. In estimating the fair value of an asset and
liability, the Group uses market observable data to the extent it is available. When Level 1 inputs are not available, the Group engages third party qualified external valuers to establish the appropriate valuation techniques and inputs to the valuation model.
Information about the valuation techniques and inputs used in determining the fair value of various assets and liabilities are disclosed in Note 55.
Impairment of Goodwill (Refer Note 41) Determining whether goodwill is impaired requires an estimation of the recoverable amount of the cash-generating units to which goodwill has
been allocated. The recoverable amount is higher of the Value-in-Use and Fair Value Less Cost To Sell (FVLCTS). The value in use calculation requires the directors to estimate the future cash flows expected to arise from the cash-generating unit and a suitable discount rate in order to calculate the present value. Where the actual future cash flows are less than expected, a material impairment loss may arise.
Expected Credit Loss: When determining whether the risk of default on a financial instrument has increased significantly since initial recognition, the Group considers
reasonable and supportable information that is relevant and available without undue cost or effort. This includes both quantitative and qualitative information and analysis, based on the Group’s historical experience and credit assessment and including forward-looking information.
The inputs used and process followed by the Group in determining the increase in credit risk have been detailed in Note 50 (f).
Useful life of Assets: Property, plant and equipment and Intangible Assets represent a significant proportion of the assets of the Group. Depreciation is derived after
determining an estimate of an asset’s expected useful life and the expected residual value at the end of its life. The useful lives and residual values of Group's assets are determined by management at the time the asset is acquired and reviewed periodically, including at each financial year end. The lives are based on historical experience with similar assets as well as anticipation of future events, which may impact their life, such as changes in technology.
Deferred Taxes Deferred tax is recorded on temporary differences between the tax bases of assets and liabilities and their carrying amounts, at the rates that have
been enacted or substantively enacted at the reporting date. The ultimate realisation of deferred tax assets is dependent upon the generation of future taxable profits during the periods in which those temporary differences and tax loss carry-forwards become deductible. The Group considers the expected reversal of deferred tax liabilities and projected future taxable income in making this assessment. The amount of the deferred tax
300 | Piramal Enterprises Limited
NOTES TO THE CONSOLIDATED FINANCIAL STATEMENTS (Contd.)for the Year ended March 31, 2018
CONSOLIDATED FINANCIAL STATEMENTS
assets considered realizable, however, could be reduced in the near term if estimates of future taxable income during the carry-forward period are reduced.
Defined benefit plans: The cost of the defined benefit plans and the present value of the defined benefit obligation are based on actuarial valuation using the projected
unit credit method. An actuarial valuation involves making various assumptions that may differ from actual developments in the future. These include the determination of the discount rate, future salary increases and mortality rates. Due to the complexities involved in the valuation and its long-term nature, a defined benefit obligation is highly sensitive to changes in these assumptions. All assumptions are reviewed at each reporting date.
Contingent Consideration (Refer Note 40) In accounting for business combinations,judgement is required in determining contingent consideration. Contingent consideration is payable in case
of achievement of certain milestones. It is calculated by applying an appropriate discount rate to the probability adjusted sales / margins.
Functional Currency (Refer Note 50(d)) Functional currency is the currency of the primary economic environment in which the Company and its subsidiaries operate. The Group assesses
the factors as per Ind AS 21 in determining the functional currency of the Company and its subsidiaries. If there is any change in underlying transactions, events and conditions in the Company or its subsidiary, the Group reassesses the functional currency.
Assessment of Significant influence (Refer Note 39 (d)) Irrespective of the voting rights in an entity, if the Company has a right to appoint Directors or participates in all significant financial and operating
decisions of an investee, there is an existence of significant influence and the investment is considered as an Associate.
Assessment of Joint control (Refer Note 39 (b)) Irrespective of the voting rights in an entity, if a contractual arrangement requires unanimous consent from all the parties for the relevant activities
and if there is a separation of the legal form of the structure, the arrangement is accounted as a Joint venture.
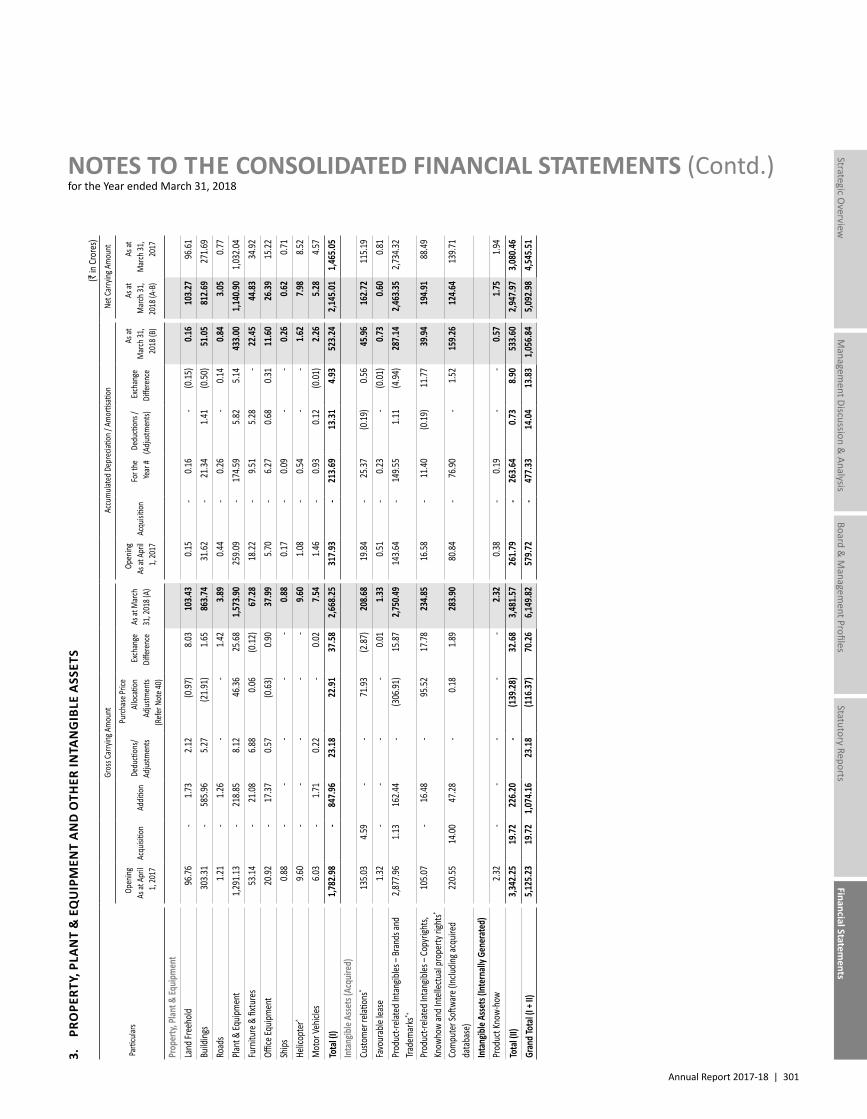
Annual Report 2017-18 | 301
Managem
ent Discussion & Analysis
Strategic Overview
Board &
Managem
ent ProfilesStatutory Reports
Financial Statements
NOTES TO THE CONSOLIDATED FINANCIAL STATEMENTS (Contd.)for the Year ended March 31, 2018
3.
PRO
PERT
Y, P
LAN
T &
EQ
UIP
MEN
T A
ND
OTH
ER IN
TAN
GIB
LE A
SSET
S (`
in Cr
ores
)
Parti
cular
s
Gro
ss Ca
rrying
Am
ount
Acc
umula
ted D
epre
ciatio
n / A
mor
tisati
on N
et Ca
rrying
Am
ount
Ope
ning
As at
Apr
il 1,
2017
Acq
uisitio
n A
dditio
n D
educ
tions
/ Ad
justm
ents
Purch
ase P
rice
Alloc
ation
Adjus
tmen
ts (R
efer N
ote 4
0)
Exch
ange
Di
ffere
nce
As a
t Mar
ch
31, 2
018 (
A)
Ope
ning
As at
Apr
il 1,
2017
Acq
uisitio
n Fo
r the
Ye
ar #
Ded
uctio
ns /
(Adju
stmen
ts) Ex
chan
ge
Diffe
renc
e
As a
t M
arch
31,
2018
(B)
As a
t M
arch
31,
2018
(A-B
)
As a
t M
arch
31,
2017
Prop
erty,
Plan
t & Eq
uipm
ent
Land
Free
hold
96.76
- 1.
73 2.
12 (0
.97)
8.03
103.4
3 0.
15 -
0.16
- (0
.15)
0.16
103.2
7 96
.61Bu
ilding
s 30
3.31
- 58
5.96
5.27
(21.9
1) 1.
65 86
3.74
31.62
- 21
.34 1.
41 (0
.50)
51.05
812.6
9 27
1.69
Road
s 1.
21 -
1.26
- -
1.42
3.89
0.44
- 0.
26 -
0.14
0.84
3.05
0.77
Plant
& Eq
uipm
ent
1,29
1.13
- 21
8.85
8.12
46.36
25.68
1,57
3.90
259.0
9 -
174.5
9 5.
82 5.
14 43
3.00
1,14
0.90
1,03
2.04
Furn
iture
& fix
ture
s 53
.14 -
21.08
6.88
0.06
(0.12
) 67
.28 18
.22 -
9.51
5.28
- 22
.45 44
.83 34
.92Offi
ce Eq
uipm
ent
20.92
- 17
.37 0.
57 (0
.63)
0.90
37.99
5.70
- 6.
27 0.
68 0.
31 11
.60 26
.39 15
.22Sh
ips 0.
88 -
- -
- -
0.88
0.17
- 0.
09 -
- 0.
26 0.
62 0.
71He
licop
ter^
9.60
- -
- -
- 9.
60 1.
08 -
0.54
- -
1.62
7.98
8.52
Mot
or Ve
hicles
6.03
- 1.
71 0.
22 -
0.02
7.54
1.46
- 0.
93 0.
12 (0
.01)
2.26
5.28
4.57
Tota
l (I)
1,78
2.98
- 84
7.96
23.1
8 22
.91
37.5
8 2,
668.
25 31
7.93
- 21
3.69
13.3
1 4.
93 52
3.24
2,14
5.01
1,46
5.05
Inta
ngibl
e Ass
ets (
Acqu
ired)
Custo
mer
relati
ons*
135.0
3 4.
59 -
- 71
.93 (2
.87)
208.6
8 19
.84 -
25.37
(0.19
) 0.
56 45
.96 16
2.72
115.1
9Fa
vour
able
lease
1.32
- -
- -
0.01
1.33
0.51
- 0.
23 -
(0.01
) 0.
73 0.
60 0.
81Pr
oduc
t-rela
ted I
ntan
gibles
– Br
ands
and
Trade
mar
ks*+
2,87
7.96
1.13
162.4
4 -
(306
.91)
15.87
2,75
0.49
143.6
4 -
149.5
5 1.
11 (4
.94)
287.1
4 2,
463.3
5 2,
734.3
2
Prod
uct-r
elate
d Int
angib
les –
Copy
right
s, Kn
owho
w an
d Int
ellec
tual
prop
erty
right
s*
105.0
7 -
16.48
- 95
.52 17
.78 23
4.85
16.58
- 11
.40 (0
.19)
11.77
39.94
194.9
1 88
.49
Com
pute
r Soft
ware
(Inclu
ding a
cquir
ed
data
base
) 22
0.55
14.00
47.28
- 0.
18 1.
89 28
3.90
80.84
- 76
.90 -
1.52
159.2
6 12
4.64
139.7
1
Inta
ngibl
e Ass
ets (
Inte
rnall
y Gen
erat
ed)
Prod
uct K
now-
how
2.32
- -
- -
- 2.
32 0.
38 -
0.19
- -
0.57
1.75
1.94
Tota
l (II)
3,34
2.25
19.7
2 22
6.20
- (1
39.2
8) 32
.68
3,48
1.57
261.
79 -
263.
64 0.
73 8.
90 53
3.60
2,94
7.97
3,08
0.46
Gran
d Tot
al (I
+ II)
5,12
5.23
19.7
2 1,
074.
16 23
.18
(116
.37)
70.2
6 6,
149.
82 57
9.72
- 47
7.33
14.0
4 13
.83
1,05
6.84
5,09
2.98
4,54
5.51
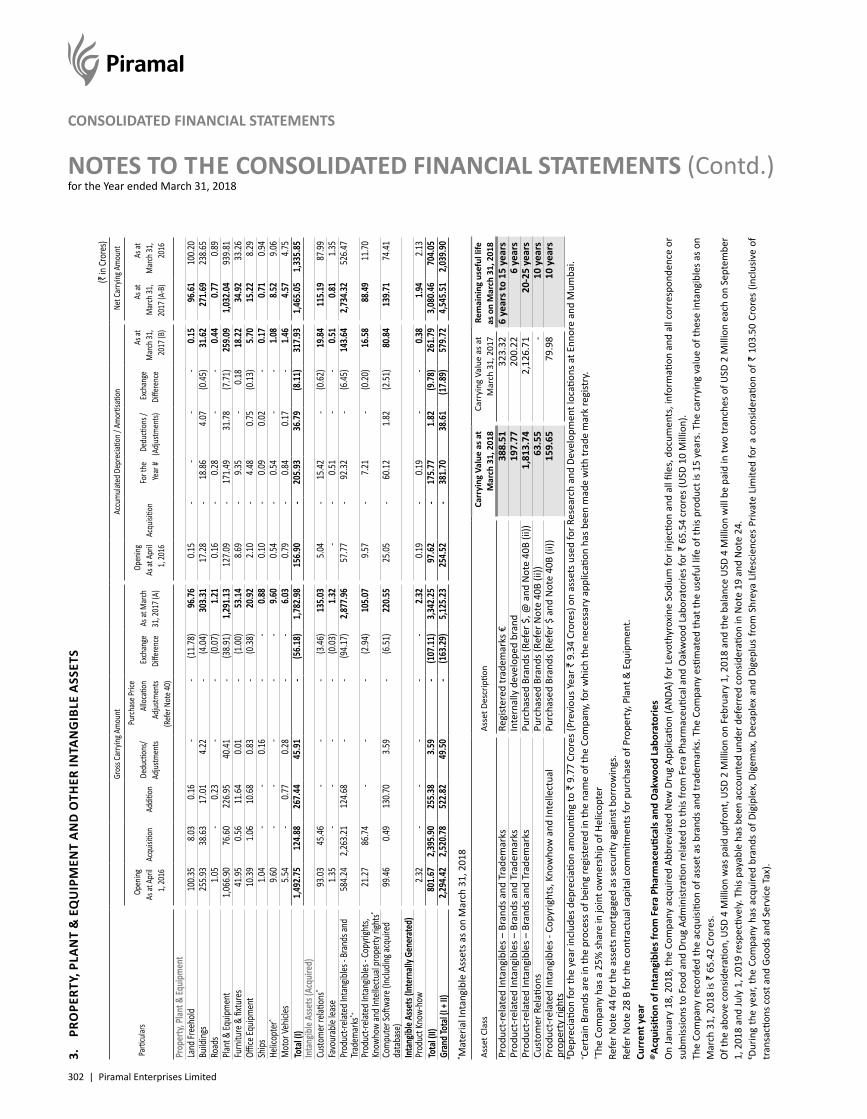
302 | Piramal Enterprises Limited
NOTES TO THE CONSOLIDATED FINANCIAL STATEMENTS (Contd.)for the Year ended March 31, 2018
CONSOLIDATED FINANCIAL STATEMENTS (`
in Cr
ores
)
Parti
cular
s
Gro
ss Ca
rrying
Am
ount
Acc
umula
ted D
epre
ciatio
n / A
mor
tisati
on N
et Ca
rrying
Am
ount
Ope
ning
As at
Apr
il 1,
2016
Acq
uisitio
n A
dditio
n D
educ
tions
/ Ad
justm
ents
Purch
ase P
rice
Alloc
ation
Adjus
tmen
ts (R
efer N
ote 4
0)
Exch
ange
Di
ffere
nce
As a
t Mar
ch
31, 2
017 (
A)
Ope
ning
As at
Apr
il 1,
2016
Acq
uisitio
n Fo
r the
Ye
ar #
Ded
uctio
ns /
(Adju
stmen
ts) Ex
chan
ge
Diffe
renc
e
As a
t M
arch
31,
2017
(B)
As a
t M
arch
31,
2017
(A-B
)
As a
t M
arch
31,
2016
Prop
erty,
Plan
t & Eq
uipm
ent
Land
Free
hold
100.3
5 8.
03 0.
16 -
- (1
1.78)
96.76
0.15
- -
- -
0.15
96.61
100.2
0Bu
ilding
s 25
5.93
38.63
17.01
4.22
- (4
.04)
303.3
1 17
.28 -
18.86
4.07
(0.45
) 31
.62 27
1.69
238.6
5Ro
ads
1.05
- 0.
23 -
- (0
.07)
1.21
0.16
- 0.
28 -
- 0.
44 0.
77 0.
89Pla
nt &
Equip
men
t 1,
066.9
0 76
.60 22
6.95
40.41
- (3
8.91)
1,29
1.13
127.0
9 -
171.4
9 31
.78 (7
.71)
259.0
9 1,
032.0
4 93
9.81
Furn
iture
& fix
ture
s 41
.95 0.
56 11
.64 0.
01 -
(1.00
) 53
.14 8.
69 -
9.35
- 0.
18 18
.22 34
.92 33
.26Offi
ce Eq
uipm
ent
10.39
1.06
10.68
0.83
- (0
.38)
20.92
2.10
- 4.
48 0.
75 (0
.13)
5.70
15.22
8.29
Ships
1.04
- -
0.16
- -
0.88
0.10
- 0.
09 0.
02 -
0.17
0.71
0.94
Helic
opte
r^ 9.
60 -
- -
- -
9.60
0.54
- 0.
54 -
- 1.
08 8.
52 9.
06M
otor
Vehic
les 5.
54 -
0.77
0.28
- -
6.03
0.79
- 0.
84 0.
17 -
1.46
4.57
4.75
Tota
l (I)
1,49
2.75
124.
88 26
7.44
45.9
1 -
(56.
18)
1,78
2.98
156.
90 -
205.
93 36
.79
(8.1
1) 31
7.93
1,46
5.05
1,33
5.85
Inta
ngibl
e Ass
ets (
Acqu
ired)
Custo
mer
relati
ons*
93.03
45.46
- -
- (3
.46)
135.0
3 5.
04 -
15.42
- (0
.62)
19.84
115.1
9 87
.99Fa
vour
able
lease
1.35
- -
- -
(0.03
) 1.
32 -
- 0.
51 -
- 0.
51 0.
81 1.
35Pr
oduc
t-rela
ted I
ntan
gibles
- Bra
nds a
nd
Trade
mar
ks*+
584.2
4 2,
263.2
1 12
4.68
- -
(94.1
7) 2,
877.9
6 57
.77 -
92.32
- (6
.45)
143.6
4 2,
734.3
2 52
6.47
Prod
uct-r
elate
d Int
angib
les - C
opyr
ights,
Kn
owho
w an
d Int
ellec
tual
prop
erty
right
s* 21
.27 86
.74 -
- -
(2.94
) 10
5.07
9.57
- 7.
21 -
(0.20
) 16
.58 88
.49 11
.70
Com
pute
r Soft
ware
(Inclu
ding a
cquir
ed
data
base
) 99
.46 0.
49 13
0.70
3.59
- (6
.51)
220.5
5 25
.05 -
60.12
1.82
(2.51
) 80
.84 13
9.71
74.41
Inta
ngibl
e Ass
ets (
Inte
rnall
y Gen
erat
ed)
Prod
uct K
now-
how
2.32
- -
- -
- 2.
32 0.
19 -
0.19
- -
0.38
1.94
2.13
Tota
l (II)
801.
67 2,
395.
90 25
5.38
3.59
- (1
07.1
1) 3,
342.
25 97
.62
- 17
5.77
1.82
(9.7
8) 26
1.79
3,08
0.46
704.
05Gr
and T
otal
(I + I
I) 2,
294.
42 2,
520.
78 52
2.82
49.5
0 -
(163
.29)
5,12
5.23
254.
52 -
381.
70 38
.61
(17.
89)
579.
72 4,
545.
51 2,
039.
90* M
ater
ial I
ntan
gibl
e As
sets
as o
n M
arch
31,
201
8
Asse
t Cla
ssAs
set D
escr
iptio
nCa
rryi
ng V
alue
as a
t M
arch
31,
201
8Ca
rryi
ng V
alue
as a
t M
arch
31,
201
7Re
mai
ning
use
ful l
ife
as o
n M
arch
31,
201
8Pr
oduc
t-rel
ated
Inta
ngib
les –
Bra
nds a
nd T
rade
mar
ksRe
gist
ered
trad
emar
ks €
388
.51
323
.32
6 ye
ars t
o 15
yea
rsPr
oduc
t-rel
ated
Inta
ngib
les –
Bra
nds a
nd T
rade
mar
ksIn
tern
ally
dev
elop
ed b
rand
197
.77
200
.22
6 ye
ars
Prod
uct-r
elat
ed In
tang
ible
s – B
rand
s and
Tra
dem
arks
Purc
hase
d Br
ands
(Ref
er $
, @ a
nd N
ote
40B
(ii))
1,8
13.7
4 2
,126
.71
20-2
5 ye
ars
Cust
omer
Rel
ation
sPu
rcha
sed
Bran
ds (R
efer
Not
e 40
B (ii
)) 6
3.55
-10
yea
rsPr
oduc
t-rel
ated
Inta
ngib
les -
Cop
yrig
hts,
Kno
who
w a
nd In
telle
ctua
l pr
oper
ty ri
ghts
Purc
hase
d Br
ands
(Ref
er $
and
Not
e 40
B (ii
)) 1
59.6
5 7
9.98
10 y
ears
# Depr
ecia
tion
for t
he y
ear i
nclu
des d
epre
ciati
on a
mou
nting
to `
9.7
7 Cr
ores
(Pre
viou
s Yea
r ` 9
.34
Cror
es) o
n as
sets
use
d fo
r Res
earc
h an
d De
velo
pmen
t loc
ation
s at E
nnor
e an
d M
umba
i.+ Ce
rtai
n Br
ands
are
in th
e pr
oces
s of b
eing
regi
ster
ed in
the
nam
e of
the
Com
pany
, for
whi
ch th
e ne
cess
ary
appl
icati
on h
as b
een
mad
e w
ith tr
ade
mar
k re
gist
ry.
^ The
Com
pany
has
a 2
5% sh
are
in jo
int o
wne
rshi
p of
Hel
icop
ter
Refe
r Not
e 44
for t
he a
sset
s mor
tgag
ed a
s sec
urity
aga
inst
bor
row
ings
.Re
fer N
ote
28 B
for t
he c
ontr
actu
al c
apita
l com
mitm
ents
for p
urch
ase
of P
rope
rty,
Plan
t & E
quip
men
t.Cu
rren
t yea
r@
Acqu
isiti
on o
f Int
angi
bles
from
Fer
a Ph
arm
aceu
tical
s and
Oak
woo
d La
bora
torie
sO
n Ja
nuar
y 18
, 201
8, th
e Co
mpa
ny a
cqui
red
Abbr
evia
ted
New
Dru
g Ap
plic
ation
(AN
DA) f
or L
evot
hyro
xine
Sod
ium
for i
njec
tion
and
all fi
les,
doc
umen
ts, i
nfor
mati
on a
nd a
ll co
rres
pond
ence
or
subm
issio
ns to
Foo
d an
d Dr
ug A
dmin
istra
tion
rela
ted
to th
is fr
om F
era
Phar
mac
eutic
al a
nd O
akw
ood
Labo
rato
ries f
or `
65.
54 c
rore
s (U
SD 1
0 M
illio
n).
The
Com
pany
reco
rded
the
acqu
isitio
n of
ass
et a
s br
ands
and
trad
emar
ks. T
he C
ompa
ny e
stim
ated
that
the
usef
ul li
fe o
f thi
s pr
oduc
t is
15 y
ears
. The
car
ryin
g va
lue
of th
ese
inta
ngib
les
as o
n M
arch
31,
201
8 is
` 65
.42
Cror
es.
Of t
he a
bove
con
sider
ation
, USD
4 M
illio
n w
as p
aid
upfr
ont,
USD
2 M
illio
n on
Feb
ruar
y 1,
201
8 an
d th
e ba
lanc
e U
SD 4
Mill
ion
will
be
paid
in tw
o tr
anch
es o
f USD
2 M
illio
n ea
ch o
n Se
ptem
ber
1, 2
018
and
July
1, 2
019
resp
ectiv
ely.
Thi
s pay
able
has
bee
n ac
coun
ted
unde
r def
erre
d co
nsid
erati
on in
Not
e 19
and
Not
e 24
.€ Du
ring
the
year
, the
Com
pany
has
acq
uire
d br
ands
of D
igip
lex,
Dig
emax
, Dec
aple
x an
d Di
gepl
us fr
om S
hrey
a Li
fesc
ienc
es P
rivat
e Li
mite
d fo
r a c
onsid
erati
on o
f ` 1
03.5
0 Cr
ores
(inc
lusiv
e of
tr
ansa
ction
s cos
t and
Goo
ds a
nd S
ervi
ce T
ax).
3.
PRO
PERT
Y, P
LAN
T &
EQ
UIP
MEN
T A
ND
OTH
ER IN
TAN
GIB
LE A
SSET
S
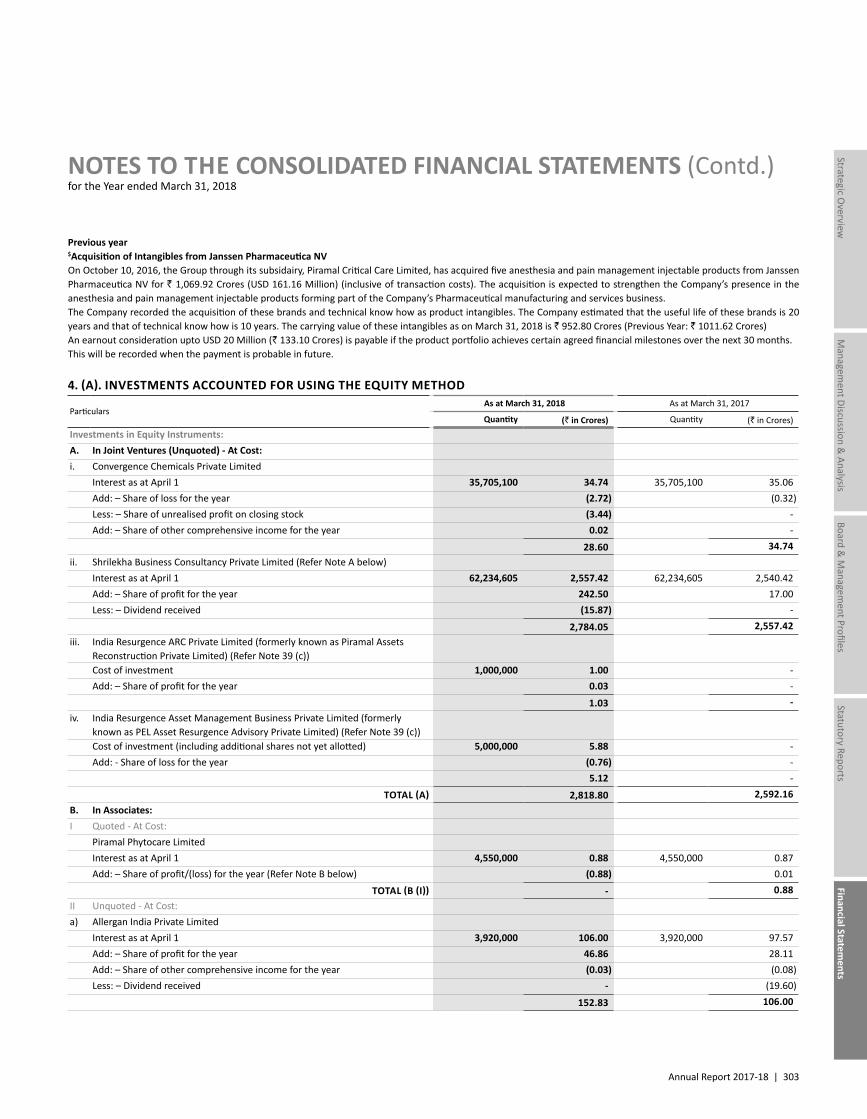
Annual Report 2017-18 | 303
Managem
ent Discussion & Analysis
Strategic Overview
Board &
Managem
ent ProfilesStatutory Reports
Financial Statements
NOTES TO THE CONSOLIDATED FINANCIAL STATEMENTS (Contd.)for the Year ended March 31, 2018
Previous year$Acquisition of Intangibles from Janssen Pharmaceutica NVOn October 10, 2016, the Group through its subsidairy, Piramal Critical Care Limited, has acquired five anesthesia and pain management injectable products from Janssen Pharmaceutica NV for ` 1,069.92 Crores (USD 161.16 Million) (inclusive of transaction costs). The acquisition is expected to strengthen the Company’s presence in the anesthesia and pain management injectable products forming part of the Company’s Pharmaceutical manufacturing and services business.The Company recorded the acquisition of these brands and technical know how as product intangibles. The Company estimated that the useful life of these brands is 20 years and that of technical know how is 10 years. The carrying value of these intangibles as on March 31, 2018 is ` 952.80 Crores (Previous Year: ` 1011.62 Crores)An earnout consideration upto USD 20 Million (` 133.10 Crores) is payable if the product portfolio achieves certain agreed financial milestones over the next 30 months. This will be recorded when the payment is probable in future.
4. (A). INVESTMENTS ACCOUNTED FOR USING THE EQUITY METHOD
Particulars As at March 31, 2018 As at March 31, 2017
Quantity (` in Crores) Quantity (` in Crores)Investments in Equity Instruments:A. In Joint Ventures (Unquoted) - At Cost:i. Convergence Chemicals Private Limited
Interest as at April 1 35,705,100 34.74 35,705,100 35.06Add: – Share of loss for the year (2.72) (0.32)Less: – Share of unrealised profit on closing stock (3.44) -Add: – Share of other comprehensive income for the year 0.02 -
28.60 34.74ii. Shrilekha Business Consultancy Private Limited (Refer Note A below)
Interest as at April 1 62,234,605 2,557.42 62,234,605 2,540.42Add: – Share of profit for the year 242.50 17.00Less: – Dividend received (15.87) -
2,784.05 2,557.42iii. India Resurgence ARC Private Limited (formerly known as Piramal Assets
Reconstruction Private Limited) (Refer Note 39 (c))Cost of investment 1,000,000 1.00 -Add: – Share of profit for the year 0.03 -
1.03 -iv. India Resurgence Asset Management Business Private Limited (formerly
known as PEL Asset Resurgence Advisory Private Limited) (Refer Note 39 (c))Cost of investment (including additional shares not yet allotted) 5,000,000 5.88 -Add: - Share of loss for the year (0.76) -
5.12 -TOTAL (A) 2,818.80 2,592.16
B. In Associates:I Quoted - At Cost:
Piramal Phytocare LimitedInterest as at April 1 4,550,000 0.88 4,550,000 0.87Add: – Share of profit/(loss) for the year (Refer Note B below) (0.88) 0.01
TOTAL (B (I)) - 0.88II Unquoted - At Cost:a) Allergan India Private Limited
Interest as at April 1 3,920,000 106.00 3,920,000 97.57Add: – Share of profit for the year 46.86 28.11Add: – Share of other comprehensive income for the year (0.03) (0.08)Less: – Dividend received - (19.60)
152.83 106.00
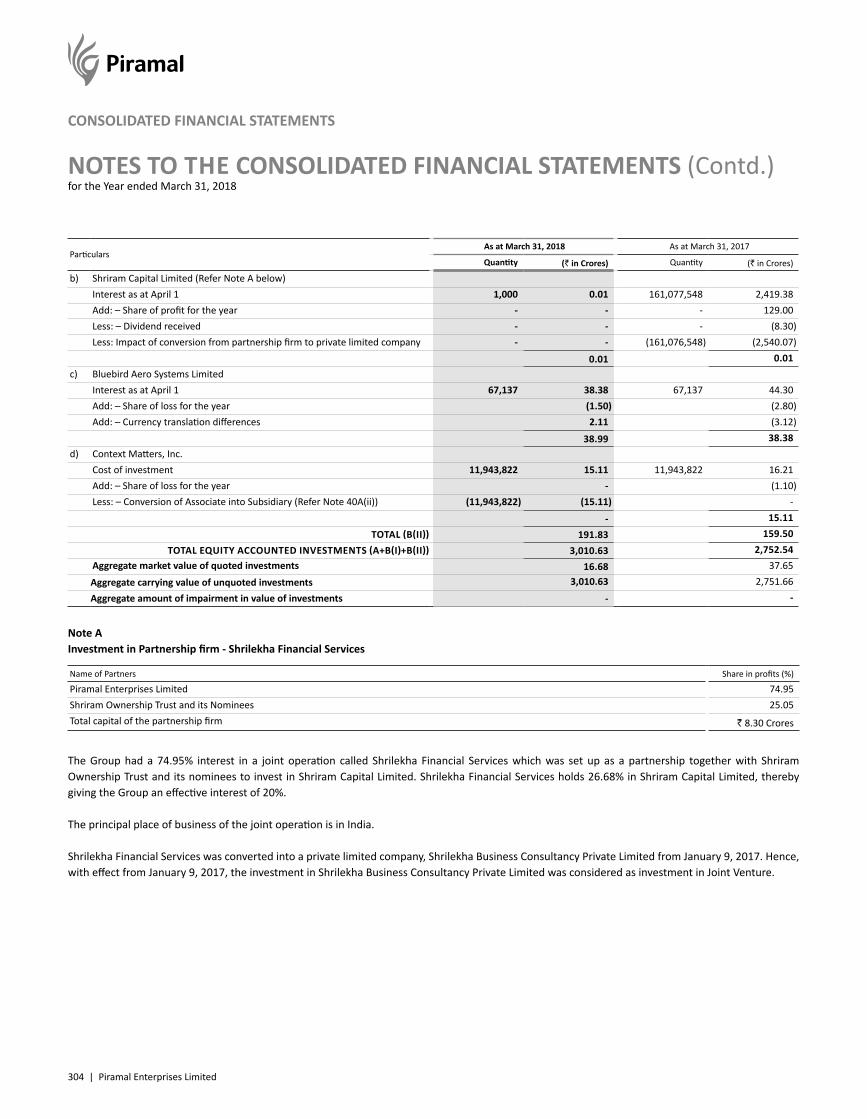
304 | Piramal Enterprises Limited
NOTES TO THE CONSOLIDATED FINANCIAL STATEMENTS (Contd.)for the Year ended March 31, 2018
CONSOLIDATED FINANCIAL STATEMENTS
Particulars As at March 31, 2018 As at March 31, 2017
Quantity (` in Crores) Quantity (` in Crores)
b) Shriram Capital Limited (Refer Note A below)Interest as at April 1 1,000 0.01 161,077,548 2,419.38Add: – Share of profit for the year - - - 129.00Less: – Dividend received - - - (8.30)Less: Impact of conversion from partnership firm to private limited company - - (161,076,548) (2,540.07)
0.01 0.01c) Bluebird Aero Systems Limited
Interest as at April 1 67,137 38.38 67,137 44.30Add: – Share of loss for the year (1.50) (2.80)Add: – Currency translation differences 2.11 (3.12)
38.99 38.38d) Context Matters, Inc.
Cost of investment 11,943,822 15.11 11,943,822 16.21Add: – Share of loss for the year - (1.10)Less: – Conversion of Associate into Subsidiary (Refer Note 40A(ii)) (11,943,822) (15.11) -
- 15.11TOTAL (B(II)) 191.83 159.50
TOTAL EQUITY ACCOUNTED INVESTMENTS (A+B(I)+B(II)) 3,010.63 2,752.54Aggregate market value of quoted investments 16.68 37.65Aggregate carrying value of unquoted investments 3,010.63 2,751.66Aggregate amount of impairment in value of investments - -
Note AInvestment in Partnership firm - Shrilekha Financial Services
Name of Partners Share in profits (%)
Piramal Enterprises Limited 74.95Shriram Ownership Trust and its Nominees 25.05Total capital of the partnership firm ` 8.30 Crores
The Group had a 74.95% interest in a joint operation called Shrilekha Financial Services which was set up as a partnership together with Shriram Ownership Trust and its nominees to invest in Shriram Capital Limited. Shrilekha Financial Services holds 26.68% in Shriram Capital Limited, thereby giving the Group an effective interest of 20%.
The principal place of business of the joint operation is in India.
Shrilekha Financial Services was converted into a private limited company, Shrilekha Business Consultancy Private Limited from January 9, 2017. Hence, with effect from January 9, 2017, the investment in Shrilekha Business Consultancy Private Limited was considered as investment in Joint Venture.
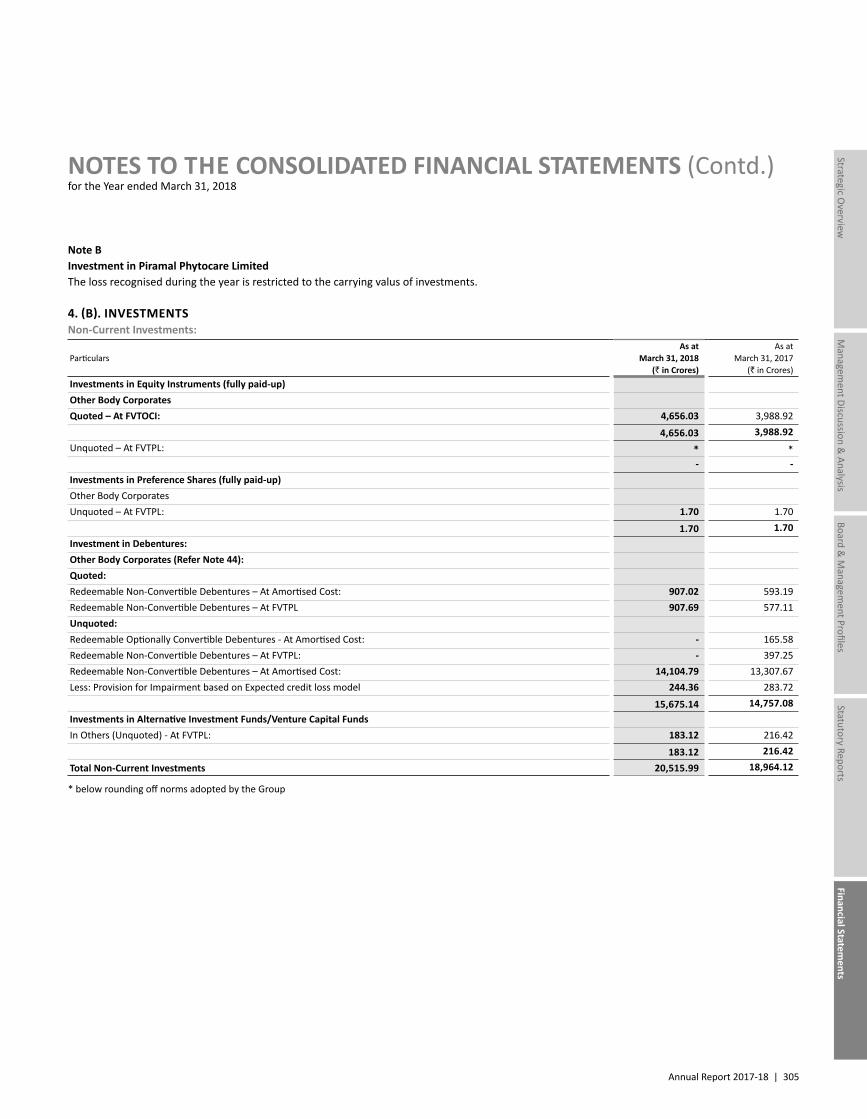
Annual Report 2017-18 | 305
Managem
ent Discussion & Analysis
Strategic Overview
Board &
Managem
ent ProfilesStatutory Reports
Financial Statements
NOTES TO THE CONSOLIDATED FINANCIAL STATEMENTS (Contd.)for the Year ended March 31, 2018
Note BInvestment in Piramal Phytocare LimitedThe loss recognised during the year is restricted to the carrying valus of investments.
4. (B). INVESTMENTSNon-Current Investments:
ParticularsAs at
March 31, 2018(` in Crores)
As at March 31, 2017
(` in Crores)Investments in Equity Instruments (fully paid-up)Other Body CorporatesQuoted – At FVTOCI: 4,656.03 3,988.92
4,656.03 3,988.92Unquoted – At FVTPL: * *
- -Investments in Preference Shares (fully paid-up)Other Body CorporatesUnquoted – At FVTPL: 1.70 1.70
1.70 1.70Investment in Debentures:Other Body Corporates (Refer Note 44):Quoted:Redeemable Non-Convertible Debentures – At Amortised Cost: 907.02 593.19Redeemable Non-Convertible Debentures – At FVTPL 907.69 577.11Unquoted:Redeemable Optionally Convertible Debentures - At Amortised Cost: - 165.58Redeemable Non-Convertible Debentures – At FVTPL: - 397.25Redeemable Non-Convertible Debentures – At Amortised Cost: 14,104.79 13,307.67Less: Provision for Impairment based on Expected credit loss model 244.36 283.72
15,675.14 14,757.08Investments in Alternative Investment Funds/Venture Capital FundsIn Others (Unquoted) - At FVTPL: 183.12 216.42
183.12 216.42
Total Non-Current Investments 20,515.99 18,964.12
* below rounding off norms adopted by the Group
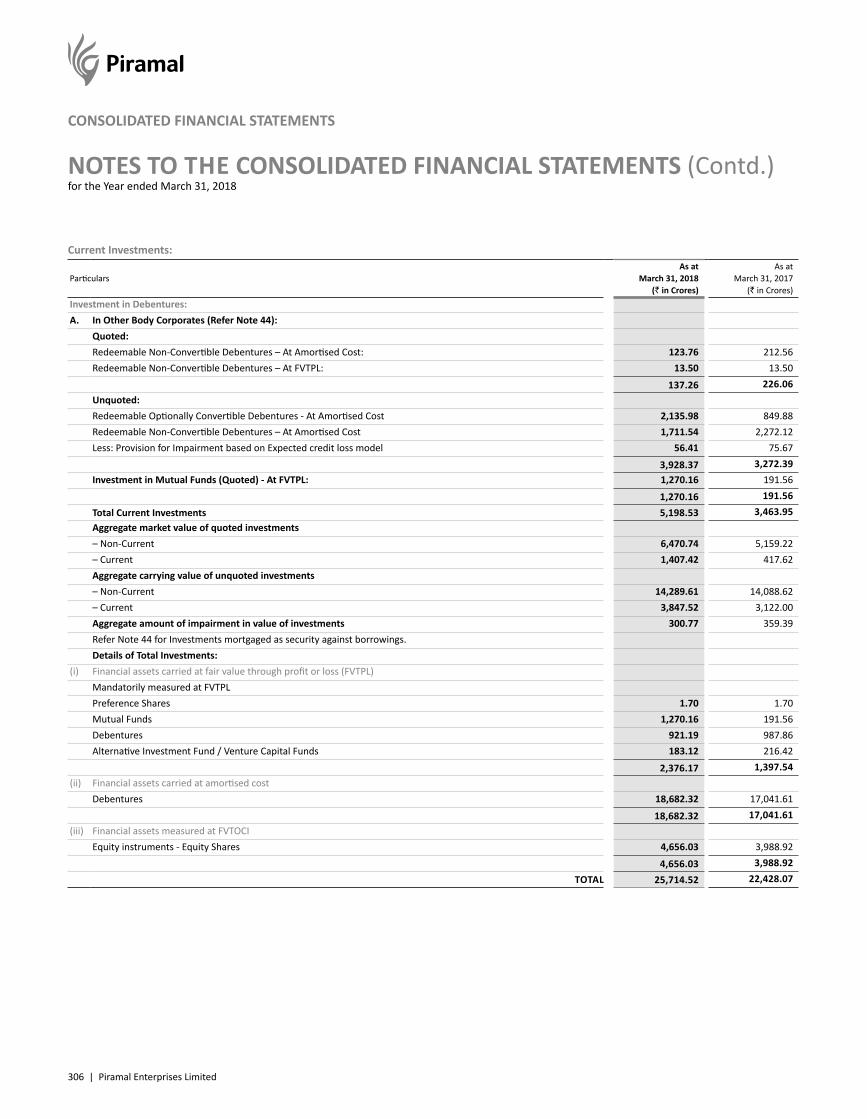
306 | Piramal Enterprises Limited
NOTES TO THE CONSOLIDATED FINANCIAL STATEMENTS (Contd.)for the Year ended March 31, 2018
CONSOLIDATED FINANCIAL STATEMENTS
Current Investments:
ParticularsAs at
March 31, 2018(` in Crores)
As at March 31, 2017
(` in Crores)Investment in Debentures:A. In Other Body Corporates (Refer Note 44):
Quoted:Redeemable Non-Convertible Debentures – At Amortised Cost: 123.76 212.56Redeemable Non-Convertible Debentures – At FVTPL: 13.50 13.50
137.26 226.06Unquoted:Redeemable Optionally Convertible Debentures - At Amortised Cost 2,135.98 849.88Redeemable Non-Convertible Debentures – At Amortised Cost 1,711.54 2,272.12Less: Provision for Impairment based on Expected credit loss model 56.41 75.67
3,928.37 3,272.39Investment in Mutual Funds (Quoted) - At FVTPL: 1,270.16 191.56
1,270.16 191.56
Total Current Investments 5,198.53 3,463.95Aggregate market value of quoted investments– Non-Current 6,470.74 5,159.22– Current 1,407.42 417.62Aggregate carrying value of unquoted investments– Non-Current 14,289.61 14,088.62– Current 3,847.52 3,122.00Aggregate amount of impairment in value of investments 300.77 359.39Refer Note 44 for Investments mortgaged as security against borrowings.Details of Total Investments:
(i) Financial assets carried at fair value through profit or loss (FVTPL)Mandatorily measured at FVTPLPreference Shares 1.70 1.70Mutual Funds 1,270.16 191.56Debentures 921.19 987.86Alternative Investment Fund / Venture Capital Funds 183.12 216.42
2,376.17 1,397.54(ii) Financial assets carried at amortised cost
Debentures 18,682.32 17,041.61
18,682.32 17,041.61(iii) Financial assets measured at FVTOCI
Equity instruments - Equity Shares 4,656.03 3,988.92
4,656.03 3,988.92TOTAL 25,714.52 22,428.07
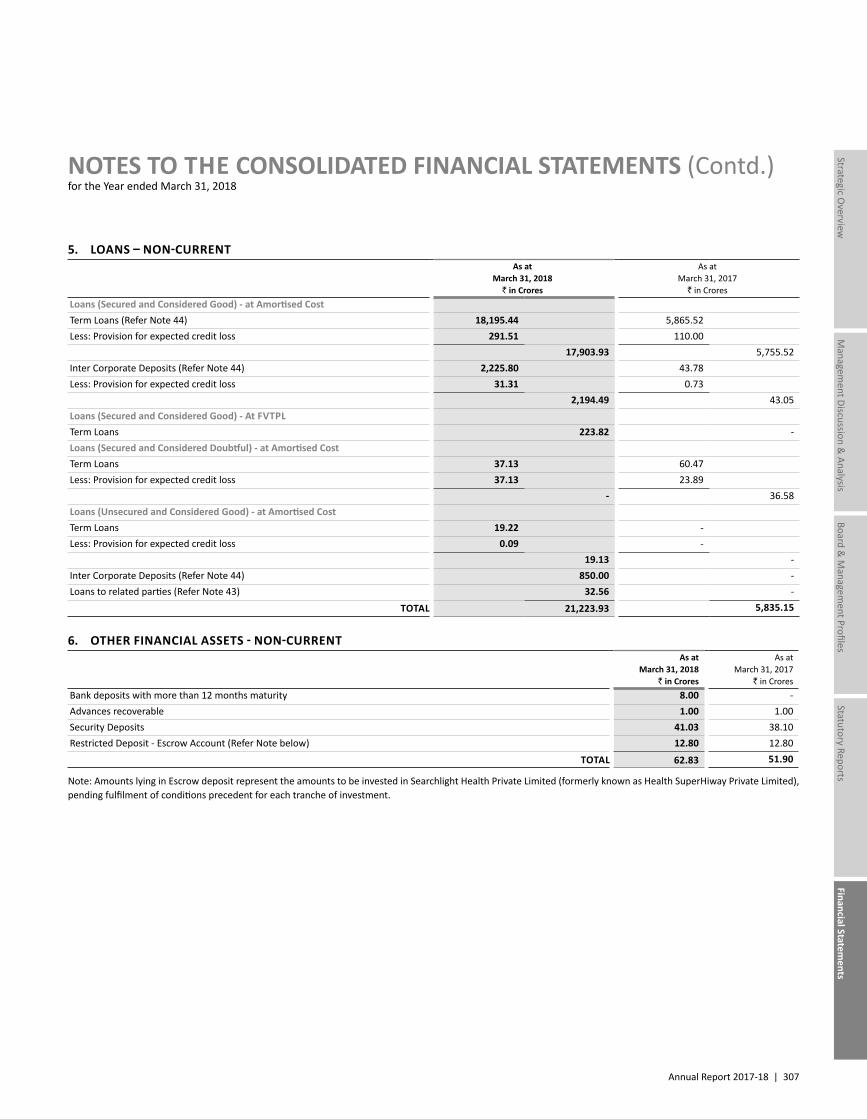
Annual Report 2017-18 | 307
Managem
ent Discussion & Analysis
Strategic Overview
Board &
Managem
ent ProfilesStatutory Reports
Financial Statements
NOTES TO THE CONSOLIDATED FINANCIAL STATEMENTS (Contd.)for the Year ended March 31, 2018
5. LOANS – NON-CURRENT As at
March 31, 2018 ` in Crores
As at March 31, 2017
` in CroresLoans (Secured and Considered Good) - at Amortised CostTerm Loans (Refer Note 44) 18,195.44 5,865.52Less: Provision for expected credit loss 291.51 110.00
17,903.93 5,755.52Inter Corporate Deposits (Refer Note 44) 2,225.80 43.78Less: Provision for expected credit loss 31.31 0.73
2,194.49 43.05Loans (Secured and Considered Good) - At FVTPLTerm Loans 223.82 -Loans (Secured and Considered Doubtful) - at Amortised CostTerm Loans 37.13 60.47Less: Provision for expected credit loss 37.13 23.89
- 36.58Loans (Unsecured and Considered Good) - at Amortised CostTerm Loans 19.22 -Less: Provision for expected credit loss 0.09 -
19.13 -Inter Corporate Deposits (Refer Note 44) 850.00 -Loans to related parties (Refer Note 43) 32.56 -
TOTAL 21,223.93 5,835.15
6. OTHER FINANCIAL ASSETS - NON-CURRENT As at
March 31, 2018 ` in Crores
As at March 31, 2017
` in CroresBank deposits with more than 12 months maturity 8.00 -Advances recoverable 1.00 1.00Security Deposits 41.03 38.10Restricted Deposit - Escrow Account (Refer Note below) 12.80 12.80
TOTAL 62.83 51.90
Note: Amounts lying in Escrow deposit represent the amounts to be invested in Searchlight Health Private Limited (formerly known as Health SuperHiway Private Limited), pending fulfilment of conditions precedent for each tranche of investment.
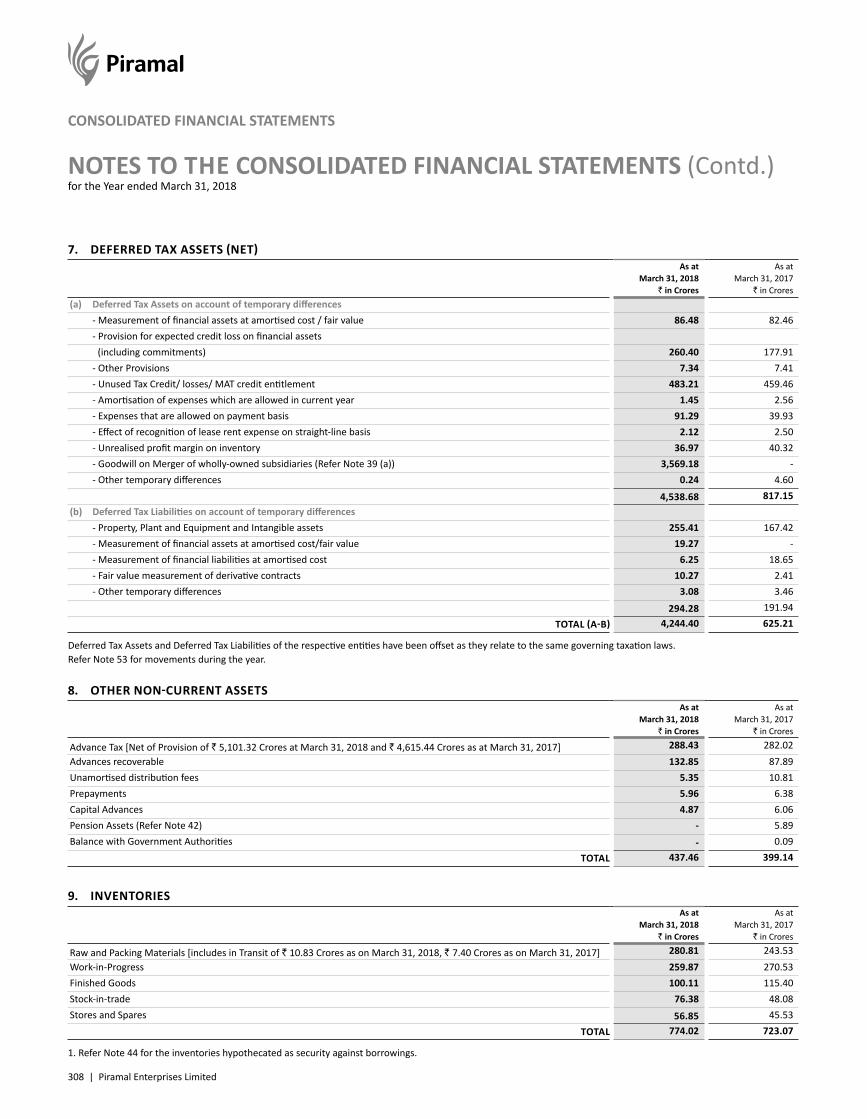
308 | Piramal Enterprises Limited
NOTES TO THE CONSOLIDATED FINANCIAL STATEMENTS (Contd.)for the Year ended March 31, 2018
CONSOLIDATED FINANCIAL STATEMENTS
7. DEFERRED TAX ASSETS (NET) As at
March 31, 2018 ` in Crores
As at March 31, 2017
` in Crores(a) Deferred Tax Assets on account of temporary differences - Measurement of financial assets at amortised cost / fair value 86.48 82.46 - Provision for expected credit loss on financial assets (including commitments) 260.40 177.91 - Other Provisions 7.34 7.41 - Unused Tax Credit/ losses/ MAT credit entitlement 483.21 459.46 - Amortisation of expenses which are allowed in current year 1.45 2.56 - Expenses that are allowed on payment basis 91.29 39.93 - Effect of recognition of lease rent expense on straight-line basis 2.12 2.50 - Unrealised profit margin on inventory 36.97 40.32 - Goodwill on Merger of wholly-owned subsidiaries (Refer Note 39 (a)) 3,569.18 - - Other temporary differences 0.24 4.60
4,538.68 817.15(b) Deferred Tax Liabilities on account of temporary differences - Property, Plant and Equipment and Intangible assets 255.41 167.42 - Measurement of financial assets at amortised cost/fair value 19.27 - - Measurement of financial liabilities at amortised cost 6.25 18.65 - Fair value measurement of derivative contracts 10.27 2.41 - Other temporary differences 3.08 3.46
294.28 191.94 TOTAL (A-B) 4,244.40 625.21
Deferred Tax Assets and Deferred Tax Liabilities of the respective entities have been offset as they relate to the same governing taxation laws.Refer Note 53 for movements during the year.
8. OTHER NON-CURRENT ASSETS As at
March 31, 2018 ` in Crores
As at March 31, 2017
` in Crores
Advance Tax [Net of Provision of ` 5,101.32 Crores at March 31, 2018 and ` 4,615.44 Crores as at March 31, 2017] 288.43 282.02Advances recoverable 132.85 87.89Unamortised distribution fees 5.35 10.81Prepayments 5.96 6.38Capital Advances 4.87 6.06Pension Assets (Refer Note 42) - 5.89Balance with Government Authorities - 0.09
TOTAL 437.46 399.14
9. INVENTORIES As at
March 31, 2018 ` in Crores
As at March 31, 2017
` in Crores
Raw and Packing Materials [includes in Transit of ` 10.83 Crores as on March 31, 2018, ` 7.40 Crores as on March 31, 2017] 280.81 243.53Work-in-Progress 259.87 270.53Finished Goods 100.11 115.40Stock-in-trade 76.38 48.08Stores and Spares 56.85 45.53
TOTAL 774.02 723.07
1. Refer Note 44 for the inventories hypothecated as security against borrowings.
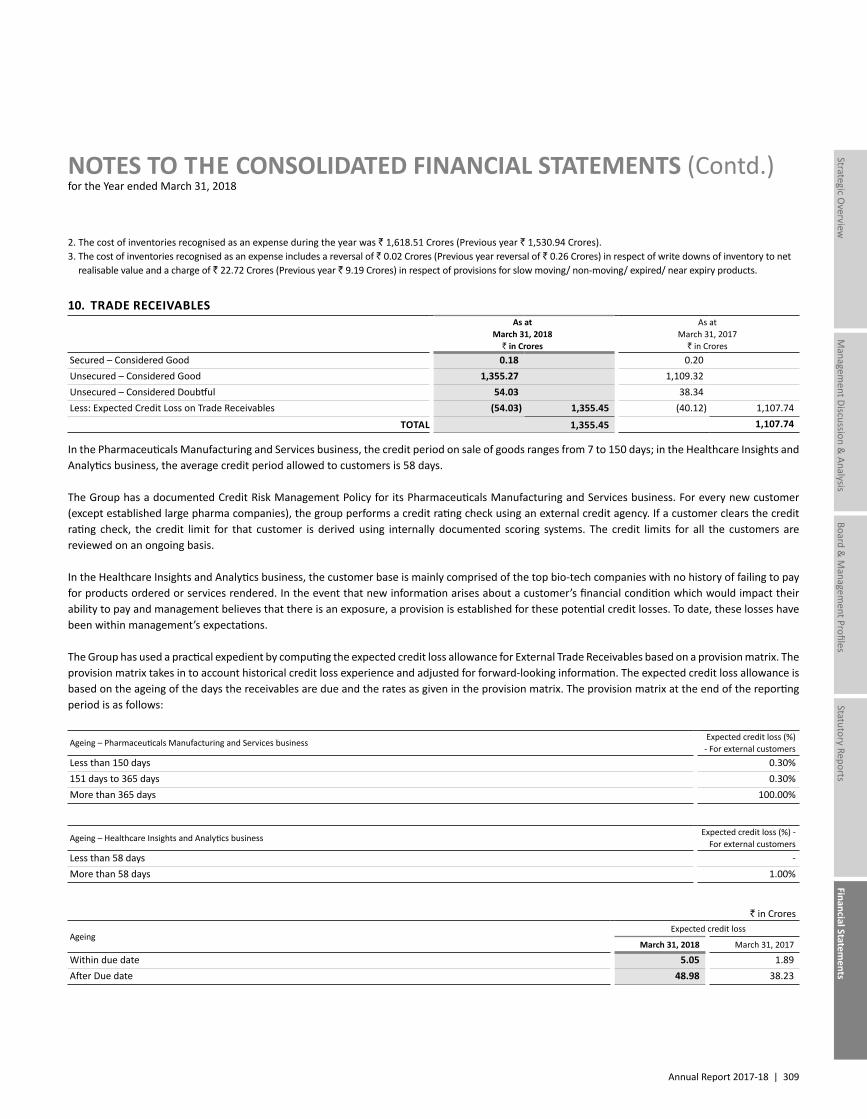
Annual Report 2017-18 | 309
Managem
ent Discussion & Analysis
Strategic Overview
Board &
Managem
ent ProfilesStatutory Reports
Financial Statements
NOTES TO THE CONSOLIDATED FINANCIAL STATEMENTS (Contd.)for the Year ended March 31, 2018
2. The cost of inventories recognised as an expense during the year was ` 1,618.51 Crores (Previous year ` 1,530.94 Crores).3. The cost of inventories recognised as an expense includes a reversal of ` 0.02 Crores (Previous year reversal of ` 0.26 Crores) in respect of write downs of inventory to net
realisable value and a charge of ` 22.72 Crores (Previous year ` 9.19 Crores) in respect of provisions for slow moving/ non-moving/ expired/ near expiry products.
10. TRADE RECEIVABLES As at
March 31, 2018 ` in Crores
As at March 31, 2017
` in CroresSecured – Considered Good 0.18 0.20Unsecured – Considered Good 1,355.27 1,109.32Unsecured – Considered Doubtful 54.03 38.34Less: Expected Credit Loss on Trade Receivables (54.03) 1,355.45 (40.12) 1,107.74
TOTAL 1,355.45 1,107.74
In the Pharmaceuticals Manufacturing and Services business, the credit period on sale of goods ranges from 7 to 150 days; in the Healthcare Insights and Analytics business, the average credit period allowed to customers is 58 days.
The Group has a documented Credit Risk Management Policy for its Pharmaceuticals Manufacturing and Services business. For every new customer (except established large pharma companies), the group performs a credit rating check using an external credit agency. If a customer clears the credit rating check, the credit limit for that customer is derived using internally documented scoring systems. The credit limits for all the customers are reviewed on an ongoing basis.
In the Healthcare Insights and Analytics business, the customer base is mainly comprised of the top bio-tech companies with no history of failing to pay for products ordered or services rendered. In the event that new information arises about a customer’s financial condition which would impact their ability to pay and management believes that there is an exposure, a provision is established for these potential credit losses. To date, these losses have been within management’s expectations.
The Group has used a practical expedient by computing the expected credit loss allowance for External Trade Receivables based on a provision matrix. The provision matrix takes in to account historical credit loss experience and adjusted for forward-looking information. The expected credit loss allowance is based on the ageing of the days the receivables are due and the rates as given in the provision matrix. The provision matrix at the end of the reporting period is as follows:
Ageing – Pharmaceuticals Manufacturing and Services business Expected credit loss (%) - For external customers
Less than 150 days 0.30%151 days to 365 days 0.30%More than 365 days 100.00%
Ageing – Healthcare Insights and Analytics business Expected credit loss (%) -
For external customersLess than 58 days -More than 58 days 1.00%
` in Crores
Ageing Expected credit loss
March 31, 2018 March 31, 2017
Within due date 5.05 1.89After Due date 48.98 38.23
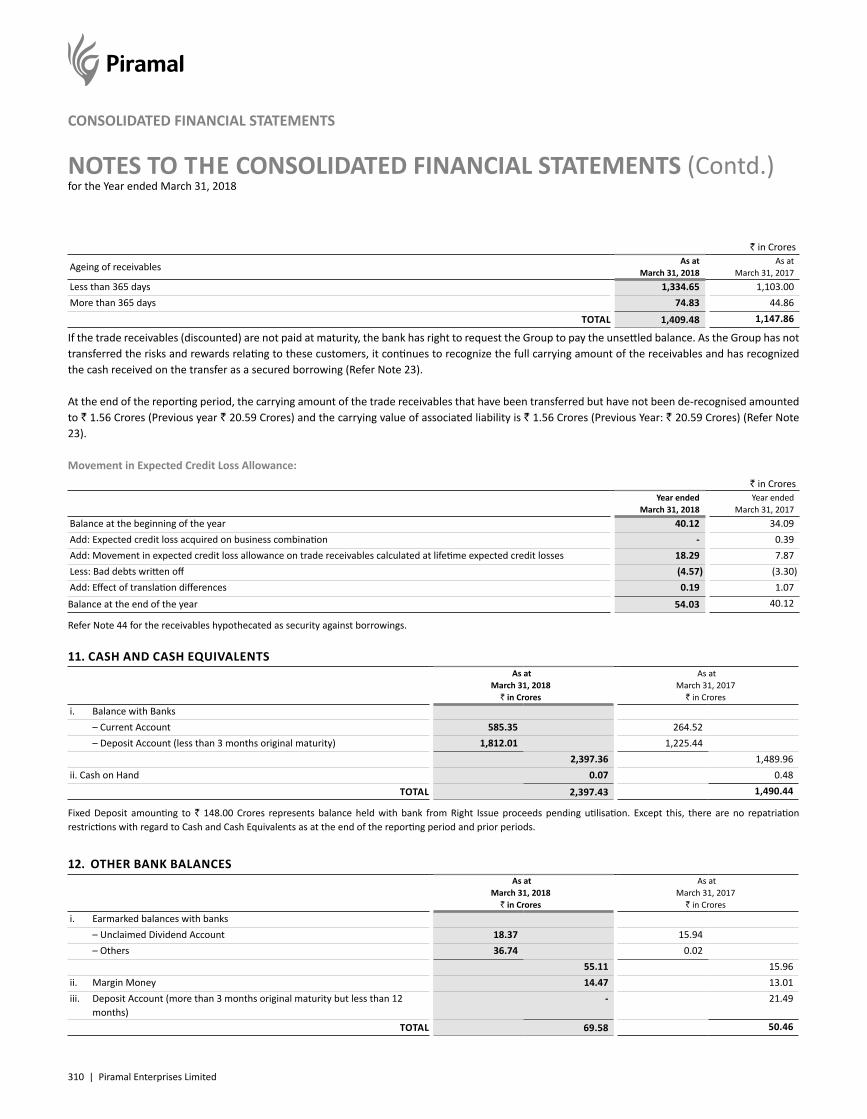
310 | Piramal Enterprises Limited
NOTES TO THE CONSOLIDATED FINANCIAL STATEMENTS (Contd.)for the Year ended March 31, 2018
CONSOLIDATED FINANCIAL STATEMENTS
` in Crores
Ageing of receivables As at March 31, 2018
As at March 31, 2017
Less than 365 days 1,334.65 1,103.00More than 365 days 74.83 44.86
TOTAL 1,409.48 1,147.86
If the trade receivables (discounted) are not paid at maturity, the bank has right to request the Group to pay the unsettled balance. As the Group has not transferred the risks and rewards relating to these customers, it continues to recognize the full carrying amount of the receivables and has recognized the cash received on the transfer as a secured borrowing (Refer Note 23).
At the end of the reporting period, the carrying amount of the trade receivables that have been transferred but have not been de-recognised amounted to ` 1.56 Crores (Previous year ` 20.59 Crores) and the carrying value of associated liability is ` 1.56 Crores (Previous Year: ` 20.59 Crores) (Refer Note 23).
Movement in Expected Credit Loss Allowance: ` in Crores
Year ended March 31, 2018
Year ended March 31, 2017
Balance at the beginning of the year 40.12 34.09Add: Expected credit loss acquired on business combination - 0.39Add: Movement in expected credit loss allowance on trade receivables calculated at lifetime expected credit losses 18.29 7.87Less: Bad debts written off (4.57) (3.30)Add: Effect of translation differences 0.19 1.07Balance at the end of the year 54.03 40.12
Refer Note 44 for the receivables hypothecated as security against borrowings.
11. CASH AND CASH EQUIVALENTS As at
March 31, 2018` in Crores
As at March 31, 2017
` in Croresi. Balance with Banks – Current Account 585.35 264.52 – Deposit Account (less than 3 months original maturity) 1,812.01 1,225.44
2,397.36 1,489.96ii. Cash on Hand 0.07 0.48
TOTAL 2,397.43 1,490.44
Fixed Deposit amounting to ` 148.00 Crores represents balance held with bank from Right Issue proceeds pending utilisation. Except this, there are no repatriation restrictions with regard to Cash and Cash Equivalents as at the end of the reporting period and prior periods.
12. OTHER BANK BALANCES As at
March 31, 2018` in Crores
As at March 31, 2017
` in Croresi. Earmarked balances with banks – Unclaimed Dividend Account 18.37 15.94 – Others 36.74 0.02
55.11 15.96ii. Margin Money 14.47 13.01iii. Deposit Account (more than 3 months original maturity but less than 12
months) - 21.49
TOTAL 69.58 50.46
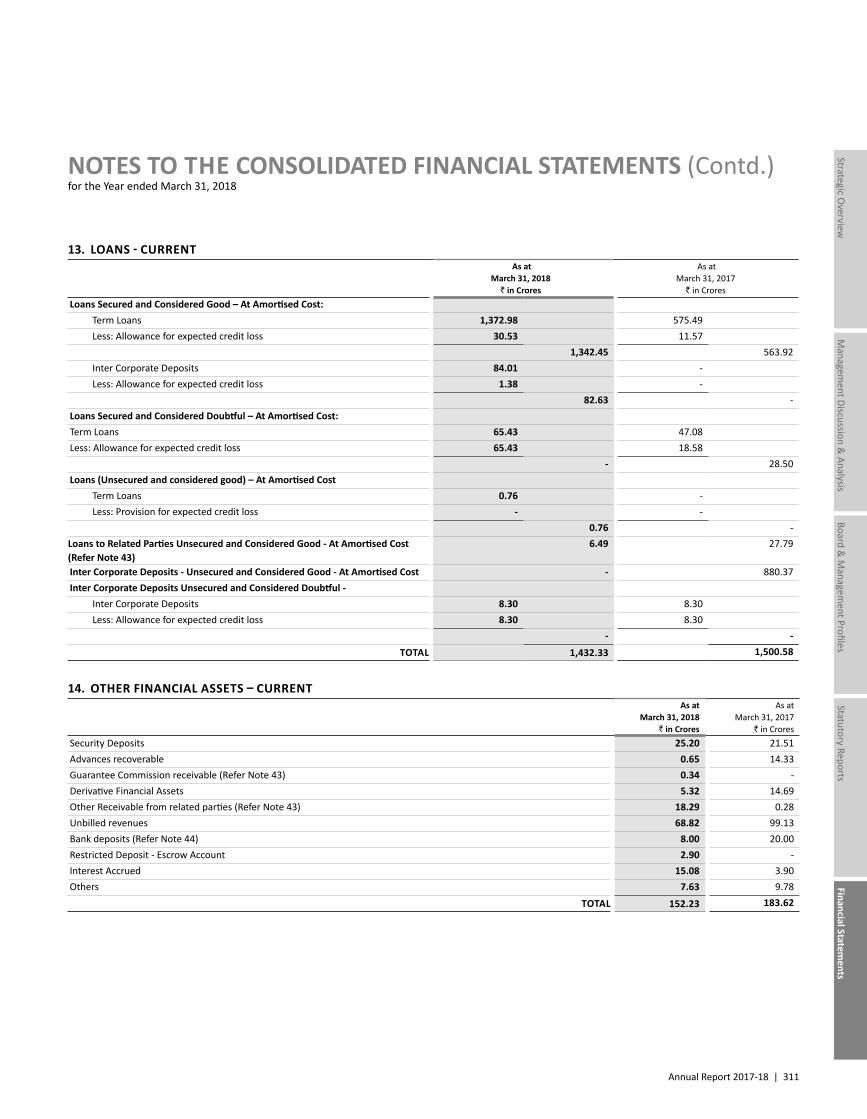
Annual Report 2017-18 | 311
Managem
ent Discussion & Analysis
Strategic Overview
Board &
Managem
ent ProfilesStatutory Reports
Financial Statements
NOTES TO THE CONSOLIDATED FINANCIAL STATEMENTS (Contd.)for the Year ended March 31, 2018
13. LOANS - CURRENT As at
March 31, 2018` in Crores
As at March 31, 2017
` in CroresLoans Secured and Considered Good – At Amortised Cost: Term Loans 1,372.98 575.49 Less: Allowance for expected credit loss 30.53 11.57
1,342.45 563.92 Inter Corporate Deposits 84.01 - Less: Allowance for expected credit loss 1.38 -
82.63 -Loans Secured and Considered Doubtful – At Amortised Cost:Term Loans 65.43 47.08Less: Allowance for expected credit loss 65.43 18.58
- 28.50Loans (Unsecured and considered good) – At Amortised Cost Term Loans 0.76 - Less: Provision for expected credit loss - -
0.76 -Loans to Related Parties Unsecured and Considered Good - At Amortised Cost (Refer Note 43)
6.49 27.79
Inter Corporate Deposits - Unsecured and Considered Good - At Amortised Cost - 880.37Inter Corporate Deposits Unsecured and Considered Doubtful - Inter Corporate Deposits 8.30 8.30 Less: Allowance for expected credit loss 8.30 8.30
- - TOTAL 1,432.33 1,500.58
14. OTHER FINANCIAL ASSETS – CURRENT As at
March 31, 2018 ` in Crores
As at March 31, 2017
` in CroresSecurity Deposits 25.20 21.51Advances recoverable 0.65 14.33Guarantee Commission receivable (Refer Note 43) 0.34 -Derivative Financial Assets 5.32 14.69Other Receivable from related parties (Refer Note 43) 18.29 0.28Unbilled revenues 68.82 99.13Bank deposits (Refer Note 44) 8.00 20.00Restricted Deposit - Escrow Account 2.90 -Interest Accrued 15.08 3.90Others 7.63 9.78
TOTAL 152.23 183.62
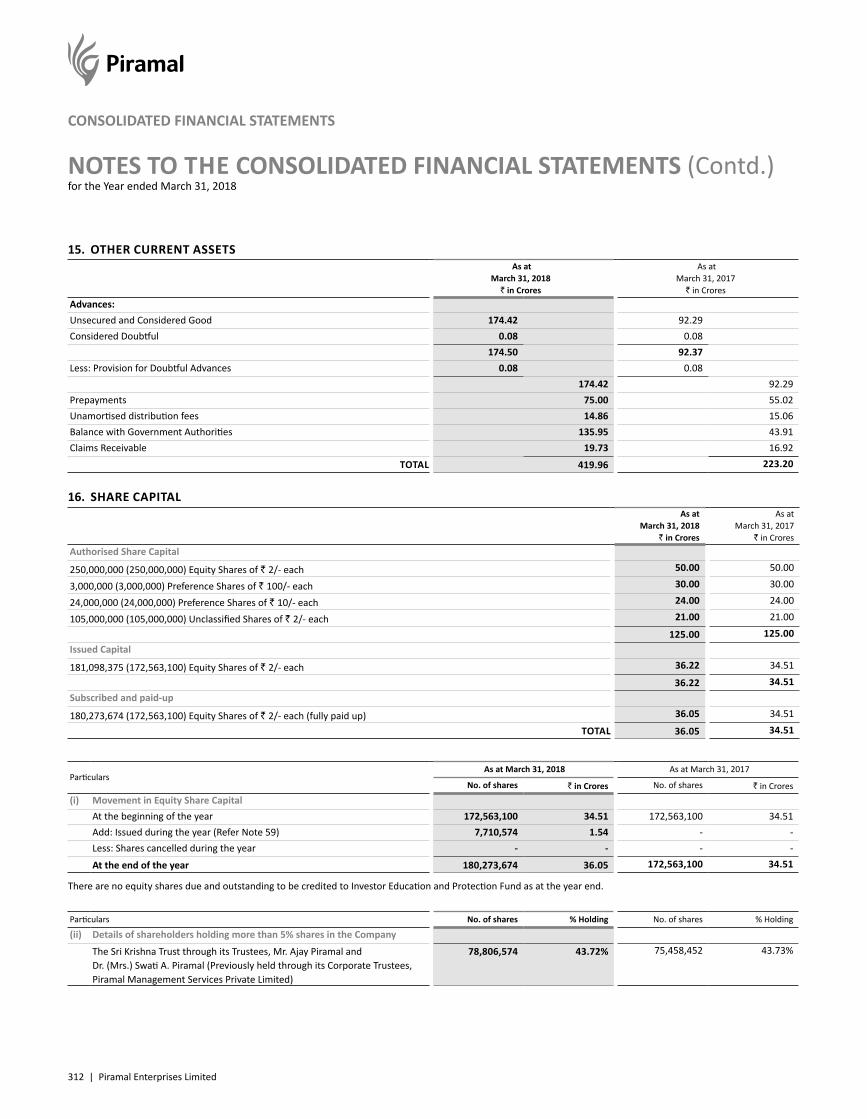
312 | Piramal Enterprises Limited
NOTES TO THE CONSOLIDATED FINANCIAL STATEMENTS (Contd.)for the Year ended March 31, 2018
CONSOLIDATED FINANCIAL STATEMENTS
15. OTHER CURRENT ASSETS As at
March 31, 2018` in Crores
As at March 31, 2017
` in CroresAdvances:Unsecured and Considered Good 174.42 92.29Considered Doubtful 0.08 0.08
174.50 92.37Less: Provision for Doubtful Advances 0.08 0.08
174.42 92.29Prepayments 75.00 55.02Unamortised distribution fees 14.86 15.06Balance with Government Authorities 135.95 43.91Claims Receivable 19.73 16.92
TOTAL 419.96 223.20
16. SHARE CAPITAL As at
March 31, 2018 ` in Crores
As at March 31, 2017
` in CroresAuthorised Share Capital
250,000,000 (250,000,000) Equity Shares of ` 2/- each 50.00 50.00
3,000,000 (3,000,000) Preference Shares of ` 100/- each 30.00 30.00
24,000,000 (24,000,000) Preference Shares of ` 10/- each 24.00 24.00
105,000,000 (105,000,000) Unclassified Shares of ` 2/- each 21.00 21.00
125.00 125.00Issued Capital
181,098,375 (172,563,100) Equity Shares of ` 2/- each 36.22 34.51
36.22 34.51Subscribed and paid-up
180,273,674 (172,563,100) Equity Shares of ` 2/- each (fully paid up) 36.05 34.51
TOTAL 36.05 34.51
Particulars As at March 31, 2018 As at March 31, 2017
No. of shares ` in Crores No. of shares ` in Crores(i) Movement in Equity Share Capital
At the beginning of the year 172,563,100 34.51 172,563,100 34.51Add: Issued during the year (Refer Note 59) 7,710,574 1.54 - -Less: Shares cancelled during the year - - - -
At the end of the year 180,273,674 36.05 172,563,100 34.51
There are no equity shares due and outstanding to be credited to Investor Education and Protection Fund as at the year end.
Particulars No. of shares % Holding No. of shares % Holding
(ii) Details of shareholders holding more than 5% shares in the Company
The Sri Krishna Trust through its Trustees, Mr. Ajay Piramal and Dr. (Mrs.) Swati A. Piramal (Previously held through its Corporate Trustees, Piramal Management Services Private Limited)
78,806,574 43.72% 75,458,452 43.73%
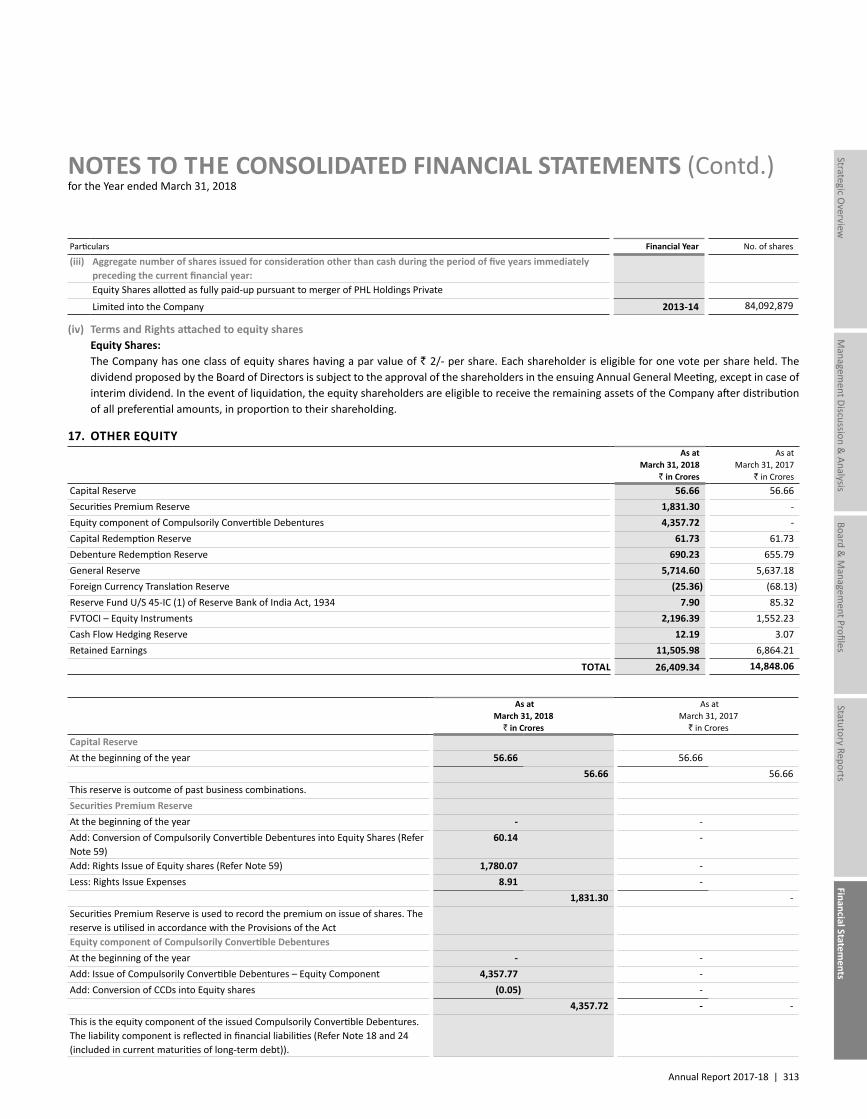
Annual Report 2017-18 | 313
Managem
ent Discussion & Analysis
Strategic Overview
Board &
Managem
ent ProfilesStatutory Reports
Financial Statements
NOTES TO THE CONSOLIDATED FINANCIAL STATEMENTS (Contd.)for the Year ended March 31, 2018
Particulars Financial Year No. of shares
(iii) Aggregate number of shares issued for consideration other than cash during the period of five years immediately preceding the current financial year:Equity Shares allotted as fully paid-up pursuant to merger of PHL Holdings Private
Limited into the Company 2013-14 84,092,879
(iv) Terms and Rights attached to equity shares Equity Shares: The Company has one class of equity shares having a par value of ` 2/- per share. Each shareholder is eligible for one vote per share held. The
dividend proposed by the Board of Directors is subject to the approval of the shareholders in the ensuing Annual General Meeting, except in case of interim dividend. In the event of liquidation, the equity shareholders are eligible to receive the remaining assets of the Company after distribution of all preferential amounts, in proportion to their shareholding.
17. OTHER EQUITY As at
March 31, 2018 ` in Crores
As at March 31, 2017
` in CroresCapital Reserve 56.66 56.66Securities Premium Reserve 1,831.30 -Equity component of Compulsorily Convertible Debentures 4,357.72 -Capital Redemption Reserve 61.73 61.73Debenture Redemption Reserve 690.23 655.79General Reserve 5,714.60 5,637.18Foreign Currency Translation Reserve (25.36) (68.13)Reserve Fund U/S 45-IC (1) of Reserve Bank of India Act, 1934 7.90 85.32FVTOCI – Equity Instruments 2,196.39 1,552.23Cash Flow Hedging Reserve 12.19 3.07Retained Earnings 11,505.98 6,864.21
TOTAL 26,409.34 14,848.06
As at March 31, 2018
` in Crores
As at March 31, 2017
` in CroresCapital ReserveAt the beginning of the year 56.66 56.66
56.66 56.66This reserve is outcome of past business combinations.Securities Premium ReserveAt the beginning of the year - -Add: Conversion of Compulsorily Convertible Debentures into Equity Shares (Refer Note 59)
60.14 -
Add: Rights Issue of Equity shares (Refer Note 59) 1,780.07 -Less: Rights Issue Expenses 8.91 -
1,831.30 -Securities Premium Reserve is used to record the premium on issue of shares. The reserve is utilised in accordance with the Provisions of the ActEquity component of Compulsorily Convertible DebenturesAt the beginning of the year - -Add: Issue of Compulsorily Convertible Debentures – Equity Component 4,357.77 -Add: Conversion of CCDs into Equity shares (0.05) -
4,357.72 - -This is the equity component of the issued Compulsorily Convertible Debentures. The liability component is reflected in financial liabilities (Refer Note 18 and 24 (included in current maturities of long-term debt)).
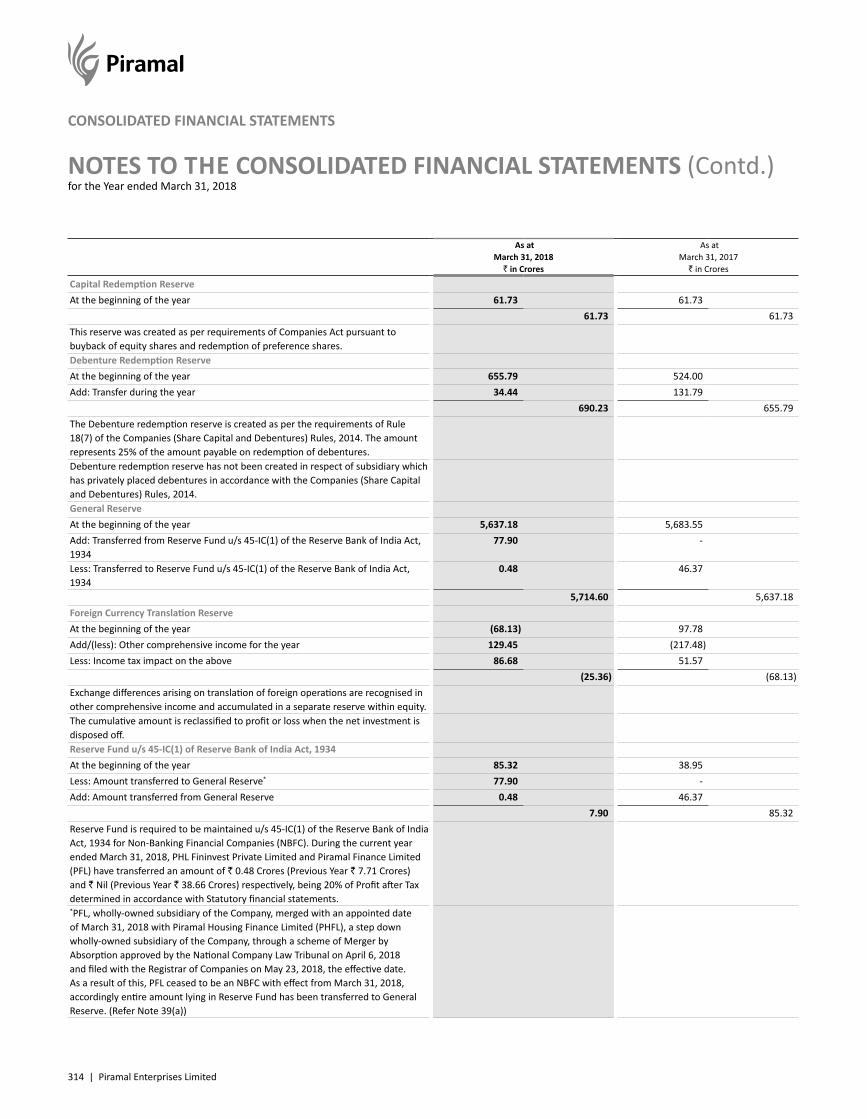
314 | Piramal Enterprises Limited
NOTES TO THE CONSOLIDATED FINANCIAL STATEMENTS (Contd.)for the Year ended March 31, 2018
CONSOLIDATED FINANCIAL STATEMENTS
As at March 31, 2018
` in Crores
As at March 31, 2017
` in Crores
Capital Redemption ReserveAt the beginning of the year 61.73 61.73
61.73 61.73This reserve was created as per requirements of Companies Act pursuant to buyback of equity shares and redemption of preference shares.Debenture Redemption ReserveAt the beginning of the year 655.79 524.00Add: Transfer during the year 34.44 131.79
690.23 655.79The Debenture redemption reserve is created as per the requirements of Rule 18(7) of the Companies (Share Capital and Debentures) Rules, 2014. The amount represents 25% of the amount payable on redemption of debentures.Debenture redemption reserve has not been created in respect of subsidiary which has privately placed debentures in accordance with the Companies (Share Capital and Debentures) Rules, 2014.General ReserveAt the beginning of the year 5,637.18 5,683.55Add: Transferred from Reserve Fund u/s 45-IC(1) of the Reserve Bank of India Act, 1934
77.90 -
Less: Transferred to Reserve Fund u/s 45-IC(1) of the Reserve Bank of India Act, 1934
0.48 46.37
5,714.60 5,637.18Foreign Currency Translation ReserveAt the beginning of the year (68.13) 97.78Add/(less): Other comprehensive income for the year 129.45 (217.48)Less: Income tax impact on the above 86.68 51.57
(25.36) (68.13)Exchange differences arising on translation of foreign operations are recognised in other comprehensive income and accumulated in a separate reserve within equity.The cumulative amount is reclassified to profit or loss when the net investment is disposed off.Reserve Fund u/s 45-IC(1) of Reserve Bank of India Act, 1934At the beginning of the year 85.32 38.95Less: Amount transferred to General Reserve* 77.90 -Add: Amount transferred from General Reserve 0.48 46.37
7.90 85.32Reserve Fund is required to be maintained u/s 45-IC(1) of the Reserve Bank of India Act, 1934 for Non-Banking Financial Companies (NBFC). During the current year ended March 31, 2018, PHL Fininvest Private Limited and Piramal Finance Limited (PFL) have transferred an amount of ` 0.48 Crores (Previous Year ` 7.71 Crores) and ` Nil (Previous Year ` 38.66 Crores) respectively, being 20% of Profit after Tax determined in accordance with Statutory financial statements.*PFL, wholly-owned subsidiary of the Company, merged with an appointed date of March 31, 2018 with Piramal Housing Finance Limited (PHFL), a step down wholly-owned subsidiary of the Company, through a scheme of Merger by Absorption approved by the National Company Law Tribunal on April 6, 2018 and filed with the Registrar of Companies on May 23, 2018, the effective date. As a result of this, PFL ceased to be an NBFC with effect from March 31, 2018, accordingly entire amount lying in Reserve Fund has been transferred to General Reserve. (Refer Note 39(a))
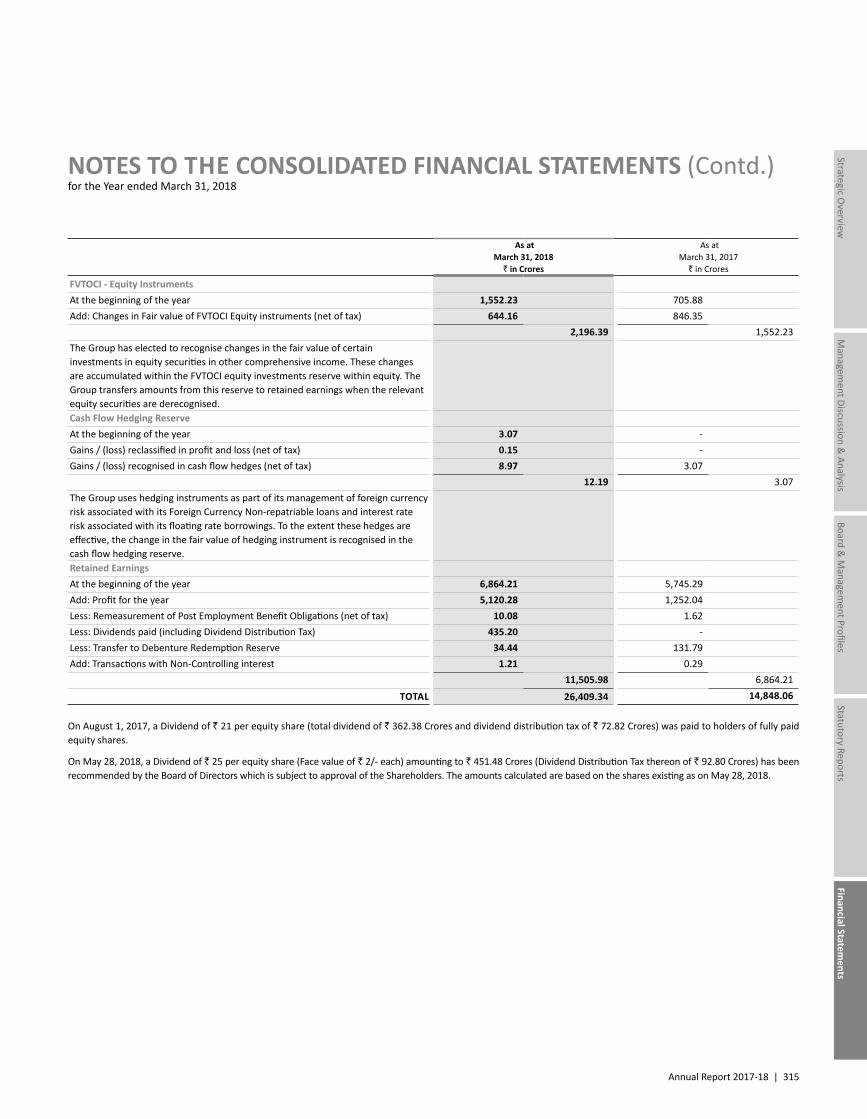
Annual Report 2017-18 | 315
Managem
ent Discussion & Analysis
Strategic Overview
Board &
Managem
ent ProfilesStatutory Reports
Financial Statements
NOTES TO THE CONSOLIDATED FINANCIAL STATEMENTS (Contd.)for the Year ended March 31, 2018
As at March 31, 2018
` in Crores
As at March 31, 2017
` in Crores
FVTOCI - Equity InstrumentsAt the beginning of the year 1,552.23 705.88Add: Changes in Fair value of FVTOCI Equity instruments (net of tax) 644.16 846.35
2,196.39 1,552.23The Group has elected to recognise changes in the fair value of certain investments in equity securities in other comprehensive income. These changes are accumulated within the FVTOCI equity investments reserve within equity. The Group transfers amounts from this reserve to retained earnings when the relevant equity securities are derecognised.Cash Flow Hedging ReserveAt the beginning of the year 3.07 -Gains / (loss) reclassified in profit and loss (net of tax) 0.15 -Gains / (loss) recognised in cash flow hedges (net of tax) 8.97 3.07
12.19 3.07The Group uses hedging instruments as part of its management of foreign currency risk associated with its Foreign Currency Non-repatriable loans and interest rate risk associated with its floating rate borrowings. To the extent these hedges are effective, the change in the fair value of hedging instrument is recognised in the cash flow hedging reserve.Retained EarningsAt the beginning of the year 6,864.21 5,745.29Add: Profit for the year 5,120.28 1,252.04Less: Remeasurement of Post Employment Benefit Obligations (net of tax) 10.08 1.62Less: Dividends paid (including Dividend Distribution Tax) 435.20 -Less: Transfer to Debenture Redemption Reserve 34.44 131.79Add: Transactions with Non-Controlling interest 1.21 0.29
11,505.98 6,864.21 TOTAL 26,409.34 14,848.06
On August 1, 2017, a Dividend of ` 21 per equity share (total dividend of ` 362.38 Crores and dividend distribution tax of ` 72.82 Crores) was paid to holders of fully paid equity shares.
On May 28, 2018, a Dividend of ` 25 per equity share (Face value of ` 2/- each) amounting to ` 451.48 Crores (Dividend Distribution Tax thereon of ` 92.80 Crores) has been recommended by the Board of Directors which is subject to approval of the Shareholders. The amounts calculated are based on the shares existing as on May 28, 2018.
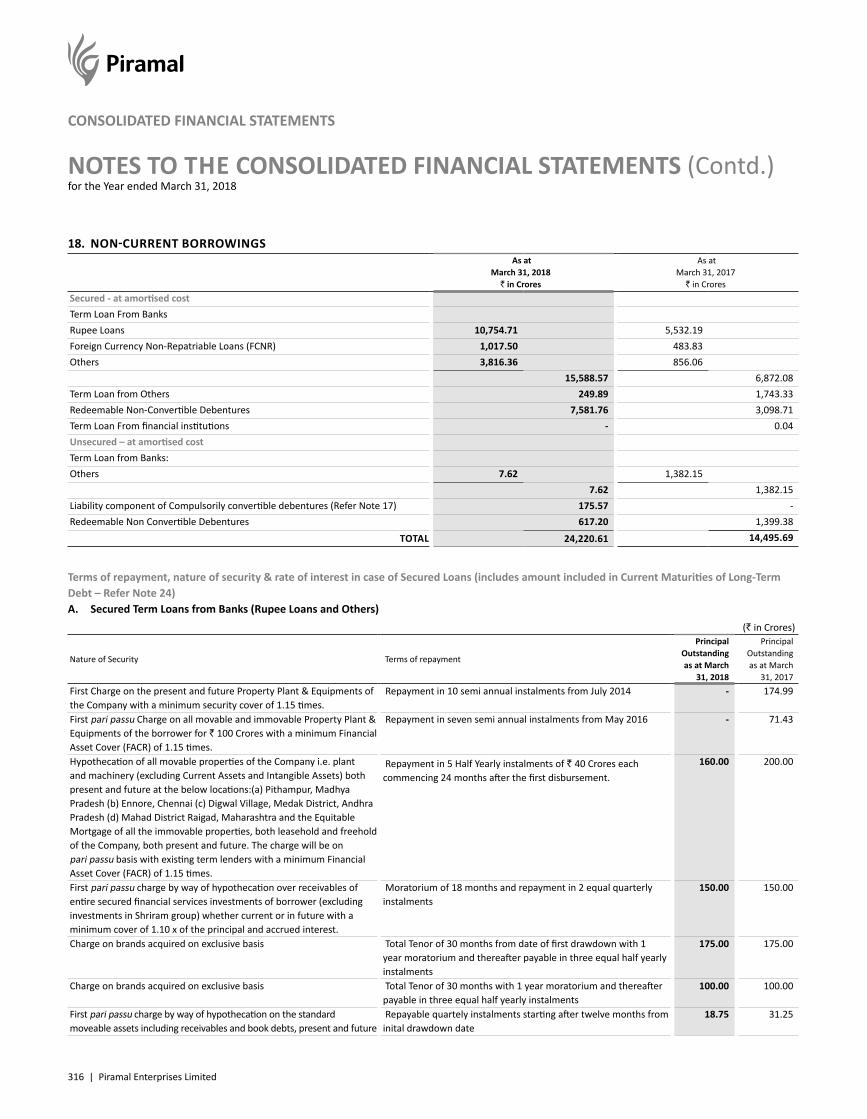
316 | Piramal Enterprises Limited
NOTES TO THE CONSOLIDATED FINANCIAL STATEMENTS (Contd.)for the Year ended March 31, 2018
CONSOLIDATED FINANCIAL STATEMENTS
18. NON-CURRENT BORROWINGS As at
March 31, 2018` in Crores
As at March 31, 2017
` in CroresSecured - at amortised costTerm Loan From BanksRupee Loans 10,754.71 5,532.19Foreign Currency Non-Repatriable Loans (FCNR) 1,017.50 483.83Others 3,816.36 856.06
15,588.57 6,872.08Term Loan from Others 249.89 1,743.33Redeemable Non-Convertible Debentures 7,581.76 3,098.71Term Loan From financial institutions - 0.04Unsecured – at amortised costTerm Loan from Banks:Others 7.62 1,382.15
7.62 1,382.15Liability component of Compulsorily convertible debentures (Refer Note 17) 175.57 -Redeemable Non Convertible Debentures 617.20 1,399.38
TOTAL 24,220.61 14,495.69
Terms of repayment, nature of security & rate of interest in case of Secured Loans (includes amount included in Current Maturities of Long-Term Debt – Refer Note 24)A. Secured Term Loans from Banks (Rupee Loans and Others)
(` in Crores)
Nature of Security Terms of repayment
Principal Outstanding as at March
31, 2018
Principal Outstanding as at March
31, 2017First Charge on the present and future Property Plant & Equipments of the Company with a minimum security cover of 1.15 times.
Repayment in 10 semi annual instalments from July 2014 - 174.99
First pari passu Charge on all movable and immovable Property Plant & Equipments of the borrower for ` 100 Crores with a minimum Financial Asset Cover (FACR) of 1.15 times.
Repayment in seven semi annual instalments from May 2016 - 71.43
Hypothecation of all movable properties of the Company i.e. plant and machinery (excluding Current Assets and Intangible Assets) both present and future at the below locations:(a) Pithampur, Madhya Pradesh (b) Ennore, Chennai (c) Digwal Village, Medak District, Andhra Pradesh (d) Mahad District Raigad, Maharashtra and the Equitable Mortgage of all the immovable properties, both leasehold and freehold of the Company, both present and future. The charge will be on pari passu basis with existing term lenders with a minimum Financial Asset Cover (FACR) of 1.15 times.
Repayment in 5 Half Yearly instalments of ` 40 Crores each commencing 24 months after the first disbursement.
160.00 200.00
First pari passu charge by way of hypothecation over receivables of entire secured financial services investments of borrower (excluding investments in Shriram group) whether current or in future with a minimum cover of 1.10 x of the principal and accrued interest.
Moratorium of 18 months and repayment in 2 equal quarterly instalments
150.00 150.00
Charge on brands acquired on exclusive basis Total Tenor of 30 months from date of first drawdown with 1 year moratorium and thereafter payable in three equal half yearly instalments
175.00 175.00
Charge on brands acquired on exclusive basis Total Tenor of 30 months with 1 year moratorium and thereafter payable in three equal half yearly instalments
100.00 100.00
First pari passu charge by way of hypothecation on the standard moveable assets including receivables and book debts, present and future
Repayable quartely instalments starting after twelve months from inital drawdown date
18.75 31.25
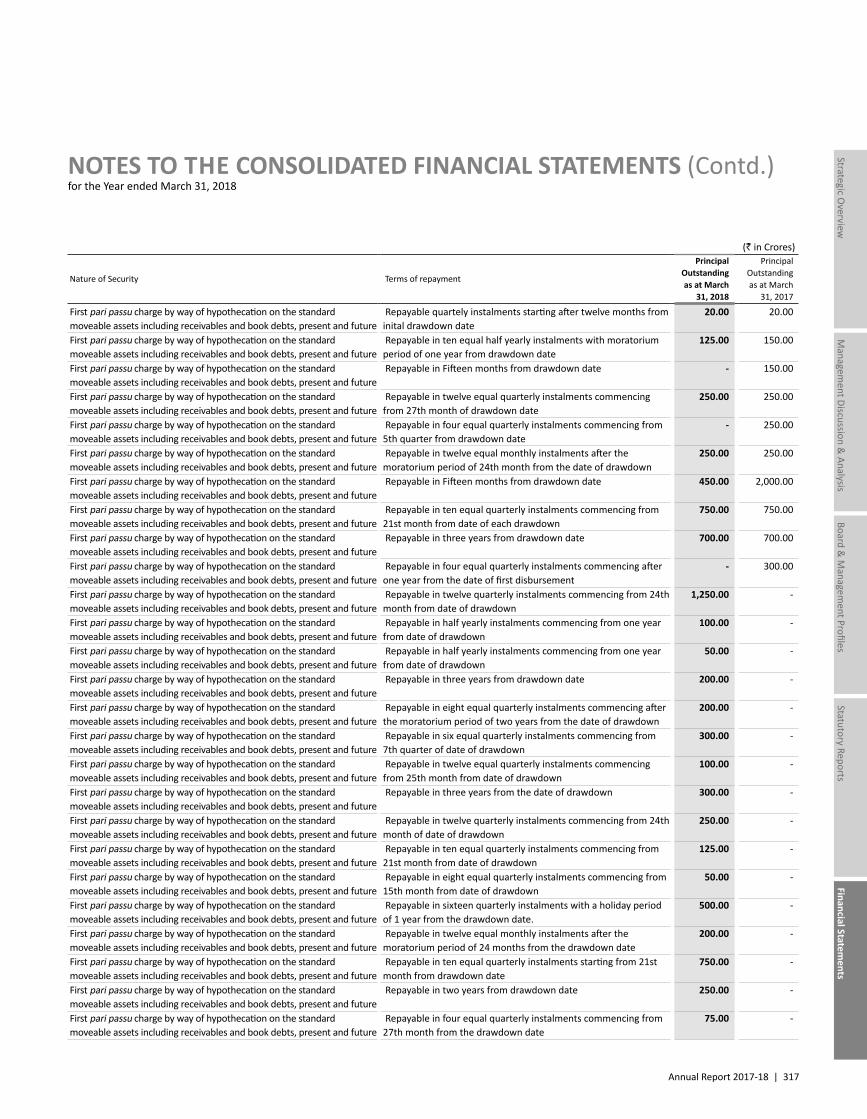
Annual Report 2017-18 | 317
Managem
ent Discussion & Analysis
Strategic Overview
Board &
Managem
ent ProfilesStatutory Reports
Financial Statements
NOTES TO THE CONSOLIDATED FINANCIAL STATEMENTS (Contd.)for the Year ended March 31, 2018
(` in Crores)
Nature of Security Terms of repayment
Principal Outstanding as at March
31, 2018
Principal Outstanding as at March
31, 2017
First pari passu charge by way of hypothecation on the standard moveable assets including receivables and book debts, present and future
Repayable quartely instalments starting after twelve months from inital drawdown date
20.00 20.00
First pari passu charge by way of hypothecation on the standard moveable assets including receivables and book debts, present and future
Repayable in ten equal half yearly instalments with moratorium period of one year from drawdown date
125.00 150.00
First pari passu charge by way of hypothecation on the standard moveable assets including receivables and book debts, present and future
Repayable in Fifteen months from drawdown date - 150.00
First pari passu charge by way of hypothecation on the standard moveable assets including receivables and book debts, present and future
Repayable in twelve equal quarterly instalments commencing from 27th month of drawdown date
250.00 250.00
First pari passu charge by way of hypothecation on the standard moveable assets including receivables and book debts, present and future
Repayable in four equal quarterly instalments commencing from 5th quarter from drawdown date
- 250.00
First pari passu charge by way of hypothecation on the standard moveable assets including receivables and book debts, present and future
Repayable in twelve equal monthly instalments after the moratorium period of 24th month from the date of drawdown
250.00 250.00
First pari passu charge by way of hypothecation on the standard moveable assets including receivables and book debts, present and future
Repayable in Fifteen months from drawdown date 450.00 2,000.00
First pari passu charge by way of hypothecation on the standard moveable assets including receivables and book debts, present and future
Repayable in ten equal quarterly instalments commencing from 21st month from date of each drawdown
750.00 750.00
First pari passu charge by way of hypothecation on the standard moveable assets including receivables and book debts, present and future
Repayable in three years from drawdown date 700.00 700.00
First pari passu charge by way of hypothecation on the standard moveable assets including receivables and book debts, present and future
Repayable in four equal quarterly instalments commencing after one year from the date of first disbursement
- 300.00
First pari passu charge by way of hypothecation on the standard moveable assets including receivables and book debts, present and future
Repayable in twelve quarterly instalments commencing from 24th month from date of drawdown
1,250.00 -
First pari passu charge by way of hypothecation on the standard moveable assets including receivables and book debts, present and future
Repayable in half yearly instalments commencing from one year from date of drawdown
100.00 -
First pari passu charge by way of hypothecation on the standard moveable assets including receivables and book debts, present and future
Repayable in half yearly instalments commencing from one year from date of drawdown
50.00 -
First pari passu charge by way of hypothecation on the standard moveable assets including receivables and book debts, present and future
Repayable in three years from drawdown date 200.00 -
First pari passu charge by way of hypothecation on the standard moveable assets including receivables and book debts, present and future
Repayable in eight equal quarterly instalments commencing after the moratorium period of two years from the date of drawdown
200.00 -
First pari passu charge by way of hypothecation on the standard moveable assets including receivables and book debts, present and future
Repayable in six equal quarterly instalments commencing from 7th quarter of date of drawdown
300.00 -
First pari passu charge by way of hypothecation on the standard moveable assets including receivables and book debts, present and future
Repayable in twelve equal quarterly instalments commencing from 25th month from date of drawdown
100.00 -
First pari passu charge by way of hypothecation on the standard moveable assets including receivables and book debts, present and future
Repayable in three years from the date of drawdown 300.00 -
First pari passu charge by way of hypothecation on the standard moveable assets including receivables and book debts, present and future
Repayable in twelve quarterly instalments commencing from 24th month of date of drawdown
250.00 -
First pari passu charge by way of hypothecation on the standard moveable assets including receivables and book debts, present and future
Repayable in ten equal quarterly instalments commencing from 21st month from date of drawdown
125.00 -
First pari passu charge by way of hypothecation on the standard moveable assets including receivables and book debts, present and future
Repayable in eight equal quarterly instalments commencing from 15th month from date of drawdown
50.00 -
First pari passu charge by way of hypothecation on the standard moveable assets including receivables and book debts, present and future
Repayable in sixteen quarterly instalments with a holiday period of 1 year from the drawdown date.
500.00 -
First pari passu charge by way of hypothecation on the standard moveable assets including receivables and book debts, present and future
Repayable in twelve equal monthly instalments after the moratorium period of 24 months from the drawdown date
200.00 -
First pari passu charge by way of hypothecation on the standard moveable assets including receivables and book debts, present and future
Repayable in ten equal quarterly instalments starting from 21st month from drawdown date
750.00 -
First pari passu charge by way of hypothecation on the standard moveable assets including receivables and book debts, present and future
Repayable in two years from drawdown date 250.00 -
First pari passu charge by way of hypothecation on the standard moveable assets including receivables and book debts, present and future
Repayable in four equal quarterly instalments commencing from 27th month from the drawdown date
75.00 -
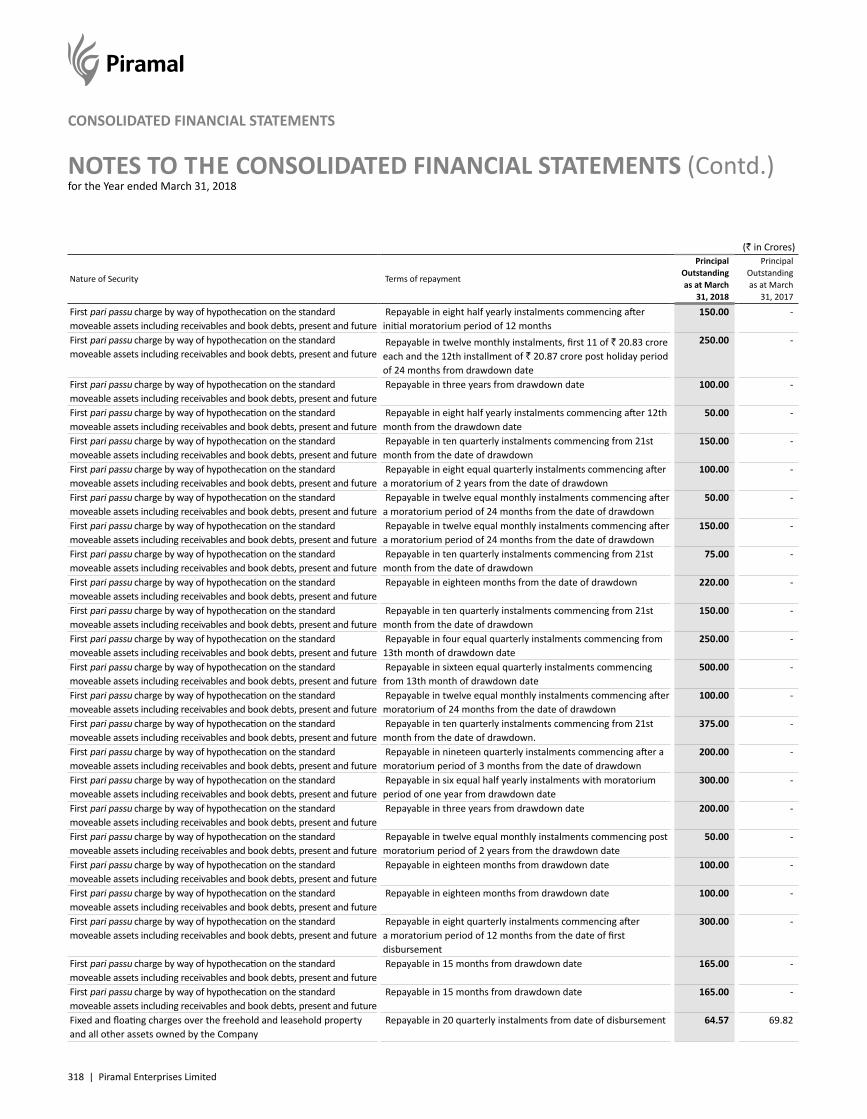
318 | Piramal Enterprises Limited
NOTES TO THE CONSOLIDATED FINANCIAL STATEMENTS (Contd.)for the Year ended March 31, 2018
CONSOLIDATED FINANCIAL STATEMENTS
(` in Crores)
Nature of Security Terms of repayment
Principal Outstanding as at March
31, 2018
Principal Outstanding as at March
31, 2017
First pari passu charge by way of hypothecation on the standard moveable assets including receivables and book debts, present and future
Repayable in eight half yearly instalments commencing after initial moratorium period of 12 months
150.00 -
First pari passu charge by way of hypothecation on the standard moveable assets including receivables and book debts, present and future
Repayable in twelve monthly instalments, first 11 of ` 20.83 crore each and the 12th installment of ` 20.87 crore post holiday period of 24 months from drawdown date
250.00 -
First pari passu charge by way of hypothecation on the standard moveable assets including receivables and book debts, present and future
Repayable in three years from drawdown date 100.00 -
First pari passu charge by way of hypothecation on the standard moveable assets including receivables and book debts, present and future
Repayable in eight half yearly instalments commencing after 12th month from the drawdown date
50.00 -
First pari passu charge by way of hypothecation on the standard moveable assets including receivables and book debts, present and future
Repayable in ten quarterly instalments commencing from 21st month from the date of drawdown
150.00 -
First pari passu charge by way of hypothecation on the standard moveable assets including receivables and book debts, present and future
Repayable in eight equal quarterly instalments commencing after a moratorium of 2 years from the date of drawdown
100.00 -
First pari passu charge by way of hypothecation on the standard moveable assets including receivables and book debts, present and future
Repayable in twelve equal monthly instalments commencing after a moratorium period of 24 months from the date of drawdown
50.00 -
First pari passu charge by way of hypothecation on the standard moveable assets including receivables and book debts, present and future
Repayable in twelve equal monthly instalments commencing after a moratorium period of 24 months from the date of drawdown
150.00 -
First pari passu charge by way of hypothecation on the standard moveable assets including receivables and book debts, present and future
Repayable in ten quarterly instalments commencing from 21st month from the date of drawdown
75.00 -
First pari passu charge by way of hypothecation on the standard moveable assets including receivables and book debts, present and future
Repayable in eighteen months from the date of drawdown 220.00 -
First pari passu charge by way of hypothecation on the standard moveable assets including receivables and book debts, present and future
Repayable in ten quarterly instalments commencing from 21st month from the date of drawdown
150.00 -
First pari passu charge by way of hypothecation on the standard moveable assets including receivables and book debts, present and future
Repayable in four equal quarterly instalments commencing from 13th month of drawdown date
250.00 -
First pari passu charge by way of hypothecation on the standard moveable assets including receivables and book debts, present and future
Repayable in sixteen equal quarterly instalments commencing from 13th month of drawdown date
500.00 -
First pari passu charge by way of hypothecation on the standard moveable assets including receivables and book debts, present and future
Repayable in twelve equal monthly instalments commencing after moratorium of 24 months from the date of drawdown
100.00 -
First pari passu charge by way of hypothecation on the standard moveable assets including receivables and book debts, present and future
Repayable in ten quarterly instalments commencing from 21st month from the date of drawdown.
375.00 -
First pari passu charge by way of hypothecation on the standard moveable assets including receivables and book debts, present and future
Repayable in nineteen quarterly instalments commencing after a moratorium period of 3 months from the date of drawdown
200.00 -
First pari passu charge by way of hypothecation on the standard moveable assets including receivables and book debts, present and future
Repayable in six equal half yearly instalments with moratorium period of one year from drawdown date
300.00 -
First pari passu charge by way of hypothecation on the standard moveable assets including receivables and book debts, present and future
Repayable in three years from drawdown date 200.00 -
First pari passu charge by way of hypothecation on the standard moveable assets including receivables and book debts, present and future
Repayable in twelve equal monthly instalments commencing post moratorium period of 2 years from the drawdown date
50.00 -
First pari passu charge by way of hypothecation on the standard moveable assets including receivables and book debts, present and future
Repayable in eighteen months from drawdown date 100.00 -
First pari passu charge by way of hypothecation on the standard moveable assets including receivables and book debts, present and future
Repayable in eighteen months from drawdown date 100.00 -
First pari passu charge by way of hypothecation on the standard moveable assets including receivables and book debts, present and future
Repayable in eight quarterly instalments commencing after a moratorium period of 12 months from the date of first disbursement
300.00 -
First pari passu charge by way of hypothecation on the standard moveable assets including receivables and book debts, present and future
Repayable in 15 months from drawdown date 165.00 -
First pari passu charge by way of hypothecation on the standard moveable assets including receivables and book debts, present and future
Repayable in 15 months from drawdown date 165.00 -
Fixed and floating charges over the freehold and leasehold property and all other assets owned by the Company
Repayable in 20 quarterly instalments from date of disbursement 64.57 69.82
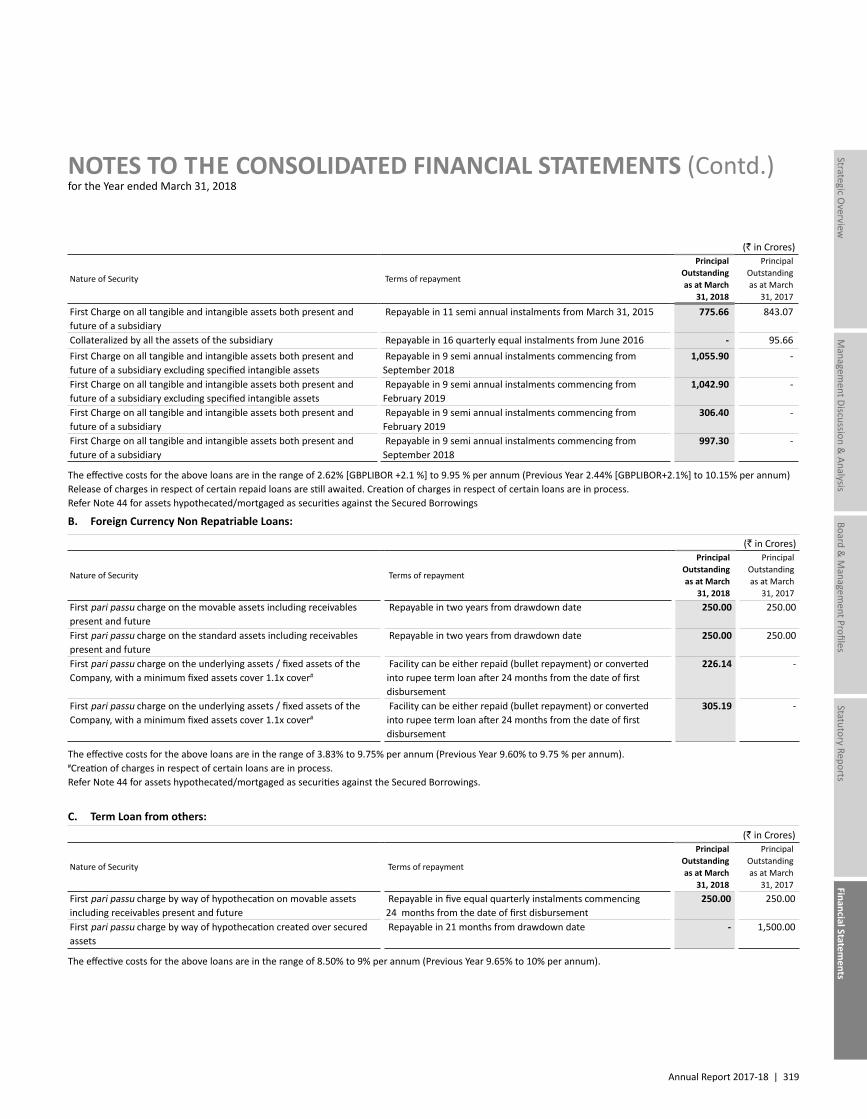
Annual Report 2017-18 | 319
Managem
ent Discussion & Analysis
Strategic Overview
Board &
Managem
ent ProfilesStatutory Reports
Financial Statements
NOTES TO THE CONSOLIDATED FINANCIAL STATEMENTS (Contd.)for the Year ended March 31, 2018
(` in Crores)
Nature of Security Terms of repayment
Principal Outstanding as at March
31, 2018
Principal Outstanding as at March
31, 2017
First Charge on all tangible and intangible assets both present and future of a subsidiary
Repayable in 11 semi annual instalments from March 31, 2015 775.66 843.07
Collateralized by all the assets of the subsidiary Repayable in 16 quarterly equal instalments from June 2016 - 95.66First Charge on all tangible and intangible assets both present and future of a subsidiary excluding specified intangible assets
Repayable in 9 semi annual instalments commencing from September 2018
1,055.90 -
First Charge on all tangible and intangible assets both present and future of a subsidiary excluding specified intangible assets
Repayable in 9 semi annual instalments commencing from February 2019
1,042.90 -
First Charge on all tangible and intangible assets both present and future of a subsidiary
Repayable in 9 semi annual instalments commencing from February 2019
306.40 -
First Charge on all tangible and intangible assets both present and future of a subsidiary
Repayable in 9 semi annual instalments commencing from September 2018
997.30 -
The effective costs for the above loans are in the range of 2.62% [GBPLIBOR +2.1 %] to 9.95 % per annum (Previous Year 2.44% [GBPLIBOR+2.1%] to 10.15% per annum)Release of charges in respect of certain repaid loans are still awaited. Creation of charges in respect of certain loans are in process.Refer Note 44 for assets hypothecated/mortgaged as securities against the Secured Borrowings
B. Foreign Currency Non Repatriable Loans:
(` in Crores)
Nature of Security Terms of repayment
Principal Outstanding as at March
31, 2018
Principal Outstanding as at March
31, 2017First pari passu charge on the movable assets including receivables present and future
Repayable in two years from drawdown date 250.00 250.00
First pari passu charge on the standard assets including receivables present and future
Repayable in two years from drawdown date 250.00 250.00
First pari passu charge on the underlying assets / fixed assets of the Company, with a minimum fixed assets cover 1.1x cover#
Facility can be either repaid (bullet repayment) or converted into rupee term loan after 24 months from the date of first disbursement
226.14 -
First pari passu charge on the underlying assets / fixed assets of the Company, with a minimum fixed assets cover 1.1x cover#
Facility can be either repaid (bullet repayment) or converted into rupee term loan after 24 months from the date of first disbursement
305.19 -
The effective costs for the above loans are in the range of 3.83% to 9.75% per annum (Previous Year 9.60% to 9.75 % per annum).#Creation of charges in respect of certain loans are in process.Refer Note 44 for assets hypothecated/mortgaged as securities against the Secured Borrowings.
C. Term Loan from others: (` in Crores)
Nature of Security Terms of repayment
Principal Outstanding as at March
31, 2018
Principal Outstanding as at March
31, 2017First pari passu charge by way of hypothecation on movable assets including receivables present and future
Repayable in five equal quarterly instalments commencing 24 months from the date of first disbursement
250.00 250.00
First pari passu charge by way of hypothecation created over secured assets
Repayable in 21 months from drawdown date - 1,500.00
The effective costs for the above loans are in the range of 8.50% to 9% per annum (Previous Year 9.65% to 10% per annum).
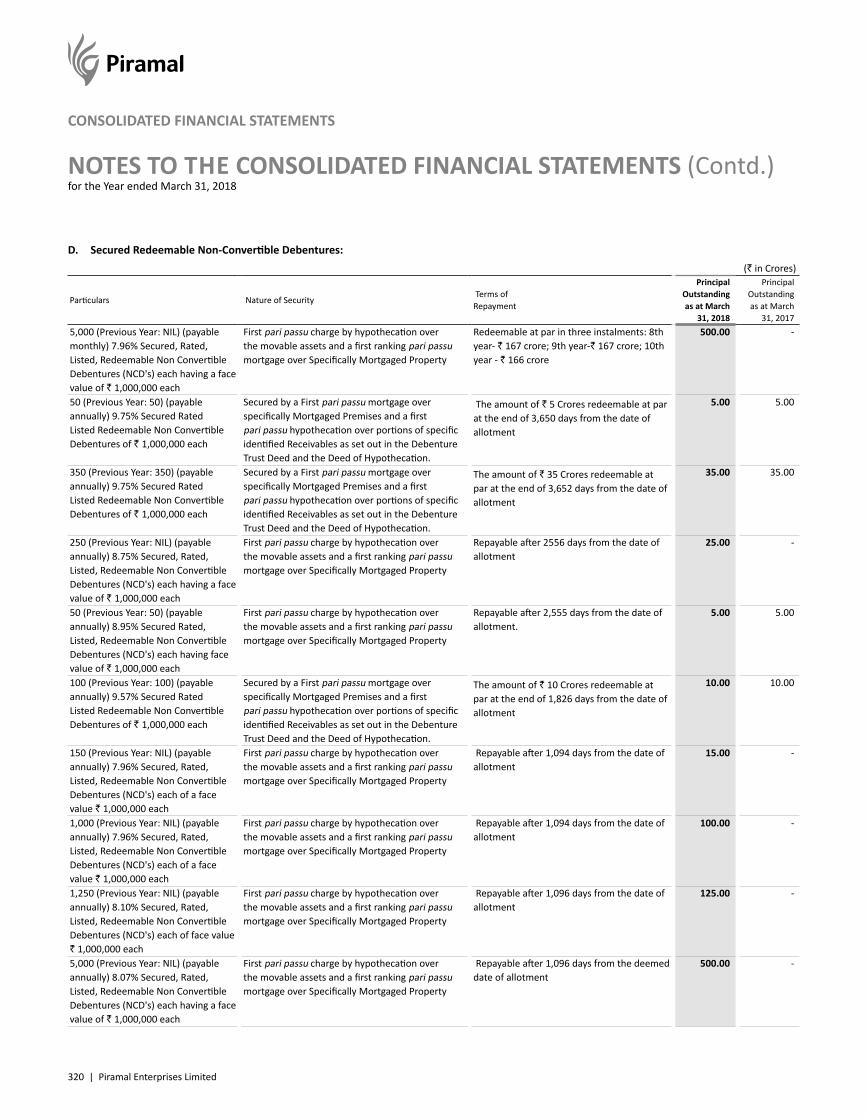
320 | Piramal Enterprises Limited
NOTES TO THE CONSOLIDATED FINANCIAL STATEMENTS (Contd.)for the Year ended March 31, 2018
CONSOLIDATED FINANCIAL STATEMENTS
D. Secured Redeemable Non-Convertible Debentures: (` in Crores)
Particulars Nature of Security Terms ofRepayment
Principal Outstanding as at March
31, 2018
Principal Outstanding as at March
31, 20175,000 (Previous Year: NIL) (payable monthly) 7.96% Secured, Rated, Listed, Redeemable Non Convertible Debentures (NCD's) each having a face value of ` 1,000,000 each
First pari passu charge by hypothecation over the movable assets and a first ranking pari passu mortgage over Specifically Mortgaged Property
Redeemable at par in three instalments: 8th year- ` 167 crore; 9th year-` 167 crore; 10th year - ` 166 crore
500.00 -
50 (Previous Year: 50) (payable annually) 9.75% Secured Rated Listed Redeemable Non Convertible Debentures of ` 1,000,000 each
Secured by a First pari passu mortgage over specifically Mortgaged Premises and a first pari passu hypothecation over portions of specific identified Receivables as set out in the Debenture Trust Deed and the Deed of Hypothecation.
The amount of ` 5 Crores redeemable at par at the end of 3,650 days from the date of allotment
5.00 5.00
350 (Previous Year: 350) (payable annually) 9.75% Secured Rated Listed Redeemable Non Convertible Debentures of ` 1,000,000 each
Secured by a First pari passu mortgage over specifically Mortgaged Premises and a first pari passu hypothecation over portions of specific identified Receivables as set out in the Debenture Trust Deed and the Deed of Hypothecation.
The amount of ` 35 Crores redeemable at par at the end of 3,652 days from the date of allotment
35.00 35.00
250 (Previous Year: NIL) (payable annually) 8.75% Secured, Rated, Listed, Redeemable Non Convertible Debentures (NCD's) each having a face value of ` 1,000,000 each
First pari passu charge by hypothecation over the movable assets and a first ranking pari passu mortgage over Specifically Mortgaged Property
Repayable after 2556 days from the date of allotment
25.00 -
50 (Previous Year: 50) (payable annually) 8.95% Secured Rated, Listed, Redeemable Non Convertible Debentures (NCD's) each having face value of ` 1,000,000 each
First pari passu charge by hypothecation over the movable assets and a first ranking pari passu mortgage over Specifically Mortgaged Property
Repayable after 2,555 days from the date of allotment.
5.00 5.00
100 (Previous Year: 100) (payable annually) 9.57% Secured Rated Listed Redeemable Non Convertible Debentures of ` 1,000,000 each
Secured by a First pari passu mortgage over specifically Mortgaged Premises and a first pari passu hypothecation over portions of specific identified Receivables as set out in the Debenture Trust Deed and the Deed of Hypothecation.
The amount of ` 10 Crores redeemable at par at the end of 1,826 days from the date of allotment
10.00 10.00
150 (Previous Year: NIL) (payable annually) 7.96% Secured, Rated, Listed, Redeemable Non Convertible Debentures (NCD's) each of a face value ` 1,000,000 each
First pari passu charge by hypothecation over the movable assets and a first ranking pari passu mortgage over Specifically Mortgaged Property
Repayable after 1,094 days from the date of allotment
15.00 -
1,000 (Previous Year: NIL) (payable annually) 7.96% Secured, Rated, Listed, Redeemable Non Convertible Debentures (NCD's) each of a face value ` 1,000,000 each
First pari passu charge by hypothecation over the movable assets and a first ranking pari passu mortgage over Specifically Mortgaged Property
Repayable after 1,094 days from the date of allotment
100.00 -
1,250 (Previous Year: NIL) (payable annually) 8.10% Secured, Rated, Listed, Redeemable Non Convertible Debentures (NCD's) each of face value ` 1,000,000 each
First pari passu charge by hypothecation over the movable assets and a first ranking pari passu mortgage over Specifically Mortgaged Property
Repayable after 1,096 days from the date of allotment
125.00 -
5,000 (Previous Year: NIL) (payable annually) 8.07% Secured, Rated, Listed, Redeemable Non Convertible Debentures (NCD's) each having a face value of ` 1,000,000 each
First pari passu charge by hypothecation over the movable assets and a first ranking pari passu mortgage over Specifically Mortgaged Property
Repayable after 1,096 days from the deemed date of allotment
500.00 -
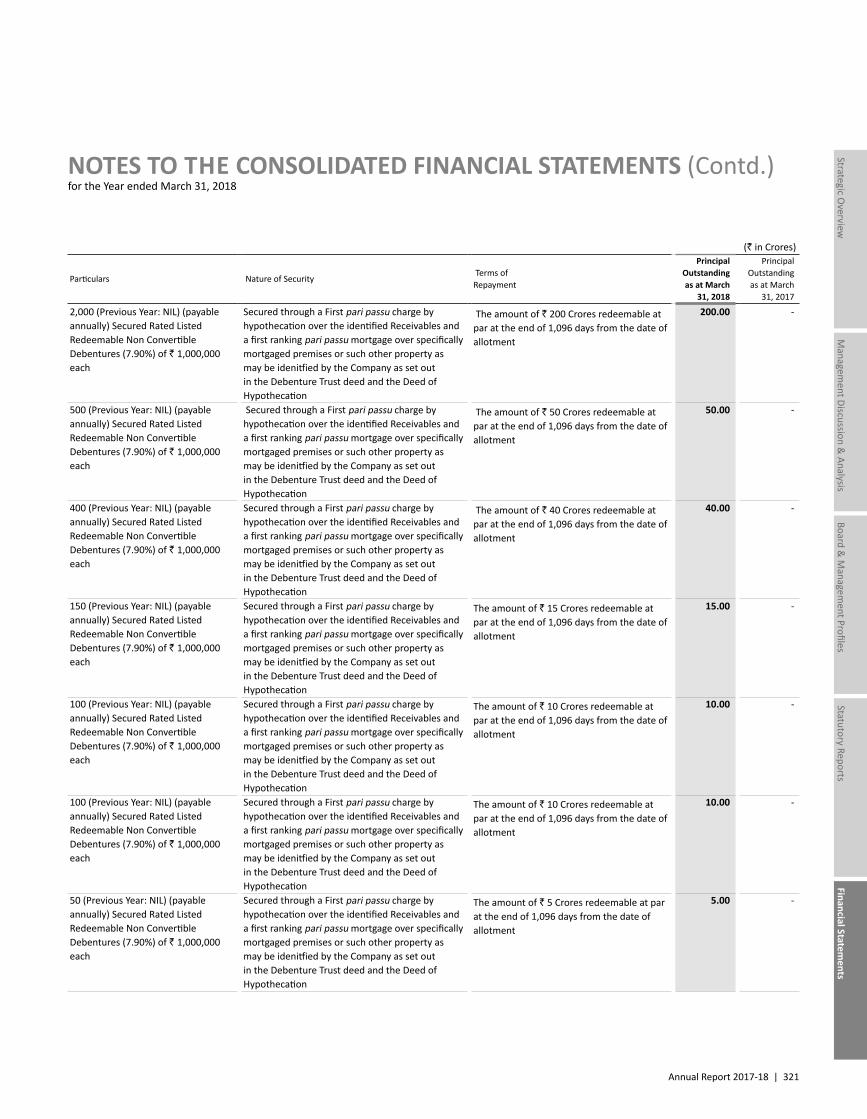
Annual Report 2017-18 | 321
Managem
ent Discussion & Analysis
Strategic Overview
Board &
Managem
ent ProfilesStatutory Reports
Financial Statements
NOTES TO THE CONSOLIDATED FINANCIAL STATEMENTS (Contd.)for the Year ended March 31, 2018
(` in Crores)
Particulars Nature of Security Terms ofRepayment
Principal Outstanding as at March
31, 2018
Principal Outstanding as at March
31, 2017
2,000 (Previous Year: NIL) (payable annually) Secured Rated Listed Redeemable Non Convertible Debentures (7.90%) of ` 1,000,000 each
Secured through a First pari passu charge by hypothecation over the identified Receivables and a first ranking pari passu mortgage over specifically mortgaged premises or such other property as may be idenitfied by the Company as set out in the Debenture Trust deed and the Deed of Hypothecation
The amount of ` 200 Crores redeemable at par at the end of 1,096 days from the date of allotment
200.00 -
500 (Previous Year: NIL) (payable annually) Secured Rated Listed Redeemable Non Convertible Debentures (7.90%) of ` 1,000,000 each
Secured through a First pari passu charge by hypothecation over the identified Receivables and a first ranking pari passu mortgage over specifically mortgaged premises or such other property as may be idenitfied by the Company as set out in the Debenture Trust deed and the Deed of Hypothecation
The amount of ` 50 Crores redeemable at par at the end of 1,096 days from the date of allotment
50.00 -
400 (Previous Year: NIL) (payable annually) Secured Rated Listed Redeemable Non Convertible Debentures (7.90%) of ` 1,000,000 each
Secured through a First pari passu charge by hypothecation over the identified Receivables and a first ranking pari passu mortgage over specifically mortgaged premises or such other property as may be idenitfied by the Company as set out in the Debenture Trust deed and the Deed of Hypothecation
The amount of ` 40 Crores redeemable at par at the end of 1,096 days from the date of allotment
40.00 -
150 (Previous Year: NIL) (payable annually) Secured Rated Listed Redeemable Non Convertible Debentures (7.90%) of ` 1,000,000 each
Secured through a First pari passu charge by hypothecation over the identified Receivables and a first ranking pari passu mortgage over specifically mortgaged premises or such other property as may be idenitfied by the Company as set out in the Debenture Trust deed and the Deed of Hypothecation
The amount of ` 15 Crores redeemable at par at the end of 1,096 days from the date of allotment
15.00 -
100 (Previous Year: NIL) (payable annually) Secured Rated Listed Redeemable Non Convertible Debentures (7.90%) of ` 1,000,000 each
Secured through a First pari passu charge by hypothecation over the identified Receivables and a first ranking pari passu mortgage over specifically mortgaged premises or such other property as may be idenitfied by the Company as set out in the Debenture Trust deed and the Deed of Hypothecation
The amount of ` 10 Crores redeemable at par at the end of 1,096 days from the date of allotment
10.00 -
50 (Previous Year: NIL) (payable annually) Secured Rated Listed Redeemable Non Convertible Debentures (7.90%) of ` 1,000,000 each
Secured through a First pari passu charge by hypothecation over the identified Receivables and a first ranking pari passu mortgage over specifically mortgaged premises or such other property as may be idenitfied by the Company as set out in the Debenture Trust deed and the Deed of Hypothecation
The amount of ` 5 Crores redeemable at par at the end of 1,096 days from the date of allotment
5.00 -
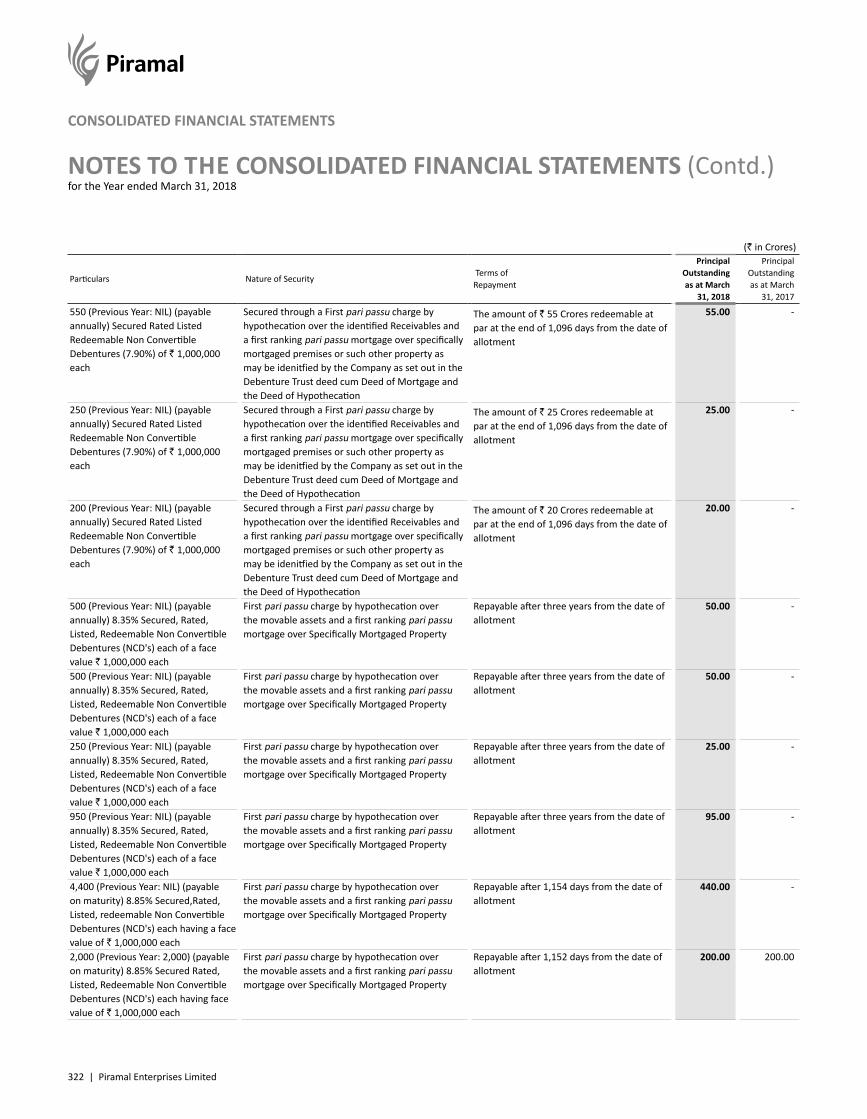
322 | Piramal Enterprises Limited
NOTES TO THE CONSOLIDATED FINANCIAL STATEMENTS (Contd.)for the Year ended March 31, 2018
CONSOLIDATED FINANCIAL STATEMENTS
(` in Crores)
Particulars Nature of Security Terms ofRepayment
Principal Outstanding as at March
31, 2018
Principal Outstanding as at March
31, 2017
550 (Previous Year: NIL) (payable annually) Secured Rated Listed Redeemable Non Convertible Debentures (7.90%) of ` 1,000,000 each
Secured through a First pari passu charge by hypothecation over the identified Receivables and a first ranking pari passu mortgage over specifically mortgaged premises or such other property as may be idenitfied by the Company as set out in the Debenture Trust deed cum Deed of Mortgage and the Deed of Hypothecation
The amount of ` 55 Crores redeemable at par at the end of 1,096 days from the date of allotment
55.00 -
250 (Previous Year: NIL) (payable annually) Secured Rated Listed Redeemable Non Convertible Debentures (7.90%) of ` 1,000,000 each
Secured through a First pari passu charge by hypothecation over the identified Receivables and a first ranking pari passu mortgage over specifically mortgaged premises or such other property as may be idenitfied by the Company as set out in the Debenture Trust deed cum Deed of Mortgage and the Deed of Hypothecation
The amount of ` 25 Crores redeemable at par at the end of 1,096 days from the date of allotment
25.00 -
200 (Previous Year: NIL) (payable annually) Secured Rated Listed Redeemable Non Convertible Debentures (7.90%) of ` 1,000,000 each
Secured through a First pari passu charge by hypothecation over the identified Receivables and a first ranking pari passu mortgage over specifically mortgaged premises or such other property as may be idenitfied by the Company as set out in the Debenture Trust deed cum Deed of Mortgage and the Deed of Hypothecation
The amount of ` 20 Crores redeemable at par at the end of 1,096 days from the date of allotment
20.00 -
500 (Previous Year: NIL) (payable annually) 8.35% Secured, Rated, Listed, Redeemable Non Convertible Debentures (NCD's) each of a face value ` 1,000,000 each
First pari passu charge by hypothecation over the movable assets and a first ranking pari passu mortgage over Specifically Mortgaged Property
Repayable after three years from the date of allotment
50.00 -
250 (Previous Year: NIL) (payable annually) 8.35% Secured, Rated, Listed, Redeemable Non Convertible Debentures (NCD's) each of a face value ` 1,000,000 each
First pari passu charge by hypothecation over the movable assets and a first ranking pari passu mortgage over Specifically Mortgaged Property
Repayable after three years from the date of allotment
25.00 -
950 (Previous Year: NIL) (payable annually) 8.35% Secured, Rated, Listed, Redeemable Non Convertible Debentures (NCD's) each of a face value ` 1,000,000 each
First pari passu charge by hypothecation over the movable assets and a first ranking pari passu mortgage over Specifically Mortgaged Property
Repayable after three years from the date of allotment
95.00 -
4,400 (Previous Year: NIL) (payable on maturity) 8.85% Secured,Rated, Listed, redeemable Non Convertible Debentures (NCD's) each having a face value of ` 1,000,000 each
First pari passu charge by hypothecation over the movable assets and a first ranking pari passu mortgage over Specifically Mortgaged Property
Repayable after 1,154 days from the date of allotment
440.00 -
2,000 (Previous Year: 2,000) (payable on maturity) 8.85% Secured Rated, Listed, Redeemable Non Convertible Debentures (NCD's) each having face value of ` 1,000,000 each
First pari passu charge by hypothecation over the movable assets and a first ranking pari passu mortgage over Specifically Mortgaged Property
Repayable after 1,152 days from the date of allotment
200.00 200.00
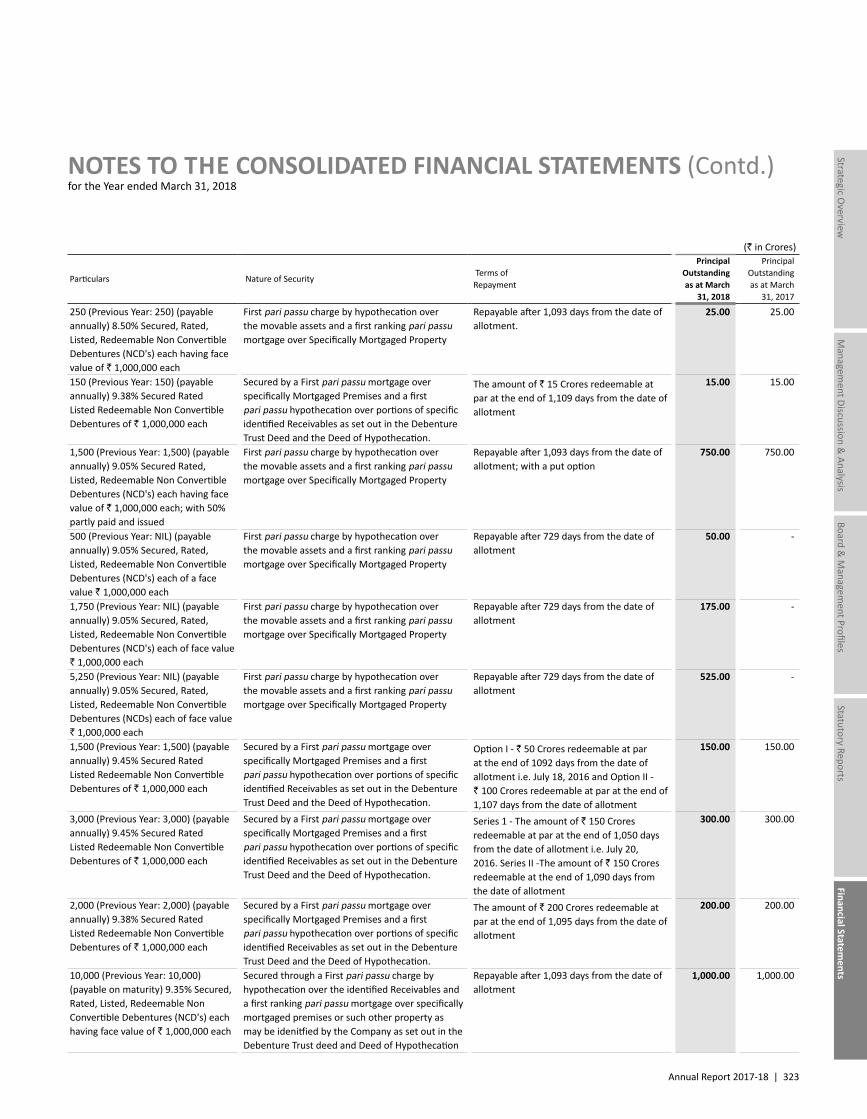
Annual Report 2017-18 | 323
Managem
ent Discussion & Analysis
Strategic Overview
Board &
Managem
ent ProfilesStatutory Reports
Financial Statements
NOTES TO THE CONSOLIDATED FINANCIAL STATEMENTS (Contd.)for the Year ended March 31, 2018
(` in Crores)
Particulars Nature of Security Terms ofRepayment
Principal Outstanding as at March
31, 2018
Principal Outstanding as at March
31, 2017
250 (Previous Year: 250) (payable annually) 8.50% Secured, Rated, Listed, Redeemable Non Convertible Debentures (NCD's) each having face value of ` 1,000,000 each
First pari passu charge by hypothecation over the movable assets and a first ranking pari passu mortgage over Specifically Mortgaged Property
Repayable after 1,093 days from the date of allotment.
25.00 25.00
150 (Previous Year: 150) (payable annually) 9.38% Secured Rated Listed Redeemable Non Convertible Debentures of ` 1,000,000 each
Secured by a First pari passu mortgage over specifically Mortgaged Premises and a first pari passu hypothecation over portions of specific identified Receivables as set out in the Debenture Trust Deed and the Deed of Hypothecation.
The amount of ` 15 Crores redeemable at par at the end of 1,109 days from the date of allotment
15.00 15.00
1,500 (Previous Year: 1,500) (payable annually) 9.05% Secured Rated, Listed, Redeemable Non Convertible Debentures (NCD's) each having face value of ` 1,000,000 each; with 50% partly paid and issued
First pari passu charge by hypothecation over the movable assets and a first ranking pari passu mortgage over Specifically Mortgaged Property
Repayable after 1,093 days from the date of allotment; with a put option
750.00 750.00
500 (Previous Year: NIL) (payable annually) 9.05% Secured, Rated, Listed, Redeemable Non Convertible Debentures (NCD's) each of a face value ` 1,000,000 each
First pari passu charge by hypothecation over the movable assets and a first ranking pari passu mortgage over Specifically Mortgaged Property
Repayable after 729 days from the date of allotment
50.00 -
1,750 (Previous Year: NIL) (payable annually) 9.05% Secured, Rated, Listed, Redeemable Non Convertible Debentures (NCD's) each of face value ` 1,000,000 each
First pari passu charge by hypothecation over the movable assets and a first ranking pari passu mortgage over Specifically Mortgaged Property
Repayable after 729 days from the date of allotment
175.00 -
5,250 (Previous Year: NIL) (payable annually) 9.05% Secured, Rated, Listed, Redeemable Non Convertible Debentures (NCDs) each of face value ` 1,000,000 each
First pari passu charge by hypothecation over the movable assets and a first ranking pari passu mortgage over Specifically Mortgaged Property
Repayable after 729 days from the date of allotment
525.00 -
1,500 (Previous Year: 1,500) (payable annually) 9.45% Secured Rated Listed Redeemable Non Convertible Debentures of ` 1,000,000 each
Secured by a First pari passu mortgage over specifically Mortgaged Premises and a first pari passu hypothecation over portions of specific identified Receivables as set out in the Debenture Trust Deed and the Deed of Hypothecation.
Option I - ` 50 Crores redeemable at par at the end of 1092 days from the date of allotment i.e. July 18, 2016 and Option II - ` 100 Crores redeemable at par at the end of 1,107 days from the date of allotment
150.00 150.00
3,000 (Previous Year: 3,000) (payable annually) 9.45% Secured Rated Listed Redeemable Non Convertible Debentures of ` 1,000,000 each
Secured by a First pari passu mortgage over specifically Mortgaged Premises and a first pari passu hypothecation over portions of specific identified Receivables as set out in the Debenture Trust Deed and the Deed of Hypothecation.
Series 1 - The amount of ` 150 Crores redeemable at par at the end of 1,050 days from the date of allotment i.e. July 20, 2016. Series II -The amount of ` 150 Crores redeemable at the end of 1,090 days from the date of allotment
300.00 300.00
2,000 (Previous Year: 2,000) (payable annually) 9.38% Secured Rated Listed Redeemable Non Convertible Debentures of ` 1,000,000 each
Secured by a First pari passu mortgage over specifically Mortgaged Premises and a first pari passu hypothecation over portions of specific identified Receivables as set out in the Debenture Trust Deed and the Deed of Hypothecation.
The amount of ` 200 Crores redeemable at par at the end of 1,095 days from the date of allotment
200.00 200.00
10,000 (Previous Year: 10,000) (payable on maturity) 9.35% Secured, Rated, Listed, Redeemable Non Convertible Debentures (NCD's) each having face value of ` 1,000,000 each
Secured through a First pari passu charge by hypothecation over the identified Receivables and a first ranking pari passu mortgage over specifically mortgaged premises or such other property as may be idenitfied by the Company as set out in the Debenture Trust deed and Deed of Hypothecation
Repayable after 1,093 days from the date of allotment
1,000.00 1,000.00
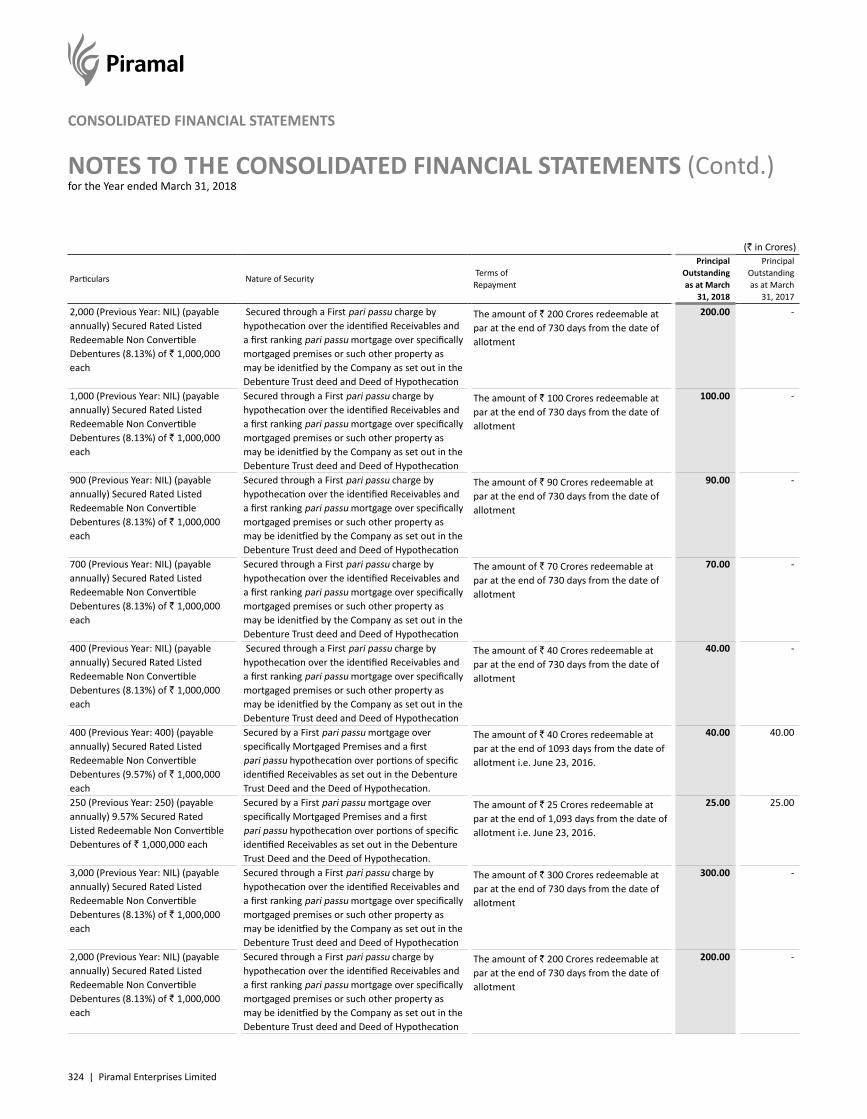
324 | Piramal Enterprises Limited
NOTES TO THE CONSOLIDATED FINANCIAL STATEMENTS (Contd.)for the Year ended March 31, 2018
CONSOLIDATED FINANCIAL STATEMENTS
(` in Crores)
Particulars Nature of Security Terms ofRepayment
Principal Outstanding as at March
31, 2018
Principal Outstanding as at March
31, 2017
2,000 (Previous Year: NIL) (payable annually) Secured Rated Listed Redeemable Non Convertible Debentures (8.13%) of ` 1,000,000 each
Secured through a First pari passu charge by hypothecation over the identified Receivables and a first ranking pari passu mortgage over specifically mortgaged premises or such other property as may be idenitfied by the Company as set out in the Debenture Trust deed and Deed of Hypothecation
The amount of ` 200 Crores redeemable at par at the end of 730 days from the date of allotment
200.00 -
1,000 (Previous Year: NIL) (payable annually) Secured Rated Listed Redeemable Non Convertible Debentures (8.13%) of ` 1,000,000 each
Secured through a First pari passu charge by hypothecation over the identified Receivables and a first ranking pari passu mortgage over specifically mortgaged premises or such other property as may be idenitfied by the Company as set out in the Debenture Trust deed and Deed of Hypothecation
The amount of ` 100 Crores redeemable at par at the end of 730 days from the date of allotment
100.00 -
900 (Previous Year: NIL) (payable annually) Secured Rated Listed Redeemable Non Convertible Debentures (8.13%) of ` 1,000,000 each
Secured through a First pari passu charge by hypothecation over the identified Receivables and a first ranking pari passu mortgage over specifically mortgaged premises or such other property as may be idenitfied by the Company as set out in the Debenture Trust deed and Deed of Hypothecation
The amount of ` 90 Crores redeemable at par at the end of 730 days from the date of allotment
90.00 -
700 (Previous Year: NIL) (payable annually) Secured Rated Listed Redeemable Non Convertible Debentures (8.13%) of ` 1,000,000 each
Secured through a First pari passu charge by hypothecation over the identified Receivables and a first ranking pari passu mortgage over specifically mortgaged premises or such other property as may be idenitfied by the Company as set out in the Debenture Trust deed and Deed of Hypothecation
The amount of ` 70 Crores redeemable at par at the end of 730 days from the date of allotment
70.00 -
400 (Previous Year: NIL) (payable annually) Secured Rated Listed Redeemable Non Convertible Debentures (8.13%) of ` 1,000,000 each
Secured through a First pari passu charge by hypothecation over the identified Receivables and a first ranking pari passu mortgage over specifically mortgaged premises or such other property as may be idenitfied by the Company as set out in the Debenture Trust deed and Deed of Hypothecation
The amount of ` 40 Crores redeemable at par at the end of 730 days from the date of allotment
40.00 -
400 (Previous Year: 400) (payable annually) Secured Rated Listed Redeemable Non Convertible Debentures (9.57%) of ` 1,000,000 each
Secured by a First pari passu mortgage over specifically Mortgaged Premises and a first pari passu hypothecation over portions of specific identified Receivables as set out in the Debenture Trust Deed and the Deed of Hypothecation.
The amount of ` 40 Crores redeemable at par at the end of 1093 days from the date of allotment i.e. June 23, 2016.
40.00 40.00
250 (Previous Year: 250) (payable annually) 9.57% Secured Rated Listed Redeemable Non Convertible Debentures of ` 1,000,000 each
Secured by a First pari passu mortgage over specifically Mortgaged Premises and a first pari passu hypothecation over portions of specific identified Receivables as set out in the Debenture Trust Deed and the Deed of Hypothecation.
The amount of ` 25 Crores redeemable at par at the end of 1,093 days from the date of allotment i.e. June 23, 2016.
25.00 25.00
3,000 (Previous Year: NIL) (payable annually) Secured Rated Listed Redeemable Non Convertible Debentures (8.13%) of ` 1,000,000 each
Secured through a First pari passu charge by hypothecation over the identified Receivables and a first ranking pari passu mortgage over specifically mortgaged premises or such other property as may be idenitfied by the Company as set out in the Debenture Trust deed and Deed of Hypothecation
The amount of ` 300 Crores redeemable at par at the end of 730 days from the date of allotment
300.00 -
2,000 (Previous Year: NIL) (payable annually) Secured Rated Listed Redeemable Non Convertible Debentures (8.13%) of ` 1,000,000 each
Secured through a First pari passu charge by hypothecation over the identified Receivables and a first ranking pari passu mortgage over specifically mortgaged premises or such other property as may be idenitfied by the Company as set out in the Debenture Trust deed and Deed of Hypothecation
The amount of ` 200 Crores redeemable at par at the end of 730 days from the date of allotment
200.00 -
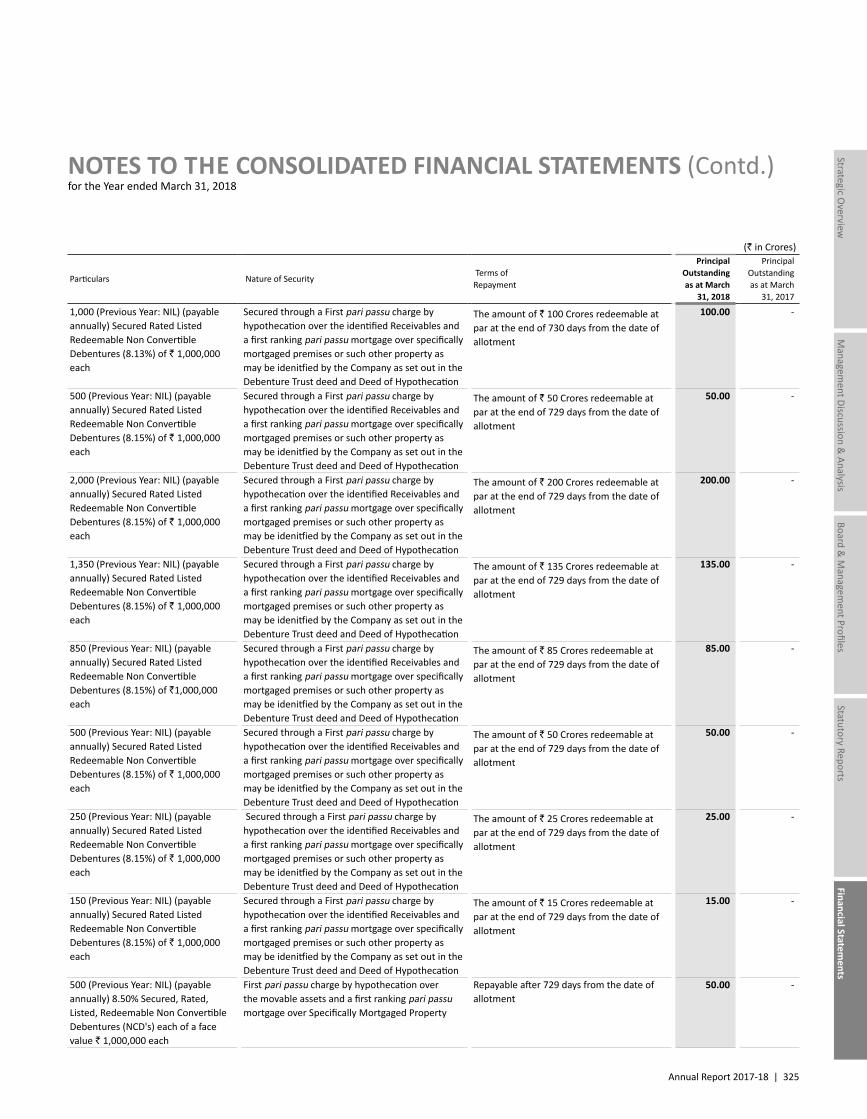
Annual Report 2017-18 | 325
Managem
ent Discussion & Analysis
Strategic Overview
Board &
Managem
ent ProfilesStatutory Reports
Financial Statements
NOTES TO THE CONSOLIDATED FINANCIAL STATEMENTS (Contd.)for the Year ended March 31, 2018
(` in Crores)
Particulars Nature of Security Terms ofRepayment
Principal Outstanding as at March
31, 2018
Principal Outstanding as at March
31, 2017
1,000 (Previous Year: NIL) (payable annually) Secured Rated Listed Redeemable Non Convertible Debentures (8.13%) of ` 1,000,000 each
Secured through a First pari passu charge by hypothecation over the identified Receivables and a first ranking pari passu mortgage over specifically mortgaged premises or such other property as may be idenitfied by the Company as set out in the Debenture Trust deed and Deed of Hypothecation
The amount of ` 100 Crores redeemable at par at the end of 730 days from the date of allotment
100.00 -
500 (Previous Year: NIL) (payable annually) Secured Rated Listed Redeemable Non Convertible Debentures (8.15%) of ` 1,000,000 each
Secured through a First pari passu charge by hypothecation over the identified Receivables and a first ranking pari passu mortgage over specifically mortgaged premises or such other property as may be idenitfied by the Company as set out in the Debenture Trust deed and Deed of Hypothecation
The amount of ` 50 Crores redeemable at par at the end of 729 days from the date of allotment
50.00 -
2,000 (Previous Year: NIL) (payable annually) Secured Rated Listed Redeemable Non Convertible Debentures (8.15%) of ` 1,000,000 each
Secured through a First pari passu charge by hypothecation over the identified Receivables and a first ranking pari passu mortgage over specifically mortgaged premises or such other property as may be idenitfied by the Company as set out in the Debenture Trust deed and Deed of Hypothecation
The amount of ` 200 Crores redeemable at par at the end of 729 days from the date of allotment
200.00 -
1,350 (Previous Year: NIL) (payable annually) Secured Rated Listed Redeemable Non Convertible Debentures (8.15%) of ` 1,000,000 each
Secured through a First pari passu charge by hypothecation over the identified Receivables and a first ranking pari passu mortgage over specifically mortgaged premises or such other property as may be idenitfied by the Company as set out in the Debenture Trust deed and Deed of Hypothecation
The amount of ` 135 Crores redeemable at par at the end of 729 days from the date of allotment
135.00 -
850 (Previous Year: NIL) (payable annually) Secured Rated Listed Redeemable Non Convertible Debentures (8.15%) of `1,000,000 each
Secured through a First pari passu charge by hypothecation over the identified Receivables and a first ranking pari passu mortgage over specifically mortgaged premises or such other property as may be idenitfied by the Company as set out in the Debenture Trust deed and Deed of Hypothecation
The amount of ` 85 Crores redeemable at par at the end of 729 days from the date of allotment
85.00 -
500 (Previous Year: NIL) (payable annually) Secured Rated Listed Redeemable Non Convertible Debentures (8.15%) of ` 1,000,000 each
Secured through a First pari passu charge by hypothecation over the identified Receivables and a first ranking pari passu mortgage over specifically mortgaged premises or such other property as may be idenitfied by the Company as set out in the Debenture Trust deed and Deed of Hypothecation
The amount of ` 50 Crores redeemable at par at the end of 729 days from the date of allotment
50.00 -
250 (Previous Year: NIL) (payable annually) Secured Rated Listed Redeemable Non Convertible Debentures (8.15%) of ` 1,000,000 each
Secured through a First pari passu charge by hypothecation over the identified Receivables and a first ranking pari passu mortgage over specifically mortgaged premises or such other property as may be idenitfied by the Company as set out in the Debenture Trust deed and Deed of Hypothecation
The amount of ` 25 Crores redeemable at par at the end of 729 days from the date of allotment
25.00 -
150 (Previous Year: NIL) (payable annually) Secured Rated Listed Redeemable Non Convertible Debentures (8.15%) of ` 1,000,000 each
Secured through a First pari passu charge by hypothecation over the identified Receivables and a first ranking pari passu mortgage over specifically mortgaged premises or such other property as may be idenitfied by the Company as set out in the Debenture Trust deed and Deed of Hypothecation
The amount of ` 15 Crores redeemable at par at the end of 729 days from the date of allotment
15.00 -
500 (Previous Year: NIL) (payable annually) 8.50% Secured, Rated, Listed, Redeemable Non Convertible Debentures (NCD's) each of a face value ` 1,000,000 each
First pari passu charge by hypothecation over the movable assets and a first ranking pari passu mortgage over Specifically Mortgaged Property
Repayable after 729 days from the date of allotment
50.00 -
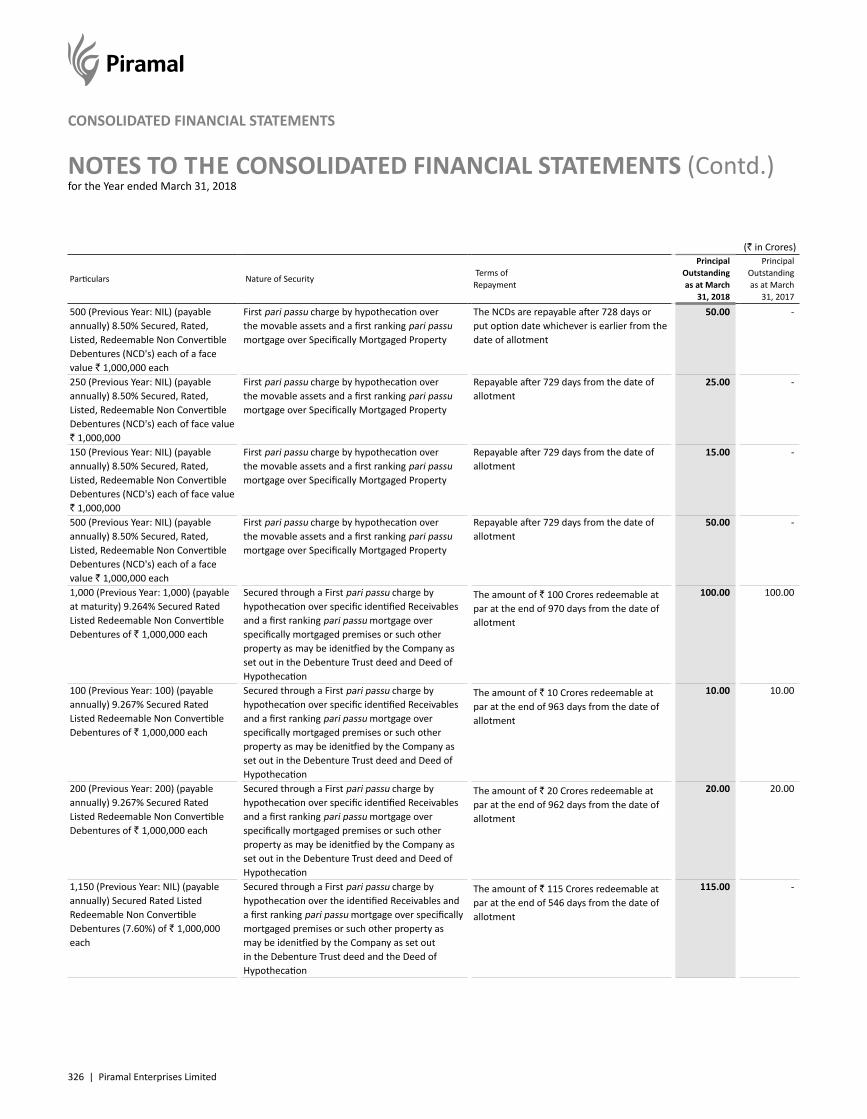
326 | Piramal Enterprises Limited
NOTES TO THE CONSOLIDATED FINANCIAL STATEMENTS (Contd.)for the Year ended March 31, 2018
CONSOLIDATED FINANCIAL STATEMENTS
(` in Crores)
Particulars Nature of Security Terms ofRepayment
Principal Outstanding as at March
31, 2018
Principal Outstanding as at March
31, 2017
500 (Previous Year: NIL) (payable annually) 8.50% Secured, Rated, Listed, Redeemable Non Convertible Debentures (NCD's) each of a face value ` 1,000,000 each
First pari passu charge by hypothecation over the movable assets and a first ranking pari passu mortgage over Specifically Mortgaged Property
The NCDs are repayable after 728 days or put option date whichever is earlier from the date of allotment
50.00 -
250 (Previous Year: NIL) (payable annually) 8.50% Secured, Rated, Listed, Redeemable Non Convertible Debentures (NCD's) each of face value ` 1,000,000
First pari passu charge by hypothecation over the movable assets and a first ranking pari passu mortgage over Specifically Mortgaged Property
Repayable after 729 days from the date of allotment
25.00 -
150 (Previous Year: NIL) (payable annually) 8.50% Secured, Rated, Listed, Redeemable Non Convertible Debentures (NCD's) each of face value ` 1,000,000
First pari passu charge by hypothecation over the movable assets and a first ranking pari passu mortgage over Specifically Mortgaged Property
Repayable after 729 days from the date of allotment
15.00 -
500 (Previous Year: NIL) (payable annually) 8.50% Secured, Rated, Listed, Redeemable Non Convertible Debentures (NCD's) each of a face value ` 1,000,000 each
First pari passu charge by hypothecation over the movable assets and a first ranking pari passu mortgage over Specifically Mortgaged Property
Repayable after 729 days from the date of allotment
50.00 -
1,000 (Previous Year: 1,000) (payable at maturity) 9.264% Secured Rated Listed Redeemable Non Convertible Debentures of ` 1,000,000 each
Secured through a First pari passu charge by hypothecation over specific identified Receivables and a first ranking pari passu mortgage over specifically mortgaged premises or such other property as may be idenitfied by the Company as set out in the Debenture Trust deed and Deed of Hypothecation
The amount of ` 100 Crores redeemable at par at the end of 970 days from the date of allotment
100.00 100.00
100 (Previous Year: 100) (payable annually) 9.267% Secured Rated Listed Redeemable Non Convertible Debentures of ` 1,000,000 each
Secured through a First pari passu charge by hypothecation over specific identified Receivables and a first ranking pari passu mortgage over specifically mortgaged premises or such other property as may be idenitfied by the Company as set out in the Debenture Trust deed and Deed of Hypothecation
The amount of ` 10 Crores redeemable at par at the end of 963 days from the date of allotment
10.00 10.00
200 (Previous Year: 200) (payable annually) 9.267% Secured Rated Listed Redeemable Non Convertible Debentures of ` 1,000,000 each
Secured through a First pari passu charge by hypothecation over specific identified Receivables and a first ranking pari passu mortgage over specifically mortgaged premises or such other property as may be idenitfied by the Company as set out in the Debenture Trust deed and Deed of Hypothecation
The amount of ` 20 Crores redeemable at par at the end of 962 days from the date of allotment
20.00 20.00
1,150 (Previous Year: NIL) (payable annually) Secured Rated Listed Redeemable Non Convertible Debentures (7.60%) of ` 1,000,000 each
Secured through a First pari passu charge by hypothecation over the identified Receivables and a first ranking pari passu mortgage over specifically mortgaged premises or such other property as may be idenitfied by the Company as set out in the Debenture Trust deed and the Deed of Hypothecation
The amount of ` 115 Crores redeemable at par at the end of 546 days from the date of allotment
115.00 -
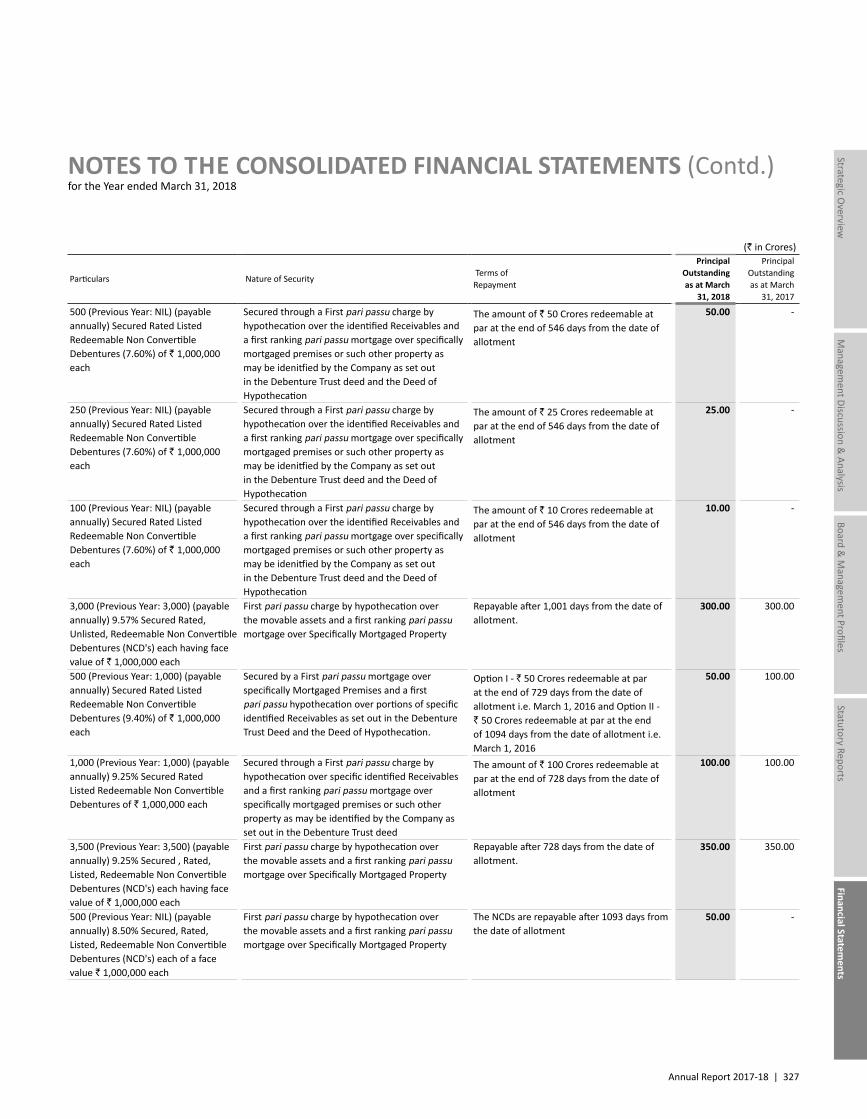
Annual Report 2017-18 | 327
Managem
ent Discussion & Analysis
Strategic Overview
Board &
Managem
ent ProfilesStatutory Reports
Financial Statements
NOTES TO THE CONSOLIDATED FINANCIAL STATEMENTS (Contd.)for the Year ended March 31, 2018
(` in Crores)
Particulars Nature of Security Terms ofRepayment
Principal Outstanding as at March
31, 2018
Principal Outstanding as at March
31, 2017
500 (Previous Year: NIL) (payable annually) Secured Rated Listed Redeemable Non Convertible Debentures (7.60%) of ` 1,000,000 each
Secured through a First pari passu charge by hypothecation over the identified Receivables and a first ranking pari passu mortgage over specifically mortgaged premises or such other property as may be idenitfied by the Company as set out in the Debenture Trust deed and the Deed of Hypothecation
The amount of ` 50 Crores redeemable at par at the end of 546 days from the date of allotment
50.00 -
250 (Previous Year: NIL) (payable annually) Secured Rated Listed Redeemable Non Convertible Debentures (7.60%) of ` 1,000,000 each
Secured through a First pari passu charge by hypothecation over the identified Receivables and a first ranking pari passu mortgage over specifically mortgaged premises or such other property as may be idenitfied by the Company as set out in the Debenture Trust deed and the Deed of Hypothecation
The amount of ` 25 Crores redeemable at par at the end of 546 days from the date of allotment
25.00 -
100 (Previous Year: NIL) (payable annually) Secured Rated Listed Redeemable Non Convertible Debentures (7.60%) of ` 1,000,000 each
Secured through a First pari passu charge by hypothecation over the identified Receivables and a first ranking pari passu mortgage over specifically mortgaged premises or such other property as may be idenitfied by the Company as set out in the Debenture Trust deed and the Deed of Hypothecation
The amount of ` 10 Crores redeemable at par at the end of 546 days from the date of allotment
10.00 -
3,000 (Previous Year: 3,000) (payable annually) 9.57% Secured Rated, Unlisted, Redeemable Non Convertible Debentures (NCD's) each having face value of ` 1,000,000 each
First pari passu charge by hypothecation over the movable assets and a first ranking pari passu mortgage over Specifically Mortgaged Property
Repayable after 1,001 days from the date of allotment.
300.00 300.00
500 (Previous Year: 1,000) (payable annually) Secured Rated Listed Redeemable Non Convertible Debentures (9.40%) of ` 1,000,000 each
Secured by a First pari passu mortgage over specifically Mortgaged Premises and a first pari passu hypothecation over portions of specific identified Receivables as set out in the Debenture Trust Deed and the Deed of Hypothecation.
Option I - ` 50 Crores redeemable at par at the end of 729 days from the date of allotment i.e. March 1, 2016 and Option II - ` 50 Crores redeemable at par at the end of 1094 days from the date of allotment i.e. March 1, 2016
50.00 100.00
1,000 (Previous Year: 1,000) (payable annually) 9.25% Secured Rated Listed Redeemable Non Convertible Debentures of ` 1,000,000 each
Secured through a First pari passu charge by hypothecation over specific identified Receivables and a first ranking pari passu mortgage over specifically mortgaged premises or such other property as may be identified by the Company as set out in the Debenture Trust deed
The amount of ` 100 Crores redeemable at par at the end of 728 days from the date of allotment
100.00 100.00
3,500 (Previous Year: 3,500) (payable annually) 9.25% Secured , Rated, Listed, Redeemable Non Convertible Debentures (NCD's) each having face value of ` 1,000,000 each
First pari passu charge by hypothecation over the movable assets and a first ranking pari passu mortgage over Specifically Mortgaged Property
Repayable after 728 days from the date of allotment.
350.00 350.00
500 (Previous Year: NIL) (payable annually) 8.50% Secured, Rated, Listed, Redeemable Non Convertible Debentures (NCD's) each of a face value ` 1,000,000 each
First pari passu charge by hypothecation over the movable assets and a first ranking pari passu mortgage over Specifically Mortgaged Property
The NCDs are repayable after 1093 days from the date of allotment
50.00 -
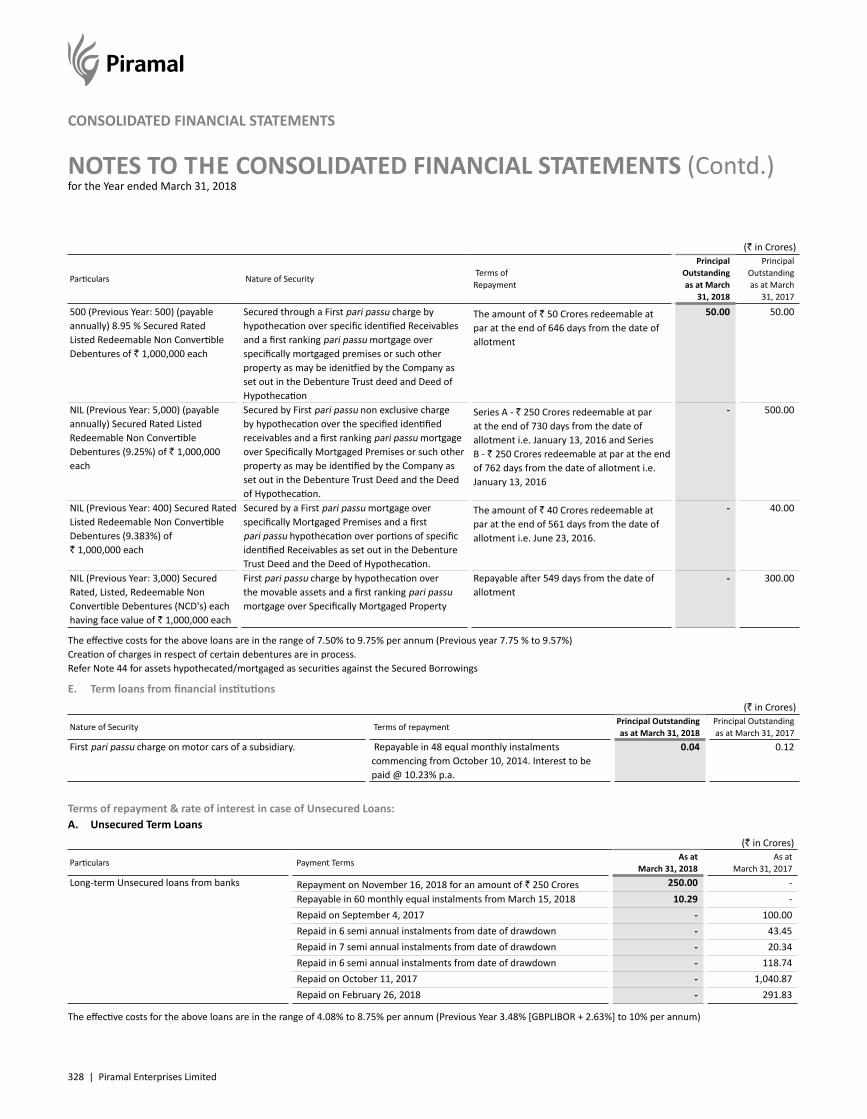
328 | Piramal Enterprises Limited
NOTES TO THE CONSOLIDATED FINANCIAL STATEMENTS (Contd.)for the Year ended March 31, 2018
CONSOLIDATED FINANCIAL STATEMENTS
(` in Crores)
Particulars Nature of Security Terms ofRepayment
Principal Outstanding as at March
31, 2018
Principal Outstanding as at March
31, 2017
500 (Previous Year: 500) (payable annually) 8.95 % Secured Rated Listed Redeemable Non Convertible Debentures of ` 1,000,000 each
Secured through a First pari passu charge by hypothecation over specific identified Receivables and a first ranking pari passu mortgage over specifically mortgaged premises or such other property as may be idenitfied by the Company as set out in the Debenture Trust deed and Deed of Hypothecation
The amount of ` 50 Crores redeemable at par at the end of 646 days from the date of allotment
50.00 50.00
NIL (Previous Year: 5,000) (payable annually) Secured Rated Listed Redeemable Non Convertible Debentures (9.25%) of ` 1,000,000 each
Secured by First pari passu non exclusive charge by hypothecation over the specified identified receivables and a first ranking pari passu mortgage over Specifically Mortgaged Premises or such other property as may be identified by the Company as set out in the Debenture Trust Deed and the Deed of Hypothecation.
Series A - ` 250 Crores redeemable at par at the end of 730 days from the date of allotment i.e. January 13, 2016 and Series B - ` 250 Crores redeemable at par at the end of 762 days from the date of allotment i.e. January 13, 2016
- 500.00
NIL (Previous Year: 400) Secured Rated Listed Redeemable Non Convertible Debentures (9.383%) of ` 1,000,000 each
Secured by a First pari passu mortgage over specifically Mortgaged Premises and a first pari passu hypothecation over portions of specific identified Receivables as set out in the Debenture Trust Deed and the Deed of Hypothecation.
The amount of ` 40 Crores redeemable at par at the end of 561 days from the date of allotment i.e. June 23, 2016.
- 40.00
NIL (Previous Year: 3,000) Secured Rated, Listed, Redeemable Non Convertible Debentures (NCD's) each having face value of ` 1,000,000 each
First pari passu charge by hypothecation over the movable assets and a first ranking pari passu mortgage over Specifically Mortgaged Property
Repayable after 549 days from the date of allotment
- 300.00
The effective costs for the above loans are in the range of 7.50% to 9.75% per annum (Previous year 7.75 % to 9.57%)Creation of charges in respect of certain debentures are in process.Refer Note 44 for assets hypothecated/mortgaged as securities against the Secured Borrowings
E. Term loans from financial institutions (` in Crores)
Nature of Security Terms of repaymentPrincipal Outstanding as at March 31, 2018
Principal Outstanding as at March 31, 2017
First pari passu charge on motor cars of a subsidiary. Repayable in 48 equal monthly instalments commencing from October 10, 2014. Interest to be paid @ 10.23% p.a.
0.04 0.12
Terms of repayment & rate of interest in case of Unsecured Loans:A. Unsecured Term Loans
(` in Crores)
Particulars Payment TermsAs at
March 31, 2018As at
March 31, 2017Long-term Unsecured loans from banks Repayment on November 16, 2018 for an amount of ` 250 Crores 250.00 -
Repayable in 60 monthly equal instalments from March 15, 2018 10.29 - Repaid on September 4, 2017 - 100.00 Repaid in 6 semi annual instalments from date of drawdown - 43.45 Repaid in 7 semi annual instalments from date of drawdown - 20.34 Repaid in 6 semi annual instalments from date of drawdown - 118.74 Repaid on October 11, 2017 - 1,040.87 Repaid on February 26, 2018 - 291.83
The effective costs for the above loans are in the range of 4.08% to 8.75% per annum (Previous Year 3.48% [GBPLIBOR + 2.63%] to 10% per annum)
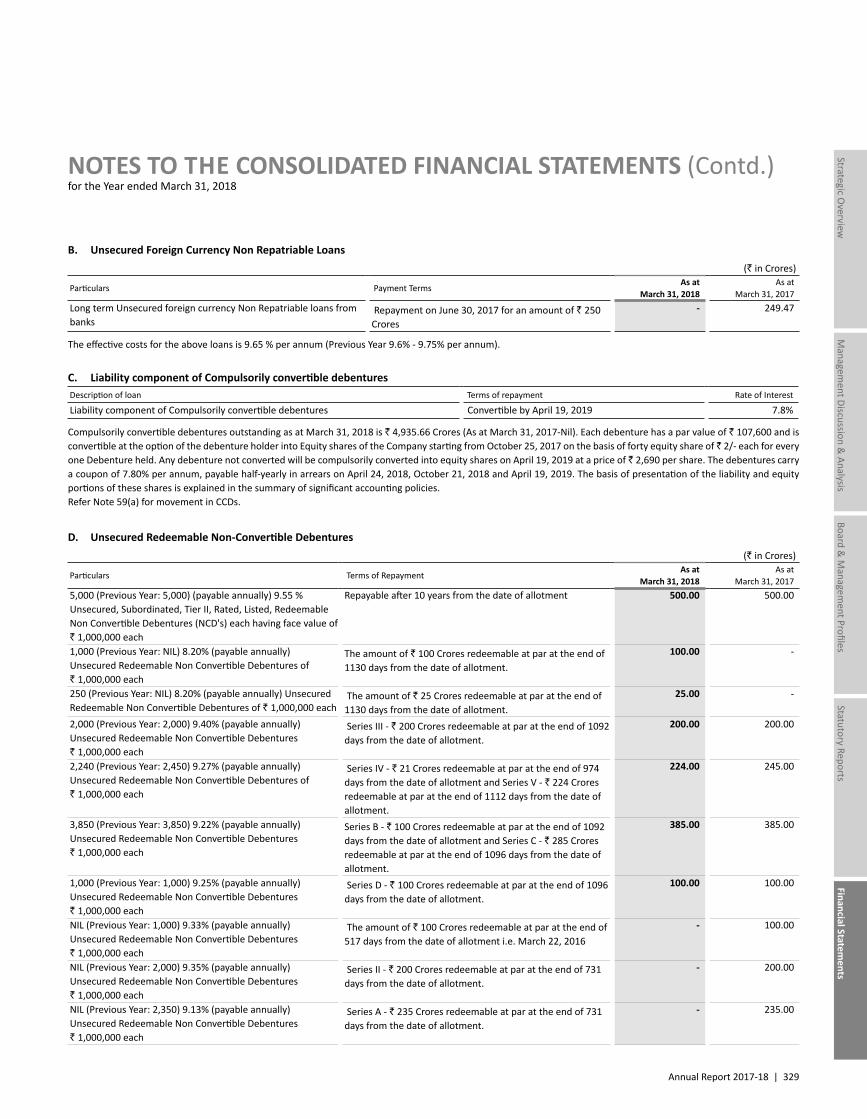
Annual Report 2017-18 | 329
Managem
ent Discussion & Analysis
Strategic Overview
Board &
Managem
ent ProfilesStatutory Reports
Financial Statements
NOTES TO THE CONSOLIDATED FINANCIAL STATEMENTS (Contd.)for the Year ended March 31, 2018
B. Unsecured Foreign Currency Non Repatriable Loans (` in Crores)
Particulars Payment TermsAs at
March 31, 2018As at
March 31, 2017Long term Unsecured foreign currency Non Repatriable loans from banks
Repayment on June 30, 2017 for an amount of ` 250 Crores
- 249.47
The effective costs for the above loans is 9.65 % per annum (Previous Year 9.6% - 9.75% per annum).
C. Liability component of Compulsorily convertible debenturesDescription of loan Terms of repayment Rate of Interest
Liability component of Compulsorily convertible debentures Convertible by April 19, 2019 7.8%
Compulsorily convertible debentures outstanding as at March 31, 2018 is ` 4,935.66 Crores (As at March 31, 2017-Nil). Each debenture has a par value of ` 107,600 and is convertible at the option of the debenture holder into Equity shares of the Company starting from October 25, 2017 on the basis of forty equity share of ` 2/- each for every one Debenture held. Any debenture not converted will be compulsorily converted into equity shares on April 19, 2019 at a price of ` 2,690 per share. The debentures carry a coupon of 7.80% per annum, payable half-yearly in arrears on April 24, 2018, October 21, 2018 and April 19, 2019. The basis of presentation of the liability and equity portions of these shares is explained in the summary of significant accounting policies.Refer Note 59(a) for movement in CCDs.
D. Unsecured Redeemable Non-Convertible Debentures (` in Crores)
Particulars Terms of RepaymentAs at
March 31, 2018As at
March 31, 20175,000 (Previous Year: 5,000) (payable annually) 9.55 % Unsecured, Subordinated, Tier II, Rated, Listed, Redeemable Non Convertible Debentures (NCD's) each having face value of ` 1,000,000 each
Repayable after 10 years from the date of allotment 500.00 500.00
1,000 (Previous Year: NIL) 8.20% (payable annually) Unsecured Redeemable Non Convertible Debentures of ` 1,000,000 each
The amount of ` 100 Crores redeemable at par at the end of 1130 days from the date of allotment.
100.00 -
250 (Previous Year: NIL) 8.20% (payable annually) Unsecured Redeemable Non Convertible Debentures of ` 1,000,000 each
The amount of ` 25 Crores redeemable at par at the end of 1130 days from the date of allotment.
25.00 -
2,000 (Previous Year: 2,000) 9.40% (payable annually) Unsecured Redeemable Non Convertible Debentures ` 1,000,000 each
Series III - ` 200 Crores redeemable at par at the end of 1092 days from the date of allotment.
200.00 200.00
2,240 (Previous Year: 2,450) 9.27% (payable annually) Unsecured Redeemable Non Convertible Debentures of ` 1,000,000 each
Series IV - ` 21 Crores redeemable at par at the end of 974 days from the date of allotment and Series V - ` 224 Crores redeemable at par at the end of 1112 days from the date of allotment.
224.00 245.00
3,850 (Previous Year: 3,850) 9.22% (payable annually) Unsecured Redeemable Non Convertible Debentures ` 1,000,000 each
Series B - ` 100 Crores redeemable at par at the end of 1092 days from the date of allotment and Series C - ` 285 Crores redeemable at par at the end of 1096 days from the date of allotment.
385.00 385.00
1,000 (Previous Year: 1,000) 9.25% (payable annually) Unsecured Redeemable Non Convertible Debentures ` 1,000,000 each
Series D - ` 100 Crores redeemable at par at the end of 1096 days from the date of allotment.
100.00 100.00
NIL (Previous Year: 1,000) 9.33% (payable annually) Unsecured Redeemable Non Convertible Debentures ` 1,000,000 each
The amount of ` 100 Crores redeemable at par at the end of 517 days from the date of allotment i.e. March 22, 2016
- 100.00
NIL (Previous Year: 2,000) 9.35% (payable annually) Unsecured Redeemable Non Convertible Debentures ` 1,000,000 each
Series II - ` 200 Crores redeemable at par at the end of 731 days from the date of allotment.
- 200.00
NIL (Previous Year: 2,350) 9.13% (payable annually) Unsecured Redeemable Non Convertible Debentures ` 1,000,000 each
Series A - ` 235 Crores redeemable at par at the end of 731 days from the date of allotment.
- 235.00
330 | Piramal Enterprises Limited
NOTES TO THE CONSOLIDATED FINANCIAL STATEMENTS (Contd.)for the Year ended March 31, 2018
CONSOLIDATED FINANCIAL STATEMENTS
(` in Crores)
Particulars Terms of RepaymentAs at
March 31, 2018As at
March 31, 2017
NIL (Previous Year: 4,000) 9.15% (payable annually) Unsecured Redeemable Non Convertible Debentures ` 1,000,000 each
Series A - ` 150 Crores redeemable at par at the end of 711 days from the date of allotment and Series B - ` 150 Crores redeemable at par at the end of 746 days from the date of allotment and Series C - ` 100 Crores redeemable at par at the end of 767 days from the date of allotment
- 400.00
NIL (Previous Year: 1,550) 9.18% (payable annually) Unsecured Redeemable Non Convertible Debentures ` 1,000,000 each
Series I - ` 75 Crores redeemable at par at the end of 532 days from the date of allotment and Series II - ` 15 Crores redeemable at par at the end of 644 days from the date of allotment and Series III - ` 65 Crores redeemable at par at the end of 731 days from the date of allotment.
- 80.00
NIL (Previous Year: 5,000) 9.43% Unsecured Redeemable Non Convertible Debentures of ` 1,000,000 each*
Series A - ` 350 Crores redeemable at par at the end of 731 days from the date of allotment and Series B - ` 100 Crores redeemable at par at the end of 1095 days from the date of allotment , Series C - ` 50 Crores redeemable at par at the end of 1,095 days from the date of allotment.
- 150.00
The effective costs for the above loans are in the range of 8.20% to 9.55% per annum (Previous Year 9.13% to 10.65 % per annum).*Interest on Series A & B is payable annually. Interest on Series C is payable at maturity.
19. OTHER FINANCIAL LIABILITIES – NON-CURRENT As at
March 31, 2018 ` in Crores
As at March 31, 2017
` in CroresLease Equalisation Liability 4.13 5.79Deferred Consideration (Refer Note 3) 13.04 -Contingent consideration at FVTPL (Refer Note 40) 107.57 141.79Deposits Received 4.86 2.90
TOTAL 129.60 150.48
20. NON-CURRENT PROVISIONS As at
March 31, 2018 ` in Crores
As at March 31, 2017
` in CroresProvision for employee benefits (Refer Note 42) 40.82 34.95Provision for Grants-committed* - 4.91Provision for Onerous contracts* 1.29 4.25Provision for incentive* - 29.48
TOTAL 42.11 73.59
*Refer Note 51 for movement during the year.
Annual Report 2017-18 | 331
Managem
ent Discussion & Analysis
Strategic Overview
Board &
Managem
ent ProfilesStatutory Reports
Financial Statements
NOTES TO THE CONSOLIDATED FINANCIAL STATEMENTS (Contd.)for the Year ended March 31, 2018
21. DEFERRED TAX LIABILITIES (NET) As at
March 31, 2018` in Crores
As at March 31, 2017
` in Crores(a) Deferred Tax Liabilities on account of temporary differences - Fair Valuation of Investment 11.74 15.43 - Unamortised Distribution Expenses 4.02 6.70 - Share of undistributed earnings of associates 16.37 11.60 - Others 0.10 0.85
32.23 34.58(b) Deferred Tax Asset on account of temporary differences - Property, Plant and Equipment and Intangible assets 0.98 0.97 - Expenses that are allowed on payment basis 1.58 1.68 - Others 0.49 1.18
3.05 3.83 TOTAL (A-B) 29.18 30.75
22. OTHER NON-CURRENT LIABILITIES As at
March 31, 2018 ` in Crores
As at March 31, 2017
` in CroresDeferred Government grant related to assets 3.63 4.06Other grants related to assets 72.36 28.30Deferred Revenue - 2.87
TOTAL 75.99 35.23
23. CURRENT BORROWINGS As at
March 31, 2018` in Crores
As at March 31, 2017
` in CroresSecured - at amortised cost Loans from banks - Working Capital Demand Loan 1,185.38 35.05 - Overdraft with banks (including PCFC) 140.11 175.70 - Collaterised Debt Obligations (Refer Note 10) 1.56 20.59
1,327.05 231.34Unsecured - at amortised cost Loans from banks Rupee Loans – Repayable on demand 771.76 1,147.06 – Others - 1.01 Foreign Currency Non Repatriable Loans - 146.29 Others - 1,039.12 Commercial Papers 12,567.07 9,514.66
13,338.83 11,848.14 TOTAL 14,665.88 12,079.48
332 | Piramal Enterprises Limited
NOTES TO THE CONSOLIDATED FINANCIAL STATEMENTS (Contd.)for the Year ended March 31, 2018
CONSOLIDATED FINANCIAL STATEMENTS
Note:Description of loan Terms of repayment Rate of InterestSecured Loans:Working capital Demand Loan* At Call 4.49 % pa to 10.45 % paOverdraft with banks* At Call 0.9% pa to 13.00 % paOthers (PCFC)* At Call 1.55 % pa to 2.94 % paCollaterised Debt Obligations* By the end of credit period 0.40 % pa to 2.94 % paUnsecured Loans:Rupee Loans from Banks (Repayable on demand) Repayable within 365 days from date of disbursement 7.90 % pa to 9.60 % paCommercial Papers Repayable within 365 days from date of disbursement 6.35 % pa to 9.00 % pa
Terms of repayment, nature of security & rate of interest in case of Secured Loans:Working capital Demand Loan
(` in Crores)
Nature of Security Terms of RepaymentPrincipal Outstanding as at March 31, 2018
Principal Outstanding as at March 31, 2017
First pari passu charge on the standard assets receivables of the borrower along with other lenders with minimum asset cover of 1.1x (where standard receivables constitute receivables arising out of activities permitted by RBI/ NHB)
Final Maturity date of each tranche drawn down under the facility shall not extend 3 months from the date of first disbursement. Facility shall be subject to review after 3 months from the date of first disbursement.
400.00 -
First pari passu charge by way of hypothecation on the standard moveable assets including receivables and book debts, present and future
Final Maturity date of each tranche drawn down under the facility shall not extend 3 months from the date of first disbursement. Facility shall be subject to review after 3 months from the date of first disbursement.
350.00 45.00
First pari passu charge by way of hypothecation on the standard moveable assets including receivables and book debts, present and future
Final Maturity date of each tranche drawn down under the facility shall not extend 3 months from the date of first disbursement. Facility shall be subject to review after 3 months from the date of first disbursement.
50.00 150.00
First pari passu charge by way of hypothecation on the standard moveable assets including receivables and book debts, present and future
Final Maturity date of each tranche drawn down under the facility shall not extend 3 months from the date of first disbursement. Facility shall be subject to review after 3 months from the date of first disbursement.
50.00 -
First pari passu charge by way of hypothecation on the standard moveable assets including receivables and book debts, present and future
Final Maturity date of each tranche drawn down under the facility shall not extend 3 months from the date of first disbursement. Facility shall be subject to review after 3 months from the date of first disbursement.
200.00 -
*These are secured by hypothecation of inventories and book debts except as mentioned above separately.Refer Note 44 for assets hypothecated/mortgaged as securities against the Secured Borrowings.
24. OTHER FINANCIAL LIABILITIES – CURRENT As at
March 31, 2018 ` in Crores
As at March 31, 2017
` in CroresCurrent maturities of long-term debt (Refer Note 18) 5,274.31 3,875.81Interest accrued 0.13 -Deferred Consideration (Refer Note 3 and 40) 13.03 998.72Payable to related parties 0.10 -Unclaimed Dividend (Refer Note below) 18.37 15.94Lease Equalisation 2.11 1.46Employee related liabilities 255.70 142.84Contingent consideration at FVTPL (Refer Note 40) 18.13 -Capital Creditors 4.52 42.74Security Deposits Received 2.34 1.44Derivative Financial Liabilities 16.24 30.73Other payables 0.04 2.93
TOTAL 5,605.02 5,112.61
There are no amounts due and outstanding to be credited to Investor Education and Protection Fund as at the year end.
Annual Report 2017-18 | 333
Managem
ent Discussion & Analysis
Strategic Overview
Board &
Managem
ent ProfilesStatutory Reports
Financial Statements
NOTES TO THE CONSOLIDATED FINANCIAL STATEMENTS (Contd.)for the Year ended March 31, 2018
25. OTHER CURRENT LIABILITIES As at
March 31, 2018 ` in Crores
As at March 31, 2017
` in CroresAdvance from Customers 99.60 124.78Deferred Revenue 271.25 273.92Deferred Government grant related to assets 6.23 0.20Deferred Rent 10.13 6.95Statutory Dues 45.64 44.66
TOTAL 432.85 450.51
26. CURRENT PROVISIONS As at
March 31, 2018 ` in Crores
As at March 31, 2017
` in CroresProvision for employee benefits (Refer Note 42) 42.61 85.32Provision for Expected Credit Loss on Loan Commitments / Letter of Credit (Refer Note 50(f)) 11.07 6.36Provision for Wealth Tax 0.21 0.21Provision for Onerous contracts * - 5.11Provision for grants-committed * 6.34 12.97Provision for Litigations & Disputes * 3.50 3.50Provision for Incentives * 29.64 -
TOTAL 93.37 113.47
* Refer Note 51 for movement during the year.
27. CURRENT TAX LIABILITIES (NET) As at
March 31, 2018 ` in Crores
As at March 31, 2017
` in Crores
Provision for Income Tax [Net of Advance Tax of ` 750.22 Crores as on March 31, 2018 and ` 404.44 Crores as on March 31, 2017]
57.10 37.48
TOTAL 57.10 37.48
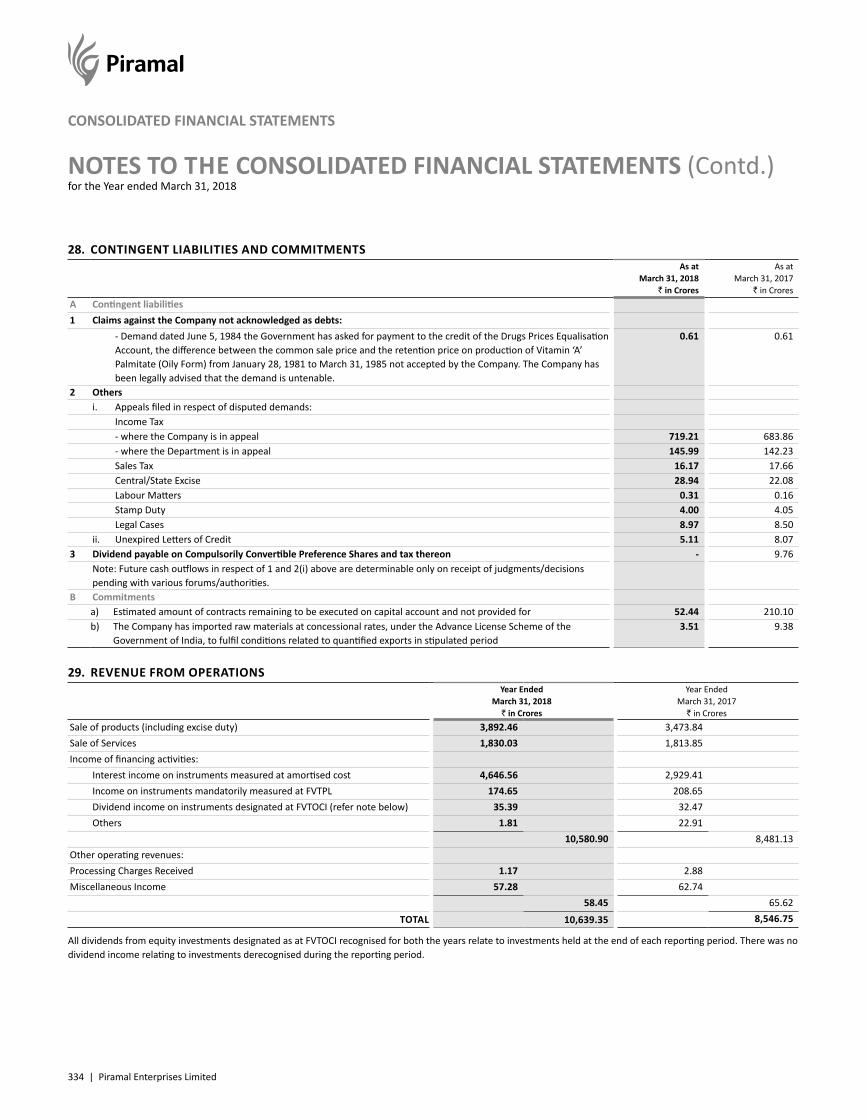
334 | Piramal Enterprises Limited
NOTES TO THE CONSOLIDATED FINANCIAL STATEMENTS (Contd.)for the Year ended March 31, 2018
CONSOLIDATED FINANCIAL STATEMENTS
28. CONTINGENT LIABILITIES AND COMMITMENTS As at
March 31, 2018 ` in Crores
As at March 31, 2017
` in CroresA Contingent liabilities1 Claims against the Company not acknowledged as debts:
- Demand dated June 5, 1984 the Government has asked for payment to the credit of the Drugs Prices Equalisation Account, the difference between the common sale price and the retention price on production of Vitamin ‘A’ Palmitate (Oily Form) from January 28, 1981 to March 31, 1985 not accepted by the Company. The Company has been legally advised that the demand is untenable.
0.61 0.61
2 Othersi. Appeals filed in respect of disputed demands: Income Tax - where the Company is in appeal 719.21 683.86 - where the Department is in appeal 145.99 142.23 Sales Tax 16.17 17.66 Central/State Excise 28.94 22.08 Labour Matters 0.31 0.16 Stamp Duty 4.00 4.05 Legal Cases 8.97 8.50ii. Unexpired Letters of Credit 5.11 8.07
3 Dividend payable on Compulsorily Convertible Preference Shares and tax thereon - 9.76Note: Future cash outflows in respect of 1 and 2(i) above are determinable only on receipt of judgments/decisions pending with various forums/authorities.
B Commitmentsa) Estimated amount of contracts remaining to be executed on capital account and not provided for 52.44 210.10b) The Company has imported raw materials at concessional rates, under the Advance License Scheme of the
Government of India, to fulfil conditions related to quantified exports in stipulated period 3.51 9.38
29. REVENUE FROM OPERATIONS Year Ended
March 31, 2018 ` in Crores
Year Ended March 31, 2017
` in CroresSale of products (including excise duty) 3,892.46 3,473.84Sale of Services 1,830.03 1,813.85Income of financing activities: Interest income on instruments measured at amortised cost 4,646.56 2,929.41 Income on instruments mandatorily measured at FVTPL 174.65 208.65 Dividend income on instruments designated at FVTOCI (refer note below) 35.39 32.47 Others 1.81 22.91
10,580.90 8,481.13Other operating revenues:Processing Charges Received 1.17 2.88Miscellaneous Income 57.28 62.74
58.45 65.62 TOTAL 10,639.35 8,546.75
All dividends from equity investments designated as at FVTOCI recognised for both the years relate to investments held at the end of each reporting period. There was no dividend income relating to investments derecognised during the reporting period.
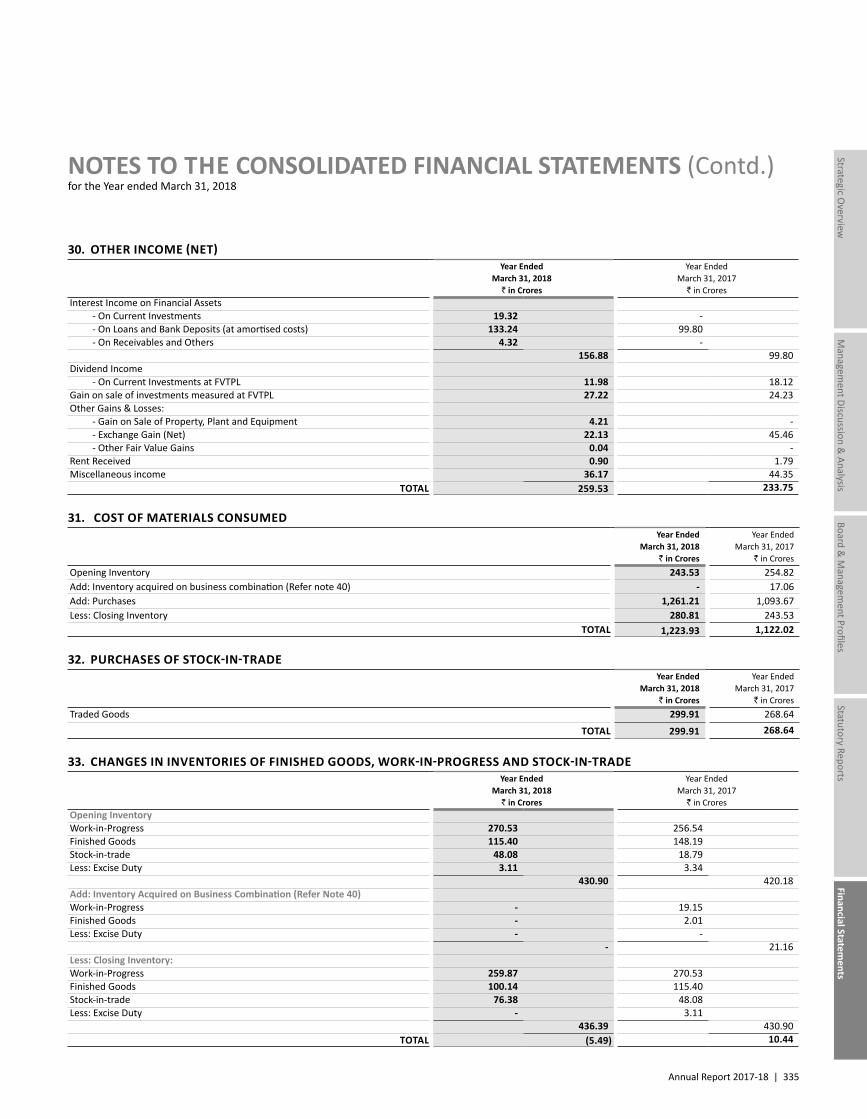
Annual Report 2017-18 | 335
Managem
ent Discussion & Analysis
Strategic Overview
Board &
Managem
ent ProfilesStatutory Reports
Financial Statements
NOTES TO THE CONSOLIDATED FINANCIAL STATEMENTS (Contd.)for the Year ended March 31, 2018
30. OTHER INCOME (NET) Year Ended
March 31, 2018 ` in Crores
Year Ended March 31, 2017
` in CroresInterest Income on Financial Assets - On Current Investments 19.32 - - On Loans and Bank Deposits (at amortised costs) 133.24 99.80 - On Receivables and Others 4.32 -
156.88 99.80Dividend Income - On Current Investments at FVTPL 11.98 18.12Gain on sale of investments measured at FVTPL 27.22 24.23Other Gains & Losses: - Gain on Sale of Property, Plant and Equipment 4.21 - - Exchange Gain (Net) 22.13 45.46 - Other Fair Value Gains 0.04 -Rent Received 0.90 1.79Miscellaneous income 36.17 44.35
TOTAL 259.53 233.75
31. COST OF MATERIALS CONSUMED Year Ended
March 31, 2018 ` in Crores
Year Ended March 31, 2017
` in CroresOpening Inventory 243.53 254.82Add: Inventory acquired on business combination (Refer note 40) - 17.06Add: Purchases 1,261.21 1,093.67Less: Closing Inventory 280.81 243.53
TOTAL 1,223.93 1,122.02
32. PURCHASES OF STOCK-IN-TRADE Year Ended
March 31, 2018 ` in Crores
Year Ended March 31, 2017
` in CroresTraded Goods 299.91 268.64
TOTAL 299.91 268.64
33. CHANGES IN INVENTORIES OF FINISHED GOODS, WORK-IN-PROGRESS AND STOCK-IN-TRADE Year Ended
March 31, 2018 ` in Crores
Year Ended March 31, 2017
` in CroresOpening InventoryWork-in-Progress 270.53 256.54Finished Goods 115.40 148.19Stock-in-trade 48.08 18.79Less: Excise Duty 3.11 3.34
430.90 420.18Add: Inventory Acquired on Business Combination (Refer Note 40)Work-in-Progress - 19.15Finished Goods - 2.01Less: Excise Duty - -
- 21.16Less: Closing Inventory:Work-in-Progress 259.87 270.53Finished Goods 100.14 115.40Stock-in-trade 76.38 48.08Less: Excise Duty - 3.11
436.39 430.90 TOTAL (5.49) 10.44
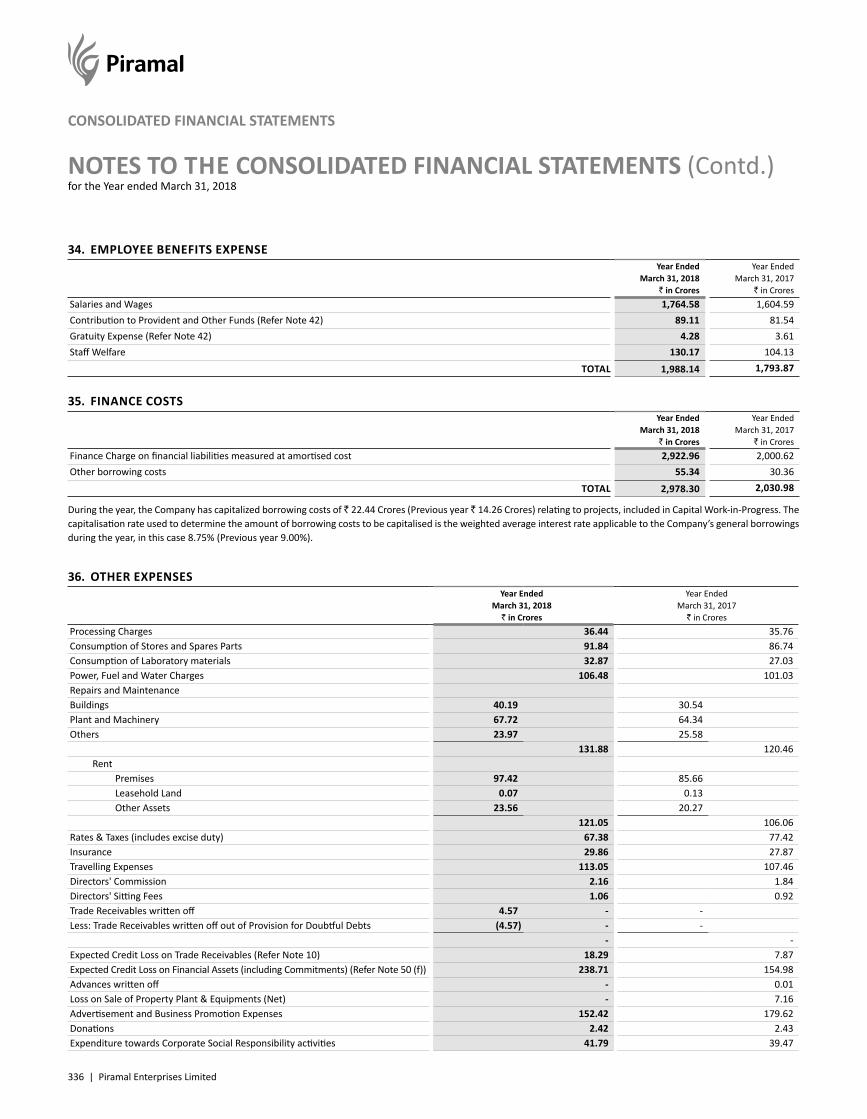
336 | Piramal Enterprises Limited
NOTES TO THE CONSOLIDATED FINANCIAL STATEMENTS (Contd.)for the Year ended March 31, 2018
CONSOLIDATED FINANCIAL STATEMENTS
34. EMPLOYEE BENEFITS EXPENSE Year Ended
March 31, 2018 ` in Crores
Year Ended March 31, 2017
` in CroresSalaries and Wages 1,764.58 1,604.59Contribution to Provident and Other Funds (Refer Note 42) 89.11 81.54Gratuity Expense (Refer Note 42) 4.28 3.61Staff Welfare 130.17 104.13
TOTAL 1,988.14 1,793.87
35. FINANCE COSTS Year Ended
March 31, 2018 ` in Crores
Year Ended March 31, 2017
` in CroresFinance Charge on financial liabilities measured at amortised cost 2,922.96 2,000.62Other borrowing costs 55.34 30.36
TOTAL 2,978.30 2,030.98
During the year, the Company has capitalized borrowing costs of ` 22.44 Crores (Previous year ` 14.26 Crores) relating to projects, included in Capital Work-in-Progress. The capitalisation rate used to determine the amount of borrowing costs to be capitalised is the weighted average interest rate applicable to the Company’s general borrowings during the year, in this case 8.75% (Previous year 9.00%).
36. OTHER EXPENSES Year Ended
March 31, 2018 ` in Crores
Year Ended March 31, 2017
` in CroresProcessing Charges 36.44 35.76Consumption of Stores and Spares Parts 91.84 86.74Consumption of Laboratory materials 32.87 27.03Power, Fuel and Water Charges 106.48 101.03Repairs and MaintenanceBuildings 40.19 30.54Plant and Machinery 67.72 64.34Others 23.97 25.58
131.88 120.46 Rent Premises 97.42 85.66 Leasehold Land 0.07 0.13 Other Assets 23.56 20.27
121.05 106.06Rates & Taxes (includes excise duty) 67.38 77.42Insurance 29.86 27.87Travelling Expenses 113.05 107.46Directors' Commission 2.16 1.84Directors' Sitting Fees 1.06 0.92Trade Receivables written off 4.57 - -Less: Trade Receivables written off out of Provision for Doubtful Debts (4.57) - -
- -Expected Credit Loss on Trade Receivables (Refer Note 10) 18.29 7.87Expected Credit Loss on Financial Assets (including Commitments) (Refer Note 50 (f)) 238.71 154.98Advances written off - 0.01Loss on Sale of Property Plant & Equipments (Net) - 7.16Advertisement and Business Promotion Expenses 152.42 179.62Donations 2.42 2.43Expenditure towards Corporate Social Responsibility activities 41.79 39.47
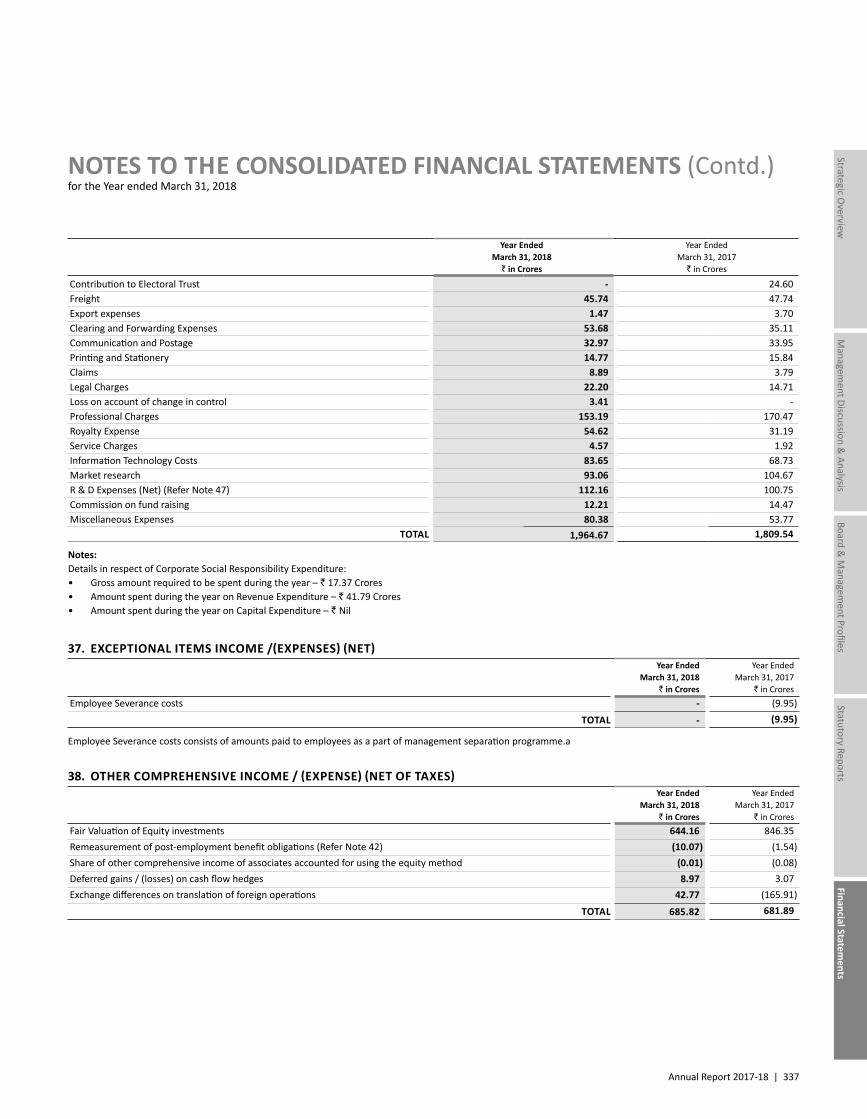
Annual Report 2017-18 | 337
Managem
ent Discussion & Analysis
Strategic Overview
Board &
Managem
ent ProfilesStatutory Reports
Financial Statements
NOTES TO THE CONSOLIDATED FINANCIAL STATEMENTS (Contd.)for the Year ended March 31, 2018
Year Ended March 31, 2018
` in Crores
Year Ended March 31, 2017
` in Crores
Contribution to Electoral Trust - 24.60Freight 45.74 47.74Export expenses 1.47 3.70Clearing and Forwarding Expenses 53.68 35.11Communication and Postage 32.97 33.95Printing and Stationery 14.77 15.84Claims 8.89 3.79Legal Charges 22.20 14.71Loss on account of change in control 3.41 -Professional Charges 153.19 170.47Royalty Expense 54.62 31.19Service Charges 4.57 1.92Information Technology Costs 83.65 68.73Market research 93.06 104.67R & D Expenses (Net) (Refer Note 47) 112.16 100.75Commission on fund raising 12.21 14.47Miscellaneous Expenses 80.38 53.77
TOTAL 1,964.67 1,809.54
Notes:Details in respect of Corporate Social Responsibility Expenditure:• Gross amount required to be spent during the year – ` 17.37 Crores• Amount spent during the year on Revenue Expenditure – ` 41.79 Crores• Amount spent during the year on Capital Expenditure – ` Nil
37. EXCEPTIONAL ITEMS INCOME /(EXPENSES) (NET) Year Ended
March 31, 2018 ` in Crores
Year Ended March 31, 2017
` in CroresEmployee Severance costs - (9.95)
TOTAL - (9.95)
Employee Severance costs consists of amounts paid to employees as a part of management separation programme.a
38. OTHER COMPREHENSIVE INCOME / (EXPENSE) (NET OF TAXES) Year Ended
March 31, 2018 ` in Crores
Year Ended March 31, 2017
` in CroresFair Valuation of Equity investments 644.16 846.35Remeasurement of post-employment benefit obligations (Refer Note 42) (10.07) (1.54)Share of other comprehensive income of associates accounted for using the equity method (0.01) (0.08)Deferred gains / (losses) on cash flow hedges 8.97 3.07Exchange differences on translation of foreign operations 42.77 (165.91)
TOTAL 685.82 681.89
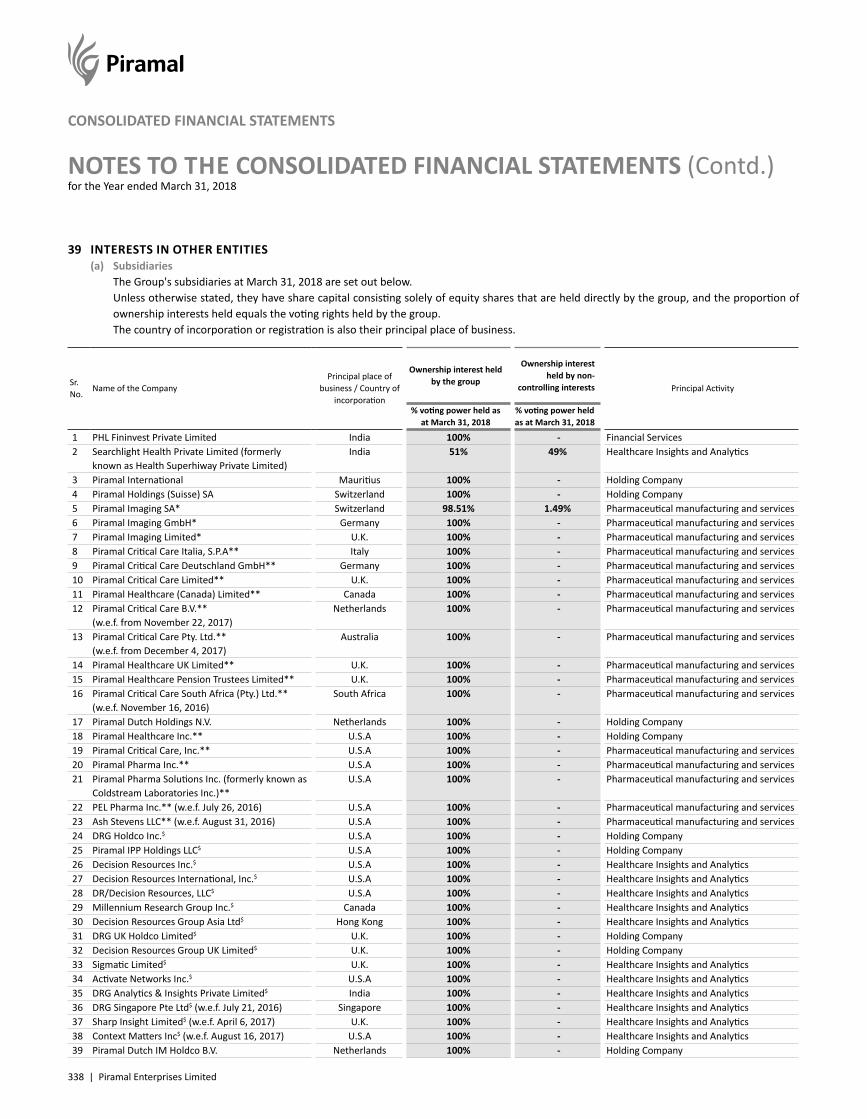
338 | Piramal Enterprises Limited
NOTES TO THE CONSOLIDATED FINANCIAL STATEMENTS (Contd.)for the Year ended March 31, 2018
CONSOLIDATED FINANCIAL STATEMENTS
39 INTERESTS IN OTHER ENTITIES (a) Subsidiaries The Group's subsidiaries at March 31, 2018 are set out below. Unless otherwise stated, they have share capital consisting solely of equity shares that are held directly by the group, and the proportion of
ownership interests held equals the voting rights held by the group. The country of incorporation or registration is also their principal place of business.
Sr. No.
Name of the CompanyPrincipal place of
business / Country of incorporation
Ownership interest held by the group
Ownership interest held by non-
controlling interests Principal Activity
% voting power held as at March 31, 2018
% voting power held as at March 31, 2018
1 PHL Fininvest Private Limited India 100% - Financial Services 2 Searchlight Health Private Limited (formerly
known as Health Superhiway Private Limited)India 51% 49% Healthcare Insights and Analytics
3 Piramal International Mauritius 100% - Holding Company 4 Piramal Holdings (Suisse) SA Switzerland 100% - Holding Company 5 Piramal Imaging SA* Switzerland 98.51% 1.49% Pharmaceutical manufacturing and services 6 Piramal Imaging GmbH* Germany 100% - Pharmaceutical manufacturing and services 7 Piramal Imaging Limited* U.K. 100% - Pharmaceutical manufacturing and services 8 Piramal Critical Care Italia, S.P.A** Italy 100% - Pharmaceutical manufacturing and services 9 Piramal Critical Care Deutschland GmbH** Germany 100% - Pharmaceutical manufacturing and services 10 Piramal Critical Care Limited** U.K. 100% - Pharmaceutical manufacturing and services 11 Piramal Healthcare (Canada) Limited** Canada 100% - Pharmaceutical manufacturing and services 12 Piramal Critical Care B.V.**
(w.e.f. from November 22, 2017)Netherlands 100% - Pharmaceutical manufacturing and services
13 Piramal Critical Care Pty. Ltd.** (w.e.f. from December 4, 2017)
Australia 100% - Pharmaceutical manufacturing and services
14 Piramal Healthcare UK Limited** U.K. 100% - Pharmaceutical manufacturing and services 15 Piramal Healthcare Pension Trustees Limited** U.K. 100% - Pharmaceutical manufacturing and services 16 Piramal Critical Care South Africa (Pty.) Ltd.**
(w.e.f. November 16, 2016)South Africa 100% - Pharmaceutical manufacturing and services
17 Piramal Dutch Holdings N.V. Netherlands 100% - Holding Company 18 Piramal Healthcare Inc.** U.S.A 100% - Holding Company 19 Piramal Critical Care, Inc.** U.S.A 100% - Pharmaceutical manufacturing and services 20 Piramal Pharma Inc.** U.S.A 100% - Pharmaceutical manufacturing and services 21 Piramal Pharma Solutions Inc. (formerly known as
Coldstream Laboratories Inc.)**U.S.A 100% - Pharmaceutical manufacturing and services
22 PEL Pharma Inc.** (w.e.f. July 26, 2016) U.S.A 100% - Pharmaceutical manufacturing and services 23 Ash Stevens LLC** (w.e.f. August 31, 2016) U.S.A 100% - Pharmaceutical manufacturing and services 24 DRG Holdco Inc.$ U.S.A 100% - Holding Company 25 Piramal IPP Holdings LLC$ U.S.A 100% - Holding Company 26 Decision Resources Inc.$ U.S.A 100% - Healthcare Insights and Analytics 27 Decision Resources International, Inc.$ U.S.A 100% - Healthcare Insights and Analytics 28 DR/Decision Resources, LLC$ U.S.A 100% - Healthcare Insights and Analytics 29 Millennium Research Group Inc.$ Canada 100% - Healthcare Insights and Analytics 30 Decision Resources Group Asia Ltd$ Hong Kong 100% - Healthcare Insights and Analytics 31 DRG UK Holdco Limited$ U.K. 100% - Holding Company 32 Decision Resources Group UK Limited$ U.K. 100% - Holding Company 33 Sigmatic Limited$ U.K. 100% - Healthcare Insights and Analytics 34 Activate Networks Inc.$ U.S.A 100% - Healthcare Insights and Analytics 35 DRG Analytics & Insights Private Limited$ India 100% - Healthcare Insights and Analytics 36 DRG Singapore Pte Ltd$ (w.e.f. July 21, 2016) Singapore 100% - Healthcare Insights and Analytics 37 Sharp Insight Limited$ (w.e.f. April 6, 2017) U.K. 100% - Healthcare Insights and Analytics 38 Context Matters Inc$ (w.e.f. August 16, 2017) U.S.A 100% - Healthcare Insights and Analytics 39 Piramal Dutch IM Holdco B.V. Netherlands 100% - Holding Company
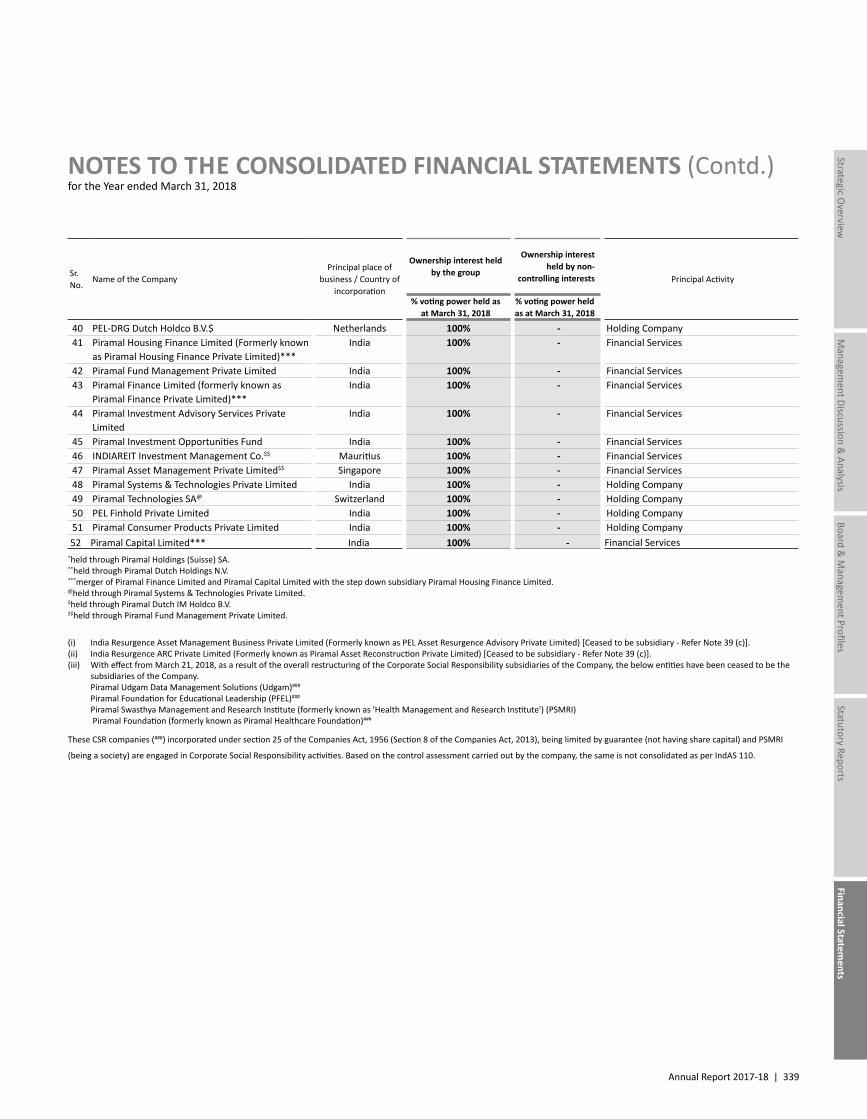
Annual Report 2017-18 | 339
Managem
ent Discussion & Analysis
Strategic Overview
Board &
Managem
ent ProfilesStatutory Reports
Financial Statements
NOTES TO THE CONSOLIDATED FINANCIAL STATEMENTS (Contd.)for the Year ended March 31, 2018
Sr. No.
Name of the CompanyPrincipal place of
business / Country of incorporation
Ownership interest held by the group
Ownership interest held by non-
controlling interests Principal Activity
% voting power held as at March 31, 2018
% voting power held as at March 31, 2018
40 PEL-DRG Dutch Holdco B.V.$ Netherlands 100% - Holding Company 41 Piramal Housing Finance Limited (Formerly known
as Piramal Housing Finance Private Limited)***India 100% - Financial Services
42 Piramal Fund Management Private Limited India 100% - Financial Services 43 Piramal Finance Limited (formerly known as
Piramal Finance Private Limited)***India 100% - Financial Services
44 Piramal Investment Advisory Services Private Limited
India 100% - Financial Services
45 Piramal Investment Opportunities Fund India 100% - Financial Services 46 INDIAREIT Investment Management Co.$$ Mauritius 100% - Financial Services 47 Piramal Asset Management Private Limited$$ Singapore 100% - Financial Services 48 Piramal Systems & Technologies Private Limited India 100% - Holding Company 49 Piramal Technologies SA@ Switzerland 100% - Holding Company 50 PEL Finhold Private Limited India 100% - Holding Company 51 Piramal Consumer Products Private Limited India 100% - Holding Company 52 Piramal Capital Limited*** India 100% - Financial Services*held through Piramal Holdings (Suisse) SA.**held through Piramal Dutch Holdings N.V.***merger of Piramal Finance Limited and Piramal Capital Limited with the step down subsidiary Piramal Housing Finance Limited. @held through Piramal Systems & Technologies Private Limited.$held through Piramal Dutch IM Holdco B.V.$$held through Piramal Fund Management Private Limited.
(i) India Resurgence Asset Management Business Private Limited (Formerly known as PEL Asset Resurgence Advisory Private Limited) [Ceased to be subsidiary - Refer Note 39 (c)].(ii) India Resurgence ARC Private Limited (Formerly known as Piramal Asset Reconstruction Private Limited) [Ceased to be subsidiary - Refer Note 39 (c)].(iii) With effect from March 21, 2018, as a result of the overall restructuring of the Corporate Social Responsibility subsidiaries of the Company, the below entities have been ceased to be the
subsidiaries of the Company. Piramal Udgam Data Management Solutions (Udgam)###
Piramal Foundation for Educational Leadership (PFEL)###
Piramal Swasthya Management and Research Institute (formerly known as 'Health Management and Research Institute') (PSMRI) Piramal Foundation (formerly known as Piramal Healthcare Foundation)###
These CSR companies (###) incorporated under section 25 of the Companies Act, 1956 (Section 8 of the Companies Act, 2013), being limited by guarantee (not having share capital) and PSMRI
(being a society) are engaged in Corporate Social Responsibility activities. Based on the control assessment carried out by the company, the same is not consolidated as per IndAS 110.
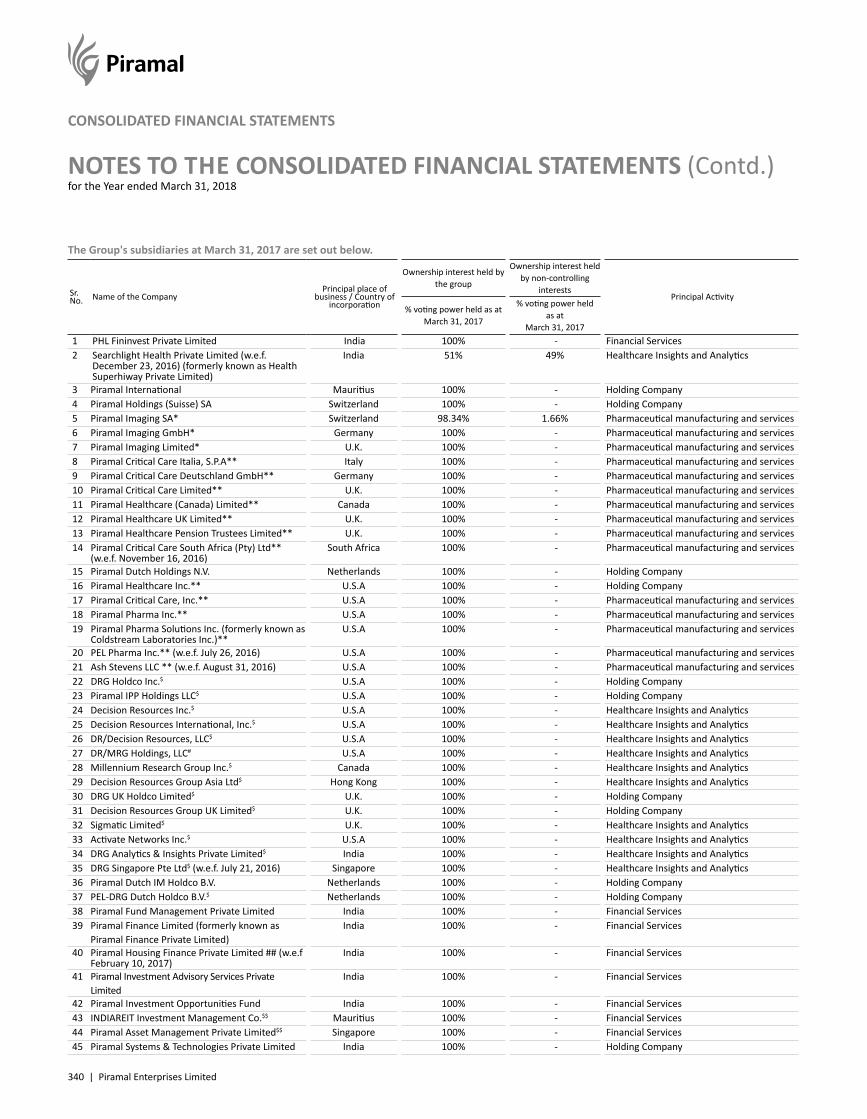
340 | Piramal Enterprises Limited
NOTES TO THE CONSOLIDATED FINANCIAL STATEMENTS (Contd.)for the Year ended March 31, 2018
CONSOLIDATED FINANCIAL STATEMENTS
The Group's subsidiaries at March 31, 2017 are set out below.
Sr. No. Name of the Company
Principal place of business / Country of
incorporation
Ownership interest held by the group
Ownership interest held by non-controlling
interestsPrincipal Activity
% voting power held as at March 31, 2017
% voting power held as at
March 31, 2017 1 PHL Fininvest Private Limited India 100% - Financial Services 2 Searchlight Health Private Limited (w.e.f.
December 23, 2016) (formerly known as Health Superhiway Private Limited)
India 51% 49% Healthcare Insights and Analytics
3 Piramal International Mauritius 100% - Holding Company 4 Piramal Holdings (Suisse) SA Switzerland 100% - Holding Company 5 Piramal Imaging SA* Switzerland 98.34% 1.66% Pharmaceutical manufacturing and services 6 Piramal Imaging GmbH* Germany 100% - Pharmaceutical manufacturing and services 7 Piramal Imaging Limited* U.K. 100% - Pharmaceutical manufacturing and services 8 Piramal Critical Care Italia, S.P.A** Italy 100% - Pharmaceutical manufacturing and services 9 Piramal Critical Care Deutschland GmbH** Germany 100% - Pharmaceutical manufacturing and services 10 Piramal Critical Care Limited** U.K. 100% - Pharmaceutical manufacturing and services 11 Piramal Healthcare (Canada) Limited** Canada 100% - Pharmaceutical manufacturing and services 12 Piramal Healthcare UK Limited** U.K. 100% - Pharmaceutical manufacturing and services 13 Piramal Healthcare Pension Trustees Limited** U.K. 100% - Pharmaceutical manufacturing and services 14 Piramal Critical Care South Africa (Pty) Ltd**
(w.e.f. November 16, 2016)South Africa 100% - Pharmaceutical manufacturing and services
15 Piramal Dutch Holdings N.V. Netherlands 100% - Holding Company 16 Piramal Healthcare Inc.** U.S.A 100% - Holding Company 17 Piramal Critical Care, Inc.** U.S.A 100% - Pharmaceutical manufacturing and services 18 Piramal Pharma Inc.** U.S.A 100% - Pharmaceutical manufacturing and services 19 Piramal Pharma Solutions Inc. (formerly known as
Coldstream Laboratories Inc.)**U.S.A 100% - Pharmaceutical manufacturing and services
20 PEL Pharma Inc.** (w.e.f. July 26, 2016) U.S.A 100% - Pharmaceutical manufacturing and services 21 Ash Stevens LLC ** (w.e.f. August 31, 2016) U.S.A 100% - Pharmaceutical manufacturing and services 22 DRG Holdco Inc.$ U.S.A 100% - Holding Company 23 Piramal IPP Holdings LLC$ U.S.A 100% - Holding Company 24 Decision Resources Inc.$ U.S.A 100% - Healthcare Insights and Analytics 25 Decision Resources International, Inc.$ U.S.A 100% - Healthcare Insights and Analytics 26 DR/Decision Resources, LLC$ U.S.A 100% - Healthcare Insights and Analytics 27 DR/MRG Holdings, LLC# U.S.A 100% - Healthcare Insights and Analytics 28 Millennium Research Group Inc.$ Canada 100% - Healthcare Insights and Analytics 29 Decision Resources Group Asia Ltd$ Hong Kong 100% - Healthcare Insights and Analytics 30 DRG UK Holdco Limited$ U.K. 100% - Holding Company 31 Decision Resources Group UK Limited$ U.K. 100% - Holding Company 32 Sigmatic Limited$ U.K. 100% - Healthcare Insights and Analytics 33 Activate Networks Inc.$ U.S.A 100% - Healthcare Insights and Analytics 34 DRG Analytics & Insights Private Limited$ India 100% - Healthcare Insights and Analytics 35 DRG Singapore Pte Ltd$ (w.e.f. July 21, 2016) Singapore 100% - Healthcare Insights and Analytics 36 Piramal Dutch IM Holdco B.V. Netherlands 100% - Holding Company 37 PEL-DRG Dutch Holdco B.V.$ Netherlands 100% - Holding Company 38 Piramal Fund Management Private Limited India 100% - Financial Services 39 Piramal Finance Limited (formerly known as
Piramal Finance Private Limited)India 100% - Financial Services
40 Piramal Housing Finance Private Limited ## (w.e.f February 10, 2017)
India 100% - Financial Services
41 Piramal Investment Advisory Services Private Limited
India 100% - Financial Services
42 Piramal Investment Opportunities Fund India 100% - Financial Services 43 INDIAREIT Investment Management Co.$$ Mauritius 100% - Financial Services 44 Piramal Asset Management Private Limited$$ Singapore 100% - Financial Services 45 Piramal Systems & Technologies Private Limited India 100% - Holding Company
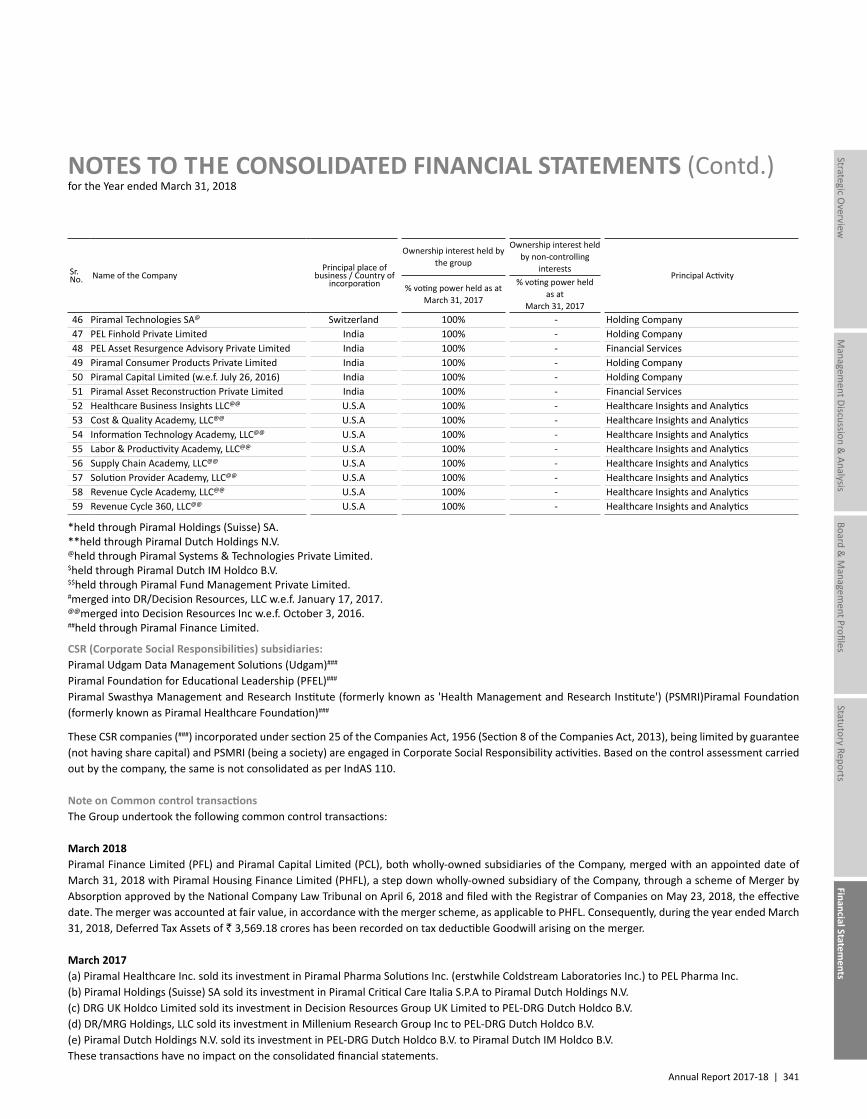
Annual Report 2017-18 | 341
Managem
ent Discussion & Analysis
Strategic Overview
Board &
Managem
ent ProfilesStatutory Reports
Financial Statements
NOTES TO THE CONSOLIDATED FINANCIAL STATEMENTS (Contd.)for the Year ended March 31, 2018
Sr. No. Name of the Company
Principal place of business / Country of
incorporation
Ownership interest held by the group
Ownership interest held by non-controlling
interestsPrincipal Activity
% voting power held as at March 31, 2017
% voting power held as at
March 31, 2017 46 Piramal Technologies SA@ Switzerland 100% - Holding Company 47 PEL Finhold Private Limited India 100% - Holding Company 48 PEL Asset Resurgence Advisory Private Limited India 100% - Financial Services 49 Piramal Consumer Products Private Limited India 100% - Holding Company 50 Piramal Capital Limited (w.e.f. July 26, 2016) India 100% - Holding Company 51 Piramal Asset Reconstruction Private Limited India 100% - Financial Services 52 Healthcare Business Insights LLC@@ U.S.A 100% - Healthcare Insights and Analytics 53 Cost & Quality Academy, LLC@@ U.S.A 100% - Healthcare Insights and Analytics 54 Information Technology Academy, LLC@@ U.S.A 100% - Healthcare Insights and Analytics 55 Labor & Productivity Academy, LLC@@ U.S.A 100% - Healthcare Insights and Analytics 56 Supply Chain Academy, LLC@@ U.S.A 100% - Healthcare Insights and Analytics 57 Solution Provider Academy, LLC@@ U.S.A 100% - Healthcare Insights and Analytics 58 Revenue Cycle Academy, LLC@@ U.S.A 100% - Healthcare Insights and Analytics 59 Revenue Cycle 360, LLC@@ U.S.A 100% - Healthcare Insights and Analytics
*held through Piramal Holdings (Suisse) SA. **held through Piramal Dutch Holdings N.V.@held through Piramal Systems & Technologies Private Limited.$held through Piramal Dutch IM Holdco B.V.$$held through Piramal Fund Management Private Limited.#merged into DR/Decision Resources, LLC w.e.f. January 17, 2017.@@merged into Decision Resources Inc w.e.f. October 3, 2016.##held through Piramal Finance Limited.
CSR (Corporate Social Responsibilities) subsidiaries:Piramal Udgam Data Management Solutions (Udgam)###
Piramal Foundation for Educational Leadership (PFEL)###
Piramal Swasthya Management and Research Institute (formerly known as 'Health Management and Research Institute') (PSMRI)Piramal Foundation (formerly known as Piramal Healthcare Foundation)###
These CSR companies (###) incorporated under section 25 of the Companies Act, 1956 (Section 8 of the Companies Act, 2013), being limited by guarantee (not having share capital) and PSMRI (being a society) are engaged in Corporate Social Responsibility activities. Based on the control assessment carried out by the company, the same is not consolidated as per IndAS 110.
Note on Common control transactionsThe Group undertook the following common control transactions:
March 2018Piramal Finance Limited (PFL) and Piramal Capital Limited (PCL), both wholly-owned subsidiaries of the Company, merged with an appointed date of March 31, 2018 with Piramal Housing Finance Limited (PHFL), a step down wholly-owned subsidiary of the Company, through a scheme of Merger by Absorption approved by the National Company Law Tribunal on April 6, 2018 and filed with the Registrar of Companies on May 23, 2018, the effective date. The merger was accounted at fair value, in accordance with the merger scheme, as applicable to PHFL. Consequently, during the year ended March 31, 2018, Deferred Tax Assets of ` 3,569.18 crores has been recorded on tax deductible Goodwill arising on the merger.
March 2017(a) Piramal Healthcare Inc. sold its investment in Piramal Pharma Solutions Inc. (erstwhile Coldstream Laboratories Inc.) to PEL Pharma Inc. (b) Piramal Holdings (Suisse) SA sold its investment in Piramal Critical Care Italia S.P.A to Piramal Dutch Holdings N.V.(c) DRG UK Holdco Limited sold its investment in Decision Resources Group UK Limited to PEL-DRG Dutch Holdco B.V. (d) DR/MRG Holdings, LLC sold its investment in Millenium Research Group Inc to PEL-DRG Dutch Holdco B.V.(e) Piramal Dutch Holdings N.V. sold its investment in PEL-DRG Dutch Holdco B.V. to Piramal Dutch IM Holdco B.V.These transactions have no impact on the consolidated financial statements.
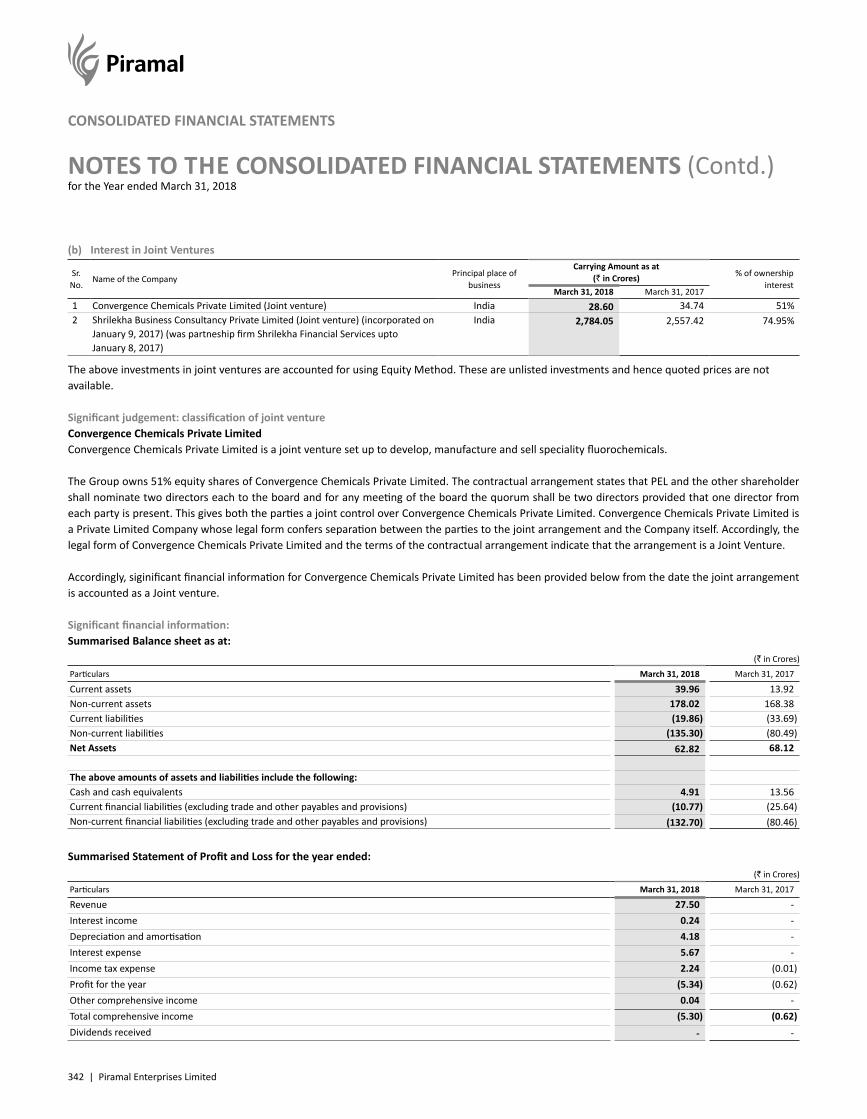
342 | Piramal Enterprises Limited
NOTES TO THE CONSOLIDATED FINANCIAL STATEMENTS (Contd.)for the Year ended March 31, 2018
CONSOLIDATED FINANCIAL STATEMENTS
(b) Interest in Joint Ventures
Sr. No.
Name of the CompanyPrincipal place of
business
Carrying Amount as at (` in Crores) % of ownership
interestMarch 31, 2018 March 31, 2017
1 Convergence Chemicals Private Limited (Joint venture) India 28.60 34.74 51% 2 Shrilekha Business Consultancy Private Limited (Joint venture) (incorporated on
January 9, 2017) (was partneship firm Shrilekha Financial Services upto January 8, 2017)
India 2,784.05 2,557.42 74.95%
The above investments in joint ventures are accounted for using Equity Method. These are unlisted investments and hence quoted prices are not available.
Significant judgement: classification of joint ventureConvergence Chemicals Private LimitedConvergence Chemicals Private Limited is a joint venture set up to develop, manufacture and sell speciality fluorochemicals.
The Group owns 51% equity shares of Convergence Chemicals Private Limited. The contractual arrangement states that PEL and the other shareholder shall nominate two directors each to the board and for any meeting of the board the quorum shall be two directors provided that one director from each party is present. This gives both the parties a joint control over Convergence Chemicals Private Limited. Convergence Chemicals Private Limited is a Private Limited Company whose legal form confers separation between the parties to the joint arrangement and the Company itself. Accordingly, the legal form of Convergence Chemicals Private Limited and the terms of the contractual arrangement indicate that the arrangement is a Joint Venture.
Accordingly, siginificant financial information for Convergence Chemicals Private Limited has been provided below from the date the joint arrangement is accounted as a Joint venture.
Significant financial information:Summarised Balance sheet as at:
(` in Crores)
Particulars March 31, 2018 March 31, 2017
Current assets 39.96 13.92 Non-current assets 178.02 168.38 Current liabilities (19.86) (33.69)Non-current liabilities (135.30) (80.49)Net Assets 62.82 68.12
The above amounts of assets and liabilities include the following:Cash and cash equivalents 4.91 13.56 Current financial liabilities (excluding trade and other payables and provisions) (10.77) (25.64)Non-current financial liabilities (excluding trade and other payables and provisions) (132.70) (80.46)
Summarised Statement of Profit and Loss for the year ended: (` in Crores)
Particulars March 31, 2018 March 31, 2017
Revenue 27.50 - Interest income 0.24 - Depreciation and amortisation 4.18 - Interest expense 5.67 - Income tax expense 2.24 (0.01)Profit for the year (5.34) (0.62)Other comprehensive income 0.04 - Total comprehensive income (5.30) (0.62)Dividends received - -
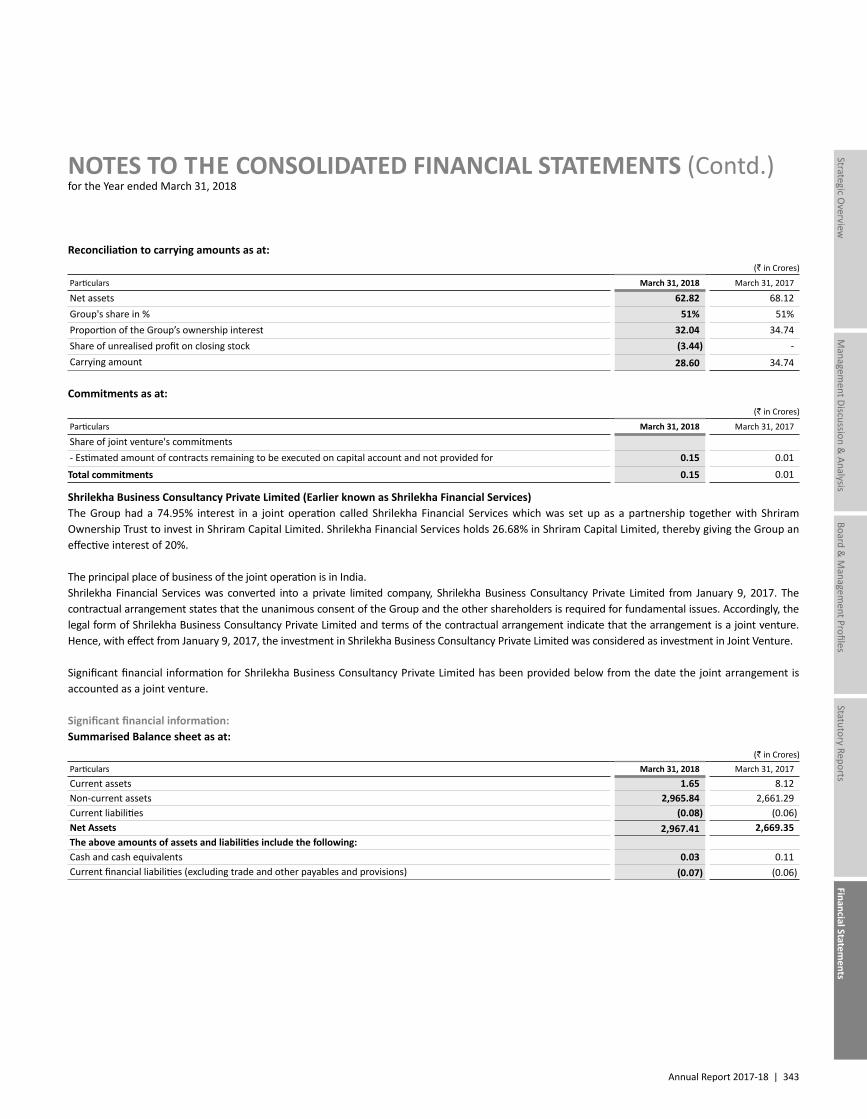
Annual Report 2017-18 | 343
Managem
ent Discussion & Analysis
Strategic Overview
Board &
Managem
ent ProfilesStatutory Reports
Financial Statements
NOTES TO THE CONSOLIDATED FINANCIAL STATEMENTS (Contd.)for the Year ended March 31, 2018
Reconciliation to carrying amounts as at: (` in Crores)
Particulars March 31, 2018 March 31, 2017
Net assets 62.82 68.12 Group's share in % 51% 51%Proportion of the Group’s ownership interest 32.04 34.74 Share of unrealised profit on closing stock (3.44) - Carrying amount 28.60 34.74
Commitments as at: (` in Crores)
Particulars March 31, 2018 March 31, 2017
Share of joint venture's commitments - Estimated amount of contracts remaining to be executed on capital account and not provided for 0.15 0.01
Total commitments 0.15 0.01
Shrilekha Business Consultancy Private Limited (Earlier known as Shrilekha Financial Services)The Group had a 74.95% interest in a joint operation called Shrilekha Financial Services which was set up as a partnership together with Shriram Ownership Trust to invest in Shriram Capital Limited. Shrilekha Financial Services holds 26.68% in Shriram Capital Limited, thereby giving the Group an effective interest of 20%.
The principal place of business of the joint operation is in India.Shrilekha Financial Services was converted into a private limited company, Shrilekha Business Consultancy Private Limited from January 9, 2017. The contractual arrangement states that the unanimous consent of the Group and the other shareholders is required for fundamental issues. Accordingly, the legal form of Shrilekha Business Consultancy Private Limited and terms of the contractual arrangement indicate that the arrangement is a joint venture. Hence, with effect from January 9, 2017, the investment in Shrilekha Business Consultancy Private Limited was considered as investment in Joint Venture.
Significant financial information for Shrilekha Business Consultancy Private Limited has been provided below from the date the joint arrangement is accounted as a joint venture.
Significant financial information:Summarised Balance sheet as at:
(` in Crores) Particulars March 31, 2018 March 31, 2017
Current assets 1.65 8.12 Non-current assets 2,965.84 2,661.29 Current liabilities (0.08) (0.06)Net Assets 2,967.41 2,669.35 The above amounts of assets and liabilities include the following:Cash and cash equivalents 0.03 0.11 Current financial liabilities (excluding trade and other payables and provisions) (0.07) (0.06)
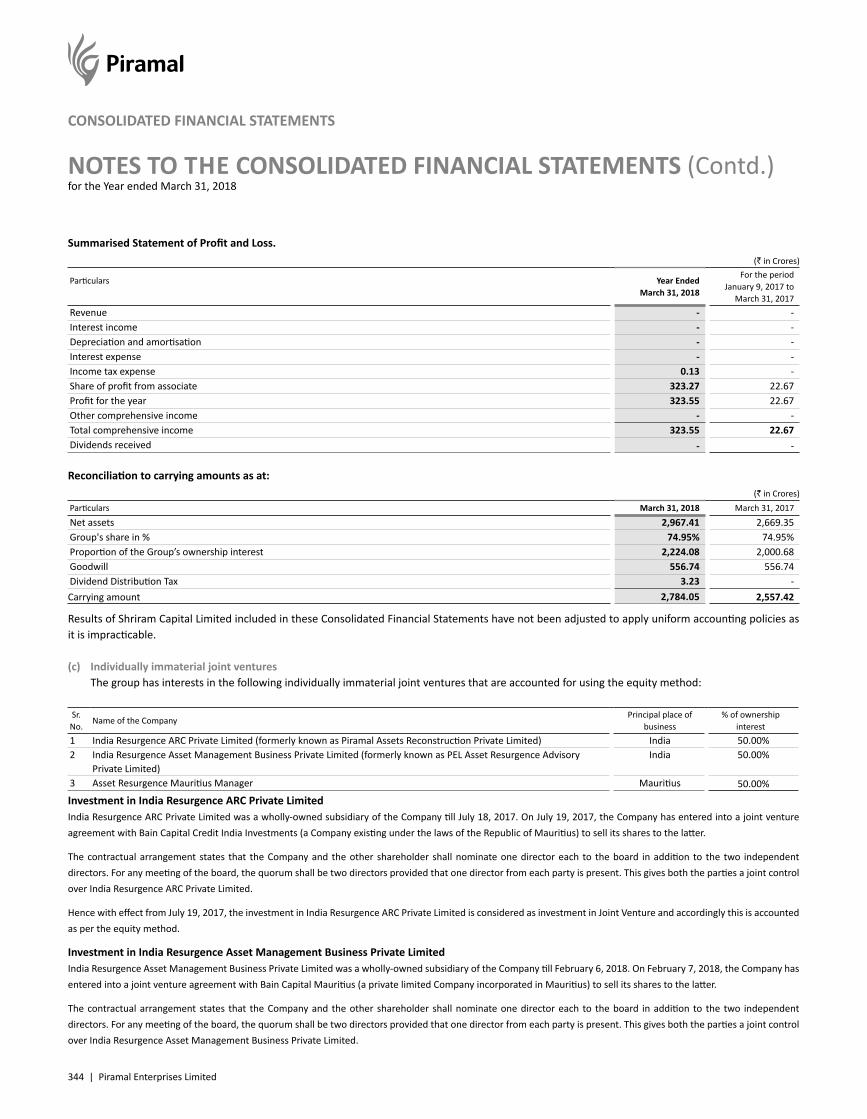
344 | Piramal Enterprises Limited
NOTES TO THE CONSOLIDATED FINANCIAL STATEMENTS (Contd.)for the Year ended March 31, 2018
CONSOLIDATED FINANCIAL STATEMENTS
Summarised Statement of Profit and Loss. (` in Crores)
Particulars Year Ended March 31, 2018
For the period January 9, 2017 to
March 31, 2017Revenue - - Interest income - - Depreciation and amortisation - - Interest expense - - Income tax expense 0.13 - Share of profit from associate 323.27 22.67 Profit for the year 323.55 22.67 Other comprehensive income - - Total comprehensive income 323.55 22.67 Dividends received - -
Reconciliation to carrying amounts as at: (` in Crores)
Particulars March 31, 2018 March 31, 2017
Net assets 2,967.41 2,669.35 Group's share in % 74.95% 74.95%Proportion of the Group’s ownership interest 2,224.08 2,000.68 Goodwill 556.74 556.74 Dividend Distribution Tax 3.23 - Carrying amount 2,784.05 2,557.42
Results of Shriram Capital Limited included in these Consolidated Financial Statements have not been adjusted to apply uniform accounting policies as it is impracticable.
(c) Individually immaterial joint ventures The group has interests in the following individually immaterial joint ventures that are accounted for using the equity method:
Sr. No.
Name of the CompanyPrincipal place of
business% of ownership
interest1 India Resurgence ARC Private Limited (formerly known as Piramal Assets Reconstruction Private Limited) India 50.00%2 India Resurgence Asset Management Business Private Limited (formerly known as PEL Asset Resurgence Advisory
Private Limited)India 50.00%
3 Asset Resurgence Mauritius Manager Mauritius 50.00%
Investment in India Resurgence ARC Private LimitedIndia Resurgence ARC Private Limited was a wholly-owned subsidiary of the Company till July 18, 2017. On July 19, 2017, the Company has entered into a joint venture agreement with Bain Capital Credit India Investments (a Company existing under the laws of the Republic of Mauritius) to sell its shares to the latter.
The contractual arrangement states that the Company and the other shareholder shall nominate one director each to the board in addition to the two independent directors. For any meeting of the board, the quorum shall be two directors provided that one director from each party is present. This gives both the parties a joint control over India Resurgence ARC Private Limited.
Hence with effect from July 19, 2017, the investment in India Resurgence ARC Private Limited is considered as investment in Joint Venture and accordingly this is accounted as per the equity method.
Investment in India Resurgence Asset Management Business Private LimitedIndia Resurgence Asset Management Business Private Limited was a wholly-owned subsidiary of the Company till February 6, 2018. On February 7, 2018, the Company has entered into a joint venture agreement with Bain Capital Mauritius (a private limited Company incorporated in Mauritius) to sell its shares to the latter.
The contractual arrangement states that the Company and the other shareholder shall nominate one director each to the board in addition to the two independent directors. For any meeting of the board, the quorum shall be two directors provided that one director from each party is present. This gives both the parties a joint control over India Resurgence Asset Management Business Private Limited.
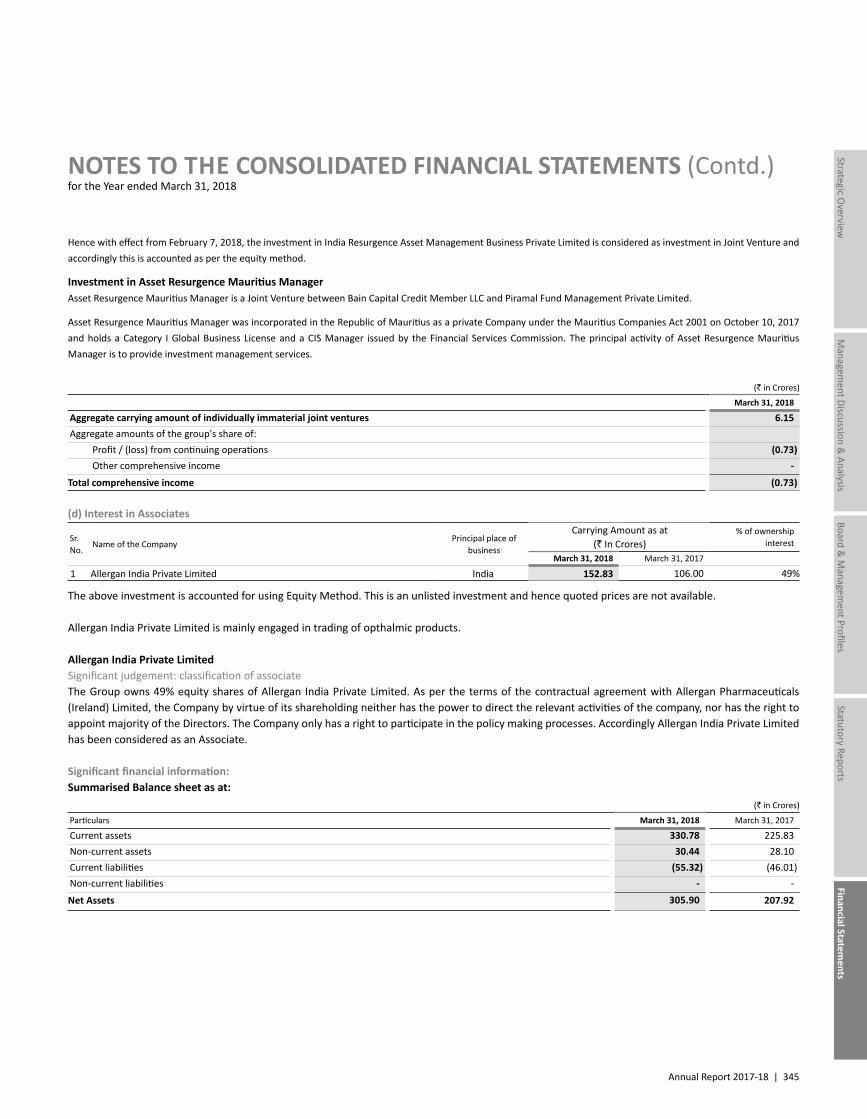
Annual Report 2017-18 | 345
Managem
ent Discussion & Analysis
Strategic Overview
Board &
Managem
ent ProfilesStatutory Reports
Financial Statements
NOTES TO THE CONSOLIDATED FINANCIAL STATEMENTS (Contd.)for the Year ended March 31, 2018
Hence with effect from February 7, 2018, the investment in India Resurgence Asset Management Business Private Limited is considered as investment in Joint Venture and accordingly this is accounted as per the equity method.
Investment in Asset Resurgence Mauritius ManagerAsset Resurgence Mauritius Manager is a Joint Venture between Bain Capital Credit Member LLC and Piramal Fund Management Private Limited.
Asset Resurgence Mauritius Manager was incorporated in the Republic of Mauritius as a private Company under the Mauritius Companies Act 2001 on October 10, 2017 and holds a Category I Global Business License and a CIS Manager issued by the Financial Services Commission. The principal activity of Asset Resurgence Mauritius Manager is to provide investment management services.
(` in Crores)
March 31, 2018
Aggregate carrying amount of individually immaterial joint ventures 6.15 Aggregate amounts of the group's share of: Profit / (loss) from continuing operations (0.73) Other comprehensive income -
Total comprehensive income (0.73)
(d) Interest in Associates
Sr. No.
Name of the CompanyPrincipal place of
business
Carrying Amount as at (` In Crores)
% of ownership interest
March 31, 2018 March 31, 2017
1 Allergan India Private Limited India 152.83 106.00 49%
The above investment is accounted for using Equity Method. This is an unlisted investment and hence quoted prices are not available.
Allergan India Private Limited is mainly engaged in trading of opthalmic products.
Allergan India Private LimitedSignificant judgement: classification of associateThe Group owns 49% equity shares of Allergan India Private Limited. As per the terms of the contractual agreement with Allergan Pharmaceuticals (Ireland) Limited, the Company by virtue of its shareholding neither has the power to direct the relevant activities of the company, nor has the right to appoint majority of the Directors. The Company only has a right to participate in the policy making processes. Accordingly Allergan India Private Limited has been considered as an Associate.
Significant financial information: Summarised Balance sheet as at:
(` in Crores)
Particulars March 31, 2018 March 31, 2017
Current assets 330.78 225.83 Non-current assets 30.44 28.10 Current liabilities (55.32) (46.01)Non-current liabilities - -
Net Assets 305.90 207.92
346 | Piramal Enterprises Limited
NOTES TO THE CONSOLIDATED FINANCIAL STATEMENTS (Contd.)for the Year ended March 31, 2018
CONSOLIDATED FINANCIAL STATEMENTS
Summarised Statement of Profit and Loss for the year ended: (` in Crores)
Particulars March 31, 2018 March 31, 2017
Revenue 390.07 329.11 Profit for the year 95.64 57.38 Other comprehensive income (0.07) (0.17)Total comprehensive income 95.57 57.20
Dividends received - 19.60
Reconciliation to carrying amounts as at: (` in Crores)
Particulars March 31, 2018 March 31, 2017
Net assets 305.90 207.92Group's share in % 49% 49%Proportion of the Group’s ownership interest 149.89 101.88 Others 2.94 4.11
Carrying amount 152.83 106.00
Contingent liabilities as at: (` in Crores)
Particulars March 31, 2018 March 31, 2017
Share of associate's contingent liabilities- Claims against the Company not acknowledged as debt 1.43 1.43 - Disputed demands for income tax, sales tax and service tax matters 10.70 11.15
Total contingent liabilities 12.13 12.58
(e) Individually immaterial associates The group has interests in the following individually immaterial associates that are accounted for using the equity method:
Sr. No.
Name of the CompanyPrincipal place of
business% of ownership
interest
1 Piramal Phytocare Limited (PPL) India 17.53%2 Bluebird Aero Systems Limited Israel 27.83%
(` in Crores)
Particulars March 31, 2018 March 31, 2017
Aggregate carrying amount of individually immaterial associates 38.99 54.37 Aggregate amounts of the group's share of: Profit / (loss) from continuing operations (2.38) (3.89) Other comprehensive income - -
Total comprehensive income (2.38) (3.89)
Significant judgement: classification of associateThe group has 17.53% shareholding in PPL. The group has the ability to appoint directors on the Board of PPL giving it the power to participate in the financial and operating policy decisions. Thus the group has significant influence over PPL making it an associate.
Annual Report 2017-18 | 347
Managem
ent Discussion & Analysis
Strategic Overview
Board &
Managem
ent ProfilesStatutory Reports
Financial Statements
NOTES TO THE CONSOLIDATED FINANCIAL STATEMENTS (Contd.)for the Year ended March 31, 2018
(f) Share of profits from Associates and Joint Venture for the year ended: (` in Crores)
Particulars March 31, 2018 March 31, 2017
Share of profits from Joint Ventures 235.61 16.68 Share of profits from Associates 44.48 153.22
Total share of profits from Associates and Joint Venture 280.09 169.90
40 BUSINESS COMBINATIONSA. Summary of acquisitions during the current year (i) Acquisition of Sharp Insights Limited On April 7, 2017, Group through its subsidiary, Sigmatic Limited entered into a stock purchase agreement to acquire 100% ownership of the issued
share capital of Sharp Insights Limited, a Royston based private company.
The transaction has been entered by Sigmatic to make a valuable addition to group's existing offerings of Healthcare Insights and Analytics business. The acquisition of Sharp Insights Limited is expected to enrich the group with the ability to access European hospital-level data which includes, legacy hospital registers data, inpatient surgical procedure, diagnostic data and outpatient data sets. Sharp Insights Limited is in business of collating, aggregating and providing analytical data and reports regarding medical information relating to hospitals, medical specialties and equipment, surgery and inpatient information.
(a) Details of purchase consideration
ParticularsSharp Insights Limited
USD in Million ` in CroresCash paid 1.45 9.43 Contingent Consideration 0.45 2.93 Working capital adjustment 0.01 0.05 Total Purchase Consideration 1.91 12.41
(b) The fair value of assets and liabilities recognised as a result of the acquisition are as follows:Particulars USD in Million ` in CroresAssetsIntangible assets – Customer Relations 0.04 0.26 Intangible assets – Computer Software (Including acquired database) 1.03 6.67 Trade Receivables * 0.03 Cash and cash equivalents 0.14 0.89 Total Assets 1.21 7.85
Liabilities Trade payable 0.04 0.28 Deferred Revenue 0.04 0.25 Total Liabilities 0.08 0.53 Net identifiable assets acquired 1.13 7.32
(c) Calculation of goodwillParticulars USD in Million ` in CroresConsideration transferred 1.91 12.41 Less: Net identifiable assets acquired 1.13 7.32 Goodwill 0.78 5.09
(d) Significant estimate: Contingent consideration Contingent consideration upto ` 3.91 Crores (USD 0.6 Million) is payable if the revenue growth thresholds are achieved in the calendar year 2018
and 2019. The fair value of contingent consideration of ̀ 2.93 Crores (USD 0.45 Million) was estimated by calculating the weighted average probable earnings.
348 | Piramal Enterprises Limited
NOTES TO THE CONSOLIDATED FINANCIAL STATEMENTS (Contd.)for the Year ended March 31, 2018
CONSOLIDATED FINANCIAL STATEMENTS
(e) Acquired ReceivablesParticulars USD in Million ` in CroresFair value of acquired trade receivables * 0.03 Gross contractual amount for trade receivables * 0.03 Contractual cash flows not expected to be collected - -
(f) Revenue and profit contribution The revenues and profits to the group for the period ended March 31, 2018 are as follows:Particulars USD in Million ` in CroresRevenue 0.56 3.62 Profit/(Loss) before tax 0.22 1.40
(g) Acquisition costs charged to P&L Acquisition costs of Rs. 1.65 Crores (USD 0.25 Million) were charged to Consolidated Statement of Profit and Loss for the year ended March 31, 2018
in relation to the acquisition of Sharp Insights Limited under the head - Other expenses.
(h) Purchase consideration – cash outflowParticulars USD in Million ` in Crores
Net outflow of cash – investing activities 1.45 9.43
* below rounding off norms adopted by the Group
(ii) Acquisition of Context Matters Inc. In August 2016 the Group through its subsidiary Decision Resources Inc invested ` 16.21 Crores (USD 2.5 Million) for 11,943,822 shares in Context
Matters, Inc. ('Context Matters'), which resulted in a 22.73% ownership stake in Context Matters. The Group had accounted for this investment using the equity method.
On August 16, 2017, the Group acquired further 77.27% stake in Context Matters, Inc. This transaction resulted into Context Matters Inc, being a wholly-owned subsidiary of the Group. The Group fair-valued it’s previously held investment in the Context Matters and recorded a loss of ` 7.77 Crores (USD 1.20 Million) during the current year ended March 31, 2018 which is recorded as a separate line-item in other expenses.
The Group entered into the transaction considering the potential synergistic benefits to its Healthcare Insights and Analytics business that Context Matters is expected to provide.
(a) Details of purchase consideration
ParticularsContext Matters Inc
USD in Million ` in CroresConsideration for additional stake 6.50 41.78 Fair value of previously held interest 1.13 7.26 Add: Cash 1.52 9.79 Less: Working capital adjustments (0.83) (5.32)Less: Post combination expenses (0.91) (5.87)Less: Others (0.41) (2.68)Cash paid 7.00 44.96 Total Purchase Consideration 7.00 44.96
Annual Report 2017-18 | 349
Managem
ent Discussion & Analysis
Strategic Overview
Board &
Managem
ent ProfilesStatutory Reports
Financial Statements
NOTES TO THE CONSOLIDATED FINANCIAL STATEMENTS (Contd.)for the Year ended March 31, 2018
(b) The fair value of assets and liabilities recognised as a result of the acquisition are as follows: Particulars USD in Million ` in Crores
AssetsIntangible assets – Customer Relations 0.67 4.33 Intangible assets – Computer Software (Including acquired database) 1.14 7.33 Intangible assets – Trade Name 0.18 1.13 Trade Receivables 0.28 1.80 Cash and cash equivalents 1.52 9.79 Other current assets 0.06 0.37 Total Assets 3.85 24.75 Liabilities Trade payable 0.79 5.08 Deferred Revenue 0.60 3.82 Other current liabilities 0.01 0.05 Total Liabilities 1.40 8.95 Net identifiable assets acquired 2.45 15.80
(c) Calculation of goodwillParticulars USD in Million ` in CroresConsideration transferred 7.00 44.96 Less: Net identifiable assets acquired 2.45 15.80 Goodwill 4.55 29.16
(d) Acquired Receivables Particulars USD in Million ` in CroresFair value of acquired trade receivables 0.28 1.80 Gross contractual amount for trade receivables 0.28 1.80 Contractual cash flows not expected to be collected - -
(e) Revenue and profit contributionThe revenues and profits to the group for the period ended March 31, 2018 are as follows:Particulars USD in Million ` in CroresRevenue 0.93 6.00
Profit/(Loss) before tax (0.57) (3.67)
(f) Acquisition costs charged to P&L Acquisition costs of Rs. 1.49 Crores (USD 0.23 million) were charged to Consolidated Statement of Profit and Loss for the year ended March 31, 2018
in relation to the acquisition of Context Matters under the head - Other expenses.
(g) Purchase consideration - cash outflow Particulars USD in Million ` in CroresOutflow of cash to acquire subsidiaryTotal value for 100% stake 7.00 44.96 Less: Previously held stake (1.13) (7.26)
Net outflow of cash - investing activities 5.87 37.70
350 | Piramal Enterprises Limited
NOTES TO THE CONSOLIDATED FINANCIAL STATEMENTS (Contd.)for the Year ended March 31, 2018
CONSOLIDATED FINANCIAL STATEMENTS
B. Summary of acquisitions during the previous year (i) Acquisition of Ash Stevens On August 31, 2016, the Group through its subsidiary, PEL Pharma Inc. acquired 100% of issued and outstanding membership interests in Ash
Stevens LLC, formerly known as Ash Stevens Inc. Ash Stevens is a full-service pharmaceutical contract manufacturer (CMO) with over five decades of experience developing drug substances and manufacturing active pharmaceutical ingredients (APIs). It also provides research and development services to various drug manufacturers including government agencies.
The acquisition is expected to be synergetic with the Group's antibody drug conjugates and injectible business and expand its presence in North America.
(a) Details of purchase consideration
ParticularsAsh Stevens
USD in Million ` in CroresCash paid 44.79 300.34 Total Purchase Consideration 44.79 300.34
During the year ended March 31, 2018, the Group concluded the fair value adjustments of the assets acquired and liabilities assumed on acquisition. Comparatives have not been retrospectively revised as the amounts are not material.
(b) The fair value of assets and liabilities recognised as a result of the acquisition are as follows: Particulars USD in Million ` in Crores
AssetsAccounts receivable, net 2.11 14.12 Cash and cash equivalents 1.09 7.33 Inventories 1.17 7.87 Contracts in process 1.57 10.50 Prepaid expenses 0.88 5.87 Property Plant and Equipment 22.02 147.66 Computer Software 0.07 0.49 Customer relationship 6.46 43.32 Trade name 4.50 30.19 Total Assets 39.87 267.35 Liabilities Trade payable 0.52 3.51 Advance from customers 1.87 12.51 Accrued expenses 0.32 2.13 Security deposit 0.05 0.34 Total Liabilities 2.76 18.49 Net identifiable assets acquired 37.11 248.86
(c) Calculation of goodwillParticulars USD in Million ` in CroresConsideration transferred 44.79 300.34 Less: Net identifiable assets acquired 37.11 248.86 Goodwill 7.68 51.48
The goodwill is attributable to the workforce and the expected high profitability of the acquired business.Goodwill is fully deductible for tax purposes over a period of 15 years.
(d) Acquired ReceivablesParticulars USD in Million ` in CroresFair value of acquired trade receivables 2.11 14.12 Gross contractual amount for trade receivables 2.12 14.22 Contractual cash flows not expected to be collected * 0.10
* below rounding off norms adopted by the Group.
Annual Report 2017-18 | 351
Managem
ent Discussion & Analysis
Strategic Overview
Board &
Managem
ent ProfilesStatutory Reports
Financial Statements
NOTES TO THE CONSOLIDATED FINANCIAL STATEMENTS (Contd.)for the Year ended March 31, 2018
(e) Revenue and profit contribution The Ash Stevens business contributed revenues and profits to the group for the period ended March 31, 2017 are as follows:
Particulars USD in Million ` in CroresRevenue 11.73 78.66 Profit/(loss) before tax (0.36) (2.42)
(f) Acquisition costs charged to P&L Acquisition costs of ` 5.50 Crores (USD 0.8 Million) were charged to Consolidated Statement of Profit and Loss under the head - Other Expenses.
(g) Purchase consideration - cash outflowParticulars USD in Million ` in CroresOutflow of cash to acquire subsidiary, net of cash acquired Cash consideration 44.79 300.34Less: Balances acquired Cash and cash equivalents 1.09 7.33 Net outflow of cash – investing activities 43.70 293.01
(ii) Purchase of intrathecal spasticity and pain management business from Mallinckrodt LLC
The Group through its subsidiary, Piramal Critical Care Limited, had entered into an agreement to acquire a portfolio of intrathecal spasticity and pain management drugs from Mallinckrodt LLC in an all cash deal on January 30, 2017 for a consideration of ` 1,164.17 crores (USD 171 Million). This transaction was consummated on March 20, 2017. This transaction is a step further to expand the group's presence in global generic hospital drug market.
Of the above consideration, ` 114.02 Crores (USD 17 Million) was paid upfront and the balance ` 997.61 Crores (USD 154 Million) was paid in February 2018.
Apart from the above consideration, ` 4.49 Crores (USD 0.67 Million) was paid for final inventory adjustments.
The agreement also provides for an additional ` 207.53 Crores (USD 32 Million) payable depending on achievement of certain financial milestones by the acquired business over the next 3 years.
The fair value of contingent consideration of ` 103.76 Crores (USD 16 Million) was estimated based on achievement of financial milestones. The estimates are based on discount rate of 10.31%. There are no changes to fair value as at March 31, 2018.
During the year ended March 31, 2018, the Group concluded the fair value adjustments of the assets acquired and liabilities assumed on acquisition. Comparatives have not been retrospectively revised as the amounts are not material.
(a) Details of purchase considerationParticulars USD in Million ` in CroresCash paid 171.00 1,164.17 Contingent Consideration 16.00 103.76 Inventory Adjustment 0.67 4.49 Total Purchase Consideration 187.67 1,272.42
(b) The assets recognised as a result of the acquisition are as follows:Particulars USD in Million ` in CroresAssetsBrands 138.66 944.00 Customer relationships 10.88 74.07 Technical know-how 14.03 95.52 Inventory acquired on acquisition 3.16 21.51 Net identifiable assets acquired 166.73 1,135.10
352 | Piramal Enterprises Limited
NOTES TO THE CONSOLIDATED FINANCIAL STATEMENTS (Contd.)for the Year ended March 31, 2018
CONSOLIDATED FINANCIAL STATEMENTS
(c) Calculation of goodwillParticulars USD in Million ` in CroresConsideration transferred 187.67 1,272.42 Less: Net identifiable assets acquired 166.73 1,135.10 Goodwill 20.94 137.32
The goodwill is attributable to the workforce and the expected high profitability of the acquired business.
Goodwill is not deductible for income tax purposes.
(d) Acquisition costs charged to P&L Acquisition costs of ` 22.02 Crores (USD 3.3 Million) were charged to Consolidated Statement of Profit and Loss in the previous year under the head
- Other Expenses.
(e) Purchase consideration - cash outflowParticulars USD in Million ` in CroresOutflow of cash to acquire subsidiary, net of cash acquiredUpfront consideration paid in March 2017 17.00 114.02 Deferred consideration paid in February 2018 154.00 997.61 Net outflow of cash – investing activities 171.00 1,111.63
(f) Revenue and profit contribution There were no sales during the previous year.
(iii) Acquisition of Searchlight Health Private Limited During 2016, pursuant to Investment Agreement, the Company had invested ` 0.01 Crores for a minority stake in Searchlight Health Private Limited,
a healthcare analytics company. The Company had committed to invest an additional amount of ` 44.20 Crores subject to achievement of certain milestones by Searchlight Health Private Limited.
During the previous year, upon the second tranche of investment, the Group had waived off certain closing conditions and conditions precedent under the Investment Agreement by which it has raised the stake in Searchlight Health Private Limited to 51% on a fully diluted basis.
(a) Details of purchase considerationParticulars ` in CroresCash paid in the 2015-16 1.07Cash paid in the 2016-17 31.40Total Purchase Consideration 32.47
(b) The fair value of assets and liabilities recognised as a result of the acquisition are as follows:Particulars ` in Crores
AssetsTrade receivables 0.51Cash and cash equivalents 31.45Property Plant and Equipment 0.14Other Non-current financial assets 0.19Other Non-current assets 0.32Other current assets 0.15Total Assets 32.76Liabilities Non-current provisions 0.02 Current Borrowings 3.20 Trade Payables 1.39 Other current liabilities 0.60 Total Liabilities 5.21 Net identifiable assets acquired 27.55 Company's stake 14.05
Annual Report 2017-18 | 353
Managem
ent Discussion & Analysis
Strategic Overview
Board &
Managem
ent ProfilesStatutory Reports
Financial Statements
NOTES TO THE CONSOLIDATED FINANCIAL STATEMENTS (Contd.)for the Year ended March 31, 2018
(c) Calculation of goodwillParticulars ` in CroresConsideration transferred 32.47Less: Net identifiable assets acquired 14.05Goodwill 18.42
Goodwill is not deductible for income tax purposes.
Fair value of Non-controlling interests as on the acquisition date is ` 13.50 Crores. This was measured at the non-controlling interest's proportionate share of the Searchlight Health Private Limited's net identifiable assets.
(d) The revenues and profits to the group for the period ended March 31, 2017 are as follows:Particulars ` in CroresRevenue 1.19 Profit/(Loss) before tax (0.60)
The pro-forma effects of the above acquisition on the Group's results were not material.
(e) Acquired ReceivablesParticulars ` in CroresFair value of acquired trade receivables 0.51 Gross contractual amount for trade receivables 0.51 Contractual cash flows not expected to be collected -
(f) Purchase consideration - cash outflowParticulars ` in CroresOutflow of cash to acquire subsidiary, net of cash acquiredCash consideration 32.47 Less: Balances acquired Cash and cash equivalents 31.45 Net outflow of cash - investing activities 1.02
41 GOODWILLFollowing is a summary of changes in the carrying amount of goodwill:
(` in Crores)
Particulars As at March 31, 2018
As at March 31, 2017
Opening balance 5,427.19 5,485.38 Add: Additions due to Acquisitions during the year (Refer Note 40A) 34.25 90.45 Add: Adjustments to provisional purchase price allocation (Refer Note 40B) 116.37 - Add: Currency translation differences 54.74 (148.64)
Closing balance 5,632.55 5,427.19
For the purpose of impairment testing, goodwill acquired in a business combination is allocated to the cash generating units (CGU) or groups of CGUs, which are benefited from the synergies of the acquisition. Goodwill is reviewed for any impairment at the operating segment level, which is represented through groups of CGUs.
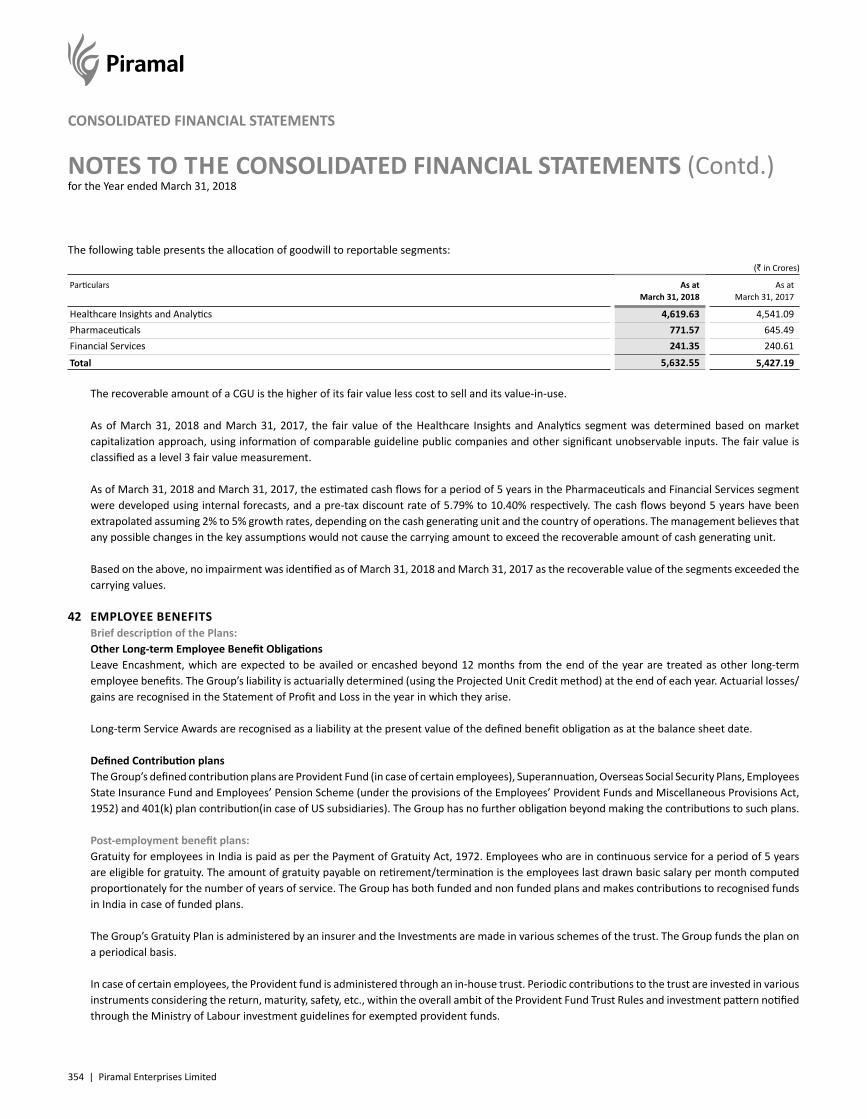
354 | Piramal Enterprises Limited
NOTES TO THE CONSOLIDATED FINANCIAL STATEMENTS (Contd.)for the Year ended March 31, 2018
CONSOLIDATED FINANCIAL STATEMENTS
The following table presents the allocation of goodwill to reportable segments: (` in Crores)
Particulars As at March 31, 2018
As at March 31, 2017
Healthcare Insights and Analytics 4,619.63 4,541.09 Pharmaceuticals 771.57 645.49 Financial Services 241.35 240.61
Total 5,632.55 5,427.19
The recoverable amount of a CGU is the higher of its fair value less cost to sell and its value-in-use.
As of March 31, 2018 and March 31, 2017, the fair value of the Healthcare Insights and Analytics segment was determined based on market capitalization approach, using information of comparable guideline public companies and other significant unobservable inputs. The fair value is classified as a level 3 fair value measurement.
As of March 31, 2018 and March 31, 2017, the estimated cash flows for a period of 5 years in the Pharmaceuticals and Financial Services segment were developed using internal forecasts, and a pre-tax discount rate of 5.79% to 10.40% respectively. The cash flows beyond 5 years have been extrapolated assuming 2% to 5% growth rates, depending on the cash generating unit and the country of operations. The management believes that any possible changes in the key assumptions would not cause the carrying amount to exceed the recoverable amount of cash generating unit.
Based on the above, no impairment was identified as of March 31, 2018 and March 31, 2017 as the recoverable value of the segments exceeded the carrying values.
42 EMPLOYEE BENEFITS Brief description of the Plans: Other Long-term Employee Benefit Obligations Leave Encashment, which are expected to be availed or encashed beyond 12 months from the end of the year are treated as other long-term
employee benefits. The Group’s liability is actuarially determined (using the Projected Unit Credit method) at the end of each year. Actuarial losses/ gains are recognised in the Statement of Profit and Loss in the year in which they arise.
Long-term Service Awards are recognised as a liability at the present value of the defined benefit obligation as at the balance sheet date.
Defined Contribution plans The Group’s defined contribution plans are Provident Fund (in case of certain employees), Superannuation, Overseas Social Security Plans, Employees
State Insurance Fund and Employees’ Pension Scheme (under the provisions of the Employees’ Provident Funds and Miscellaneous Provisions Act, 1952) and 401(k) plan contribution(in case of US subsidiaries). The Group has no further obligation beyond making the contributions to such plans.
Post-employment benefit plans: Gratuity for employees in India is paid as per the Payment of Gratuity Act, 1972. Employees who are in continuous service for a period of 5 years
are eligible for gratuity. The amount of gratuity payable on retirement/termination is the employees last drawn basic salary per month computed proportionately for the number of years of service. The Group has both funded and non funded plans and makes contributions to recognised funds in India in case of funded plans.
The Group’s Gratuity Plan is administered by an insurer and the Investments are made in various schemes of the trust. The Group funds the plan on a periodical basis.
In case of certain employees, the Provident fund is administered through an in-house trust. Periodic contributions to the trust are invested in various instruments considering the return, maturity, safety, etc., within the overall ambit of the Provident Fund Trust Rules and investment pattern notified through the Ministry of Labour investment guidelines for exempted provident funds.
Annual Report 2017-18 | 355
Managem
ent Discussion & Analysis
Strategic Overview
Board &
Managem
ent ProfilesStatutory Reports
Financial Statements
NOTES TO THE CONSOLIDATED FINANCIAL STATEMENTS (Contd.)for the Year ended March 31, 2018
In case of a foreign subsidiary, the subsidiary sponsors a defined benefit retirement plan. The benefits are based on employees' years of experience and final remuneration. The plan is funded through a separate trustee-administered fund.The pension cost for the main defined plans is established in accordance with the advice of independent qualified actuary. This fund was closed to future accrual of benefits with effect from November 15, 2017. The surplus of ` 6.22 Crores (GBP 727,400) has now been reversed in other comprehensive income as the fund is closed to future accruals and there are no active members.
These plans typically expose the Group to actuarial risks such as: investment risk, interest rate risk, longevity risk and salary risk.
Investment risk The present value of the defined benefit plan liability is calculated using a discount rate which is determined by reference to market yields at the
end of the reporting period on government bonds. Plan investment is a mix of investments in government securities, and other debt instruments.
Interest risk A decrease in the bond interest rate will increase the plan liability; however, this will be partially offset by an increase in the return on the plan’s
debt investments.
Longevity risk The present value of the defined benefit plan liability is calculated by reference to the best estimate of the mortality of plan participants both during
and after their employment. An increase in the life expectancy of the plan participants will increase the plan’s liability.
Salary risk The present value of the defined benefit plan liability is calculated by reference to the future salaries of plan participants. As such, an increase in the
salary of the plan participants will increase the plan’s liability.
The Group has both funded and non funded plans and makes contributions to recognised funds in India in case of funded plans. The Group does not fully fund the liability and maintains a target level of funding to be maintained over a period of time based on estimations of expected gratuity payments. In respect of certain employees, Provident Fund contributions are made to a Trust administered by the Group. The contributions made to the trust are recognised as plan assets. Plan assets in the Provident fund trust are governed by local regulations, including limits on contributions in each class of investments.
The Group actively monitors how the duration and the expected yield of the investments are matching the expected cash outflows arising from the employee benefit obligations, with the objective that assets of the gratuity / provident fund obligations match the benefit payments as they fall due. Investments are well diversified, such that the failure of any single investment would not have a material impact on the overall level of assets.
A large portion of assets consists of government and corporate bonds, although the Group also invests in equities, cash and mutual funds. The plan asset mix is in compliance with the requirements of the regulations in case of Provident fund.
In case of an overseas subsidiary, the pension plans are funded through a separate trustee – administered fund. The subsidiary employs a building block approach in determining the long-term rate of return on pension plan assets. Historical markets are studied and assets with higher volatility are assumed to generate higher returns consistent with widely accepted capital market principles.
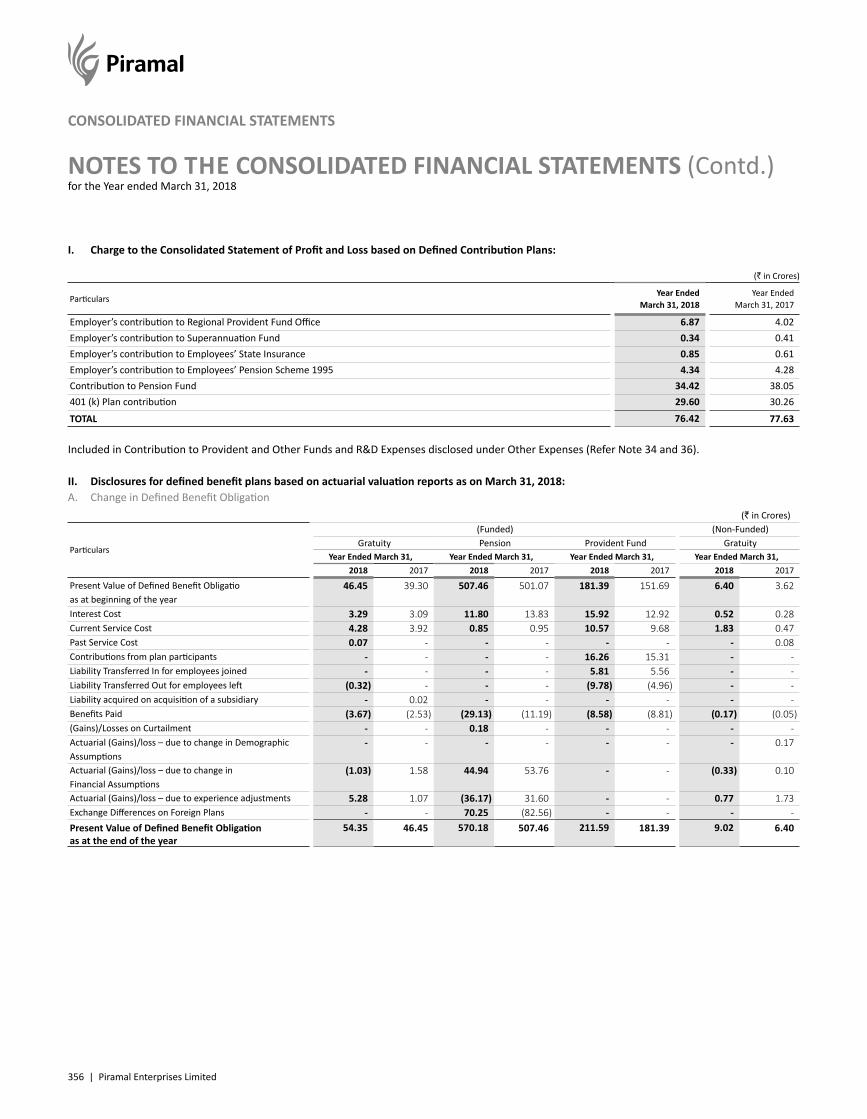
356 | Piramal Enterprises Limited
NOTES TO THE CONSOLIDATED FINANCIAL STATEMENTS (Contd.)for the Year ended March 31, 2018
CONSOLIDATED FINANCIAL STATEMENTS
I. Charge to the Consolidated Statement of Profit and Loss based on Defined Contribution Plans:
(` in Crores)
ParticularsYear Ended
March 31, 2018Year Ended
March 31, 2017
Employer’s contribution to Regional Provident Fund Office 6.87 4.02 Employer’s contribution to Superannuation Fund 0.34 0.41 Employer’s contribution to Employees’ State Insurance 0.85 0.61 Employer’s contribution to Employees’ Pension Scheme 1995 4.34 4.28 Contribution to Pension Fund 34.42 38.05 401 (k) Plan contribution 29.60 30.26
TOTAL 76.42 77.63
Included in Contribution to Provident and Other Funds and R&D Expenses disclosed under Other Expenses (Refer Note 34 and 36).
II. Disclosures for defined benefit plans based on actuarial valuation reports as on March 31, 2018:A. Change in Defined Benefit Obligation
(` in Crores)
Particulars
(Funded) (Non-Funded)Gratuity Pension Provident Fund Gratuity
Year Ended March 31, Year Ended March 31, Year Ended March 31, Year Ended March 31,2018 2017 2018 2017 2018 2017 2018 2017
Present Value of Defined Benefit Obligatio as at beginning of the year
46.45 39.30 507.46 501.07 181.39 151.69 6.40 3.62
Interest Cost 3.29 3.09 11.80 13.83 15.92 12.92 0.52 0.28 Current Service Cost 4.28 3.92 0.85 0.95 10.57 9.68 1.83 0.47 Past Service Cost 0.07 - - - - - - 0.08 Contributions from plan participants - - - - 16.26 15.31 - - Liability Transferred In for employees joined - - - - 5.81 5.56 - - Liability Transferred Out for employees left (0.32) - - - (9.78) (4.96) - - Liability acquired on acquisition of a subsidiary - 0.02 - - - - - - Benefits Paid (3.67) (2.53) (29.13) (11.19) (8.58) (8.81) (0.17) (0.05)(Gains)/Losses on Curtailment - - 0.18 - - - - - Actuarial (Gains)/loss – due to change in Demographic Assumptions
- - - - - - - 0.17
Actuarial (Gains)/loss – due to change in Financial Assumptions
(1.03) 1.58 44.94 53.76 - - (0.33) 0.10
Actuarial (Gains)/loss – due to experience adjustments 5.28 1.07 (36.17) 31.60 - - 0.77 1.73 Exchange Differences on Foreign Plans - - 70.25 (82.56) - - - - Present Value of Defined Benefit Obligation as at the end of the year
54.35 46.45 570.18 507.46 211.59 181.39 9.02 6.40
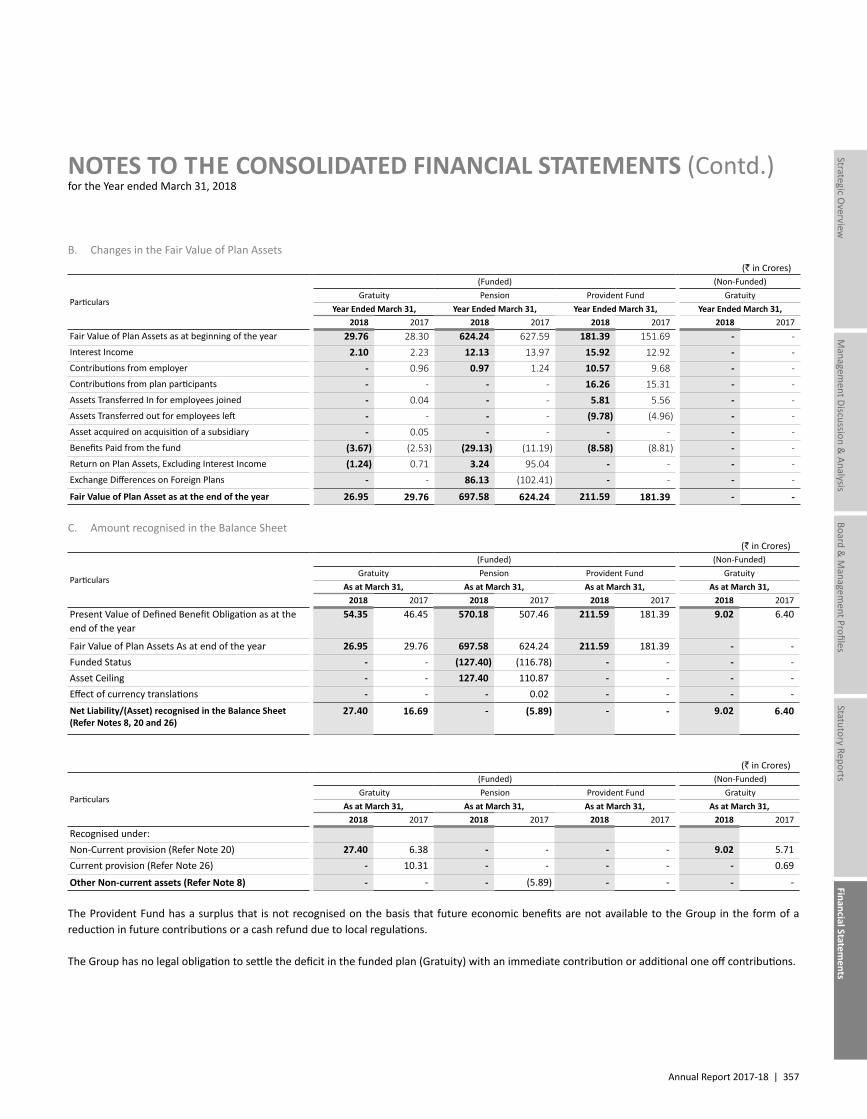
Annual Report 2017-18 | 357
Managem
ent Discussion & Analysis
Strategic Overview
Board &
Managem
ent ProfilesStatutory Reports
Financial Statements
NOTES TO THE CONSOLIDATED FINANCIAL STATEMENTS (Contd.)for the Year ended March 31, 2018
B. Changes in the Fair Value of Plan Assets(` in Crores)
Particulars
(Funded) (Non-Funded)Gratuity Pension Provident Fund Gratuity
Year Ended March 31, Year Ended March 31, Year Ended March 31, Year Ended March 31,2018 2017 2018 2017 2018 2017 2018 2017
Fair Value of Plan Assets as at beginning of the year 29.76 28.30 624.24 627.59 181.39 151.69 - - Interest Income 2.10 2.23 12.13 13.97 15.92 12.92 - - Contributions from employer - 0.96 0.97 1.24 10.57 9.68 - - Contributions from plan participants - - - - 16.26 15.31 - - Assets Transferred In for employees joined - 0.04 - - 5.81 5.56 - - Assets Transferred out for employees left - - - - (9.78) (4.96) - - Asset acquired on acquisition of a subsidiary - 0.05 - - - - - - Benefits Paid from the fund (3.67) (2.53) (29.13) (11.19) (8.58) (8.81) - - Return on Plan Assets, Excluding Interest Income (1.24) 0.71 3.24 95.04 - - - - Exchange Differences on Foreign Plans - - 86.13 (102.41) - - - -
Fair Value of Plan Asset as at the end of the year 26.95 29.76 697.58 624.24 211.59 181.39 - -
C. Amount recognised in the Balance Sheet(` in Crores)
Particulars
(Funded) (Non-Funded)Gratuity Pension Provident Fund Gratuity
As at March 31, As at March 31, As at March 31, As at March 31,2018 2017 2018 2017 2018 2017 2018 2017
Present Value of Defined Benefit Obligation as at the end of the year
54.35 46.45 570.18 507.46 211.59 181.39 9.02 6.40
Fair Value of Plan Assets As at end of the year 26.95 29.76 697.58 624.24 211.59 181.39 - - Funded Status - - (127.40) (116.78) - - - - Asset Ceiling - - 127.40 110.87 - - - - Effect of currency translations - - - 0.02 - - - - Net Liability/(Asset) recognised in the Balance Sheet (Refer Notes 8, 20 and 26)
27.40 16.69 - (5.89) - - 9.02 6.40
(` in Crores)
Particulars
(Funded) (Non-Funded)Gratuity Pension Provident Fund Gratuity
As at March 31, As at March 31, As at March 31, As at March 31,2018 2017 2018 2017 2018 2017 2018 2017
Recognised under:Non-Current provision (Refer Note 20) 27.40 6.38 - - - - 9.02 5.71 Current provision (Refer Note 26) - 10.31 - - - - - 0.69
Other Non-current assets (Refer Note 8) - - - (5.89) - - - -
The Provident Fund has a surplus that is not recognised on the basis that future economic benefits are not available to the Group in the form of a reduction in future contributions or a cash refund due to local regulations.
The Group has no legal obligation to settle the deficit in the funded plan (Gratuity) with an immediate contribution or additional one off contributions.
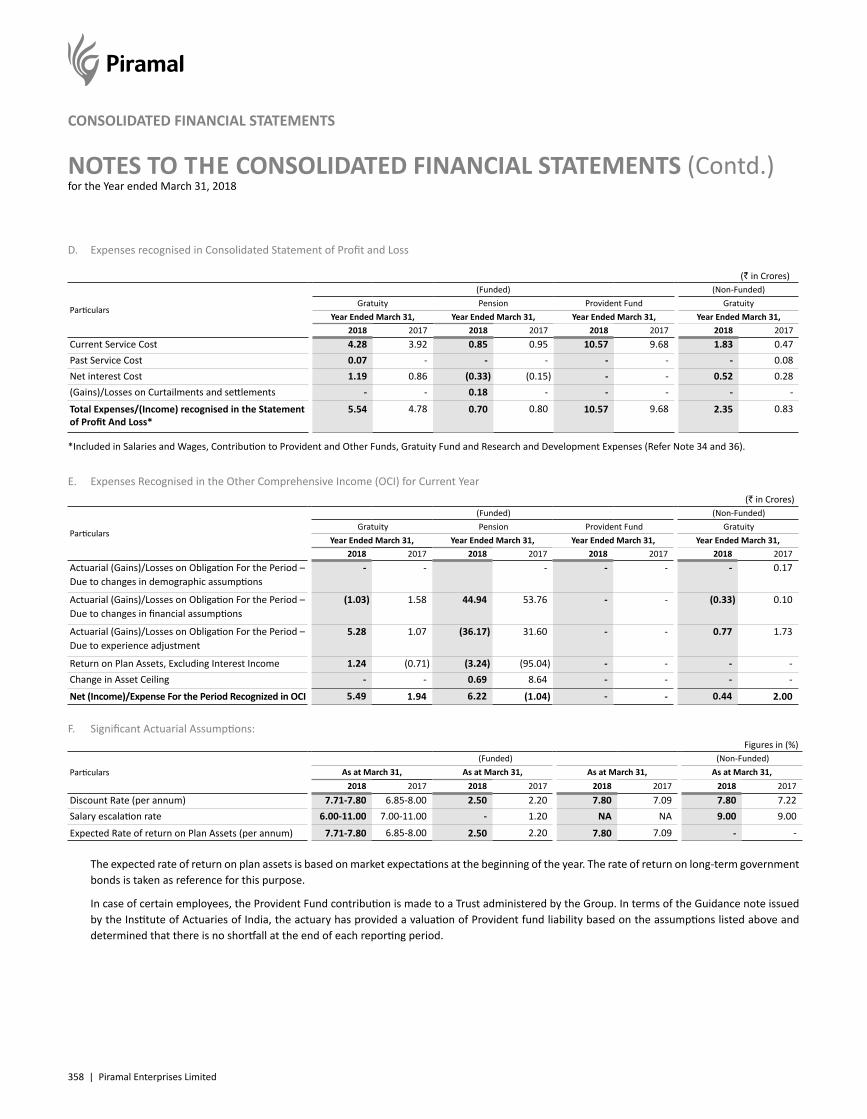
358 | Piramal Enterprises Limited
NOTES TO THE CONSOLIDATED FINANCIAL STATEMENTS (Contd.)for the Year ended March 31, 2018
CONSOLIDATED FINANCIAL STATEMENTS
D. Expenses recognised in Consolidated Statement of Profit and Loss
(` in Crores)
Particulars
(Funded) (Non-Funded)Gratuity Pension Provident Fund Gratuity
Year Ended March 31, Year Ended March 31, Year Ended March 31, Year Ended March 31,2018 2017 2018 2017 2018 2017 2018 2017
Current Service Cost 4.28 3.92 0.85 0.95 10.57 9.68 1.83 0.47 Past Service Cost 0.07 - - - - - - 0.08 Net interest Cost 1.19 0.86 (0.33) (0.15) - - 0.52 0.28 (Gains)/Losses on Curtailments and settlements - - 0.18 - - - - -
Total Expenses/(Income) recognised in the Statement of Profit And Loss*
5.54 4.78 0.70 0.80 10.57 9.68 2.35 0.83
*Included in Salaries and Wages, Contribution to Provident and Other Funds, Gratuity Fund and Research and Development Expenses (Refer Note 34 and 36).
E. Expenses Recognised in the Other Comprehensive Income (OCI) for Current Year(` in Crores)
Particulars
(Funded) (Non-Funded)Gratuity Pension Provident Fund Gratuity
Year Ended March 31, Year Ended March 31, Year Ended March 31, Year Ended March 31,2018 2017 2018 2017 2018 2017 2018 2017
Actuarial (Gains)/Losses on Obligation For the Period – Due to changes in demographic assumptions
- - - - - - 0.17
Actuarial (Gains)/Losses on Obligation For the Period – Due to changes in financial assumptions
(1.03) 1.58 44.94 53.76 - - (0.33) 0.10
Actuarial (Gains)/Losses on Obligation For the Period – Due to experience adjustment
5.28 1.07 (36.17) 31.60 - - 0.77 1.73
Return on Plan Assets, Excluding Interest Income 1.24 (0.71) (3.24) (95.04) - - - - Change in Asset Ceiling - - 0.69 8.64 - - - -
Net (Income)/Expense For the Period Recognized in OCI 5.49 1.94 6.22 (1.04) - - 0.44 2.00
F. Significant Actuarial Assumptions:Figures in (%)
Particulars(Funded) (Non-Funded)
As at March 31, As at March 31, As at March 31, As at March 31,2018 2017 2018 2017 2018 2017 2018 2017
Discount Rate (per annum) 7.71-7.80 6.85-8.00 2.50 2.20 7.80 7.09 7.80 7.22Salary escalation rate 6.00-11.00 7.00-11.00 - 1.20 NA NA 9.00 9.00
Expected Rate of return on Plan Assets (per annum) 7.71-7.80 6.85-8.00 2.50 2.20 7.80 7.09 - -
The expected rate of return on plan assets is based on market expectations at the beginning of the year. The rate of return on long-term government bonds is taken as reference for this purpose.
In case of certain employees, the Provident Fund contribution is made to a Trust administered by the Group. In terms of the Guidance note issued by the Institute of Actuaries of India, the actuary has provided a valuation of Provident fund liability based on the assumptions listed above and determined that there is no shortfall at the end of each reporting period.
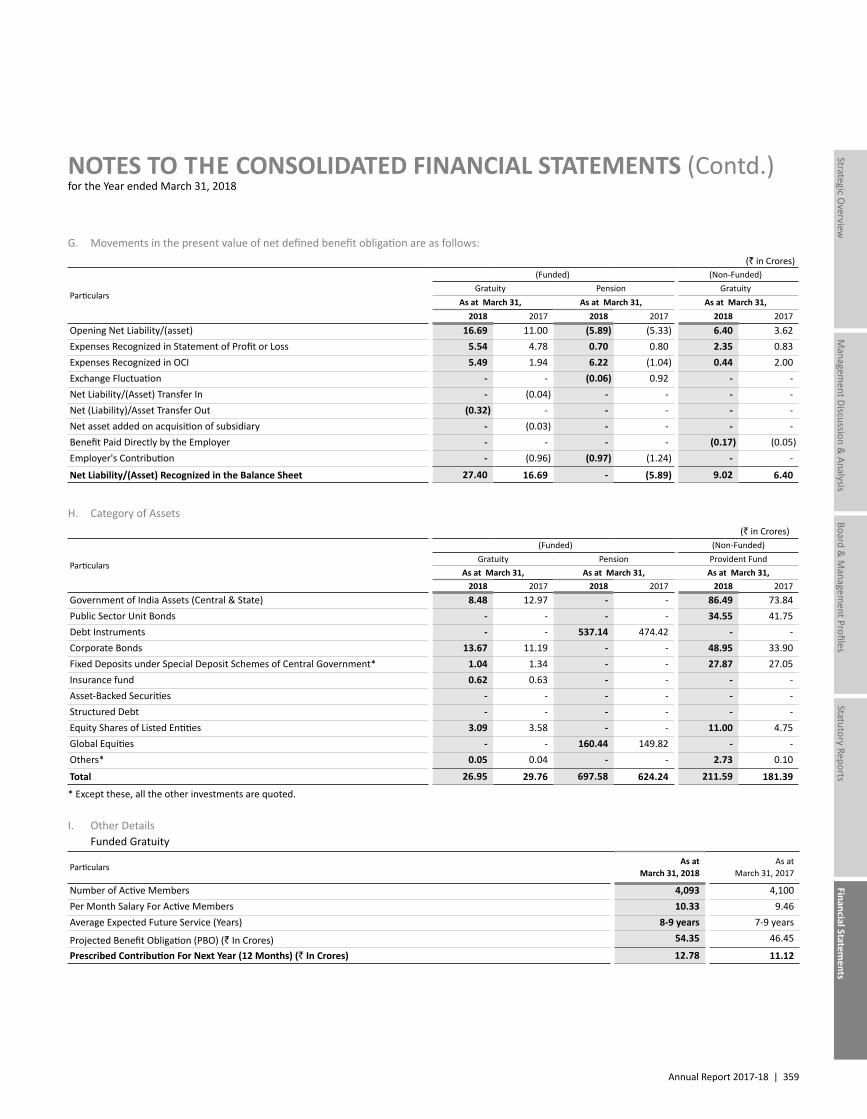
Annual Report 2017-18 | 359
Managem
ent Discussion & Analysis
Strategic Overview
Board &
Managem
ent ProfilesStatutory Reports
Financial Statements
NOTES TO THE CONSOLIDATED FINANCIAL STATEMENTS (Contd.)for the Year ended March 31, 2018
G. Movements in the present value of net defined benefit obligation are as follows:(` in Crores)
Particulars
(Funded) (Non-Funded)Gratuity Pension Gratuity
As at March 31, As at March 31, As at March 31,2018 2017 2018 2017 2018 2017
Opening Net Liability/(asset) 16.69 11.00 (5.89) (5.33) 6.40 3.62 Expenses Recognized in Statement of Profit or Loss 5.54 4.78 0.70 0.80 2.35 0.83 Expenses Recognized in OCI 5.49 1.94 6.22 (1.04) 0.44 2.00 Exchange Fluctuation - - (0.06) 0.92 - - Net Liability/(Asset) Transfer In - (0.04) - - - - Net (Liability)/Asset Transfer Out (0.32) - - - - - Net asset added on acquisition of subsidiary - (0.03) - - - - Benefit Paid Directly by the Employer - - - - (0.17) (0.05)Employer's Contribution - (0.96) (0.97) (1.24) - -
Net Liability/(Asset) Recognized in the Balance Sheet 27.40 16.69 - (5.89) 9.02 6.40
H. Category of Assets(` in Crores)
Particulars
(Funded) (Non-Funded)Gratuity Pension Provident Fund
As at March 31, As at March 31, As at March 31,2018 2017 2018 2017 2018 2017
Government of India Assets (Central & State) 8.48 12.97 - - 86.49 73.84 Public Sector Unit Bonds - - - - 34.55 41.75 Debt Instruments - - 537.14 474.42 - - Corporate Bonds 13.67 11.19 - - 48.95 33.90 Fixed Deposits under Special Deposit Schemes of Central Government* 1.04 1.34 - - 27.87 27.05 Insurance fund 0.62 0.63 - - - - Asset-Backed Securities - - - - - - Structured Debt - - - - - - Equity Shares of Listed Entities 3.09 3.58 - - 11.00 4.75 Global Equities - - 160.44 149.82 - - Others* 0.05 0.04 - - 2.73 0.10
Total 26.95 29.76 697.58 624.24 211.59 181.39
* Except these, all the other investments are quoted.
I. Other Details Funded Gratuity
ParticularsAs at
March 31, 2018As at
March 31, 2017
Number of Active Members 4,093 4,100 Per Month Salary For Active Members 10.33 9.46 Average Expected Future Service (Years) 8-9 years 7-9 years
Projected Benefit Obligation (PBO) (` In Crores) 54.35 46.45
Prescribed Contribution For Next Year (12 Months) (` In Crores) 12.78 11.12
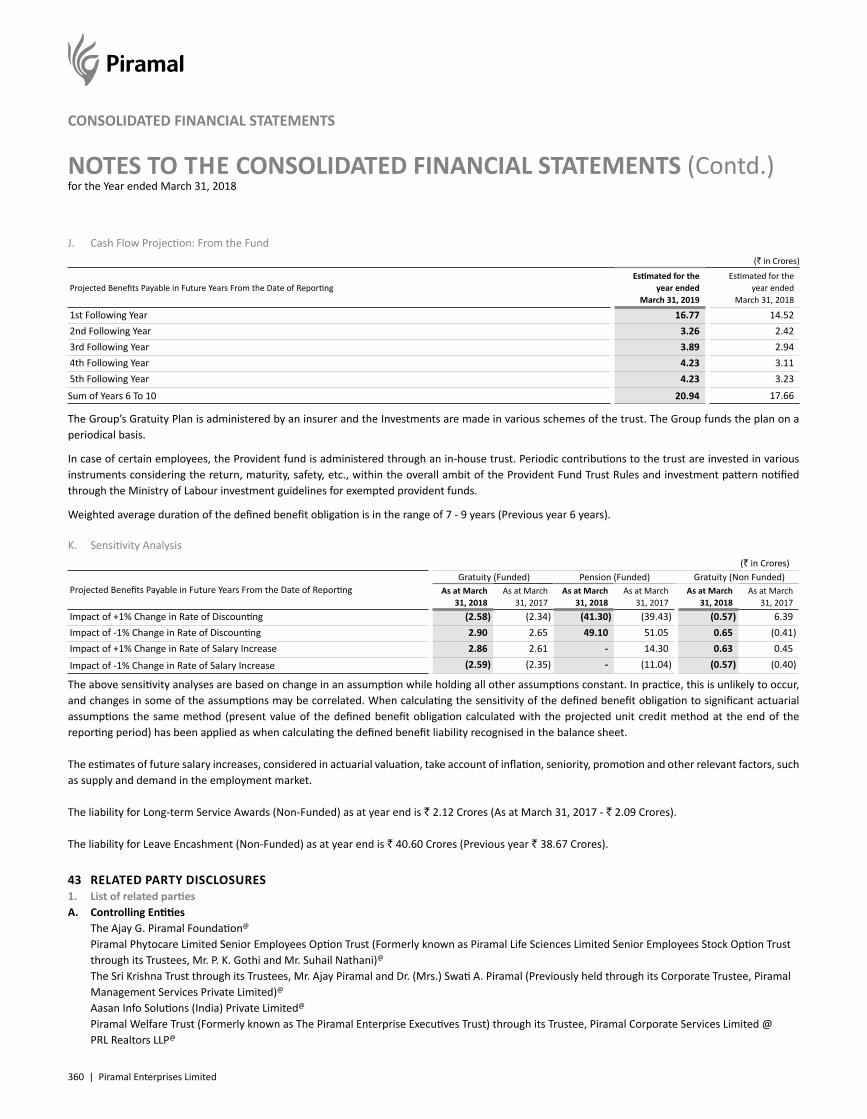
360 | Piramal Enterprises Limited
NOTES TO THE CONSOLIDATED FINANCIAL STATEMENTS (Contd.)for the Year ended March 31, 2018
CONSOLIDATED FINANCIAL STATEMENTS
J. Cash Flow Projection: From the Fund (` in Crores)
Projected Benefits Payable in Future Years From the Date of ReportingEstimated for the
year ended March 31, 2019
Estimated for the year ended
March 31, 2018
1st Following Year 16.77 14.52 2nd Following Year 3.26 2.42 3rd Following Year 3.89 2.94 4th Following Year 4.23 3.11 5th Following Year 4.23 3.23
Sum of Years 6 To 10 20.94 17.66
The Group’s Gratuity Plan is administered by an insurer and the Investments are made in various schemes of the trust. The Group funds the plan on a periodical basis.
In case of certain employees, the Provident fund is administered through an in-house trust. Periodic contributions to the trust are invested in various instruments considering the return, maturity, safety, etc., within the overall ambit of the Provident Fund Trust Rules and investment pattern notified through the Ministry of Labour investment guidelines for exempted provident funds.
Weighted average duration of the defined benefit obligation is in the range of 7 - 9 years (Previous year 6 years).
K. Sensitivity Analysis(` in Crores)
Projected Benefits Payable in Future Years From the Date of ReportingGratuity (Funded) Pension (Funded) Gratuity (Non Funded)
As at March 31, 2018
As at March 31, 2017
As at March 31, 2018
As at March 31, 2017
As at March 31, 2018
As at March 31, 2017
Impact of +1% Change in Rate of Discounting (2.58) (2.34) (41.30) (39.43) (0.57) 6.39 Impact of -1% Change in Rate of Discounting 2.90 2.65 49.10 51.05 0.65 (0.41)Impact of +1% Change in Rate of Salary Increase 2.86 2.61 - 14.30 0.63 0.45
Impact of -1% Change in Rate of Salary Increase (2.59) (2.35) - (11.04) (0.57) (0.40)
The above sensitivity analyses are based on change in an assumption while holding all other assumptions constant. In practice, this is unlikely to occur, and changes in some of the assumptions may be correlated. When calculating the sensitivity of the defined benefit obligation to significant actuarial assumptions the same method (present value of the defined benefit obligation calculated with the projected unit credit method at the end of the reporting period) has been applied as when calculating the defined benefit liability recognised in the balance sheet.
The estimates of future salary increases, considered in actuarial valuation, take account of inflation, seniority, promotion and other relevant factors, such as supply and demand in the employment market.
The liability for Long-term Service Awards (Non-Funded) as at year end is ` 2.12 Crores (As at March 31, 2017 - ` 2.09 Crores).
The liability for Leave Encashment (Non-Funded) as at year end is ` 40.60 Crores (Previous year ` 38.67 Crores).
43 RELATED PARTY DISCLOSURES1. List of related partiesA. Controlling Entities The Ajay G. Piramal Foundation@
Piramal Phytocare Limited Senior Employees Option Trust (Formerly known as Piramal Life Sciences Limited Senior Employees Stock Option Trust through its Trustees, Mr. P. K. Gothi and Mr. Suhail Nathani)@ The Sri Krishna Trust through its Trustees, Mr. Ajay Piramal and Dr. (Mrs.) Swati A. Piramal (Previously held through its Corporate Trustee, Piramal Management Services Private Limited)@ Aasan Info Solutions (India) Private Limited@
Piramal Welfare Trust (Formerly known as The Piramal Enterprise Executives Trust) through its Trustee, Piramal Corporate Services Limited @ PRL Realtors LLP@
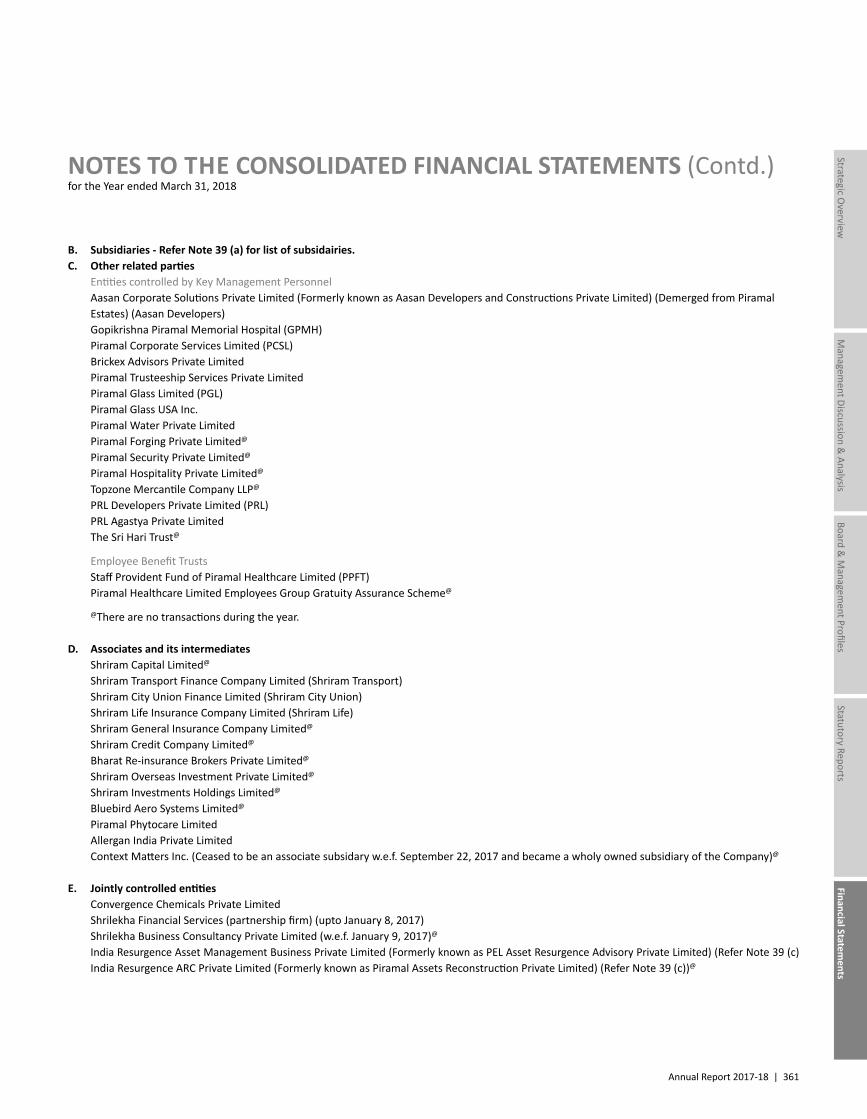
Annual Report 2017-18 | 361
Managem
ent Discussion & Analysis
Strategic Overview
Board &
Managem
ent ProfilesStatutory Reports
Financial Statements
NOTES TO THE CONSOLIDATED FINANCIAL STATEMENTS (Contd.)for the Year ended March 31, 2018
B. Subsidiaries - Refer Note 39 (a) for list of subsidairies.C. Other related parties Entities controlled by Key Management Personnel Aasan Corporate Solutions Private Limited (Formerly known as Aasan Developers and Constructions Private Limited) (Demerged from Piramal
Estates) (Aasan Developers) Gopikrishna Piramal Memorial Hospital (GPMH) Piramal Corporate Services Limited (PCSL) Brickex Advisors Private Limited Piramal Trusteeship Services Private Limited Piramal Glass Limited (PGL) Piramal Glass USA Inc. Piramal Water Private Limited Piramal Forging Private Limited@
Piramal Security Private Limited@
Piramal Hospitality Private Limited@ Topzone Mercantile Company LLP@
PRL Developers Private Limited (PRL) PRL Agastya Private Limited The Sri Hari Trust@
Employee Benefit Trusts Staff Provident Fund of Piramal Healthcare Limited (PPFT) Piramal Healthcare Limited Employees Group Gratuity Assurance Scheme@
@There are no transactions during the year.
D. Associates and its intermediates Shriram Capital Limited@
Shriram Transport Finance Company Limited (Shriram Transport) Shriram City Union Finance Limited (Shriram City Union) Shriram Life Insurance Company Limited (Shriram Life) Shriram General Insurance Company Limited@ Shriram Credit Company Limited@
Bharat Re-insurance Brokers Private Limited@
Shriram Overseas Investment Private Limited@ Shriram Investments Holdings Limited@ Bluebird Aero Systems Limited@
Piramal Phytocare Limited Allergan India Private Limited Context Matters Inc. (Ceased to be an associate subsidary w.e.f. September 22, 2017 and became a wholy owned subsidiary of the Company)@
E. Jointly controlled entities Convergence Chemicals Private Limited Shrilekha Financial Services (partnership firm) (upto January 8, 2017) Shrilekha Business Consultancy Private Limited (w.e.f. January 9, 2017)@
India Resurgence Asset Management Business Private Limited (Formerly known as PEL Asset Resurgence Advisory Private Limited) (Refer Note 39 (c)India Resurgence ARC Private Limited (Formerly known as Piramal Assets Reconstruction Private Limited) (Refer Note 39 (c))@
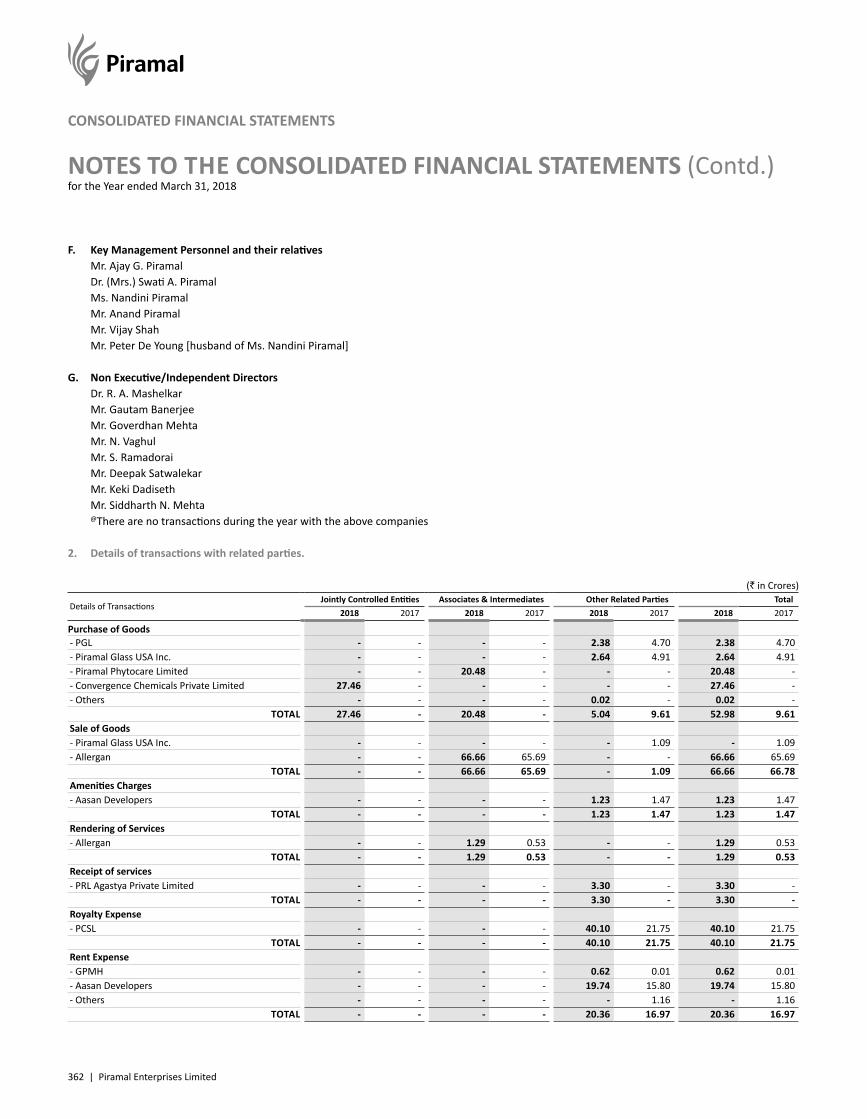
362 | Piramal Enterprises Limited
NOTES TO THE CONSOLIDATED FINANCIAL STATEMENTS (Contd.)for the Year ended March 31, 2018
CONSOLIDATED FINANCIAL STATEMENTS
F. Key Management Personnel and their relatives Mr. Ajay G. Piramal Dr. (Mrs.) Swati A. Piramal Ms. Nandini Piramal Mr. Anand Piramal Mr. Vijay Shah Mr. Peter De Young [husband of Ms. Nandini Piramal] G. Non Executive/Independent Directors Dr. R. A. Mashelkar Mr. Gautam Banerjee Mr. Goverdhan Mehta Mr. N. Vaghul Mr. S. Ramadorai Mr. Deepak Satwalekar Mr. Keki Dadiseth Mr. Siddharth N. Mehta @There are no transactions during the year with the above companies
2. Details of transactions with related parties.
(` in Crores)
Details of Transactions Jointly Controlled Entities Associates & Intermediates Other Related Parties Total
2018 2017 2018 2017 2018 2017 2018 2017
Purchase of Goods - PGL - - - - 2.38 4.70 2.38 4.70 - Piramal Glass USA Inc. - - - - 2.64 4.91 2.64 4.91 - Piramal Phytocare Limited - - 20.48 - - - 20.48 - - Convergence Chemicals Private Limited 27.46 - - - - - 27.46 - - Others - - - - 0.02 - 0.02 -
TOTAL 27.46 - 20.48 - 5.04 9.61 52.98 9.61 Sale of Goods - Piramal Glass USA Inc. - - - - - 1.09 - 1.09 - Allergan - - 66.66 65.69 - - 66.66 65.69
TOTAL - - 66.66 65.69 - 1.09 66.66 66.78 Amenities Charges- Aasan Developers - - - - 1.23 1.47 1.23 1.47
TOTAL - - - - 1.23 1.47 1.23 1.47 Rendering of Services- Allergan - - 1.29 0.53 - - 1.29 0.53
TOTAL - - 1.29 0.53 - - 1.29 0.53 Receipt of services- PRL Agastya Private Limited - - - - 3.30 - 3.30 -
TOTAL - - - - 3.30 - 3.30 - Royalty Expense- PCSL - - - - 40.10 21.75 40.10 21.75
TOTAL - - - - 40.10 21.75 40.10 21.75 Rent Expense- GPMH - - - - 0.62 0.01 0.62 0.01 - Aasan Developers - - - - 19.74 15.80 19.74 15.80 - Others - - - - - 1.16 - 1.16
TOTAL - - - - 20.36 16.97 20.36 16.97
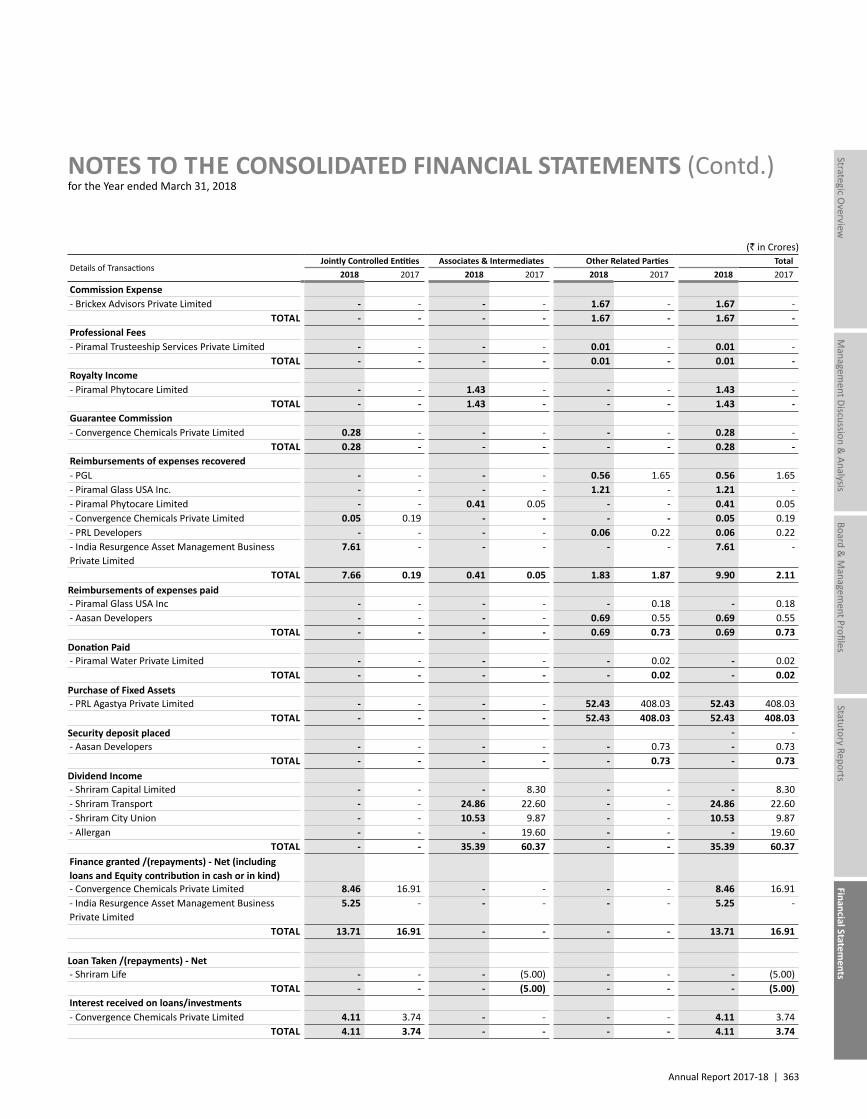
Annual Report 2017-18 | 363
Managem
ent Discussion & Analysis
Strategic Overview
Board &
Managem
ent ProfilesStatutory Reports
Financial Statements
NOTES TO THE CONSOLIDATED FINANCIAL STATEMENTS (Contd.)for the Year ended March 31, 2018
(` in Crores)
Details of Transactions Jointly Controlled Entities Associates & Intermediates Other Related Parties Total
2018 2017 2018 2017 2018 2017 2018 2017
Commission Expense- Brickex Advisors Private Limited - - - - 1.67 - 1.67 -
TOTAL - - - - 1.67 - 1.67 - Professional Fees- Piramal Trusteeship Services Private Limited - - - - 0.01 - 0.01 -
TOTAL - - - - 0.01 - 0.01 - Royalty Income- Piramal Phytocare Limited - - 1.43 - - - 1.43 -
TOTAL - - 1.43 - - - 1.43 - Guarantee Commission- Convergence Chemicals Private Limited 0.28 - - - - - 0.28 -
TOTAL 0.28 - - - - - 0.28 - Reimbursements of expenses recovered- PGL - - - - 0.56 1.65 0.56 1.65 - Piramal Glass USA Inc. - - - - 1.21 - 1.21 - - Piramal Phytocare Limited - - 0.41 0.05 - - 0.41 0.05 - Convergence Chemicals Private Limited 0.05 0.19 - - - - 0.05 0.19 - PRL Developers - - - - 0.06 0.22 0.06 0.22 - India Resurgence Asset Management Business Private Limited
7.61 - - - - - 7.61 -
TOTAL 7.66 0.19 0.41 0.05 1.83 1.87 9.90 2.11 Reimbursements of expenses paid- Piramal Glass USA Inc - - - - - 0.18 - 0.18 - Aasan Developers - - - - 0.69 0.55 0.69 0.55
TOTAL - - - - 0.69 0.73 0.69 0.73 Donation Paid- Piramal Water Private Limited - - - - - 0.02 - 0.02
TOTAL - - - - - 0.02 - 0.02 Purchase of Fixed Assets- PRL Agastya Private Limited - - - - 52.43 408.03 52.43 408.03
TOTAL - - - - 52.43 408.03 52.43 408.03 Security deposit placed - - - Aasan Developers - - - - - 0.73 - 0.73
TOTAL - - - - - 0.73 - 0.73 Dividend Income- Shriram Capital Limited - - - 8.30 - - - 8.30 - Shriram Transport - - 24.86 22.60 - - 24.86 22.60 - Shriram City Union - - 10.53 9.87 - - 10.53 9.87 - Allergan - - - 19.60 - - - 19.60
TOTAL - - 35.39 60.37 - - 35.39 60.37 Finance granted /(repayments) - Net (including loans and Equity contribution in cash or in kind) - Convergence Chemicals Private Limited 8.46 16.91 - - - - 8.46 16.91 - India Resurgence Asset Management Business Private Limited
5.25 - - - - - 5.25 -
TOTAL 13.71 16.91 - - - - 13.71 16.91
Loan Taken /(repayments) - Net - Shriram Life - - - (5.00) - - - (5.00)
TOTAL - - - (5.00) - - - (5.00)Interest received on loans/investments - Convergence Chemicals Private Limited 4.11 3.74 - - - - 4.11 3.74
TOTAL 4.11 3.74 - - - - 4.11 3.74
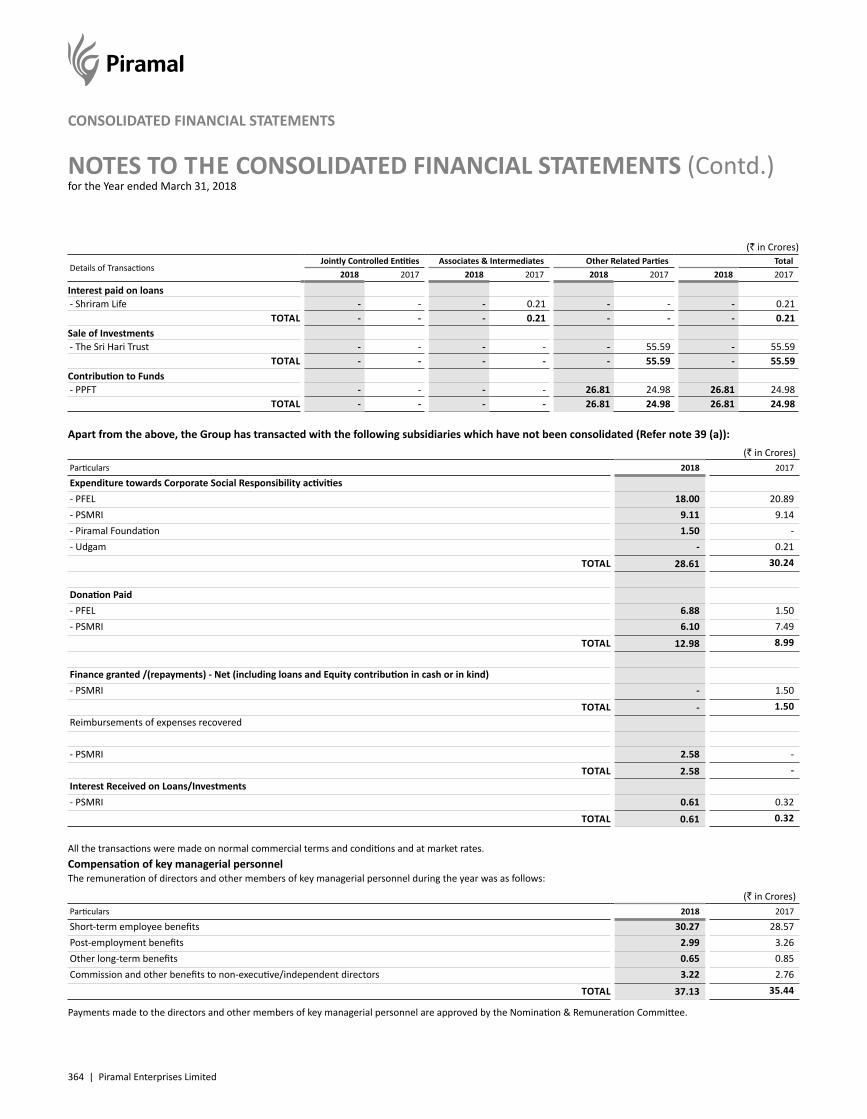
364 | Piramal Enterprises Limited
NOTES TO THE CONSOLIDATED FINANCIAL STATEMENTS (Contd.)for the Year ended March 31, 2018
CONSOLIDATED FINANCIAL STATEMENTS
(` in Crores)
Details of Transactions Jointly Controlled Entities Associates & Intermediates Other Related Parties Total
2018 2017 2018 2017 2018 2017 2018 2017
Interest paid on loans - Shriram Life - - - 0.21 - - - 0.21
TOTAL - - - 0.21 - - - 0.21 Sale of Investments - The Sri Hari Trust - - - - - 55.59 - 55.59
TOTAL - - - - - 55.59 - 55.59 Contribution to Funds - PPFT - - - - 26.81 24.98 26.81 24.98
TOTAL - - - - 26.81 24.98 26.81 24.98
Apart from the above, the Group has transacted with the following subsidiaries which have not been consolidated (Refer note 39 (a)):(` in Crores)
Particulars 2018 2017
Expenditure towards Corporate Social Responsibility activities- PFEL 18.00 20.89- PSMRI 9.11 9.14- Piramal Foundation 1.50 -- Udgam - 0.21
TOTAL 28.61 30.24
Donation Paid- PFEL 6.88 1.50- PSMRI 6.10 7.49
TOTAL 12.98 8.99
Finance granted /(repayments) - Net (including loans and Equity contribution in cash or in kind)- PSMRI - 1.50
TOTAL - 1.50Reimbursements of expenses recovered
- PSMRI 2.58 - TOTAL 2.58 -
Interest Received on Loans/Investments- PSMRI 0.61 0.32
TOTAL 0.61 0.32
All the transactions were made on normal commercial terms and conditions and at market rates.Compensation of key managerial personnelThe remuneration of directors and other members of key managerial personnel during the year was as follows:
(` in Crores)Particulars 2018 2017
Short-term employee benefits 30.27 28.57Post-employment benefits 2.99 3.26Other long-term benefits 0.65 0.85Commission and other benefits to non-executive/independent directors 3.22 2.76
TOTAL 37.13 35.44
Payments made to the directors and other members of key managerial personnel are approved by the Nomination & Remuneration Committee.
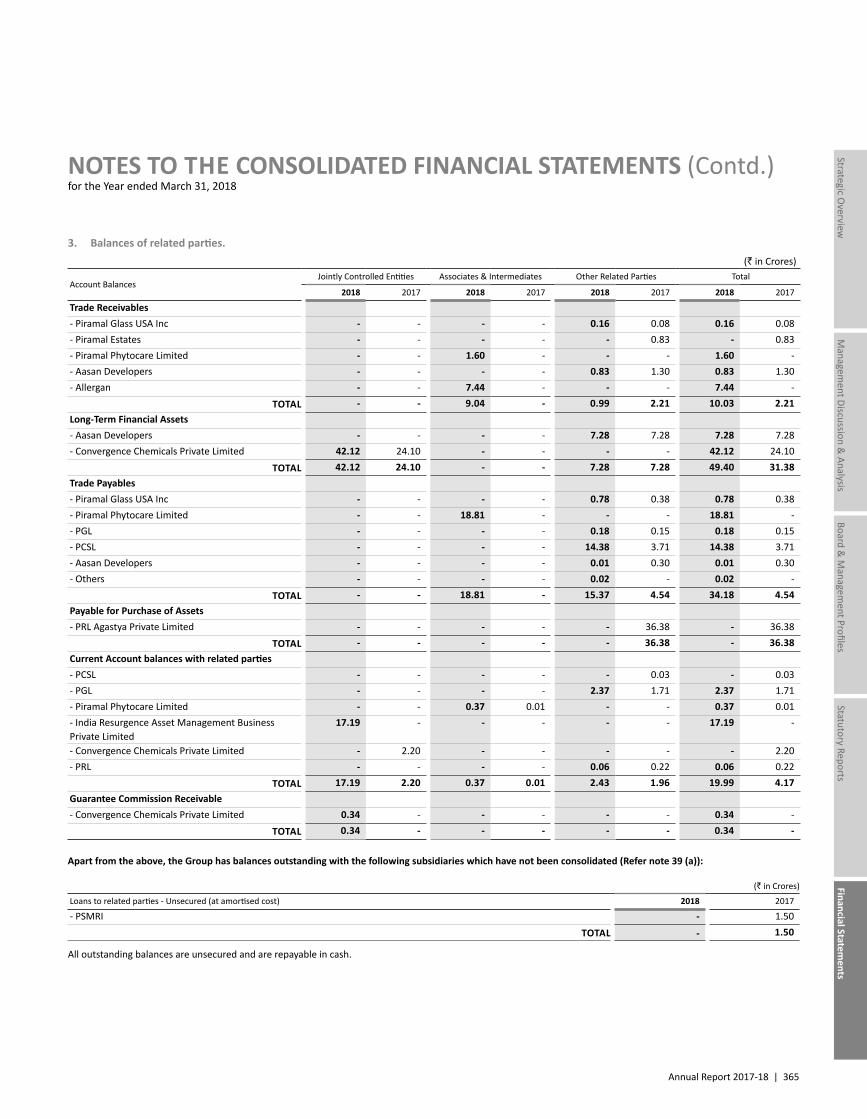
Annual Report 2017-18 | 365
Managem
ent Discussion & Analysis
Strategic Overview
Board &
Managem
ent ProfilesStatutory Reports
Financial Statements
NOTES TO THE CONSOLIDATED FINANCIAL STATEMENTS (Contd.)for the Year ended March 31, 2018
3. Balances of related parties.(` in Crores)
Account BalancesJointly Controlled Entities Associates & Intermediates Other Related Parties Total
2018 2017 2018 2017 2018 2017 2018 2017
Trade Receivables- Piramal Glass USA Inc - - - - 0.16 0.08 0.16 0.08- Piramal Estates - - - - - 0.83 - 0.83- Piramal Phytocare Limited - - 1.60 - - - 1.60 -- Aasan Developers - - - - 0.83 1.30 0.83 1.30- Allergan - - 7.44 - - - 7.44 -
TOTAL - - 9.04 - 0.99 2.21 10.03 2.21Long-Term Financial Assets- Aasan Developers - - - - 7.28 7.28 7.28 7.28- Convergence Chemicals Private Limited 42.12 24.10 - - - - 42.12 24.10
TOTAL 42.12 24.10 - - 7.28 7.28 49.40 31.38Trade Payables- Piramal Glass USA Inc - - - - 0.78 0.38 0.78 0.38- Piramal Phytocare Limited - - 18.81 - - - 18.81 -- PGL - - - - 0.18 0.15 0.18 0.15- PCSL - - - - 14.38 3.71 14.38 3.71- Aasan Developers - - - - 0.01 0.30 0.01 0.30- Others - - - - 0.02 - 0.02 -
TOTAL - - 18.81 - 15.37 4.54 34.18 4.54Payable for Purchase of Assets- PRL Agastya Private Limited - - - - - 36.38 - 36.38
TOTAL - - - - - 36.38 - 36.38Current Account balances with related parties- PCSL - - - - - 0.03 - 0.03- PGL - - - - 2.37 1.71 2.37 1.71- Piramal Phytocare Limited - - 0.37 0.01 - - 0.37 0.01- India Resurgence Asset Management Business Private Limited
17.19 - - - - - 17.19 -
- Convergence Chemicals Private Limited - 2.20 - - - - - 2.20- PRL - - - - 0.06 0.22 0.06 0.22
TOTAL 17.19 2.20 0.37 0.01 2.43 1.96 19.99 4.17Guarantee Commission Receivable- Convergence Chemicals Private Limited 0.34 - - - - - 0.34 -
TOTAL 0.34 - - - - - 0.34 -
Apart from the above, the Group has balances outstanding with the following subsidiaries which have not been consolidated (Refer note 39 (a)):
(` in Crores)
Loans to related parties - Unsecured (at amortised cost) 2018 2017
- PSMRI - 1.50TOTAL - 1.50
All outstanding balances are unsecured and are repayable in cash.
366 | Piramal Enterprises Limited
NOTES TO THE CONSOLIDATED FINANCIAL STATEMENTS (Contd.)for the Year ended March 31, 2018
CONSOLIDATED FINANCIAL STATEMENTS
44 Property, Plant & Equipment, Brands and Trademarks, Investment in Non-Convertible Debentures, Inter Corporate Deposits and Other Financial Assets are mortgaged / hypothecated to the extent of ` 26,659.98 Crores (As on March 31, 2017 ` 13,693.18 Crores) as a security against long-term secured borrowings as at March 31, 2018.
Inventories, Trade receivables, Investment in Non Convertible Debentures and Inter Corporate Deposits are hypothecated as a security to the extent of ` 1,367.05 Crores (As on March 31, 2017 ` 231.34 Crores) against short term secured borrowings as at March 31, 2018.
45 The Group's significant operating lease arrangements are mainly in respect of residential / office premises, computers, motor vehicles and vaporizers. The aggregate lease rentals payable on these leasing arrangements are charged as rent under "Other Expenses" in Note 36.
These lease arrangements are for a period ranging from one year to fifteen years and are in most cases renewable by mutual consent, on mutually agreeable terms.
Future minimum lease rentals payable in respect of non-cancellable operating leases have been mentioned below:
(` in Crores)
PayableAs at
March 31, 2018As at
March 31, 2017Not Later than one year 70.30 68.35Later than one year but not later than five years 160.36 180.87Later than five years 65.98 43.80
46. Earnings Per Share (EPS) - EPS is calculated by dividing the profit attributable to the equity shareholders by the weighted average number of equity shares outstanding during the year. The earnings and weighted average numbers of equity shares used in calculating basic and diluted earnings per equity share are as follows:
(` in Crores)
ParticularsFor the year ended
March 31, 2018For the year ended
March 31, 2017
1. Profit attributable to owners of Piramal Enterprises Limited (` in Crores) 5,121.49 1,252.332. Weighted Average Number of Equity Shares used as denominator for calculating Basic EPS (nos.) 181,766,747 173,281,5353. Weighted Average Potential Equity Shares in respect of right issue shares reserved for CCD holders and right shares held in
abeyance (nos.) 54,227 -
4. Total Weighted Average Number of Equity Shares for calculating Diluted EPS (nos.) (2+3) 181,820,974 173,281,535
5. Earnings Per Share – Basic attributable to Equity Shareholders (`) (1/2) 281.76 72.27
6. Earnings Per Share – Diluted attributable to Equity Shareholders (`) (1/4) 281.68 72.27
7. Face value per share (`) 2.00 2.00
Basic and diluted earnings per share for year ended March 31, 2017 have been retrospectively adjusted for effect of Rights Issue. Further, considering the effect of conversion of CCDs into equity shares, the Earnings Per Share (Basic and Diluted) for the year ended March 31, 2018 is not comparable with that of the earlier period.
Annual Report 2017-18 | 367
Managem
ent Discussion & Analysis
Strategic Overview
Board &
Managem
ent ProfilesStatutory Reports
Financial Statements
NOTES TO THE CONSOLIDATED FINANCIAL STATEMENTS (Contd.)for the Year ended March 31, 2018
The following additional information is presented to disclose the effect on profit attributable to owners of Piramal Enterprises Limited, Basic and Diluted EPS, without the effect of deferred tax on merger of subsidiaries (Refer Note 39(a)).
(` in Crores)
ParticularsFor the year ended
March 31, 2018Profit attributable to owners of Piramal Enterprises Limited 5,121.49Less: Adjustment for Deferred tax on merger of subsidiaries 3,569.18
Adjusted Profit attributable to owners of Piramal Enterprises Limited 1,552.31
Basic EPS (of ` 2/- each) for the period (`)As reported above in Sr. No. 5 281.76Less: Adjustment for Deferred tax on merger of subsidiaries 196.36
Adjusted Basic EPS 85.40
Diluted EPS (of ` 2/- each) for the period (`)As reported above in Sr. No. 6 281.68Less: Adjustment for Deferred tax on merger of subsidiaries 196.30
Adjusted Diluted EPS 85.38
47 (a) The Company conducts research and development to find new sustainable chemical routes for pharmaceutical & herbal products. The Company is undertaking development activities for Oral Solids and Sterile Injectables, apart from other Active Pharmaceutical Ingredients.
The Company has research and development centres in Mumbai, Ennore and Ahmedabad.
Details of additions to Property Plant & Equipments & Intangibles under Development and qualifying Revenue Expenditure for Department of Scientific & Industrial Research (DSIR) approved research and development facilities / division of the Company at Mumbai, Ennore and Ahmedabad for the year are as follows:
(` in Crores)
DescriptionFor the year ended
March 31, 2018For the year ended
March 31, 2017Revenue Expenditure* 89.81 43.39
TOTAL 89.81 43.39Capital Expenditure, NetAdditions to Property Plant & Equipments 12.37 7.11Additions to Intangibles under Development 11.68 11.55
TOTAL 24.05 18.66
* The amount included in Note 36, under R & D Expenses (Net) does not include ` 57.40 Crores (Previous Year ` 27.93 Crores) relating to Ahmedabad location.(b) In addition to the above, R & D Expenses (Net) included under Note 36 "Other Expenses" also includes expenditure incurred by the Group.
48 The Consolidated results for the year ended March 31, 2018 includes the results for Piramal Critical Care Italia S.P.A, Piramal Holdings (Suisse) SA, Piramal Technologies SA, Piramal Critical Care Deutschland GmbH, Piramal Healthcare Canada Limited, Piramal Critical Care South Africa (Pty.) Ltd. Piramal Dutch Holdings N.V., Ash Stevens LLC, and PEL Pharma Inc. based on audited accounts upto their respective financial year ending December 31, 2017 and management estimates prepared by respective Company's Management for the interim period ending March 31, 2018. The results of Bluebird Aero Systems Limited, Piramal Pharma Solutions Inc and Piramal Healthcare Pension Trustees Limited are based on management estimates for the year ended March 31, 2018 as audited results were unavailable. The percentage of combined Revenues from operations for the year ended March 31, 2018 for all the above companies to the Consolidated Revenue is 4.74%. The percentage of combined profit/(loss) for the year ended March 31, 2018 for all the above companies to the Consolidated Profit and Loss is (0.58)%.
368 | Piramal Enterprises Limited
NOTES TO THE CONSOLIDATED FINANCIAL STATEMENTS (Contd.)for the Year ended March 31, 2018
CONSOLIDATED FINANCIAL STATEMENTS
49 CAPITAL MANAGEMENT The Group manages its capital to ensure that it will be able to continue as going concern while maximising the return to stakeholders through the
optimisation of the debt and equity balance. The capital structure of the Group consists of net debt (borrowings as detailed in notes 18, 23 and 24 offset by cash and bank balances) and total equity of the Group.
The Group determines the amount of capital required on the basis of annual as well as long-term operating plans and other strategic investment plans. The funding requirements are met through non convertible debt securities or other long-term /short-term borrowings. The Group monitors the capital structure on the basis of total debt to equity ratio and maturity profile of the overall debt portfolio of the Group.
The capital components of the Group are as given below:
(` in Crores) As at
March 31, 2018As at
March 31, 2017Equity 26,457.39 14,895.78
Total Equity 26,457.39 14,895.78Borrowings – Non-Current 24,220.61 14,495.69Borrowings – Current 14,665.88 12,079.48Current Maturities of Long-term Debt 5,274.31 3,875.81
Total Debt 44,160.80 30,450.98Cash & Cash equivalents (2,397.43) (1,490.44)
Net Debt 41,763.37 28,960.54
Debt/Equity Ratio 1.58 1.94
The terms of the Secured and unsecured loans and borrowings contain certain financial covenants primarily requiring the Company and it's subsidiaries to maintain certain financial ratios like Total Debt to Total Net Worth, Interest Coverage Ratio, Fixed Asset Cover ratio, Minimum net worth conditions, etc. The Company and it's subsidiaries are broadly in compliance with the said covenants and banks have generally waived / condoned such covenants.
50 RISK MANAGEMENT The Group’s activities expose it to market risk, liquidity risk and credit risk.
The Group has an independent and dedicated Enterprise Risk Management (ERM) system to identify, manage and mitigate business risks.
Board has approved the Asset Liability Management Policy and the formation of Asset Liability Management Committee (ALCO). The ALCO includes the Group’s senior management and an external industry expert. It defines the strategy for managing liquidity and interest rate risks in the business.
Annual Report 2017-18 | 369
Managem
ent Discussion & Analysis
Strategic Overview
Board &
Managem
ent ProfilesStatutory Reports
Financial Statements
NOTES TO THE CONSOLIDATED FINANCIAL STATEMENTS (Contd.)for the Year ended March 31, 2018
This note explains the sources of risk which the group is exposed to and how the group manages the risk and the impact of hedge accounting in the financial statements.
Risk Exposure arising from Management
Liquidity risk Borrowings and other liabilities ALCO deliberates on the static liquidity gap statement, future asset growth plans, tenor of assets, market liquidity and pricing of various sources of funds. It decides on the optimal funding mix taking into consideration the asset strategy and a focus on diversifying sources of funds.
Market risk – Interest rate Long-term borrowings at variable rates ALCO reviews the interest rate gap statement and the mix of floating and fixed rate assets and liabilities. The Risk Management Group has also initiated a scenario analysis to assess the short-term impact of interest rates on net interest income (NII).
Market risk – Securities price risks Equity Investment The Group continue to effectively evaluate various risks involved in underlying assets, before and after making any such strategic investments.
Market risk – Foreign exchange Transactions denominated in foreign currency
The centralised treasury function aggregates the foreign exchange exposure and takes measures to hedge the exposure based on prevalent macroeconomic conditions.
Credit risk Cash and cash equivalents, trade receivables, derivative financial instruments, financial assets measured at amortised cost.
Diversification of bank deposits, credit limits and letters of creditEach investment in financial services is assessed by the investment team as well as independent risk team on the risk-return framework. The combined analysis of these teams is presented to the Investment Committee for investment decision. The risk is being partly mitigated by setting up a concentration risk framework, which incentivises business units to diversify portfolio across counterparties, sectors and geographies.
a) Liquidity Risk Management Liquidity Risk refers to insufficiency of funds to meet the financial obligations. Liquidity Risk Management implies maintenance of sufficient cash and
marketable securities and the availability of funding through an adequate amount of committed credit lines to meet obligations when due.
The Group has formulated an Asset Liability Management Policy. The Asset Liability Management Committee (ALCO) is responsible for the management of the Group's short-term, medium-term and long-term funding and liquidity management requirements. The Group manages liquidity risk by maintaining adequate reserves, banking facilities and by continuously monitoring forecast and actual cash flows, and by assessing the maturity profiles of financial assets and liabilities. The Group has access to undrawn borrowing facilities at the end of each reporting period, as detailed below:
The Group has the following undrawn credit lines available as at the end of the reporting period.
(` in Crores)
ParticularsAs at
March 31, 2018As at
March 31, 2017- Expiring within one year 17,953.80 20,699.28- Expiring beyond one year - -
17,953.80 20,699.28
Note: This includes Non-Convertible Debentures and Commercial Papers where only credit rating has been obtained and which can be issued, if required, within a short period of time. Further, the facilities related to Commercial Papers are generally rolled over.
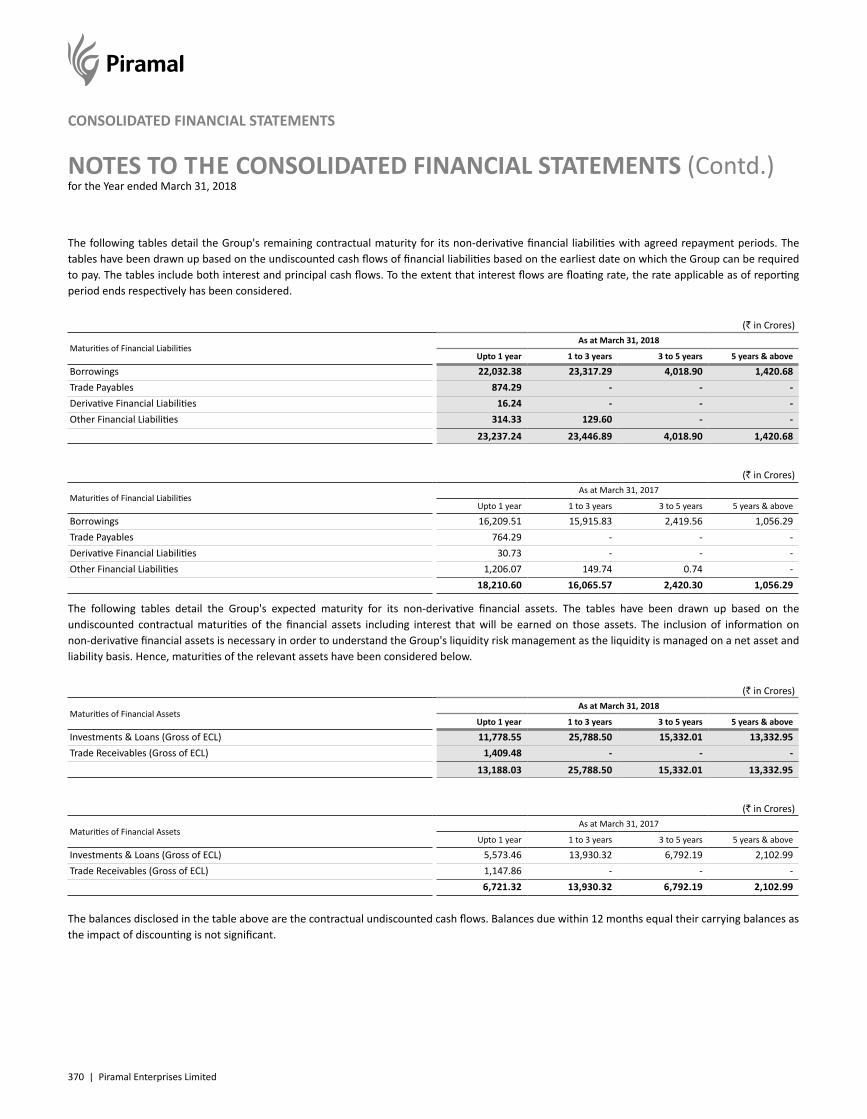
370 | Piramal Enterprises Limited
NOTES TO THE CONSOLIDATED FINANCIAL STATEMENTS (Contd.)for the Year ended March 31, 2018
CONSOLIDATED FINANCIAL STATEMENTS
The following tables detail the Group's remaining contractual maturity for its non-derivative financial liabilities with agreed repayment periods. The tables have been drawn up based on the undiscounted cash flows of financial liabilities based on the earliest date on which the Group can be required to pay. The tables include both interest and principal cash flows. To the extent that interest flows are floating rate, the rate applicable as of reporting period ends respectively has been considered.
(` in Crores)
Maturities of Financial Liabilities As at March 31, 2018
Upto 1 year 1 to 3 years 3 to 5 years 5 years & above
Borrowings 22,032.38 23,317.29 4,018.90 1,420.68Trade Payables 874.29 - - -Derivative Financial Liabilities 16.24 - - -Other Financial Liabilities 314.33 129.60 - -
23,237.24 23,446.89 4,018.90 1,420.68
(` in Crores)
Maturities of Financial Liabilities As at March 31, 2017
Upto 1 year 1 to 3 years 3 to 5 years 5 years & above
Borrowings 16,209.51 15,915.83 2,419.56 1,056.29Trade Payables 764.29 - - -Derivative Financial Liabilities 30.73 - - -Other Financial Liabilities 1,206.07 149.74 0.74 -
18,210.60 16,065.57 2,420.30 1,056.29
The following tables detail the Group's expected maturity for its non-derivative financial assets. The tables have been drawn up based on the undiscounted contractual maturities of the financial assets including interest that will be earned on those assets. The inclusion of information on non-derivative financial assets is necessary in order to understand the Group's liquidity risk management as the liquidity is managed on a net asset and liability basis. Hence, maturities of the relevant assets have been considered below.
(` in Crores)
Maturities of Financial Assets As at March 31, 2018
Upto 1 year 1 to 3 years 3 to 5 years 5 years & above
Investments & Loans (Gross of ECL) 11,778.55 25,788.50 15,332.01 13,332.95Trade Receivables (Gross of ECL) 1,409.48 - - -
13,188.03 25,788.50 15,332.01 13,332.95
(` in Crores)
Maturities of Financial Assets As at March 31, 2017
Upto 1 year 1 to 3 years 3 to 5 years 5 years & above
Investments & Loans (Gross of ECL) 5,573.46 13,930.32 6,792.19 2,102.99Trade Receivables (Gross of ECL) 1,147.86 - - -
6,721.32 13,930.32 6,792.19 2,102.99
The balances disclosed in the table above are the contractual undiscounted cash flows. Balances due within 12 months equal their carrying balances as the impact of discounting is not significant.
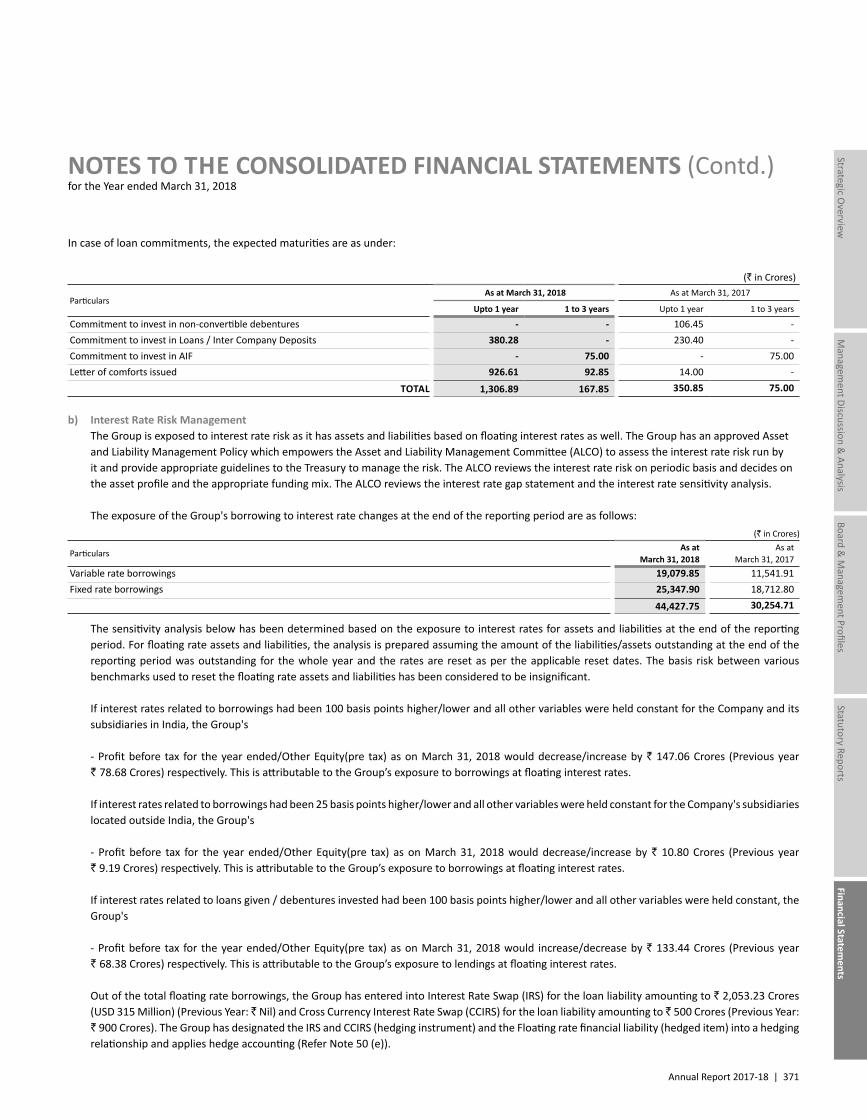
Annual Report 2017-18 | 371
Managem
ent Discussion & Analysis
Strategic Overview
Board &
Managem
ent ProfilesStatutory Reports
Financial Statements
NOTES TO THE CONSOLIDATED FINANCIAL STATEMENTS (Contd.)for the Year ended March 31, 2018
In case of loan commitments, the expected maturities are as under:
(` in Crores)
Particulars As at March 31, 2018 As at March 31, 2017
Upto 1 year 1 to 3 years Upto 1 year 1 to 3 years
Commitment to invest in non-convertible debentures - - 106.45 -Commitment to invest in Loans / Inter Company Deposits 380.28 - 230.40 -Commitment to invest in AIF - 75.00 - 75.00Letter of comforts issued 926.61 92.85 14.00 -
TOTAL 1,306.89 167.85 350.85 75.00
b) Interest Rate Risk Management The Group is exposed to interest rate risk as it has assets and liabilities based on floating interest rates as well. The Group has an approved Asset
and Liability Management Policy which empowers the Asset and Liability Management Committee (ALCO) to assess the interest rate risk run by it and provide appropriate guidelines to the Treasury to manage the risk. The ALCO reviews the interest rate risk on periodic basis and decides on the asset profile and the appropriate funding mix. The ALCO reviews the interest rate gap statement and the interest rate sensitivity analysis.
The exposure of the Group's borrowing to interest rate changes at the end of the reporting period are as follows: (` in Crores)
ParticularsAs at
March 31, 2018As at
March 31, 2017Variable rate borrowings 19,079.85 11,541.91Fixed rate borrowings 25,347.90 18,712.80
44,427.75 30,254.71
The sensitivity analysis below has been determined based on the exposure to interest rates for assets and liabilities at the end of the reporting period. For floating rate assets and liabilities, the analysis is prepared assuming the amount of the liabilities/assets outstanding at the end of the reporting period was outstanding for the whole year and the rates are reset as per the applicable reset dates. The basis risk between various benchmarks used to reset the floating rate assets and liabilities has been considered to be insignificant.
If interest rates related to borrowings had been 100 basis points higher/lower and all other variables were held constant for the Company and its subsidiaries in India, the Group's
- Profit before tax for the year ended/Other Equity(pre tax) as on March 31, 2018 would decrease/increase by ` 147.06 Crores (Previous year ` 78.68 Crores) respectively. This is attributable to the Group’s exposure to borrowings at floating interest rates.
If interest rates related to borrowings had been 25 basis points higher/lower and all other variables were held constant for the Company's subsidiaries located outside India, the Group's
- Profit before tax for the year ended/Other Equity(pre tax) as on March 31, 2018 would decrease/increase by ` 10.80 Crores (Previous year ` 9.19 Crores) respectively. This is attributable to the Group’s exposure to borrowings at floating interest rates.
If interest rates related to loans given / debentures invested had been 100 basis points higher/lower and all other variables were held constant, the Group's
- Profit before tax for the year ended/Other Equity(pre tax) as on March 31, 2018 would increase/decrease by ` 133.44 Crores (Previous year ` 68.38 Crores) respectively. This is attributable to the Group’s exposure to lendings at floating interest rates.
Out of the total floating rate borrowings, the Group has entered into Interest Rate Swap (IRS) for the loan liability amounting to ` 2,053.23 Crores (USD 315 Million) (Previous Year: ̀ Nil) and Cross Currency Interest Rate Swap (CCIRS) for the loan liability amounting to ̀ 500 Crores (Previous Year: ` 900 Crores). The Group has designated the IRS and CCIRS (hedging instrument) and the Floating rate financial liability (hedged item) into a hedging relationship and applies hedge accounting (Refer Note 50 (e)).
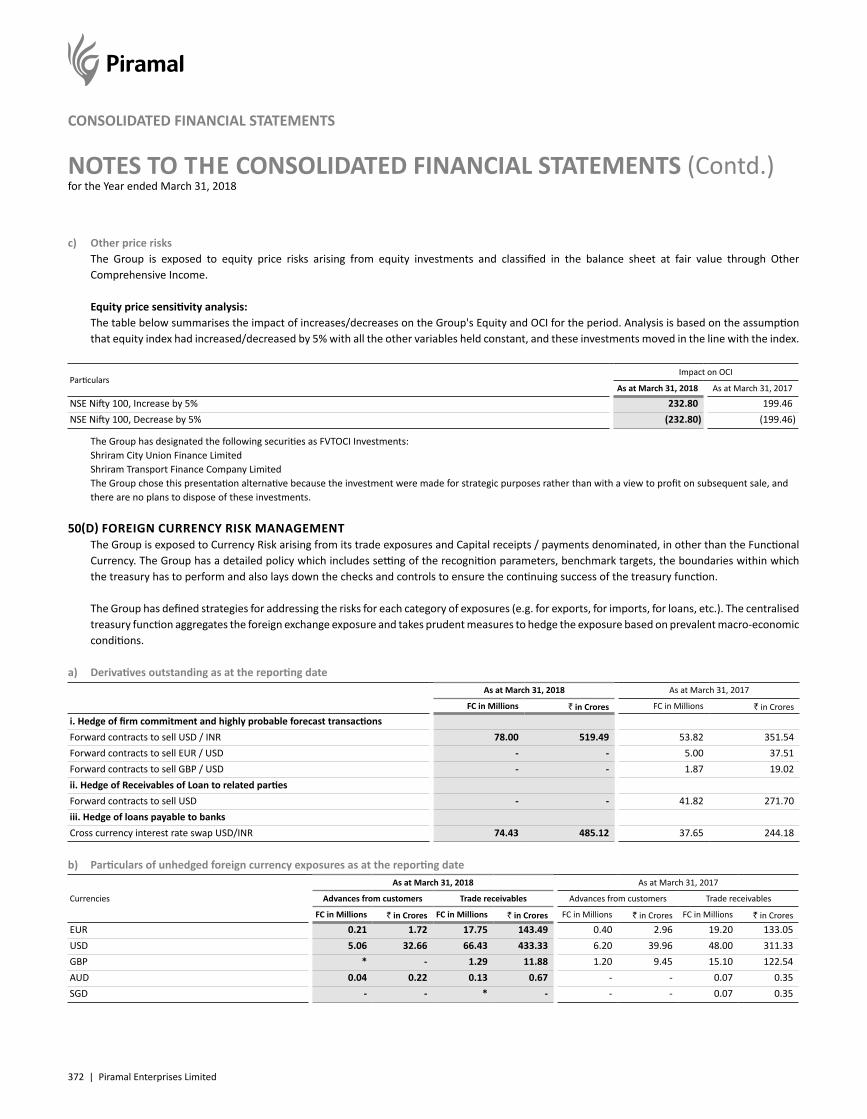
372 | Piramal Enterprises Limited
NOTES TO THE CONSOLIDATED FINANCIAL STATEMENTS (Contd.)for the Year ended March 31, 2018
CONSOLIDATED FINANCIAL STATEMENTS
c) Other price risks The Group is exposed to equity price risks arising from equity investments and classified in the balance sheet at fair value through Other
Comprehensive Income.
Equity price sensitivity analysis: The table below summarises the impact of increases/decreases on the Group's Equity and OCI for the period. Analysis is based on the assumption
that equity index had increased/decreased by 5% with all the other variables held constant, and these investments moved in the line with the index.
ParticularsImpact on OCI
As at March 31, 2018 As at March 31, 2017
NSE Nifty 100, Increase by 5% 232.80 199.46NSE Nifty 100, Decrease by 5% (232.80) (199.46)
The Group has designated the following securities as FVTOCI Investments: Shriram City Union Finance Limited Shriram Transport Finance Company Limited The Group chose this presentation alternative because the investment were made for strategic purposes rather than with a view to profit on subsequent sale, and
there are no plans to dispose of these investments.
50(D) FOREIGN CURRENCY RISK MANAGEMENT The Group is exposed to Currency Risk arising from its trade exposures and Capital receipts / payments denominated, in other than the Functional
Currency. The Group has a detailed policy which includes setting of the recognition parameters, benchmark targets, the boundaries within which the treasury has to perform and also lays down the checks and controls to ensure the continuing success of the treasury function.
The Group has defined strategies for addressing the risks for each category of exposures (e.g. for exports, for imports, for loans, etc.). The centralised treasury function aggregates the foreign exchange exposure and takes prudent measures to hedge the exposure based on prevalent macro-economic conditions.
a) Derivatives outstanding as at the reporting dateAs at March 31, 2018 As at March 31, 2017
FC in Millions ` in Crores FC in Millions ` in Croresi. Hedge of firm commitment and highly probable forecast transactionsForward contracts to sell USD / INR 78.00 519.49 53.82 351.54Forward contracts to sell EUR / USD - - 5.00 37.51Forward contracts to sell GBP / USD - - 1.87 19.02ii. Hedge of Receivables of Loan to related partiesForward contracts to sell USD - - 41.82 271.70iii. Hedge of loans payable to banksCross currency interest rate swap USD/INR 74.43 485.12 37.65 244.18
b) Particulars of unhedged foreign currency exposures as at the reporting date
Currencies
As at March 31, 2018 As at March 31, 2017
Advances from customers Trade receivables Advances from customers Trade receivables
FC in Millions ` in Crores FC in Millions ` in Crores FC in Millions ` in Crores FC in Millions ` in CroresEUR 0.21 1.72 17.75 143.49 0.40 2.96 19.20 133.05USD 5.06 32.66 66.43 433.33 6.20 39.96 48.00 311.33GBP * - 1.29 11.88 1.20 9.45 15.10 122.54AUD 0.04 0.22 0.13 0.67 - - 0.07 0.35SGD - - * - - - 0.07 0.35
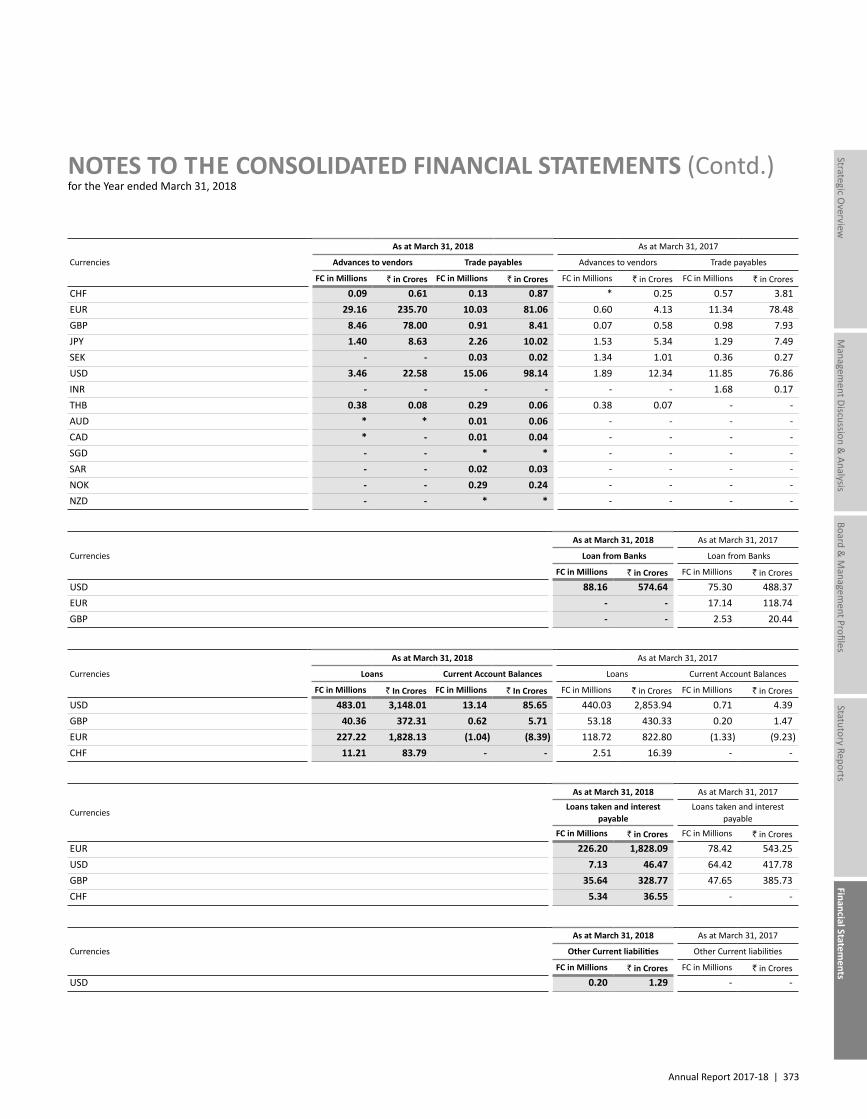
Annual Report 2017-18 | 373
Managem
ent Discussion & Analysis
Strategic Overview
Board &
Managem
ent ProfilesStatutory Reports
Financial Statements
NOTES TO THE CONSOLIDATED FINANCIAL STATEMENTS (Contd.)for the Year ended March 31, 2018
Currencies
As at March 31, 2018 As at March 31, 2017
Advances to vendors Trade payables Advances to vendors Trade payables
FC in Millions ` in Crores FC in Millions ` in Crores FC in Millions ` in Crores FC in Millions ` in CroresCHF 0.09 0.61 0.13 0.87 * 0.25 0.57 3.81EUR 29.16 235.70 10.03 81.06 0.60 4.13 11.34 78.48GBP 8.46 78.00 0.91 8.41 0.07 0.58 0.98 7.93JPY 1.40 8.63 2.26 10.02 1.53 5.34 1.29 7.49SEK - - 0.03 0.02 1.34 1.01 0.36 0.27USD 3.46 22.58 15.06 98.14 1.89 12.34 11.85 76.86INR - - - - - - 1.68 0.17THB 0.38 0.08 0.29 0.06 0.38 0.07 - -AUD * * 0.01 0.06 - - - -CAD * - 0.01 0.04 - - - -SGD - - * * - - - -SAR - - 0.02 0.03 - - - -NOK - - 0.29 0.24 - - - -NZD - - * * - - - -
Currencies
As at March 31, 2018 As at March 31, 2017
Loan from Banks Loan from Banks
FC in Millions ` in Crores FC in Millions ` in CroresUSD 88.16 574.64 75.30 488.37EUR - - 17.14 118.74GBP - - 2.53 20.44
Currencies
As at March 31, 2018 As at March 31, 2017
Loans Current Account Balances Loans Current Account Balances
FC in Millions ` In Crores FC in Millions ` In Crores FC in Millions ` in Crores FC in Millions ` in CroresUSD 483.01 3,148.01 13.14 85.65 440.03 2,853.94 0.71 4.39GBP 40.36 372.31 0.62 5.71 53.18 430.33 0.20 1.47EUR 227.22 1,828.13 (1.04) (8.39) 118.72 822.80 (1.33) (9.23)CHF 11.21 83.79 - - 2.51 16.39 - -
Currencies
As at March 31, 2018 As at March 31, 2017Loans taken and interest
payableLoans taken and interest
payableFC in Millions ` in Crores FC in Millions ` in Crores
EUR 226.20 1,828.09 78.42 543.25USD 7.13 46.47 64.42 417.78GBP 35.64 328.77 47.65 385.73CHF 5.34 36.55 - -
Currencies
As at March 31, 2018 As at March 31, 2017
Other Current liabilities Other Current liabilities
FC in Millions ` in Crores FC in Millions ` in CroresUSD 0.20 1.29 - -
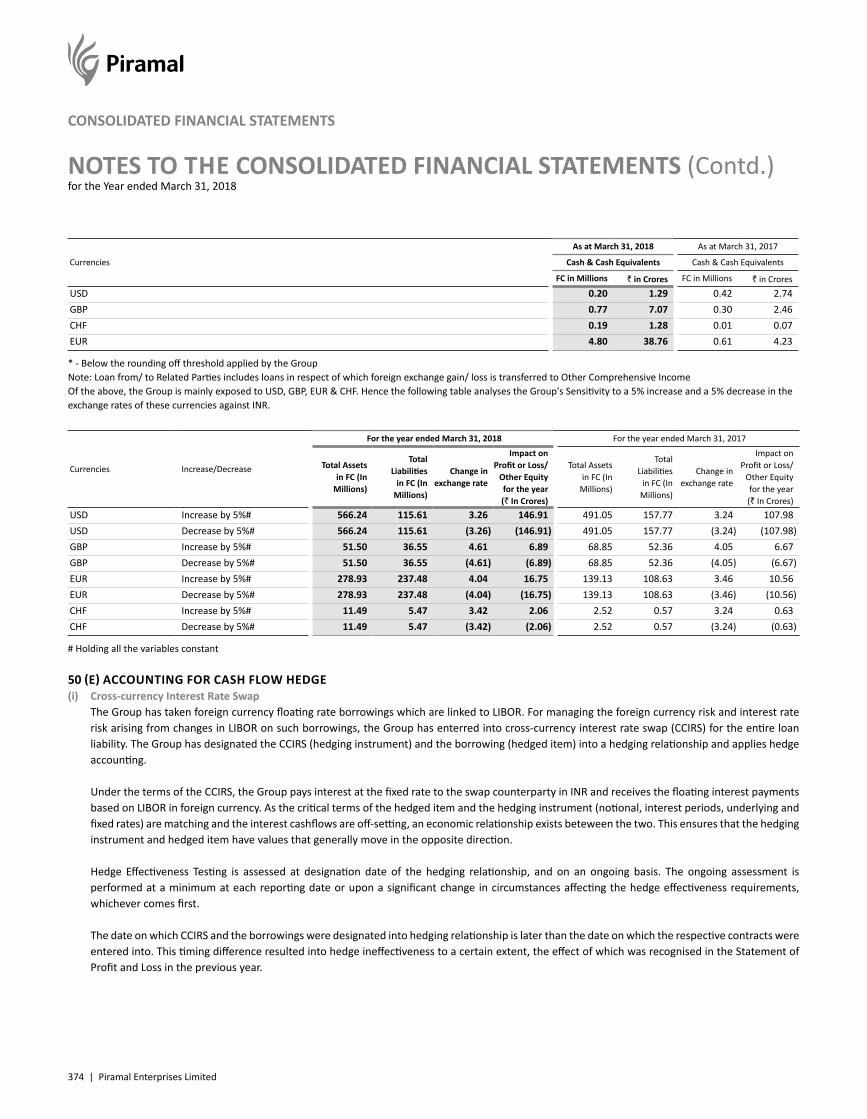
374 | Piramal Enterprises Limited
NOTES TO THE CONSOLIDATED FINANCIAL STATEMENTS (Contd.)for the Year ended March 31, 2018
CONSOLIDATED FINANCIAL STATEMENTS
Currencies
As at March 31, 2018 As at March 31, 2017
Cash & Cash Equivalents Cash & Cash Equivalents
FC in Millions ` in Crores FC in Millions ` in CroresUSD 0.20 1.29 0.42 2.74GBP 0.77 7.07 0.30 2.46CHF 0.19 1.28 0.01 0.07EUR 4.80 38.76 0.61 4.23
* - Below the rounding off threshold applied by the GroupNote: Loan from/ to Related Parties includes loans in respect of which foreign exchange gain/ loss is transferred to Other Comprehensive IncomeOf the above, the Group is mainly exposed to USD, GBP, EUR & CHF. Hence the following table analyses the Group's Sensitivity to a 5% increase and a 5% decrease in the exchange rates of these currencies against INR.
Currencies Increase/Decrease
For the year ended March 31, 2018 For the year ended March 31, 2017
Total Assets in FC (In
Millions)
Total Liabilities
in FC (In Millions)
Change in exchange rate
Impact on Profit or Loss/
Other Equity for the year (` In Crores)
Total Assets in FC (In
Millions)
Total Liabilities
in FC (In Millions)
Change in exchange rate
Impact on Profit or Loss/
Other Equity for the year (` In Crores)
USD Increase by 5%# 566.24 115.61 3.26 146.91 491.05 157.77 3.24 107.98USD Decrease by 5%# 566.24 115.61 (3.26) (146.91) 491.05 157.77 (3.24) (107.98)GBP Increase by 5%# 51.50 36.55 4.61 6.89 68.85 52.36 4.05 6.67GBP Decrease by 5%# 51.50 36.55 (4.61) (6.89) 68.85 52.36 (4.05) (6.67)EUR Increase by 5%# 278.93 237.48 4.04 16.75 139.13 108.63 3.46 10.56EUR Decrease by 5%# 278.93 237.48 (4.04) (16.75) 139.13 108.63 (3.46) (10.56)CHF Increase by 5%# 11.49 5.47 3.42 2.06 2.52 0.57 3.24 0.63CHF Decrease by 5%# 11.49 5.47 (3.42) (2.06) 2.52 0.57 (3.24) (0.63)
# Holding all the variables constant
50 (E) ACCOUNTING FOR CASH FLOW HEDGE(i) Cross-currency Interest Rate Swap The Group has taken foreign currency floating rate borrowings which are linked to LIBOR. For managing the foreign currency risk and interest rate
risk arising from changes in LIBOR on such borrowings, the Group has enterred into cross-currency interest rate swap (CCIRS) for the entire loan liability. The Group has designated the CCIRS (hedging instrument) and the borrowing (hedged item) into a hedging relationship and applies hedge accounting.
Under the terms of the CCIRS, the Group pays interest at the fixed rate to the swap counterparty in INR and receives the floating interest payments based on LIBOR in foreign currency. As the critical terms of the hedged item and the hedging instrument (notional, interest periods, underlying and fixed rates) are matching and the interest cashflows are off-setting, an economic relationship exists beteween the two. This ensures that the hedging instrument and hedged item have values that generally move in the opposite direction.
Hedge Effectiveness Testing is assessed at designation date of the hedging relationship, and on an ongoing basis. The ongoing assessment is performed at a minimum at each reporting date or upon a significant change in circumstances affecting the hedge effectiveness requirements, whichever comes first.
The date on which CCIRS and the borrowings were designated into hedging relationship is later than the date on which the respective contracts were entered into. This timing difference resulted into hedge ineffectiveness to a certain extent, the effect of which was recognised in the Statement of Profit and Loss in the previous year.
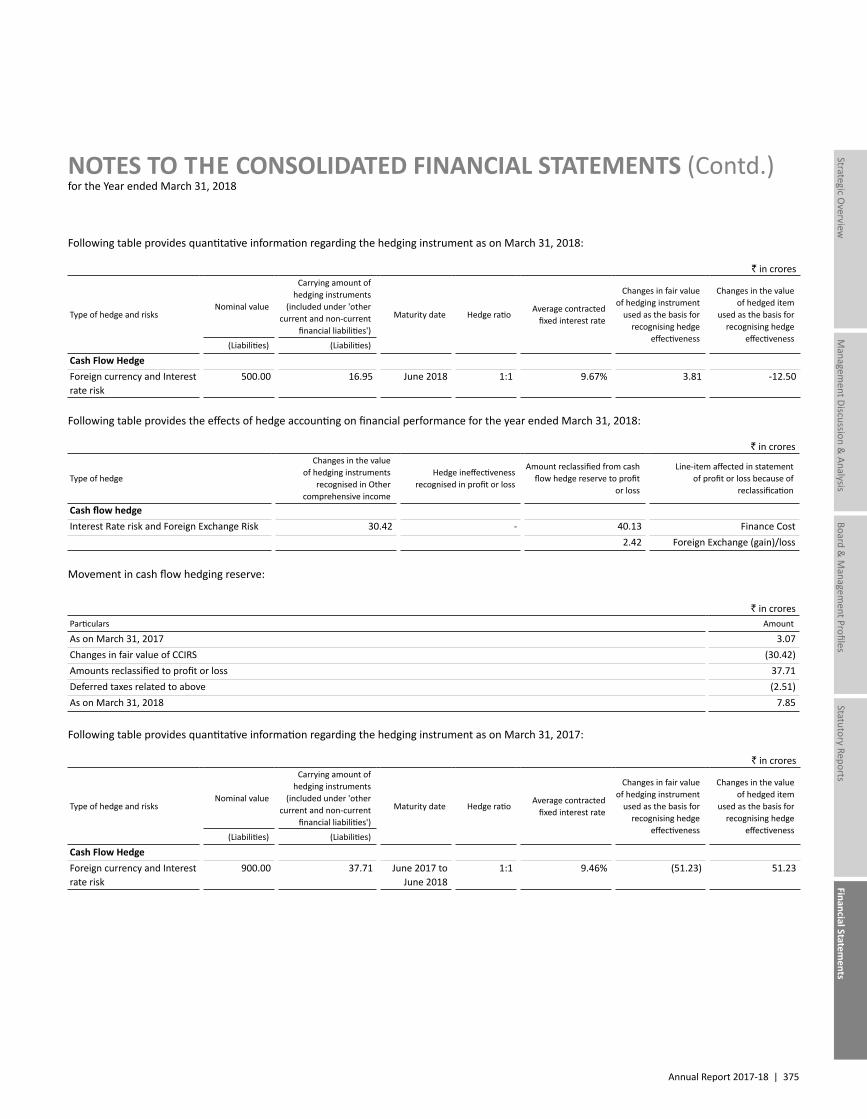
Annual Report 2017-18 | 375
Managem
ent Discussion & Analysis
Strategic Overview
Board &
Managem
ent ProfilesStatutory Reports
Financial Statements
NOTES TO THE CONSOLIDATED FINANCIAL STATEMENTS (Contd.)for the Year ended March 31, 2018
Following table provides quantitative information regarding the hedging instrument as on March 31, 2018:
` in crores
Type of hedge and risksNominal value
Carrying amount of hedging instruments
(included under 'other current and non-current
financial liabilities')
Maturity date Hedge ratioAverage contracted
fixed interest rate
Changes in fair value of hedging instrument
used as the basis for recognising hedge
effectiveness
Changes in the value of hedged item
used as the basis for recognising hedge
effectiveness(Liabilities) (Liabilities)
Cash Flow HedgeForeign currency and Interest rate risk
500.00 16.95 June 2018 1:1 9.67% 3.81 -12.50
Following table provides the effects of hedge accounting on financial performance for the year ended March 31, 2018:
` in crores
Type of hedge
Changes in the value of hedging instruments
recognised in Other comprehensive income
Hedge ineffectiveness recognised in profit or loss
Amount reclassified from cash flow hedge reserve to profit
or loss
Line-item affected in statement of profit or loss because of
reclassification
Cash flow hedgeInterest Rate risk and Foreign Exchange Risk 30.42 - 40.13 Finance Cost
2.42 Foreign Exchange (gain)/loss
Movement in cash flow hedging reserve:
` in croresParticulars Amount
As on March 31, 2017 3.07Changes in fair value of CCIRS (30.42)Amounts reclassified to profit or loss 37.71Deferred taxes related to above (2.51)As on March 31, 2018 7.85
Following table provides quantitative information regarding the hedging instrument as on March 31, 2017:
` in crores
Type of hedge and risksNominal value
Carrying amount of hedging instruments
(included under 'other current and non-current
financial liabilities')
Maturity date Hedge ratioAverage contracted
fixed interest rate
Changes in fair value of hedging instrument
used as the basis for recognising hedge
effectiveness
Changes in the value of hedged item
used as the basis for recognising hedge
effectiveness(Liabilities) (Liabilities)
Cash Flow HedgeForeign currency and Interest rate risk
900.00 37.71 June 2017 to June 2018
1:1 9.46% (51.23) 51.23
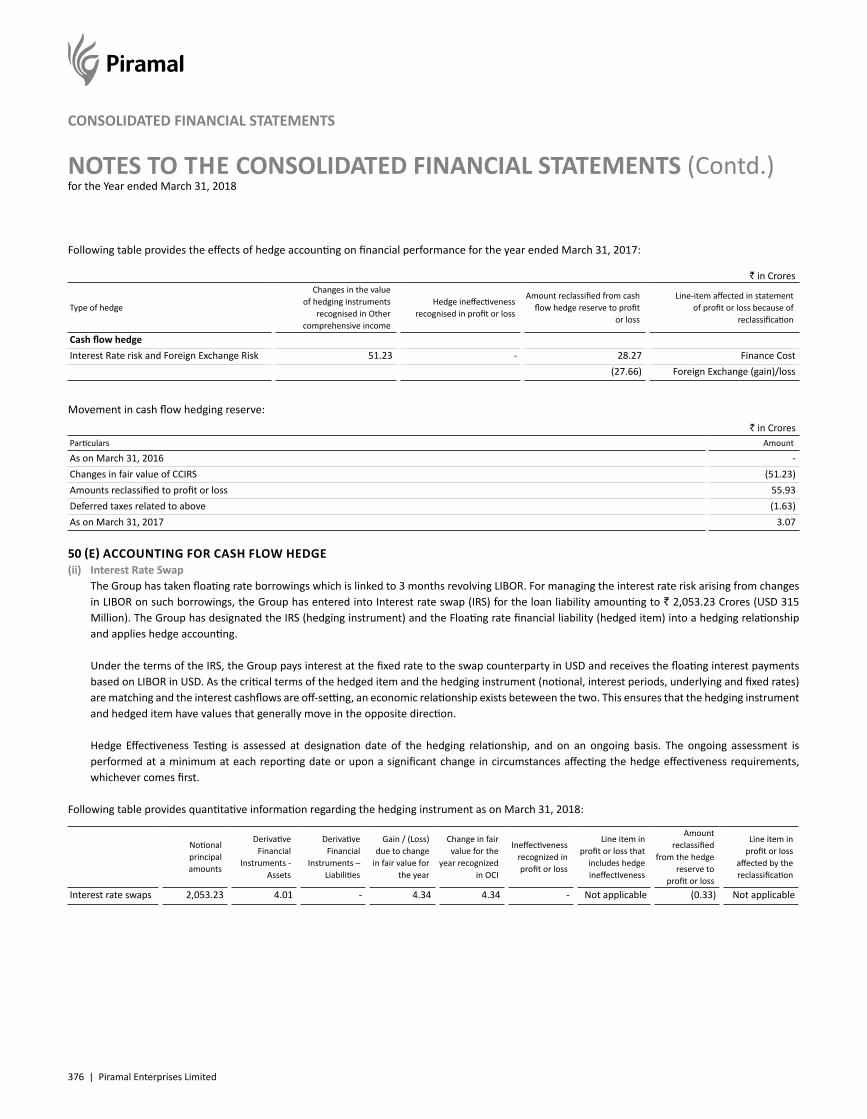
376 | Piramal Enterprises Limited
NOTES TO THE CONSOLIDATED FINANCIAL STATEMENTS (Contd.)for the Year ended March 31, 2018
CONSOLIDATED FINANCIAL STATEMENTS
Following table provides the effects of hedge accounting on financial performance for the year ended March 31, 2017:
` in Crores
Type of hedge
Changes in the value of hedging instruments
recognised in Other comprehensive income
Hedge ineffectiveness recognised in profit or loss
Amount reclassified from cash flow hedge reserve to profit
or loss
Line-item affected in statement of profit or loss because of
reclassification
Cash flow hedgeInterest Rate risk and Foreign Exchange Risk 51.23 - 28.27 Finance Cost
(27.66) Foreign Exchange (gain)/loss
Movement in cash flow hedging reserve:` in Crores
Particulars Amount
As on March 31, 2016 -Changes in fair value of CCIRS (51.23)Amounts reclassified to profit or loss 55.93Deferred taxes related to above (1.63)As on March 31, 2017 3.07
50 (E) ACCOUNTING FOR CASH FLOW HEDGE(ii) Interest Rate Swap The Group has taken floating rate borrowings which is linked to 3 months revolving LIBOR. For managing the interest rate risk arising from changes
in LIBOR on such borrowings, the Group has entered into Interest rate swap (IRS) for the loan liability amounting to ` 2,053.23 Crores (USD 315 Million). The Group has designated the IRS (hedging instrument) and the Floating rate financial liability (hedged item) into a hedging relationship and applies hedge accounting.
Under the terms of the IRS, the Group pays interest at the fixed rate to the swap counterparty in USD and receives the floating interest payments based on LIBOR in USD. As the critical terms of the hedged item and the hedging instrument (notional, interest periods, underlying and fixed rates) are matching and the interest cashflows are off-setting, an economic relationship exists beteween the two. This ensures that the hedging instrument and hedged item have values that generally move in the opposite direction.
Hedge Effectiveness Testing is assessed at designation date of the hedging relationship, and on an ongoing basis. The ongoing assessment is performed at a minimum at each reporting date or upon a significant change in circumstances affecting the hedge effectiveness requirements, whichever comes first.
Following table provides quantitative information regarding the hedging instrument as on March 31, 2018:
Notional principal amounts
Derivative Financial
Instruments - Assets
Derivative Financial
Instruments – Liabilities
Gain / (Loss) due to change
in fair value for the year
Change in fair value for the
year recognized in OCI
Ineffectiveness recognized in profit or loss
Line item in profit or loss that
includes hedge ineffectiveness
Amount reclassified
from the hedge reserve to
profit or loss
Line item in profit or loss
affected by the reclassification
Interest rate swaps 2,053.23 4.01 - 4.34 4.34 - Not applicable (0.33) Not applicable
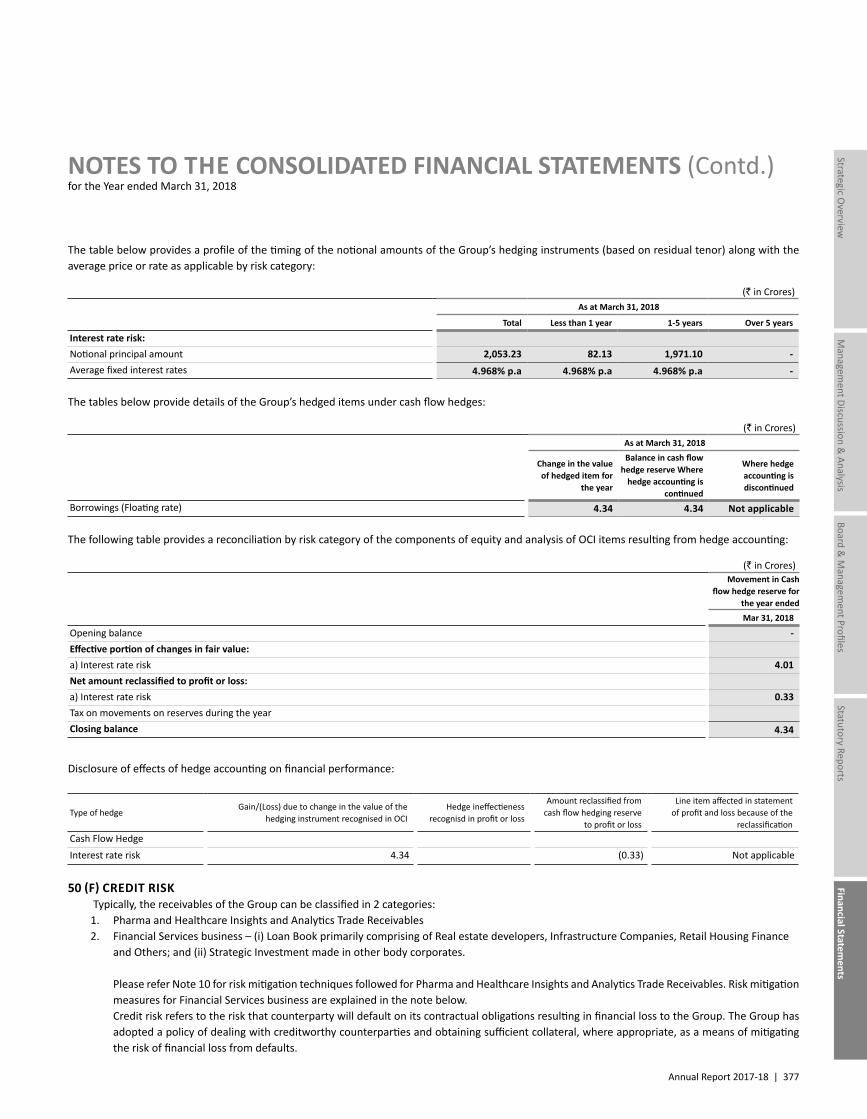
Annual Report 2017-18 | 377
Managem
ent Discussion & Analysis
Strategic Overview
Board &
Managem
ent ProfilesStatutory Reports
Financial Statements
NOTES TO THE CONSOLIDATED FINANCIAL STATEMENTS (Contd.)for the Year ended March 31, 2018
The table below provides a profile of the timing of the notional amounts of the Group’s hedging instruments (based on residual tenor) along with the average price or rate as applicable by risk category:
(` in Crores) As at March 31, 2018
Total Less than 1 year 1-5 years Over 5 years
Interest rate risk:Notional principal amount 2,053.23 82.13 1,971.10 -Average fixed interest rates 4.968% p.a 4.968% p.a 4.968% p.a -
The tables below provide details of the Group’s hedged items under cash flow hedges:
(` in Crores) As at March 31, 2018
Change in the value of hedged item for
the year
Balance in cash flow hedge reserve Where
hedge accounting is continued
Where hedge accounting is discontinued
Borrowings (Floating rate) 4.34 4.34 Not applicable
The following table provides a reconciliation by risk category of the components of equity and analysis of OCI items resulting from hedge accounting:
(` in Crores)Movement in Cash
flow hedge reserve for the year endedMar 31, 2018
Opening balance -Effective portion of changes in fair value:a) Interest rate risk 4.01Net amount reclassified to profit or loss:a) Interest rate risk 0.33Tax on movements on reserves during the yearClosing balance 4.34
Disclosure of effects of hedge accounting on financial performance:
Type of hedgeGain/(Loss) due to change in the value of the
hedging instrument recognised in OCIHedge ineffectieness
recognisd in profit or loss
Amount reclassified from cash flow hedging reserve
to profit or loss
Line item affected in statement of profit and loss because of the
reclassificationCash Flow HedgeInterest rate risk 4.34 (0.33) Not applicable
50 (F) CREDIT RISK Typically, the receivables of the Group can be classified in 2 categories: 1. Pharma and Healthcare Insights and Analytics Trade Receivables 2. Financial Services business – (i) Loan Book primarily comprising of Real estate developers, Infrastructure Companies, Retail Housing Finance
and Others; and (ii) Strategic Investment made in other body corporates.
Please refer Note 10 for risk mitigation techniques followed for Pharma and Healthcare Insights and Analytics Trade Receivables. Risk mitigation measures for Financial Services business are explained in the note below.
Credit risk refers to the risk that counterparty will default on its contractual obligations resulting in financial loss to the Group. The Group has adopted a policy of dealing with creditworthy counterparties and obtaining sufficient collateral, where appropriate, as a means of mitigating the risk of financial loss from defaults.
378 | Piramal Enterprises Limited
NOTES TO THE CONSOLIDATED FINANCIAL STATEMENTS (Contd.)for the Year ended March 31, 2018
CONSOLIDATED FINANCIAL STATEMENTS
Retail lending: For retail lending the credit policy has been reviewed and approved by Risk Team. The Credit Risk management structure includes credit policies and
procedures. The Credit Policy defines customer segments, income assessment criteria, underwriting standards, target market definition, appraisal and approval processes, product limits, Delegation of Authority metrics (DoA) and cover risk assessment for product offerings etc. to ensure consistency of credit buying patterns.
Wholesale lending: For wholesale lending business, the Group's Risk management team has developed proprietary internal rating model to evaluate risk return trade-
off for the loans and investments made by the Group. The output of traditional credit rating model is an estimate of probability of default. These models are different from the traditional credit rating models as they integrate both probability of default and loss given default into a single model.
The lending exposure includes lending to the below sectors
SectorsExposure as at
As at March 31, 2018 As at March 31, 2017
Real Estate 75.87% 87.58%Infrastructure 18.49% 3.59%Retail Housing Finance 2.90% - Others 2.74% 8.83%
Credit Risk Management For retail lending business, credit risk management is achieved by considering various factors like:
• Assessment of borrower’s capability to pay – a detailed assessment of borrower’s capability to pay is conducted. The approach to the assessment is uniform across the entire Group and is spelt out in the Credit Policy. For construction finance deals, the underlying project, the financial capability, past track record of repayments of the promoters are assessed by an independent risk team.
• Security cover – this is an assessment of the value of security under stress scenario which is further adjusted for factors like liquidity, enforceability, transparency in valuation, etc of the collateral.
• Geographic region – the Group monitors loan performances in a particular region to assess if there is any stress due to natural calamities, etc, impacting the performance of loans in a particular geographic region
For wholesale lending business, credit risk management is achieved by considering various factors like: • Cash flow at risk – This is an assessment of the standalone project or business from which interest servicing and principal repayment is expected
to be done.
• Security cover – This is an assessment of the value of the security under stress scenario which is further adjusted for factors like liquidity, enforceability, transparency in valuation etc. of the collateral.
• Promoter strength – This is an assessment of the promoter from financial, management and performance perspective.
• Exit – This is an assessment of the liquidity of the loan or investment.
Annual Report 2017-18 | 379
Managem
ent Discussion & Analysis
Strategic Overview
Board &
Managem
ent ProfilesStatutory Reports
Financial Statements
NOTES TO THE CONSOLIDATED FINANCIAL STATEMENTS (Contd.)for the Year ended March 31, 2018
The output from each of the analysis is converted to a risk weight equivalent. Each of the four components of the risk analysis are assigned a specific weight which differ based on type of investment. The risk weight is then converted into capital requirement. The required capital and the return is combined to create a metric which is used for deal assessment.
Based on the above assessment the risk team categorises the deals in to the below Risk Grades
– Good Deals with very high risk adjusted returns– Investment Grade Deals with high risk adjusted returns– Management Review Grade Deals with risk adjusted returns required as per lending policy– Not Advisable Grade Deals with lower than required risk adjusted returns
Further, a periodic review of the performance of the portfolio is also carried out by the Risk Group. The Risk Group adjusts the stress case considered during the initial approval based on actual performance of the deal, developments in the sector, regulatory changes etc. The deal level output is combined to form a portfolio snapshot. The trends from portfolio are used to provide strategic inputs to the management.
The credit risk on liquid funds and other financial instruments is limited because the counterparties are banks with high credit-ratings assigned by credit-rating agencies or mutual funds.
Provision for Expected Credit Loss The Group considers the probability of default upon initial recognition of asset and whether there has been a significant increase in credit risk on
an ongoing basis throughout each reporting period. To assess whether there is a significant increase in credit risk the Group compares the risk of a default occurring on the asset as at the reporting date with the risk of default as at the date of initial recognition. It considers available reasonable and supportive forward-looking parameters, which are both qualitative and quantitative. These parameters have been detailed in Note no.vii of Significant Accounting Policies. Based on the result yielded by the above assessment the Financial assets are classified into (1) Standard (Performing) Asset, (2) Significant Credit Deteriorated (Under-Performing) Asset (3) Default (Non-Performing) Asset (Credit Impaired).
Macroeconomic information (such as regulatory changes, market interest rate or growth rates) is incorporated as part of the internal rating model.
In general, it is presumed that credit risk has significantly increased since initial recognition if the payments are more than 30 days past due. For the purpose of expected credit loss analysis the Group defines default as any asset with more than 90 days overdues. This is also as per the rebuttable presumption provided by the standard.
The Group provides for expected credit loss based on the following:Category – Description Basis for Recognition of Expected Credit Loss
Stage 1 – Standard (Performing) Assets 12 month ECLStage 2 – Significant Credit Deteriorated Assets Life time ECLStage 3 – Default (Non-Performing) Assets (Credit Impaired) Life time ECL
The Company has developed a PD Matrix consisting of various parameters suitably tailored for various facilities like grade of the borrower, past overdue history, status from monthly asset monitoring report, deal IRR, deal tenure remaining etc.
Based on these parameters the Company has computed the PD. The Company has also built in model scorecard to determine the internal LGD. However, since there has been no default history to substantiate the internal LGD, the Company has made use of a combination of both internal as well as external LGD.
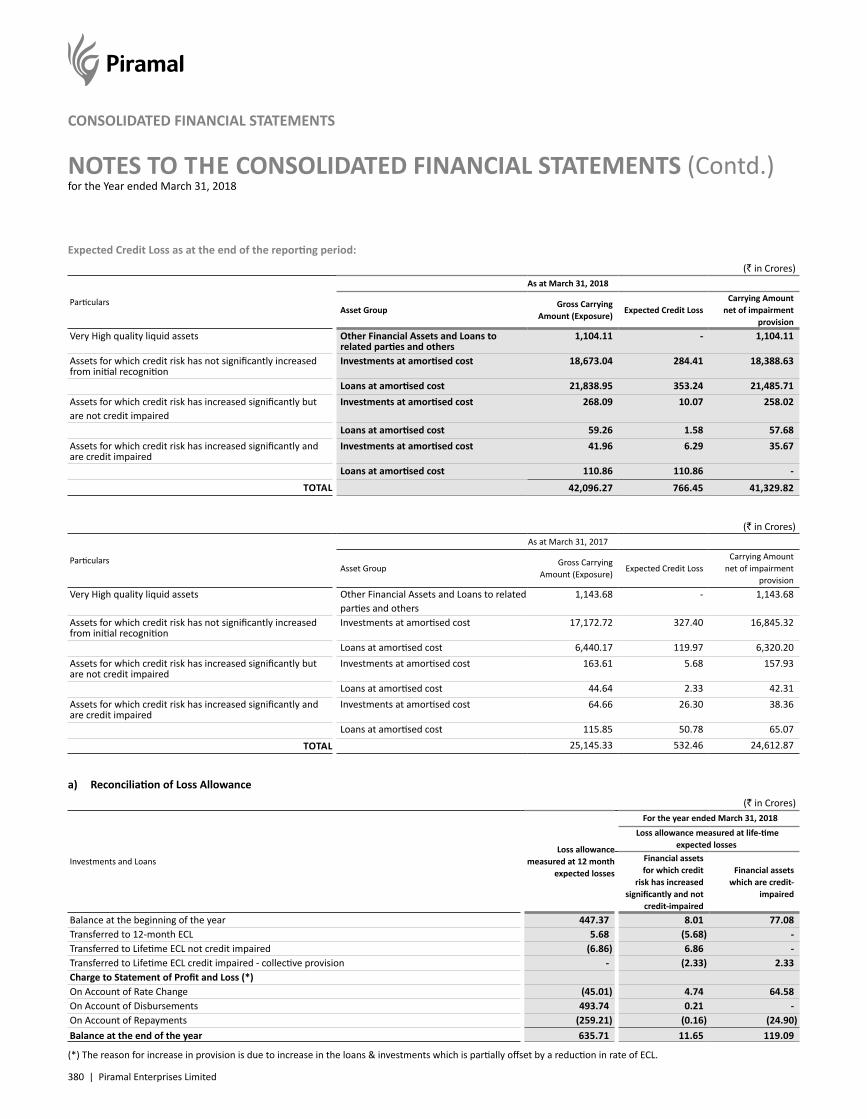
380 | Piramal Enterprises Limited
NOTES TO THE CONSOLIDATED FINANCIAL STATEMENTS (Contd.)for the Year ended March 31, 2018
CONSOLIDATED FINANCIAL STATEMENTS
Expected Credit Loss as at the end of the reporting period:(` in Crores)
Particulars
As at March 31, 2018
Asset GroupGross Carrying
Amount (Exposure)Expected Credit Loss
Carrying Amount net of impairment
provisionVery High quality liquid assets Other Financial Assets and Loans to
related parties and others 1,104.11 - 1,104.11
Assets for which credit risk has not significantly increased from initial recognition
Investments at amortised cost 18,673.04 284.41 18,388.63
Loans at amortised cost 21,838.95 353.24 21,485.71Assets for which credit risk has increased significantly but are not credit impaired
Investments at amortised cost 268.09 10.07 258.02
Loans at amortised cost 59.26 1.58 57.68Assets for which credit risk has increased significantly and are credit impaired
Investments at amortised cost 41.96 6.29 35.67
Loans at amortised cost 110.86 110.86 -TOTAL 42,096.27 766.45 41,329.82
(` in Crores)
Particulars
As at March 31, 2017
Asset GroupGross Carrying
Amount (Exposure)Expected Credit Loss
Carrying Amount net of impairment
provisionVery High quality liquid assets Other Financial Assets and Loans to related
parties and others 1,143.68 - 1,143.68
Assets for which credit risk has not significantly increased from initial recognition
Investments at amortised cost 17,172.72 327.40 16,845.32
Loans at amortised cost 6,440.17 119.97 6,320.20Assets for which credit risk has increased significantly but are not credit impaired
Investments at amortised cost 163.61 5.68 157.93
Loans at amortised cost 44.64 2.33 42.31Assets for which credit risk has increased significantly and are credit impaired
Investments at amortised cost 64.66 26.30 38.36
Loans at amortised cost 115.85 50.78 65.07TOTAL 25,145.33 532.46 24,612.87
a) Reconciliation of Loss Allowance(` in Crores)
Investments and Loans Loss allowance
measured at 12 month expected losses
For the year ended March 31, 2018 Loss allowance measured at life-time
expected losses Financial assets for which credit
risk has increased significantly and not
credit-impaired
Financial assets which are credit-
impaired
Balance at the beginning of the year 447.37 8.01 77.08Transferred to 12-month ECL 5.68 (5.68) -Transferred to Lifetime ECL not credit impaired (6.86) 6.86 -Transferred to Lifetime ECL credit impaired - collective provision - (2.33) 2.33Charge to Statement of Profit and Loss (*)On Account of Rate Change (45.01) 4.74 64.58On Account of Disbursements 493.74 0.21 -On Account of Repayments (259.21) (0.16) (24.90)Balance at the end of the year 635.71 11.65 119.09
(*) The reason for increase in provision is due to increase in the loans & investments which is partially offset by a reduction in rate of ECL.
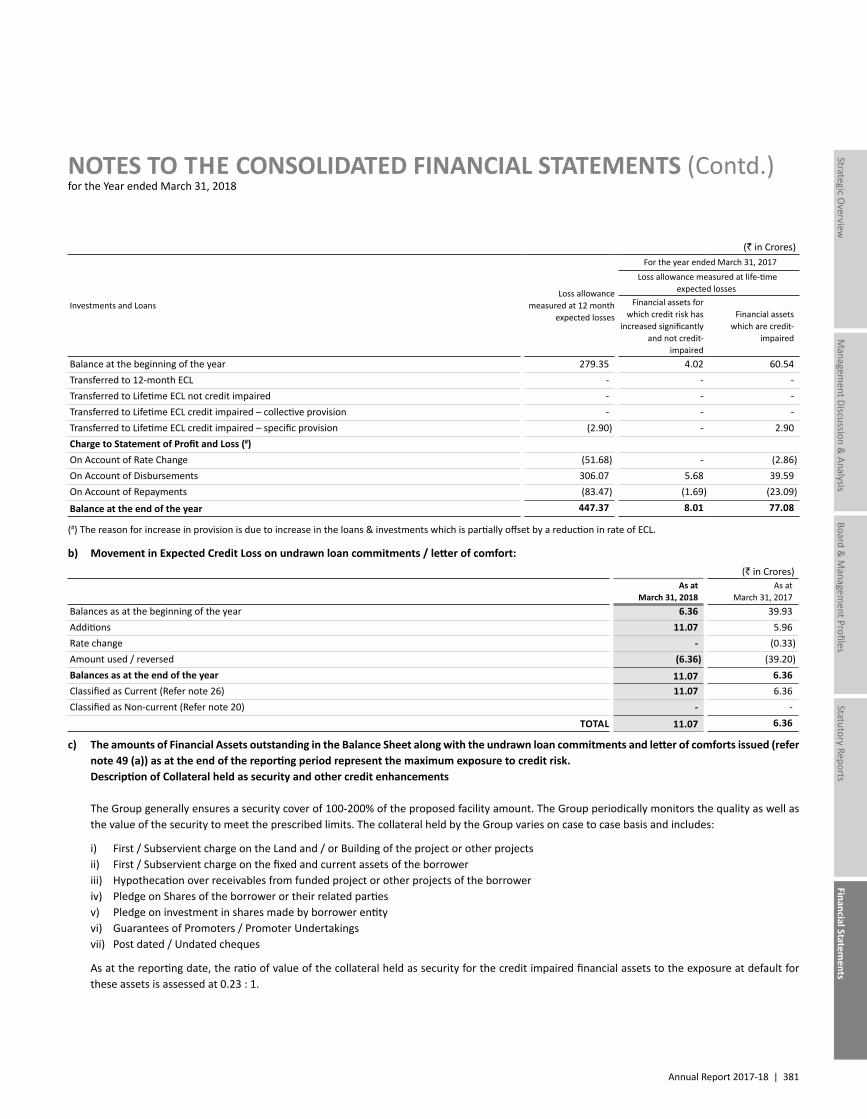
Annual Report 2017-18 | 381
Managem
ent Discussion & Analysis
Strategic Overview
Board &
Managem
ent ProfilesStatutory Reports
Financial Statements
NOTES TO THE CONSOLIDATED FINANCIAL STATEMENTS (Contd.)for the Year ended March 31, 2018
(` in Crores)
Investments and Loans Loss allowance
measured at 12 month expected losses
For the year ended March 31, 2017 Loss allowance measured at life-time
expected losses Financial assets for
which credit risk has increased significantly
and not credit-impaired
Financial assets which are credit-
impaired
Balance at the beginning of the year 279.35 4.02 60.54Transferred to 12-month ECL - - -Transferred to Lifetime ECL not credit impaired - - -Transferred to Lifetime ECL credit impaired – collective provision - - -Transferred to Lifetime ECL credit impaired – specific provision (2.90) - 2.90Charge to Statement of Profit and Loss (#)On Account of Rate Change (51.68) - (2.86)On Account of Disbursements 306.07 5.68 39.59On Account of Repayments (83.47) (1.69) (23.09)
Balance at the end of the year 447.37 8.01 77.08
(#) The reason for increase in provision is due to increase in the loans & investments which is partially offset by a reduction in rate of ECL.
b) Movement in Expected Credit Loss on undrawn loan commitments / letter of comfort:(` in Crores)
As at March 31, 2018
As at March 31, 2017
Balances as at the beginning of the year 6.36 39.93Additions 11.07 5.96Rate change - (0.33)Amount used / reversed (6.36) (39.20)Balances as at the end of the year 11.07 6.36Classified as Current (Refer note 26) 11.07 6.36Classified as Non-current (Refer note 20) - -
TOTAL 11.07 6.36
c) The amounts of Financial Assets outstanding in the Balance Sheet along with the undrawn loan commitments and letter of comforts issued (refer note 49 (a)) as at the end of the reporting period represent the maximum exposure to credit risk.
Description of Collateral held as security and other credit enhancements
The Group generally ensures a security cover of 100-200% of the proposed facility amount. The Group periodically monitors the quality as well as the value of the security to meet the prescribed limits. The collateral held by the Group varies on case to case basis and includes:
i) First / Subservient charge on the Land and / or Building of the project or other projects ii) First / Subservient charge on the fixed and current assets of the borrower iii) Hypothecation over receivables from funded project or other projects of the borrower iv) Pledge on Shares of the borrower or their related parties v) Pledge on investment in shares made by borrower entity vi) Guarantees of Promoters / Promoter Undertakings vii) Post dated / Undated cheques
As at the reporting date, the ratio of value of the collateral held as security for the credit impaired financial assets to the exposure at default for these assets is assessed at 0.23 : 1.
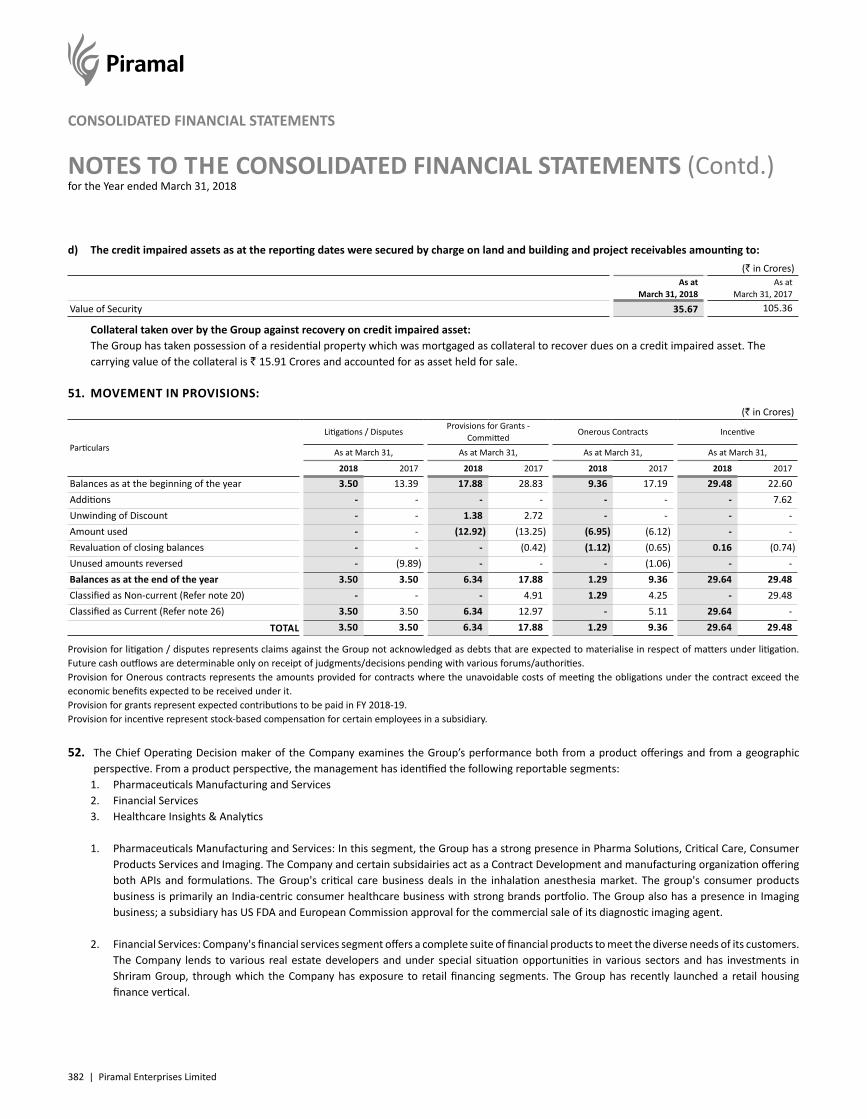
382 | Piramal Enterprises Limited
NOTES TO THE CONSOLIDATED FINANCIAL STATEMENTS (Contd.)for the Year ended March 31, 2018
CONSOLIDATED FINANCIAL STATEMENTS
d) The credit impaired assets as at the reporting dates were secured by charge on land and building and project receivables amounting to:(` in Crores)
As at March 31, 2018
As at March 31, 2017
Value of Security 35.67 105.36
Collateral taken over by the Group against recovery on credit impaired asset: The Group has taken possession of a residential property which was mortgaged as collateral to recover dues on a credit impaired asset. The
carrying value of the collateral is ` 15.91 Crores and accounted for as asset held for sale.
51. MOVEMENT IN PROVISIONS:(` in Crores)
Particulars
Litigations / DisputesProvisions for Grants -
CommittedOnerous Contracts Incentive
As at March 31, As at March 31, As at March 31, As at March 31,
2018 2017 2018 2017 2018 2017 2018 2017
Balances as at the beginning of the year 3.50 13.39 17.88 28.83 9.36 17.19 29.48 22.60Additions - - - - - - - 7.62Unwinding of Discount - - 1.38 2.72 - - - -Amount used - - (12.92) (13.25) (6.95) (6.12) - -Revaluation of closing balances - - - (0.42) (1.12) (0.65) 0.16 (0.74)Unused amounts reversed - (9.89) - - - (1.06) - -Balances as at the end of the year 3.50 3.50 6.34 17.88 1.29 9.36 29.64 29.48Classified as Non-current (Refer note 20) - - - 4.91 1.29 4.25 - 29.48Classified as Current (Refer note 26) 3.50 3.50 6.34 12.97 - 5.11 29.64 -
TOTAL 3.50 3.50 6.34 17.88 1.29 9.36 29.64 29.48
Provision for litigation / disputes represents claims against the Group not acknowledged as debts that are expected to materialise in respect of matters under litigation. Future cash outflows are determinable only on receipt of judgments/decisions pending with various forums/authorities.Provision for Onerous contracts represents the amounts provided for contracts where the unavoidable costs of meeting the obligations under the contract exceed the economic benefits expected to be received under it.Provision for grants represent expected contributions to be paid in FY 2018-19.Provision for incentive represent stock-based compensation for certain employees in a subsidiary.
52. The Chief Operating Decision maker of the Company examines the Group’s performance both from a product offerings and from a geographic perspective. From a product perspective, the management has identified the following reportable segments:
1. Pharmaceuticals Manufacturing and Services 2. Financial Services 3. Healthcare Insights & Analytics
1. Pharmaceuticals Manufacturing and Services: In this segment, the Group has a strong presence in Pharma Solutions, Critical Care, Consumer Products Services and Imaging. The Company and certain subsidairies act as a Contract Development and manufacturing organization offering both APIs and formulations. The Group's critical care business deals in the inhalation anesthesia market. The group's consumer products business is primarily an India-centric consumer healthcare business with strong brands portfolio. The Group also has a presence in Imaging business; a subsidiary has US FDA and European Commission approval for the commercial sale of its diagnostic imaging agent.
2. Financial Services: Company's financial services segment offers a complete suite of financial products to meet the diverse needs of its customers. The Company lends to various real estate developers and under special situation opportunities in various sectors and has investments in Shriram Group, through which the Company has exposure to retail financing segments. The Group has recently launched a retail housing finance vertical.
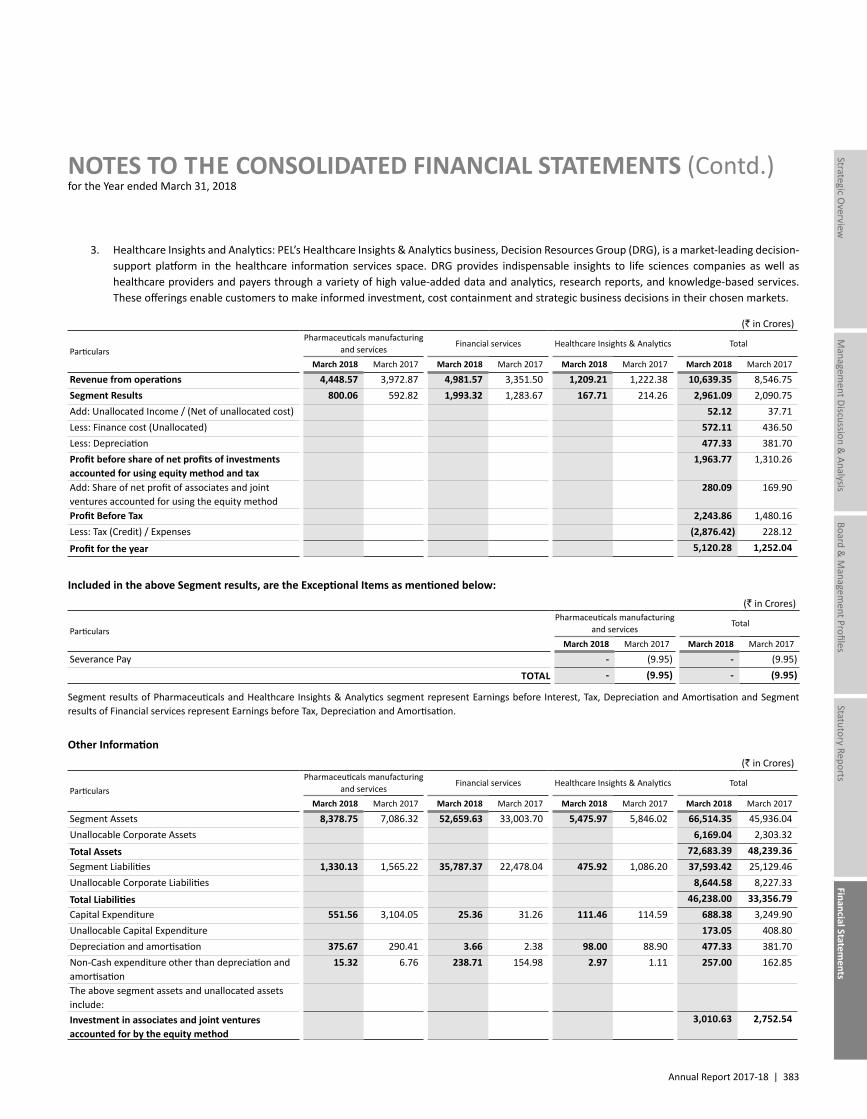
Annual Report 2017-18 | 383
Managem
ent Discussion & Analysis
Strategic Overview
Board &
Managem
ent ProfilesStatutory Reports
Financial Statements
NOTES TO THE CONSOLIDATED FINANCIAL STATEMENTS (Contd.)for the Year ended March 31, 2018
3. Healthcare Insights and Analytics: PEL’s Healthcare Insights & Analytics business, Decision Resources Group (DRG), is a market-leading decision-support platform in the healthcare information services space. DRG provides indispensable insights to life sciences companies as well as healthcare providers and payers through a variety of high value-added data and analytics, research reports, and knowledge-based services. These offerings enable customers to make informed investment, cost containment and strategic business decisions in their chosen markets.
(` in Crores)
ParticularsPharmaceuticals manufacturing
and servicesFinancial services Healthcare Insights & Analytics Total
March 2018 March 2017 March 2018 March 2017 March 2018 March 2017 March 2018 March 2017
Revenue from operations 4,448.57 3,972.87 4,981.57 3,351.50 1,209.21 1,222.38 10,639.35 8,546.75Segment Results 800.06 592.82 1,993.32 1,283.67 167.71 214.26 2,961.09 2,090.75Add: Unallocated Income / (Net of unallocated cost) 52.12 37.71Less: Finance cost (Unallocated) 572.11 436.50Less: Depreciation 477.33 381.70Profit before share of net profits of investments accounted for using equity method and tax
1,963.77 1,310.26
Add: Share of net profit of associates and joint ventures accounted for using the equity method
280.09 169.90
Profit Before Tax 2,243.86 1,480.16Less: Tax (Credit) / Expenses (2,876.42) 228.12
Profit for the year 5,120.28 1,252.04
Included in the above Segment results, are the Exceptional Items as mentioned below:(` in Crores)
ParticularsPharmaceuticals manufacturing
and services Total
March 2018 March 2017 March 2018 March 2017
Severance Pay - (9.95) - (9.95)TOTAL - (9.95) - (9.95)
Segment results of Pharmaceuticals and Healthcare Insights & Analytics segment represent Earnings before Interest, Tax, Depreciation and Amortisation and Segment results of Financial services represent Earnings before Tax, Depreciation and Amortisation.
Other Information(` in Crores)
ParticularsPharmaceuticals manufacturing
and servicesFinancial services Healthcare Insights & Analytics Total
March 2018 March 2017 March 2018 March 2017 March 2018 March 2017 March 2018 March 2017
Segment Assets 8,378.75 7,086.32 52,659.63 33,003.70 5,475.97 5,846.02 66,514.35 45,936.04Unallocable Corporate Assets 6,169.04 2,303.32
Total Assets 72,683.39 48,239.36Segment Liabilities 1,330.13 1,565.22 35,787.37 22,478.04 475.92 1,086.20 37,593.42 25,129.46Unallocable Corporate Liabilities 8,644.58 8,227.33
Total Liabilities 46,238.00 33,356.79Capital Expenditure 551.56 3,104.05 25.36 31.26 111.46 114.59 688.38 3,249.90Unallocable Capital Expenditure 173.05 408.80Depreciation and amortisation 375.67 290.41 3.66 2.38 98.00 88.90 477.33 381.70Non-Cash expenditure other than depreciation and amortisation
15.32 6.76 238.71 154.98 2.97 1.11 257.00 162.85
The above segment assets and unallocated assets include:Investment in associates and joint ventures accounted for by the equity method
3,010.63 2,752.54
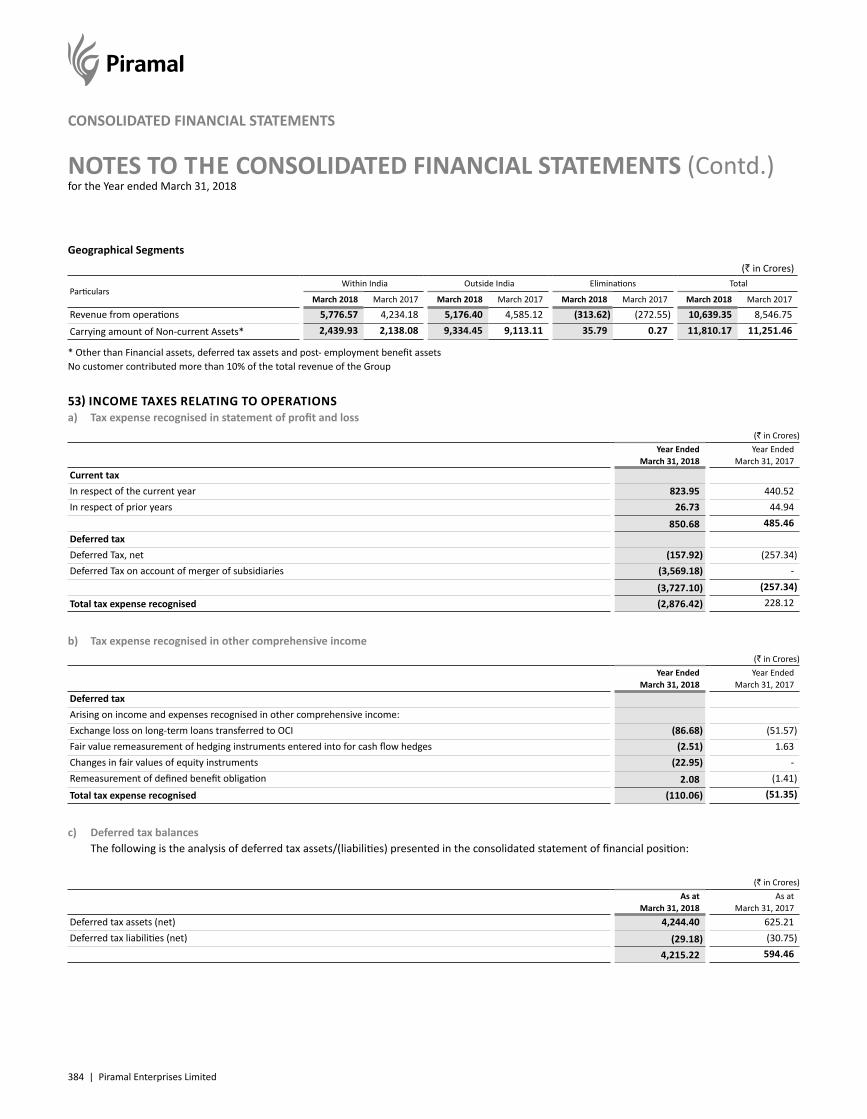
384 | Piramal Enterprises Limited
NOTES TO THE CONSOLIDATED FINANCIAL STATEMENTS (Contd.)for the Year ended March 31, 2018
CONSOLIDATED FINANCIAL STATEMENTS
Geographical Segments(` in Crores)
Particulars Within India Outside India Eliminations Total
March 2018 March 2017 March 2018 March 2017 March 2018 March 2017 March 2018 March 2017
Revenue from operations 5,776.57 4,234.18 5,176.40 4,585.12 (313.62) (272.55) 10,639.35 8,546.75
Carrying amount of Non-current Assets* 2,439.93 2,138.08 9,334.45 9,113.11 35.79 0.27 11,810.17 11,251.46
* Other than Financial assets, deferred tax assets and post- employment benefit assetsNo customer contributed more than 10% of the total revenue of the Group
53) INCOME TAXES RELATING TO OPERATIONSa) Tax expense recognised in statement of profit and loss
(` in Crores) Year Ended
March 31, 2018Year Ended
March 31, 2017Current taxIn respect of the current year 823.95 440.52In respect of prior years 26.73 44.94
850.68 485.46Deferred taxDeferred Tax, net (157.92) (257.34)Deferred Tax on account of merger of subsidiaries (3,569.18) -
(3,727.10) (257.34)
Total tax expense recognised (2,876.42) 228.12
b) Tax expense recognised in other comprehensive income (` in Crores)
Year Ended March 31, 2018
Year Ended March 31, 2017
Deferred taxArising on income and expenses recognised in other comprehensive income:Exchange loss on long-term loans transferred to OCI (86.68) (51.57)Fair value remeasurement of hedging instruments entered into for cash flow hedges (2.51) 1.63Changes in fair values of equity instruments (22.95) -Remeasurement of defined benefit obligation 2.08 (1.41)
Total tax expense recognised (110.06) (51.35)
c) Deferred tax balances The following is the analysis of deferred tax assets/(liabilities) presented in the consolidated statement of financial position:
(` in Crores) As at
March 31, 2018As at
March 31, 2017Deferred tax assets (net) 4,244.40 625.21Deferred tax liabilities (net) (29.18) (30.75)
4,215.22 594.46
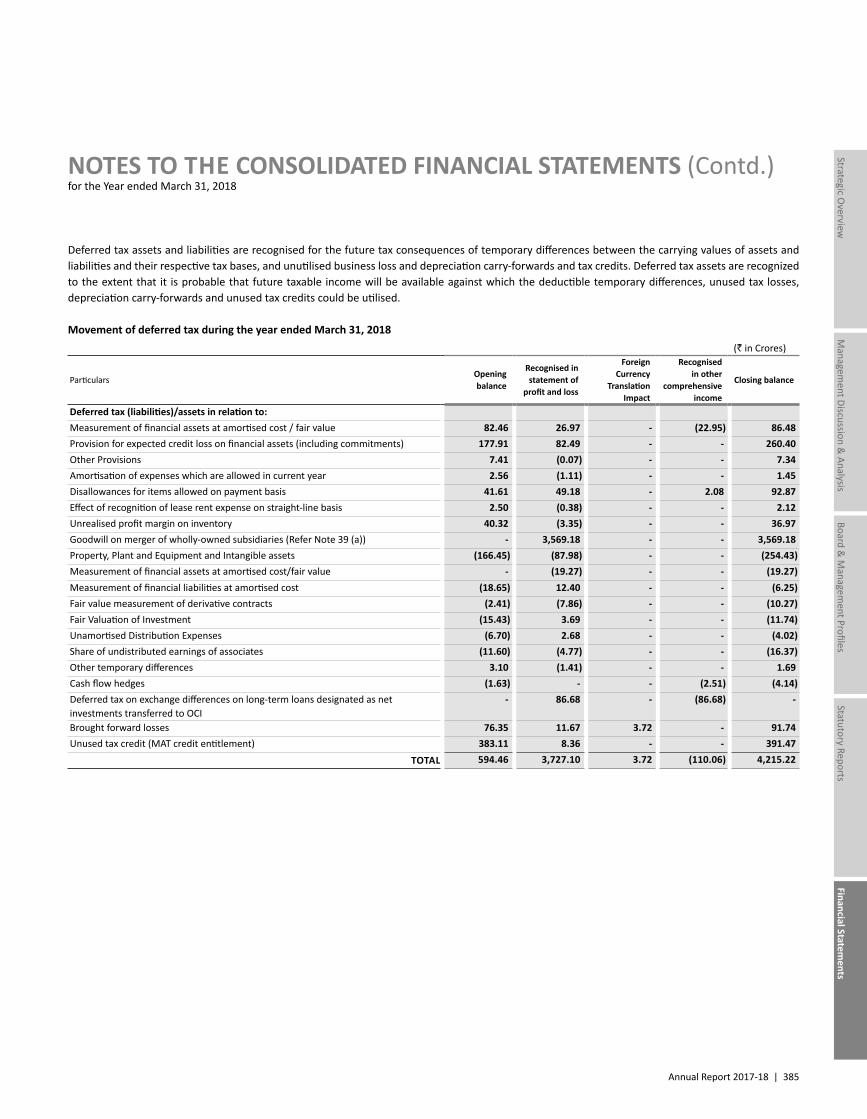
Annual Report 2017-18 | 385
Managem
ent Discussion & Analysis
Strategic Overview
Board &
Managem
ent ProfilesStatutory Reports
Financial Statements
NOTES TO THE CONSOLIDATED FINANCIAL STATEMENTS (Contd.)for the Year ended March 31, 2018
Deferred tax assets and liabilities are recognised for the future tax consequences of temporary differences between the carrying values of assets and liabilities and their respective tax bases, and unutilised business loss and depreciation carry-forwards and tax credits. Deferred tax assets are recognized to the extent that it is probable that future taxable income will be available against which the deductible temporary differences, unused tax losses, depreciation carry-forwards and unused tax credits could be utilised.
Movement of deferred tax during the year ended March 31, 2018(` in Crores)
ParticularsOpening balance
Recognised in statement of
profit and loss
Foreign Currency
Translation Impact
Recognised in other
comprehensive income
Closing balance
Deferred tax (liabilities)/assets in relation to:Measurement of financial assets at amortised cost / fair value 82.46 26.97 - (22.95) 86.48Provision for expected credit loss on financial assets (including commitments) 177.91 82.49 - - 260.40Other Provisions 7.41 (0.07) - - 7.34Amortisation of expenses which are allowed in current year 2.56 (1.11) - - 1.45Disallowances for items allowed on payment basis 41.61 49.18 - 2.08 92.87Effect of recognition of lease rent expense on straight-line basis 2.50 (0.38) - - 2.12Unrealised profit margin on inventory 40.32 (3.35) - - 36.97Goodwill on merger of wholly-owned subsidiaries (Refer Note 39 (a)) - 3,569.18 - - 3,569.18Property, Plant and Equipment and Intangible assets (166.45) (87.98) - - (254.43)Measurement of financial assets at amortised cost/fair value - (19.27) - - (19.27)Measurement of financial liabilities at amortised cost (18.65) 12.40 - - (6.25)Fair value measurement of derivative contracts (2.41) (7.86) - - (10.27)Fair Valuation of Investment (15.43) 3.69 - - (11.74)Unamortised Distribution Expenses (6.70) 2.68 - - (4.02)Share of undistributed earnings of associates (11.60) (4.77) - - (16.37)Other temporary differences 3.10 (1.41) - - 1.69Cash flow hedges (1.63) - - (2.51) (4.14)Deferred tax on exchange differences on long-term loans designated as net investments transferred to OCI
- 86.68 - (86.68) -
Brought forward losses 76.35 11.67 3.72 - 91.74Unused tax credit (MAT credit entitlement) 383.11 8.36 - - 391.47
TOTAL 594.46 3,727.10 3.72 (110.06) 4,215.22
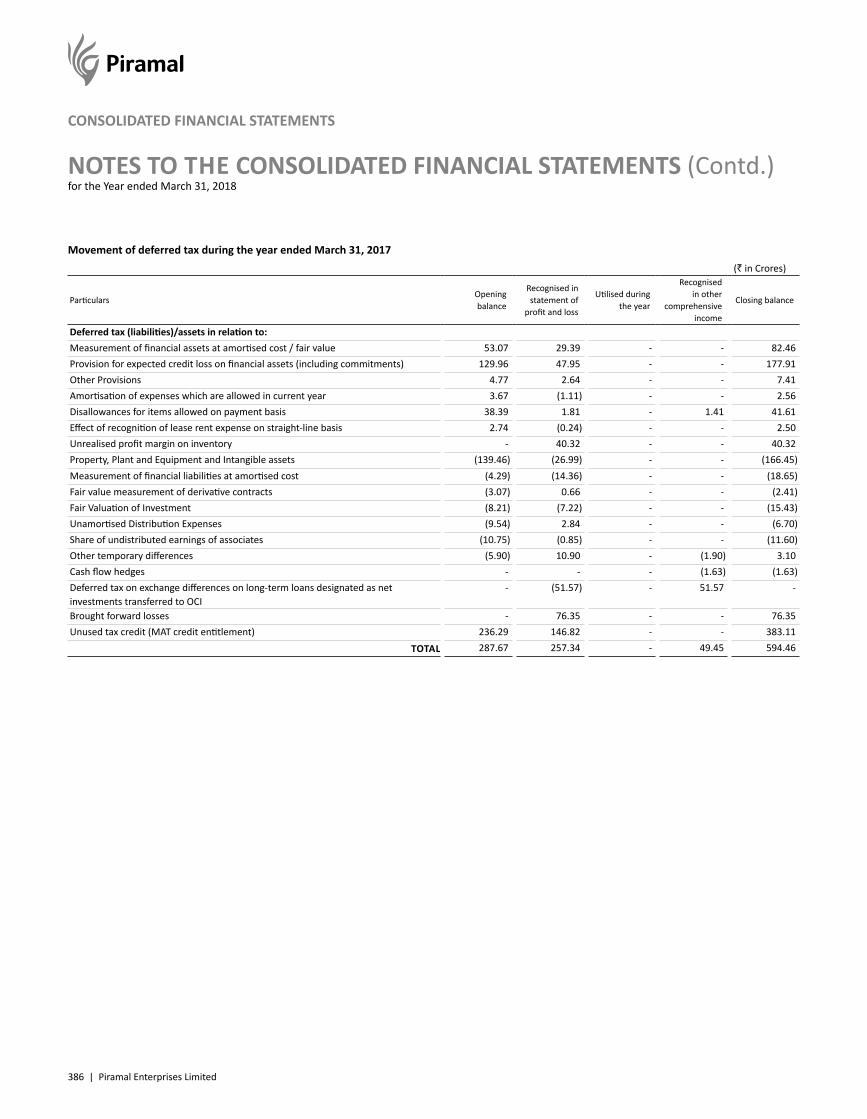
386 | Piramal Enterprises Limited
NOTES TO THE CONSOLIDATED FINANCIAL STATEMENTS (Contd.)for the Year ended March 31, 2018
CONSOLIDATED FINANCIAL STATEMENTS
Movement of deferred tax during the year ended March 31, 2017(` in Crores)
ParticularsOpening balance
Recognised in statement of
profit and loss
Utilised during the year
Recognised in other
comprehensive income
Closing balance
Deferred tax (liabilities)/assets in relation to:Measurement of financial assets at amortised cost / fair value 53.07 29.39 - - 82.46Provision for expected credit loss on financial assets (including commitments) 129.96 47.95 - - 177.91Other Provisions 4.77 2.64 - - 7.41Amortisation of expenses which are allowed in current year 3.67 (1.11) - - 2.56Disallowances for items allowed on payment basis 38.39 1.81 - 1.41 41.61Effect of recognition of lease rent expense on straight-line basis 2.74 (0.24) - - 2.50Unrealised profit margin on inventory - 40.32 - - 40.32Property, Plant and Equipment and Intangible assets (139.46) (26.99) - - (166.45)Measurement of financial liabilities at amortised cost (4.29) (14.36) - - (18.65)Fair value measurement of derivative contracts (3.07) 0.66 - - (2.41)Fair Valuation of Investment (8.21) (7.22) - - (15.43)Unamortised Distribution Expenses (9.54) 2.84 - - (6.70)Share of undistributed earnings of associates (10.75) (0.85) - - (11.60)Other temporary differences (5.90) 10.90 - (1.90) 3.10Cash flow hedges - - - (1.63) (1.63)Deferred tax on exchange differences on long-term loans designated as net investments transferred to OCI
- (51.57) - 51.57 -
Brought forward losses - 76.35 - - 76.35Unused tax credit (MAT credit entitlement) 236.29 146.82 - - 383.11
TOTAL 287.67 257.34 - 49.45 594.46
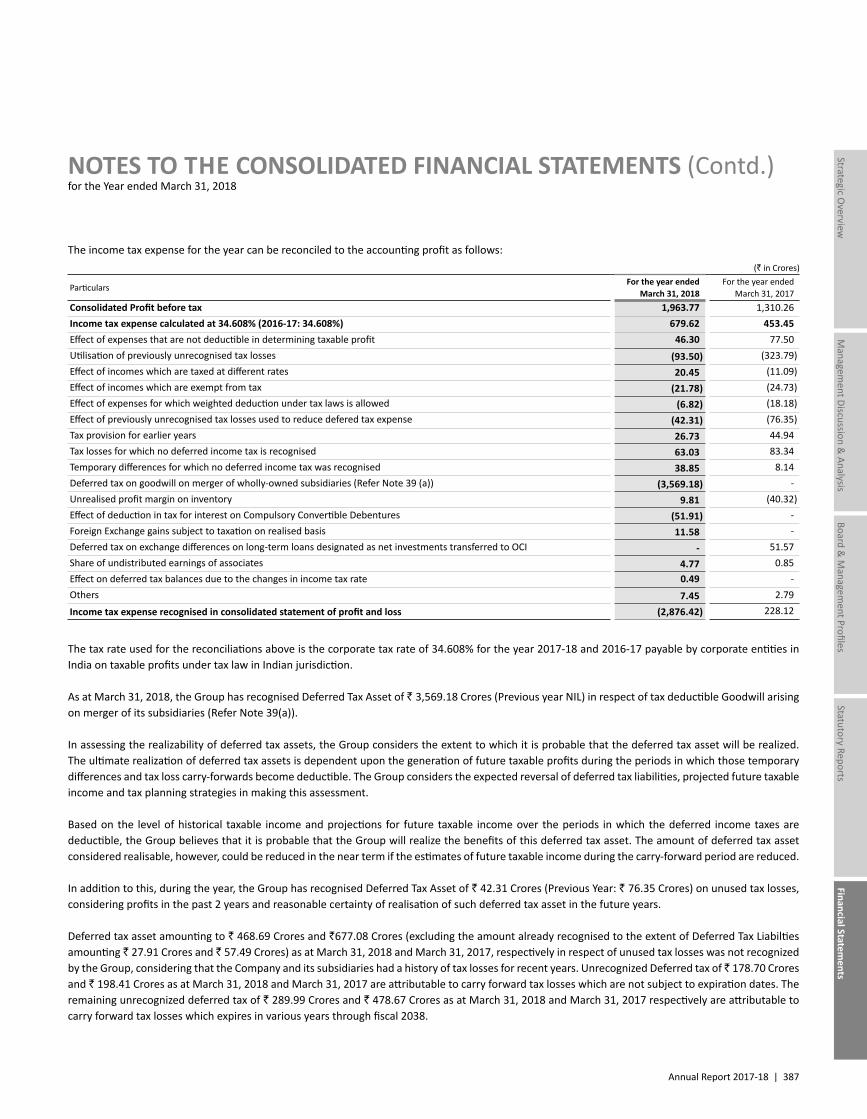
Annual Report 2017-18 | 387
Managem
ent Discussion & Analysis
Strategic Overview
Board &
Managem
ent ProfilesStatutory Reports
Financial Statements
NOTES TO THE CONSOLIDATED FINANCIAL STATEMENTS (Contd.)for the Year ended March 31, 2018
The income tax expense for the year can be reconciled to the accounting profit as follows: (` in Crores)
Particulars For the year ended
March 31, 2018 For the year ended
March 31, 2017Consolidated Profit before tax 1,963.77 1,310.26Income tax expense calculated at 34.608% (2016-17: 34.608%) 679.62 453.45Effect of expenses that are not deductible in determining taxable profit 46.30 77.50Utilisation of previously unrecognised tax losses (93.50) (323.79)Effect of incomes which are taxed at different rates 20.45 (11.09)Effect of incomes which are exempt from tax (21.78) (24.73)Effect of expenses for which weighted deduction under tax laws is allowed (6.82) (18.18)Effect of previously unrecognised tax losses used to reduce defered tax expense (42.31) (76.35)Tax provision for earlier years 26.73 44.94Tax losses for which no deferred income tax is recognised 63.03 83.34Temporary differences for which no deferred income tax was recognised 38.85 8.14Deferred tax on goodwill on merger of wholly-owned subsidiaries (Refer Note 39 (a)) (3,569.18) -Unrealised profit margin on inventory 9.81 (40.32)Effect of deduction in tax for interest on Compulsory Convertible Debentures (51.91) -Foreign Exchange gains subject to taxation on realised basis 11.58 -Deferred tax on exchange differences on long-term loans designated as net investments transferred to OCI - 51.57Share of undistributed earnings of associates 4.77 0.85Effect on deferred tax balances due to the changes in income tax rate 0.49 -Others 7.45 2.79
Income tax expense recognised in consolidated statement of profit and loss (2,876.42) 228.12
The tax rate used for the reconciliations above is the corporate tax rate of 34.608% for the year 2017-18 and 2016-17 payable by corporate entities in India on taxable profits under tax law in Indian jurisdiction.
As at March 31, 2018, the Group has recognised Deferred Tax Asset of ` 3,569.18 Crores (Previous year NIL) in respect of tax deductible Goodwill arising on merger of its subsidiaries (Refer Note 39(a)).
In assessing the realizability of deferred tax assets, the Group considers the extent to which it is probable that the deferred tax asset will be realized. The ultimate realization of deferred tax assets is dependent upon the generation of future taxable profits during the periods in which those temporary differences and tax loss carry-forwards become deductible. The Group considers the expected reversal of deferred tax liabilities, projected future taxable income and tax planning strategies in making this assessment.
Based on the level of historical taxable income and projections for future taxable income over the periods in which the deferred income taxes are deductible, the Group believes that it is probable that the Group will realize the benefits of this deferred tax asset. The amount of deferred tax asset considered realisable, however, could be reduced in the near term if the estimates of future taxable income during the carry-forward period are reduced.
In addition to this, during the year, the Group has recognised Deferred Tax Asset of ` 42.31 Crores (Previous Year: ` 76.35 Crores) on unused tax losses, considering profits in the past 2 years and reasonable certainty of realisation of such deferred tax asset in the future years.
Deferred tax asset amounting to ` 468.69 Crores and `677.08 Crores (excluding the amount already recognised to the extent of Deferred Tax Liabilties amounting ` 27.91 Crores and ` 57.49 Crores) as at March 31, 2018 and March 31, 2017, respectively in respect of unused tax losses was not recognized by the Group, considering that the Company and its subsidiaries had a history of tax losses for recent years. Unrecognized Deferred tax of ̀ 178.70 Crores and ` 198.41 Crores as at March 31, 2018 and March 31, 2017 are attributable to carry forward tax losses which are not subject to expiration dates. The remaining unrecognized deferred tax of ` 289.99 Crores and ` 478.67 Crores as at March 31, 2018 and March 31, 2017 respectively are attributable to carry forward tax losses which expires in various years through fiscal 2038.
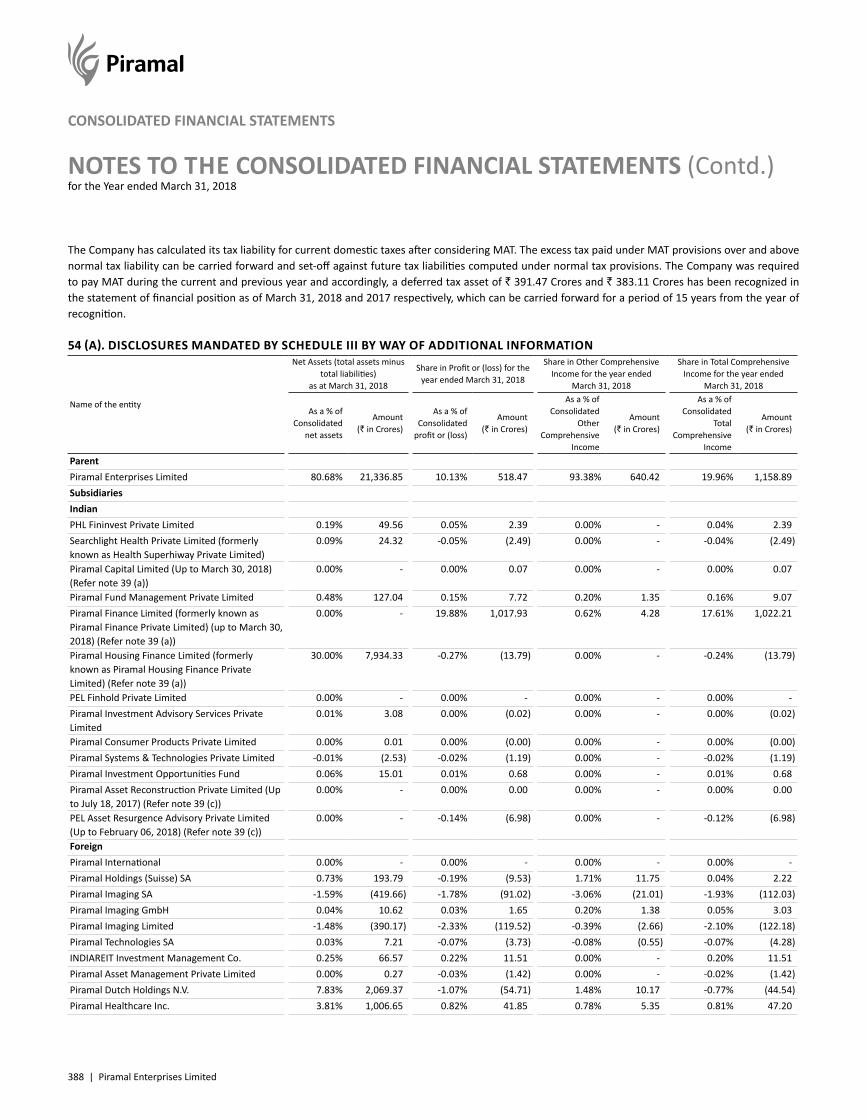
388 | Piramal Enterprises Limited
NOTES TO THE CONSOLIDATED FINANCIAL STATEMENTS (Contd.)for the Year ended March 31, 2018
CONSOLIDATED FINANCIAL STATEMENTS
The Company has calculated its tax liability for current domestic taxes after considering MAT. The excess tax paid under MAT provisions over and above normal tax liability can be carried forward and set-off against future tax liabilities computed under normal tax provisions. The Company was required to pay MAT during the current and previous year and accordingly, a deferred tax asset of ` 391.47 Crores and ` 383.11 Crores has been recognized in the statement of financial position as of March 31, 2018 and 2017 respectively, which can be carried forward for a period of 15 years from the year of recognition.
54 (A). DISCLOSURES MANDATED BY SCHEDULE III BY WAY OF ADDITIONAL INFORMATION
Name of the entity
Net Assets (total assets minus total liabilities)
as at March 31, 2018
Share in Profit or (loss) for the year ended March 31, 2018
Share in Other Comprehensive Income for the year ended
March 31, 2018
Share in Total Comprehensive Income for the year ended
March 31, 2018
As a % of Consolidated
net assets
Amount (` in Crores)
As a % of Consolidated
profit or (loss)
Amount (` in Crores)
As a % of Consolidated
Other Comprehensive
Income
Amount (` in Crores)
As a % of Consolidated
Total Comprehensive
Income
Amount (` in Crores)
ParentPiramal Enterprises Limited 80.68% 21,336.85 10.13% 518.47 93.38% 640.42 19.96% 1,158.89SubsidiariesIndianPHL Fininvest Private Limited 0.19% 49.56 0.05% 2.39 0.00% - 0.04% 2.39Searchlight Health Private Limited (formerly known as Health Superhiway Private Limited)
0.09% 24.32 -0.05% (2.49) 0.00% - -0.04% (2.49)
Piramal Capital Limited (Up to March 30, 2018) (Refer note 39 (a))
0.00% - 0.00% 0.07 0.00% - 0.00% 0.07
Piramal Fund Management Private Limited 0.48% 127.04 0.15% 7.72 0.20% 1.35 0.16% 9.07Piramal Finance Limited (formerly known as Piramal Finance Private Limited) (up to March 30, 2018) (Refer note 39 (a))
0.00% - 19.88% 1,017.93 0.62% 4.28 17.61% 1,022.21
Piramal Housing Finance Limited (formerly known as Piramal Housing Finance Private Limited) (Refer note 39 (a))
30.00% 7,934.33 -0.27% (13.79) 0.00% - -0.24% (13.79)
PEL Finhold Private Limited 0.00% - 0.00% - 0.00% - 0.00% -Piramal Investment Advisory Services Private Limited
0.01% 3.08 0.00% (0.02) 0.00% - 0.00% (0.02)
Piramal Consumer Products Private Limited 0.00% 0.01 0.00% (0.00) 0.00% - 0.00% (0.00)Piramal Systems & Technologies Private Limited -0.01% (2.53) -0.02% (1.19) 0.00% - -0.02% (1.19)Piramal Investment Opportunities Fund 0.06% 15.01 0.01% 0.68 0.00% - 0.01% 0.68Piramal Asset Reconstruction Private Limited (Up to July 18, 2017) (Refer note 39 (c))
0.00% - 0.00% 0.00 0.00% - 0.00% 0.00
PEL Asset Resurgence Advisory Private Limited (Up to February 06, 2018) (Refer note 39 (c))
0.00% - -0.14% (6.98) 0.00% - -0.12% (6.98)
ForeignPiramal International 0.00% - 0.00% - 0.00% - 0.00% -Piramal Holdings (Suisse) SA 0.73% 193.79 -0.19% (9.53) 1.71% 11.75 0.04% 2.22Piramal Imaging SA -1.59% (419.66) -1.78% (91.02) -3.06% (21.01) -1.93% (112.03)Piramal Imaging GmbH 0.04% 10.62 0.03% 1.65 0.20% 1.38 0.05% 3.03Piramal Imaging Limited -1.48% (390.17) -2.33% (119.52) -0.39% (2.66) -2.10% (122.18)Piramal Technologies SA 0.03% 7.21 -0.07% (3.73) -0.08% (0.55) -0.07% (4.28)INDIAREIT Investment Management Co. 0.25% 66.57 0.22% 11.51 0.00% - 0.20% 11.51Piramal Asset Management Private Limited 0.00% 0.27 -0.03% (1.42) 0.00% - -0.02% (1.42)Piramal Dutch Holdings N.V. 7.83% 2,069.37 -1.07% (54.71) 1.48% 10.17 -0.77% (44.54)Piramal Healthcare Inc. 3.81% 1,006.65 0.82% 41.85 0.78% 5.35 0.81% 47.20
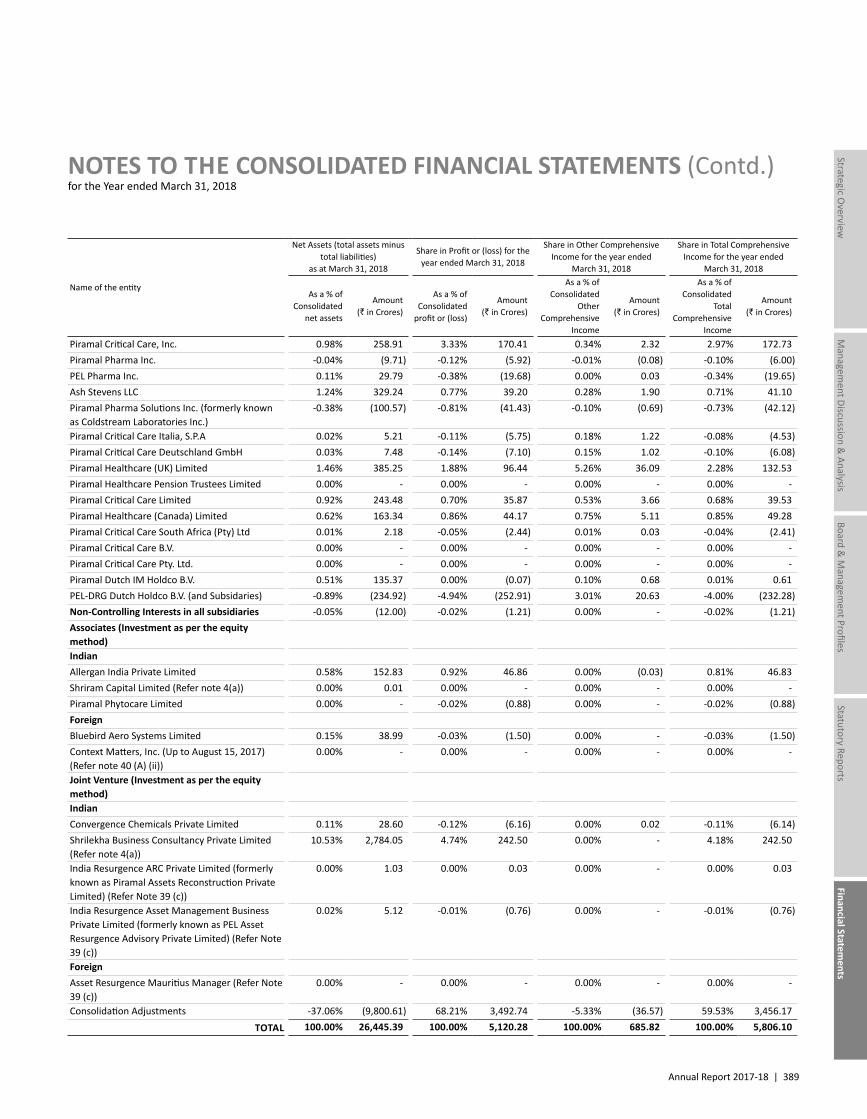
Annual Report 2017-18 | 389
Managem
ent Discussion & Analysis
Strategic Overview
Board &
Managem
ent ProfilesStatutory Reports
Financial Statements
NOTES TO THE CONSOLIDATED FINANCIAL STATEMENTS (Contd.)for the Year ended March 31, 2018
Name of the entity
Net Assets (total assets minus total liabilities)
as at March 31, 2018
Share in Profit or (loss) for the year ended March 31, 2018
Share in Other Comprehensive Income for the year ended
March 31, 2018
Share in Total Comprehensive Income for the year ended
March 31, 2018
As a % of Consolidated
net assets
Amount (` in Crores)
As a % of Consolidated
profit or (loss)
Amount (` in Crores)
As a % of Consolidated
Other Comprehensive
Income
Amount (` in Crores)
As a % of Consolidated
Total Comprehensive
Income
Amount (` in Crores)
Piramal Critical Care, Inc. 0.98% 258.91 3.33% 170.41 0.34% 2.32 2.97% 172.73Piramal Pharma Inc. -0.04% (9.71) -0.12% (5.92) -0.01% (0.08) -0.10% (6.00)PEL Pharma Inc. 0.11% 29.79 -0.38% (19.68) 0.00% 0.03 -0.34% (19.65)Ash Stevens LLC 1.24% 329.24 0.77% 39.20 0.28% 1.90 0.71% 41.10Piramal Pharma Solutions Inc. (formerly known as Coldstream Laboratories Inc.)
-0.38% (100.57) -0.81% (41.43) -0.10% (0.69) -0.73% (42.12)
Piramal Critical Care Italia, S.P.A 0.02% 5.21 -0.11% (5.75) 0.18% 1.22 -0.08% (4.53)Piramal Critical Care Deutschland GmbH 0.03% 7.48 -0.14% (7.10) 0.15% 1.02 -0.10% (6.08)Piramal Healthcare (UK) Limited 1.46% 385.25 1.88% 96.44 5.26% 36.09 2.28% 132.53Piramal Healthcare Pension Trustees Limited 0.00% - 0.00% - 0.00% - 0.00% -Piramal Critical Care Limited 0.92% 243.48 0.70% 35.87 0.53% 3.66 0.68% 39.53Piramal Healthcare (Canada) Limited 0.62% 163.34 0.86% 44.17 0.75% 5.11 0.85% 49.28Piramal Critical Care South Africa (Pty) Ltd 0.01% 2.18 -0.05% (2.44) 0.01% 0.03 -0.04% (2.41)Piramal Critical Care B.V. 0.00% - 0.00% - 0.00% - 0.00% -Piramal Critical Care Pty. Ltd. 0.00% - 0.00% - 0.00% - 0.00% -Piramal Dutch IM Holdco B.V. 0.51% 135.37 0.00% (0.07) 0.10% 0.68 0.01% 0.61PEL-DRG Dutch Holdco B.V. (and Subsidaries) -0.89% (234.92) -4.94% (252.91) 3.01% 20.63 -4.00% (232.28)Non-Controlling Interests in all subsidiaries -0.05% (12.00) -0.02% (1.21) 0.00% - -0.02% (1.21)Associates (Investment as per the equity method)IndianAllergan India Private Limited 0.58% 152.83 0.92% 46.86 0.00% (0.03) 0.81% 46.83Shriram Capital Limited (Refer note 4(a)) 0.00% 0.01 0.00% - 0.00% - 0.00% -Piramal Phytocare Limited 0.00% - -0.02% (0.88) 0.00% - -0.02% (0.88)ForeignBluebird Aero Systems Limited 0.15% 38.99 -0.03% (1.50) 0.00% - -0.03% (1.50)Context Matters, Inc. (Up to August 15, 2017) (Refer note 40 (A) (ii))
0.00% - 0.00% - 0.00% - 0.00% -
Joint Venture (Investment as per the equity method)IndianConvergence Chemicals Private Limited 0.11% 28.60 -0.12% (6.16) 0.00% 0.02 -0.11% (6.14)Shrilekha Business Consultancy Private Limited (Refer note 4(a))
10.53% 2,784.05 4.74% 242.50 0.00% - 4.18% 242.50
India Resurgence ARC Private Limited (formerly known as Piramal Assets Reconstruction Private Limited) (Refer Note 39 (c))
0.00% 1.03 0.00% 0.03 0.00% - 0.00% 0.03
India Resurgence Asset Management Business Private Limited (formerly known as PEL Asset Resurgence Advisory Private Limited) (Refer Note 39 (c))
0.02% 5.12 -0.01% (0.76) 0.00% - -0.01% (0.76)
ForeignAsset Resurgence Mauritius Manager (Refer Note 39 (c))
0.00% - 0.00% - 0.00% - 0.00% -
Consolidation Adjustments -37.06% (9,800.61) 68.21% 3,492.74 -5.33% (36.57) 59.53% 3,456.17TOTAL 100.00% 26,445.39 100.00% 5,120.28 100.00% 685.82 100.00% 5,806.10
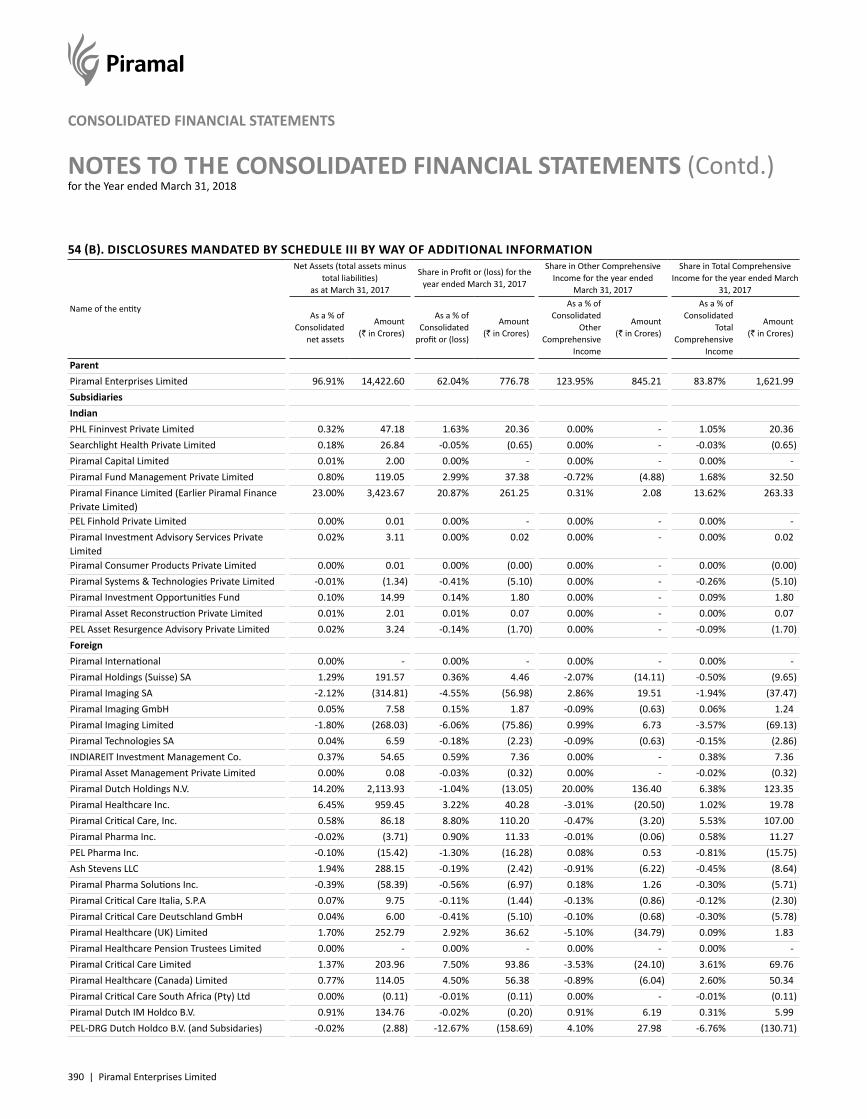
390 | Piramal Enterprises Limited
NOTES TO THE CONSOLIDATED FINANCIAL STATEMENTS (Contd.)for the Year ended March 31, 2018
CONSOLIDATED FINANCIAL STATEMENTS
54 (B). DISCLOSURES MANDATED BY SCHEDULE III BY WAY OF ADDITIONAL INFORMATION
Name of the entity
Net Assets (total assets minus total liabilities)
as at March 31, 2017
Share in Profit or (loss) for the year ended March 31, 2017
Share in Other Comprehensive Income for the year ended
March 31, 2017
Share in Total Comprehensive Income for the year ended March
31, 2017
As a % of Consolidated
net assets
Amount (` in Crores)
As a % of Consolidated
profit or (loss)
Amount (` in Crores)
As a % of Consolidated
Other Comprehensive
Income
Amount (` in Crores)
As a % of Consolidated
Total Comprehensive
Income
Amount (` in Crores)
ParentPiramal Enterprises Limited 96.91% 14,422.60 62.04% 776.78 123.95% 845.21 83.87% 1,621.99SubsidiariesIndianPHL Fininvest Private Limited 0.32% 47.18 1.63% 20.36 0.00% - 1.05% 20.36Searchlight Health Private Limited 0.18% 26.84 -0.05% (0.65) 0.00% - -0.03% (0.65)Piramal Capital Limited 0.01% 2.00 0.00% - 0.00% - 0.00% -Piramal Fund Management Private Limited 0.80% 119.05 2.99% 37.38 -0.72% (4.88) 1.68% 32.50Piramal Finance Limited (Earlier Piramal Finance Private Limited)
23.00% 3,423.67 20.87% 261.25 0.31% 2.08 13.62% 263.33
PEL Finhold Private Limited 0.00% 0.01 0.00% - 0.00% - 0.00% -Piramal Investment Advisory Services Private Limited
0.02% 3.11 0.00% 0.02 0.00% - 0.00% 0.02
Piramal Consumer Products Private Limited 0.00% 0.01 0.00% (0.00) 0.00% - 0.00% (0.00)Piramal Systems & Technologies Private Limited -0.01% (1.34) -0.41% (5.10) 0.00% - -0.26% (5.10)Piramal Investment Opportunities Fund 0.10% 14.99 0.14% 1.80 0.00% - 0.09% 1.80Piramal Asset Reconstruction Private Limited 0.01% 2.01 0.01% 0.07 0.00% - 0.00% 0.07PEL Asset Resurgence Advisory Private Limited 0.02% 3.24 -0.14% (1.70) 0.00% - -0.09% (1.70)ForeignPiramal International 0.00% - 0.00% - 0.00% - 0.00% -Piramal Holdings (Suisse) SA 1.29% 191.57 0.36% 4.46 -2.07% (14.11) -0.50% (9.65)Piramal Imaging SA -2.12% (314.81) -4.55% (56.98) 2.86% 19.51 -1.94% (37.47)Piramal Imaging GmbH 0.05% 7.58 0.15% 1.87 -0.09% (0.63) 0.06% 1.24Piramal Imaging Limited -1.80% (268.03) -6.06% (75.86) 0.99% 6.73 -3.57% (69.13)Piramal Technologies SA 0.04% 6.59 -0.18% (2.23) -0.09% (0.63) -0.15% (2.86)INDIAREIT Investment Management Co. 0.37% 54.65 0.59% 7.36 0.00% - 0.38% 7.36Piramal Asset Management Private Limited 0.00% 0.08 -0.03% (0.32) 0.00% - -0.02% (0.32)Piramal Dutch Holdings N.V. 14.20% 2,113.93 -1.04% (13.05) 20.00% 136.40 6.38% 123.35Piramal Healthcare Inc. 6.45% 959.45 3.22% 40.28 -3.01% (20.50) 1.02% 19.78Piramal Critical Care, Inc. 0.58% 86.18 8.80% 110.20 -0.47% (3.20) 5.53% 107.00Piramal Pharma Inc. -0.02% (3.71) 0.90% 11.33 -0.01% (0.06) 0.58% 11.27PEL Pharma Inc. -0.10% (15.42) -1.30% (16.28) 0.08% 0.53 -0.81% (15.75)Ash Stevens LLC 1.94% 288.15 -0.19% (2.42) -0.91% (6.22) -0.45% (8.64)Piramal Pharma Solutions Inc. -0.39% (58.39) -0.56% (6.97) 0.18% 1.26 -0.30% (5.71)Piramal Critical Care Italia, S.P.A 0.07% 9.75 -0.11% (1.44) -0.13% (0.86) -0.12% (2.30)Piramal Critical Care Deutschland GmbH 0.04% 6.00 -0.41% (5.10) -0.10% (0.68) -0.30% (5.78)Piramal Healthcare (UK) Limited 1.70% 252.79 2.92% 36.62 -5.10% (34.79) 0.09% 1.83Piramal Healthcare Pension Trustees Limited 0.00% - 0.00% - 0.00% - 0.00% -Piramal Critical Care Limited 1.37% 203.96 7.50% 93.86 -3.53% (24.10) 3.61% 69.76Piramal Healthcare (Canada) Limited 0.77% 114.05 4.50% 56.38 -0.89% (6.04) 2.60% 50.34Piramal Critical Care South Africa (Pty) Ltd 0.00% (0.11) -0.01% (0.11) 0.00% - -0.01% (0.11)Piramal Dutch IM Holdco B.V. 0.91% 134.76 -0.02% (0.20) 0.91% 6.19 0.31% 5.99PEL-DRG Dutch Holdco B.V. (and Subsidaries) -0.02% (2.88) -12.67% (158.69) 4.10% 27.98 -6.76% (130.71)
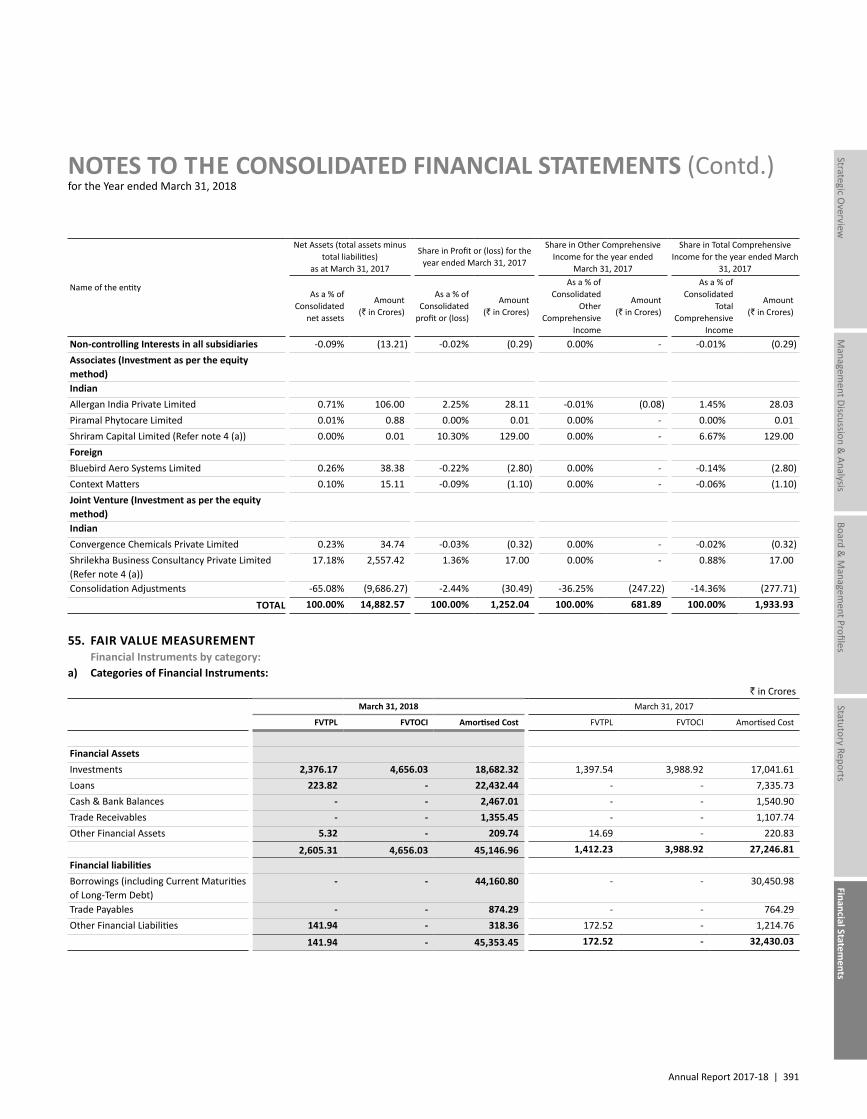
Annual Report 2017-18 | 391
Managem
ent Discussion & Analysis
Strategic Overview
Board &
Managem
ent ProfilesStatutory Reports
Financial Statements
NOTES TO THE CONSOLIDATED FINANCIAL STATEMENTS (Contd.)for the Year ended March 31, 2018
Name of the entity
Net Assets (total assets minus total liabilities)
as at March 31, 2017
Share in Profit or (loss) for the year ended March 31, 2017
Share in Other Comprehensive Income for the year ended
March 31, 2017
Share in Total Comprehensive Income for the year ended March
31, 2017
As a % of Consolidated
net assets
Amount (` in Crores)
As a % of Consolidated
profit or (loss)
Amount (` in Crores)
As a % of Consolidated
Other Comprehensive
Income
Amount (` in Crores)
As a % of Consolidated
Total Comprehensive
Income
Amount (` in Crores)
Non-controlling Interests in all subsidiaries -0.09% (13.21) -0.02% (0.29) 0.00% - -0.01% (0.29)Associates (Investment as per the equity method)IndianAllergan India Private Limited 0.71% 106.00 2.25% 28.11 -0.01% (0.08) 1.45% 28.03Piramal Phytocare Limited 0.01% 0.88 0.00% 0.01 0.00% - 0.00% 0.01Shriram Capital Limited (Refer note 4 (a)) 0.00% 0.01 10.30% 129.00 0.00% - 6.67% 129.00ForeignBluebird Aero Systems Limited 0.26% 38.38 -0.22% (2.80) 0.00% - -0.14% (2.80)Context Matters 0.10% 15.11 -0.09% (1.10) 0.00% - -0.06% (1.10)Joint Venture (Investment as per the equity method)IndianConvergence Chemicals Private Limited 0.23% 34.74 -0.03% (0.32) 0.00% - -0.02% (0.32)Shrilekha Business Consultancy Private Limited (Refer note 4 (a))
17.18% 2,557.42 1.36% 17.00 0.00% - 0.88% 17.00
Consolidation Adjustments -65.08% (9,686.27) -2.44% (30.49) -36.25% (247.22) -14.36% (277.71)TOTAL 100.00% 14,882.57 100.00% 1,252.04 100.00% 681.89 100.00% 1,933.93
55. FAIR VALUE MEASUREMENT Financial Instruments by category:a) Categories of Financial Instruments:
` in CroresMarch 31, 2018 March 31, 2017
FVTPL FVTOCI Amortised Cost FVTPL FVTOCI Amortised Cost
Financial AssetsInvestments 2,376.17 4,656.03 18,682.32 1,397.54 3,988.92 17,041.61Loans 223.82 - 22,432.44 - - 7,335.73Cash & Bank Balances - - 2,467.01 - - 1,540.90Trade Receivables - - 1,355.45 - - 1,107.74Other Financial Assets 5.32 - 209.74 14.69 - 220.83
2,605.31 4,656.03 45,146.96 1,412.23 3,988.92 27,246.81Financial liabilitiesBorrowings (including Current Maturities of Long-Term Debt)
- - 44,160.80 - - 30,450.98
Trade Payables - - 874.29 - - 764.29Other Financial Liabilities 141.94 - 318.36 172.52 - 1,214.76
141.94 - 45,353.45 172.52 - 32,430.03
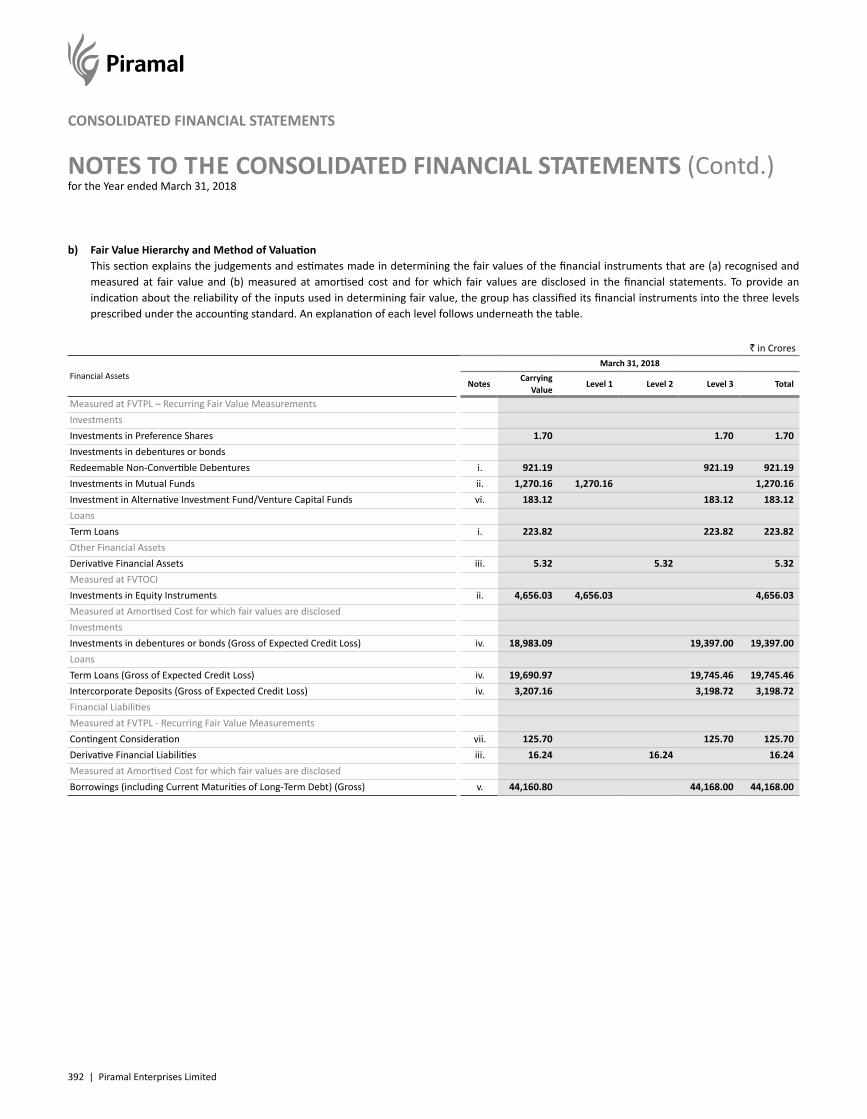
392 | Piramal Enterprises Limited
NOTES TO THE CONSOLIDATED FINANCIAL STATEMENTS (Contd.)for the Year ended March 31, 2018
CONSOLIDATED FINANCIAL STATEMENTS
b) Fair Value Hierarchy and Method of Valuation This section explains the judgements and estimates made in determining the fair values of the financial instruments that are (a) recognised and
measured at fair value and (b) measured at amortised cost and for which fair values are disclosed in the financial statements. To provide an indication about the reliability of the inputs used in determining fair value, the group has classified its financial instruments into the three levels prescribed under the accounting standard. An explanation of each level follows underneath the table.
` in Crores
Financial AssetsMarch 31, 2018
NotesCarrying
ValueLevel 1 Level 2 Level 3 Total
Measured at FVTPL – Recurring Fair Value MeasurementsInvestmentsInvestments in Preference Shares 1.70 1.70 1.70Investments in debentures or bondsRedeemable Non-Convertible Debentures i. 921.19 921.19 921.19Investments in Mutual Funds ii. 1,270.16 1,270.16 1,270.16Investment in Alternative Investment Fund/Venture Capital Funds vi. 183.12 183.12 183.12LoansTerm Loans i. 223.82 223.82 223.82Other Financial AssetsDerivative Financial Assets iii. 5.32 5.32 5.32Measured at FVTOCIInvestments in Equity Instruments ii. 4,656.03 4,656.03 4,656.03Measured at Amortised Cost for which fair values are disclosedInvestmentsInvestments in debentures or bonds (Gross of Expected Credit Loss) iv. 18,983.09 19,397.00 19,397.00LoansTerm Loans (Gross of Expected Credit Loss) iv. 19,690.97 19,745.46 19,745.46Intercorporate Deposits (Gross of Expected Credit Loss) iv. 3,207.16 3,198.72 3,198.72Financial LiabilitiesMeasured at FVTPL - Recurring Fair Value MeasurementsContingent Consideration vii. 125.70 125.70 125.70Derivative Financial Liabilities iii. 16.24 16.24 16.24Measured at Amortised Cost for which fair values are disclosedBorrowings (including Current Maturities of Long-Term Debt) (Gross) v. 44,160.80 44,168.00 44,168.00
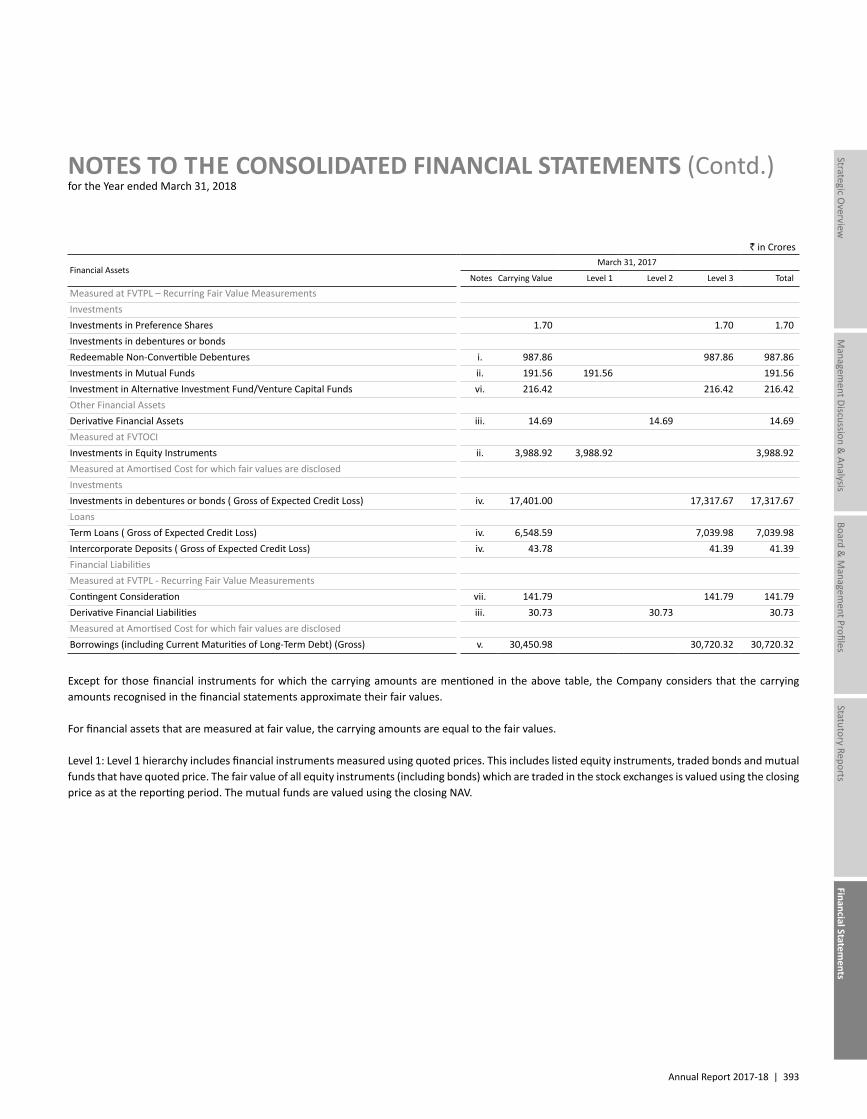
Annual Report 2017-18 | 393
Managem
ent Discussion & Analysis
Strategic Overview
Board &
Managem
ent ProfilesStatutory Reports
Financial Statements
NOTES TO THE CONSOLIDATED FINANCIAL STATEMENTS (Contd.)for the Year ended March 31, 2018
` in Crores
Financial AssetsMarch 31, 2017
Notes Carrying Value Level 1 Level 2 Level 3 Total
Measured at FVTPL – Recurring Fair Value MeasurementsInvestmentsInvestments in Preference Shares 1.70 1.70 1.70Investments in debentures or bondsRedeemable Non-Convertible Debentures i. 987.86 987.86 987.86Investments in Mutual Funds ii. 191.56 191.56 191.56Investment in Alternative Investment Fund/Venture Capital Funds vi. 216.42 216.42 216.42Other Financial AssetsDerivative Financial Assets iii. 14.69 14.69 14.69Measured at FVTOCIInvestments in Equity Instruments ii. 3,988.92 3,988.92 3,988.92Measured at Amortised Cost for which fair values are disclosedInvestmentsInvestments in debentures or bonds ( Gross of Expected Credit Loss) iv. 17,401.00 17,317.67 17,317.67LoansTerm Loans ( Gross of Expected Credit Loss) iv. 6,548.59 7,039.98 7,039.98Intercorporate Deposits ( Gross of Expected Credit Loss) iv. 43.78 41.39 41.39Financial LiabilitiesMeasured at FVTPL - Recurring Fair Value MeasurementsContingent Consideration vii. 141.79 141.79 141.79Derivative Financial Liabilities iii. 30.73 30.73 30.73Measured at Amortised Cost for which fair values are disclosedBorrowings (including Current Maturities of Long-Term Debt) (Gross) v. 30,450.98 30,720.32 30,720.32
Except for those financial instruments for which the carrying amounts are mentioned in the above table, the Company considers that the carrying amounts recognised in the financial statements approximate their fair values.
For financial assets that are measured at fair value, the carrying amounts are equal to the fair values.
Level 1: Level 1 hierarchy includes financial instruments measured using quoted prices. This includes listed equity instruments, traded bonds and mutual funds that have quoted price. The fair value of all equity instruments (including bonds) which are traded in the stock exchanges is valued using the closing price as at the reporting period. The mutual funds are valued using the closing NAV.
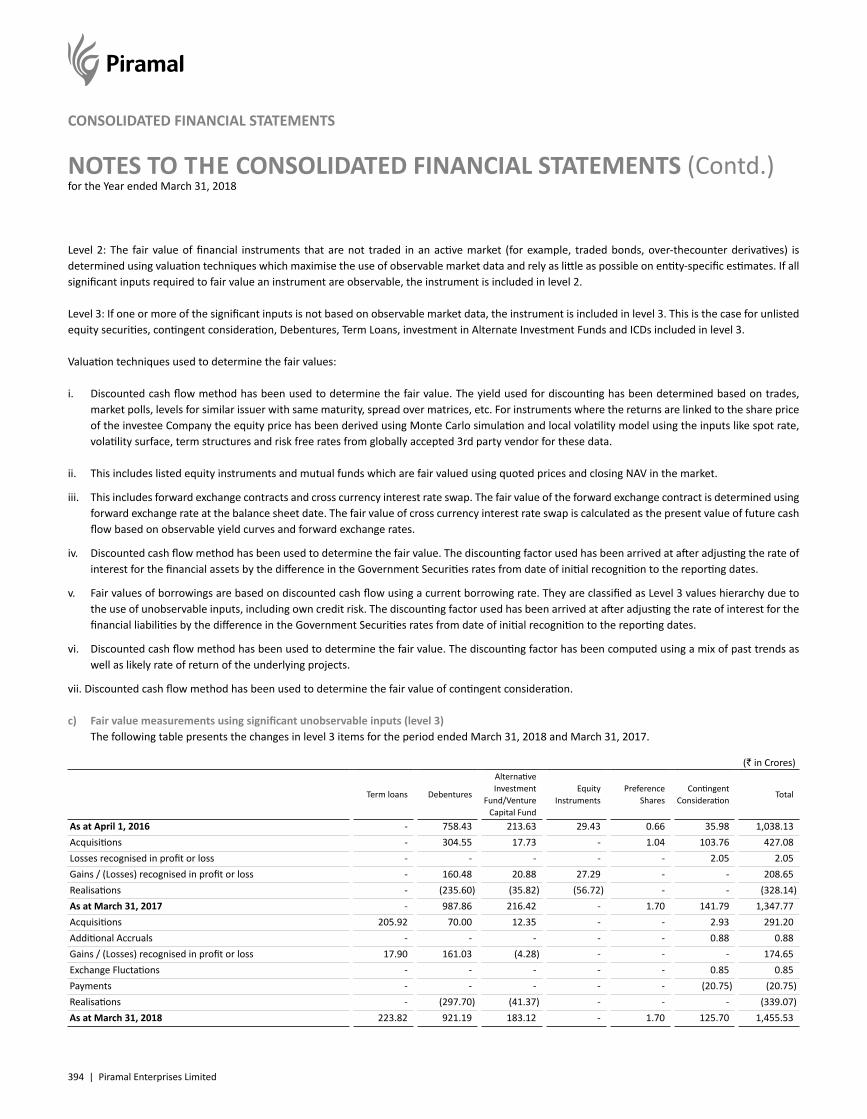
394 | Piramal Enterprises Limited
NOTES TO THE CONSOLIDATED FINANCIAL STATEMENTS (Contd.)for the Year ended March 31, 2018
CONSOLIDATED FINANCIAL STATEMENTS
Level 2: The fair value of financial instruments that are not traded in an active market (for example, traded bonds, over-thecounter derivatives) is determined using valuation techniques which maximise the use of observable market data and rely as little as possible on entity-specific estimates. If all significant inputs required to fair value an instrument are observable, the instrument is included in level 2.
Level 3: If one or more of the significant inputs is not based on observable market data, the instrument is included in level 3. This is the case for unlisted equity securities, contingent consideration, Debentures, Term Loans, investment in Alternate Investment Funds and ICDs included in level 3.
Valuation techniques used to determine the fair values:
i. Discounted cash flow method has been used to determine the fair value. The yield used for discounting has been determined based on trades, market polls, levels for similar issuer with same maturity, spread over matrices, etc. For instruments where the returns are linked to the share price of the investee Company the equity price has been derived using Monte Carlo simulation and local volatility model using the inputs like spot rate, volatility surface, term structures and risk free rates from globally accepted 3rd party vendor for these data.
ii. This includes listed equity instruments and mutual funds which are fair valued using quoted prices and closing NAV in the market.
iii. This includes forward exchange contracts and cross currency interest rate swap. The fair value of the forward exchange contract is determined using forward exchange rate at the balance sheet date. The fair value of cross currency interest rate swap is calculated as the present value of future cash flow based on observable yield curves and forward exchange rates.
iv. Discounted cash flow method has been used to determine the fair value. The discounting factor used has been arrived at after adjusting the rate of interest for the financial assets by the difference in the Government Securities rates from date of initial recognition to the reporting dates.
v. Fair values of borrowings are based on discounted cash flow using a current borrowing rate. They are classified as Level 3 values hierarchy due to the use of unobservable inputs, including own credit risk. The discounting factor used has been arrived at after adjusting the rate of interest for the financial liabilities by the difference in the Government Securities rates from date of initial recognition to the reporting dates.
vi. Discounted cash flow method has been used to determine the fair value. The discounting factor has been computed using a mix of past trends as well as likely rate of return of the underlying projects.
vii. Discounted cash flow method has been used to determine the fair value of contingent consideration.
c) Fair value measurements using significant unobservable inputs (level 3) The following table presents the changes in level 3 items for the period ended March 31, 2018 and March 31, 2017.
(` in Crores)
Term loans Debentures
Alternative Investment
Fund/Venture Capital Fund
Equity Instruments
Preference Shares
Contingent Consideration
Total
As at April 1, 2016 - 758.43 213.63 29.43 0.66 35.98 1,038.13Acquisitions - 304.55 17.73 - 1.04 103.76 427.08Losses recognised in profit or loss - - - - - 2.05 2.05Gains / (Losses) recognised in profit or loss - 160.48 20.88 27.29 - - 208.65Realisations - (235.60) (35.82) (56.72) - - (328.14)As at March 31, 2017 - 987.86 216.42 - 1.70 141.79 1,347.77Acquisitions 205.92 70.00 12.35 - - 2.93 291.20Additional Accruals - - - - - 0.88 0.88Gains / (Losses) recognised in profit or loss 17.90 161.03 (4.28) - - - 174.65Exchange Fluctations - - - - - 0.85 0.85Payments - - - - - (20.75) (20.75)Realisations - (297.70) (41.37) - - - (339.07)As at March 31, 2018 223.82 921.19 183.12 - 1.70 125.70 1,455.53
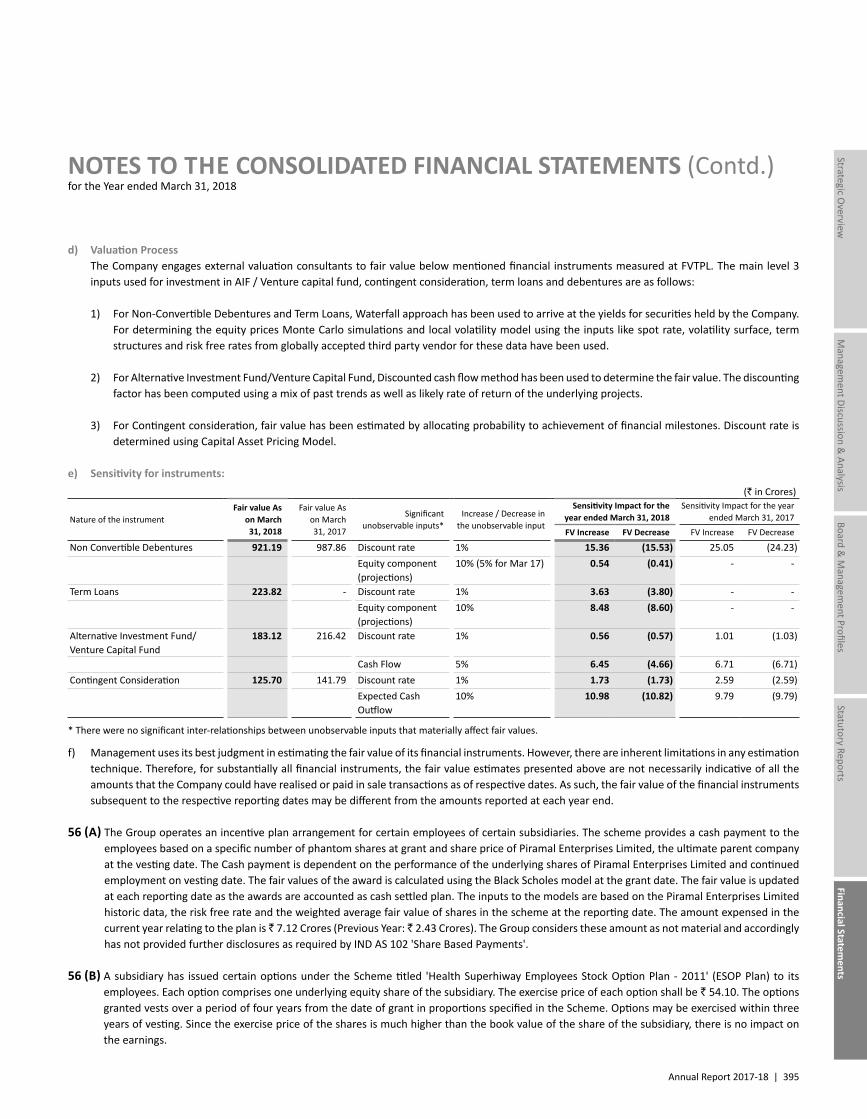
Annual Report 2017-18 | 395
Managem
ent Discussion & Analysis
Strategic Overview
Board &
Managem
ent ProfilesStatutory Reports
Financial Statements
NOTES TO THE CONSOLIDATED FINANCIAL STATEMENTS (Contd.)for the Year ended March 31, 2018
d) Valuation Process The Company engages external valuation consultants to fair value below mentioned financial instruments measured at FVTPL. The main level 3
inputs used for investment in AIF / Venture capital fund, contingent consideration, term loans and debentures are as follows:
1) For Non-Convertible Debentures and Term Loans, Waterfall approach has been used to arrive at the yields for securities held by the Company. For determining the equity prices Monte Carlo simulations and local volatility model using the inputs like spot rate, volatility surface, term structures and risk free rates from globally accepted third party vendor for these data have been used.
2) For Alternative Investment Fund/Venture Capital Fund, Discounted cash flow method has been used to determine the fair value. The discounting factor has been computed using a mix of past trends as well as likely rate of return of the underlying projects.
3) For Contingent consideration, fair value has been estimated by allocating probability to achievement of financial milestones. Discount rate is determined using Capital Asset Pricing Model.
e) Sensitivity for instruments:(` in Crores)
Nature of the instrumentFair value As
on March 31, 2018
Fair value As on March 31, 2017
Significant unobservable inputs*
Increase / Decrease in the unobservable input
Sensitivity Impact for the year ended March 31, 2018
Sensitivity Impact for the year ended March 31, 2017
FV Increase FV Decrease FV Increase FV Decrease
Non Convertible Debentures 921.19 987.86 Discount rate 1% 15.36 (15.53) 25.05 (24.23)Equity component (projections)
10% (5% for Mar 17) 0.54 (0.41) - -
Term Loans 223.82 - Discount rate 1% 3.63 (3.80) - -Equity component (projections)
10% 8.48 (8.60) - -
Alternative Investment Fund/Venture Capital Fund
183.12 216.42 Discount rate 1% 0.56 (0.57) 1.01 (1.03)
Cash Flow 5% 6.45 (4.66) 6.71 (6.71)Contingent Consideration 125.70 141.79 Discount rate 1% 1.73 (1.73) 2.59 (2.59)
Expected Cash Outflow
10% 10.98 (10.82) 9.79 (9.79)
* There were no significant inter-relationships between unobservable inputs that materially affect fair values.
f) Management uses its best judgment in estimating the fair value of its financial instruments. However, there are inherent limitations in any estimation technique. Therefore, for substantially all financial instruments, the fair value estimates presented above are not necessarily indicative of all the amounts that the Company could have realised or paid in sale transactions as of respective dates. As such, the fair value of the financial instruments subsequent to the respective reporting dates may be different from the amounts reported at each year end.
56 (A) The Group operates an incentive plan arrangement for certain employees of certain subsidiaries. The scheme provides a cash payment to the employees based on a specific number of phantom shares at grant and share price of Piramal Enterprises Limited, the ultimate parent company at the vesting date. The Cash payment is dependent on the performance of the underlying shares of Piramal Enterprises Limited and continued employment on vesting date. The fair values of the award is calculated using the Black Scholes model at the grant date. The fair value is updated at each reporting date as the awards are accounted as cash settled plan. The inputs to the models are based on the Piramal Enterprises Limited historic data, the risk free rate and the weighted average fair value of shares in the scheme at the reporting date. The amount expensed in the current year relating to the plan is ̀ 7.12 Crores (Previous Year: ̀ 2.43 Crores). The Group considers these amount as not material and accordingly has not provided further disclosures as required by IND AS 102 'Share Based Payments'.
56 (B) A subsidiary has issued certain options under the Scheme titled 'Health Superhiway Employees Stock Option Plan - 2011' (ESOP Plan) to its employees. Each option comprises one underlying equity share of the subsidiary. The exercise price of each option shall be ` 54.10. The options granted vests over a period of four years from the date of grant in proportions specified in the Scheme. Options may be exercised within three years of vesting. Since the exercise price of the shares is much higher than the book value of the share of the subsidiary, there is no impact on the earnings.
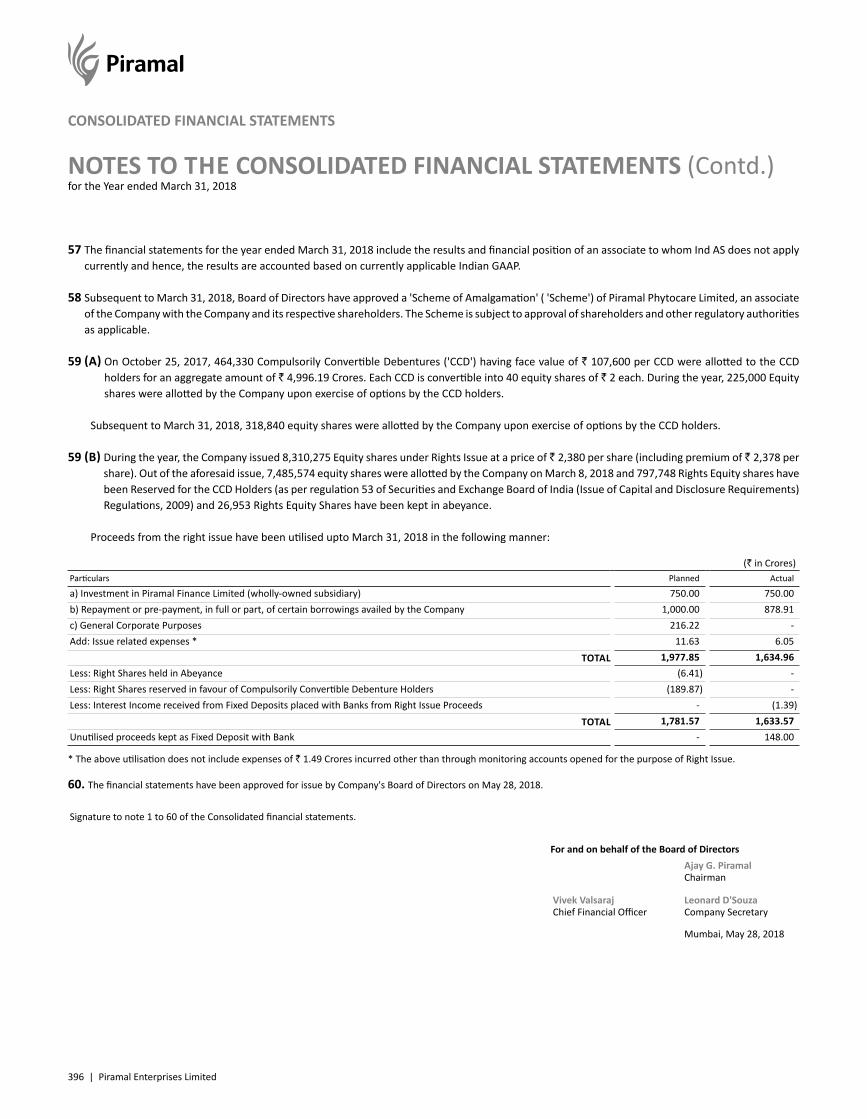
396 | Piramal Enterprises Limited
NOTES TO THE CONSOLIDATED FINANCIAL STATEMENTS (Contd.)for the Year ended March 31, 2018
CONSOLIDATED FINANCIAL STATEMENTS
57 The financial statements for the year ended March 31, 2018 include the results and financial position of an associate to whom Ind AS does not apply currently and hence, the results are accounted based on currently applicable Indian GAAP.
58 Subsequent to March 31, 2018, Board of Directors have approved a 'Scheme of Amalgamation' ( 'Scheme') of Piramal Phytocare Limited, an associate of the Company with the Company and its respective shareholders. The Scheme is subject to approval of shareholders and other regulatory authorities as applicable.
59 (A) On October 25, 2017, 464,330 Compulsorily Convertible Debentures ('CCD') having face value of ` 107,600 per CCD were allotted to the CCD holders for an aggregate amount of ` 4,996.19 Crores. Each CCD is convertible into 40 equity shares of ` 2 each. During the year, 225,000 Equity shares were allotted by the Company upon exercise of options by the CCD holders.
Subsequent to March 31, 2018, 318,840 equity shares were allotted by the Company upon exercise of options by the CCD holders.
59 (B) During the year, the Company issued 8,310,275 Equity shares under Rights Issue at a price of ` 2,380 per share (including premium of ` 2,378 per share). Out of the aforesaid issue, 7,485,574 equity shares were allotted by the Company on March 8, 2018 and 797,748 Rights Equity shares have been Reserved for the CCD Holders (as per regulation 53 of Securities and Exchange Board of India (Issue of Capital and Disclosure Requirements) Regulations, 2009) and 26,953 Rights Equity Shares have been kept in abeyance.
Proceeds from the right issue have been utilised upto March 31, 2018 in the following manner:
(` in Crores)Particulars Planned Actual
a) Investment in Piramal Finance Limited (wholly-owned subsidiary) 750.00 750.00b) Repayment or pre-payment, in full or part, of certain borrowings availed by the Company 1,000.00 878.91c) General Corporate Purposes 216.22 -Add: Issue related expenses * 11.63 6.05
TOTAL 1,977.85 1,634.96Less: Right Shares held in Abeyance (6.41) -Less: Right Shares reserved in favour of Compulsorily Convertible Debenture Holders (189.87) -Less: Interest Income received from Fixed Deposits placed with Banks from Right Issue Proceeds - (1.39)
TOTAL 1,781.57 1,633.57Unutilised proceeds kept as Fixed Deposit with Bank - 148.00
* The above utilisation does not include expenses of ` 1.49 Crores incurred other than through monitoring accounts opened for the purpose of Right Issue.
60. The financial statements have been approved for issue by Company's Board of Directors on May 28, 2018.
Signature to note 1 to 60 of the Consolidated financial statements.
For and on behalf of the Board of DirectorsAjay G. PiramalChairman
Vivek Valsaraj Chief Financial Officer
Leonard D'SouzaCompany Secretary
Mumbai, May 28, 2018
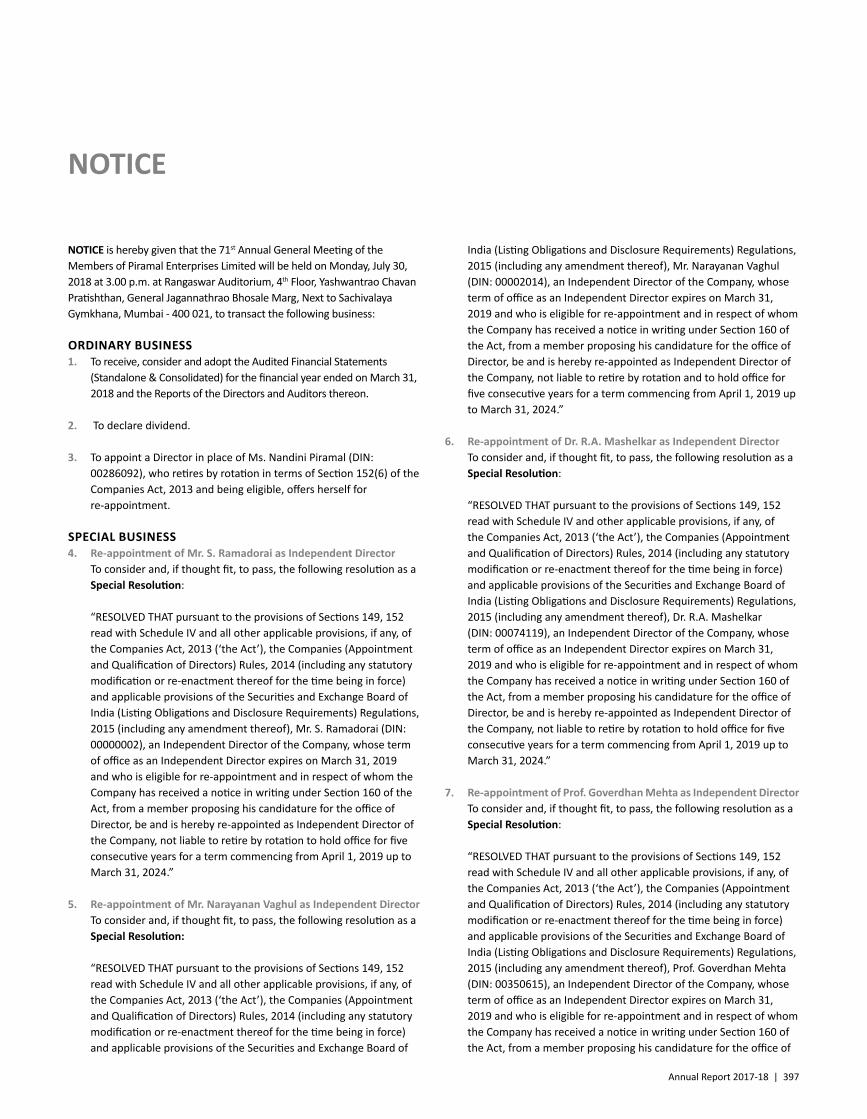
Annual Report 2017-18 | 397
NOTICE is hereby given that the 71st Annual General Meeting of the Members of Piramal Enterprises Limited will be held on Monday, July 30, 2018 at 3.00 p.m. at Rangaswar Auditorium, 4th Floor, Yashwantrao Chavan Pratishthan, General Jagannathrao Bhosale Marg, Next to Sachivalaya Gymkhana, Mumbai - 400 021, to transact the following business:
ORDINARY BUSINESS1. To receive, consider and adopt the Audited Financial Statements
(Standalone & Consolidated) for the financial year ended on March 31, 2018 and the Reports of the Directors and Auditors thereon.
2. To declare dividend.
3. To appoint a Director in place of Ms. Nandini Piramal (DIN: 00286092), who retires by rotation in terms of Section 152(6) of the Companies Act, 2013 and being eligible, offers herself for re-appointment.
SPECIAL BUSINESS4. Re-appointment of Mr. S. Ramadorai as Independent Director To consider and, if thought fit, to pass, the following resolution as a
Special Resolution:
“RESOLVED THAT pursuant to the provisions of Sections 149, 152 read with Schedule IV and all other applicable provisions, if any, of the Companies Act, 2013 (‘the Act’), the Companies (Appointment and Qualification of Directors) Rules, 2014 (including any statutory modification or re-enactment thereof for the time being in force) and applicable provisions of the Securities and Exchange Board of India (Listing Obligations and Disclosure Requirements) Regulations, 2015 (including any amendment thereof), Mr. S. Ramadorai (DIN: 00000002), an Independent Director of the Company, whose term of office as an Independent Director expires on March 31, 2019 and who is eligible for re-appointment and in respect of whom the Company has received a notice in writing under Section 160 of the Act, from a member proposing his candidature for the office of Director, be and is hereby re-appointed as Independent Director of the Company, not liable to retire by rotation to hold office for five consecutive years for a term commencing from April 1, 2019 up to March 31, 2024.”
5. Re-appointment of Mr. Narayanan Vaghul as Independent Director To consider and, if thought fit, to pass, the following resolution as a
Special Resolution:
“RESOLVED THAT pursuant to the provisions of Sections 149, 152 read with Schedule IV and all other applicable provisions, if any, of the Companies Act, 2013 (‘the Act’), the Companies (Appointment and Qualification of Directors) Rules, 2014 (including any statutory modification or re-enactment thereof for the time being in force) and applicable provisions of the Securities and Exchange Board of
India (Listing Obligations and Disclosure Requirements) Regulations, 2015 (including any amendment thereof), Mr. Narayanan Vaghul (DIN: 00002014), an Independent Director of the Company, whose term of office as an Independent Director expires on March 31, 2019 and who is eligible for re-appointment and in respect of whom the Company has received a notice in writing under Section 160 of the Act, from a member proposing his candidature for the office of Director, be and is hereby re-appointed as Independent Director of the Company, not liable to retire by rotation and to hold office for five consecutive years for a term commencing from April 1, 2019 up to March 31, 2024.”
6. Re-appointment of Dr. R.A. Mashelkar as Independent Director To consider and, if thought fit, to pass, the following resolution as a
Special Resolution:
“RESOLVED THAT pursuant to the provisions of Sections 149, 152 read with Schedule IV and other applicable provisions, if any, of the Companies Act, 2013 (‘the Act’), the Companies (Appointment and Qualification of Directors) Rules, 2014 (including any statutory modification or re-enactment thereof for the time being in force) and applicable provisions of the Securities and Exchange Board of India (Listing Obligations and Disclosure Requirements) Regulations, 2015 (including any amendment thereof), Dr. R.A. Mashelkar (DIN: 00074119), an Independent Director of the Company, whose term of office as an Independent Director expires on March 31, 2019 and who is eligible for re-appointment and in respect of whom the Company has received a notice in writing under Section 160 of the Act, from a member proposing his candidature for the office of Director, be and is hereby re-appointed as Independent Director of the Company, not liable to retire by rotation to hold office for five consecutive years for a term commencing from April 1, 2019 up to March 31, 2024.”
7. Re-appointment of Prof. Goverdhan Mehta as Independent Director To consider and, if thought fit, to pass, the following resolution as a
Special Resolution:
“RESOLVED THAT pursuant to the provisions of Sections 149, 152 read with Schedule IV and all other applicable provisions, if any, of the Companies Act, 2013 (‘the Act’), the Companies (Appointment and Qualification of Directors) Rules, 2014 (including any statutory modification or re-enactment thereof for the time being in force) and applicable provisions of the Securities and Exchange Board of India (Listing Obligations and Disclosure Requirements) Regulations, 2015 (including any amendment thereof), Prof. Goverdhan Mehta (DIN: 00350615), an Independent Director of the Company, whose term of office as an Independent Director expires on March 31, 2019 and who is eligible for re-appointment and in respect of whom the Company has received a notice in writing under Section 160 of the Act, from a member proposing his candidature for the office of
NOTICE
398 | Piramal Enterprises Limited
Director, be and is hereby re-appointed as Independent Director of the Company, not liable to retire by rotation to hold office for five consecutive years for a term commencing from April 1, 2019 up to March 31, 2024.”
8. Re-appointment of Mr. Keki Dadiseth as Independent Director To consider and, if thought fit, to pass, the following resolution as a
Special Resolution:
“RESOLVED THAT pursuant to the provisions of Sections 149, 152 read with Schedule IV and all other applicable provisions, if any, of the Companies Act, 2013 (‘the Act’), the Companies (Appointment and Qualification of Directors) Rules, 2014 (including any statutory modification or re-enactment thereof for the time being in force) and applicable provisions of the Securities and Exchange Board of India (Listing Obligations and Disclosure Requirements) Regulations, 2015, including any amendment thereof, Mr. Keki Dadiseth (DIN: 00052165), an Independent Director of the Company, whose term of office as an Independent Director expires on March 31, 2019 and who is eligible for re-appointment and in respect of whom the Company has received a notice in writing under Section 160 of the Act, from a member proposing his candidature for the office of Director, be and is hereby re-appointed as Independent Director of the Company, not liable to retire by rotation to hold office for five consecutive years for a term commencing from April 1, 2019 up to March 31, 2024.”
9. Re-appointment of Mr. Deepak Satwalekar as Independent Director To consider and, if thought fit, to pass, the following resolution as a
Special Resolution:
“RESOLVED THAT pursuant to the provisions of Sections 149, 152 read with Schedule IV and all other applicable provisions, if any, of the Companies Act, 2013 (‘the Act’), the Companies (Appointment and Qualification of Directors) Rules, 2014 (including any statutory modification or re-enactment thereof for the time being in force) and applicable provisions of the Securities and Exchange Board of India (Listing Obligations and Disclosure Requirements) Regulations, 2015, including any amendment thereof, Mr. Deepak Satwalekar (DIN: 00009627), an Independent Director of the Company, whose term of office as an Independent Director expires on March 31, 2019 and who is eligible for re-appointment and in respect of whom the Company has received a notice in writing under Section 160 of the Act, from a member proposing his candidature for the office of Director, be and is hereby re-appointed as Independent Director of the Company, not liable to retire by rotation to hold office for five consecutive years for a term commencing from April 1, 2019 up to March 31, 2024.”
10. Re-appointment of Mr. Gautam Banerjee as Independent Director To consider and, if thought fit, to pass, the following resolution as a
Special Resolution:
“RESOLVED THAT pursuant to the provisions of Sections 149, 152 read with Schedule IV and all other applicable provisions, if any, of the Companies Act, 2013 (‘the Act’), the Companies (Appointment and Qualification of Directors) Rules, 2014 (including any statutory
modification or re-enactment thereof for the time being in force) and applicable provisions of the Securities and Exchange Board of India (Listing Obligations and Disclosure Requirements) Regulations, 2015 (including any amendment thereof), Mr. Gautam Banerjee (DIN: 03031655), an Independent Director of the Company, whose term of office as an Independent Director expires on March 31, 2019 and who is eligible for re-appointment and in respect of whom the Company has received a notice in writing under Section 160 of the Act, from a member proposing his candidature for the office of Director, be and is hereby re-appointed as Independent Director of the Company, not liable to retire by rotation to hold office for five consecutive years for a term commencing from April 1, 2019 up to March 31, 2024.”
11. Re-appointment of Mr. Siddharth Mehta as Independent Director To consider and, if thought fit, to pass, the following resolution as a
Special Resolution:
“RESOLVED THAT pursuant to the provisions of Sections 149, 152 read with Schedule IV and all other applicable provisions, if any, of the Companies Act, 2013 (‘the Act’), the Companies (Appointment and Qualification of Directors) Rules, 2014 (including any statutory modification or re-enactment thereof for the time being in force) and applicable provisions of the Securities and Exchange Board of India (Listing Obligations and Disclosure Requirements) Regulations, 2015, including any amendment thereof, Mr. Siddharth Mehta (DIN: 06530606), an Independent Director of the Company, whose term of office as an Independent Director expires on March 31, 2019 and who is eligible for re-appointment and in respect of whom the Company has received a notice in writing under Section 160 of the Act, from a member proposing his candidature for the office of Director, be and is hereby re-appointed as Independent Director of the Company, not liable to retire by rotation to hold office for five consecutive years for a term commencing from April 1, 2019 up to March 31, 2024.”
12. Re-appointment of Dr. (Mrs.) Swati A. Piramal as Vice-Chairperson To consider and, if thought fit, to pass, the following resolution as a
Special Resolution:
“RESOLVED THAT subject to and in accordance with the provisions of Sections 196, 197 and Schedule V read with the Companies (Appointment and Remuneration of Managerial Personnel) Rules, 2014 and all other applicable provisions, if any, of the Companies Act, 2013 (‘the Act’) (including any statutory modifications or re-enactment thereof for the time being in force), approval of the members be and is hereby accorded to the re-appointment of Dr. (Mrs.) Swati A. Piramal (DIN: 00067125) as Whole – Time Director designated as ‘Vice – Chairperson’ of the Company, liable to retire by rotation with effect from November 20, 2017, for a further period of 5 years, upon the terms and conditions including payment of remuneration, perquisites and benefits as set out in the draft of the Agreement to be entered into between the Company and Dr. (Mrs.) Swati A. Piramal and main terms of which are set out hereunder, which have been approved and recommended by the Nomination and Remuneration Committee and the Board
Annual Report 2017-18 | 399
of Directors, which Draft Agreement is hereby approved, with liberty and power to the Board of Directors (‘the Board’ which term shall include its duly empowered Committee constituted / to be constituted by it to exercise its powers including the powers conferred by this resolution) to grant annual increments and to alter and vary from time to time the terms and conditions of Dr. Piramal’s appointment, including the amount and type of perquisites, allowances and benefits to be provided to Dr. Piramal subject to the applicable provisions of the Act, including Schedule V thereof:
a) Basic Salary: ` 3,00,43,260 p.a. (i.e. ` 25,03,605 per month)
b) Perquisites and Allowances: Dr. Piramal will be entitled to perquisites, benefits and allowances like furnished residential accommodation (or house rent allowance in lieu thereof), special allowance, reimbursement of expenses in respect of gas, electricity and water, reimbursement of telephone expenses, furnishing and repairs, medical reimbursement for self and family, Leave Travel Allowance, personal accident insurance, leave and encashment of leave, contributions to provident fund and superannuation or annuity fund, gratuity and/or contribution to gratuity fund, chauffeur driven company maintained / leased cars (or allowances in lieu thereof) and such other payments in the nature of perquisites, benefits and allowances as per Company policy in force from time to time or as may otherwise be decided by the Board;
In arriving at the value of perquisites, in so far as there exists a provision for valuation of such perquisites under the Income Tax Rules, the value shall be determined on the basis of the Income Tax Rules in force from time to time;
PROVIDED HOWEVER THAT the Total Fixed Pay (as defined hereinbelow) for FY 2019 shall not exceed ` 4,26,93,156 per annum, with authority to the Board to grant such annual increments and/or revisions in the Total Fixed Pay and/or in the components thereof from time to time during the tenure of her appointment, subject to the applicable provisions of Schedule V of the Act as may be amended from time to time PROVIDED THAT such annual increments and/or revisions shall not exceed 20% per annum of Dr. Piramal’s last drawn Total Fixed Pay;
PROVIDED FURTHER THAT the limits referred to herein shall not apply to those components of her perquisites which, as per Company Policy in force from time to time, are reimbursable at actuals;
Total Fixed Pay: For the purpose of this resolution, the term ‘Total Fixed Pay’ shall mean the aggregate of and shall include all fixed components (including basic salary) of Dr. Piramal’s remuneration, all allowances and the value of all perquisites as per Company Policy in force from time to time, excluding Performance Linked Incentive;
c) Performance Linked Incentive: In addition to Total Fixed Pay, Dr. Piramal shall also be entitled to Performance Linked Incentive of such amount as may be determined by the Board for each financial year of the Company or part thereof, subject to the applicable provisions of Schedule V of the Act, taking into consideration various criteria, including the performance of Dr. Piramal and the performance of the Company PROVIDED THAT the total Performance Linked Incentive shall not exceed 50% p.a. of the last drawn Total Fixed Pay;
RESOLVED FURTHER THAT if in any financial year, the Company has no profits or its profits are inadequate, Dr. Piramal shall be entitled to receive the aforesaid remuneration, perquisites, performance linked incentive and benefits on the same terms as set out above, subject to compliance with the applicable provisions of Schedule V of the Act, if and to the extent necessary, with the approval of the Central Government.”
13. Re-appointment of Mr. Vijay Shah as Executive Director To consider and, if thought fit, to pass, the following resolution as a
Special Resolution:
“RESOLVED THAT subject to and in accordance with the provisions of Sections 196, 197, 203 and Schedule V read with the Companies (Appointment and Remuneration of Managerial Personnel) Rules, 2014 and all other applicable provisions, if any, of the Companies Act, 2013 (‘the Act’) (including any statutory modifications or re-enactment thereof for the time being in force), approval of the members be and is hereby accorded to the appointment of Mr. Vijay Shah (DIN: 00021276) as Whole-Time Director designated as ‘Executive Director’ of the Company, liable to retire by rotation with effect from January 1, 2018, for a further period of 3 years, upon the terms and conditions including payment of remuneration, perquisites and benefits as set out in the draft of the Agreement to be entered into between the Company and Mr. Vijay Shah and main terms of which are set out hereunder, which have been approved and recommended by the Nomination and Remuneration Committee and the Board of Directors, which Draft Agreement is hereby approved, with liberty and power to the Board of Directors (‘the Board’ which term shall include its duly empowered Committee constituted / to be constituted by it to exercise its powers including the powers conferred by this resolution) to re-designate him and/or reallocate his duties and responsibilities and to grant annual increments and to alter and vary from time to time the terms and conditions of Mr. Shah’s appointment, including the amount and type of perquisites, allowances and benefits to be provided to Mr. Shah subject to the applicable provisions of the Act, including Schedule V thereof:
a) Basic Salary: ` 2,96,45,916 p.a. (i.e. ` 24,70,493 per month)
b) Perquisites and Allowances: Mr. Vijay Shah will also be entitled to perquisites, benefits and allowances like furnished residential accommodation (or house rent allowance in lieu
400 | Piramal Enterprises Limited
thereof), special allowance, reimbursement of expenses in respect of gas, electricity and water, reimbursement of telephone expenses, furnishing and repairs, medical reimbursement for self and family, Leave Travel Allowance, personal accident insurance, leave and encashment of leave, contributions to provident fund and superannuation or annuity fund, gratuity and/or contribution to gratuity fund, chauffeur driven Company maintained / leased cars (or allowances in lieu thereof) and such other payments in the nature of perquisites, benefits and allowances as per Company policy in force from time to time or as may otherwise be decided by the Board;
In arriving at the value of perquisites, in so far as there exists a provision for valuation of such perquisites under the Income Tax Rules, the value shall be determined on the basis of the Income Tax Rules in force from time to time;
PROVIDED HOWEVER THAT the Total Fixed Pay (as defined hereinbelow) for FY 2019 shall not exceed ` 5,16,42,360 per annum, with authority to the Board to grant such annual increments and/or revisions in the Total Fixed Pay and/or in the components thereof from time to time during the tenure of his appointment, subject to the applicable provisions of Schedule V of the Act, as may be amended from time to time PROVIDED THAT such annual increments and / or revisions shall not exceed 20% per annum of Mr. Shah’s last drawn Total Fixed Pay;
PROVIDED FURTHER THAT the limits referred to herein shall not apply to those components of his perquisites which, as per Company Policy in force from time to time, are reimbursable at actuals;
Total Fixed Pay: For the purpose of this resolution, the term ‘Total Fixed Pay’ shall mean the aggregate of and shall include all fixed components (including basic salary) of Mr. Shah’s remuneration, all allowances and the value of all perquisites as per Company Policy in force from time to time, excluding Performance Linked Incentive and Stock Options (‘ESOPs’);
c) Performance Linked Incentive: In addition to Total Fixed Pay, Mr. Shah shall also be entitled to Performance Linked Incentive of such amount as may be determined by the Board for each financial year of the Company or part thereof, subject to the applicable provisions of Schedule V of the Act, taking into consideration various criteria, including the performance of Mr. Shah and the performance of the Company PROVIDED THAT the total Performance Linked Incentive shall not exceed 30% per annum of the last drawn Total Fixed Pay;
d) ESOPs: In addition to Total Fixed Pay and Performance Linked Incentive, Mr. Shah shall also be entitled to ESOPs for each financial year or part thereof, under the Company’s Employees Stock Option Plans, in force from time to time;
RESOLVED FURTHER THAT if in any financial year, the Company has no profits or its profits are inadequate, Mr. Vijay Shah shall
be entitled to receive the aforesaid remuneration, perquisites, performance linked incentive and benefits on the same terms as set out above, subject to compliance with the applicable provisions of Schedule V of the Act, if and to the extent necessary, with the approval of the Central Government.”
14. Issue of Non-Convertible Debentures on Private Placement Basis To consider and, if thought fit, to pass the following resolution as a
Special Resolution:
“RESOLVED THAT pursuant to the provisions of Sections 42, 71 and all other applicable provisions, if any, of the Companies Act, 2013 (‘the Act’), read with the Companies (Prospectus and Allotment of Securities) Rules, 2014 and subject to the provisions of the Articles of Association of the Company and subject to compliance with such other provisions of law as may be applicable, approval of the members be and is hereby accorded to the Board of Directors of the Company (‘the Board’, which term shall include its duly empowered Committee(s) constituted/to be constituted by it for this purpose), to offer or invite subscriptions for secured/unsecured redeemable non-convertible debentures, in one or more series/tranches, on private placement, on such terms and conditions as the Board may, from time to time, determine and consider proper and most beneficial to the Company, including as to when the said Debentures be issued, the consideration for the issue, utilisation of the issue proceeds and all matters connected therewith or incidental thereto PROVIDED THAT the total amount that may be so raised in the aggregate, by such offer or invitation for subscriptions of the said Debentures, and outstanding at any point of time, shall be within the overall borrowing limit as approved by the shareholders under Section 180(1)(c) of the Act;
RESOLVED FURTHER THAT the Board be and is hereby authorised to do all such acts, deeds, matters and things as may be necessary or expedient for or in connection with this resolution and to settle any question or difficulty that may arise in this regard in the best interest of the Company.”
15. Ratification of remuneration of Cost Auditor To consider and, if thought fit, to pass the following resolution as an
Ordinary Resolution:
“RESOLVED THAT pursuant to the provisions of Section 148 and all other applicable provisions of the Companies Act, 2013 read with Companies (Audit and Auditors) Rules, 2014, the remuneration payable to M/s. G.R. Kulkarni & Associates, Cost Accountants, Mumbai (Registration No. 00168), the Cost Auditors appointed by the Board of Directors of the Company (‘the Board’, which term shall include its duly empowered Committee(s) constituted/to be constituted by it for this purpose), to conduct the audit of the cost records of the Company for the financial year ending March 31, 2019 amounting to ` 6,00,000/- (Rupees Six Lakhs) plus taxes as applicable and reimbursement of actual travel and out-of-pocket expenses be and is hereby ratified and confirmed;
Annual Report 2017-18 | 401
RESOLVED FURTHER THAT the Board be and is hereby authorized to do all such acts, deeds, matters and things as may be necessary or expedient for or in connection with this resolution and to settle any question or difficulty that may arise in this regard in the best interest of the Company.”
NOTES:1. A member entitled to attend and vote at the Annual General
Meeting (‘the Meeting’) is entitled to appoint a proxy to attend and to vote on a poll instead of himself and the proxy need not be a member of the Company. The instrument appointing the proxy should, however, be deposited at the Registered Office of the Company not less than forty-eight hours before the commencement of the Meeting.
A person can act as proxy on behalf of members not exceeding fifty and holding in the aggregate not more than ten percent of the total share capital of the Company. A member holding more than ten percent of the total share capital of the Company may appoint a single person as proxy. However, such person shall not act as a proxy for any other person or shareholder.
2. Corporate members intending to send their authorised representatives to attend the Meeting are requested to send to the Company a certified copy of the Board Resolution authorizing their representative to attend and vote on their behalf at the Meeting.
3. The Explanatory Statement pursuant to Section 102 of the Companies Act, 2013 is annexed hereto.
4. In case of joint holders attending the Meeting, only such joint holder who is higher in the order of names will be entitled to vote.
5. Relevant documents referred to in the Notice and Explanatory Statement are open for inspection at the Registered Office of the Company on all working days, except Saturdays, between 11.00 a.m. and 1.00 p.m., upto the date of the Meeting.
6. The Company has already notified closure of Register of Members and Transfer Books from Monday, July 23, 2018 to Monday, July 30, 2018 (both days inclusive) for determining the names of members eligible for dividend on equity shares.
7. Dividend on equity shares when declared at the Meeting, will be paid during the period from July 31, 2018 to August 4, 2018.
8. Route map giving directions to reach the venue of the 71st AGM is given at the end of the Notice.
9. Members are requested to bring their Attendance Slip along with their copy of the Annual Report to the Meeting.
10. In terms of the applicable provisions of the Companies Act, 1956/ Companies Act, 2013, the amount of dividend remaining unclaimed or unpaid for a period of seven years from the date of transfer to the unpaid dividend account is required to be transferred to the
Investor Education and Protection Fund. Those members who have so far not encashed their dividend warrants for the below mentioned dividends, may claim or approach the Company for the payment thereof before due date of transfer as the same will be transferred to the Investor Education and Protection Fund of the Central Government on the respective dates mentioned below. Intimation in this regard is being sent to the concerned shareholders periodically. Kindly note that after such dates, no claim shall lie against the Company in any respect thereof.
Financial Year Ended Due date of Transfer
31.03.2011 09.09.201831.03.2012 19.08.201931.03.2013 25.08.202031.03.2014 25.08.202131.03.2015 06.09.202231.03.2016 (Interim Dividend) 09.04.202331.03.2017 01.09.2024
11. Pursuant to Section 205C of the Companies Act, 1956 all unclaimed dividends for the financial years ended March 31, 1996 to March 31, 2010 have been transferred to the Investor Education and Protection Fund.
12. Pursuant to Section 205A of the Companies Act, 1956 all unclaimed dividends upto the financial year ended March 31, 1995 have been transferred to the General Revenue Account of the Central Government. Shareholders who have not encashed the dividend warrants for the said period(s) are requested to claim the same from the Central Government in the prescribed form.
13. Section 72 of the Companies Act, 2013 provides for Nomination by the shareholders of the Company in the prescribed Form No. SH- 13. If a member desires to cancel the earlier nomination and record fresh nomination, he may submit the same in Form No. SH-14. Both these forms are available on the website of the Company http://www.piramal.com/investors/forms under the Section, ‘Shareholder Services’. Shareholders are requested to avail this facility.
14. Over the years, as a result of allotment of shares arising out of earlier mergers, it is possible that multiple folios have been created. In the event of there being multiple folios on account of the above reason or otherwise, we request you to consolidate multiple folios existing in the same names and in identical order. In case you decide to consolidate your folios, you are requested to forward your share certificates to the Company’s Share Transfer Agent.
15. Members are requested to note that in case of transfers, transmission and transposition of names of shareholders in respect of shares held in physical form, submission of photocopy of PAN Card of both the transferor(s) and the transferee(s) is mandatory.
In case of deletion of name of deceased shareholder(s), in respect of shares held in physical form, the PAN Card of the surviving shareholder(s) is mandatory.
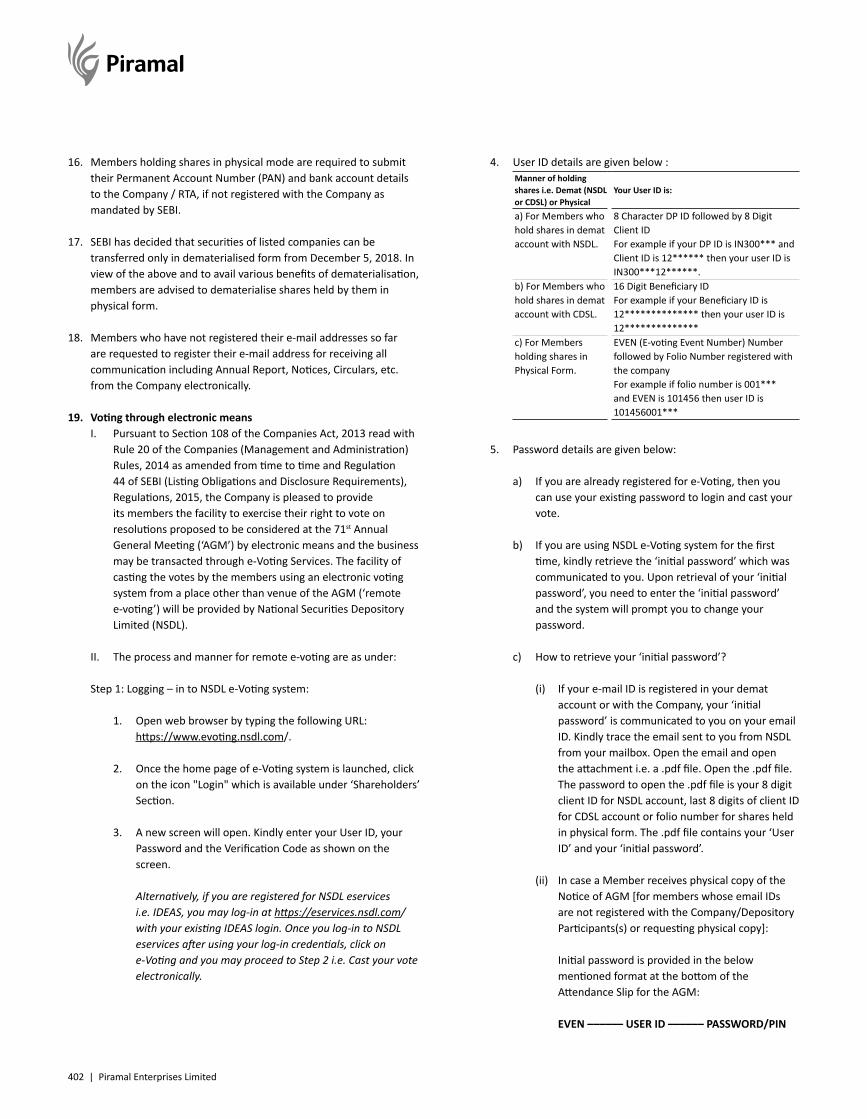
402 | Piramal Enterprises Limited
16. Members holding shares in physical mode are required to submit their Permanent Account Number (PAN) and bank account details to the Company / RTA, if not registered with the Company as mandated by SEBI.
17. SEBI has decided that securities of listed companies can be transferred only in dematerialised form from December 5, 2018. In view of the above and to avail various benefits of dematerialisation, members are advised to dematerialise shares held by them in physical form.
18. Members who have not registered their e-mail addresses so far are requested to register their e-mail address for receiving all communication including Annual Report, Notices, Circulars, etc. from the Company electronically.
19. Voting through electronic means I. Pursuant to Section 108 of the Companies Act, 2013 read with
Rule 20 of the Companies (Management and Administration) Rules, 2014 as amended from time to time and Regulation 44 of SEBI (Listing Obligations and Disclosure Requirements), Regulations, 2015, the Company is pleased to provide its members the facility to exercise their right to vote on resolutions proposed to be considered at the 71st Annual General Meeting (‘AGM’) by electronic means and the business may be transacted through e-Voting Services. The facility of casting the votes by the members using an electronic voting system from a place other than venue of the AGM (‘remote e-voting’) will be provided by National Securities Depository Limited (NSDL).
II. The process and manner for remote e-voting are as under:
Step 1: Logging – in to NSDL e-Voting system:
1. Open web browser by typing the following URL: https://www.evoting.nsdl.com/.
2. Once the home page of e-Voting system is launched, click on the icon "Login" which is available under ‘Shareholders’ Section.
3. A new screen will open. Kindly enter your User ID, your Password and the Verification Code as shown on the screen.
�Alternatively,�if�you�are�registered�for�NSDL�eservices�i.e.�IDEAS,�you�may�log-in�at�https://eservices.nsdl.com/�with�your�existing�IDEAS�login.�Once�you�log-in�to�NSDL�eservices�after�using�your�log-in�credentials,�click�on�e-Voting�and�you�may�proceed�to�Step�2�i.e.�Cast�your�vote�electronically.
4. User ID details are given below :Manner of holding shares i.e. Demat (NSDL or CDSL) or Physical
Your User ID is:
a) For Members who hold shares in demat account with NSDL.
8 Character DP ID followed by 8 Digit Client IDFor example if your DP ID is IN300*** and Client ID is 12****** then your user ID is IN300***12******.
b) For Members who hold shares in demat account with CDSL.
16 Digit Beneficiary IDFor example if your Beneficiary ID is 12************** then your user ID is 12**************
c) For Members holding shares in Physical Form.
EVEN (E-voting Event Number) Number followed by Folio Number registered with the companyFor example if folio number is 001*** and EVEN is 101456 then user ID is 101456001***
5. Password details are given below:
a) If you are already registered for e-Voting, then you can use your existing password to login and cast your vote.
b) If you are using NSDL e-Voting system for the first time, kindly retrieve the ‘initial password’ which was communicated to you. Upon retrieval of your ‘initial password’, you need to enter the ‘initial password’ and the system will prompt you to change your password.
c) How to retrieve your ‘initial password’?
(i) If your e-mail ID is registered in your demat account or with the Company, your ‘initial password’ is communicated to you on your email ID. Kindly trace the email sent to you from NSDL from your mailbox. Open the email and open the attachment i.e. a .pdf file. Open the .pdf file. The password to open the .pdf file is your 8 digit client ID for NSDL account, last 8 digits of client ID for CDSL account or folio number for shares held in physical form. The .pdf file contains your ‘User ID’ and your ‘initial password’.
(ii) In case a Member receives physical copy of the Notice of AGM [for members whose email IDs are not registered with the Company/Depository Participants(s) or requesting physical copy]:
Initial password is provided in the below mentioned format at the bottom of the Attendance Slip for the AGM:
EVEN –––––– USER ID –––––– PASSWORD/PIN
Annual Report 2017-18 | 403
6. If you are unable to retrieve or have not received the "initial password" or have forgotten your password:
a) Click on "Forgot User Details/Password?" (If you are holding shares in your demat account with NSDL or CDSL) option available on www.evoting.nsdl.com.
b) Click on "Physical User Reset Password?" (If you are holding shares in physical mode) option available on www.evoting.nsdl.com.
c) If you are still unable to retrieve the password by aforesaid two options, kindly send a request at [email protected] mentioning your demat account number/folio number, your PAN No., your name and your registered address.
7. After entering your password, kindly tick on Agree to "Terms and Conditions" by selecting the check box.
8. Thereafter, kindly click on "Login" button upon which the E-Voting home page will open.
Step 2: Casting your vote electronically:
1. On the Home page of e-Voting, click on e-Voting. Then, click on Active Voting Cycles.
2. After click on Active Voting Cycles, you will be able to see all the companies "EVEN" in which you are holding shares and whose voting cycle is in active status.
3. Select "EVEN" of the Company (PEL).
4. Now you are ready for e-Voting as the Voting page opens.
5. Cast your vote by selecting appropriate options i.e. assent or dissent, verify/modify the number of shares for which you wish to cast your vote and click on "Submit" and also "Confirm" when prompted.
6. Upon confirmation, the message "Vote cast successfully" will be displayed.
7. You may also print the details of the votes cast by you by clicking on the print option on the confirmation page.
8. Once you confirm your vote on the resolution, you will not be allowed to modify your vote.
Please note that:1. The voting period begins on July 27, 2018, at 10.00 a.m. and ends
on July 29, 2018, at 5.00 p.m. During this period shareholders of the Company, holding shares either in physical form or in dematerialised form, as on the cut-off date which is July 23, 2018, may cast their vote electronically. The voting rights of shareholders shall be in proportion to their shares in the paid-up equity share capital of the Company as on this cut-off date. The e-voting module shall be disabled by NSDL for voting after 5.00 p.m. on July 29, 2018.
2. Any person, who acquires shares of the Company and becomes member of the Company after dispatch of the notice and holding shares as of the cut-off date i.e. July 23, 2018, may obtain the login ID and password by sending a request at [email protected] or [email protected].
However, if you are already registered with NSDL for remote e-voting then you can use your existing user ID and password for casting your vote. If you forgot your password, you can reset your password by using ‘Forgot User Details/Password?’ or ‘Physical User Reset Password?’ option available on www.evoting.nsdl.com or contact NSDL at the following toll free no.: 1800-222-990.
3. You can also update your mobile number and e-mail id in the user profile details of the folio which may be used for sending future communication(s).
4. Institutional shareholders (i.e. other than individuals, HUF, NRI etc.) are required to send scanned copy (PDF/JPG Format) of the relevant Board Resolution/ Authority letter etc. with attested specimen signature of the duly authorized signatory(ies) who are authorized to vote, to the Scrutinizer by e-mail to [email protected] with a copy marked to [email protected].
5. It is strongly recommended not to share your password with any other person and take utmost care to keep your password confidential. Login to the e-voting website will be disabled upon five unsuccessful attempts to key in the correct password. In such an event, you will need to go through the “Forgot User Details/Password?” or “Physical User Reset Password?” option available on www.evoting.nsdl.com to reset the password.
6. In case of any queries, you may refer the Frequently Asked Questions (FAQs) for Members and remote e-voting user manual for Members available at the downloads section of www.evoting.nsdl.com or call on toll free no.: 1800-222-990.
404 | Piramal Enterprises Limited
7. Mr. N.L. Bhatia, Practising Company Secretary (Membership No. FCS 1176) has been appointed as the Scrutinizer to scrutinize the e-voting process and voting through ballot paper at the AGM in a fair and transparent manner.
8. The members would be able to cast their votes at the Meeting through ballot paper if they have not availed the remote e-voting facility. If the vote is cast through remote e-voting facility then the members cannot exercise their voting rights at the Meeting. However, the members who have cast their vote by remote e-voting prior to the AGM may also attend the AGM but shall not be entitled to cast their vote again.
9. The Scrutinizer shall within 48 hours of the conclusion of the AGM, submit a consolidated Scrutinizer’s report of the votes cast in favour or against, to the Chairman of the AGM (‘Chairman’) or to any
EXPLANATORY STATEMENT UNDER SECTION 102 OF THE COMPANIES ACT, 2013
Director or any person authorized by the Chairman for this purpose, who shall countersign the same.
10. The Results declared along with the Scrutinizer’s Report shall be placed on the Company’s website www.piramal.com and on the website of NSDL and communicated to the Stock Exchanges.
Registered Office: By Order of the BoardPiramal Ananta, Agastya Corporate Park, Opposite Fire Brigade, Kamani Junction, Kurla (West), Mumbai – 400 070.
Leonard D’Souza Company Secretary
ACS No.: A7922Dated: May 28, 2018
ITEM NOS. 4 TO 11Appointment of Independent DirectorsIn line with the provisions of Sections 149, 152 and other applicable provisions of the Companies Act, 2013 including the Rules made thereunder (‘the Act’) and the erstwhile Listing Agreement, the following Independent Directors of the Company were appointed at the Annual General Meeting of the Company held on July 25, 2014, to hold office for five consecutive years for a term up to March 31, 2019:
1. Mr. S. Ramadorai2. Mr. Narayanan Vaghul3. Dr. R.A. Mashelkar4. Prof. Goverdhan Mehta5. Mr. Keki Dadiseth6. Mr. Deepak Satwalekar7. Mr. Gautam Banerjee8. Mr. Siddharth Mehta
Sub-section (11) of Section 149 of the Act provides that Independent Directors shall not hold office for more than two consecutive terms.
The Board of Directors of the Company and the Nomination and Remuneration Committee have evaluated the performance of the Independent Directors and on the basis of the said evaluations have concluded that the Independent Directors fulfil their responsibilities towards the Company in a professional and ethical manner, actively participate in discussions during the Board and Committee meetings and act objectively and constructively while bringing an independent opinion during deliberations at the said meetings.
It is now proposed that the Independent Directors of the Company be appointed for a second term of five consecutive years, commencing from April 1, 2019 up to March 31, 2024.
None of the aforenamed Directors are disqualified from being appointed as Directors in terms of Section 164 of the Act and have given their consent to act as Directors.
The Company has also received declarations from all the above Directors that they meet with the criteria of independence as prescribed both under sub-section (6) of Section 149 of the Act and under the Securities and Exchange Board of India (Listing Obligations and Disclosure Requirements) Regulations, 2015 (‘Listing Regulations’).
The Company has also received separate notices in writing from a member, proposing the candidature of each of the aforenamed Directors for the office of Director of the Company.
In the opinion of the Board, they also fulfill the conditions for their re-appointment as Independent Directors as specified in the Act and the Listing Regulations. They are independent of the management.
Details of the Directors as required to be provided pursuant to Regulation 36(3) of the Listing Regulations and SS – 2 (Secretarial Standards on General Meetings) are provided as an Annexure to this Notice.
Mr. N. Vaghul, Dr. R.A. Mashelkar and Prof. Goverdhan Mehta are over 75 years of age and Mr. S. Ramadorai, Mr. Keki Dadiseth and Mr. Deepak Satwalekar will complete 75 years of age during the course of their second term of appointment as Independent Directors. In line with the SEBI (Listing Obligations and Disclosure Requirements) (Amendment) Regulations, 2018, the appointment or continuation of directorship of Non-Executive Directors must be approved by the Members by way of a Special Resolution. As regards Mr. Gautam Banerjee and Mr. Siddharth Mehta, they will not be attaining 75 years of age during the course of their second term. Nevertheless, a special resolution is proposed for them as well, as the same is also required under section 149(10) of the Act.
Annual Report 2017-18 | 405
The Board acknowledges that each of the Independent Directors are stalwarts in their respective areas of operation and leaders par-excellence. They bring to the table rich and varied expertise including financial, scientific and technological expertise and unmatched business acumen. Some of them are also recipients of numerous awards including the Padma Shri, Padma Bhushan and Padma Vibhushan (the highest forms of honour in the country), the leadership of the Company comprising the said Independent Directors is evidently best in class. The re-appointment of the above named Independent Directors will therefore be in the best interest of the Company.
Copy of the draft letter for appointment of as the Independent Directors setting out the terms and conditions is available for inspection by members at the Registered Office of the Company.
These Directors may be deemed to be interested in the respective resolutions as it concerns their appointment.
Save and except for the aforesaid Independent Directors, none of the other Directors / Key Managerial Personnel of the Company / their relatives are, in any way, concerned or interested, financially or otherwise, in the resolutions set out at Item Nos. 4 to 11 of the Notice.
The Board recommends the Special Resolutions set out at Item Nos. 4 to 11 of the Notice for approval by the shareholders.
ITEM NO. 12Re-appointment of Dr. (Mrs.) Swati Piramal as Vice-ChairpersonMembers will recall that by a Special Resolution passed at the Extraordinary General Meeting held on March 13, 2013, members had approved the appointment of Dr. (Mrs.) Swati A. Piramal (DIN No. 00067125) as Whole-Time Director designated as ‘Vice-Chairperson’, for a period of 5 years, w.e.f. November 20, 2012 i.e. upto November 19, 2017 and that by an Ordinary Resolution passed at the Annual General Meeting held on July 25, 2014, Dr. Piramal’s residual term of office was changed to director liable to retire by rotation.
The Board of Directors of the Company has on the basis of the recommendations made by the Nomination & Remuneration Committee and taking into consideration several factors, including the performance of Dr. Piramal, her contribution to the various strategies successfully executed by the Company which has added value to the Company, its shareholders and its employees, her contribution to and role played in the various strategic growth initiatives pursued in terms of new business initiatives as well as for the Company’s existing businesses and the significance of her role in achieving growth and performance targets given the attendant challenges and the responsibilities in this regard and other performance factors decided to continue the appointment of Dr. Piramal as Vice - Chairperson, liable to retire by rotation, for a further period of 5 years, w.e.f. November 20, 2017 and approved the terms and conditions of her appointment, including payment of remuneration, subject to the requisite approval of shareholders.
The terms of remuneration of Dr. Piramal are in accordance with the Remuneration Policy of the Company.
Dr. Piramal earned her medical degree from Mumbai University and completed her Masters in Public Health from the Harvard School of Public Health. She has used her background in medicine, public health and business to change the trajectory of healthcare, education and public policy in India. She is one of India’s leading scientists and industrialists and is involved in public health and innovation. Dr. Piramal is also a member of the Harvard Board of Overseers and Dean’s Advisor to Harvard Business School & Public Health.
Further details relating to Dr. Piramal as required to be provided pursuant to Regulation 36(3) of the Listing Regulations and SS – 2 (Secretarial Standards on General Meetings) are provided as an Annexure to this Notice.
The terms and conditions, including remuneration payable to Dr. Piramal are contained in the Draft Agreement (‘Agreement’) proposed to be entered into by the Company with Dr. Piramal, main terms of which are set out in the resolution at Item No. 12 of the accompanying Notice. A copy of the Agreement is open for inspection at the Registered Office of the Company on all working days, except Saturdays between 11.00 a.m. and 1.00 p.m. upto the date of the Meeting.
Except for Dr. (Mrs.) Swati A. Piramal, Mr. Ajay G. Piramal, Ms. Nandini Piramal, Mr. Anand Piramal, Directors of Company who are related to each other, none of the other Directors/ Key Managerial Personnel of the Company/ their relatives are, in any way, concerned or interested, financially or otherwise, in this resolution.
The Board recommends the Special Resolution set out at Item No. 12 of the Notice for approval by the shareholders.
ITEM NO. 13Re-appointment of Mr. Vijay Shah as Executive DirectorMembers will recall that by a Special Resolution passed at the 68th Annual General Meeting held on August 6, 2015, members had approved the appointment of Mr. Vijay Shah (DIN No. 00021276) as Whole-Time Director designated as ‘Executive Director’, for a period of 3 years, w.e.f. January 1, 2015, liable to retire by rotation.
The Board of Directors of the Company has on the basis of the recommendations made by the Nomination & Remuneration Committee and taking into consideration several factors, including the qualifications of Mr. Shah, skills and expertise in the fields of finance and general corporate management, performance during his existing tenure, growth and performance targets for the functions under his responsibility, familiarity with the business operations of the Company, commitment towards the Company and leadership skills decided to continue the appointment of Mr. Shah as Executive Director, liable to retire by rotation, for a further period of 3 years, w.e.f. January 1, 2018 and approved the terms and conditions of his appointment, including payment of remuneration, subject to the requisite approval of shareholders.
406 | Piramal Enterprises Limited
The terms of remuneration of Mr. Vijay Shah are in accordance with the Remuneration Policy of the Company.
Mr. Shah is a first class in B.Com and a Chartered Accountant (rank holder). He has also done a Management Education Programme from IIM, Ahmedabad and the Advanced Management Program from the Harvard Business School, Boston, USA and has more than 30 years of rich and varied experience in Corporate Management and Business Strategy.
Further details relating to Mr. Shah as required to be provided pursuant to Regulation 36(3) of the Listing Regulations and SS – 2 (Secretarial Standards on General Meetings) are provided as an Annexure to this Notice.
The terms and conditions, including remuneration payable to Mr. Vijay Shah are contained in the Draft Agreement (‘Agreement’) proposed to be entered into by the Company with Mr. Vijay Shah, main terms of which are set out in the resolution at Item No. 13 of the accompanying Notice. A copy of the Agreement is open for inspection at the Registered Office of the Company on all working days, except Saturdays between 11.00 a.m. and 1.00 p.m. upto the date of the Meeting.
Except for Mr. Shah, none of the other Directors/ Key Managerial Personnel of the Company/ their relatives are, in any way, concerned or interested, financially or otherwise,in this resolution.
The Board recommends the Special Resolution set out at Item No. 13 of the Notice for approval by the shareholders.
ITEM NO. 14Issue of Non-Convertible Debentures on Private Placement BasisIn terms of Sections 42 and 71 of the Companies Act, 2013 (‘the Act’) read with Rule 14(2) of the Companies (Prospectus and Allotment of Securities) Rules, 2014, in case an offer of or invitation to subscribe to Non-Convertible Debentures (‘NCDs’) is made by the Company on a private placement basis, the Company is required to seek the prior approval of its shareholders by means of a Special Resolution, on an annual basis for all the offers or invitations for such debentures during the year.
For the purpose of availing financial assistance (including borrowings) for its business or operations, the Company may offer or invite subscription to secured / unsecured redeemable NCDs on private placement basis (within the meaning of the Section 42 of the Act) in one or more series / tranches. Hence, the Board of Directors (‘Board’) seeks your approval to offer or invite subscription to NCDs, within the overall borrowing limits under Section 180(1)(c) of the Act, as may be required by the Company, from time to time, for a year.
None of the Directors/ Key Managerial Personnel of the Company/ their relatives are, in any way, concerned or interested, financially or otherwise, in this resolution.
The Board recommends the Special Resolution set out at Item No. 14 of the Notice for approval by the shareholders.
ITEM NO. 15Ratification of remuneration payable to Cost AuditorsThe Board of Directors, on the recommendations of the Audit & Risk Management Committee, has approved the appointment of M/s. G. R. Kulkarni & Associates, Cost Accountants, as Cost Auditors for conducting cost audit of the relevant cost records of the Company for the financial year ending March 31, 2019, at a remuneration of ` 6,00,000/- (Rupees Six Lakhs) plus tax as applicable and reimbursement of actual travel and out-of-pocket expenses.
In accordance with Section 148 of the Companies Act, 2013 and Rule 14 of the Companies (Audit and Auditors) Rules, 2014, the remuneration so payable to the Cost Auditors is required to be ratified by the shareholders of the Company.
None of the Directors/ Key Managerial Personnel of the Company/ their relatives are, in any way, concerned or interested, financially or otherwise, in this resolution.
The Board recommends the Ordinary Resolution set out at Item No. 15 of the Notice for approval by the shareholders.
Registered Office: By Order of the BoardPiramal Ananta, Agastya Corporate Park, Opposite Fire Brigade, Kamani Junction, Kurla (West), Mumbai – 400 070.
Leonard D’Souza Company Secretary
ACS No.: A7922Dated: May 28, 2018
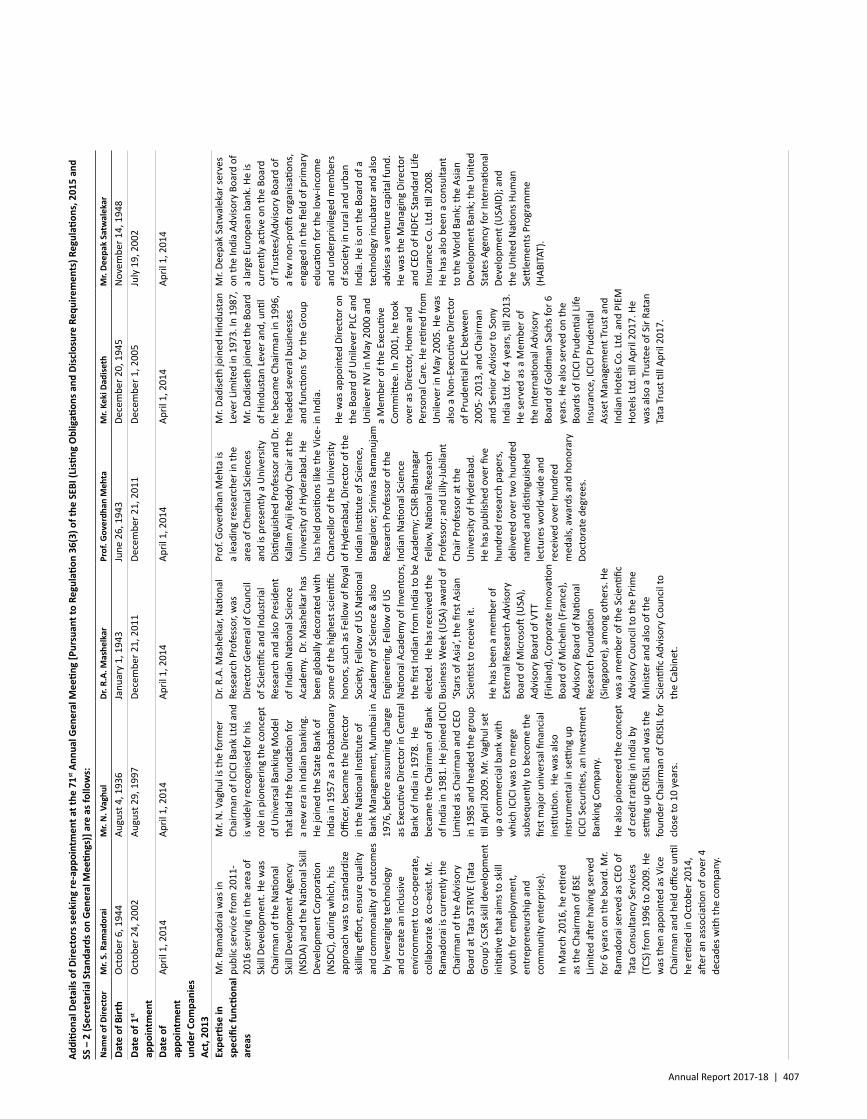
Annual Report 2017-18 | 407
Addi
tiona
l Det
ails
of D
irect
ors s
eeki
ng re
-app
oint
men
t at t
he 7
1st A
nnua
l Gen
eral
Mee
ting
[Pur
suan
t to
Regu
latio
n 36
(3) o
f the
SEB
I (Li
sting
Obl
igati
ons a
nd D
iscl
osur
e Re
quire
men
ts) R
egul
ation
s, 2
015
and
SS –
2 (S
ecre
taria
l Sta
ndar
ds o
n G
ener
al M
eetin
gs)]
are
as f
ollo
ws:
Nam
e of
Dire
ctor
Mr.
S. R
amad
orai
M
r. N
. Vag
hul
Dr. R
.A. M
ashe
lkar
Prof
. Gov
erdh
an M
ehta
Mr.
Keki
Dad
iset
hM
r. De
epak
Sat
wal
ekar
Date
of B
irth
Oct
ober
6, 1
944
Augu
st 4
, 193
6Ja
nuar
y 1,
194
3Ju
ne 2
6, 1
943
Dece
mbe
r 20,
194
5N
ovem
ber 1
4, 1
948
Date
of 1
st
appo
intm
ent
Oct
ober
24,
200
2Au
gust
29,
199
7De
cem
ber 2
1, 2
011
Dece
mbe
r 21,
201
1De
cem
ber 1
, 200
5Ju
ly 1
9, 2
002
Date
of
appo
intm
ent
unde
r Com
pani
es
Act,
2013
April
1, 2
014
April
1, 2
014
April
1, 2
014
April
1, 2
014
April
1, 2
014
April
1, 2
014
Expe
rtise
in
spec
ific
func
tiona
l ar
eas
Mr.
Ram
ador
ai w
as in
pu
blic
serv
ice
from
201
1-20
16 se
rvin
g in
the
area
of
Skill
Dev
elop
men
t. He
was
Ch
airm
an o
f the
Nati
onal
Sk
ill D
evel
opm
ent A
genc
y (N
SDA)
and
the
Nati
onal
Ski
ll De
velo
pmen
t Cor
pora
tion
(NSD
C), d
urin
g w
hich
, his
appr
oach
was
to st
anda
rdize
sk
illin
g eff
ort,
ensu
re q
ualit
y an
d co
mm
onal
ity o
f out
com
es
by le
vera
ging
tech
nolo
gy
and
crea
te a
n in
clus
ive
envi
ronm
ent t
o co
-ope
rate
, co
llabo
rate
& c
o-ex
ist. M
r. Ra
mad
orai
is c
urre
ntly
the
Chai
rman
of t
he A
dviso
ry
Boar
d at
Tat
a ST
RIVE
(Tat
a Gr
oup’
s CSR
skill
dev
elop
men
t in
itiati
ve th
at a
ims t
o sk
ill
yout
h fo
r em
ploy
men
t, en
trep
rene
ursh
ip a
nd
com
mun
ity e
nter
prise
).
In M
arch
201
6, h
e re
tired
as
the
Chai
rman
of B
SE
Lim
ited
after
hav
ing
serv
ed
for 6
yea
rs o
n th
e bo
ard.
Mr.
Ram
ador
ai se
rved
as C
EO o
f Ta
ta C
onsu
ltanc
y Se
rvic
es
(TCS
) fro
m 1
996
to 2
009.
He
was
then
app
oint
ed a
s Vic
e Ch
airm
an a
nd h
eld
office
unti
l he
retir
ed in
Oct
ober
201
4,
after
an
asso
ciati
on o
f ove
r 4
deca
des w
ith th
e co
mpa
ny.
Mr.
N. V
aghu
l is t
he fo
rmer
Ch
airm
an o
f ICI
CI B
ank
Ltd
and
is w
idel
y re
cogn
ised
for h
is ro
le in
pio
neer
ing
the
conc
ept
of U
nive
rsal
Ban
king
Mod
el
that
laid
the
foun
datio
n fo
r a
new
era
in In
dian
ban
king
. He
join
ed th
e St
ate
Bank
of
Indi
a in
195
7 as
a P
roba
tiona
ry
Offi
cer,
beca
me
the
Dire
ctor
in
the
Nati
onal
Insti
tute
of
Bank
Man
agem
ent,
Mum
bai i
n 19
76, b
efor
e as
sum
ing
char
ge
as E
xecu
tive
Dire
ctor
in C
entr
al
Bank
of I
ndia
in 1
978.
He
beca
me
the
Chai
rman
of B
ank
of In
dia
in 1
981.
He
join
ed IC
ICI
Lim
ited
as C
hairm
an a
nd C
EO
in 1
985
and
head
ed th
e gr
oup
till A
pril
2009
. Mr.
Vagh
ul se
t up
a c
omm
erci
al b
ank
with
w
hich
ICIC
I was
to m
erge
su
bseq
uent
ly to
bec
ome
the
first
maj
or u
nive
rsal
fina
ncia
l in
stitu
tion.
He
was
also
in
stru
men
tal i
n se
tting
up
ICIC
I Sec
uriti
es, a
n In
vest
men
t Ba
nkin
g Co
mpa
ny.
He a
lso p
ione
ered
the
conc
ept
of c
redi
t rati
ng in
Indi
a by
se
tting
up
CRIS
IL a
nd w
as th
e fo
unde
r Cha
irman
of C
RISI
L fo
r cl
ose
to 1
0 ye
ars.
Dr. R
.A. M
ashe
lkar
, Nati
onal
Re
sear
ch P
rofe
ssor
, was
Di
rect
or G
ener
al o
f Cou
ncil
of S
cien
tific
and
Indu
stria
l Re
sear
ch a
nd a
lso P
resid
ent
of In
dian
Nati
onal
Sci
ence
Ac
adem
y. D
r. M
ashe
lkar
has
be
en g
loba
lly d
ecor
ated
with
so
me
of th
e hi
ghes
t sci
entifi
c ho
nors
, suc
h as
Fel
low
of R
oyal
So
ciet
y, Fe
llow
of U
S N
ation
al
Acad
emy
of S
cien
ce &
also
En
gine
erin
g, F
ello
w o
f US
Nati
onal
Aca
dem
y of
Inve
ntor
s,
the
first
Indi
an fr
om In
dia
to b
e el
ecte
d. H
e ha
s rec
eive
d th
e Bu
sines
s Wee
k (U
SA) a
war
d of
‘S
tars
of A
sia’, t
he fi
rst A
sian
Scie
ntist
to re
ceiv
e it.
He h
as b
een
a m
embe
r of
Exte
rnal
Res
earc
h Ad
viso
ry
Boar
d of
Mic
roso
ft (U
SA),
Advi
sory
Boa
rd o
f VTT
(F
inla
nd),
Corp
orat
e In
nova
tion
Boar
d of
Mic
helin
(Fra
nce)
, Ad
viso
ry B
oard
of N
ation
al
Rese
arch
Fou
ndati
on
(Sin
gapo
re),
amon
g ot
hers
. He
was
a m
embe
r of t
he S
cien
tific
Advi
sory
Cou
ncil
to th
e Pr
ime
Min
ister
and
also
of t
he
Scie
ntific
Adv
isory
Cou
ncil
to
the
Cabi
net.
Prof
. Gov
erdh
an M
ehta
is
a le
adin
g re
sear
cher
in th
e ar
ea o
f Che
mic
al S
cien
ces
and
is pr
esen
tly a
Uni
vers
ity
Disti
ngui
shed
Pro
fess
or a
nd D
r. Ka
llam
Anj
i Red
dy C
hair
at th
e U
nive
rsity
of H
yder
abad
. He
has h
eld
positi
ons l
ike
the
Vice
-Ch
ance
llor o
f the
Uni
vers
ity
of H
yder
abad
, Dire
ctor
of t
he
Indi
an In
stitu
te o
f Sci
ence
, Ba
ngal
ore;
Srin
ivas
Ram
anuj
am
Rese
arch
Pro
fess
or o
f the
In
dian
Nati
onal
Sci
ence
Ac
adem
y; C
SIR-
Bhat
naga
r Fe
llow,
Nati
onal
Res
earc
h Pr
ofes
sor;
and
Lilly
-Jubi
lant
Ch
air P
rofe
ssor
at t
he
Uni
vers
ity o
f Hyd
erab
ad.
He h
as p
ublis
hed
over
five
hu
ndre
d re
sear
ch p
aper
s,
deliv
ered
ove
r tw
o hu
ndre
d na
med
and
disti
ngui
shed
le
ctur
es w
orld
-wid
e an
d re
ceiv
ed o
ver h
undr
ed
med
als,
aw
ards
and
hon
orar
y Do
ctor
ate
degr
ees.
Mr.
Dadi
seth
join
ed H
indu
stan
Le
ver L
imite
d in
197
3. In
198
7,
Mr.
Dadi
seth
join
ed th
e Bo
ard
of H
indu
stan
Lev
er a
nd, u
ntil
he b
ecam
e Ch
airm
an in
199
6,
head
ed se
vera
l bus
ines
ses
and
func
tions
for
the
Grou
p in
Indi
a.
He w
as a
ppoi
nted
Dire
ctor
on
the
Boar
d of
Uni
leve
r PLC
and
U
nile
ver N
V in
May
200
0 an
d a
Mem
ber o
f the
Exe
cutiv
e Co
mm
ittee
. In
2001
, he
took
ov
er a
s Dire
ctor
, Hom
e an
d Pe
rson
al C
are.
He
retir
ed fr
om
Uni
leve
r in
May
200
5. H
e w
as
also
a N
on-E
xecu
tive
Dire
ctor
of
Pru
denti
al P
LC b
etw
een
2005
- 201
3, a
nd C
hairm
an
and
Seni
or A
dviso
r to
Sony
In
dia
Ltd.
for 4
yea
rs, ti
ll 20
13.
He se
rved
as a
Mem
ber o
f th
e In
tern
ation
al A
dviso
ry
Boar
d of
Gol
dman
Sac
hs fo
r 6
year
s. H
e al
so se
rved
on
the
Boar
ds o
f ICI
CI P
rude
ntial
Life
In
sura
nce,
ICIC
I Pru
denti
al
Asse
t Man
agem
ent T
rust
and
In
dian
Hot
els C
o. Lt
d. a
nd P
IEM
Ho
tels
Ltd.
till
April
201
7. H
e w
as a
lso a
Tru
stee
of S
ir Ra
tan
Tata
Tru
st ti
ll Ap
ril 2
017.
Mr.
Deep
ak S
atw
alek
ar se
rves
on
the
Indi
a Ad
viso
ry B
oard
of
a la
rge
Euro
pean
ban
k. H
e is
curr
ently
acti
ve o
n th
e Bo
ard
of T
rust
ees/
Advi
sory
Boa
rd o
f a
few
non
-pro
fit o
rgan
isatio
ns,
enga
ged
in th
e fie
ld o
f prim
ary
educ
ation
for t
he lo
w-in
com
e an
d un
derp
rivile
ged
mem
bers
of
soci
ety
in ru
ral a
nd u
rban
In
dia.
He
is on
the
Boar
d of
a
tech
nolo
gy in
cuba
tor a
nd a
lso
advi
ses a
ven
ture
cap
ital f
und.
He
was
the
Man
agin
g Di
rect
or
and
CEO
of H
DFC
Stan
dard
Life
In
sura
nce
Co. L
td. ti
ll 20
08.
He h
as a
lso b
een
a co
nsul
tant
to
the
Wor
ld B
ank;
the
Asia
n De
velo
pmen
t Ban
k; th
e U
nite
d St
ates
Age
ncy
for I
nter
natio
nal
Deve
lopm
ent (
USA
ID);
and
the
Uni
ted
Nati
ons H
uman
Se
ttle
men
ts P
rogr
amm
e (H
ABIT
AT).
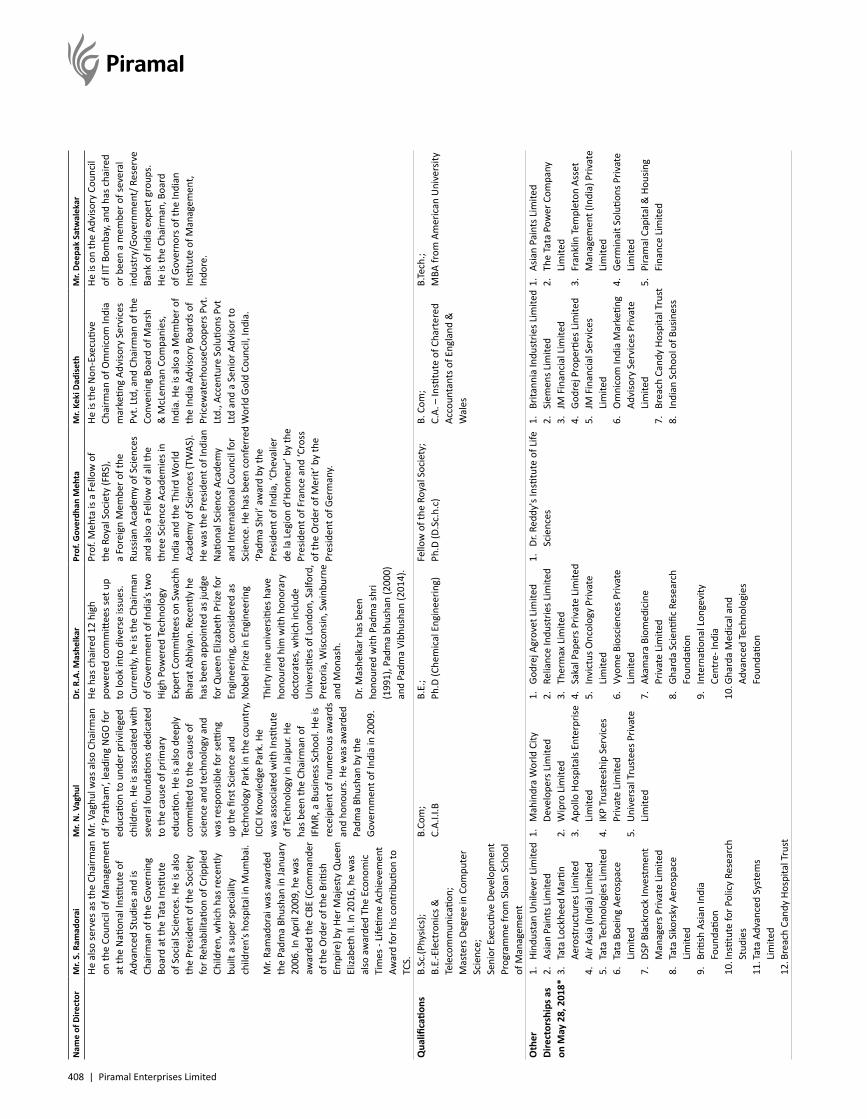
408 | Piramal Enterprises Limited
Nam
e of
Dire
ctor
Mr.
S. R
amad
orai
M
r. N
. Vag
hul
Dr. R
.A. M
ashe
lkar
Prof
. Gov
erdh
an M
ehta
Mr.
Keki
Dad
iset
hM
r. De
epak
Sat
wal
ekar
He a
lso se
rves
as t
he C
hairm
an
on th
e Co
unci
l of M
anag
emen
t at
the
Nati
onal
Insti
tute
of
Adva
nced
Stu
dies
and
is
Chai
rman
of t
he G
over
ning
Bo
ard
at th
e Ta
ta In
stitu
te
of S
ocia
l Sci
ence
s. H
e is
also
th
e Pr
esid
ent o
f the
Soc
iety
fo
r Reh
abili
tatio
n of
Crip
pled
Ch
ildre
n, w
hich
has
rece
ntly
bu
ilt a
supe
r spe
cial
ity
child
ren’
s hos
pita
l in
Mum
bai.
Mr.
Ram
ador
ai w
as a
war
ded
the
Padm
a Bh
usha
n in
Janu
ary
2006
. In
April
200
9, h
e w
as
awar
ded
the
CBE
(Com
man
der
of th
e O
rder
of t
he B
ritish
Em
pire
) by
Her M
ajes
ty Q
ueen
El
izabe
th II
. In
2016
, he
was
al
so a
war
ded
The
Econ
omic
Ti
mes
- Li
fetim
e Ac
hiev
emen
t Aw
ard
for h
is co
ntrib
ution
to
TCS.
Mr.
Vagh
ul w
as a
lso C
hairm
an
of ‘P
rath
am’, l
eadi
ng N
GO fo
r ed
ucati
on to
und
er p
rivile
ged
child
ren.
He
is as
soci
ated
with
se
vera
l fou
ndati
ons d
edic
ated
to
the
caus
e of
prim
ary
educ
ation
. He
is al
so d
eepl
y co
mm
itted
to th
e ca
use
of
scie
nce
and
tech
nolo
gy a
nd
was
resp
onsib
le fo
r setti
ng
up th
e fir
st S
cien
ce a
nd
Tech
nolo
gy P
ark
in th
e co
untr
y, IC
ICI K
now
ledg
e Pa
rk. H
e w
as a
ssoc
iate
d w
ith In
stitu
te
of Te
chno
logy
in Ja
ipur
. He
has b
een
the
Chai
rman
of
IFM
R, a
Bus
ines
s Sch
ool.
He is
re
ceip
ient
of n
umer
ous a
war
ds
and
hono
urs.
He
was
aw
arde
d Pa
dma
Bhus
han
by th
e Go
vern
men
t of I
ndia
in 2
009.
He h
as c
haire
d 12
hig
h po
wer
ed c
omm
ittee
s set
up
to lo
ok in
to d
iver
se is
sues
. Cu
rren
tly, h
e is
the
Chai
rman
of
Gov
ernm
ent o
f Ind
ia’s
two
High
Pow
ered
Tech
nolo
gy
Expe
rt C
omm
ittee
s on
Swac
hh
Bhar
at A
bhiy
an. R
ecen
tly h
e ha
s bee
n ap
poin
ted
as ju
dge
for Q
ueen
Eliz
abet
h Pr
ize fo
r En
gine
erin
g, c
onsid
ered
as
Nob
el P
rize
in E
ngin
eerin
g
Thirt
y ni
ne u
nive
rsiti
es h
ave
hono
ured
him
with
hon
orar
y do
ctor
ates
, whi
ch in
clud
e U
nive
rsiti
es o
f Lon
don,
Sal
ford
, Pr
etor
ia, W
iscon
sin, S
win
burn
e an
d M
onas
h.
Dr. M
ashe
lkar
has
bee
n ho
nour
ed w
ith P
adm
a sh
ri (1
991)
, Pad
ma
bhus
han
(200
0)
and
Padm
a Vi
bhus
han
(201
4).
Prof
. Meh
ta is
a F
ello
w o
f th
e Ro
yal S
ocie
ty (F
RS),
a Fo
reig
n M
embe
r of t
he
Russ
ian
Acad
emy
of S
cien
ces
and
also
a F
ello
w o
f all
the
thre
e Sc
ienc
e Ac
adem
ies i
n In
dia
and
the
Third
Wor
ld
Acad
emy
of S
cien
ces (
TWAS
). He
was
the
Pres
iden
t of I
ndia
n N
ation
al S
cien
ce A
cade
my
and
Inte
rnati
onal
Cou
ncil
for
Scie
nce.
He
has b
een
conf
erre
d ‘P
adm
a Sh
ri’ a
war
d by
the
Pres
iden
t of I
ndia
, ‘Ch
eval
ier
de la
Leg
ion
d’Ho
nneu
r’ b
y th
e Pr
esid
ent o
f Fra
nce
and
‘Cro
ss
of th
e O
rder
of M
erit’
by
the
Pres
iden
t of G
erm
any.
He is
the
Non
-Exe
cutiv
e Ch
airm
an o
f Om
nico
m In
dia
mar
ketin
g Ad
viso
ry S
ervi
ces
Pvt.
Ltd,
and
Cha
irman
of t
he
Conv
enin
g Bo
ard
of M
arsh
&
McL
enna
n Co
mpa
nies
, In
dia.
He
is al
so a
Mem
ber o
f th
e In
dia
Advi
sory
Boa
rds o
f Pr
icew
ater
hous
eCoo
pers
Pvt
. Lt
d., A
ccen
ture
Sol
ution
s Pvt
Lt
d an
d a
Seni
or A
dviso
r to
Wor
ld G
old
Coun
cil,
Indi
a.
He is
on
the
Advi
sory
Cou
ncil
of II
T Bo
mba
y, an
d ha
s cha
ired
or b
een
a m
embe
r of s
ever
al
indu
stry
/Gov
ernm
ent/
Res
erve
Ba
nk o
f Ind
ia e
xper
t gro
ups.
He
is th
e Ch
airm
an, B
oard
of
Gov
erno
rs o
f the
Indi
an
Insti
tute
of M
anag
emen
t, In
dore
.
Qua
lifica
tions
B.Sc
.(Phy
sics)
; B.
E.-E
lect
roni
cs &
Te
leco
mm
unic
ation
; M
aste
rs D
egre
e in
Com
pute
r Sc
ienc
e;Se
nior
Exe
cutiv
e De
velo
pmen
t Pr
ogra
mm
e fr
om S
loan
Sch
ool
of M
anag
emen
t
B.Co
m;
C.A.
I.I.B
B.E.
;Ph
.D (C
hem
ical
Eng
inee
ring)
Fello
w o
f the
Roy
al S
ocie
ty;
Ph.D
(D.S
c.h.
c)B.
Com
;C.
A. –
Insti
tute
of C
hart
ered
Ac
coun
tant
s of E
ngla
nd &
W
ales
B.Te
ch.;
MBA
from
Am
eric
an U
nive
rsity
Oth
er
Dire
ctor
ship
s as
on M
ay 2
8, 2
018*
1.
Hind
usta
n U
nile
ver L
imite
d 2.
As
ian
Pain
ts L
imite
d3.
Ta
ta L
ockh
eed
Mar
tin
Aero
stru
ctur
es L
imite
d4.
Ai
r Asia
(Ind
ia) L
imite
d5.
Ta
ta Te
chno
logi
es L
imite
d6.
Ta
ta B
oein
g Ae
rosp
ace
Lim
ited
7.
DSP
Blac
kroc
k In
vest
men
t M
anag
ers P
rivat
e Li
mite
d8.
Ta
ta S
ikor
sky
Aero
spac
e Li
mite
d9.
Br
itish
Asia
n In
dia
Foun
datio
n10
. Ins
titut
e fo
r Pol
icy
Rese
arch
St
udie
s 11
. Tat
a Ad
vanc
ed S
yste
ms
Lim
ited
12. B
reac
h Ca
ndy
Hosp
ital T
rust
1.
Mah
indr
a W
orld
City
De
velo
pers
Lim
ited
2.
Wip
ro L
imite
d3.
Ap
ollo
Hos
pita
ls En
terp
rise
Lim
ited
4.
IKP
Trus
tees
hip
Serv
ices
Pr
ivat
e Li
mite
d5.
U
nive
rsal
Tru
stee
s Priv
ate
Lim
ited
1.
Godr
ej A
grov
et L
imite
d2.
Re
lianc
e In
dust
ries L
imite
d3.
Th
erm
ax L
imite
d4.
Sa
kal P
aper
s Priv
ate
Lim
ited
5.
Invi
ctus
Onc
olog
y Pr
ivat
e Li
mite
d6.
Vy
ome
Bios
cien
ces P
rivat
e Li
mite
d7.
Ak
amar
a Bi
omed
icin
e Pr
ivat
e Li
mite
d8.
Gh
arda
Sci
entifi
c Re
sear
ch
Foun
datio
n 9.
In
tern
ation
al L
onge
vity
Ce
ntre
- Ind
ia
10. G
hard
a M
edic
al a
nd
Adva
nced
Tech
nolo
gies
Fo
unda
tion
1.
Dr. R
eddy
's In
stitu
te o
f Life
Sc
ienc
es1.
Br
itann
ia In
dust
ries L
imite
d2.
Si
emen
s Lim
ited
3.
JM F
inan
cial
Lim
ited
4.
Godr
ej P
rope
rties
Lim
ited
5.
JM F
inan
cial
Ser
vice
s Li
mite
d6.
O
mni
com
Indi
a M
arke
ting
Advi
sory
Ser
vice
s Priv
ate
Lim
ited
7.
Brea
ch C
andy
Hos
pita
l Tru
st8.
In
dian
Sch
ool o
f Bus
ines
s
1.
Asia
n Pa
ints
Lim
ited
2.
The
Tata
Pow
er C
ompa
ny
Lim
ited
3.
Fran
klin
Tem
plet
on A
sset
M
anag
emen
t (In
dia)
Priv
ate
Lim
ited
4.
Germ
inai
t Sol
ution
s Priv
ate
Lim
ited
5.
Pira
mal
Cap
ital &
Hou
sing
Fina
nce
Lim
ited
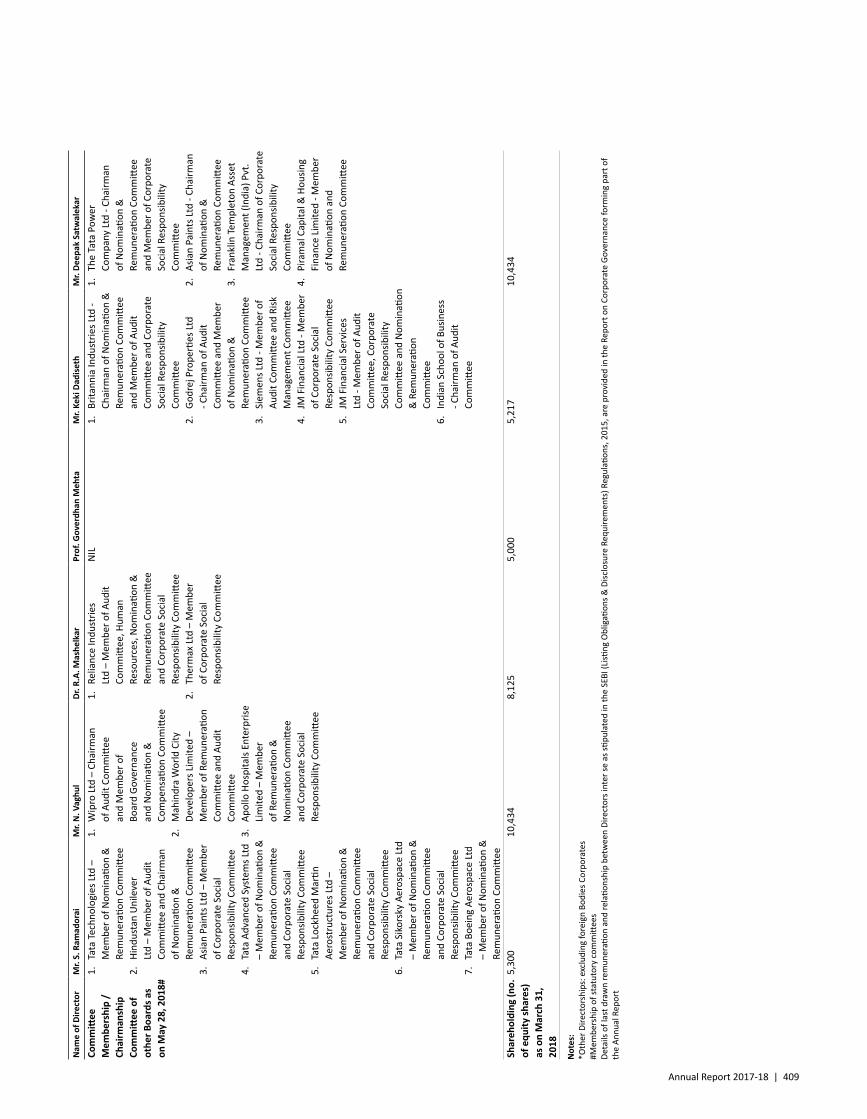
Annual Report 2017-18 | 409
Nam
e of
Dire
ctor
Mr.
S. R
amad
orai
M
r. N
. Vag
hul
Dr. R
.A. M
ashe
lkar
Prof
. Gov
erdh
an M
ehta
Mr.
Keki
Dad
iset
hM
r. De
epak
Sat
wal
ekar
Com
mitt
ee
Mem
bers
hip
/
Chai
rman
ship
Co
mm
ittee
of
othe
r Boa
rds a
s on
May
28,
201
8#
1.
Tata
Tech
nolo
gies
Ltd
– M
embe
r of N
omin
ation
&
Rem
uner
ation
Com
mitt
ee2.
Hi
ndus
tan
Uni
leve
r Lt
d –
Mem
ber o
f Aud
it Co
mm
ittee
and
Cha
irman
of
Nom
inati
on &
Re
mun
erati
on C
omm
ittee
3.
Asia
n Pa
ints
Ltd
– M
embe
r of
Cor
pora
te S
ocia
l Re
spon
sibili
ty C
omm
ittee
4.
Tata
Adv
ance
d Sy
stem
s Ltd
–
Mem
ber o
f Nom
inati
on &
Re
mun
erati
on C
omm
ittee
an
d Co
rpor
ate
Soci
al
Resp
onsib
ility
Com
mitt
ee5.
Ta
ta L
ockh
eed
Mar
tin
Aero
stru
ctur
es Lt
d –
Mem
ber o
f Nom
inati
on &
Re
mun
erati
on C
omm
ittee
an
d Co
rpor
ate
Soci
al
Resp
onsib
ility
Com
mitt
ee6.
Ta
ta S
ikor
sky
Aero
spac
e Lt
d –
Mem
ber o
f Nom
inati
on &
Re
mun
erati
on C
omm
ittee
an
d Co
rpor
ate
Soci
al
Resp
onsib
ility
Com
mitt
ee7.
Ta
ta B
oein
g Ae
rosp
ace
Ltd
– M
embe
r of N
omin
ation
&
Rem
uner
ation
Com
mitt
ee
1.
Wip
ro Lt
d –
Chai
rman
of
Aud
it Co
mm
ittee
an
d M
embe
r of
Boar
d Go
vern
ance
an
d N
omin
ation
&
Com
pens
ation
Com
mitt
ee2.
M
ahin
dra
Wor
ld C
ity
Deve
lope
rs L
imite
d –
Mem
ber o
f Rem
uner
ation
Co
mm
ittee
and
Aud
it Co
mm
ittee
3.
Apol
lo H
ospi
tals
Ente
rpris
e Li
mite
d –
Mem
ber
of R
emun
erati
on &
N
omin
ation
Com
mitt
ee
and
Corp
orat
e So
cial
Re
spon
sibili
ty C
omm
ittee
1.
Relia
nce
Indu
strie
s Lt
d –
Mem
ber o
f Aud
it Co
mm
ittee
, Hum
an
Reso
urce
s, N
omin
ation
&
Rem
uner
ation
Com
mitt
ee
and
Corp
orat
e So
cial
Re
spon
sibili
ty C
omm
ittee
2.
Ther
max
Ltd
– M
embe
r of
Cor
pora
te S
ocia
l Re
spon
sibili
ty C
omm
ittee
NIL
1.
Brita
nnia
Indu
strie
s Ltd
- Ch
airm
an o
f Nom
inati
on &
Re
mun
erati
on C
omm
ittee
an
d M
embe
r of A
udit
Com
mitt
ee a
nd C
orpo
rate
So
cial
Res
pons
ibili
ty
Com
mitt
ee2.
Go
drej
Pro
perti
es Lt
d - C
hairm
an o
f Aud
it Co
mm
ittee
and
Mem
ber
of N
omin
ation
&
Rem
uner
ation
Com
mitt
ee
3.
Siem
ens L
td -
Mem
ber o
f Au
dit C
omm
ittee
and
Risk
M
anag
emen
t Com
mitt
ee
4.
JM F
inan
cial
Ltd
- Mem
ber
of C
orpo
rate
Soc
ial
Resp
onsib
ility
Com
mitt
ee
5.
JM F
inan
cial
Ser
vice
s Lt
d - M
embe
r of A
udit
Com
mitt
ee, C
orpo
rate
So
cial
Res
pons
ibili
ty
Com
mitt
ee a
nd N
omin
ation
&
Rem
uner
ation
Co
mm
ittee
6.
Indi
an S
choo
l of B
usin
ess
- Cha
irman
of A
udit
Com
mitt
ee
1.
The
Tata
Pow
er
Com
pany
Ltd
- Cha
irman
of
Nom
inati
on &
Re
mun
erati
on C
omm
ittee
an
d M
embe
r of C
orpo
rate
So
cial
Res
pons
ibili
ty
Com
mitt
ee
2.
Asia
n Pa
ints
Ltd
- Cha
irman
of
Nom
inati
on &
Re
mun
erati
on C
omm
ittee
3.
Fr
ankl
in Te
mpl
eton
Ass
et
Man
agem
ent (
Indi
a) P
vt.
Ltd
- Cha
irman
of C
orpo
rate
So
cial
Res
pons
ibili
ty
Com
mitt
ee4.
Pi
ram
al C
apita
l & H
ousin
g Fi
nanc
e Li
mite
d - M
embe
r of
Nom
inati
on a
nd
Rem
uner
ation
Com
mitt
ee
Shar
ehol
ding
(no.
of
equ
ity sh
ares
) as
on
Mar
ch 3
1,
2018
5,30
010
,434
8,12
55,
000
5,21
710
,434
Not
es:
*Oth
er D
irect
orsh
ips:
exc
ludi
ng fo
reig
n Bo
dies
Cor
pora
tes
#Mem
bers
hip
of st
atut
ory
com
mitt
ees
Deta
ils o
f las
t dra
wn
rem
uner
ation
and
rela
tions
hip
betw
een
Dire
ctor
s int
er se
as s
tipul
ated
in th
e SE
BI (L
isting
Obl
igati
ons &
Disc
losu
re R
equi
rem
ents
) Reg
ulati
ons,
201
5, a
re p
rovi
ded
in th
e Re
port
on
Corp
orat
e Go
vern
ance
form
ing
part
of
the
Annu
al R
epor
t
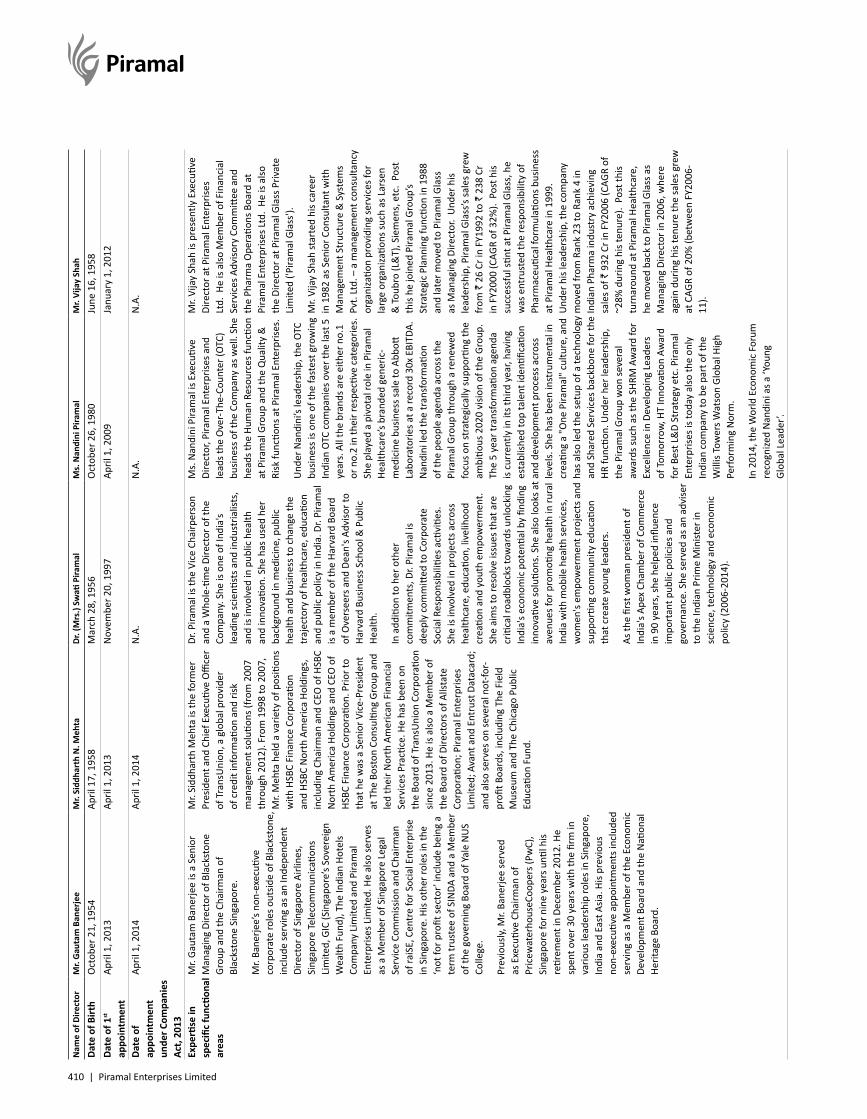
410 | Piramal Enterprises Limited
Nam
e of
Dire
ctor
Mr.
Gau
tam
Ban
erje
eM
r. Si
ddha
rth
N. M
ehta
Dr. (
Mrs
.) Sw
ati P
iram
alM
s. N
andi
ni P
iram
alM
r. Vi
jay
Shah
Date
of B
irth
Oct
ober
21,
195
4Ap
ril 1
7, 1
958
Mar
ch 2
8, 1
956
Oct
ober
26,
198
0Ju
ne 1
6, 1
958
Date
of 1
st
appo
intm
ent
April
1, 2
013
April
1, 2
013
Nov
embe
r 20,
199
7Ap
ril 1
, 200
9Ja
nuar
y 1,
201
2
Date
of
appo
intm
ent
unde
r Com
pani
es
Act,
2013
April
1, 2
014
April
1, 2
014
N.A
.N
.A.
N.A
.
Expe
rtise
in
spec
ific
func
tiona
l ar
eas
Mr.
Gaut
am B
aner
jee
is a
Seni
or
Man
agin
g Di
rect
or o
f Bla
ckst
one
Grou
p an
d th
e Ch
airm
an o
f Bl
acks
tone
Sin
gapo
re.
Mr.
Bane
rjee’
s non
-exe
cutiv
e co
rpor
ate
role
s out
side
of B
lack
ston
e,
incl
ude
serv
ing
as a
n In
depe
nden
t Di
rect
or o
f Sin
gapo
re A
irlin
es,
Sing
apor
e Te
leco
mm
unic
ation
s Li
mite
d, G
IC (S
inga
pore
’s So
vere
ign
Wea
lth F
und)
, The
Indi
an H
otel
s Co
mpa
ny L
imite
d an
d Pi
ram
al
Ente
rpris
es L
imite
d. H
e al
so se
rves
as
a M
embe
r of S
inga
pore
Leg
al
Serv
ice
Com
miss
ion
and
Chai
rman
of
raiS
E, C
entr
e fo
r Soc
ial E
nter
prise
in
Sin
gapo
re. H
is ot
her r
oles
in th
e ‘n
ot fo
r pro
fit se
ctor
’ inc
lude
bei
ng a
te
rm tr
uste
e of
SIN
DA a
nd a
Mem
ber
of th
e go
vern
ing
Boar
d of
Yal
e N
US
Colle
ge.
Prev
ious
ly, M
r. Ba
nerje
e se
rved
as
Exe
cutiv
e Ch
airm
an o
f Pr
icew
ater
hous
eCoo
pers
(Pw
C),
Sing
apor
e fo
r nin
e ye
ars u
ntil h
is re
tirem
ent i
n De
cem
ber 2
012.
He
spen
t ove
r 30
year
s with
the
firm
in
vario
us le
ader
ship
role
s in
Sing
apor
e,
Indi
a an
d Ea
st A
sia. H
is pr
evio
us
non-
exec
utive
app
oint
men
ts in
clud
ed
serv
ing
as a
Mem
ber o
f the
Eco
nom
ic
Deve
lopm
ent B
oard
and
the
Nati
onal
He
ritag
e Bo
ard.
Mr.
Sidd
hart
h M
ehta
is th
e fo
rmer
Pr
esid
ent a
nd C
hief
Exe
cutiv
e O
ffice
r of
Tra
nsU
nion
, a g
loba
l pro
vide
r of
cre
dit i
nfor
mati
on a
nd ri
sk
man
agem
ent s
oluti
ons (
from
200
7 th
roug
h 20
12).
From
199
8 to
200
7,
Mr.
Meh
ta h
eld
a va
riety
of p
ositi
ons
with
HSB
C Fi
nanc
e Co
rpor
ation
an
d HS
BC N
orth
Am
eric
a Ho
ldin
gs,
incl
udin
g Ch
airm
an a
nd C
EO o
f HSB
C N
orth
Am
eric
a Ho
ldin
gs a
nd C
EO o
f HS
BC F
inan
ce C
orpo
ratio
n. P
rior t
o th
at h
e w
as a
Sen
ior V
ice-
Pres
iden
t at
The
Bos
ton
Cons
ultin
g Gr
oup
and
led
thei
r Nor
th A
mer
ican
Fin
anci
al
Serv
ices
Pra
ctice
. He
has b
een
on
the
Boar
d of
Tra
nsU
nion
Cor
pora
tion
since
201
3. H
e is
also
a M
embe
r of
the
Boar
d of
Dire
ctor
s of A
llsta
te
Corp
orati
on; P
iram
al E
nter
prise
s Li
mite
d; A
vant
and
Ent
rust
Dat
acar
d;
and
also
serv
es o
n se
vera
l not
-for-
profi
t Boa
rds,
incl
udin
g Th
e Fi
eld
Mus
eum
and
The
Chi
cago
Pub
lic
Educ
ation
Fun
d.
Dr. P
iram
al is
the
Vice
Cha
irper
son
and
a W
hole
-tim
e Di
rect
or o
f the
Co
mpa
ny. S
he is
one
of I
ndia
's le
adin
g sc
ienti
sts a
nd in
dust
rialis
ts,
and
is in
volv
ed in
pub
lic h
ealth
an
d in
nova
tion.
She
has
use
d he
r ba
ckgr
ound
in m
edic
ine,
pub
lic
heal
th a
nd b
usin
ess t
o ch
ange
the
traj
ecto
ry o
f hea
lthca
re, e
duca
tion
and
publ
ic p
olic
y in
Indi
a. D
r. Pi
ram
al
is a
mem
ber o
f the
Har
vard
Boa
rd
of O
vers
eers
and
Dea
n's A
dviso
r to
Harv
ard
Busin
ess S
choo
l & P
ublic
He
alth
.
In a
dditi
on to
her
oth
er
com
mitm
ents
, Dr.
Pira
mal
is
deep
ly c
omm
itted
to C
orpo
rate
So
cial
Res
pons
ibili
ties a
ctivi
ties.
Sh
e is
invo
lved
in p
roje
cts a
cros
s he
alth
care
, edu
catio
n, li
velih
ood
crea
tion
and
yout
h em
pow
erm
ent.
She
aim
s to
reso
lve
issue
s tha
t are
cr
itica
l roa
dblo
cks t
owar
ds u
nloc
king
In
dia'
s eco
nom
ic p
oten
tial b
y fin
ding
in
nova
tive
solu
tions
. She
also
look
s at
aven
ues f
or p
rom
oting
hea
lth in
rura
l In
dia
with
mob
ile h
ealth
serv
ices
, w
omen
's em
pow
erm
ent p
roje
cts a
nd
supp
ortin
g co
mm
unity
edu
catio
n th
at c
reat
e yo
ung
lead
ers.
As th
e fir
st w
oman
pre
siden
t of
Indi
a's A
pex
Cham
ber o
f Com
mer
ce
in 9
0 ye
ars,
she
help
ed in
fluen
ce
impo
rtan
t pub
lic p
olic
ies a
nd
gove
rnan
ce. S
he se
rved
as a
n ad
vise
r to
the
Indi
an P
rime
Min
ister
in
scie
nce,
tech
nolo
gy a
nd e
cono
mic
po
licy
(200
6-20
14).
Ms.
Nan
dini
Pira
mal
is E
xecu
tive
Dire
ctor
, Pira
mal
Ent
erpr
ises a
nd
lead
s the
Ove
r-The
-Cou
nter
(OTC
) bu
sines
s of t
he C
ompa
ny a
s wel
l. Sh
e he
ads t
he H
uman
Res
ourc
es fu
nctio
n at
Pira
mal
Gro
up a
nd th
e Q
ualit
y &
Ri
sk fu
nctio
ns a
t Pira
mal
Ent
erpr
ises.
Und
er N
andi
ni’s
lead
ersh
ip, t
he O
TC
busin
ess i
s one
of t
he fa
stes
t gro
win
g In
dian
OTC
com
pani
es o
ver t
he la
st 5
ye
ars.
All
the
bran
ds a
re e
ither
no.
1 or
no.
2 in
thei
r res
pecti
ve c
ateg
orie
s.
She
play
ed a
piv
otal
role
in P
iram
al
Heal
thca
re’s
bran
ded
gene
ric-
med
icin
e bu
sines
s sal
e to
Abb
ott
Labo
rato
ries a
t a re
cord
30x
EBI
TDA.
N
andi
ni le
d th
e tr
ansf
orm
ation
of
the
peop
le a
gend
a ac
ross
the
Pira
mal
Gro
up th
roug
h a
rene
wed
fo
cus o
n st
rate
gica
lly su
ppor
ting
the
ambi
tious
202
0 vi
sion
of th
e Gr
oup.
Th
e 5
year
tran
sfor
mati
on a
gend
a is
curr
ently
in it
s thi
rd y
ear,
havi
ng
esta
blish
ed to
p ta
lent
iden
tifica
tion
and
deve
lopm
ent p
roce
ss a
cros
s le
vels.
She
has
bee
n in
stru
men
tal i
n cr
eatin
g a
"One
Pira
mal
" cul
ture
, and
ha
s also
led
the
setu
p of
a te
chno
logy
an
d Sh
ared
Ser
vice
s bac
kbon
e fo
r the
HR
func
tion.
Und
er h
er le
ader
ship
, th
e Pi
ram
al G
roup
won
seve
ral
awar
ds su
ch a
s the
SHR
M A
war
d fo
r Ex
celle
nce
in D
evel
opin
g Le
ader
s of
Tom
orro
w, H
T In
nova
tion
Awar
d fo
r Bes
t L&
D St
rate
gy e
tc. P
iram
al
Ente
rpris
es is
toda
y al
so th
e on
ly
Indi
an c
ompa
ny to
be
part
of t
he
Will
is To
wer
s Wat
son
Glob
al H
igh
Perf
orm
ing
Nor
m.
In 2
014,
the
Wor
ld E
cono
mic
For
um
reco
gnize
d N
andi
ni a
s a ‘Y
oung
Gl
obal
Lea
der’.
Mr.
Vija
y Sh
ah is
pre
sent
ly E
xecu
tive
Dire
ctor
at P
iram
al E
nter
prise
s Lt
d. H
e is
also
Mem
ber o
f Fin
anci
al
Serv
ices
Adv
isory
Com
mitt
ee a
nd
the
Phar
ma
Ope
ratio
ns B
oard
at
Pira
mal
Ent
erpr
ises L
td.
He is
also
th
e Di
rect
or a
t Pira
mal
Gla
ss P
rivat
e Li
mite
d ('P
iram
al G
lass
').
Mr.
Vija
y Sh
ah st
arte
d hi
s car
eer
in 1
982
as S
enio
r Con
sulta
nt w
ith
Man
agem
ent S
truc
ture
& S
yste
ms
Pvt.
Ltd.
– a
man
agem
ent c
onsu
ltanc
y or
gani
zatio
n pr
ovid
ing
serv
ices
for
larg
e or
gani
zatio
ns su
ch a
s Lar
sen
& To
ubro
(L&
T), S
iem
ens,
etc
. Po
st
this
he jo
ined
Pira
mal
Gro
up’s
Stra
tegi
c Pl
anni
ng fu
nctio
n in
198
8 an
d la
ter m
oved
to P
iram
al G
lass
as
Man
agin
g Di
rect
or.
Und
er h
is le
ader
ship
, Pira
mal
Gla
ss’s
sale
s gre
w
from
` 2
6 Cr
in F
Y199
2 to
` 2
38 C
r in
FY2
000
(CAG
R of
32%
). P
ost h
is su
cces
sful
stint
at P
iram
al G
lass
, he
was
ent
rust
ed th
e re
spon
sibili
ty o
f Ph
arm
aceu
tical
form
ulati
ons b
usin
ess
at P
iram
al H
ealth
care
in 1
999.
U
nder
his
lead
ersh
ip, t
he c
ompa
ny
mov
ed fr
om R
ank
23 to
Ran
k 4
in
Indi
an P
harm
a in
dust
ry a
chie
ving
sa
les o
f ` 9
32 C
r in
FY20
06 (C
AGR
of
~28%
dur
ing
his t
enur
e).
Post
this
turn
arou
nd a
t Pira
mal
Hea
lthca
re,
he m
oved
bac
k to
Pira
mal
Gla
ss a
s M
anag
ing
Dire
ctor
in 2
006,
whe
re
agai
n du
ring
his t
enur
e th
e sa
les g
rew
at
CAG
R of
20%
(bet
wee
n FY
2006
-11
).
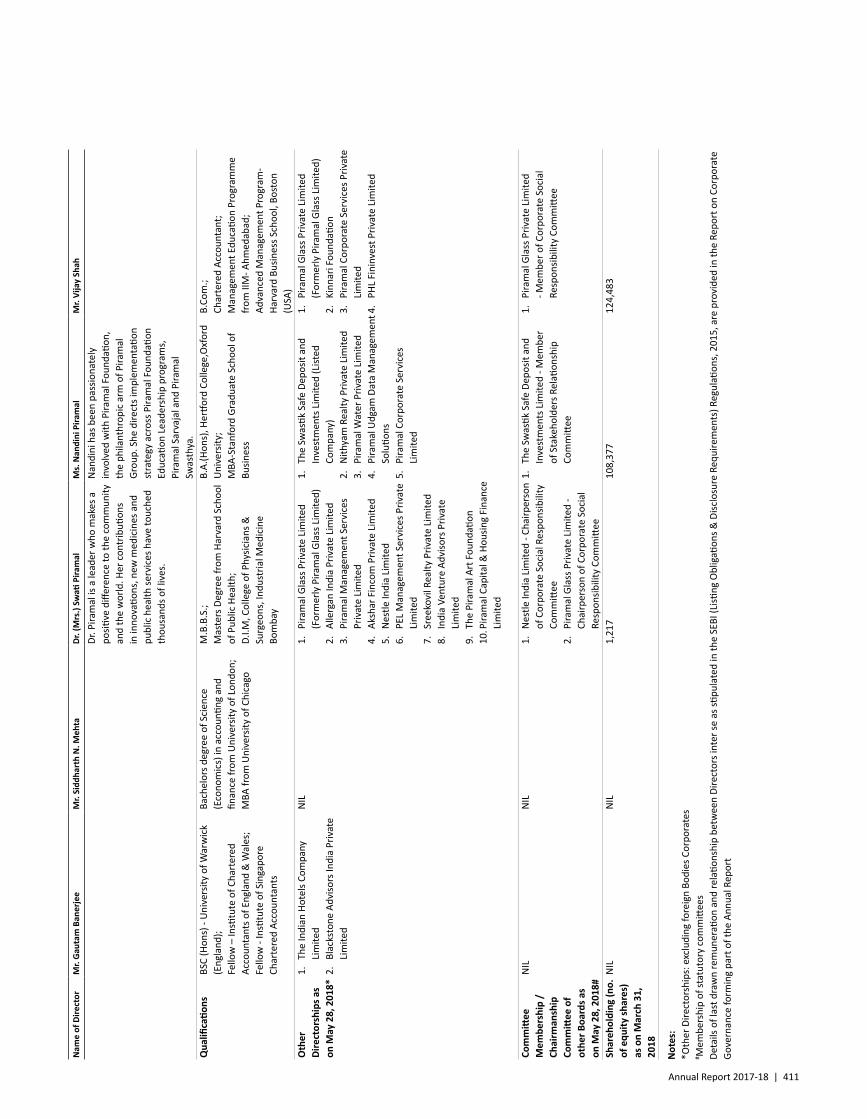
Annual Report 2017-18 | 411
Nam
e of
Dire
ctor
Mr.
Gau
tam
Ban
erje
eM
r. Si
ddha
rth
N. M
ehta
Dr. (
Mrs
.) Sw
ati P
iram
alM
s. N
andi
ni P
iram
alM
r. Vi
jay
Shah
Dr. P
iram
al is
a le
ader
who
mak
es a
po
sitive
diff
eren
ce to
the
com
mun
ity
and
the
wor
ld. H
er c
ontr
ibuti
ons
in in
nova
tions
, new
med
icin
es a
nd
publ
ic h
ealth
serv
ices
hav
e to
uche
d th
ousa
nds o
f liv
es.
Nan
dini
has
bee
n pa
ssio
nate
ly
invo
lved
with
Pira
mal
Fou
ndati
on,
the
phila
nthr
opic
arm
of P
iram
al
Grou
p. S
he d
irect
s im
plem
enta
tion
stra
tegy
acr
oss P
iram
al F
ound
ation
Ed
ucati
on L
eade
rshi
p pr
ogra
ms,
Pi
ram
al S
arva
jal a
nd P
iram
al
Swas
thya
.Q
ualifi
catio
nsBS
C (H
ons)
- U
nive
rsity
of W
arw
ick
(Eng
land
); Fe
llow
– In
stitu
te o
f Cha
rter
ed
Acco
unta
nts o
f Eng
land
& W
ales
;Fe
llow
- In
stitu
te o
f Sin
gapo
re
Char
tere
d Ac
coun
tant
s
Bach
elor
s deg
ree
of S
cien
ce
(Eco
nom
ics)
in a
ccou
nting
and
fin
ance
from
Uni
vers
ity o
f Lon
don;
M
BA fr
om U
nive
rsity
of C
hica
go
M.B
.B.S
.;M
aste
rs D
egre
e fr
om H
arva
rd S
choo
l of
Pub
lic H
ealth
;D.
I.M, C
olle
ge o
f Phy
sicia
ns &
Su
rgeo
ns, I
ndus
tria
l Med
icin
e Bo
mba
y
B.A.
(Hon
s), H
ertfo
rd C
olle
ge,O
xfor
d U
nive
rsity
;M
BA-S
tanf
ord
Grad
uate
Sch
ool o
f Bu
sines
s
B.Co
m.;
Char
tere
d Ac
coun
tant
;M
anag
emen
t Edu
catio
n Pr
ogra
mm
e fr
om II
M- A
hmed
abad
;Ad
vanc
ed M
anag
emen
t Pro
gram
- Ha
rvar
d Bu
sines
s Sch
ool,
Bost
on
(USA
)O
ther
Di
rect
orsh
ips a
s on
May
28,
201
8*
1.
The
Indi
an H
otel
s Com
pany
Li
mite
d2.
Bl
acks
tone
Adv
isors
Indi
a Pr
ivat
e Li
mite
d
NIL
1.
Pira
mal
Gla
ss P
rivat
e Li
mite
d (F
orm
erly
Pira
mal
Gla
ss L
imite
d)2.
Al
lerg
an In
dia
Priv
ate
Lim
ited
3.
Pira
mal
Man
agem
ent S
ervi
ces
Priv
ate
Lim
ited
4.
Aksh
ar F
inco
m P
rivat
e Li
mite
d5.
N
estle
Indi
a Li
mite
d6.
PE
L M
anag
emen
t Ser
vice
s Priv
ate
Lim
ited
7.
Sree
kovi
l Rea
lty P
rivat
e Li
mite
d8.
In
dia
Vent
ure
Advi
sors
Priv
ate
Lim
ited
9.
The
Pira
mal
Art
Fou
ndati
on
10
. Pira
mal
Cap
ital &
Hou
sing
Fina
nce
Lim
ited
1.
The
Swas
tik S
afe
Depo
sit a
nd
Inve
stm
ents
Lim
ited
(List
ed
Com
pany
)2.
N
ithya
m R
ealty
Priv
ate
Lim
ited
3.
Pira
mal
Wat
er P
rivat
e Li
mite
d4.
Pi
ram
al U
dgam
Dat
a M
anag
emen
t So
lutio
ns5.
Pi
ram
al C
orpo
rate
Ser
vice
s Li
mite
d
1.
Pira
mal
Gla
ss P
rivat
e Li
mite
d (F
orm
erly
Pira
mal
Gla
ss L
imite
d)2.
Ki
nnar
i Fou
ndati
on3.
Pi
ram
al C
orpo
rate
Ser
vice
s Priv
ate
Lim
ited
4.
PHL
Fini
nves
t Priv
ate
Lim
ited
Com
mitt
ee
Mem
bers
hip
/
Chai
rman
ship
Co
mm
ittee
of
othe
r Boa
rds a
s on
May
28,
201
8#
NIL
NIL
1.
Nes
tle In
dia
Lim
ited
- Cha
irper
son
of C
orpo
rate
Soc
ial R
espo
nsib
ility
Co
mm
ittee
2.
Pira
mal
Gla
ss P
rivat
e Li
mite
d -
Chai
rper
son
of C
orpo
rate
Soc
ial
Resp
onsib
ility
Com
mitt
ee
1.
The
Swas
tik S
afe
Depo
sit a
nd
Inve
stm
ents
Lim
ited
- Mem
ber
of S
take
hold
ers R
elati
onsh
ip
Com
mitt
ee
1.
Pira
mal
Gla
ss P
rivat
e Li
mite
d - M
embe
r of C
orpo
rate
Soc
ial
Resp
onsib
ility
Com
mitt
ee
Shar
ehol
ding
(no.
of
equ
ity sh
ares
) as
on
Mar
ch 3
1,
2018
NIL
NIL
1,21
710
8,37
712
4,48
3
Not
es:
*Oth
er D
irect
orsh
ips:
exc
ludi
ng fo
reig
n Bo
dies
Cor
pora
tes
# Mem
bers
hip
of st
atut
ory
com
mitt
ees
Deta
ils o
f las
t dra
wn
rem
uner
ation
and
rela
tions
hip
betw
een
Dire
ctor
s int
er se
as s
tipul
ated
in th
e SE
BI (L
isting
Obl
igati
ons &
Disc
losu
re R
equi
rem
ents
) Reg
ulati
ons,
201
5, a
re p
rovi
ded
in th
e Re
port
on
Corp
orat
e Go
vern
ance
form
ing
part
of t
he A
nnua
l Rep
ort
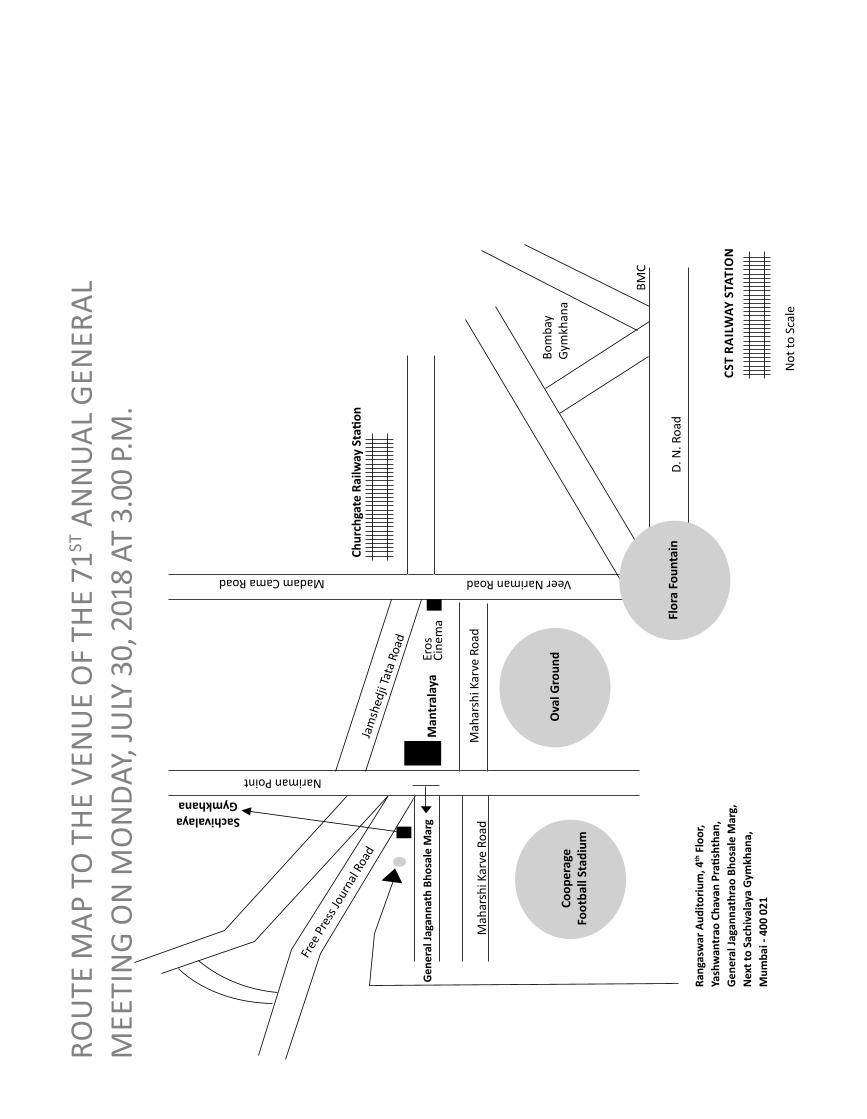
Rang
asw
ar A
udito
rium
, 4th
Flo
or,
Yash
wan
trao
Cha
van
Prati
shth
an,
Gen
eral
Jaga
nnat
hrao
Bho
sale
Mar
g,
Nex
t to
Sach
ival
aya
Gym
khan
a,
Mum
bai -
400
021Co
oper
age
Foot
ball
Stad
ium
Ova
l Gro
und
Flor
a Fo
unta
in
Veer Nariman Road
Chur
chga
te R
ailw
ay S
tatio
n
Mah
arsh
i Kar
ve R
oad
Man
tral
aya
Jam
shed
ji Ta
ta R
oad
Madam Cama Road
Nariman Point
Sachivalaya Gymkhana
Mah
arsh
i Kar
ve R
oad
Gen
eral
Jaga
nnat
h Bh
osal
e M
arg
Free
Pre
ss Jo
urna
l Roa
d
Eros
Ci
nem
a
Not
to S
cale
CST
RAIL
WAY
STA
TIO
N
D. N
. Roa
d
BMC
Bom
bay
Gym
khan
a
ROU
TE M
AP T
O T
HE
VEN
UE
OF
THE
71ST
AN
NU
AL G
ENER
AL
MEE
TIN
G O
N M
ON
DAY,
JULY
30,
201
8 AT
3.0
0 P.
M.

Notes

Notes

Notes
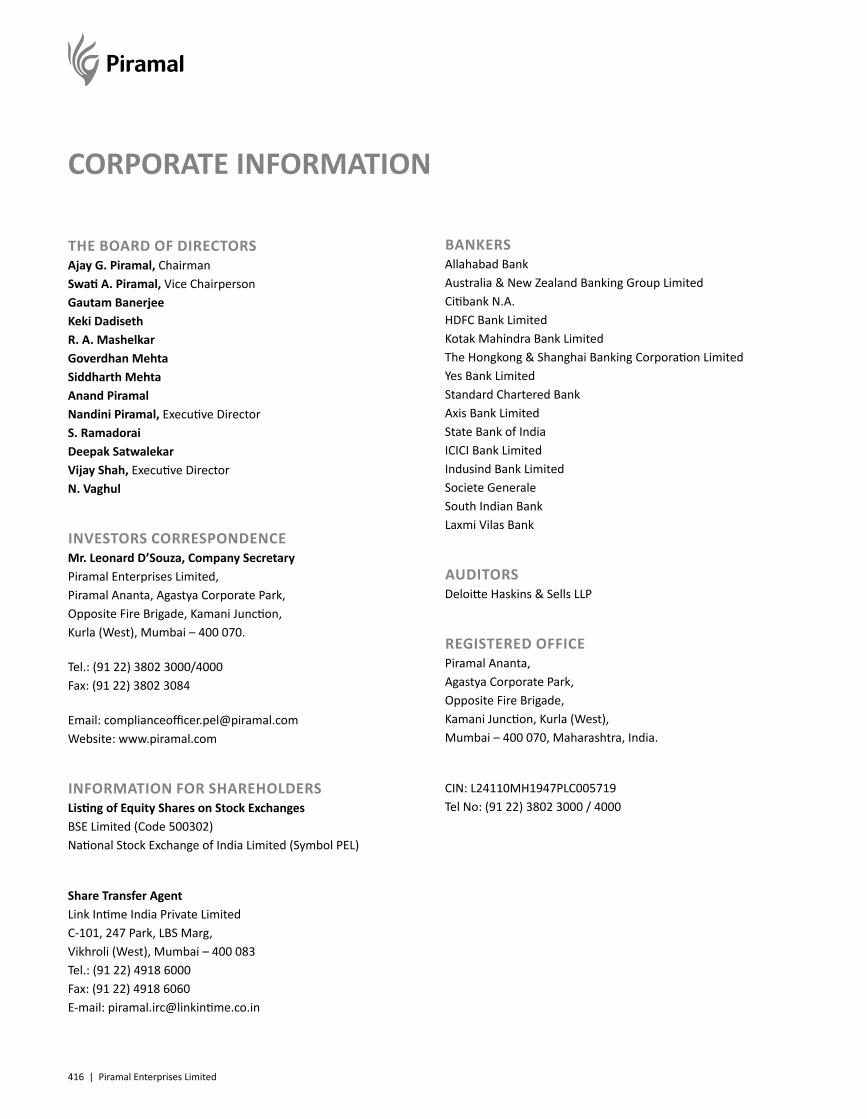
THE BOARD OF DIRECTORSAjay G. Piramal, ChairmanSwati A. Piramal, Vice ChairpersonGautam BanerjeeKeki DadisethR. A. MashelkarGoverdhan MehtaSiddharth MehtaAnand PiramalNandini Piramal, Executive DirectorS. RamadoraiDeepak SatwalekarVijay Shah, Executive DirectorN. Vaghul
INVESTORS CORRESPONDENCEMr. Leonard D’Souza, Company SecretaryPiramal Enterprises Limited,Piramal Ananta, Agastya Corporate Park,Opposite Fire Brigade, Kamani Junction,Kurla (West), Mumbai – 400 070.
Tel.: (91 22) 3802 3000/4000Fax: (91 22) 3802 3084
Email: [email protected]: www.piramal.com
INFORMATION FOR SHAREHOLDERSListing of Equity Shares on Stock ExchangesBSE Limited (Code 500302)National Stock Exchange of India Limited (Symbol PEL)
Share Transfer AgentLink Intime India Private LimitedC-101, 247 Park, LBS Marg,Vikhroli (West), Mumbai – 400 083Tel.: (91 22) 4918 6000Fax: (91 22) 4918 6060E-mail: [email protected]
BANKERSAllahabad BankAustralia & New Zealand Banking Group LimitedCitibank N.A.HDFC Bank LimitedKotak Mahindra Bank LimitedThe Hongkong & Shanghai Banking Corporation LimitedYes Bank LimitedStandard Chartered BankAxis Bank LimitedState Bank of IndiaICICI Bank LimitedIndusind Bank LimitedSociete GeneraleSouth Indian BankLaxmi Vilas Bank
AUDITORSDeloitte Haskins & Sells LLP
REGISTERED OFFICEPiramal Ananta, Agastya Corporate Park, Opposite Fire Brigade, Kamani Junction, Kurla (West),Mumbai – 400 070, Maharashtra, India.
CIN: L24110MH1947PLC005719Tel No: (91 22) 3802 3000 / 4000
CORPORATE INFORMATION
416 | Piramal Enterprises Limited

FORWARD-LOOKING STATEMENTInthisAnnualReport,wehavedisclosedforward-lookinginformationtoenableinvestorstocomprehendourprospectsandtakeinvestmentdecisions.Thisreportandotherstatements-writtenandoral-thatweperiodicallymake,containforwardlookingstatementsthatsetoutanticipatedresultsbasedonthemanagement’splansandassumptions.Wehavetried,whereverpossible,toidentifysuchstatementsbyusingwordssuchas‘anticipate’,‘estimate’,‘expect’,‘project’,‘intend’,‘plan’,‘believe’,andwordsofsimilarnatureinconnectionwithanydiscussionoffutureperformance.Wecannotguaranteethattheseforward-lookingstatementswillberealised,althoughwebelievewehavebeenprudentinourassumptions.Theachievementsofresultsaresubjecttorisks,uncertaintiesandeveninaccurateassumptions.Shouldknownorunknownrisksoruncertaintiesmaterialise,orshouldunderlyingassumptionsproveinaccurate,actualresultscouldvarymateriallyfromthoseanticipated,estimatedorprojected.Readersshouldkeepthisinmind.Weundertakenoobligationtopubliclyupdateanyforward-lookingstatement,whetherasaresultofnewinformation,futureeventsorotherwise.

Piramal Enterprises LimitedRegistered Office: Piramal Ananta, Agastya Corporate Park (Opposite Fire Brigade)
Kamani Junction, LBS Marg, Kurla (West), Mumbai - 400 070 CIN: L24110MH1947PLC005719