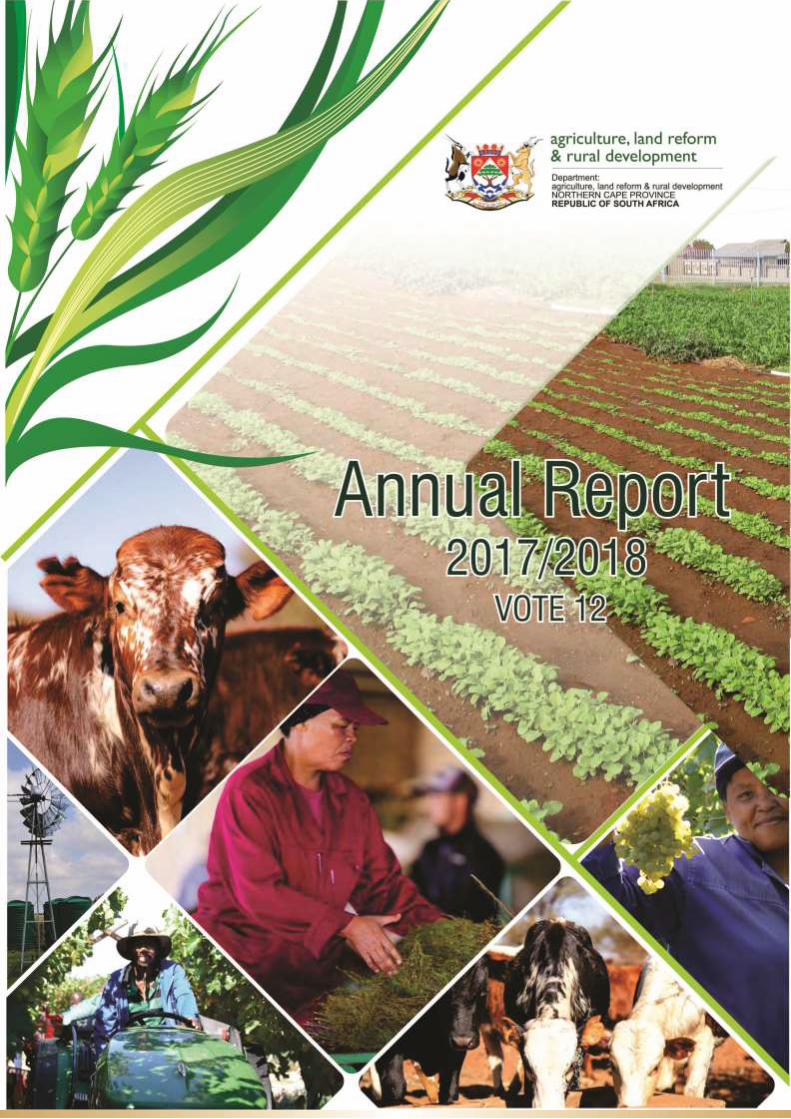
vote 12 annual report 2017/18 financial year
TRANSCRIPT
1
2
Vote 12
Annual Report
2017/18 Financial Year
3
Table of Contents
PART A: GENERAL INFORMATION ....... 6Error! Bookmark not defined.
1. DEPARTMENT GENERAL INFORMATION ....................................................................... 7
2. LIST OF ABBREVIATIONS/ACRONYMS ........................................................................... 8
3. FOREWORD BY THE MEC ................................................................................................. 11
4. REPORT OF THE ACCOUNTING OFFICER ................................................................... 13
5. STATEMENT OF RESPONSIBILITY AND CONFIRMATION OF ACCURACY FOR
THE ANNUAL REPORT ................................................................................................................... 22
6. STRATEGIC OVERVIEW ............................................................................................................ 23
6.1 Vision ............................................................................................................................... 23
6.2 Mission ............................................................................................................................ 23
6.3 Values .............................................................................................................................. 23
7 LEGISLATIVE AND OTHER MANDATES ........................................................................ 24
8 ORGANISATIONAL STRUCTURE .................................................................................... 25
9 ENTITIES REPORTING TO THE MEC .............................................................................. 25
PART B: PERFOMANCE INFORMATION ........................................... 26
1. AUDITOR GENERAL’S REPORT: PREDETERMINED OBJECTIVES ....................... 27
2. OVERVIEW OF DEPARTMENTAL PERFORMANCE .................................................... 27
2.1 Service Delivery Environment .................................................................................. 27
2.2 Service Delivery Improvement Plan ........................................................................ 30
2.3 Organisational Environment ..................................................................................... 33
2.4 Key policy developments and legislative changes ............................................. 35
3. STRATEGIC OUTCOME ORIENTED GOALS ................................................................. 36
4. 4. PERFORMANCE INFORMATION BY PROGRAMMES .......................................... 47
4.1 Programme 1: Administration .................................................................................... 49
4
4.2 Programme 2: Sustainable Resource Management ............................................. 64
4.3 Programme 3: Farmer Support and Development ................................................ 86
4.4 Programme 4: Veterinary Services ......................................................................... 124
4.5 Programme 5: Research and Technology Development Services ................. 153
4.6 Programme 6: Agricultural Economics Services ................................................ 175
4.7 Programme 7: Rural Development Coordination ................................................ 185
5. TRANSFER PAYMENTS.................................................................................................... 201
6. CONDITIONAL GRANTS ................................................................................................... 202
7. CAPITAL INVESTMENT .................................................................................................... 207
PART C: GOVERNANCE ................................................................... 207
1. INTRODUCTION .................................................................................................................. 209
2. RISK MANAGEMENT ......................................................................................................... 210
3. FRAUD AND CORRUPTION ............................................................................................. 210
4. MINIMISING CONFLICT OF INTEREST ......................................................................... 211
5. CODE OF CONDUCT ......................................................................................................... 211
6. HEALTH SAFETY AND ENVIRONMENTAL ISSUES .................................................. 212
7. PORTFOLIO COMMITTEES .............................................................................................. 213
8. SCOPA RESOLUTIONS .................................................................................................... 213
9. PRIOR MODIFICATIONS TO AUDIT REPORTS ........................................................... 215
10. INTERNAL CONTROL UNIT ............................................................................................. 215
11. INTERNAL AUDIT AND AUDIT COMMITTEES ............................................................ 216
12. AUDIT COMMITTEE REPORT FOR 2017/18 ................................................................. 218
PART D: HUMAN RESOURCE MANAGEMENT ............................... 220
1. INTRODUCTION .................................................................................................................. 222
2. HUMAN RESOURCE OVERSITE STATISTICS ............................................................ 223
5
PART E: FINANCIAL INFORMATION ............................................... 247
1. REPORT OF THE AUDITOR-GENERAL ........................................................................ 249
2. ANNUAL FINANCIAL STATEMENTS ............................................................................. 255

6

7
1. DEPARTMENT GENERAL INFORMATION
PHYSICAL ADDRESS: 162 George Street
Kimberley
8301
POSTAL ADDRESS: Private bag X5018
Kimberley
8301
TELEPHONE NUMBER/S: +27 538389100
FAX NUMBER: +27 538389138
EMAIL ADDRESS: [email protected]
WEBSITE ADDRESS : www.agrinc.gov.za
8
2. LIST OF ABBREVIATIONS/ACRONYMS
AC Audit Committee ADHD Attention Deficit Hyperactivity Disorder AFASA African Farmers Association of South Africa AFS Annual Financial Statements AgriNK Agri – Noord-Kaap AGSA Auditor General of South Africa AHS African Horse Sickness AI Avian influenza AIMS Agriculture Information Management System AO Accounting Officer APAP Agricultural Policy Action Plan APR Agricultural Potential Reports ARC Agricultural Research Council ASF African Swine Fever BBBEE Broad –based Black Economic Empowerment BTB Bovine Tuberculosis CAADP Comprehensive African Agricultural Development CASA Computer Assisted Sperm Analysis CASP Comprehensive Agricultural Support Programme CCS Compulsory Community Service CFO Chief Financial Officer CITT Comparative Intradermal Tuberculin Test CNDC Community Nutrition Development Centres COGHSTA Cooperative Governance, Human Settlement and Traditional Affairs CoS Council of Stakeholders CPA Communal Property Association CRD Comprehensive Rural Development CRDP Comprehensive Rural Development Program . CWP Community Work Programme DAFF Department of Agriculture, Forestry and Fisheries DALRRD Department of Agriculture, Land Reform and Rural DEC Departmental Executive Committee DPW Department of Public Works DSA Descriptive Sensory Analysis DWS Department of Water and Sanitation EIA Environmental Impact Assessment EMS electro-magnetic spectrum EPWP Expanded Public Works Programme EU European Union FAO Food & Agriculture Organization FMD Foot and Mouth Disease GADI Grootfontein Agricultural Development Institute GEMS Government Employees Medical Scheme GI Geographic Indication HAS Hygiene Assessment System HIV Human Immunodeficiency Virus HOD Head of Department HPAI Highly Pathogenic Avian Influenza IDP Integrated Development Programme IFSNP Integrated Food Security & Nutrition Programme IFSS Integrated Food Security Strategy of South Africa
9
IMI Independent Meat Inspection JTG John Taolo Gaetsewe KDF Trust Karoo Development Foundation Trust LHR Lawyers for Human Rights LPAI Low Pathogenic Avian Influenza LSU Large Stock Unit MCF Malignant Catarrhal Fever ME Molecular Epidemiology MEC Member of Executive Council MIG Municipal Infrastructure Grant MISS Management Information Security Systems MOU Memorandum of Understanding MPAT Management Performance Assessment Tool MPL Member of the Provincial Legislature MTEF Medium Term Expenditure Framework MTSF Medium Term Strategic Framework NAFU National African Farmers Union NAMC National Agriculture Marketing Council NCAIS Northern Cape Agricultural Information System NCOP National Council of Provinces NDMC National Disaster Management Centre NDP National Development Plan NEF National Empowerment Fund NGO Non-Governmental Organization NGP New Growth Path NICD National Institute of Communicable Diseases NRMP National Residue Monitoring Programme NSC National Surveillance Scheme NZG National Zoological Gardens OCFO Office of the Chief Financial Officer OIE Office International des Epizooties OTP Office of the Premier. PA Pyrrolizidine alkaloid PAHC Primary Animal Health Care PAIA Promotion of Access to Information Act PAJA Promotion of Administrative Justice Act PAJA Promotion of Administrative Justice Act PDF Provincial Delivery Forum PDMC Provincial Disaster Management Centre PFMA Public Finance Management Act PMQS Pregnant Mare Quarantine Station PORT Provincial Outbreak Response Team PPME Planning Performance Monitoring & Evaluation PPP Public Private Partnerships PSC Public Service Commission PTIF Provincial Technical Implementation Forum QLFS Quarterly Labour Force Survey REID Rural Enterprise and Industrial Development RID Rural Industrial Development RMC Risk Management Committee RMC Risk Management Committee RPA Remotely Piloted Aircrafts RVF Rift Valley Fever SAQA South African Qualifications Authority SASAE South African Society for Agricultural Extension
10
SASSA South African Social Security Agency SAVC South African Veterinary Council SCM Supply Chain Management SCOPA Standing Committee on Public Accounts SDIP Service Delivery Improvement Plan SDVI Standardized Difference Vegetation Index SEDA Small Enterprise Development Agency SEFA Small Enterprise Financial Agency SHD Small Harbour Development SIP Strategic Integrated Projects SITA State Information Technology Agency SKA Square Kilometre Array SMME Small Medium and Micro Enterprises SPLUMA Spatial Planning and Land Use Management Act SSA State Security Agency STC Social Technical Cluster STI Sexual Transmitted Diseases TB tuberculosis ( TR Treasury Regulations VCI Vegetation Condition Index VPH Veterinary Public Health WHO World Health Organisation
11
3. FOREWORD BY THE MEC
The annual report 2017/18 is a key instrument for the department to report against its
set performance targets and budget as outlined in the Department’s Strategic Plan. In
executing its mandate, the Department was guided by key government policies and
plans including the National Development Plan (NDP), the New Growth Path (NGP),
the Medium Term Strategic Framework (MTSF), and the Agricultural Policy Action
Plan (APAP).
However, the delivery environment was constrained and affected by restrained
economic performance, natural disasters in the form drought, as well as internal
adversities relating to the recruitment of skilled technical workforce. In particular, the
drought condition in the province forced the Department to re-channel both financial
and human resources to ensuring that farmers are in full production and food security
in the Province is not threatened. Even so, the Department has judiciously been able
to pursue and fulfil its planned programmes successfully.
The Department has been able to provide tangible and technical support to farmers
affected by the drought. Subsequent to that, the Department established a productive
fodder bank in an attempt to complement the disbursement of animal feed and ease
the financial burden on procurement of fodder and silage for farmers. The Department
continues to timeously monitor the situation to avoid adverse outcomes.
During the year under review, the Department planted a total of 1056.53 hectares with
various crop cultivars, mainly maize and wheat, as part of the Fetsa Tlala Food
Production Programme. This programme aims to put unutilized land into production in

12
order to promote food security and address structural causes of food insecurity, which
continue to perpetuate inequality and social exclusion.
In addressing the plight of slow economic growth and job creation, the Department,
through the conditional grant funding was able to support smallholder farmers and
black commercial farmers. The Comprehensive Agricultural Support Programme
(CASP) and Ilima /Letsema grants combined, supported a total of 32 projects across
the province. As a result of these projects, a total of 852 jobs were created and 4266
smallholder producers were supported with the aim of enhancing productivity and
transforming the sector.
The veterinary services remain a key component of the Department that plays a
fundamental role in ensuring healthy animals, safe animal products, and welfare of the
human population in the province. Since the inception of the Compulsory Community
Service Programme (CCS) for newly qualified veterinarians, the Department is able to
provide Primary Animal Health Care Services (PAHCS) to the most rural areas in the
province. Furthermore, since obtaining the South African National System
Accreditation (SANAS), our laboratory service has continued to work with
determination in providing diagnostic and investigative services, not only for the
Northern Cape, but for the neighbouring provinces as well.
_________________
Mr GNJ Shushu, MPL
MEC of the Department of Agriculture, Land Reform and Rural Development
31 August 2018
13
4. REPORT OF THE ACCOUNTING OFFICER
Mr W.V.D Mothibi
Head of Department
Overview of the operations of the Department:
The Annual Report 2017/18 outlines key achievements in the quest of government to
address unemployment, poverty and inequality. It expresses the specific tasks
undertaken to implement programmes that seeks to create a transformed, vibrant
agricultural sector for food security and sustainable development.
The service delivery environment was adversely affected by constrained fiscal position
as a result of subdued economic growth. Nonetheless the department managed to
implement planned programmes without major deviations.
The province continued to experience drought and occurrence of diseases. Pixley ka
Seme and Namakwa were classified as provincial stated of drought disaster. The
Department of Agriculture, Forestry and Fisheries (DAFF) allocated an amount of
about R25 million to the Northern Cape Province for the procurement of drought feed
to assist affected farmers. The province reported the occurrences of African swine
fever in Pniel, Gong Gong and Alfa farm resulting R132 500 financial loss.
Furthermore, the were reported outbreaks of African Horse sickness in Kuruman,
Calvinia and De Aar which resulted in about 150 animals succumbing to the disease.
In curbing the disease, the department carried out 279 vaccinations around the
affected areas.
14
Overview of the financial results of the Department:
Departmental receipts
Departmental receipts
2017/2018 2016/2017
Estimate
Actual
Amount
Collected
(Over) /
Under
Collection Estimate
Actual
Amount
Collected
(Over) / Under
Collection
R’000 R’000 R’000 R’000 R’000 R’000
Tax Receipts
Casino taxes
Horse racing taxes
Liquor licences
Motor vehicle licences
Sale of goods and
services other than
capital assets
2 748 4 078 (1 330) 2 557 2 838 (281)
Sale of scrap, waste &
other goods 54 236 (182)
Transfers received
Fines, penalties and
forfeits
Interest, dividends and
rent on land 30 104 (74) 4 5 (1)
Sale of capital assets 112 90 22 648 648 -
Financial transactions in
assets and liabilities 141 163 (22) 102 221 (119)
Total 3 085 4 671 (1 586) 3 311 3 712 (401)
The Department collected R4.671 million of own revenue for the 2017/18 financial year
and this represents an increase of almost 26 percent when compared to the previous
financial year. This increase is noted in the category of “Sale of goods and services
other than capital assets” and is related to the sales of biological assets from research
stations.
As has been the trend over the past few years, the Department has over collected on
its revenue estimates. The over collection of 51 percent is attributed to the incidental
sale of biological assets which are used for breeding and research purposes on our
research stations and the Livestock Improvement Programme (LIP) as well as the
introduction of the Compulsory Community Service (CCS) Programme which has
extended the reach of veterinary services in the province.
The tariffs related to services rendered by the Department are reviewed annually and
when necessary increased with the approval of the Provincial Treasury. There were
15
no bad debts written off during the period under review.
The list below represents those free services rendered by the Department that if a
fee/tariff were charged, could have yielded a significant amount of revenue.
Veterinary Services
Primary animal health care (e.g. spay campaigns)
Awareness campaigns (radio talks, farmer’s days & workshops)
Vaccination campaigns
Agricultural business development
Business plan development
Feasibility studies
Training and capacity building of farmer’s
Extension and advisory services
Programme Expenditure
Programme Name
2017/2018 2016/2017
Final
Appropriat
ion
Actual
Expendit
ure
(Over) /
Under
Expendit
ure
Final
Appropriat
ion
Actual
Expendit
ure
(Over) /
Under
Expenditur
e
R’000 R’000 R’000 R’000 R’000 R’000
Pr1: Administration 120 337 120 337 - 118 608 118 606 2
Pr2: Sustainable
Resource
Management
32 623 29 377 3 246 95 698 95 444 254
Pr3: Farmer Support
& Development 351 702 335 137 16 565 226 885 212 071 14 814
Pr4: Veterinary
Services 50 312 50 312 - 44 659 44 659 -
Pr5: Research &
Technology
Development
Services
44 327 44 326 1 46 656 46 656 -
Pr6: Agricultural
Economics 9 716 9 716 - 9 061 9 043 18
Pr7: Rural
Development
Coordination
15 096 15 096 - 13 638 13 630 8
Total 624 113 604 301 19 812 555 205 540 109 15 096
The final adjusted budget allocation of the Department, including conditional grants,
for the 2017/18 financial year was R624.113 million of which R604.301 million or

16
97 percent was spent. The unspent portion mainly related to the conditional grants
however these funds were committed and rollover of funds was requested from the
Provincial Treasury.
The total budget available from the conditional grants amounted to R315.199 million
of which R298.176 million or 95 percent was spent. The conditional grant allocation
included a portion related to flood disasters of R111.500 million within the CASP grant.
R17.018 million of the unspent funds from the CASP and LandCare grants have been
requested to be rolled over to the 2017/18 financial year.
The graph below shows the overall budget and expenditure trend of the Department for the past three
financial years.
Virements/roll overs
The Department has effected virements between the main divisions and shifted funds
within the main divisions in terms of section 43 of the PFMA and Treasury Regulation
6.3 to defray excess expenditure in some programmes with savings from other
programmes. The details of the virements are summarised in the table. The virements
were approved by the Accounting Officer and both the Executive Authority and the
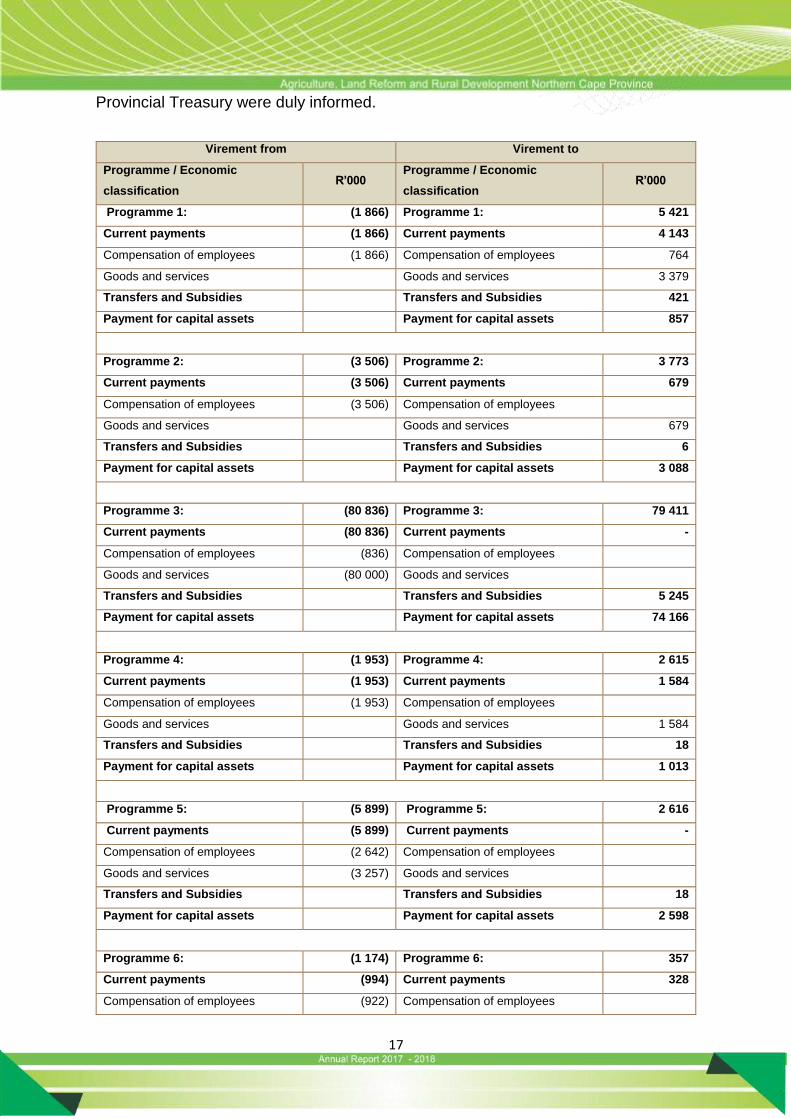
17
Provincial Treasury were duly informed.
Virement from Virement to
Programme / Economic
classification R’000
Programme / Economic
classification R’000
Programme 1: (1 866) Programme 1: 5 421
Current payments (1 866) Current payments 4 143
Compensation of employees (1 866) Compensation of employees 764
Goods and services Goods and services 3 379
Transfers and Subsidies Transfers and Subsidies 421
Payment for capital assets Payment for capital assets 857
Programme 2: (3 506) Programme 2: 3 773
Current payments (3 506) Current payments 679
Compensation of employees (3 506) Compensation of employees
Goods and services Goods and services 679
Transfers and Subsidies Transfers and Subsidies 6
Payment for capital assets Payment for capital assets 3 088
Programme 3: (80 836) Programme 3: 79 411
Current payments (80 836) Current payments -
Compensation of employees (836) Compensation of employees
Goods and services (80 000) Goods and services
Transfers and Subsidies Transfers and Subsidies 5 245
Payment for capital assets Payment for capital assets 74 166
Programme 4: (1 953) Programme 4: 2 615
Current payments (1 953) Current payments 1 584
Compensation of employees (1 953) Compensation of employees
Goods and services Goods and services 1 584
Transfers and Subsidies Transfers and Subsidies 18
Payment for capital assets Payment for capital assets 1 013
Programme 5: (5 899) Programme 5: 2 616
Current payments (5 899) Current payments -
Compensation of employees (2 642) Compensation of employees
Goods and services (3 257) Goods and services
Transfers and Subsidies Transfers and Subsidies 18
Payment for capital assets Payment for capital assets 2 598
Programme 6: (1 174) Programme 6: 357
Current payments (994) Current payments 328
Compensation of employees (922) Compensation of employees

18
Virement from Virement to
Programme / Economic
classification R’000
Programme / Economic
classification R’000
Goods and services (72) Goods and services 328
Transfers and Subsidies Transfers and Subsidies 29
Payment for capital assets (180) Payment for capital assets
Programme 7: (1 044) Programme 7: 2 085
Current payments (1 044) Current payments 1 936
Compensation of employees (1 044) Compensation of employees 1 041
Goods and services Goods and services 895
Transfers and Subsidies Transfers and Subsidies 5
Payment for capital assets Payment for capital assets 144
The Department received roll-over funds amounting to R14.809 million on the CASP
and Ilima/Letsema conditional grants during the adjustment estimates process of the
2017/18 financial year. The details thereof are summarised in the table below.
The unspent funds for the 2017/18 financial year amounted to R19.812 million. The
unspent portion relates to conditional grants (CASP – R16.545 million & LandCare –
R0.474 million) and equitable share (R2.775 million) that had been requested for roll
over to the 2018/19 financial year.
Grant Name Original
Budget
Roll-
over
Adjusted
Budget R’000
Programme 3: Farmer Support and Development
Comprehensive Agriculture Support Programme Grant (Projects,
ERP & Flood Disaster) 232 772 11 609 244 381
Ilima/Letsema Projects Grant 58 480 3 200 61 680
Unauthorised, fruitless and wasteful expenditure
There has been no unauthorised expenditure incurred in the 2017/18 financial year.
The Department went through a thorough exercise to ensure that all fruitless and
wasteful expenditure is identified and treated appropriately. During the 2017/2018
financial year a total amount of R0.214 million was identified as fruitless and wasteful
expenditure. Investigations to determine whether there was gross negligence or
circumstances beyond reasonable care that resulted in the fruitless and wasteful
19
expenditure is underway and expected to be finalised during the 2018/19 financial
year.
Future plans of the Department
The future plans of the Department are contained in its strategic and operational plans.
These plans are aligned with the government’s MTSF and the NDP.
Public Private Partnerships
None
Discontinued activities / activities to be discontinued
None
New or proposed activities
All the activities undertaken as outlined in the operations were in pursuance of the
goals and objectives of the approved annual performance plan and no new activities
were proposed or implemented for the year under review.
Supply chain management
The Department did not receive or conclude unsolicited bids for the year under review.
Immense progress was made during this financial year with regard to the identification
and reporting of irregular expenditure within the Department.
Investigations for the huge backlog of cases since 2014/15 were prioritised. The
outcome indicated that for most of these cases, though proper supply chain
management procedures were not always followed, there were indeed justifiable
circumstances that resulted in deviations from normal SCM processes being the only
option, so as not to compromise service delivery.
The investigations indicated however, that there was a huge gap in the awareness of
new developments in the legislation pieces that lead to the non-adherence. The
Internal Control unit and SCM unit embarked on training workshops to update officials
involved. The training focused on procurement officials and other users within our
Department that were linked to the procurement process.
20
Gifts and Donations received in kind from non-related parties
No gifts and donations have been received in kind from non-related parties.
Exemptions and deviations received from the National Treasury
For the 2017/18 financial year, the Department did not receive any exemptions and/or
deviations from National Treasury.
Events after the reporting date
There are no reportable events subsequent to the reporting date of 31 March 2018.
Other
There are no other material facts or circumstances, which may have an impact on the
understanding of the state of the financial affairs of the Department, not addressed
elsewhere in the report.
Acknowledgement/s or Appreciation
I would like to thank all the officials of the Department who worked diligently and
tirelessly with the support of our partners and the relevant stakeholders in the sector
to ensure that our priorities, goals and objectives are achieved.
Conclusion
The successes and accomplishments of the Department are driven by a common
understanding throughout its structures that ensures that the agriculture sector is
served best. The economical and efficient use of scarce resources to deliver services
is appreciated by sector stakeholders. While it is acknowledged that all is not perfect,
the Department will pursue relentlessly and learn from past errors.
21
Approval and sign off
The Annual Financial Statements set out on pages 256 to 338 have been approved
by the Accounting Officer
_________________
Mr WVD Mothibi
Accounting Officer
Department of Agriculture, Land Reform and Rural Development
Date: 31 August 2018
22
5. STATEMENT OF RESPONSIBILITY AND CONFIRMATION OF ACCURACY
FOR THE ANNUAL REPORT
To the best of my knowledge and belief, I confirm the following:
All information and amounts disclosed throughout the annual report are consistent.
The annual report is complete, accurate and is free from any omissions.
The annual report has been prepared in accordance with the guidelines on the annual
report as issued by National Treasury.
The Annual Financial Statements (Part E) have been prepared in accordance with the
modified cash standard and the relevant frameworks and guidelines issued by the
National Treasury.
The Accounting Officer is responsible for the preparation of the annual financial
statements and for the judgements made in this information.
The Accounting Officer is responsible for establishing, and implementing a system of
internal control that has been designed to provide reasonable assurance as to the
integrity and reliability of the performance information, the human resources
information and the annual financial statements.
The external auditors are engaged to express an independent opinion on the annual
financial statements.
In my opinion, the annual report fairly reflects the operations, the performance
information, the human resources information and the financial affairs of the
Department for the financial year ended 31 March 2018.
Yours faithfully
___________________
Accounting Officer
Mr WVD Mothibi
Department of Agriculture, Land Reform and Rural Development
Date: 30 August 2018
23
6. STRATEGIC OVERVIEW
6.1 Vision
A transformed, vibrant agricultural sector for food security and sustainable rural
development.
6.2 Mission
The Department as a lead agent in the sector, will champion land and agrarian
transformation, promote and facilitate increased production and provide expertise
for improved livelihoods, sustainable rural development and food security for all.
6.3 Values
The Department will aspire to the following values:
Responsiveness
Sacrifice
Professionalism
Accountability
Respect
Innovation

24
7 LEGISLATIVE AND OTHER MANDATES
The Department of Agriculture, Land Reform and Rural Development is an integral
part of the South African Public Service established in terms of section 197 of the
Constitution and read with section 7 (1) and 7 (2) of the Public Services Act of 1994.
In particular, the following sections are relevant to the Department. Chapter 2,
Sections 23, 25 and 27 Schedule 4 and 5 of the Constitution.
The Department functions under several legislative mandates, which include among
others the following:
Agricultural Development Fund Act, 1993 (Act No 175 of 1993)
Agricultural Product Standards Act, 1990 (Act No 119 of 1990)
Animal Diseases Act, 1984 (Act 35 of 1984)
Agricultural Research Act, 1990 (Act No 86 of 1990)
Animal Identification Act, 2002 (Act No 6 of 2002
Animal Improvement Act, 1998 (Act 62 of 1998)
Broad Based Black Economic Empowerment Act, 2003 (Act No 53 of 2003)
Codex Alimentarius of the World Health Organization (WHO) and Food and Agricultural Organization (FAO) (International Code on Food Safety)
Communal Land Rights Act, 2004
Conservation of Agricultural Resources Act, 1983 (Act 43 of 1983)
Constitution of the Republic of South Africa, 1996 (Act 108 of 1996)
Disaster Management Act, 2002 (Act No 57 of 2002)
Fencing Act, 1963 (Act No 31 of 1963)
Fertilizers, Farm feeds, Agricultural Remedies and Stock Remedies Act, 1947 (Act 36 of 1947)
Genetically Modified Organisms Act, 1997 (Act 15 of 1997)
Land Redistribution for Agricultural Development (LRAD)
Land Reform Act, 1997 (Act 3 of 1997)
Marketing of Agricultural Produce Act, 1996 (Act 47 of 1996)
Meat Safety Act, 2000 (Act 40 of 2000)
Northern Cape Land Administration Act, 2003
Perishable Product Export Control Act, 1983 (Act 9 of 1983)
Plant Improvement Act, 1976 (Act 53 of 1976)
Public Finance Management Act, 1999 (PFMA), Act 1 of 1999 as amended by Act 29 of 1999
Preferential Procurement Policy Framework Act, 2000 (Act No 5 of 2000)
Preferential Procurement Regulations of August 2001
Provincial Supply Chain Management Policy (April 2006)
South African Abattoir Corporation Act, 2005 Repeal (Act no 17 of 2005)
Subdivision of Agricultural Land Act, 1970 (Act 70 of 1970) (pending repeal)
The International Animal Health Code of the World Organization for Animal Health (OIE – Office International des Epizooties)
The international Code for Laboratory Diagnostic Procedure for Animal Diseases of the World Organization for Animal Health
The Sanitary and Phyto-sanitary Agreement of the World Trade Organization (WTO)
Treasury Regulations for Departments, constitutional institutions and public entities issued in March 2005 in terms of the PFMA
Veterinary and Para-Veterinary Professions Act, 1982 (Act 19 of 1982)
Water Act, 1998
25
8 ORGANISATIONAL STRUCTURE
9 ENTITIES REPORTING TO THE MEC

26
27
1. AUDITOR GENERAL’S REPORT: PREDETERMINED OBJECTIVES
Refer to page 248 of the Report of the Auditor General, published as Part E: Financial
Information.
2. OVERVIEW OF DEPARTMENTAL PERFORMANCE
2.1 Service Delivery Environment
The performance environment during the year under review was characterized by a
subdued economic outlook; high levels of unemployment; deteriorating poverty levels
and widening inequality. These factors have had an adverse effect on the poverty
levels and food security. Accordingly, the Department sought to respond to service
delivery challenges while contributing to the broad developmental goals of
government.
In terms of the global economic outlook, the International Monetary Fund projected
that the world economy would grow by 3.7 percent in 2017 and 3.9 percent in 2018
and 2019. The South African economy grew by an estimated 1.3 percent in 2017, and
is expected to grow by 2 percent in 2018 as economic conditions strengthen. This
represents a very modest growth which places a strain on the government revenue
and its ability to expand public services.
In terms of the province, the economy grew negatively by 0.3 percent in 2016 which
is substantially lower than growth of 0.9 percent in 2015. The agricultural sector in the
Northern Cape has been growing at a slow pace since 2015. This demonstrates the
support from the agricultural sector towards positive provincial growth. Constraints
facing the Agricultural sector are numerous, including rising inputs costs, an uneven
international trade environment, fluctuations in the global markets, lack of
development infrastructure and the impeding drought conditions.
One of the priorities of government is the creation of decent jobs. The 2017 Labour
Force Survey by Statistics South Africa indicated an increase in the provincial
28
unemployment by roughly 11 000 in 2017.This increased the provincial unemployment
numbers from 288 000 to 299 000. As a response to the job losses experienced, the
department created 1052 jobs through the CASP, Ilima/Letsema, and the LandCare
Conditional Grants.
Furthermore, the province has been affected by the worst drought in this century. The
Department has had to provide technical and material support to the affected farmers.
As part of the disaster management strategy, under-utilised portions of irrigation lands
on three Research Stations have been used for the production of fodder to assist
farmers in the event of natural disasters. In this respect, the Department initiated a
fodder bank concept with the aim to provide a support service to the Disaster
Management Unit through the production and storage of fodder crops such as Lucerne
and yellow maize on research stations.
As part of the Drought Relief Initiative, 413 tons of lucerne and 13 tons of maize have
been donated through the fodder bank initiative. Approximately 100 tons of lucerne
was still in stock at Eiland Research Station as at the end of the financial year.
Agriculture plays an important role in the process of economic development and can
contribute significantly to household food security. Consequently, the Department
implements key programmes aimed at addressing food insecurity and bringing relief
to the most affected households. During the 2017/18 financial year, 1 266 households
benefitted from the Department’s food security initiatives. Moreover, the Department
established 680 household food gardens and 39 institutional gardens. Throughout the
Fetsa Tlala Food Production Programme, 1056.5 hectares were planted in communal
areas and land reform projects.
In terms of the General Household Survey of 2017, the percentage of households with
limited access to food decreased from 23.9 percent in 2010 to 22.3 percent in 2016. It
is therefore encouraging to note a marginal decrease in the percentage of households
that are food insecure. Simultaneously, the percentage of persons with more limited
access to food declined from 28.6 percent in 2010 to 24.9 percent in 2016. In the
29
Northern Cape 33.6 percent of the households had inadequate or severely inadequate
food access.
Furthermore, about 10.4 percent of households in the Northern Cape are involved in
agricultural production activities. From the households involved in agricultural
activities, 7.5 percent constitutes the households main source of income and for 9.1
percent of the households, these agricultural activities are the main source of food for
the household.
The service delivery environment was also plagued by threats of disease outbreaks
that required the province to deploy resources in monitoring and surveillance. In
particular, during the second quarter of the 2017/18 financial year South Africa was
hard hit by the H5N8 Avian Influenza virus.
The most affected provinces were Mpumalanga, Gauteng and Western Cape.
Although, the Northern Cape and Limpopo were the two provinces that were not
affected by the outbreak, trade in live poultry and poultry products were disrupted.
The province has at least 26 ostrich compartments and about 10 commercial poultry
establishments which have strict biosecurity measures in place. Warrenton Super
Chicken is one of the 10 commercial poultry establishments which has departmental
support. The assistance the Department rendered at this facility reduced the threat of
Avian Influenza and there has not been any confirmed human cases so far. Similarly,
the department’s Veterinary Public Health (VPH) component heightened hygiene
compliance particularly deep cleaning at abattoirs in the province in response to the
Listeriosis outbreak in the country.

30
2.2 Service Delivery Improvement Plan
The Department has completed a service delivery improvement plan. The tables below
highlight the service delivery plan and the achievements to date.
Main services and standards
Main services Beneficiaries
Current/actual standard of
service Desired standard
of service Actual
achievement
Extension and advisory Services
Smallholder Farmers Land reform beneficiaries Communities
4258 farmers and beneficiaries
2700 smallholder farmers supported with agricultural advice 1300 training in agricultural skills programmes 20 projects supported with CASP (Comprehensive Agricultural Support Programme) 14 Projects supported with Ililma/Letsema 1000 work opportunity created 1200 Household benefitting from agricultural food security initiatives 800 hectares cultivated for food production in communal areas and land reform projects 400 household gardens to be established 5 war on poverty change agents supported
2974 smallholder farmers received support through agricultural advice, information days, demonstrations, site visits and meeting. 1998 farmers were trained in agricultural skills programmes 18 projects supported with CASP 14 Projects supported with Ililma/Letsema 852 work opportunity created 1266 Household benefitting from agricultural food security initiatives 1056.5 hectares cultivated for food production in communal areas and land reform projects 680 household gardens established 21 war on poverty change agents supported
31
Main services Beneficiaries
Current/actual standard of
service Desired standard
of service Actual
achievement
Primary Animal HealthCare interventions using the mobile veterinary truck
Resource poor communities in the most remote and rural areas of the province with special emphasis on 1. Indigent
persons 2. Pensioners 3. Child headed
households 4. Persons with
disability
At least 7 primary animal health outreach interventions to the rural poor communities in the province targeting between 20 and 40 animals sterilization at each session.
18 food safety campaigns 3000 epidemiological units visited 22 000 tests performed for diagnostic services and epidemiological investigations 250 clients were serviced for animal and animal products export control
18 safety campaigns and 8 community outreach programmes conducted 4486 epidemiological units visited for veterinary intervention 28 356 tests performed for diagnostic services and epidemiological investigations 265 clients were serviced for animal and animal products export control
Batho Pele arrangements with beneficiaries (Consultation access etc.)
Current/actual arrangements Desired arrangements Actual achievements
Information is disseminated to the community by Animal Health Technicians and Community Development Workers.
Local radio and newspapers is also used to reach the people in a particular area.
Sharing of information also takes place during tribal, community meetings and Agricultural forum meetings.
Community to be informed of visit 4 weeks in advance. Itinerary to be placed on notice board at Tribal offices, municipal offices. Conduct food safety campaigns
Notice of visit was communicated to the community 4 weeks in advance
A total of 52 awareness interventions and 2 workshops were carried out throughout the State Vet areas with emphasizes on zoonosis by VPH officials. Public Institutions (42), community outreach programs (8) as well as schools (52) were targeted.
Support all the farming communities and beneficiaries through various engagement Meetings, workshops, information sessions, individual contact sessions, Agricultural demonstrations and farmers’ days.
Support all the farming communities and beneficiaries.
3218 smallholder farmers received support through agricultural advice, information days, demonstrations, site visits and meeting.
1998 farmers were trained in agricultural skills programmes.
32
Service delivery information tool
Current/actual information tools Desired information tools Actual achievements
Information is disseminated to the community by Animal Health Technician and Extension Officers.
Local radio and newspapers is also used to reach the people in a particular area.
Sharing of information also takes place during tribal, community meetings and Agricultural Forum meetings.
Departmental website should be updated and be accessible to clients.
Departmental Annual Report should be made accessible to client.
Conduct Food Safety awareness campaigns.
The website is accessible to clients for information.
The Departmental Annual report and Quarter performance reports are published on the Departmental website
A total of 52 awareness interventions and 2 workshops were carried out throughout the State Vet areas with emphasizes on zoonosis by VPH officials. Public Institutions (42), community outreach programs (8) as well as schools (52) were targeted.
Meetings, workshops, information sessions, individual contact sessions, telephones.
Conduct Agricultural demonstrations, courses and farmers’ days
Explore the use of Electronic media.
3218 Farmers supported through information days, demonstrations, site visits and meeting.
1615 farmers were trained.
Use of departmental website for information sharing.
Complaints mechanism
Current/actual complaints mechanism Desired complaints mechanism Actual achievements
All complaints are directed to the Deputy Director: Animal Health who may refer the complaint to the Director.
Code of conduct exists for public servants and professionals e.g. PSC code and SAVC code.
Departmental grievance procedure should be explained to clients.
No formal complaints received by the Deputy Director: animal Health due to high level of service delivery satisfaction from most of our farmers.
Response given to the grievances by the Senior manager, HOD office, and the MEC to the farmers
Shorten the turn -around time of responses and act on the grievances.
Put in the corrective measures on grievances lodged.
Due to high level of transparency and the improved reporting system introduced by the Department grievances and feedback to farmers are immediately attended to during farmers days and Agricultural demonstration days.
Reports to Director, HOD or Ministry
Reports to Director, HOD or Ministry
Most of the complaints are attended and resolved during the MEC Exco meetings, information days and Agricultural demonstrations.
33
2.3 Organisational Environment
The organisational environment was largely affected by the subdued economic outlook
and the pressure placed on human resources to attend to the drought affected areas.
In particular, the Department had to grapple with the impact that previous technical
budget adjustments had on overall achievement of targets.
Given the slow growth of the South African Economy, further budget cuts were
anticipated in the 2017-19 financial years. This further put pressure on achievements
of key policy imperatives such as the National Development Plan and MTSF priorities.
This also meant the Department should look at innovative ways to achieve targets in
an extremely constrained budgetary environment.
The Department therefore looked at how it can increase efficiency, implement cost
saving measures, work with sector partners to pool resources, target high impact
projects, reduce the cost of doing business with government, especially when
procurement is done directly by government. Moreover, the Department devised
means to institutionalize long-term planning and developed a disciplined, people-
centred and professional public servant.
Terms of Reference of the Departmental Technical Committees and Departmental
Project Coordinating Committees were revised in order to institutionalise long-term
planning and provided platform for the private sector to engage government on pooling
resources and efficient implementation of high impact projects.
Government resources continued to be drained by replacement of material lost
through theft, especially at research stations. Theft at the research stations has
resulted in some projects, especially where edible products are researched, being
temporarily stopped until access control and patrols were instituted. Subsequently, a
Comprehensive Security Plan to secure government assets was prioritised.

34
The audit of the 2016/17 by the Auditor-General of South Africa (AGSA) highlighted
some of the administrative and compliance issues that the Department must focus on.
In addition, the Management Performance Assessment Tool (MPAT) enabled the
Department to reflect on the functionality of key management performance areas.
These included amongst others the planning and monitoring and evaluation capacity;
the capacity of human resource function to provide strategic support to line functions
thereby achieving performance objectives; and functionality of internal control
measures as they relate mainly to financial management.
Accordingly, the results of MPAT 1.7 showed continued improvement in the key
management functionality areas. Provincially the Department moved from position
nine (MPAT 1.5) to position four (MPAT 1.7). This indicates an improvement on
governance of the Department. Nonetheless, the Department will continue to develop
and implement improvement plans as well as institutionalise good corporate
governance.
The Compulsory Community Service for Veterinarians programme was implemented
from the 1st of January 2016. A preliminary assessment suggests that the cohort in
the Northern Cape is generally satisfied with the type of exposure they are getting.
Coverage of the most rural communities in the provinces has increased significantly
in attempting to eradicate diseases of economic importance in the province
The Northern Cape Provincial Veterinary Laboratory was finally assessed on the 14th
and 15th March 2017 and was recommended for accreditation of 5 diagnostic methods
it had applied for. Amongst these methods, was the accreditation for sheep scab,
making it the first laboratory to be accredited for sheep scab in the country.
The laboratory showed its competitiveness through its performance in Proficiency
testing schemes and has proven to be one of the best performing laboratories among

35
the 15 participants. It is expected that there the laboratory will receive more demand
for services due to the new status.
2.4 Key policy developments and legislative changes
There were no key policy and legislative changes.
36
3. STRATEGIC OUTCOME ORIENTED GOALS
3.1 The Department has the following goals that are linked to the MTSF 2015-2019
outcomes.
Strategic outcome
oriented goal 1
EFFECTIVE AND EFFICIENT GOVERNANCE
Goal statement To ensure effective and efficient governance
Strategic outcome
oriented goal 2
SUSTAINABLE USE AND MANAGEMENT OF NATURAL
RESOURCES
Goal statement To ensure sustainable use and management of natural resources
Strategic outcome
oriented goal 3
SUSTAINABLE AGRICULTURAL PRODUCTION
Goal statement Optimal and sustainable agricultural production to ensure food
security
Strategic outcome
oriented goal 4
BIO-SAFETY AND BIO-SECURITY FOR THE WELLNESS OF
THE PUBLIC
Goal statement To ensure bio-safety and bio-security for the wellness of the public
Strategic outcome
oriented goal 5
EXPERT AND NEEDS BASED RESEARCH AND TECHNOLOGY
Goal statement To render expert and needs based research and technology
transfer services to clients
Strategic outcome
oriented goal 6
INCLUSIVE AGRICULTURAL ECONOMIC GROWTH
Goal statement Inclusive Agricultural Economic Growth
Strategic outcome
oriented goal 7
COMPREHENSIVE RURAL DEVELOPMENT
Goal statement To ensure the effective implementation of the Comprehensive
Rural Development Programme.
37
Outcomes Reports
Outcome 7: Comprehensive Rural Development
Overview:
Overall annual performance for the 2017/18 financial year
Sub-Outcome 1: Improved land administration and spatial planning for
integrated development in rural areas
A. Spatial Planning and Land Use Management (SPLUMA) support to the
Northern Cape Local Municipalities.
Twenty-six local municipalities have been supported with the implementation of
SPLUMA in all five districts. A total of four District Rural Development Plans were
developed.
B. Strengthening Coordination across the three spheres of government and
external stakeholders to implement CRD
As per the resolution of the Service Delivery workshop held on the 28th 29th of March
2017 and the Social Technical Cluster (STC) dated 6th April 2017, delivery partners to
the Outcome are to meet on a quarterly basis to discuss Comprehensive Rural
Development as a whole and to monitor progress against activities and milestones
agreed in the implementation plan, to resolve blockages and to report to the relevant
clusters in the Province. For the financial year at hand 4 Provincial Technical
Implementation Forum were held on the following dates:
Quarter Dates
First Quarter 19th July
Second Quarter 12 October
Third Quarter 25th January
Fourth Quarter 10 April
Kindly note the meetings can only be held after all departments have submitted reports to the office of the
Premier
38
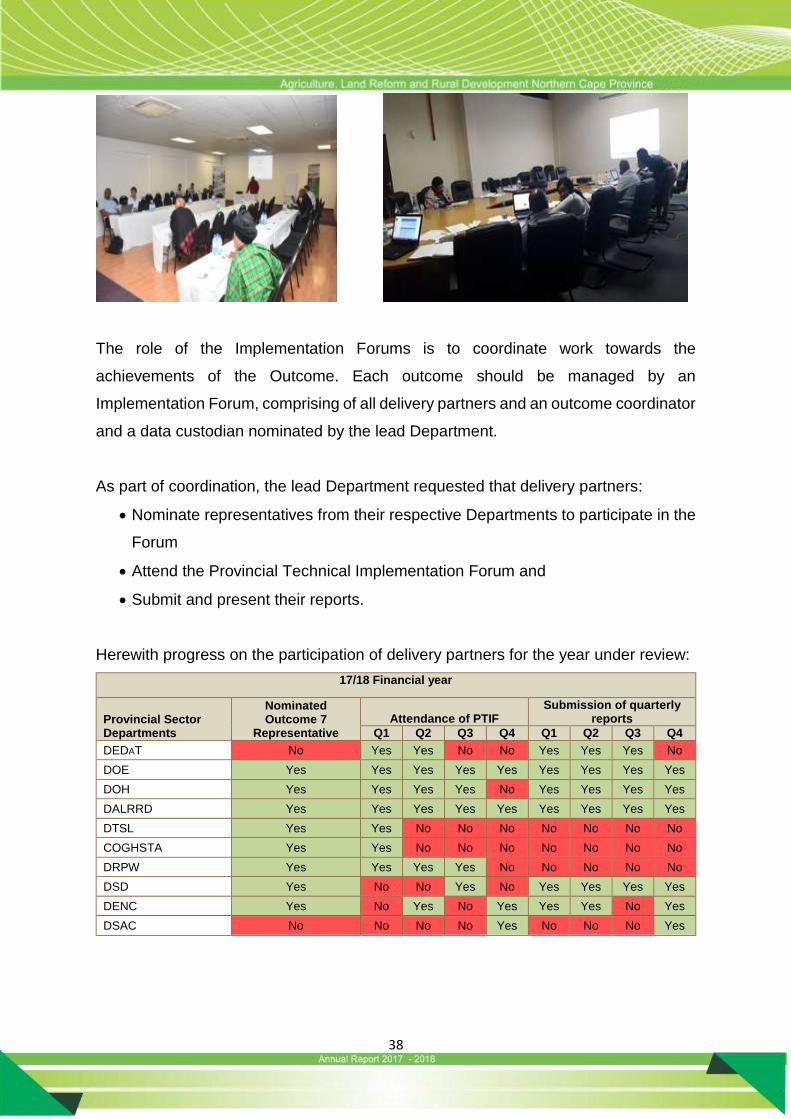
The role of the Implementation Forums is to coordinate work towards the
achievements of the Outcome. Each outcome should be managed by an
Implementation Forum, comprising of all delivery partners and an outcome coordinator
and a data custodian nominated by the lead Department.
As part of coordination, the lead Department requested that delivery partners:
Nominate representatives from their respective Departments to participate in the
Forum
Attend the Provincial Technical Implementation Forum and
Submit and present their reports.
Herewith progress on the participation of delivery partners for the year under review:
17/18 Financial year
Provincial Sector Departments
Nominated Outcome 7
Representative
Attendance of PTIF Submission of quarterly
reports
Q1 Q2 Q3 Q4 Q1 Q2 Q3 Q4
DEDAT No Yes Yes No No Yes Yes Yes No
DOE Yes Yes Yes Yes Yes Yes Yes Yes Yes
DOH Yes Yes Yes Yes No Yes Yes Yes Yes
DALRRD Yes Yes Yes Yes Yes Yes Yes Yes Yes
DTSL Yes Yes No No No No No No No
COGHSTA Yes Yes No No No No No No No
DRPW Yes Yes Yes Yes No No No No No
DSD Yes No No Yes No Yes Yes Yes Yes
DENC Yes No Yes No Yes Yes Yes No Yes
DSAC No No No No Yes No No No Yes

39
17/18 Financial year
National Sector Departments
Nominated Outcome 7 Representative
Attendance of PTIF Submission of quarterly
reports
Q1 Q2 Q3 Q4 Q1 Q2 Q3 Q4
DRDLR Yes No Yes Yes Yes Yes Yes Yes Yes
DWS No No No No No Yes Yes Yes No
DOENERGY Yes No No Yes No Yes No No No
SASSA Yes Yes No Yes No Yes Yes Yes Yes
17/18 Financial year
District Municipality Nominated Outcome 7
Representative
Attendance of PTIF Submission of Quarterly reports
Q1 Q2 Q3 Q4 Q1 Q2 Q3 Q4
FRANCES BAARD Yes No No No No No No No No
JTG Yes No No No No No No No No
NAMAKWA Yes No No No No No No No No
PIXLEY KA SEME Yes No No Yes Yes No No No No
ZF MGCAWU Yes No No No No No No No No
Sub-Outcome 2: Sustainable Land Reform contributing to agrarian
transformation
34 399.74ha land was acquired and allocated, 3 368.42ha were allocated to
smallholder farmers for the purpose of Agri-Parks where 12 farms were allocated to
support Agri-Parks. A total of 97 land claims were finalised. A total of 3 land claims
were settled. A total of 21952.3098ha was allocated to farm dwellers and labour
tenants. A total of 1 Proactive Land Acquisition Strategy (PLAS) farms was identified
for incubation and training of agricultural graduates and National Rural Youth Service
Corps (NARYSEC) participants.
Sub-Outcome 3: Improved Food Security
1266 households benefited from Agricultural food initiatives throughout the year. A
total of 680 household gardens were established. A total of 39 institutional gardens
were established. A total of 21 War on Poverty Change Agents were supported.
1 415 292 grants in payment including Grant in Aid were processed. A total of 13684
applications for children aged 0-1 years. 27 816 Social Relief of Distress application
were awarded.

40
The Department of Social Development (DSD) provided 5 197 vulnerable households
accessed nutritious and affordable foods. 82 717 people were accessing food through
DSD feeding (centre-based).
32 169 beneficiaries benefited from social relief programmes. 10160 hectares
protected/ rehabilitated to improve agricultural production.
343 842 quantile1-3 learners with access to the National Schools Nutrition Programme
(NSNP).
Sub-Outcome 4: Smallholder producers’ development and support (Technical,
financial, infrastructure) for agrarian transformation
A total of 1266 smallholder farmers were supported through infrastructure
development and supply of production inputs through Comprehensive Agricultural
Support Program (CASP) and Ilima/ Letsema Funds as well as drought relief
interventions. A total of 51 agriculture infrastructure were established. A total of
1056.53 hectares were cultivated for food production in communal areas and land
reform projects. A total of 2974 smallholder producers were supported with agriculture
advice. A total of 12 disaster risk reduction programmes was managed.
A total of 13 research projects were implemented to improve agricultural production
and 2 scientific papers were published with 6 research infrastructure managed. A total
of 8 research presentation were made nationally or internationally.
The Veterinary Directorate serviced 265 clients for animal and animal products export
control. An average of 85.7 abattoir compliance was achieved. A total of 4624
epidemiological units were visited for veterinary interventions. A total of 36 466 tests
were performed the equal of which meets the International Organization for
Standardization (ISO) 17 025 standard and OIE (World Organization for Animal
Health) requirements. 41% water use authorisation application finalised as per the
41
water use authorisation guidelines. A total of 111 rainwater harvesting tanks were
installed for food production and other household productive uses.
Sub-Outcome 5: Increased access to quality infrastructure and functional
services, particularly in education, healthcare and public transport in rural areas
13 additional clinics, community health centre were constructed. A total of 3 additional
hospitals and mortuaries were constructed. 160 libraries provided free internet. 1 new
library was constructed in Petrusville. 225 495 learners were subsidised with transport.
Sub-Outcome 6: Growth of sustainable rural enterprises and industries –
resulting in rural job creation
Rural enterprises
14 Cooperatives were established. A total of 7 Agri-business supported with
agricultural economic services to access markets. A total of 770 clients benefitted from
agricultural economic advice provided.
A total of 9 agricultural economic information responses were provided. A total of 8
economic reports were compiled. A total of 14 agricultural enterprises supported in the
5 districts. A total of 7 non-agricultural enterprises supported in the 5 districts.
A total of 852 work opportunities were created through EPWP (CASP/ILIMA
LETSEMA). A total of 200 green jobs were created. A total of 228 jobs created in
Rural Enterprise and Industrial Development (REID) initiatives. A total of 80 jobs
created in Rural Industrial Development (RID) initiatives.
A total of 1998 participants were trained in agricultural skill development programmes.
7 Agricultural higher education and training graduates. 16 environmental capacity
building activities conducted. 220 environmental stakeholders (community members
42
attending capacity building workshops) 328 skills development opportunities provided
in rural development initiatives. 321 skills development opportunities were provided to
NARYSEC.
Outcome 4: Decent Employment through Inclusive Growth
Background and Basis for Outcome #4 Analysis
In response to achieving the objectives of the National Development Plan (NDP) which
its vision includes better integration of the country’s rural areas, achieved through
successful land reform, job creation and poverty alleviation, the Department of
Agriculture, Land Reform and Rural Development(DALRRD), has developed a five-
year vision or Medium Term Strategic Framework that spans from the financial year
2015 to 2020. The following key strategic indicators have been identified by the
Department as catalyst to achieve the ultimate goal of NDP in agriculture, fisheries
and forestry sector:
Access to markets by both smallholder and commercial farmers,
Access to finance,
Co-operative formation and support,
Penetration of export markets particularly by the smallholder farmers,
Employment creation,
As well as rendering necessary support to all aspiring individuals in the sector
including vulnerable groups of the society such as youth, female and people
with disability.
Comparative analysis of the performance indicators from the three financial years, viz.
2015/2016 to 2017/2018 is done with a view to track progress made with regard to
achieving the NDP 2030 vision.
Access to Markets: Market Linkages Created Figure 1: Number of Agri-Businesses Supported with Marketing Services

43
The figure above indicates that there has been a huge improvement in the number of
agricultural economic services given to agribusinesses with a view to help them
access markets. Year-on-year, the percentage increase from 2016/2017 to 2017/2018
financial year has been recorded at 133% as compared to 28% recorded from the
previous financial year 2015/2016 to 2016/2017.
Establishment of New Co-operatives
During the three financial years under review, the Department has been performing
very well in terms of planned targets (see Figure 2 below).
The Department contributed by establishing 14 Cooperatives in the 2017/2018
financial year.
Figure 2: Number of New Co-operatives Registered
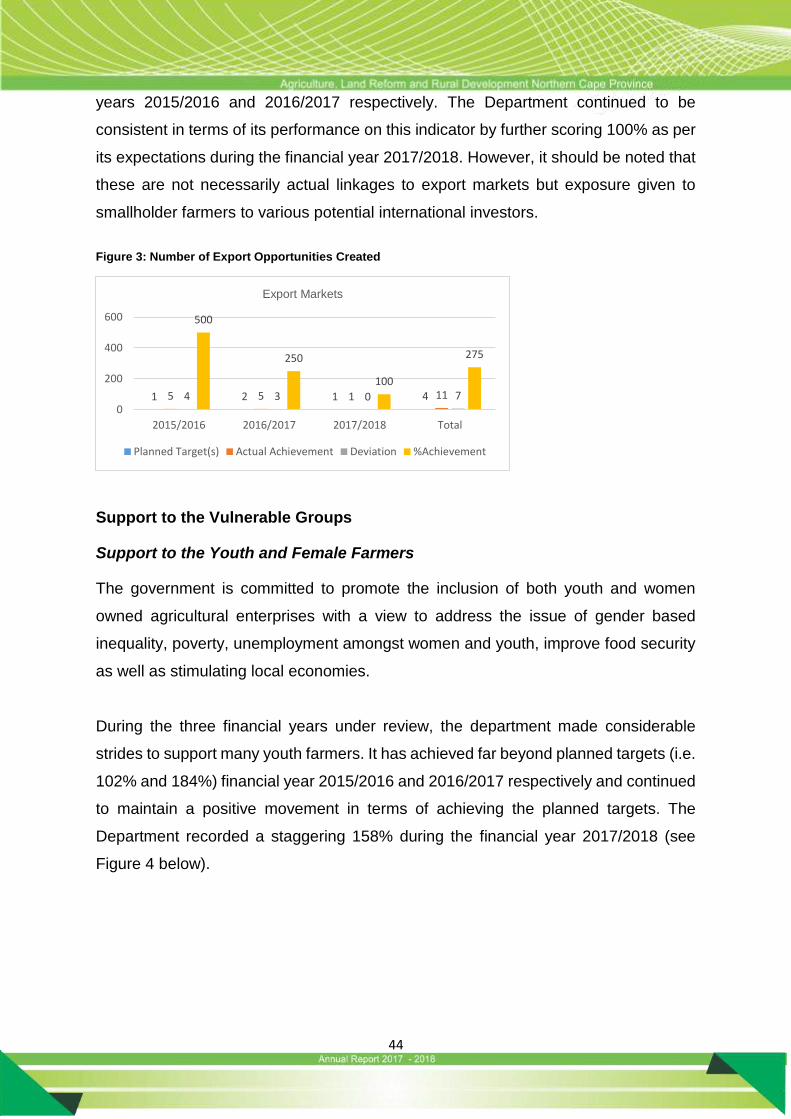
Export Markets Figure 3 below depicts that during the three financial years under review, the
Department has been achieving its planned targets (i.e. 500% and 250%) financial
6 5
-1
83
10 6
-4
60
5 7 2
140
21 18
-3
86
-50
0
50
100
150
Planned Target(s) Actual Achievement Deviation %Achievement
Access to Markets
2015/2016 2016/2017 2017/2018 Total
8 11 726
8 11 1433
0 0 7 7
100 100
200
127
0
50
100
150
200
250
2015/2016 2016/2017 2017/2018 Total
Number of New Cooperatives Registered
Planned Target(s) Actual Achievement Deviation %Achievement
44
years 2015/2016 and 2016/2017 respectively. The Department continued to be
consistent in terms of its performance on this indicator by further scoring 100% as per
its expectations during the financial year 2017/2018. However, it should be noted that
these are not necessarily actual linkages to export markets but exposure given to
smallholder farmers to various potential international investors.
Figure 3: Number of Export Opportunities Created
Support to the Vulnerable Groups
Support to the Youth and Female Farmers
The government is committed to promote the inclusion of both youth and women
owned agricultural enterprises with a view to address the issue of gender based
inequality, poverty, unemployment amongst women and youth, improve food security
as well as stimulating local economies.
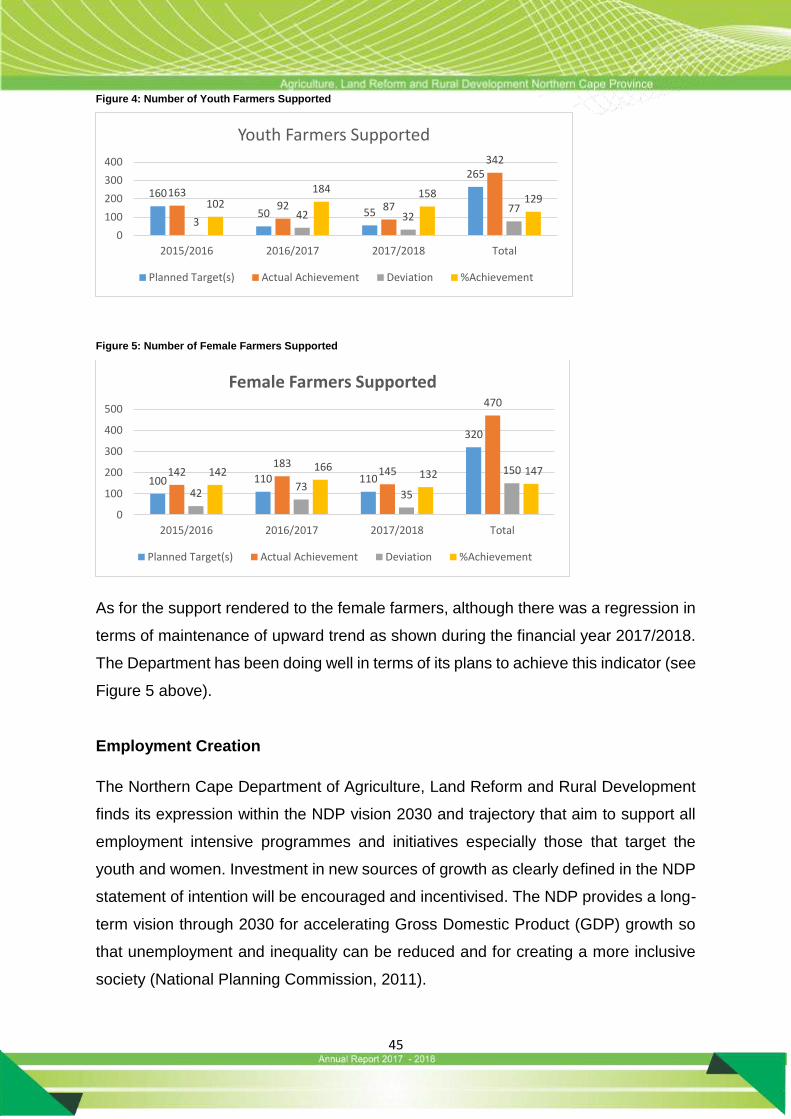
During the three financial years under review, the department made considerable
strides to support many youth farmers. It has achieved far beyond planned targets (i.e.
102% and 184%) financial year 2015/2016 and 2016/2017 respectively and continued
to maintain a positive movement in terms of achieving the planned targets. The
Department recorded a staggering 158% during the financial year 2017/2018 (see
Figure 4 below).
1 2 1 45 5 1 114 3 0 7
500
250
100
275
0
200
400
600
2015/2016 2016/2017 2017/2018 Total
Export Markets
Planned Target(s) Actual Achievement Deviation %Achievement
45
Figure 4: Number of Youth Farmers Supported
Figure 5: Number of Female Farmers Supported
As for the support rendered to the female farmers, although there was a regression in
terms of maintenance of upward trend as shown during the financial year 2017/2018.
The Department has been doing well in terms of its plans to achieve this indicator (see
Figure 5 above).
Employment Creation
The Northern Cape Department of Agriculture, Land Reform and Rural Development
finds its expression within the NDP vision 2030 and trajectory that aim to support all
employment intensive programmes and initiatives especially those that target the
youth and women. Investment in new sources of growth as clearly defined in the NDP
statement of intention will be encouraged and incentivised. The NDP provides a long-
term vision through 2030 for accelerating Gross Domestic Product (GDP) growth so
that unemployment and inequality can be reduced and for creating a more inclusive
society (National Planning Commission, 2011).
160
50 55
265
16392 87
342
342 32
77102
184 158 129
0
100
200
300
400
2015/2016 2016/2017 2017/2018 Total
Youth Farmers Supported
Planned Target(s) Actual Achievement Deviation %Achievement
100 110 110
320
142183
145
470
4273
35
150142 166 132 147
0
100
200
300
400
500
2015/2016 2016/2017 2017/2018 Total
Female Farmers Supported
Planned Target(s) Actual Achievement Deviation %Achievement
46
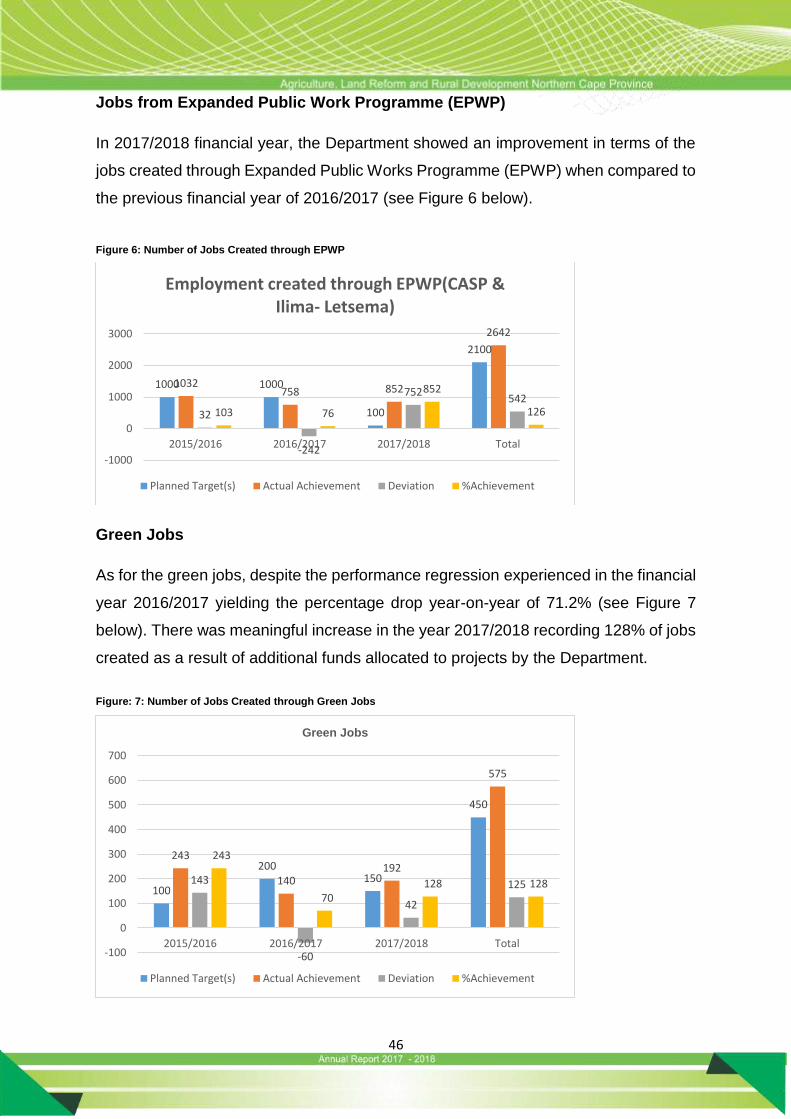
Jobs from Expanded Public Work Programme (EPWP)
In 2017/2018 financial year, the Department showed an improvement in terms of the
jobs created through Expanded Public Works Programme (EPWP) when compared to
the previous financial year of 2016/2017 (see Figure 6 below).
Figure 6: Number of Jobs Created through EPWP
Green Jobs
As for the green jobs, despite the performance regression experienced in the financial
year 2016/2017 yielding the percentage drop year-on-year of 71.2% (see Figure 7
below). There was meaningful increase in the year 2017/2018 recording 128% of jobs
created as a result of additional funds allocated to projects by the Department.
Figure: 7: Number of Jobs Created through Green Jobs
1000 1000
100
2100
1032758 852
2642
32
-242
752542
103 76
852
126
-1000
0
1000
2000
3000
2015/2016 2016/2017 2017/2018 Total
Employment created through EPWP(CASP & Ilima- Letsema)
Planned Target(s) Actual Achievement Deviation %Achievement
100
200150
450
243
140192
575
143
-60
42
125
243
70 128 128
-100
0
100
200
300
400
500
600
700
2015/2016 2016/2017 2017/2018 Total
Green Jobs
Planned Target(s) Actual Achievement Deviation %Achievement
47
4. 4. PERFORMANCE INFORMATION BY PROGRAMMES

48
49
4.1 Programme 1: Administration
Purpose: The purpose of this programme is to manage and formulate policy directives
and priorities and, to ensure there is appropriate support service to all other
programmes with regard to finance, personnel, information, communication and
procurement.
Sub- Programmes:
Office of the MEC
Senior Management
Corporate Services
Financial Management
Communication Services
Strategic Objectives:
To determine policy and set priorities for the Department.
To provide strategic leadership and support throughout the organization.
To ensure effective human resource management of 624 employees.
To provide sound financial and risk management support services to the
Department.
To provide communication services and information technology support.
50
Strategic objectives, performance indicators planned targets and actual outputs
Strategic Objectives:
Programme: 1 Administration
Strategic objective
Actual Achievement
2016/2017
Planned Target
2017/2018
Actual Achievement
2017/2018
Deviation from planned
target to Actual
Achievement
for 2017/12018
Comment on deviations
To determine policy and priorities for the
Department
3.7 4 3.6 -0.4 Ethics Officers could not complete the online training due to the
system being off-line.
To provide strategic leadership and support throughout the
organization
3.8 4 3.3 -0.7 A completed Evaluation Improvement Plan was not developed and the Evaluation not published on the Departmental
Website.
To ensure effective human resource management of
624 employees
2.4 3 2.6 -0.4 Department did not have an approved organisational structure.
To provide sound financial and risk management support services to the Department
3.3 3 3.6 0.6 Department is fully compliant with financial regulatory
requirements.
To provide communication services and Information Technology
support
4 4 4 0
51
Performance Indicators
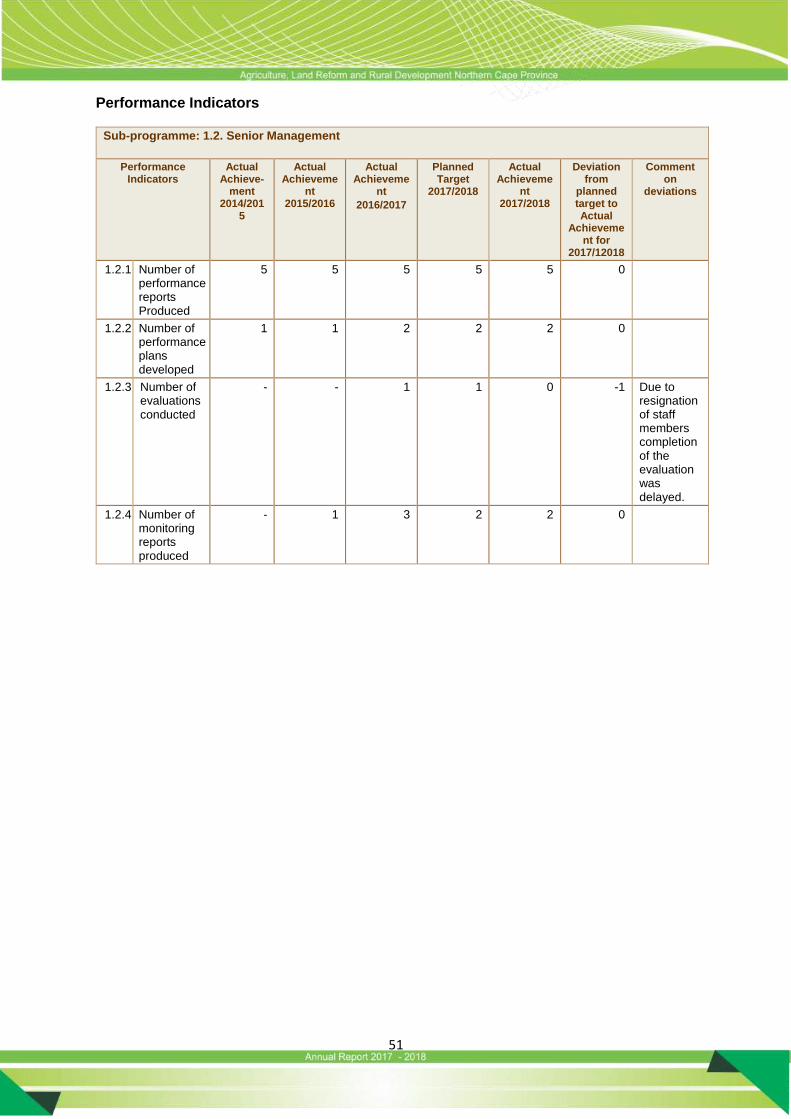
Sub-programme: 1.2. Senior Management
Performance Indicators
Actual Achieve-
ment 2014/201
5
Actual Achieveme
nt 2015/2016
Actual Achieveme
nt
2016/2017
Planned Target
2017/2018
Actual Achieveme
nt 2017/2018
Deviation from
planned target to Actual
Achievement for
2017/12018
Comment on
deviations
1.2.1 Number of performance reports Produced
5 5 5 5 5 0
1.2.2 Number of performance plans developed
1 1 2 2 2 0
1.2.3 Number of evaluations conducted
- - 1 1 0 -1 Due to resignation of staff members completion of the evaluation was delayed.
1.2.4 Number of monitoring reports produced
- 1 3 2 2 0
52
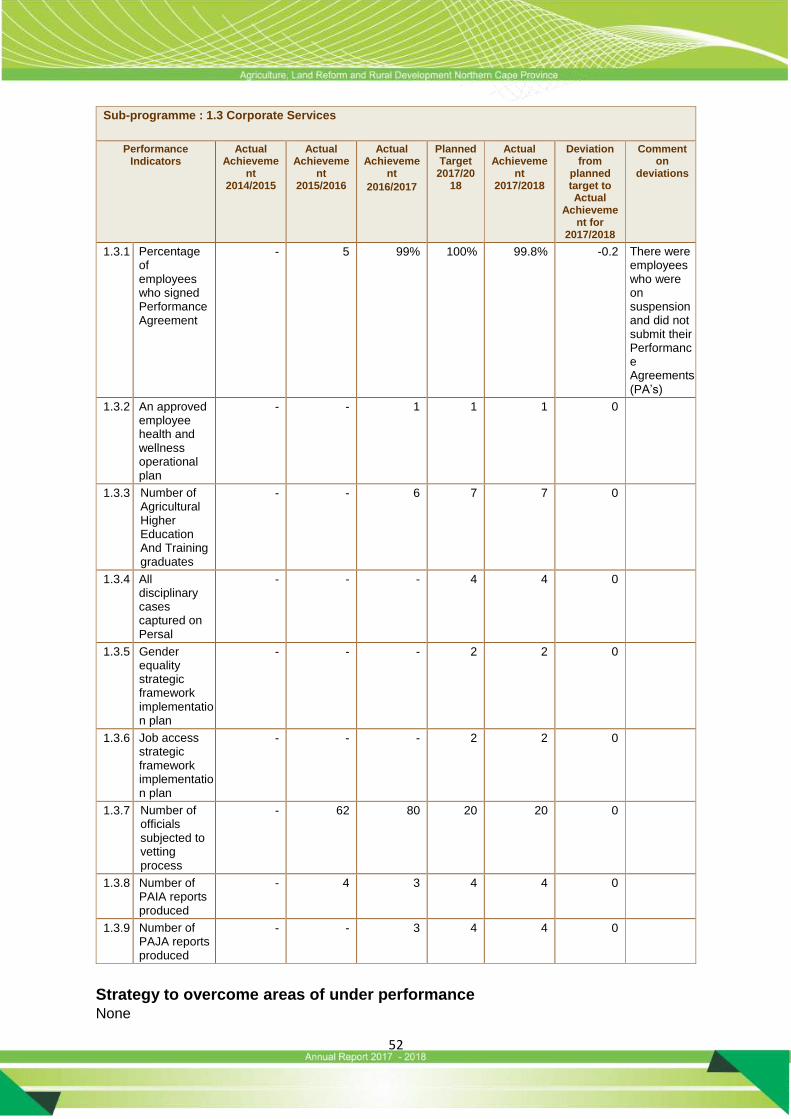
Sub-programme : 1.3 Corporate Services
Performance Indicators
Actual Achieveme
nt 2014/2015
Actual Achieveme
nt 2015/2016
Actual Achieveme
nt
2016/2017
Planned Target
2017/2018
Actual Achieveme
nt 2017/2018
Deviation from
planned target to Actual
Achievement for
2017/2018
Comment on
deviations
1.3.1 Percentage of employees who signed Performance Agreement
- 5 99% 100% 99.8% -0.2 There were employees who were on suspension and did not submit their Performance Agreements
(PA’s)
1.3.2 An approved employee health and wellness operational plan
- - 1 1 1 0
1.3.3 Number of Agricultural Higher Education And Training graduates
- - 6 7 7 0
1.3.4 All disciplinary cases captured on Persal
- - - 4 4 0
1.3.5 Gender equality strategic framework implementation plan
- - - 2 2 0
1.3.6 Job access strategic framework implementation plan
- - - 2 2 0
1.3.7 Number of officials subjected to vetting process
- 62 80 20 20 0
1.3.8 Number of PAIA reports produced
- 4 3 4 4 0
1.3.9 Number of PAJA reports produced
- - 3 4 4 0
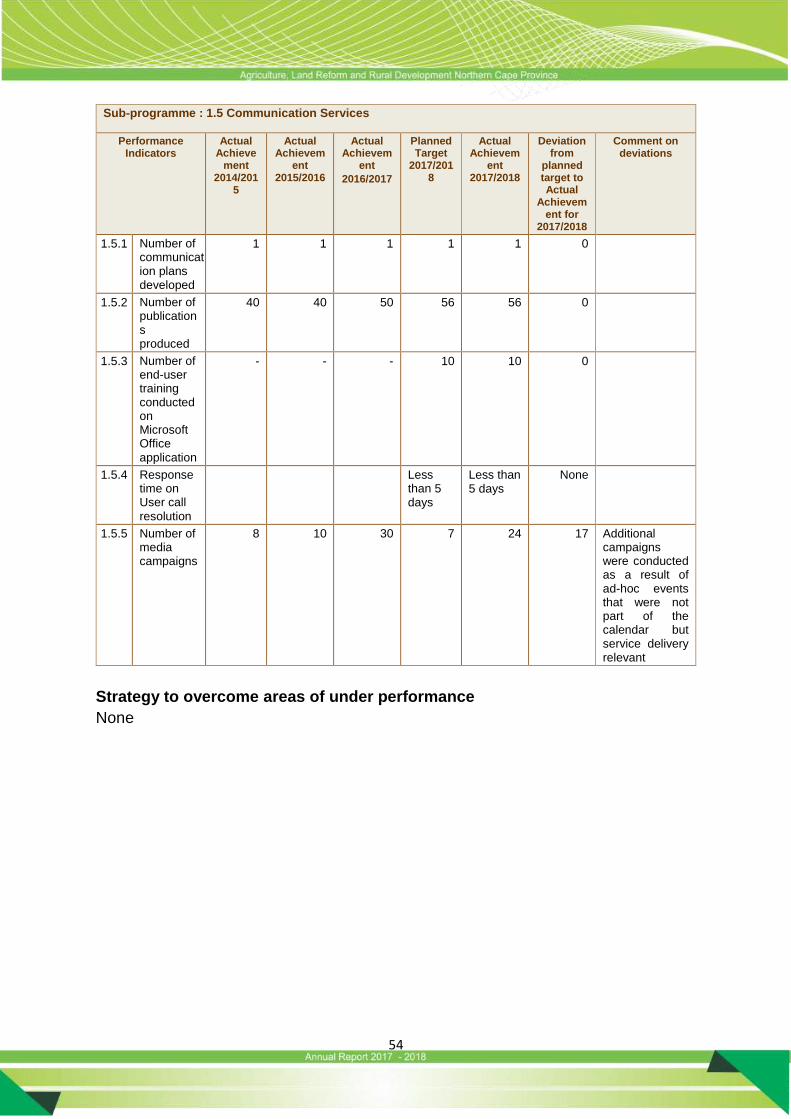
Strategy to overcome areas of under performance
None
53
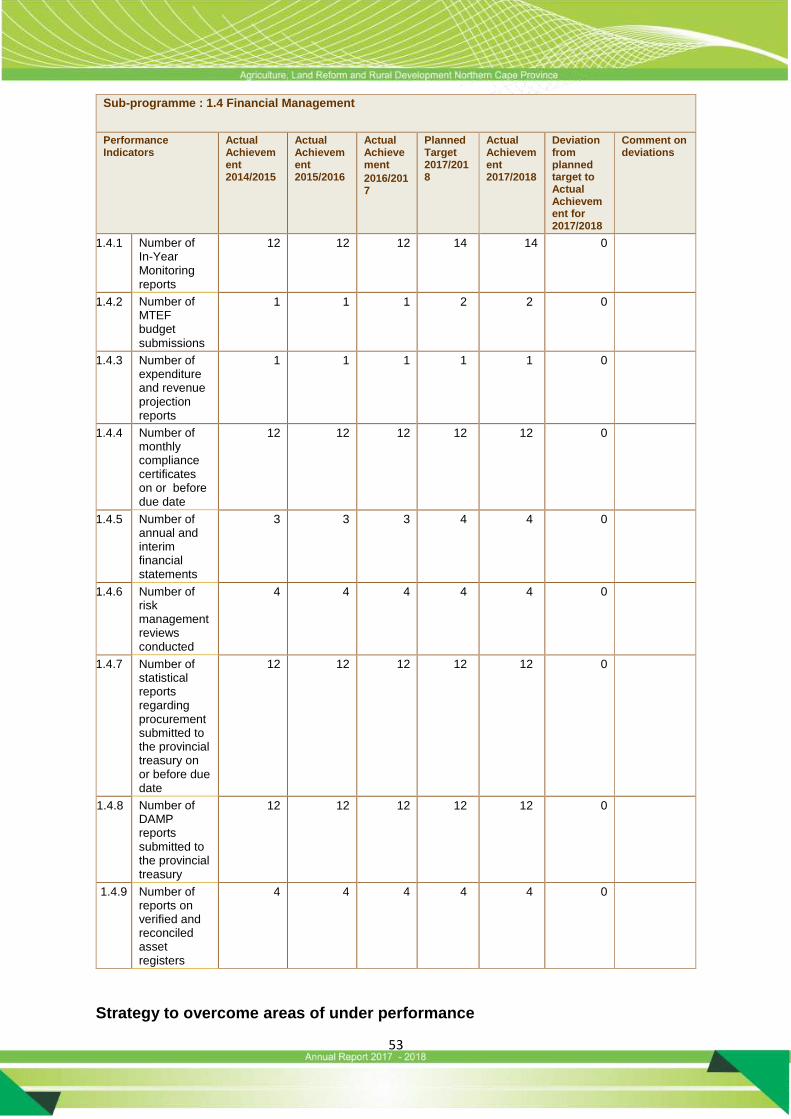
Sub-programme : 1.4 Financial Management
Performance Indicators
Actual Achievement 2014/2015
Actual Achievement 2015/2016
Actual Achievement
2016/2017
Planned Target 2017/2018
Actual Achievement 2017/2018
Deviation from planned target to Actual Achievement for 2017/2018
Comment on deviations
1.4.1 Number of In-Year Monitoring reports
12 12 12 14 14 0
1.4.2 Number of MTEF budget
submissions
1 1 1 2 2 0
1.4.3 Number of expenditure and revenue projection reports
1 1 1 1 1 0
1.4.4 Number of monthly compliance certificates on or before due date
12 12 12 12 12 0
1.4.5 Number of annual and interim financial statements
3 3 3 4 4 0
1.4.6 Number of risk management reviews conducted
4 4 4 4 4 0
1.4.7 Number of statistical reports regarding procurement submitted to the provincial treasury on or before due date
12 12 12 12 12 0
1.4.8 Number of DAMP reports submitted to the provincial treasury
12 12 12 12 12 0
1.4.9 Number of reports on verified and reconciled asset registers
4 4 4 4 4 0
Strategy to overcome areas of under performance
54
Strategy to overcome areas of under performance
None
Sub-programme : 1.5 Communication Services
Performance Indicators
Actual Achieve
ment 2014/201
5
Actual Achievem
ent 2015/2016
Actual Achievem
ent
2016/2017
Planned Target
2017/2018
Actual Achievem
ent 2017/2018
Deviation from
planned target to Actual
Achievement for
2017/2018
Comment on deviations
1.5.1 Number of communication plans developed
1 1 1 1 1 0
1.5.2 Number of publications produced
40 40 50 56 56 0
1.5.3 Number of end-user training conducted on Microsoft Office
application
- - - 10 10 0
1.5.4 Response time on User call
resolution
Less than 5 days
Less than 5 days
None
1.5.5 Number of media campaigns
8 10 30 7 24 17 Additional campaigns were conducted as a result of ad-hoc events that were not part of the calendar but service delivery relevant
55
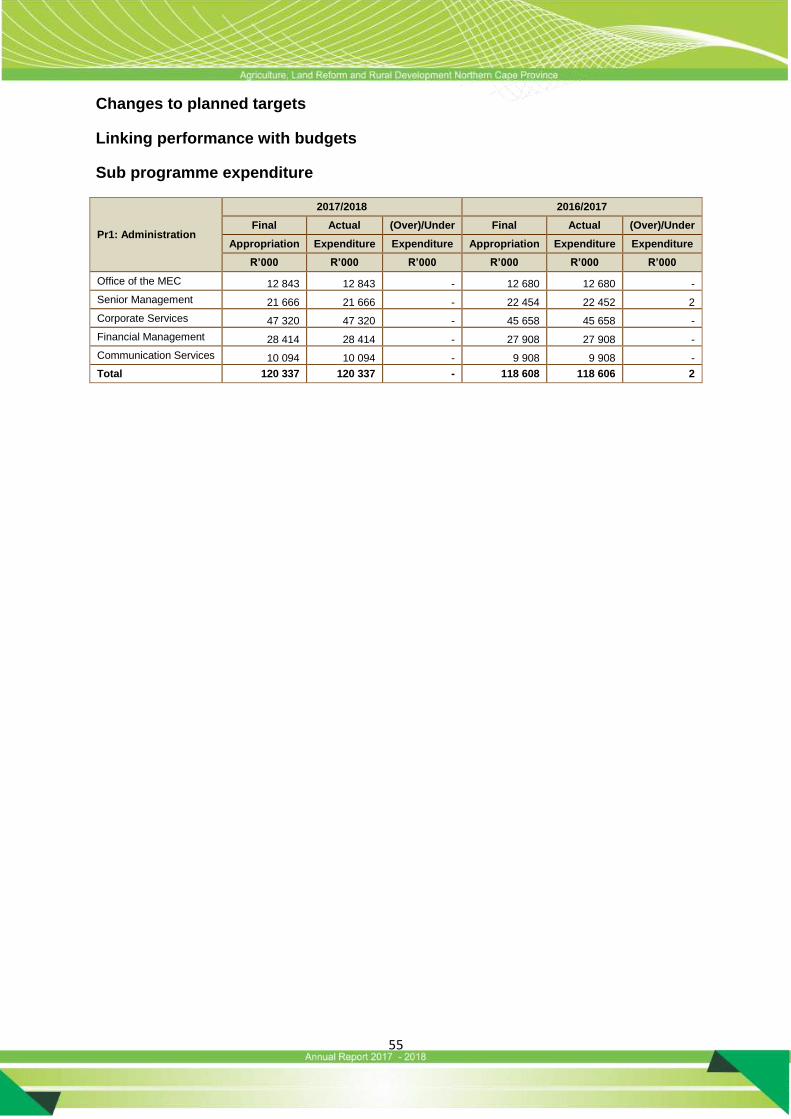
Changes to planned targets
Linking performance with budgets
Sub programme expenditure
Pr1: Administration
2017/2018 2016/2017
Final Actual (Over)/Under Final Actual (Over)/Under
Appropriation Expenditure Expenditure Appropriation Expenditure Expenditure
R’000 R’000 R’000 R’000 R’000 R’000
Office of the MEC 12 843 12 843 - 12 680 12 680 -
Senior Management 21 666 21 666 - 22 454 22 452 2
Corporate Services 47 320 47 320 - 45 658 45 658 -
Financial Management 28 414 28 414 - 27 908 27 908 -
Communication Services 10 094 10 094 - 9 908 9 908 -
Total 120 337 120 337 - 118 608 118 606 2
56
SERVICE DELIVERY HIGHLIGHTS
4.1.1.1 Human Resource Management
During the 2017/18 financial year the total workforce was 586 and on the 31 March
2018 we closed the financial year with a total workforce of 562. For the period under
review 24 employees left the Department as a result of death (5), resignations (6),
retirements (9), dismissals(4) and transfers. This had a negative impact on the staff
establishment as we have unable to recruit and fill the vacancies of the previous
financial year.
The Recruitment unit monitors the post establishment and PERSAL on a continuous
basis to improve the accuracy, reliability and the integrity of the information on the
system. This is done through PERSAL Clean-up process which identifies the cleaning
of establishment information, and the identification and removal of unfunded vacancies
from the system as crucial aspects towards improving the accurate reflection of
vacancy rates in the department. .
In view of recognizing employees who have served the public service continuously
and qualified for long service recognition in line with Resolution 1 of 2012, 36
employees received certificates and their annual leave days increased to 30 days for
10 years of service, 15 received certificates and cash bonus of R9 886 each for 20
years of service, while 6 received certificates and cash bonus of R19 771 each for 30
years of service and 1 received certificate and cash bonus of R26 362 for 40 years’
service. The total cash bonus amounted to R293 278.
As part of the job review process, 7 posts (2 of Programme 2 and 5 of Programme 1)
were submitted to the provincial job evaluation panel and two of them were upgraded
to a higher level, the job descriptions of the Security Officer’s and the Registry Clerks
in the Corporate Services Directorate were reviewed and finalized.
57
Workforce planning is one of the key components in Human Resource Directorate and
as a result a Human Resource Plan was developed in order to highlight personnel
needs of the Department to attract and recruit skilled and capable workforce.
The skills programme of the Department managed to place 209 employees through
different short skills development courses and also 17 employees were awarded
bursaries to further their studies to ensure that their performance is enhanced and to
encourage lifelong learning in the working environment.
As part of our role to reduce the unemployment of young people the Department
funded 58 youth from the province to attain formal higher education in different study
fields e.g. BVSC, BSc Agriculture. This strategy will assist the Department greatly to
narrow the gap of skills shortage in certain agricultural fields.
Employee Performance Management
The provincial EPMDS policy dictates all employee of the Department should enter
and sign a performance on or before 31 May each financial year. All the PA’s are to
be submitted and captured on PERSAL as per department of Public Service and
Administration (DPSA) Directive. Therefore, the Department had a 99% compliance
with only 1 exception due to the employee being on suspension.
The performance incentive process was also implemented in line with the Provincial
Policy and all committees, Intermediate Review Committees (IRC) and Departmental
Moderating Committee (DMC), convened accordingly. For the 2016/17 financial year
541 employees qualified for performance assessment incentives of which 271
qualified and received cash bonus, and 392 employees qualified and received pay
progression. The total expenditure for Employee Performance Management
Development System (EPMDS) incentive payments was R3 897. The Department
managed to assess and concluded incentive payments for all SMS’s members, the
58
assessments period was for three financial years 2014/15, 2015/16 and 2016/17
financial years and all qualifying employees received their incentives. The Department
had 4 employees who qualified for grade progression under Resolution 9 of 2009 for
OSD employees.
Employee health and wellness programmes are increasingly being recognized as a
strategic contributor towards Departmental success. Incapacity leave has been
identified as the key problem in ensuring that employees are performing optimally. For
17/18, 20 cases were reported due to the severity of the illness and this constitute
2.81% of production lost for the financial year.
The Department conducted awareness on the following types of illnesses: chronic
fatigue, Hepatitis, Human papillomavirus and Attention Deficit Hyperactivity Disorder
(ADHD) by disbursing pamphlets all employees in the Department. Information
sessions were done in conjunction with Department of Health and Lifeline NGO, and
were conducted under the Health and productivity pillar. It is imperative that the
Department conduct these awareness’s programmes to all employees to empower
them with knowledge, and identify symptoms.
The Department also continued its partnership with GEMS (Government Employees
Medical Scheme) by enrolling for the GEMS workplace fitness. GEMS also assisted
the Department with wellness screenings in the different districts. A total of 5520
condoms were distributed in Departmental buildings as a preventative measure.
An analysis was also done on the financial wellness of employees and the outcome
thereof urged the department to partner with Standard Bank to assist employees with
financial wellbeing.
The Department had a successful Heritage Day event. The Human Immunodeficiency
Virus (HIV) Workplace Programme is guided by the Provincial Strategic Plan on
59
HIV/AIDS, Sexual Transmitted Diseases (STI) and tuberculosis (TB) 2016-2020. It is
aimed at minimizing the impact of HIV/AIDS in the workplace and subsequently
minimise the prevalence of HIV/AIDS in the Province. The unit also participated in the
World AIDS day and TB day celebrations in the Z.F.Mgcawu district. A collaboration
was formed with the different Departments and Office of the Premier (OTP).
4.1.2 Legal Services and Logistics
The courts handled four (4) cases: namely; the Timkulu, Thetha, Unyathi and Obontse
cases. PAJA legislative compliance on both Veterinary Services and tender process
were concluded.
The Department led the investigations in the Umsobomvu Fencing Project where
funds cannot be accounted for and the suspense account cannot be cleared.
PAJA mainstreaming for Veterinary Services has been completed and will be
discussed with the directorate for their inputs and comments for final document.
Legislative audit questioner has been completed and will be distributed to all
programs.
Transport
Two sources provide transport to employees to use as tools for work namely the
Northern Cape Transport entity and Mela, a financing institution for subsidized
vehicles.
The Provincial fleet entity provides ninety-two vehicles distinctly marked with the ALR
registration. The budget for the use of this is significantly high for this financial year.
78% of the old fleet had been replaced and had significantly affected the lease amount
from the fleet entity.
With subsidized, applications, had not been approved for more than two years and this
had caused the Department to approve the use of private vehicles in place and also
increase the use of fleet entity vehicles allocated.
60
White fleet
The total number of white fleet in the Department is ninety-two (92). A total of thirty-
eight (38) cars were added to the fleet that must be replaced, bringing the total
replaced to twenty-two (22) and leaving the ones that require replacement to sixty (60).
Equally we have also not seen with our performance on the white fleet a significant
decline on the bill as well nor has there been a shift from the white fleet to the
subsidized vehicles. We need the organisation to start to encourage officials to apply
for subsidized vehicles. We see officials buying private vehicles for private use and
requesting GG vehicles for official usage. Transport policy was reviewed during the
period under review
4.3.1 Security Management
Vetting
The Department has coordinated and submitted twenty (20) vetting forms to State
Security Agency (SSA) for the 2017/2018 financial year.
Since 2011 only one-hundred and sixty-two (162) applications for vetting have been
submitted. From the total submitted, over a period of four years little processing was
done over the period.
Screening
Annually the Department is required to coordinate vetting and screening of new and
personnel in the Department, who their post has as an inherent requirement must
complete a vetting application before executing their responsibility. For the past year
to date a number of applications were submitted to the State Security Agency but not
much feedback had been provided leaving the Department with the risk of appointing
and allowing personnel in areas identified for vetting, working without the appropriate
clearance certificate.
Theft and losses
A procedure manual has been drafted for all theft and loss experienced in the
Department. The draft document considers both movable and biological assets. The
draft document therefore seeks to explain the process.

61
The highest percentage of theft and losses occurred at the Vaalharts Research
Station. Most of the losses were reported as per the Theft and Loss Register.
Registrations of Vehicles
The Department has started the registration processes of newly procured tractors and
trailers so as to have a record of mechanization assets.
Security Audit
A joint physical compliance security audit was done at the Department’s head office
by SAPS National Key Points and Strategic Installations. The results are expected
during the first quarter of the financial year.
4.1.4 Records Management
In order to comply with the National Archives Act, all Departmental files have now been
incorporated into a single Departmental filing system. The revisions and additions to
the file plan was approved by the provincial archivist and amended accordingly for
series h2.5 (MPAT), h3.3.1 cash flow and h3.12.4 (treasury instructions) for finance
unit. The Department has received an approval letter from the Provincial Archivist.
4.1.5 Gender
The Department hosted eight (8) information sessions in all five (5) districts, and
facilitated four (4) quarterly Gender Forum and Capacity Development Workshops.
The Succession Plan and Resettlement Policies were analysed to ensure that these
were gender responsive.
Information Technology
Telephone management system
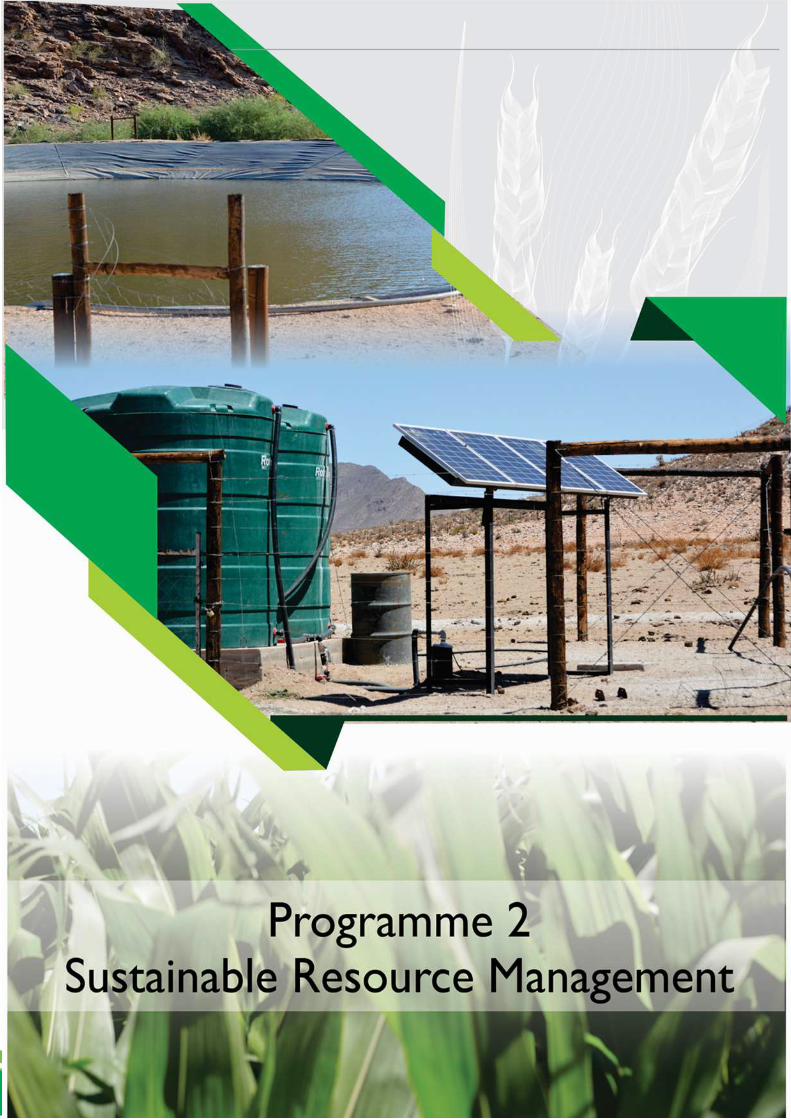
62
The User Requirement Specification (URS) documents (VPN &Voice) have been
signed. SITA will now compile and finalise a proposal that will be submitted to the
Head of Department for approval.

63
SITA will then schedule the Project Meeting soon to communicate on the plan.
Deployment of Windows 10 and Microsoft Office Professional Plus 2016
IT staff visited the under mentioned regions to deploy Windows 10 and Microsoft Office
2016, the visited regions resulted in more than 80 percent completion of the
deployment: (ZF Mgcawu, John Taolo Gaetsewe, Frances Baard and Pixley Ka Seme)
Namaqua was completed during the second quarter.
Global Computing have completed deploying Microsoft infrastructure on our cloud
platform that the Department has through the Microsoft Enterprise Agreement.
Three (3) trainings were conducted on Windows 10 Microsoft Office 2016 and all
incidents/problems reported were resolved within five (5) working days.

64
4.2 Programme 2: Sustainable Resource Management
Purpose: The purpose of the programme is to provide agricultural engineering support
service to farmers in order to ensure sustainable development and management of
agricultural resources.
Sub- Programmes:
Engineering Services;
LandCare;
Land Use Management; and
Disaster Risk Management.
Strategic Objectives:
To provide engineering support (planning, development, monitoring and
evaluation) with regards to irrigation technology, on-farm mechanization, value
adding, farm structures, resource conservation management, operation and
maintenance of farm equipment, machinery, tools, and implements solutions;
To plan and coordinate the implementation of 25 LandCare projects;
To Promote sustainable use of natural resources through the implementation
of regulated land use Act (Act 43 of 1983, Act 70 of 1970, and related
legislation); and
To provide agricultural disaster risk management support services to
clients/farmers by implementing programmes on disaster plans for droughts,
veld fires and floods.
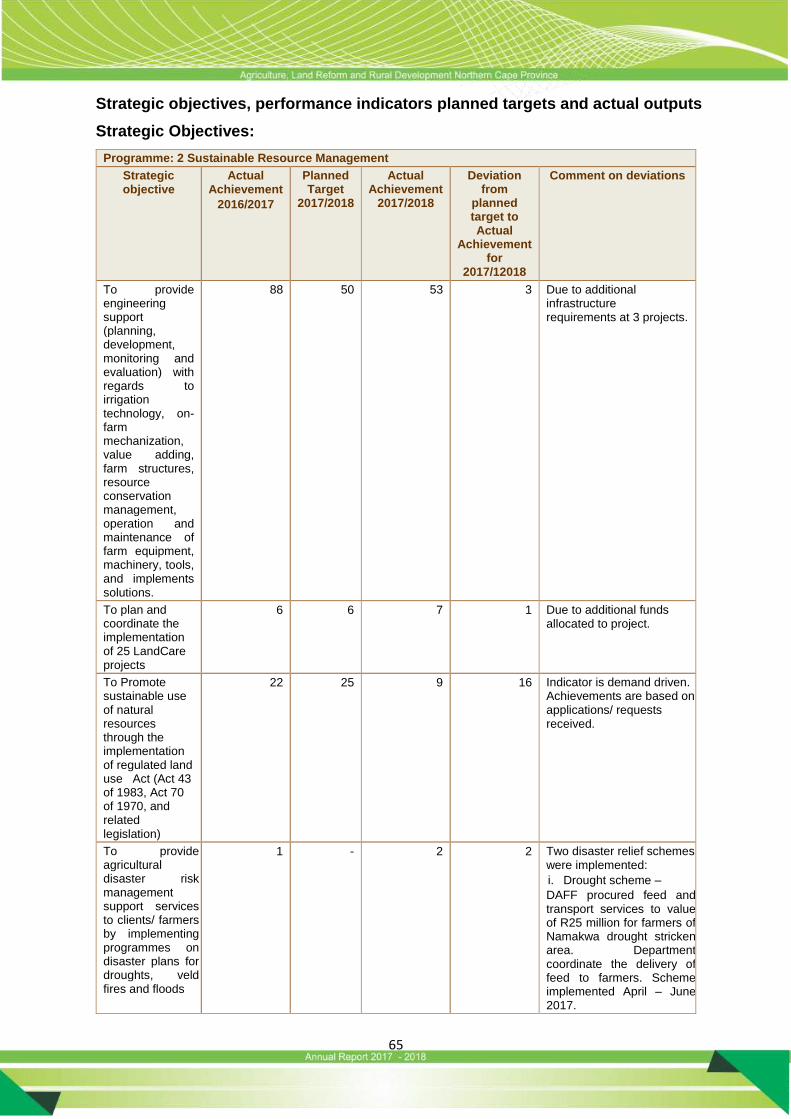
65
Strategic objectives, performance indicators planned targets and actual outputs
Strategic Objectives:
Programme: 2 Sustainable Resource Management
Strategic objective
Actual Achievement
2016/2017
Planned Target
2017/2018
Actual Achievement
2017/2018
Deviation from
planned target to Actual
Achievement for
2017/12018
Comment on deviations
To provide engineering support (planning, development, monitoring and evaluation) with regards to irrigation technology, on-farm mechanization, value adding, farm structures, resource conservation management, operation and maintenance of farm equipment, machinery, tools, and implements solutions.
88 50 53 3 Due to additional infrastructure requirements at 3 projects.
To plan and coordinate the implementation of 25 LandCare projects
6 6 7 1 Due to additional funds allocated to project.
To Promote sustainable use of natural resources through the implementation of regulated land use Act (Act 43 of 1983, Act 70 of 1970, and related legislation)
22 25 9 16 Indicator is demand driven. Achievements are based on applications/ requests received.
To provide agricultural disaster risk management support services to clients/ farmers by implementing programmes on disaster plans for droughts, veld fires and floods
1 - 2 2 Two disaster relief schemes were implemented:
i. Drought scheme –
DAFF procured feed and transport services to value of R25 million for farmers of Namakwa drought stricken area. Department coordinate the delivery of feed to farmers. Scheme implemented April – June 2017.
66
Programme: 2 Sustainable Resource Management
Strategic objective
Actual Achievement
2016/2017
Planned Target
2017/2018
Actual Achievement
2017/2018
Deviation from
planned target to Actual
Achievement for
2017/12018
Comment on deviations
ii. Flood Scheme –
Department continue with implementation of 2011 flood assistance scheme with R92 million allocation
through CASP.
Performance indicators
Sub-programme: 2.1 Engineering Services
Performance Indicators
Actual Achieve
ment 2014/201
5
Actual Achieve
ment 2015/201
6
Actual Achieve
ment
2016/201
7
Planned Target
2017/2018
Actual Achieve
ment 2017/201
8
Deviation from
planned target to Actual
Achievement for
2017/12018
Comment on
deviations
2.1.1 Number of Agricultural infrastructure established
- 54 88 50 53 3 Due to additional infrastructure requirements at 3
projects.
Strategy to overcome areas of under performance
None
67
Sub-programme: 2.2 LandCare
Performance Indicators
Actual Achievem
ent 2014/2015
Actual Achievem
ent 2015/2016
Actual Achievem
ent
2016/2017
Planned
Target 2017/20
18
Actual Achievem
ent 2017/2018
Deviation from
planned target to Actual
Achievement for
2017/2018
Comment on
deviations
2.2.1 Number of hectares protected/rehabilitated to improve agricultural production
- 6500 4700 5500 7118 1618 Due to environmental considerations (i.e. Veld fires) Most projects commenced in the 3rd quarter and additional funding was re-allocated to some projects which resulted in more hectares of land being rehabilitated
2.2.2 Number of green jobs created
364 100 153 150 200 50 As a result of additional funds being allocated to projects extra workers were employed.
2.2.3 Number of awareness campaigns conducted on
LandCare
1 2 2 3 3 0
2.2.4 Number of capacity building exercises conducted within approved LandCare projects
2 2 2 2 2 0
2.2.5 Number of beneficiaries adopting/practising sustainable production technologies & practices
100 100 100 200 228 28 Additional beneficiaries, who were mistakenly left out of the initial project beneficiaries list prior
68
Sub-programme: 2.2 LandCare
Performance Indicators
Actual Achievem
ent 2014/2015
Actual Achievem
ent 2015/2016
Actual Achievem
ent
2016/2017
Planned
Target 2017/20
18
Actual Achievem
ent 2017/2018
Deviation from
planned target to Actual
Achievement for
2017/2018
Comment on
deviations
to project implementation, were added on the list after conducting a validation process in the midst of project implement
ation.
Strategy to overcome areas of under performance
None
Sub-programme: 2.3 Land Use Management
Performance Indicators Actual Achieve
ment 2014/201
5
Actual Achieve
ment 2015/201
6
Actual Achieve
ment
2016/2017
Planned
Target 2017/2
018
Actual Achieve
ment 2017/201
8
Deviation from
planned target to Actual
Achievement for 2017/201
8
Comment on
deviatio
ns
2.3.1 Number of hectares of agricultural land protected through guiding subdivision/rezoning/change of agricultural land
use
- 20 16609 200 710.1 510 Indicator is demand driven. Achievements are based on applications/ requests received.
Strategy to overcome areas of under performance
None
69
Sub-programme: 2.4 Disaster Risk Management
Performance Indicators
Actual Achievem
ent 2014/2015
Actual Achievem
ent 2015/2016
Actual Achievem
ent
2016/2017
Planned
Target 2017/20
18
Actual Achievem
ent 2017/2018
Deviation from
planned target to Actual
Achievement for
2017/2018
Comment on
deviations
2.4.1 Number of disaster risks reduction programme managed
12 13 12 12 12 0
2.4.2 Number of disaster relief schemes managed
1 3 1 - 2 2 Two disaster relief schemes were implemented:
iii. Drought scheme –
DAFF procured feed and transport services to value of R25 million for farmers of Namaqua drought stricken area. Department coordinate the delivery of feed to farmers. Scheme implemented April – June 2017.
iv. Flood Scheme –
Department continue with implementation of 2011 flood assistance scheme with R92 million allocation through CASP.
Strategy to overcome areas of under performance
None

70
Changes to planned targets
None
Linking performance with budgets
Sub programme expenditure
Pr2: Sustainable Resource Management
2017/2018 2016/2017
Final Actual (Over)/Under Final Actual (Over)/Under
Appropriation Expenditure Expenditure Appropriation Expenditure Expenditure
R’000 R’000 R’000 R’000 R’000 R’000
Engineering Services 6 755 6 755 - 7 126 7 126 -
Land Care 7 094 6 621 473 9 320 9 306 14
Land Use Management 18 774 16 001 2 773 15 055 14 815 240
Disaster Risk Management - 64 197 64 197 -
Total 32 623 29 377 3 246 95 698 95 444 254
71
SERVICE DELIVERY HIGHLIGHTS
4.2.1 Engineering Support for Development of Infrastructure and Mechanisation
Systems to Increase Production, Food and Product Processing and Marketing.
Namakwa district
Focus was on the Namakwa Irrigation Development Programme with the following
achievements:
Coboop - Supply portable pump units and delivery pipes for irrigation.
Onseepkans – Installation of irrigation and trellising systems for 17.6 ha
vineyards completed.
- Procured a vineyard tractor and boom sprayer.
Pella - Procured a tractor and implements for vineyard production.
ZF Mgcawu district
Blucoso Trust- Construction of fence and soil preparation for raisin drying area.
Eksteenskuil Grape- Support with soil preparation on 10 ha.
Pixley Ka Seme district
Intswenekazi Vegetable Garden – Survey and design a shade net structure,
tanks, drip irrigation system, security fence and solar pump system to
establish a 1 ha food security garden.
Emthanjeni hydroponics - Repair of greenhouse.
Bakengraf - Construction of 3 centre pivot irrigation systems for 13.3 ha and
water supply infrastructure for 5.7 ha dragline systems completed.
Elim Trust - Soil preparation; de-bushing, de-stumping, cross ripping and
levelling; for irrigation of 19 ha completed.
Frances Baard district
Pniel, Kalkput and Rooibult projects - Supply and deliver tractors and farming implements for irrigation.
Plot 5J14 - Installation of a 17.8ha centre pivot completed.
Oreratile Project - Construction of fence and an ostrich house completed.
Reetsang - Establish food garden.
Vula-Vula - Establish food garden

72
John Taolo Gaetsewe district
Manyeding - Construction of a storage facility was done.
Stock handling facilities
Farmers were supported with the construction of fixed handling facilities and supply of
mobile stock handling facilities.
Projects supplied with mobile handling facilities:
Hartswater commonage
Projects where fixed stock handling facilities were constructed:
District Project/ Farm Designed Under
Construction Completed
John Taolo Gaetsewe Mapoteng 1 1
Gasehunelo - Wyk 1 1 1
Masilebetsane 1 1
Taunten 1 1
Frances Baard Doornkloof 1 1
Dipitsing 1 1
Alfa farm 1 1
Caerwining farm 1 1
Bellsbank 1 1
Rust & Vrede 1 1
Waterbron 1 1
Pniel 1 1
Namaqua Kammiesberg 3
Total 15 6 6
Assistance with Construction of Fences
Large areas of communal land are not well fenced and with no or little inner or camp
fences which make effective veld management difficult. To overcome the problem
farmers are supported with the construction of fences.
Fences constructed:
District Inner Camp Fences staked
out and constructed (Km)
Border Fences staked out and
constructed (Km)
John Taolo Gaetsewe 76.713 36.09
Pixley Ka Seme 14.506 32.33
Namaqua 5.0 -
73
Frances Baard 7.865 26.3
Total 104.084 94.72
Stock Water Supply
Availability and on – farm distribution of adequate stock water on rural and land reform
farms is one of the limiting factors to ensure effective utilisation of rangeland by
emerging stock farmers.
Stock water systems were designed, service providers appointed and construction of
stock water systems completed:
Support towards development of stock water
District Number of
projects/
Farms
Serviced
Boreholes
Drilled/
Rehabilitated
Pumps
Installed
Windmills
Installed/
Upgraded
Stock Water
Systems
Installed/
Upgraded
Area
Serviced
with Stock
Water (Ha)
John Taolo Gaetsewe
46
- 24 2 33 59 134
Pixley Ka Seme
9 4 6 - 18 10 597
Namaqua 14 14 26 45 40 597 000
Frances Baard 2 2 4 2 10 5 619
Total 71 20 60 49 98 672 350
4.2.2 LANDCARE
The LandCare Programme was conceptualised in the year 1997 in South Africa
because the Government, communities and individuals accepted the need for
changing the way we manage and use our land and water resources, so that their
long-term potentials are sustained and optimised.
LandCare Programme pursues the goal of optimizing productivity and sustainability of
natural resources resulting in greater productivity, food security, job creation and a
better quality of life for all. The principles that define and guide LandCare in South
Africa must be explicitly incorporated within any initiative claiming to incorporate
LandCare processes and achieve LandCare outcomes.
In the 2017/2018 fiscal year the Department through the provincial LandCare
programme allocated a total sum of R 7.094 million towards the implementation of
74
seven (7) community led natural resource management projects and one (1) LandCare
awareness project aimed at school learners.
The following projects were implemented in the 2017/2018 fiscal year
Project District Municipality Local Municipality
Location Budget R’000
Bothithong Gnidia Burchelli control
John Taolo Gaetsewe Joe Morolong
Danoon, Kiang Kop & Bothitong
R1.000m
Frances Baard VeldCare Frances Baard Magareng & Dikgatlong
Majeng, Witfontein & Delportshoop
R1.100m
Gamagara Bush control John Taolo Gaetsewe Gamagara Deben, Olifantshoek, Vredebron & Broughton
R1.000m
Joe Morolong Bush control
John Taolo Gaetsewe Joe Morlong Dutton, Garapoana & Metsimantsi (Wyk 7)
R1.200m
JTG Wetlands rehabilitation
John Taolo Gaetsewe Joe Morolong
R0.800m
Niekerkshoop Prosopis control
Pixley Ka Seme Siyathemba Niekerkshoop R0.300m
Pixley Ka Seme SoilCare
Pixley Ka Seme Ubuntu Richmond R1.200m
NC LandCare Awareness
John Taolo Gaetsewe, Pixley Ka Seme and Frances Baard
R0.354m
4.2.2.1 SoilCare:
This theme addresses issues of soil acidity, soil erosion and the reduction in soil fertility
caused by the selective removal of fine particles, nutrients and organic matter. e.g
Gully erosion or dongas.
Through the Pixley Ka Seme SoilCare project 300ha of eroded soil was rehabilitated
using bio-engineering techniques. A total of 16 people were employed during the
implementation of this project and all were trained on different methods of erosion
control. The objective on this project was to rehabilitate the unproductive lands of
Richmond communal farm to optimize agricultural production.
4.2.2.2 VeldCare:
This theme deals with the reduction in ground cover of rangelands, exposing soil to
different forms of erosion, and degrading the species composition relative to the
nutritional requirements of the grazing animals. Widespread bush encroachment has
reduces the livestock productivity of the veld and this theme concentrates on
addressing these broader degradation issues. A total of five (5) projects were
implemented under this theme at a total budget of R4 300 000.

75
Bothithong Gnidia Burchelli Control
1038ha of rangeland were rehabilitated using manual control of Harpuisbos
(Gnidia Burchelli), 81 job opportunities were created during project
implementation. A total of R1 100,000 was allocated for implementation of this
project and approximately 1000 farmers will benefit from this support.
Frances Baard VeldCare
A total of 2020ha of rangeland were rehabilitated through the chemical control
of senegalia mellifera (Swarthaak/Black torn/Mongana). A total sum of R1 259
060 and 280 farmers will benefit from this support. The project was
implemented at Majeng village, Fairfield farm (Delportshoop) and Witfontein
(Majeng village) and 35 job opportunities were created.
Gamagara Bush Control
Through the chemical control of senegalia mellifera (Swarthaak/Black
torn/Mongana) 2600ha of rangeland were rehabilitated at Deben, Olifantshoek,
Vredebron and Broughton. A total of 31 job opportunities were created and
approximately 2300 farmers will benefit differently from this support. R1 150
000 was spent during implementation.
Joe Morolong Bush Control
A total of 1460ha of rangeland were rehabilitated through the chemical control
of senegalia mellifera (Swarthaak/Black torn/Mongana). A total sum of R1 233
327 and 2000 farmers will benefit from this support. The project was
implemented at Dutton, Garapoana, Metsimantsi (Wyk7) in the Kuruman area
and 33 job opportunities were created and an allocation.
4.2.2.3 Water Care
This theme includes the huge problem of soil loss which has damaged the catchments
and hydrological systems by accelerating the siltation of dams used for irrigation,
reducing infiltration and lowering the water tables. It also deals with the control of alien
invader plant species that reduces underground over utilises underground water.
John Taolo Gaetsewe Wetlands Rehabilitation

76
Eleven (11) freshwater ecosystems (Wetlands) were rehabilitated around the Joe
Morolong local Municipality. The rehabilitation process included removal of alien plant
species around wetlands and fencing critical areas of the wetlands to minimise
trampling.
A total of 45 job opportunities were created at a total allocation of R800 000. These
water bodies support sustainable livelihoods in the Joe Morolong area as they provide
water for households and agricultural use.
4.2.2.4 Junior Care:
Junior-LandCare seeks to empower previously disadvantaged young people with
regard to training in facilitation and leadership skills. This includes the promotion of
food security at home and at schools by establishing food gardens, creating
awareness in sustainable agriculture, stimulating the formation of youth clubs and
small projects that aim to promote other components of LandCare. Junior-LandCare
addresses the needs of young people in an integrated way that involves
interdisciplinary approaches.
NC LandCare Awareness (Junior LandCare Weekend Camp)
The Department through the LandCare programme held a weekend long camp for
learners from three (3) districts namely; Frances Baard, John Taolo Gaetsewe and
Pixley Ka Seme district. The camp was attended by 110 learners and teachers from
their respective schools. The objective of Junior LandCare weekend camp was to
capacitate learners in different environmental issues and how they can contribute
positively in their own environment.
The learners were tasked with establishing school projects which will be evaluated by
the end of June 2018; the winning school/learners will receive a prize and will
represent the province during the 8th Biennial National LandCare Conference in 2018.
As part of the weekend program MEC Norman Shushu launched the “LandCare adopt
a tree program” This program seeks to promote greening (Tree planting) of
communities across the province.

77
4.2.3 LAND-USE MANAGEMENT
Engineering inputs were delivered to ensure sustainable utilisation of agricultural
resources as provided for in the Conservation of Agricultural Resources Act; Act 43
of 1983.
4.2.3.1 Subdivision/rezoning/change of agricultural land use applications for
Rezoning
Frances Baard
Middelpos No 241 - Middelpos Guest Farm; Rezoning for a guest farm-369.3 ha
Kraanvogel Vallei No 29; Rezoning to establish a filling station- 9.7ha
4.2.3.2 Applications for Plough Certificates
ZF Mgcawu
FGJ Wiid; Portion 29 of Uap 418;- 25 ha
FGJ Wiid; Portion 21 of Uap 418;- 150 ha
BN Kilian; Portion 27 of Rouville West:- 12 ha
Frances Baard
Van Deventer Familie Trust; Por 4 of Brakpan 143; Kimberley- 7 ha
Pixley Ka Seme
Mahoebe (De Kalk 37, Por 1 of Klipfontein 38 and Por 1 of Torquay 157)-91ha
MJ van Wyk; Farm Buffelsvlei; Umsobomvu- 40ha
AL Murray; Farm Slingersfontein; Umsobomvu- 6ha
4.2.3.4 Assistance with Farm Planning
Land use plans and maps were compiled for effective planning and design of on farm
infrastructure development.
Farm plans compiled:
District Number of Farm Plans Compiled Total area of Farm Plans Compiled (Ha)
John Taolo Gaetsewe 25 104 488
Pixley Ka Seme 9 23 314
Frances Baard 15 7 360
Total 49 135 162
78
4.2.3.5 Vaalharts Revitalisation
This is a long term programme to rebuild the water supply, main drainage
infrastructure, installation of on-farm drainage and rebuilding of old overnight
reservoirs to minimize water logging. The following were achieved with R12 million
allocation from the Ilima Letsema programme:
The Environmental Impact Assessment (EIA) for Vaalharts Revitalisation -Basic
Assessment Report (BAR) was submitted to Department of Environmental Affairs
(DEA) for construction of the following works:
Awaiting approvals
800mm concrete pipeline and new balancing dam to service VH Farms.
A new balancing dam and supply pipeline to Ganspan from the North Canal.
4 x new balancing dams.
11 x new feeder dams and the replacement of feeder canals with pipelines.
Construction of new storm water drains.
Approvals issued
Ganspan - sub-surface drainage and communal main outfall drain.
North main supply canal.
Construction works completed in the year:
Subsurface drainage systems on Plots 5I6 and 4G5 for drainage of 41 ha.
Installation of 2.9 km communal drainage pipeline to service 201 ha irrigation
land in block G5 and I6B farms.
Storage dam on Plot 4G8 (30% completed)
Storage dam on Plot 5H16 (70% completed)
79
4.2.4 SUB-PROGRAMME DISASTER MANAGEMENT
4.2.4.1 Disaster Risk Reduction Programmes
The Department implemented programmes aimed to minimize the agricultural
vulnerabilities and disaster risks. It includes prevention, mitigation, adaptation,
prediction and early warning systems. The following activities were implemented in
support during the year:
Early warning system
An Early Warning Committee was established which analyses data collected through
remote-sensing techniques, seasonal climatic data and grazing capacity data to inform
the Department and farmers of developing disaster drought situations.
Twelve (12) early warning reports have been generated for the whole province and
disseminated to farmers through extension services and communication as an integral
component of an effective Early Warning System.
Awareness campaigns
The objective of the campaigns is to promote a culture of risk avoidance among
stakeholders by capacitating them through integrated education, training and public
awareness programmes informed by scientific research.
The following campaigns were conducted on veld fires and disaster management
processes:
On the 18th of September 2017, the disaster unit conducted a disaster
management information session day for farmers in Barkley West. Purpose of
the workshop was on Veld Fire awareness, LandCare and Provincial Disaster
Management Centre (PDMC) processes when veld fires become disastrous.
Disaster Funding and Process Workshop On the 14th of September 2017,
disaster management workshop was held to clear disaster management
challenges in the province. Different types of available for disasters and
requirements were presented by the National Disaster Management Centre
(NDMC). Drought status of the province was reflected and way forward tabled.
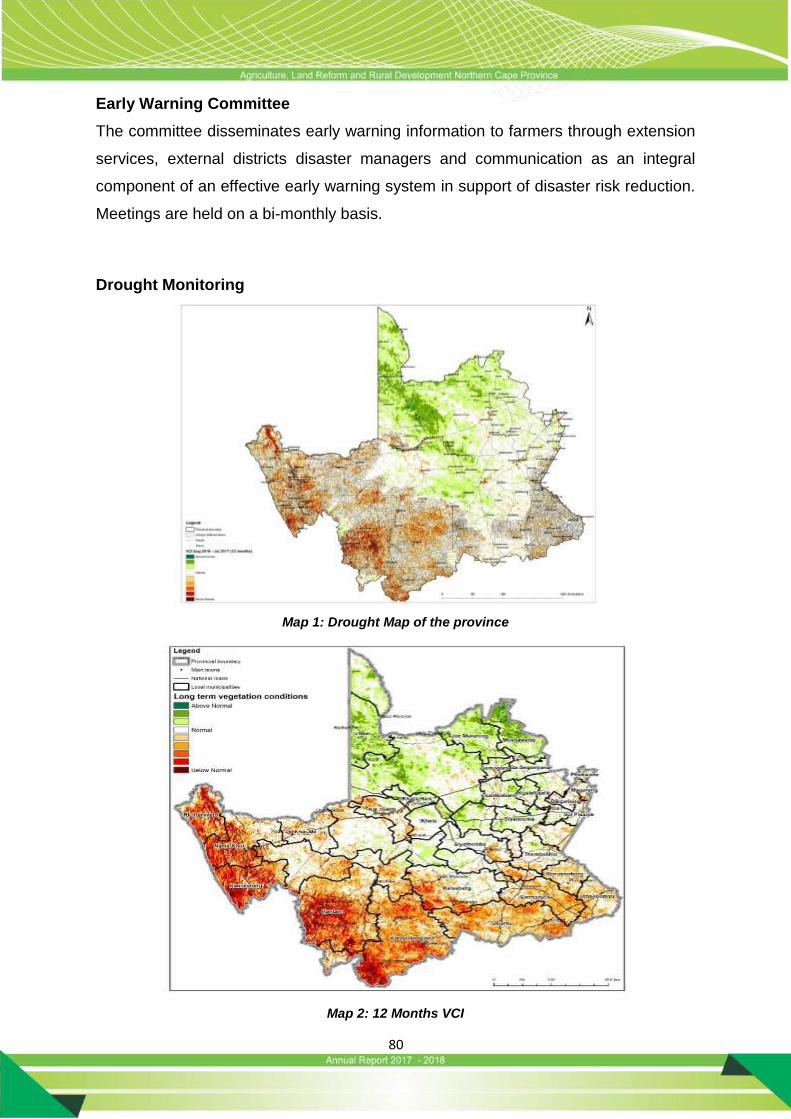
80
Early Warning Committee
The committee disseminates early warning information to farmers through extension
services, external districts disaster managers and communication as an integral
component of an effective early warning system in support of disaster risk reduction.
Meetings are held on a bi-monthly basis.
Drought Monitoring
Map 1: Drought Map of the province
Map 2: 12 Months VCI

81
The Province is still experiencing severe drought conditions as indicated on the maps
above. The Province has received below normal rainfall for the past years and in the
2017/18 financial year. Animal conditions are in a bad shape and some areas are
experiencing shortage of water due to the crippling drought.
4.2.4.2 Project Monitoring and Visits
On the 26 until the 28th of March 2018, the Department of Agriculture’s Disaster and
LandCare units, NDMC, PDMC and Department of Environmental Affairs visited
Carnavon, Calvinia, Loeriesfontein and Brandvlei for drought monitoring and
inspection of the infestation of the prosopis problem in the drought affected areas. The
team also met with the local councils of the respective towns regarding drought
interventions and coping strategies.
Fig. 2: Infestation of prosopis trees along the river in Carnavon
4.2.4.3 Boreholes
DAFF has approved to equip boreholes for the JTG area under the disaster mitigation
fund. Disaster Inception meeting for Mitigation fund of boreholes project was held in
Kuruman on the 1st of March 2018. The team also went for the boreholes inspection
and has agreed that boreholes will be equipped through DAFF funding.

82
4.2.4.4 International Day for Disaster Reduction (IDDR)
On the 18th and 19th of October 2017, the disaster unit conducted IDDR workshop to
celebrate and raise awareness on disaster management issues. The aim was also to
reduce the number of people affected by disasters.
Stakeholders who attended were farmers, DAFF, Departmental officials, district
disaster managers and those involved in disaster management.
Handover of the Agricultural Veld and Drought Disaster Management plans was done
on the 19th of October 2017.
Members attending IDDR Handover of the veld & drought management plan
4.2.4.5 Veld/Natural resource management training for extension officials
On the 13th until the 17th of November 2017 Veld/Natural resource management
training for extension officials was held in Kuruman. The purpose of the training is
to equip extension officials on the basic principles and practices needed for
sustainable natural resources management, such as grazing lands (veld) and water
resources. The course is also practical where extension officials will identify
different plants and grass species. It also touches on the issues of farm planning,
veld fires, and soil identification.
83
4.2.4.6 Fodder Bank:
To increase the production of lucerne and other animal feed on the research farms;
Rietrivier, Vaalharts and Eiland; for immediate support to stock farmers when disasters
like veld fires and droughts strike, the following support were delivered:
Rietrivier
3 centre pivot irrigation systems for 60 ha were procured and installed.
Storage facility constructed.
Mechanisation equipment supplied.
Vaalharts
Construction of two centre pivot irrigation systems for 22 ha in process.
Storage facility constructed.
Mechanisation equipment supplied.
Eiland
Lucerne store repaired and upgraded
Mechanisation equipment supplied.
4.2.4.7 Disaster Management Relief Scheme Projects:
Drought Support
The Department of Agriculture, Forestry and Fisheries (DAFF) allocated R25 million
to the Northern Cape for the procurement of drought feed. DAFF centrally procured
73 000 bags of drought pellets at a cost of R 20,44 million from Stanch Trading for
distribution to farmers in Namakwa district. Officials of the Department were
responsible for the coordination of feed distribution to the farmers. The distribution
was completed by end of June 2017. DAFF also awarded a tender to the amount of
R4.0 million to a contractor who transported donated feed from Mpumalanga and
Western Cape to the area.
On the 30th of August 2017, Namakwa District Municipality took a resolution to
declare the district drought stricken as per council resolution number
URN14/08/2017.
84
On the 10 October 2017, The Honourable Premier Sylvia Lucas declared a
provincial state of disaster for Namakwa and Pixley Ka Seme districts as per
notice number 149 of 2017.
A total number of 2380 famers applied for drought assistance in October, (Small
scale farmers 595, Medium scale farmers 403 and Commercial farmers 1382.
The Department compiled a request for drought relief funding report that was
submitted to PDMC for NDMC and DAFF Climate Change and Disaster
Management Directorate in November to assist the province.
On the 22nd of February 2018 the Honourable Premier re-declared the above
mentioned two districts as provincial state of disaster for 3months as according
to legislation (Disaster Management Act 57 of 20012)
On the 13th of March 2018, the NDMC declared a National State of Drought
Disaster as per gazette 41493.
Flood Assistance Scheme
An amount of R92 million was made available for the 2017/2018 financial year to
continue with the repair of farm infrastructure that was damaged in the 2011
floods in the Orange River.
The following work was completed:
Survey, plan, design, cost and issue approvals to farmers to repair 42.887 km
of flood protection walls along the banks of the Orange River in ZF Mgcawu
district.
Repair of 50 flood walls on 79 land partials with a total length of 39.593 km were
constructed by contractors appointed by the farmers.
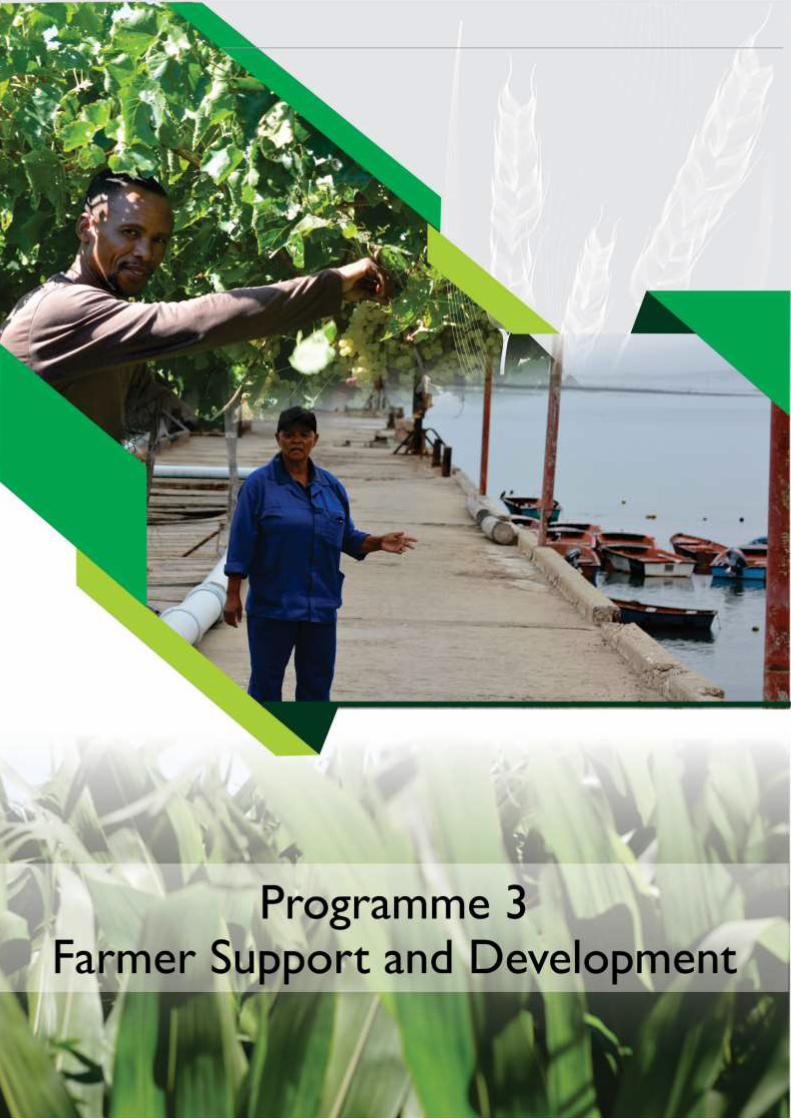
85
86
4.3 Programme 3: Farmer Support and Development
Purpose: The purpose of the programme is to provide support to farmers and rural
communities through agricultural development programmes.
Sub- Programmes:
Farmer settlement and development;
Extension and advisory services; and
Food security.
Strategic Objectives:
To provide agricultural support to 8400 smallholder and commercial producers
for sustainable agricultural development;
To provide extension and advisory services to 25 000 farmers; and
To provide support to 10 000 food insecure households by 2020.
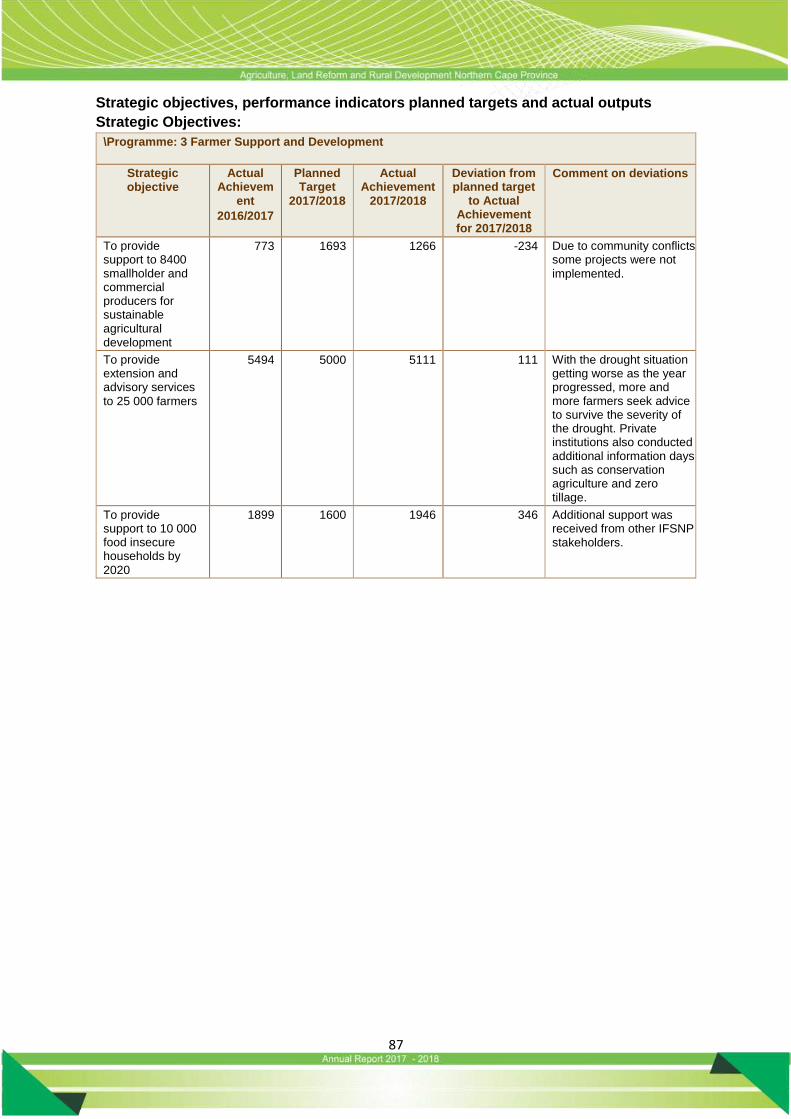
87
Strategic objectives, performance indicators planned targets and actual outputs
Strategic Objectives:
\Programme: 3 Farmer Support and Development
Strategic objective
Actual Achievem
ent
2016/2017
Planned Target
2017/2018
Actual Achievement
2017/2018
Deviation from planned target
to Actual Achievement for 2017/2018
Comment on deviations
To provide support to 8400 smallholder and commercial producers for sustainable agricultural development
773 1693 1266 -234 Due to community conflicts some projects were not
implemented.
To provide extension and advisory services
to 25 000 farmers
5494 5000 5111 111 With the drought situation getting worse as the year progressed, more and more farmers seek advice to survive the severity of the drought. Private institutions also conducted additional information days such as conservation agriculture and zero tillage.
To provide support to 10 000 food insecure households by
2020
1899 1600 1946 346 Additional support was received from other IFSNP stakeholders.
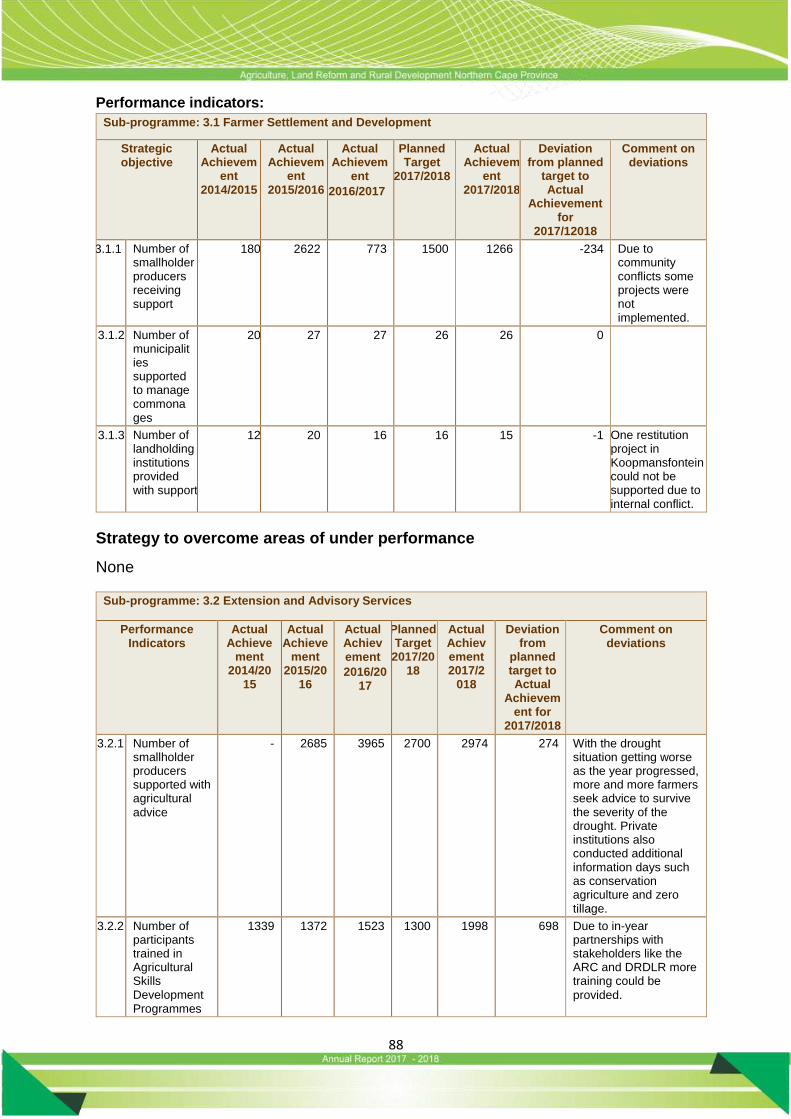
88
Performance indicators:
Sub-programme: 3.1 Farmer Settlement and Development
Strategic objective
Actual Achievem
ent 2014/2015
Actual Achievem
ent 2015/2016
Actual Achievem
ent
2016/2017
Planned Target
2017/2018
Actual Achievem
ent 2017/2018
Deviation from planned
target to Actual
Achievement for
2017/12018
Comment on deviations
3.1.1 Number of smallholder producers receiving support
180 2622 773 1500 1266 -234 Due to community conflicts some projects were not implemented.
3.1.2 Number of municipalities supported to manage commonages
20 27 27 26 26 0
3.1.3 Number of landholding institutions provided with support
12 20 16 16 15 -1 One restitution project in Koopmansfontein could not be supported due to internal conflict.
Strategy to overcome areas of under performance
None
Sub-programme: 3.2 Extension and Advisory Services
Performance Indicators
Actual Achieve
ment 2014/20
15
Actual Achieve
ment 2015/20
16
Actual Achievement
2016/2017
Planned Target
2017/2018
Actual Achievement 2017/2
018
Deviation from
planned target to Actual
Achievement for
2017/2018
Comment on deviations
3.2.1 Number of smallholder producers supported with agricultural
advice
- 2685 3965 2700 2974 274 With the drought situation getting worse as the year progressed, more and more farmers seek advice to survive the severity of the drought. Private institutions also conducted additional information days such as conservation agriculture and zero tillage.
3.2.2 Number of participants trained in Agricultural Skills Development Programmes
1339 1372 1523 1300 1998 698 Due to in-year partnerships with stakeholders like the ARC and DRDLR more training could be
provided.
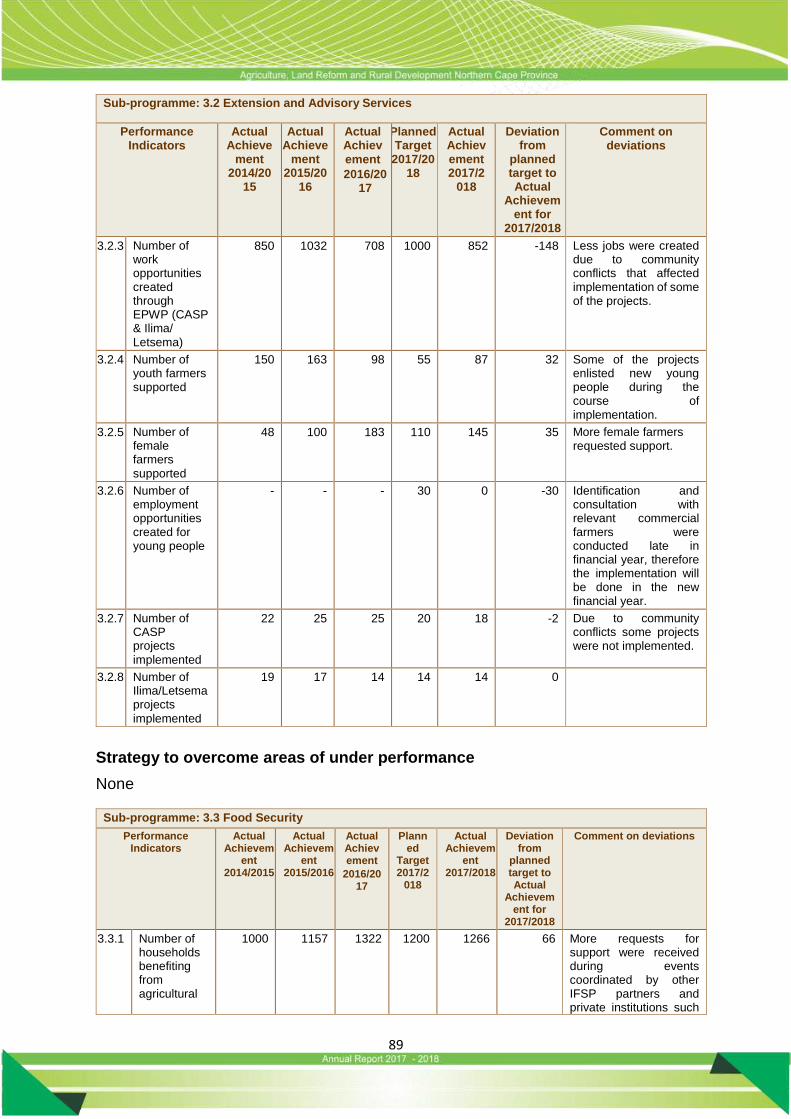
89
Sub-programme: 3.2 Extension and Advisory Services
Performance Indicators
Actual Achieve
ment 2014/20
15
Actual Achieve
ment 2015/20
16
Actual Achiev
ement
2016/2017
Planned Target
2017/2018
Actual Achievement 2017/2
018
Deviation from
planned target to Actual
Achievement for
2017/2018
Comment on deviations
3.2.3 Number of work opportunities created through EPWP (CASP & Ilima/
Letsema)
850 1032 708 1000 852 -148 Less jobs were created due to community conflicts that affected implementation of some of the projects.
3.2.4 Number of youth farmers supported
150 163 98 55 87 32 Some of the projects enlisted new young people during the course of implementation.
3.2.5 Number of female farmers
supported
48 100 183 110 145 35 More female farmers requested support.
3.2.6 Number of employment opportunities created for young people
- - - 30 0 -30 Identification and consultation with relevant commercial farmers were conducted late in financial year, therefore the implementation will be done in the new financial year.
3.2.7 Number of CASP projects
implemented
22 25 25 20 18 -2 Due to community conflicts some projects were not implemented.
3.2.8 Number of Ilima/Letsema projects
implemented
19 17 14 14 14 0
Strategy to overcome areas of under performance
None
Sub-programme: 3.3 Food Security
Performance Indicators
Actual Achievem
ent 2014/2015
Actual Achievem
ent 2015/2016
Actual Achievement
2016/2017
Planned
Target 2017/2
018
Actual Achievem
ent 2017/2018
Deviation from
planned target to Actual
Achievement for
2017/2018
Comment on deviations
3.3.1 Number of households benefiting from agricultural
1000 1157 1322 1200 1266 66 More requests for support were received during events coordinated by other IFSP partners and private institutions such
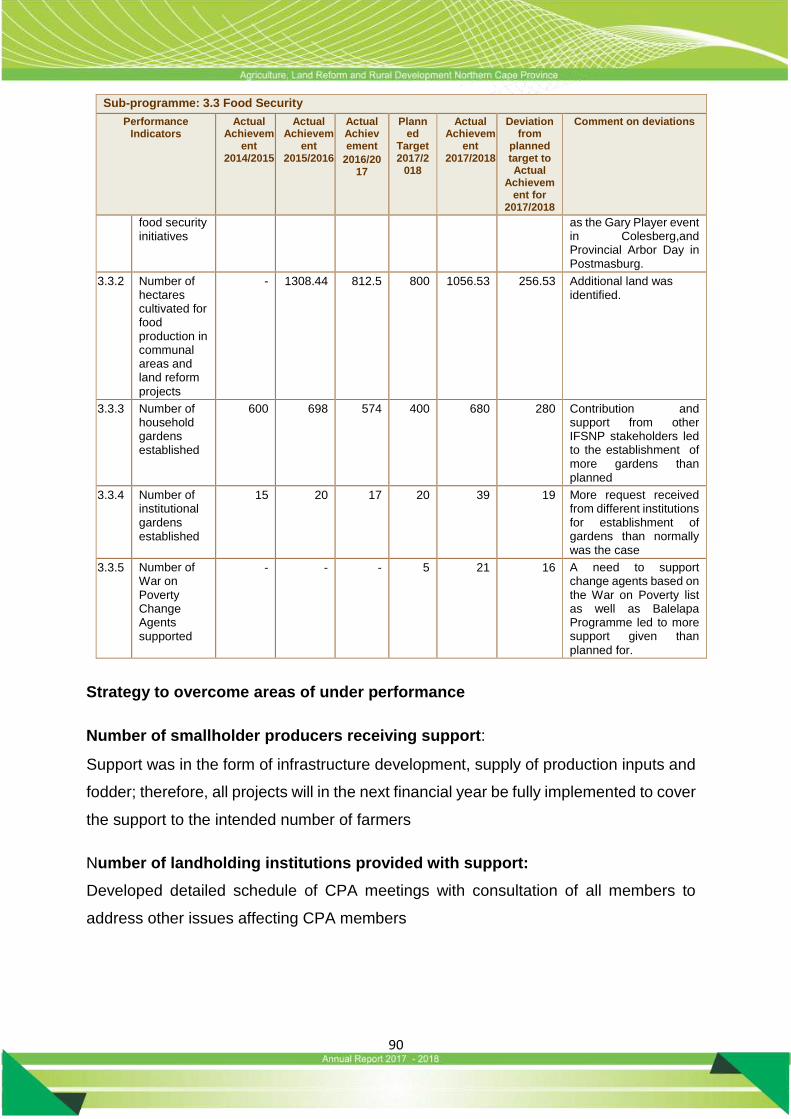
90
Sub-programme: 3.3 Food Security
Performance Indicators
Actual Achievem
ent 2014/2015
Actual Achievem
ent 2015/2016
Actual Achievement
2016/2017
Planned
Target 2017/2
018
Actual Achievem
ent 2017/2018
Deviation from
planned target to Actual
Achievement for
2017/2018
Comment on deviations
food security initiatives
as the Gary Player event in Colesberg,and Provincial Arbor Day in Postmasburg.
3.3.2 Number of hectares cultivated for food production in communal areas and land reform
projects
- 1308.44 812.5 800 1056.53 256.53 Additional land was identified.
3.3.3 Number of household gardens established
600 698 574 400 680 280 Contribution and support from other IFSNP stakeholders led to the establishment of more gardens than planned
3.3.4 Number of institutional gardens established
15 20 17 20 39 19 More request received from different institutions for establishment of gardens than normally was the case
3.3.5 Number of War on Poverty Change Agents supported
- - - 5 21 16 A need to support change agents based on the War on Poverty list as well as Balelapa Programme led to more support given than
planned for.
Strategy to overcome areas of under performance
Number of smallholder producers receiving support:
Support was in the form of infrastructure development, supply of production inputs and
fodder; therefore, all projects will in the next financial year be fully implemented to cover
the support to the intended number of farmers
Number of landholding institutions provided with support:
Developed detailed schedule of CPA meetings with consultation of all members to
address other issues affecting CPA members
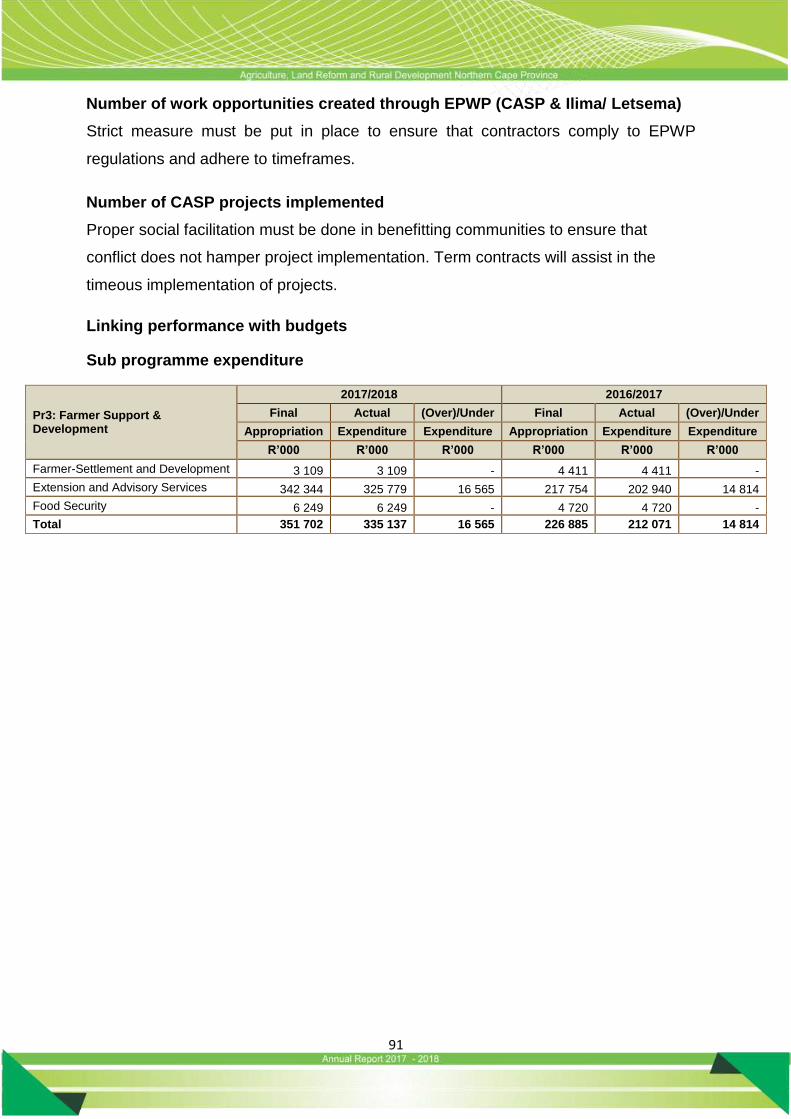
91
Number of work opportunities created through EPWP (CASP & Ilima/ Letsema)
Strict measure must be put in place to ensure that contractors comply to EPWP
regulations and adhere to timeframes.
Number of CASP projects implemented
Proper social facilitation must be done in benefitting communities to ensure that
conflict does not hamper project implementation. Term contracts will assist in the
timeous implementation of projects.
Linking performance with budgets
Sub programme expenditure
Pr3: Farmer Support & Development
2017/2018 2016/2017
Final Actual (Over)/Under Final Actual (Over)/Under
Appropriation Expenditure Expenditure Appropriation Expenditure Expenditure
R’000 R’000 R’000 R’000 R’000 R’000
Farmer-Settlement and Development 3 109 3 109 - 4 411 4 411 -
Extension and Advisory Services 342 344 325 779 16 565 217 754 202 940 14 814
Food Security 6 249 6 249 - 4 720 4 720 -
Total 351 702 335 137 16 565 226 885 212 071 14 814
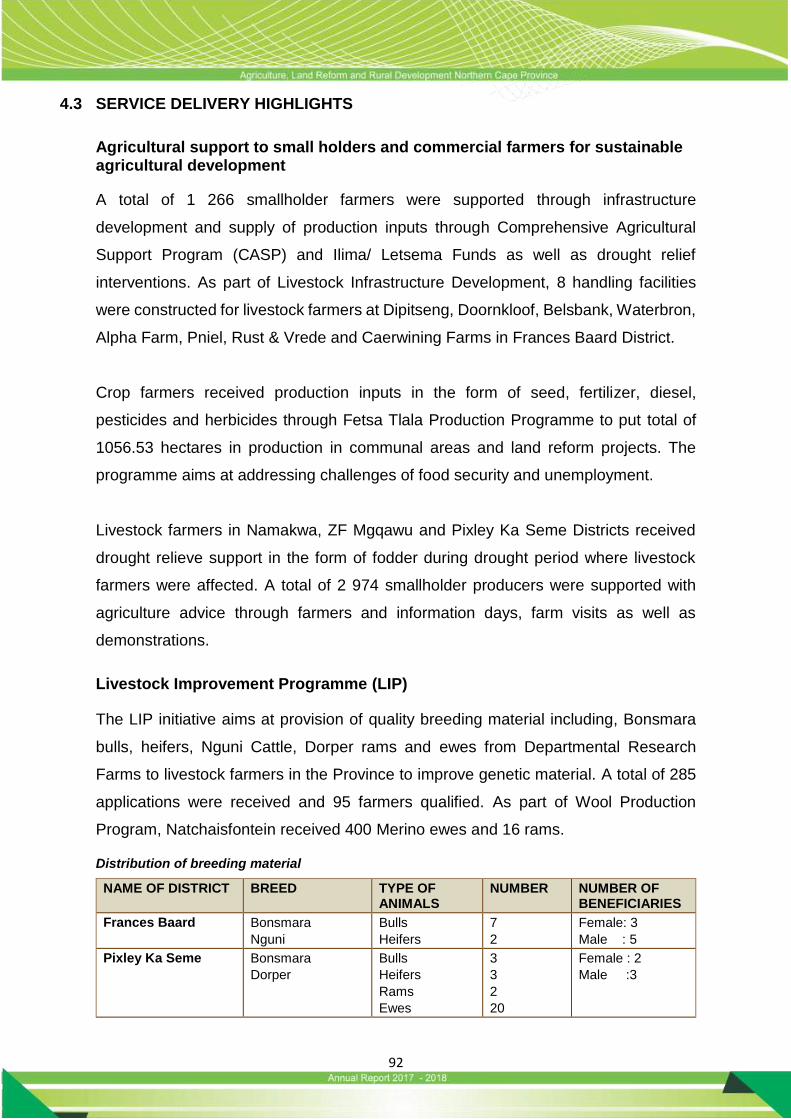
92
4.3 SERVICE DELIVERY HIGHLIGHTS
Agricultural support to small holders and commercial farmers for sustainable agricultural development
A total of 1 266 smallholder farmers were supported through infrastructure
development and supply of production inputs through Comprehensive Agricultural
Support Program (CASP) and Ilima/ Letsema Funds as well as drought relief
interventions. As part of Livestock Infrastructure Development, 8 handling facilities
were constructed for livestock farmers at Dipitseng, Doornkloof, Belsbank, Waterbron,
Alpha Farm, Pniel, Rust & Vrede and Caerwining Farms in Frances Baard District.
Crop farmers received production inputs in the form of seed, fertilizer, diesel,
pesticides and herbicides through Fetsa Tlala Production Programme to put total of
1056.53 hectares in production in communal areas and land reform projects. The
programme aims at addressing challenges of food security and unemployment.
Livestock farmers in Namakwa, ZF Mgqawu and Pixley Ka Seme Districts received
drought relieve support in the form of fodder during drought period where livestock
farmers were affected. A total of 2 974 smallholder producers were supported with
agriculture advice through farmers and information days, farm visits as well as
demonstrations.
Livestock Improvement Programme (LIP)
The LIP initiative aims at provision of quality breeding material including, Bonsmara
bulls, heifers, Nguni Cattle, Dorper rams and ewes from Departmental Research
Farms to livestock farmers in the Province to improve genetic material. A total of 285
applications were received and 95 farmers qualified. As part of Wool Production
Program, Natchaisfontein received 400 Merino ewes and 16 rams.
Distribution of breeding material
NAME OF DISTRICT BREED TYPE OF ANIMALS
NUMBER NUMBER OF BENEFICIARIES
Frances Baard Bonsmara
Nguni
Bulls
Heifers
7
2
Female: 3
Male : 5
Pixley Ka Seme Bonsmara
Dorper
Bulls
Heifers
Rams
Ewes
3
3
2
20
Female : 2
Male :3
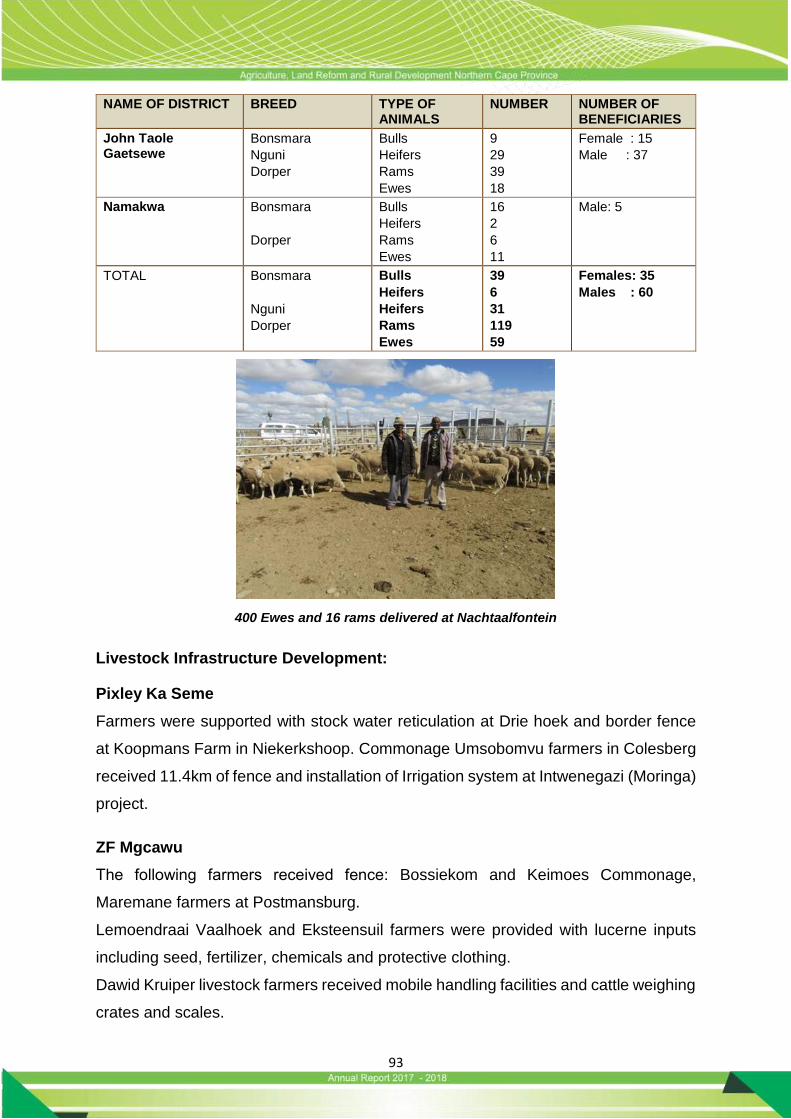
93
NAME OF DISTRICT BREED TYPE OF ANIMALS
NUMBER NUMBER OF BENEFICIARIES
John Taole Gaetsewe
Bonsmara
Nguni
Dorper
Bulls
Heifers
Rams
Ewes
9
29
39
18
Female : 15
Male : 37
Namakwa Bonsmara
Dorper
Bulls
Heifers
Rams
Ewes
16
2
6
11
Male: 5
TOTAL Bonsmara
Nguni
Dorper
Bulls
Heifers
Heifers
Rams
Ewes
39
6
31
119
59
Females: 35
Males : 60
400 Ewes and 16 rams delivered at Nachtaalfontein
Livestock Infrastructure Development:
Pixley Ka Seme
Farmers were supported with stock water reticulation at Drie hoek and border fence
at Koopmans Farm in Niekerkshoop. Commonage Umsobomvu farmers in Colesberg
received 11.4km of fence and installation of Irrigation system at Intwenegazi (Moringa)
project.
ZF Mgcawu
The following farmers received fence: Bossiekom and Keimoes Commonage,
Maremane farmers at Postmansburg.
Lemoendraai Vaalhoek and Eksteensuil farmers were provided with lucerne inputs
including seed, fertilizer, chemicals and protective clothing.
Dawid Kruiper livestock farmers received mobile handling facilities and cattle weighing
crates and scales.
94
Stock water system
The following farms in Frances Baard, Waterfall, Groenville, and Rust & Vrede
received stock water for optimum livestock production.
Namakwa District
A total of 92 farmers in Namakwa received support through Kamiesberg Livestock
Infrastructure.
John Taolo Gaetsewe
Solar pump for 15 farmers for productive vegetable production at Legobate Village
and 100 small stock farmers from Maipeing, Gasehunelo Wyk 6, Reries Farm,
Magojaneng and Ga-Mohitlhe villages. Installation of Line shaft and 8.3km pipeline
for 8 livestock farmers at Ashfield. Gasehunelo Wyk 6, Manaaneng, Yale Farm and
Bothitong
Municipalities Supported
The department assisted 26 local municipalities with guideline to draft commonage
policies. The following municipalities, Kgatelopele, Phokwane, Thembelihle, Karoo-
Hoogland, Kareeberg, Joe Morolong, Kheis, Khaima, Kai Garib, Siyancuma,
Siyathemba, Gamagara, Dikgatlong, Dawid Kruiper, Umsobomvu and Hantam,
Tsantsabane, Ubuntu, Renosterberg, Richtersveld, and Gasegonyana.
Four municipalities (Magareng, Emthanjeni. Namakhoi and Kamiesberg) use By-law
documents to manage commonages.
Assistance with policies and contracts:
Joe Morolong and Hantam municipalities.
Gamagara and Gasegonyana municipalities with policy frameworks
Advised Kheis municipality to issue farmers at Wegdraai, Topline and Grootdrink
commonages with lease agreements;
Karoo Hoogland municipality; transfer of use of communal rights.
Facilitated and coordinated Workshops on the draft commonage policy to farmers
in the three towns Williston, Fraserberg and Sutherland
Umsobomvu and Thembelihle municipality: PLAS application.
Kareeberg municipality Economic Viability Studies for rental fees;

95
Advised Emthanjeni Municipality to apply to the Department of Environment and
Nature Conservation for a hunting licence.
Advised Karoo Hoogland municipality not to renew the lease agreements of white
commercial farmers.
Kgatelopele (Lime Ridge), Hantam (Witsyfer), Tsanstabane (Jenn Haven) and
Siyancuma (Vaalplaas) and Graskop farmers (Kheis)
Department of Environment and Nature Conservation assisted with predator control
on different farms in Kheis, Kareeberg, Khai Garib, Siyancuma, Ubuntu,
Kgatelopele, Magareng, Joe Morolong, Khai-Ma, Gamagara, Hantam, Karoo
Hoogland and Kamiesberg, Dawid Krupper local municipalities.
Needs analysis for infrastructure development on the following farms:
MUNICIPALITIES FARMS
Kheis Wegdraai, Topline, Grootdrink, Kareelaagte, Dassiekop,Pepplar
Magareng Middelplaats
Sol Plaatje Lynplaas, Kenilworth, Paardenkamp, /Thembu, Doorns and John Weston
Khaima Coboop
Kai Garib Graskop, Brakfontein, Melkboskop
Ubuntu Loxton, Richmond and Victoria West traditional commonages
Umsobomvu Perdekop, Pokkiesfontein, Skietberg, Colesberg
Kareeberg Carnarvon commonage, Jagpan, Dubbele Vlei
Siyathemba Oranjezicht Prieska, Mooipoort Niekerkshoop, Marydale traditional, Prieska traditional, Niekerkshoop traditional
Renosterberg Philipstown traditional, Petrusville traditional, Vostersdam
Phokwane Hartswater grazing camps
Dikgatlong Rooibult
Siyancuma Vaalplaas, Ulswater
Emthanjeni Britstown traditional, De Aar traditional, Hanover traditional
Thembelihle Patriotspan, Sandbuiilt, Sunnyside
Kgatelopele Limeridge
Tstanstabane Darehope
Dawid Kruiper Klein Mier 2, Middlepos, Geisemap, Welkom traditional, Lambrechtsdrift, Karos, Leerkrans, Olynvenhoutsdrift, Hondejag Rosedale, Hondejag Pabalello
Kamiesberg Dikmatjie, Tweefontein
Richtersveld Augrabies-Oos
Hantam Witsyfer
Namakhoi Kontorogap
Karoo Hoogland Verjaarsfontein, De Riet
Joe Morolong Bowde, Surprise, Chakwane
Gasegonyana Kuruman Grazing camps
Gamagara Debeng grazing camps
96
Lease agreements/contracts:
13 are without lease agreements: (Phokwane, Dikgatlong, Hantam, Umsobomvu,
Siyancuma, Siyathemba, Renosterberg, Kai Garib, Tsantsabane and Kgatelopele and
Vosterdam (Rhenosterberg) do not have contracts with the farmers
Rental / grazing fees
Payment of grazing fees is a challengein 8 (Karoo Hoogland, Gasegonyana, Sol
Plaatje, Kareeberg, Ubuntu, Kheis, Emthanjeni and Thembelihle).
Invader species:
MUNICIPALITY / FARM SPECIES
Kgatelopele – Limeridge Vaalbos
Kareeberg – Jagpan Prosopis
Siyancuma – Vaalplaas Swarthaak
Kai Garib – Brakfontein Prosopis
Emthanjeni – Britstown traditional Prosopis
Thembelihle – Sandbuilt Prosopis
Dawid Kruiper- Welkom traditional Three Thorn
Siyathemba Prosopis
Hantam – Witsyfer Prosopis
Phokwane – Harstwater grazing camps Swarthaak
Gamagara – Debeng grazing camps Swarthaak
Kamiesberg – Tweefontein Swarthaak
Sol Plaatje – Lynplaas Swarthaak
Karoo Hoogland – Verjaarsfontein Prosopis
Fencing
Most of the commonages have poor fencing conditions.
Affected municipalities are: Kheis, Kai Garib, Renosterberg, Siyathemba and
Phokwane, Hartswater
Water shortages
Kontorogap (Namakhoi), Augrabies Oos (Richtersveld) and Tweefontein
(Kamiesberg) Namakwa District and Lambrechtsdrift, Karos and Leerkrans in the
Upington
97
Lease of White commercial farmers
Agricultural activities of white commercial farmers in Emthanjeni (sub-leasing) and
Thembelihle (mentorship) were noted with concern.
Mining activities
Siyathemba municipality alleges that illegal mining is a challenge.
Shortage of agricultural land
Phokwane is faces with shortage of enough grazing camps in the following areas.
(Hartswater, Jan Kempdorp, Ganspan and Pampierstad).
Farm management
Poor farm management is prevalent at Rooibult commonage (Dikgatlong).
Support to Land Holdings Institution
The following Restitution farms were supported; Kono, Dikgweng, CK Adams,
Ronaldsvalei, Vreede, Tsineng, Seoding, Rooiwal, Madibeng Holpan CPAs. The main
discussion was sourcing of funds through Department and Department of Land
Reform and Rural Development for infrastructure development.
Smallholder Producers Supported with Agricultural Advice
A total of 2 974 farmers received agricultural advice on various aspects of production
to improve yield and income through farmer’s days, information days and
demonstrations, site visits and meetings.
The advice included the following: PLAS Application, Grazing Management on
livestock farms, Application for MAFISA, scouting of pesticides, Financial Record
keeping in farming business, Safety and health issues in handling of raisins, Milk Goat
Production, Mentorship Programme, Livestock Improvement Programme, Correct
sugar level of grapes, layering and picking of grapes. Drought Relief, Calibration of
planter and boom sprayer, Departmental Funding Programmes, Vegetable Production

98
Information day at Pescodia, Kimberly
Agricultural Skills Development Programmes (Training)
Through CASP Funding, farmers are trained to improve farming skills and knowledge
and applying new farming technologies for optimum and increased production,
efficient and effective production
A total of 1 998 farmers received the following training:
Application of Fertilizer, Vegetable Production, Harvesting process of dates, Pre and
Post Handling of harvested grapes, Post-harvest activities of vines, Financial record
keeping, Small stock and Large stock management, Basic business skills training,
Artificial insemination of livestock, Transplanting of seedlings and fertilizer mixing, Veld
Management, Small Stock Management, Small Stock & Large Production, Boer Goat
Farming & Cattle Management.
A concerted effort from Departmental officials was made by extension practitioners,
Agricultural Economist and Scientist. Additional training was achieved through
Partnership with the following stakeholders in Grikwaland- Ws Koporatief (GWK),
Agricultural Research Council (ARC) and Department of Rural Development & Land
Reform.
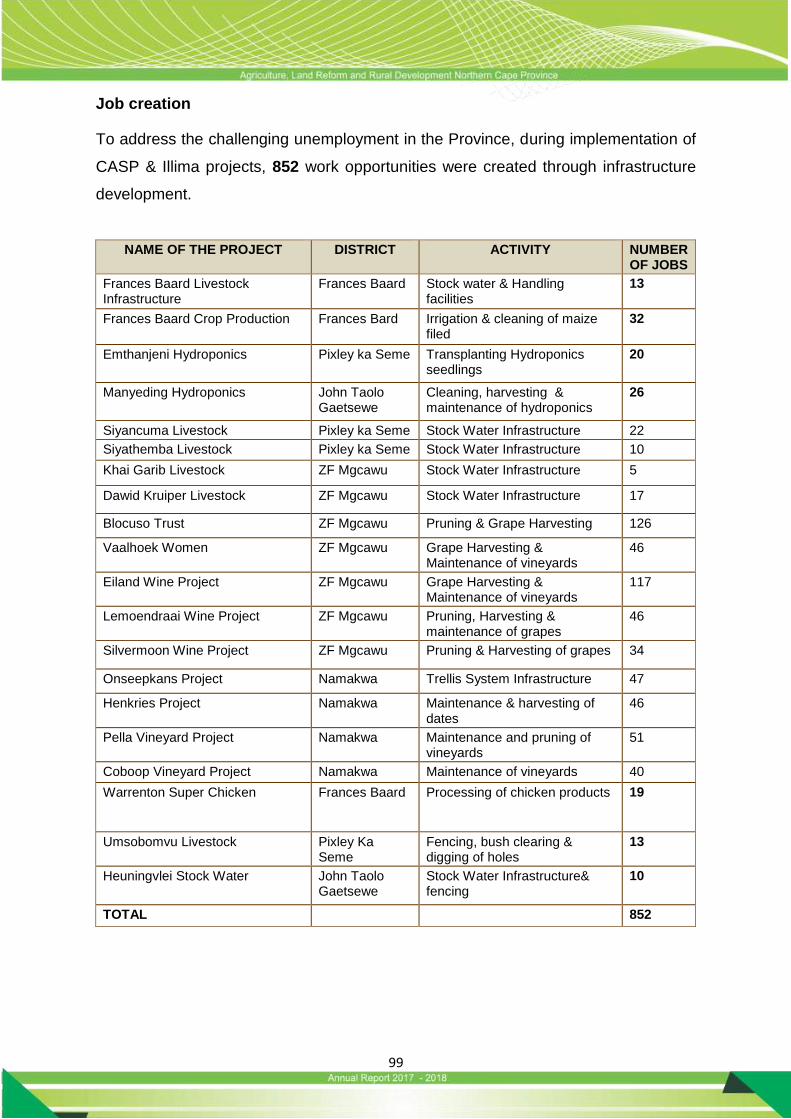
99
Job creation
To address the challenging unemployment in the Province, during implementation of
CASP & Illima projects, 852 work opportunities were created through infrastructure
development.
NAME OF THE PROJECT DISTRICT ACTIVITY NUMBER OF JOBS
Frances Baard Livestock Infrastructure
Frances Baard Stock water & Handling facilities
13
Frances Baard Crop Production Frances Bard Irrigation & cleaning of maize filed
32
Emthanjeni Hydroponics Pixley ka Seme Transplanting Hydroponics seedlings
20
Manyeding Hydroponics John Taolo Gaetsewe
Cleaning, harvesting & maintenance of hydroponics
26
Siyancuma Livestock Pixley ka Seme Stock Water Infrastructure 22
Siyathemba Livestock Pixley ka Seme Stock Water Infrastructure 10
Khai Garib Livestock ZF Mgcawu Stock Water Infrastructure 5
Dawid Kruiper Livestock ZF Mgcawu Stock Water Infrastructure 17
Blocuso Trust ZF Mgcawu Pruning & Grape Harvesting 126
Vaalhoek Women ZF Mgcawu Grape Harvesting & Maintenance of vineyards
46
Eiland Wine Project ZF Mgcawu Grape Harvesting & Maintenance of vineyards
117
Lemoendraai Wine Project ZF Mgcawu Pruning, Harvesting & maintenance of grapes
46
Silvermoon Wine Project ZF Mgcawu Pruning & Harvesting of grapes 34
Onseepkans Project Namakwa Trellis System Infrastructure 47
Henkries Project Namakwa Maintenance & harvesting of dates
46
Pella Vineyard Project Namakwa Maintenance and pruning of vineyards
51
Coboop Vineyard Project Namakwa Maintenance of vineyards 40
Warrenton Super Chicken Frances Baard Processing of chicken products 19
Umsobomvu Livestock Pixley Ka Seme
Fencing, bush clearing & digging of holes
13
Heuningvlei Stock Water John Taolo Gaetsewe
Stock Water Infrastructure& fencing
10
TOTAL 852
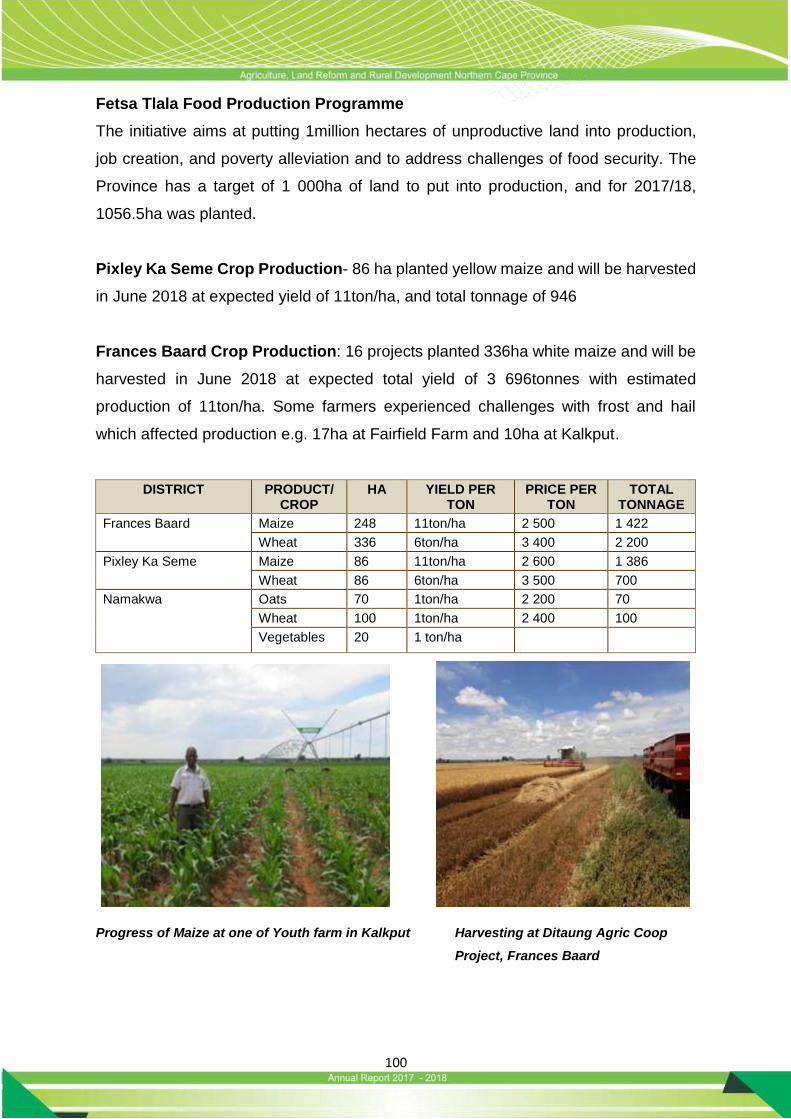
100
Fetsa Tlala Food Production Programme
The initiative aims at putting 1million hectares of unproductive land into production,
job creation, and poverty alleviation and to address challenges of food security. The
Province has a target of 1 000ha of land to put into production, and for 2017/18,
1056.5ha was planted.
Pixley Ka Seme Crop Production- 86 ha planted yellow maize and will be harvested
in June 2018 at expected yield of 11ton/ha, and total tonnage of 946
Frances Baard Crop Production: 16 projects planted 336ha white maize and will be
harvested in June 2018 at expected total yield of 3 696tonnes with estimated
production of 11ton/ha. Some farmers experienced challenges with frost and hail
which affected production e.g. 17ha at Fairfield Farm and 10ha at Kalkput.
DISTRICT PRODUCT/ CROP
HA YIELD PER TON
PRICE PER TON
TOTAL TONNAGE
Frances Baard Maize 248 11ton/ha 2 500 1 422
Wheat 336 6ton/ha 3 400 2 200
Pixley Ka Seme Maize 86 11ton/ha 2 600 1 386
Wheat 86 6ton/ha 3 500 700
Namakwa Oats 70 1ton/ha 2 200 70
Wheat 100 1ton/ha 2 400 100
Vegetables 20 1 ton/ha
Progress of Maize at one of Youth farm in Kalkput Harvesting at Ditaung Agric Coop
Project, Frances Baard
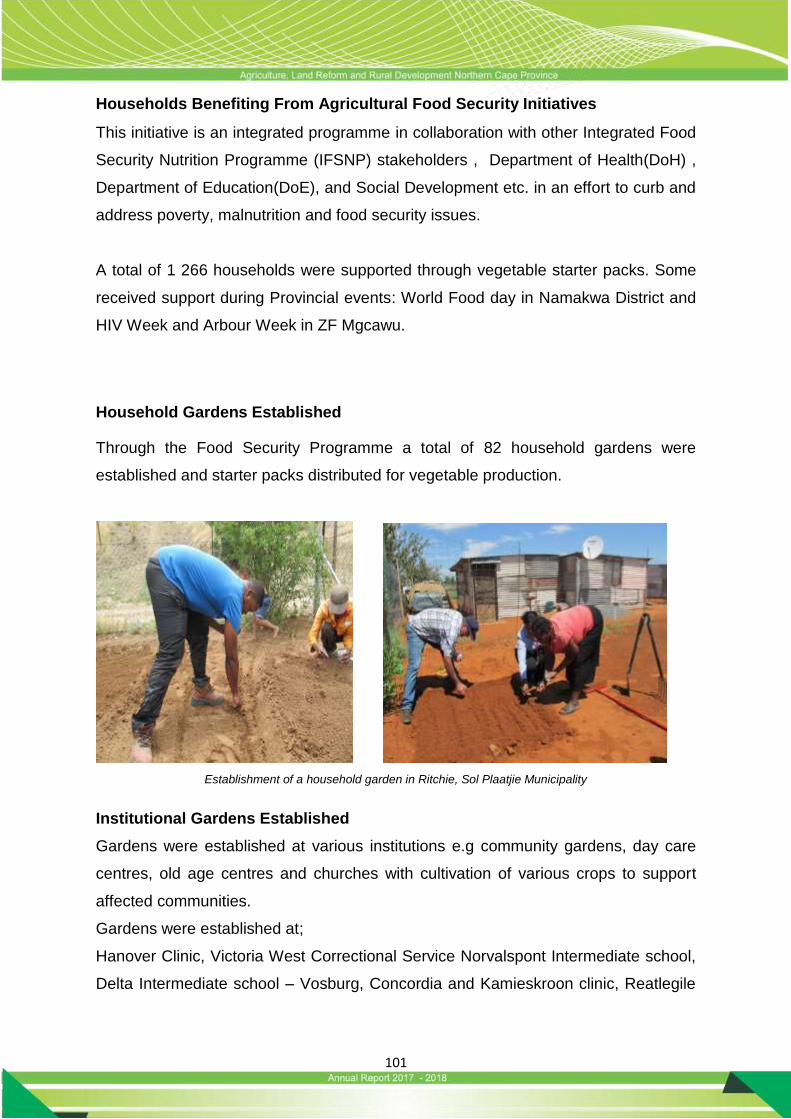
101
Households Benefiting From Agricultural Food Security Initiatives
This initiative is an integrated programme in collaboration with other Integrated Food
Security Nutrition Programme (IFSNP) stakeholders , Department of Health(DoH) ,
Department of Education(DoE), and Social Development etc. in an effort to curb and
address poverty, malnutrition and food security issues.
A total of 1 266 households were supported through vegetable starter packs. Some
received support during Provincial events: World Food day in Namakwa District and
HIV Week and Arbour Week in ZF Mgcawu.
Household Gardens Established
Through the Food Security Programme a total of 82 household gardens were
established and starter packs distributed for vegetable production.
Establishment of a household garden in Ritchie, Sol Plaatjie Municipality
Institutional Gardens Established
Gardens were established at various institutions e.g community gardens, day care
centres, old age centres and churches with cultivation of various crops to support
affected communities.
Gardens were established at;
Hanover Clinic, Victoria West Correctional Service Norvalspont Intermediate school,
Delta Intermediate school – Vosburg, Concordia and Kamieskroon clinic, Reatlegile
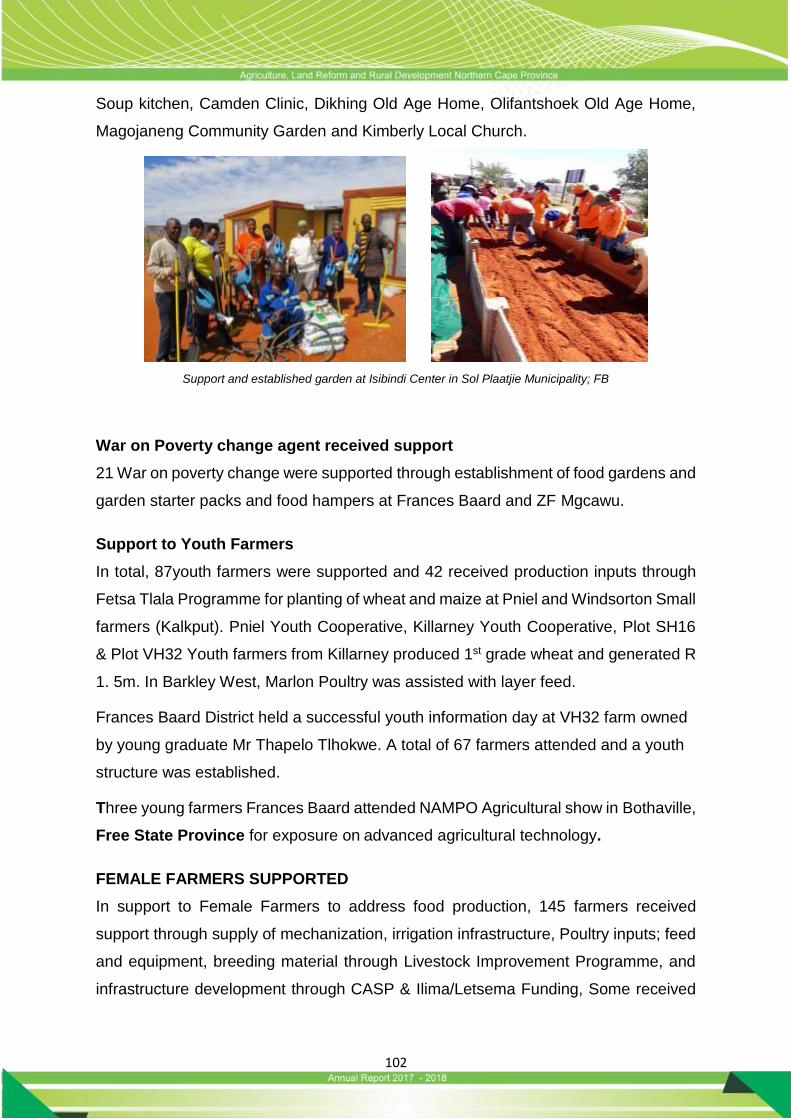
102
Soup kitchen, Camden Clinic, Dikhing Old Age Home, Olifantshoek Old Age Home,
Magojaneng Community Garden and Kimberly Local Church.
Support and established garden at Isibindi Center in Sol Plaatjie Municipality; FB
War on Poverty change agent received support
21 War on poverty change were supported through establishment of food gardens and
garden starter packs and food hampers at Frances Baard and ZF Mgcawu.
Support to Youth Farmers
In total, 87youth farmers were supported and 42 received production inputs through
Fetsa Tlala Programme for planting of wheat and maize at Pniel and Windsorton Small
farmers (Kalkput). Pniel Youth Cooperative, Killarney Youth Cooperative, Plot SH16
& Plot VH32 Youth farmers from Killarney produced 1st grade wheat and generated R
1. 5m. In Barkley West, Marlon Poultry was assisted with layer feed.
Frances Baard District held a successful youth information day at VH32 farm owned
by young graduate Mr Thapelo Tlhokwe. A total of 67 farmers attended and a youth
structure was established.
Three young farmers Frances Baard attended NAMPO Agricultural show in Bothaville,
Free State Province for exposure on advanced agricultural technology.
FEMALE FARMERS SUPPORTED
In support to Female Farmers to address food production, 145 farmers received
support through supply of mechanization, irrigation infrastructure, Poultry inputs; feed
and equipment, breeding material through Livestock Improvement Programme, and
infrastructure development through CASP & Ilima/Letsema Funding, Some received
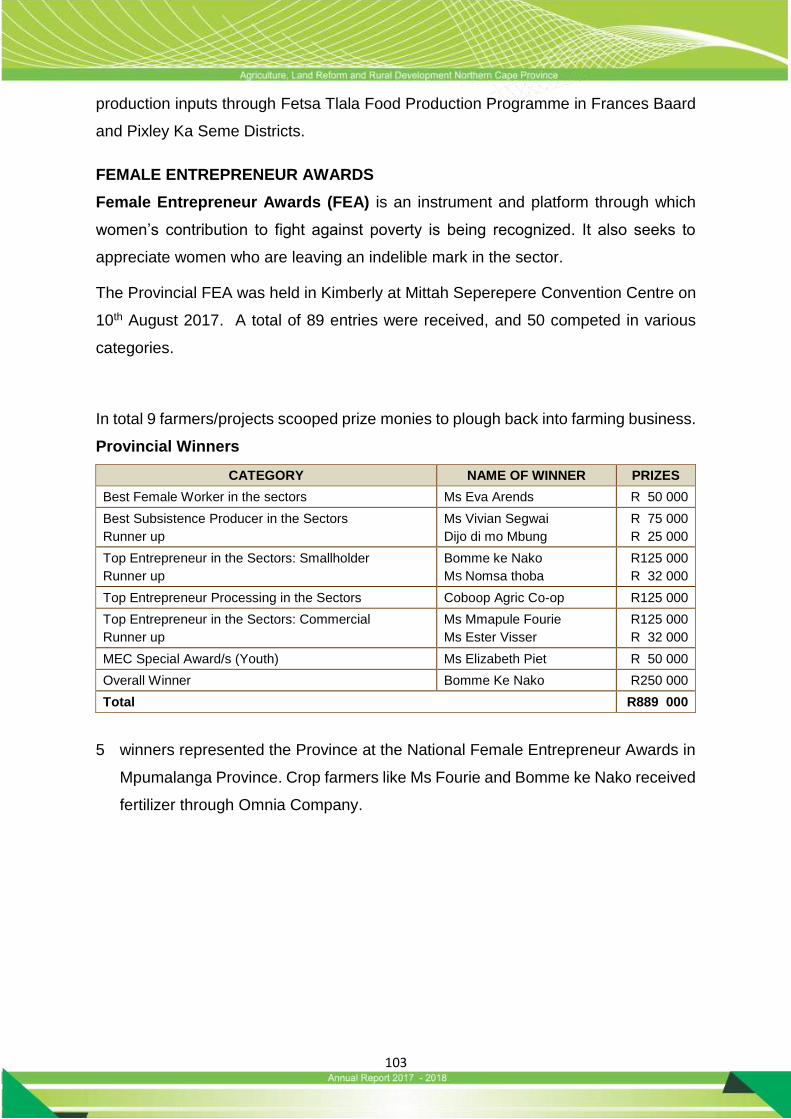
103
production inputs through Fetsa Tlala Food Production Programme in Frances Baard
and Pixley Ka Seme Districts.
FEMALE ENTREPRENEUR AWARDS
Female Entrepreneur Awards (FEA) is an instrument and platform through which
women’s contribution to fight against poverty is being recognized. It also seeks to
appreciate women who are leaving an indelible mark in the sector.
The Provincial FEA was held in Kimberly at Mittah Seperepere Convention Centre on
10th August 2017. A total of 89 entries were received, and 50 competed in various
categories.
In total 9 farmers/projects scooped prize monies to plough back into farming business.
Provincial Winners
CATEGORY NAME OF WINNER PRIZES
Best Female Worker in the sectors Ms Eva Arends R 50 000
Best Subsistence Producer in the Sectors
Runner up
Ms Vivian Segwai
Dijo di mo Mbung
R 75 000
R 25 000
Top Entrepreneur in the Sectors: Smallholder
Runner up
Bomme ke Nako
MS Nomsa thoba
R125 000
R 32 000
Top Entrepreneur Processing in the Sectors Coboop Agric Co-op R125 000
Top Entrepreneur in the Sectors: Commercial
Runner up
Ms Mmapule Fourie
Ms Ester Visser
R125 000
R 32 000
MEC Special Award/s (Youth) Ms Elizabeth Piet R 50 000
Overall Winner Bomme Ke Nako R250 000
Total R889 000
5 winners represented the Province at the National Female Entrepreneur Awards in
Mpumalanga Province. Crop farmers like Ms Fourie and Bomme ke Nako received
fertilizer through Omnia Company.
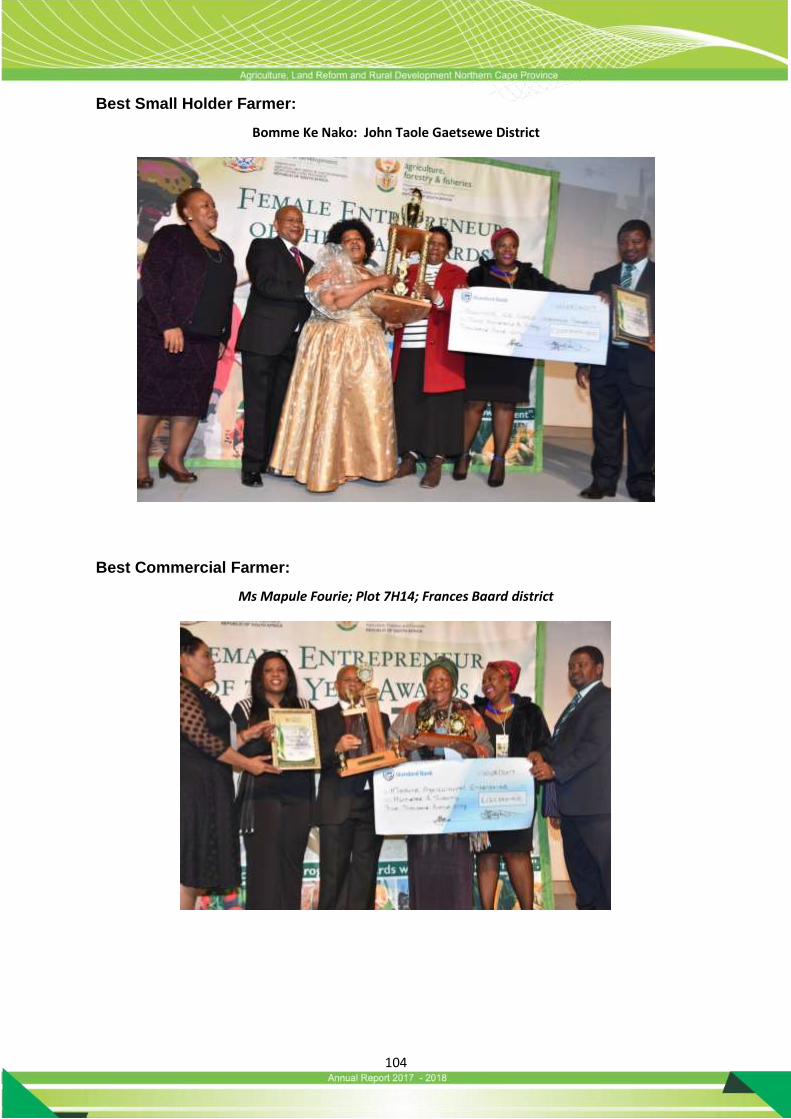
104
Best Small Holder Farmer:
Bomme Ke Nako: John Taole Gaetsewe District
Best Commercial Farmer:
Ms Mapule Fourie; Plot 7H14; Frances Baard district

105
IMPLEMENTATION OF CASP AND ILLIMA/LETSEMA PROGRAMMES
Frances Baard District
Livestock Project: Construction of 8 stock handling facilities at Waterbron, Dipitseng,
Doornkloof, Belsbank, Alpha, Rust & Vrede and Caerwining.
Mechanization Project: Delivery of 2x CASE tractors and implements including
combination tiller, wheat and maize planter and trailers at Pniel Youth Coop, Kalkput,
Moso Irrigation Farm and 5J14 for optimum crop production.
Some of implements delivered at Kalkput & Rooibult Implements delivered at 5J14 & Pniel farms
Vaalharts Revitalisation Project: Construction of 2 overnight dam at Plot 5H16 and
communal discharge line for commercial farmers in Hartswater as well as installation
of a centre pivot at Plot 5J14.
Newly installed Centre pivots at 5J14
106
John Taolo Gaetsewe District
Infrastructure Project: Construction of fence for livestock farmers for effective veldt
management.
Heuningvlei Stock water: Construction of 5 stock water systems including drilling
and equipping of boreholes, drinking troughs and reservoirs. Installation of Line
shaft and 8.3km pipeline was received by 8 livestock farmers from Ashfield in JTG
District to address challenges of stock water.
Manyeding Irrigation Farming: The project was supported with truck for
transportation of produce to the market and received a certificate of Best Producer of
tomatoes at Shoprite checkers.
Pixley Ka Seme District
Siyancuma Livestock Infrastructure: Construction of 16.km border fence at St.
Clair & Stock water reticulation & including 4 boreholes at Ulswater, both in Douglas
for provision of stock water
Umsobomvu Commonages: Construction of 14.7km border & inner fence at
Colesberg Commonage and Construction of Security gate at Intswenagazi (Moringa
Project)
Siyathemba Livestock Infrastructure: Construction of 4 km inner fence at
Koopmans Farm in Niekershoop and 3km at Koegaput and Installation of stock water
both at Driehoek and Koegaput Farms
Namakwa District
Hantam Karoo Livestock Infrastructure: Equipping of one borehole with windmill at
Klipfontein Farm and Branvlei and Equipping of one borehole at Melkraal in
Neuvodville as well as Repair and upgrading of one borehole in Witsuiper Farm in
Calvinia.
Onseepkans Irrigation Development: An advance for 47 temporary workers was
made available.
Pella Irrigation Development: Farmers received a vineyard tractor and trailer.
107
Coboop Irrigation Development: The project received advance for Wages of 40
temporary workers.
ZF Mgcawu District
Khai Garib Livestock Development: Upgrading of inner fence at Bossiekom Farm
to improve grazing potential of the farm.
Dawid Kruiper Livestock Development: Mobile handling facilities, water
reticulation and upgrading of fences for improved livestock production.
Tsantsabane Livestock Infrastructure: Construction of 18km border fencing at
Groenwater.
Vaalharts Revitalization Programme
Environmental Impact Assessment (EIA) report covering total of 32 700ha on
Vaalharts Scheme was completed.
Construction of overnight dam at 4G8 & 5H16 is still in progress and could not be
completed and to be rolled over into the new financial year; 2018/19.
Main lines covering 2 plots (farms) at 2 500km each are also complete (Plot G5 &
I6) in the Hartswater area in Phokwane Local Municipality.
To curb challenges of salinization and waterlogging, there was installation of
drainage system at the following plots: 4G8, 2G5, 5I6 & 6I6.
For effective and efficient irrigation system, Plot 5J14 received installation of
centre pivot that benefited one female farmer in the Magogong area.
Vineyard Development Programme
The objective of the project was to create opportunities for previously disadvantaged
individuals in the Northern Cape and Free State to enter the commercial wine industry
of South Africa especially production of wine, raisin and table grapes in Namakwa and
ZF Mgcawu District.
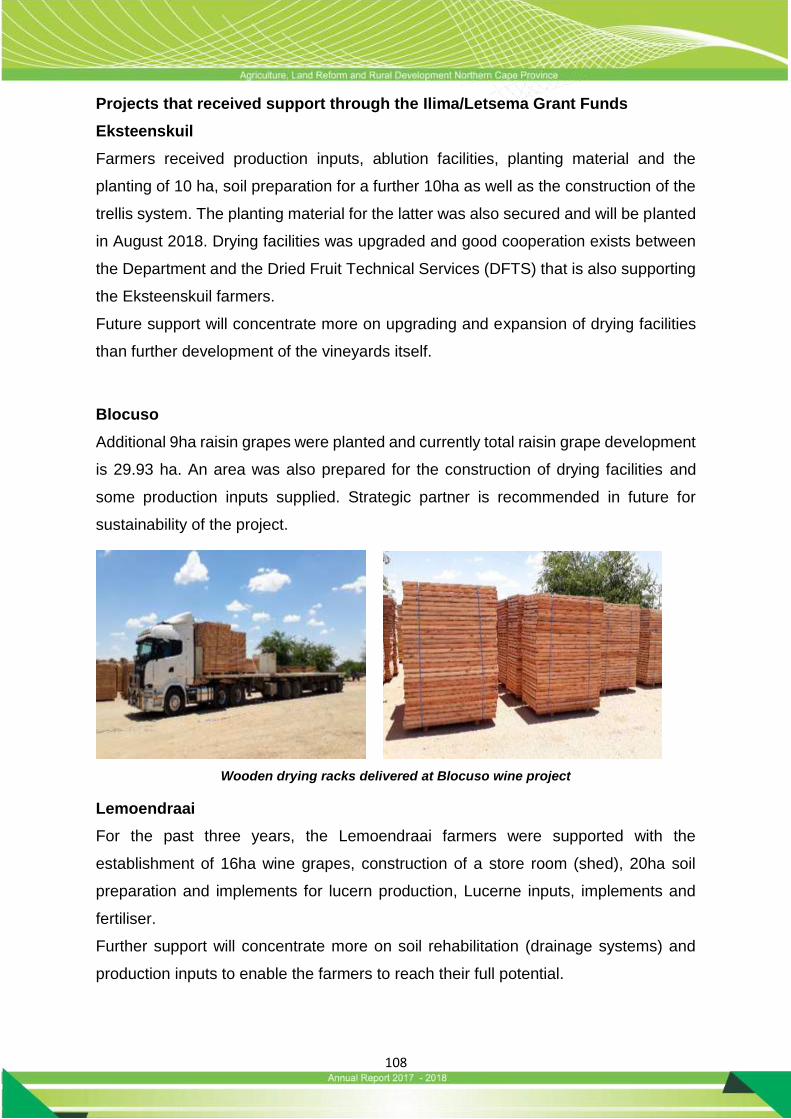
108
Projects that received support through the Ilima/Letsema Grant Funds
Eksteenskuil
Farmers received production inputs, ablution facilities, planting material and the
planting of 10 ha, soil preparation for a further 10ha as well as the construction of the
trellis system. The planting material for the latter was also secured and will be planted
in August 2018. Drying facilities was upgraded and good cooperation exists between
the Department and the Dried Fruit Technical Services (DFTS) that is also supporting
the Eksteenskuil farmers.
Future support will concentrate more on upgrading and expansion of drying facilities
than further development of the vineyards itself.
Blocuso
Additional 9ha raisin grapes were planted and currently total raisin grape development
is 29.93 ha. An area was also prepared for the construction of drying facilities and
some production inputs supplied. Strategic partner is recommended in future for
sustainability of the project.
Wooden drying racks delivered at Blocuso wine project
Lemoendraai
For the past three years, the Lemoendraai farmers were supported with the
establishment of 16ha wine grapes, construction of a store room (shed), 20ha soil
preparation and implements for lucern production, Lucerne inputs, implements and
fertiliser.
Further support will concentrate more on soil rehabilitation (drainage systems) and
production inputs to enable the farmers to reach their full potential.
109
Eiland Women
Since the start of the project, 12.9ha of wine grapes were established and for the
2017/18 financial year, only production inputs like herbicides and pesticides and
wages were procured. Future plans will concentrate more on storage facilities and
production inputs as the available land is fully developed.
Silvermoon
Support was given through production inputs, drying racks and a sulphur treatment
plant to enable farmers to add value to the raisins by producing more Goldens and
less OR raising. Further expansion of drying facilities and planting material to replace
that were destroyed by animals such as baboons and river monkeys will be required
to develop the available land to its full potential.
Namakwa Irrigation Development
The Namakwa Irrigation Development Programme was initiated in the Khai Ma local
municipal area as other areas experienced challenges with the possible construction
of the Vioolsdrift dam.
Onseepkans Irrigation development is the anchor project where the department
developed 40ha of raisin grapes; 30ha of table grapes in Pella and also 20ha raisins
in Coboop.
Coboop
The farm Coboop was purchased as Commonage and transferred to the Khai Ma
municipality. The previous farmworkers leased the 49ha of irrigation land from the
municipality for 10 years with the option to extend the lease agreement. There are
currently 300 mango trees (3ha) under production. The products are marketed as fresh
produce and the rest as dried produce and marketed locally to communities, shops
like OK Growers and Spar as well as to Fruit stalls.
Current beneficiaries are 165(85M, F 78 & 7 Youth). Training sessions were conducted
on young vines and correct sugar levels of grapes. Activities that were completed

110
included the construction of a pipeline system, construction of trellis, planting of 10ha
vines as well as the procurement of fuel.
The Department managed to established 10ha vines and harvested 8 tons wet
grapes and secured a market with Red Sun Dried fruit.
Picking of grapes during harvesting
Onseepkans Irrigation Development
Temporary workers (47) were appointed for post-harvest and the cleaning of the vines.
Farmers received training on harvesting, preparation of planting holes, correct method
of planting, suckering of young vines, pre- and post-handling of grapes, and
implementation methods of post harvesting methods. Additional information and
demonstration sessions were conducted on harvest and layering of grapes, grape
nutritional requirements and management of young vines.

111
Activities that were completed included the construction of 20ha trellis and irrigation
system, the planting of 17ha vines, the ordering of 20ha vines as well as the
procurement of a vineyard tractor and a spray machine as well as 40 temporary
workers wages were paid.
The Department managed to establishment of 40ha raisin grapes and harvested 50
tons wet grapes and a stable market was established with Red Sun Dried fruit.
Pella Irrigation Development
Pella consist of 85ha of communal land leasing for 30 years by Charlies Pass Private
Company. Beneficiaries consist of 7 directors and 30 shareholders (farmworkers),
amounting to a total of 37 beneficiaries.
Farmers received a vineyard tractor and trailer for improved vineyard development
and they were provided with training in irrigation methods, pruning and application of
fertilizer to enhance production.
Activities that were completed included the planting of 15ha vines, the procurement
of LDV, the procurement of a tractor and trailers, the purchasing of fertilizer and
herbicides as well as wages for temporary workers.
The Department managed to establish 30ha table grape vines.
Henkries
A total of 40 job opportunities were created for harvesting of the dates.
Farmers received training on the harvesting process in order to enhance their skills
and to improve date production as well as to improve the quality of the produce for
profit increase.
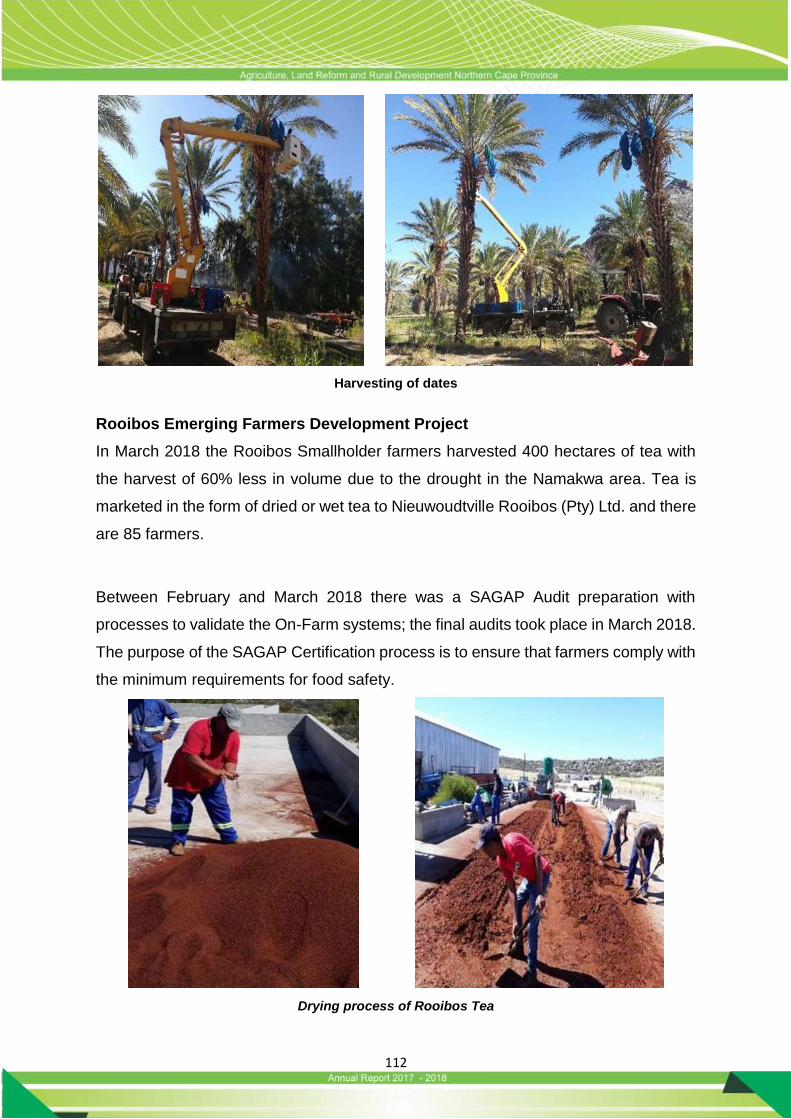
112
Harvesting of dates
Rooibos Emerging Farmers Development Project
In March 2018 the Rooibos Smallholder farmers harvested 400 hectares of tea with
the harvest of 60% less in volume due to the drought in the Namakwa area. Tea is
marketed in the form of dried or wet tea to Nieuwoudtville Rooibos (Pty) Ltd. and there
are 85 farmers.
Between February and March 2018 there was a SAGAP Audit preparation with
processes to validate the On-Farm systems; the final audits took place in March 2018.
The purpose of the SAGAP Certification process is to ensure that farmers comply with
the minimum requirements for food safety.
Drying process of Rooibos Tea
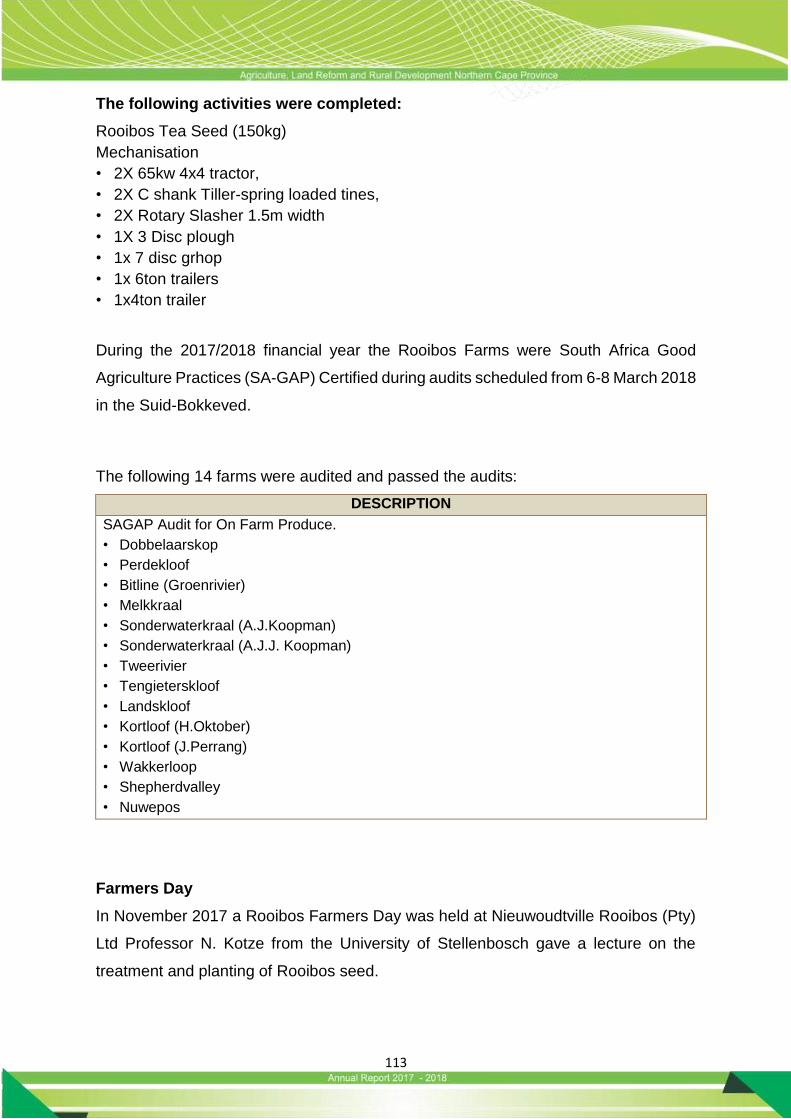
113
The following activities were completed:
Rooibos Tea Seed (150kg)
Mechanisation
• 2X 65kw 4x4 tractor,
• 2X C shank Tiller-spring loaded tines,
• 2X Rotary Slasher 1.5m width
• 1X 3 Disc plough
• 1x 7 disc grhop
• 1x 6ton trailers
• 1x4ton trailer
During the 2017/2018 financial year the Rooibos Farms were South Africa Good
Agriculture Practices (SA-GAP) Certified during audits scheduled from 6-8 March 2018
in the Suid-Bokkeved.
The following 14 farms were audited and passed the audits:
DESCRIPTION
SAGAP Audit for On Farm Produce.
• Dobbelaarskop
• Perdekloof
• Bitline (Groenrivier)
• Melkkraal
• Sonderwaterkraal (A.J.Koopman)
• Sonderwaterkraal (A.J.J. Koopman)
• Tweerivier
• Tengieterskloof
• Landskloof
• Kortloof (H.Oktober)
• Kortloof (J.Perrang)
• Wakkerloop
• Shepherdvalley
• Nuwepos
Farmers Day
In November 2017 a Rooibos Farmers Day was held at Nieuwoudtville Rooibos (Pty)
Ltd Professor N. Kotze from the University of Stellenbosch gave a lecture on the
treatment and planting of Rooibos seed.

114
Harvesting
Rooibos Smallholder farmers harvested 400 hectares between January and March
2018. The tea harvested to date was 60 percent less in volume due to the drought.
Farmers market their produce in the form of dried tea or wet tea to Nieuwoudtville
Rooibos (Pty) Ltd.
Vanderkloof Fisheries
The verification procedure consisted of a participatory process through which the list
of kraal fishers, previously provided by the chairpersons of the three towns, has been
verified by the community in public meetings organized by Masifundise Development
Trust.
Activities completed
Verification of the list of kraal fishers was completed in August 2017. Production of
the new Kraal Fisher identity cards was completed in November 2017 for regulation
of the access to the Security Zone below the dam wall as per the agreement with the
department of Water and Sanitation.
The Constitution was rectified and elections were conducted for new committees in
the three towns and process completed in December 2017.
Five employment opportunities were created i.e Fisheries official, Skipper, two decks
men and administrative clerks were appointed on a year contract through Rhodes
University and they received training. All the training provided as part of the
Vanderkloof Experimental Fishery Project contribute to the overall social goals of the
project.
The following items were procured for fishers in March 2018; Fishing gear ie. Gill
nets, long line, fyknets Ice machine, cooler boxes and freezers to support fishermen
for efficient and effective aquaculture development.
Employment Opportunities Created For Young People
Appointment of 30 young graduates is in process and will be implemented at the
beginning of the new financial year (April 2018) with additional 50 to make a total of
80 graduates. Two adverts are in process of been advertised.
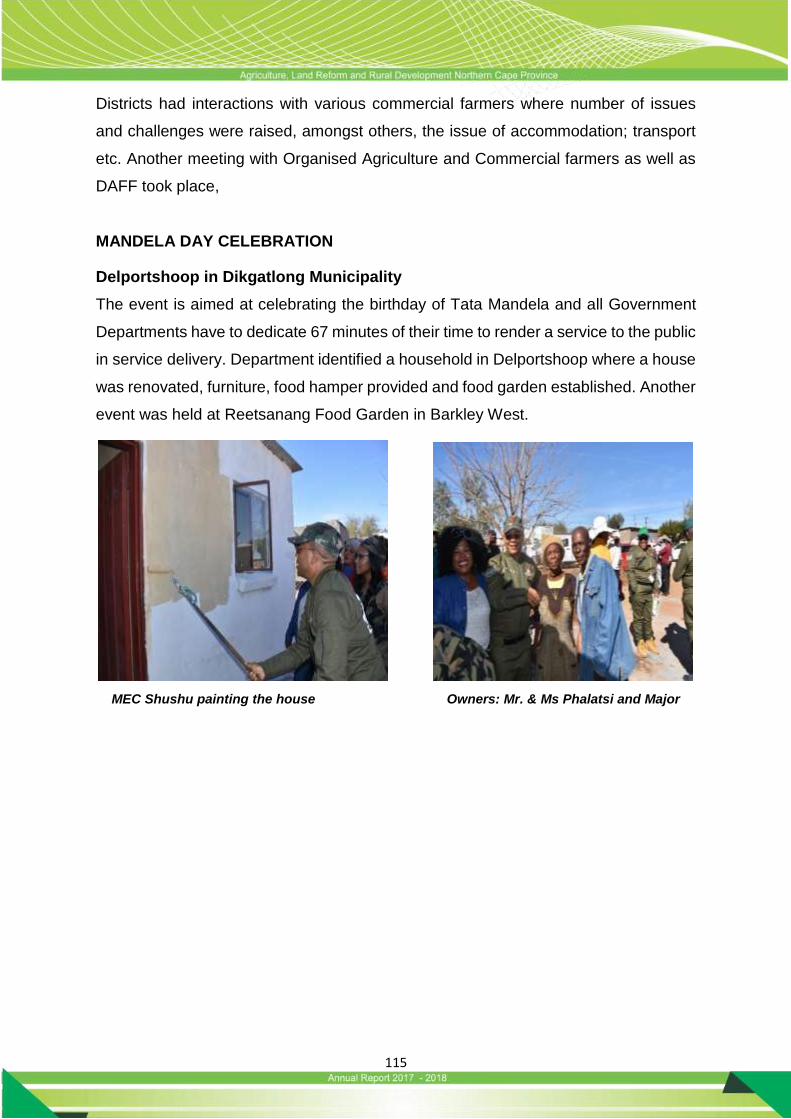
115
Districts had interactions with various commercial farmers where number of issues
and challenges were raised, amongst others, the issue of accommodation; transport
etc. Another meeting with Organised Agriculture and Commercial farmers as well as
DAFF took place,
MANDELA DAY CELEBRATION
Delportshoop in Dikgatlong Municipality
The event is aimed at celebrating the birthday of Tata Mandela and all Government
Departments have to dedicate 67 minutes of their time to render a service to the public
in service delivery. Department identified a household in Delportshoop where a house
was renovated, furniture, food hamper provided and food garden established. Another
event was held at Reetsanang Food Garden in Barkley West.
MEC Shushu painting the house Owners: Mr. & Ms Phalatsi and Major

116
ZF Mgcawu District
Painting of Local Crèche in Mier
John Taolo Gaetsewe District
The event was celebrated in a form of information sharing session at Eiffel, Klein Eiffel
and Madibeng farms with farm workers and farm dwellers. Focus was on sectorial
determination, labour issues and departmental programmes. Officials donated money
to prepare soup and bread. Vegetable hampers were donated to 15 disadvantaged
households and 3 change agents. DAFF donated 30 fruit trees and 30 shade trees
Pixley Ka Seme
The event was held in Vanwyksvlei and 12 households received Food Hampers and
60 household gardens established throughout the District
Namakwa
Mandela Day Outreach Program was held on the 18th of July 2017 in Melkkraal. The
elderly and community were supported with Blankets (10) and vegetable Starter Packs
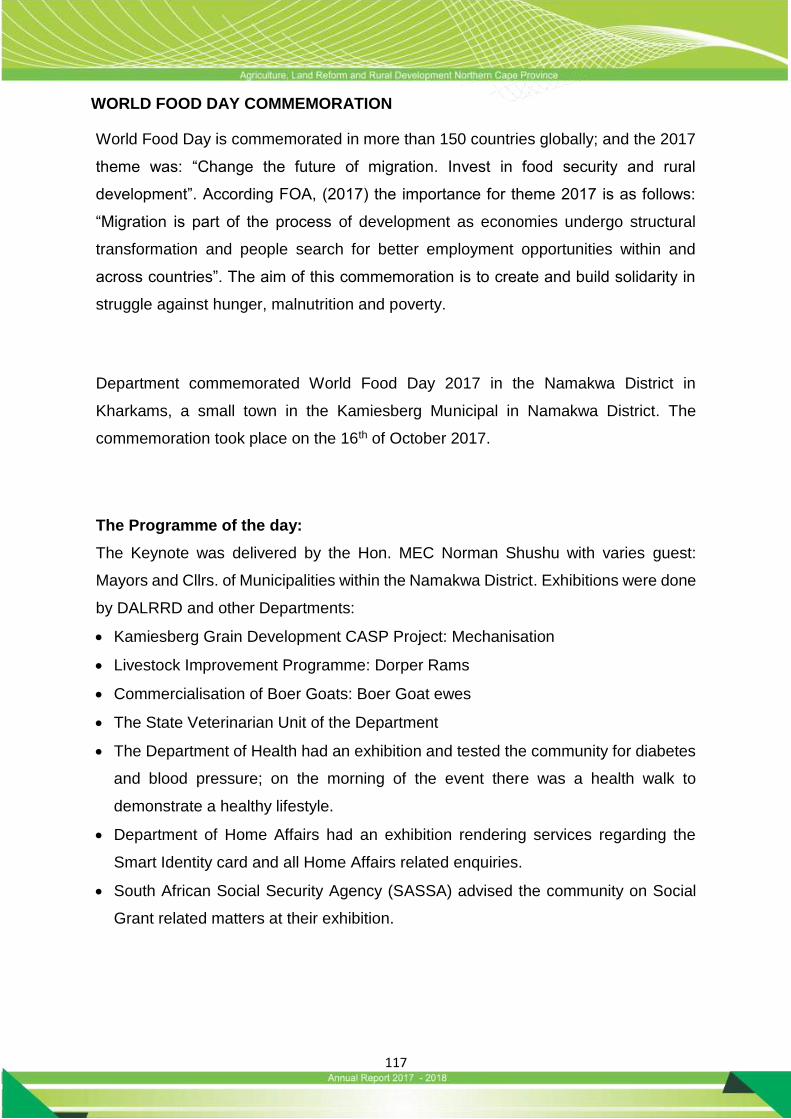
117
WORLD FOOD DAY COMMEMORATION
World Food Day is commemorated in more than 150 countries globally; and the 2017
theme was: “Change the future of migration. Invest in food security and rural
development”. According FOA, (2017) the importance for theme 2017 is as follows:
“Migration is part of the process of development as economies undergo structural
transformation and people search for better employment opportunities within and
across countries”. The aim of this commemoration is to create and build solidarity in
struggle against hunger, malnutrition and poverty.
Department commemorated World Food Day 2017 in the Namakwa District in
Kharkams, a small town in the Kamiesberg Municipal in Namakwa District. The
commemoration took place on the 16th of October 2017.
The Programme of the day:
The Keynote was delivered by the Hon. MEC Norman Shushu with varies guest:
Mayors and Cllrs. of Municipalities within the Namakwa District. Exhibitions were done
by DALRRD and other Departments:
Kamiesberg Grain Development CASP Project: Mechanisation
Livestock Improvement Programme: Dorper Rams
Commercialisation of Boer Goats: Boer Goat ewes
The State Veterinarian Unit of the Department
The Department of Health had an exhibition and tested the community for diabetes
and blood pressure; on the morning of the event there was a health walk to
demonstrate a healthy lifestyle.
Department of Home Affairs had an exhibition rendering services regarding the
Smart Identity card and all Home Affairs related enquiries.
South African Social Security Agency (SASSA) advised the community on Social
Grant related matters at their exhibition.
118
Exhibitions
Mechanization from Kamiesberg Grain Development Project, Dorper Rams from the
Livestock Improvement Programme, Boergoat Ewes Commercialization of Goats
Programme.
Boer Goats from Spoegrivier Woman Groep Some of Implements for Kamiesberg Grain
Project Visit
Kamiesberg Livestock Development CASP Project: Solar Power pump with
tanks and troughs
Kamiesberg Grain Development CASP Project: Fetsa Tlala Project where 30ha
oats was planted. Aim of Grain Development to address food security challenges
faced by Kamiesberg Community and also has sufficient fodder available for
livestock during the drier periods of the summer season.
The MEC distributed Food Security Starter Packs to 10 War on Poverty Beneficiaries
as well as 10 Food Parcels donated by the Department of Social Development.
NAME AND SURNAME TOWN NAME AND SURNAME TOWN
1. Jason Willems Kheis 6. Mieta Engelbrecht Kheis
2. Damon Dirks Klipfontein 7. Sarah Dirks Kharkams
3. Andries Isacks Kharkams 8. Piet Gouws Kharkams
4. Annie Links Kharkams 9. Johanna Brandt Kamassies
5. Johanna Beukes Kamassies 10. Dehamran Cloete Leliefontein
119
The following beneficiaries received the Food Parcels:
NAME AND SURNAME TOWN NAME AND SURNAME TOWN
1. Daisia Steenkamp Kharkams 6. Barend Beukes Kharkams
2. Elizabeth van Rooyen Kharkams 7. Andries Isacks Kharkams
3. Maria Cupido Kharkams 8. Hendrina Saul Kharkams
4. Gertruida Peddie Kharkams 9. Katrina van Niekerk Kharkams
5. Sarah Dirks Kharkams 10. Katrina Links Kharkams
EXECUTIVE OUTREACH PROGRAM IN NAMAKWA DISTRICT
Due to persistent drought in Namakwa District there was an EXCO Outreach
Programme with various role player to address challenges faced by farmers in
Namakwa.
The Departmental initiated Fodder Bank to assist livestock farmers with animal feed
during drought period. In March 2018, Department, Hantam Municipality and Karoo-
Hoogland Municipality had meetings with 61 farmers from the following towns namely:
Loeriesfontein, Brandvlei and Fraserburg.
Distribution of fodder:
Loeriesfontein: Distribution of fodder was calculated according to the current
number of livestock per farmer.
50 farmers received 56 lucerne bales: 44 received one bale each and 6 farmers
received 2 bales
Brandvlei – 25 farmers received 31 bales ( 19 farmers – 1 bale each and 6 farmers
– 2 bales
Fraserburg – 10 farmers received 12 bales ( 8 farmers – 1 bale each and 2 farmers
– 2 bales
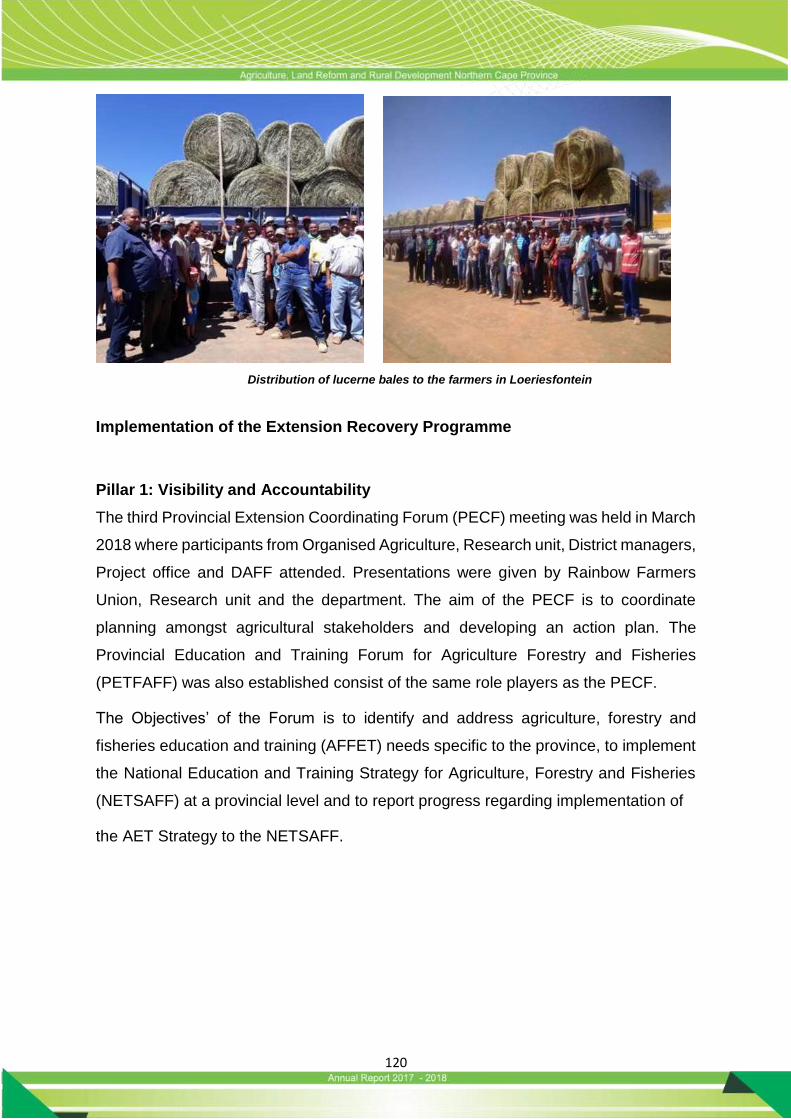
120
Distribution of lucerne bales to the farmers in Loeriesfontein
Implementation of the Extension Recovery Programme
Pillar 1: Visibility and Accountability
The third Provincial Extension Coordinating Forum (PECF) meeting was held in March
2018 where participants from Organised Agriculture, Research unit, District managers,
Project office and DAFF attended. Presentations were given by Rainbow Farmers
Union, Research unit and the department. The aim of the PECF is to coordinate
planning amongst agricultural stakeholders and developing an action plan. The
Provincial Education and Training Forum for Agriculture Forestry and Fisheries
(PETFAFF) was also established consist of the same role players as the PECF.
The Objectives’ of the Forum is to identify and address agriculture, forestry and
fisheries education and training (AFFET) needs specific to the province, to implement
the National Education and Training Strategy for Agriculture, Forestry and Fisheries
(NETSAFF) at a provincial level and to report progress regarding implementation of
the AET Strategy to the NETSAFF.
121
Provincial SASAE Activities
The Northern Cape South African Society for Agricultural Extension (SASAE)
Committee had a meeting in January 2018, in the Frances Baard district. Some of the
issues addressed were the health and safety of extension practitioners and the
member recruitment drive.
South African Council for Natural Scientific Profession (SACNASP) Registration
A total of 46 officials are currently active members of SACNASP. Officials whose
applications are still pending amounts to 17; of this 17, 11 officials have submitted all
the required documents.
Pillar 3: Recruitment
This pillar is responsible for the salary payment of 46 Extension Practitioners. No new
appointments were made.
Pillar 4: Re-skilling and Re-orientation
Tirisano Ya Bakwena provided a credit bearing computer training course, National
qualification Level(NQF) level 2&3, for extension officials. The training was held in
Kimberley, Frances Baard district where 9 extension practitioners attended. The aim
of the training was to enhance the basic computer skills of officials.
Smartpen Training
Five Smart pen training sessions were held in all districts and officials and managers
were trained in the utilisation of the digital pen. The training was provided by Xcallibre
Solutions.
In total, 45 officials attended, consisting of 26 males and 19 females. Sixteen officials
from Frances Baard, fourteen officials from John Taolo Gaetsewe, nine officials from
Namakwa and six officials from the Pixley ka Seme Districts attended.
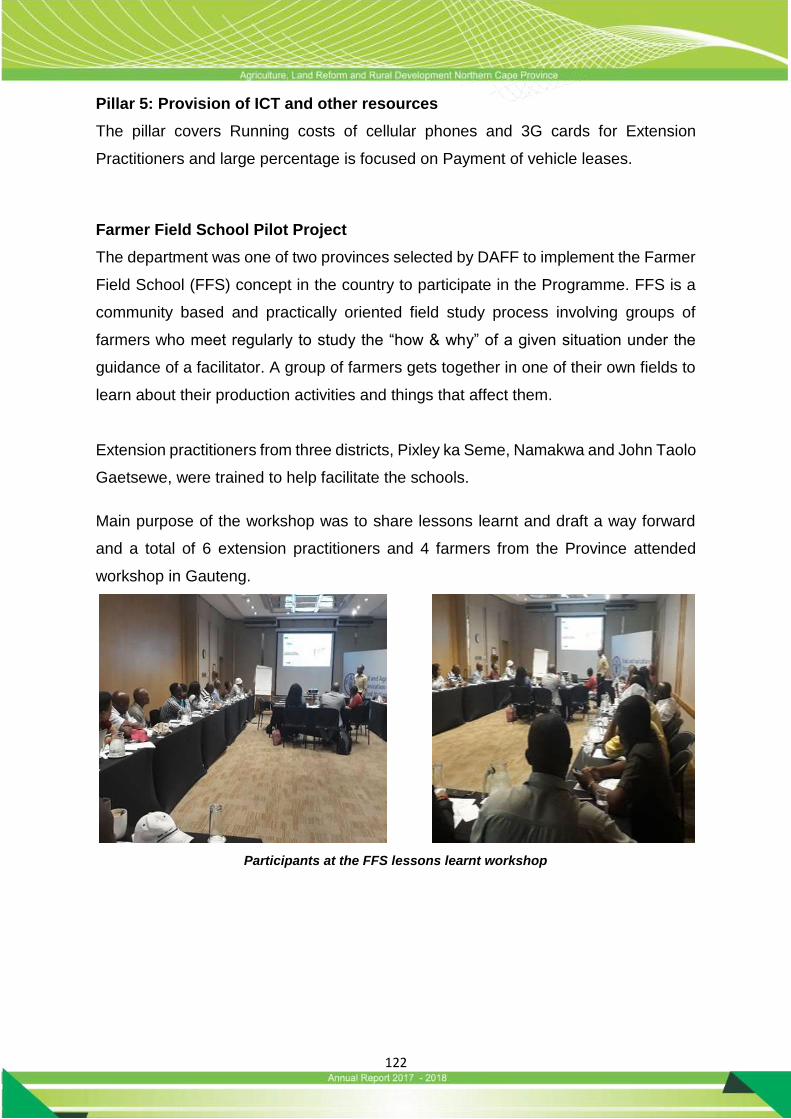
122
Pillar 5: Provision of ICT and other resources
The pillar covers Running costs of cellular phones and 3G cards for Extension
Practitioners and large percentage is focused on Payment of vehicle leases.
Farmer Field School Pilot Project
The department was one of two provinces selected by DAFF to implement the Farmer
Field School (FFS) concept in the country to participate in the Programme. FFS is a
community based and practically oriented field study process involving groups of
farmers who meet regularly to study the “how & why” of a given situation under the
guidance of a facilitator. A group of farmers gets together in one of their own fields to
learn about their production activities and things that affect them.
Extension practitioners from three districts, Pixley ka Seme, Namakwa and John Taolo
Gaetsewe, were trained to help facilitate the schools.
Main purpose of the workshop was to share lessons learnt and draft a way forward
and a total of 6 extension practitioners and 4 farmers from the Province attended
workshop in Gauteng.
Participants at the FFS lessons learnt workshop

123
124
4.4 Programme 4: Veterinary Services
Purpose: The purpose of the programme is to provide veterinary services to clients in
order to ensure healthy animals, safe animal products and welfare of people of South
Africa
Sub- Programmes:
Animal Health
Export Control
Veterinary Public Health
Veterinary Laboratory Services
Strategic Objectives:
To prevent, control and eradicate animal diseases for 6,5 million animals
through surveillance programmes, vaccination, inspections and training;
To provide 1000 health certifications for import and export of animals and
animal products;
To promote the safety of meat and meat products at harvesting level through
the registration and monitoring of abattoirs; and
To provide diagnostic services (150 000 tests) to veterinary personnel,
farmers, food processing plants and private veterinarians.
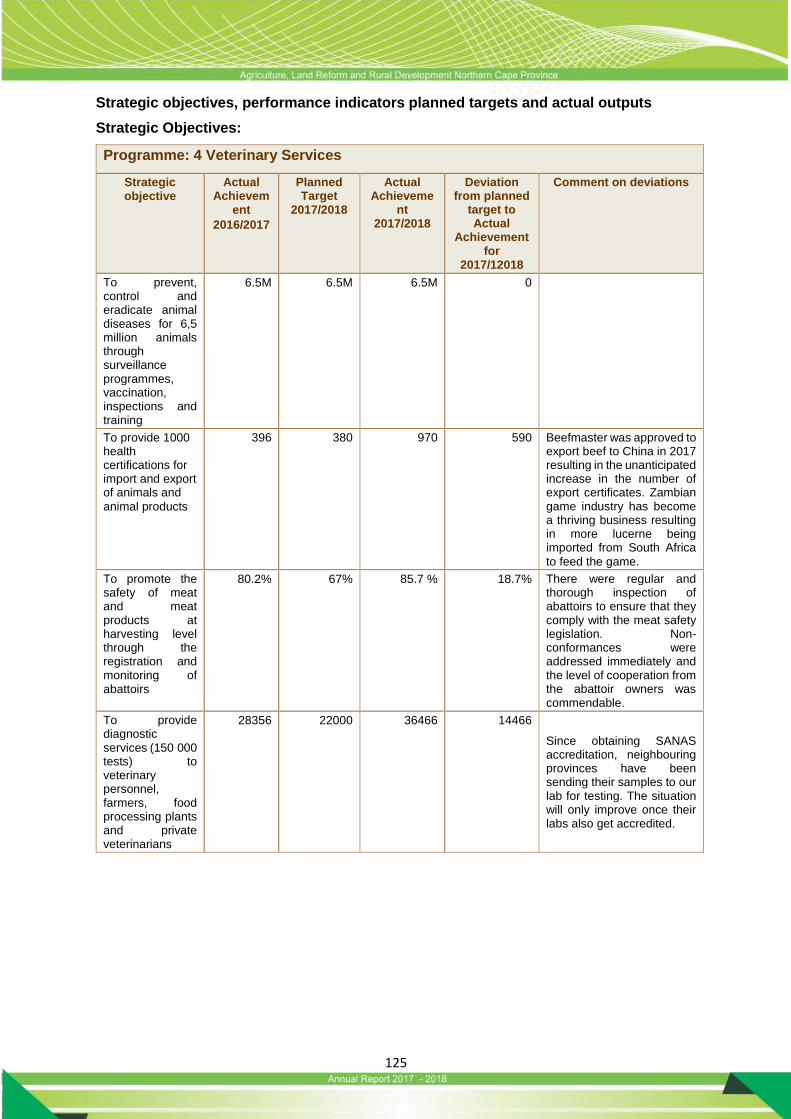
125
Strategic objectives, performance indicators planned targets and actual outputs
Strategic Objectives:
Programme: 4 Veterinary Services
Strategic objective
Actual Achievem
ent
2016/2017
Planned Target
2017/2018
Actual Achieveme
nt 2017/2018
Deviation from planned
target to Actual
Achievement for
2017/12018
Comment on deviations
To prevent, control and eradicate animal diseases for 6,5 million animals through surveillance programmes, vaccination, inspections and training
6.5M 6.5M 6.5M 0
To provide 1000 health certifications for import and export of animals and
animal products
396 380 970 590 Beefmaster was approved to export beef to China in 2017 resulting in the unanticipated increase in the number of export certificates. Zambian game industry has become a thriving business resulting in more lucerne being imported from South Africa
to feed the game.
To promote the safety of meat and meat products at harvesting level through the registration and monitoring of abattoirs
80.2% 67% 85.7 % 18.7% There were regular and thorough inspection of abattoirs to ensure that they comply with the meat safety legislation. Non-conformances were addressed immediately and the level of cooperation from the abattoir owners was commendable.
To provide diagnostic services (150 000 tests) to veterinary personnel, farmers, food processing plants and private veterinarians
28356 22000 36466 14466
Since obtaining SANAS accreditation, neighbouring provinces have been sending their samples to our lab for testing. The situation will only improve once their labs also get accredited.
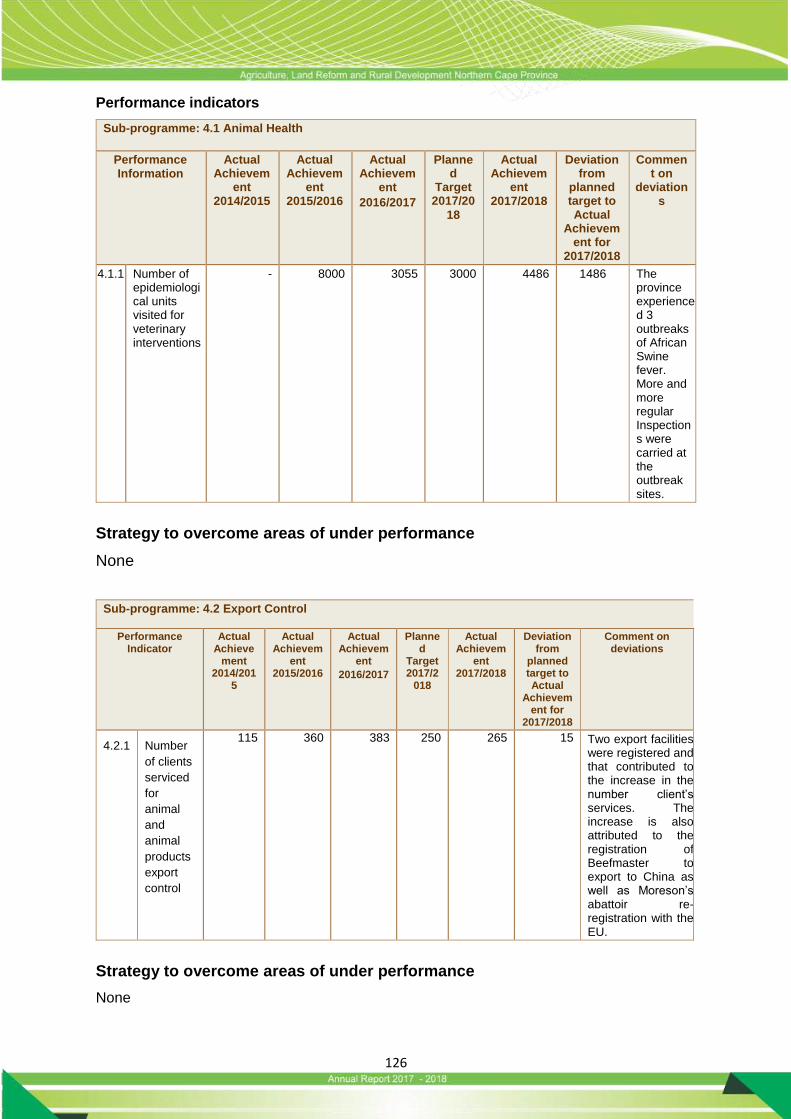
126
Performance indicators
Sub-programme: 4.1 Animal Health
Performance Information
Actual Achievem
ent 2014/2015
Actual Achievem
ent 2015/2016
Actual Achievem
ent
2016/2017
Planned
Target 2017/20
18
Actual Achievem
ent 2017/2018
Deviation from
planned target to Actual
Achievement for
2017/2018
Comment on
deviations
4.1.1 Number of epidemiological units visited for veterinary interventions
- 8000 3055 3000 4486 1486 The province experienced 3 outbreaks of African Swine fever. More and more regular Inspections were carried at the outbreak sites.
Strategy to overcome areas of under performance
None
Sub-programme: 4.2 Export Control
Performance Indicator
Actual Achieve
ment 2014/201
5
Actual Achievem
ent 2015/2016
Actual Achievem
ent
2016/2017
Planned
Target 2017/2
018
Actual Achievem
ent 2017/2018
Deviation from
planned target to Actual
Achievement for
2017/2018
Comment on deviations
4.2.1 Number
of clients
serviced
for
animal
and
animal
products
export
control
115 360 383 250 265 15 Two export facilities were registered and that contributed to the increase in the number client’s services. The increase is also attributed to the registration of Beefmaster to export to China as well as Moreson’s abattoir re-registration with the EU.
Strategy to overcome areas of under performance
None
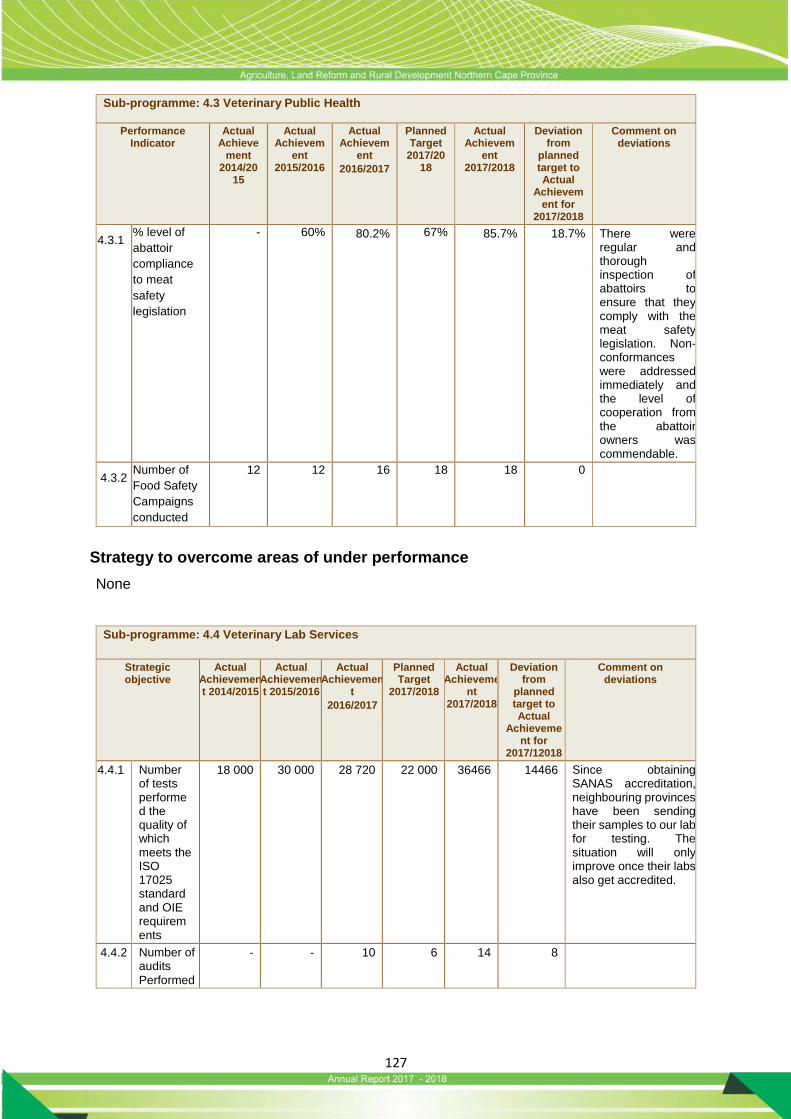
127
Sub-programme: 4.3 Veterinary Public Health
Performance Indicator
Actual Achieve
ment 2014/20
15
Actual Achievem
ent 2015/2016
Actual Achievem
ent
2016/2017
Planned Target
2017/2018
Actual Achievem
ent 2017/2018
Deviation from
planned target to Actual
Achievement for
2017/2018
Comment on deviations
4.3.1 % level of
abattoir
compliance
to meat
safety
legislation
- 60% 80.2% 67% 85.7% 18.7% There were regular and thorough inspection of abattoirs to ensure that they comply with the meat safety legislation. Non-conformances were addressed immediately and the level of cooperation from the abattoir owners was commendable.
4.3.2 Number of
Food Safety
Campaigns
conducted
12 12 16 18 18 0
Strategy to overcome areas of under performance
None
Sub-programme: 4.4 Veterinary Lab Services
Strategic objective
Actual Achievement 2014/2015
Actual Achievement 2015/2016
Actual Achievemen
t
2016/2017
Planned Target
2017/2018
Actual Achieveme
nt 2017/2018
Deviation from
planned target to Actual
Achievement for
2017/12018
Comment on deviations
4.4.1 Number of tests performed the quality of which meets the ISO 17025 standard and OIE requirements
18 000 30 000 28 720 22 000 36466 14466 Since obtaining SANAS accreditation, neighbouring provinces have been sending their samples to our lab for testing. The situation will only improve once their labs also get accredited.
4.4.2 Number of audits
Performed
- - 10 6 14 8
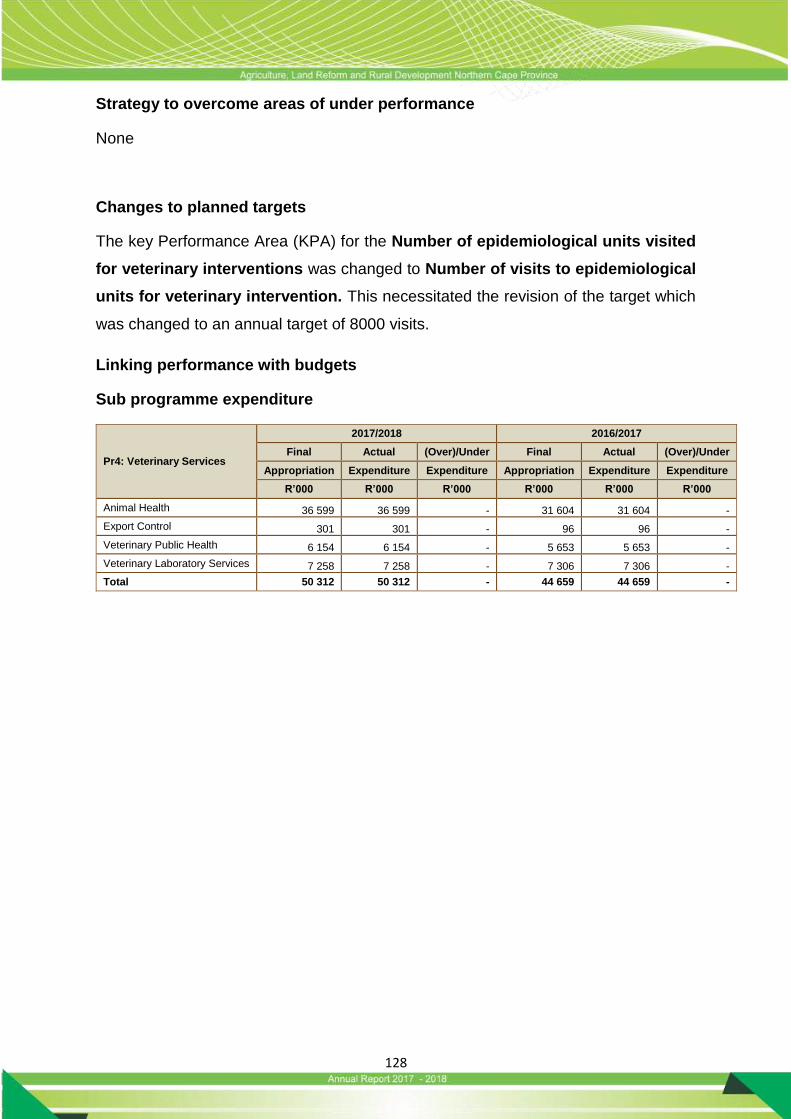
128
Strategy to overcome areas of under performance
None
Changes to planned targets
The key Performance Area (KPA) for the Number of epidemiological units visited
for veterinary interventions was changed to Number of visits to epidemiological
units for veterinary intervention. This necessitated the revision of the target which
was changed to an annual target of 8000 visits.
Linking performance with budgets
Sub programme expenditure
Pr4: Veterinary Services
2017/2018 2016/2017
Final Actual (Over)/Under Final Actual (Over)/Under
Appropriation Expenditure Expenditure Appropriation Expenditure Expenditure
R’000 R’000 R’000 R’000 R’000 R’000
Animal Health 36 599 36 599 - 31 604 31 604 -
Export Control 301 301 - 96 96 -
Veterinary Public Health 6 154 6 154 - 5 653 5 653 -
Veterinary Laboratory Services 7 258 7 258 - 7 306 7 306 -
Total 50 312 50 312 - 44 659 44 659 -
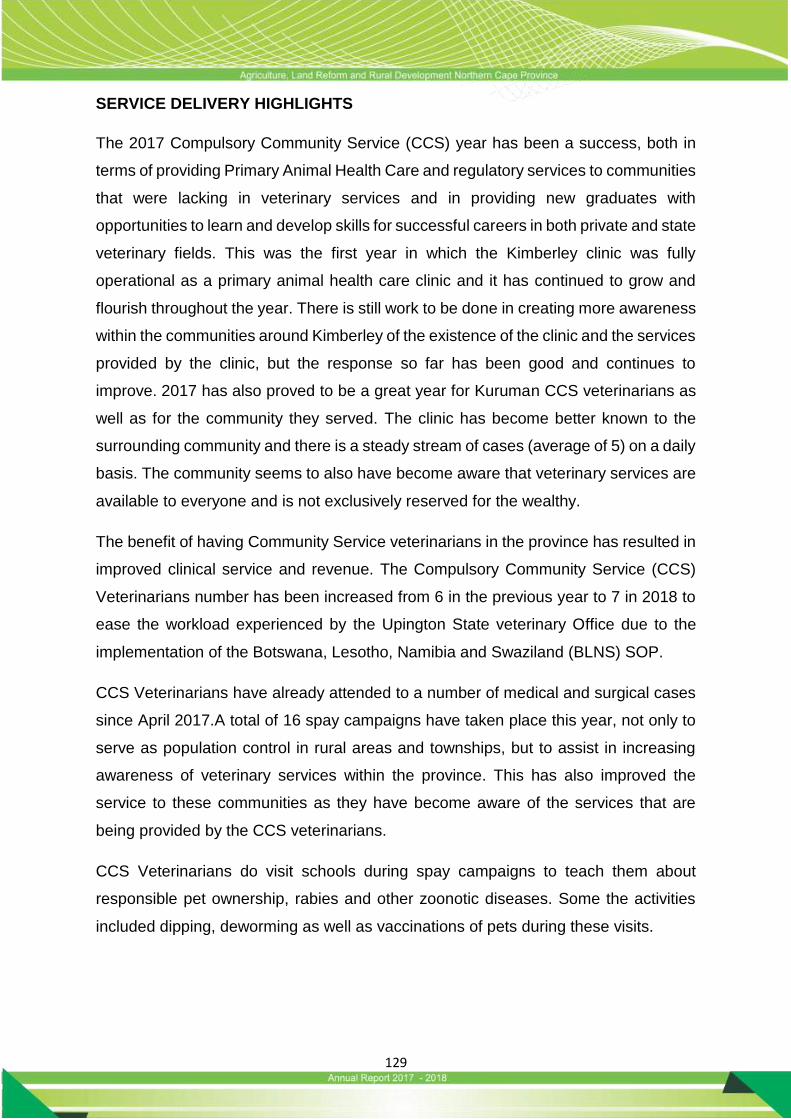
129
SERVICE DELIVERY HIGHLIGHTS
The 2017 Compulsory Community Service (CCS) year has been a success, both in
terms of providing Primary Animal Health Care and regulatory services to communities
that were lacking in veterinary services and in providing new graduates with
opportunities to learn and develop skills for successful careers in both private and state
veterinary fields. This was the first year in which the Kimberley clinic was fully
operational as a primary animal health care clinic and it has continued to grow and
flourish throughout the year. There is still work to be done in creating more awareness
within the communities around Kimberley of the existence of the clinic and the services
provided by the clinic, but the response so far has been good and continues to
improve. 2017 has also proved to be a great year for Kuruman CCS veterinarians as
well as for the community they served. The clinic has become better known to the
surrounding community and there is a steady stream of cases (average of 5) on a daily
basis. The community seems to also have become aware that veterinary services are
available to everyone and is not exclusively reserved for the wealthy.
The benefit of having Community Service veterinarians in the province has resulted in
improved clinical service and revenue. The Compulsory Community Service (CCS)
Veterinarians number has been increased from 6 in the previous year to 7 in 2018 to
ease the workload experienced by the Upington State veterinary Office due to the
implementation of the Botswana, Lesotho, Namibia and Swaziland (BLNS) SOP.
CCS Veterinarians have already attended to a number of medical and surgical cases
since April 2017.A total of 16 spay campaigns have taken place this year, not only to
serve as population control in rural areas and townships, but to assist in increasing
awareness of veterinary services within the province. This has also improved the
service to these communities as they have become aware of the services that are
being provided by the CCS veterinarians.
CCS Veterinarians do visit schools during spay campaigns to teach them about
responsible pet ownership, rabies and other zoonotic diseases. Some the activities
included dipping, deworming as well as vaccinations of pets during these visits.
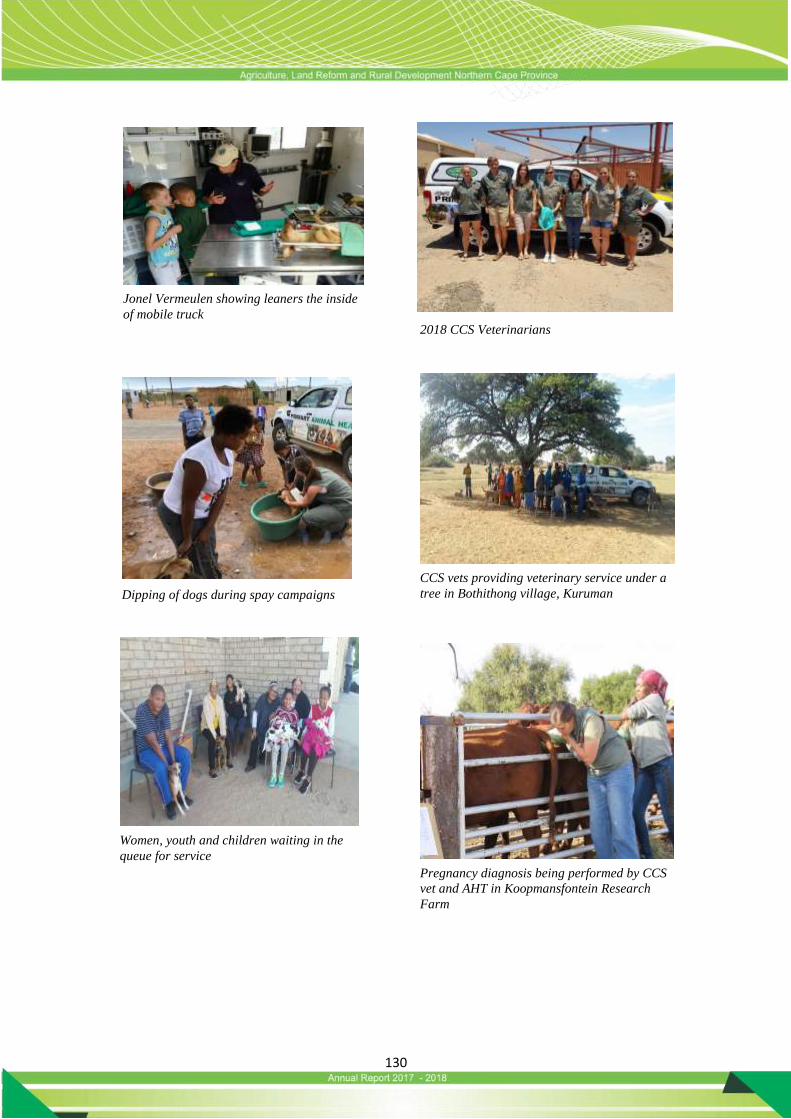
130
Jonel Vermeulen showing leaners the inside
of mobile truck
2018 CCS Veterinarians
Dipping of dogs during spay campaigns
CCS vets providing veterinary service under a
tree in Bothithong village, Kuruman
Pregnancy diagnosis being performed by CCS
vet and AHT in Koopmansfontein Research
Farm
Women, youth and children waiting in the
queue for service
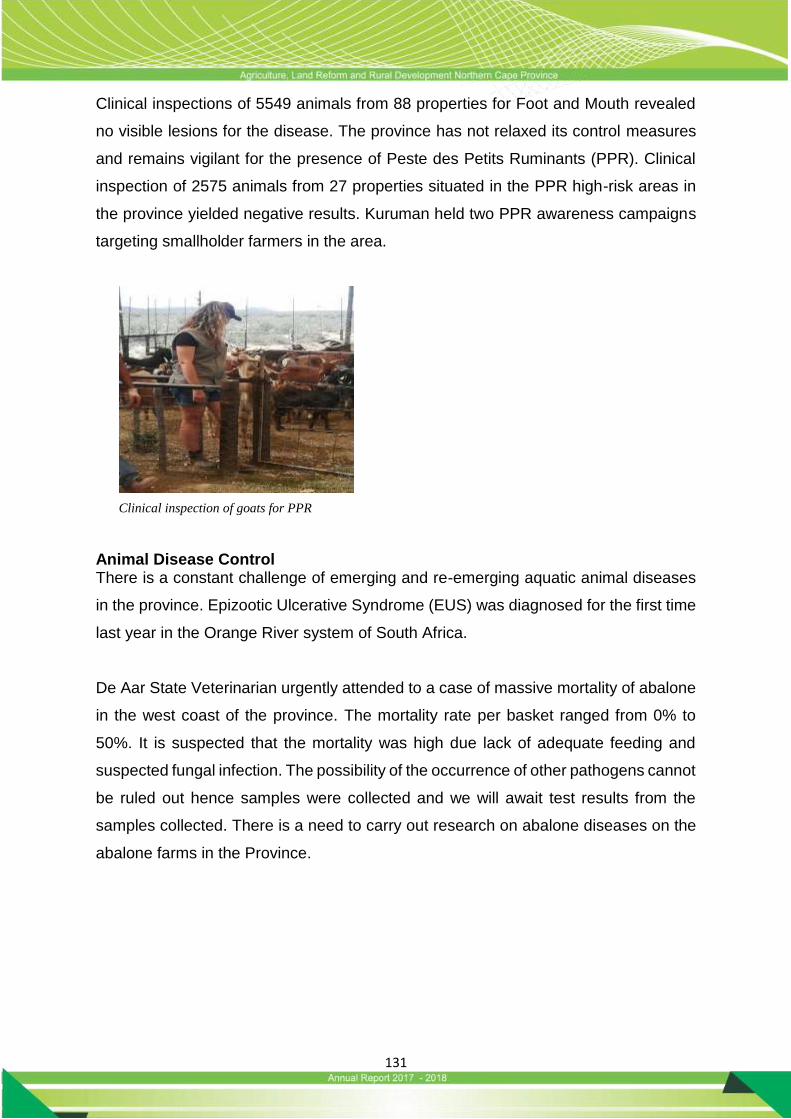
131
Clinical inspections of 5549 animals from 88 properties for Foot and Mouth revealed
no visible lesions for the disease. The province has not relaxed its control measures
and remains vigilant for the presence of Peste des Petits Ruminants (PPR). Clinical
inspection of 2575 animals from 27 properties situated in the PPR high-risk areas in
the province yielded negative results. Kuruman held two PPR awareness campaigns
targeting smallholder farmers in the area.
Animal Disease Control There is a constant challenge of emerging and re-emerging aquatic animal diseases
in the province. Epizootic Ulcerative Syndrome (EUS) was diagnosed for the first time
last year in the Orange River system of South Africa.
De Aar State Veterinarian urgently attended to a case of massive mortality of abalone
in the west coast of the province. The mortality rate per basket ranged from 0% to
50%. It is suspected that the mortality was high due lack of adequate feeding and
suspected fungal infection. The possibility of the occurrence of other pathogens cannot
be ruled out hence samples were collected and we will await test results from the
samples collected. There is a need to carry out research on abalone diseases on the
abalone farms in the Province.
Clinical inspection of goats for PPR
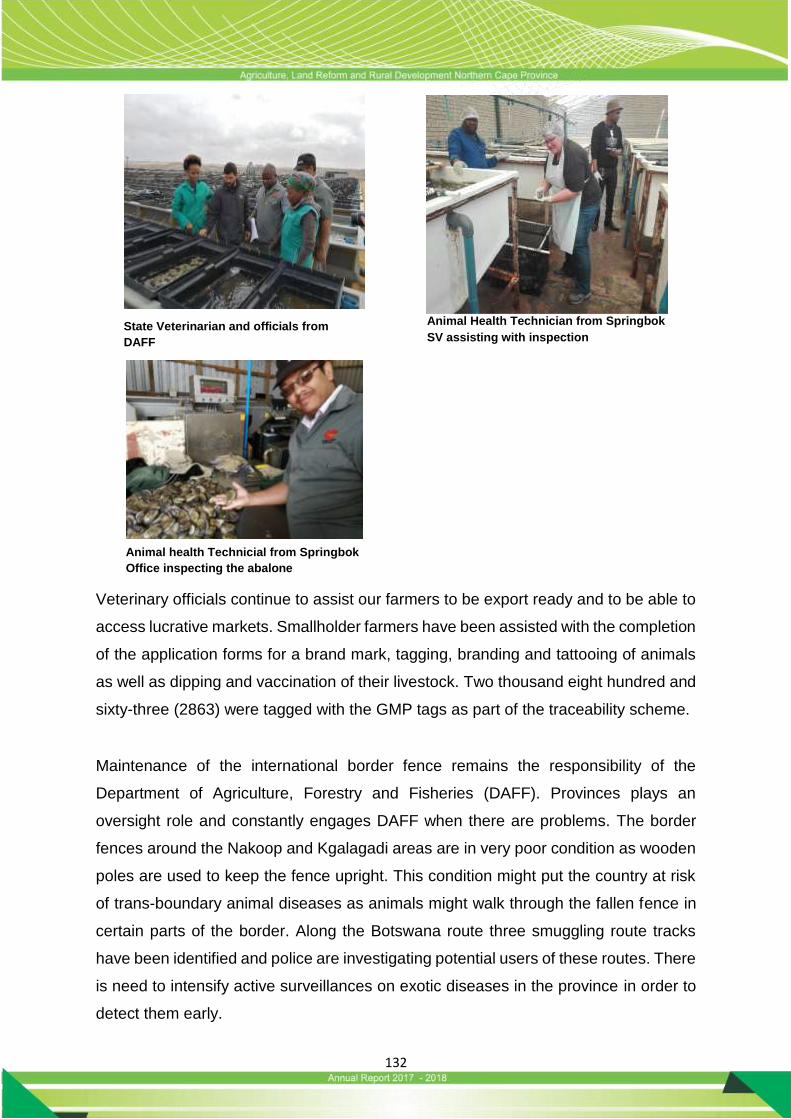
132
Veterinary officials continue to assist our farmers to be export ready and to be able to
access lucrative markets. Smallholder farmers have been assisted with the completion
of the application forms for a brand mark, tagging, branding and tattooing of animals
as well as dipping and vaccination of their livestock. Two thousand eight hundred and
sixty-three (2863) were tagged with the GMP tags as part of the traceability scheme.
Maintenance of the international border fence remains the responsibility of the
Department of Agriculture, Forestry and Fisheries (DAFF). Provinces plays an
oversight role and constantly engages DAFF when there are problems. The border
fences around the Nakoop and Kgalagadi areas are in very poor condition as wooden
poles are used to keep the fence upright. This condition might put the country at risk
of trans-boundary animal diseases as animals might walk through the fallen fence in
certain parts of the border. Along the Botswana route three smuggling route tracks
have been identified and police are investigating potential users of these routes. There
is need to intensify active surveillances on exotic diseases in the province in order to
detect them early.
Animal health Technicial from Springbok
Office inspecting the abalone
State Veterinarian and officials from
DAFF
Animal Health Technician from Springbok
SV assisting with inspection

133
CONTROLLED AND NOTIFIABLE DISEASES 2017/2018 saw the Calvinia District entering its 3rd year of subnormal rainfall. The
widespread drought conditions are continuing to add pressure to farmers and animals
alike. Widespread feeding of animals has become the norm and this intensification
around feeding points has given rise to an increase of diseases like Pasteurella
Pneumonia, E. coli septicaemia in lambs and botulism where animals seeks nutrients
in old bones of the increasing amount of carcasses. Despite the dry conditions, the
Fishriver between Calvinia and Williston had some water late in 2016 and the farms
along the river experienced one of the worst outbreaks of bluetongue during April and
May of 2017.
Sheep Scab still remains a disease of concern in the sheep farming areas of the
Province. So far, 101 494 (104 properties) sheep have been inspected and 6 347
treated for Sheep Scab. During spring the Department saw a sheep scab outbreak
near Loeriesfontein in an area where stock migration between winter and summer
grazing farms are still practised. Even though only a few positive animals were
involved the inspection area was massive and time consuming.
African Swine Fever (ASF) The Province reported the occurrence of African Swine Fever in Pniel, Alfa and Gong
Gong in 2017. All the three African Swine Fever (AFS) outbreaks were formally closed
out as of 10 November 2017. Stamping out, quarantine, movement controls of pigs
and pig products and community education were some of the control measures. Soft
ticks’ samples from burrows on Alfa Farm came back negative for the virus. Based on
minimal surveillance on 7 tampans obtained in a nesting burrow, African Swine Fever
infection has been demonstrated not to be present in the host ticks. Compensation
paid for the 14 pigs culled through euthanasia in Pniel as a stamp out measure
amounted to R7 000.00. This is a welcoming development as it improved relations
between the Department and the community. 265 (Pniel 59, Alfa 43 and Gong-Gong
170) pigs are estimated to have died of the disease amounting to R132 500.00
financial loss.
The Molecular Epidemiology (ME) of the three African Swine Fever (ASF) outbreaks
shows the need for constant sharpening of early warning and detection systems
especially with regards to high impact diseases. The Pniel and Gong Gong outbreaks
are related at Molecular Epidemiology to the outbreaks in the Free State.
134
African Horse Sickness (AHS)
There have been a number of reported African Horse Sickness outbreaks in horses in
the Province mainly due to AHSV2. There were mortalities but other horses recovered.
This disease is severely underreported as private veterinarians later on confirmed that
closer to 150 animals succumbed to the disease in 2017. This is quite worrying and
shows that there is need for education of horse owners. Direct movements of horses
to the AHS free zone of the Western Cape were stopped and periodic AHS freedom
declaration issued to the State Veterinarian Boland were withdrawn.
The following state veterinary areas reported positive cases of AHS namely; Kuruman
(2), Calvinia (1) and De Aar that recorded 4 cases. Horse owners were advised to
The map depicting ASF outbreak sites
A horse that died of African Horse Sickness (AHS)
135
vaccinate their horses. 279 vaccinations were carried out against African Horse
Sickness.
Bovine Brucellosis The Province is starting to pick up Brucellosis positive cases in communal farms in the
John Taolo Gaetsewe area which is our main cattle farming area. From the 18 herds
(1418 cattle) that were tested, only one herd had positive reactors. The farmer has
undertaken to work together with veterinary officials during the testing and
slaughtering exercise as per the protocol. Eradicating the disease in communal areas
remains a challenge as it is difficult to place infected herds under quarantine.
The Kuruman Office excelled in eradicating Bovine Brucellosis on various farms (8
farms in total). Some of these farms have been under quarantine for many years. The
farmers in the area are starting to buy into the idea of having their animals tested which
makes controlling the disease much easier. 15325 cattle were tested for brucellosis
while 64 were vaccinated using strain 19 vaccine.
Bovine Tuberculosis (BTB) One buffalo bull at a farm in Phokwane was culled following two consecutive positive
reactions on the comparative intradermal tuberculin test (CITT). On post-mortem, the
bull had granulomatous lesions in the lungs consistent with infection with a tubercle
causing mycobacterium. On culture, Oryx bacillus was cultured. This tubercle causing
pathogen mainly affects antelopes. This is the second case in the country noted of
Oryx bacillus infection in buffaloes. The tuberculosis testing of buffaloes on the
following culture positive specimens for Oryx bacillus are ongoing.

136
3 buffalo farms had their quarantine lifted after the 5 consecutive comparative
intradermal tuberculin (CITT) test results were negative for TB. One farm had the
quarantine lifted by the Northern Cape High Court following numerous court
challenges.
Rabies World Rabies Day celebrations were held in Kimberley on the 28th of September 2017.
The build up to the day involved community outreaches and vaccination of pets against
rabies.
School outreaches were undertaken raising rabies awareness and education. A school
event attended by seven schools was held with competition and prize giving in poetry,
drama and poster art. Montshiwa Primary school was the overall winner with the
Kimberley Islamic School coming second and Venus primary school in third position.
A Scientific evening was held with three keynote speakers presenting on rabies.
Testing of buffalo Capturing of buffalo
137
The event was attended by health and allied professionals in and around Kimberley.
The Norther Cape Province as part of the Rabies Campaign managed to vaccinate
33 431 animals against rabies.
Leaners attending the rabies school event
Leaner rendering a poem on rabies
MEC Norman Shushu addressing the audience at the Rabies Scientific Evening
The audience at the Rabies Scientific Evening
Presenters at the Rabies Scientific Evening:
LR - Dr Shumba, Prof Blumberg, Dr Sabeta
Figure 1: Dr Mpho Maja, National Director from DAFF receiving a present from the Hon. MEC N
Shushu
138
Anthrax The annual Anthrax vaccination in the anthrax endemic area of the Ghaap Plateau
was undertaken. Six thousand three hundred and seventy-two (6 372) animals were
vaccinated.
In total, 12 513 cattle have been vaccinated in the province by Departmental officials.
Radio interview was hosted on popular radio station (Motsweding Fm) to conscientize
the listeners about Anthrax Disease.
Avian influenza (AI) Northern Cape is the only province that has not been affected by Highly Pathogenic
Avian Influenza (HPAI) H5N8. As at March 2017, more than 150 locations had been
identified that tested positive for Highly Pathogenic Avian Influenza (HPAI) H5N8 since
the first case of HPAI was confirmed in a broiler breeder operation near Villiers,
Mpumalanga.
The Province has at least 26 ostrich compartments and about 10 commercial poultry
establishments which have strict biosecurity measures in place. Warrenton Super
Chicken is one of the 10 commercial poultry establishments which has Departmental
support. The assistance the Department rendered at this facility has reduced the threat
of Avian Influenza.
The Province partakes in the Avian Influenza (AI) National Surveillance Scheme which
is reported every 6 months to DAFF. In total, 2 838 samples from 146 properties were
tested in 2017/18. Through this programme 17 Low Pathogenic Avian Influenza (LPAI)
reactors have been picked up in Springbok and Calvinia areas were classified as low
risk cases.
The fact that the outbreak has been confirmed in wild birds in the country calls for
increased surveillance in this group of birds. Surveillance programmes took the
Veterinary Epidemiology team in the Province to high risk areas such as the Warrenton
Weir and Van Der Kloof Dam to identify perching and breeding sites of migratory birds
and unusual mortalities in susceptible species. Fortunately, no unusual mortalities
were witnessed in the province.
139
During an inspection at a poultry farm in De Aar, the Animal Health Technician saw a
lot of dead pigeons. Samples were sent to Onderstepoort Veterinary Institute and
Pigeon Paramyxovirus was diagnosed. This was a great relief to the farmer as this
viral disease does not affect poultry.
Rift Valley Fever (RVF) The De Aar Office reported a case of Rift Valley Fever on a farm in Colesburg. The
Polymerase Chain Reaction test result was positive for Rift Valley Fever but upon
further investigation, it was concluded that this was purely vaccine strain reaction and
not the wild strain reaction. As a result, no control measures were put in place.
However, farmers are still advised to vaccinate their livestock against Rift Valley Fever
(RVF) as a preventative measure.
Malignant Herd Catarrhal Fever
Malignant Catarrhal Fever (MCF) is an indicator of interactions at the wildlife-livestock
interface. Of the cases noted, the majority were wildebeest-associated MCF virus with
only one case in Greenpoint being sheep-associated MCF
VETERINARY PUBLIC HEALTH South Africa experienced the worst Listeriosis outbreak in the history of the discovery
of the bacterial pathogen over some 80 years ago. As at March 2018, 982 laboratory-
confirmed Listeriosis cases have been reported to National Institute for Communicable
Diseases (NICD) since the start of the outbreak resulting in 687 deaths.
Provincial Outbreak Response Team (PORT) convened on the 05 & 08 March 2018
and it was indicated that six (6) cases were confirmed at Kimberley Hospital since the
beginning of the outbreak. Of the six patients, four have fully recovered and two
patients (67 years old and a neonatal) sadly passed away. The meeting resolved on
embarking on an awareness campaign drive throughout the province and issues
relating to recall and disposal of products were discussed. The Kimberley Veterinary
Laboratory played a significant role in the incineration of at least half a tonne of recalled
high-risk foodstuffs from food chain stores in Sol Plaatjie Municipality.

140
Veterinary Public Health Officials visited abattoirs to sensitize them about the outbreak
and emphasizes put on the abattoir’s deep cleaning programs during the Hygiene
Assessment Audits. The Directorate of Veterinary Public Health (VPH) has since made
the awareness material from National Institute of Communicable Diseases (NICD)
available and it is mainly centred on World Health Organization (WHO) five keys to
safe food and the frequently asked question factsheet.
In terms of the awareness campaign, four (4) schools in the John Taolo Gaetsewe
region have been visited as part of the awareness campaign regarding Listeriosis. 30
people attended the mini workshop on Listeria Monocytogenes that was held in the ZF
Mgcawu district at Desert Beef abattoir on 21 Feb 2018. 5 of the VPH officials
managed to attend the event, which was an initiative of the industry in the district.
Veterinary Public Health in the ZF Mgcawu led by the state veterinarian attended to
reports of Congo Haemorrhagic Fever incidents within the Upington State Vet area
following reports of a human death of a 20-year-old from Deben area. The
investigation led to two cases of possible human contacts being investigated; a sheep
farmer around Upington and professional hunter from Kalahari Oryx. The working
partnership with all the other District Outbreak Response Team members ensured that
both cases were followed up very well. A lot of awareness initiatives has been done
targeting animal herders, farmers, livestock workers, hunters and slaughterers by
Department of Health and Veterinary Services. 200 pamphlets titled “Tick bites: What
you need to know “were distributed by Veterinary Public Health officials as part of the
awareness campaign.
Training, extension and Liaison
Schools
No of learners reached
Food-Safety
Public institutions
Farmers days
Community out-reach programs
Calvinia 1 10 0 3 0 0
De Aar 9 9118 1 12 1 1
Kimberley 1 0 1 2 0 2
Kuruman 11 10260 1 8 2 1
Mothibistad 16 2477 2 9 6 1
Springbok 9 1285 1 4 0 2
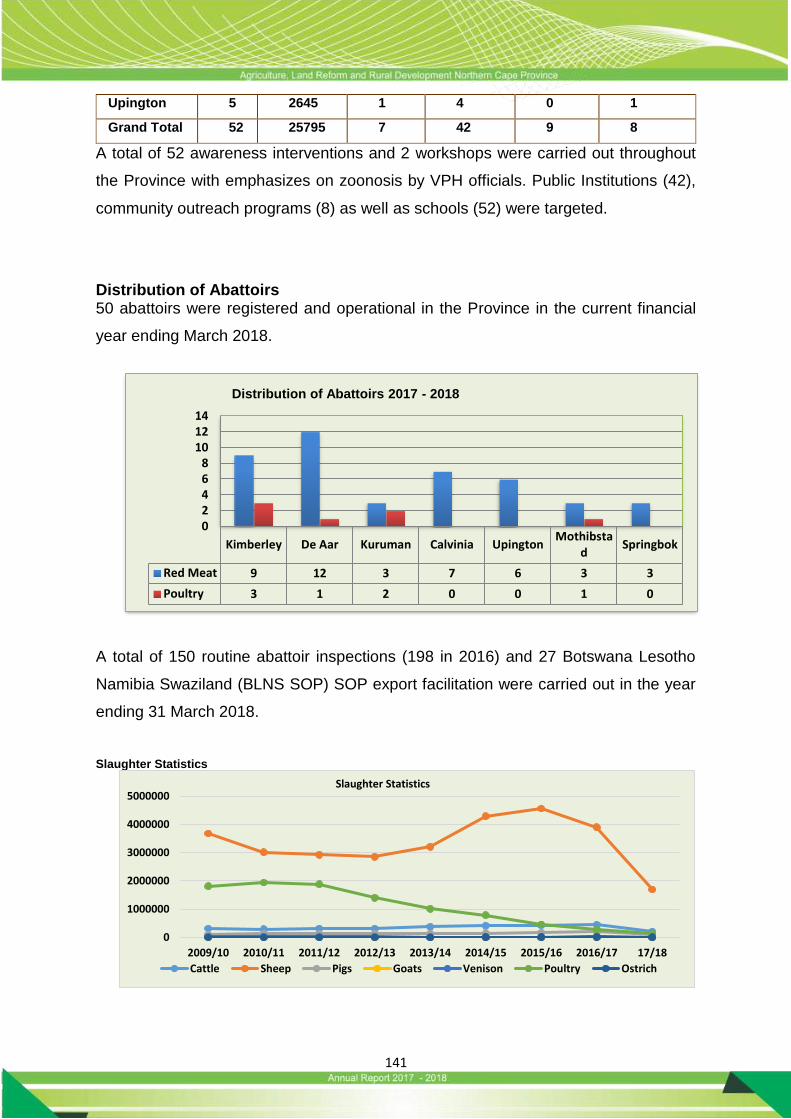
141
Upington 5 2645 1 4 0 1
Grand Total 52 25795 7 42 9 8
A total of 52 awareness interventions and 2 workshops were carried out throughout
the Province with emphasizes on zoonosis by VPH officials. Public Institutions (42),
community outreach programs (8) as well as schools (52) were targeted.
Distribution of Abattoirs 50 abattoirs were registered and operational in the Province in the current financial
year ending March 2018.
A total of 150 routine abattoir inspections (198 in 2016) and 27 Botswana Lesotho
Namibia Swaziland (BLNS SOP) SOP export facilitation were carried out in the year
ending 31 March 2018.
Slaughter Statistics
Kimberley De Aar Kuruman Calvinia UpingtonMothibsta
dSpringbok
Red Meat 9 12 3 7 6 3 3
Poultry 3 1 2 0 0 1 0
02468
101214
Distribution of Abattoirs 2017 - 2018
0
1000000
2000000
3000000
4000000
5000000
2009/10 2010/11 2011/12 2012/13 2013/14 2014/15 2015/16 2016/17 17/18
Slaughter Statistics
Cattle Sheep Pigs Goats Venison Poultry Ostrich
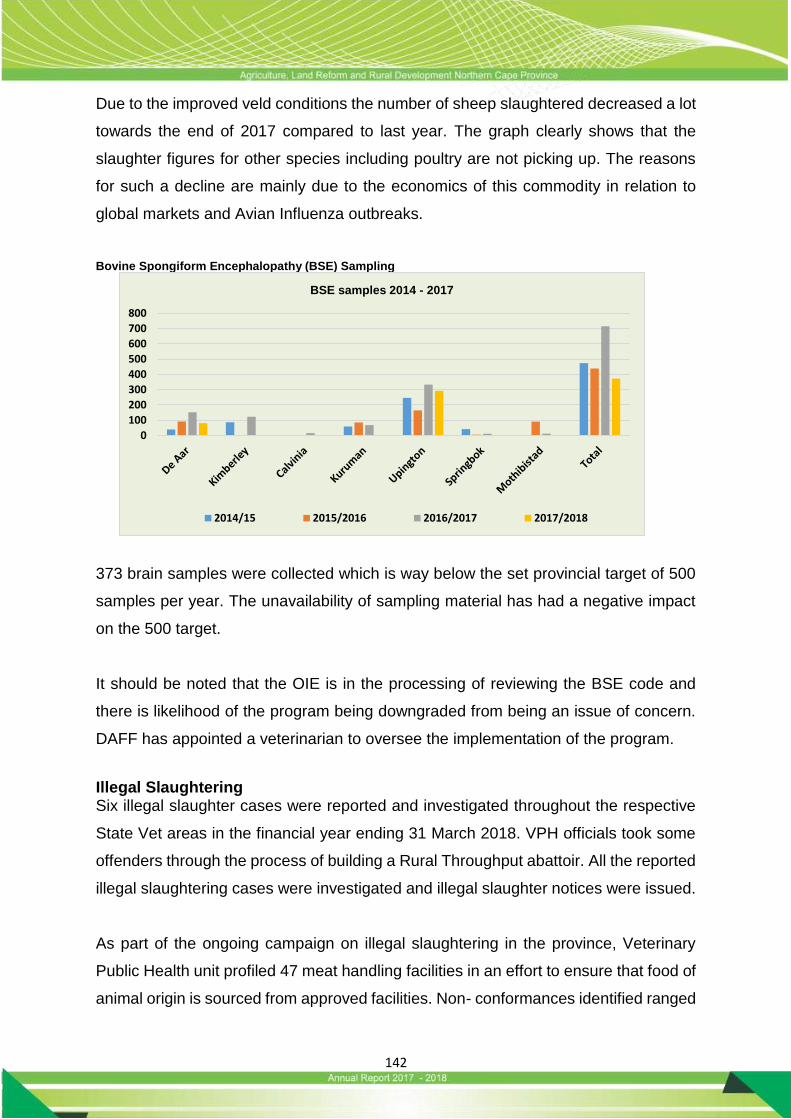
142
Due to the improved veld conditions the number of sheep slaughtered decreased a lot
towards the end of 2017 compared to last year. The graph clearly shows that the
slaughter figures for other species including poultry are not picking up. The reasons
for such a decline are mainly due to the economics of this commodity in relation to
global markets and Avian Influenza outbreaks.
Bovine Spongiform Encephalopathy (BSE) Sampling
373 brain samples were collected which is way below the set provincial target of 500
samples per year. The unavailability of sampling material has had a negative impact
on the 500 target.
It should be noted that the OIE is in the processing of reviewing the BSE code and
there is likelihood of the program being downgraded from being an issue of concern.
DAFF has appointed a veterinarian to oversee the implementation of the program.
Illegal Slaughtering Six illegal slaughter cases were reported and investigated throughout the respective
State Vet areas in the financial year ending 31 March 2018. VPH officials took some
offenders through the process of building a Rural Throughput abattoir. All the reported
illegal slaughtering cases were investigated and illegal slaughter notices were issued.
As part of the ongoing campaign on illegal slaughtering in the province, Veterinary
Public Health unit profiled 47 meat handling facilities in an effort to ensure that food of
animal origin is sourced from approved facilities. Non- conformances identified ranged
0
100
200
300
400
500
600
700
800
BSE samples 2014 - 2017
2014/15 2015/2016 2016/2017 2017/2018

143
from an ineligible passed stamp on carcasses as well as poor trimming. This was a
joint effort with Environmental Health unit from the local municipalities.
Veterinary Public Health in ZF Mgcawu District municipality hosted a farmer’s day at
the remote area of Grootdrink just outside of Upington on the 05/10/2017. The exercise
was part of the ongoing information day sessions scheduled by the State Veterinary
office to raise awareness on food safety matters (illegal slaughtering), zoonosis and
animal health related issues.
It is worth noting that the donkey slaughtering syndicate has since died down
throughout the country as a results of constant surveillance by veterinary services.
Hygiene Assessment Score Hundred and one (101) Hygiene Assessment System Audits were carried out
throughout the financial year ending 31 March 2018. The overall average score stands
at 82.3% a 3% increase from the previous financial year.
Map depicting illegal slaughtering sites since 2017
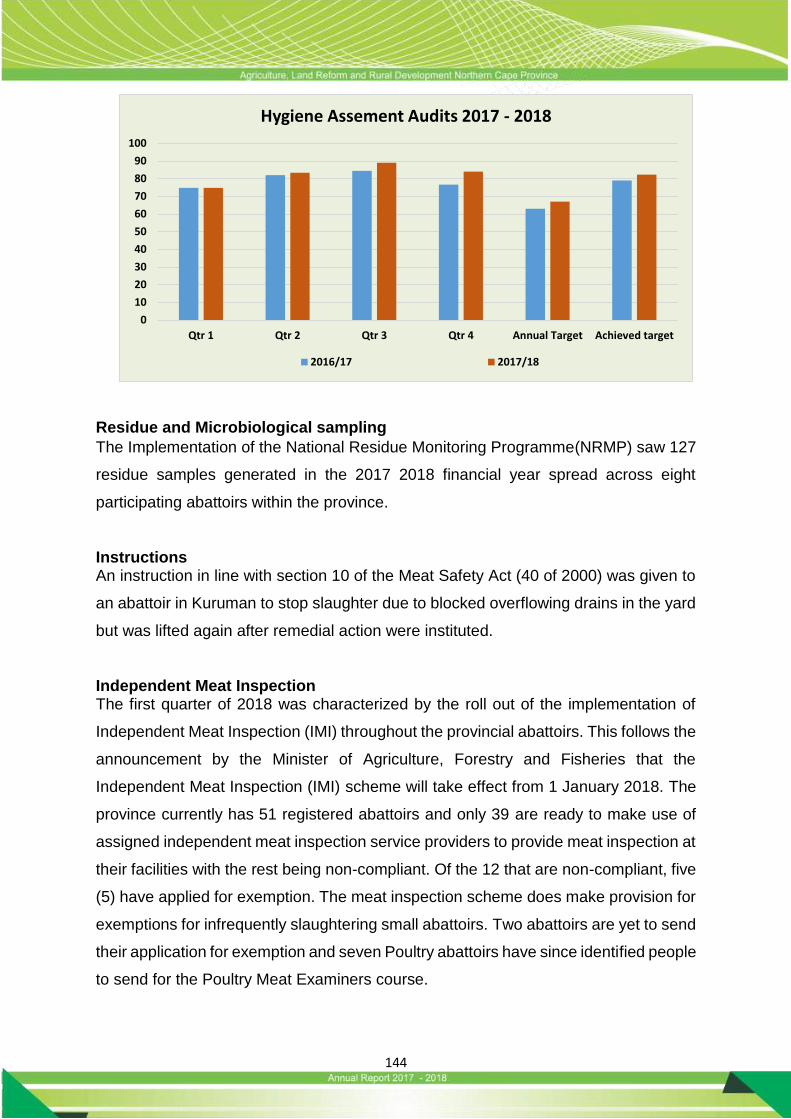
144
Residue and Microbiological sampling
The Implementation of the National Residue Monitoring Programme(NRMP) saw 127
residue samples generated in the 2017 2018 financial year spread across eight
participating abattoirs within the province.
Instructions An instruction in line with section 10 of the Meat Safety Act (40 of 2000) was given to
an abattoir in Kuruman to stop slaughter due to blocked overflowing drains in the yard
but was lifted again after remedial action were instituted.
Independent Meat Inspection The first quarter of 2018 was characterized by the roll out of the implementation of
Independent Meat Inspection (IMI) throughout the provincial abattoirs. This follows the
announcement by the Minister of Agriculture, Forestry and Fisheries that the
Independent Meat Inspection (IMI) scheme will take effect from 1 January 2018. The
province currently has 51 registered abattoirs and only 39 are ready to make use of
assigned independent meat inspection service providers to provide meat inspection at
their facilities with the rest being non-compliant. Of the 12 that are non-compliant, five
(5) have applied for exemption. The meat inspection scheme does make provision for
exemptions for infrequently slaughtering small abattoirs. Two abattoirs are yet to send
their application for exemption and seven Poultry abattoirs have since identified people
to send for the Poultry Meat Examiners course.
0
10
20
30
40
50
60
70
80
90
100
Qtr 1 Qtr 2 Qtr 3 Qtr 4 Annual Target Achieved target
Hygiene Assement Audits 2017 - 2018
2016/17 2017/18
145
EXPORT CONTROL
The past period was characterized by difficult trading conditions particularly for the
ostrich and game industry. Due to the trade ban of ostrich and game meat the number
of registered export game and ostrich farms have declined dramatically. This is very
unfortunate and will most probably impact negatively on the economies of the affected
areas.
Moreson abattoir in De Aar regained its European Union (EU) registration during 2017
after the Department placed a state veterinarian at the plant. This was of immediate
benefit to the ostrich industry as a whole as Avian Influenza outbreaks in large parts
of South Africa and the Western Cape in particular prevented other ostrich abattoirs
to be able to export. Most birds were thus channelled to Moreson abattoir in De Aar.
This greatly benefitted the community at large as the facility operated at full capacity
and employment opportunities maximized. Unfortunately, the EU suspended trade in
all meat products with South Africa early in 2018 due to South Africa’s inability to
provide the required guarantees on residues and residue sampling. Hopefully this will
be addressed with urgency as a failure to do so, will most probably result in negative
economic consequences for De Aar as well as all our ostrich farmers. This is very
unfortunate and will most probably impact negatively on the economies of the affected
areas.
The registration of the closed ratite unit in Campbell is still ongoing. The ostrich
industry is going to be affected heavily by the EU directive stated above.
This quarter saw new applications being brought forward for different establishments
namely; The Pregnant Mare Quarantine Station (PMQS) in Mauritzfontein, embryo
facility in Olierivier. Currently four ostrich farms, two taxidermies, two dip & pack
facility, one feed mill are registered as export facilities.

146
Certification
There number of health attestations can be seen dropping in 2017/18 compared to
2016/17. Export certification of beef to various destinations: China, Dubai, Jordan,
Hong Kong, Kuwait, Namibia, Mauritius, Mozambique, Qatar, Egypt, Zimbabwe,
Ghana and Switzerland. Animal feed is exported to Botswana and Namibia. Lucerne
was exported to Zambia and Mauritius. Wildlife exports are mainly to Namibia and
Zambia. Horses were mainly exported to Namibia and Botswana.
Live Animal Exports
Importation of cattle from Namibia has been on the increase. Of the countries covered
in the BLNS SOP (Botswana, Lesotho, Namibia and Swaziland Standard Operating
Procedures), Namibia is the main source of cattle for the registered feedlots and
0
200
400
600
800
1000
1200
1400
2009/10 2010/11 2011/12 2012/13 2013/14 2014/15 2015/16 2016/17 2017/18
Certification 2009 - 2018
0
500
1000
1500
2000
2500
3000
3500
2009/10 2010/11 2011/12 2012/13 2013/14 2014/15 2015/16 2016/17 2017/18
Live Animal Exports
Bovine Ovine Caprine
147
abattoir in the province. The importation is on a weekly basis. The BLNS scheme
continuous to place a huge burden on our offices in regions where facilities are
registered. The sustainability of our direct involvement in this scheme will have to be
discussed at a National level, as resources are stretched quite severely.
Trophies
Since 2015, there is a drastic decline in the number trophies units. The Namibian
market has become lucrative for overseas trophy hunters. Hunters prefers to hunt in
Namibia than in South Africa. The downside is that fewer hunters visited our province,
with the result of less foreign currency inflow.
South African hunting statistics for the 2016 calendar year provided by the Department
of Environmental Affairs (DEA) indicates that South Africa has seen drastic decline in
overseas hunters visiting South Africa from 16 394 in 2008 to 6 539 in 2016 (a drop of
60% in nine years) and this trend is expected to continue for the next five (5) years.
Feed and Lucerne exports
0
5000000
10000000
15000000
20000000
25000000
30000000
Feed and Lucerne Exports 2009 - 2017
FEED LUCERNE

148
Feed exports in the first halve of 2016/17 were also quite high due to continuing
drought conditions experienced in the Southern African region. Fortunately, good rains
since the start of 2018 will hopefully ensure that grazing conditions improve. Feed and
Lucerne exports are expected to increase in 2018/19. The Lucerne is mainly destined
for Zambia and Mauritius with the recent inclusion of the Reunion Islands
Export of milk and milk products
The export of milk and milk products is expected to increase in 2018/19. VPH unit is
assisting a milk establishment in Hartswater with registration to export milk to Namibia.
Currently the establishment is exporting milk through a third party. Once successful
with the registration, the establishment plan to export on average one million (1m)
litres of milk per month.
Beef and Lamb exports
0
10000
20000
30000
40000
50000
60000
70000
80000
90000
2009/2010 2010/2011 2011/2012 2012/2013 2013/2014 2014/2015 2015/2016 2016/2017 2017/2018
Export of milk and milk products
Milk Butter Yogurt Juice
0
500000
1000000
1500000
2000000
2500000
3000000
2009/10 2010/11 2011/12 2012/13 2013/14 2014/15 2015/16 2016/17 2017/18
Beef and Lamb Exports 2009 - 2017 (Kg)
Lamb Beef
149
Since the trade started in late 2017, China has become the largest export market for
Beefmaster and had exported about 2460 tons of beef towards the end of March 2018.
Beefmaster in Kimberley was approved as one of only two facilities in South Africa
eligible to export to China. Negotiations are ongoing on at national level to try and
ease the strict requirements set by China as this will ensure easier access to that
market by a larger part of our farming community including the smallholder farmers. In
another development, Malu pork cutting plant in Kimberley has been registered as an
export plant. This is going to result in the much needed job creation.
VETERINARY LABORATORY SERVICES AND EPIDEMIOLOGY The Northern Cape Provincial Veterinary laboratory was SANAS accredited for 5
diagnostic methods in 2017. The second SANAS surveillance assessment was done
6 months later on the 15th of February 2018 and the laboratory received an
unconditional accreditation after clearance of the non-conformances. The next major
18 months’ surveillance assessment has been scheduled for mid- January 2019.
The provincial laboratory continues to outperform established laboratories in the
Proficiency Testing Schemes run for its accredited methods despite serious personnel
challenges the laboratory is facing. Since obtaining the SANAS accreditation, the
laboratory has received requests from the Free State Province to test 120 000 Brucella
samples but has committed to test only a maximum of 1500 samples from outside the
province due to personnel issues and budgetary constraints. The Veterinary
Laboratory will embark on validation of Brucella ovis and Brucella melitensis test
methods for their inclusion in the January 2019 accreditation cycle. This initiative
stems from the feedback that the laboratory received during the veterinary laboratory
roadshow in the third quarter of 2017/2018 where farmers requested for extension of
scope for accredited tests.
In preparation for the DAFF approval system audit due on 9 April 2018, the sub-
programme managed to have signage erected in strategic positions in the Municipality
to fulfil the requirements for the audit.
The Laboratory finally received its 5-year Air Emission License for the incinerator and
continues to monitor and report the emissions according to National Environmental
Management Act of 2008. Remedial actions are currently underway to comply with the
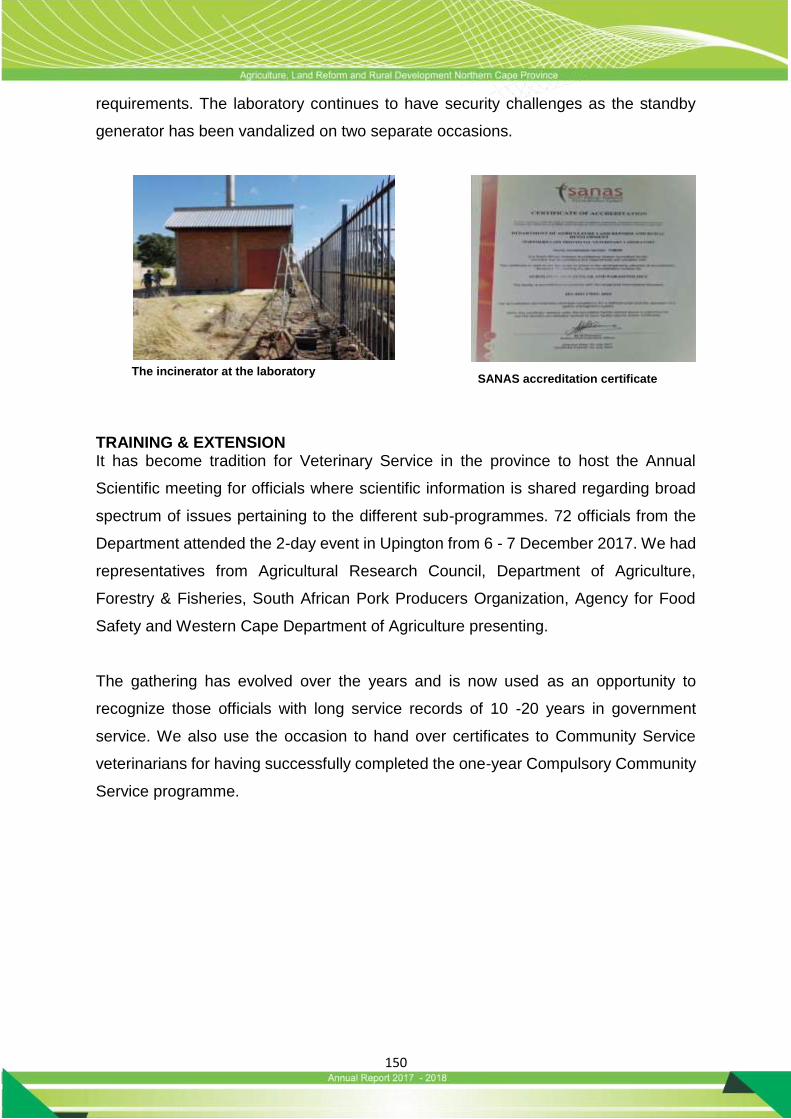
150
requirements. The laboratory continues to have security challenges as the standby
generator has been vandalized on two separate occasions.
TRAINING & EXTENSION It has become tradition for Veterinary Service in the province to host the Annual
Scientific meeting for officials where scientific information is shared regarding broad
spectrum of issues pertaining to the different sub-programmes. 72 officials from the
Department attended the 2-day event in Upington from 6 - 7 December 2017. We had
representatives from Agricultural Research Council, Department of Agriculture,
Forestry & Fisheries, South African Pork Producers Organization, Agency for Food
Safety and Western Cape Department of Agriculture presenting.
The gathering has evolved over the years and is now used as an opportunity to
recognize those officials with long service records of 10 -20 years in government
service. We also use the occasion to hand over certificates to Community Service
veterinarians for having successfully completed the one-year Compulsory Community
Service programme.
The incinerator at the laboratory SANAS accreditation certificate

151
The programme also makes provision for the Employee Assistance Programme in
collaboration with stakeholders within the fraternity. The Acting Director was invited
for an interview by Riverside Community Radio station and he used the opportunity to
promote the event and the veterinary profession. Onderstepoort Biological Products
(OBP) division sponsored the event and donated vaccine for use by smallholder
farmers in the province.
Figure 2: Mr Ernest Ngoepe from ARC
Attendants at the Scientific Meeting
Dr Peter Evans from SAPPO
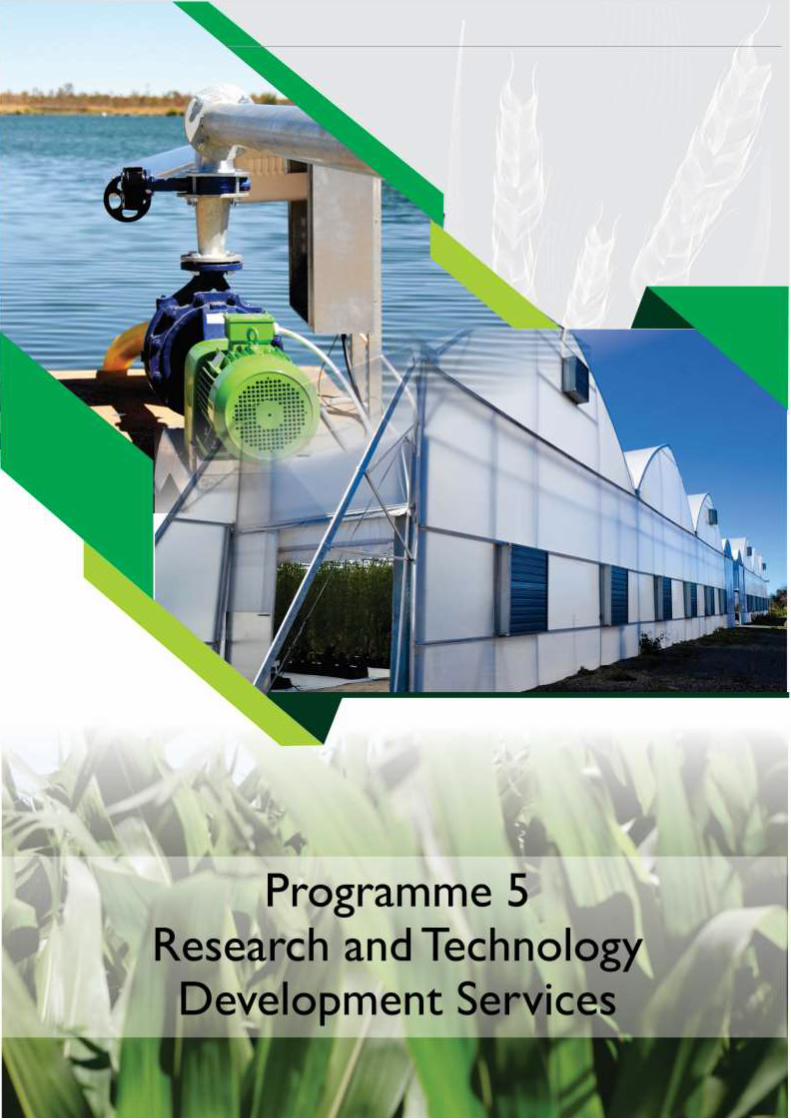
152
153
4.5 Programme 5: Research and Technology Development Services
Purpose: The purpose of the programme is to render expert and needs based
research, development and technology transfer services impacting on development
objectives.
Sub-Programmes:
Research
Technology Transfer Services
Infrastructure Support Services
Strategic Objectives:
To improve the agricultural production through conducting, facilitating and
coordinating 13 medium to long term research and technology development
projects;
To disseminate information on research and technology developed to clients,
peers and scientific community;
To provide and maintain 7 infrastructure facilities for the line function to
perform their research and other functions.
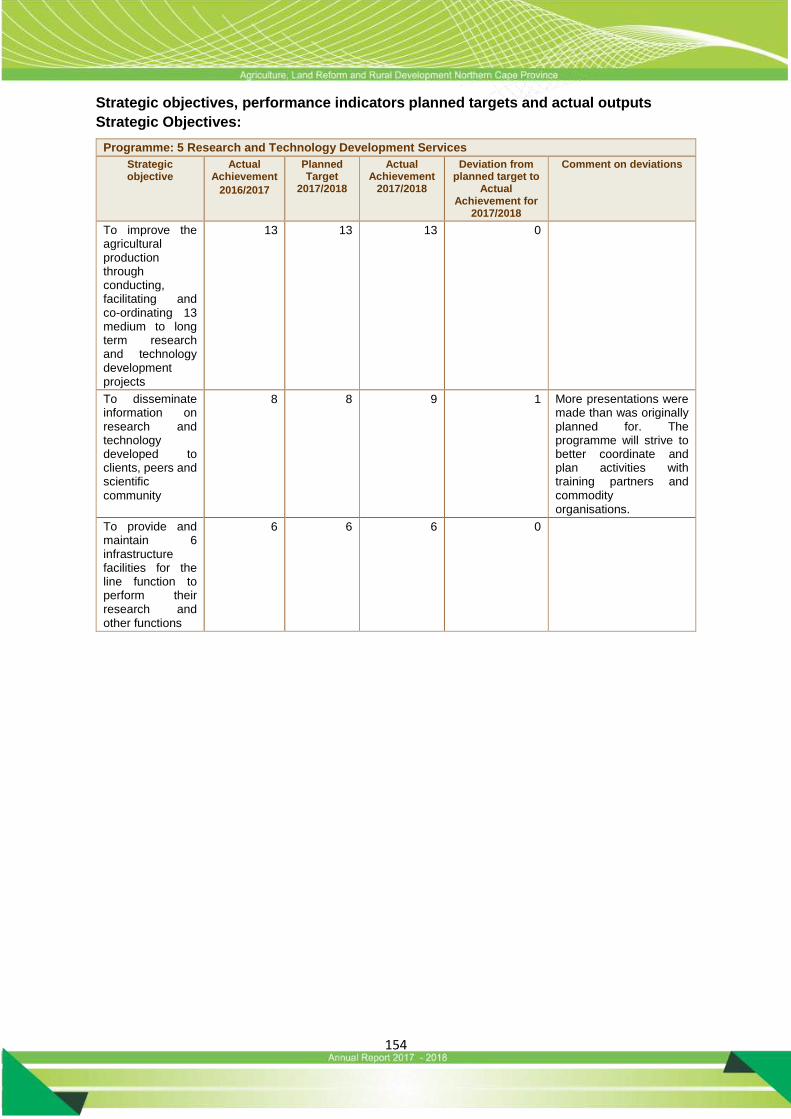
154
Strategic objectives, performance indicators planned targets and actual outputs
Strategic Objectives:
Programme: 5 Research and Technology Development Services
Strategic objective
Actual Achievement
2016/2017
Planned Target
2017/2018
Actual Achievement
2017/2018
Deviation from planned target to
Actual Achievement for
2017/2018
Comment on deviations
To improve the agricultural production through conducting, facilitating and co-ordinating 13 medium to long term research and technology development projects
13 13 13 0
To disseminate information on research and technology developed to clients, peers and scientific
community
8 8 9 1 More presentations were made than was originally planned for. The programme will strive to better coordinate and plan activities with training partners and commodity organisations.
To provide and maintain 6 infrastructure facilities for the line function to perform their research and other functions
6 6 6 0

155
Performance indicators:
Sub-programme: 5.1 Research
Performance Indicators
Actual Achieve
ment 2014/20
15
Actual Achieve
ment 2015/201
6
Actual Achieve
ment
2016/2017
Planned Target
2017/2018
Actual Achieve
ment 2017/201
8
Deviation from
planned target to Actual
Achievement for
2017/2018
Comment on deviations
5.1.1 Number of research and technology development projects implemented to improve agricultural production
13 13 13 13 13 0
5.1.2 Number of scientific investigations conducted
8 8 8 8 9 1 More requests for scientific investigations were received than was planned for.
Strategy to overcome areas of under performance
None
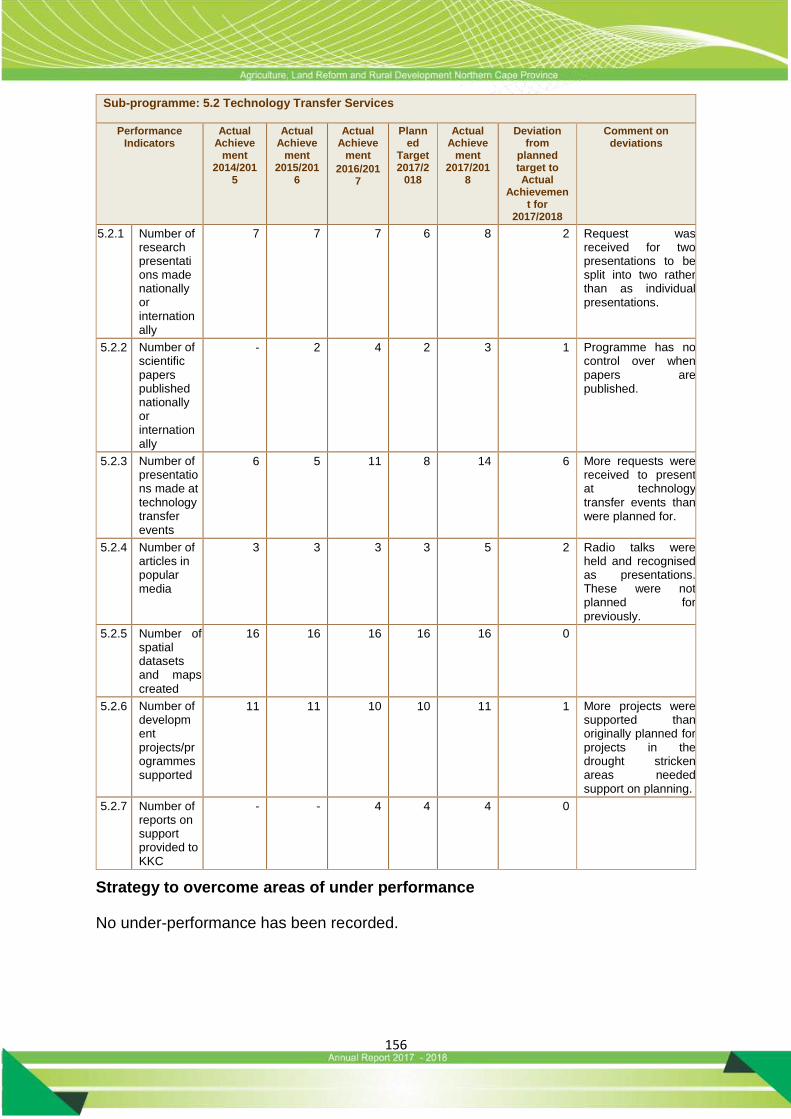
156
Sub-programme: 5.2 Technology Transfer Services
Performance Indicators
Actual Achieve
ment 2014/201
5
Actual Achieve
ment 2015/201
6
Actual Achieve
ment
2016/2017
Planned
Target 2017/2
018
Actual Achieve
ment 2017/201
8
Deviation from
planned target to Actual
Achievement for
2017/2018
Comment on deviations
5.2.1 Number of research presentations made nationally or internationally
7 7 7 6 8 2 Request was received for two presentations to be split into two rather than as individual presentations.
5.2.2 Number of scientific papers published nationally or internationally
- 2 4 2 3 1 Programme has no control over when papers are published.
5.2.3 Number of presentations made at technology transfer events
6 5 11 8 14 6 More requests were received to present at technology transfer events than were planned for.
5.2.4 Number of articles in popular media
3 3 3 3 5 2 Radio talks were held and recognised as presentations. These were not planned for
previously.
5.2.5 Number of spatial datasets and maps
created
16 16 16 16 16 0
5.2.6 Number of development projects/programmes supported
11 11 10 10 11 1 More projects were supported than originally planned for projects in the drought stricken areas needed support on planning.
5.2.7 Number of reports on support provided to KKC
- - 4 4 4 0
Strategy to overcome areas of under performance
No under-performance has been recorded.
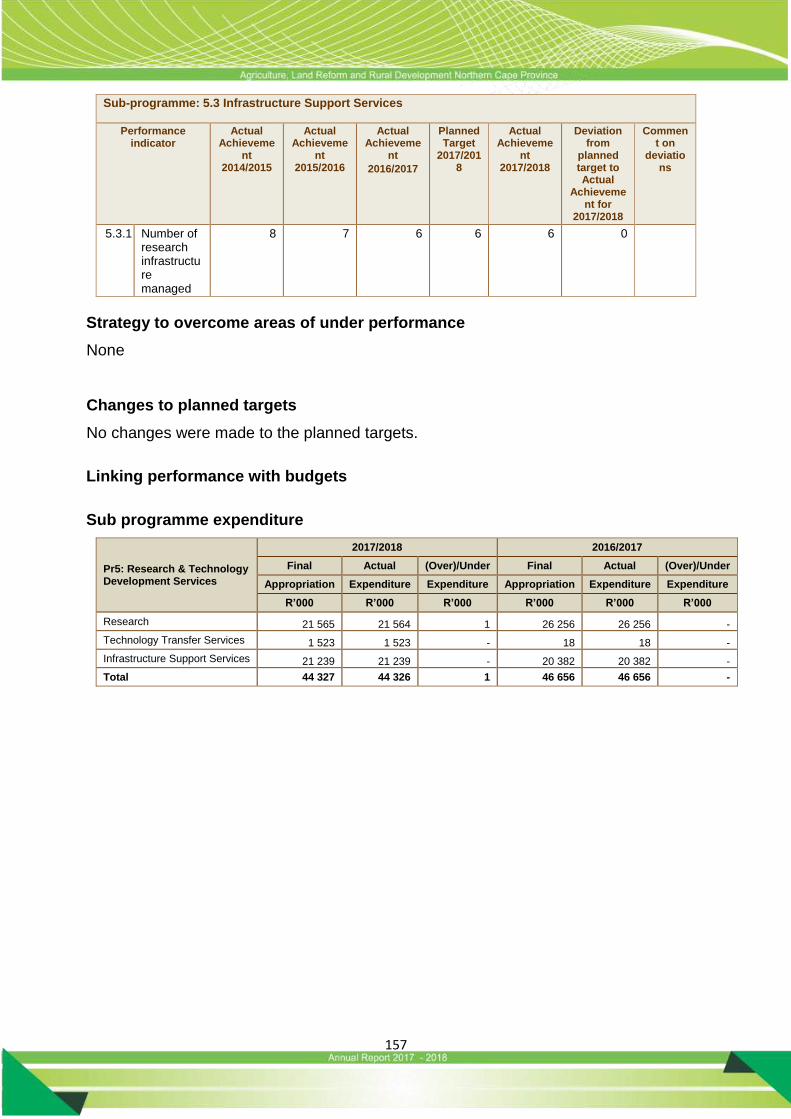
157
Sub-programme: 5.3 Infrastructure Support Services
Performance indicator
Actual Achieveme
nt 2014/2015
Actual Achieveme
nt 2015/2016
Actual Achieveme
nt
2016/2017
Planned Target
2017/2018
Actual Achieveme
nt 2017/2018
Deviation from
planned target to Actual
Achievement for
2017/2018
Comment on
deviations
5.3.1 Number of research infrastructure managed
8 7 6 6 6 0
Strategy to overcome areas of under performance
None
Changes to planned targets
No changes were made to the planned targets.
Linking performance with budgets
Sub programme expenditure
Pr5: Research & Technology Development Services
2017/2018 2016/2017
Final Actual (Over)/Under Final Actual (Over)/Under
Appropriation Expenditure Expenditure Appropriation Expenditure Expenditure
R’000 R’000 R’000 R’000 R’000 R’000
Research 21 565 21 564 1 26 256 26 256 -
Technology Transfer Services 1 523 1 523 - 18 18 -
Infrastructure Support Services 21 239 21 239 - 20 382 20 382 -
Total 44 327 44 326 1 46 656 46 656 -

158
SERVICE DELIVERY HIGHLIGHTS
As a result of the persisting drought conditions in large parts of the Province, numerous
requests regarding veld condition assessments and climatic information has been
received. The drought together with the winter frost has left large parts of the
vegetation of the Province extremely dry.
During the past season the Northern Cape Province contributed approximately 10%
to the national maize and wheat production of South Africa at 703 200 tons of maize
and 304 00 tons of wheat. Cotton production was 11 500 tons and groundnuts 14 000
tons. Table grape production was 20.5 million cartons, wine grape production 124 800
tons and raisin production 55 000 tons. There is a significant shift towards pecan nut
production and a reduction in olive production in the Northern Cape Province
The effect of stocking density on animal performance and vegetation in the
Upper Karoo
As the primary land use in the Western Upper Karoo, extensive small-stock farming
contributes significantly towards the agricultural economy of the region. However, the
sustainability thereof has been questioned for many years. This led to the
establishment of a long-term stocking-density trial in 1988 at the Carnarvon Research
Station. While various variables are known to influence vegetation, stocking density
was perceived to be an important factor. The trial was designed on a three-camp
rotational grazing system under four stocking densities (8, 7, 5.5 and 4 ha SSU-1).
Following continuous treatment over twenty-eight years, the results from a once-off
assessment portrayed no significant differences between treatments with regard to
plant height, cover, species diversity, ecological and grazing index scores as well as
animal performance. Animal production varied among treatments where the mean
production per hectare was found to be the highest under the high stocking-density
treatment.
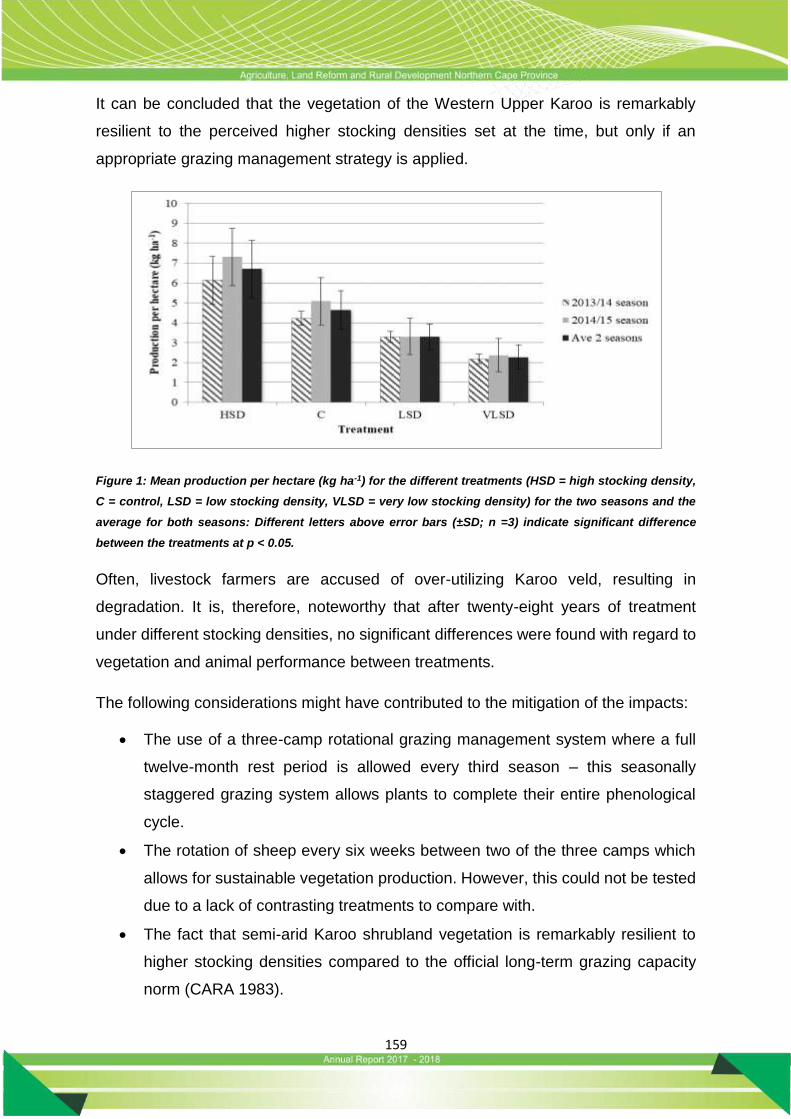
159
It can be concluded that the vegetation of the Western Upper Karoo is remarkably
resilient to the perceived higher stocking densities set at the time, but only if an
appropriate grazing management strategy is applied.
Figure 1: Mean production per hectare (kg ha-1) for the different treatments (HSD = high stocking density,
C = control, LSD = low stocking density, VLSD = very low stocking density) for the two seasons and the
average for both seasons: Different letters above error bars (±SD; n =3) indicate significant difference
between the treatments at p < 0.05.
Often, livestock farmers are accused of over-utilizing Karoo veld, resulting in
degradation. It is, therefore, noteworthy that after twenty-eight years of treatment
under different stocking densities, no significant differences were found with regard to
vegetation and animal performance between treatments.
The following considerations might have contributed to the mitigation of the impacts:
The use of a three-camp rotational grazing management system where a full
twelve-month rest period is allowed every third season – this seasonally
staggered grazing system allows plants to complete their entire phenological
cycle.
The rotation of sheep every six weeks between two of the three camps which
allows for sustainable vegetation production. However, this could not be tested
due to a lack of contrasting treatments to compare with.
The fact that semi-arid Karoo shrubland vegetation is remarkably resilient to
higher stocking densities compared to the official long-term grazing capacity
norm (CARA 1983).
160
The fact that the high stocking density set at four ha SSU-1 at the start of the
trial in 1988 was, actually, not high enough to cause veld degradation and to
lower animal production significantly. It may further suggest that the
recommended (legislated) long-term stocking density is overly conservative for
a three-camp rotational grazing system in the Karoo.
The development of veldt condition and degradation indices
Considering the nature and scale of agriculture in general, remote sensing techniques
offers the ideal tool for monitoring management inputs and response over time. As a
result, current advancements in data collection and monitoring are frequently based
on combining in situ measurements, airborne sensors and satellite observations.
Simultaneously, remote sensing technologies are evolving at a rapid rate and together
with an increased number of Earth observing satellites, high resolution remotely
sensed imagery are more accessible than ever. Remotely sensed data are used to
describe both small and large-scale processes, but each system has its unique
spatiotemporal constraints. Ground based assessments are time consuming, labour
intensive and very expensive. The main impediment to using remotely sensed data
from satellites are the unavailability of cloud free, high spatial (0.3 m or better) and
spectral resolution (multiple narrow bands) data. In recent times, the affordability and
accessibility of Remotely Piloted Aircrafts (RPA’s) opened new opportunities as
transporters of remote sensing equipment. Currently, RPA-mounted sensors are in
common used for bridging the gap between ground-based surveys and satellite
derived data. As a result, RPA’s are commonly used to monitor an array of agricultural
applications including, vegetation cover, plant health, crop condition, nutrient status,
yield, productivity and many more. While most RPA’s provide an accurate, geo-
referenced platform which allows for instant results at regular intervals, it has its
limitations with regard to flight time, adverse weather conditions and often it’s sensing
capacity.
In order to correctly interpret the imagery derived in this manner, it is important to take
cognisance of the capacity or capability of the particular sensor in use, as well as the
161
reflection pattern which is derived from light that was absorbed and reflected from the
electro-magnetic spectrum (EMS).
Reflectance of vegetation differs throughout the EMS and is generally found to be very
low in the blue and red regions of the EMS, slightly higher in the green region and high
in the near infra-red region. This information can be used to determine stress levels in
plants linked nitrogen status and correlated with chlorophyll concentration.
This current study provides a first-hand account on the application of high resolution
remote sensing imagery and illustrating the potential for this approach in Agricultural
Management.
The development of a comprehensive project footprint linked to the Northern
Cape Agricultural information system (NCAIS).
All the budget information of projects for the 2017/18 financial year were finalized on
the Northern Cape Agricultural Information System (NCAIS). The Land Care projects
have also been captured and spatially linked in NCAIS. The GIS portal for NCAIS has
been installed and setup was completed on the GIS server hosted at the Eiland
Research Station. The development of a mobile application to capture future project
information via mobile (cell phone) technology is currently being developed and tested.
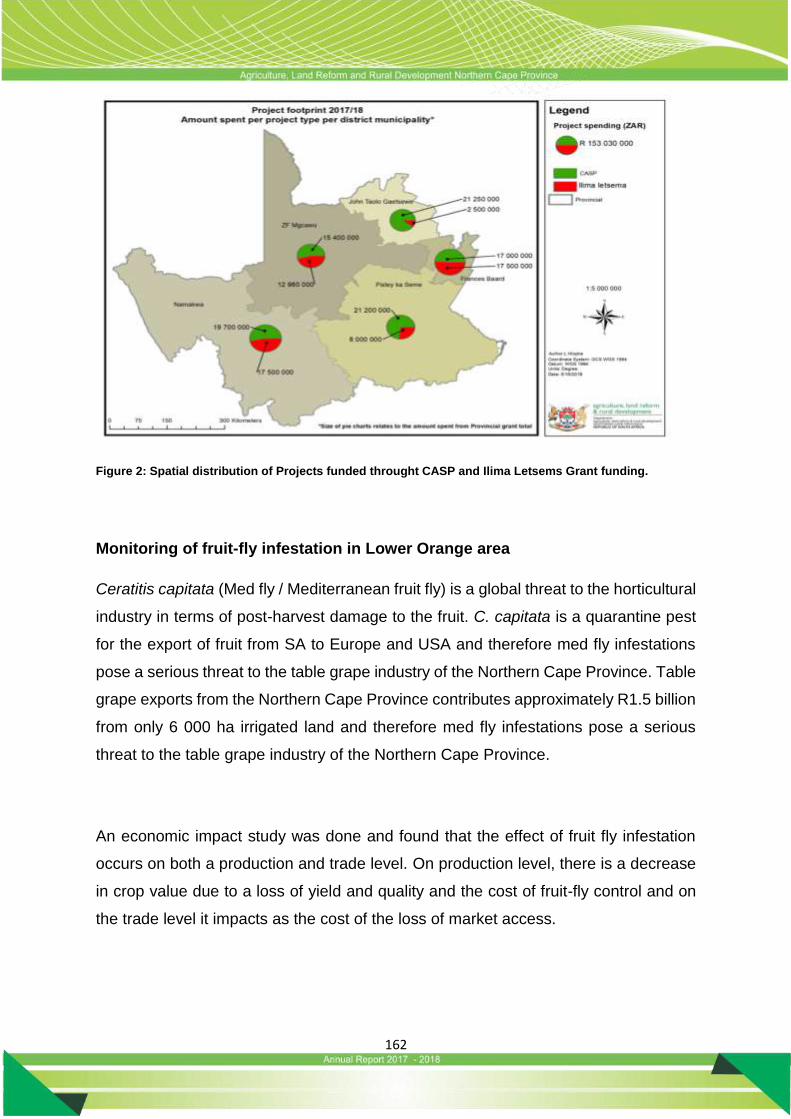
162
Figure 2: Spatial distribution of Projects funded throught CASP and Ilima Letsems Grant funding.
Monitoring of fruit-fly infestation in Lower Orange area
Ceratitis capitata (Med fly / Mediterranean fruit fly) is a global threat to the horticultural
industry in terms of post-harvest damage to the fruit. C. capitata is a quarantine pest
for the export of fruit from SA to Europe and USA and therefore med fly infestations
pose a serious threat to the table grape industry of the Northern Cape Province. Table
grape exports from the Northern Cape Province contributes approximately R1.5 billion
from only 6 000 ha irrigated land and therefore med fly infestations pose a serious
threat to the table grape industry of the Northern Cape Province.
An economic impact study was done and found that the effect of fruit fly infestation
occurs on both a production and trade level. On production level, there is a decrease
in crop value due to a loss of yield and quality and the cost of fruit-fly control and on
the trade level it impacts as the cost of the loss of market access.
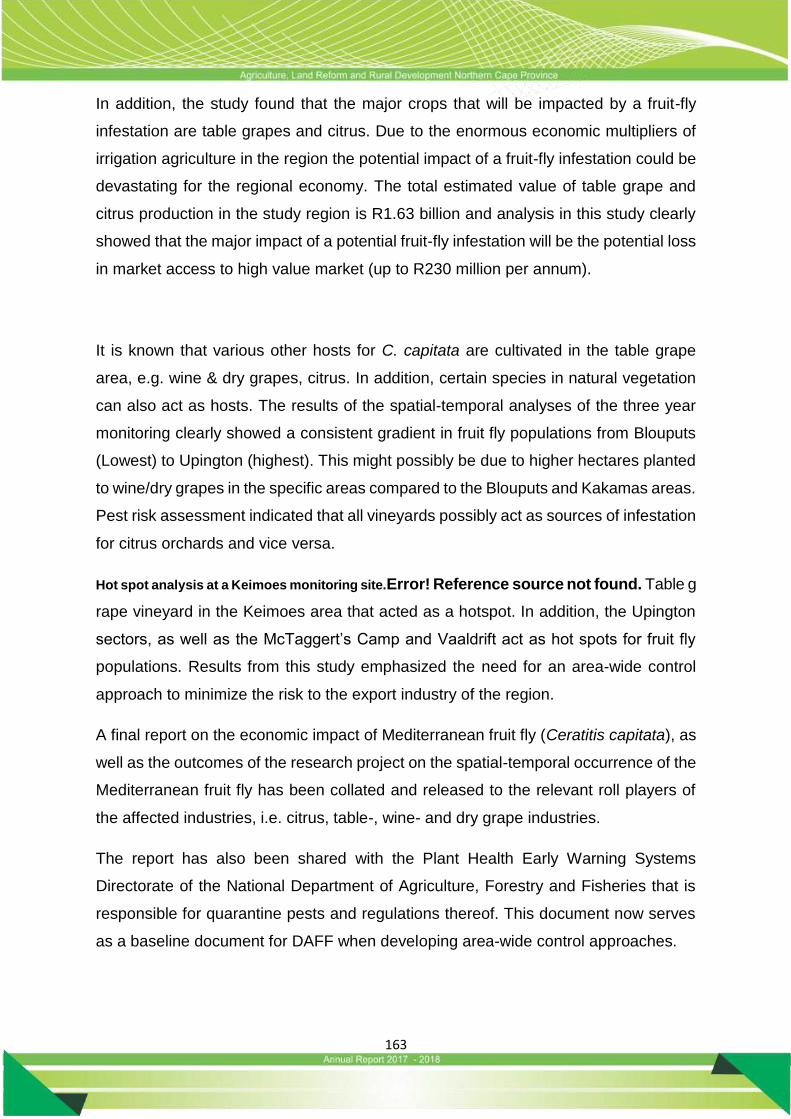
163
In addition, the study found that the major crops that will be impacted by a fruit-fly
infestation are table grapes and citrus. Due to the enormous economic multipliers of
irrigation agriculture in the region the potential impact of a fruit-fly infestation could be
devastating for the regional economy. The total estimated value of table grape and
citrus production in the study region is R1.63 billion and analysis in this study clearly
showed that the major impact of a potential fruit-fly infestation will be the potential loss
in market access to high value market (up to R230 million per annum).
It is known that various other hosts for C. capitata are cultivated in the table grape
area, e.g. wine & dry grapes, citrus. In addition, certain species in natural vegetation
can also act as hosts. The results of the spatial-temporal analyses of the three year
monitoring clearly showed a consistent gradient in fruit fly populations from Blouputs
(Lowest) to Upington (highest). This might possibly be due to higher hectares planted
to wine/dry grapes in the specific areas compared to the Blouputs and Kakamas areas.
Pest risk assessment indicated that all vineyards possibly act as sources of infestation
for citrus orchards and vice versa.
Hot spot analysis at a Keimoes monitoring site.Error! Reference source not found. Table g
rape vineyard in the Keimoes area that acted as a hotspot. In addition, the Upington
sectors, as well as the McTaggert’s Camp and Vaaldrift act as hot spots for fruit fly
populations. Results from this study emphasized the need for an area-wide control
approach to minimize the risk to the export industry of the region.
A final report on the economic impact of Mediterranean fruit fly (Ceratitis capitata), as
well as the outcomes of the research project on the spatial-temporal occurrence of the
Mediterranean fruit fly has been collated and released to the relevant roll players of
the affected industries, i.e. citrus, table-, wine- and dry grape industries.
The report has also been shared with the Plant Health Early Warning Systems
Directorate of the National Department of Agriculture, Forestry and Fisheries that is
responsible for quarantine pests and regulations thereof. This document now serves
as a baseline document for DAFF when developing area-wide control approaches.
164
Spatial distribution of med fly populations during the three-year monitoring period from
September 2014 to June 2017.
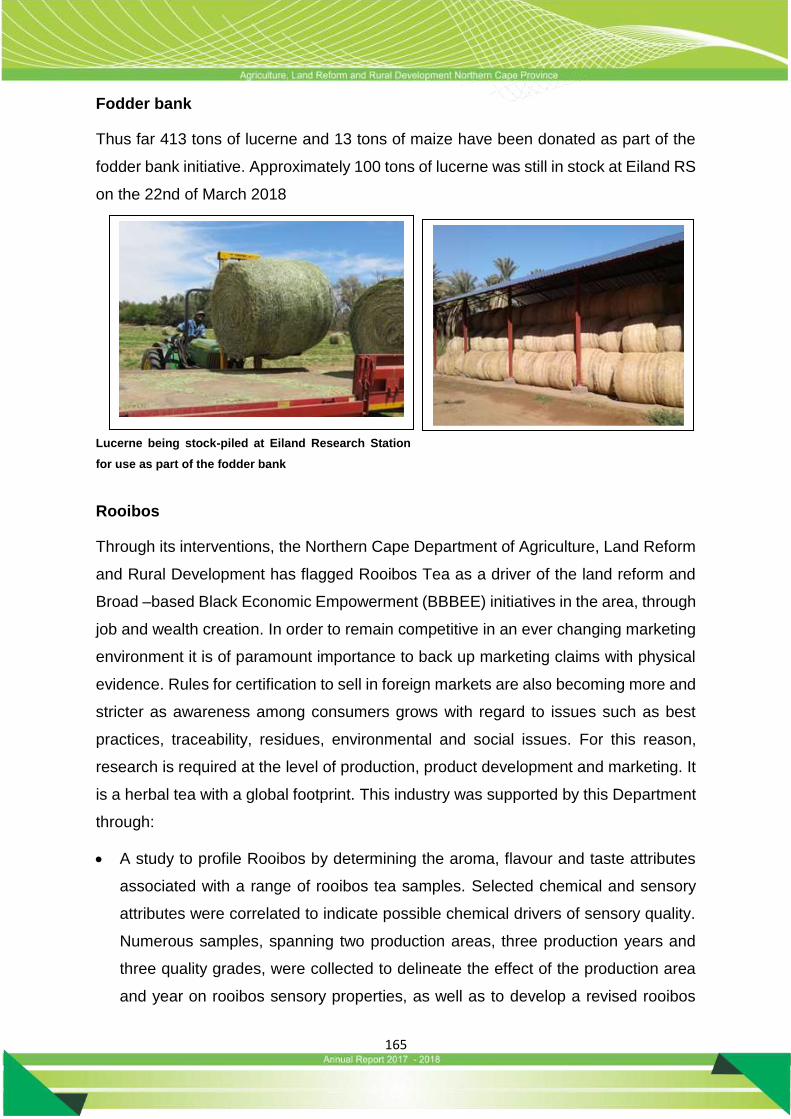
165
Fodder bank
Thus far 413 tons of lucerne and 13 tons of maize have been donated as part of the
fodder bank initiative. Approximately 100 tons of lucerne was still in stock at Eiland RS
on the 22nd of March 2018
Lucerne being stock-piled at Eiland Research Station
for use as part of the fodder bank
Rooibos
Through its interventions, the Northern Cape Department of Agriculture, Land Reform
and Rural Development has flagged Rooibos Tea as a driver of the land reform and
Broad –based Black Economic Empowerment (BBBEE) initiatives in the area, through
job and wealth creation. In order to remain competitive in an ever changing marketing
environment it is of paramount importance to back up marketing claims with physical
evidence. Rules for certification to sell in foreign markets are also becoming more and
stricter as awareness among consumers grows with regard to issues such as best
practices, traceability, residues, environmental and social issues. For this reason,
research is required at the level of production, product development and marketing. It
is a herbal tea with a global footprint. This industry was supported by this Department
through:
A study to profile Rooibos by determining the aroma, flavour and taste attributes
associated with a range of rooibos tea samples. Selected chemical and sensory
attributes were correlated to indicate possible chemical drivers of sensory quality.
Numerous samples, spanning two production areas, three production years and
three quality grades, were collected to delineate the effect of the production area
and year on rooibos sensory properties, as well as to develop a revised rooibos

166
sensory wheel. A lexicon for all aroma attributes were developed including
chemical references and a user-friendly aroma wheel which will provide users with
relative importance of attributes at a glance. This quality control tool can be used
in the industry to aid in grading and marketing of rooibos tea.
In an attempt to optimize the value of rooibos waste material (dust and stems), a
study was completed to determine the aroma and taste profile of stem material
infused with extracts from dust material. It was concluded from this study that
fermented rooibos waste material (dust) can be utilised for the production of good
quality rooibos extracts and that diluted dust extracts are of similar sensory quality
as that of a normal cup of rooibos tea. Stem infusions also produce infusions of
similar sensory quality as that of a normal cup of rooibos tea, but some contain
undesirable “planky/pencil shaving” aromas at high intensities. Diluted dust
extracts & stem infusions can be combined to produce infusions of similar sensory
quality as that of a normal cup of rooibos tea. However, “planky/pencil shaving”
aromas and flavours are still evident and not fully masked by a 50/50 combination
ratio. Therefore, these two rooibos tea agro-processing waste materials COULD
have significant market value.
Profiling of dust extract and stem infusion combinations
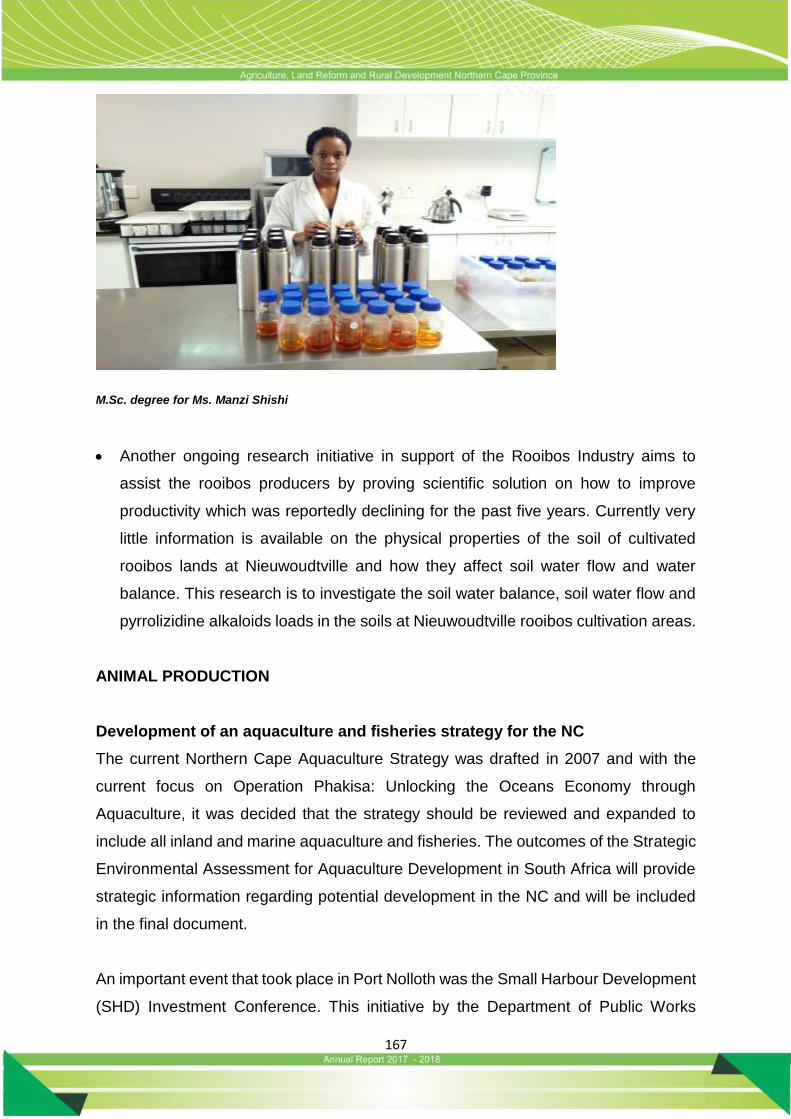
167
M.Sc. degree for Ms. Manzi Shishi
Another ongoing research initiative in support of the Rooibos Industry aims to
assist the rooibos producers by proving scientific solution on how to improve
productivity which was reportedly declining for the past five years. Currently very
little information is available on the physical properties of the soil of cultivated
rooibos lands at Nieuwoudtville and how they affect soil water flow and water
balance. This research is to investigate the soil water balance, soil water flow and
pyrrolizidine alkaloids loads in the soils at Nieuwoudtville rooibos cultivation areas.
ANIMAL PRODUCTION
Development of an aquaculture and fisheries strategy for the NC
The current Northern Cape Aquaculture Strategy was drafted in 2007 and with the
current focus on Operation Phakisa: Unlocking the Oceans Economy through
Aquaculture, it was decided that the strategy should be reviewed and expanded to
include all inland and marine aquaculture and fisheries. The outcomes of the Strategic
Environmental Assessment for Aquaculture Development in South Africa will provide
strategic information regarding potential development in the NC and will be included
in the final document.
An important event that took place in Port Nolloth was the Small Harbour Development
(SHD) Investment Conference. This initiative by the Department of Public Works
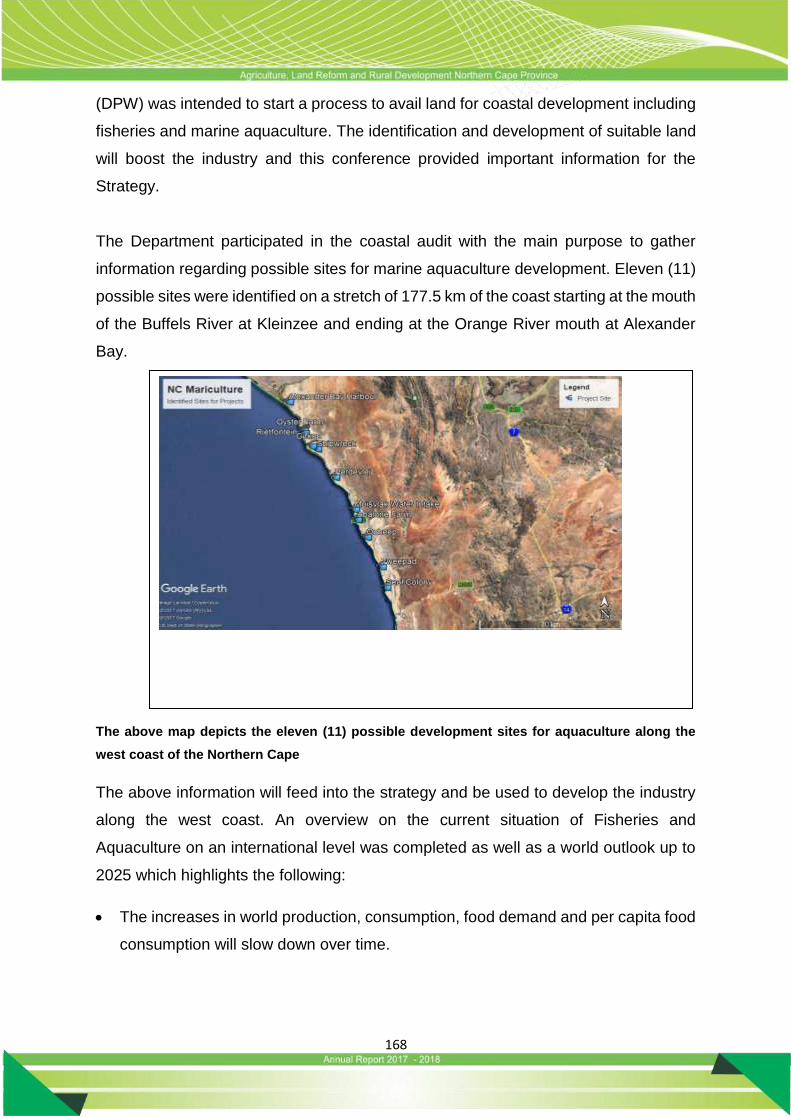
168
(DPW) was intended to start a process to avail land for coastal development including
fisheries and marine aquaculture. The identification and development of suitable land
will boost the industry and this conference provided important information for the
Strategy.
The Department participated in the coastal audit with the main purpose to gather
information regarding possible sites for marine aquaculture development. Eleven (11)
possible sites were identified on a stretch of 177.5 km of the coast starting at the mouth
of the Buffels River at Kleinzee and ending at the Orange River mouth at Alexander
Bay.
The above map depicts the eleven (11) possible development sites for aquaculture along the
west coast of the Northern Cape
The above information will feed into the strategy and be used to develop the industry
along the west coast. An overview on the current situation of Fisheries and
Aquaculture on an international level was completed as well as a world outlook up to
2025 which highlights the following:
The increases in world production, consumption, food demand and per capita food
consumption will slow down over time.
169
The sustainable management of overfished stock can give rise to slight increases
in world capture production, but the growth in aquaculture production is expected
to fill the demand gap. This growth will however be slower than in the past.
The changes in demand will be primarily in the developing countries where
population growth will slow down, per capita incomes will increase and urbanisation
will lead to increases in demand.
Prices are set to decline in real terms, but will remain relatively high.
Increases in the trade of fish and fish products are expected to slow down and
exports will remain stable.
Fisheries and aquaculture will contribute towards the fight against hunger and poverty
through sustainable growth in the sector that will ensure economic and social
development.
The draft Aquaculture and Fisheries Strategy for the NC was completed and submitted
for comments and inputs. The document will also be circulated amongst industry
experts before final sign-off and distribution for implementation.
The following are excerpts from the document that will provide insight on the expected
objectives. This strategy is based on four pillars or strategic objectives which will be
linked to 18 outputs:
Institutional objective: to establish an enabling environment to effectively manage
the sector, ensure that support services are available and ensure equitable
development through the allocation of resources and support systems (good
governance support, social accountability, equitable economic growth and
environmental awareness).
Social objective: to produce healthy and nutritious food for the people and to
develop productive livelihoods through quality education, health care, basic
services and social security (social stability supports economic development and
environmental management).
Economic objective: to develop the economic potential of rural communities
through job creation, increased household incomes and saving/earning of foreign
exchange by import replacement or increased exports (economic development
supports social stability and encourage environmental improvement).
170
Ecological objective: to ensure the conservation of aquatic biodiversity, promote
the improvement of genetic resources and ensure the sustainable utilisation of
natural resources (healthy environment supports social and economic
development).
Implement the pilot trout cage culture project at Vanderkloof in collaboration
with our partners
The survey of the dam with Department of Agriculture, forestry and fisheries (DAFF)
scientists and the technical partner was conducted on 4 June 2017. The report
generated by the survey was used to guide the final application to Department of Water
and Sanitation (DWS) to access the dam and indicated the exact location of the cages.
The following authorizations and permits were issued:
Environmental Impact Assessment not listed letter
Northern Cape Exemption letter
General Authorization for water use
Western Cape Export permit
Northern Cape Import permit
DWS access permit
The programme for the implementation of the project will be as follows:
Base line studies for environmental health was conducted last year.
Further environmental monitoring will be conducted at the time of placing
the fish in the water.
The initial trial will be conducted with 4000 thousand fish in 1 10m length
x 10m width X 5 m depth cage
Infrastructure will be moved to Vanderkloof dam a week prior to the
projects actual implementation.
The Department of Water and Sanitation (Dam Manager) must be
consulted prior to the infrastructure placement.
Fish to be moved from Western Cape to Northern Cape in early May
2018. This will be subject to the update of the Northern Cape Import
permit
Depending on results, expected harvest time will be planned for October.
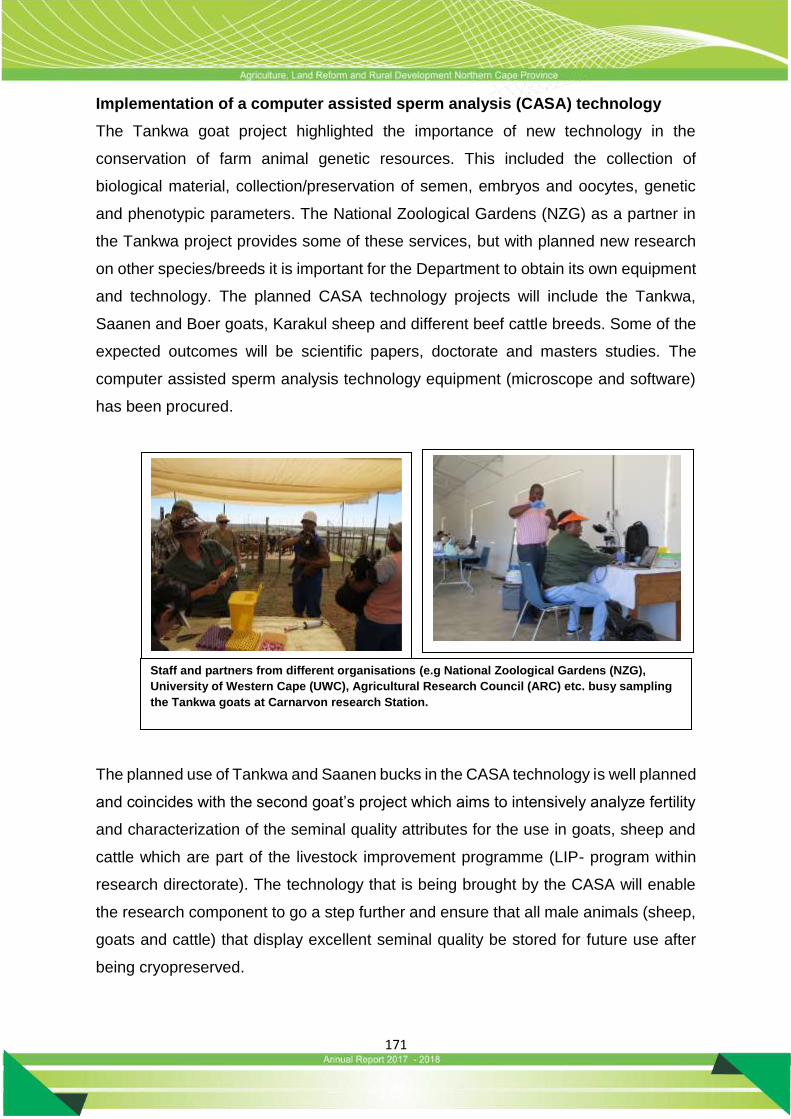
171
Implementation of a computer assisted sperm analysis (CASA) technology
The Tankwa goat project highlighted the importance of new technology in the
conservation of farm animal genetic resources. This included the collection of
biological material, collection/preservation of semen, embryos and oocytes, genetic
and phenotypic parameters. The National Zoological Gardens (NZG) as a partner in
the Tankwa project provides some of these services, but with planned new research
on other species/breeds it is important for the Department to obtain its own equipment
and technology. The planned CASA technology projects will include the Tankwa,
Saanen and Boer goats, Karakul sheep and different beef cattle breeds. Some of the
expected outcomes will be scientific papers, doctorate and masters studies. The
computer assisted sperm analysis technology equipment (microscope and software)
has been procured.
The planned use of Tankwa and Saanen bucks in the CASA technology is well planned
and coincides with the second goat’s project which aims to intensively analyze fertility
and characterization of the seminal quality attributes for the use in goats, sheep and
cattle which are part of the livestock improvement programme (LIP- program within
research directorate). The technology that is being brought by the CASA will enable
the research component to go a step further and ensure that all male animals (sheep,
goats and cattle) that display excellent seminal quality be stored for future use after
being cryopreserved.
Staff and partners from different organisations (e.g National Zoological Gardens (NZG),
University of Western Cape (UWC), Agricultural Research Council (ARC) etc. busy sampling
the Tankwa goats at Carnarvon research Station.

172
The CASA technology projects will include the PhD studies on the Tankwa, Saanen
and Boer goat bucks at Rietrivier Research Station and the analysis and cryopreserve
of bull semen at Vaalharts Research Station. All components of the CASA technology
software has been procured. Training on the use of the equipment is expected to be
conducted in the new financial year. This technology will enable scientists to ensure
that semen from male animals with excellent seminal quality is cryopreserved for
future use.
Technology development and transfer in the field of sustainable crossbreeding
with beef cattle in semi-arid areas of South Africa
An article ‘Factors affecting the pre-weaning performance of Nguni and Angus x Nguni
calves in an arid environment of South Africa’ was published in the Applied Animal
Husbandry & Rural Development Journal. This research is the combined efforts of the
Department and the ARC and was conducted at Vaalharts Research Station. The
results indicated that crossbreeding can increase the weaning weight of calves of
Nguni cows with an average of 32 kg. Cow efficiency was also improved with 22% and
these results can be implemented in determining breeding strategies of producers.
Further investigations are needed into the reasons for the large variation in weaning
weights and the effect of epigenetics on phenotypic diversity (the molecular
mechanisms of environmental control over genetic activity and gene expression). The
survey of the dam with DAFF scientists and the technical partner was conducted
yesterday, 4 June 2017.
An article ‘Evaluating breed complementarity and sexed semen with maternal use of
Afrikaner germplasm’ was published in the Agricultural Sciences (2017, 8:507-517).
The objective of the study was to assess productivity of five simulated production
systems. The results indicated that crossbreeding could be applied as a commercially
appropriate technology to potentially improve production efficiency relative to straight-
bred production system using adapted germplasm.
At the recently held joint conference: 3rd AFAAS Africa-wide Agricultural Extension
Week and 51st Annual Conference of the South African Society for Agricultural
Extension the Directorate was part of the Organizing Committee, made a platform
presentation anda poster presentation. The platform presentation ‘Crossbreeding in
173
beef cattle for increased efficiency in response to environmental conditions’ focused
on the improvement of production in Angus x Nguni cows. This presentation received
the SASAE Award for the 3rd Best Scientific paper at the Conference. The poster
presentation ‘Literature review: Effects of global warming on homeothermy and
production in beef cattle’ identified adaptation strategies that will be needed to optimise
homeothermy and identified knowledge gaps for future research.
174
175
4.6 Programme 6: Agricultural Economics Services
Purpose: The purpose of the programme is to provide timely and relevant agricultural
economic services to the sector in support of sustainable agricultural and agri-
business development to increase economic growth.
Sub- Programmes:
Agri-business Support and Development
Macroeconomics Support
Strategic Objectives:
To provide Agri-Businesses support through entrepreneurial development,
marketing services, value adding, production and resource economics.
To provide macroeconomic and statistical information on the performance of
the agricultural sector in order to inform planning and decision making
Strategic objectives, performance indicators planned targets and actual outputs
Strategic objectives:
Programme: 6 Agricultural Economics Services
Strategic objective
Actual Achievement
2016/2017
Planned Target
2017/2018
Actual Achievement
2017/2018
Deviation from planned target to
Actual Achievement for
2017/2018
Comment on deviations
To provide Agri-Businesses support services through entrepreneurial development, marketing services, value adding, production and resource economics.
32 32 32 0
To provide macroeconomic and statistical information on the performance of the agricultural sector in order to inform planning and decision
making
14 14 14 0
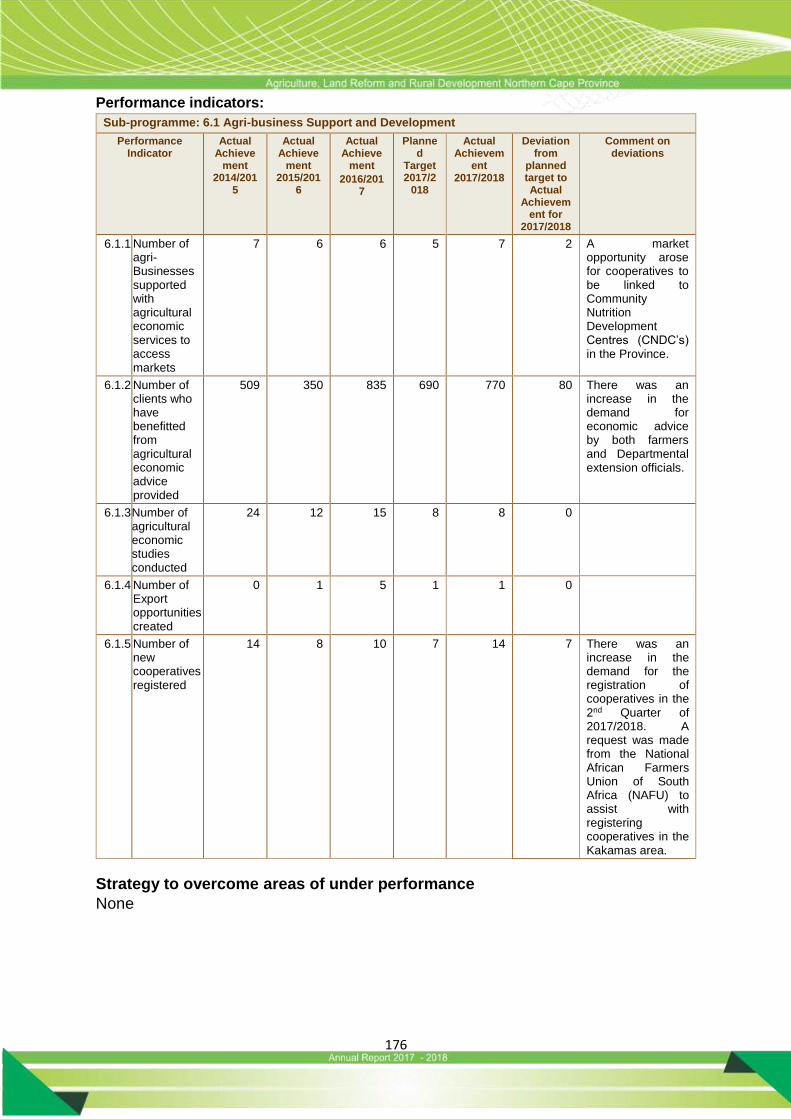
176
Performance indicators:
Strategy to overcome areas of under performance
None
Sub-programme: 6.1 Agri-business Support and Development
Performance Indicator
Actual Achieve
ment 2014/201
5
Actual Achieve
ment 2015/201
6
Actual Achieve
ment
2016/2017
Planned
Target 2017/2
018
Actual Achievem
ent 2017/2018
Deviation from
planned target to Actual
Achievement for
2017/2018
Comment on deviations
6.1.1 Number of agri-Businesses supported with agricultural economic services to access markets
7 6 6 5 7 2 A market opportunity arose for cooperatives to be linked to Community Nutrition Development Centres (CNDC’s) in the Province.
6.1.2 Number of clients who have benefitted from agricultural economic advice provided
509 350 835 690 770 80 There was an increase in the demand for economic advice by both farmers and Departmental extension officials.
6.1.3 Number of agricultural economic studies conducted
24 12 15 8 8 0
6.1.4 Number of Export opportunities created
0 1 5 1 1 0
6.1.5 Number of new cooperatives registered
14 8 10 7 14 7 There was an increase in the demand for the registration of cooperatives in the 2nd Quarter of 2017/2018. A request was made from the National African Farmers Union of South Africa (NAFU) to assist with registering cooperatives in the Kakamas area.

177
Sub-programme: 6.2 Macroeconomic Support
Performance Indicator
Actual Achievem
ent 2014/2015
Actual Achievem
ent 2015/2016
Actual Achievem
ent
2016/2017
Planned
Target 2017/20
18
Actual Achievem
ent 2017/2018
Deviation from
planned target to Actual
Achievement for
2017/2018
Comment on deviations
6.2.1 Number of agricultural economic information responses provided
5 5 8 8 8 0
6.2.2 Number of economic reports compiled
14 12 12 12 12 0
6.2.3 Number of new enterprise budgets (combuds) developed
6 5 5 4 4 0
6.2.4 Enterprise budgets (combuds) annual prices updated and report generated
1 1 1 1 1 0
6.2.5 Functional statistical economic database available
1 1 1 1 1 0
Strategy to overcome areas of under performance
None
Changes to planned targets
None
Linking performance with budgets
Sub programme expenditure
Pr6: Agricultural Economics
2017/2018 2016/2017
Final Actual (Over)/Under Final Actual (Over)/Under
Appropriation Expenditure Expenditure Appropriation Expenditure Expenditure
R’000 R’000 R’000 R’000 R’000 R’000
Agric-Business Support and Development 4 262 4 262 - 2 987 2 987 -
Macroeconomics Support 5 454 5 454 - 6 074 6 056 18
Total 9 716 9 716 - 9 061 9 043 18
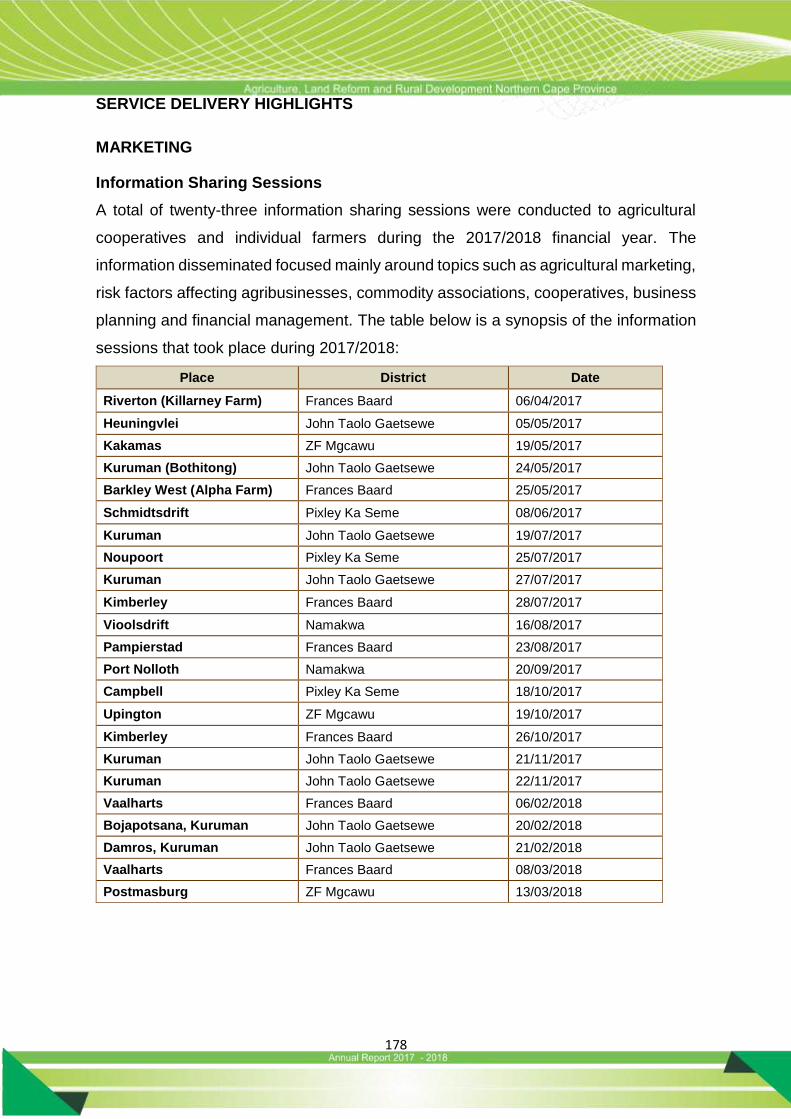
178
SERVICE DELIVERY HIGHLIGHTS
MARKETING
Information Sharing Sessions
A total of twenty-three information sharing sessions were conducted to agricultural
cooperatives and individual farmers during the 2017/2018 financial year. The
information disseminated focused mainly around topics such as agricultural marketing,
risk factors affecting agribusinesses, commodity associations, cooperatives, business
planning and financial management. The table below is a synopsis of the information
sessions that took place during 2017/2018:
Place District Date
Riverton (Killarney Farm) Frances Baard 06/04/2017
Heuningvlei John Taolo Gaetsewe 05/05/2017
Kakamas ZF Mgcawu 19/05/2017
Kuruman (Bothitong) John Taolo Gaetsewe 24/05/2017
Barkley West (Alpha Farm) Frances Baard 25/05/2017
Schmidtsdrift Pixley Ka Seme 08/06/2017
Kuruman John Taolo Gaetsewe 19/07/2017
Noupoort Pixley Ka Seme 25/07/2017
Kuruman John Taolo Gaetsewe 27/07/2017
Kimberley Frances Baard 28/07/2017
Vioolsdrift Namakwa 16/08/2017
Pampierstad Frances Baard 23/08/2017
Port Nolloth Namakwa 20/09/2017
Campbell Pixley Ka Seme 18/10/2017
Upington ZF Mgcawu 19/10/2017
Kimberley Frances Baard 26/10/2017
Kuruman John Taolo Gaetsewe 21/11/2017
Kuruman John Taolo Gaetsewe 22/11/2017
Vaalharts Frances Baard 06/02/2018
Bojapotsana, Kuruman John Taolo Gaetsewe 20/02/2018
Damros, Kuruman John Taolo Gaetsewe 21/02/2018
Vaalharts Frances Baard 08/03/2018
Postmasburg ZF Mgcawu 13/03/2018
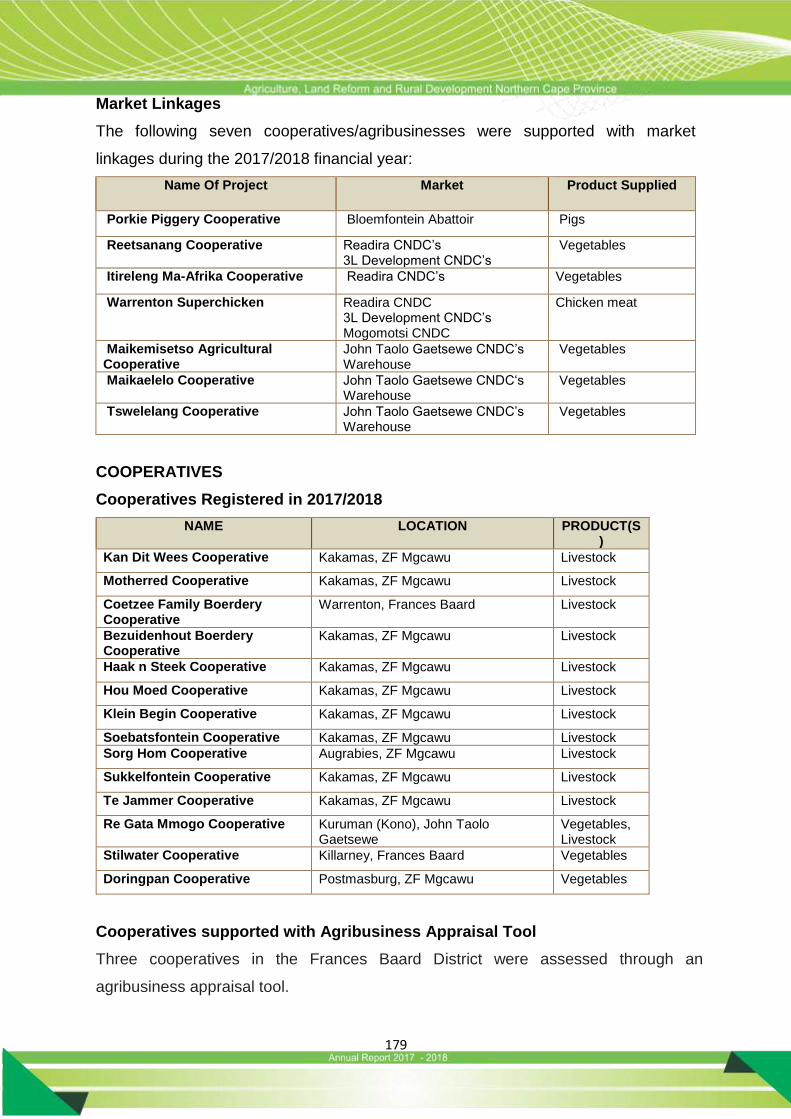
179
Market Linkages
The following seven cooperatives/agribusinesses were supported with market
linkages during the 2017/2018 financial year:
Name Of Project Market Product Supplied
Porkie Piggery Cooperative Bloemfontein Abattoir Pigs
Reetsanang Cooperative Readira CNDC’s 3L Development CNDC’s
Vegetables
Itireleng Ma-Afrika Cooperative Readira CNDC’s Vegetables
Warrenton Superchicken Readira CNDC 3L Development CNDC’s Mogomotsi CNDC
Chicken meat
Maikemisetso Agricultural Cooperative
John Taolo Gaetsewe CNDC’s Warehouse
Vegetables
Maikaelelo Cooperative John Taolo Gaetsewe CNDC‘s Warehouse
Vegetables
Tswelelang Cooperative John Taolo Gaetsewe CNDC’s Warehouse
Vegetables
COOPERATIVES
Cooperatives Registered in 2017/2018
NAME LOCATION PRODUCT(S)
Kan Dit Wees Cooperative Kakamas, ZF Mgcawu Livestock
Motherred Cooperative Kakamas, ZF Mgcawu Livestock
Coetzee Family Boerdery Cooperative
Warrenton, Frances Baard Livestock
Bezuidenhout Boerdery Cooperative
Kakamas, ZF Mgcawu Livestock
Haak n Steek Cooperative Kakamas, ZF Mgcawu Livestock
Hou Moed Cooperative Kakamas, ZF Mgcawu Livestock
Klein Begin Cooperative Kakamas, ZF Mgcawu Livestock
Soebatsfontein Cooperative Kakamas, ZF Mgcawu Livestock
Sorg Hom Cooperative Augrabies, ZF Mgcawu Livestock
Sukkelfontein Cooperative Kakamas, ZF Mgcawu Livestock
Te Jammer Cooperative Kakamas, ZF Mgcawu Livestock
Re Gata Mmogo Cooperative Kuruman (Kono), John Taolo Gaetsewe
Vegetables, Livestock
Stilwater Cooperative Killarney, Frances Baard Vegetables
Doringpan Cooperative Postmasburg, ZF Mgcawu Vegetables
Cooperatives supported with Agribusiness Appraisal Tool
Three cooperatives in the Frances Baard District were assessed through an
agribusiness appraisal tool.

180
The Department of Agriculture, Land Reform & Rural Development worked jointly with
Department of Agriculture, Forestry & Fisheries. The assessment was conducted to
monitor the management and production of each cooperative. The cooperatives
received their assessment reports which outlined their challenges, strengths and
weaknesses as well as where they need to improve.
The following cooperatives were assessed:
Reetsanang Agricultural Cooperative in Barkley West
Killarney Agricultural Cooperative in Killarney
Pniel Youth Agricultural Cooperative in Pniel
Cooperative Incentive Workshop in Kimberley
The Department arranged and facilitated a cooperative incentive workshop, where
each cooperative was represented by two or three of its members. The purpose of the
workshop was to expose cooperatives to different financial support institutions that are
out there for them to pursue, grow and maintain their businesses. Four stakeholders
were invited to be key role players and present on the services they provide for farmers
and cooperatives.
These are the four stakeholders that gave critical information and advice to
cooperatives:
National Empowerment Fund (NEF)
Small Enterprise Financial Agency (SEFA)
Standard Bank
Mme Rekathusa

181
Agricultural Cooperative Summit in Kimberley
The Department of Social Development together with the Department of Agriculture,
Land Reform & Rural Development hosted an Agricultural Cooperative Summit in
December 2017 at the Protea Hotel in Kimberley.The event was attended by
agricultural cooperatives and Community Nutrition Development Centres (CNDC’s).
The summit focused around empowering cooperatives by challenging them to see
beyond their current frame of thinking and to change their perception towards the
challenges that they are faced with.
ECONOMIC STUDIES
Eight economic studies were developed during the financial year:
SA GAP Certification
SA GAP certification plays a pivotal role in ensuring farmers are involved in good
agricultural practices on their farms by focusing around areas of hygiene and safety.
This certification ensures a final product that is safe to consume and therefore it is
becoming increasingly vital that farmers be certified. A total of 29 farmers were
supported during the financial year, of which 28 were SA GAP certified.
Economic Article
The Impact of South Africa’s Credit Rating Downgrade on the Agricultural Sector.
Name Of Study Type Date
Food Cost Review in the Rural Areas of the Northern Cape Province
Food Cost Review June 2017
Itireleng Ma Afrika in Platfontein – Vegetable Project Business Plan
Business Plan June 2017
Future Development of Vineyard Production: Blocuso Trust
Feasibility Study August 2017
Maize Production Output Report September 2017
Agricultural Commodities Price Analysis Quarterly Outlook Analysis
October 2017
African Heritage Village – Vegetable Project Business Plan
Business Plan November 2017
Manyeding Hydroponic Viability Study Viability Study January 2018
Mamasetara Farming Cooperative -Business Plan Business Plan March 2018
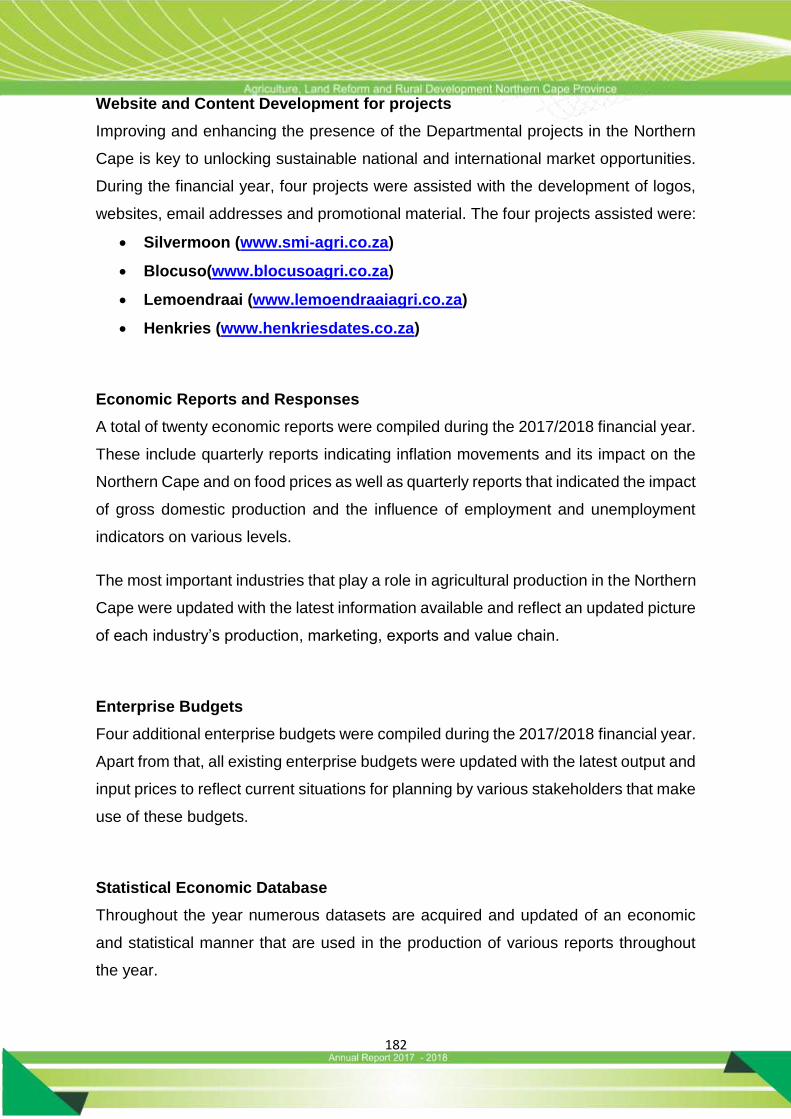
182
Website and Content Development for projects
Improving and enhancing the presence of the Departmental projects in the Northern
Cape is key to unlocking sustainable national and international market opportunities.
During the financial year, four projects were assisted with the development of logos,
websites, email addresses and promotional material. The four projects assisted were:
Silvermoon (www.smi-agri.co.za)
Blocuso(www.blocusoagri.co.za)
Lemoendraai (www.lemoendraaiagri.co.za)
Henkries (www.henkriesdates.co.za)
Economic Reports and Responses
A total of twenty economic reports were compiled during the 2017/2018 financial year.
These include quarterly reports indicating inflation movements and its impact on the
Northern Cape and on food prices as well as quarterly reports that indicated the impact
of gross domestic production and the influence of employment and unemployment
indicators on various levels.
The most important industries that play a role in agricultural production in the Northern
Cape were updated with the latest information available and reflect an updated picture
of each industry’s production, marketing, exports and value chain.
Enterprise Budgets
Four additional enterprise budgets were compiled during the 2017/2018 financial year.
Apart from that, all existing enterprise budgets were updated with the latest output and
input prices to reflect current situations for planning by various stakeholders that make
use of these budgets.
Statistical Economic Database
Throughout the year numerous datasets are acquired and updated of an economic
and statistical manner that are used in the production of various reports throughout
the year.
183
Financial Recordkeeping Training
During the 2017/2018 financial year training was provided at eleven different venues
in the Districts of Frances Baard, Pixley ka Seme, ZF Mgcawu and Namakwa and
benefitted 146 land reform farmers.These farmers were introduced to how finances
are incorporated into farming practises and decision making.The training events were
also attended by 52 youth farmers (36% of participants) and 63 female farmers (43%
of participants).
184
185
4.7 Programme 7: Rural Development Coordination
Purpose: The purpose of the programme is to co-ordinate the intervention
programmes of all departments and institutions in rural areas to ensure that the land
and agrarian reform and rural development mandate is achieved. To coordinate joint
planning, identify specific areas for targeted interventions, and monitor progress with
CRDP implementation plans in the province.
Sub- Programmes:
Development Planning and monitoring
Social Facilitation
Strategic Objectives:
To ensure Comprehensive Rural Development;
To support development structures at CRDP Sites; and
To facilitate provision of services to 2500 farmworkers and dwellers.

186
Strategic objectives, performance indicators planned targets and actual outputs
Strategic Objectives:
Programme: 7 Rural Development Coordination
Strategic objective
Actual Achievement
2016/2017
Planned Target
2017/2018
Actual Achievem
ent 2017/2018
Deviation from planned target
to Actual Achievement for 2017/2018
Comment on deviations
To ensure Comprehensive Rural Development
5 5 5 0
To support development structures at CRDP Sites
5 5 5 0
To facilitate provision of services to 2500 farmworkers and dwellers.
855 500 771 271 Due to the comprehensive labour inspections that were conducted in conjunction with the Department of Labour in the ZFM District.
Performance indicators:
Sub-programme: 7.1 Development Planning and Monitoring
Performance Indicator
Actual Achieve
ment
2014/2015
Actual Achievem
ent
2015/2016
Actual Achievem
ent
2016/2017
Planned
Target 2017/20
18
Actual Achievem
ent
2017/2018
Deviation from
planned target to Actual
Achievement for
2017/2018
Comment on
deviations
7.1.1 Number of approved outcome 7 CRDP programme of action
- - - 1 1 0
7.1.2 Number of outcome 7 Provincial Technical implementation forum meetings convened
5 5 3 4 3 -1 The Technical Implementation Forum was not yet established hence it did not convene on the 1st quarter of the last financial year.
7.1.3 Number of reports on outcome 7
4 4 4 4 4 0

187
Strategy to overcome areas of under performance
None
Sub-programme: 7.2 Social Facilitation
Performance Indicator
Actual Achievement
2014/2015
Actual Achievem
ent
2015/2016
Actual Achievem
ent
2016/2017
Planned Target
2017/2018
Actual Achievem
ent 2017/2018
Deviation from
planned target to Actual
Achievement for
2017/2018
Comment on deviations
7.2.1 Number of structures supported to achieve social cohesion and development
15 12 5 5 5 0
7.3.1 Number of farmworker advocacy sessions held
15 25 21 20 24 4 The Department responded to the requests for more information sessions in relation to the minimum wage to be implemented in May 2018.
7.3.2 Number of Provincial delivery forum meetings
held
4 4 3 4 4 0
7.3.3 Number of farm workers and dwellers assisted to access governme
nt services
500 550 860 500 771 271 This was due to the comprehensive labour inspections that were conducted in conjunction with the Department of Labour in the ZFM
District.

188
Strategy to overcome areas of under performance
In responding to the challenge of access to farms the Department managed to hold a
Meeting with AgriNoord-Kaap and the agreement is that AgriNoord-Kaap will facilitate
on behalf of the Department meetings with their District chapters to address the
problem of access to farms in the new financial year (18/19).A collaborative program
with SASSA, DRDLR, Department of Labour and Non-Governmental Organisations
servicing farmworkers and dwellers were embarked upon to increase delivery of
services in the farming communities.
The Provincial Technical Implementation Forum (PTIF)resolved that the Outcome 7
Coordinator and the Chairperson meet with Municipal Managers to persuade them to
send representatives to meetings and also to attend delivery partners’ quarterly review
meetings.
Changes to planned targets
None
Linking performance with budgets
Sub programme expenditure
Pr7: Rural Development
2017/2018 2016/2017
Final Actual (Over)/Under Final Actual (Over)/Under
Appropriation Expenditure Expenditure Appropriation Expenditure Expenditure
R’000 R’000 R’000 R’000 R’000 R’000
Rural Development Coordination 15 096 15 096 - 13 638 13 630 8
Total 15 096 15 096 - 13 638 13 630 8
189
SERVICE DELIVERY HIGHLIGHTS
Outcome 7 coordination
The objective of Outcome 7 is to coordinate plans of all sector departments and delivery
partners on the implementation of the Comprehensive Rural Development Program (CRDP).
The sub outcomes are:
Improved land administration and spatial planning for integrated development in rural
areas.
Sustainable Land Reform contributing to agrarian transformation.
Improved food security
Smallholder producers' development and support (technical, financial, infrastructure) for
agrarian transformation.
Increased access to quality infrastructure and functional services, particularly in
education, healthcare and public transport in rural areas.
Growth of sustainable rural enterprises and industries – resulting in rural job creation.
Provincial Technical Implementation Forum (PTIF)
The Implementation Forum coordinate government work towards achievement of the
Outcomes’ objective. The Implementation Forum functions with clearly determined objectives
and mandates. The Department convened 3 Provincial Technical Implementation Forums for
Outcome 7 for the financial year to receive reports from delivery partners. Presentations were
also made to the National Technical Implementation Forum Meetings, and at the Provincial
Clusters.
The ZF Mgcawu Technical IGR Meeting, Pixley Ka Seme Technical IGR and Namakwa
District Municipality were engaged to ensure alignment with the Programme of Action and the
MTSF priorities alignment with the Municipal Integrated Development Plans (IDPs) and
Provincial Plan. Outcome 7 was also at the John Taolo Gaetsewe District Joint Planning
Committee Meeting.
Council of Stakeholders (CoS)
Objective of the CoS is to ensure that members of society participate in their own
development. The composition of this committee is representatives of organised formations
in the community. The public representatives at a municipal level also participate at this level
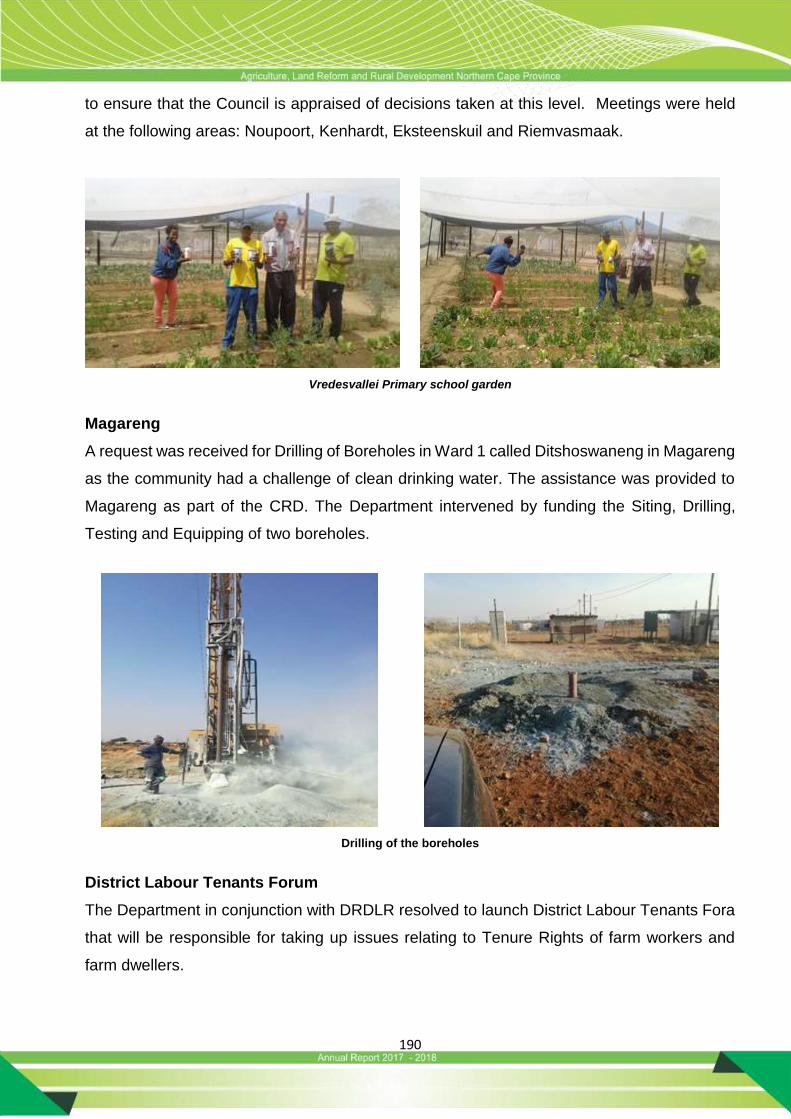
190
to ensure that the Council is appraised of decisions taken at this level. Meetings were held
at the following areas: Noupoort, Kenhardt, Eksteenskuil and Riemvasmaak.
Vredesvallei Primary school garden
Magareng
A request was received for Drilling of Boreholes in Ward 1 called Ditshoswaneng in Magareng
as the community had a challenge of clean drinking water. The assistance was provided to
Magareng as part of the CRD. The Department intervened by funding the Siting, Drilling,
Testing and Equipping of two boreholes.
Drilling of the boreholes
District Labour Tenants Forum
The Department in conjunction with DRDLR resolved to launch District Labour Tenants Fora
that will be responsible for taking up issues relating to Tenure Rights of farm workers and
farm dwellers.

191
Three District Labour Tenants Forums were established in the John Taolo Gaetsewe, Pixley
ka Seme and the ZFM Districts. The objective of these for is to enable harmonious
relationship between employers and employees in the agricultural sector. These forums are
also entrusted with the responsibility of the reporting farm evictions as soon as they arise.
Government Services
The department facilitated access to public services to 771 farm workers and dwellers. These
included provision of health packs, clothing, food parcels, school shoes, Identity Documents
(ID), social relief intervention for farmworkers and dwellers from the Department of Health,
SASSA and national Youth Development Agency.
Furthermore, the Department managed to stop the desecration of graves by Kitso Mining
Company in Postmansburg with the assistance of the McGregor Museum and South African
Heritage Association. The Department of Minerals and Energy was advised to immediately
instruct the Company to halt all mining operations pending finalization of investigations on the
matter.
Skeletons from the exhumed graves at the mining site
The following farms were visited to monitor compliance with the relevant legislation
particularly the Labour Relations Act, Basic Conditions of Employment Act, Sectoral Wage
Determination Act and basic government services:
De Heuwel Boerdery
Witklip Boerdery
Steynmond Boerdery
Karstens Boerdery
Chargo Trust
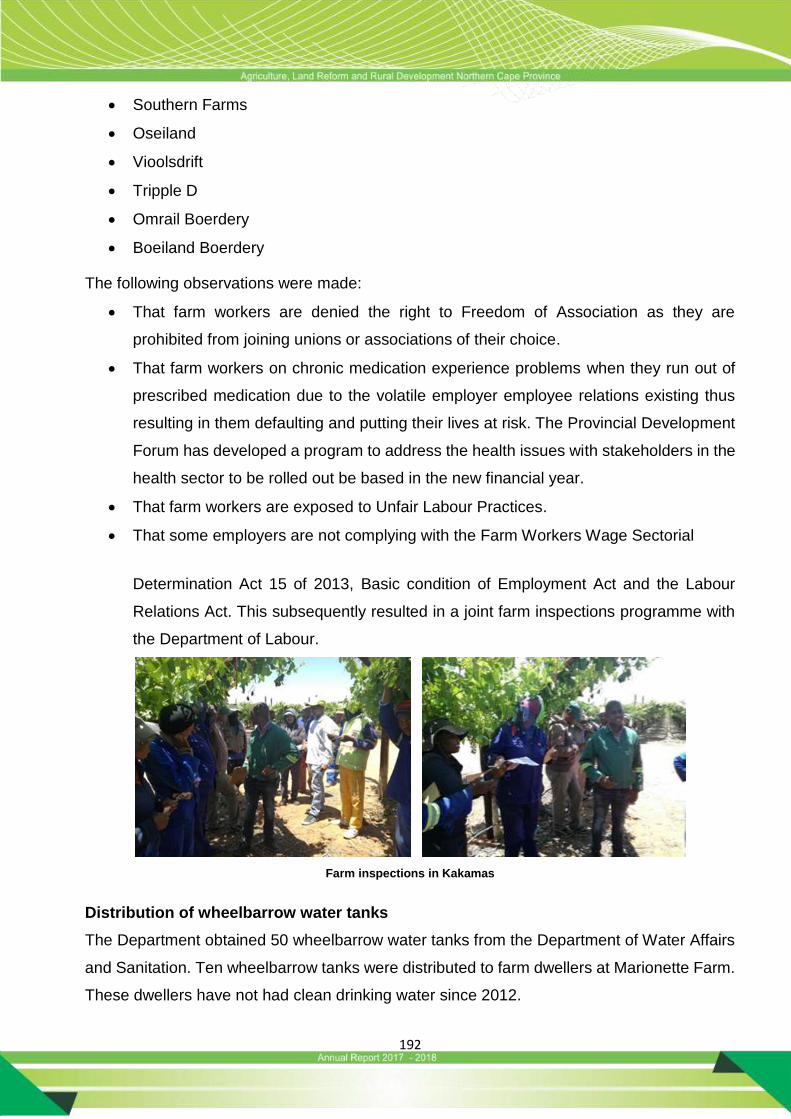
192
Southern Farms
Oseiland
Vioolsdrift
Tripple D
Omrail Boerdery
Boeiland Boerdery
The following observations were made:
That farm workers are denied the right to Freedom of Association as they are
prohibited from joining unions or associations of their choice.
That farm workers on chronic medication experience problems when they run out of
prescribed medication due to the volatile employer employee relations existing thus
resulting in them defaulting and putting their lives at risk. The Provincial Development
Forum has developed a program to address the health issues with stakeholders in the
health sector to be rolled out be based in the new financial year.
That farm workers are exposed to Unfair Labour Practices.
That some employers are not complying with the Farm Workers Wage Sectorial
Determination Act 15 of 2013, Basic condition of Employment Act and the Labour
Relations Act. This subsequently resulted in a joint farm inspections programme with
the Department of Labour.
Farm inspections in Kakamas
Distribution of wheelbarrow water tanks
The Department obtained 50 wheelbarrow water tanks from the Department of Water Affairs
and Sanitation. Ten wheelbarrow tanks were distributed to farm dwellers at Marionette Farm.
These dwellers have not had clean drinking water since 2012.

193
This matter was report to the Land Rights Facilitation Committee at DRDLR for their
intervention and also requested them to negotiate with the farmer to sell a portion of the land
in order to secure their tenure rights.
Forty other wheelbarrow tanks were distributed to the following farm communities: Majeng,
Koedoesberg Farm, Eifel, Ncwueng, Gasehubane, Realeboga, Sidneyshope and
Thagadipelajang Informal Settlement.
Marionette Farm Dwellers Receiving Wheelbarrow Tanks
Lawyers for Human Rights (LHR) Training
The Department in collaboration with the Lawyers for Human Rights conducted training for
farmworkers and dwellers in Prieska, Augrabies and Louriesfontein focusing on the law
protecting farmworkers and occupiers’, rights and duties of farm owner, farmworkers and
people residing on the farms on the farms evictions, granting of and effect of eviction orders
employees, security of tenure act, Basic Conditions of Employment Act and the Sectorial
Determination act 13 of 2013.
Farm Evictions
The Department managed to avert threat of evictions of an elderly couple, Mr and Mrs
Grasvoet, in Grobblershoop. The Department of Health was contacted to provide Mr Dawid
Grasvoet with a wheelchair.
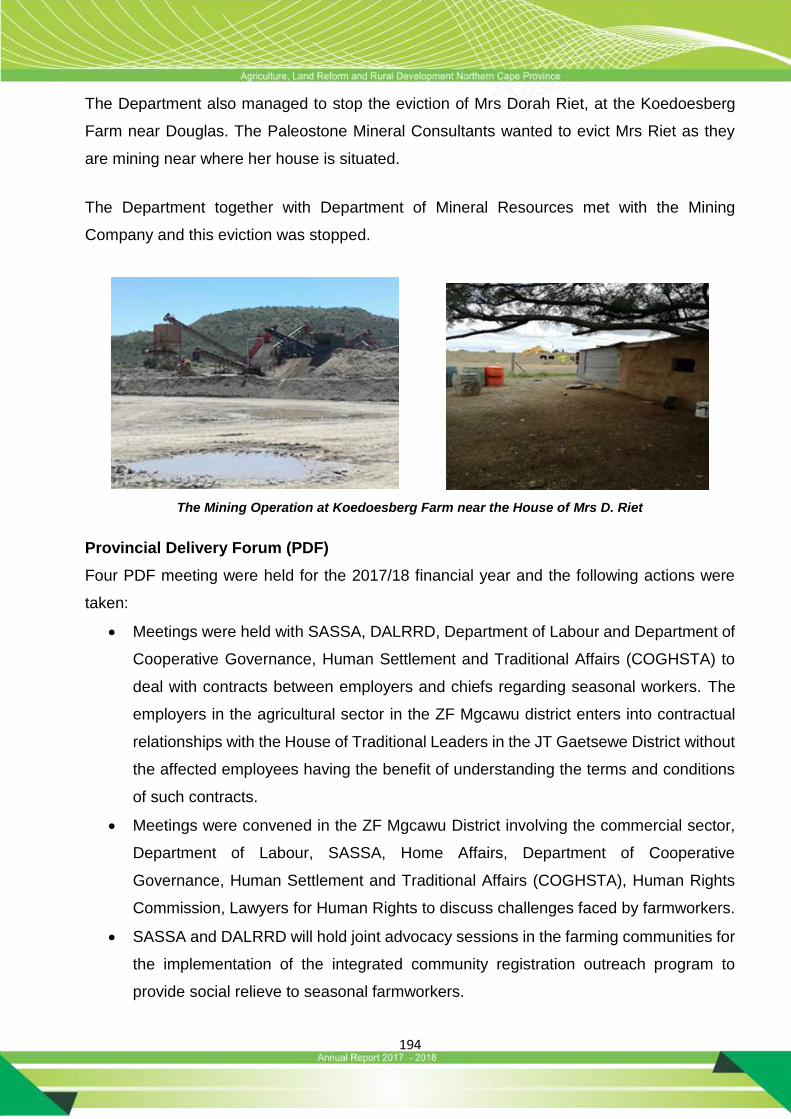
194
The Department also managed to stop the eviction of Mrs Dorah Riet, at the Koedoesberg
Farm near Douglas. The Paleostone Mineral Consultants wanted to evict Mrs Riet as they
are mining near where her house is situated.
The Department together with Department of Mineral Resources met with the Mining
Company and this eviction was stopped.
The Mining Operation at Koedoesberg Farm near the House of Mrs D. Riet
Provincial Delivery Forum (PDF)
Four PDF meeting were held for the 2017/18 financial year and the following actions were
taken:
Meetings were held with SASSA, DALRRD, Department of Labour and Department of
Cooperative Governance, Human Settlement and Traditional Affairs (COGHSTA) to
deal with contracts between employers and chiefs regarding seasonal workers. The
employers in the agricultural sector in the ZF Mgcawu district enters into contractual
relationships with the House of Traditional Leaders in the JT Gaetsewe District without
the affected employees having the benefit of understanding the terms and conditions
of such contracts.
Meetings were convened in the ZF Mgcawu District involving the commercial sector,
Department of Labour, SASSA, Home Affairs, Department of Cooperative
Governance, Human Settlement and Traditional Affairs (COGHSTA), Human Rights
Commission, Lawyers for Human Rights to discuss challenges faced by farmworkers.
SASSA and DALRRD will hold joint advocacy sessions in the farming communities for
the implementation of the integrated community registration outreach program to
provide social relieve to seasonal farmworkers.
195
Developed a program for Voter Registration for farm workers and farm dwellers.
Launched Land Rights Management Committee.
Advocacy Sessions
The Department conducted Advocacy Sessions at the following farms and areas:
De Heuwel Boerdery, Omrail Farm, Ebenaeser Farm, Witklip Farm, Shelfco Farm, Eifel
Boerdery, Heuningsvlei, Maruping, Van Zylsrus, Louriesfontein, Prieska, Penry, Bothitong,
Steynmond.
All these Sessions were conducted after hours as it is the only time farm workers can be
accessed. Presentations were made by Departmental Officials responsible for the
Programme. Farm workers were taken through Farm Workers Wage Sectorial Determination
Act 13 of 2013 and Farm Workers Summit of May 2010. These sessions are used to educate
farm workers about their rights. The positive effects of these sessions is that more farm
workers and dwellers are now reporting any forms of violations in their working and living
environment.
State Land Administration
The objective is to facilitate and co-ordinate provision of agricultural support in the settlement
of land and agrarian reform beneficiaries.
Agricultural Potential Report (APR) Coordination
The APR assist the Department of Rural Development and Land Reform when purchasing
farms on the viability and suitability of the project.
The APR`s below were requested during the period under review and were submitted to
Department of Rural Development and Land Reform.
Project Name Location Extent (ha) Land Use District
Brakkies Farm Douglas 3000 Livestock production Pixley Ka Seme
Kalk Bult Upington 6031.6813 Livestock production ZF Mgcawu
Paauwbult Olifantshoek 3957.4776 Livestock production ZF Mgcawu
Portion 1,2,3 of farm secretaris no 89
Sol Plaatje 1913.0348 Livestock production Frances Baard
Loog kolkies + loog kolkies restant
Kenhardt 5920.4997 Livestock production ZF Mgcawu
Elkelende kameelboom Upington 8117.2537 Livestock Production ZF Mgcawu
Hendrik zyn puts Upington 5927.3605 Livestock production ZF Mgcawu
196
Project Name Location Extent (ha) Land Use District
Bloubos ( Remainder of Klein Lemoen Kop farm No. 321)
Frazerburg Livestock Production Namakwa
Doorn laagte Barkly West Livestock production Frances Baard
Brakkies Farm Douglas Livestock Production Pixley Ka Seme
Portion 1 of farm secretaries no 89,portion 2 of farm secretaries no 89 and portion 3 of farm secretaries no 89
Kimberley 1913.0348 Livestock production Frances Baard
Farm Roily Grobleershoop 5531 Livestock production and vine yard
ZF Mcgawu
Farm Bellsbank No. 54 Barkly West 3524.5949 Livestock production Frances Baard
Farm Bellsbank No. 55 Upington 5335.8988 Livestock Production Frances Baard
Farm Bellbank No. 107 Upington 1679.5108 Livestock production Frances Baard
Farm Springfield Warrenton 957 Livestock production Frances Baard
Farm No. 137 Vaalharts settlement a
Jan Kempdorp 24 Crop production Frances Baard
Portion 1 of the farm Greeffputs No. 169
Barkly West 2108.1774 Livestock production Frances Baard
Economic Viability Studies for the following farms were conducted and sent to DRDLR
Project Name District Land Use
Portion 1/2/3 of farm Secretaris NO.89, Frances Baard Livestock production
Farm Roily ZF Mgcawu Livestock Production
Bellsbank No. 54 Namakwa Livestock production
Bellsbank No. 55 Frances Baard Livestock production
Bellsbank No. 107 Frances Baard Livestock production
Support to emerging farmers on state land
Lot 40 Rietrivier Settlement
The unit assisted beneficiaries to plot the borders of the farm
Drieplotte
The unit revived the project steering committee, meetings were held monthly. The purpose of
the meeting was to discuss progress and to ensure that developments are support for the
farm to produce to its maximum capacity.
Carnarvon Women Projects:

197
Two female farmers; Ms Snyders and Ms Malan are occupying the farm. Mrs Snyders have
the following livestock: Ewes 244, Lambs 70 and Rams 8.
Eiland Women project
The project members were advised to go to Small Enterprise Development Agency (SEDA)
to register their business as a legal entity, the business is now registered.
Haartebees Kleinboere (Alheit)
The project was visited to assist the farmers with financial record keeping and to check the
progress of the project. The Department bought implements for farmers funded through
CASP.
Equipment bought for the project
Reikemetse community garden
This project is located in Schmidsdrift, was revived after some of the members resigned due
to old age and lack of interest. Six additional members were recruited to join the project. The
beneficiaries were trained on how to make seedling and to transplant them. The project has
planted vegetables such as beetroot and Spinach.
State Lease Contracts
The lease agreements of most farmers expired at the end of April 2017.The Department has
reviewed rentals for Drieplotte, Carnarvon, Patryskraal and Eiland to be in line with the
request from National Treasury.
Department attends the Revenue Tariff Board meetings to discuss Tariffs Framework. The
aim of the Framework is to ensure that departments follow a standard tariff determination
process.
198
The framework provides guidance on how departments must:
determine and set their own revenue tariffs and
Follow a uniform tariff application and review process.
Maphiniki Bush Control Project: EPWP
The project started on the 05 June 2017 and was completed February 2018.The total budget
of the project is R 2 044 million. The total output of the Black Thorn control is 1165 Ha out of
the planned 1000 ha. Thirty job opportunities was created.
The Ratanang and Tshepanang cooperatives from Maphiniki were assisted to register and
obtained tax clearance certificates. They were also registered on the Central Supplier
Database (CSD) in order to facilitate the ease of doing business with government and to also
apply for funding as part of the post project sustainability.
Workers applying chemicals during the bush control project
Farm Equity Schemes
The Department has received complaints from beneficiaries of the Farm Equity Schemes.
The state (DRDLR) had embarked on an empowerment programme as part of Land Reform
and Broad Based Black Economic Empowerment as a means of de-racialization of ownership
in the agricultural sector in 2002.The schemes were accessed as part of the Redistribution
component of Land Reform. Farmworkers and dwellers applied for grants from the state
through the Land Redistribution for Agricultural Distribution (LRAD) and further took bank
loans to buy equity in some farming operations. In some schemes the DALRRD used the

199
4000 of Ha of water rights allocated to the Province as contribution in the schemes. The
following farms participated in the Scheme:
Vaallus – Douglas, Salt Lake –Douglas, Jonkerwater – Prieska, Rekopane – Kakamas,
Sonvrucht – Kakamas, Opwag Farm – Grobblershoop, Sheep power equity- Colesburg,
Vaalharts Cotton –Hartswater, Augrabies – Kakamas, Badirammogo – Sonvrucht, Sosarona
– Kakamas, Komnader –Douglas, Lorethlabetse - Little River Trading 921, Pella – Pelsan,
Rekathusanya, Sandraai Arbeidsgenot, Thusano Empowerment, Bakenrant Empowerment
Farm.
In most instances the Black Board Directors (farmworkers/dwellers) of the companies which
were created as a consequence of the equity schemes did not realise the intendant
transformation objective of the State. They were not exposed to the running of the companies
nor were the terms and conditions of the agreements executed/implemented like making the
financials of the company available to shareholders, transference of skills or the convening of
shareholders’ meetings as prescribed by the Companies Act or the Property Trust Act.
The contributions by the farm dwellers and farm workers was largely attributable to the
expansions of the businesses. Shareholders/beneficiaries in most schemes were given
between R10 000 and R20 000 after ten years of the operations. The majority shareholders
would claim takeover by “new owners” as a means of getting rid of their partners. Most of the
enterprises made their shareholders to sign for “dividends” only for them to realise that they
have resold their shares to their commercial partners. Their status remained as those of
farmworkers and most were dismissed as there as it is claimed that the juristic person, the
Trust and not the individual owned the shares. This made it easy for the previous owners to
dismiss their “partners”, (farm workers and dwellers) who then also lost their shares. Farm
dwellers who participated in these schemes were found worse off after the implementation of
these schemes. They were not only dismissed, evicted, but also lost their movable properties
and security of tenure.
The Farm Equity Scheme Task Team was established by the Department to seek redress for
the beneficiaries who participated in these schemes. The Task Team is composed of the
DALRRD, DRDLR, NPA Upington Office, Directorate of Priority Crimes, Master of the
Northern Cape High Court, Lawyers for Human Rights, Legal Aid South Africa, NAFU, AFASA

200
and Representatives of the Beneficiaries in the Province. A report back meeting with all
beneficiaries will be held on the 27 May 2018 and to seek a mandate to institute a forensic
audit. It is intended that the forensic audit shall investigate current status of legal entity,
determine the bonafides of the appointed trustees in administering the Trust on behalf of the
beneficiaries, confirm if the decision to “sell shares” was as a result of a resolution by majority
members or beneficiaries at a properly constituted board meeting, obtain audited annual
financial statements for the period before and after the collapse of the schemes, determine
and verify current ownership and shareholding details, investigate current financial status
considering existing assets and liabilities, valuation of the enterprises considering movable
and immovable assets, detailed due diligence on the operational and technical aspects of the
enterprise relating to the farming industry.
Based on the findings of the forensic audit and other external factors, compile a detailed legal
report on the possible criminal and civil liability of the shareholders/management. Facilitate
the restoration of shares and monetary compensation based on the findings of the forensic
report and legal report.

201
5. TRANSFER PAYMENTS
A three-year turnaround strategy was presented to the portfolio committee with regard to the
sustainability of the Kalahari Kid Cooperation during the year under review. The strategy was
approved implementation commenced immediately. It is projected that the Kalahari Kid
Cooperation will be completely self-sustainable by the end of the 2018/19 financial year.
The transfer payment to the National Agricultural Marketing Council (NAMC) was for the
Agriculture Information Management System (AIMS) which is being developed for the country.
The table below reflects the transfer payments made to public entities for the period 1 April 2017
to 31 March 2018
Name of Public Entity Amount transferred to the public entity Amount transferred to the
public entity (R’000)
Kalahari Kid Corporation Management of the production farm
Marketing of animals and animal products
Marketing of animals from co-operatives and procurement of goods from emerging farmers
R8 279
National Agricultural Marketing Council
Market and economic research
Statutory measures
Agricultural trust
Agri-business development
R4 500
A total amount of R9.600 million was transferred to Nieuwoudtville Rooibos (Pty) Ltd for the
financial year 2017/18. An amount of R7.0 million was transferred for the purpose of acquiring a
stick pack machine for the rooibos tea factory. The remaining amount of R2.0 million was
transferred so that the company can influence the rooibos industry by supporting upstream and
downstream development in the rooibos industry. The table below reflects the transfer payments
made for the period 1 April 2017 to 31 March 2018
Name of transferee Type of organisation
Purpose for which the funds were used
Did the dept. comply with s 38 (1) (j) of the
PFMA
Amount transferred
(R’000)
Niewoudtville Rooibos (Pty) Ltd
Private Enterprise Capital acquisitions for rooibos tea factory and upstream and downstream development of the rooibos industry
Yes R9 600

202
6. CONDITIONAL GRANTS
Conditional grants and earmarked funds received
Conditional Grant
2017/2018 2016/2017
Final Appropriation
Actual Expenditure
Over/ Under Expenditure
Final Appropriation
Actual Expenditure
Over/Under Expenditure
R’000 R’000 R’000 R’000 R’000 R’000
1. Comprehensive Agricultural Support Programme Grant
244 381 227 836 16 545 129 924 118 314 11 610
2. Ilima / Letsema Projects Grant
61 679 61 675 4 55 222 52 022 3 200
3. LandCare Programme Grant: Poverty Relief and Infrastructure Development
7 095 6 621 474 9 320 9 306 14
4. Expanded Public Works Programme Integrated Grant
2 044 2 044 - 2 000 1 992 8
Total 315 199 298 176 17 023 196 466 181 634 14 832
The total budget allocation for the 2017/18 financial year amounted to R315.199 million of
which R298.176 million or 95 percent was spent.
The full amount that was appropriated to the Department was received and none of the funds
were withheld by any of the transferring departments. All the funds of the conditional grants
that were appropriated to the Department were transferred into the accredited bank account
of the Provincial Treasury and then subsequently transferred into the bank account of the
Department.
The unspent portions of the CASP and LandCare were requested for rollover to the 2018/19
financial year since these funds were committed to identifiable projects. The specific
performance of each grant is discussed in detail under the relevant programme that
administers and implements the grants.
203
The tables below details the conditional grants received during for the period 1 April 2017 to
31 March 2018.
Conditional Grant: Comprehensive Agricultural Support Programme Grant
Department who transferred the grant National Department of Agriculture, Forestry and Fisheries
Purpose of the grant
To provide effective agricultural support services, promote and facilitate agricultural development by targeting beneficiaries of land reform, restitution and redistribution, and other black producers who have acquired land through private means and are engaged in value-adding enterprises domestically, or the export market; to address damages to infrastructure caused by floods.
Expected outputs of the grant
Farmer supported per category (subsistence, smallholder)
450 black commercial farmers supported
Number of CASP beneficiaries that are South African Good Agricultural Practice Standard certified
Jobs created
Youth, women and farmers with disabilities supported through CASP
On and off - farm infrastructure provided and repaired
Land under agricultural production (crop and livestock)
Yields per unit area
Beneficiaries of CASP trained on farming methods or opportunities along the value chain
Beneficiaries of CASP accessing markets
Extension personnel recruited and maintained in the system
Extension officers upgrading qualifications at various institutions
Agriculture Information Management System (AIMS) implemented in all 9 provinces
Actual outputs achieved
Farmer supported per category (subsistence, smallholder) - Subsistence: 0 - Smallholder: 901 (Male 728; Female 173
50 Commercial Farmers Supported - 63 (Male 51; Male 12)
Jobs created - Total: 246
Youth, women and farmers with disabilities supported through CASP - Youth: 82 (Male 71; Female 82) - Women: 185 - Disabled: 0
On and off - farm infrastructure provided and repaired - Boreholes drilled & equipped: 84 - Stock handling facilities: 14 - Stock water systems: 28 - Poultry structures: 1 - Inner fencing: 178 km - Border fencing: 114.5km
Beneficiaries of CASP accessing markets - Total: 964 (Male 779 ; Female 185)
Agriculture Information Management System (AIMS) implemented in the province.
- None
Amount per amended DORA R244.381 million
Amount received (R’000) R244.381 million
Reasons if amount as per DORA was not received
Not applicable
Amount spent by the Department (R’000)
R227.836 million
Reasons for the funds unspent by the entity
None responsive bids via supply chain management processes
Reasons for deviations on performance None responsive bids via supply chain management processes
Measures taken to improve performance Earlier and more intensified procurement
204
Monitoring mechanism by the receiving Department
Monthly and quarterly reporting
Ilima/Letsema Projects Grant
Department who transferred the grant National Department of Agriculture, Forestry and Fisheries
Purpose of the grant To assist vulnerable black South African farming communities to achieve an increase in agricultural production and invest in infrastructure that unlocks agricultural production
Expected outputs of the grant
Land under agricultural production (crop and livestock)
Yields per unit area
Jobs created
Beneficiaries/farmers supported by the grant per category
Hectares of rehabilitated and expanded irrigation schemes
Actual outputs achieved
Jobs created - Total: 620
Beneficiaries supported by the grant per category - Total: 545 (Male 326; Female 219)
Farmers supported by the grant per category - Subsistence: 0 - Smallholder: 402(Male 237 ; Female 165) - Black Commercial: 26 (Male 18; Female 8)
Amount per amended DORA R61.680 million
Amount received (R’000) R61.680 million
Reasons if amount as per DORA was not received
Not applicable
Amount spent by the Department (R’000)
R61.675 million
Reasons for the funds unspent by the entity
Not applicable
Reasons for deviations on performance Not applicable
Measures taken to improve performance Not applicable
Monitoring mechanism by the receiving Department
Monthly and quarterly reporting
205
Land Care Programme Grant: Poverty Relief and Infrastructure Development
Department who transferred the grant National Department of Agriculture, Forestry and Fisheries
Purpose of the grant
To promote sustainable use and management of natural resources by engaging in community based initiatives that support the pillars of sustainability (social, economic and environmental), leading to greater productivity, food security, job creation and better well-being for all
Expected outputs of the grant
Hectares of rangeland protected and rehabilitated
Hectares of land protected and rehabilitated
Number of Junior Care participants involved in the programme
Number of hectares of land where water resources are protected and rehabilitated
Number of capacity building initiatives conducted for Junior Care
Number of capacity building initiatives conducted for Land Carers
Number of awareness campaigns conducted and attended by Land Carers
Hectares of land where weeds and invader plants are under control
Number of kilometres of fence erected
Number of green jobs created expressed as full time equivalents (FTEs)
Number of Land Care committees established
Actual outputs achieved
7118 Hectares of rangeland protected and rehabilitated
11 hectares of land where water resources are protected and rehabilitated
2 capacity building initiatives conducted for Junior Care
2 capacity building initiatives conducted for Land Carers
3 awareness campaigns conducted and attended by Land Carers
192 green jobs created expressed as full time equivalents (FTEs)
Amount per amended DORA R7.095 million
Amount received (R’000) R7.095 million
Reasons if amount as per DORA was not received
Not applicable
Amount spent by the Department (R’000)
R6.621 million
Reasons for the funds unspent by the entity
Reasons for deviations on performance None
Measures taken to improve performance Stringent planning and monitoring processes
Monitoring mechanism by the receiving Department
Monthly and quarterly reporting
206
Expanded Public Works Programme Integrated Grant for Provinces
Department who transferred the grant National Department of Public Works
Purpose of the grant
To incentivise provincial departments to expand work creation efforts through the use of labour intensive delivery methods in the following identified focus areas, in compliance with the Expanded Public Works Programme (EPWP) guidelines:
road maintenance and the maintenance of buildings
low traffic volume roads and rural roads
other economic and social infrastructure
tourism and cultural industries
sustainable land based livelihoods
waste management
Expected outputs of the grant Number of people employed and receiving income through the
EPWP
Increased average duration of the work opportunities created
Actual outputs achieved
Amount per amended DORA R2.044 million
Amount received (R’000) R2.044 million
Reasons if amount as per DORA was not received
Not applicable
Amount spent by the Department (R’000) R2.044 million
Reasons for the funds unspent by the entity
Reasons for deviations on performance
Measures taken to improve performance
Monitoring mechanism by the receiving Department

207
7. CAPITAL INVESTMENT
7.1 Capital investment, maintenance and asset management plan
The Department did not undertake any major maintenance for the year under review. There
was however some minor maintenance that was done at some of the research stations. As
was previously reported, there exists a significant backlog of infrastructure maintenance on
the Department’s research stations and the situation has not changed. This is proving a
challenge to address since no dedicated funding has been made available. Management has
committed itself to find the necessary resources within future budget allocations.
In total, there were 67 infrastructure type activities/projects that were undertaken in the
2017/17. An amount of R121.418million was spent on new and replacement assets through
51 infrastructure type activities mainly associated with the flood scheme.
The other significant infrastructure spend of R57.261 million in 2017/18 related to upgrades
and additions on 8 different projects/activities.
The CASP and Ilima/Letsema grant account for 44 percent of the total money spent on
infrastructure while the balance was mainly from the funds of the flood scheme for flood
diversion walls.
Infrastructure projects
2017/2018 2016/2017
Final Actual (Over) / Under
Final Actual (Over) / Under
Appropriation
Expenditure
Expenditure
Appropriation
Expenditure
Expenditure
R’000 R’000 R’000 R’000 R’000 R’000
New and replacement assets 131 591 121 418 10 173 63,160 49,918 22,024
Existing infrastructure assets 50 925 49 685 1 240 61,790 63,197 -17,852
- Upgrades and additions 48 639 48 305 334 59,066 56,839 -21,136
- Rehabilitation, renovations and refurbishments
- - - 917 2,707 3,202
- Maintenance and repairs 2 286 1 380 906 1,807 3,651 82
Infrastructure transfer - - -
- Current - -
- Capital - -
Total 182 516 171 103 11 413 124,950 113,115 4,172
208
209
PART C: GOVERNANCE
1. INTRODUCTION
The Department scored an average score of ???? in the final Management Performance and
Assessment tool (MPAT) 1.7, in the key performance area of Governance and Accountability.
The areas where the department was found to be fully compliant with legal/ regulatory
requirements and is doing this smartly (scoring the maximum of 4) are:
• Functionality of management structures – the Department Executive (DEC), chaired
by the Accounting Office and its members are all the senior managers, while the Service
Delivery Forum (SDF), is also chaired by the Accounting Officer and members include senior
management and middle management. Internal Audit and Provincial Treasury are attendees
of both mentioned management structures.
• Assessment of Accountability mechanisms, through the Audit Committee
• Prevention of fraud and corruption
• Assessment of Internal Audit Arrangements
• Corporate Governance of ICT
• Promotion of Access to information
• Compliance with PAJA requirements
Performance areas where the department was found to be fully compliant with legal/
regulatory requirements (scoring of 3),
• Service Delivery Improvement Mechanisms
• Professional Ethics
• Assessment of Risk Management
An improvement plan has been implemented to work toward obtaining a 4 with the next MPAT
cycle.
210
2. RISK MANAGEMENT
The Department’s risk management policy and strategy were reviewed by the Risk
Management Committee (RMC) on 08 June 2018 Risks assessments are conducted
continuously through risk assessment workshops throughout the year. The workshops are
held with each programme individually, while strategic risks are discussed at the DEC. The
workshops discuss mitigating actions of existing risks, analysis of whether the actions are
appropriately mitigating the risk, identification of new and emerging risks and designing
specific actions to mitigate the new and emerging risks.
The Risk Management Committee (RMC) reviews the risk register to monitor the effective
implementation of the risk management strategy in the department. The RMC met on 13 April
2018 during the 2017/2018 financial year.
The Audit Committee has discussed the risk management process and the risk register at its
quarterly meetings, where specific recommendations have been made to the Accounting
Officer to improve and enhance risk management within the department. The risk register for
2018/2019 was submitted to Internal Audit by end of January 2018 for incorporation into the
internal audit plan 2018/2019.
An assessment on the impact of the risk management process specific to improvements in
the department’s performance will be performed during the 2018/2019 financial year.
3. FRAUD AND CORRUPTION
At the date of writing this report, the department’s fraud prevention plan was not reviewed
and approved subsequent to the dates as reported during the 2016/2017 Annual Report.
Progress made in implementing the fraud prevention plan was discussed at the RMC during
December 2017.
The Anti-fraud and Whistle blower policy provides guidance on the mechanisms and
processes to follow when reporting fraud and corruption. The policy has communicated to all

211
officials. Identified cases possible fraud and corruption are being dealt with through the
Departmental Oversight Committee.
4. MINIMISING CONFLICT OF INTEREST
Conflict of interest in Supply Chain Management (SCM) is minimised by, annual signing of a
code of conduct by all officials involved in the SCM process, including members of
departmental bid committees. This has been extended to all other role players in SCM.
Officials are not only required to sign code of conduct but are reminded and trained on what
constitutes a conflict of interest and processes to follow should a conflict of interest be
identified.
Departmental bid committee members (Evaluation and Adjudication Committees) sign a
declaration of interest for each bid evaluated and adjudicated.
SCM officials in Contract Management unit checks with the Persal system for each bid
awarded whether the shareholders/owners of companies doing business with the State are
not state employees.
Company ownership and/or shareholders with regard to suppliers doing business with the
State in the Department are also verified by using the Central Supplier Database reports.
No identified cases where employees of this Department had done business with the state or
the Department during 2017/2018 financial year.
5. CODE OF CONDUCT
The core business of the sub-directorate Labour Relations is to promote sound labour
relations and industrial stability through effective misconduct and grievance management,
dispute management, collective bargaining and support to management and all units.
The code of conduct seeks to promote high standard of professional ethics in the workplace,
public servants should be encouraged to think and behave ethically. For the period under
review, the Department undertook information sessions throughout the province to capacitate

212
new entrants and current employees on the Code of Conduct for the Public Service produced
by the Public Service Commission.
This self-explanatory manual, together with the Disciplinary Code and Grievance Procedures
were intended to serve as internal communication tools to reduce both misconducts and
grievance cases in the department.
The Code outlines and emphasize the importance of acceptable conduct from all employees,
helps managers and supervisors who are entrusted with the responsibility of enforcing the
code to apply same prompt and fairly. It further conveys consequences management for poor
decisions.
The Unit has embarked on training of 220 officials from different units in the Department. The
topics for the information sessions focused on Code of Conduct, Grievance Procedure,
Disciplinary Code and Procedure and Importance of the attendance Register. In the
management of disciplinary cases there has been a number of multiple misconduct cases
that were conclude during the period under review. These information sessions were also
aimed at promoting mutual respect between employees themselves, between employees and
the employer, to avert and correct unacceptable conduct.
Grievances of employees that were registered with the unit were addressed accordingly and
promptly within the prescribed timeframes and all cases referred externally were in favour of
the Department.
6. HEALTH SAFETY AND ENVIRONMENTAL ISSUES
The Department is obliged by law to comply and executive health and safety standards in all
buildings of the Department and to ensure that all employees are trained on the legislation of
occupational health and safety Act 85 of 1993. 15 safety representatives are appointed and
trained on safety and to ensure they understand the drill of evacuation in the event of a fire
outbreak
The Safety Office has developed an evacuation plans and Seventy per cent (70%) of all office
evacuation plans have been signed off by the Fire Department. The Safety Officer with the
213
assistance of the local Fire Department conducts fire and evacuation drills annually, to ensure
the employees evacuate safely from a building should a fire, hostage situation or a bomb
scare occur.
The Safety Officer together with the nominated Safety Representatives conducts regular site
audits at research farms, veterinary services, veterinary laboratory and administrative
buildings within the Department, to verify compliance and identify contraventions to OHS Act.
All Safety Representatives are enrolled to First Aid training and thus each unit has someone
who knows how to act in cases for workplace injury and emergencies. First Aid trainings are
valid for 3 years.
Training for the management on fires drill has resulted in farms being able to manage fires
when they occur. A refresher training is planned due to staff lost and transfers.
Employees on the research stations and laboratory servicers has been provided with
protective clothing, as well as the cleaners in all Departmental buildings
7. PORTFOLIO COMMITTEES
Date Of Meeting Matters Discussed
01 June 2017 2017/2018 Annual Performance Plan and Budget Presentation
27 June 2017 4th Quarter Performance Report 2016/2017 Presentation
19 October 2017 1st Quarter Performance Report 2017/2018 Presentation
20 November 2017 Annual Report 2016/2017 to Portfolio Committee and SCOPA
29 November 2017 Status of Nieuwoudtville Rooibos Project
8. SCOPA RESOLUTIONS
Resolution No.
Subject Details Response by the department
1. Emphasis of matter
When will the reconciliation of the irregular expenditure be determined
The reconciliation was determined and disclosed in Note 24 to the Annual Financial statements
1.1 Give reasons of the Non-compliance by the department
Key Areas:
Non-compliance – SCM Procedure not followed, 6 cases to the value of R6,486,998. – Contracts not in place Short term contracts Security
Tenders not advertised on the government Tender bulletin, 5 cases to the value of R7,958,247. These were however put onto the e-portal.
214
Resolution No.
Subject Details Response by the department
Bid documentation not complete, 2 cases to the value of R1,524,461.
Other various non-compliance, 139 cases to the value of R3,023,604.
1.2 Movable Assets When will the department finish the investigation on Movable assets?
Verification exercise and consolidation will be done by 15 December 2017
Final investigation reports will be given to the Accounting Officer by 28 February 2018
2. Compliance with legislature
2.1 Procurement and Contract management
Explain why discipline steps were not taken against those officials and SCM
Q2.1.1 • The reference to 16A6.1 in the AG report. • In consultation with the AG the findings specifically relate to
the following deviations that the AG deems invalid: • Catering for the Cuban Ambassador’s visit (non-compliance
with 16A3.2 – procurement was not fair in that it did not source 3 quotations) – This was an emergency.
• Calibration of lab equipment (non-compliance with 16A6.4) – reasons for deviation where it is impractical to procure through competitive process. – The AG did not agree with the deviation as recorded by
the department and deemed it to be invalid. – The Department sourced the only 2 suppliers to provide
quotes. The Deviation was supported in that the calibration is similar to a strip and quote exercise where it was required that the supplier come in to do the calibration. Of the 2 suppliers only 1 supplier was willing to come in. The alternate was to send the lab machinery away for calibration which was not a cost effective or efficient consideration at all as this would result in additional costs.
– No further disciplinary processes is required.
2.2 Expenditure Management
Give reasons for the contravention of TR9.1.1 why effective steps to prevent FEW by the department were not taken
• Reference is made to note 25.3 that provides an outline of the contravention as follows: – Interest paid on overdue accounts – Cancellation costs – Traffic fines – Accident costs – damage to vehicles – No show on accommodation
Q2.2.2 –Irregular expenditure Please give reasons for this
contravention by the department? Refer to Q1.1.
3. Internal Controls deficiencies
Why did management fail to deal with all allegation as per pg 173 in the annual report
• Leadership – misstatements on transfer payments, expenditure on capital assets and goods and services – The misstatement of the above-mentioned is not as a
result of a lack of leadership to deal with the allegations. This was a national interpretation of transfer payments made to public entities that had a compounding impact on the Department. Similarly on project expenditure, all relevant stakeholders such as internal audit, Treasury and AG had been engaged in advance.
– Regarding NAMC we had to reclassify the expenditure from transfer payments to capital and goods and services expenditure items. The adjustments will be done in the 2017/18 financial year (due 28 Feb).
– Project expenditure: movables had to be reclassified as assets under re-distribution (done).
• Leadership – oversight responsibility over regular monitoring
of compliance with laws. • The department acknowledges that instances of non-
compliance have occurred, but owing to stronger oversight

215
Resolution No.
Subject Details Response by the department
such instances have been reduced significantly. Controls have been put in place and investigations now having being finalised will provide insight as to the specifics of the 152 cases non-compliance that has occurred.
• Record keeping to support financial reporting – The Department and management commits to addressing
the deficiencies on record keeping that resulted in the findings.
– Actions and activities have been implemented to address these deficiencies.
• Re-occurrence of findings – Management regrets that the internal controls
implemented did not prevent recurrence of certain findings, in particular those on irregular expenditure. Controls and their adequacy will be revaluated to determine whether it is adequate to prevent re-occurrence. The control environment has been strengthened as the number of audit findings have significantly been reduced.
9. PRIOR MODIFICATIONS TO AUDIT REPORTS
The Department obtained an unqualified audit opinion in the previous financial year
(2016/2017). This consistent with the audit opinion in 2015/2016.
The following matters were reported on as emphasis of matter:
Irregular expenditure
Assets under investigation
The following matters were reported on for non-compliance with legislation:
Material misstatements identified by the auditors and corrected by the department
Findings on procurement and contract management
Effective steps not taken to prevent irregular expenditure
Effective steps not taken to prevent fruitless and wasteful expenditure
10. INTERNAL CONTROL UNIT
The internal control unit consisting of 3 individuals continued to perform the function of 100%
batch testing in ensuring completeness of identification of all cases of irregular expenditure.
This unit also continued with investigative reports for identified cases as well as appropriate
consequence management. Consequence management required that all cases were
individually evaluated, in obtaining appropriate evidence to either condone expenditure or
recovery of such expenditure where an official was found to be legally liable for incurring such
expenditure.
216
The Internal Control unit also played a significant role in reviewing the draft financial
statements against audit evidence to limit any subsequent re-statement of figures.
The unit also performs as a strong co-ordinating role with respect to both internal and external
audit. The unit monitors findings, updates the audit action plan and facilitates audit matters
between the auditors and the department.
11. INTERNAL AUDIT AND AUDIT COMMITTEES
Internal Audit
The department’s internal audit function is performed by the Shared Provincial Internal Audit
Unit which fulfils an independent assurance function. The internal audit unit follows a risk-
based audit approach in providing management and the audit committee with assurance on
the adequacy and effectiveness of governance, risk management and internal control
processes. The internal audit unit is guided by an Internal Audit Charter approved by the Audit
Committee and performs its functions as provided in the Public Finance Management Act
(PFMA) and the internal audit charter.
The internal audit unit compiles a rolling three-year risk-based plan and prepares an annual
plan after taking into consideration the risks facing the entity, strategic objectives, the entity’s
mandate, audit issues and inputs by management. The audit committee approves the Internal
Audit Plan for implementation.
The internal audit reviews performed for the financial year under year, were all in line with the
approved annual audit plan and are detailed in the Audit Committee annual report.
Internal audit findings were communicated timely and management implemented measures
to mitigate the risks. Significant matters identified during the audit were reported to the Audit
Committee.
Audit Committee
Throughout the year under review, the Audit Committee operated in terms of an approved
Audit Committee Charter, which was the committee’s approved terms of reference. The
committee comprise of three external members and two internal audit committee members,
all of whom are not employed by the department.
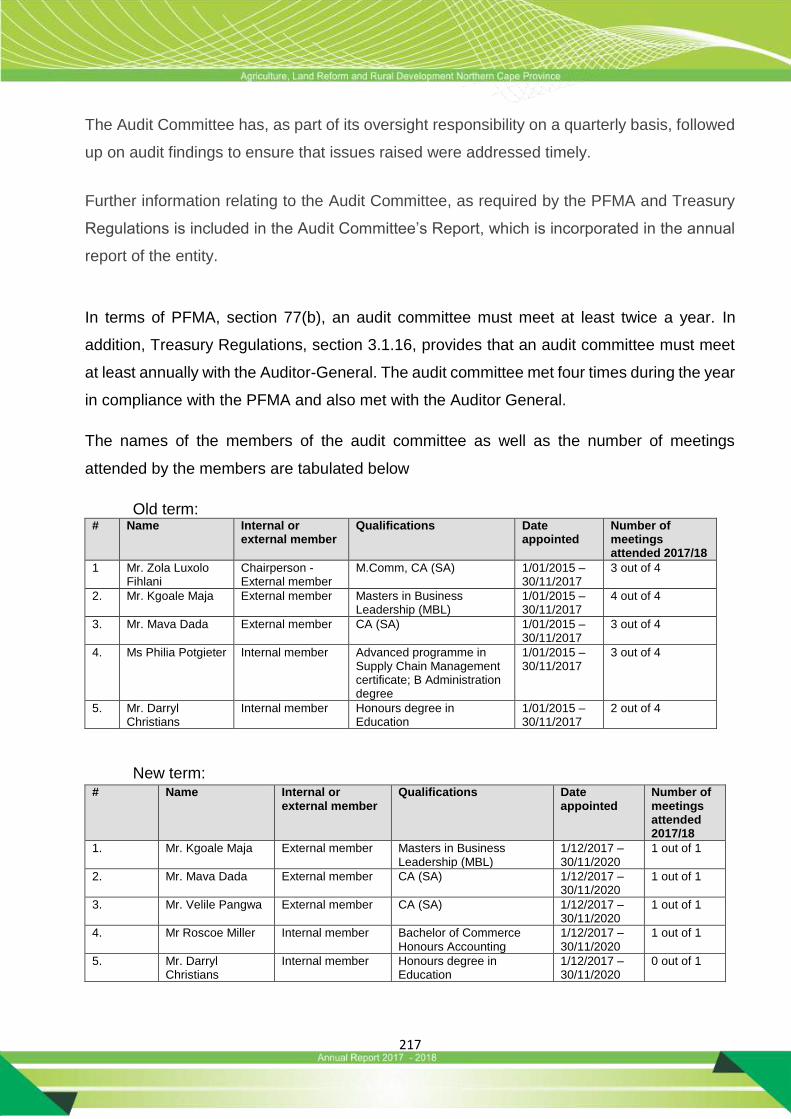
217
The Audit Committee has, as part of its oversight responsibility on a quarterly basis, followed
up on audit findings to ensure that issues raised were addressed timely.
Further information relating to the Audit Committee, as required by the PFMA and Treasury
Regulations is included in the Audit Committee’s Report, which is incorporated in the annual
report of the entity.
In terms of PFMA, section 77(b), an audit committee must meet at least twice a year. In
addition, Treasury Regulations, section 3.1.16, provides that an audit committee must meet
at least annually with the Auditor-General. The audit committee met four times during the year
in compliance with the PFMA and also met with the Auditor General.
The names of the members of the audit committee as well as the number of meetings
attended by the members are tabulated below
Old term: # Name Internal or
external member Qualifications Date
appointed Number of meetings attended 2017/18
1 Mr. Zola Luxolo Fihlani
Chairperson - External member
M.Comm, CA (SA) 1/01/2015 – 30/11/2017
3 out of 4
2. Mr. Kgoale Maja
External member Masters in Business Leadership (MBL)
1/01/2015 – 30/11/2017
4 out of 4
3. Mr. Mava Dada External member CA (SA) 1/01/2015 – 30/11/2017
3 out of 4
4. Ms Philia Potgieter Internal member Advanced programme in Supply Chain Management certificate; B Administration degree
1/01/2015 – 30/11/2017
3 out of 4
5. Mr. Darryl Christians
Internal member Honours degree in Education
1/01/2015 – 30/11/2017
2 out of 4
New term: # Name Internal or
external member Qualifications Date
appointed Number of meetings attended 2017/18
1. Mr. Kgoale Maja
External member Masters in Business Leadership (MBL)
1/12/2017 – 30/11/2020
1 out of 1
2. Mr. Mava Dada External member CA (SA) 1/12/2017 – 30/11/2020
1 out of 1
3. Mr. Velile Pangwa External member CA (SA) 1/12/2017 – 30/11/2020
1 out of 1
4. Mr Roscoe Miller Internal member Bachelor of Commerce Honours Accounting
1/12/2017 – 30/11/2020
1 out of 1
5. Mr. Darryl Christians
Internal member Honours degree in Education
1/12/2017 – 30/11/2020
0 out of 1
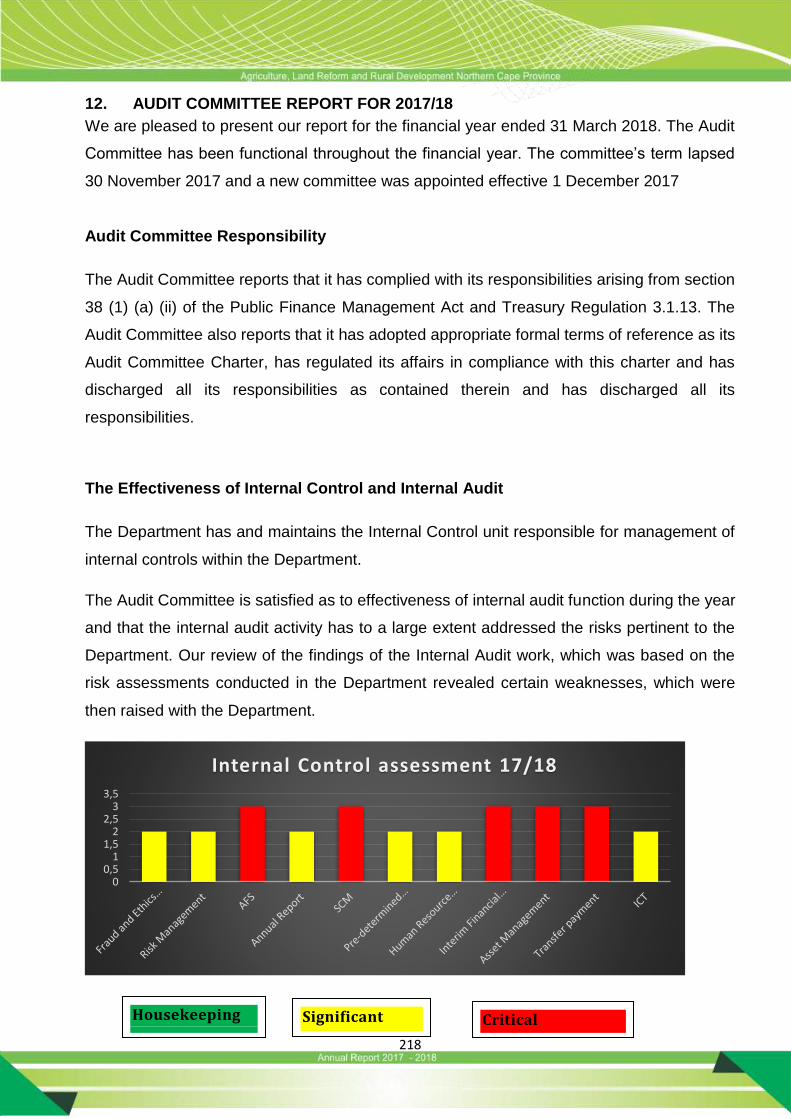
218
12. AUDIT COMMITTEE REPORT FOR 2017/18
We are pleased to present our report for the financial year ended 31 March 2018. The Audit
Committee has been functional throughout the financial year. The committee’s term lapsed
30 November 2017 and a new committee was appointed effective 1 December 2017
Audit Committee Responsibility
The Audit Committee reports that it has complied with its responsibilities arising from section
38 (1) (a) (ii) of the Public Finance Management Act and Treasury Regulation 3.1.13. The
Audit Committee also reports that it has adopted appropriate formal terms of reference as its
Audit Committee Charter, has regulated its affairs in compliance with this charter and has
discharged all its responsibilities as contained therein and has discharged all its
responsibilities.
The Effectiveness of Internal Control and Internal Audit
The Department has and maintains the Internal Control unit responsible for management of
internal controls within the Department.
The Audit Committee is satisfied as to effectiveness of internal audit function during the year
and that the internal audit activity has to a large extent addressed the risks pertinent to the
Department. Our review of the findings of the Internal Audit work, which was based on the
risk assessments conducted in the Department revealed certain weaknesses, which were
then raised with the Department.
00,5
11,5
22,5
33,5
Internal Control assessment 17/18
Significant Housekeeping
Critical

219
Asset management remains a challenge in the department, with the highest number of issues
not implemented during the year. Management has however developed a pragmatic action
plan to address the issues over a period of time. The Audit Committee monitored the
implementation of the plan during the quarterly audit committee meetings and implementation
of its recommendations is in progress.
The Internal Audit activity also maintains combined assurance framework and plan which
were developed in collaboration with the departmental risk management unit and Auditor
General. The plan has been useful in ensuring that assurance is placed at all high risks by
various assurance providers.
In-Year Management and Monthly/Quarterly Report
The Audit Committee satisfied itself of the expertise, resources and experience of the
departments finance function as required in the King IV report on corporate governance.
The Department has been reporting monthly and quarterly to Provincial Treasury as is
required by the PFMA. We had engagements with the Department’s management to provide
clarity on completeness and quality of the monthly and quarterly reports during our quarterly
meetings and officials of the Department were able to clarify areas of concern raised by the
Audit Committee.
Evaluation of Financial Statements
The Audit Committee reviewed the financial statements for the year ended 31 March 2018
at a meeting which took place 30 May 2018. In addition the Audit Committee reviewed the
draft Annual Report of the Department.
The Audit Committee reviewed the Department’s compliance with legal and regulatory
provisions during the quarterly audit committee meetings and management was directed
to implement remedial measures where instances of non-compliance are noted.
The Audit Committee also reviewed quarterly financial and 6 monthly Interim Financial
Statements as presented to it by IA and management. It interrogated monthly IYM on
expenditure as well as status of payment of accruals and commitments. Status of clearing
irregular expenditure by the department was monitored throughout the year.
220
Meeting with Member of the Executive Council
The Audit Committee met with the MEC for Agriculture, land reform and rural development
on 24 July 2018 to discuss matters of outmost importance to the committee and department.
The Committee appreciate commitment and support from the office of the MEC to ensure that
the Committee and the department fulfil its obligations.
Auditor-General South Africa
We have reviewed the Department’s implementation plan for audit issues raised in the prior
year and we are satisfied that the matters have been adequately resolved, except for the
issues relating to movable assets.
The audit committee met with representatives from the Office of the Auditor-General South
Africa during the year and discussed issues of mutual concern and ensured that there are no
other unresolved issues.
The Audit Committee reviewed the audit and management reports for the audit of 2017/18
annual financial statements in a meeting held 23 July 2018. The Committee concurs and
accepts the conclusions of the Auditor-General on the annual financial statements and is of
the opinion that the audited annual financial statements be accepted and read together with
the report of the Auditor-General.
____________________________
K. Maja
Chairperson of the Audit Committee
Northern Cape Department of Agriculture, Land Reform and Rural Development
Date: 29 August 2018

221
222
PART D: HUMAN RESOURCE MANAGEMENT
1. INTRODUCTION
During the year 2017/2018 Human Resources Management(HRM) Directorate, worked
proficiently and witnessed certain key achievements such as the commitment of employees
to adhere to the EPMDS processes by submitting the performance documents in time which
was a remarkable. As part of commitment to ensure that the Performance Development Plans
(PDPs) from EPMDS are fully monitored. A total number of 177 staff members were trained
to enhance their performance. The Benefits administration unit, implements the Departmental
system to administer and track benefit programs like compensation of retirement of
employees has managed to ensure that most of the cases they dealt with pay-outs are made
within a month by being innovative in dealing with the applications.
The Strategic Objectives of the Department are linked to the Human Resource Plan to ensure
consistency and this has improved the outcome of our scores during the provincial
assessment. The Human resources directorate provided a great opportunity of practical
internship and work integrated learning to 12 students for the period, which 3 of them
permanently got an opportunity and recruited in different departments.
The Labour Relations Unit had information sessions in all regions on Grievance Procedure,
the importance of the Attendance Register and the Code of Conduct to promote and maintain
a high standard of professional ethics and discipline in the Department.
During the 2017/18 financial year the Employee Health and Wellness Unit formed
partnerships with a few institutions that assisted the employees with financial wellness
sessions. Those institutions include: National Credit Regulator, the Northern Cape consumer
protector and Standard Bank. The main focus of these presentations was to educate
employees on the importance of saving, their rights as consumers, to be debt free and credit
bureau. These sessions formed part of the highlights as employees were equipped on how
to better manage their finances and the financial advice options available for them. The unit
also issued four health information pamphlets; chronic fatigue, Hepatitis, Human
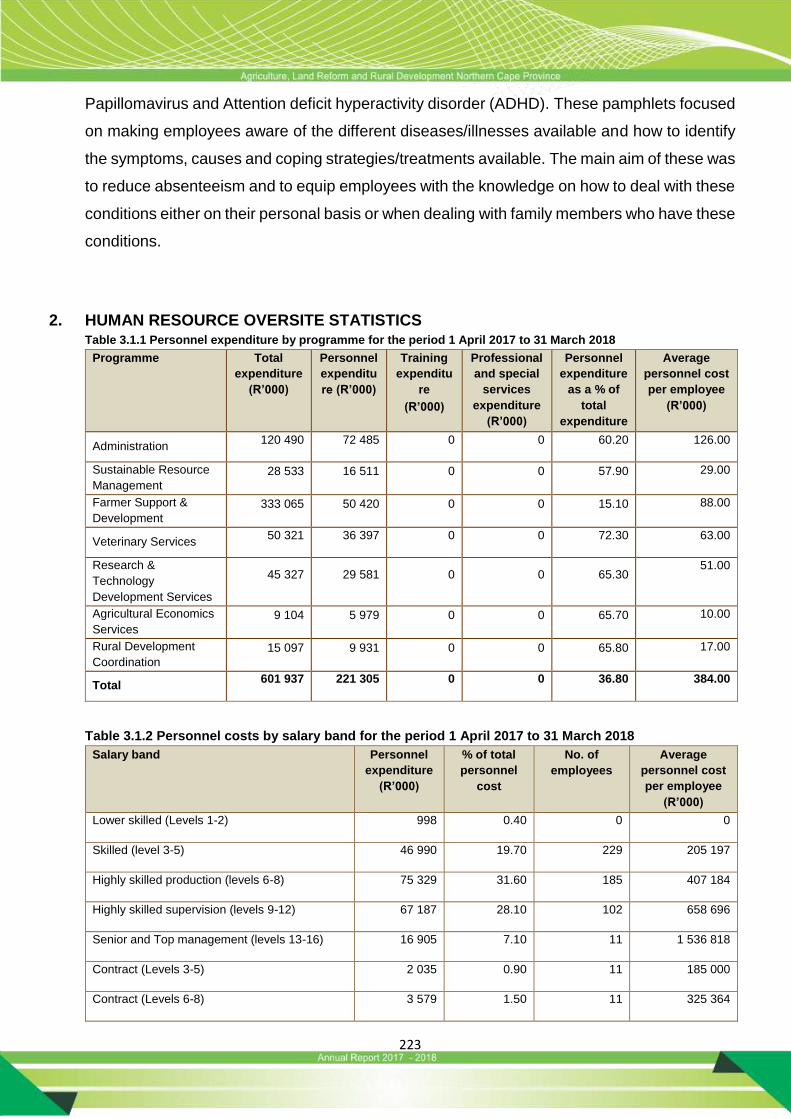
223
Papillomavirus and Attention deficit hyperactivity disorder (ADHD). These pamphlets focused
on making employees aware of the different diseases/illnesses available and how to identify
the symptoms, causes and coping strategies/treatments available. The main aim of these was
to reduce absenteeism and to equip employees with the knowledge on how to deal with these
conditions either on their personal basis or when dealing with family members who have these
conditions.
2. HUMAN RESOURCE OVERSITE STATISTICS Table 3.1.1 Personnel expenditure by programme for the period 1 April 2017 to 31 March 2018
Programme Total
expenditure
(R’000)
Personnel
expenditu
re (R’000)
Training
expenditu
re
(R’000)
Professional
and special
services
expenditure
(R’000)
Personnel
expenditure
as a % of
total
expenditure
Average
personnel cost
per employee
(R’000)
Administration 120 490 72 485 0 0 60.20 126.00
Sustainable Resource
Management
28 533 16 511 0 0 57.90 29.00
Farmer Support &
Development
333 065 50 420 0 0 15.10 88.00
Veterinary Services 50 321 36 397 0 0 72.30 63.00
Research &
Technology
Development Services
45 327 29 581 0 0 65.30 51.00
Agricultural Economics
Services
9 104 5 979 0 0 65.70 10.00
Rural Development
Coordination
15 097 9 931 0 0 65.80 17.00
Total 601 937 221 305 0 0 36.80 384.00
Table 3.1.2 Personnel costs by salary band for the period 1 April 2017 to 31 March 2018
Salary band Personnel
expenditure
(R’000)
% of total
personnel
cost
No. of
employees
Average
personnel cost
per employee
(R’000)
Lower skilled (Levels 1-2) 998 0.40 0 0
Skilled (level 3-5) 46 990 19.70 229 205 197
Highly skilled production (levels 6-8) 75 329 31.60 185 407 184
Highly skilled supervision (levels 9-12) 67 187 28.10 102 658 696
Senior and Top management (levels 13-16) 16 905 7.10 11 1 536 818
Contract (Levels 3-5) 2 035 0.90 11 185 000
Contract (Levels 6-8) 3 579 1.50 11 325 364
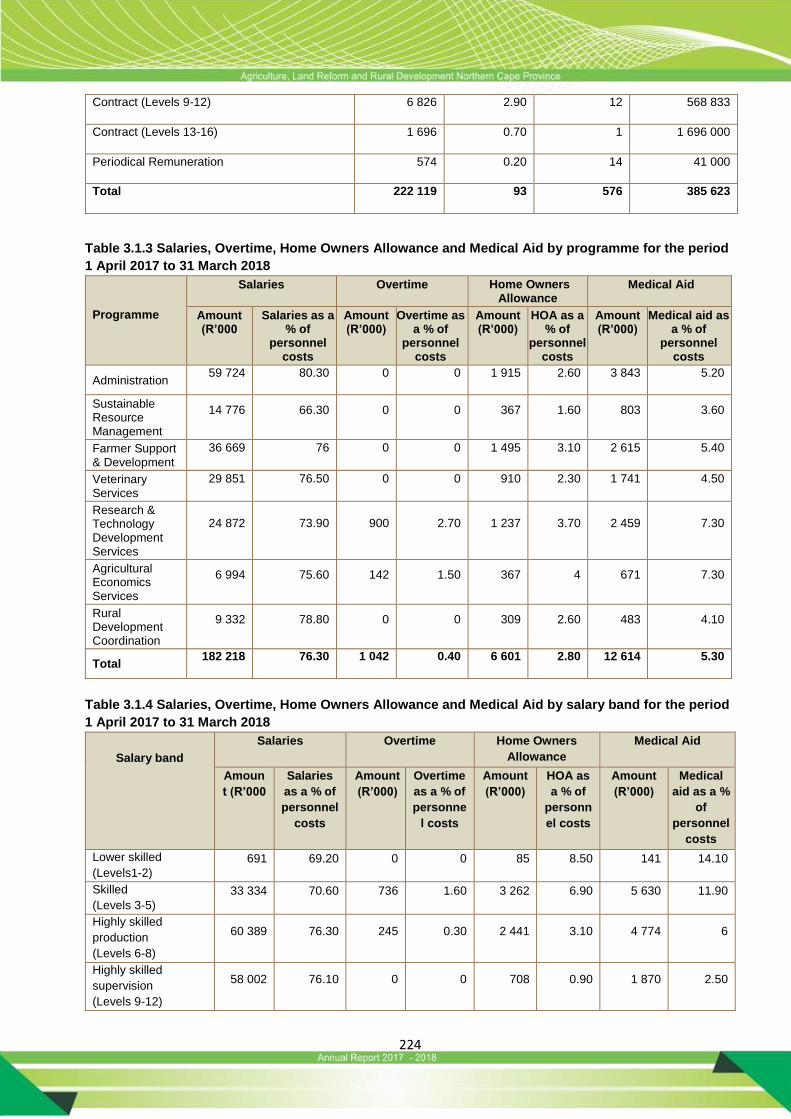
224
Contract (Levels 9-12) 6 826 2.90 12 568 833
Contract (Levels 13-16) 1 696 0.70 1 1 696 000
Periodical Remuneration 574 0.20 14 41 000
Total 222 119 93 576 385 623
Table 3.1.3 Salaries, Overtime, Home Owners Allowance and Medical Aid by programme for the period
1 April 2017 to 31 March 2018
Programme
Salaries Overtime Home Owners Allowance
Medical Aid
Amount (R’000
Salaries as a % of
personnel costs
Amount (R’000)
Overtime as a % of
personnel costs
Amount (R’000)
HOA as a % of
personnel costs
Amount (R’000)
Medical aid as a % of
personnel costs
Administration 59 724 80.30 0 0 1 915 2.60 3 843 5.20
Sustainable Resource Management
14 776 66.30 0 0 367 1.60 803 3.60
Farmer Support & Development
36 669 76 0 0 1 495 3.10 2 615 5.40
Veterinary Services
29 851 76.50 0 0 910 2.30 1 741 4.50
Research & Technology Development Services
24 872 73.90 900 2.70 1 237 3.70 2 459 7.30
Agricultural Economics Services
6 994 75.60 142 1.50 367 4 671 7.30
Rural Development Coordination
9 332 78.80 0 0 309 2.60 483 4.10
Total 182 218 76.30 1 042 0.40 6 601 2.80 12 614 5.30
Table 3.1.4 Salaries, Overtime, Home Owners Allowance and Medical Aid by salary band for the period
1 April 2017 to 31 March 2018
Salary band
Salaries Overtime Home Owners
Allowance
Medical Aid
Amoun
t (R’000
Salaries
as a % of
personnel
costs
Amount
(R’000)
Overtime
as a % of
personne
l costs
Amount
(R’000)
HOA as
a % of
personn
el costs
Amount
(R’000)
Medical
aid as a %
of
personnel
costs
Lower skilled
(Levels1-2)
691 69.20 0 0 85 8.50 141 14.10
Skilled
(Levels 3-5)
33 334 70.60 736 1.60 3 262 6.90 5 630 11.90
Highly skilled
production
(Levels 6-8)
60 389 76.30 245 0.30 2 441 3.10 4 774 6
Highly skilled
supervision
(Levels 9-12)
58 002 76.10 0 0 708 0.90 1 870 2.50
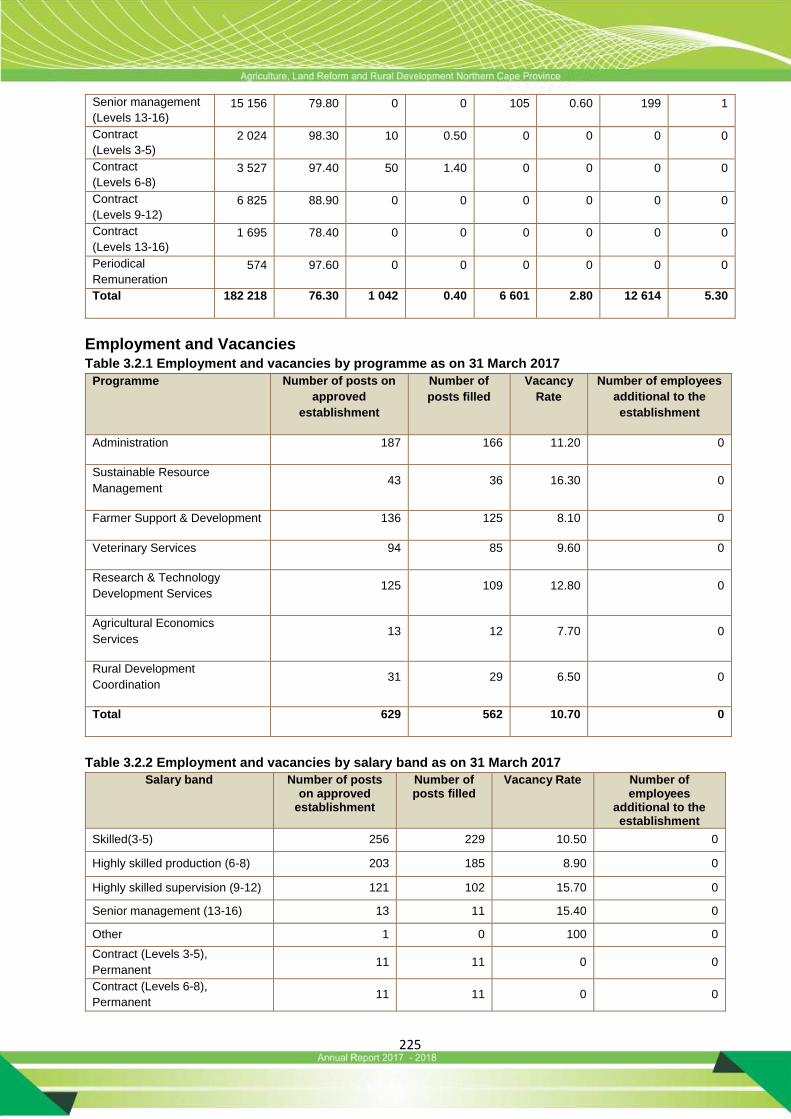
225
Senior management
(Levels 13-16)
15 156 79.80 0 0 105 0.60 199 1
Contract
(Levels 3-5)
2 024 98.30 10 0.50 0 0 0 0
Contract
(Levels 6-8)
3 527 97.40 50 1.40 0 0 0 0
Contract
(Levels 9-12)
6 825 88.90 0 0 0 0 0 0
Contract
(Levels 13-16)
1 695 78.40 0 0 0 0 0 0
Periodical
Remuneration
574 97.60 0 0 0 0 0 0
Total 182 218 76.30 1 042 0.40 6 601 2.80 12 614 5.30
Employment and Vacancies Table 3.2.1 Employment and vacancies by programme as on 31 March 2017
Programme Number of posts on
approved
establishment
Number of
posts filled
Vacancy
Rate
Number of employees
additional to the
establishment
Administration 187 166 11.20 0
Sustainable Resource
Management 43 36 16.30 0
Farmer Support & Development 136 125 8.10 0
Veterinary Services 94 85 9.60 0
Research & Technology
Development Services 125 109 12.80 0
Agricultural Economics
Services 13 12 7.70 0
Rural Development
Coordination 31 29 6.50 0
Total 629 562 10.70 0
Table 3.2.2 Employment and vacancies by salary band as on 31 March 2017
Salary band Number of posts on approved
establishment
Number of posts filled
Vacancy Rate Number of employees
additional to the establishment
Skilled(3-5) 256 229 10.50 0
Highly skilled production (6-8) 203 185 8.90 0
Highly skilled supervision (9-12) 121 102 15.70 0
Senior management (13-16) 13 11 15.40 0
Other 1 0 100 0
Contract (Levels 3-5),
Permanent 11 11 0 0
Contract (Levels 6-8),
Permanent 11 11 0 0
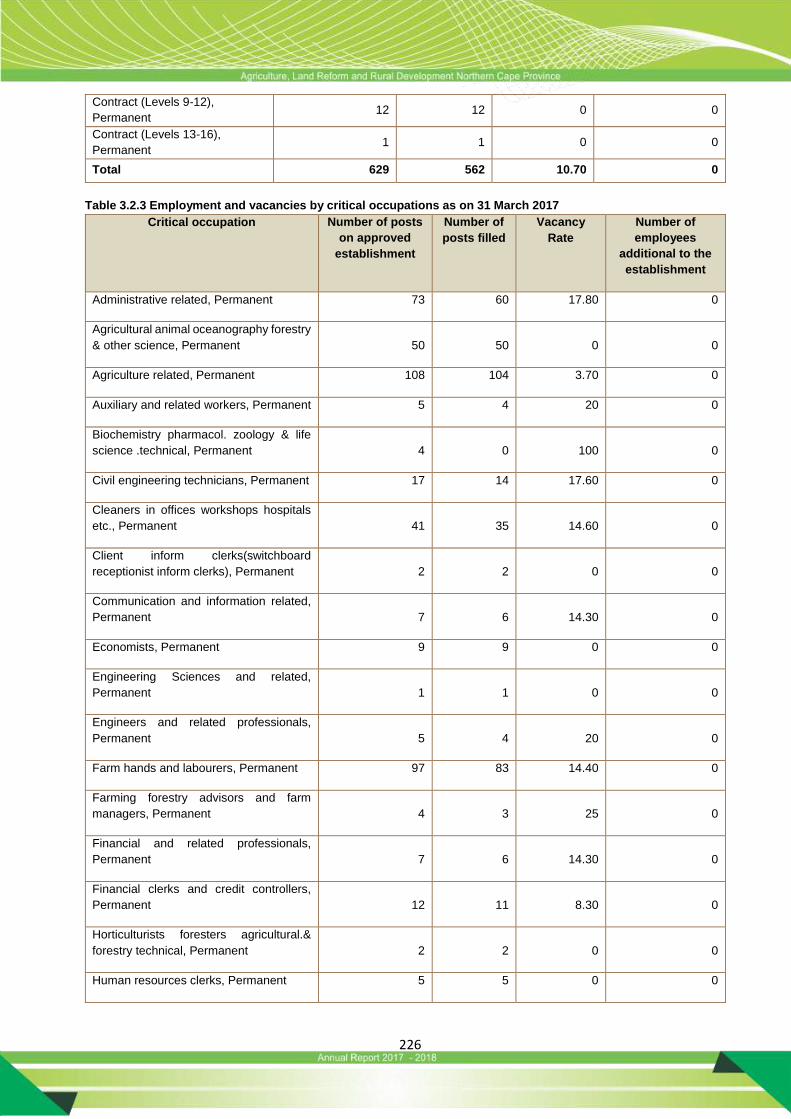
226
Contract (Levels 9-12),
Permanent 12 12 0 0
Contract (Levels 13-16),
Permanent 1 1 0 0
Total 629 562 10.70 0
Table 3.2.3 Employment and vacancies by critical occupations as on 31 March 2017
Critical occupation Number of posts
on approved
establishment
Number of
posts filled
Vacancy
Rate
Number of
employees
additional to the
establishment
Administrative related, Permanent 73 60 17.80 0
Agricultural animal oceanography forestry
& other science, Permanent 50 50 0 0
Agriculture related, Permanent 108 104 3.70 0
Auxiliary and related workers, Permanent 5 4 20 0
Biochemistry pharmacol. zoology & life
science .technical, Permanent 4 0 100 0
Civil engineering technicians, Permanent 17 14 17.60 0
Cleaners in offices workshops hospitals
etc., Permanent 41 35 14.60 0
Client inform clerks(switchboard
receptionist inform clerks), Permanent 2 2 0 0
Communication and information related,
Permanent 7 6 14.30 0
Economists, Permanent 9 9 0 0
Engineering Sciences and related,
Permanent 1 1 0 0
Engineers and related professionals,
Permanent 5 4 20 0
Farm hands and labourers, Permanent 97 83 14.40 0
Farming forestry advisors and farm
managers, Permanent 4 3 25 0
Financial and related professionals,
Permanent 7 6 14.30 0
Financial clerks and credit controllers,
Permanent 12 11 8.30 0
Horticulturists foresters agricultural.&
forestry technical, Permanent 2 2 0 0
Human resources clerks, Permanent 5 5 0 0
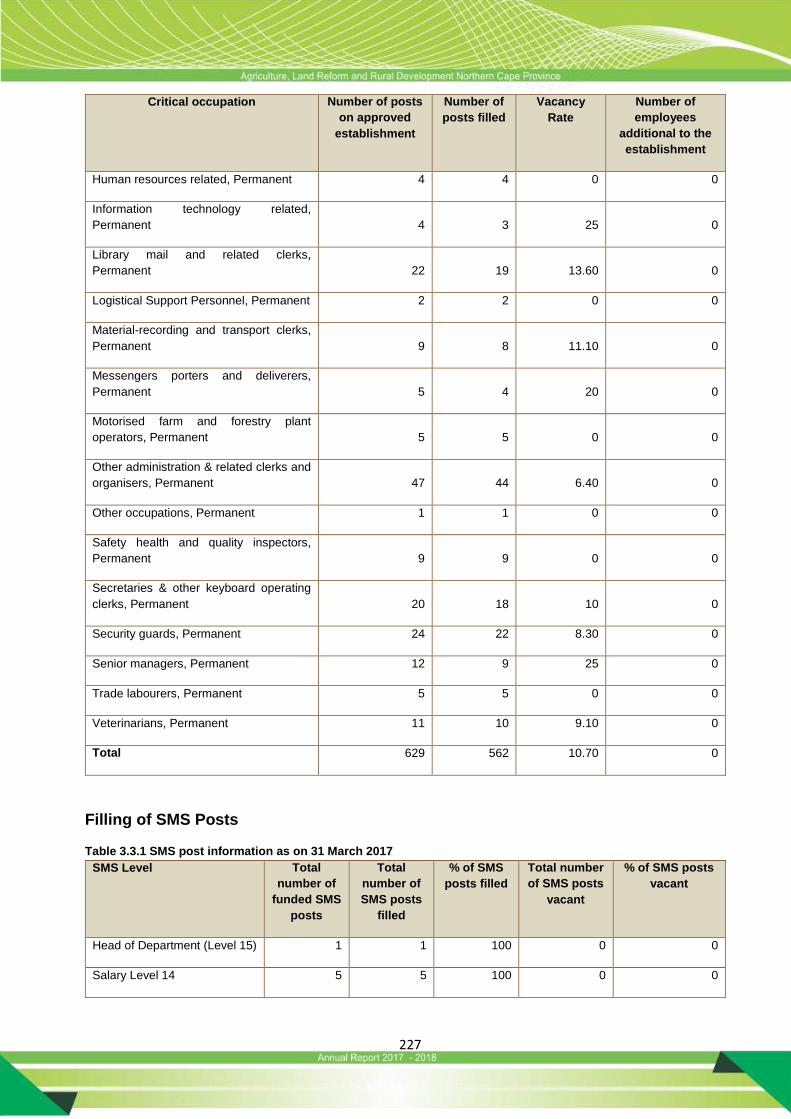
227
Critical occupation Number of posts
on approved
establishment
Number of
posts filled
Vacancy
Rate
Number of
employees
additional to the
establishment
Human resources related, Permanent 4 4 0 0
Information technology related,
Permanent 4 3 25 0
Library mail and related clerks,
Permanent 22 19 13.60 0
Logistical Support Personnel, Permanent 2 2 0 0
Material-recording and transport clerks,
Permanent 9 8 11.10 0
Messengers porters and deliverers,
Permanent 5 4 20 0
Motorised farm and forestry plant
operators, Permanent 5 5 0 0
Other administration & related clerks and
organisers, Permanent 47 44 6.40 0
Other occupations, Permanent 1 1 0 0
Safety health and quality inspectors,
Permanent 9 9 0 0
Secretaries & other keyboard operating
clerks, Permanent 20 18 10 0
Security guards, Permanent 24 22 8.30 0
Senior managers, Permanent 12 9 25 0
Trade labourers, Permanent 5 5 0 0
Veterinarians, Permanent 11 10 9.10 0
Total 629 562 10.70 0
Filling of SMS Posts
Table 3.3.1 SMS post information as on 31 March 2017
SMS Level Total
number of
funded SMS
posts
Total
number of
SMS posts
filled
% of SMS
posts filled
Total number
of SMS posts
vacant
% of SMS posts
vacant
Head of Department (Level 15) 1 1 100 0 0
Salary Level 14 5 5 100 0 0
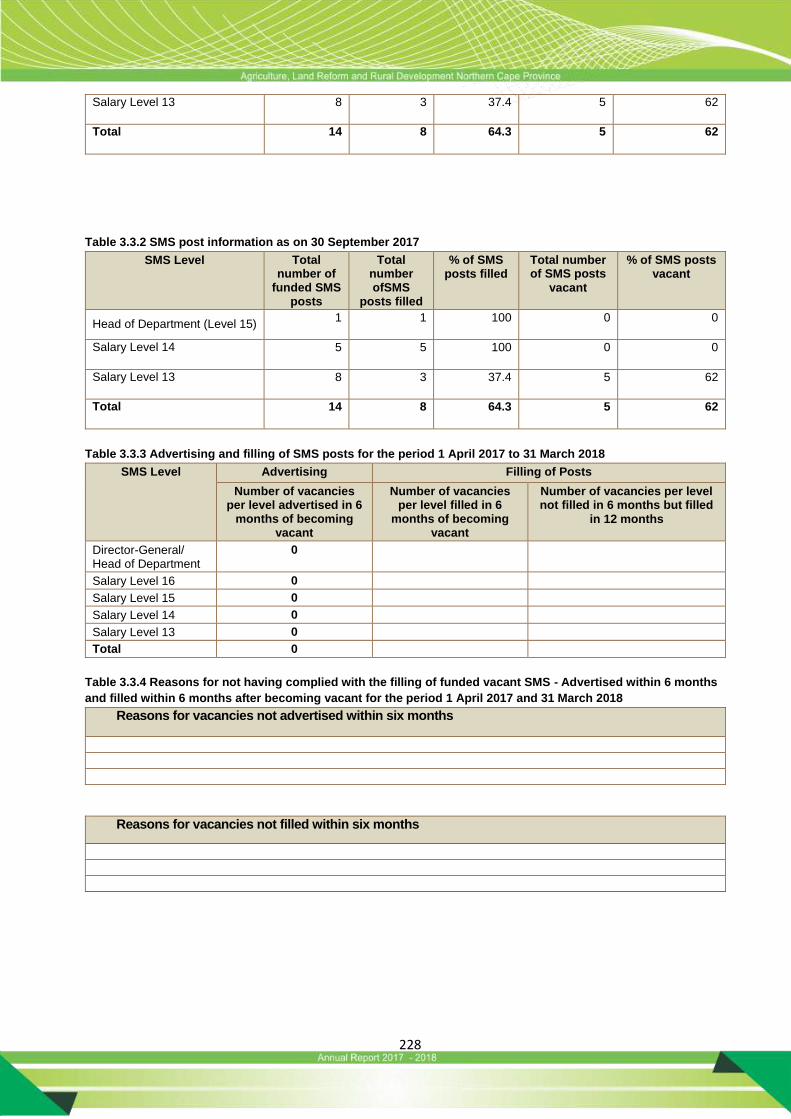
228
Salary Level 13 8 3 37.4 5 62
Total 14 8 64.3 5 62
Table 3.3.2 SMS post information as on 30 September 2017
SMS Level Total number of
funded SMS posts
Total number ofSMS
posts filled
% of SMS posts filled
Total number of SMS posts
vacant
% of SMS posts vacant
Head of Department (Level 15) 1 1 100 0 0
Salary Level 14 5 5 100 0 0
Salary Level 13 8 3 37.4 5 62
Total 14 8 64.3 5 62
Table 3.3.3 Advertising and filling of SMS posts for the period 1 April 2017 to 31 March 2018
SMS Level Advertising Filling of Posts
Number of vacancies per level advertised in 6
months of becoming vacant
Number of vacancies per level filled in 6
months of becoming vacant
Number of vacancies per level not filled in 6 months but filled
in 12 months
Director-General/ Head of Department
0
Salary Level 16 0
Salary Level 15 0
Salary Level 14 0
Salary Level 13 0
Total 0
Table 3.3.4 Reasons for not having complied with the filling of funded vacant SMS - Advertised within 6 months
and filled within 6 months after becoming vacant for the period 1 April 2017 and 31 March 2018
Reasons for vacancies not advertised within six months
Reasons for vacancies not filled within six months
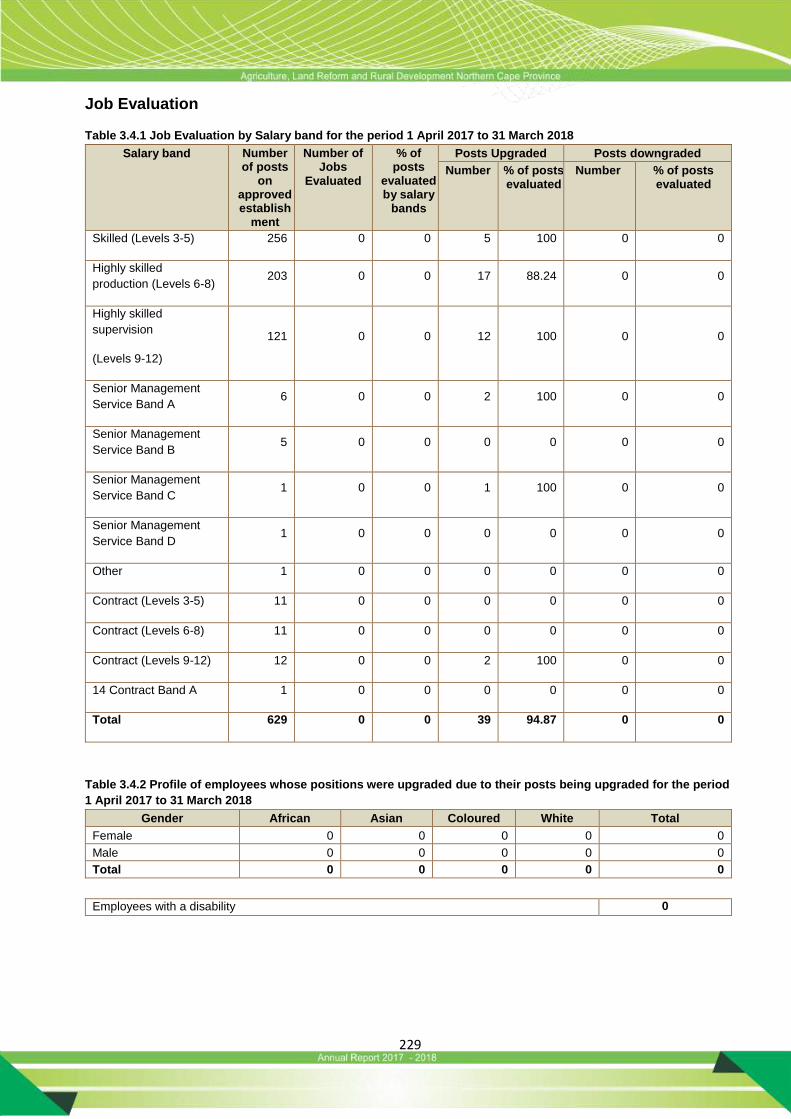
229
Job Evaluation
Table 3.4.1 Job Evaluation by Salary band for the period 1 April 2017 to 31 March 2018
Salary band Number of posts
on approved establish
ment
Number of Jobs
Evaluated
% of posts
evaluated by salary
bands
Posts Upgraded Posts downgraded
Number % of posts evaluated
Number % of posts evaluated
Skilled (Levels 3-5) 256 0 0 5 100 0 0
Highly skilled
production (Levels 6-8) 203 0 0 17 88.24 0 0
Highly skilled
supervision
(Levels 9-12)
121 0 0 12 100 0 0
Senior Management
Service Band A 6 0 0 2 100 0 0
Senior Management
Service Band B 5 0 0 0 0 0 0
Senior Management
Service Band C 1 0 0 1 100 0 0
Senior Management
Service Band D 1 0 0 0 0 0 0
Other 1 0 0 0 0 0 0
Contract (Levels 3-5) 11 0 0 0 0 0 0
Contract (Levels 6-8) 11 0 0 0 0 0 0
Contract (Levels 9-12) 12 0 0 2 100 0 0
14 Contract Band A 1 0 0 0 0 0 0
Total 629 0 0 39 94.87 0 0
Table 3.4.2 Profile of employees whose positions were upgraded due to their posts being upgraded for the period
1 April 2017 to 31 March 2018
Gender African Asian Coloured White Total
Female 0 0 0 0 0
Male 0 0 0 0 0
Total 0 0 0 0 0
Employees with a disability 0
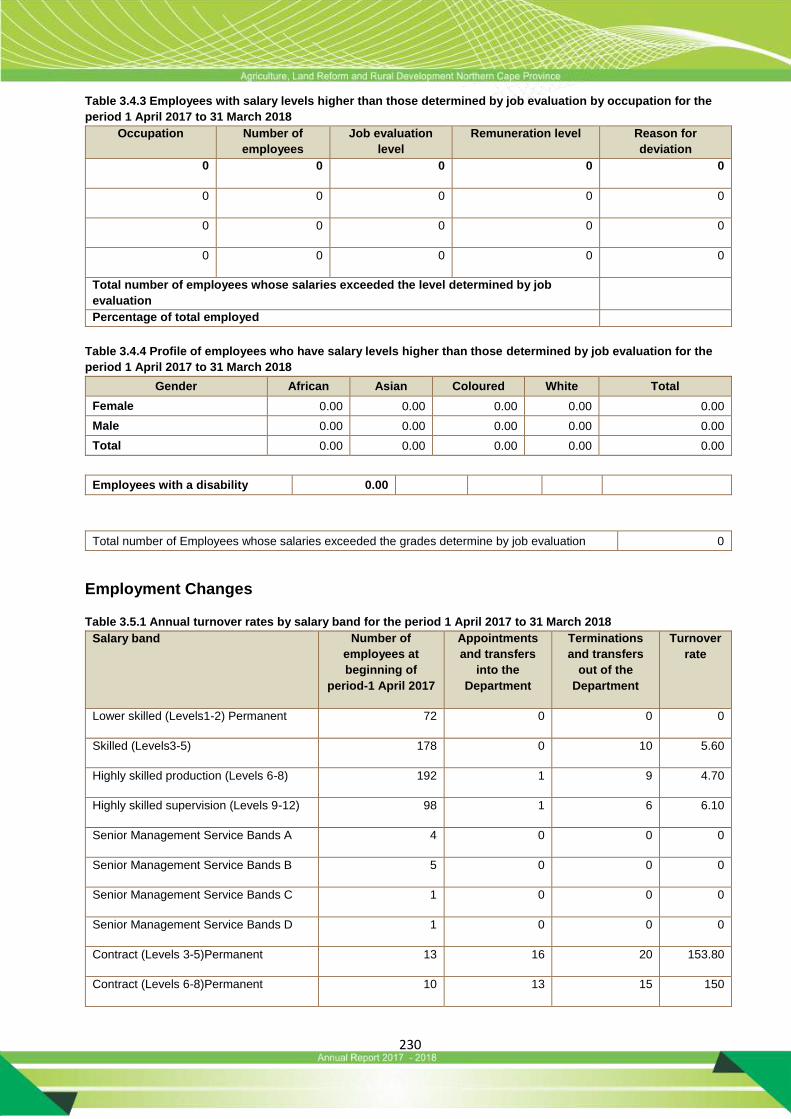
230
Table 3.4.3 Employees with salary levels higher than those determined by job evaluation by occupation for the
period 1 April 2017 to 31 March 2018
Occupation Number of
employees
Job evaluation
level
Remuneration level Reason for
deviation
0 0 0 0 0
0 0 0 0 0
0 0 0 0 0
0 0 0 0 0
Total number of employees whose salaries exceeded the level determined by job
evaluation
Percentage of total employed
Table 3.4.4 Profile of employees who have salary levels higher than those determined by job evaluation for the
period 1 April 2017 to 31 March 2018
Gender African Asian Coloured White Total
Female 0.00 0.00 0.00 0.00 0.00
Male 0.00 0.00 0.00 0.00 0.00
Total 0.00 0.00 0.00 0.00 0.00
Employees with a disability 0.00
Total number of Employees whose salaries exceeded the grades determine by job evaluation 0
Employment Changes
Table 3.5.1 Annual turnover rates by salary band for the period 1 April 2017 to 31 March 2018
Salary band Number of
employees at
beginning of
period-1 April 2017
Appointments
and transfers
into the
Department
Terminations
and transfers
out of the
Department
Turnover
rate
Lower skilled (Levels1-2) Permanent 72 0 0 0
Skilled (Levels3-5) 178 0 10 5.60
Highly skilled production (Levels 6-8) 192 1 9 4.70
Highly skilled supervision (Levels 9-12) 98 1 6 6.10
Senior Management Service Bands A 4 0 0 0
Senior Management Service Bands B 5 0 0 0
Senior Management Service Bands C 1 0 0 0
Senior Management Service Bands D 1 0 0 0
Contract (Levels 3-5)Permanent 13 16 20 153.80
Contract (Levels 6-8)Permanent 10 13 15 150
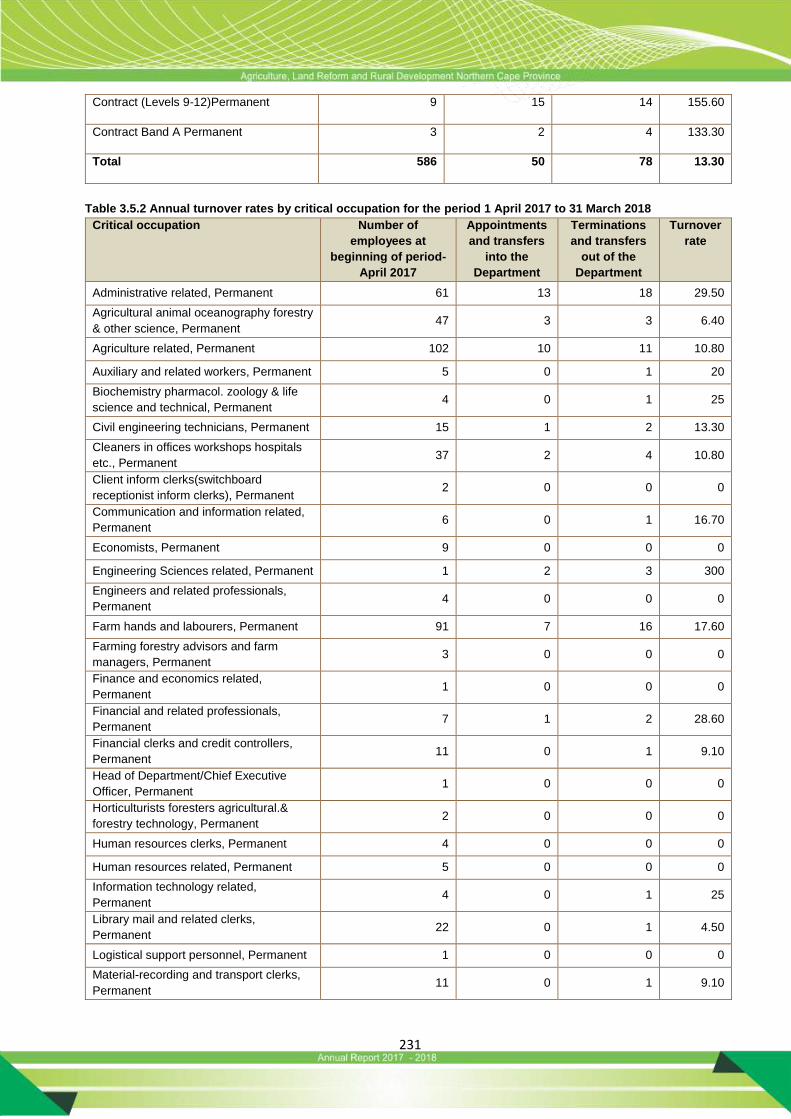
231
Contract (Levels 9-12)Permanent 9 15 14 155.60
Contract Band A Permanent 3 2 4 133.30
Total 586 50 78 13.30
Table 3.5.2 Annual turnover rates by critical occupation for the period 1 April 2017 to 31 March 2018
Critical occupation Number of
employees at
beginning of period-
April 2017
Appointments
and transfers
into the
Department
Terminations
and transfers
out of the
Department
Turnover
rate
Administrative related, Permanent 61 13 18 29.50
Agricultural animal oceanography forestry
& other science, Permanent 47 3 3 6.40
Agriculture related, Permanent 102 10 11 10.80
Auxiliary and related workers, Permanent 5 0 1 20
Biochemistry pharmacol. zoology & life
science and technical, Permanent 4 0 1 25
Civil engineering technicians, Permanent 15 1 2 13.30
Cleaners in offices workshops hospitals
etc., Permanent 37 2 4 10.80
Client inform clerks(switchboard
receptionist inform clerks), Permanent 2 0 0 0
Communication and information related,
Permanent 6 0 1 16.70
Economists, Permanent 9 0 0 0
Engineering Sciences related, Permanent 1 2 3 300
Engineers and related professionals,
Permanent 4 0 0 0
Farm hands and labourers, Permanent 91 7 16 17.60
Farming forestry advisors and farm
managers, Permanent 3 0 0 0
Finance and economics related,
Permanent 1 0 0 0
Financial and related professionals,
Permanent 7 1 2 28.60
Financial clerks and credit controllers,
Permanent 11 0 1 9.10
Head of Department/Chief Executive
Officer, Permanent 1 0 0 0
Horticulturists foresters agricultural.&
forestry technology, Permanent 2 0 0 0
Human resources clerks, Permanent 4 0 0 0
Human resources related, Permanent 5 0 0 0
Information technology related,
Permanent 4 0 1 25
Library mail and related clerks,
Permanent 22 0 1 4.50
Logistical support personnel, Permanent 1 0 0 0
Material-recording and transport clerks,
Permanent 11 0 1 9.10

232
Critical occupation Number of
employees at
beginning of period-
April 2017
Appointments
and transfers
into the
Department
Terminations
and transfers
out of the
Department
Turnover
rate
Messengers porters and deliverers,
Permanent 4 0 0 0
Motorised farm and forestry plant
operators, Permanent 5 0 0 0
Other administrat & related clerks and
organizers, Permanent 46 2 3 6.50
Other occupations, Permanent 1 0 0 0
Safety health and quality inspectors,
Permanent 9 0 0 0
Secretaries & other keyboard operating
clerks, Permanent 19 0 0 0
Security guards, Permanent 23 4 4 17.40
Senior managers, Permanent 9 1 1 11.10
Trade labourers, Permanent 5 0 0 0
Veterinarians, Permanent 9 4 4 44.40
TOTAL 586 50 78 13.30
Table 3.5.3 Reasons why staff left the department for the period 1 April 2017 to 31 March 2018
Termination Type Number % of Total Resignations
Death 5 6.40
Resignation 8 10.30
Expiry of contract 53 67.90
Dismissal – misconduct 4 5.10
Retirement 8 10.30
Total 78 100
Total number of employees who left as a % of
total employment
Table 3.5.4 Promotions by critical occupation for the period 1 April 2017 and 31 March 2018
Occupation Employees
at 01 April
2017
Promotions
to another
salary level
Salary level
promotions
as a % of
employees by
occupation
Progressions
to another
notch within a
salary level
Notch
progression as
a % of
employees by
occupation
Administrative related 61 0 0 36 59
Agricultural animal
oceanography forestry & other
science 47 0 0 33 70.20
Agriculture related 102 0 0 58 56.90
Auxiliary and related workers 5 0 0 1 20
Biochemistry pharmacol. zoology
& life science and technical 4 0 0 0 0
Civil engineering technicians 15 0 0 8 53.30
Cleaners in offices workshops
hospitals etc. 37 0 0 29 78.40
Client inform clerks(switchboard
receptionist inform clerks) 2 0 0 2 100
Communication and information
related 6 0 0 6 100

233
Occupation Employees
at 01 April
2017
Promotions
to another
salary level
Salary level
promotions
as a % of
employees by
occupation
Progressions
to another
notch within a
salary level
Notch
progression as
a % of
employees by
occupation
Economists 9 0 0 8 88.90
Engineer and Sciences related,
Permanent 1 0 0 0 0
Engineers and related
professionals 4 0 0 1 25
Farm hands and labourers 91 0 0 72 79.10
Farming forestry advisors and
farm managers 3 0 0 0 0
Finance and economics related 1 0 0 0 0
Financial and related
professionals 7 0 0 3 42.90
Financial clerks and credit
controllers 11 0 0 9 81.80
Head of Department/Chief
Executive Officer 1 0 0 0 0
Horticulturists foresters
agriculture.& forestry technology 2 0 0 0 0
Human resources clerks 4 0 0 4 100
Human resources related 5 0 0 1 20
Information technology related 4 0 0 2 50
Library mail and related clerks 22 0 0 12 54.50
Logistical support personnel 1 0 0 0 0
Material-recording and transport
clerks 11 0 0 7 63.60
Messengers porters and
deliverers 4 0 0 3 75
Motorised farm and forestry plant
operators 5 0 0 5 100
Other administrat & related
clerks and organisers 46 0 0 32 69.60
Other occupations 1 0 0 0 0
Safety health and quality
inspectors 9 0 0 4 44.40
Secretaries & other keyboard
operating clerks 19 1 5.30 15 78.90
Security guards 23 0 0 18 78.30
Senior managers 9 0 0 8 88.90
Trade labourers 5 0 0 5 100
Veterinarians 9 0 0 4 44.40
TOTAL 586 1 0.20 386 65.90
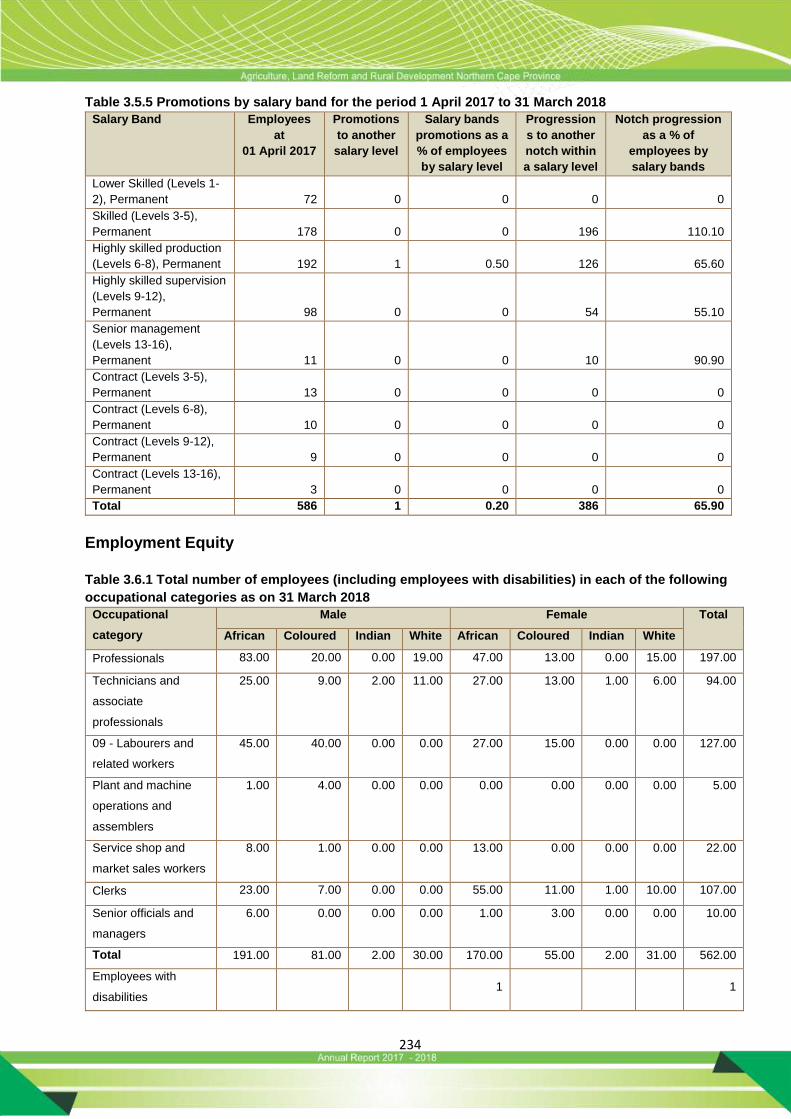
234
Table 3.5.5 Promotions by salary band for the period 1 April 2017 to 31 March 2018
Salary Band Employees
at
01 April 2017
Promotions
to another
salary level
Salary bands
promotions as a
% of employees
by salary level
Progression
s to another
notch within
a salary level
Notch progression
as a % of
employees by
salary bands
Lower Skilled (Levels 1-
2), Permanent 72 0 0 0 0
Skilled (Levels 3-5),
Permanent 178 0 0 196 110.10
Highly skilled production
(Levels 6-8), Permanent 192 1 0.50 126 65.60
Highly skilled supervision
(Levels 9-12),
Permanent 98 0 0 54 55.10
Senior management
(Levels 13-16),
Permanent 11 0 0 10 90.90
Contract (Levels 3-5),
Permanent 13 0 0 0 0
Contract (Levels 6-8),
Permanent 10 0 0 0 0
Contract (Levels 9-12),
Permanent 9 0 0 0 0
Contract (Levels 13-16),
Permanent 3 0 0 0 0
Total 586 1 0.20 386 65.90
Employment Equity
Table 3.6.1 Total number of employees (including employees with disabilities) in each of the following
occupational categories as on 31 March 2018
Occupational
category
Male Female Total
African Coloured Indian White African Coloured Indian White
Professionals 83.00 20.00 0.00 19.00 47.00 13.00 0.00 15.00 197.00
Technicians and
associate
professionals
25.00 9.00 2.00 11.00 27.00 13.00 1.00 6.00 94.00
09 - Labourers and
related workers
45.00 40.00 0.00 0.00 27.00 15.00 0.00 0.00 127.00
Plant and machine
operations and
assemblers
1.00 4.00 0.00 0.00 0.00 0.00 0.00 0.00 5.00
Service shop and
market sales workers
8.00 1.00 0.00 0.00 13.00 0.00 0.00 0.00 22.00
Clerks 23.00 7.00 0.00 0.00 55.00 11.00 1.00 10.00 107.00
Senior officials and
managers
6.00 0.00 0.00 0.00 1.00 3.00 0.00 0.00 10.00
Total 191.00 81.00 2.00 30.00 170.00 55.00 2.00 31.00 562.00
Employees with
disabilities 1 1
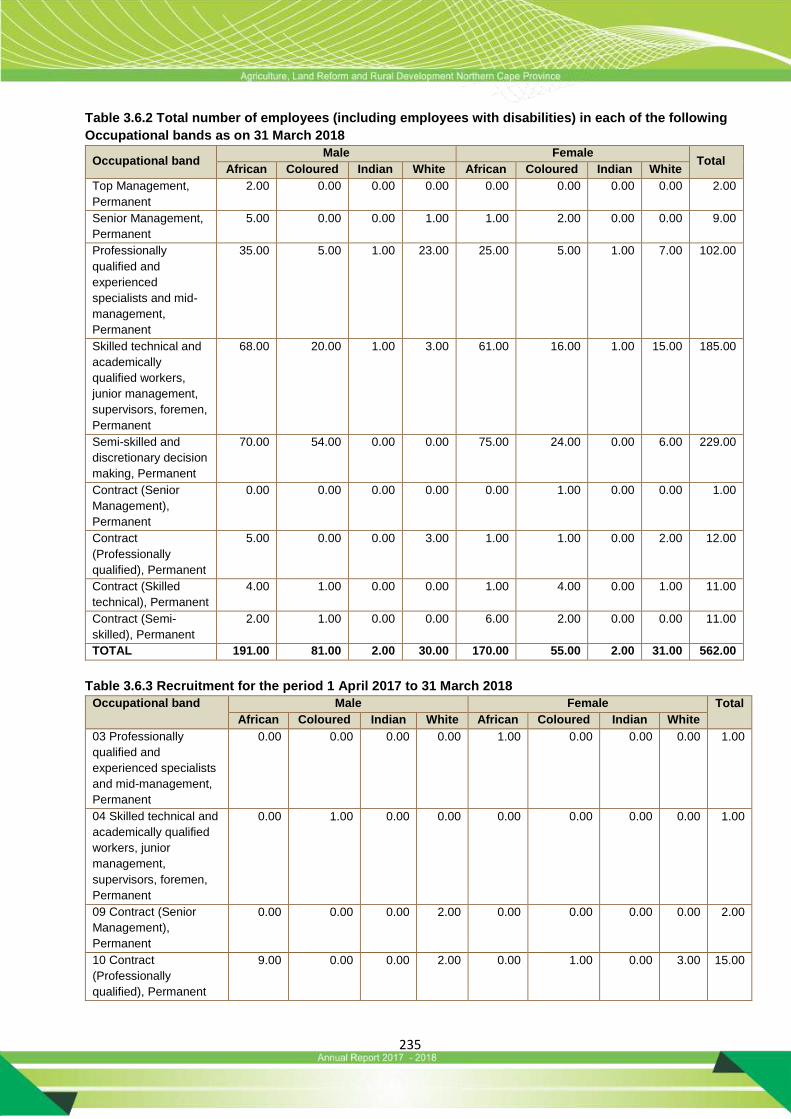
235
Table 3.6.2 Total number of employees (including employees with disabilities) in each of the following
Occupational bands as on 31 March 2018
Occupational band Male Female
Total African Coloured Indian White African Coloured Indian White
Top Management,
Permanent
2.00 0.00 0.00 0.00 0.00 0.00 0.00 0.00 2.00
Senior Management,
Permanent
5.00 0.00 0.00 1.00 1.00 2.00 0.00 0.00 9.00
Professionally
qualified and
experienced
specialists and mid-
management,
Permanent
35.00 5.00 1.00 23.00 25.00 5.00 1.00 7.00 102.00
Skilled technical and
academically
qualified workers,
junior management,
supervisors, foremen,
Permanent
68.00 20.00 1.00 3.00 61.00 16.00 1.00 15.00 185.00
Semi-skilled and
discretionary decision
making, Permanent
70.00 54.00 0.00 0.00 75.00 24.00 0.00 6.00 229.00
Contract (Senior
Management),
Permanent
0.00 0.00 0.00 0.00 0.00 1.00 0.00 0.00 1.00
Contract
(Professionally
qualified), Permanent
5.00 0.00 0.00 3.00 1.00 1.00 0.00 2.00 12.00
Contract (Skilled
technical), Permanent
4.00 1.00 0.00 0.00 1.00 4.00 0.00 1.00 11.00
Contract (Semi-
skilled), Permanent
2.00 1.00 0.00 0.00 6.00 2.00 0.00 0.00 11.00
TOTAL 191.00 81.00 2.00 30.00 170.00 55.00 2.00 31.00 562.00
Table 3.6.3 Recruitment for the period 1 April 2017 to 31 March 2018
Occupational band Male Female Total
African Coloured Indian White African Coloured Indian White
03 Professionally
qualified and
experienced specialists
and mid-management,
Permanent
0.00 0.00 0.00 0.00 1.00 0.00 0.00 0.00 1.00
04 Skilled technical and
academically qualified
workers, junior
management,
supervisors, foremen,
Permanent
0.00 1.00 0.00 0.00 0.00 0.00 0.00 0.00 1.00
09 Contract (Senior
Management),
Permanent
0.00 0.00 0.00 2.00 0.00 0.00 0.00 0.00 2.00
10 Contract
(Professionally
qualified), Permanent
9.00 0.00 0.00 2.00 0.00 1.00 0.00 3.00 15.00
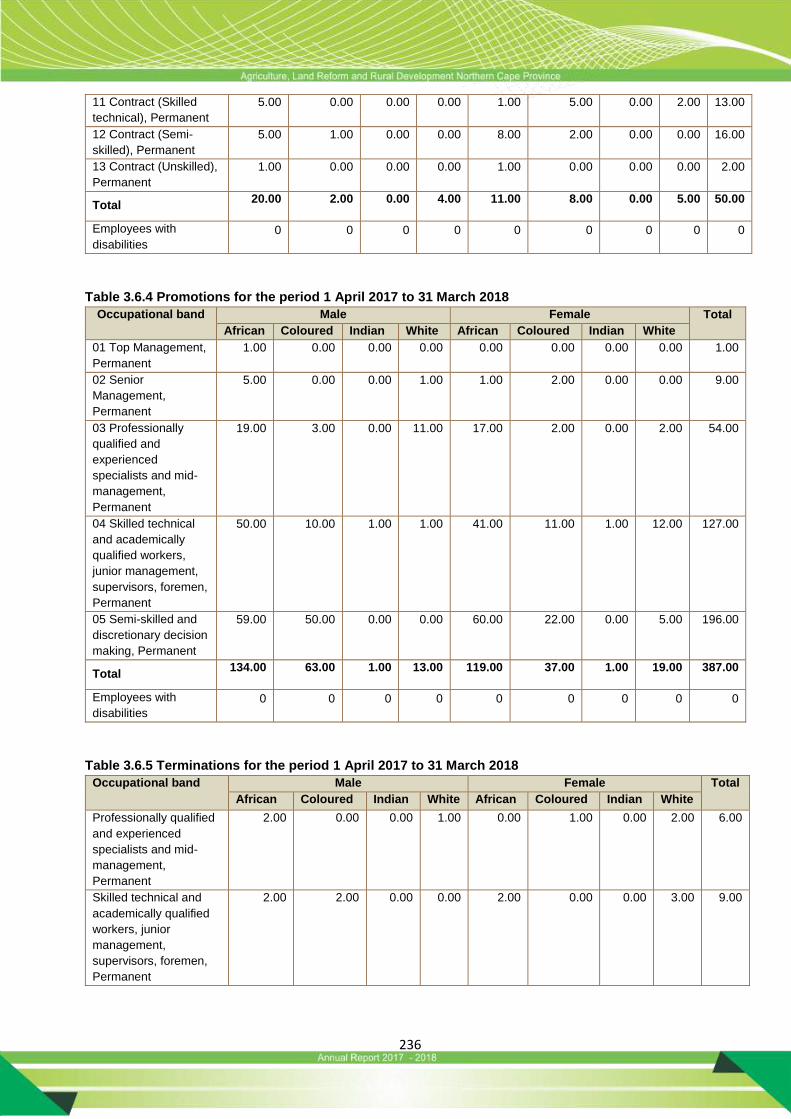
236
11 Contract (Skilled
technical), Permanent
5.00 0.00 0.00 0.00 1.00 5.00 0.00 2.00 13.00
12 Contract (Semi-
skilled), Permanent
5.00 1.00 0.00 0.00 8.00 2.00 0.00 0.00 16.00
13 Contract (Unskilled),
Permanent
1.00 0.00 0.00 0.00 1.00 0.00 0.00 0.00 2.00
Total 20.00 2.00 0.00 4.00 11.00 8.00 0.00 5.00 50.00
Employees with
disabilities
0 0 0 0 0 0 0 0 0
Table 3.6.4 Promotions for the period 1 April 2017 to 31 March 2018
Occupational band Male Female Total
African Coloured Indian White African Coloured Indian White
01 Top Management,
Permanent
1.00 0.00 0.00 0.00 0.00 0.00 0.00 0.00 1.00
02 Senior
Management,
Permanent
5.00 0.00 0.00 1.00 1.00 2.00 0.00 0.00 9.00
03 Professionally
qualified and
experienced
specialists and mid-
management,
Permanent
19.00 3.00 0.00 11.00 17.00 2.00 0.00 2.00 54.00
04 Skilled technical
and academically
qualified workers,
junior management,
supervisors, foremen,
Permanent
50.00 10.00 1.00 1.00 41.00 11.00 1.00 12.00 127.00
05 Semi-skilled and
discretionary decision
making, Permanent
59.00 50.00 0.00 0.00 60.00 22.00 0.00 5.00 196.00
Total 134.00 63.00 1.00 13.00 119.00 37.00 1.00 19.00 387.00
Employees with
disabilities
0 0 0 0 0 0 0 0 0
Table 3.6.5 Terminations for the period 1 April 2017 to 31 March 2018
Occupational band Male Female Total
African Coloured Indian White African Coloured Indian White
Professionally qualified
and experienced
specialists and mid-
management,
Permanent
2.00 0.00 0.00 1.00 0.00 1.00 0.00 2.00 6.00
Skilled technical and
academically qualified
workers, junior
management,
supervisors, foremen,
Permanent
2.00 2.00 0.00 0.00 2.00 0.00 0.00 3.00 9.00
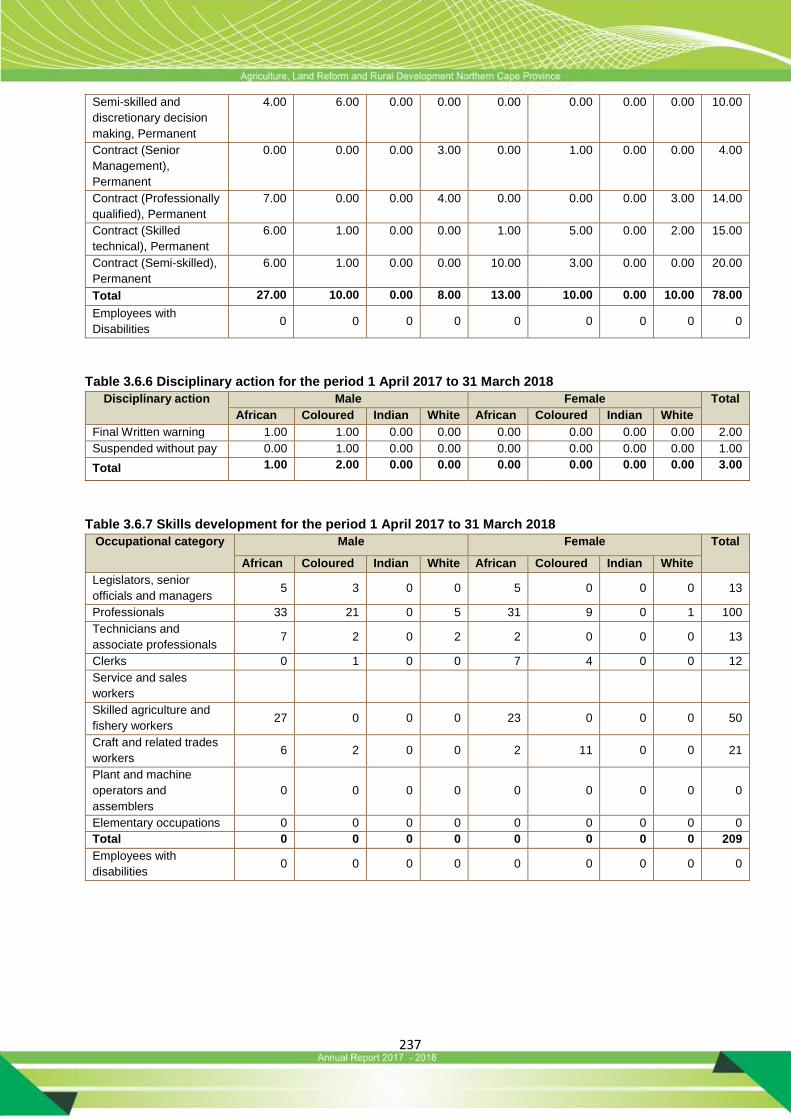
237
Semi-skilled and
discretionary decision
making, Permanent
4.00 6.00 0.00 0.00 0.00 0.00 0.00 0.00 10.00
Contract (Senior
Management),
Permanent
0.00 0.00 0.00 3.00 0.00 1.00 0.00 0.00 4.00
Contract (Professionally
qualified), Permanent
7.00 0.00 0.00 4.00 0.00 0.00 0.00 3.00 14.00
Contract (Skilled
technical), Permanent
6.00 1.00 0.00 0.00 1.00 5.00 0.00 2.00 15.00
Contract (Semi-skilled),
Permanent
6.00 1.00 0.00 0.00 10.00 3.00 0.00 0.00 20.00
Total 27.00 10.00 0.00 8.00 13.00 10.00 0.00 10.00 78.00
Employees with
Disabilities 0 0 0 0 0 0 0 0 0
Table 3.6.6 Disciplinary action for the period 1 April 2017 to 31 March 2018
Disciplinary action Male Female Total
African Coloured Indian White African Coloured Indian White
Final Written warning 1.00 1.00 0.00 0.00 0.00 0.00 0.00 0.00 2.00
Suspended without pay 0.00 1.00 0.00 0.00 0.00 0.00 0.00 0.00 1.00
Total 1.00 2.00 0.00 0.00 0.00 0.00 0.00 0.00 3.00
Table 3.6.7 Skills development for the period 1 April 2017 to 31 March 2018
Occupational category Male Female Total
African Coloured Indian White African Coloured Indian White
Legislators, senior
officials and managers 5 3 0 0 5 0 0 0 13
Professionals 33 21 0 5 31 9 0 1 100
Technicians and
associate professionals 7 2 0 2 2 0 0 0 13
Clerks 0 1 0 0 7 4 0 0 12
Service and sales
workers
Skilled agriculture and
fishery workers 27 0 0 0 23 0 0 0 50
Craft and related trades
workers 6 2 0 0 2 11 0 0 21
Plant and machine
operators and
assemblers
0 0 0 0 0 0 0 0 0
Elementary occupations 0 0 0 0 0 0 0 0 0
Total 0 0 0 0 0 0 0 0 209
Employees with
disabilities 0 0 0 0 0 0 0 0 0
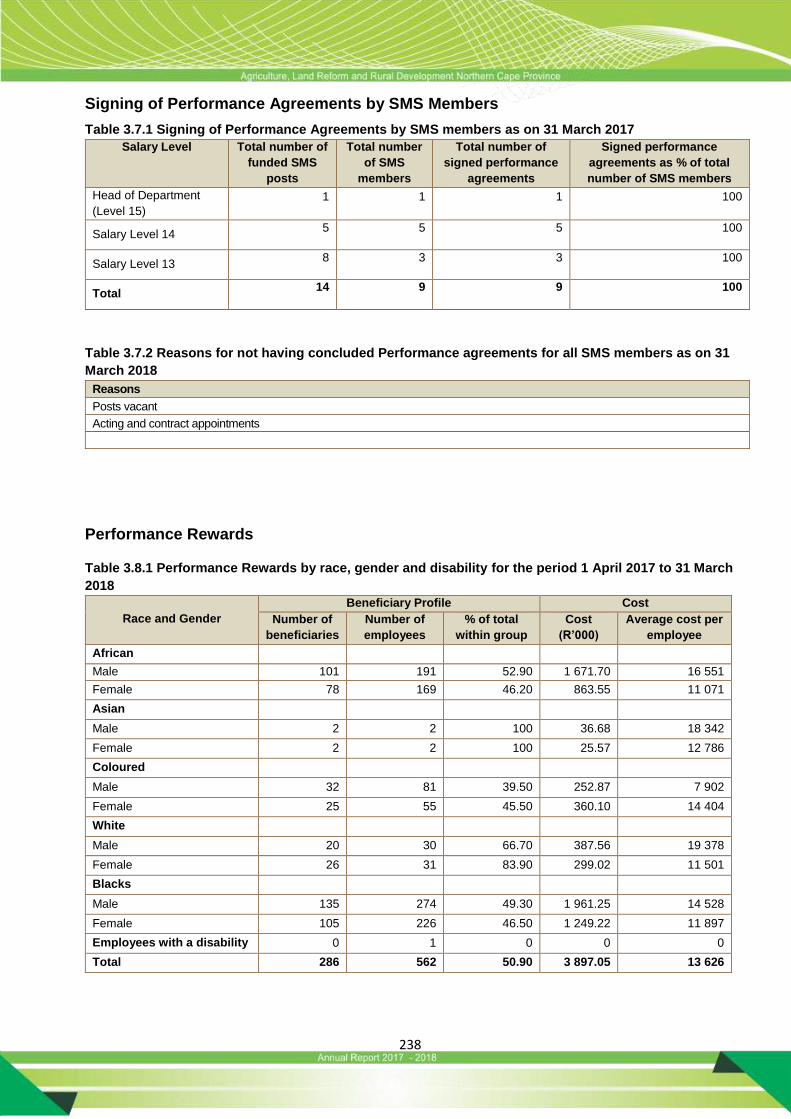
238
Signing of Performance Agreements by SMS Members
Table 3.7.1 Signing of Performance Agreements by SMS members as on 31 March 2017
Salary Level Total number of
funded SMS
posts
Total number
of SMS
members
Total number of
signed performance
agreements
Signed performance
agreements as % of total
number of SMS members
Head of Department
(Level 15)
1 1 1 100
Salary Level 14 5 5 5 100
Salary Level 13 8 3 3 100
Total 14 9 9 100
Table 3.7.2 Reasons for not having concluded Performance agreements for all SMS members as on 31
March 2018
Reasons
Posts vacant
Acting and contract appointments
Performance Rewards
Table 3.8.1 Performance Rewards by race, gender and disability for the period 1 April 2017 to 31 March
2018
Race and Gender
Beneficiary Profile Cost
Number of
beneficiaries
Number of
employees
% of total
within group
Cost
(R’000)
Average cost per
employee
African
Male 101 191 52.90 1 671.70 16 551
Female 78 169 46.20 863.55 11 071
Asian
Male 2 2 100 36.68 18 342
Female 2 2 100 25.57 12 786
Coloured
Male 32 81 39.50 252.87 7 902
Female 25 55 45.50 360.10 14 404
White
Male 20 30 66.70 387.56 19 378
Female 26 31 83.90 299.02 11 501
Blacks
Male 135 274 49.30 1 961.25 14 528
Female 105 226 46.50 1 249.22 11 897
Employees with a disability 0 1 0 0 0
Total 286 562 50.90 3 897.05 13 626
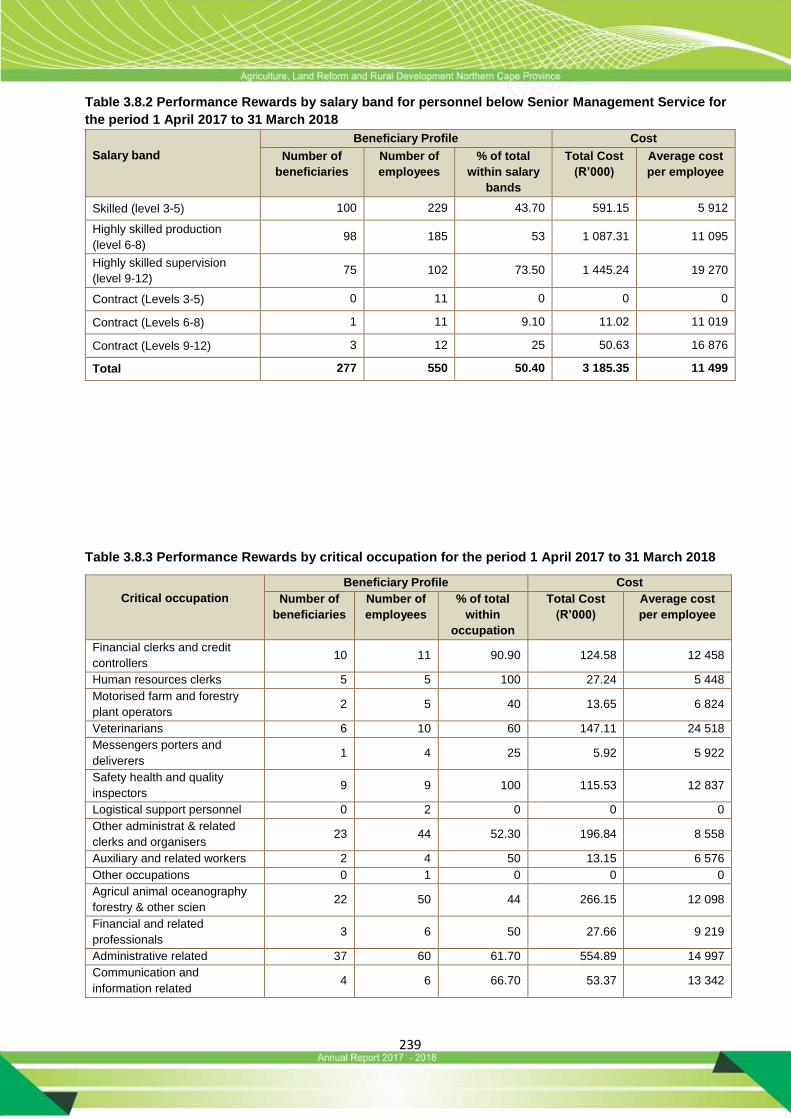
239
Table 3.8.2 Performance Rewards by salary band for personnel below Senior Management Service for
the period 1 April 2017 to 31 March 2018
Salary band
Beneficiary Profile Cost
Number of
beneficiaries
Number of
employees
% of total
within salary
bands
Total Cost
(R’000)
Average cost
per employee
Skilled (level 3-5) 100 229 43.70 591.15 5 912
Highly skilled production
(level 6-8) 98 185 53 1 087.31 11 095
Highly skilled supervision
(level 9-12) 75 102 73.50 1 445.24 19 270
Contract (Levels 3-5) 0 11 0 0 0
Contract (Levels 6-8) 1 11 9.10 11.02 11 019
Contract (Levels 9-12) 3 12 25 50.63 16 876
Total 277 550 50.40 3 185.35 11 499
Table 3.8.3 Performance Rewards by critical occupation for the period 1 April 2017 to 31 March 2018
Critical occupation
Beneficiary Profile Cost
Number of
beneficiaries
Number of
employees
% of total
within
occupation
Total Cost
(R’000)
Average cost
per employee
Financial clerks and credit
controllers 10 11 90.90 124.58 12 458
Human resources clerks 5 5 100 27.24 5 448
Motorised farm and forestry
plant operators 2 5 40 13.65 6 824
Veterinarians 6 10 60 147.11 24 518
Messengers porters and
deliverers 1 4 25 5.92 5 922
Safety health and quality
inspectors 9 9 100 115.53 12 837
Logistical support personnel 0 2 0 0 0
Other administrat & related
clerks and organisers 23 44 52.30 196.84 8 558
Auxiliary and related workers 2 4 50 13.15 6 576
Other occupations 0 1 0 0 0
Agricul animal oceanography
forestry & other scien 22 50 44 266.15 12 098
Financial and related
professionals 3 6 50 27.66 9 219
Administrative related 37 60 61.70 554.89 14 997
Communication and
information related 4 6 66.70 53.37 13 342
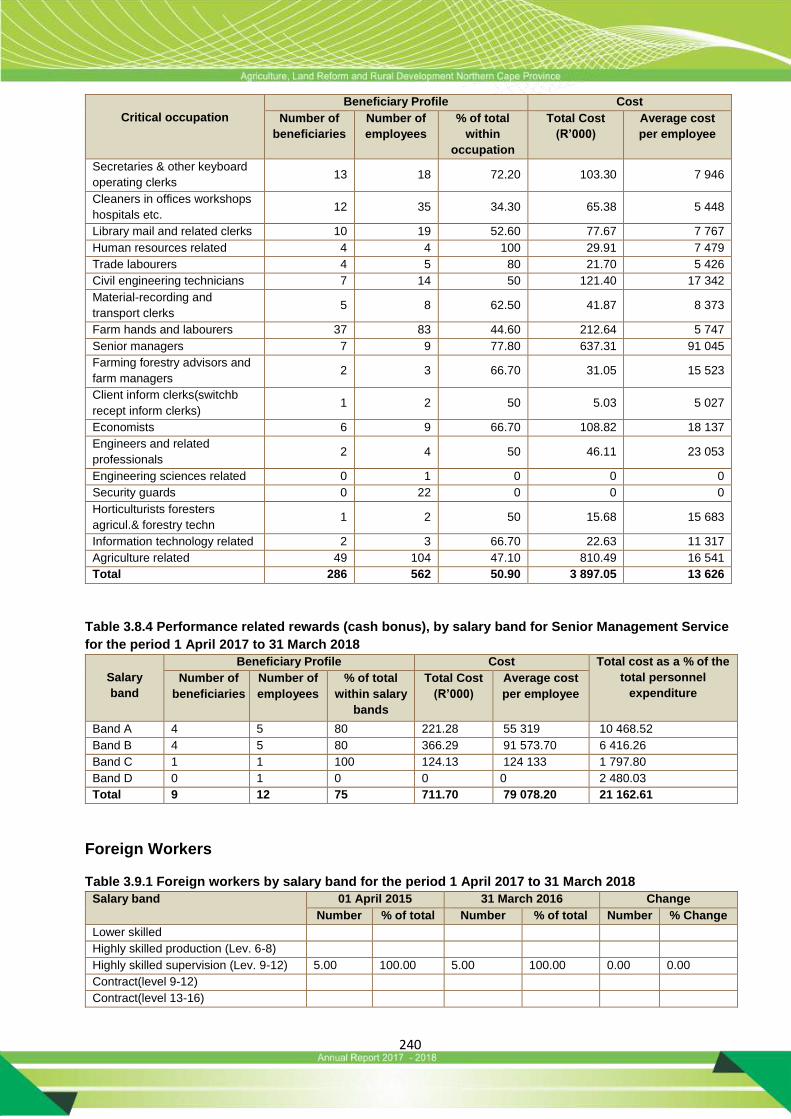
240
Critical occupation
Beneficiary Profile Cost
Number of
beneficiaries
Number of
employees
% of total
within
occupation
Total Cost
(R’000)
Average cost
per employee
Secretaries & other keyboard
operating clerks 13 18 72.20 103.30 7 946
Cleaners in offices workshops
hospitals etc. 12 35 34.30 65.38 5 448
Library mail and related clerks 10 19 52.60 77.67 7 767
Human resources related 4 4 100 29.91 7 479
Trade labourers 4 5 80 21.70 5 426
Civil engineering technicians 7 14 50 121.40 17 342
Material-recording and
transport clerks 5 8 62.50 41.87 8 373
Farm hands and labourers 37 83 44.60 212.64 5 747
Senior managers 7 9 77.80 637.31 91 045
Farming forestry advisors and
farm managers 2 3 66.70 31.05 15 523
Client inform clerks(switchb
recept inform clerks) 1 2 50 5.03 5 027
Economists 6 9 66.70 108.82 18 137
Engineers and related
professionals 2 4 50 46.11 23 053
Engineering sciences related 0 1 0 0 0
Security guards 0 22 0 0 0
Horticulturists foresters
agricul.& forestry techn 1 2 50 15.68 15 683
Information technology related 2 3 66.70 22.63 11 317
Agriculture related 49 104 47.10 810.49 16 541
Total 286 562 50.90 3 897.05 13 626
Table 3.8.4 Performance related rewards (cash bonus), by salary band for Senior Management Service
for the period 1 April 2017 to 31 March 2018
Salary
band
Beneficiary Profile Cost Total cost as a % of the
total personnel
expenditure
Number of
beneficiaries
Number of
employees
% of total
within salary
bands
Total Cost
(R’000)
Average cost
per employee
Band A 4 5 80 221.28 55 319 10 468.52
Band B 4 5 80 366.29 91 573.70 6 416.26
Band C 1 1 100 124.13 124 133 1 797.80
Band D 0 1 0 0 0 2 480.03
Total 9 12 75 711.70 79 078.20 21 162.61
Foreign Workers
Table 3.9.1 Foreign workers by salary band for the period 1 April 2017 to 31 March 2018
Salary band 01 April 2015 31 March 2016 Change
Number % of total Number % of total Number % Change
Lower skilled
Highly skilled production (Lev. 6-8)
Highly skilled supervision (Lev. 9-12) 5.00 100.00 5.00 100.00 0.00 0.00
Contract(level 9-12)
Contract(level 13-16)
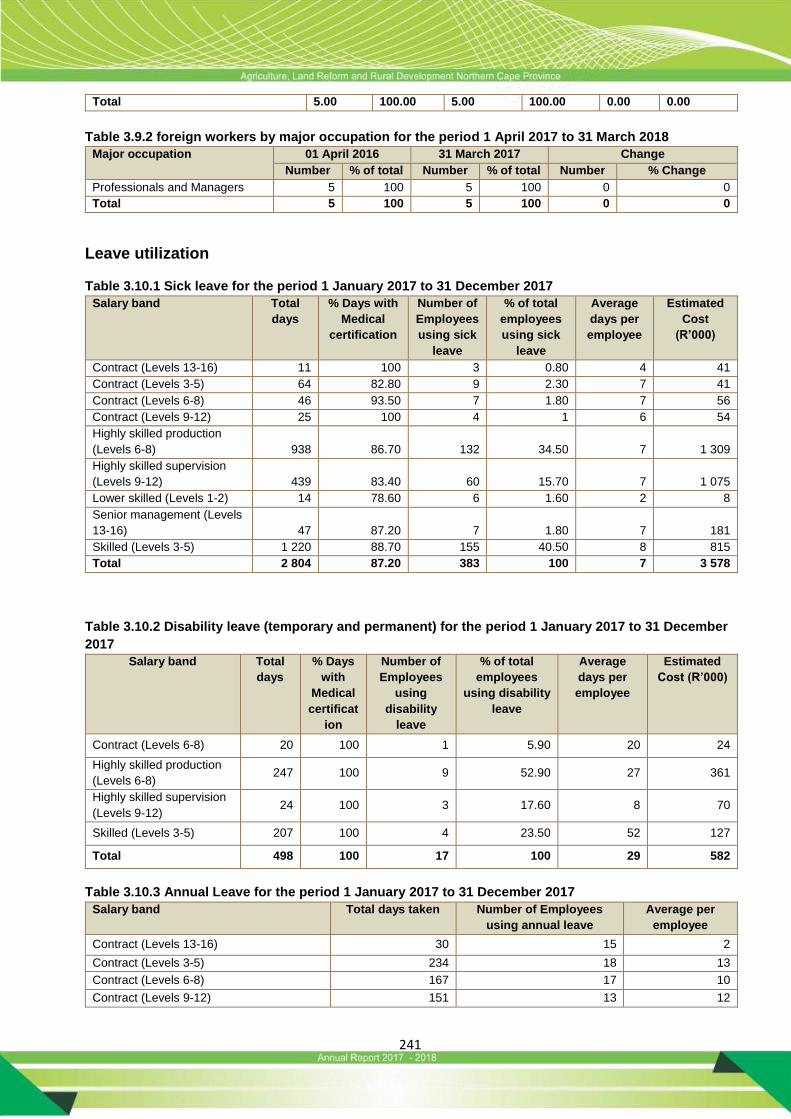
241
Total 5.00 100.00 5.00 100.00 0.00 0.00
Table 3.9.2 foreign workers by major occupation for the period 1 April 2017 to 31 March 2018
Major occupation 01 April 2016 31 March 2017 Change
Number % of total Number % of total Number % Change
Professionals and Managers 5 100 5 100 0 0
Total 5 100 5 100 0 0
Leave utilization
Table 3.10.1 Sick leave for the period 1 January 2017 to 31 December 2017
Salary band Total
days
% Days with
Medical
certification
Number of
Employees
using sick
leave
% of total
employees
using sick
leave
Average
days per
employee
Estimated
Cost
(R’000)
Contract (Levels 13-16) 11 100 3 0.80 4 41
Contract (Levels 3-5) 64 82.80 9 2.30 7 41
Contract (Levels 6-8) 46 93.50 7 1.80 7 56
Contract (Levels 9-12) 25 100 4 1 6 54
Highly skilled production
(Levels 6-8) 938 86.70 132 34.50 7 1 309
Highly skilled supervision
(Levels 9-12) 439 83.40 60 15.70 7 1 075
Lower skilled (Levels 1-2) 14 78.60 6 1.60 2 8
Senior management (Levels
13-16) 47 87.20 7 1.80 7 181
Skilled (Levels 3-5) 1 220 88.70 155 40.50 8 815
Total 2 804 87.20 383 100 7 3 578
Table 3.10.2 Disability leave (temporary and permanent) for the period 1 January 2017 to 31 December
2017
Salary band Total
days
% Days
with
Medical
certificat
ion
Number of
Employees
using
disability
leave
% of total
employees
using disability
leave
Average
days per
employee
Estimated
Cost (R’000)
Contract (Levels 6-8) 20 100 1 5.90 20 24
Highly skilled production
(Levels 6-8) 247 100 9 52.90 27 361
Highly skilled supervision
(Levels 9-12) 24 100 3 17.60 8 70
Skilled (Levels 3-5) 207 100 4 23.50 52 127
Total 498 100 17 100 29 582
Table 3.10.3 Annual Leave for the period 1 January 2017 to 31 December 2017
Salary band Total days taken Number of Employees
using annual leave
Average per
employee
Contract (Levels 13-16) 30 15 2
Contract (Levels 3-5) 234 18 13
Contract (Levels 6-8) 167 17 10
Contract (Levels 9-12) 151 13 12
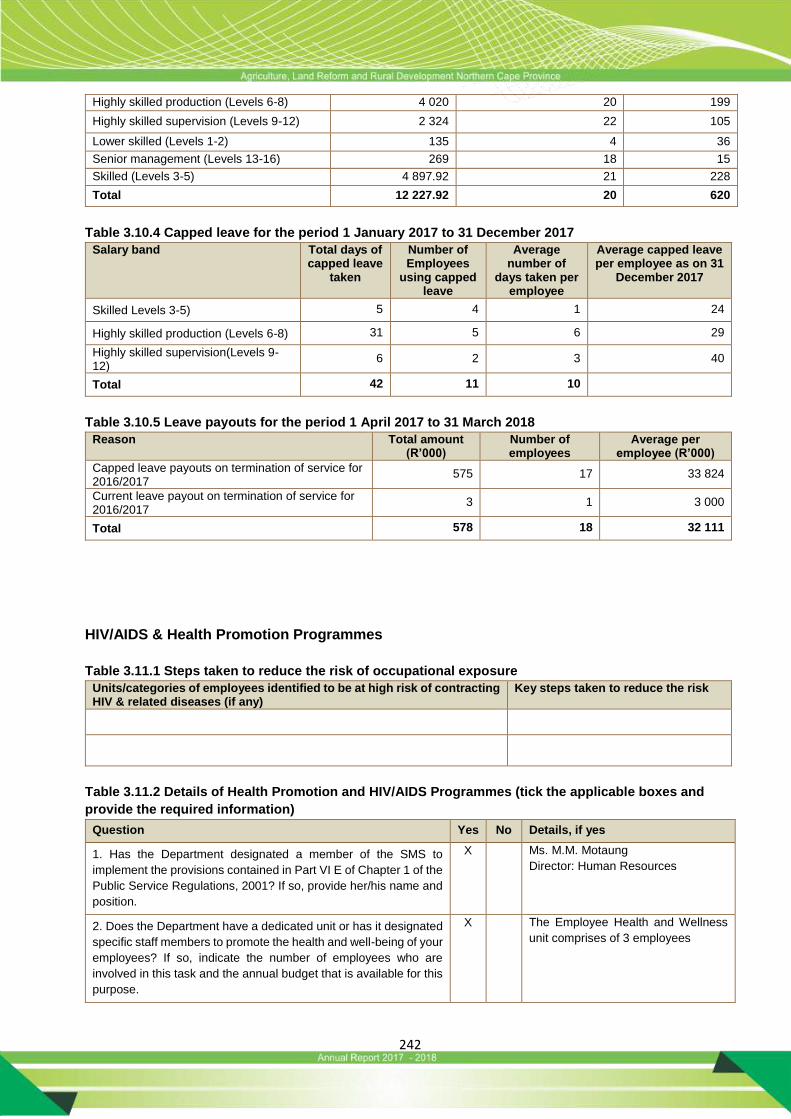
242
Highly skilled production (Levels 6-8) 4 020 20 199
Highly skilled supervision (Levels 9-12) 2 324 22 105
Lower skilled (Levels 1-2) 135 4 36
Senior management (Levels 13-16) 269 18 15
Skilled (Levels 3-5) 4 897.92 21 228
Total 12 227.92 20 620
Table 3.10.4 Capped leave for the period 1 January 2017 to 31 December 2017
Salary band Total days of capped leave
taken
Number of Employees
using capped leave
Average number of
days taken per employee
Average capped leave per employee as on 31
December 2017
Skilled Levels 3-5) 5 4 1 24
Highly skilled production (Levels 6-8) 31 5 6 29
Highly skilled supervision(Levels 9-12)
6 2 3 40
Total 42 11 10
Table 3.10.5 Leave payouts for the period 1 April 2017 to 31 March 2018
Reason Total amount (R’000)
Number of employees
Average per employee (R’000)
Capped leave payouts on termination of service for 2016/2017
575 17 33 824
Current leave payout on termination of service for 2016/2017
3 1 3 000
Total 578 18 32 111
HIV/AIDS & Health Promotion Programmes
Table 3.11.1 Steps taken to reduce the risk of occupational exposure
Units/categories of employees identified to be at high risk of contracting HIV & related diseases (if any)
Key steps taken to reduce the risk
Table 3.11.2 Details of Health Promotion and HIV/AIDS Programmes (tick the applicable boxes and
provide the required information)
Question Yes No Details, if yes
1. Has the Department designated a member of the SMS to
implement the provisions contained in Part VI E of Chapter 1 of the
Public Service Regulations, 2001? If so, provide her/his name and
position.
X Ms. M.M. Motaung
Director: Human Resources
2. Does the Department have a dedicated unit or has it designated
specific staff members to promote the health and well-being of your
employees? If so, indicate the number of employees who are
involved in this task and the annual budget that is available for this
purpose.
X The Employee Health and Wellness
unit comprises of 3 employees

243
Question Yes No Details, if yes
3. Has the Department introduced an Employee Assistance or
Health Promotion Programme for your employees? If so, indicate
the key elements/services of this Programme.
X The unit’s key elements are guided by
the 4 pillars:
Wellness management
HIV/AIDS, TB and STI management
Health and Productivity management
SHERQ
4. Has the Department established (a) committee(s) as
contemplated in Part VI E.5 (e) of Chapter 1 of the Public Service
Regulations, 2001? If so, please provide the names of the
members of the committee and the stakeholder(s) that they
represent.
X
5. Has the Department reviewed its employment policies and
practices to ensure that these do not unfairly discriminate against
employees on the basis of their HIV status? If so, list the
employment policies/practices so reviewed.
X HIV/AIDS, TB and STI management
policy
6. Has the Department introduced measures to protect HIV-positive
employees or those perceived to be HIV-positive from
discrimination? If so, list the key elements of these measures.
X The unit derives/is guided by Section
34 of the Promotion of Equality and
Prevention of unfair Discrimination
Act of 2000
7. Does the Department encourage its employees to undergo
Voluntary Counselling and Testing? If so, list the results that you
have you achieved.
X The Employee Health and Wellness
unit conducts screenings on a
quarterly basis with the assistance of
Dep. Of Health; however the staff
turnout is minimal
8. Has the Department developed measures/indicators to monitor
& evaluate the impact of its health promotion programme? If so, list
these measures/indicators.
X The unit usually measures the impact
of the information sessions by
feedback/questions that employees
directs to them. Follow up sessions
are also conducted to always keep
colleagues updated of new health
related developments
Labour Relations
Table 3.12.1 Collective agreements for the period 1 April 2017 to 31 March 2018
Subject matter Date
0 0
0 0
Total number of Collective agreements 0
Table 3.12.2 Misconduct and disciplinary hearings finalised for the period 1 April 2017 to 31 March
2018
Outcomes of disciplinary hearings Number % of total
Correctional counselling
Verbal warning
Written warning
Final written warning 2.00 66.70
Suspended without pay 1.00 33.30
Fine
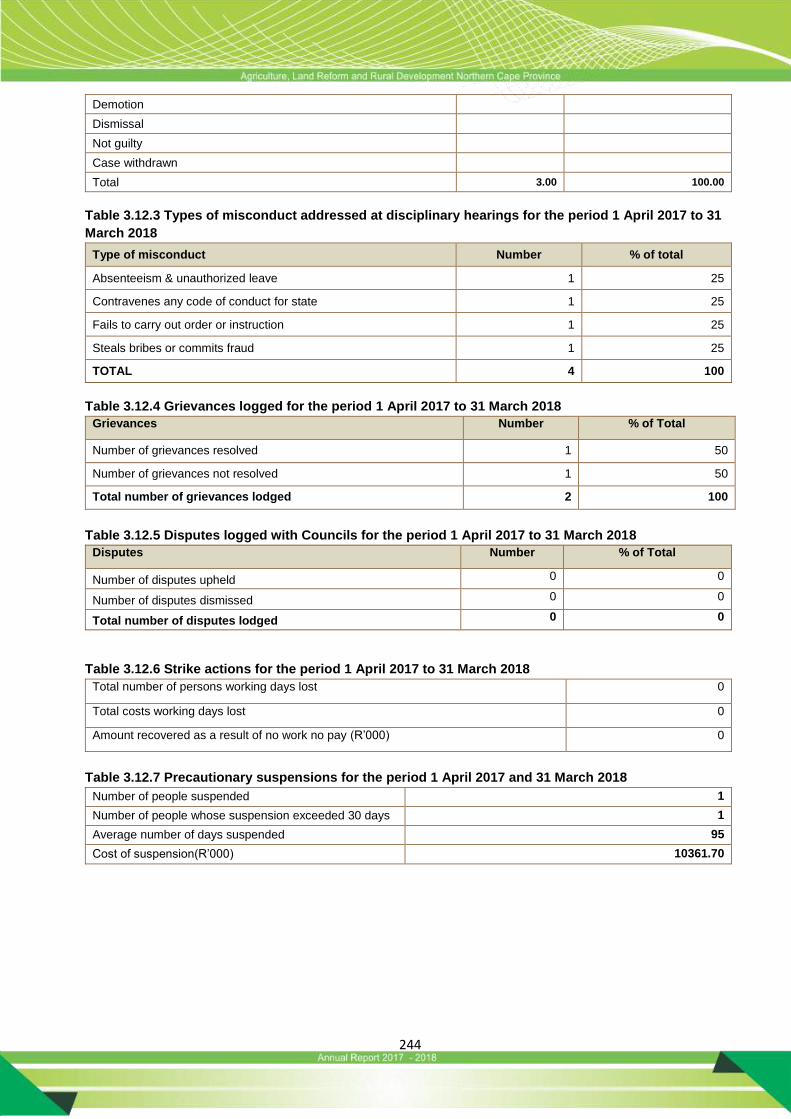
244
Demotion
Dismissal
Not guilty
Case withdrawn
Total 3.00 100.00
Table 3.12.3 Types of misconduct addressed at disciplinary hearings for the period 1 April 2017 to 31
March 2018
Type of misconduct Number % of total
Absenteeism & unauthorized leave 1 25
Contravenes any code of conduct for state 1 25
Fails to carry out order or instruction 1 25
Steals bribes or commits fraud 1 25
TOTAL 4 100
Table 3.12.4 Grievances logged for the period 1 April 2017 to 31 March 2018
Grievances Number % of Total
Number of grievances resolved 1 50
Number of grievances not resolved 1 50
Total number of grievances lodged 2 100
Table 3.12.5 Disputes logged with Councils for the period 1 April 2017 to 31 March 2018
Disputes Number % of Total
Number of disputes upheld 0 0
Number of disputes dismissed 0 0
Total number of disputes lodged 0 0
Table 3.12.6 Strike actions for the period 1 April 2017 to 31 March 2018
Total number of persons working days lost 0
Total costs working days lost 0
Amount recovered as a result of no work no pay (R’000) 0
Table 3.12.7 Precautionary suspensions for the period 1 April 2017 and 31 March 2018
Number of people suspended 1
Number of people whose suspension exceeded 30 days 1
Average number of days suspended 95
Cost of suspension(R’000) 10361.70
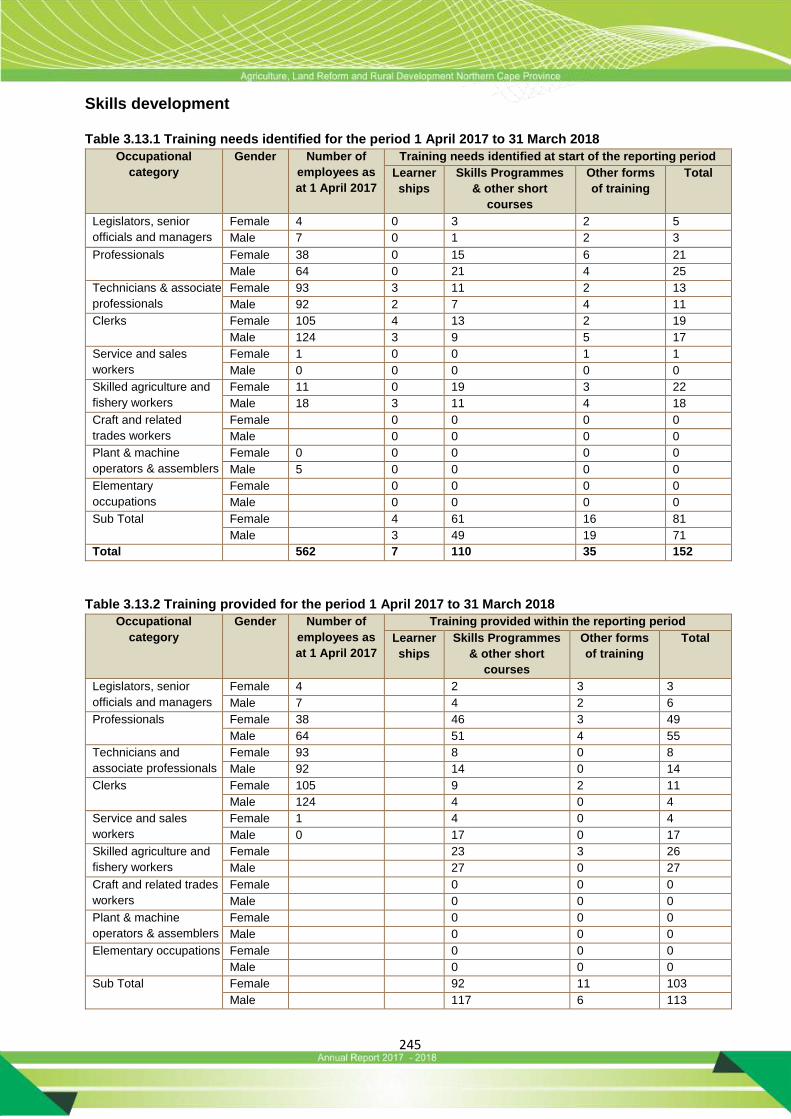
245
Skills development
Table 3.13.1 Training needs identified for the period 1 April 2017 to 31 March 2018 Occupational
category
Gender Number of
employees as
at 1 April 2017
Training needs identified at start of the reporting period
Learner
ships
Skills Programmes
& other short
courses
Other forms
of training
Total
Legislators, senior
officials and managers
Female 4 0 3 2 5
Male 7 0 1 2 3
Professionals Female 38 0 15 6 21
Male 64 0 21 4 25
Technicians & associate
professionals
Female 93 3 11 2 13
Male 92 2 7 4 11
Clerks Female 105 4 13 2 19
Male 124 3 9 5 17
Service and sales
workers
Female 1 0 0 1 1
Male 0 0 0 0 0
Skilled agriculture and
fishery workers
Female 11 0 19 3 22
Male 18 3 11 4 18
Craft and related
trades workers
Female 0 0 0 0
Male 0 0 0 0
Plant & machine
operators & assemblers
Female 0 0 0 0 0
Male 5 0 0 0 0
Elementary
occupations
Female 0 0 0 0
Male 0 0 0 0
Sub Total Female 4 61 16 81
Male 3 49 19 71
Total 562 7 110 35 152
Table 3.13.2 Training provided for the period 1 April 2017 to 31 March 2018
Occupational
category
Gender Number of
employees as
at 1 April 2017
Training provided within the reporting period
Learner
ships
Skills Programmes
& other short
courses
Other forms
of training
Total
Legislators, senior
officials and managers
Female 4 2 3 3
Male 7 4 2 6
Professionals Female 38 46 3 49
Male 64 51 4 55
Technicians and
associate professionals
Female 93 8 0 8
Male 92 14 0 14
Clerks Female 105 9 2 11
Male 124 4 0 4
Service and sales
workers
Female 1 4 0 4
Male 0 17 0 17
Skilled agriculture and
fishery workers
Female 23 3 26
Male 27 0 27
Craft and related trades
workers
Female 0 0 0
Male 0 0 0
Plant & machine
operators & assemblers
Female 0 0 0
Male 0 0 0
Elementary occupations Female 0 0 0
Male 0 0 0
Sub Total Female 92 11 103
Male 117 6 113
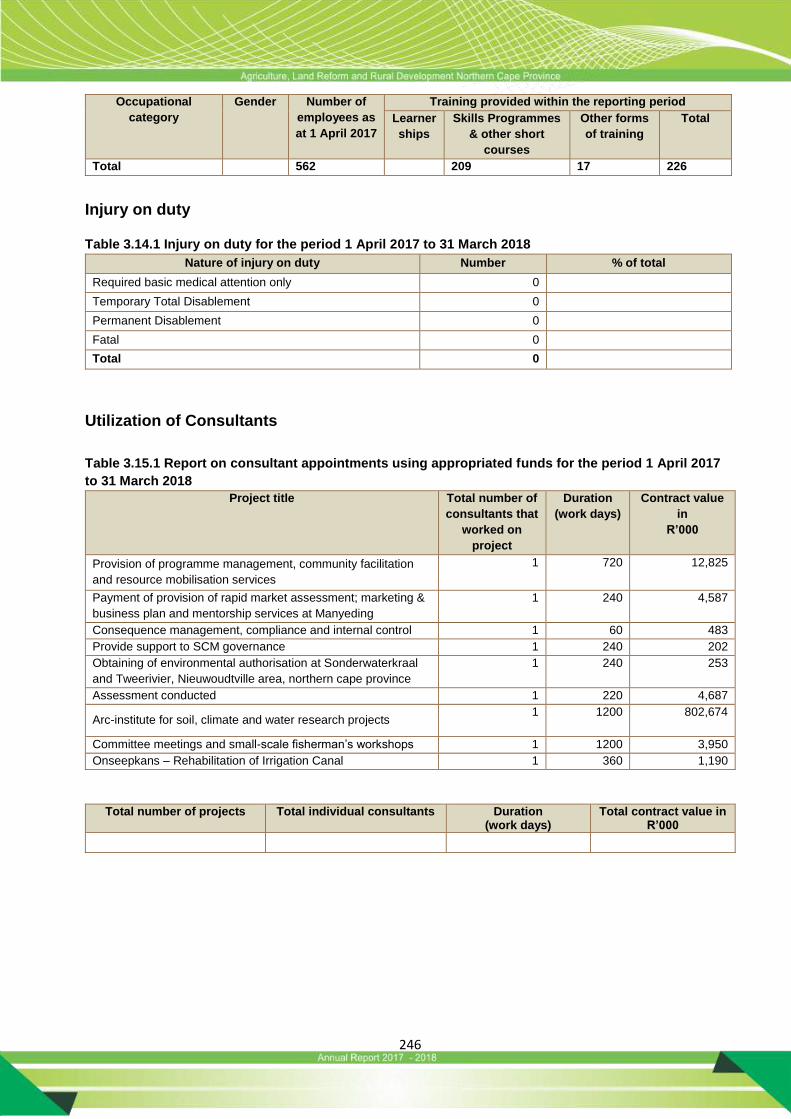
246
Occupational
category
Gender Number of
employees as
at 1 April 2017
Training provided within the reporting period
Learner
ships
Skills Programmes
& other short
courses
Other forms
of training
Total
Total 562 209 17 226
Injury on duty
Table 3.14.1 Injury on duty for the period 1 April 2017 to 31 March 2018
Nature of injury on duty Number % of total
Required basic medical attention only 0
Temporary Total Disablement 0
Permanent Disablement 0
Fatal 0
Total 0
Utilization of Consultants
Table 3.15.1 Report on consultant appointments using appropriated funds for the period 1 April 2017
to 31 March 2018
Project title Total number of
consultants that
worked on
project
Duration
(work days)
Contract value
in
R’000
Provision of programme management, community facilitation
and resource mobilisation services
1 720 12,825
Payment of provision of rapid market assessment; marketing &
business plan and mentorship services at Manyeding
1 240 4,587
Consequence management, compliance and internal control 1 60 483
Provide support to SCM governance 1 240 202
Obtaining of environmental authorisation at Sonderwaterkraal
and Tweerivier, Nieuwoudtville area, northern cape province
1 240 253
Assessment conducted 1 220 4,687
Arc-institute for soil, climate and water research projects 1 1200 802,674
Committee meetings and small-scale fisherman’s workshops 1 1200 3,950
Onseepkans – Rehabilitation of Irrigation Canal 1 360 1,190
Total number of projects Total individual consultants Duration (work days)
Total contract value in R’000
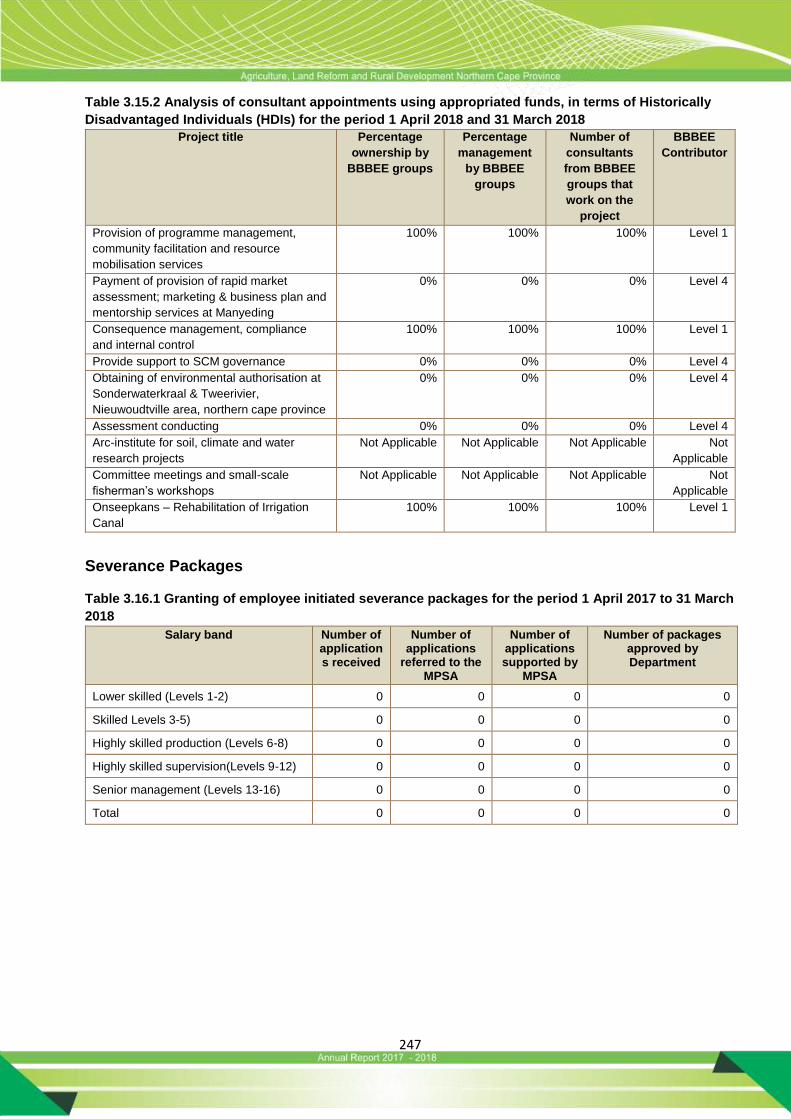
247
Table 3.15.2 Analysis of consultant appointments using appropriated funds, in terms of Historically
Disadvantaged Individuals (HDIs) for the period 1 April 2018 and 31 March 2018
Project title Percentage
ownership by
BBBEE groups
Percentage
management
by BBBEE
groups
Number of
consultants
from BBBEE
groups that
work on the
project
BBBEE
Contributor
Provision of programme management,
community facilitation and resource
mobilisation services
100% 100% 100% Level 1
Payment of provision of rapid market
assessment; marketing & business plan and
mentorship services at Manyeding
0% 0% 0% Level 4
Consequence management, compliance
and internal control
100% 100% 100% Level 1
Provide support to SCM governance 0% 0% 0% Level 4
Obtaining of environmental authorisation at
Sonderwaterkraal & Tweerivier,
Nieuwoudtville area, northern cape province
0% 0% 0% Level 4
Assessment conducting 0% 0% 0% Level 4
Arc-institute for soil, climate and water
research projects
Not Applicable Not Applicable Not Applicable Not
Applicable
Committee meetings and small-scale
fisherman’s workshops
Not Applicable Not Applicable Not Applicable Not
Applicable
Onseepkans – Rehabilitation of Irrigation
Canal
100% 100% 100% Level 1
Severance Packages
Table 3.16.1 Granting of employee initiated severance packages for the period 1 April 2017 to 31 March
2018
Salary band Number of applications received
Number of applications
referred to the MPSA
Number of applications supported by
MPSA
Number of packages approved by Department
Lower skilled (Levels 1-2) 0 0 0 0
Skilled Levels 3-5) 0 0 0 0
Highly skilled production (Levels 6-8) 0 0 0 0
Highly skilled supervision(Levels 9-12) 0 0 0 0
Senior management (Levels 13-16) 0 0 0 0
Total 0 0 0 0
248
249
1. REPORT OF THE AUDITOR-GENERAL
Report on the financial statement
Qualified opinion
1. I have audited the financial statements of the Department of Agriculture, Land Reform and Rural
Development set out on pages 256 to 327, which comprise the appropriation statement, the
statement of financial position as at 31 March 2018, the statement of financial performance,
statement of changes in net assets and cash flow statement for the year then ended, as well as
the notes to the financial statements, including a summary of significant accounting policies.
2. In my opinion, except for the possible effects of the matters described in the basis for qualified
opinion section of this auditor’s report, the financial statements present fairly, in all material
respects, the financial position of the Department of Agriculture, Land Reform and Rural
Development as at 31 March 2018, and its financial performance and cash flows for the year then
ended in accordance with the Modified Cash Standard (MCS) prescribed by the National
Treasury, and the requirements of the Public Finance Management Act of South Africa, 1999 (Act
No. 1 of 1999) (PFMA) and the Division of Revenue Act of South Africa, 2017 (Act No. 3 of 2017)
(DoRA).
Basis for qualified opinion
Immovable tangible capital assets
3. The Department did not recognise all items of immovable capital assets in accordance with
chapter 11, Capital assets of the MCS. Completed project assets in the capital work in progress
disclosed in note 29.4 were not capitalised by the Department and included in the immovable
asset register as non-cash additions. Consequently, immovable assets disclosed in note 29 is
understated by R157 855 000.
4. The Department did not include all disclosures in the financial statements as required by chapter
11, Capital assets of the MCS. The age analysis of the capital work in progress in note 29.4 was
not included in the notes to the financial statements. Consequently, the Department did not comply
with the presentation and disclosure requirements for capital work in progress.
Movable tangible capital assets
5. The Department did not recognise all items of movable capital assets in accordance with chapter 11, Capital assets of the MCS. The opening balance of R15 856 000 for minor machinery and equipment according to the corresponding figure in note 27.4 was incorrectly reported. The amount disclosed did not agree with the amount of R2 408 000 in the previous year’s published annual financial statements. Consequently, the closing balance of minor machinery and equipment is overstated by R13 448 000 (2017: R13 448 000).
250
6. The Department did not classify all items of movable capital assets in accordance with chapter
11, Capital assets of the MCS. The Department included major machinery and equipment assets
valued at R7 066 612 in the minor machinery and equipment asset register and minor machinery
and equipment assets in the major asset register to the value of R129 931. Consequently, minor
machinery and equipment in note 27.4 is overstated by R7 066 612 and major machinery and
equipment in Note.27 is overstated by R129 931.
Context for the opinion
7. I conducted my audit in accordance with the International Standards on Auditing (ISAs). My
responsibilities under those standards are further described in the auditor-general’s
responsibilities for the audit of the financial statements section of this auditor’s report.
8. I am independent of the Department in accordance with the International Ethics Standards Board
for Accountants’ Code of ethics for professional accountants (IESBA code) and the ethical
requirements that are relevant to my audit in South Africa. I have fulfilled my other ethical
responsibilities in accordance with these requirements and the IESBA code.
9. I believe that the audit evidence I have obtained is sufficient and appropriate to provide a basis
for my qualified opinion.
Emphasis of matters
10. I draw attention to the matters below. My opinion is not modified in respect of these matters.
Movable tangible capital assets under investigation
11. As disclosed in note 27 and note 27.7 to the financial statements, the Department disclosed
movable tangible capital assets under investigation to the sum of R16 564 000. The disclosure
was according to the requirements of the MCS.
Restatement of corresponding figures
12. As disclosed in note 31 to the financial statements, the corresponding figures for 31 March 2017
were restated as a result of an error in the financial statements of the Department at, and for the
year ended, 31 March 2018.
Underspending of the budget
13. As disclosed in the appropriation statement, the Department materially underspent the budget by
R16 565 000 on programme 3 – farmer support and development relating to the comprehensive
agriculture support programme (CASP) conditional grant.
Other matter
14. I draw attention to the matter below. My opinion is not modified in respect of this matter.
251
Unaudited supplementary schedules
15. The supplementary information set out on pages 328 to 338 does not form part of the financial
statements and is presented as additional information. I have not audited these schedules and,
accordingly, I do not express an opinion thereon.
Responsibilities of the accounting officer for the financial statements
16. The accounting officer is responsible for the preparation and fair presentation of the financial
statements in accordance with the MCS prescribed by the National Treasury and the requirements
of the PFMA and Dora, and for such internal control as the accounting officer determines is
necessary to enable the preparation of financial statements that are free from material
misstatement, whether due to fraud or error.
17. In preparing the financial statements, the accounting officer is responsible for assessing the
Department’s ability to continue as a going concern, disclosing, as applicable, matters relating to
going concern and using the going concern basis of accounting unless the accounting officer
either intends to liquidate the Department or to cease operations, or has no realistic alternative
but to do so.
Auditor-general’s responsibilities for the audit of the financial statements
18. My objectives are to obtain reasonable assurance about whether the financial statements as a
whole are free from material misstatement, whether due to fraud or error, and to issue an auditor’s
report that includes my opinion. Reasonable assurance is a high level of assurance, but is not a
guarantee that an audit conducted in accordance with the ISAs will always detect a material
misstatement when it exists. Misstatements can arise from fraud or error and are considered
material if, individually or in aggregate, they could reasonably be expected to influence the
economic decisions of users taken on the basis of these financial statements.
19. A further description of my responsibilities for the audit of the financial statements is included in
the annexure to this auditor’s report.
Report on the audit of the annual performance report
Introduction and scope
20. In accordance with the Public Audit Act of South Africa, 2004 (Act No. 25 of 2004) (PAA) and the
general notice issued in terms thereof, I have a responsibility to report material findings on the
reported performance information against predetermined objectives for selected programmes
presented in the annual performance report. I performed procedures to identify findings but not to
gather evidence to express assurance.
21. My procedures address the reported performance information, which must be based on the approved performance planning documents of the Department. I have not evaluated the completeness and appropriateness of the performance indicators included in the planning documents. My procedures also did not extend to any disclosures or assertions relating to planned performance strategies and information in respect of future periods that may be included as part of the reported performance information. Accordingly, my findings do not extend to these matters.
252
I evaluated the usefulness and reliability of the reported performance information in accordance with the criteria developed from the performance management and reporting framework, as defined in the general notice, for the following selected programmes presented in the annual performance report of the Department for the year ended 31 March 2018:
Programmes Pages in the annual
performance report
Programme 2 – Sustainable Resource Management 63-83
Programme 3 – Farmer Support and Development 85-121
Programme 4 – Veterinary Services 123-150
22. I performed procedures to determine whether the reported performance information was properly
presented and whether performance was consistent with the approved performance planning
documents. I performed further procedures to determine whether the indicators and related
targets were measurable and relevant, and assessed the reliability of the reported performance
information to determine whether it was valid, accurate and complete.
23. I did not raise any material findings on the usefulness and reliability of the reported performance
information for the following programmes:
Programme 2 – Sustainable Resource Management
Programme 3 – Farmer Support and Development
Programme 4 – Veterinary Services
Other matter
24. I draw attention to the matter below.
Achievement of planned targets
25. Refer to the annual performance report on pages 49 to 206 for information on the achievement of
planned targets for the year and explanations provided for the over achievement of a significant
number of targets.
Report on the audit of compliance with legislation
Introduction and scope
26. In accordance with the PAA and the general notice issued in terms thereof, I have a responsibility
to report material findings on the compliance of the Department with specific matters in key
legislation. I performed procedures to identify findings but not to gather evidence to express
assurance.
27. The material findings on compliance with specific matters in key legislations are as follows:
253
Annual financial statements, performance reports and annual reports
28. The financial statements submitted for auditing were not prepared in accordance with the prescribed financial reporting framework and/or supported by full and proper records, as required by section 40(1) (a) of the PFMA.
29. Material misstatements (of related party transactions, tangible capital assets – machinery and equipment, prior period error note – movable tangible capital assets, immovable tangible capital assets and inventory) identified by the auditors in the submitted financial statements were corrected and the supporting records were provided subsequently, but the uncorrected material misstatements and supporting records that could not be provided resulted in the financial statements receiving a qualified opinion.
Expenditure management
30. Effective steps were not taken to prevent irregular expenditure of R12 875 000 disclosed in note 23 to the annual financial statements, as required by section 38(1)(c)(ii) of the PFMA and treasury regulation 9.1.1.
31. Effective steps were not taken to prevent fruitless and wasteful expenditure of R214 000 disclosed in note 24 to the annual financial statements, as required by section 38(1)(c)(ii) of the PFMA and treasury regulation 9.1.1.
32. Payments were not made within 30 days or an agreed period after receipt of an invoice, as required by treasury regulation 8.2.3.
Procurement and contract management
33. Some quotations were awarded to suppliers whose tax matters had not been declared by the South African Revenue Services to be in order, as required by treasury regulations 16A9.1(d). Similar non-compliance was also reported in the previous year.
Other information
34. The accounting officer is responsible for the other information. The other information comprises the information included in the annual report. The other information does not include the financial statements, the auditor’s report and those selected programmes presented in the annual performance report that have been specifically reported in this auditor’s report.
35. My opinion on the financial statements and findings on the reported performance information and compliance with legislation do not cover the other information and I do not express an audit opinion or any form of assurance conclusion thereon.
36. In connection with my audit, my responsibility is to read the other information and, in doing so, consider whether the other information is materially inconsistent with the financial statements and the selected programmes presented in the annual performance report, or my knowledge obtained in the audit, or otherwise appears to be materially misstated.
37. I did not receive the other information prior to the date of this auditor’s report. After I receive and read this information, and if I conclude that there is a material misstatement, I am required to communicate the matter to those charged with governance and request that the other information be corrected. If the other information is not corrected, I may have to retract this
254
auditor’s report and re-issue an amended report as appropriate. However, if it is corrected this will not be necessary.
Internal control deficiencies
38. I considered internal control relevant to my audit of the financial statements, reported performance information and compliance with applicable legislation; however, my objective was not to express any form of assurance on it. The matters reported below are limited to the significant internal control deficiencies that resulted in the basis for the qualified opinion, the findings on compliance with legislation included in this report.
Leadership did not take appropriate action to facilitate the continuous monitoring of internal controls in the finance and SCM directorates. This resulted in misstatements in related party transactions, movable tangible capital assets (machinery and equipment), prior period error note, immovable tangible capital assets, inventory and irregular expenditure.
Leadership did not oversee the regular monitoring of compliance with PFMA and SCM laws and regulations.
Leadership did not take appropriate action to resolve the control deficiencies identified in the current and previous year’s audits, resulting in numerous material misstatements being identified and corrected during the audit process.
The Department did not implement proper record keeping to ensure that complete, relevant and accurate information is accessible and available to support financial reporting.
The Department did not ensure ongoing monitoring and supervision to enable an assessment of the effectiveness of internal control over compliance with laws and regulations.
The Department developed a plan to address the audit findings relating to the previous year. The appropriate level of management did not monitor adherence to the plan, resulting in the recurrence of some of the non-compliance issues and material misstatements corrected in the annual financial statements
Kimberley
31 July 2018
255
Annexure – Auditor-general’s responsibility for the audit
1. As part of an audit in accordance with the ISAs, I exercise professional judgement and maintain
professional scepticism throughout my audit of the financial statements, and the procedures
performed on reported performance information for selected programmes and on the
Department’s compliance with respect to the selected subject matters.
Financial statements
2. In addition to my responsibility for the audit of the financial statements as described in this auditor’s
report, I also:
identify and assess the risks of material misstatement of the financial statements whether due
to fraud or error, design and perform audit procedures responsive to those risks, and obtain
audit evidence that is sufficient and appropriate to provide a basis for my opinion. The risk of
not detecting a material misstatement resulting from fraud is higher than for one resulting from
error, as fraud may involve collusion, forgery, intentional omissions, misrepresentations, or the
override of internal control
obtain an understanding of internal control relevant to the audit in order to design audit
procedures that are appropriate in the circumstances, but not for the purpose of expressing an
opinion on the effectiveness of the Department’s internal control
evaluate the appropriateness of accounting policies used and the reasonableness of
accounting estimates and related disclosures made by the accounting officer
conclude on the appropriateness of the accounting officer’s use of the going concern basis of
accounting in the preparation of the financial statements. I also conclude, based on the audit
evidence obtained, whether a material uncertainty exists related to events or conditions that
may cast significant doubt on the Department of Agriculture, Land Reform and Rural
Development’s ability to continue as a going concern. If I conclude that a material uncertainty
exists, I am required to draw attention in my auditor’s report to the related disclosures in the
financial statements about the material uncertainty or, if such disclosures are inadequate, to
modify the opinion on the financial statements. My conclusions are based on the information
available to me at the date of this auditor’s report. However, future events or conditions may
cause a department to cease continuing as a going concern
evaluate the overall presentation, structure and content of the financial statements, including
the disclosures, and whether the financial statements represent the underlying transactions
and events in a manner that achieves fair presentation
Communication with those charged with governance
3. I communicate with the accounting officer regarding, among other matters, the planned scope and
timing of the audit and significant audit findings, including any significant deficiencies in internal
control that I identify during my audit.
4. I also confirm to the accounting officer that I have complied with relevant ethical requirements
regarding independence, and communicate all relationships and other matters that may
reasonably be thought to have a bearing on my independence and, where applicable, related
safeguards.
256
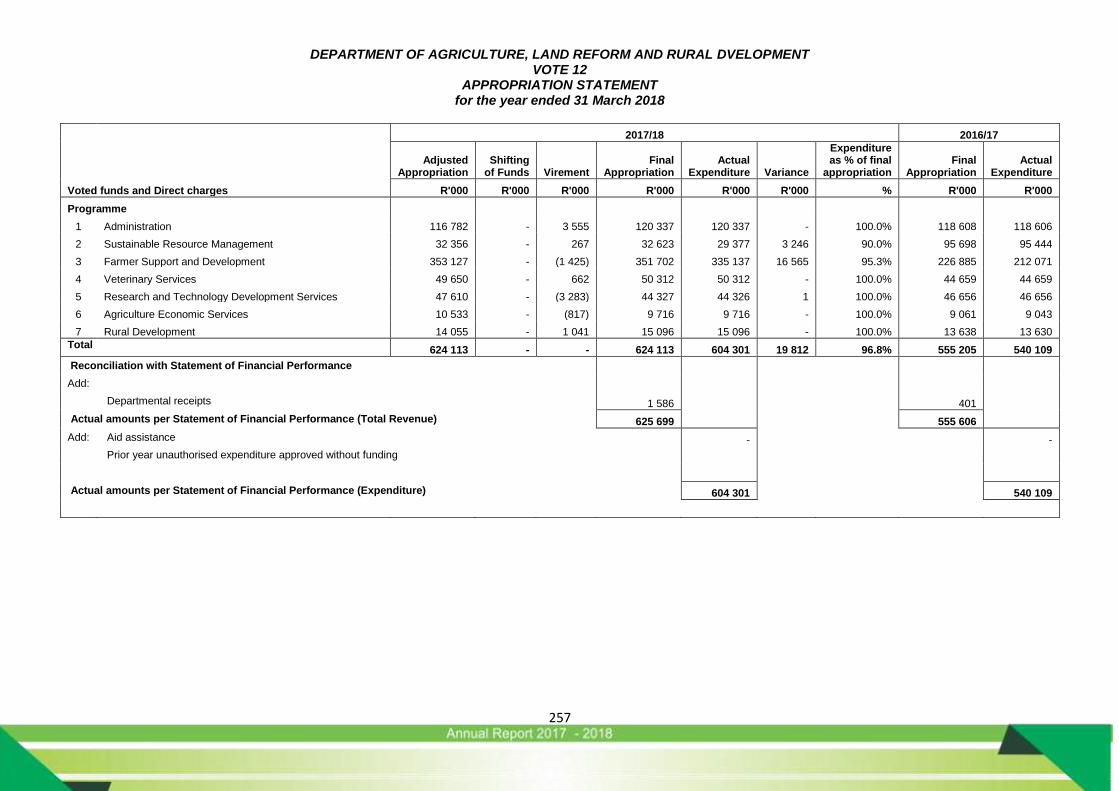
DEPARTMENT OF AGRICULTURE, LAND REFORM AND RURAL DVELOPMENT VOTE 12
APPROPRIATION STATEMENT for the year ended 31 March 2018
257
2017/18 2016/17
Voted funds and Direct charges
Adjusted Appropriation
Shifting of Funds
Virement
Final Appropriation
Actual Expenditure
Variance
Expenditure as % of final
appropriation Final
Appropriation Actual
Expenditure
R'000 R'000 R'000 R'000 R'000 R'000 % R'000 R'000
Programme
1 Administration 116 782 - 3 555 120 337 120 337 - 100.0% 118 608 118 606
2 Sustainable Resource Management 32 356 - 267 32 623 29 377 3 246 90.0% 95 698 95 444
3 Farmer Support and Development 353 127 - (1 425) 351 702 335 137 16 565 95.3% 226 885 212 071
4 Veterinary Services 49 650 - 662 50 312 50 312 - 100.0% 44 659 44 659
5 Research and Technology Development Services 47 610 - (3 283) 44 327 44 326 1 100.0% 46 656 46 656
6 Agriculture Economic Services 10 533 - (817) 9 716 9 716 - 100.0% 9 061 9 043
7 Rural Development 14 055 - 1 041 15 096 15 096 - 100.0% 13 638 13 630
Total 624 113 - - 624 113 604 301 19 812 96.8% 555 205 540 109
Reconciliation with Statement of Financial Performance
Add:
Departmental receipts 1 586 401
Actual amounts per Statement of Financial Performance (Total Revenue) 625 699 555 606
Add: Aid assistance - -
Prior year unauthorised expenditure approved without funding
Actual amounts per Statement of Financial Performance (Expenditure) 604 301 540 109
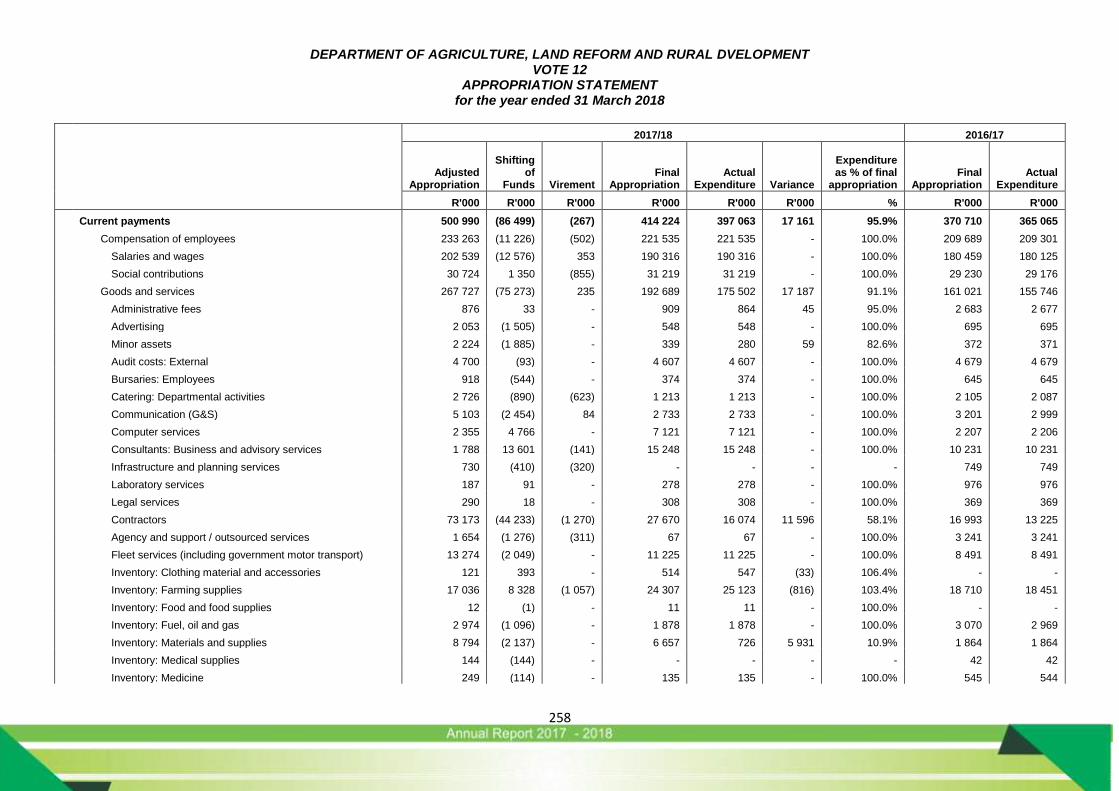
DEPARTMENT OF AGRICULTURE, LAND REFORM AND RURAL DVELOPMENT VOTE 12
APPROPRIATION STATEMENT for the year ended 31 March 2018
258
2017/18 2016/17
Adjusted Appropriation
Shifting
of Funds
Virement
Final Appropriation
Actual Expenditure
Variance
Expenditure as % of final
appropriation Final
Appropriation Actual
Expenditure
R'000 R'000 R'000 R'000 R'000 R'000 % R'000 R'000
Current payments 500 990 (86 499) (267) 414 224 397 063 17 161 95.9% 370 710 365 065
Compensation of employees 233 263 (11 226) (502) 221 535 221 535 - 100.0% 209 689 209 301
Salaries and wages 202 539 (12 576) 353 190 316 190 316 - 100.0% 180 459 180 125
Social contributions 30 724 1 350 (855) 31 219 31 219 - 100.0% 29 230 29 176
Goods and services 267 727 (75 273) 235 192 689 175 502 17 187 91.1% 161 021 155 746
Administrative fees 876 33 - 909 864 45 95.0% 2 683 2 677
Advertising 2 053 (1 505) - 548 548 - 100.0% 695 695
Minor assets 2 224 (1 885) - 339 280 59 82.6% 372 371
Audit costs: External 4 700 (93) - 4 607 4 607 - 100.0% 4 679 4 679
Bursaries: Employees 918 (544) - 374 374 - 100.0% 645 645
Catering: Departmental activities 2 726 (890) (623) 1 213 1 213 - 100.0% 2 105 2 087
Communication (G&S) 5 103 (2 454) 84 2 733 2 733 - 100.0% 3 201 2 999
Computer services 2 355 4 766 - 7 121 7 121 - 100.0% 2 207 2 206
Consultants: Business and advisory services 1 788 13 601 (141) 15 248 15 248 - 100.0% 10 231 10 231
Infrastructure and planning services 730 (410) (320) - - - - 749 749
Laboratory services 187 91 - 278 278 - 100.0% 976 976
Legal services 290 18 - 308 308 - 100.0% 369 369
Contractors 73 173 (44 233) (1 270) 27 670 16 074 11 596 58.1% 16 993 13 225
Agency and support / outsourced services 1 654 (1 276) (311) 67 67 - 100.0% 3 241 3 241
Fleet services (including government motor transport) 13 274 (2 049) - 11 225 11 225 - 100.0% 8 491 8 491
Inventory: Clothing material and accessories 121 393 - 514 547 (33) 106.4% - -
Inventory: Farming supplies 17 036 8 328 (1 057) 24 307 25 123 (816) 103.4% 18 710 18 451
Inventory: Food and food supplies 12 (1) - 11 11 - 100.0% - -
Inventory: Fuel, oil and gas 2 974 (1 096) - 1 878 1 878 - 100.0% 3 070 2 969
Inventory: Materials and supplies 8 794 (2 137) - 6 657 726 5 931 10.9% 1 864 1 864
Inventory: Medical supplies 144 (144) - - - - - 42 42
Inventory: Medicine 249 (114) - 135 135 - 100.0% 545 544

DEPARTMENT OF AGRICULTURE, LAND REFORM AND RURAL DVELOPMENT VOTE 12
APPROPRIATION STATEMENT for the year ended 31 March 2018
259
2017/18 2016/17
Adjusted Appropriation
Shifting
of Funds
Virement
Final Appropriation
Actual Expenditure
Variance
Expenditure as % of final
appropriation Final
Appropriation Actual
Expenditure
R'000 R'000 R'000 R'000 R'000 R'000 % R'000 R'000
Inventory: Other supplies 52 889 (29 845) - 23 044 23 041 3 100.0% 10 575 10 585
Consumable supplies 14 864 (11 340) - 3 524 3 437 87 97.5% 4 030 3 833
Consumable: Stationery, printing and office supplies 2 493 (980) - 1 513 1 475 38 97.5% 1 313 1 313
Operating leases 11 023 (2 028) - 8 995 8 995 - 100.0% 10 912 10 545
Property payments 10 455 878 1 763 13 096 13 255 (159) 101.2% 11 391 11 074
Transport provided: Departmental activity 253 (253) - - - - - - -
Travel and subsistence 29 467 118 1 969 31 554 31 407 147 99.5% 33 637 33 615
Training and development 2 082 (288) - 1 794 1 693 101 94.4% 1 363 1 363
Operating payments 1 509 (131) 141 1 519 1 518 1 99.9% 1 830 1 815
Venues and facilities 1 310 61 - 1 371 1 184 187 86.4% 3 656 3 646
Rental and hiring 1 136 - 137 137 - 100.0% 446 446
Interest and rent on land - - - - 1 (1) - - 18
Interest (Incl. interest on unitary payments (PPP)) - - - - 1 (1) - - 18
Transfers and subsidies 19 993 1 244 - 21 237 21 262 (25) 100.0% 5 964 5 964
Provinces and municipalities - 43 - 43 43 - 100.0% 119 119
Municipalities - 43 - 43 43 - 100.0% 119 119
Municipal bank accounts - 43 - 43 43 - 100.0% 119 119
Departmental agencies and accounts 12 870 (4 500) - 8 370 8 370 - 100.0% 2 550 2 550
Departmental agencies (non-business entities) 12 870 (4 500) - 8 370 8 370 - 100.0% 2 550 2 550
Public corporations and private enterprises 5 000 4 600 - 9 600 9 600 - 100.0% - -
Private enterprises 5 000 4 600 - 9 600 9 600 - 100.0% - -
Other transfers to private enterprises 5 000 4 600 - 9 600 9 600 - 100.0% - -
Households 2 123 1 101 - 3 224 3 249 (25) 100.8% 3 295 3 295
Social benefits 107 322 - 429 429 - 100.0% 598 598
Other transfers to households 2 016 779 - 2 795 2 820 (25) 100.9% 2 697 2 697
Payments for capital assets 103 130 85 255 267 188 652 185 882 2 770 98.5% 178 531 169 080
Buildings and other fixed structures 86 582 81 616 - 168 198 168 180 18 100.0% 162 596 153 862

DEPARTMENT OF AGRICULTURE, LAND REFORM AND RURAL DVELOPMENT VOTE 12
APPROPRIATION STATEMENT for the year ended 31 March 2018
260
2017/18 2016/17
Adjusted Appropriation
Shifting
of Funds
Virement
Final Appropriation
Actual Expenditure
Variance
Expenditure as % of final
appropriation Final
Appropriation Actual
Expenditure
R'000 R'000 R'000 R'000 R'000 R'000 % R'000 R'000
Buildings 1 021 1 480 - 2 501 2 501 - 100.0% - -
Other fixed structures 85 561 80 136 - 165 697 165 679 18 100.0% 162 596 153 862
Machinery and equipment 16 486 24 281 16 791 14 039 2 752 83.6% 12 399 11 682
Transport equipment 4 126 2 983 109 7 218 7 218 - 100.0% 5 910 5 910
Other machinery and equipment 12 360 (2 959) 172 9 573 6 821 2 752 71.3% 6 489 5 772
Biological assets - 730 - 730 730 - 100.0% 990 990
Software and other intangible assets 62 2 885 (14) 2 933 2 933 - 100.0% 2 546 2 546
Payment for financial assets - - - - 119 (119) - - -
Total 624 113 - - 624 113 604 301 19 812 96.8% 555 205 540 109
The comparative figure for finance leases of vehicles and machinery and equipment has been restated due to a classification error from current to capital in
the prior year.
DEPARTMENT OF AGRICULTURE, LAND REFORM AND RURAL DVELOPMENT VOTE 12
APPROPRIATION STATEMENT for the year ended 31 March 2018
261
Programme 1: Administration
2017/18 2016/17
Adjusted
Appropriation Shifting of Funds
Virement
Final Appropriation
Actual Expenditure
Variance
Expenditure as % of final
appropriation Final
Appropriation Actual
Expenditure
R'000 R'000 R'000 R'000 R'000 R'000 % R'000 R'000
Sub programme
1 OFFICE OF THE MEC 10 506 1 645 692 12 843 12 843 - 100.0% 12 680 12 680
2 SENIOR MANAGEMENT 22 579 (913) - 21 666 21 666 - 100.0% 22 454 22 452
3 CORPORATE SERVICES 45 280 - 2 040 47 320 47 320 - 100.0% 45 658 45 658
4 FINANCIAL MANAGEMENT 27 293 298 823 28 414 28 414 - 100.0% 27 908 27 908
5 COMMUNICATION SERVICES 11 124 (1 030) - 10 094 10 094 - 100.0% 9 908 9 908
116 782 - 3 555 120 337 120 337 - 100.0% 118 608 118 606
Economic classification
Current payments 112 950 (1 098) 3 375 115 227 115 101 126 99.9% 112 713 112 713
Compensation of employees 74 351 (1 866) - 72 485 72 485 - 100.0% 68 635 68 635
Salaries and wages 64 831 (2 297) - 62 534 62 534 - 100.0% 59 331 59 331
Social contributions 9 520 431 - 9 951 9 951 - 100.0% 9 304 9 304
Goods and services 38 599 768 3 375 42 742 42 615 127 99.7% 44 078 44 066
Administrative fees 23 2 - 25 48 (23) 192.0% 55 55
Advertising 238 (115) - 123 123 - 100.0% 178 178
Minor assets 70 13 - 83 83 - 100.0% 121 121
Audit costs: External 3 915 72 - 3 987 3 987 - 100.0% 4 115 4 115
Bursaries: Employees 250 98 - 348 348 - 100.0% 370 370
Catering: Departmental activities 379 (82) - 297 297 - 100.0% 514 514
Communication (G&S) 1 933 (718) 97 1 312 1 312 - 100.0% 1 557 1 557
Computer services 2 057 (90) - 1 967 1 967 - 100.0% 1 469 1 469
Consultants: Business and advisory services 134 1 739 - 1 873 1 873 - 100.0% 580 580
Legal services 290 18 - 308 308 - 100.0% 350 350
Contractors 156 179 67 402 270 132 67.2% 204 204
Agency and support / outsourced services 523 (523) - - - - - 3 216 3 216
Fleet services (including government motor transport) 1 682 (505) - 1 177 1 177 - 100.0% 714 714
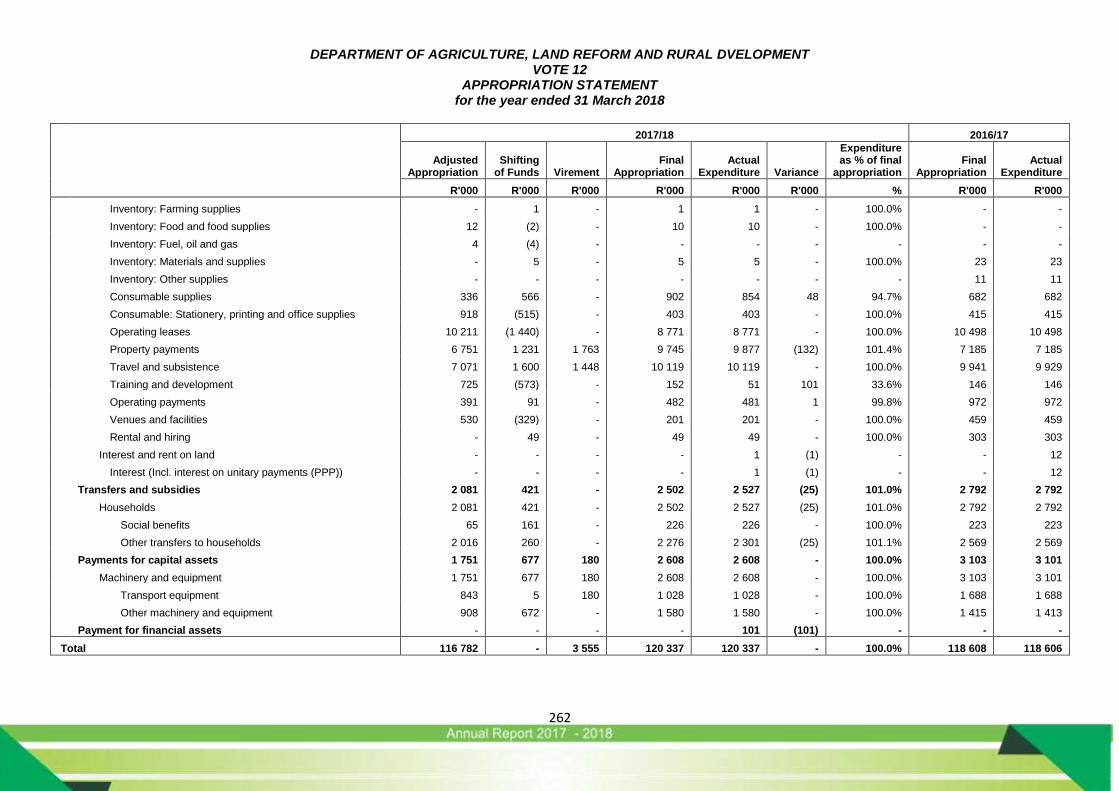
DEPARTMENT OF AGRICULTURE, LAND REFORM AND RURAL DVELOPMENT VOTE 12
APPROPRIATION STATEMENT for the year ended 31 March 2018
262
2017/18 2016/17
Adjusted
Appropriation Shifting of Funds
Virement
Final Appropriation
Actual Expenditure
Variance
Expenditure as % of final
appropriation Final
Appropriation Actual
Expenditure
R'000 R'000 R'000 R'000 R'000 R'000 % R'000 R'000
Inventory: Farming supplies - 1 - 1 1 - 100.0% - -
Inventory: Food and food supplies 12 (2) - 10 10 - 100.0% - -
Inventory: Fuel, oil and gas 4 (4) - - - - - - -
Inventory: Materials and supplies - 5 - 5 5 - 100.0% 23 23
Inventory: Other supplies - - - - - - - 11 11
Consumable supplies 336 566 - 902 854 48 94.7% 682 682
Consumable: Stationery, printing and office supplies 918 (515) - 403 403 - 100.0% 415 415
Operating leases 10 211 (1 440) - 8 771 8 771 - 100.0% 10 498 10 498
Property payments 6 751 1 231 1 763 9 745 9 877 (132) 101.4% 7 185 7 185
Travel and subsistence 7 071 1 600 1 448 10 119 10 119 - 100.0% 9 941 9 929
Training and development 725 (573) - 152 51 101 33.6% 146 146
Operating payments 391 91 - 482 481 1 99.8% 972 972
Venues and facilities 530 (329) - 201 201 - 100.0% 459 459
Rental and hiring - 49 - 49 49 - 100.0% 303 303
Interest and rent on land - - - - 1 (1) - - 12
Interest (Incl. interest on unitary payments (PPP)) - - - - 1 (1) - - 12
Transfers and subsidies 2 081 421 - 2 502 2 527 (25) 101.0% 2 792 2 792
Households 2 081 421 - 2 502 2 527 (25) 101.0% 2 792 2 792
Social benefits 65 161 - 226 226 - 100.0% 223 223
Other transfers to households 2 016 260 - 2 276 2 301 (25) 101.1% 2 569 2 569
Payments for capital assets 1 751 677 180 2 608 2 608 - 100.0% 3 103 3 101
Machinery and equipment 1 751 677 180 2 608 2 608 - 100.0% 3 103 3 101
Transport equipment 843 5 180 1 028 1 028 - 100.0% 1 688 1 688
Other machinery and equipment 908 672 - 1 580 1 580 - 100.0% 1 415 1 413
Payment for financial assets - - - - 101 (101) - - -
Total 116 782 - 3 555 120 337 120 337 - 100.0% 118 608 118 606
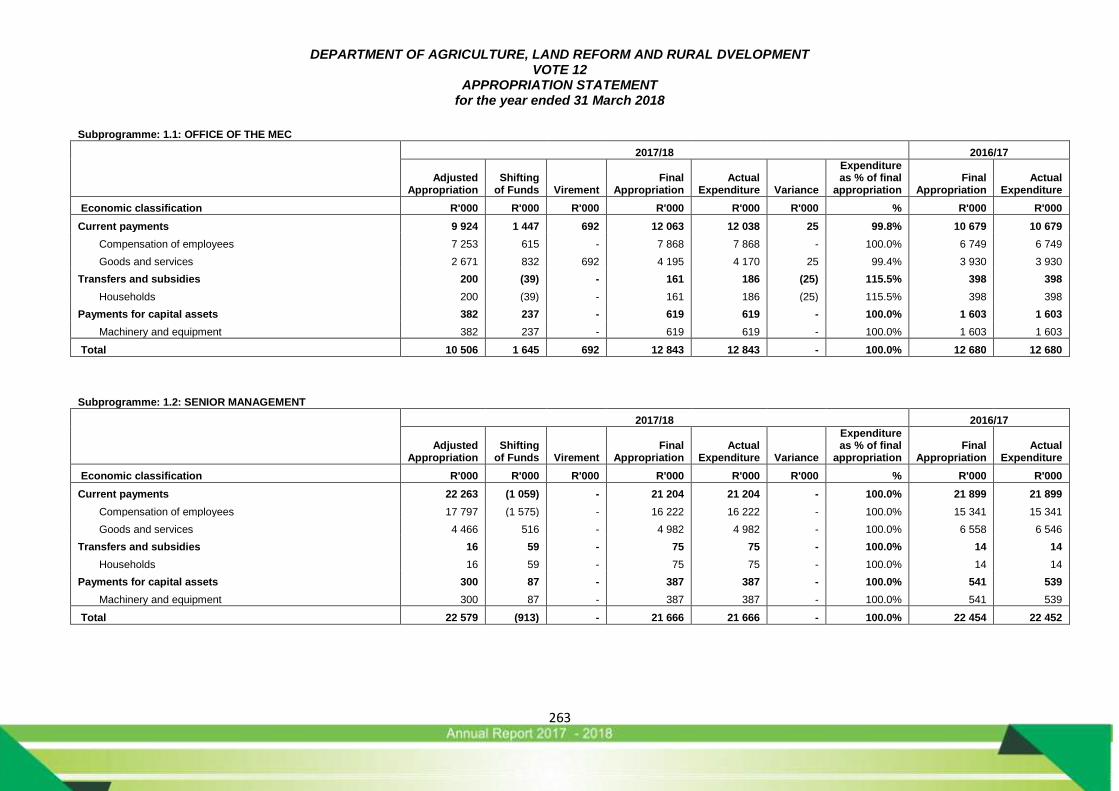
DEPARTMENT OF AGRICULTURE, LAND REFORM AND RURAL DVELOPMENT VOTE 12
APPROPRIATION STATEMENT for the year ended 31 March 2018
263
Subprogramme: 1.1: OFFICE OF THE MEC
2017/18 2016/17
Adjusted
Appropriation Shifting of Funds
Virement
Final Appropriation
Actual Expenditure
Variance
Expenditure as % of final
appropriation Final
Appropriation Actual
Expenditure
Economic classification R'000 R'000 R'000 R'000 R'000 R'000 % R'000 R'000
Current payments 9 924 1 447 692 12 063 12 038 25 99.8% 10 679 10 679
Compensation of employees 7 253 615 - 7 868 7 868 - 100.0% 6 749 6 749
Goods and services 2 671 832 692 4 195 4 170 25 99.4% 3 930 3 930
Transfers and subsidies 200 (39) - 161 186 (25) 115.5% 398 398
Households 200 (39) - 161 186 (25) 115.5% 398 398
Payments for capital assets 382 237 - 619 619 - 100.0% 1 603 1 603
Machinery and equipment 382 237 - 619 619 - 100.0% 1 603 1 603
Total 10 506 1 645 692 12 843 12 843 - 100.0% 12 680 12 680
Subprogramme: 1.2: SENIOR MANAGEMENT
2017/18 2016/17
Adjusted
Appropriation Shifting of Funds
Virement
Final Appropriation
Actual Expenditure
Variance
Expenditure as % of final
appropriation Final
Appropriation Actual
Expenditure
Economic classification R'000 R'000 R'000 R'000 R'000 R'000 % R'000 R'000
Current payments 22 263 (1 059) - 21 204 21 204 - 100.0% 21 899 21 899
Compensation of employees 17 797 (1 575) - 16 222 16 222 - 100.0% 15 341 15 341
Goods and services 4 466 516 - 4 982 4 982 - 100.0% 6 558 6 546
Transfers and subsidies 16 59 - 75 75 - 100.0% 14 14
Households 16 59 - 75 75 - 100.0% 14 14
Payments for capital assets 300 87 - 387 387 - 100.0% 541 539
Machinery and equipment 300 87 - 387 387 - 100.0% 541 539
Total 22 579 (913) - 21 666 21 666 - 100.0% 22 454 22 452
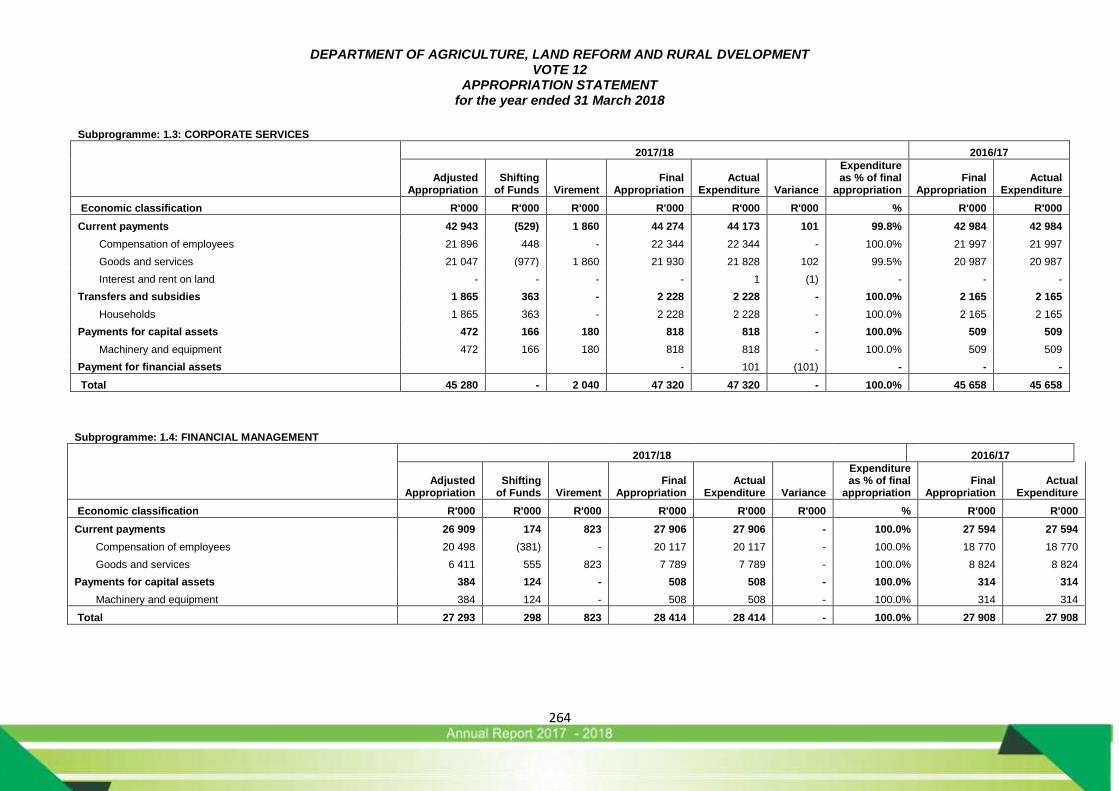
DEPARTMENT OF AGRICULTURE, LAND REFORM AND RURAL DVELOPMENT VOTE 12
APPROPRIATION STATEMENT for the year ended 31 March 2018
264
Subprogramme: 1.3: CORPORATE SERVICES
2017/18 2016/17
Adjusted
Appropriation Shifting of Funds
Virement
Final Appropriation
Actual Expenditure
Variance
Expenditure as % of final
appropriation Final
Appropriation Actual
Expenditure
Economic classification R'000 R'000 R'000 R'000 R'000 R'000 % R'000 R'000
Current payments 42 943 (529) 1 860 44 274 44 173 101 99.8% 42 984 42 984
Compensation of employees 21 896 448 - 22 344 22 344 - 100.0% 21 997 21 997
Goods and services 21 047 (977) 1 860 21 930 21 828 102 99.5% 20 987 20 987
Interest and rent on land - - - - 1 (1) - - -
Transfers and subsidies 1 865 363 - 2 228 2 228 - 100.0% 2 165 2 165
Households 1 865 363 - 2 228 2 228 - 100.0% 2 165 2 165
Payments for capital assets 472 166 180 818 818 - 100.0% 509 509
Machinery and equipment 472 166 180 818 818 - 100.0% 509 509
Payment for financial assets - 101 (101) - - -
Total 45 280 - 2 040 47 320 47 320 - 100.0% 45 658 45 658
Subprogramme: 1.4: FINANCIAL MANAGEMENT
2017/18 2016/17
Adjusted
Appropriation Shifting of Funds
Virement
Final Appropriation
Actual Expenditure
Variance
Expenditure as % of final
appropriation Final
Appropriation Actual
Expenditure
Economic classification R'000 R'000 R'000 R'000 R'000 R'000 % R'000 R'000
Current payments 26 909 174 823 27 906 27 906 - 100.0% 27 594 27 594
Compensation of employees 20 498 (381) - 20 117 20 117 - 100.0% 18 770 18 770
Goods and services 6 411 555 823 7 789 7 789 - 100.0% 8 824 8 824
Payments for capital assets 384 124 - 508 508 - 100.0% 314 314
Machinery and equipment 384 124 - 508 508 - 100.0% 314 314
Total 27 293 298 823 28 414 28 414 - 100.0% 27 908 27 908
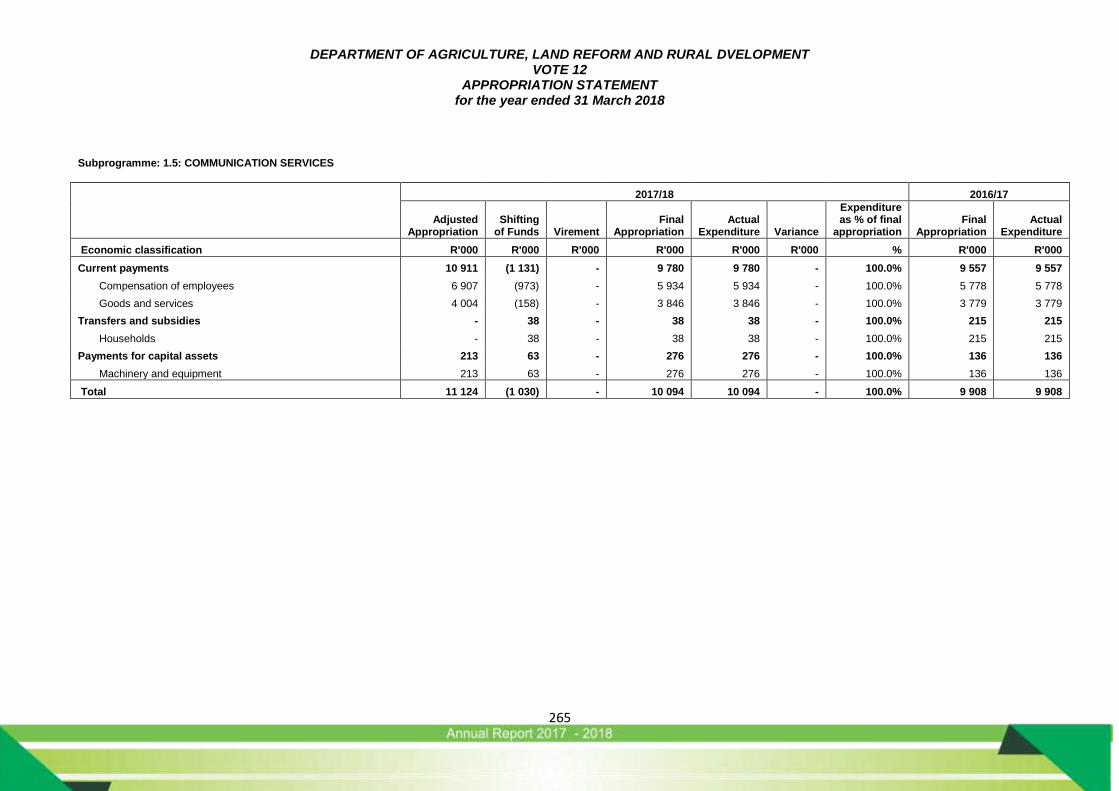
DEPARTMENT OF AGRICULTURE, LAND REFORM AND RURAL DVELOPMENT VOTE 12
APPROPRIATION STATEMENT for the year ended 31 March 2018
265
Subprogramme: 1.5: COMMUNICATION SERVICES
2017/18 2016/17
Adjusted
Appropriation Shifting of Funds
Virement
Final Appropriation
Actual Expenditure
Variance
Expenditure as % of final
appropriation Final
Appropriation Actual
Expenditure
Economic classification R'000 R'000 R'000 R'000 R'000 R'000 % R'000 R'000
Current payments 10 911 (1 131) - 9 780 9 780 - 100.0% 9 557 9 557
Compensation of employees 6 907 (973) - 5 934 5 934 - 100.0% 5 778 5 778
Goods and services 4 004 (158) - 3 846 3 846 - 100.0% 3 779 3 779
Transfers and subsidies - 38 - 38 38 - 100.0% 215 215
Households - 38 - 38 38 - 100.0% 215 215
Payments for capital assets 213 63 - 276 276 - 100.0% 136 136
Machinery and equipment 213 63 - 276 276 - 100.0% 136 136
Total 11 124 (1 030) - 10 094 10 094 - 100.0% 9 908 9 908
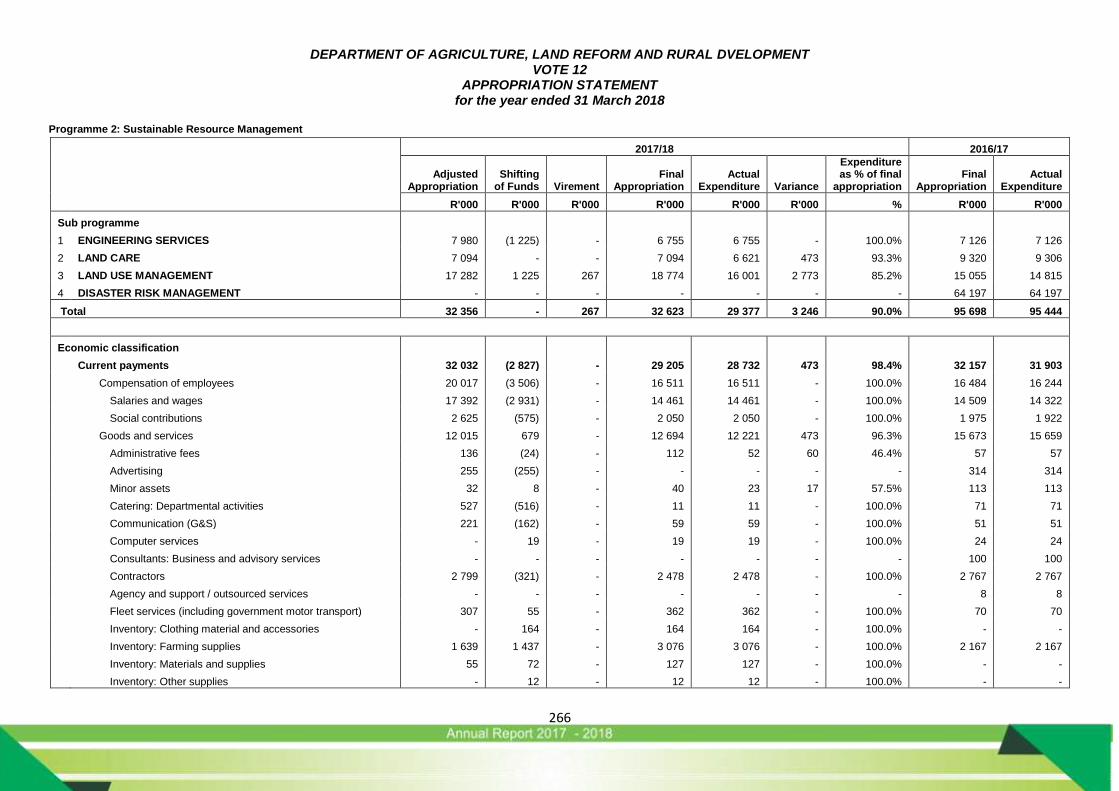
DEPARTMENT OF AGRICULTURE, LAND REFORM AND RURAL DVELOPMENT VOTE 12
APPROPRIATION STATEMENT for the year ended 31 March 2018
266
Programme 2: Sustainable Resource Management
2017/18 2016/17
Adjusted
Appropriation Shifting of Funds
Virement
Final Appropriation
Actual Expenditure
Variance
Expenditure as % of final
appropriation Final
Appropriation Actual
Expenditure
R'000 R'000 R'000 R'000 R'000 R'000 % R'000 R'000
Sub programme
1 ENGINEERING SERVICES 7 980 (1 225) - 6 755 6 755 - 100.0% 7 126 7 126
2 LAND CARE 7 094 - - 7 094 6 621 473 93.3% 9 320 9 306
3 LAND USE MANAGEMENT 17 282 1 225 267 18 774 16 001 2 773 85.2% 15 055 14 815
4 DISASTER RISK MANAGEMENT - - - - - - - 64 197 64 197
Total 32 356 - 267 32 623 29 377 3 246 90.0% 95 698 95 444
Economic classification
Current payments 32 032 (2 827) - 29 205 28 732 473 98.4% 32 157 31 903
Compensation of employees 20 017 (3 506) - 16 511 16 511 - 100.0% 16 484 16 244
Salaries and wages 17 392 (2 931) - 14 461 14 461 - 100.0% 14 509 14 322
Social contributions 2 625 (575) - 2 050 2 050 - 100.0% 1 975 1 922
Goods and services 12 015 679 - 12 694 12 221 473 96.3% 15 673 15 659
Administrative fees 136 (24) - 112 52 60 46.4% 57 57
Advertising 255 (255) - - - - - 314 314
Minor assets 32 8 - 40 23 17 57.5% 113 113
Catering: Departmental activities 527 (516) - 11 11 - 100.0% 71 71
Communication (G&S) 221 (162) - 59 59 - 100.0% 51 51
Computer services - 19 - 19 19 - 100.0% 24 24
Consultants: Business and advisory services - - - - - - - 100 100
Contractors 2 799 (321) - 2 478 2 478 - 100.0% 2 767 2 767
Agency and support / outsourced services - - - - - - - 8 8
Fleet services (including government motor transport) 307 55 - 362 362 - 100.0% 70 70
Inventory: Clothing material and accessories - 164 - 164 164 - 100.0% - -
Inventory: Farming supplies 1 639 1 437 - 3 076 3 076 - 100.0% 2 167 2 167
Inventory: Materials and supplies 55 72 - 127 127 - 100.0% - -
Inventory: Other supplies - 12 - 12 12 - 100.0% - -
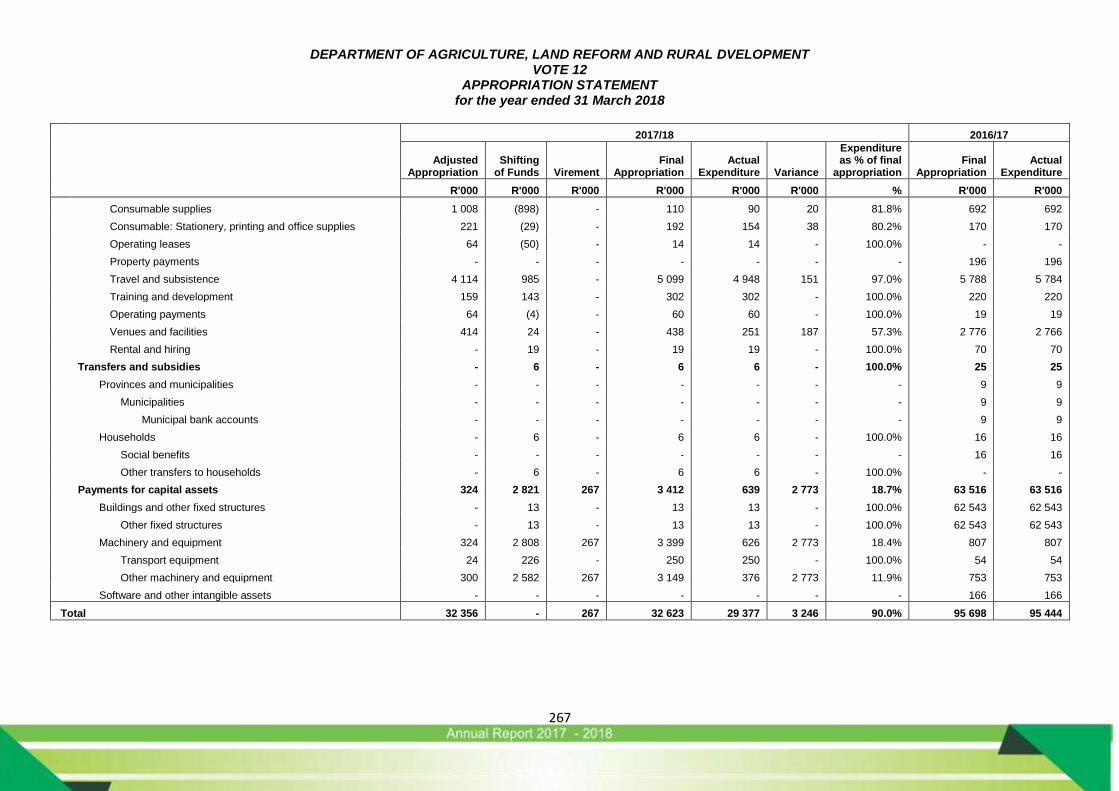
DEPARTMENT OF AGRICULTURE, LAND REFORM AND RURAL DVELOPMENT VOTE 12
APPROPRIATION STATEMENT for the year ended 31 March 2018
267
2017/18 2016/17
Adjusted
Appropriation Shifting of Funds
Virement
Final Appropriation
Actual Expenditure
Variance
Expenditure as % of final
appropriation Final
Appropriation Actual
Expenditure
R'000 R'000 R'000 R'000 R'000 R'000 % R'000 R'000
Consumable supplies 1 008 (898) - 110 90 20 81.8% 692 692
Consumable: Stationery, printing and office supplies 221 (29) - 192 154 38 80.2% 170 170
Operating leases 64 (50) - 14 14 - 100.0% - -
Property payments - - - - - - - 196 196
Travel and subsistence 4 114 985 - 5 099 4 948 151 97.0% 5 788 5 784
Training and development 159 143 - 302 302 - 100.0% 220 220
Operating payments 64 (4) - 60 60 - 100.0% 19 19
Venues and facilities 414 24 - 438 251 187 57.3% 2 776 2 766
Rental and hiring - 19 - 19 19 - 100.0% 70 70
Transfers and subsidies - 6 - 6 6 - 100.0% 25 25
Provinces and municipalities - - - - - - - 9 9
Municipalities - - - - - - - 9 9
Municipal bank accounts - - - - - - - 9 9
Households - 6 - 6 6 - 100.0% 16 16
Social benefits - - - - - - - 16 16
Other transfers to households - 6 - 6 6 - 100.0% - -
Payments for capital assets 324 2 821 267 3 412 639 2 773 18.7% 63 516 63 516
Buildings and other fixed structures - 13 - 13 13 - 100.0% 62 543 62 543
Other fixed structures - 13 - 13 13 - 100.0% 62 543 62 543
Machinery and equipment 324 2 808 267 3 399 626 2 773 18.4% 807 807
Transport equipment 24 226 - 250 250 - 100.0% 54 54
Other machinery and equipment 300 2 582 267 3 149 376 2 773 11.9% 753 753
Software and other intangible assets - - - - - - - 166 166
Total 32 356 - 267 32 623 29 377 3 246 90.0% 95 698 95 444
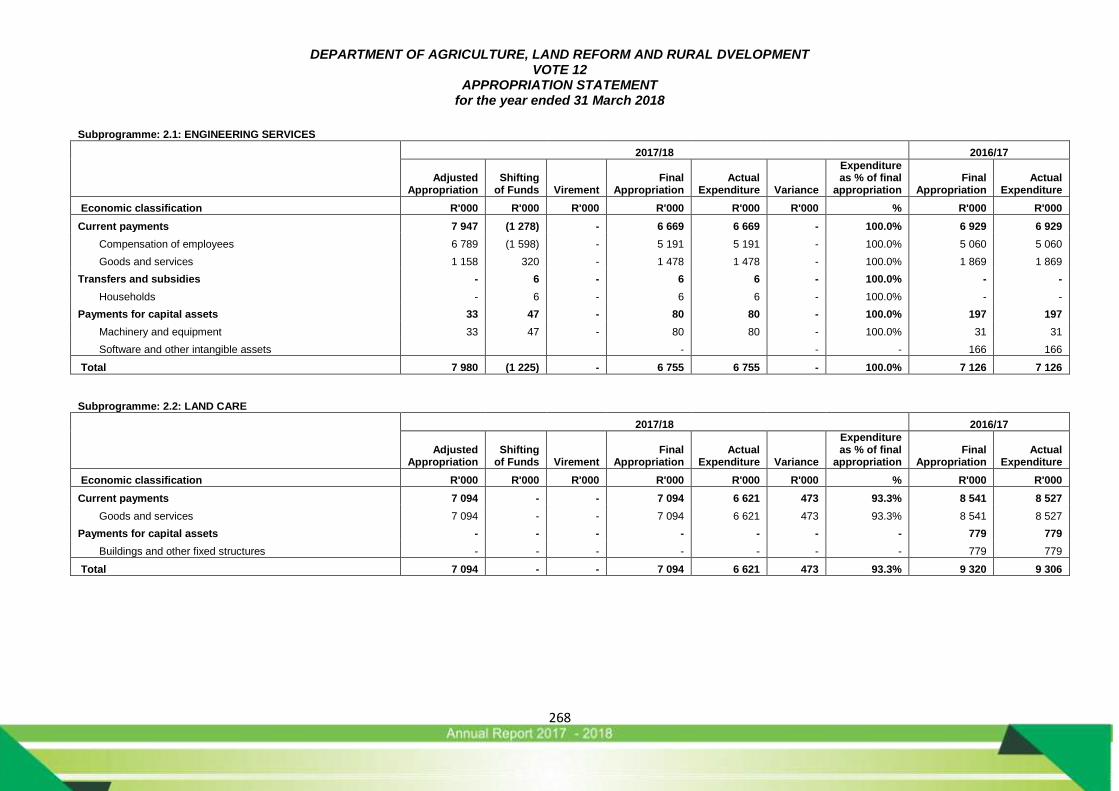
DEPARTMENT OF AGRICULTURE, LAND REFORM AND RURAL DVELOPMENT VOTE 12
APPROPRIATION STATEMENT for the year ended 31 March 2018
268
Subprogramme: 2.1: ENGINEERING SERVICES
2017/18 2016/17
Adjusted
Appropriation Shifting of Funds
Virement
Final Appropriation
Actual Expenditure
Variance
Expenditure as % of final
appropriation Final
Appropriation Actual
Expenditure
Economic classification R'000 R'000 R'000 R'000 R'000 R'000 % R'000 R'000
Current payments 7 947 (1 278) - 6 669 6 669 - 100.0% 6 929 6 929
Compensation of employees 6 789 (1 598) - 5 191 5 191 - 100.0% 5 060 5 060
Goods and services 1 158 320 - 1 478 1 478 - 100.0% 1 869 1 869
Transfers and subsidies - 6 - 6 6 - 100.0% - -
Households - 6 - 6 6 - 100.0% - -
Payments for capital assets 33 47 - 80 80 - 100.0% 197 197
Machinery and equipment 33 47 - 80 80 - 100.0% 31 31
Software and other intangible assets - - - 166 166
Total 7 980 (1 225) - 6 755 6 755 - 100.0% 7 126 7 126
Subprogramme: 2.2: LAND CARE
2017/18 2016/17
Adjusted
Appropriation Shifting of Funds
Virement
Final Appropriation
Actual Expenditure
Variance
Expenditure as % of final
appropriation Final
Appropriation Actual
Expenditure
Economic classification R'000 R'000 R'000 R'000 R'000 R'000 % R'000 R'000
Current payments 7 094 - - 7 094 6 621 473 93.3% 8 541 8 527
Goods and services 7 094 - - 7 094 6 621 473 93.3% 8 541 8 527
Payments for capital assets - - - - - - - 779 779
Buildings and other fixed structures - - - - - - - 779 779
Total 7 094 - - 7 094 6 621 473 93.3% 9 320 9 306

DEPARTMENT OF AGRICULTURE, LAND REFORM AND RURAL DVELOPMENT VOTE 12
APPROPRIATION STATEMENT for the year ended 31 March 2018
269
Subprogramme: 2.3: LAND USE MANAGEMENT
2017/18 2016/17
Adjusted
Appropriation Shifting of Funds
Virement
Final Appropriation
Actual Expenditure
Variance
Expenditure as % of final
appropriation Final
Appropriation Actual
Expenditure
Economic classification R'000 R'000 R'000 R'000 R'000 R'000 % R'000 R'000
Current payments 16 991 (1 549) - 15 442 15 442 - 100.0% 14 257 14 017
Compensation of employees 13 228 (1 908) - 11 320 11 320 - 100.0% 10 376 10 136
Goods and services 3 763 359 - 4 122 4 122 - 100.0% 3 881 3 881
Payments for capital assets 291 2 774 267 3 332 559 2 773 16.8% 773 773
Buildings and other fixed structures - 13 - 13 13 - 100.0% - -
Machinery and equipment 291 2 761 267 3 319 546 2 773 16.5% 773 773
Total 17 282 1 225 267 18 774 16 001 2 773 85.2% 15 055 14 815
Subprogramme: 2.4: DISASTER RISK MANAGEMENT
2017/18 2016/17
Adjusted
Appropriation Shifting of Funds
Virement
Final Appropriation
Actual Expenditure
Variance
Expenditure as % of final
appropriation Final
Appropriation Actual
Expenditure
Economic classification R'000 R'000 R'000 R'000 R'000 R'000 % R'000 R'000
Current payments - - - - - - - 2 430 2 430
Compensation of employees - - - - - - - 1 048 1 048
Goods and services - - - - - - - 1 382 1 382
Payments for capital assets - - - - - - - 61 767 61 767
Buildings and other fixed structures - - - - - - - 61 764 61 764
Machinery and equipment - - - - - - - 3 3
Total - - - - - - - 64 197 64 197
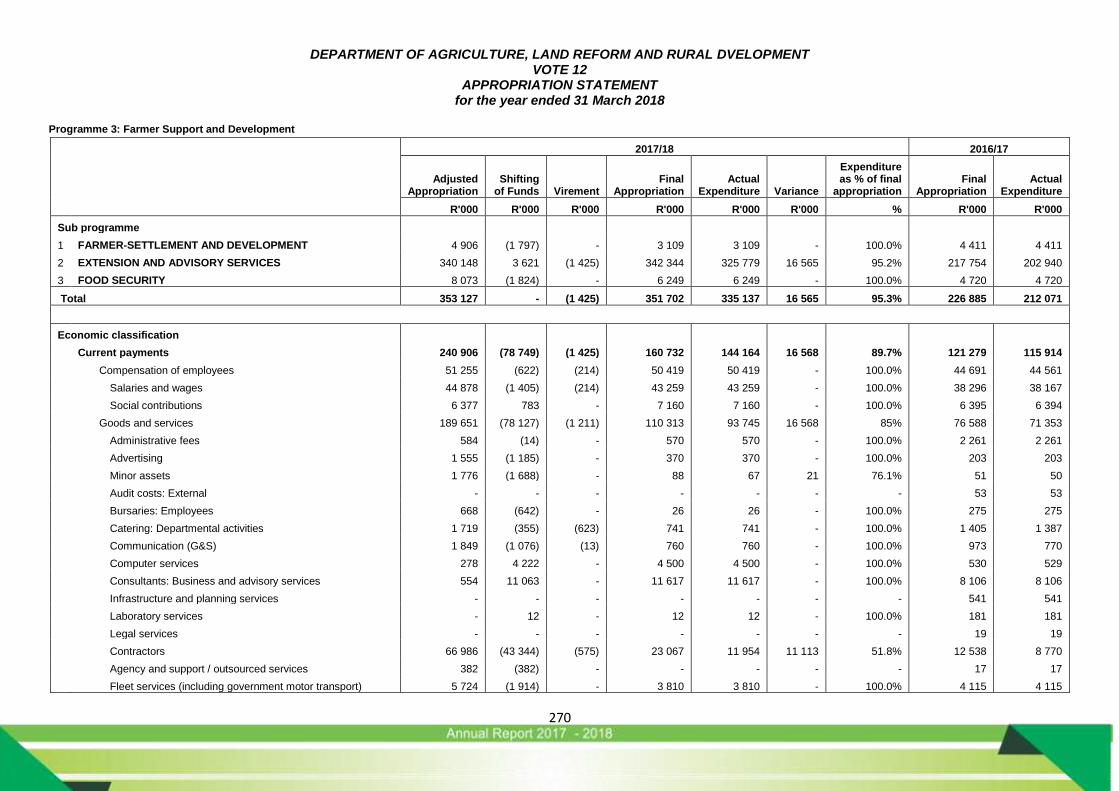
DEPARTMENT OF AGRICULTURE, LAND REFORM AND RURAL DVELOPMENT VOTE 12
APPROPRIATION STATEMENT for the year ended 31 March 2018
270
Programme 3: Farmer Support and Development
2017/18 2016/17
Adjusted
Appropriation Shifting of Funds
Virement
Final Appropriation
Actual Expenditure
Variance
Expenditure as % of final
appropriation Final
Appropriation Actual
Expenditure
R'000 R'000 R'000 R'000 R'000 R'000 % R'000 R'000
Sub programme
1 FARMER-SETTLEMENT AND DEVELOPMENT 4 906 (1 797) - 3 109 3 109 - 100.0% 4 411 4 411
2 EXTENSION AND ADVISORY SERVICES 340 148 3 621 (1 425) 342 344 325 779 16 565 95.2% 217 754 202 940
3 FOOD SECURITY 8 073 (1 824) - 6 249 6 249 - 100.0% 4 720 4 720
Total 353 127 - (1 425) 351 702 335 137 16 565 95.3% 226 885 212 071
Economic classification
Current payments 240 906 (78 749) (1 425) 160 732 144 164 16 568 89.7% 121 279 115 914
Compensation of employees 51 255 (622) (214) 50 419 50 419 - 100.0% 44 691 44 561
Salaries and wages 44 878 (1 405) (214) 43 259 43 259 - 100.0% 38 296 38 167
Social contributions 6 377 783 - 7 160 7 160 - 100.0% 6 395 6 394
Goods and services 189 651 (78 127) (1 211) 110 313 93 745 16 568 85% 76 588 71 353
Administrative fees 584 (14) - 570 570 - 100.0% 2 261 2 261
Advertising 1 555 (1 185) - 370 370 - 100.0% 203 203
Minor assets 1 776 (1 688) - 88 67 21 76.1% 51 50
Audit costs: External - - - - - - - 53 53
Bursaries: Employees 668 (642) - 26 26 - 100.0% 275 275
Catering: Departmental activities 1 719 (355) (623) 741 741 - 100.0% 1 405 1 387
Communication (G&S) 1 849 (1 076) (13) 760 760 - 100.0% 973 770
Computer services 278 4 222 - 4 500 4 500 - 100.0% 530 529
Consultants: Business and advisory services 554 11 063 - 11 617 11 617 - 100.0% 8 106 8 106
Infrastructure and planning services - - - - - - - 541 541
Laboratory services - 12 - 12 12 - 100.0% 181 181
Legal services - - - - - - - 19 19
Contractors 66 986 (43 344) (575) 23 067 11 954 11 113 51.8% 12 538 8 770
Agency and support / outsourced services 382 (382) - - - - - 17 17
Fleet services (including government motor transport) 5 724 (1 914) - 3 810 3 810 - 100.0% 4 115 4 115
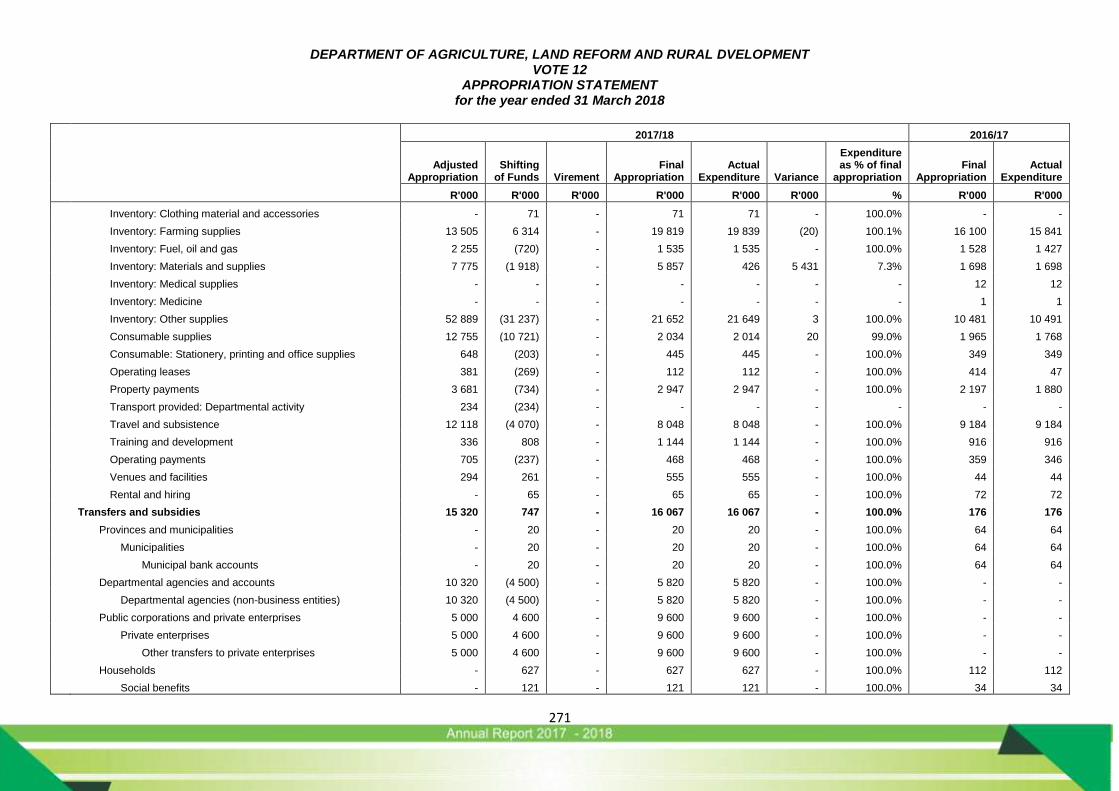
DEPARTMENT OF AGRICULTURE, LAND REFORM AND RURAL DVELOPMENT VOTE 12
APPROPRIATION STATEMENT for the year ended 31 March 2018
271
2017/18 2016/17
Adjusted
Appropriation Shifting of Funds
Virement
Final Appropriation
Actual Expenditure
Variance
Expenditure as % of final
appropriation Final
Appropriation Actual
Expenditure
R'000 R'000 R'000 R'000 R'000 R'000 % R'000 R'000
Inventory: Clothing material and accessories - 71 - 71 71 - 100.0% - -
Inventory: Farming supplies 13 505 6 314 - 19 819 19 839 (20) 100.1% 16 100 15 841
Inventory: Fuel, oil and gas 2 255 (720) - 1 535 1 535 - 100.0% 1 528 1 427
Inventory: Materials and supplies 7 775 (1 918) - 5 857 426 5 431 7.3% 1 698 1 698
Inventory: Medical supplies - - - - - - - 12 12
Inventory: Medicine - - - - - - - 1 1
Inventory: Other supplies 52 889 (31 237) - 21 652 21 649 3 100.0% 10 481 10 491
Consumable supplies 12 755 (10 721) - 2 034 2 014 20 99.0% 1 965 1 768
Consumable: Stationery, printing and office supplies 648 (203) - 445 445 - 100.0% 349 349
Operating leases 381 (269) - 112 112 - 100.0% 414 47
Property payments 3 681 (734) - 2 947 2 947 - 100.0% 2 197 1 880
Transport provided: Departmental activity 234 (234) - - - - - - -
Travel and subsistence 12 118 (4 070) - 8 048 8 048 - 100.0% 9 184 9 184
Training and development 336 808 - 1 144 1 144 - 100.0% 916 916
Operating payments 705 (237) - 468 468 - 100.0% 359 346
Venues and facilities 294 261 - 555 555 - 100.0% 44 44
Rental and hiring - 65 - 65 65 - 100.0% 72 72
Transfers and subsidies 15 320 747 - 16 067 16 067 - 100.0% 176 176
Provinces and municipalities - 20 - 20 20 - 100.0% 64 64
Municipalities - 20 - 20 20 - 100.0% 64 64
Municipal bank accounts - 20 - 20 20 - 100.0% 64 64
Departmental agencies and accounts 10 320 (4 500) - 5 820 5 820 - 100.0% - -
Departmental agencies (non-business entities) 10 320 (4 500) - 5 820 5 820 - 100.0% - -
Public corporations and private enterprises 5 000 4 600 - 9 600 9 600 - 100.0% - -
Private enterprises 5 000 4 600 - 9 600 9 600 - 100.0% - -
Other transfers to private enterprises 5 000 4 600 - 9 600 9 600 - 100.0% - -
Households - 627 - 627 627 - 100.0% 112 112
Social benefits - 121 - 121 121 - 100.0% 34 34

DEPARTMENT OF AGRICULTURE, LAND REFORM AND RURAL DVELOPMENT VOTE 12
APPROPRIATION STATEMENT for the year ended 31 March 2018
272
2017/18 2016/17
Adjusted
Appropriation Shifting of Funds
Virement
Final Appropriation
Actual Expenditure
Variance
Expenditure as % of final
appropriation Final
Appropriation Actual
Expenditure
R'000 R'000 R'000 R'000 R'000 R'000 % R'000 R'000
Other transfers to households - 506 - 506 506 - 100.0% 78 78
Payments for capital assets 96 901 78 002 - 174 903 174 906 (3) 100.0% 105 430 95 981
Buildings and other fixed structures 85 488 81 219 - 166 707 166 689 18 100.0% 98 714 89 980
Buildings - 1 300 - 1 300 1 300 - 100.0% - -
Other fixed structures 85 488 79 919 - 165 407 165 389 18 100.0% 98 714 89 980
Machinery and equipment 11 365 (5 598) - 5 767 5 788 (21) 100.4% 4 336 3 621
Transport equipment 1 315 928 - 2 243 2 243 - 100.0% 1 999 1 999
Other machinery and equipment 10 050 (6 526) - 3 524 3 545 (21) 100.6% 2 337 1 622
Software and other intangible assets 48 2 381 - 2 429 2 429 - 100.0% 2 380 2 380
Total 353 127 - (1 425) 351 702 335 137 16 565 95.3% 226 885 212 071
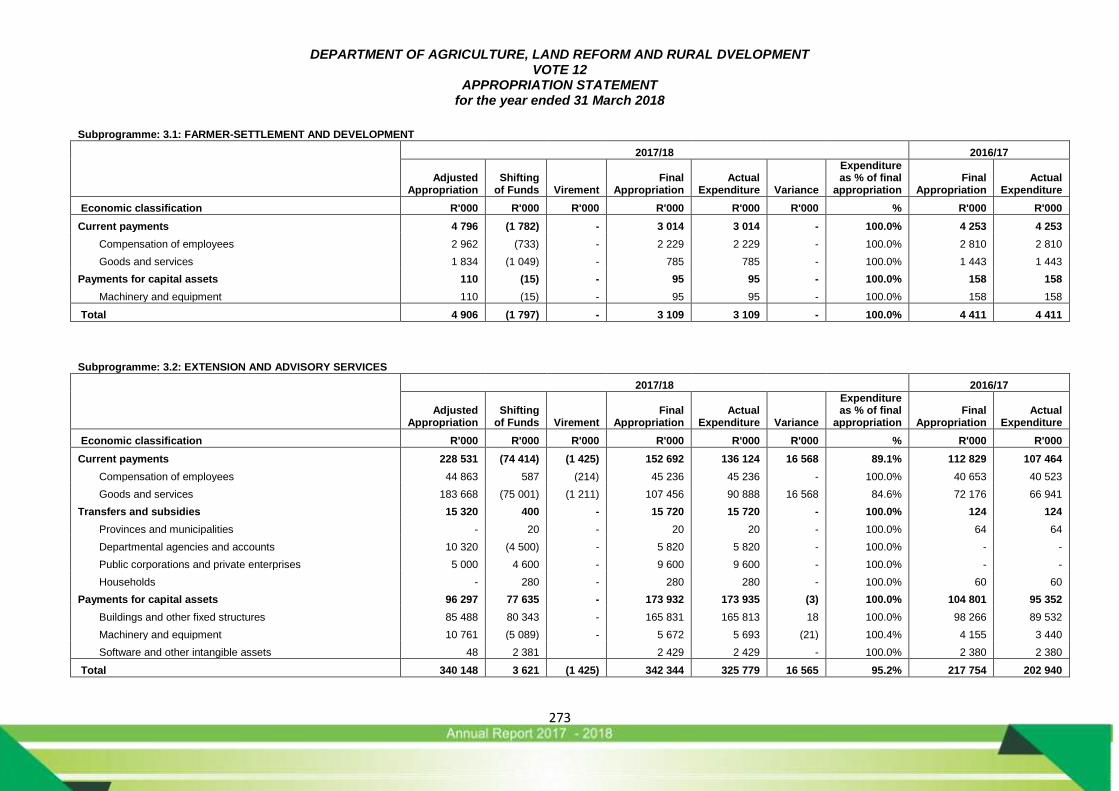
DEPARTMENT OF AGRICULTURE, LAND REFORM AND RURAL DVELOPMENT VOTE 12
APPROPRIATION STATEMENT for the year ended 31 March 2018
273
Subprogramme: 3.1: FARMER-SETTLEMENT AND DEVELOPMENT
2017/18 2016/17
Adjusted
Appropriation Shifting of Funds
Virement
Final Appropriation
Actual Expenditure
Variance
Expenditure as % of final
appropriation Final
Appropriation Actual
Expenditure
Economic classification R'000 R'000 R'000 R'000 R'000 R'000 % R'000 R'000
Current payments 4 796 (1 782) - 3 014 3 014 - 100.0% 4 253 4 253
Compensation of employees 2 962 (733) - 2 229 2 229 - 100.0% 2 810 2 810
Goods and services 1 834 (1 049) - 785 785 - 100.0% 1 443 1 443
Payments for capital assets 110 (15) - 95 95 - 100.0% 158 158
Machinery and equipment 110 (15) - 95 95 - 100.0% 158 158
Total 4 906 (1 797) - 3 109 3 109 - 100.0% 4 411 4 411
Subprogramme: 3.2: EXTENSION AND ADVISORY SERVICES
2017/18 2016/17
Adjusted
Appropriation Shifting of Funds
Virement
Final Appropriation
Actual Expenditure
Variance
Expenditure as % of final
appropriation Final
Appropriation Actual
Expenditure
Economic classification R'000 R'000 R'000 R'000 R'000 R'000 % R'000 R'000
Current payments 228 531 (74 414) (1 425) 152 692 136 124 16 568 89.1% 112 829 107 464
Compensation of employees 44 863 587 (214) 45 236 45 236 - 100.0% 40 653 40 523
Goods and services 183 668 (75 001) (1 211) 107 456 90 888 16 568 84.6% 72 176 66 941
Transfers and subsidies 15 320 400 - 15 720 15 720 - 100.0% 124 124
Provinces and municipalities - 20 - 20 20 - 100.0% 64 64
Departmental agencies and accounts 10 320 (4 500) - 5 820 5 820 - 100.0% - -
Public corporations and private enterprises 5 000 4 600 - 9 600 9 600 - 100.0% - -
Households - 280 - 280 280 - 100.0% 60 60
Payments for capital assets 96 297 77 635 - 173 932 173 935 (3) 100.0% 104 801 95 352
Buildings and other fixed structures 85 488 80 343 - 165 831 165 813 18 100.0% 98 266 89 532
Machinery and equipment 10 761 (5 089) - 5 672 5 693 (21) 100.4% 4 155 3 440
Software and other intangible assets 48 2 381 2 429 2 429 - 100.0% 2 380 2 380
Total 340 148 3 621 (1 425) 342 344 325 779 16 565 95.2% 217 754 202 940
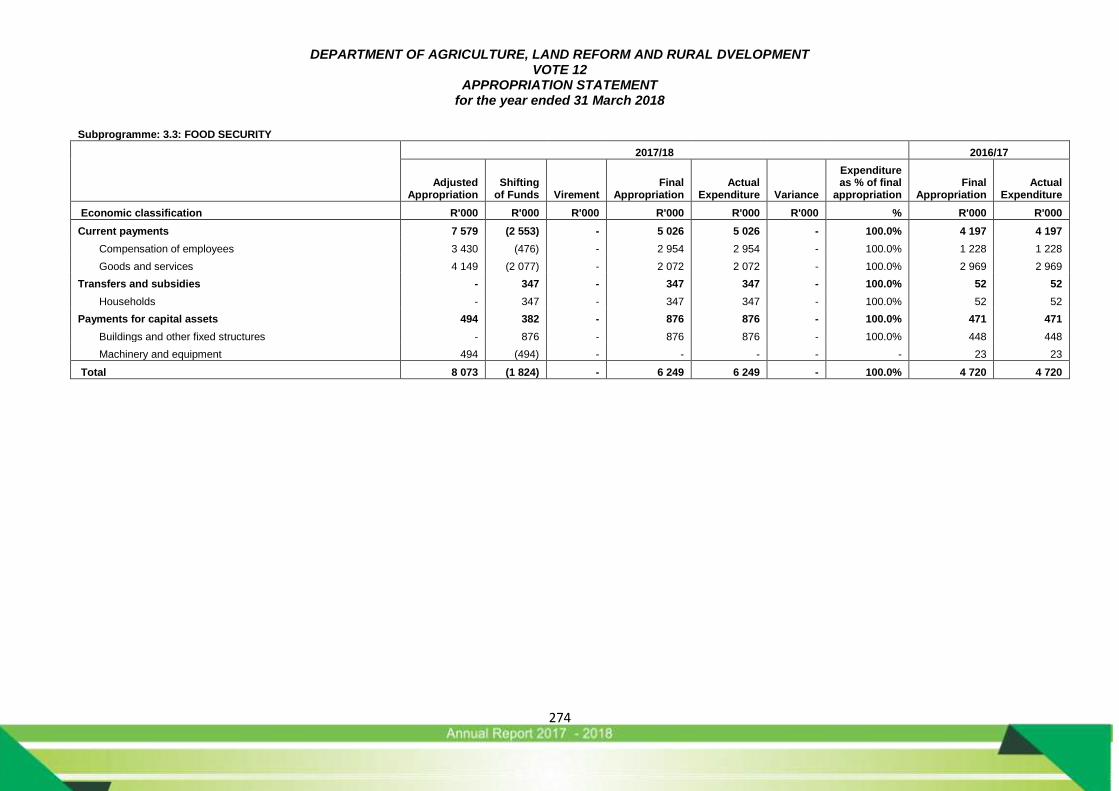
DEPARTMENT OF AGRICULTURE, LAND REFORM AND RURAL DVELOPMENT VOTE 12
APPROPRIATION STATEMENT for the year ended 31 March 2018
274
Subprogramme: 3.3: FOOD SECURITY
2017/18 2016/17
Adjusted Appropriation
Shifting of Funds
Virement
Final Appropriation
Actual Expenditure
Variance
Expenditure as % of final
appropriation Final
Appropriation Actual
Expenditure
Economic classification R'000 R'000 R'000 R'000 R'000 R'000 % R'000 R'000
Current payments 7 579 (2 553) - 5 026 5 026 - 100.0% 4 197 4 197
Compensation of employees 3 430 (476) - 2 954 2 954 - 100.0% 1 228 1 228
Goods and services 4 149 (2 077) - 2 072 2 072 - 100.0% 2 969 2 969
Transfers and subsidies - 347 - 347 347 - 100.0% 52 52
Households - 347 - 347 347 - 100.0% 52 52
Payments for capital assets 494 382 - 876 876 - 100.0% 471 471
Buildings and other fixed structures - 876 - 876 876 - 100.0% 448 448
Machinery and equipment 494 (494) - - - - - 23 23
Total 8 073 (1 824) - 6 249 6 249 - 100.0% 4 720 4 720

DEPARTMENT OF AGRICULTURE, LAND REFORM AND RURAL DVELOPMENT VOTE 12
APPROPRIATION STATEMENT for the year ended 31 March 2018
275
Programme 4: Veterinary Services
2017/18 2016/17
Adjusted
Appropriation Shifting of
Funds
Virement Final
Appropriation Actual
Expenditure
Variance
Expenditure as % of final
appropriation Final
Appropriation Actual
Expenditure
R'000 R'000 R'000 R'000 R'000 R'000 % R'000 R'000
Sub programme 1 ANIMAL HEALTH 34 522 1 415 662 36 599 36 599 - 100.0% 31 604 31 604 2 EXPORT CONTROL 1 718 (1 417) - 301 301 - 100.0% 96 96 3 VETERINARY PUBLIC HEALTH 5 825 329 - 6 154 6 154 - 100.0% 5 653 5 653 4 VETERINARY LABORATORY SERVICES 7 585 (327) - 7 258 7 258 - 100.0% 7 306 7 306
Total 49 650 - 662 50 312 50 312 - 100.0% 44 659 44 659
Economic classification
Current payments 47 520 (1 031) 662 47 151 47 151 - 100.0% 41 900 41 900
Compensation of employees 38 351 (1 953) - 36 398 36 398 - 100.0% 32 847 32 847
Salaries and wages 33 329 (1 784) - 31 545 31 545 - 100.0% 28 563 28 563
Social contributions 5 022 (169) - 4 853 4 853 - 100.0% 4 284 4 284
Goods and services 9 169 922 662 10 753 10 753 - 100.0% 9 053 9 048
Administrative fees 38 65 - 103 103 - 100.0% 88 88
Advertising - 37 - 37 37 - 100.0% - -
Minor assets 65 11 - 76 76 - 100.0% 48 48
Catering: Departmental activities 28 8 - 36 36 - 100.0% 12 12
Communication (G&S) 670 (253) - 417 417 - 100.0% 470 470
Computer services 20 70 - 90 90 - 100.0% 2 2
Consultants: Business and advisory services - 21 - 21 21 - 100.0% 69 69
Laboratory services 162 42 - 204 204 - 100.0% 552 552
Contractors 221 (86) - 135 135 - 100.0% 235 235
Agency and support / outsourced services 30 (30) - - - - - - -
Fleet services (incl. government motor transport) 3 225 (773) - 2 452 2 452 - 100.0% 2 079 2 079
Inventory: Clothing material and accessories - 125 - 125 125 - 100.0% - -
Inventory: Farming supplies - 185 - 185 185 - 100.0% 1 1
Inventory: Food and food supplies - 1 - 1 1 - 100.0% - -
Inventory: Fuel, oil and gas 23 34 - 57 57 - 100.0% 20 20
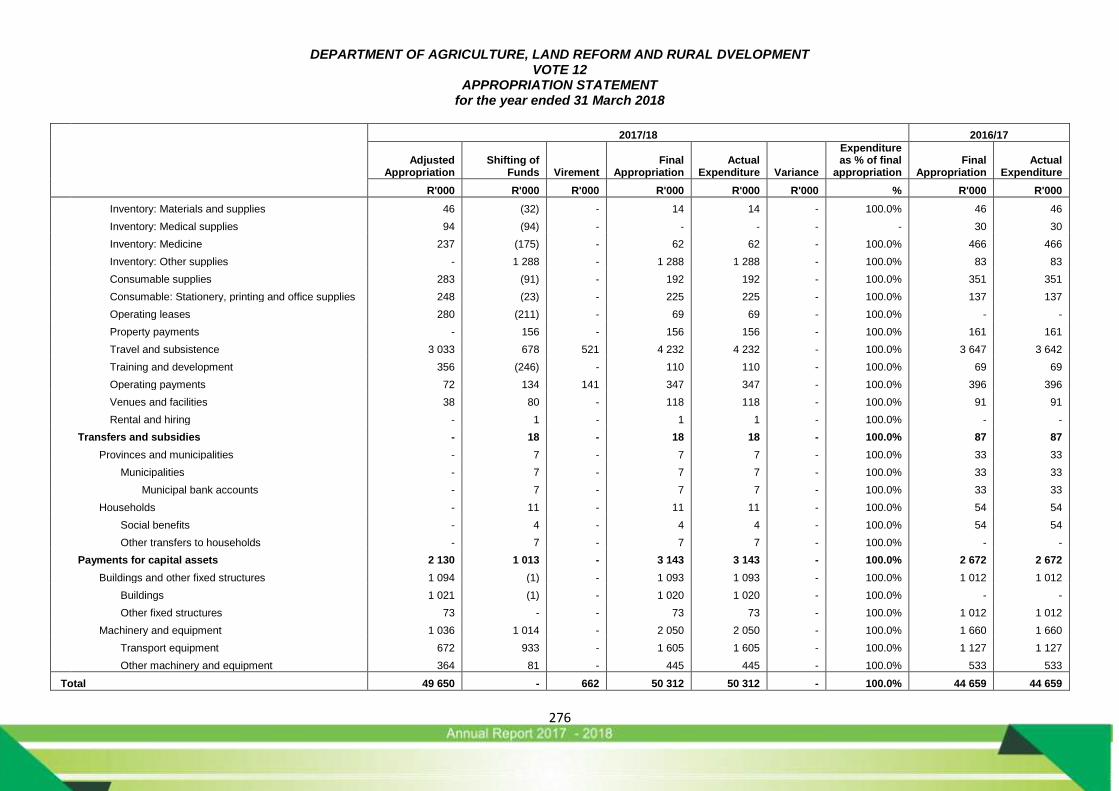
DEPARTMENT OF AGRICULTURE, LAND REFORM AND RURAL DVELOPMENT VOTE 12
APPROPRIATION STATEMENT for the year ended 31 March 2018
276
2017/18 2016/17
Adjusted
Appropriation Shifting of
Funds
Virement Final
Appropriation Actual
Expenditure
Variance
Expenditure as % of final
appropriation Final
Appropriation Actual
Expenditure
R'000 R'000 R'000 R'000 R'000 R'000 % R'000 R'000
Inventory: Materials and supplies 46 (32) - 14 14 - 100.0% 46 46
Inventory: Medical supplies 94 (94) - - - - - 30 30
Inventory: Medicine 237 (175) - 62 62 - 100.0% 466 466
Inventory: Other supplies - 1 288 - 1 288 1 288 - 100.0% 83 83
Consumable supplies 283 (91) - 192 192 - 100.0% 351 351
Consumable: Stationery, printing and office supplies 248 (23) - 225 225 - 100.0% 137 137
Operating leases 280 (211) - 69 69 - 100.0% - -
Property payments - 156 - 156 156 - 100.0% 161 161
Travel and subsistence 3 033 678 521 4 232 4 232 - 100.0% 3 647 3 642
Training and development 356 (246) - 110 110 - 100.0% 69 69
Operating payments 72 134 141 347 347 - 100.0% 396 396
Venues and facilities 38 80 - 118 118 - 100.0% 91 91
Rental and hiring - 1 - 1 1 - 100.0% - -
Transfers and subsidies - 18 - 18 18 - 100.0% 87 87
Provinces and municipalities - 7 - 7 7 - 100.0% 33 33
Municipalities - 7 - 7 7 - 100.0% 33 33
Municipal bank accounts - 7 - 7 7 - 100.0% 33 33
Households - 11 - 11 11 - 100.0% 54 54
Social benefits - 4 - 4 4 - 100.0% 54 54
Other transfers to households - 7 - 7 7 - 100.0% - -
Payments for capital assets 2 130 1 013 - 3 143 3 143 - 100.0% 2 672 2 672
Buildings and other fixed structures 1 094 (1) - 1 093 1 093 - 100.0% 1 012 1 012
Buildings 1 021 (1) - 1 020 1 020 - 100.0% - -
Other fixed structures 73 - - 73 73 - 100.0% 1 012 1 012
Machinery and equipment 1 036 1 014 - 2 050 2 050 - 100.0% 1 660 1 660
Transport equipment 672 933 - 1 605 1 605 - 100.0% 1 127 1 127
Other machinery and equipment 364 81 - 445 445 - 100.0% 533 533
Total 49 650 - 662 50 312 50 312 - 100.0% 44 659 44 659
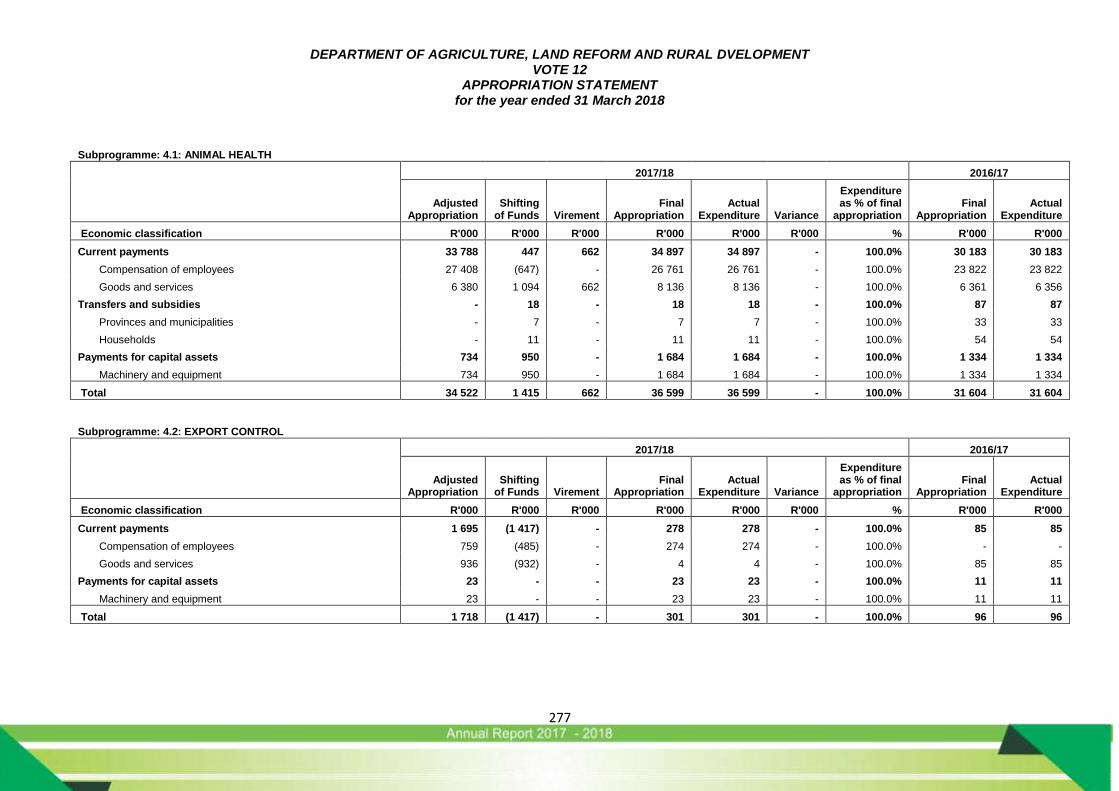
DEPARTMENT OF AGRICULTURE, LAND REFORM AND RURAL DVELOPMENT VOTE 12
APPROPRIATION STATEMENT for the year ended 31 March 2018
277
Subprogramme: 4.1: ANIMAL HEALTH
2017/18 2016/17
Adjusted Appropriation
Shifting of Funds
Virement
Final Appropriation
Actual Expenditure
Variance
Expenditure as % of final
appropriation Final
Appropriation Actual
Expenditure
Economic classification R'000 R'000 R'000 R'000 R'000 R'000 % R'000 R'000
Current payments 33 788 447 662 34 897 34 897 - 100.0% 30 183 30 183
Compensation of employees 27 408 (647) - 26 761 26 761 - 100.0% 23 822 23 822
Goods and services 6 380 1 094 662 8 136 8 136 - 100.0% 6 361 6 356
Transfers and subsidies - 18 - 18 18 - 100.0% 87 87
Provinces and municipalities - 7 - 7 7 - 100.0% 33 33
Households - 11 - 11 11 - 100.0% 54 54
Payments for capital assets 734 950 - 1 684 1 684 - 100.0% 1 334 1 334
Machinery and equipment 734 950 - 1 684 1 684 - 100.0% 1 334 1 334
Total 34 522 1 415 662 36 599 36 599 - 100.0% 31 604 31 604
Subprogramme: 4.2: EXPORT CONTROL
2017/18 2016/17
Adjusted Appropriation
Shifting of Funds
Virement
Final Appropriation
Actual Expenditure
Variance
Expenditure as % of final
appropriation Final
Appropriation Actual
Expenditure
Economic classification R'000 R'000 R'000 R'000 R'000 R'000 % R'000 R'000
Current payments 1 695 (1 417) - 278 278 - 100.0% 85 85
Compensation of employees 759 (485) - 274 274 - 100.0% - -
Goods and services 936 (932) - 4 4 - 100.0% 85 85
Payments for capital assets 23 - - 23 23 - 100.0% 11 11
Machinery and equipment 23 - - 23 23 - 100.0% 11 11
Total 1 718 (1 417) - 301 301 - 100.0% 96 96
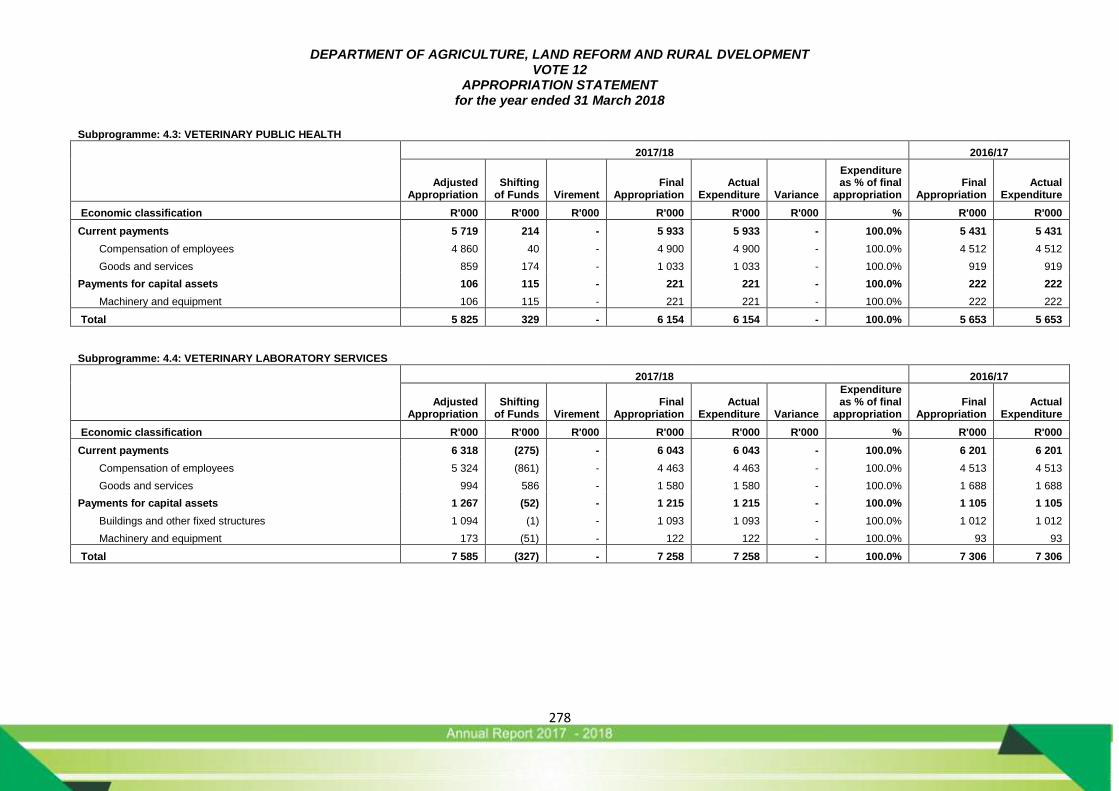
DEPARTMENT OF AGRICULTURE, LAND REFORM AND RURAL DVELOPMENT VOTE 12
APPROPRIATION STATEMENT for the year ended 31 March 2018
278
Subprogramme: 4.3: VETERINARY PUBLIC HEALTH
2017/18 2016/17
Adjusted Appropriation
Shifting of Funds
Virement
Final Appropriation
Actual Expenditure
Variance
Expenditure as % of final
appropriation Final
Appropriation Actual
Expenditure
Economic classification R'000 R'000 R'000 R'000 R'000 R'000 % R'000 R'000
Current payments 5 719 214 - 5 933 5 933 - 100.0% 5 431 5 431
Compensation of employees 4 860 40 - 4 900 4 900 - 100.0% 4 512 4 512
Goods and services 859 174 - 1 033 1 033 - 100.0% 919 919
Payments for capital assets 106 115 - 221 221 - 100.0% 222 222
Machinery and equipment 106 115 - 221 221 - 100.0% 222 222
Total 5 825 329 - 6 154 6 154 - 100.0% 5 653 5 653
Subprogramme: 4.4: VETERINARY LABORATORY SERVICES
2017/18 2016/17
Adjusted
Appropriation Shifting of Funds
Virement
Final Appropriation
Actual Expenditure
Variance
Expenditure as % of final
appropriation Final
Appropriation Actual
Expenditure
Economic classification R'000 R'000 R'000 R'000 R'000 R'000 % R'000 R'000
Current payments 6 318 (275) - 6 043 6 043 - 100.0% 6 201 6 201
Compensation of employees 5 324 (861) - 4 463 4 463 - 100.0% 4 513 4 513
Goods and services 994 586 - 1 580 1 580 - 100.0% 1 688 1 688
Payments for capital assets 1 267 (52) - 1 215 1 215 - 100.0% 1 105 1 105
Buildings and other fixed structures 1 094 (1) - 1 093 1 093 - 100.0% 1 012 1 012
Machinery and equipment 173 (51) - 122 122 - 100.0% 93 93
Total 7 585 (327) - 7 258 7 258 - 100.0% 7 306 7 306
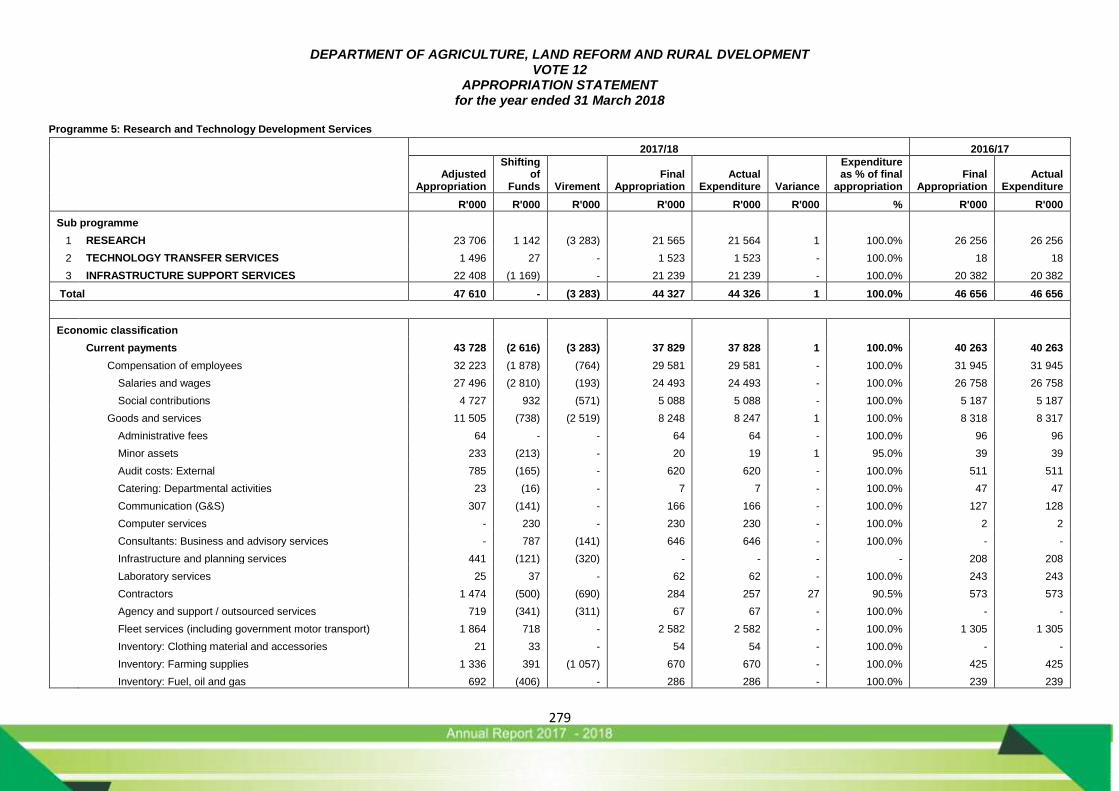
DEPARTMENT OF AGRICULTURE, LAND REFORM AND RURAL DVELOPMENT VOTE 12
APPROPRIATION STATEMENT for the year ended 31 March 2018
279
Programme 5: Research and Technology Development Services
2017/18 2016/17
Adjusted
Appropriation
Shifting of
Funds
Virement Final
Appropriation Actual
Expenditure
Variance
Expenditure as % of final
appropriation Final
Appropriation Actual
Expenditure
R'000 R'000 R'000 R'000 R'000 R'000 % R'000 R'000
Sub programme
1 RESEARCH 23 706 1 142 (3 283) 21 565 21 564 1 100.0% 26 256 26 256
2 TECHNOLOGY TRANSFER SERVICES 1 496 27 - 1 523 1 523 - 100.0% 18 18
3 INFRASTRUCTURE SUPPORT SERVICES 22 408 (1 169) - 21 239 21 239 - 100.0% 20 382 20 382
Total 47 610 - (3 283) 44 327 44 326 1 100.0% 46 656 46 656
Economic classification
Current payments 43 728 (2 616) (3 283) 37 829 37 828 1 100.0% 40 263 40 263
Compensation of employees 32 223 (1 878) (764) 29 581 29 581 - 100.0% 31 945 31 945
Salaries and wages 27 496 (2 810) (193) 24 493 24 493 - 100.0% 26 758 26 758
Social contributions 4 727 932 (571) 5 088 5 088 - 100.0% 5 187 5 187
Goods and services 11 505 (738) (2 519) 8 248 8 247 1 100.0% 8 318 8 317
Administrative fees 64 - - 64 64 - 100.0% 96 96
Minor assets 233 (213) - 20 19 1 95.0% 39 39
Audit costs: External 785 (165) - 620 620 - 100.0% 511 511
Catering: Departmental activities 23 (16) - 7 7 - 100.0% 47 47
Communication (G&S) 307 (141) - 166 166 - 100.0% 127 128
Computer services - 230 - 230 230 - 100.0% 2 2
Consultants: Business and advisory services - 787 (141) 646 646 - 100.0% - -
Infrastructure and planning services 441 (121) (320) - - - - 208 208
Laboratory services 25 37 - 62 62 - 100.0% 243 243
Contractors 1 474 (500) (690) 284 257 27 90.5% 573 573
Agency and support / outsourced services 719 (341) (311) 67 67 - 100.0% - -
Fleet services (including government motor transport) 1 864 718 - 2 582 2 582 - 100.0% 1 305 1 305
Inventory: Clothing material and accessories 21 33 - 54 54 - 100.0% - -
Inventory: Farming supplies 1 336 391 (1 057) 670 670 - 100.0% 425 425
Inventory: Fuel, oil and gas 692 (406) - 286 286 - 100.0% 239 239
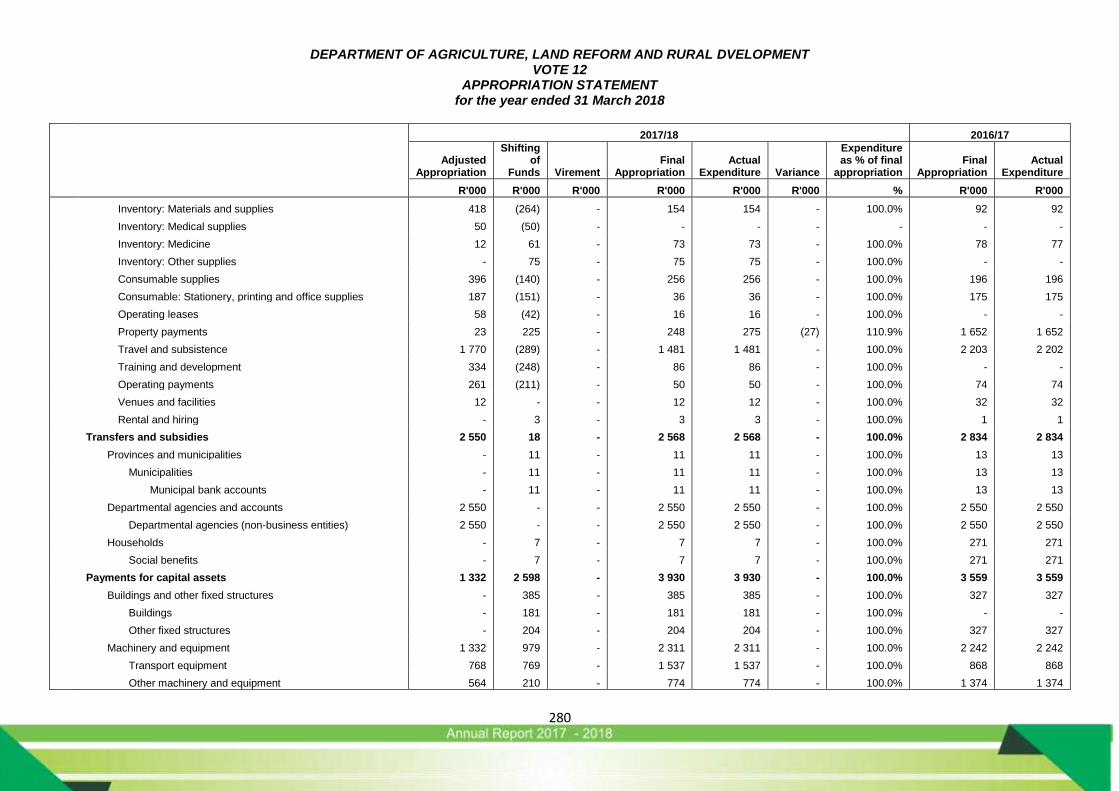
DEPARTMENT OF AGRICULTURE, LAND REFORM AND RURAL DVELOPMENT VOTE 12
APPROPRIATION STATEMENT for the year ended 31 March 2018
280
2017/18 2016/17
Adjusted
Appropriation
Shifting of
Funds
Virement Final
Appropriation Actual
Expenditure
Variance
Expenditure as % of final
appropriation Final
Appropriation Actual
Expenditure
R'000 R'000 R'000 R'000 R'000 R'000 % R'000 R'000
Inventory: Materials and supplies 418 (264) - 154 154 - 100.0% 92 92
Inventory: Medical supplies 50 (50) - - - - - - -
Inventory: Medicine 12 61 - 73 73 - 100.0% 78 77
Inventory: Other supplies - 75 - 75 75 - 100.0% - -
Consumable supplies 396 (140) - 256 256 - 100.0% 196 196
Consumable: Stationery, printing and office supplies 187 (151) - 36 36 - 100.0% 175 175
Operating leases 58 (42) - 16 16 - 100.0% - -
Property payments 23 225 - 248 275 (27) 110.9% 1 652 1 652
Travel and subsistence 1 770 (289) - 1 481 1 481 - 100.0% 2 203 2 202
Training and development 334 (248) - 86 86 - 100.0% - -
Operating payments 261 (211) - 50 50 - 100.0% 74 74
Venues and facilities 12 - - 12 12 - 100.0% 32 32
Rental and hiring - 3 - 3 3 - 100.0% 1 1
Transfers and subsidies 2 550 18 - 2 568 2 568 - 100.0% 2 834 2 834
Provinces and municipalities - 11 - 11 11 - 100.0% 13 13
Municipalities - 11 - 11 11 - 100.0% 13 13
Municipal bank accounts - 11 - 11 11 - 100.0% 13 13
Departmental agencies and accounts 2 550 - - 2 550 2 550 - 100.0% 2 550 2 550
Departmental agencies (non-business entities) 2 550 - - 2 550 2 550 - 100.0% 2 550 2 550
Households - 7 - 7 7 - 100.0% 271 271
Social benefits - 7 - 7 7 - 100.0% 271 271
Payments for capital assets 1 332 2 598 - 3 930 3 930 - 100.0% 3 559 3 559
Buildings and other fixed structures - 385 - 385 385 - 100.0% 327 327
Buildings - 181 - 181 181 - 100.0% - -
Other fixed structures - 204 - 204 204 - 100.0% 327 327
Machinery and equipment 1 332 979 - 2 311 2 311 - 100.0% 2 242 2 242
Transport equipment 768 769 - 1 537 1 537 - 100.0% 868 868
Other machinery and equipment 564 210 - 774 774 - 100.0% 1 374 1 374
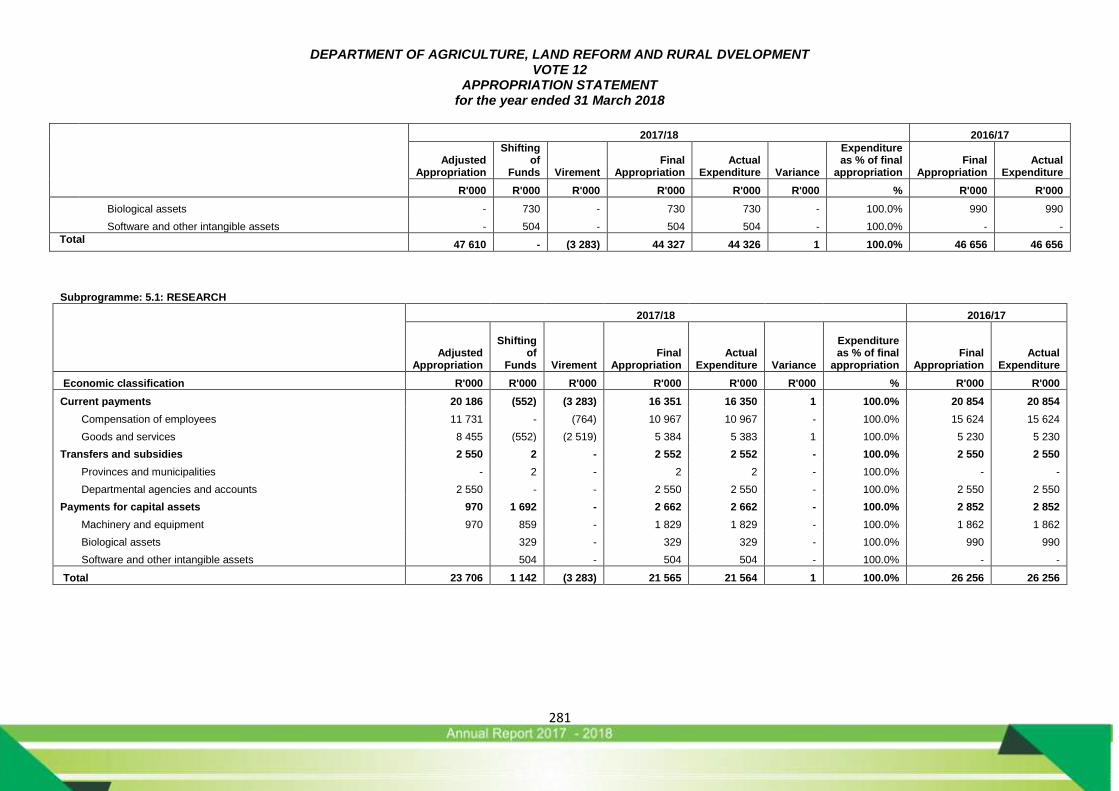
DEPARTMENT OF AGRICULTURE, LAND REFORM AND RURAL DVELOPMENT VOTE 12
APPROPRIATION STATEMENT for the year ended 31 March 2018
281
2017/18 2016/17
Adjusted
Appropriation
Shifting of
Funds
Virement Final
Appropriation Actual
Expenditure
Variance
Expenditure as % of final
appropriation Final
Appropriation Actual
Expenditure
R'000 R'000 R'000 R'000 R'000 R'000 % R'000 R'000
Biological assets - 730 - 730 730 - 100.0% 990 990
Software and other intangible assets - 504 - 504 504 - 100.0% - -
Total 47 610 - (3 283) 44 327 44 326 1 100.0% 46 656 46 656
Subprogramme: 5.1: RESEARCH
2017/18 2016/17
Adjusted Appropriation
Shifting
of Funds
Virement
Final Appropriation
Actual Expenditure
Variance
Expenditure as % of final
appropriation Final
Appropriation Actual
Expenditure
Economic classification R'000 R'000 R'000 R'000 R'000 R'000 % R'000 R'000
Current payments 20 186 (552) (3 283) 16 351 16 350 1 100.0% 20 854 20 854
Compensation of employees 11 731 - (764) 10 967 10 967 - 100.0% 15 624 15 624
Goods and services 8 455 (552) (2 519) 5 384 5 383 1 100.0% 5 230 5 230
Transfers and subsidies 2 550 2 - 2 552 2 552 - 100.0% 2 550 2 550
Provinces and municipalities - 2 - 2 2 - 100.0% - -
Departmental agencies and accounts 2 550 - - 2 550 2 550 - 100.0% 2 550 2 550
Payments for capital assets 970 1 692 - 2 662 2 662 - 100.0% 2 852 2 852
Machinery and equipment 970 859 - 1 829 1 829 - 100.0% 1 862 1 862
Biological assets 329 - 329 329 - 100.0% 990 990
Software and other intangible assets 504 - 504 504 - 100.0% - -
Total 23 706 1 142 (3 283) 21 565 21 564 1 100.0% 26 256 26 256
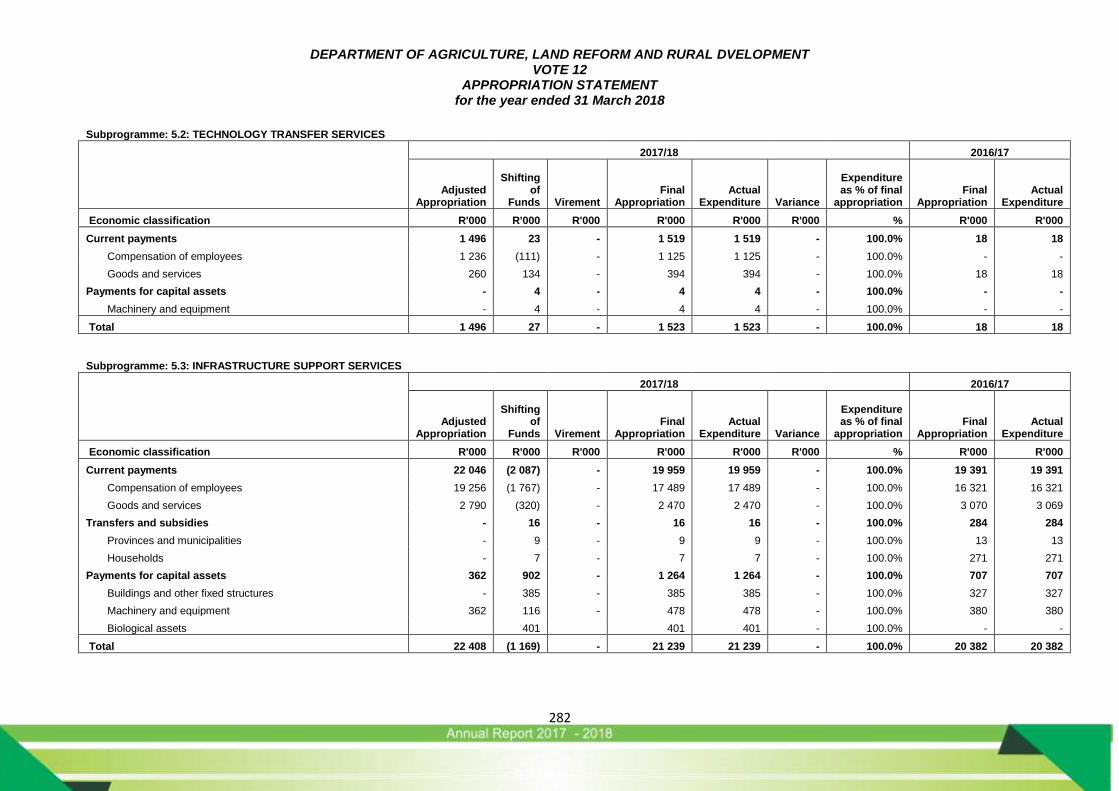
DEPARTMENT OF AGRICULTURE, LAND REFORM AND RURAL DVELOPMENT VOTE 12
APPROPRIATION STATEMENT for the year ended 31 March 2018
282
Subprogramme: 5.2: TECHNOLOGY TRANSFER SERVICES
2017/18 2016/17
Adjusted Appropriation
Shifting
of Funds
Virement
Final Appropriation
Actual Expenditure
Variance
Expenditure as % of final
appropriation Final
Appropriation Actual
Expenditure
Economic classification R'000 R'000 R'000 R'000 R'000 R'000 % R'000 R'000
Current payments 1 496 23 - 1 519 1 519 - 100.0% 18 18
Compensation of employees 1 236 (111) - 1 125 1 125 - 100.0% - -
Goods and services 260 134 - 394 394 - 100.0% 18 18
Payments for capital assets - 4 - 4 4 - 100.0% - -
Machinery and equipment - 4 - 4 4 - 100.0% - -
Total 1 496 27 - 1 523 1 523 - 100.0% 18 18
Subprogramme: 5.3: INFRASTRUCTURE SUPPORT SERVICES
2017/18 2016/17
Adjusted Appropriation
Shifting
of Funds
Virement
Final Appropriation
Actual Expenditure
Variance
Expenditure as % of final
appropriation Final
Appropriation Actual
Expenditure
Economic classification R'000 R'000 R'000 R'000 R'000 R'000 % R'000 R'000
Current payments 22 046 (2 087) - 19 959 19 959 - 100.0% 19 391 19 391
Compensation of employees 19 256 (1 767) - 17 489 17 489 - 100.0% 16 321 16 321
Goods and services 2 790 (320) - 2 470 2 470 - 100.0% 3 070 3 069
Transfers and subsidies - 16 - 16 16 - 100.0% 284 284
Provinces and municipalities - 9 - 9 9 - 100.0% 13 13
Households - 7 - 7 7 - 100.0% 271 271
Payments for capital assets 362 902 - 1 264 1 264 - 100.0% 707 707
Buildings and other fixed structures - 385 - 385 385 - 100.0% 327 327
Machinery and equipment 362 116 - 478 478 - 100.0% 380 380
Biological assets 401 401 401 - 100.0% - -
Total 22 408 (1 169) - 21 239 21 239 - 100.0% 20 382 20 382
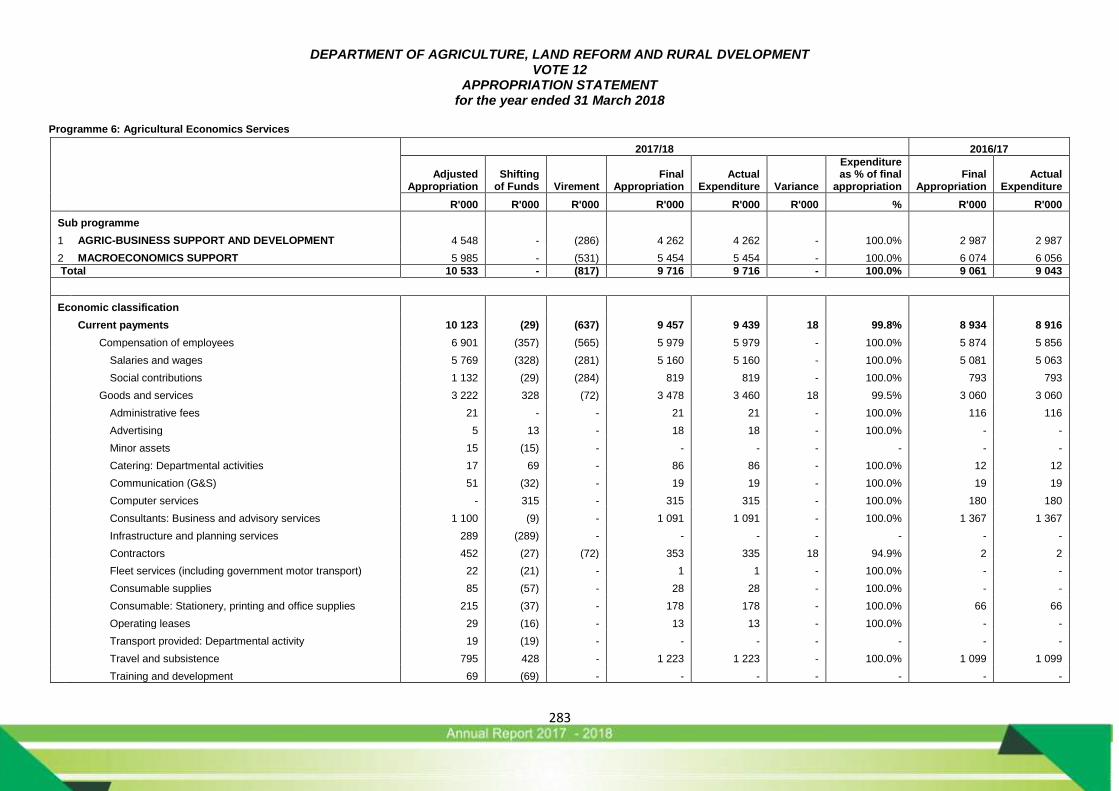
DEPARTMENT OF AGRICULTURE, LAND REFORM AND RURAL DVELOPMENT VOTE 12
APPROPRIATION STATEMENT for the year ended 31 March 2018
283
Programme 6: Agricultural Economics Services
2017/18 2016/17
Adjusted
Appropriation Shifting of Funds
Virement
Final Appropriation
Actual Expenditure
Variance
Expenditure as % of final
appropriation Final
Appropriation Actual
Expenditure
R'000 R'000 R'000 R'000 R'000 R'000 % R'000 R'000
Sub programme
1 AGRIC-BUSINESS SUPPORT AND DEVELOPMENT 4 548 - (286) 4 262 4 262 - 100.0% 2 987 2 987
2 MACROECONOMICS SUPPORT 5 985 - (531) 5 454 5 454 - 100.0% 6 074 6 056
Total 10 533 - (817) 9 716 9 716 - 100.0% 9 061 9 043
Economic classification
Current payments 10 123 (29) (637) 9 457 9 439 18 99.8% 8 934 8 916
Compensation of employees 6 901 (357) (565) 5 979 5 979 - 100.0% 5 874 5 856
Salaries and wages 5 769 (328) (281) 5 160 5 160 - 100.0% 5 081 5 063
Social contributions 1 132 (29) (284) 819 819 - 100.0% 793 793
Goods and services 3 222 328 (72) 3 478 3 460 18 99.5% 3 060 3 060
Administrative fees 21 - - 21 21 - 100.0% 116 116
Advertising 5 13 - 18 18 - 100.0% - -
Minor assets 15 (15) - - - - - - -
Catering: Departmental activities 17 69 - 86 86 - 100.0% 12 12
Communication (G&S) 51 (32) - 19 19 - 100.0% 19 19
Computer services - 315 - 315 315 - 100.0% 180 180
Consultants: Business and advisory services 1 100 (9) - 1 091 1 091 - 100.0% 1 367 1 367
Infrastructure and planning services 289 (289) - - - - - - -
Contractors 452 (27) (72) 353 335 18 94.9% 2 2
Fleet services (including government motor transport) 22 (21) - 1 1 - 100.0% - -
Consumable supplies 85 (57) - 28 28 - 100.0% - -
Consumable: Stationery, printing and office supplies 215 (37) - 178 178 - 100.0% 66 66
Operating leases 29 (16) - 13 13 - 100.0% - -
Transport provided: Departmental activity 19 (19) - - - - - - -
Travel and subsistence 795 428 - 1 223 1 223 - 100.0% 1 099 1 099
Training and development 69 (69) - - - - - - -
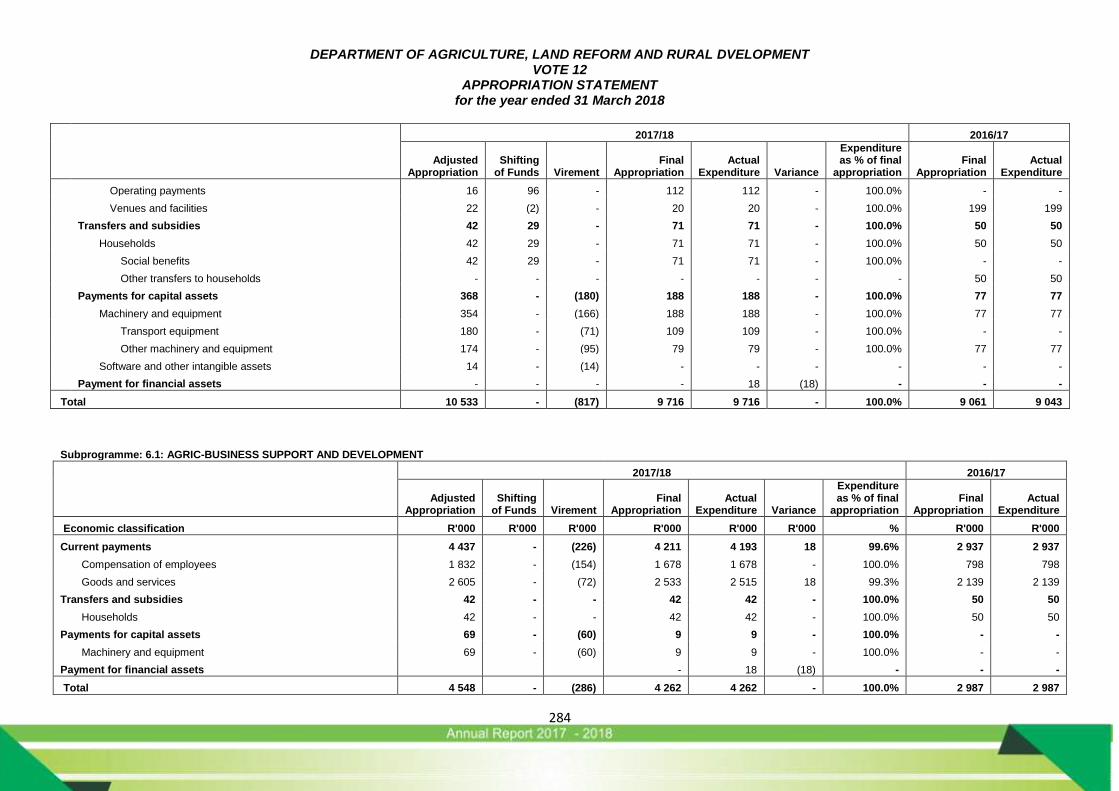
DEPARTMENT OF AGRICULTURE, LAND REFORM AND RURAL DVELOPMENT VOTE 12
APPROPRIATION STATEMENT for the year ended 31 March 2018
284
2017/18 2016/17
Adjusted
Appropriation Shifting of Funds
Virement
Final Appropriation
Actual Expenditure
Variance
Expenditure as % of final
appropriation Final
Appropriation Actual
Expenditure
Operating payments 16 96 - 112 112 - 100.0% - -
Venues and facilities 22 (2) - 20 20 - 100.0% 199 199
Transfers and subsidies 42 29 - 71 71 - 100.0% 50 50
Households 42 29 - 71 71 - 100.0% 50 50
Social benefits 42 29 - 71 71 - 100.0% - -
Other transfers to households - - - - - - - 50 50
Payments for capital assets 368 - (180) 188 188 - 100.0% 77 77
Machinery and equipment 354 - (166) 188 188 - 100.0% 77 77
Transport equipment 180 - (71) 109 109 - 100.0% - -
Other machinery and equipment 174 - (95) 79 79 - 100.0% 77 77
Software and other intangible assets 14 - (14) - - - - - -
Payment for financial assets - - - - 18 (18) - - -
Total 10 533 - (817) 9 716 9 716 - 100.0% 9 061 9 043
Subprogramme: 6.1: AGRIC-BUSINESS SUPPORT AND DEVELOPMENT
2017/18 2016/17
Adjusted
Appropriation Shifting of Funds
Virement
Final Appropriation
Actual Expenditure
Variance
Expenditure as % of final
appropriation Final
Appropriation Actual
Expenditure
Economic classification R'000 R'000 R'000 R'000 R'000 R'000 % R'000 R'000
Current payments 4 437 - (226) 4 211 4 193 18 99.6% 2 937 2 937
Compensation of employees 1 832 - (154) 1 678 1 678 - 100.0% 798 798
Goods and services 2 605 - (72) 2 533 2 515 18 99.3% 2 139 2 139
Transfers and subsidies 42 - - 42 42 - 100.0% 50 50
Households 42 - - 42 42 - 100.0% 50 50
Payments for capital assets 69 - (60) 9 9 - 100.0% - -
Machinery and equipment 69 - (60) 9 9 - 100.0% - -
Payment for financial assets - 18 (18) - - -
Total 4 548 - (286) 4 262 4 262 - 100.0% 2 987 2 987

DEPARTMENT OF AGRICULTURE, LAND REFORM AND RURAL DVELOPMENT VOTE 12
APPROPRIATION STATEMENT for the year ended 31 March 2018
285
Subprogramme: 6.2: MACROECONOMICS SUPPORT
2017/18 2016/17
Adjusted
Appropriation Shifting of Funds
Virement
Final Appropriation
Actual Expenditure
Variance
Expenditure as % of final
appropriation Final
Appropriation Actual
Expenditure
Economic classification R'000 R'000 R'000 R'000 R'000 R'000 % R'000 R'000
Current payments 5 686 (29) (411) 5 246 5 246 - 100.0% 5 997 5 979
Compensation of employees 5 069 (357) (411) 4 301 4 301 - 100.0% 5 076 5 058
Goods and services 617 328 - 945 945 - 100.0% 921 921
Transfers and subsidies - 29 - 29 29 - 100.0% - -
Households - 29 - 29 29 - 100.0% - -
Payments for capital assets 299 - (120) 179 179 - 100.0% 77 77
Machinery and equipment 285 - (106) 179 179 - 100.0% 77 77
Software and other intangible assets 14 - (14) - - - - -
Total 5 985 - (531) 5 454 5 454 - 100.0% 6 074 6 056
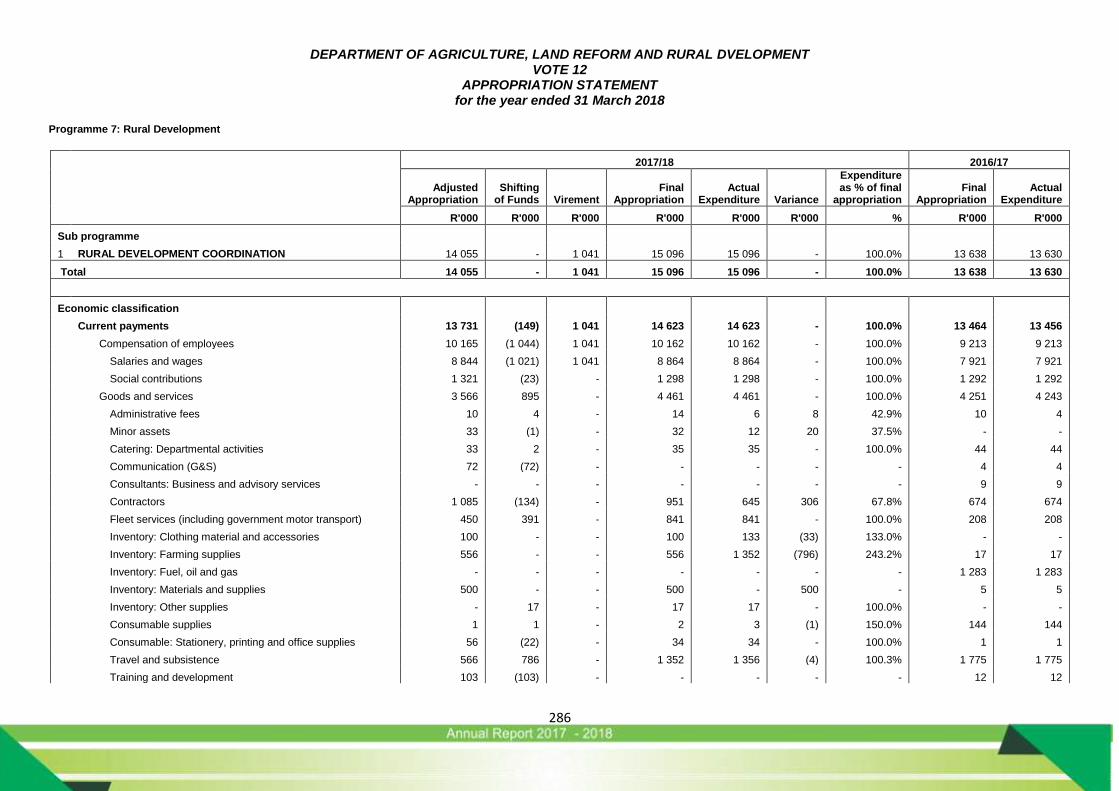
DEPARTMENT OF AGRICULTURE, LAND REFORM AND RURAL DVELOPMENT VOTE 12
APPROPRIATION STATEMENT for the year ended 31 March 2018
286
Programme 7: Rural Development
2017/18 2016/17
Adjusted
Appropriation Shifting of Funds
Virement
Final Appropriation
Actual Expenditure
Variance
Expenditure as % of final
appropriation Final
Appropriation Actual
Expenditure
R'000 R'000 R'000 R'000 R'000 R'000 % R'000 R'000
Sub programme
1 RURAL DEVELOPMENT COORDINATION 14 055 - 1 041 15 096 15 096 - 100.0% 13 638 13 630
Total 14 055 - 1 041 15 096 15 096 - 100.0% 13 638 13 630
Economic classification
Current payments 13 731 (149) 1 041 14 623 14 623 - 100.0% 13 464 13 456
Compensation of employees 10 165 (1 044) 1 041 10 162 10 162 - 100.0% 9 213 9 213
Salaries and wages 8 844 (1 021) 1 041 8 864 8 864 - 100.0% 7 921 7 921
Social contributions 1 321 (23) - 1 298 1 298 - 100.0% 1 292 1 292
Goods and services 3 566 895 - 4 461 4 461 - 100.0% 4 251 4 243
Administrative fees 10 4 - 14 6 8 42.9% 10 4
Minor assets 33 (1) - 32 12 20 37.5% - -
Catering: Departmental activities 33 2 - 35 35 - 100.0% 44 44
Communication (G&S) 72 (72) - - - - - 4 4
Consultants: Business and advisory services - - - - - - - 9 9
Contractors 1 085 (134) - 951 645 306 67.8% 674 674
Fleet services (including government motor transport) 450 391 - 841 841 - 100.0% 208 208
Inventory: Clothing material and accessories 100 - - 100 133 (33) 133.0% - -
Inventory: Farming supplies 556 - - 556 1 352 (796) 243.2% 17 17
Inventory: Fuel, oil and gas - - - - - - - 1 283 1 283
Inventory: Materials and supplies 500 - - 500 - 500 - 5 5
Inventory: Other supplies - 17 - 17 17 - 100.0% - -
Consumable supplies 1 1 - 2 3 (1) 150.0% 144 144
Consumable: Stationery, printing and office supplies 56 (22) - 34 34 - 100.0% 1 1
Travel and subsistence 566 786 - 1 352 1 356 (4) 100.3% 1 775 1 775
Training and development 103 (103) - - - - - 12 12
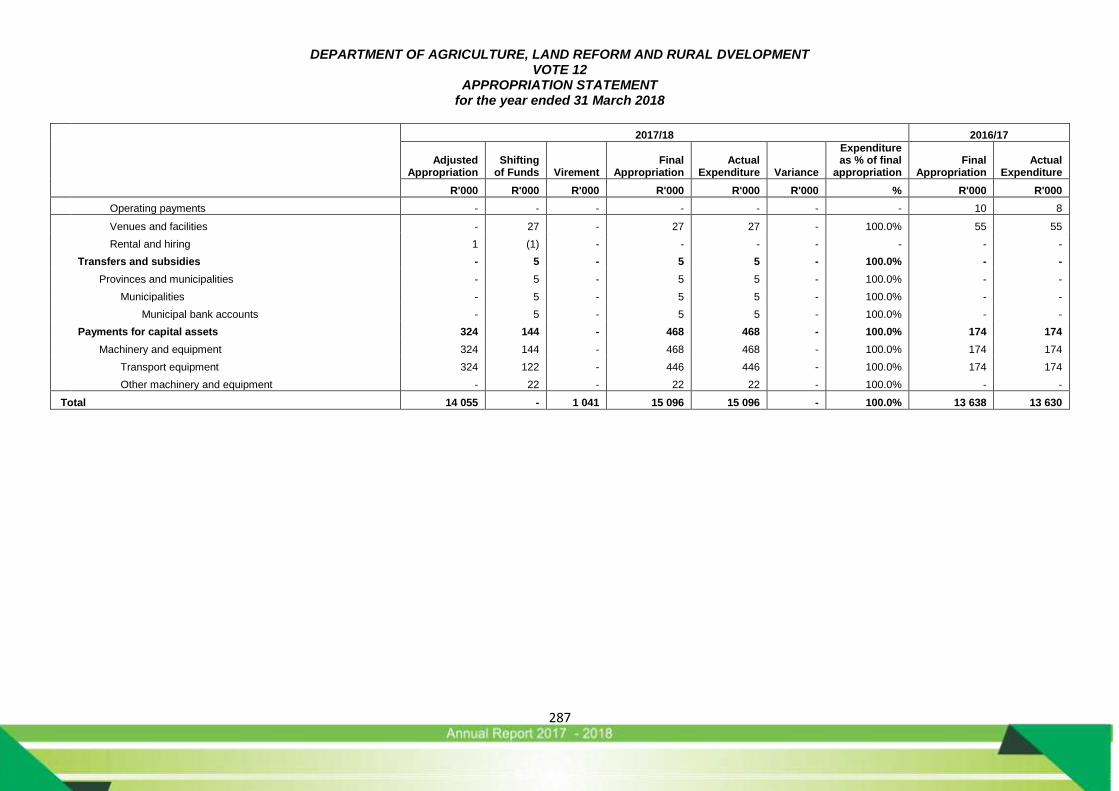
DEPARTMENT OF AGRICULTURE, LAND REFORM AND RURAL DVELOPMENT VOTE 12
APPROPRIATION STATEMENT for the year ended 31 March 2018
287
2017/18 2016/17
Adjusted
Appropriation Shifting of Funds
Virement
Final Appropriation
Actual Expenditure
Variance
Expenditure as % of final
appropriation Final
Appropriation Actual
Expenditure
R'000 R'000 R'000 R'000 R'000 R'000 % R'000 R'000
Operating payments - - - - - - - 10 8
Venues and facilities - 27 - 27 27 - 100.0% 55 55
Rental and hiring 1 (1) - - - - - - -
Transfers and subsidies - 5 - 5 5 - 100.0% - -
Provinces and municipalities - 5 - 5 5 - 100.0% - -
Municipalities - 5 - 5 5 - 100.0% - -
Municipal bank accounts - 5 - 5 5 - 100.0% - -
Payments for capital assets 324 144 - 468 468 - 100.0% 174 174
Machinery and equipment 324 144 - 468 468 - 100.0% 174 174
Transport equipment 324 122 - 446 446 - 100.0% 174 174
Other machinery and equipment - 22 - 22 22 - 100.0% - -
Total 14 055 - 1 041 15 096 15 096 - 100.0% 13 638 13 630
DEPARTMENT OF AGRICULTURE, LAND REFORM AND RURAL DEVELOPMENT VOTE 12
NOTES TO THE APPROPRIATION STATEMENT
for the year ended 31 March 2018
288
1. Detail of transfers and subsidies as per Appropriation Act (after Virement): Detail of these transactions can be viewed in the note on Transfers and subsidies, disclosure notes and Annexure 1 (A-C) to the Annual Financial Statements.
2. Detail of specifically and exclusively appropriated amounts voted (after Virement): Detail of these transactions can be viewed in note 1 (Annual Appropriation) to the Annual Financial Statements.
3. Detail on payments for financial assets Detail of these transactions per programme can be viewed in the note on Payments for financial assets to the Annual Financial Statements.
4. Explanations of material variances from Amounts Voted (after Virement):
4.1 Per programme: Final
Appropriation Actual
Expenditure Variance
Variance as a %
of Final Approp.
R’000 R’000 R’000 %
Sustainable Resource Management 32 623 29 377 3 246 10.0%
The unspent funds relate to the LandCare conditional grant and the Equitable Share that were committed but not spent. Roll-over of these funds were requested.
Farmer Support & Development 351 702 335 137 16 565 4.7%
The unspent funds relate to the CASP conditional grant that were committed but not spent before the end of the financial year. Roll-over of these funds were requested.
4.2 Per economic classification: Final
Appropriation Actual
Expenditure Variance
Variance as a %
of Final Approp.
R’000 R’000 R’000 %
Current expenditure
Compensation of employees 221 535 221 535 - 0%
Goods and services 192 689 175 502 17 187 9%
Interest and rent on land - 1 (1) -
Transfers and subsidies Provinces and municipalities 43 43 - 0%
Departmental agencies and accounts
8 370 8 370 - 0%
Public corporations and private enterprises
9 600 9 600 - 0%
Households 3 224 3 249 (25) (1%)
Payments for capital assets
Buildings and other fixed structures
168 198 168 180 18 0%
Machinery and equipment 16 791 14 039 2 752 16% Biological assets 730 730 - 0%
Software and other intangible assets
2 933 2 933 - 0%
Payments for financial assets - 119 (119) 100%
DEPARTMENT OF AGRICULTURE, LAND REFORM AND RURAL DEVELOPMENT VOTE 12
NOTES TO THE APPROPRIATION STATEMENT
for the year ended 31 March 2018
289
4.3 Per conditional grant
Final Appropriation
Actual Expenditure Variance
Variance as a %
of Final Approp.
R’000 R’000 R’000 %
DAFF-CASP 244 381 227 836 16 545 7%
DAFF-Land Care 7 094 6 621 473 7%
DAFF-Ilima/Letsema 61 680 61 675 5 0%
Public Works-EPWP Incentive Grant 2 044 2 044 - 0%
The unspent funds related to the LandCare and CASP conditional grants were committed but not spent. Roll-over of these funds were requested.
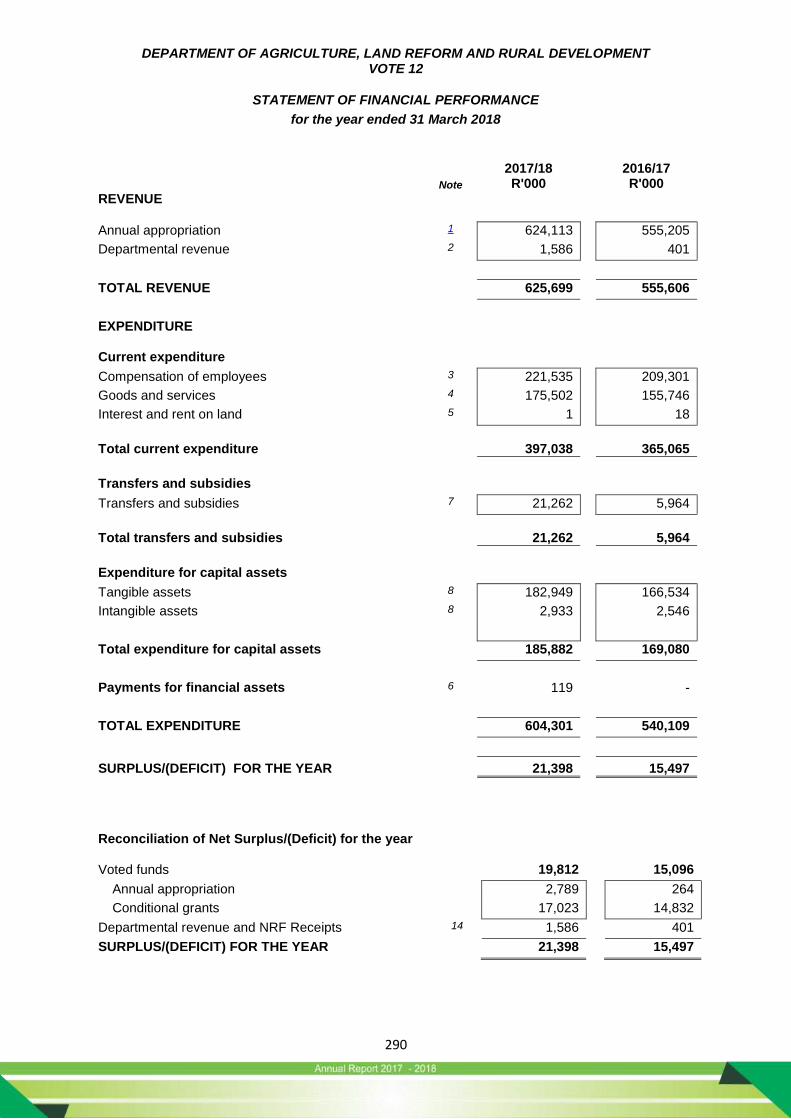
DEPARTMENT OF AGRICULTURE, LAND REFORM AND RURAL DEVELOPMENT VOTE 12
STATEMENT OF FINANCIAL PERFORMANCE
for the year ended 31 March 2018
290
Note
2017/18 R'000
2016/17 R'000
REVENUE
Annual appropriation 1 624,113 555,205
Departmental revenue 2 1,586 401
TOTAL REVENUE 625,699 555,606
EXPENDITURE
Current expenditure
Compensation of employees 3 221,535 209,301
Goods and services 4 175,502 155,746
Interest and rent on land 5 1 18
Total current expenditure
397,038
365,065
Transfers and subsidies
Transfers and subsidies 7 21,262 5,964
Total transfers and subsidies
21,262
5,964
Expenditure for capital assets
Tangible assets 8 182,949 166,534
Intangible assets 8 2,933 2,546
Total expenditure for capital assets 185,882 169,080
Payments for financial assets 6 119 -
TOTAL EXPENDITURE 604,301 540,109
SURPLUS/(DEFICIT) FOR THE YEAR 21,398 15,497
Reconciliation of Net Surplus/(Deficit) for the year
Voted funds 19,812 15,096
Annual appropriation 2,789 264
Conditional grants 17,023 14,832
Departmental revenue and NRF Receipts 14 1,586 401
SURPLUS/(DEFICIT) FOR THE YEAR 21,398 15,497
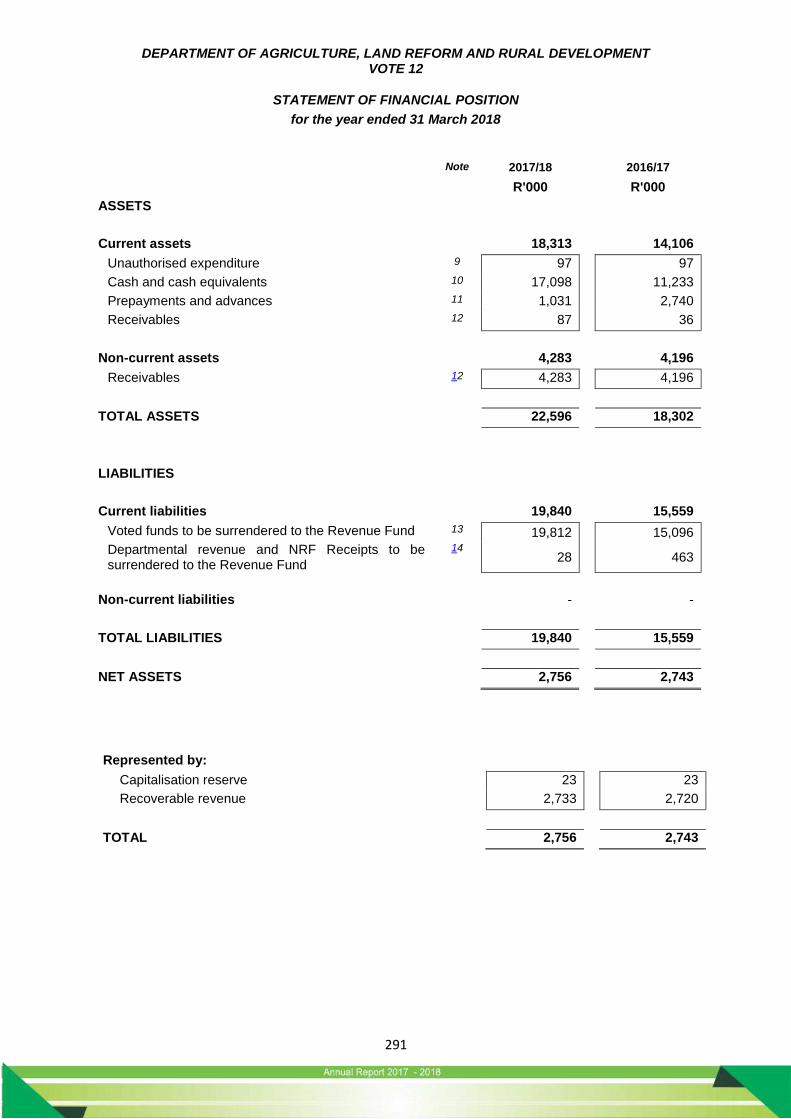
DEPARTMENT OF AGRICULTURE, LAND REFORM AND RURAL DEVELOPMENT VOTE 12
STATEMENT OF FINANCIAL POSITION
for the year ended 31 March 2018
291
Note 2017/18 2016/17
R'000 R'000
ASSETS
Current assets 18,313 14,106
Unauthorised expenditure 9 97 97
Cash and cash equivalents 10 17,098 11,233
Prepayments and advances 11 1,031 2,740
Receivables 12 87 36
Non-current assets 4,283 4,196
Receivables 12 4,283 4,196
TOTAL ASSETS 22,596 18,302
LIABILITIES
Current liabilities 19,840 15,559
Voted funds to be surrendered to the Revenue Fund 13 19,812 15,096
Departmental revenue and NRF Receipts to be surrendered to the Revenue Fund
14 28 463
Non-current liabilities - -
TOTAL LIABILITIES 19,840 15,559
NET ASSETS 2,756 2,743
Represented by:
Capitalisation reserve 23 23
Recoverable revenue 2,733 2,720
TOTAL 2,756 2,743

DEPARTMENT OF AGRICULTURE, LAND REFORM AND RURAL DEVELOPMENT VOTE 12
STATEMENT OF CHANGES IN NET ASSETS
for the year ended 31 March 2018
292
Note 2017/18 2016/17
R'000 R'000
Capitalisation Reserves
Opening balance 23 23
Transfers: - -
Movement in Equity - -
Movement in Operational Funds - -
Other movements - -
Closing balance 23 23
Recoverable revenue
Opening balance 2,720 2,708
Transfers: 13 12
Debts revised - -
Debts raised 13 12
Closing balance 2,733 2,720
TOTAL 2,756 2,743
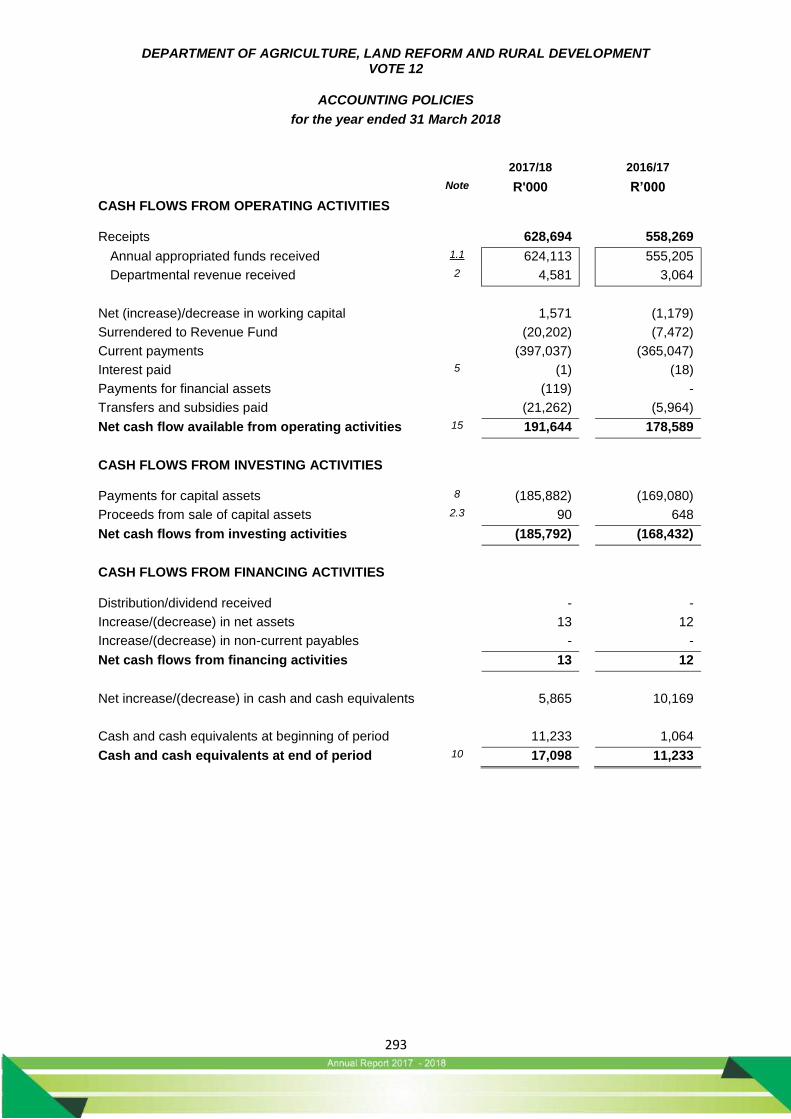
DEPARTMENT OF AGRICULTURE, LAND REFORM AND RURAL DEVELOPMENT VOTE 12
ACCOUNTING POLICIES
for the year ended 31 March 2018
293
2017/18 2016/17
Note R'000 R’000
CASH FLOWS FROM OPERATING ACTIVITIES
Receipts 628,694 558,269
Annual appropriated funds received 1.1 624,113 555,205
Departmental revenue received 2 4,581 3,064
Net (increase)/decrease in working capital 1,571 (1,179)
Surrendered to Revenue Fund (20,202) (7,472)
Current payments (397,037) (365,047)
Interest paid 5 (1) (18)
Payments for financial assets (119) -
Transfers and subsidies paid (21,262) (5,964)
Net cash flow available from operating activities 15 191,644 178,589
CASH FLOWS FROM INVESTING ACTIVITIES
Payments for capital assets 8 (185,882) (169,080)
Proceeds from sale of capital assets 2.3 90 648
Net cash flows from investing activities (185,792) (168,432)
CASH FLOWS FROM FINANCING ACTIVITIES
Distribution/dividend received - -
Increase/(decrease) in net assets 13 12
Increase/(decrease) in non-current payables - -
Net cash flows from financing activities 13 12
Net increase/(decrease) in cash and cash equivalents 5,865 10,169
Cash and cash equivalents at beginning of period 11,233 1,064
Cash and cash equivalents at end of period 10 17,098 11,233
DEPARTMENT OF AGRICULTURE, LAND REFORM AND RURAL DEVELOPMENT VOTE 12
ACCOUNTING POLICIES
for the year ended 31 March 2018
294
Summary of significant accounting policies
The financial statements have been prepared in accordance with the following policies, which have been applied consistently in all material aspects, unless otherwise indicated. Management has concluded that the financial statements present fairly the department’s primary and secondary information.
The historical cost convention has been used, except where otherwise indicated. Management has used assessments and estimates in preparing the annual financial statements. These are based on the best information available at the time of preparation.
Where appropriate and meaningful, additional information has been disclosed to enhance the
usefulness of the financial statements and to comply with the statutory requirements of the Public
Finance Management Act (PFMA), Act 1 of 1999 (as amended by Act 29 of 1999), and the Treasury
Regulations issued in terms of the PFMA and the annual Division of Revenue Act.
1 Basis of preparation
The financial statements have been prepared in accordance with the Modified Cash
Standard.
2 Going concern
The financial statements have been prepared on a going concern basis.
3 Presentation currency
Amounts have been presented in the currency of the South African Rand (R) which is also
the functional currency of the Department.
4 Rounding
Unless otherwise stated financial figures have been rounded to the nearest one thousand
Rand (R’000).
5 Foreign currency translation
Cash flows arising from foreign currency transactions are translated into South African Rands
using the spot exchange rates prevailing at the date of payment / receipt.
6 Comparative information
6.1 Prior period comparative information
Prior period comparative information has been presented in the current year’s financial
statements. Where necessary figures included in the prior period financial statements have
been reclassified to ensure that the format in which the information is presented is consistent
with the format of the current year’s financial statements.
6.2 Current year comparison with budget
A comparison between the approved, final budget and actual amounts for each programme
and economic classification is included in the appropriation statement.
DEPARTMENT OF AGRICULTURE, LAND REFORM AND RURAL DEVELOPMENT VOTE 12
ACCOUNTING POLICIES
for the year ended 31 March 2018
295
7 Revenue
7.1 Appropriated funds
Appropriated funds comprises of Departmental allocations as well as direct charges against
the revenue fund (i.e. statutory appropriation).
Appropriated funds are recognised in the statement of financial performance on the date the
appropriation becomes effective. Adjustments made in terms of the adjustments budget
process are recognised in the statement of financial performance on the date the adjustments
become effective.
The net amount of any appropriated funds due to / from the relevant revenue fund at the
reporting date is recognised as a payable / receivable in the statement of financial position.
7.2 Departmental revenue
Departmental revenue is recognised in the statement of financial performance when received
and is subsequently paid into the relevant revenue fund, unless stated otherwise.
Any amount owing to the relevant revenue fund at the reporting date is recognised as a
payable in the statement of financial position.
7.3 Accrued Departmental revenue
Accruals in respect of Departmental revenue (excluding tax revenue) are recorded in the
notes to the financial statements when:
it is probable that the economic benefits or service potential associated with the transaction will flow to the Department; and
the amount of revenue can be measured reliably.
The accrued revenue is measured at the fair value of the consideration receivable.
Accrued tax revenue (and related interest and / penalties) is measured at amounts receivable
from collecting agents.
Write-offs are made according to the Department’s debt write-off policy.
8 Expenditure
8.1 Compensation of employees
8.1.1 Salaries and wages
Salaries and wages are recognised in the statement of financial performance on the date of
payment.
8.1.2 Social contributions
Social contributions made by the Department in respect of current employees are recognised
in the statement of financial performance on the date of payment.
Social contributions made by the Department in respect of ex-employees are classified as
transfers to households in the statement of financial performance on the date of payment.
8.2 Other expenditure

DEPARTMENT OF AGRICULTURE, LAND REFORM AND RURAL DEVELOPMENT VOTE 12
ACCOUNTING POLICIES
for the year ended 31 March 2018
296
Other expenditure (such as goods and services, transfers and subsidies and payments for
capital assets) is recognised in the statement of financial performance on the date of
payment. The expense is classified as a capital expense if the total consideration paid is
more than the capitalisation threshold. Wages paid to Departmental projects are recognised
in the statement of financial performance on the date of payment to the project.
8.3 Accruals and payables not recognised
Accruals and payables not recognised are recorded in the notes to the financial statements
when the goods are received or, in the case of services, when they are rendered to the
Department or in the case of transfers and subsidies when they are due and payable.
Accruals and payables not recognised are measured at cost.
8.4 Leases
8.4.1 Operating leases
Operating lease payments made during the reporting period are recognised as current
expenditure in the statement of financial performance on the date of payment.
The operating lease commitments are recorded in the notes to the financial statements.
8.4.2 Finance leases
Finance lease payments made during the reporting period are recognised as capital
expenditure in the statement of financial performance on the date of payment.
The finance lease commitments are recorded in the notes to the financial statements and are
not apportioned between the capital and interest portions.
Finance lease assets acquired at the end of the lease term are recorded and measured at
the lower of:
cost, being the fair value of the asset; or
the sum of the minimum lease payments made, including any payments made to acquire
ownership at the end of the lease term, excluding interest.
9 Cash and cash equivalents
Cash and cash equivalents are stated at cost in the statement of financial position.
Bank overdrafts are shown separately on the face of the statement of financial position as a
current liability.
For the purposes of the cash flow statement, cash and cash equivalents comprise cash on
hand, deposits held, other short-term highly liquid investments and bank overdrafts.
10 Prepayments and advances
Prepayments and advances are recognised in the statement of financial position when the
Department receives or disburses the cash. Prepayments and advances are initially and
DEPARTMENT OF AGRICULTURE, LAND REFORM AND RURAL DEVELOPMENT VOTE 12
ACCOUNTING POLICIES
for the year ended 31 March 2018
297
subsequently measured at cost. Prepayments are expensed when the services are rendered
or goods delivered.
11 Loans and receivables
Loans and receivables are recognised in the statement of financial position at cost plus
accrued interest, where interest is charged, less amounts already settled or written-off.
Write-offs are made according to the Department’s write-off policy.
12 Financial assets
12.1 Financial assets (not covered elsewhere)
A financial asset is recognised initially at its cost plus transaction costs that are directly
attributable to the acquisition or issue of the financial asset. At the reporting date, a
department shall measure its financial assets at cost, less amounts already settled or written-
off, except for recognised loans and receivables, which are measured at cost plus accrued
interest, where interest is charged, less amounts already settled or written-off.
12.2 Impairment of financial assets
Where there is an indication of impairment of a financial asset, an estimation of the reduction
in the recorded carrying value, to reflect the best estimate of the amount of the future
economic benefits expected to be received from that asset, is recorded in the notes to the
financial statements.
13 Payables
Loans and payables are recognised in the statement of financial position at cost.
14 Capital Assets
14.1 Immovable capital assets
Immovable capital assets reflected in the asset register of the Department are initially
recorded in the notes to the financial statements at cost. Immovable capital assets acquired
through a non-exchange transaction are recorded at fair value as at the date of acquisition.
Where the cost of immovable capital assets cannot be determined reliably, the immovable
capital assets are measured at fair value for recording in the asset register. Immovable
capital assets are subsequently carried at cost and are not subject to depreciation or
impairment.
Subsequent expenditure that is of a capital nature forms part of the cost of the asset at the
end of the capital project unless the immovable asset is recorded by another department in
which case the completed project costs are transferred to that department.
14.2 Movable capital assets
Movable capital assets are initially recorded in the notes to the financial statements at cost.
Movable capital assets acquired through a non-exchange transaction is measured at fair
value as at the date of acquisition.
DEPARTMENT OF AGRICULTURE, LAND REFORM AND RURAL DEVELOPMENT VOTE 12
ACCOUNTING POLICIES
for the year ended 31 March 2018
298
Where the cost of movable capital assets cannot be determined reliably, the movable capital
assets are measured at fair value and where fair value cannot be determined; the movable
assets are measured at R1.
All assets acquired prior to 1 April 2002 (or a later date as approved by the OAG) may be
recorded at R1.
Movable capital assets are subsequently carried at cost and are not subject to depreciation
or impairment.
Biological assets are subsequently carried at fair value. Subsequent expenditure that is of a
capital nature is added to the cost of the asset at the end of the capital project unless the
movable asset is recorded by another department/entity in which case the completed project
costs are transferred to that department.
14.3 Intangible assets
Intangible assets are initially recorded in the notes to the financial statements at cost.
Intangible assets acquired through a non-exchange transaction are measured at fair value
as at the date of acquisition.
Internally generated intangible assets are recorded in the notes to the financial statements
when the Department commences the development phase of the project.
Where the cost of intangible assets cannot be determined reliably, the intangible capital
assets are measured at fair value and where fair value cannot be determined; the intangible
assets are measured at R1.
All assets acquired prior to 1 April 2002 (or a later date as approved by the OAG) may be
recorded at R1.
Intangible assets are subsequently carried at cost and are not subject to depreciation or
impairment.
Subsequent expenditure that is of a capital nature is added to the cost of the asset at the end
of the capital project unless the intangible asset is recorded by another department/entity in
which case the completed project costs are transferred to that department.
14.4 Project Costs: Work-in-progress
Expenditure of a capital nature is initially recognised in the statement of financial performance
at cost when paid.
Amounts paid towards capital projects are separated from the amounts recognised and
accumulated in work-in-progress until the underlying asset is ready for use. Once ready for
use, the total accumulated payments are recorded in an asset register. Subsequent
payments to complete the project are added to the capital asset in the asset register. Where
the Department is not the custodian of the completed project asset, the asset is transferred
to the custodian subsequent to completion.
15 Provisions and Contingents
15.1 Provisions
Provisions are recorded in the notes to the financial statements when there is a present legal
or constructive obligation to forfeit economic benefits as a result of events in the past and it
DEPARTMENT OF AGRICULTURE, LAND REFORM AND RURAL DEVELOPMENT VOTE 12
ACCOUNTING POLICIES
for the year ended 31 March 2018
299
is probable that an outflow of resources embodying economic benefits or service potential
will be required to settle the obligation and a reliable estimate of the obligation can be made.
The provision is measured as the best estimate of the funds required to settle the present
obligation at the reporting date.
15.2 Contingent liabilities
Contingent liabilities are recorded in the notes to the financial statements when there is a
possible obligation that arises from past events, and whose existence will be confirmed only
by the occurrence or non-occurrence of one or more uncertain future events not within the
control of the Department or when there is a present obligation that is not recognised because
it is not probable that an outflow of resources will be required to settle the obligation or the
amount of the obligation cannot be measured reliably.
15.3 Contingent assets
Contingent assets are recorded in the notes to the financial statements when a possible asset
arises from past events, and whose existence will be confirmed by the occurrence or non-
occurrence of one or more uncertain future events not within the control of the Department.
15.4 Commitments
Commitments (other than for transfers and subsidies) are recorded at cost in the notes to the
financial statements when there is a contractual arrangement or an approval by management
in a manner that raises a valid expectation that the Department will discharge its
responsibilities thereby incurring future expenditure that will result in the outflow of cash.
16 Unauthorised expenditure
Unauthorised expenditure is recognised in the statement of financial position until such time
as the expenditure is either:
approved by Parliament or the Provincial Legislature with funding and the related funds
are received; or
approved by Parliament or the Provincial Legislature without funding and is written off
against the appropriation in the statement of financial performance; or
transferred to receivables for recovery.
Unauthorised expenditure is measured at the amount of the confirmed unauthorised
expenditure.
17 Fruitless and wasteful expenditure
Fruitless and wasteful expenditure is recorded in the notes to the financial statements when
confirmed. The amount recorded is equal to the total value of the fruitless and or wasteful
expenditure incurred.
Fruitless and wasteful expenditure is removed from the notes to the financial statements
when it is resolved or transferred to receivables for recovery.

DEPARTMENT OF AGRICULTURE, LAND REFORM AND RURAL DEVELOPMENT VOTE 12
ACCOUNTING POLICIES
for the year ended 31 March 2018
300
Fruitless and wasteful expenditure receivables are measured at the amount that is expected
to be recoverable and are de-recognised when settled or subsequently written-off as
irrecoverable.
18 Irregular expenditure
Irregular expenditure is recorded in the notes to the financial statements when confirmed.
The amount recorded is equal to the value of the irregular expenditure incurred unless it is
impracticable to determine, in which case reasons therefor are provided in the note.
Irregular expenditure is removed from the note when it is either condoned by the relevant
authority, transferred to receivables for recovery or not condoned and is not recoverable.
Irregular expenditure receivables are measured at the amount that is expected to be
recoverable and are de-recognised when settled or subsequently written-off as irrecoverable.
19 Changes in accounting policies, accounting estimates and errors
Changes in accounting policies that are effected by management have been applied
retrospectively in accordance with MCS requirements, except to the extent that it is
impracticable to determine the period-specific effects or the cumulative effect of the change
in policy. In such instances the Department shall restate the opening balances of assets,
liabilities and net assets for the earliest period for which retrospective restatement is
practicable.
Changes in accounting estimates are applied prospectively in accordance with MCS
requirements.
Correction of errors is applied retrospectively in the period in which the error has occurred in
accordance with MCS requirements, except to the extent that it is impracticable to determine
the period-specific effects or the cumulative effect of the error. In such cases the Department
shall restate the opening balances of assets, liabilities and net assets for the earliest period
for which retrospective restatement is practicable.
20 Events after the reporting date
Events after the reporting date that are classified as adjusting events have been accounted
for in the financial statements. The events after the reporting date that are classified as non-
adjusting events after the reporting date have been disclosed in the notes to the financial
statements.
21 Principal-Agent arrangements
The Department is party to a principal-agent arrangement with NAMC for the Vineyard
Development Scheme. In terms of the arrangement the Department is the principal and is
responsible for funding the projects implemented by the agent on behalf of the Department.
All related revenues, expenditures, assets and liabilities have been recognised or recorded
in terms of the relevant policies listed herein. Additional disclosures have been provided in
the notes to the financial statements where appropriate.
22 Departures from the MCS requirements

DEPARTMENT OF AGRICULTURE, LAND REFORM AND RURAL DEVELOPMENT VOTE 12
ACCOUNTING POLICIES
for the year ended 31 March 2018
301
Management concluded that the financial statements present fairly the Department’s primary
and secondary information. The Department complied with the Modified Cash Standard in
the preparation of the Annual Financial Statements.
23 Capitalisation reserve
The capitalisation reserve comprises of financial assets and/or liabilities originating in a prior
reporting period but which are recognised in the statement of financial position for the first
time in the current reporting period. Amounts are recognised in the capitalisation reserves
when identified in the current period and are transferred to the National/Provincial Revenue
Fund when the underlying asset is disposed and the related funds are received.
24 Recoverable revenue
Amounts are recognised as recoverable revenue when a payment made in a previous
financial year becomes recoverable from a debtor in the current financial year. Amounts are
either transferred to the National/Provincial Revenue Fund when recovered or are transferred
to the statement of financial performance when written-off.
25 Related party transactions
A related party transaction is a transfer of resources, services or obligations between the
reporting entity and a related party. Related party transactions within the Minister/MEC’s
portfolio are recorded in the notes to the financial statements when the transaction is not at
arm’s length.
Key management personnel are those persons having the authority and responsibility for
planning, directing and controlling the activities of the Department. The number of individuals
and their full compensation is recorded in the notes to the financial statements.
26 Inventories (Effective from date determined in a Treasury Instruction)
At the date of acquisition, inventories are recorded at cost price in the statement of financial
performance.
Where inventories are acquired as part of a non-exchange transaction, the cost of inventory
is its fair value at the date of acquisition.
Inventories are subsequently measured at the lower of cost and net realisable value or where
intended for distribution (or consumed in the production of goods for distribution) at no or a
nominal charge, the lower of cost and current replacement value.
Subsequent measurement of the cost of inventory is determined on the weighted average
cost basis.
27 Employee benefits
The value of each major class of employee benefit obligation (accruals, payables not
recognised and provisions) is disclosed in the Employee benefits note.

DEPARTMENT OF AGRICULTURE, LAND REFORM AND RURAL DEVELOPMENT VOTE 12
NOTES TO THE ANNUAL FINANCIAL STATEMENTS
for the year ended 31 March 2018
302
1. Annual Appropriation 1.1 Annual Appropriation
Included are funds appropriated in terms of the Appropriation Act (and the Adjustments Appropriation Act) for National Departments (Voted funds) and Provincial Departments:
1.2 Conditional grants
2017/18 2016/17
Note R’000 R’000
Total grants received 33 315,199 196,466
2. Departmental revenue 2017/18 2016/17
Note R’000 R’000 Tax revenue
Sales of goods and services other than capital assets 2.1 4,314 2,838
Interest, dividends and rent on land 2.2 104 5
Sales of capital assets 2.3 90 648
Transactions in financial assets and liabilities 2.4 163 221
Total revenue collected 4,671 3,712
Less: Own revenue included in appropriation 14 3,085 3,311
Departmental revenue collected 1,586 401
2017/18 2016/17 Final
Appropriation Actual Funds
Received
Funds not requested /
not received
Final Appropriation
Appropriation received
R’000 R’000 R’000 R’000 R’000 Administration 120,337 120,337 - 118,608 118,608
Sustainable Resource development
32,623 32,623 - 95,698 95,698
Farmer Support & Development
351,702 351,702 - 226,885 226,885
Veterinary Services 50,312 50,312 - 44,659 44,659
Research& Development 44,327 44,327 - 46,656 46,656
Agricultural Economics Services
9,716 9,716 - 9,061 9,061
Rural Development 15,096 15,096 - 13,638 13,638
Total 624,113 624,113 - 555,205 555,205
DEPARTMENT OF AGRICULTURE, LAND REFORM AND RURAL DEVELOPMENT VOTE 12
NOTES TO THE ANNUAL FINANCIAL STATEMENTS
for the year ended 31 March 2018
303
2.1 Sales of goods and services other than capital assets 2017/18 2016/17
Note R’000 R’000 Sales of goods and services produced by the
department 2 4,078 2,838
Sales by market establishment 503 613
Administrative fees 415 171
Other sales
3,160
2,054
Sales of scrap, waste and other used current goods 236 -
Total 4,314 2,838
Other sales include sales of animals, dates, commission on insurance and garnishees.
2.2 Interest, dividends and rent on land 2017/18 2016/17
Note R’000 R’000
Rent on land 2 104 5
Total 104 5
2.3 Sale of capital assets
2017/18 2016/17
Note R’000 R’000
Tangible assets 2 90 648
Machinery and equipment - 648
Biological Assets 90 -
Total 90 648
2.4 Transactions in financial assets and liabilities 2017/18 2016/17
Note R’000 R’000 Receivables 2 83 77 Other receipts including recoverable revenue 2 80 144
Total 163 221
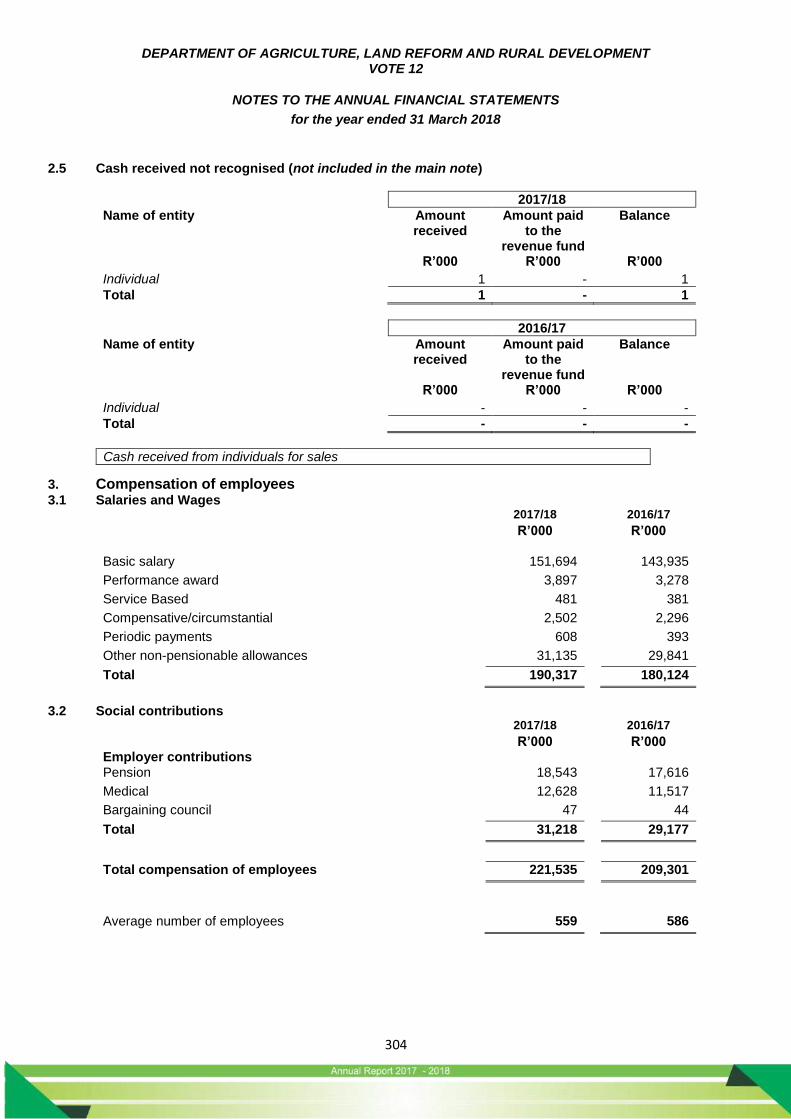
DEPARTMENT OF AGRICULTURE, LAND REFORM AND RURAL DEVELOPMENT VOTE 12
NOTES TO THE ANNUAL FINANCIAL STATEMENTS
for the year ended 31 March 2018
304
2.5 Cash received not recognised (not included in the main note)
2017/18
Name of entity Amount received
Amount paid to the
revenue fund
Balance
R’000 R’000 R’000 Individual 1 - 1
Total 1 - 1
2016/17
Name of entity Amount received
Amount paid to the
revenue fund
Balance
R’000 R’000 R’000 Individual - - -
Total - - -
Cash received from individuals for sales
3. Compensation of employees 3.1 Salaries and Wages
2017/18 2016/17
R’000 R’000 Basic salary 151,694 143,935
Performance award 3,897 3,278
Service Based 481 381
Compensative/circumstantial 2,502 2,296
Periodic payments 608 393
Other non-pensionable allowances 31,135 29,841
Total 190,317 180,124
3.2 Social contributions
2017/18 2016/17
R’000 R’000 Employer contributions Pension 18,543 17,616
Medical 12,628 11,517
Bargaining council 47 44
Total 31,218 29,177
Total compensation of employees 221,535 209,301
Average number of employees 559 586
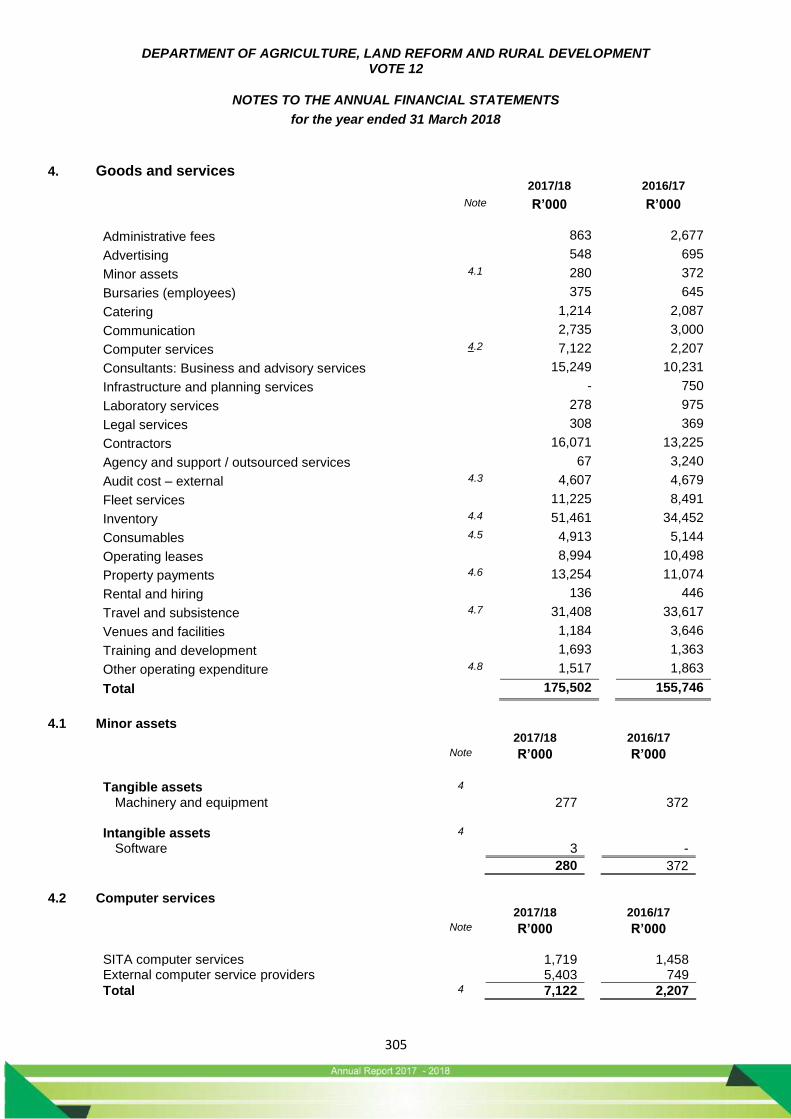
DEPARTMENT OF AGRICULTURE, LAND REFORM AND RURAL DEVELOPMENT VOTE 12
NOTES TO THE ANNUAL FINANCIAL STATEMENTS
for the year ended 31 March 2018
305
4. Goods and services 2017/18 2016/17
Note R’000 R’000
Administrative fees 863 2,677
Advertising 548 695
Minor assets 4.1 280 372
Bursaries (employees) 375 645
Catering 1,214 2,087
Communication 2,735 3,000
Computer services 4.2 7,122 2,207
Consultants: Business and advisory services 15,249 10,231
Infrastructure and planning services - 750
Laboratory services 278 975
Legal services 308 369
Contractors 16,071 13,225
Agency and support / outsourced services 67 3,240
Audit cost – external 4.3 4,607 4,679
Fleet services 11,225 8,491
Inventory 4.4 51,461 34,452
Consumables 4.5 4,913 5,144
Operating leases 8,994 10,498
Property payments 4.6 13,254 11,074
Rental and hiring 136 446
Travel and subsistence 4.7 31,408 33,617
Venues and facilities 1,184 3,646
Training and development 1,693 1,363
Other operating expenditure 4.8 1,517 1,863
Total 175,502 155,746
4.1 Minor assets
2017/18 2016/17
Note R’000
R’000
Tangible assets 4 Machinery and equipment 277 372
Intangible assets 4 Software 3 -
280 372
4.2 Computer services
2017/18 2016/17
Note R’000 R’000
SITA computer services 1,719 1,458 External computer service providers 5,403 749
Total 4 7,122 2,207
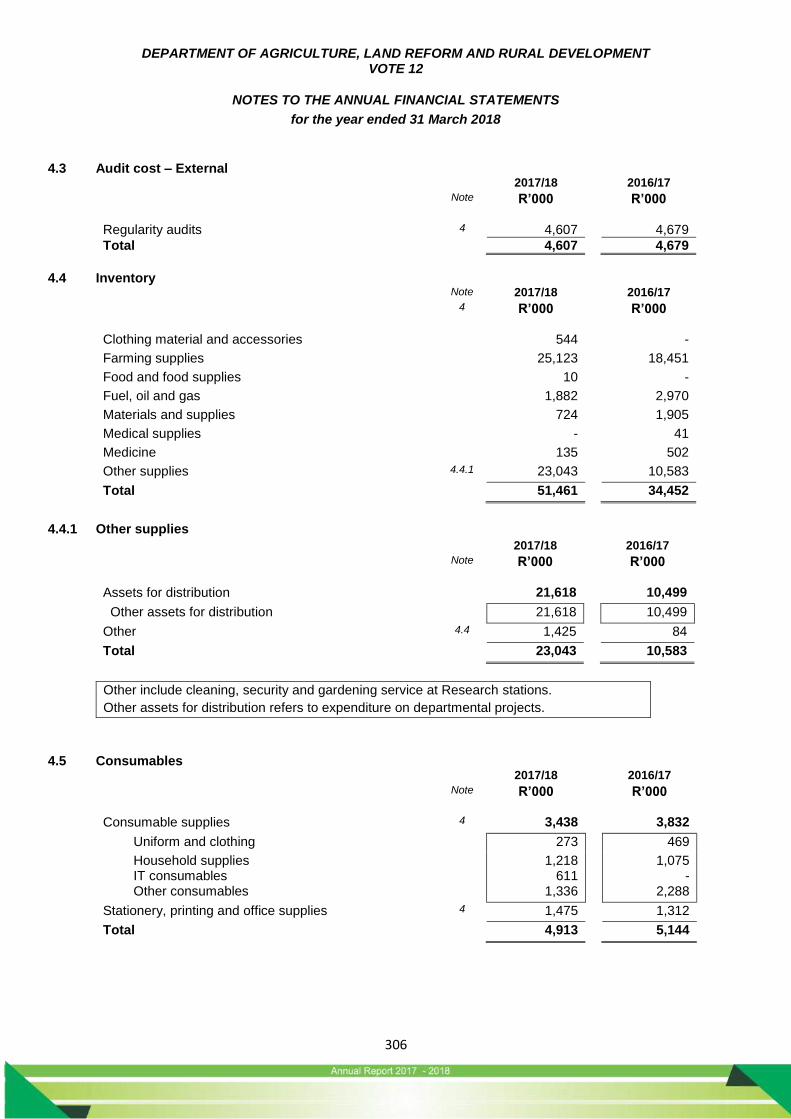
DEPARTMENT OF AGRICULTURE, LAND REFORM AND RURAL DEVELOPMENT VOTE 12
NOTES TO THE ANNUAL FINANCIAL STATEMENTS
for the year ended 31 March 2018
306
4.3 Audit cost – External 2017/18 2016/17
Note R’000 R’000
Regularity audits 4 4,607 4,679
Total 4,607 4,679
4.4 Inventory
Note 2017/18 2016/17
4 R’000 R’000
Clothing material and accessories 544 -
Farming supplies 25,123 18,451
Food and food supplies 10 -
Fuel, oil and gas 1,882 2,970
Materials and supplies 724 1,905
Medical supplies - 41
Medicine 135 502
Other supplies 4.4.1 23,043 10,583
Total 51,461 34,452
4.4.1 Other supplies
2017/18 2016/17
Note R’000 R’000
Assets for distribution 21,618 10,499
Other assets for distribution 21,618 10,499
Other 4.4 1,425 84
Total 23,043 10,583
Other include cleaning, security and gardening service at Research stations.
Other assets for distribution refers to expenditure on departmental projects.
4.5 Consumables 2017/18 2016/17
Note R’000 R’000
Consumable supplies 4 3,438 3,832
Uniform and clothing 273 469
Household supplies IT consumables
1,218 611
1,075 -
Other consumables 1,336 2,288
Stationery, printing and office supplies 4 1,475 1,312
Total 4,913 5,144
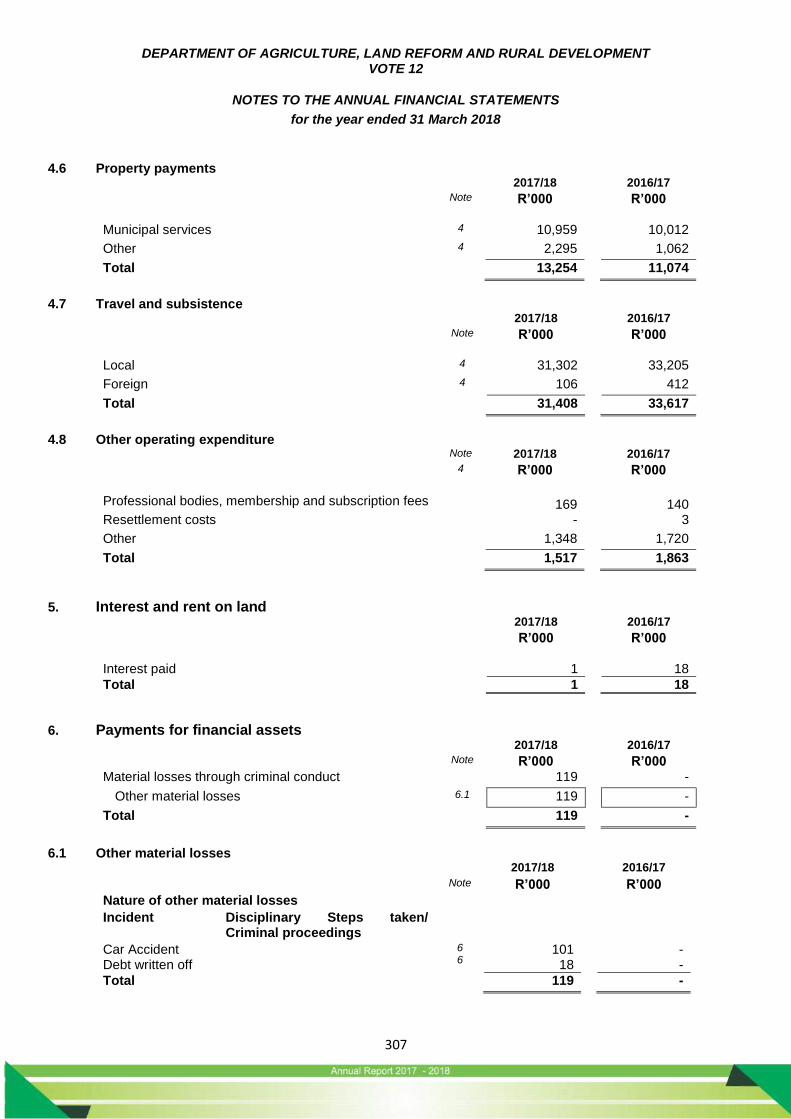
DEPARTMENT OF AGRICULTURE, LAND REFORM AND RURAL DEVELOPMENT VOTE 12
NOTES TO THE ANNUAL FINANCIAL STATEMENTS
for the year ended 31 March 2018
307
4.6 Property payments 2017/18 2016/17
Note R’000 R’000
Municipal services 4 10,959 10,012
Other 4 2,295 1,062
Total 13,254 11,074
4.7 Travel and subsistence
2017/18 2016/17
Note R’000 R’000
Local 4 31,302 33,205
Foreign 4 106 412
Total 31,408 33,617
4.8 Other operating expenditure
Note 2017/18 2016/17
4 R’000 R’000
Professional bodies, membership and subscription fees 169 140 Resettlement costs - 3
Other 1,348 1,720
Total 1,517 1,863
5. Interest and rent on land 2017/18 2016/17
R’000 R’000
Interest paid 1 18
Total 1 18
6. Payments for financial assets 2017/18 2016/17
Note R’000 R’000 Material losses through criminal conduct 119 -
Other material losses 6.1 119 -
Total 119 -
6.1 Other material losses
2017/18 2016/17
Note R’000 R’000
Nature of other material losses
Incident Disciplinary Steps taken/ Criminal proceedings
Car Accident Debt written off
6 6
101 18
- -
Total 119 -

DEPARTMENT OF AGRICULTURE, LAND REFORM AND RURAL DEVELOPMENT VOTE 12
NOTES TO THE ANNUAL FINANCIAL STATEMENTS
for the year ended 31 March 2018
308
7. Transfers and subsidies 2017/18 2016/17
R’000 R’000
Provinces and municipalities 43 119
Departmental agencies and accounts Annex 1A 8,370 2,550
Public corporations and private enterprises Annex 1B 9,600 -
Households Annex 1C 3,249 3,295
Total 21,262 5,964
Unspent funds transferred to the above beneficiaries
Departmental agencies and accounts - 4,688
Total - 4,688
8. Expenditure for capital assets 2017/18 2016/17
Note R’000 R’000 Tangible assets 182,949 166,534
Buildings and other fixed structures 29.1 168,180 153,872
Machinery and equipment 27.1 14,039 11,672
Biological assets 27.1 730 990
Intangible assets 2,933 2,546
Software 28.1 2,933 2,546
Total 185,882 169,080
8.1 Analysis of funds utilised to acquire capital assets – 2017/18
Voted funds Total R’000 R’000
Tangible assets 182,949 182,949
Buildings and other fixed structures 168,180 168,180
Machinery and equipment 14,039 14,039
Biological assets 730 730
Intangible assets 2,933 2,933
Software 2,933 2,933
Total 185,882 185,882
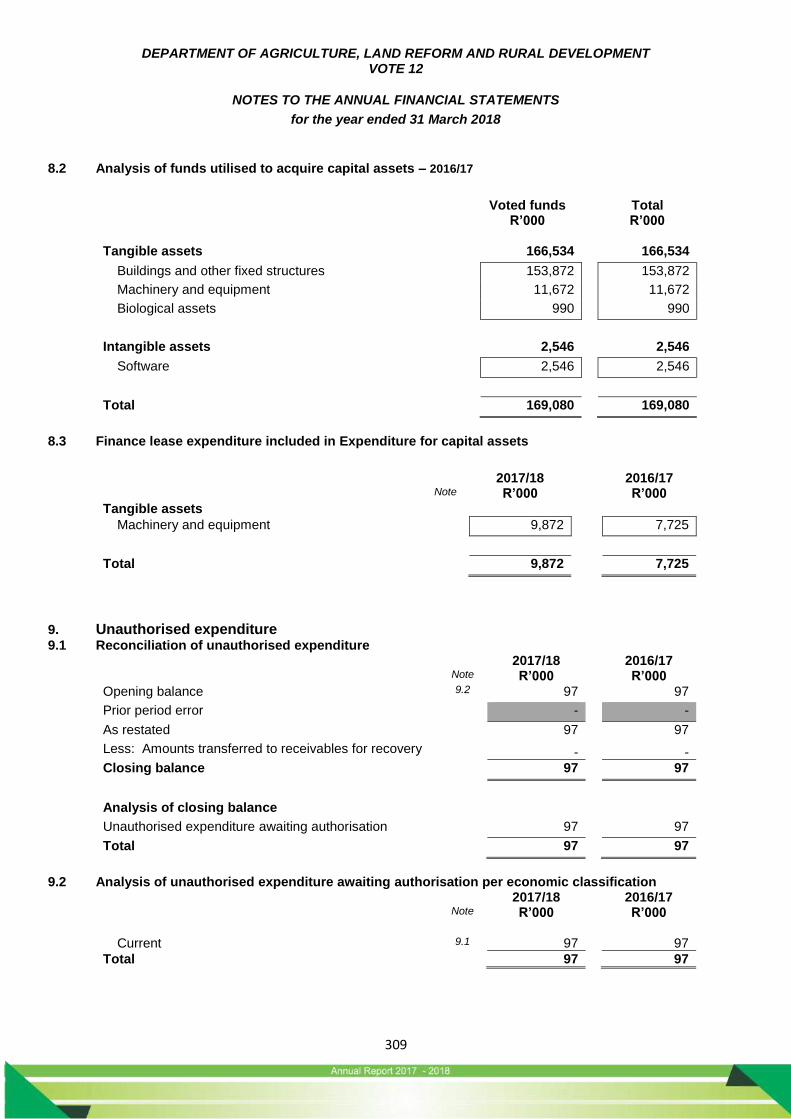
DEPARTMENT OF AGRICULTURE, LAND REFORM AND RURAL DEVELOPMENT VOTE 12
NOTES TO THE ANNUAL FINANCIAL STATEMENTS
for the year ended 31 March 2018
309
8.2 Analysis of funds utilised to acquire capital assets – 2016/17
Voted funds Total R’000 R’000
Tangible assets 166,534 166,534
Buildings and other fixed structures 153,872 153,872
Machinery and equipment 11,672 11,672
Biological assets 990 990
Intangible assets 2,546 2,546
Software 2,546 2,546
Total 169,080 169,080
8.3 Finance lease expenditure included in Expenditure for capital assets
2017/18 2016/17 Note R’000 R’000 Tangible assets
Machinery and equipment 9,872 7,725
Total 9,872 7,725
9. Unauthorised expenditure 9.1 Reconciliation of unauthorised expenditure
2017/18 2016/17 Note R’000 R’000 Opening balance 9.2 97 97
Prior period error - -
As restated 97 97
Less: Amounts transferred to receivables for recovery - -
Closing balance 97 97
Analysis of closing balance
Unauthorised expenditure awaiting authorisation 97 97
Total 97 97
9.2 Analysis of unauthorised expenditure awaiting authorisation per economic classification
2017/18 2016/17 Note R’000 R’000 Current 9.1 97 97
Total 97 97
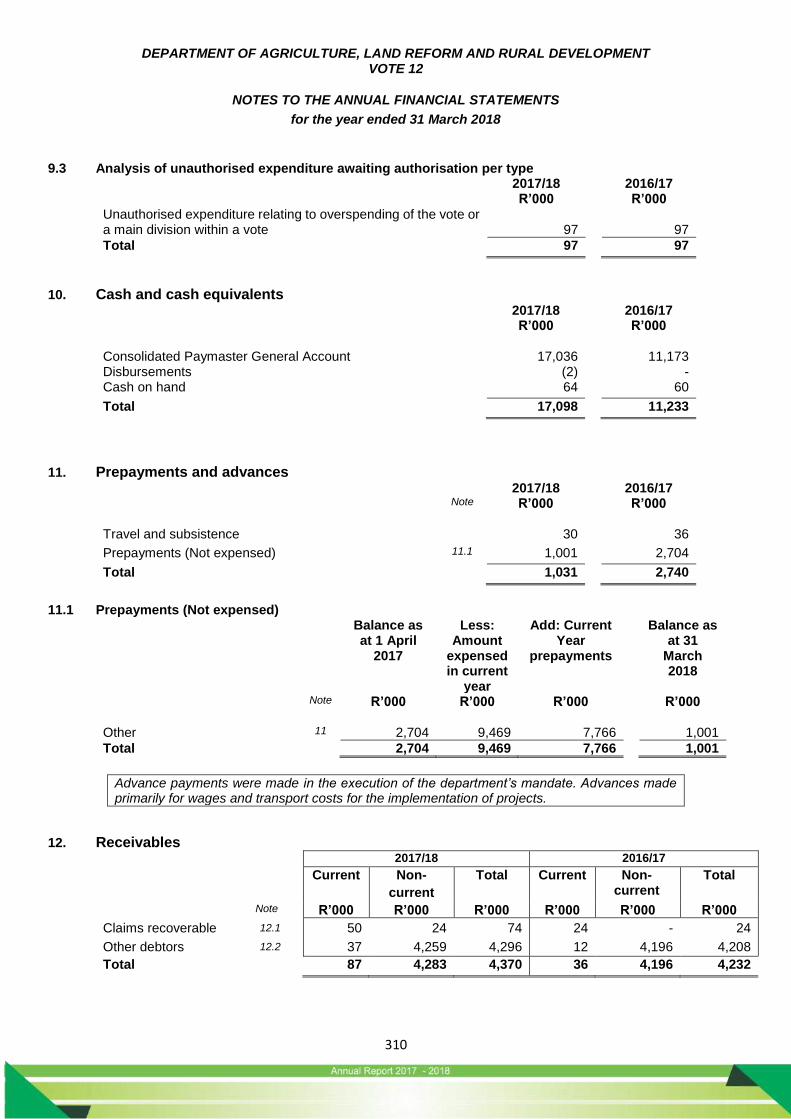
DEPARTMENT OF AGRICULTURE, LAND REFORM AND RURAL DEVELOPMENT VOTE 12
NOTES TO THE ANNUAL FINANCIAL STATEMENTS
for the year ended 31 March 2018
310
9.3 Analysis of unauthorised expenditure awaiting authorisation per type 2017/18 2016/17 R’000 R’000
Unauthorised expenditure relating to overspending of the vote or a main division within a vote 97 97
Total 97 97
10. Cash and cash equivalents 2017/18 2016/17 R’000 R’000
Consolidated Paymaster General Account Disbursements
17,036 (2)
11,173 -
Cash on hand 64 60
Total 17,098 11,233
11. Prepayments and advances 2017/18 2016/17 Note R’000 R’000
Travel and subsistence 30 36
Prepayments (Not expensed) 11.1 1,001 2,704
Total 1,031 2,740
11.1 Prepayments (Not expensed)
Balance as at 1 April
2017
Less: Amount
expensed in current
year
Add: Current Year
prepayments
Balance as at 31
March 2018
Note R’000 R’000 R’000 R’000
Other 11 2,704 9,469 7,766 1,001
Total 2,704 9,469 7,766 1,001
Advance payments were made in the execution of the department’s mandate. Advances made primarily for wages and transport costs for the implementation of projects.
12. Receivables 2017/18 2016/17
Current Non-
current Total Current Non-
current Total
Note R’000 R’000 R’000 R’000 R’000 R’000
Claims recoverable 12.1 50 24 74 24 - 24
Other debtors 12.2 37 4,259 4,296 12 4,196 4,208
Total 87 4,283 4,370 36 4,196 4,232

DEPARTMENT OF AGRICULTURE, LAND REFORM AND RURAL DEVELOPMENT VOTE 12
NOTES TO THE ANNUAL FINANCIAL STATEMENTS
for the year ended 31 March 2018
311
12.1 Claims recoverable 2017/18 2016/17
Note R’000 R’000 National departments 12 & Annex 4 74 24
Total 74 24
12.2 Other debtors 2017/18 2016/17
Note R’000 R’000 Debt Account 4,251 4,188
Tax debt 9 12
Claims recoverable 25 8
GEHS Refund 11 -
Total 12 4,296 4,208
13. Voted funds to be surrendered to the Revenue Fund 2017/18 2016/17
Note R’000 R’000 Opening balance 15,096 3,897
Prior period error - -
As restated 15,096 3,897
Transfer from statement of financial performance (as restated) 19,812 15,096
Paid during the year (15,096) (3,897)
Closing balance 19,812 15,096
14. Departmental revenue and NRF Receipts to be surrendered to the Revenue Fund 2017/18 2016/17
Note R’000 R’000 Opening balance 463 326
Prior period error - -
As restated 463 326
Transfer from Statement of Financial Performance (as restated)
1,586 401
Own revenue included in appropriation 2 3,085 3,311
Paid during the year (5,106) (3,575)
Closing balance 28 463
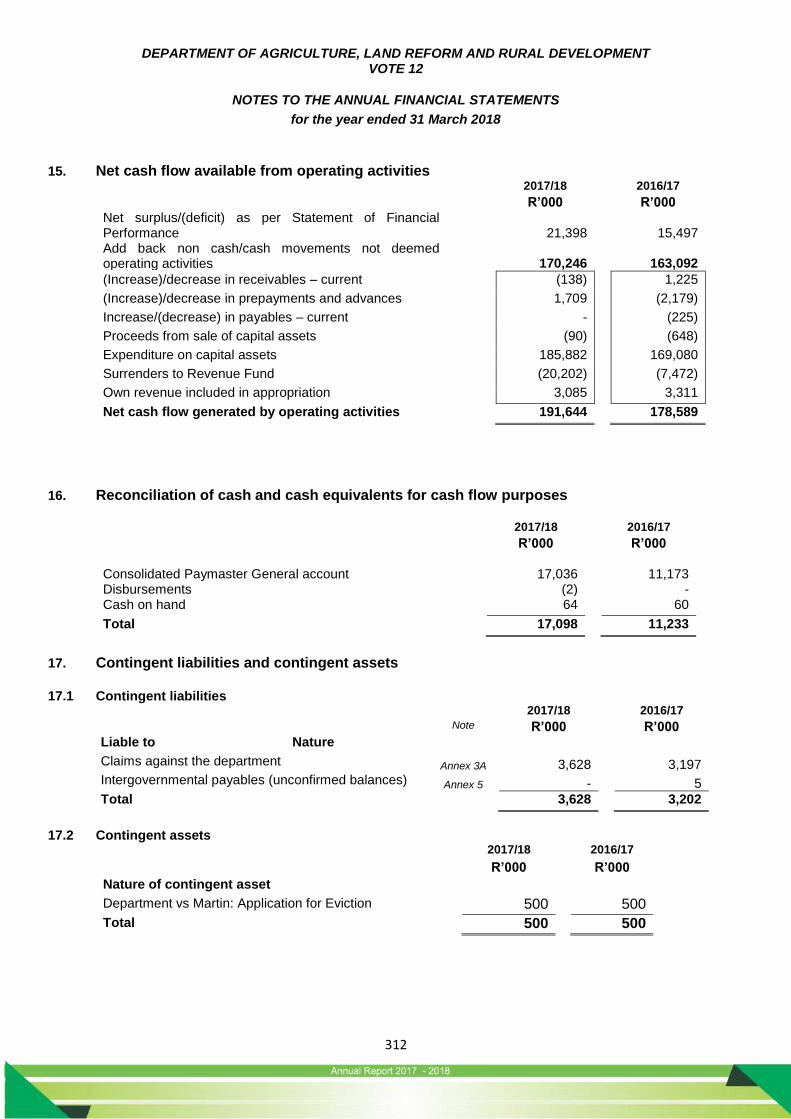
DEPARTMENT OF AGRICULTURE, LAND REFORM AND RURAL DEVELOPMENT VOTE 12
NOTES TO THE ANNUAL FINANCIAL STATEMENTS
for the year ended 31 March 2018
312
15. Net cash flow available from operating activities 2017/18 2016/17
R’000 R’000 Net surplus/(deficit) as per Statement of Financial Performance
21,398 15,497
Add back non cash/cash movements not deemed operating activities
170,246 163,092
(Increase)/decrease in receivables – current (138) 1,225
(Increase)/decrease in prepayments and advances 1,709 (2,179)
Increase/(decrease) in payables – current - (225)
Proceeds from sale of capital assets (90) (648)
Expenditure on capital assets 185,882 169,080
Surrenders to Revenue Fund (20,202) (7,472)
Own revenue included in appropriation 3,085 3,311
Net cash flow generated by operating activities 191,644 178,589
16. Reconciliation of cash and cash equivalents for cash flow purposes 2017/18 2016/17
R’000 R’000
Consolidated Paymaster General account Disbursements
17,036 (2)
11,173 -
Cash on hand 64 60
Total 17,098 11,233
17. Contingent liabilities and contingent assets
17.1 Contingent liabilities
2017/18 2016/17
Note R’000 R’000 Liable to Nature
Claims against the department Annex 3A 3,628 3,197 Intergovernmental payables (unconfirmed balances) Annex 5 - 5
Total 3,628 3,202
17.2 Contingent assets
2017/18 2016/17
R’000 R’000
Nature of contingent asset
Department vs Martin: Application for Eviction 500 500
Total 500 500
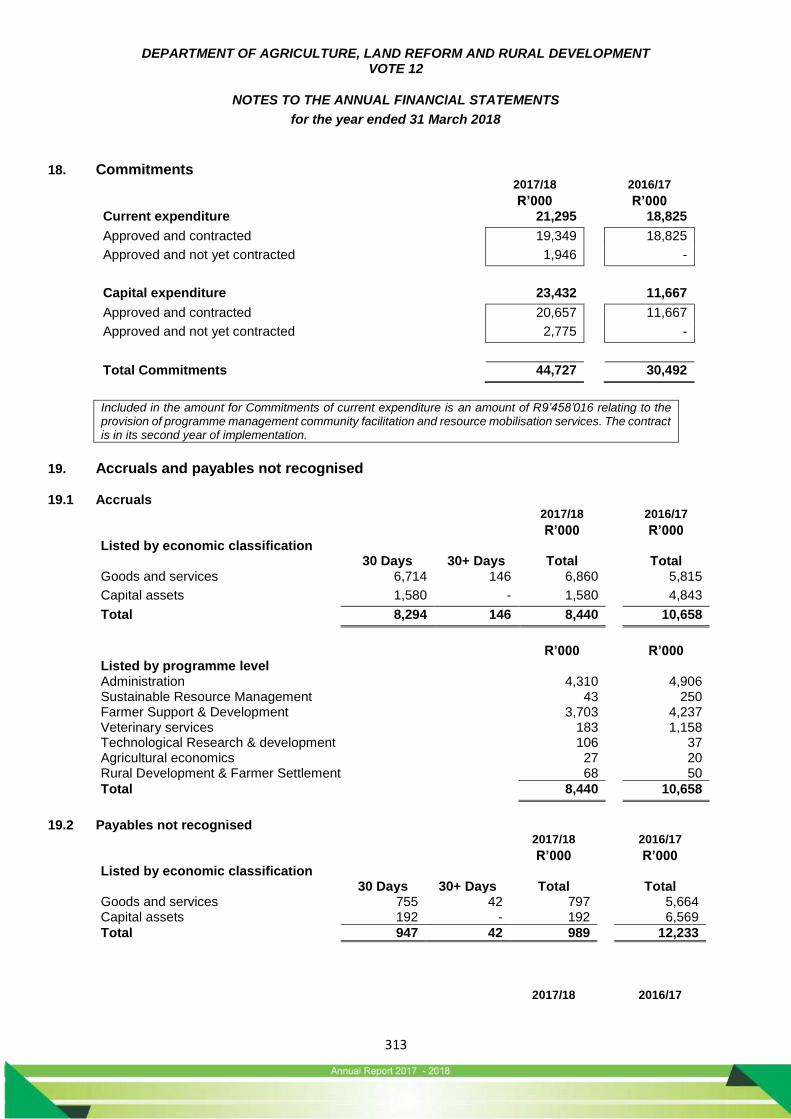
DEPARTMENT OF AGRICULTURE, LAND REFORM AND RURAL DEVELOPMENT VOTE 12
NOTES TO THE ANNUAL FINANCIAL STATEMENTS
for the year ended 31 March 2018
313
18. Commitments 2017/18 2016/17
R’000 R’000 Current expenditure 21,295 18,825
Approved and contracted 19,349 18,825
Approved and not yet contracted 1,946 -
Capital expenditure 23,432 11,667
Approved and contracted 20,657 11,667
Approved and not yet contracted 2,775 -
Total Commitments 44,727 30,492
Included in the amount for Commitments of current expenditure is an amount of R9’458’016 relating to the provision of programme management community facilitation and resource mobilisation services. The contract is in its second year of implementation.
19. Accruals and payables not recognised
19.1 Accruals
2017/18 2016/17
R’000 R’000 Listed by economic classification
30 Days 30+ Days Total Total Goods and services 6,714 146 6,860 5,815
Capital assets 1,580 - 1,580 4,843
Total 8,294 146 8,440 10,658
R’000 R’000 Listed by programme level Administration Sustainable Resource Management Farmer Support & Development Veterinary services Technological Research & development Agricultural economics Rural Development & Farmer Settlement
4,310
43 3,703
183 106 27 68
4,906
250 4,237 1,158
37 20 50
Total 8,440 10,658
19.2 Payables not recognised
2017/18 2016/17
R’000 R’000 Listed by economic classification
30 Days 30+ Days Total Total Goods and services 755 42 797 5,664 Capital assets 192 - 192 6,569
Total 947 42 989 12,233
2017/18 2016/17
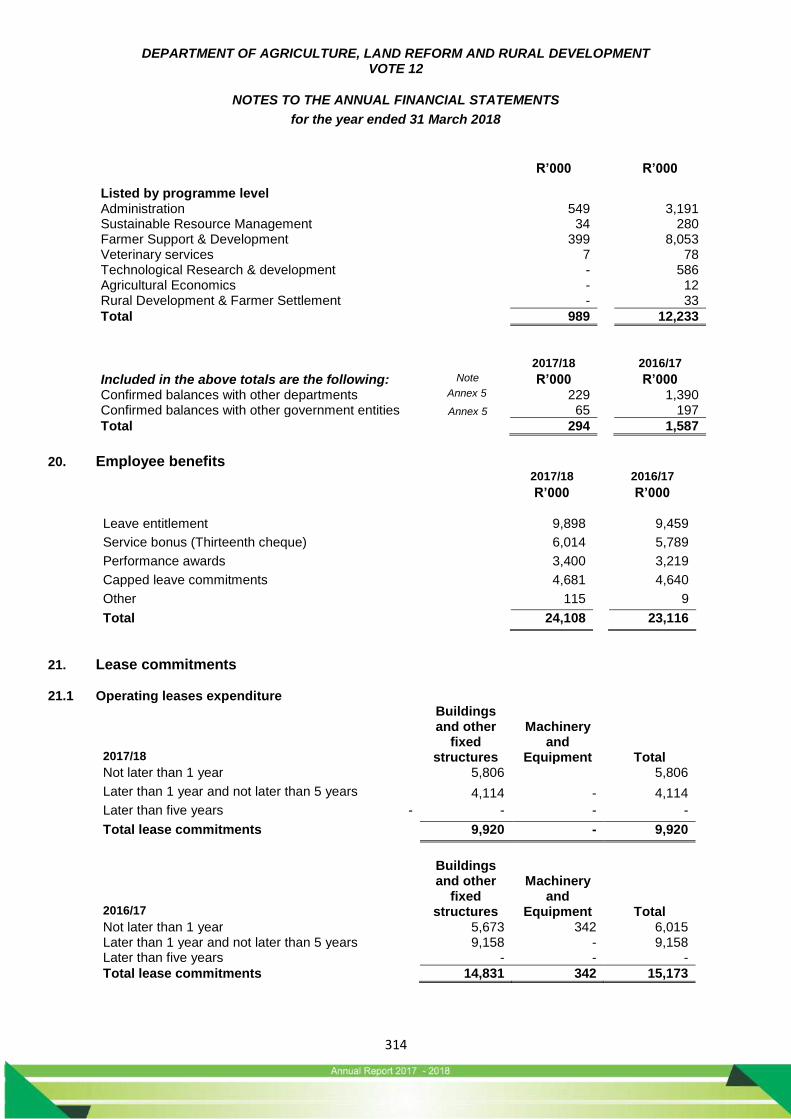
DEPARTMENT OF AGRICULTURE, LAND REFORM AND RURAL DEVELOPMENT VOTE 12
NOTES TO THE ANNUAL FINANCIAL STATEMENTS
for the year ended 31 March 2018
314
R’000 R’000
Listed by programme level Administration Sustainable Resource Management Farmer Support & Development Veterinary services Technological Research & development Agricultural Economics Rural Development & Farmer Settlement
549 34
399 7 - - -
3,191
280 8,053
78 586 12 33
Total 989 12,233
2017/18 2016/17
Included in the above totals are the following: Note R’000 R’000 Confirmed balances with other departments Annex 5 229 1,390 Confirmed balances with other government entities Annex 5 65 197
Total 294 1,587
20. Employee benefits 2017/18 2016/17
R’000 R’000
Leave entitlement 9,898 9,459
Service bonus (Thirteenth cheque) 6,014 5,789
Performance awards 3,400 3,219
Capped leave commitments 4,681 4,640
Other 115 9
Total 24,108 23,116
21. Lease commitments
21.1 Operating leases expenditure
2017/18
Buildings and other
fixed structures
Machinery and
Equipment Total Not later than 1 year 5,806 5,806
Later than 1 year and not later than 5 years 4,114 - 4,114
Later than five years - - - -
Total lease commitments 9,920 - 9,920
2016/17
Buildings and other
fixed structures
Machinery and
Equipment Total Not later than 1 year 5,673 342 6,015 Later than 1 year and not later than 5 years 9,158 - 9,158 Later than five years - - -
Total lease commitments 14,831 342 15,173
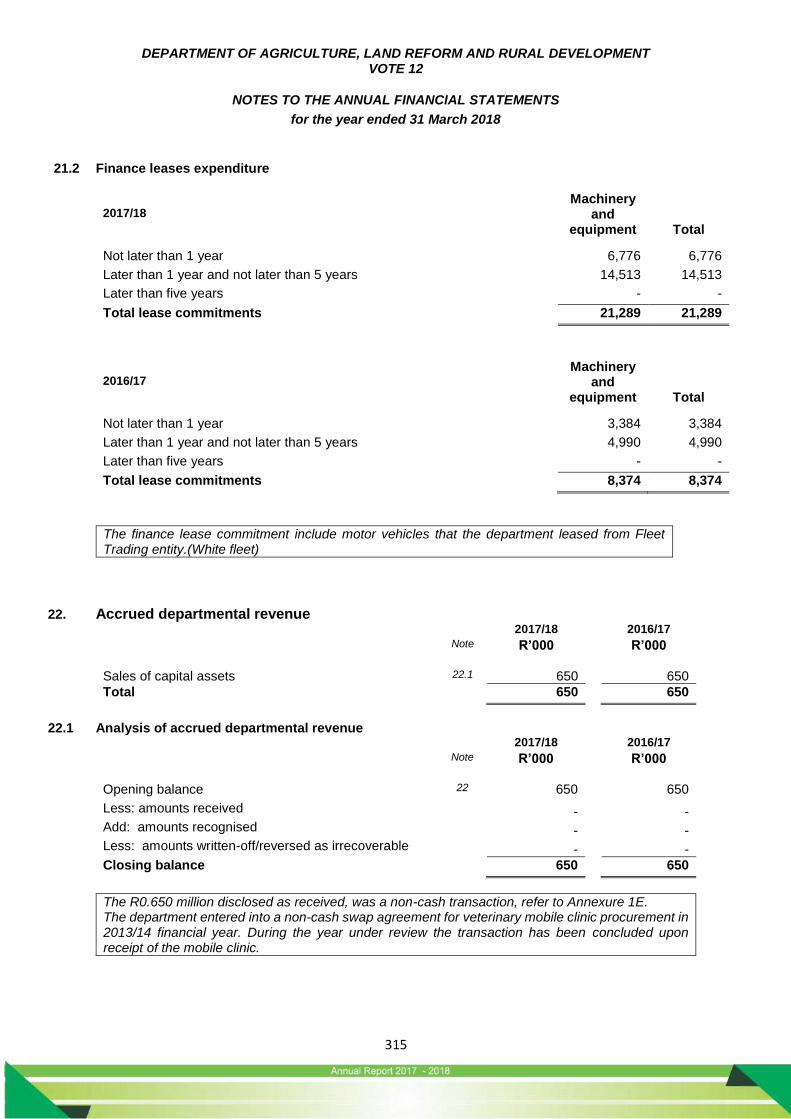
DEPARTMENT OF AGRICULTURE, LAND REFORM AND RURAL DEVELOPMENT VOTE 12
NOTES TO THE ANNUAL FINANCIAL STATEMENTS
for the year ended 31 March 2018
315
21.2 Finance leases expenditure
2017/18
Machinery
and equipment
Total
Not later than 1 year 6,776 6,776
Later than 1 year and not later than 5 years 14,513 14,513
Later than five years - -
Total lease commitments 21,289 21,289
2016/17
Machinery
and equipment
Total
Not later than 1 year 3,384 3,384
Later than 1 year and not later than 5 years 4,990 4,990
Later than five years - -
Total lease commitments 8,374 8,374
The finance lease commitment include motor vehicles that the department leased from Fleet Trading entity.(White fleet)
22. Accrued departmental revenue 2017/18 2016/17
Note R’000 R’000
Sales of capital assets 22.1 650 650
Total 650 650
22.1 Analysis of accrued departmental revenue
2017/18 2016/17
Note R’000 R’000 Opening balance 22 650 650
Less: amounts received - - Add: amounts recognised - - Less: amounts written-off/reversed as irrecoverable - -
Closing balance 650 650
The R0.650 million disclosed as received, was a non-cash transaction, refer to Annexure 1E. The department entered into a non-cash swap agreement for veterinary mobile clinic procurement in 2013/14 financial year. During the year under review the transaction has been concluded upon receipt of the mobile clinic.
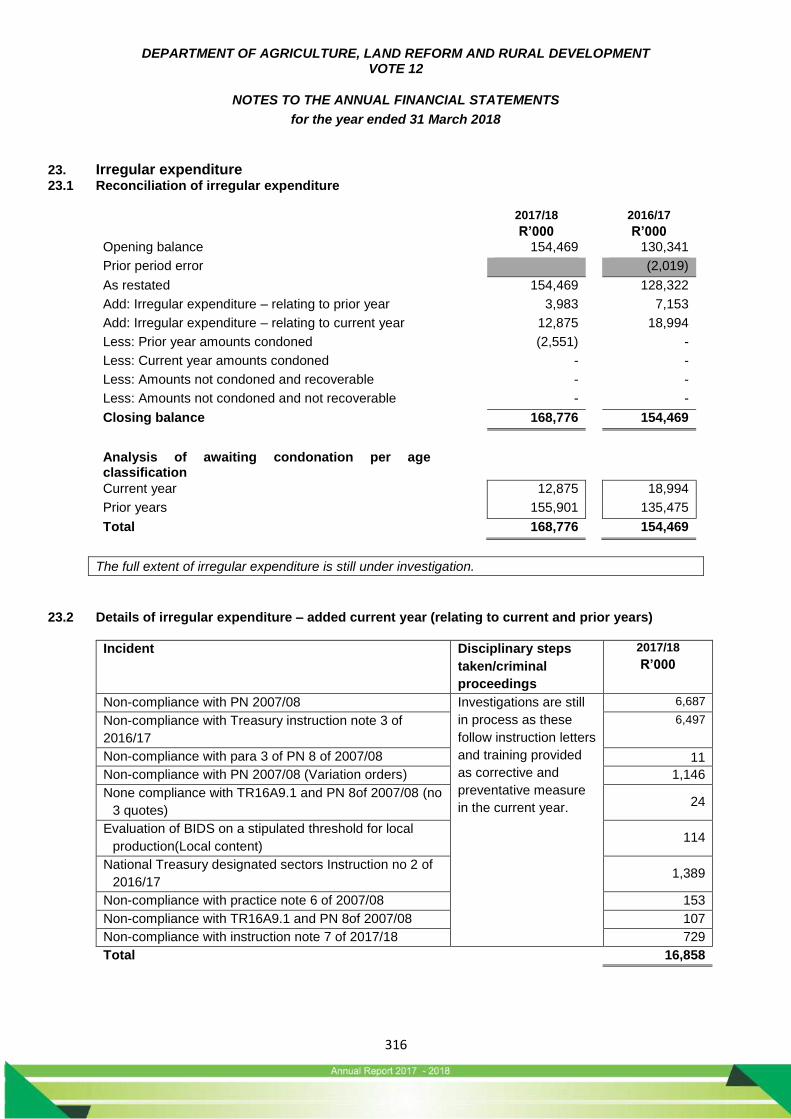
DEPARTMENT OF AGRICULTURE, LAND REFORM AND RURAL DEVELOPMENT VOTE 12
NOTES TO THE ANNUAL FINANCIAL STATEMENTS
for the year ended 31 March 2018
316
23. Irregular expenditure 23.1 Reconciliation of irregular expenditure
2017/18 2016/17
R’000 R’000 Opening balance 154,469 130,341
Prior period error (2,019)
As restated 154,469 128,322
Add: Irregular expenditure – relating to prior year 3,983 7,153
Add: Irregular expenditure – relating to current year 12,875 18,994
Less: Prior year amounts condoned (2,551) -
Less: Current year amounts condoned - -
Less: Amounts not condoned and recoverable - -
Less: Amounts not condoned and not recoverable - -
Closing balance 168,776 154,469
Analysis of awaiting condonation per age classification
Current year 12,875 18,994
Prior years 155,901 135,475
Total 168,776 154,469
The full extent of irregular expenditure is still under investigation.
23.2 Details of irregular expenditure – added current year (relating to current and prior years)
Incident Disciplinary steps
taken/criminal
proceedings
2017/18
R’000
Non-compliance with PN 2007/08 Investigations are still
in process as these
follow instruction letters
and training provided
as corrective and
preventative measure
in the current year.
6,687
Non-compliance with Treasury instruction note 3 of
2016/17
6,497
Non-compliance with para 3 of PN 8 of 2007/08 11
Non-compliance with PN 2007/08 (Variation orders) 1,146
None compliance with TR16A9.1 and PN 8of 2007/08 (no
3 quotes) 24
Evaluation of BIDS on a stipulated threshold for local
production(Local content) 114
National Treasury designated sectors Instruction no 2 of
2016/17 1,389
Non-compliance with practice note 6 of 2007/08 153
Non-compliance with TR16A9.1 and PN 8of 2007/08 107
Non-compliance with instruction note 7 of 2017/18 729
Total 16,858
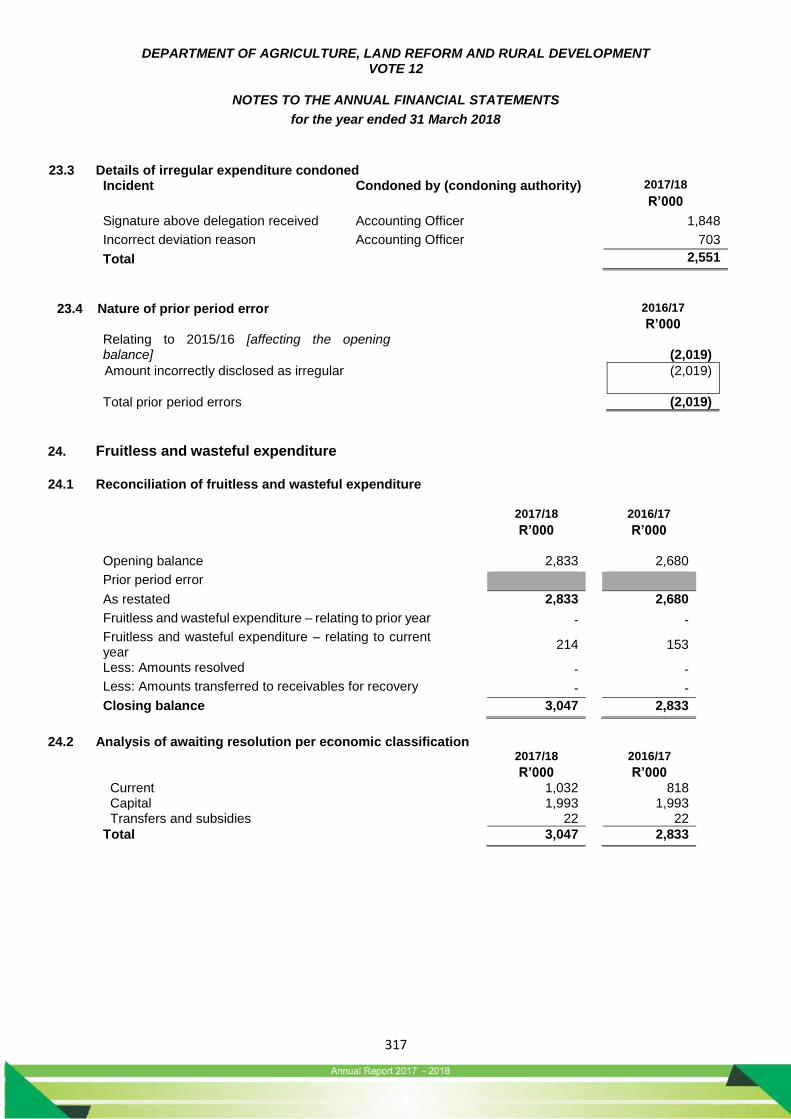
DEPARTMENT OF AGRICULTURE, LAND REFORM AND RURAL DEVELOPMENT VOTE 12
NOTES TO THE ANNUAL FINANCIAL STATEMENTS
for the year ended 31 March 2018
317
23.3 Details of irregular expenditure condoned Incident Condoned by (condoning authority) 2017/18
R’000
Signature above delegation received Accounting Officer 1,848
Incorrect deviation reason Accounting Officer 703
Total 2,551
23.4 Nature of prior period error 2016/17
R’000 Relating to 2015/16 [affecting the opening balance]
(2,019)
Amount incorrectly disclosed as irregular (2,019)
Total prior period errors (2,019)
24. Fruitless and wasteful expenditure
24.1 Reconciliation of fruitless and wasteful expenditure
2017/18 2016/17
R’000 R’000
Opening balance 2,833 2,680
Prior period error
As restated 2,833 2,680
Fruitless and wasteful expenditure – relating to prior year - -
Fruitless and wasteful expenditure – relating to current year
214 153
Less: Amounts resolved - -
Less: Amounts transferred to receivables for recovery - -
Closing balance 3,047 2,833
24.2 Analysis of awaiting resolution per economic classification
2017/18 2016/17
R’000 R’000 Current Capital Transfers and subsidies
1,032 1,993
22
818 1,993
22
Total 3,047 2,833

DEPARTMENT OF AGRICULTURE, LAND REFORM AND RURAL DEVELOPMENT VOTE 12
NOTES TO THE ANNUAL FINANCIAL STATEMENTS
for the year ended 31 March 2018
318
24.3 Analysis of Current year’s fruitless and wasteful expenditure
Incident Disciplinary steps taken/criminal
proceedings
2017/18
R’000
Interest on overdue account Investigations are in process 33
Cancellation cost Investigations are in process 2
Injury on Duty Investigations are in process 150
Accident costs – damage to vehicles Investigations are in process 12
Incorrect VAT % claimed or non-vendor Investigations are in process 17
Total 214
25. Related party transactions Payments made 2017/18 2016/17
Note R’000 R’000
Transfers Annex 1B - -
Total - -
Related party relationships: Kalahari Kid Corporation is a listed 3C public entity (This entity forms part of the portfolio of the MEC) The department does not have influence over this company’s operations, but as the mother department, we perform oversight and assist where required. Nieuwoudtville Rooibos (PTY) Ltd The department holds 100% shares. There are two senior managers assisting the company in terms of technical and financial capacity, without receiving any additional remuneration. Two other senior members are on the board in an oversight capacity without being remunerated. Transfers of R9’600’000 was made to Nieuwoudtville Rooibos (PTY) Ltd during the year.
26. Key management personnel
No. of Individuals
2017/18 2016/17
R’000 R’000 Political office bearers (provide detail below) 1 1,979 1,902
Officials:
Level 15 to 16 1 1,727 1,659
Level 14 (incl. CFO if at a lower level) 5 6,375 5,489
Family members of key management personnel - -
Total 10,081 9,050
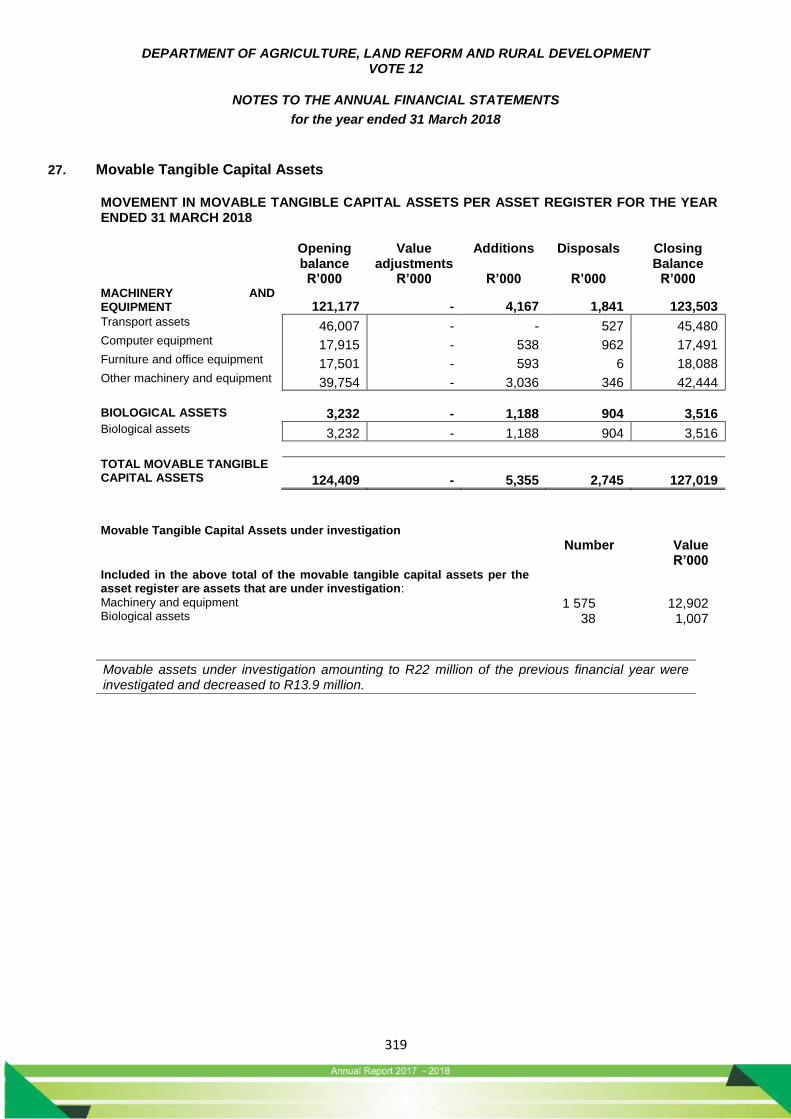
DEPARTMENT OF AGRICULTURE, LAND REFORM AND RURAL DEVELOPMENT VOTE 12
NOTES TO THE ANNUAL FINANCIAL STATEMENTS
for the year ended 31 March 2018
319
27. Movable Tangible Capital Assets
MOVEMENT IN MOVABLE TANGIBLE CAPITAL ASSETS PER ASSET REGISTER FOR THE YEAR ENDED 31 MARCH 2018 Opening
balance Value
adjustments Additions Disposals Closing
Balance R’000 R’000 R’000 R’000 R’000 MACHINERY AND EQUIPMENT 121,177 - 4,167 1,841 123,503 Transport assets 46,007 - - 527 45,480 Computer equipment 17,915 - 538 962 17,491 Furniture and office equipment 17,501 - 593 6 18,088 Other machinery and equipment 39,754 - 3,036 346 42,444 BIOLOGICAL ASSETS 3,232 - 1,188 904 3,516 Biological assets 3,232 - 1,188 904 3,516 TOTAL MOVABLE TANGIBLE CAPITAL ASSETS
124,409 - 5,355 2,745 127,019
Movable Tangible Capital Assets under investigation Number Value R’000 Included in the above total of the movable tangible capital assets per the asset register are assets that are under investigation:
Machinery and equipment Biological assets
1 575 38
12,902 1,007
Movable assets under investigation amounting to R22 million of the previous financial year were investigated and decreased to R13.9 million.
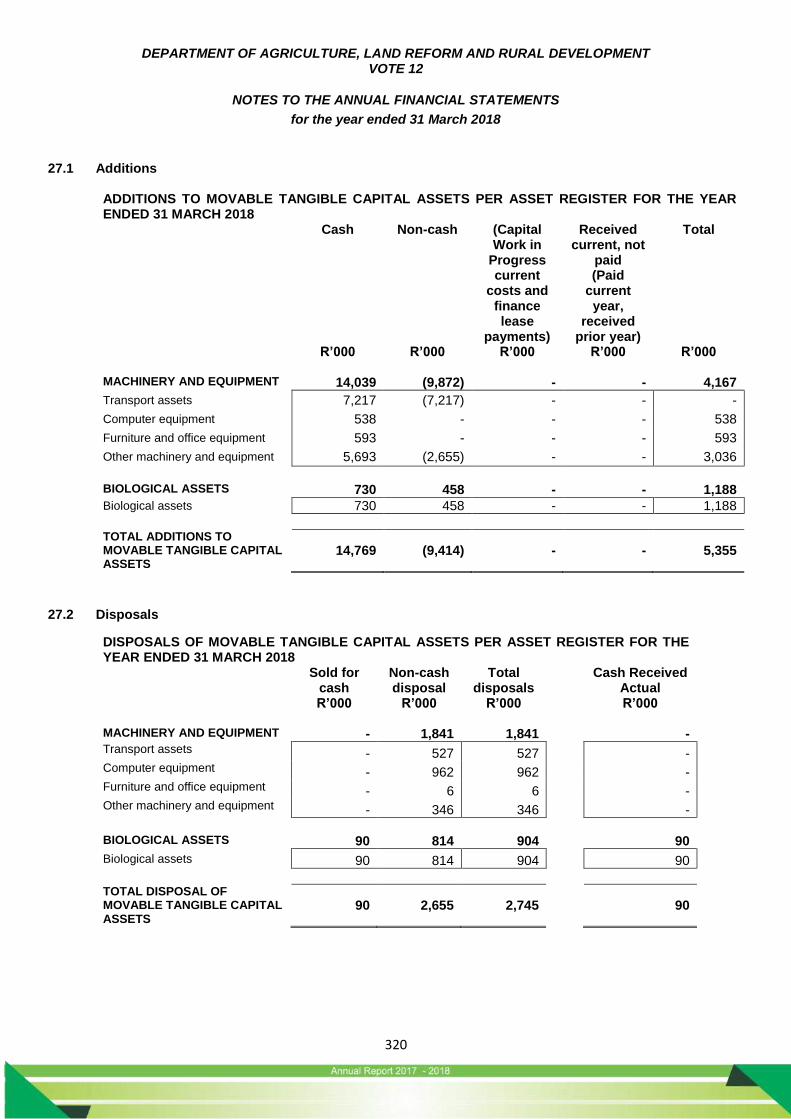
DEPARTMENT OF AGRICULTURE, LAND REFORM AND RURAL DEVELOPMENT VOTE 12
NOTES TO THE ANNUAL FINANCIAL STATEMENTS
for the year ended 31 March 2018
320
27.1 Additions ADDITIONS TO MOVABLE TANGIBLE CAPITAL ASSETS PER ASSET REGISTER FOR THE YEAR ENDED 31 MARCH 2018 Cash Non-cash (Capital
Work in Progress current
costs and finance lease
payments)
Received current, not
paid (Paid
current year,
received prior year)
Total
R’000 R’000 R’000 R’000 R’000 MACHINERY AND EQUIPMENT 14,039 (9,872) - - 4,167
Transport assets 7,217 (7,217) - - -
Computer equipment 538 - - - 538
Furniture and office equipment 593 - - - 593
Other machinery and equipment 5,693 (2,655) - - 3,036
BIOLOGICAL ASSETS 730 458 - - 1,188
Biological assets 730 458 - - 1,188 TOTAL ADDITIONS TO MOVABLE TANGIBLE CAPITAL ASSETS
14,769 (9,414) - - 5,355
27.2 Disposals
DISPOSALS OF MOVABLE TANGIBLE CAPITAL ASSETS PER ASSET REGISTER FOR THE YEAR ENDED 31 MARCH 2018
Sold for cash
Non-cash disposal
Total disposals
Cash Received Actual
R’000 R’000 R’000 R’000 MACHINERY AND EQUIPMENT - 1,841 1,841 - Transport assets - 527 527 - Computer equipment - 962 962 - Furniture and office equipment - 6 6 - Other machinery and equipment - 346 346 - BIOLOGICAL ASSETS 90 814 904 90
Biological assets 90 814 904 90 TOTAL DISPOSAL OF MOVABLE TANGIBLE CAPITAL ASSETS
90 2,655 2,745 90

DEPARTMENT OF AGRICULTURE, LAND REFORM AND RURAL DEVELOPMENT VOTE 12
NOTES TO THE ANNUAL FINANCIAL STATEMENTS
for the year ended 31 March 2018
321
27.3 Movement for 2016/17 MOVEMENT IN MOVABLE TANGIBLE CAPITAL ASSETS PER ASSET REGISTER FOR THE YEAR ENDED 31 MARCH 2017 Opening
balance Prior
period error
Additions Disposals Closing Balance
R’000 R’000 R’000 R’000 R’000 MACHINERY AND EQUIPMENT 105,813 27,973
4,439
17,048 121,177
Transport assets 45,785 1,398 1,457 2,633 46,007
Computer equipment 18,903 (1,331) 751 408 17,915
Furniture and office equipment 16,805 (108) 979 175 17,501
Other machinery and equipment 24,320 28,014 1,252 13,832 39,754
BIOLOGICAL ASSETS 2,450 (79) 990 129 3,232 Biological assets 2,450 (79) 990 129 3,232 TOTAL MOVABLE TANGIBLE CAPITAL ASSETS
108,263 27,894 5,429 17,177 124,409
27.3.1 Prior period error
2017/18
Note R’000 Nature of prior period error Relating to opening balances
Duplications and reclassification in machinery and equipment corrected
27,973
Duplications in Biological assets corrected (79)
Total prior period errors 27,894
27.4 Minor assets
MOVEMENT IN MINOR ASSETS PER THE ASSET REGISTER FOR THE YEAR ENDED AS AT 31 MARCH 2018
Intangible assets
Machinery and
equipment
Biological assets
Total
R’000 R’000 R’000 R’000 Opening balance Value Adjustment
306 -
12,941 15
8,178 2,475
21,425 2,490
Additions - 301 431 732
Disposals - (352) (1,476) (1,828)
TOTAL MINOR ASSETS 306 12,905 9,608 22,819
Intangible
assets
Machinery
and equipment
Biological
assets
Total
Number of R1 minor assets Number of minor asset at cost
- 122
4,852 4,618
- 6,171
4,852 10,911
TOTAL NUMBER OF MINOR ASSETS 122 9,470 6,171 15,763

DEPARTMENT OF AGRICULTURE, LAND REFORM AND RURAL DEVELOPMENT VOTE 12
NOTES TO THE ANNUAL FINANCIAL STATEMENTS
for the year ended 31 March 2018
322
Minor Capital Assets under investigation Number Value R’000 Included in the above total of the movable tangible capital assets per the asset register are assets that are under investigation:
Machinery and equipment Biological assets
576 1,234
757 1,898
Biological and movable assets that were include in the asset register but could not be found. Investigation ongoing
MOVEMENT IN MINOR ASSETS PER THE ASSET REGISTER FOR THE YEAR ENDED AS AT 31 MARCH 2017
Intangible assets
Machinery and
equipment
Biological assets
Total
R’000 R’000 R’000 R’000 Opening balance 306 15,856 8,207 24,369
Prior year error - (3,211) (134) (3,345)
Additions - 437 1,218 1,655
Disposals - (141) (1,113) (1,254)
TOTAL MINOR ASSETS 306 12,941 8,178 21,425
Intangible assets
Machinery and
equipment
Biological assets
Total
Number of R1 minor assets - 13,734 (51) 13,683 Number of minor assets at cost - 1,280 5,096 6,376 TOTAL NUMBER OF MINOR ASSETS - 15,014 5,045 20,059
27.4.1 Prior period error
2017/18
Note R’000 Nature of prior period error Relating to opening balance
Reclassification of expenditure and duplicated assets (3,211)
Assets duplicated and investigated assets resolved (134)
Total prior period errors (3,345)
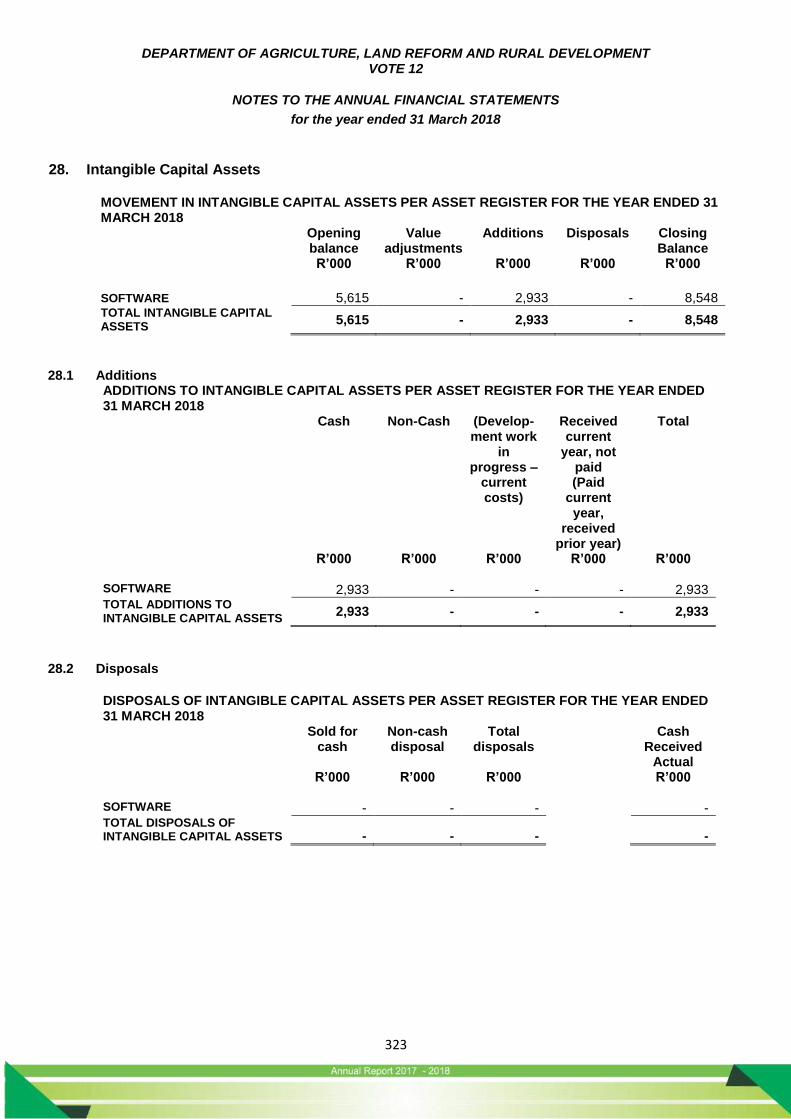
DEPARTMENT OF AGRICULTURE, LAND REFORM AND RURAL DEVELOPMENT VOTE 12
NOTES TO THE ANNUAL FINANCIAL STATEMENTS
for the year ended 31 March 2018
323
28. Intangible Capital Assets MOVEMENT IN INTANGIBLE CAPITAL ASSETS PER ASSET REGISTER FOR THE YEAR ENDED 31 MARCH 2018 Opening
balance Value
adjustments Additions Disposals Closing
Balance R’000 R’000 R’000 R’000 R’000
SOFTWARE 5,615 - 2,933 - 8,548 TOTAL INTANGIBLE CAPITAL ASSETS
5,615 - 2,933 - 8,548
28.1 Additions ADDITIONS TO INTANGIBLE CAPITAL ASSETS PER ASSET REGISTER FOR THE YEAR ENDED 31 MARCH 2018 Cash Non-Cash (Develop-
ment work in
progress – current costs)
Received current
year, not paid (Paid
current year,
received prior year)
Total
R’000 R’000 R’000 R’000 R’000 SOFTWARE 2,933 - - - 2,933 TOTAL ADDITIONS TO INTANGIBLE CAPITAL ASSETS
2,933 - - - 2,933
28.2 Disposals
DISPOSALS OF INTANGIBLE CAPITAL ASSETS PER ASSET REGISTER FOR THE YEAR ENDED 31 MARCH 2018
Sold for cash
Non-cash disposal
Total disposals
Cash Received
Actual R’000 R’000 R’000 R’000
SOFTWARE - - - - TOTAL DISPOSALS OF INTANGIBLE CAPITAL ASSETS - - - -
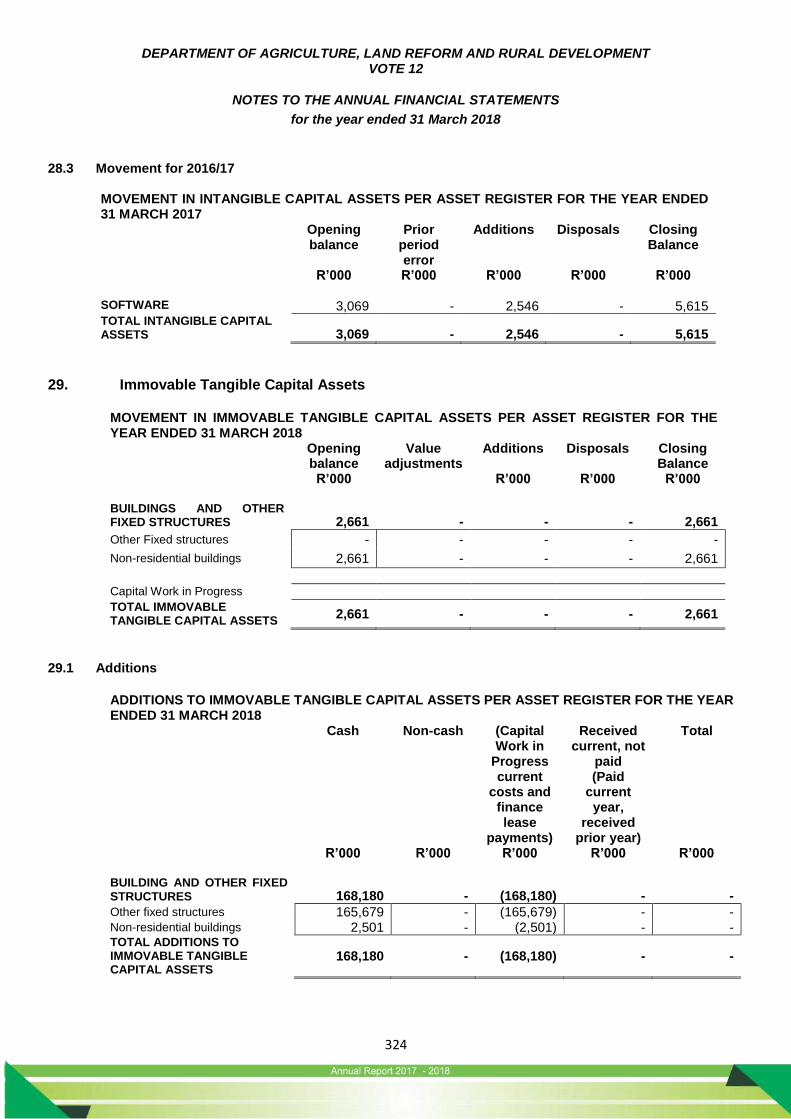
DEPARTMENT OF AGRICULTURE, LAND REFORM AND RURAL DEVELOPMENT VOTE 12
NOTES TO THE ANNUAL FINANCIAL STATEMENTS
for the year ended 31 March 2018
324
28.3 Movement for 2016/17 MOVEMENT IN INTANGIBLE CAPITAL ASSETS PER ASSET REGISTER FOR THE YEAR ENDED 31 MARCH 2017 Opening
balance Prior
period error
Additions Disposals Closing Balance
R’000 R’000 R’000 R’000 R’000 SOFTWARE 3,069 - 2,546 - 5,615 TOTAL INTANGIBLE CAPITAL ASSETS 3,069 - 2,546 - 5,615
29. Immovable Tangible Capital Assets
MOVEMENT IN IMMOVABLE TANGIBLE CAPITAL ASSETS PER ASSET REGISTER FOR THE YEAR ENDED 31 MARCH 2018 Opening
balance Value
adjustments Additions Disposals Closing
Balance R’000 R’000 R’000 R’000 BUILDINGS AND OTHER FIXED STRUCTURES 2,661 - - - 2,661
Other Fixed structures - - - - -
Non-residential buildings 2,661 - - - 2,661
Capital Work in Progress TOTAL IMMOVABLE TANGIBLE CAPITAL ASSETS
2,661 - - - 2,661
29.1 Additions
ADDITIONS TO IMMOVABLE TANGIBLE CAPITAL ASSETS PER ASSET REGISTER FOR THE YEAR ENDED 31 MARCH 2018 Cash Non-cash (Capital
Work in Progress current
costs and finance lease
payments)
Received current, not
paid (Paid
current year,
received prior year)
Total
R’000 R’000 R’000 R’000 R’000 BUILDING AND OTHER FIXED STRUCTURES 168,180 - (168,180) - -
Other fixed structures 165,679 - (165,679) - - Non-residential buildings 2,501 - (2,501) - - TOTAL ADDITIONS TO IMMOVABLE TANGIBLE CAPITAL ASSETS
168,180 - (168,180) - -
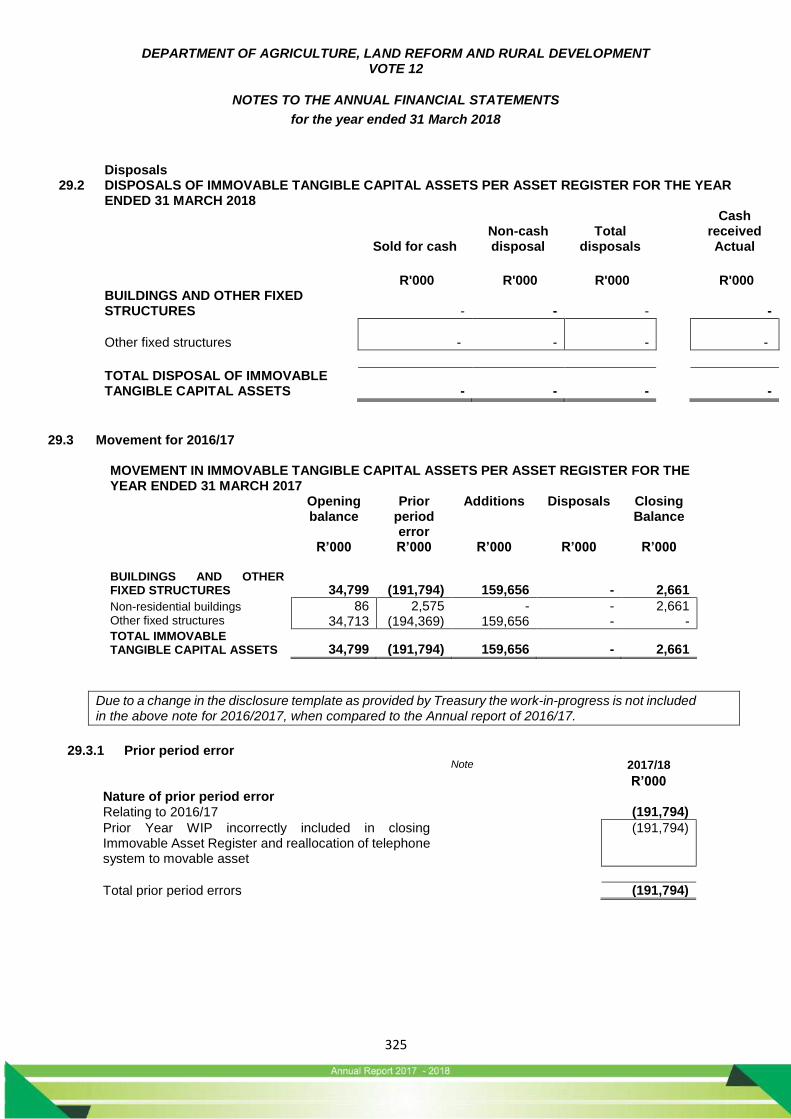
DEPARTMENT OF AGRICULTURE, LAND REFORM AND RURAL DEVELOPMENT VOTE 12
NOTES TO THE ANNUAL FINANCIAL STATEMENTS
for the year ended 31 March 2018
325
Disposals 29.2 DISPOSALS OF IMMOVABLE TANGIBLE CAPITAL ASSETS PER ASSET REGISTER FOR THE YEAR
ENDED 31 MARCH 2018
Sold for cash Non-cash disposal
Total disposals
Cash received Actual
R'000 R'000 R'000 R'000
BUILDINGS AND OTHER FIXED STRUCTURES
-
-
-
-
Other fixed structures -
-
- -
TOTAL DISPOSAL OF IMMOVABLE TANGIBLE CAPITAL ASSETS
-
-
-
-
29.3 Movement for 2016/17
MOVEMENT IN IMMOVABLE TANGIBLE CAPITAL ASSETS PER ASSET REGISTER FOR THE YEAR ENDED 31 MARCH 2017 Opening
balance Prior
period error
Additions Disposals Closing Balance
R’000 R’000 R’000 R’000 R’000 BUILDINGS AND OTHER FIXED STRUCTURES 34,799 (191,794) 159,656 - 2,661
Non-residential buildings Other fixed structures
86 34,713
2,575 (194,369)
- 159,656
- -
2,661 -
TOTAL IMMOVABLE TANGIBLE CAPITAL ASSETS 34,799 (191,794) 159,656 - 2,661
Due to a change in the disclosure template as provided by Treasury the work-in-progress is not included in the above note for 2016/2017, when compared to the Annual report of 2016/17.
29.3.1 Prior period error Note 2017/18
R’000 Nature of prior period error Relating to 2016/17 (191,794)
Prior Year WIP incorrectly included in closing Immovable Asset Register and reallocation of telephone system to movable asset
(191,794)
Total prior period errors (191,794)
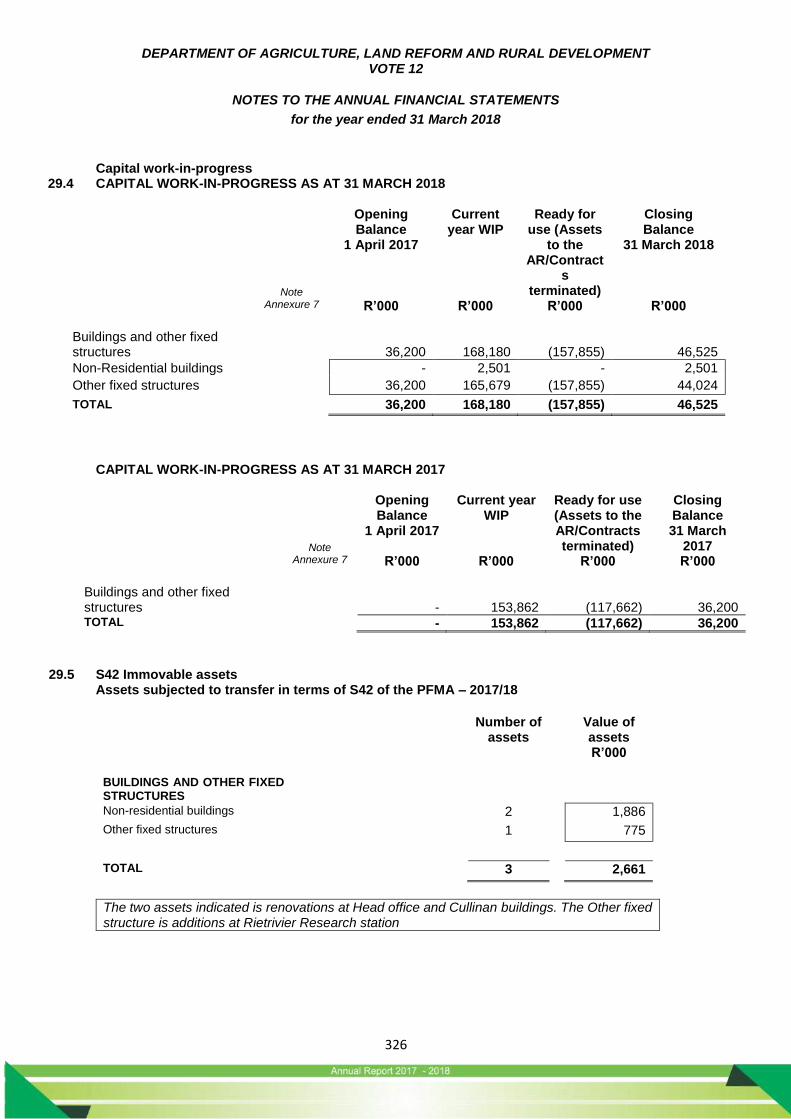
DEPARTMENT OF AGRICULTURE, LAND REFORM AND RURAL DEVELOPMENT VOTE 12
NOTES TO THE ANNUAL FINANCIAL STATEMENTS
for the year ended 31 March 2018
326
Capital work-in-progress 29.4 CAPITAL WORK-IN-PROGRESS AS AT 31 MARCH 2018
Note
Opening Balance
1 April 2017
Current year WIP
Ready for use (Assets
to the AR/Contract
s terminated)
Closing Balance
31 March 2018
Annexure 7 R’000 R’000 R’000 R’000 Buildings and other fixed structures 36,200 168,180 (157,855) 46,525
Non-Residential buildings - 2,501 - 2,501
Other fixed structures 36,200 165,679 (157,855) 44,024
TOTAL 36,200 168,180 (157,855) 46,525
CAPITAL WORK-IN-PROGRESS AS AT 31 MARCH 2017
Note
Opening Balance
1 April 2017
Current year WIP
Ready for use (Assets to the AR/Contracts terminated)
Closing Balance 31 March
2017 Annexure 7 R’000 R’000 R’000 R’000 Buildings and other fixed structures - 153,862 (117,662) 36,200 TOTAL - 153,862 (117,662) 36,200
29.5 S42 Immovable assets Assets subjected to transfer in terms of S42 of the PFMA – 2017/18
Number of
assets Value of
assets R’000
BUILDINGS AND OTHER FIXED STRUCTURES
Non-residential buildings 2 1,886
Other fixed structures 1 775
TOTAL 3 2,661
The two assets indicated is renovations at Head office and Cullinan buildings. The Other fixed structure is additions at Rietrivier Research station
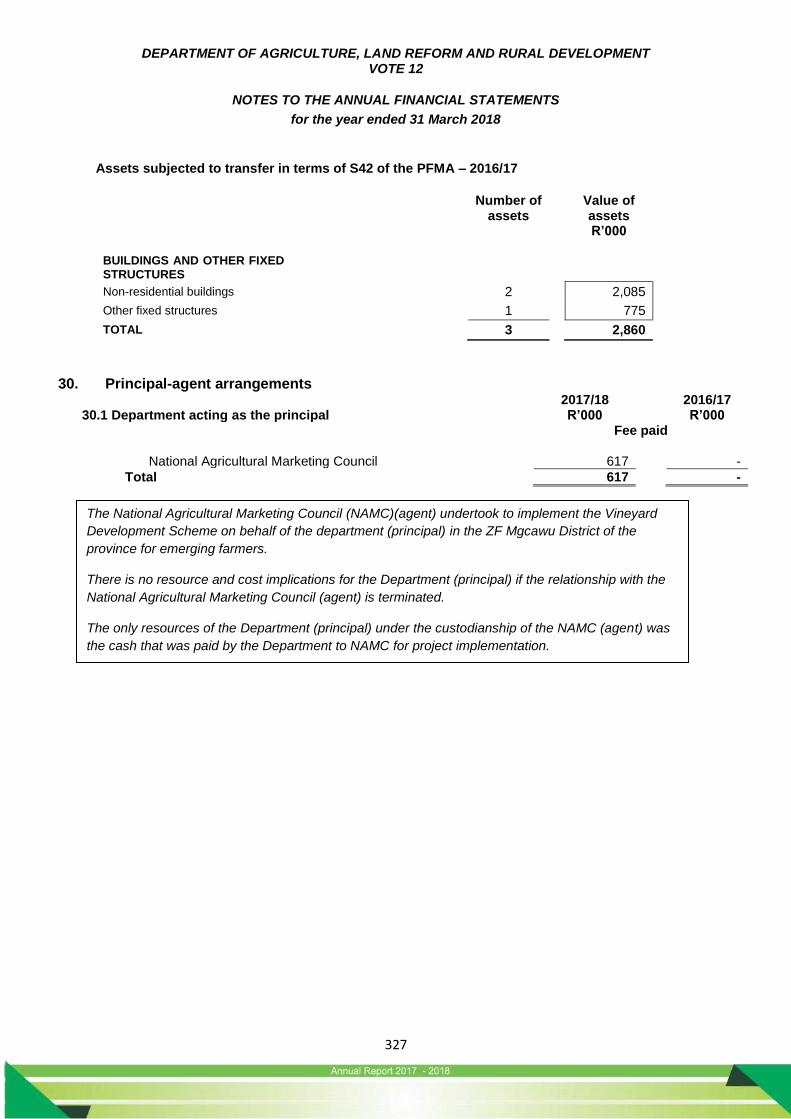
DEPARTMENT OF AGRICULTURE, LAND REFORM AND RURAL DEVELOPMENT VOTE 12
NOTES TO THE ANNUAL FINANCIAL STATEMENTS
for the year ended 31 March 2018
327
Assets subjected to transfer in terms of S42 of the PFMA – 2016/17
Number of
assets Value of
assets R’000
BUILDINGS AND OTHER FIXED STRUCTURES
Non-residential buildings 2 2,085
Other fixed structures 1 775
TOTAL 3 2,860
30. Principal-agent arrangements 2017/18 2016/17 30.1 Department acting as the principal R’000 R’000 Fee paid
National Agricultural Marketing Council 617 -
Total 617 -
The National Agricultural Marketing Council (NAMC)(agent) undertook to implement the Vineyard
Development Scheme on behalf of the department (principal) in the ZF Mgcawu District of the
province for emerging farmers.
There is no resource and cost implications for the Department (principal) if the relationship with the
National Agricultural Marketing Council (agent) is terminated.
The only resources of the Department (principal) under the custodianship of the NAMC (agent) was
the cash that was paid by the Department to NAMC for project implementation.
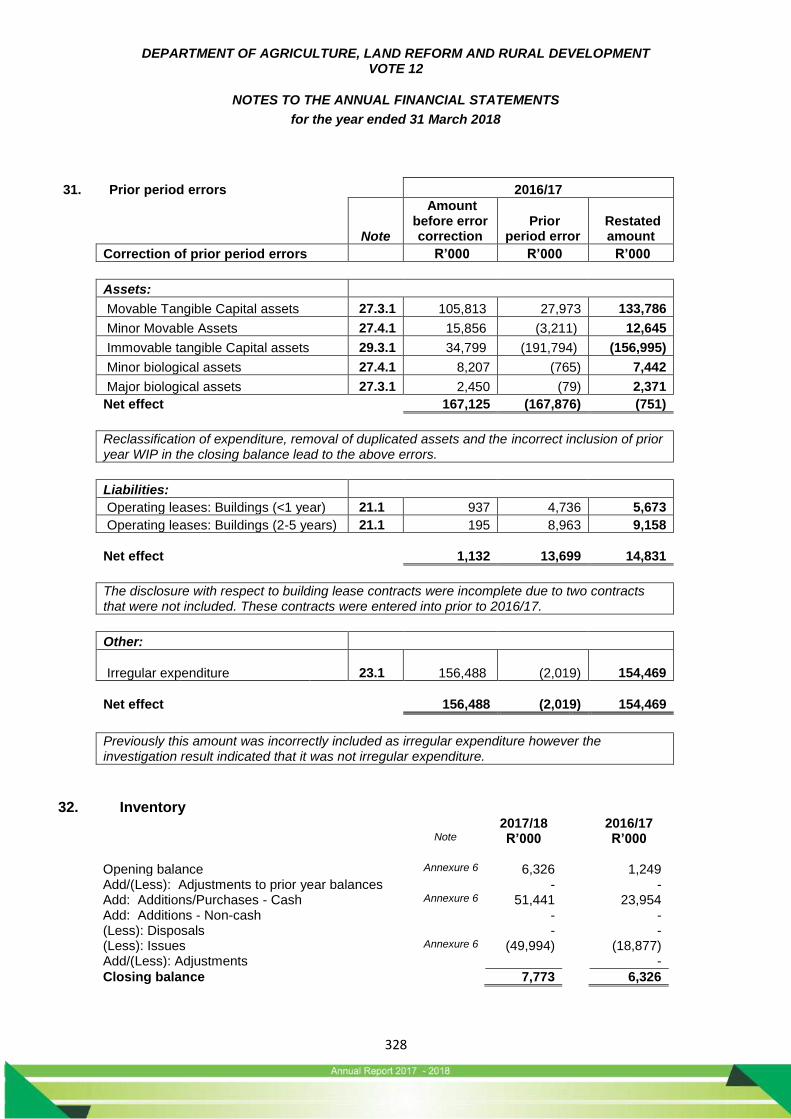
DEPARTMENT OF AGRICULTURE, LAND REFORM AND RURAL DEVELOPMENT VOTE 12
NOTES TO THE ANNUAL FINANCIAL STATEMENTS
for the year ended 31 March 2018
328
31. Prior period errors 2016/17
Note
Amount before error correction
Prior period error
Restated amount
Correction of prior period errors R’000 R’000 R’000
Assets:
Movable Tangible Capital assets 27.3.1 105,813 27,973 133,786
Minor Movable Assets 27.4.1 15,856 (3,211) 12,645
Immovable tangible Capital assets 29.3.1 34,799 (191,794) (156,995)
Minor biological assets 27.4.1 8,207 (765) 7,442
Major biological assets 27.3.1 2,450 (79) 2,371
Net effect 167,125 (167,876) (751)
Reclassification of expenditure, removal of duplicated assets and the incorrect inclusion of prior year WIP in the closing balance lead to the above errors.
Liabilities:
Operating leases: Buildings (<1 year) 21.1 937 4,736 5,673
Operating leases: Buildings (2-5 years) 21.1 195 8,963 9,158
Net effect
1,132 13,699 14,831
The disclosure with respect to building lease contracts were incomplete due to two contracts that were not included. These contracts were entered into prior to 2016/17.
Other:
Irregular expenditure 23.1 156,488 (2,019)
154,469
Net effect
156,488 (2,019)
154,469
Previously this amount was incorrectly included as irregular expenditure however the investigation result indicated that it was not irregular expenditure.
32. Inventory 2017/18 2016/17 Note R’000 R’000
Opening balance Annexure 6 6,326 1,249 Add/(Less): Adjustments to prior year balances - - Add: Additions/Purchases - Cash Annexure 6 51,441 23,954 Add: Additions - Non-cash - - (Less): Disposals - - (Less): Issues Annexure 6 (49,994) (18,877) Add/(Less): Adjustments -
Closing balance 7,773 6,326
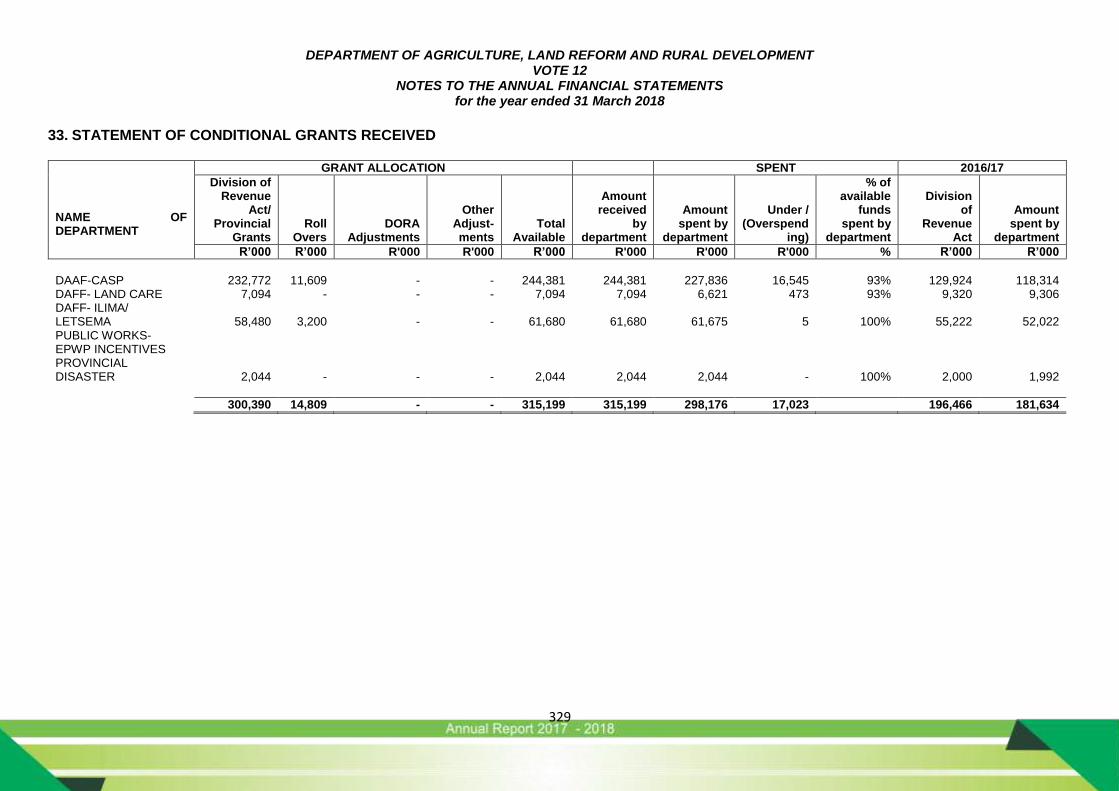
DEPARTMENT OF AGRICULTURE, LAND REFORM AND RURAL DEVELOPMENT VOTE 12
NOTES TO THE ANNUAL FINANCIAL STATEMENTS for the year ended 31 March 2018
329
33. STATEMENT OF CONDITIONAL GRANTS RECEIVED
NAME OF DEPARTMENT
GRANT ALLOCATION SPENT 2016/17
Division of Revenue
Act/ Provincial
Grants Roll
Overs DORA
Adjustments
Other Adjust- ments
Total Available
Amount received
by department
Amount spent by
department
Under / (Overspend
ing)
% of available
funds spent by
department
Division of
Revenue Act
Amount spent by
department
R’000 R’000 R'000 R'000 R’000 R'000 R'000 R'000 % R’000 R’000
DAAF-CASP 232,772 11,609 - - 244,381 244,381 227,836 16,545 93% 129,924 118,314 DAFF- LAND CARE 7,094 - - - 7,094 7,094 6,621 473 93% 9,320 9,306 DAFF- ILIMA/ LETSEMA 58,480 3,200 - - 61,680 61,680 61,675 5 100% 55,222 52,022 PUBLIC WORKS- EPWP INCENTIVES PROVINCIAL DISASTER 2,044 - - - 2,044 2,044 2,044 - 100% 2,000 1,992
300,390 14,809 - - 315,199 315,199 298,176 17,023 196,466 181,634
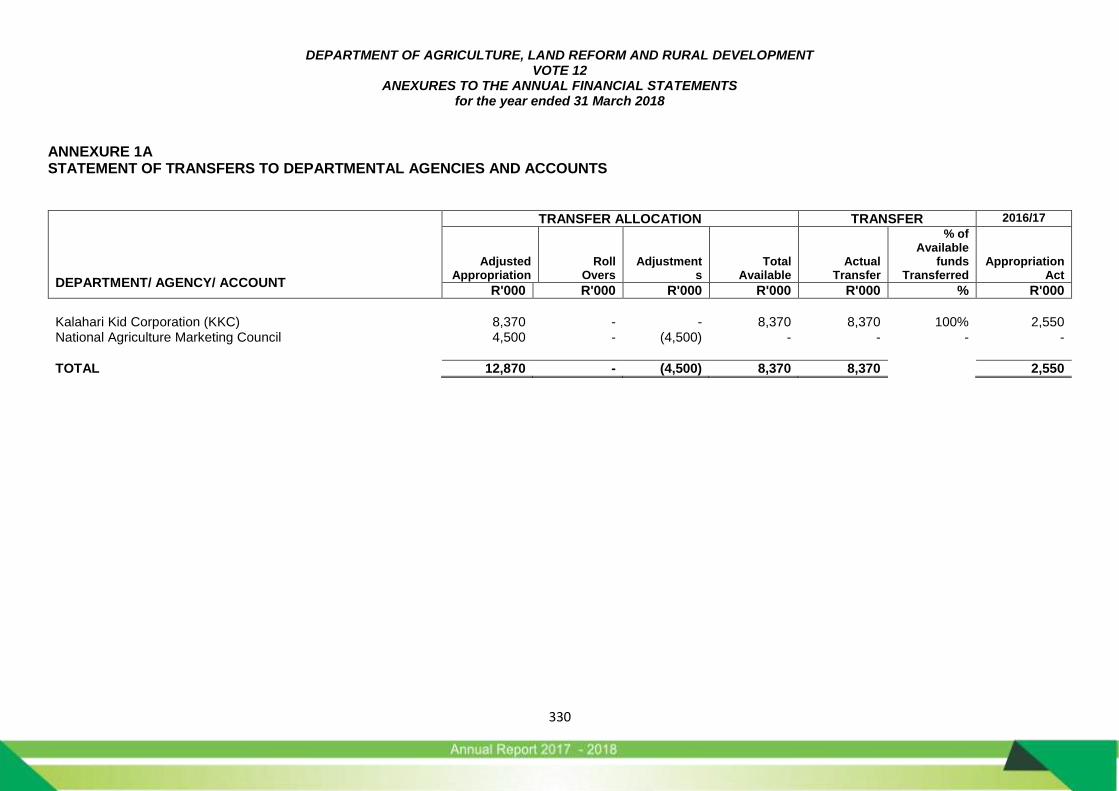
DEPARTMENT OF AGRICULTURE, LAND REFORM AND RURAL DEVELOPMENT VOTE 12
ANEXURES TO THE ANNUAL FINANCIAL STATEMENTS for the year ended 31 March 2018
330
ANNEXURE 1A STATEMENT OF TRANSFERS TO DEPARTMENTAL AGENCIES AND ACCOUNTS
DEPARTMENT/ AGENCY/ ACCOUNT
TRANSFER ALLOCATION TRANSFER 2016/17
Adjusted Appropriation
Roll Overs
Adjustments
Total Available
Actual Transfer
% of Available
funds Transferred
Appropriation Act
R'000 R'000 R'000 R'000 R'000 % R'000
Kalahari Kid Corporation (KKC) National Agriculture Marketing Council
8,370 4,500
- -
- (4,500)
8,370 -
8,370 -
100% -
2,550 -
TOTAL 12,870 - (4,500) 8,370 8,370 2,550
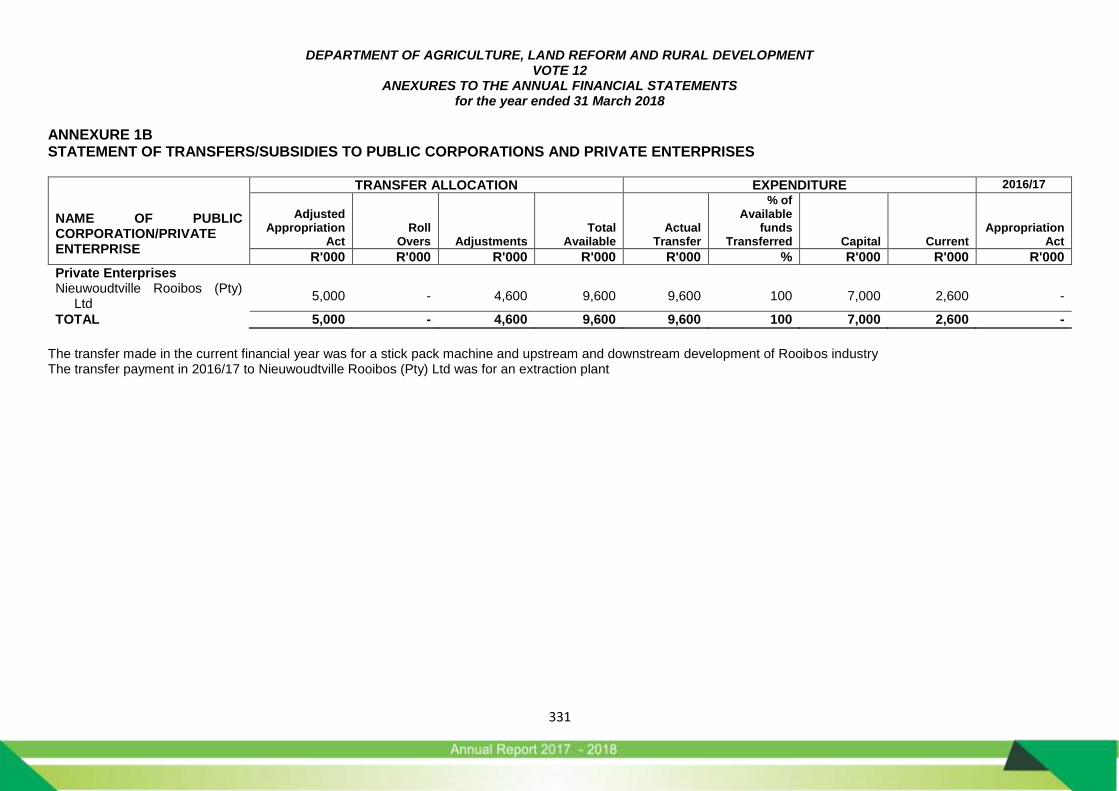
DEPARTMENT OF AGRICULTURE, LAND REFORM AND RURAL DEVELOPMENT VOTE 12
ANEXURES TO THE ANNUAL FINANCIAL STATEMENTS for the year ended 31 March 2018
331
ANNEXURE 1B STATEMENT OF TRANSFERS/SUBSIDIES TO PUBLIC CORPORATIONS AND PRIVATE ENTERPRISES
NAME OF PUBLIC CORPORATION/PRIVATE ENTERPRISE
TRANSFER ALLOCATION EXPENDITURE 2016/17
Adjusted Appropriation
Act Roll
Overs Adjustments Total
Available Actual
Transfer
% of Available
funds Transferred
Capital Current
Appropriation Act
R'000 R'000 R'000 R'000 R'000 % R'000 R'000 R'000
Private Enterprises Nieuwoudtville Rooibos (Pty)
Ltd 5,000 - 4,600 9,600 9,600 100 7,000 2,600 -
TOTAL 5,000 - 4,600 9,600 9,600 100 7,000 2,600 -
The transfer made in the current financial year was for a stick pack machine and upstream and downstream development of Rooibos industry The transfer payment in 2016/17 to Nieuwoudtville Rooibos (Pty) Ltd was for an extraction plant
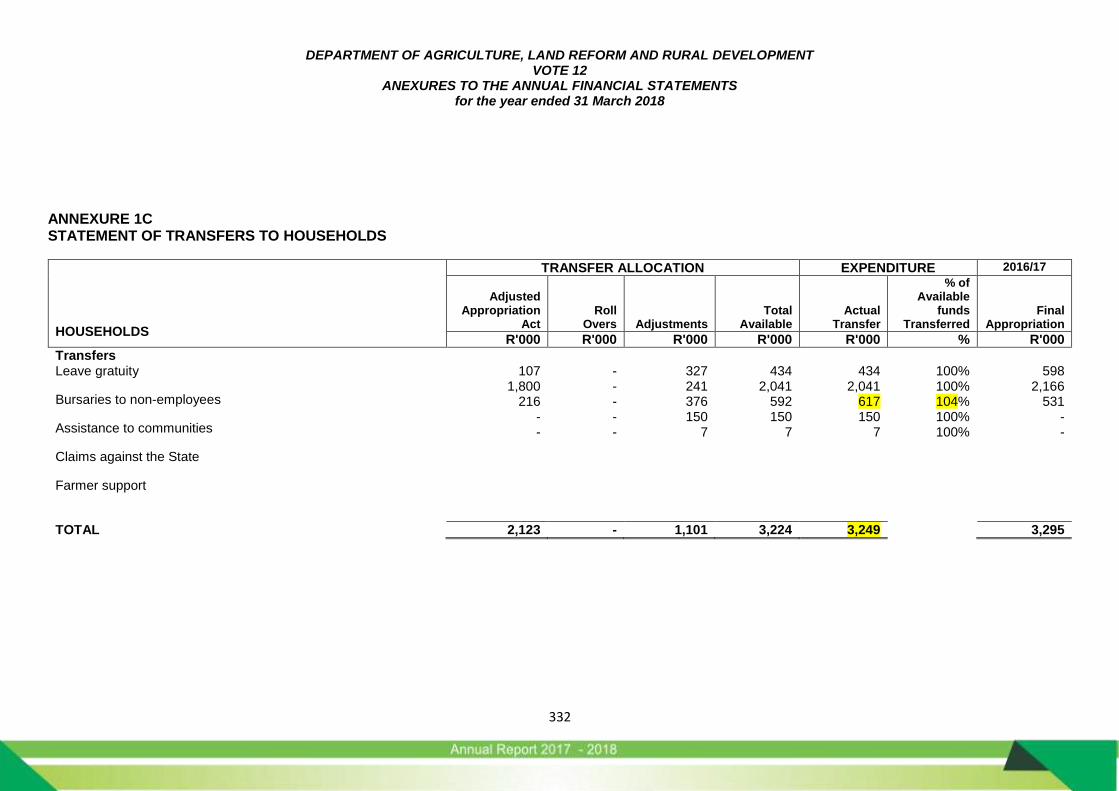
DEPARTMENT OF AGRICULTURE, LAND REFORM AND RURAL DEVELOPMENT VOTE 12
ANEXURES TO THE ANNUAL FINANCIAL STATEMENTS for the year ended 31 March 2018
332
ANNEXURE 1C STATEMENT OF TRANSFERS TO HOUSEHOLDS
HOUSEHOLDS
TRANSFER ALLOCATION EXPENDITURE 2016/17
Adjusted Appropriation
Act Roll
Overs Adjustments Total
Available Actual
Transfer
% of Available
funds Transferred
Final Appropriation
R'000 R'000 R'000 R'000 R'000 % R'000
Transfers Leave gratuity
Bursaries to non-employees
Assistance to communities
Claims against the State
Farmer support
107 1,800
216 - -
- - - - -
327 241 376 150
7
434 2,041
592 150
7
434 2,041
617 150
7
100% 100% 104% 100% 100%
598 2,166
531 - -
TOTAL 2,123 - 1,101 3,224 3,249 3,295
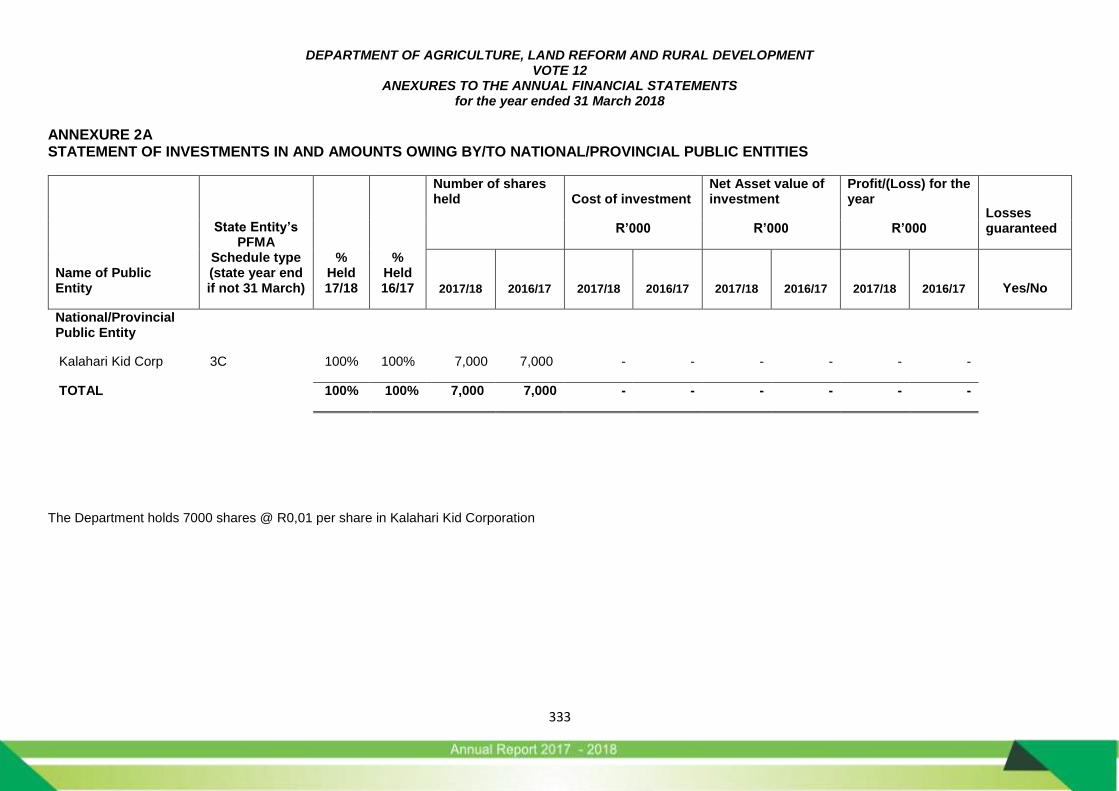
DEPARTMENT OF AGRICULTURE, LAND REFORM AND RURAL DEVELOPMENT VOTE 12
ANEXURES TO THE ANNUAL FINANCIAL STATEMENTS for the year ended 31 March 2018
333
ANNEXURE 2A STATEMENT OF INVESTMENTS IN AND AMOUNTS OWING BY/TO NATIONAL/PROVINCIAL PUBLIC ENTITIES
Name of Public Entity
State Entity’s PFMA
Schedule type (state year end if not 31 March)
% Held 17/18
Number of shares held Cost of investment
Net Asset value of investment
Profit/(Loss) for the year
Losses guaranteed R’000 R’000 R’000
% Held 16/17 2017/18 2016/17 2017/18 2016/17 2017/18 2016/17 2017/18 2016/17 Yes/No
National/Provincial Public Entity
Kalahari Kid Corp 3C 100% 100% 7,000 7,000 - - - - - -
TOTAL 100% 100% 7,000 7,000 - - - - - -
The Department holds 7000 shares @ R0,01 per share in Kalahari Kid Corporation
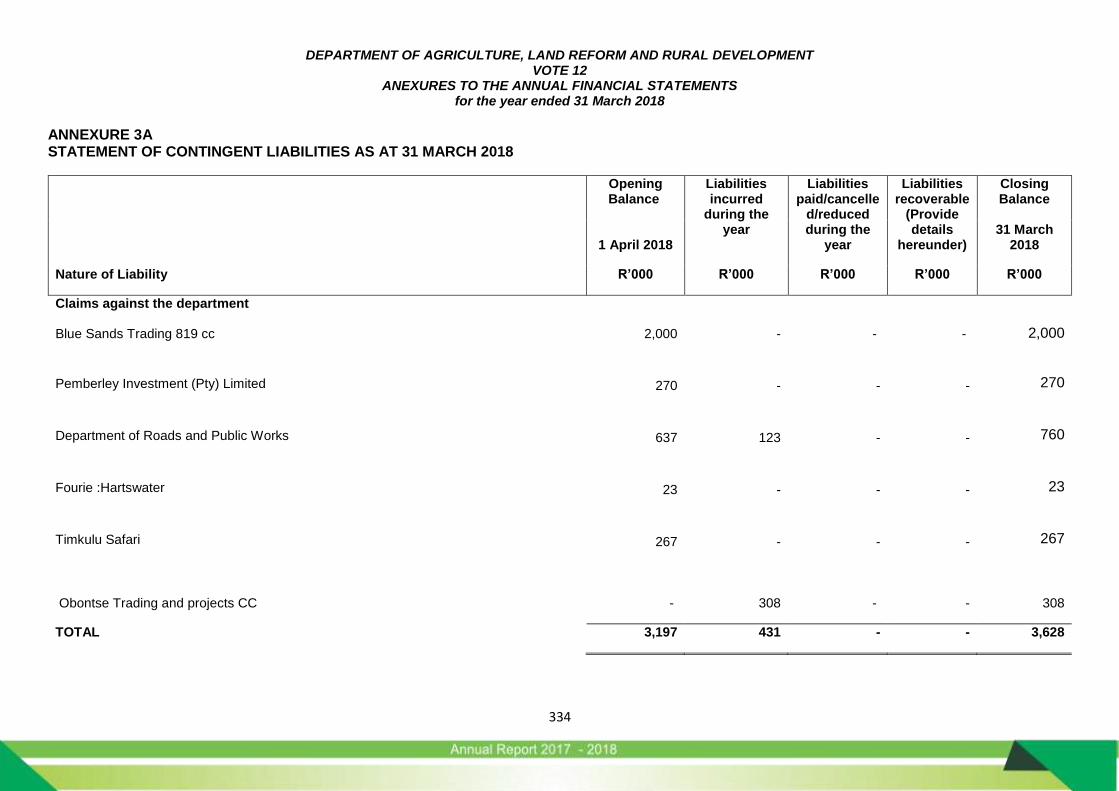
DEPARTMENT OF AGRICULTURE, LAND REFORM AND RURAL DEVELOPMENT VOTE 12
ANEXURES TO THE ANNUAL FINANCIAL STATEMENTS for the year ended 31 March 2018
334
ANNEXURE 3A STATEMENT OF CONTINGENT LIABILITIES AS AT 31 MARCH 2018
Nature of Liability
Opening Balance
Liabilities incurred
during the year
Liabilities paid/cancelle
d/reduced during the
year
Liabilities recoverable
(Provide details
hereunder)
Closing Balance
1 April 2018 31 March
2018
R’000 R’000 R’000 R’000 R’000
Claims against the department
Blue Sands Trading 819 cc 2,000 - - - 2,000
Pemberley Investment (Pty) Limited 270 - - -
270
Department of Roads and Public Works 637 123 - -
760
Fourie :Hartswater 23 - - -
23
Timkulu Safari 267 - - -
267
Obontse Trading and projects CC - 308 - - 308
TOTAL 3,197 431 - - 3,628
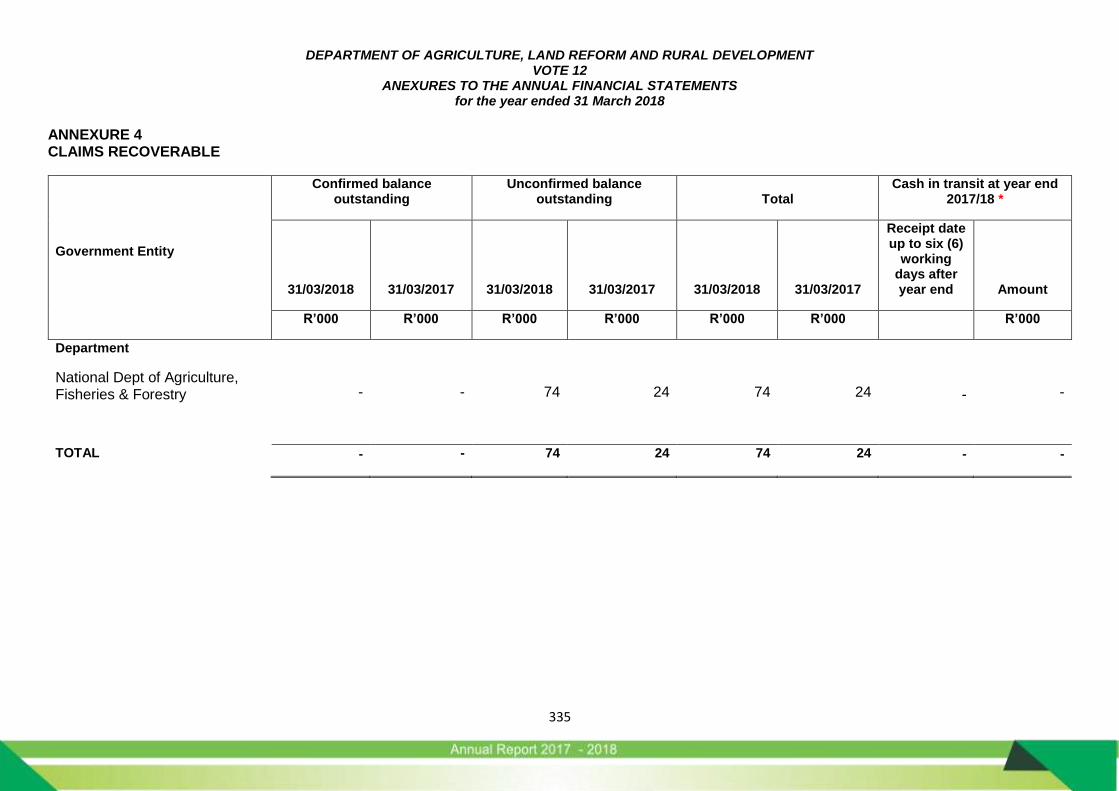
DEPARTMENT OF AGRICULTURE, LAND REFORM AND RURAL DEVELOPMENT VOTE 12
ANEXURES TO THE ANNUAL FINANCIAL STATEMENTS for the year ended 31 March 2018
335
ANNEXURE 4
CLAIMS RECOVERABLE
Government Entity
Confirmed balance outstanding
Unconfirmed balance outstanding Total
Cash in transit at year end 2017/18 *
31/03/2018 31/03/2017 31/03/2018 31/03/2017 31/03/2018 31/03/2017
Receipt date up to six (6)
working days after year end Amount
R’000 R’000 R’000 R’000 R’000 R’000 R’000
Department
National Dept of Agriculture, Fisheries & Forestry - - 74 24 74 24 - -
TOTAL - - 74 24 74 24 - -
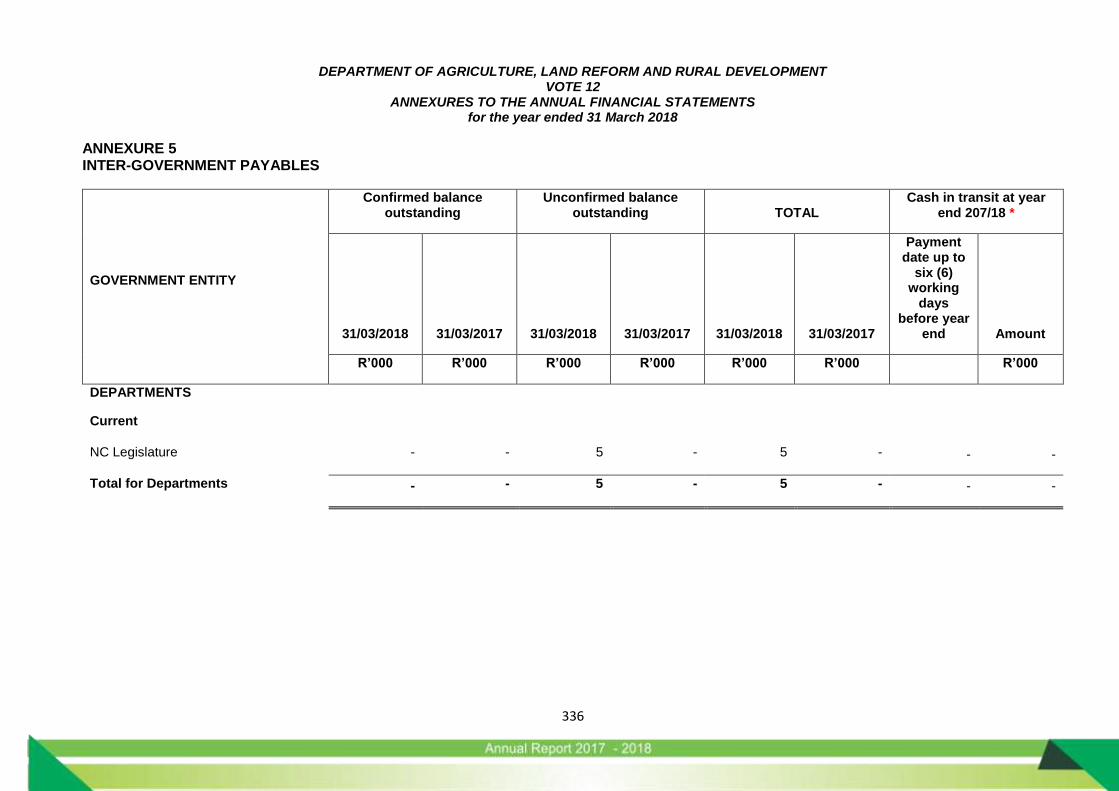
DEPARTMENT OF AGRICULTURE, LAND REFORM AND RURAL DEVELOPMENT VOTE 12
ANNEXURES TO THE ANNUAL FINANCIAL STATEMENTS for the year ended 31 March 2018
336
ANNEXURE 5 INTER-GOVERNMENT PAYABLES
GOVERNMENT ENTITY
Confirmed balance outstanding
Unconfirmed balance outstanding TOTAL
Cash in transit at year end 207/18 *
31/03/2018 31/03/2017 31/03/2018 31/03/2017 31/03/2018 31/03/2017
Payment date up to
six (6) working
days before year
end Amount
R’000 R’000 R’000 R’000 R’000 R’000 R’000
DEPARTMENTS
Current
NC Legislature - - 5 - 5 - - -
Total for Departments - - 5 - 5 - - -
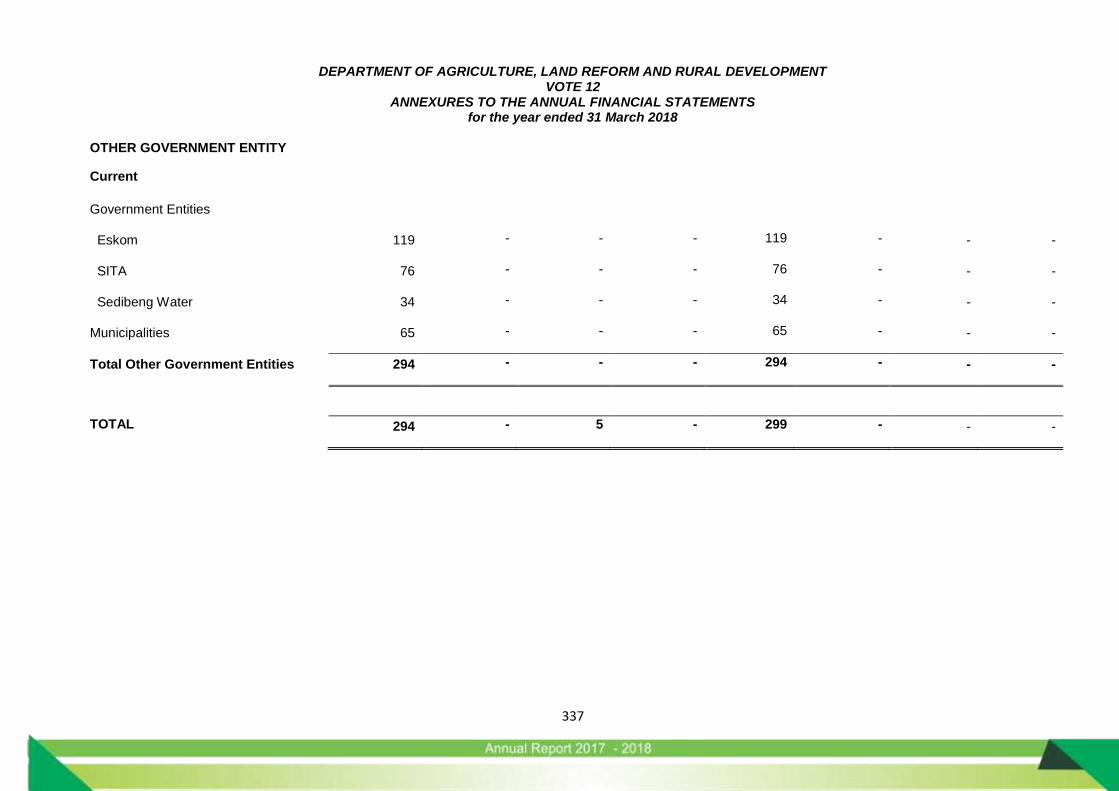
DEPARTMENT OF AGRICULTURE, LAND REFORM AND RURAL DEVELOPMENT VOTE 12
ANNEXURES TO THE ANNUAL FINANCIAL STATEMENTS for the year ended 31 March 2018
337
OTHER GOVERNMENT ENTITY
Current
Government Entities
Eskom 119 - - - 119 - - -
SITA 76 - - - 76 - - -
Sedibeng Water 34 - - - 34 - - -
Municipalities 65 - - - 65 - - -
Total Other Government Entities 294 - - - 294 - - -
TOTAL 294 - 5 - 299 - - -
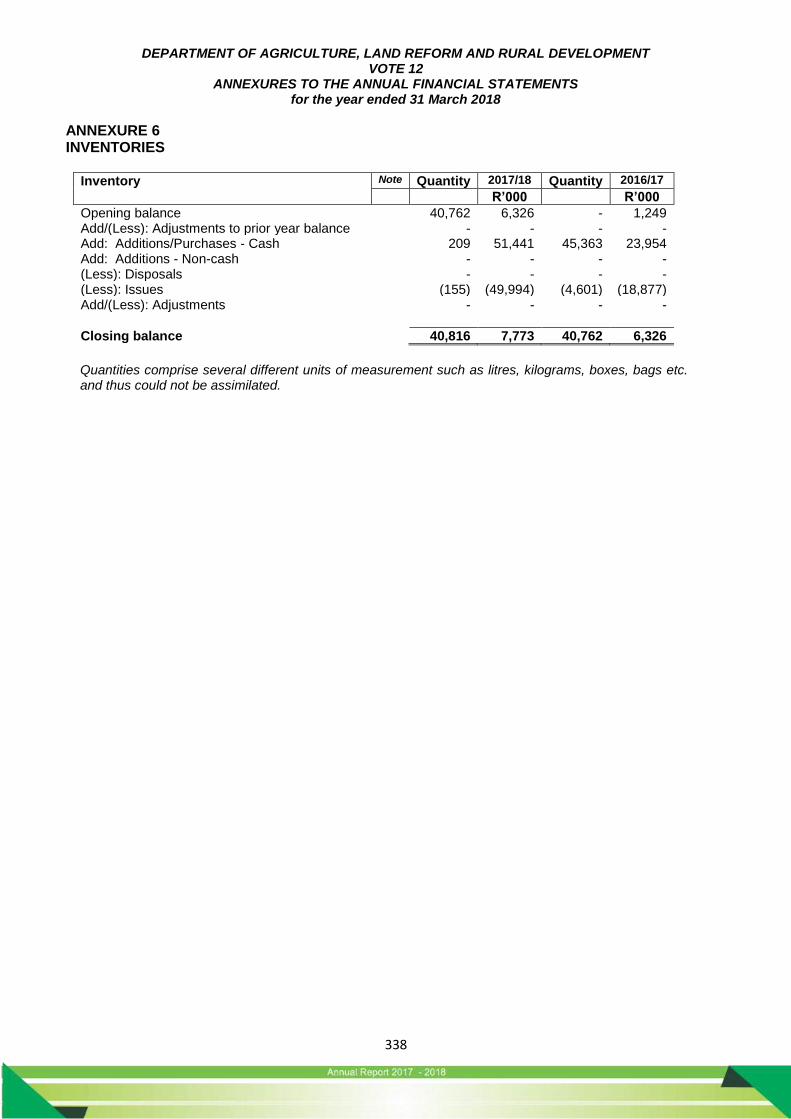
DEPARTMENT OF AGRICULTURE, LAND REFORM AND RURAL DEVELOPMENT VOTE 12
ANNEXURES TO THE ANNUAL FINANCIAL STATEMENTS for the year ended 31 March 2018
338
ANNEXURE 6 INVENTORIES
Inventory Note Quantity 2017/18 Quantity 2016/17
R’000 R’000
Opening balance 40,762 6,326 - 1,249 Add/(Less): Adjustments to prior year balance - - - - Add: Additions/Purchases - Cash 209 51,441 45,363 23,954 Add: Additions - Non-cash - - - - (Less): Disposals - - - - (Less): Issues (155) (49,994) (4,601) (18,877) Add/(Less): Adjustments - - - -
Closing balance 40,816 7,773 40,762 6,326
Quantities comprise several different units of measurement such as litres, kilograms, boxes, bags etc. and thus could not be assimilated.
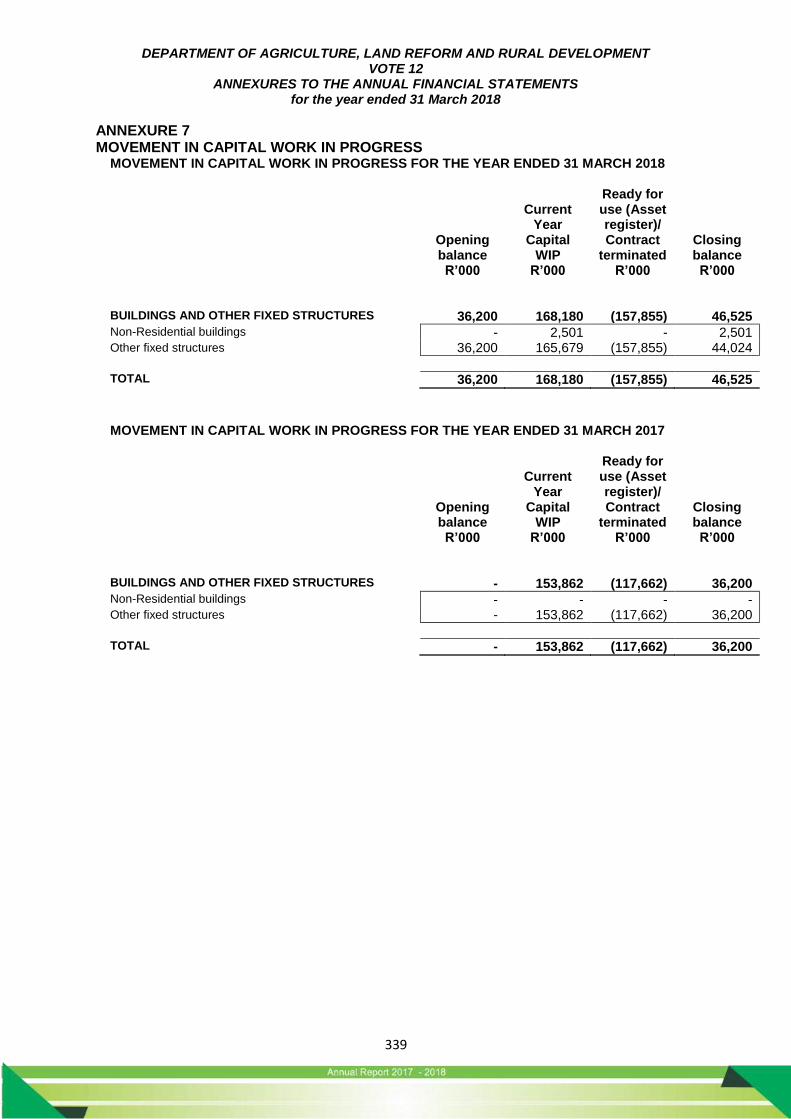
DEPARTMENT OF AGRICULTURE, LAND REFORM AND RURAL DEVELOPMENT VOTE 12
ANNEXURES TO THE ANNUAL FINANCIAL STATEMENTS for the year ended 31 March 2018
339
ANNEXURE 7 MOVEMENT IN CAPITAL WORK IN PROGRESS
MOVEMENT IN CAPITAL WORK IN PROGRESS FOR THE YEAR ENDED 31 MARCH 2018
Opening balance
Current Year
Capital WIP
Ready for use (Asset register)/ Contract
terminated Closing balance
R’000 R’000 R’000 R’000 BUILDINGS AND OTHER FIXED STRUCTURES 36,200 168,180 (157,855) 46,525 Non-Residential buildings - 2,501 - 2,501 Other fixed structures 36,200 165,679 (157,855) 44,024 TOTAL 36,200 168,180 (157,855) 46,525
MOVEMENT IN CAPITAL WORK IN PROGRESS FOR THE YEAR ENDED 31 MARCH 2017
Opening balance
Current Year
Capital WIP
Ready for use (Asset register)/ Contract
terminated Closing balance
R’000 R’000 R’000 R’000 BUILDINGS AND OTHER FIXED STRUCTURES - 153,862 (117,662) 36,200 Non-Residential buildings - - - - Other fixed structures - 153,862 (117,662) 36,200 TOTAL - 153,862 (117,662) 36,200
DEPARTMENT OF AGRICULTURE, LAND REFORM AND RURAL DEVELOPMENT VOTE 12
ANNEXURES TO THE ANNUAL FINANCIAL STATEMENTS for the year ended 31 March 2018
340