anion exchange membranes with high power density and
TRANSCRIPT
HAL Id: hal-03656369https://hal.archives-ouvertes.fr/hal-03656369
Submitted on 2 May 2022
HAL is a multi-disciplinary open accessarchive for the deposit and dissemination of sci-entific research documents, whether they are pub-lished or not. The documents may come fromteaching and research institutions in France orabroad, or from public or private research centers.
L’archive ouverte pluridisciplinaire HAL, estdestinée au dépôt et à la diffusion de documentsscientifiques de niveau recherche, publiés ou non,émanant des établissements d’enseignement et derecherche français ou étrangers, des laboratoirespublics ou privés.
Anion Exchange Membranes with High Power Densityand Energy Efficiency for Aqueous Organic Redox
Flow BatteriesMisgina Tilahun Tsehaye, Xian Yang, Tobias Janoschka, Martin Hager, Ulrich
Schubert, Emilie Planes, Fannie Alloin, Cristina Iojoiu
To cite this version:Misgina Tilahun Tsehaye, Xian Yang, Tobias Janoschka, Martin Hager, Ulrich Schubert, et al.. AnionExchange Membranes with High Power Density and Energy Efficiency for Aqueous Organic RedoxFlow Batteries. SSRN Electronic Journal, In press, 10.2139/ssrn.4007244. hal-03656369
1
Anion exchange membranes with high power density and energy efficiency for aqueous organic redox flow batteriesMisgina Tilahun Tsehayea,# , Xian Yangb,c,d, #, Tobias Janoschkad, Martin D. Hagerb,c, Ulrich S. Schubertb,c, Emilie Planesa, Fannie Alloina, Cristina Iojoiua*
a Univ. Grenoble Alpes, Univ. Savoie Mont Blanc, CNRS, Grenoble INP, LEPMI, 38 000 Grenoble, France
b Laboratory of Organic and Macromolecular Chemistry (IOMC), Friedrich Schiller University Jena, Humboldtstrasse 10, 07743 Jena, Germany
c Center for Energy and Environmental Chemistry Jena (CEEC Jena), Friedrich Schiller University Jena, Philosophenweg 7a, 07743 Jena, Germany
d JenaBatteries GmbH, Otto-Schott-Strasse 15, 07745 Jena, Germany
Corresponding authors:[email protected]@[email protected]#: Authors contributed equally.
AbstractMembrane development in organic redox flow batteries (ORFBs) is of significant importance. Herein, we
designed a series of anion exchange membranes made from poly(p-phenylene oxide) (PPO) with different
degrees of functionalization, cationic moieties and crosslinking degrees. We tested them in a N,N,N-2,2,6,6-
heptamethylpiperidinyl oxy-4-ammonium chloride/1,1′-dimethyl-4,4′-bipyridinium dichloride (TMA-
TEMPO/MV) based ORFB single cell to investigate the structure-property-performance relationship. The
common problem of active species crossover is solved by controlling the membrane water uptake below 70
wt.%, resulting in stable systems with coulombic efficiency of over 99.3%. The cell employing a membrane
prepared from PPO and trimethylamine moiety attached via a C6-spacer achieved the best overall cell
performance. It delivered high capacity retention (94% after over 100 consecutive cycles) and higher peak
power density (293 mW·cm-2 at 16 mL·min-1) and energy efficiency (80%) than the commercial reference
membrane FAA-3-50.
Keyword: Anion exchange membranes, aqueous organic redox flow battery, TMA-TEMPO, methyl viologen, power density, energy efficiency
Electronic copy available at: https://ssrn.com/abstract=4007244

2
Graphical abstractBy controlling the water uptake below 70 wt.% and involving a C6 spacer, the obtained membranes maintain excellent ion selectivity and conductivity, resulting in enhanced battery performance that breaks through the commercial membrane.
Electronic copy available at: https://ssrn.com/abstract=4007244
3
1. Introduction
Redox flow batteries (RFBs) increasingly developed to an excellent potential solution for stationary energy
storage in recent years [1–4]. They are expected to be in high demand as international climate initiatives,
such as the European Green Deal, are aiming to make our society climate neutral by using intermittent
energy sources [5]. To date, a large array of different flow battery systems has been reported, among which
the vanadium redox flow battery (VRFB) was industrialized at first and remained leading the flow battery
market [6,7]. Nowadays, organic redox flow battery (ORFB) systems have drawn extensive attention
because of the ever-growing need for sustainable development. In particular, water-based aqueous organic
redox flow batteries (AORFBs) represent promising candidates as they omit critical metals [8,9]. Limited
by the electrochemical stability window of water (~1.23 V), most efforts on AORFB development have
been focused on creating redox-active species with high solubility and stability aiming for enhanced energy
density [8,10].
As another key component, membrane development is of equal importance. However, it requires
differentiated emphases with respect to a particular electrochemical system. For instance, researchers have
attempted to reduce the cost of VRFB systems by finding cheaper alternatives to replace Nafion® [11–13].
For hybrid RFBs involving hazardous or corrosive materials like bromine, high membrane chemical
stability is required to withstand the harsh condition [14]. In organic systems, however, membrane
development has usually been overlooked as in most cases commercial membranes are used to gain a first
insight into the properties of newly developed redox-active materials [15–17]. Recently, a number of
systematic studies on the properties of commercial membranes, aiming to boost the cell performance in
ORFB systems were published [18,19]. Nevertheless, the exact chemical structures of commercially
available membranes are usually not publicly disclosed, making it increasingly difficult to further enhance
the performance of a battery system from the perspective of membranes. Overall, the synthesis of an
appropriate membrane at a low-cost combining high ionic conductivity and selectivity is of utmost
importance for widespread adoption and commercialization of high-performance, efficient and stable
AORFBs [8].
As a consequence, in a previous work, we studied the interrelation between the properties of poly(p-
phenylene oxide) (PPO) based anion exchange membranes (AEMs) and corresponding cell performance in
an ORFB single cell using N,N,N-2,2,6,6-heptamethylpiperidinyl oxy-4-ammonium chloride and 1,1′-
dimethyl-4,4′-bipyridinium dichloride as active species (TMA-TEMPO/MV) [20], see the half-cell
reactions in Figure S1. Detailed information on the solubility behavior of TMA-TEMPO and MV is
discussed in elsewhere [15]. A high ion exchange capacity (IEC), low water uptake and high chloride ion
Electronic copy available at: https://ssrn.com/abstract=4007244
4
conductivity were identified as key parameters for preparing AEM with a good battery efficiency and
performance. However, in the study, only the impact of IECs on the overall cell performance was
investigated, thus the impact of other key parameters, such as crosslinking vs linear nature, use of spacer
between polymer backbone and ionic function and type of cation requires further investigation.
Inspired by our recent findings, we here envisioned a TMA-TEMPO/MV based AORFB featuring a pH-
neutral electrolyte with high energy efficiency, peak power density and excellent coulombic efficiency by
preparing and employing AEM with optimized water uptake and high chloride conductivity. In this work,
we further investigate how the choice of the cationic moiety, the presence of a spacer, IEC value and the
polymer crosslinking degree will reflect upon the final cell performance. A series of flexible AEMs
composed of PPO functionalized either with 1,4-diazabicyclo-[2.2.2]-octane (DABCO) or trimethylamine
(TMA) were fabricated. DABCO and TMA were chosen because of their commercial availability,
straightforward functionalization protocols and chemical stabilities in neutral pH systems. In addition,
DABCO has the possibility of preparing cross-linked architectures due to its two reactive sites. Most of the
prepared membranes employ a spacer between the polymer backbone and cation moiety in order to provide
a nanophase separated morphology with well-defined ionic channels [21] and in order to tune the
hydrophobicity of the membranes. For the purpose of comparison, the well-performing commercial FAA-
3-50 membrane was used as a reference.
2. Experimental2.1. Materials
Poly(2,6-dimethyl-1,4-phenyleneoxide) (PPO) (Mn = 20,000, Đ= 2.5) was purchased from Polysciences
Inc. Methanol (99.9%) was purchased from Fisher Scientific. N-Bromosuccinimide (NBS) (99%), 2,2’-
azobis(2-methylpropionitrile) (AIBN) (98%), tetrahydrofuran (THF, ACS, >99%), 6-bromohexanoyl
chloride (97%), diethyl ether (99+%), chloroform-d (CDCl3-d, 99.9% D) and 1,4-diazabicyclo[2.2.2]octane
(98%, DABCO) were purchased from Sigma-Aldrich. Dimethyl sulfoxide-d6 (DMSO-d6, 99.9%), AlCl3
(98.5%, anhydrous), N,N-dimethylacetamide (DMAc, 99.0%) and N-methyl-2-pyrrolidone (NMP, reagent
grade) were supplied from Acros Organics. Chlorobenzene (ACS reagent, ≥ 99.5%) and trimethylamine
(TMA, 1 M soln. in THF) was bought from Alfa Aesar. MV and TMA-TEMPO were provided by
JenaBatteries GmbH. All chemicals were used as received. The FAA-3-50 AEM was purchased from
Fumatech GmbH.
Electronic copy available at: https://ssrn.com/abstract=4007244
5
2.2. Polymer synthesis
In order to introduce the cation, commercial PPO (Mn = 20,000 g·mol-1, Đ = 2.5) was first brominated either
by the bromination of benzylic methyl resulting in bromomethylated PPO (PPO-Br) or by acylation
resulting in bromohexanone PPO with a six-carbon pendant chain spacer (PPO-6CO-Br).
PPO-6CO-Br: The synthesis was carried out based on a slight modification of the method described by
Hibbs [22] and Parrondo et al. [23]. PPO-6CO-Br polymers with 57, 33 and 15% degree of bromination
were prepared. In a representative example for PPO-6CO-Br with 33% degree of bromination, 5 g PPO
(41.67 mmol polymer repetitive units) was dissolved in 200 mL of chlorobenzene in a round bottom flask
and flushed with argon. The reaction flask was chilled in an ice bath for about 30 min. Subsequently, 9.6
mL of 6-bromohexanoyl chloride (62.7 mmol) and 2.5 g of AlCl3 (Lewis acid catalyst, 18.75 mmol) were
added. Finally, the ice bath was removed, and the stirred reaction mixture was allowed to react at room
temperature for 24 h followed by precipitation in methanol (1 L) to obtain the PPO-6CO-Br polymer. It
was then dried under vacuum at 60 °C for 24 h. A white solid product was obtained (7.2 g, 97.3% yield).
The polymer showed approximately 0.33 mol of bromomethyl groups per polymer repeats unit. The
protocol is summarized in Scheme 1. A similar protocol was followed to prepare the PPO-6CO-Br polymer
with 57% and 15% degree of functionalization. To obtain the PPO-6CO-Br with 57% degree of
bromination, the same amounts of 6-bromohexanoyl chloride and AlCl3 were used to brominate 2.5 g of
PPO. Whereas, for the bromination of PPO-6CO-Br with 15% degree, 4.8 mL 6-bromohexanoyl chloride
and 1.25 g AlCl3 were used for 5 g PPO. The degree of bromination/functionalization was determined by 1H NMR spectroscopy.
PPO-Br: PPO was brominated using NBS as brominating agent and AIBN as initiator in a free-radical
bromination [24]. First, 3 g of PPO (25 mmol repeat units) was dissolved in 30 mL chlorobenzene. 1.79 g
of NBS (11.05 mmol) and 0.099 g of AIBN (0.6 mmol) were added. After 3 h of reaction under reflux, the
reaction mixture was precipitated in an excess of methanol (300 mL) and formed a light-brown precipitate
of PPO-Br. The PPO-Br polymer was filtered and dried in a vacuum oven at 60 °C for 24 h before use. The
degree of bromination (26.5%) was calculated from the 1H NMR spectrum.
2.3. Fabrication of membranes
In total, eight membranes were prepared and named from M1 to M8. Table 1 summarizes the composition
and nomenclature of the membranes. For the cross-linked membranes M1 and M2, simultaneous
quaternization and membrane preparation procedure was followed. The ratio between the quantity of
bromomethyl groups in the PPO-6CO-Br polymer and DABCO was varied to yield membranes with
different degrees of crosslinking. In a representative example to prepare M1 using PPO-6CO-Br polymer
Electronic copy available at: https://ssrn.com/abstract=4007244
6
with degree of functionalization of 57%, 0.15 g of PPO-6CO-Br (0.387 mmol Br units) was dissolved in
DMAc (2 mL). Subsequently, 13.5 mg DABCO (0.12 mmol, in solution of 1 mL DMAc) was added
dropwise under stirring for 40 min at 80 °C to initiate and promote crosslinking. The prepared solution
mixture was degassed under reduced pressure, poured onto a 5 cm diameter petri dish and kept at 60 °C in
an oven for 24 h to ensure the simultaneous cross-linking and quaternization reaction. In order to replace
the remaining Br units, the dry membrane was immersed in deionized water containing TMA in a 3% molar
excess with respect to the Br units in PPO-6CO-Br for 24 h. A similar procedure was followed for the
synthesis of M2 membrane: 0.125 molar excess of DABCO with respect to the Br units in the polymer was
used.
For the linear polymers DABCO-based membranes M3 to M6, a different procedure was followed. The
PPO-6CO-Br polymer with 33%-degree of bromination and the DABCO were dissolved in DMAc
(7wt/v%.). DABCO was added in excess (see Table 1) to avoid crosslinking. As discussed for the other
membranes, the solution containing the polymer and DABCO was stirred for 24 h and poured onto a petri
dish. It was kept in an oven at 60 °C for 24 h to ensure the complete quaternization and solvent evaporation.
To remove the excess amines and remaining solvents, the dried membranes were soaked in deionized water
for 24 h. To prepare M5, dry M4 was re-dissolved in DMAc and an excess iodomethane was added to
quaternize the free tertiary amine. For M6, PPO-6CO-Br polymer with lower degree of bromination (15%)
was used.
For the TMA-based membranes M7 and M8, the brominated polymers were first dissolved in the respective
solvents (7 wt./v%); PPO-6CO-Br in DMAc and PPO-Br in NMP (as the polymer was not completely
soluble in DMAc). For example, to prepare M7, 0.15 g of PPO-6CO-Br was dissolved in DMAc (7 wt./v
%), and TMA (3% molar excess with respect to the Br units in the polymer) was added. The procedures
followed to prepare the membranes are schematically represented in Scheme 1.
Electronic copy available at: https://ssrn.com/abstract=4007244

7
Scheme 1: Schematic representation of the syntheses of AEMs based on PPO-Br and PPO-6CO-Br polymer
backbones. Bromide and iodine ions in the final membranes were replaced by chloride ions for further
characterizations and cell tests.
Electronic copy available at: https://ssrn.com/abstract=4007244

8
Table 1: Composition and nomenclature of the AEM prepared.
* Values in brackets are amount of TMA used with respect to the Br units in the polymer
** Methylated with excess iodomethane
2.4. Characterizations2.4.1. Structural characterization
1H NMR spectroscopy was used to determine the membrane’s polymer structures. A Bruker AV 400 NMR
spectrometer was used to record the 1H NMR spectra. DMSO-d6 (δ = 2.50 ppm) or CDCl3 (δ = 7.26 ppm)
were used as solvents.
2.4.2. Chloride ion conductivity
The prepared membranes were converted to Cl- form by exchanging the original Br- form of resulting
membranes in a saturated NaCl (1 M) aqueous solution at room temperature for 48 h, followed by
immersion in deionized water overnight to remove the excess of salt. The conductivity of the membranes
was measured via the through-plane impedance technique using a homemade measuring cell and a HP
response analyzer by two-point probe impedance method in the AC frequency ranging from 13 MHz to 5
Hz.
The conductivity was calculated accordingly to equation (1):
(1)𝜎 = 𝐿
𝑅 𝑥 𝐴
Where is the ionic conductivity (S·cm-1), L (cm) is the distance between the electrodes (wet membrane 𝜎
thickness), R (Ω) is the resistance of the membrane obtained at high frequency and A (cm2) is the membrane
active area (0.0314 cm2). To obtain membrane resistance, cell resistance is first measured without
Membrane Polymer
(degree of bromination)
Cation Reaction ratio:
(mol amine)/(mol Br units in the
polymer)
M1 PPO-6CO-Br (57%) DABCO + TMA 0.31 + (3)*
M2 PPO-6CO-Br (57%) DABCO + TMA 0.125 + (3)*
M3 PPO-6CO-Br (33%) DABCO 3
M4 PPO-6CO-Br (33%) DABCO 2
M5 PPO-6CO-Br (33%) DABCO 2 + **
M6 PPO-6CO-Br (15%) DABCO 2
M7 PPO-6CO-Br (33%) TMA 3
M8 PPO-Br (26%) TMA 3
Electronic copy available at: https://ssrn.com/abstract=4007244
9
membrane and then subtracted from the cell resistance with membrane. The average of at least three
measurements was used to calculate the ionic conductivity.
2.4.3. Ionic exchange capacity and water uptake
The IEC (mmol·g-1), i.e., the number of charged functional groups per gram of polymer, was measured by
Mohr titration method [25]. Therefore, the membranes were converted to Cl- form as discussed above.
Membrane samples (~ 0.05 g) were dried in a vacuum oven at 50 °C for 24 h. The dry weight of the
membranes was recorded before immersion in 0.5 M aq. Na2SO4 (25.00 mL), followed by replacing the
Cl− anions contained in the membranes with SO42−, for at least 48 h under stirring. Three samples of the
resulting solution (containing released Cl− ions) were titrated with 0.01 M aq. AgNO3. K2CrO4 was used as
an indicator. The IEC of the membranes is calculated using the following equation (2):
(2) 𝐼𝐸𝐶 = 𝑉𝑜𝑙𝑢𝑚𝑒 𝑜𝑓 𝐴𝑔𝑁𝑂3 (mL) 𝑥 𝐶𝑜𝑛𝑐𝑒𝑛𝑡𝑟𝑎𝑡𝑖𝑜𝑛 𝑜𝑓 𝐴𝑔𝑁𝑂3(mmol/mL)
𝑔 (𝑤𝑒𝑖𝑔ℎ𝑡 𝑜𝑓 𝑑𝑟𝑦 𝑚𝑒𝑚𝑏𝑟𝑎𝑛𝑒)
Water uptake (WU) of the membrane after immersion in water at room temperature for 24 h is calculated
using the weight of the dry and wet membrane samples. The WU of the membrane is calculated using
equation (3):
(3)𝑊𝑈(%) =𝑊𝑤𝑒𝑡 ‒ 𝑊𝑑𝑟𝑦
𝑚𝑑𝑟𝑦 𝑥 100
The hydration number (or membrane water concentration) (λ), defined as the number of water molecules
per ionic group, is calculated from equation (4):
(4) 𝜆 = (𝑊𝑤𝑒𝑡 ‒ 𝑊𝑑𝑟𝑦
18.01 )( 1000𝐼𝐸𝐶 𝑥 𝑊𝑑𝑟𝑦 ) =
𝑊𝑈 (%) 𝑥 10𝐼𝐸𝐶 𝑥 18.01
2.4.4. Degree of crosslinking
The degree of crosslinking of M1 and M2 membranes was calculated from the feed ratio of DABCO (crosslinker) and brominated polymer using the following equation (5):
(5)𝐷𝑒𝑔𝑟𝑒𝑒 𝑜𝑓 𝑐𝑟𝑜𝑠𝑠𝑙𝑖𝑛𝑘𝑖𝑛𝑔(%) =𝑛𝐷𝐴𝐵𝐶𝑂
𝑛𝐵𝑟/2 𝑥 100
Where nDABCO and nBr are the amounts of DABCO (mol) added and bromine groups (mol) in the polymer,
respectively.
2.4.5. Atomic force microscopy (AFM)
After being soaked with a drop of water, the membrane sample surfaces were immediately imaged at room
temperature and 40 to 60% relative humidity using a Nanowizard (JPK) of CIME Nanotech platform
Electronic copy available at: https://ssrn.com/abstract=4007244

10
(Grenoble, France). Experiments were performed in the tapping mode using Si probes with 5 N·m-1 spring
constant and resonance frequencies in the range 60 to 80 kHz. Phase and height images were recorded
simultaneously. The images were acquired in hard tapping conditions: the interaction of the tip with the
specimen was adjusted by the ratio of the set point (Asp) to the free oscillation amplitude (A0), to obtain a
ratio Asp/A0 equal to 0.7 to 0.8. Under these operating conditions, the morphology of the samples is better
revealed. The image processing was conducted in “Gwyddion”, while “ImageJ” open-source software was
employed for the image analysis.
The ionomers’ surfaces of the membrane samples showed morphologies with distinct phases. The ionic
domains and hydrophobic backbones were identified following the procedure developed by James et
al.[26]. Post treatment of the phase images permitted to characterize the different domains. After fixing the
phase scale between -10° and 10°, a tailored procedure, which automatically iterates a threshold, a
binarization, a noise correction, a watershed segmentation, and a particle analysis, furnished the proportion
of surface of ionic domains and their average size. Five images for each polymer were analyzed.
2.4.6. Organic flow battery single cell tests2.4.6.1. Charge-discharge cycling
The cell tests were carried out in an air-conditioned room (22 °C). All membranes were investigated in a
standard lab-scale flow battery single cell with an active area of 5 cm2 (JenaBatteries GmbH), which was
reported previously [15,20,27]. The cell setup adopts a sandwiched architecture with a ‘flow-through’
design of flow field. 10 mL of 1.12 mol·L-1 TMA-TEMPO aqueous solution (aq.) serves as the catholyte
and 10 mL of 1.49 mol·L-1 MV (aq.) as the anolyte. Because the electrolyte conductivity is adequate for a
working cell, no additional supporting electrolyte was added. The electrodes (thickness 4.6 mm), made of
carbon felt, were used as received from the supplier (SGL Carbon, GFA6) and cut to designated size of 5
cm2 square. A current collector (thickness 3 mm) made of graphite, type JP 945 (Mersen, France), was
used. Ratio of N/P capacities was 1.33.
All membranes were firstly shaped into a square of 3 × 3 cm and then immersed in 0.5 M NaCl (aq.) for at
least 24 h before test. The cell setup was assembled with a sealing torque of 1.5 N·m. Afterwards, a gas
leakage test was performed before connecting the reservoirs to the cell setup. The peristatic pump (Heidolph
Pumpdrive 5201, MASTERFLEX pump) speed was set at 80 rpm, which corresponds to 16 mL·min-1 as
calibrated with the electrolyte solutions. A potentiostat/galvanostat with electrochemical impedance
spectroscopy capability (Biologic VMP3, France) was used for all electrochemical experiments.
Electronic copy available at: https://ssrn.com/abstract=4007244
11
The cell resistance was measured via potentiostatic electrochemical impedance spectroscopy (PEIS) before
the start of charge-discharge cycling tests and after it ended. The membrane resistance is calculated as the
difference of cell resistance with membrane and without membrane.
A straightforward protocol was used for battery cycling that helps to differentiate the influence of resistance
and crossover on capacity. The first charge-discharge cycle was carried out at low current density
(20 mA·cm-2) to prime the cell and establish its initial capacity. Then the cell was charged-discharged
continuously for 100 cycles at high current density (80 mA·cm-2). The last two cycles were operated at
20 mA·cm-2 to provide evidence for a comprehensive assessment of the membrane performance. 1.5 V
were used as upper cut-off voltage and 0.9 V as lower cut-off voltage. The coulombic efficiency (CE) and
energy efficiency (EE) were provided by EC-Lab Version 11.27, whereas voltage efficiency (VE) is
calculated from EE and CE. They are defined as:
(6)𝐶𝐸 =𝑄𝑑
𝑄𝑐 𝑥 100%
(7)𝑉𝐸 =𝑈𝑑
𝑈𝑐 𝑥 100%
(8)𝐸𝐸 = 𝐶𝐸 𝑥 VE
Where Qd is the discharging capacity, Qc is the charging capacity at constant current; Ud is the mean
discharging cell voltage and Uc is the mean charging cell voltage at constant current.
2.4.6.2. Polarization curves
The polarization curve measurements were carried out after the charge-discharge cycling process
mentioned above. Therefore, the cell was equipped with fresh electrolyte solutions to prevent influence
from previous cross-contamination effects of redox-active molecules. Ten charge-discharge cycles were
performed utilizing the same protocol as described above to prime the cell. Finally, the polarization curves
were acquired at a flow rate of 16 mL·min-1 by discharging at full state of charge (SOC) for 30 s over a
range of current densities (10 to 600 mA·cm-2) until the cut-off voltage (0.2 V) was achieved. In-between
the discharging steps, the cell was recharged at 50 mA·cm-2 until the cut-off voltage of 1.5 V was reached.
Afterwards, the pump speed was increased to 120 rpm, which corresponds to 24 mL·min-1 by calibration,
followed by the same process as at 16 mL·min-1. The discharging cell voltage of each cycle at the 30th
second was taken to calculate the power density at the current density of this specific cycle.
Electronic copy available at: https://ssrn.com/abstract=4007244

12
2.4.6.3. Cyclic voltammetry
The electrolyte solutions in both reservoirs before and after the cell cycling tests were investigated via
cyclic voltammetry in order to study crossover of TMA-TEMPO and MV. 100 µL of the electrolyte sample
was added into the 4.6 mL of 0.5 M NaCl (aq.) under the protection of argon after recording the background
signal. The test setup is a three-electrode system, where glassy carbon serves as the working electrode,
platinum wire as the counter electrode and silver/silver chloride as the reference electrode. Before each
measurement, the glassy carbon electrode was polished with figure-eight motions in a water/alumina slurry
to generate fresh surface [28]. Each electrolyte sample was scanned six times within the voltage range of
0.75 to 1.05 V at a scan rate of 200 mV·s-1. After each measurement, the background signal was subtracted
and the fourth scan was chosen to prepare comparative graphs.
3. Results and discussion3.1. Polymers and membranes preparation
Eight AEMs based on PPO-Br and PPO-6CO-Br polymers were prepared according to Scheme 1. The
successful bromination of PPO in the benzylic position (PPO-Br) was confirmed by analysis of 1H NMR
spectra (Figure 1). The calculated degree of bromination was 26%, determined from the integrals of the
characteristic proton peak of –CH2Br at 4.3 ppm (Figure 1b, peak b) and the non-brominated CH3 groups
(Figure 1b, peak a). The functionalization of PPO with bromohexanone (C6 spacer) using 6-bromo-1-
hexanoyl chloride as a Friedel–Crafts acylation reagent was also determined by 1H NMR spectra (Figure
1c). Specifically, the signal at 3 ppm (peak i) represents the protons adjacent to the ketone group. Whereas,
the protons in the bromomethyl group are assigned to the signal at 3.4 ppm (peak e). The degree of
functionalization was found to be 33%. Similarly, polymers with 57 and 15% degree of functionalization
were obtained.
Electronic copy available at: https://ssrn.com/abstract=4007244
13
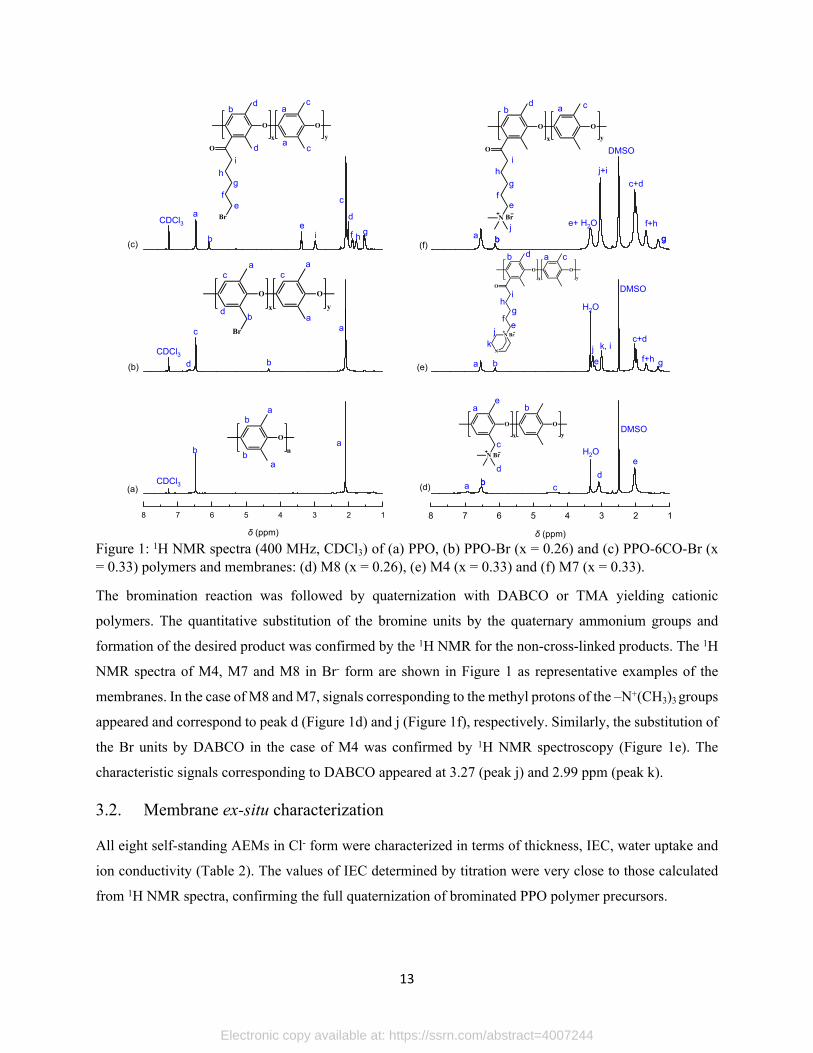
Figure 1: 1H NMR spectra (400 MHz, CDCl3) of (a) PPO, (b) PPO-Br (x = 0.26) and (c) PPO-6CO-Br (x = 0.33) polymers and membranes: (d) M8 (x = 0.26), (e) M4 (x = 0.33) and (f) M7 (x = 0.33).
The bromination reaction was followed by quaternization with DABCO or TMA yielding cationic
polymers. The quantitative substitution of the bromine units by the quaternary ammonium groups and
formation of the desired product was confirmed by the 1H NMR for the non-cross-linked products. The 1H
NMR spectra of M4, M7 and M8 in Br- form are shown in Figure 1 as representative examples of the
membranes. In the case of M8 and M7, signals corresponding to the methyl protons of the –N+(CH3)3 groups
appeared and correspond to peak d (Figure 1d) and j (Figure 1f), respectively. Similarly, the substitution of
the Br units by DABCO in the case of M4 was confirmed by 1H NMR spectroscopy (Figure 1e). The
characteristic signals corresponding to DABCO appeared at 3.27 (peak j) and 2.99 ppm (peak k).
3.2. Membrane ex-situ characterization
All eight self-standing AEMs in Cl- form were characterized in terms of thickness, IEC, water uptake and
ion conductivity (Table 2). The values of IEC determined by titration were very close to those calculated
from 1H NMR spectra, confirming the full quaternization of brominated PPO polymer precursors.
8 7 6 5 4 3 2 1
ba
a
b
ab
a
a
CDCl3
CDCl3
CDCl3
b
(a)
(b)
δ (ppm)
b
O
n
d
a
a
d
cc
c
OO
x y
Br
a
d c
cad
b
ih
gf
e
gh
d
c
f
b
a
ei
(c)
O O
Br
Ox y
8 7 6 5 4 3 2 1
j
ih
OO
x y
N Br
bb
ae
c
d
gb(f)
(e)
(d)
g
f+h
c+d
ba
e
cd
b
a
DMSO
H2O
δ (ppm)
cadb
ih
cadb
gf
ej
k
gf+h
c+dk, i
ej
H2O
a b
DMSO
O O
N
Ox y
N
Br
gf
e
DMSO
j+i
e+ H2O
O O
Ox y
N Br
Electronic copy available at: https://ssrn.com/abstract=4007244
14
In particular, water uptake is a key factor as it affects the ionic conductivity, the dimensional stability and
selectivity (cross contamination of redox active species) of the membranes [18]. At the same time, an
optimum water uptake plays a significant role in formation of phase separated and percolated conducting
domains and enhances the ionic conductity of the membrane [29]. In general, increasing the IEC leads to
increased water uptake and, hence, membrane ion conductivity and ionic domain sizes. Hence, a proper
range of IEC is necessary to reach a balance between the membrane ion selectivity and conductivity.
Table 2 : Membranes ex-situ characterizations : Thickness, IEC, water uptake and Cl- ion conductivity
* The IECs (which are determined using 1H NMR) have a 5% margin of error.
** Based on the degree of polymer bromination.
*** Data taken from the technical datasheet provided by the manufacturer.
**** The hydration number is calculated using the average value of the IEC range (1.6 ~ 2.1), which is 1.85 mmol Cl·g-1.
The water uptake of the membranes also strongly depends on the degree of crosslinking. For instance,
despite the high IECs (2.5 mmol Cl-·g-1) of the M1 and M2 membranes, they exhibited extremely low water
uptakes of 8 and 10 wt.%, respectively. As a result, the hydration numbers (λ) were found to be only about
2. The theoretical degree of crosslinking of M1 and M2 membranes is estimated (equation 5) to be 31 and
12.5%, respectively. In comparison, the water uptakes of M4, M5, M6, which are non-cross-linked are
much higher. The water uptakes of these membranes increased with the increase of IECs. Among them,
M5 achieved as high as 95 wt.% water uptake owing to the high IEC of 3.0 mmol Cl-·g-1, which stems from
the full quaternization of the two amine units in DABCO. Whereas the membrane with the lowest IEC (M6,
0.95 mmol Cl-·g-1) displayed the lowest water uptake (19 wt.%). It is noteworthy that M3 and M4 show the
same chemical structure and IEC, but the water uptake of M3 is found to be higher than M4. This could be
IEC (mmol Cl-·g-1)Membrane Thickness (µm)
1H NMR* Titration
Water uptake(wt. %)
Cl- conductivity (mS·cm-1)
Hydration number (λ)
M1 82 2.50** 2.48 ± 0.06 8 1 1.8
M2 28 2.49** 2.48 ± 0.06 10 0.8 2.2
M3 130 1.65 1.63 ± 0.05 64 6 22
M4 60 1.65 1.64 ± 0.05 42 5 14
M5 60 3.05 3.0 ± 0.11 95 30 17.6
M6 60 0.96 0.95 ± 0.09 19 3 11
M7 60 1.8 1.79 ± 0.06 25 4.3 8
M8 60 1.8 1.8 ± 0.04 20 2.1 6
FAA-3-50 50 1.6 - 2.1*** n.a. 17 1.7 5****
Electronic copy available at: https://ssrn.com/abstract=4007244

15
due to potential formation of free volumes during the elaboration process caused by the utilization of excess
DABCO (Table 1) that will be washed from the membrane. Indeed, the thickness might have influenced
the homogeneity of the quaternization reaction in the depth of the membrane and the evaporation rate of
the solvent during the drying process. As a result, the λ of M6, M4 and M5 was found to be 11, 14 and 17.6,
respectively.
In contrast, the reference FAA-3-50 membrane, which is reported to be a PPO-based polymer [30,31],
displayed a low water uptake (17 wt.%) and λ (5 water molecules per ionic function).
Two TMA-based membranes with the same IEC, M7 and M8, exhibited water uptake values of 25 and 20
wt.%, respectively, lower than the DABCO-based membranes (M3 and M4) despite of having slightly
higher IEC. This suggests the cation type is another important factor to consider, when designing AEMs
for RFBs. The slightly higher water uptake in the case of M7 could be due to the presence of a C6 side
chain spacer that allow the increase of free volume as well as the formation of larger ionic domains which
promote distinct water rich domains [32]. As a result, the λ of M7 (8 water molecules per ionic function)
was higher than that of M8 (6 water molecules per ionic function).
Besides water uptake, a membrane with high Cl- ion conductivity is important for having an AORFB with
high power density. The Cl- ion conductivity of the membranes, measured at room temperature, is
summarized in Table 2. Among all the membranes, M5 recorded an outstanding Cl- ion conductivity of 30
mS·cm-1. This high value could be attributed to the very high IEC (since both amine units of DABCO are
quaternized) and water uptake of the membrane. However, the membrane was brittle, especially in dry
form. The high-water uptake, that is inducing a high swelling degree, compromises the mechanical integrity
of the membrane. In contrast, M1 and M2 show only about 1 mS·cm-1 Cl- ion conductivity due to the
crosslinked structure of the membranes. It constrains flexibility of the polymer chain, affecting (i) their
water uptake capacities and (ii) the mobility of the ionic species [33]. In both membranes, only two water
molecules can be taken up per ionic function, thereby reducing the ionic dissociation and the ability of the
side chain to form percolated ionic clusters. As expected, the conductivities of M3, M4, M5 and M6 agree
with their IEC and water uptake. The Cl- ion conductivity of M7 doubled the value of M8 membrane. This
could be due to the presence of a spacer in the former membrane, which promotes hydrophilic-hydrophobic
nanophase separation [33–35] and, thus, the formation of more efficient and larger ionic conductive
channels. AFM images of the surface and bulk morphologies of the M7 and M8 membranes were acquired
to further study the phenomenon (Figure 2 and 3). The phase separation between the ionic and hydrophobic
domains is clearly visible. The surface proportion of ionic domains is equal to 28% and 25% for M7 and
M8, respectively, following the trend of water uptake values. This difference is essentially reflected in an
increase in the ionic domain area from 306 nm2 (M8) to 358 nm2 (M7) (Table S1). Both membranes reveal
Electronic copy available at: https://ssrn.com/abstract=4007244
16
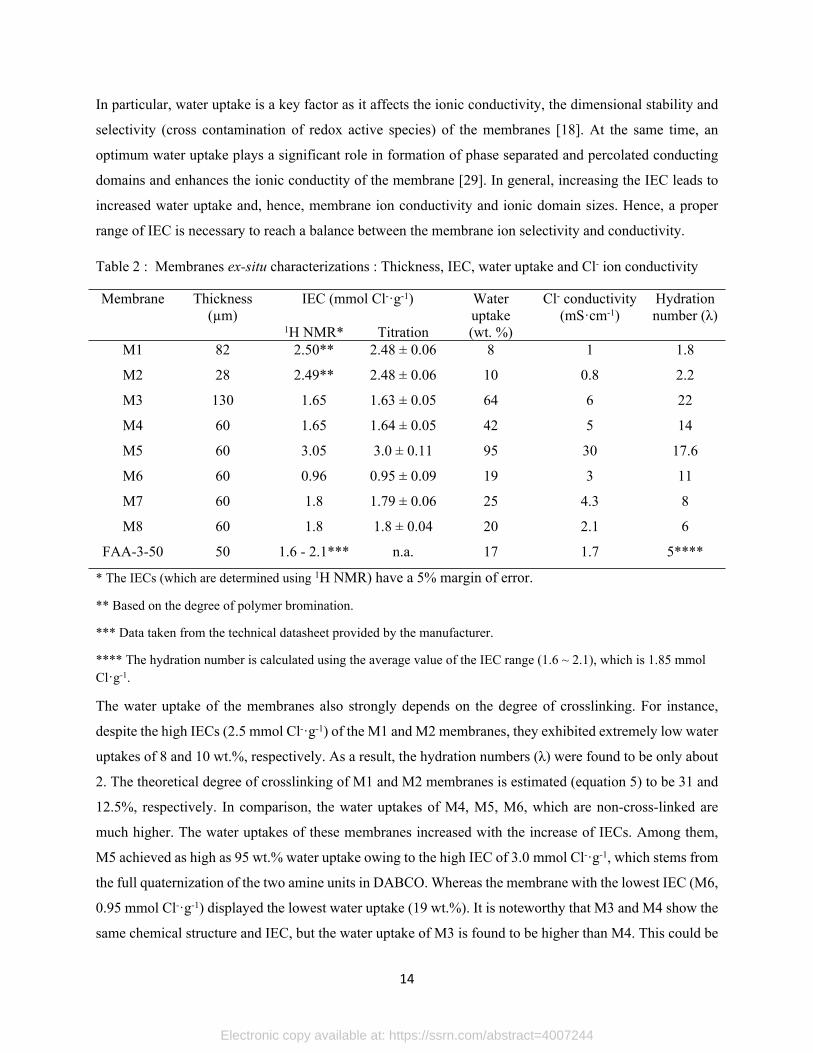
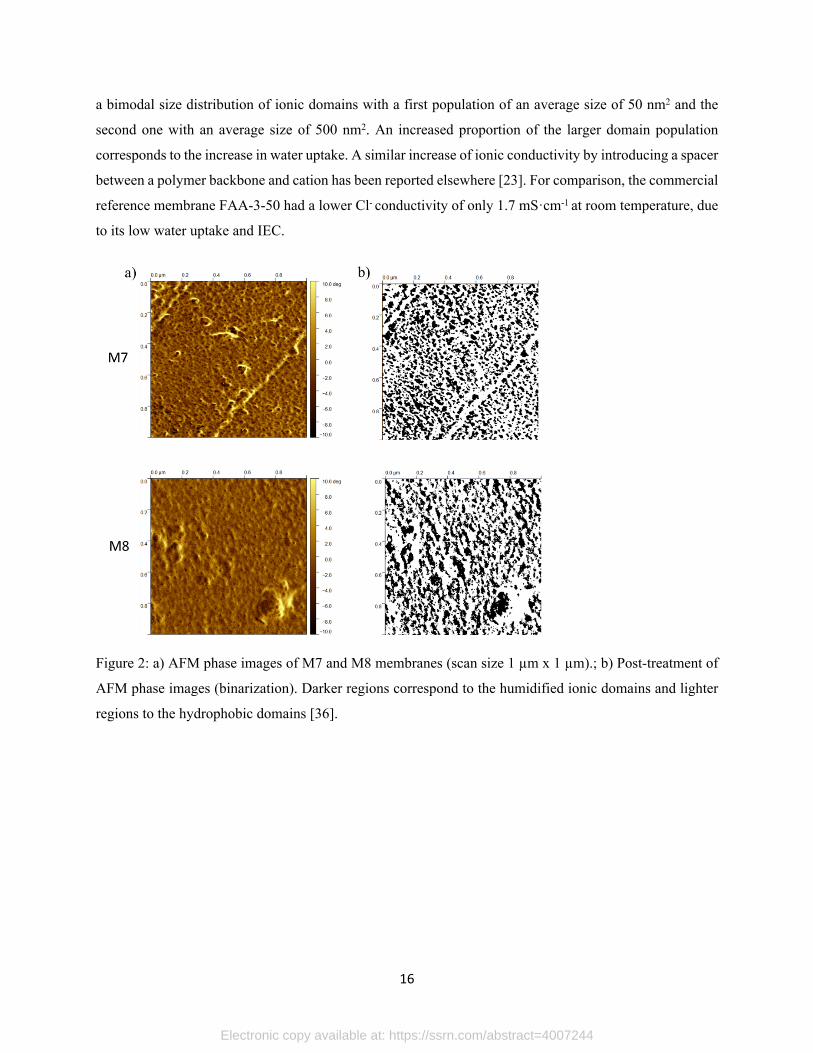
a bimodal size distribution of ionic domains with a first population of an average size of 50 nm2 and the
second one with an average size of 500 nm2. An increased proportion of the larger domain population
corresponds to the increase in water uptake. A similar increase of ionic conductivity by introducing a spacer
between a polymer backbone and cation has been reported elsewhere [23]. For comparison, the commercial
reference membrane FAA-3-50 had a lower Cl- conductivity of only 1.7 mS·cm-1 at room temperature, due
to its low water uptake and IEC.
Figure 2: a) AFM phase images of M7 and M8 membranes (scan size 1 µm х 1 µm).; b) Post-treatment of
AFM phase images (binarization). Darker regions correspond to the humidified ionic domains and lighter
regions to the hydrophobic domains [36].
Electronic copy available at: https://ssrn.com/abstract=4007244
17
10 50 100 500 1000 5000 100000
5
10
15
20
25
30Fr
eque
ncy
(%)
area (nm2)
M7M8
1 10 100 1000 100000
20
40
60
80
100
Cum
ulat
ive
frequ
ency
(%)
area (nm2)
M7M8
Figure 3: Area distribution of ionic domain for M7 and M8; left) frequency, right) cumulative frequency.
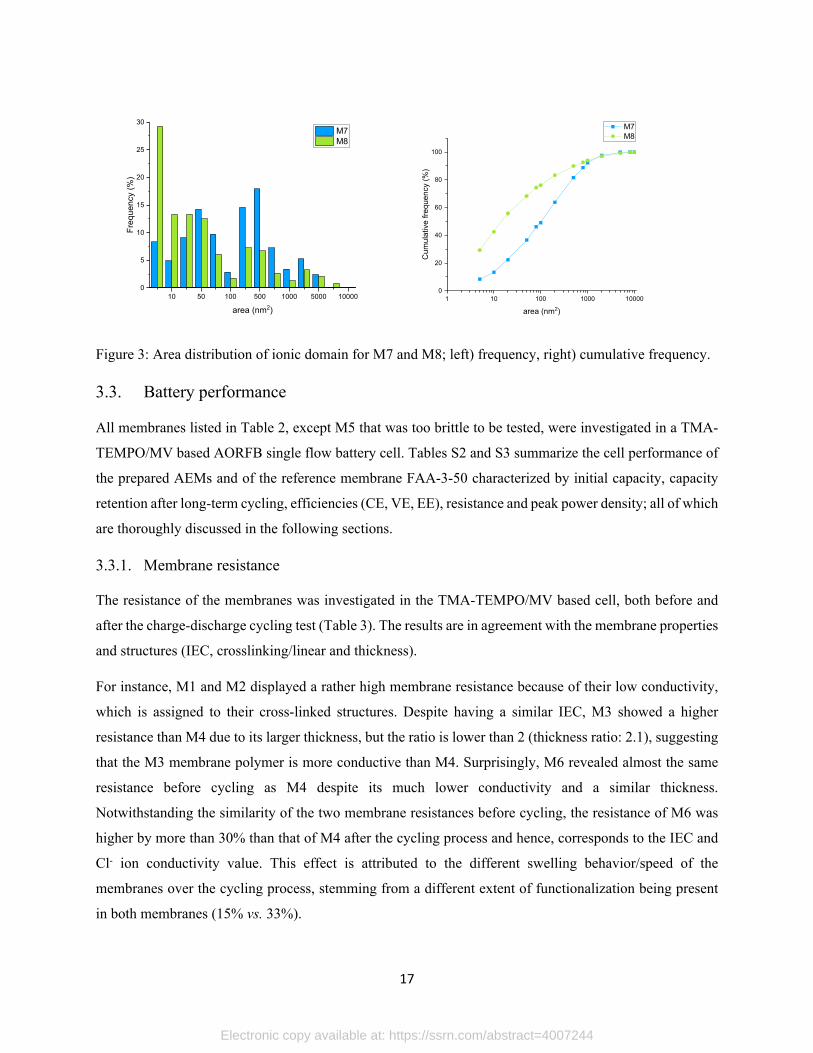
3.3. Battery performance
All membranes listed in Table 2, except M5 that was too brittle to be tested, were investigated in a TMA-
TEMPO/MV based AORFB single flow battery cell. Tables S2 and S3 summarize the cell performance of
the prepared AEMs and of the reference membrane FAA-3-50 characterized by initial capacity, capacity
retention after long-term cycling, efficiencies (CE, VE, EE), resistance and peak power density; all of which
are thoroughly discussed in the following sections.
3.3.1. Membrane resistance
The resistance of the membranes was investigated in the TMA-TEMPO/MV based cell, both before and
after the charge-discharge cycling test (Table 3). The results are in agreement with the membrane properties
and structures (IEC, crosslinking/linear and thickness).
For instance, M1 and M2 displayed a rather high membrane resistance because of their low conductivity,
which is assigned to their cross-linked structures. Despite having a similar IEC, M3 showed a higher
resistance than M4 due to its larger thickness, but the ratio is lower than 2 (thickness ratio: 2.1), suggesting
that the M3 membrane polymer is more conductive than M4. Surprisingly, M6 revealed almost the same
resistance before cycling as M4 despite its much lower conductivity and a similar thickness.
Notwithstanding the similarity of the two membrane resistances before cycling, the resistance of M6 was
higher by more than 30% than that of M4 after the cycling process and hence, corresponds to the IEC and
Cl- ion conductivity value. This effect is attributed to the different swelling behavior/speed of the
membranes over the cycling process, stemming from a different extent of functionalization being present
in both membranes (15% vs. 33%).
Electronic copy available at: https://ssrn.com/abstract=4007244
18
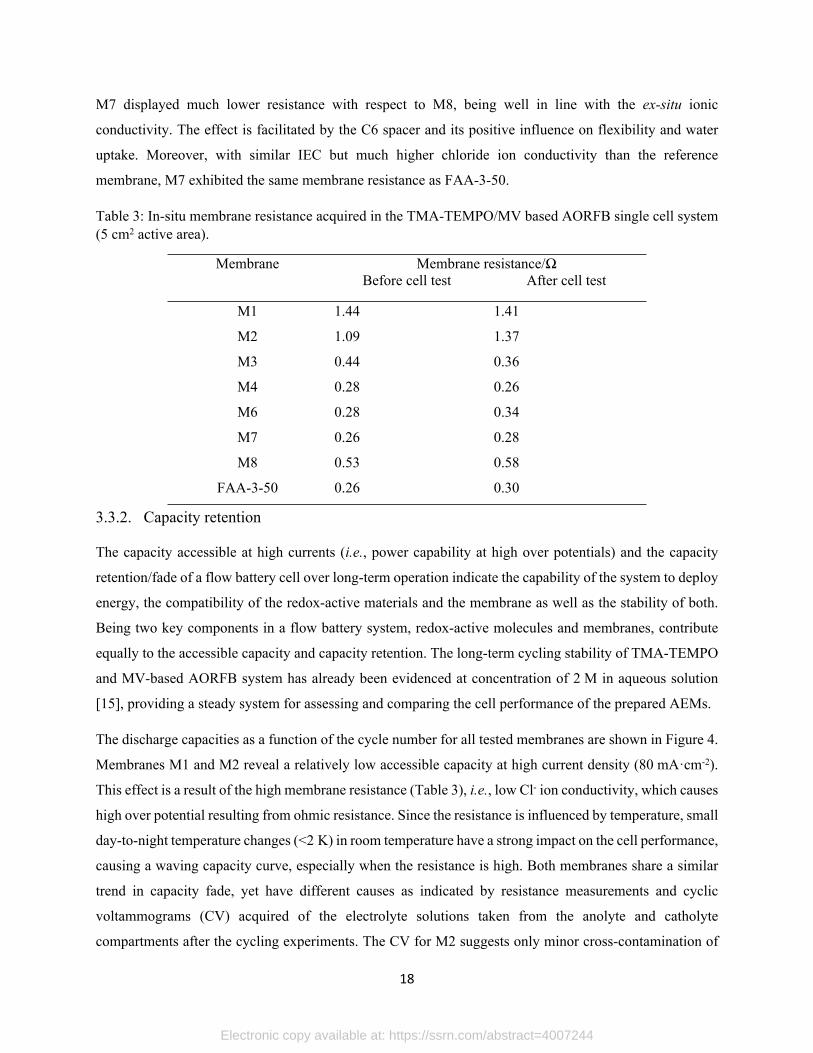
M7 displayed much lower resistance with respect to M8, being well in line with the ex-situ ionic
conductivity. The effect is facilitated by the C6 spacer and its positive influence on flexibility and water
uptake. Moreover, with similar IEC but much higher chloride ion conductivity than the reference
membrane, M7 exhibited the same membrane resistance as FAA-3-50.
Table 3: In-situ membrane resistance acquired in the TMA-TEMPO/MV based AORFB single cell system (5 cm2 active area).
Membrane resistance/ΩMembraneBefore cell test After cell test
M1 1.44 1.41
M2 1.09 1.37
M3 0.44 0.36
M4 0.28 0.26
M6 0.28 0.34
M7 0.26 0.28
M8 0.53 0.58
FAA-3-50 0.26 0.30
3.3.2. Capacity retention
The capacity accessible at high currents (i.e., power capability at high over potentials) and the capacity
retention/fade of a flow battery cell over long-term operation indicate the capability of the system to deploy
energy, the compatibility of the redox-active materials and the membrane as well as the stability of both.
Being two key components in a flow battery system, redox-active molecules and membranes, contribute
equally to the accessible capacity and capacity retention. The long-term cycling stability of TMA-TEMPO
and MV-based AORFB system has already been evidenced at concentration of 2 M in aqueous solution
[15], providing a steady system for assessing and comparing the cell performance of the prepared AEMs.
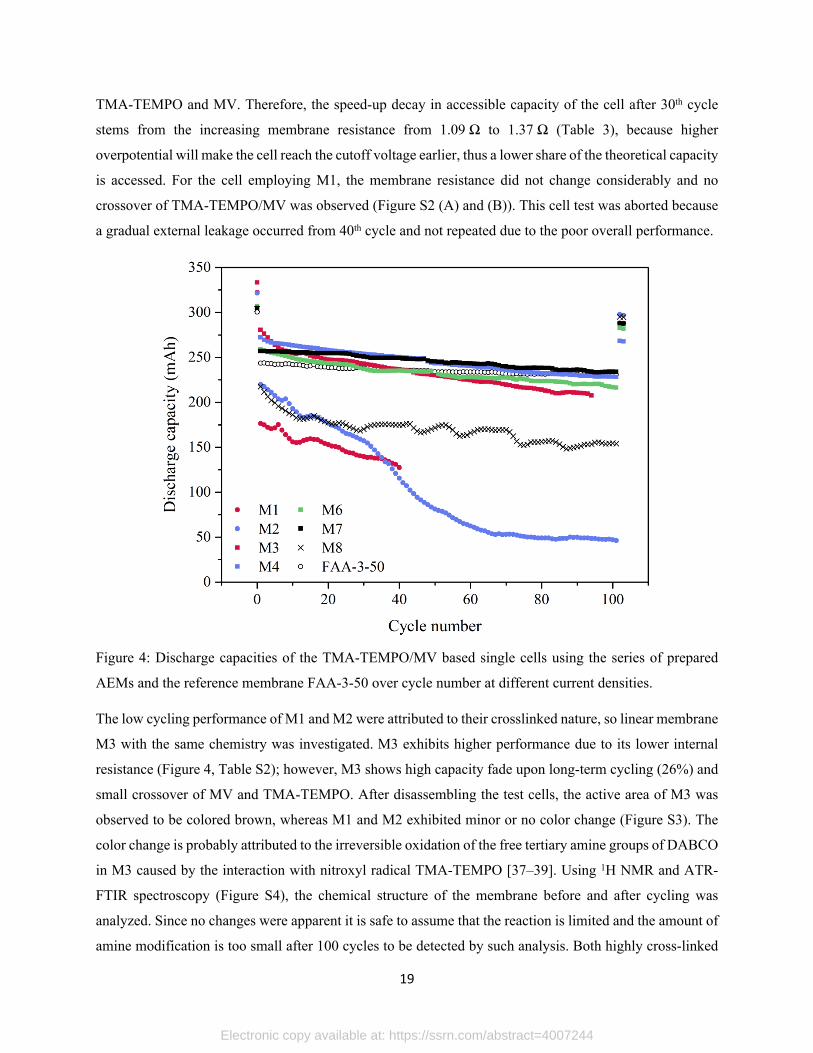
The discharge capacities as a function of the cycle number for all tested membranes are shown in Figure 4.
Membranes M1 and M2 reveal a relatively low accessible capacity at high current density (80 mA·cm-2).
This effect is a result of the high membrane resistance (Table 3), i.e., low Cl- ion conductivity, which causes
high over potential resulting from ohmic resistance. Since the resistance is influenced by temperature, small
day-to-night temperature changes (<2 K) in room temperature have a strong impact on the cell performance,
causing a waving capacity curve, especially when the resistance is high. Both membranes share a similar
trend in capacity fade, yet have different causes as indicated by resistance measurements and cyclic
voltammograms (CV) acquired of the electrolyte solutions taken from the anolyte and catholyte
compartments after the cycling experiments. The CV for M2 suggests only minor cross-contamination of
Electronic copy available at: https://ssrn.com/abstract=4007244
19
TMA-TEMPO and MV. Therefore, the speed-up decay in accessible capacity of the cell after 30th cycle
stems from the increasing membrane resistance from 1.09 Ω to 1.37 Ω (Table 3), because higher
overpotential will make the cell reach the cutoff voltage earlier, thus a lower share of the theoretical capacity
is accessed. For the cell employing M1, the membrane resistance did not change considerably and no
crossover of TMA-TEMPO/MV was observed (Figure S2 (A) and (B)). This cell test was aborted because
a gradual external leakage occurred from 40th cycle and not repeated due to the poor overall performance.
Figure 4: Discharge capacities of the TMA-TEMPO/MV based single cells using the series of prepared
AEMs and the reference membrane FAA-3-50 over cycle number at different current densities.
The low cycling performance of M1 and M2 were attributed to their crosslinked nature, so linear membrane
M3 with the same chemistry was investigated. M3 exhibits higher performance due to its lower internal
resistance (Figure 4, Table S2); however, M3 shows high capacity fade upon long-term cycling (26%) and
small crossover of MV and TMA-TEMPO. After disassembling the test cells, the active area of M3 was
observed to be colored brown, whereas M1 and M2 exhibited minor or no color change (Figure S3). The
color change is probably attributed to the irreversible oxidation of the free tertiary amine groups of DABCO
in M3 caused by the interaction with nitroxyl radical TMA-TEMPO [37–39]. Using 1H NMR and ATR-
FTIR spectroscopy (Figure S4), the chemical structure of the membrane before and after cycling was
analyzed. Since no changes were apparent it is safe to assume that the reaction is limited and the amount of
amine modification is too small after 100 cycles to be detected by such analysis. Both highly cross-linked
Electronic copy available at: https://ssrn.com/abstract=4007244
20
membranes M1 and M2 have very low water uptakes as well as lower amount of free amine groups and
are, therefore, less exposed to the oxidation reaction. M4 displayed an outstanding capacity retention of
84% after 100 cycles at 80 mA cm-2, whereas M3 exhibited only 74%, partly because of the slightly higher
membrane resistance (Table S2).
Three membrane synthesis strategies were introduced to avoid the aging process and/or capacity fade: (i)
M5 in which both tertiary amines were fully quaternized, (ii) M6 with lower IEC in order to decrease its
water uptake and (iii) M7 with TMA replacing DABCO. In the case of M6 membrane, the lower degree of
functionalization of the polymer backbone results in less free tertiary amine groups exposed to TMA-
TEMPO oxidation, as well as lower water uptake and possibly lower TMA-TEMPO penetration, which can
interact with tertiary amine. Meanwhile, the good chloride ion conductivity and low water uptake of M6
guarantee its low membrane resistance (Table 3) and high TMA-TEMPO/MV retention i.e., no cross-
contamination (Figure S2(C) and (D)). Therefore, a high capacity retention (83%) at the current density of
80 mA·cm-2 was observed for M6. It should be noted that this value is very close to the value obtained for
M4, but the capacity retention at 20 mA·cm-2 was increased by 5%. Therefore, lowering the IEC resulted
in an improvement on the capacity retention. However, this comes at the cost of power capability, as can
be seen from smaller values for the capacity accessible at high current density of 80 mA cm-2 and peak
power density (Table S3).
As for M7, when DABCO is replaced by TMA, the ionic group is no longer subjected to oxidation catalyzed
by the nitroxyl radical. At the same time, the high ionic conductivity of M7 resulted in low membrane
resistance whereas its low water uptake maintains the selectivity for Cl- ion. Therefore, the capacity and
capacity retention of the cell with M7 at both low and high current densities preserved at a high level. A
capacity retention of 99.94%/cycle at 20 mA·cm-2 (capacity retention of 94% at the 103rd cycle) was
recorded, which is a very promising result. Similarly, the commercial membrane FAA-3-50 also achieved
high-level capacity retention at both current densities. As shown in Table S2, a capacity retention of 95%
at 20 mA·cm-2 was observed. As the exact polymer structure of FAA-3-50 is not publicly disclosed, it is
hard to identify the root cause of the difference, not to mention the complex nature of the microstructures
of membranes.
With similar membrane properties as FAA-3-50, M8 exhibited a higher capacity retention (97%) at
20 mA·cm-2. However, removing the C6 spacer while keeping the TMA moiety in M8 resulted in a higher
membrane resistance and, thereby, higher over potentials. Consequently, the low ionic conductivity made
it difficult to access the full capacity at a higher current density (80 mA·cm-2), only 71% of the capacity
was available. The regular fluctuation in capacity is assigned to the waving room temperature during
Electronic copy available at: https://ssrn.com/abstract=4007244
21
summertime, as confirmed in an independent experiment with FAA-3-50 (Figure S5). Figure S2 (E and F)
shows the CVs of the electrolyte solutions of the test cell using FAA-3-50 and M8 membranes.
In summary, the best results for the TMA-TEMP/MV flow battery can be achieved, when preventing
membrane aging by avoiding the presence of free amine groups and introducing a spacer to promote the
formation of phase separated ionic clusters. Capacity retention correlates strongly with the water uptake
and Cl- ion conductivity, suggesting aiming at a high-performance membrane which possess a high
conductivity and sufficiently low water uptake.
3.3.3. Coulombic efficiency, voltage efficiency and energy efficiency
Coulombic efficiency (CE) indicates the degree of cross-contamination, which directly relates to the
membrane ion selectivity. Voltage efficiency (VE), expressed as mean discharging cell voltage divided by
mean charging cell voltage at constant current, reflects the over potentials and resistance level of the system,
which is strongly determined by the membrane resistance. As shown in Figure 5, all tested membranes
exhibited excellent CE of over 99.3%, indicating a high membrane selectivity of chloride ion, which was
further confirmed by the cyclic voltammograms of the electrolyte solutions taken from the test cell after the
charge-discharge cycling tests (Figure S2).
As the CEs are almost identical for all the membranes (close to 100%), the voltage efficiencies (VEs) and
energy efficiencies (EE) are close and mainly associated with the internal resistance, which in turn is
dominated by the membrane resistance. The VEs of the cells with M1, M2, M3 and M8 were reduced to
different extent varying with the membrane resistance (Table 3). M6 has a similar membrane resistance as
FAA-3-50, resulting in similar voltage efficiency. With slightly lower membrane resistance than FAA-3-
50, M4 and M7 displayed a bit higher voltage efficiency (80%) at 80 mA·cm-2. Therefore, the energy
efficiency was enhanced to a certain level by further lowering the membrane resistance without sacrificing
the membrane ion selectivity.
Electronic copy available at: https://ssrn.com/abstract=4007244

22
Figure 5: Average coulombic efficiency (CE), voltage efficiency (VE) and energy efficiency (EE) of 100
consecutive charge-discharge cycles at a constant current density of 80 mA·cm-2 in TMA-TEMPO/MV
based single cells with the series of prepared AEMs and the reference membrane FAA-3-50.
3.3.4. Power density
Owing to their good battery performance, M3, M4, M6, M7, M8 and FAA-3-50 membranes were chosen
for an in-depth study of their power capability. Therefore, polarization curves were acquired at two different
flow rates (16 and 24 mL·min-1) after the cycling tests. Due to the optimization of the system, the
polarization behaviour is dominated by the resistance of the membrane. Other limitations associated with
redox reaction and mass transport limitation are minor in the range of the current density investigated.
As can be seen from Figure 6, the peak power densities of M3, M4, M6 and M7 were improved comparing
to the reference membrane. Within the expectation, the peak power density of the tested membranes has a
reverse relation to the corresponding membrane resistance (Table S3), except for M3, whose power density
was probably influenced by the aging process upon interaction with the TMA-TEMPO redox couple. In a
way to uncover the power density undisturbed from aging, the polarization curve of a freshly prepared M3
was recorded using fresh electrolytes. The peak power density of the cell with pristine M3 turned out to be
376 mW·cm-2 at flow rate of 16 mL·min-1, promoted by 60% comparing to that of FAA-3-50 (Figure 6),
whereas, the aged M3 displayed a peak power density of only 269 mW·cm-2 (Table S3).
With respect to the other membranes, the peak power densities were found to be in agreement with their
ion conductivities, i.e., cell resistances, since the membranes have same thickness. Accordingly, M4, M7,
M6 and M8 delivered a maximum power density of 316, 293, 284 and 183 mW·cm-2, respectively, at a flow
rate of 16 mL·min-1. The peak power density of the cell with FAA-3-50 (235 mW·cm-2) is between that of
Electronic copy available at: https://ssrn.com/abstract=4007244

23
M8 and M3 (aged), thus several of our membranes present better performances. The I-V curves are shown
in Figure S6.
Finally, the influence of battery operating conditions was simulated by variation of the electrolyte flow. An
increased mass transport is supposed to counteract the depletion of TMA-TEMPO and MV during the redox
reaction. By increasing the flow rate from 16 to 24 mL·min-1, the peak power density of all tested
membranes was raised by 1.4 to 4.7% (Figure S7).
Figure 6: Power densities of the cells with membranes M3, M4, M6, M7, M8 and FAA-3-50 over different
current densities at the flow rate of 16 mL·min-1 after the cycling tests.
Intended for practical application, we compared the highest peak power density value achieved in this work
to those reported in different flow battery systems, including the conventional vanadium system, semi-
organic systems and all-organic systems (Table S4). Technically, power density is determined by the cell
voltage and the cell resistance including over potentials. Therefore, any factor in a battery that makes a
difference to those two parameters can ultimately change the acquired power density. As complex methods
and systems were involved in the literature, a comparison under the same condition is beyond possibility.
Nevertheless, it allows to assess the power capability achieved in this work for its practicability. To the best
of our knowledge, the power density achieved with membranes M3 to M7 is superior to the reported all-
organic flow systems.
Comparing outside all-organic systems, the peak power density of 388 mW·cm-2 in TMA-TEMPO/MV
with M3 ranks in the middle in the listed systems. The main reason lies in the different nature of the
membrane, the supporting electrolyte and flow rate. While the system described above uses AEM and
Electronic copy available at: https://ssrn.com/abstract=4007244

24
chloride ions, the literature examples employ highly conductive, but corrosive acid-based solutions (e.g.,
H2SO4) and cation exchange membranes. Hence, the results are within expectation and demonstrate that
milder electrolyte solutions in combination with optimized membranes have become suitable for practical
application.
Looking into detail, the extra high power density of 2,780 mW·cm-2 of VRFB system involved accumulated
efforts on optimizing the flow field, electrode material, flow rate and membrane [40]. Similarly, in the semi-
organic system employing 2,7-(anthraquinone-2,6-disulfonate) AQDS/Br2, a peak power density of
1,000 mW·cm-2 was achieved in an optimized condition of electrolyte composition, electrode, membrane,
flow rate and temperature. For instance, when the flow rate of VRFB system increased from 20 to
50 mL·min-1, the mass and ion transport was distinctly enhanced, which also significantly contributes to
the ultimate power density [40]. By increasing from room temperature to 40 °C, the peak power density of
the semi-organic system 2,7-AQDSNa2/Br2 could be elevated from 400 to 450 mW·cm-2 [41]. In
comparison, the peak power density achieved in this work is simply based on optimized membrane; other
aforementioned parameters are beyond the scope of this work. Therefore, the authors are convinced that by
further optimization of electrode, electrolyte composition, flow field design, flow rate and temperature,
higher power density in TMA-TEMPO/MV based AORFB can be reached using the membranes presented
here.
3.4. Membrane property-battery performance interrelation
Based on those results, we summarize the membrane property-performance interrelation in a net graph as
shown in Figure 7. In this work, all tested membranes displayed high coulombic efficiency of over 99%
and only slight or no crossover, which relies on low water uptake (below 64 wt.%). Therefore, the energy
efficiency is mainly dependent on the voltage efficiency, which relates directly to the membrane resistance
as the redox-active molecules are defined. This influence becomes more apparent when the membrane
resistance is high. For example, membrane resistance of M8 is 0.528 Ω, its energy efficiency at 80 mA·cm-2
is 69%. In contrast, the membrane resistance of M3 is 0.437 Ω, its energy efficiency at the same current
density increases to 75%. When the membrane resistance decreases to 0.257 Ω (M7), the energy efficiency
increases to 80% under the same condition. Because the resistance during the cycling process fluctuates
within a certain range, the energy efficiency over long-term cycling may not follow the trend for low-
resistance membranes. Another parameter that is strongly influenced by membrane resistance is the peak
power density. As discussed in previous sections, the peak power density will increase with decreasing
membrane resistance in general cases. However, potential membrane aging can alter the mass transport
process, thus affecting the peak power density.
Electronic copy available at: https://ssrn.com/abstract=4007244

25
The third parameter, capacity retention, generally depends on both the membrane resistance and membrane
perm-selectivity. Membrane resistance is found to be related to thickness, ion conductivity and water uptake,
yet does not follow simple rules. For instance, the thickness of M3 (130 µm) is twice that of M8 (60 µm),
but the membrane resistance of M3 is distinctly lower than that of M8. In this case, the high ion conductivity
of M3 compensates for its thickness while M8 compromises to its low ion conductivity due to the lack of
6C spacer to the polymer backbone. The commercial membrane FAA-3-50 is reported to bear no spacer as
well, its ion conductivity and water uptake are similar (slightly lower) to that of M8. However, its membrane
resistance is much reduced comparing to M8, probably stemming from its higher IEC or the cation type.
This addresses the importance to understand the structure-property-performance relationship based on
defined polymer structures.
Hence, when designing an ion exchange membrane for AORFB, low water uptake and high ionic
conductivity are targeted. Therefore, a membrane with moderate IEC is required and its value has to be
modulated as function of polymer structure. Thus, when no carbon spacer is included between the rigid
polymer backbone and the cation, higher IEC is required to overcome poor ionic cluster organization and
achieve a membrane with sufficient ionic conductivity and low resistance. When a flexible spacer, such as
6 C is included, it is important to control the water uptake at an acceptable level where only slight or no
crossover of redox-active molecules is allowed. Because polymer crosslinking has a significant impact on
chain mobility, ionic cluster structure and water uptake, a high IEC is required to provide a sufficient ion
conductivity. To ensure long-term stability, the chosen polymer backbone and ionic type should possess
chemical stability and mechanical strength to avoid potential aging and/or degradation. Following these
strategies, good battery performance is in anticipation.
Electronic copy available at: https://ssrn.com/abstract=4007244

26
Figure 7: Overview of membrane property-battery performance interrelation. All data are normalized according to the highest values. Membrane resistance before cycling experiment is used.
4. Conclusion
A series of eight anion exchange membranes based on poly(p-phenylene oxide) backbone varying in the
degree of functionalization, cation type and polymer architecture were prepared, followed by ex-situ
membrane characterizations featuring IEC, water uptake and chloride ion conductivity. Membrane M5,
bearing fully quaternized DABCO groups, a linear polymer architecture and showing a high chloride ion
conductivity of 30 mS·cm-1, turned out to be brittle and its mechanical strength is expected to be
compromised by its swelling degree. All other membranes were mechanically stable and, hence,
subsequently investigated in a TMA-TEMPO/methyl viologen based redox flow battery test cell to probe
how the cell performance is manipulated by polymer structure and the corresponding membrane properties.
Despite the absence of crossover of redox species, the partially DABCO-crosslinked M1 and M2
membranes, exhibited fast capacity fades upon battery cycling and low energy efficiencies due to their high
cell resistance. Whereas, the DABCO-based linear polymer membrane showed capacity fade following a
Electronic copy available at: https://ssrn.com/abstract=4007244

27
permanent coloration and aging of the membranes. This effect is attributed to a possible oxidation of the
tertiary amine of M3 by the nitroxyl radical TMA-TEMPO, which is a renowned oxidation catalyst.
However, the M3 membrane displayed a high chloride ion conductivity (6 mS·cm-1 at room temperature)
and freshly prepared membranes reveal a peak power density of 376 mW·cm-2 that is extensively promoted
by 60% as compared to the commercial reference membrane FAA-3-50 (235 mW·cm-2). When the aging
is lowered or avoided by either lowering the degree of functionalization or replacing the DABCO cation
with a trimethylammonium moiety, the resulting membranes M6 and M7 exhibited improved performance
in capacity retention, energy efficiency as well as peak power density. Overall, the M7 membrane-cell, that
is using a linear polymer structure and a fully quaternized trimethylammonium cation as ion exchange
group attached via a C6 spacer, achieved the best overall cell performance. It showed appreciable high
capacity retention (94% after over 100 consecutive cycles) and delivered higher peak power density (293
mW·cm-2 at 16 mL·min-1) and energy efficiency (80%) than the FAA-3-50. In addition, the production cost
of M7 is estimated to be low (Table S5). These results will greatly contribute to the future market of ORFBs
with competing low cost and high performance. In future studies, we believe it is critical to investigate the
long-term durability of the membranes in the AORFB cell, permeability rates of active species across the
membranes, and tensile strengths of the membranes.
Competing interests:
The authors have no competing interests to declare.
Author contribution:
Misgina Tilahun Tsehaye performed the synthesis and ex-situ characterization of the membranes. Xian
Yang performed the electrochemical measurements. Misgina Tilahun Tsehaye: conceptualization,
methodology, investigation, writing- original draft preparation. Xian Yang: conceptualization,
methodology, investigation, writing- original draft preparation. Tobias Janoschka: supervision, project
administration, writing - review & editing. Martin D. Hager: supervision, writing - review & editing.
Ulrich S. Schubert: supervision, writing - review & editing. Emilie Planes: analysis and writing of AFM
part. Fannie Alloin: supervision, writing - review & editing. Cristina Iojoiu: supervision, project
administration writing - review & editing.
Funding: This project has received funding from the European Union’s Horizon 2020 research and
innovation programme under the Marie Skłodowska-Curie Grant Agreement no. 765289.
Electronic copy available at: https://ssrn.com/abstract=4007244
28
References[1] E. Sánchez-Díez, E. Ventosa, M. Guarnieri, A. Trovò, C. Flox, R. Marcilla, F. Soavi, P. Mazur, E.
Aranzabe, R. Ferret, Redox flow batteries: Status and perspective towards sustainable stationary energy storage, J. Power Sources. 481 (2021) 228804. https://doi.org/10.1016/j.jpowsour.2020.228804.
[2] A.Z. Weber, M.M. Mench, J.P. Meyers, P.N. Ross, J.T. Gostick, Q. Liu, Redox flow batteries: a review, J. Appl. Electrochem. 41 (2011) 1137–1164. https://doi.org/10.1007/s10800-011-0348-2.
[3] G.L. Soloveichik, Flow batteries: Current status and trends, Chem. Rev. 115 (2015) 11533–11558. https://doi.org/10.1021/cr500720t.
[4] P. Alotto, M. Guarnieri, F. Moro, Redox flow batteries for the storage of renewable energy: A review, Renew. Sustain. Energy Rev. 29 (2014) 325–335. https://doi.org/10.1016/j.rser.2013.08.001.
[5] European Commission, The European Green Deal, Eur. Comm. 53 (2019) 24. https://doi.org/10.1017/CBO9781107415324.004.
[6] J. Winsberg, T. Hagemann, T. Janoschka, M.D. Hager, U.S. Schubert, Redox‐flow batteries: From metals to organic redox‐active materials, Angew. Chemie Int. Ed. 56 (2017) 686–711. https://doi.org/10.1002/anie.201604925.
[7] G. Kear, A.A. Shah, F.C. Walsh, Development of the all-vanadium redox flow battery for energy storage: a review of technological, financial and policy aspects, Int. J. Energy Res. 36 (2012) 1105–1120. https://doi.org/10.1002/er.1863.
[8] X. Wei, W. Pan, W. Duan, A. Hollas, Z. Yang, B. Li, Z. Nie, J. Liu, D. Reed, W. Wang, V. Sprenkle, Materials and systems for organic redox flow batteries: Status and challenges, ACS Energy Lett. 2 (2017) 2187–2204. https://doi.org/10.1021/acsenergylett.7b00650.
[9] K. Wedege, E. Dražević, D. Konya, A. Bentien, Organic redox species in aqueous flow batteries: Redox potentials, chemical stability and solubility, Sci. Rep. 6 (2016) 39101. https://doi.org/10.1038/srep39101.
[10] B. Yang, L. Hoober-Burkhardt, F. Wang, G.K. Surya Prakash, S.R. Narayanan, An inexpensive aqueous flow battery for large-scale electrical energy storage based on water-soluble organic redox couples, J. Electrochem. Soc. 161 (2014) A1371–A1380. https://doi.org/10.1149/2.1001409jes.
[11] B. Schwenzer, J. Zhang, S. Kim, L. Li, J. Liu, Z. Yang, Membrane development for vanadium redox flow batteries, ChemSusChem. 4 (2011) 1388–1406. https://doi.org/10.1002/cssc.201100068.
[12] C. Minke, T. Turek, Economics of vanadium redox flow battery membranes, J. Power Sources. 286 (2015) 247–257. https://doi.org/10.1016/j.jpowsour.2015.03.144.
[13] Y. Shi, C. Eze, B. Xiong, W. He, H. Zhang, T.M. Lim, A. Ukil, J. Zhao, Recent development of membrane for vanadium redox flow battery applications: A review, Appl. Energy. 238 (2019) 202–224. https://doi.org/10.1016/j.apenergy.2018.12.087.
[14] Y.A. Hugo, W. Kout, F. Sikkema, Z. Borneman, K. Nijmeijer, In situ long-term membrane performance evaluation of hydrogen-bromine flow batteries, J. Energy Storage. 27 (2020) 101068. https://doi.org/10.1016/j.est.2019.101068.
Electronic copy available at: https://ssrn.com/abstract=4007244

29
[15] T. Janoschka, N. Martin, M.D. Hager, U.S. Schubert, An Aqueous redox-flow battery with high capacity and power: The TEMPTMA/MV system, Angew. Chemie Int. Ed. 55 (2016) 14427–14430. https://doi.org/10.1002/anie.201606472.
[16] K. Lin, Q. Chen, M.R. Gerhardt, L. Tong, S.B. Kim, L. Eisenach, A.W. Valle, D. Hardee, R.G. Gordon, M.J. Aziz, M.P. Marshak, Alkaline quinone flow battery, Science (80-. ). 349 (2015) 1529–1532. https://doi.org/10.1126/science.aab3033.
[17] E.S. Beh, D. De Porcellinis, R.L. Gracia, K.T. Xia, R.G. Gordon, M.J. Aziz, A Neutral pH Aqueous Organic–Organometallic Redox Flow Battery with Extremely High Capacity Retention, ACS Energy Lett. 2 (2017) 639–644. https://doi.org/10.1021/acsenergylett.7b00019.
[18] L.J. Small, H.D. Pratt, T.M. Anderson, Crossover in membranes for aqueous soluble organic redox flow batteries, J. Electrochem. Soc. 166 (2019) A2536–A2542. https://doi.org/10.1149/2.0681912jes.
[19] B. Hu, C. Seefeldt, C. DeBruler, T.L. Liu, Boosting the energy efficiency and power performance of neutral aqueous organic redox flow batteries, J. Mater. Chem. A. 5 (2017) 22137–22145. https://doi.org/10.1039/C7TA06573F.
[20] M.T. Tsehaye, X. Yang, T. Janoschka, M.D. Hager, U.S. Schubert, F. Alloin, C. Iojoiu, Study of anion exchange membrane properties incorporating N-spirocyclic quaternary ammonium cations and aqueous organic redox flow battery performance, Membranes (Basel). 11 (2021) 367. https://doi.org/10.3390/membranes11050367.
[21] Y. Zhu, L. Ding, X. Liang, M.A. Shehzad, L. Wang, X. Ge, Y. He, L. Wu, J.R. Varcoe, T. Xu, Beneficial use of rotatable-spacer side-chains in alkaline anion exchange membranes for fuel cells, Energy Environ. Sci. 11 (2018) 3472–3479. https://doi.org/10.1039/C8EE02071J.
[22] M.R. Hibbs, Alkaline stability of poly(phenylene)-based anion exchange membranes with various cations, J. Polym. Sci. Part B Polym. Phys. 51 (2013) 1736–1742. https://doi.org/10.1002/polb.23149.
[23] J. Parrondo, M.J. Jung, Z. Wang, C.G. Arges, V. Ramani, Synthesis and alkaline stability of solubilized anion exchange membrane binders based on poly(phenylene oxide) functionalized with quaternary ammonium groups via a hexyl spacer, J. Electrochem. Soc. 162 (2015) F1236–F1242. https://doi.org/10.1149/2.0891510jes.
[24] X. Tongwen, Y. Weihua, Fundamental studies of a new series of anion exchange membranes: Membrane preparation and characterization, J. Memb. Sci. 190 (2001) 159–166. https://doi.org/10.1016/S0376-7388(01)00434-3.
[25] H.W. Doughty, Mohr’s method for the determination of silver and halogens in other than neutral solutions, J. Am. Chem. Soc. 46 (1924) 2707–2709. https://doi.org/10.1021/ja01677a014.
[26] P.J. James, M. Antognozzi, J. Tamayo, T.J. McMaster, J.M. Newton, M.J. Miles, Interpretation of contrast in tapping mode AFM and shear force microscopy. A study of Nafion, Langmuir. (2001). https://doi.org/10.1021/la000332h.
[27] T. Janoschka, N. Martin, U. Martin, C. Friebe, S. Morgenstern, H. Hiller, M.D. Hager, U.S. Schubert, An aqueous, polymer-based redox-flow battery using non-corrosive, safe, and low-cost materials, Nature. 527 (2015) 78–81. https://doi.org/10.1038/nature15746.
[28] N. Elgrishi, K.J. Rountree, B.D. McCarthy, E.S. Rountree, T.T. Eisenhart, J.L. Dempsey, A Practical beginner’s guide to cyclic voltammetry, J. Chem. Educ. 95 (2018) 197–206. https://doi.org/10.1021/acs.jchemed.7b00361.
Electronic copy available at: https://ssrn.com/abstract=4007244
30
[29] Q. Duan, S. Ge, C.-Y. Wang, Water uptake, ionic conductivity and swelling properties of anion-exchange membrane, J. Power Sources. 243 (2013) 773–778. https://doi.org/10.1016/j.jpowsour.2013.06.095.
[30] M.G. Marino, J.P. Melchior, A. Wohlfarth, K.D. Kreuer, Hydroxide, halide and water transport in a model anion exchange membrane, J. Memb. Sci. 464 (2014) 61–71. https://doi.org/10.1016/j.memsci.2014.04.003.
[31] A.M. Barnes, B. Liu, S.K. Buratto, Humidity-dependent surface structure and hydroxide conductance of a model quaternary ammonium anion exchange membrane, Langmuir. 35 (2019) 14188–14193. https://doi.org/10.1021/acs.langmuir.9b02160.
[32] H.-S. Dang, E.A. Weiber, P. Jannasch, Poly(phenylene oxide) functionalized with quaternary ammonium groups via flexible alkyl spacers for high-performance anion exchange membranes, J. Mater. Chem. A. 3 (2015) 5280–5284. https://doi.org/10.1039/C5TA00350D.
[33] K. Yang, H. Ni, T. Shui, X. Chi, W. Chen, Q. Liu, J. Xu, Z. Wang, High conductivity and alkali-resistant stability of imidazole side chain crosslinked anion exchange membrane, Polymer (Guildf). 211 (2020) 123085. https://doi.org/10.1016/j.polymer.2020.123085.
[34] J. Liao, X. Yu, Q. Chen, X. Gao, H. Ruan, J. Shen, C. Gao, Monovalent anion selective anion-exchange membranes with imidazolium salt-terminated side-chains: Investigating the effect of hydrophobic alkyl spacer length, J. Memb. Sci. 599 (2020) 117818. https://doi.org/10.1016/j.memsci.2020.117818.
[35] C.X. Lin, X.L. Huang, D. Guo, Q.G. Zhang, A.M. Zhu, M.L. Ye, Q.L. Liu, Side-chain-type anion exchange membranes bearing pendant quaternary ammonium groups via flexible spacers for fuel cells, J. Mater. Chem. A. 4 (2016) 13938–13948. https://doi.org/10.1039/C6TA05090E.
[36] A.S. Badami, O. Lane, H.S. Lee, A. Roy, J.E. McGrath, Fundamental investigations of the effect of the linkage group on the behavior of hydrophilic-hydrophobic poly(arylene ether sulfone) multiblock copolymers for proton exchange membrane fuel cells, J. Memb. Sci. (2009). https://doi.org/10.1016/j.memsci.2008.12.066.
[37] K. Sato, T. Ono, Y. Sasano, F. Sato, M. Kumano, K. Yoshida, T. Dairaku, Y. Iwabuchi, Y. Kashiwagi, Electrochemical oxidation of amines using a nitroxyl radical catalyst and the electroanalysis of lidocaine, Catalysts. 8 (2018) 649. https://doi.org/10.3390/catal8120649.
[38] A.L. Bartelson, K.M. Lambert, J.M. Bobbitt, W.F. Bailey, Recent developments in the nitroxide-catalyzed oxidation of amines: Preparation of imines and nitriles, ChemCatChem. 8 (2016) 3421–3430. https://doi.org/10.1002/cctc.201600858.
[39] M.F. Semmelhack, C.R. Schmid, Nitroxyl-mediated electro-oxidation of amines to nitriles and carbonyl compounds, J. Am. Chem. Soc. 105 (1983) 6732–6734. https://doi.org/10.1021/ja00360a042.
[40] H.R. Jiang, J. Sun, L. Wei, M.C. Wu, W. Shyy, T.S. Zhao, A high power density and long cycle life vanadium redox flow battery, Energy Storage Mater. 24 (2020) 529–540. https://doi.org/10.1016/j.ensm.2019.07.005.
[41] A. Khataee, E. Dražević, J. Catalano, A. Bentien, Performance optimization of differential pH quinone-bromide redox flow battery, J. Electrochem. Soc. 165 (2018) A3918–A3924. https://doi.org/10.1149/2.0681816jes.
Electronic copy available at: https://ssrn.com/abstract=4007244