crosslinked ethyl phosphoric acid grafted polybenzimidazole and polybenzimidazole blend membranes...
TRANSCRIPT
ORIGINAL PAPER
Crosslinked ethyl phosphoric acid grafted polybenzimidazoleand polybenzimidazole blend membranes for high-temperatureproton exchange membrane fuel cells
Phimraphas Ngamsantivongsa1 & Hsiu-Li Lin1,2& T. Leon Yu1,2
Received: 17 July 2015 /Accepted: 28 December 2015# Springer Science+Business Media Dordrecht 2016
Abstract Our previous work illustrated that blending 10–30 wt.% of ethyl phosphoric acid-grafted PBI (PBI-EPA,12 mol% degree of grafting) in the PBI membrane enhancesthe phosphoric acid doping level (PAdop) and proton conduc-tivity σ of the membrane. On the other hand, the mechanicalproperties were decreased, and the membrane was highly dis-solved in an 85 wt.% H3PO4 aqueous solution, while the PBI-EPA concentration in the PBI/PBI-EPA blend membrane wasgreater than 50 wt.%. To improve the mechanical properties ofthe PBI/PBI-EPA blend membrane, crosslinked PBI/PBI-EPAmembranes with a PBI-EPA concentration higher than50 wt.% were prepared by blending epoxy resin as acrosslinker. These crosslinked blend membranes demonstrat-ed greater PAdop and σ and better fuel cell performance thanthe neat-PBI and epoxide-crosslinked PBI membranes.
Keywords Polybenzimidazole . Ethyl phosphoricacid-grafted polybenzimidazole . Epoxide-crosslinkedmembrane . High-temperature proton exchangemembranefuel cell
Introduction
Due to their easy handling, low pollution, and high energyconversion efficiency, polymer electrolyte membrane fuel cell
(PEMFC) is considered one of the most promising alternativeenergy resource systems and a suitable power source for trans-portation and stationary applications [1–6]. In the past twodecades, many studies have explored the development of pro-ton exchange membranes (PEMs) in order to sustain adequateproton conductivity under low-humidity and high-temperature (120 °C < temp < 200 °C) environments [6–12].Compared to the high-humidity/low-temperature (temp <90 °C) Nafion-based PEMFCs, low-humidity- and high-temperature-operated PEMFCs (HT-PEMFCs) have advan-tages of higher electrochemical reaction kinetics, higher COtolerance of anode catalysts, and easier thermal and watermanagement, which simplifies fuel cell operating systemsand improves transient response capacity and reliability, lead-ing to reductions in system maintenance and operating costs[10].
Many researchers have focused on developing high-temperature PEMs (HT-PEMs). Among these, H3PO4-dopedpolybenzimidazole (PBI/H3PO4) PEM is considered one ofthe most promising PEMs, operating at temperatures up to200 °C in a low-humidity environment [7–14]. In PBI/H3PO4 PEMs, H3PO4 acts as a proton conductor, and nowateris needed in the PEMs [7, 11, 12, 15]. Thus, maintaining ahigh H3PO4 doping level (PAdop) in the PBI PEM is importantfor high-performance PBI/H3PO4-based PEMFC. One of thedrawbacks of the PBI/H3PO4-based PEMFCs is the migrationof free H3PO4 molecules, which are not bound by the PBIimidazole –N: groups, away from the PEM after long-termfuel cell operation [10].
One of the methods for maintaining high H3PO4 concen-tration and proton conductance of PBI-based PEMs after themigration of free H3PO4 molecules away from the PEMs isthe grafting of PBI backbones with –PO3H2 pendant sidechains [2, 11, 16–18]. The grafting of pendant side chains ontopolymer backbones causes an increase in the polymer free
* T. Leon [email protected]
1 Department of Chemical Engineering & Materials Science, Yuan ZeUniversity, Chung-Li, Taoyuan 32003, Taiwan
2 Fuel Cell Center, Yuan Ze University, Chung-Li, Taoyuan 32003,Taiwan
J Polym Res (2016) 23:22 DOI 10.1007/s10965-015-0911-3
volume [19, 20], which leads to greater PAdop. In the literature,there are many reports of alkyl-sulfonate and aryl-sulfonatesubstituent-grafted-PBIs (PBI-R-SO3Hs) [2, 9, 11, 21–30].Compared with PBIs, PBI-R-SO3Hs display higher PAdop,higher proton conductivity, and higher solubility, but a lowerdecomposition temperature due to desulfonation by heating[2, 28–31], lower brittleness and mechanical strength due tothe greater free volume [20], and a lower degree of inter-polymer imidazole >N-H…N= hydrogen bonds [32] by thepresence of side chains, and higher degree of crosslinking dueto the Lewis acid–base interactions of the grafted pendant -R-SO3H group with imidazole –C=N: and –NH groups (i.e., −R-SO3
− … H-N-C and –SO3H … N=C-) [31, 33]. The electro-chemical andmechanical properties of the PBI-R-SO3Hmem-branes strongly depend on the content and length of thegrafted pendant side chains [2, 20, 21].
Though many PBI-R-SO3H PEMs for high-temperaturePEMFCs (HT-PEMFCs) have been reported in the litera-ture, few studies have investigated phosphoric acid pen-dant side chain-grafted PBIs (PBI-R-PO3H2s, includingbenzyl methyl phosphoric acid-grafted PBI (PBI-BPA;PBI-C6H4-CH2-PO(OH)2) and ethyl phosphoric acid-grafted PBI (PBI-EPA; PBI-C2H4-PO(OH)2), and their ap-plication to PEMFCs [2, 16–18]. Researchers have report-ed the synthesis of PBI-EPAs with various degrees of EPAgrafting and membrane preparations, which showed weak-er mechanical strength of PBI-EPAs than PBI [2, 16, 18].Sukumar et al. demonstrated that PBI-EPA was dissolvedin a H3PO4 aqueous solution (85 wt% H3PO4) at roomtemperature when the degree of EPA grafting was greaterthan 19 mol% [16]. In a previous study, we showed thatthe PBI-EPA (degree of EPA grafting ∼12 mol%) mem-brane was dissolved when it was doped with an H3PO4
aqueous solution (85 wt% H3PO4) at temperatures above70 °C [18]. In order to enhance the PAdop and membranemechanical strength, we prepared PBI/PBI-EPA (degree ofEPA grafting ∼12 mol%) blend membranes and showedthat the PBI/PBI-EPA blend membranes with [PBI]/[PBI-EPA] wt. ratios of 9/1 - 7/3 had greater PAdopand betterfuel cell performance than the neat-PBI membrane [18].However, we found that the PBI/PBI-EPA blend mem-branes were dissolved in H3PO4 aqueous solutions whenthe PBI-EPA concentration in the PBI/PBI-EPA blendswas greater than 50 wt.% (i.e., [PBI]/[PBI-EPA] = 5/5–0/10 by wt.). To avoid dissolution of PBI-EPA membranesin phosphoric acid aqueous solutions, in this study, weprepared covalent crosslinked PBI/PBI-EPA ([PBI]/[PBI-EPA] = 5/5–1/9 by wt.) blend membranes using epoxide(diglycidyl ether bisphenol-A) as a crosslinker [34, 35],and then doped the crosslinked blend membranes withan 85 wt.% H3PO4 aqueous solution at 70 °C. We dem-onstrated that the membrane electrode assemblies (MEAs)prepared using the epoxide-crosslinked PBI/PBI-EPA (PBI/
PBI-EPA/EP) membranes exhibited better PEMFC perfor-mance than those prepared from the neat-PBI andepoxide-crosslinked PBI (PBI/EP) membranes.
Experimental
PBI synthesis
The detailed procedures of PBI polymerization and molecularweight determination were the same as those shown in ourearlier work [17, 18]. First, 25.58 g (0.12 mol) 3,3’-diamino-benzidine (DAB; Aldrich) and 19.92 g (0.12 mol) isophthalicacid (IPA; Sigma-Aldrich) monomers were mixed with 500 gpolyphosphoric acid (PPA; Sigma-Aldrich) solvent under anN2 atmosphere at 210 °C to allow polymerization to proceedfor 48 h. The PBI molecular weight was determined using agel permeation chromatograph (GPC; JASCO PU-2080 Plus)with an RI detector (JASCO RI-2031 Plus), and N,N’-dimethylacetamide (DMAc) was used as an elution solvent.The determined PBI molecular weight was <Mw> =1.65×10⁵ g mol−1 and <Mn> = 7.32×10⁴ g mol−1, whichwas calibrated using narrow molecular weight distributionpolystyrene standards (Sigma-Aldrich, Mw/Mn ∼1.1).
PBI-EPA synthesis
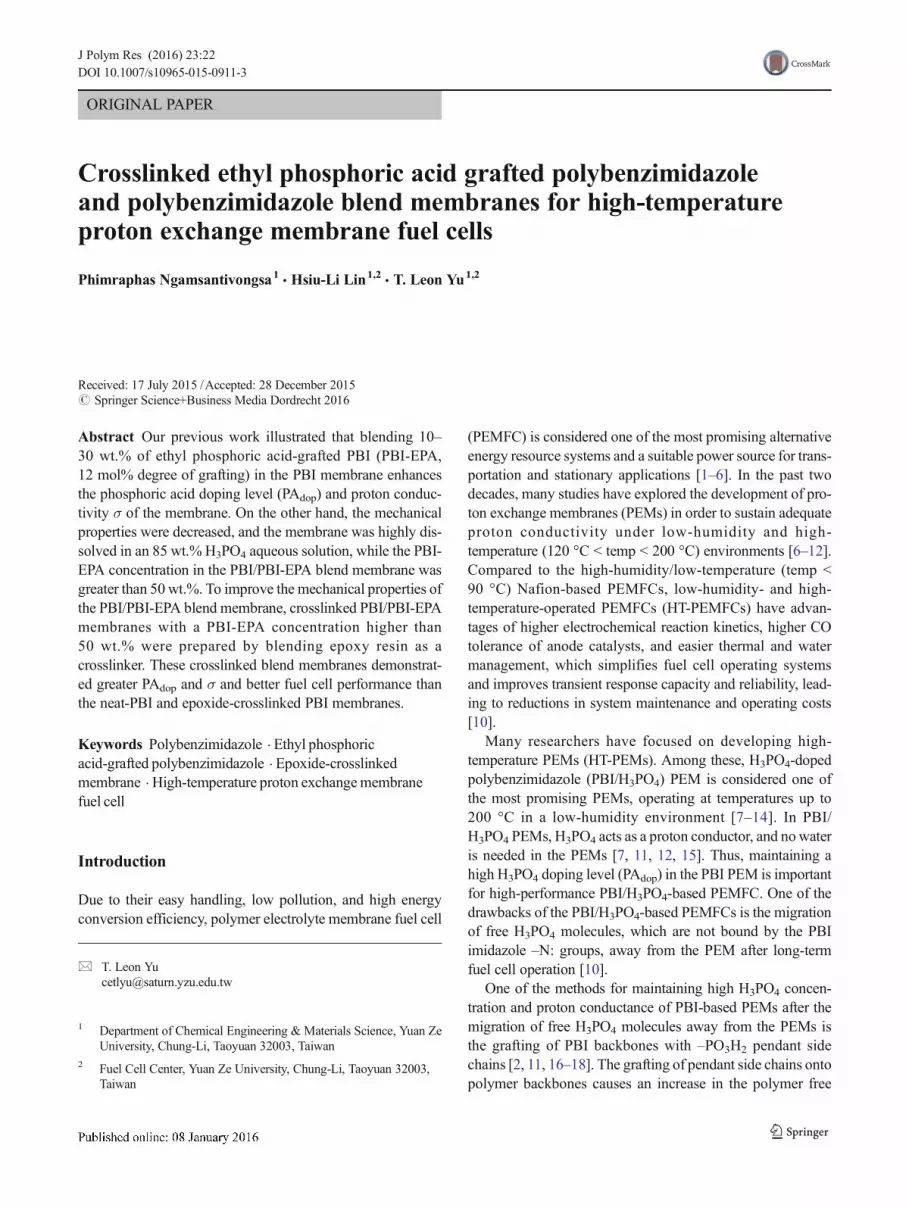
The synthesis reaction scheme of PBI-EPA is shown in Fig. 1.The detailed procedures of PBI-EPA synthesis were same asthose reported in our previous work [18]. First, 2 g PBI and 5 gLiH were mixed in 70 g DMAc solvent at 75 °C under an N2
atmosphere, and the reaction was conducted for 12 h (Fig. 1,step 1). Next, 3.68 g diethyl 2-bromoethyl phosphonate (Br-C2H4-PO(OC2H5)2; Sigma-Aldrich) was added to the reactionmixture and the temperature raised to 90 °C for 48 h (Fig. 1;reaction scheme step 2). The reaction mixture was added toacetone solvent to obtain a dark brown solid precipitate (i.e.,PBI-C2H4-PO(OC2H5)2), and the solid precipitate was thenmixed into 100 g 12-M HCl aqueous solution at 60 °C for24 h to conduct diethyl phosphate dissociation reaction toobtain PBI-EPA (i.e., PBI-C2H4-PO(OH)2; Fig. 1; reactionscheme step 3). The PBI-EPA product powder was then mixedwith distilled water and filtered several times to remove theresidual HCl, and finally was dried at ∼100 °C under a vacu-um for 2 h to evaporate the residual water.
PBI and PBI-EPA chemical structure characterization
The chemical structures of PBI and PBI-EPAwere character-ized using IR (PerkinElmer 1725X FTIR) and NMR (BrukerAVANCE 500 MHz 1H NMR). The integrated NMR reso-nance peak areas of the imidazole –NH and benzene –CH,and the grafted –EPA side chain –C2H4- of PBI-EPA and
22 Page 2 of 11 J Polym Res (2016) 23:22

CHN elemental analysis (vario EL/MICRO cube; ElementarAnalysensysteme, Germany) were used to estimate the degreeof –EPA grafting on the PBI backbone, which showed thataround ∼12 mol% imidazole –NH groups of PBI-EPA back-bone were grafted with the –EPA groups. The detailed IR,NMR, and CHN elemental analysis results were shown in anearlier report [18].
Membrane preparation
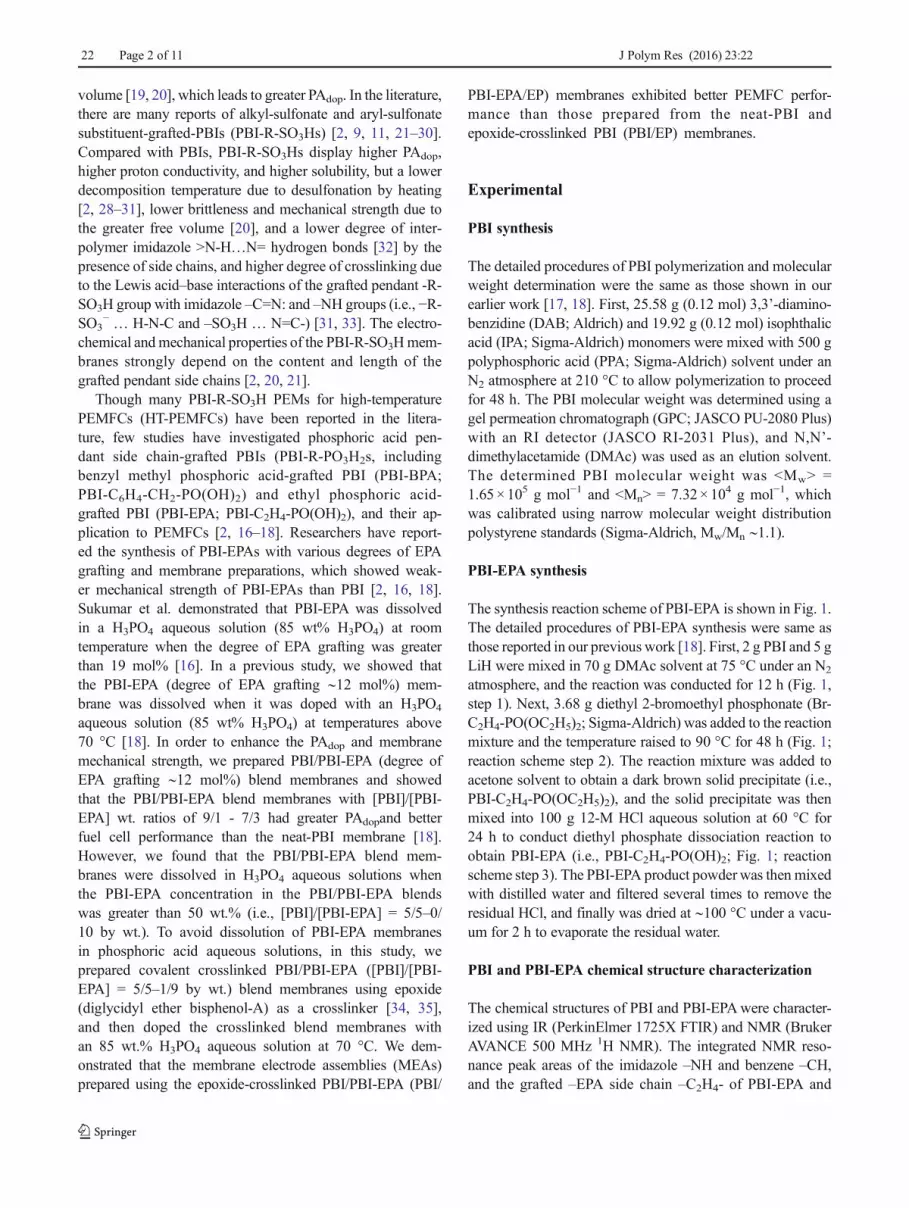
The PBI and PBI/PBI-EPA blends ([PBI]/[PBI-EPA] = 5/5,4/6, 3/7, 2/8 and 1/9 by wt., designated as PBI/PBI-EPA-55,PBI/PBI-EPA-46, PBI/PBI-EPA-37, PBI/PBI-EPA-28, andPBI/PBI-EPA-19, respectively) were crosslinked with epox-ide resin to prepare crosslinked membranes (i.e., PBI/EP, PBI/PBI-EPA-55/EP, PBI/PBI-EPA-46/EP, PBI/PBI-EPA-37/EP,PBI/PBI-EPA-28/EP and PBI/PBI-EPA-19/EP, respectively)using a solution casting method. Figure 2 illustrates the chem-ical structure of PBI-EPA crosslinked with the epoxide resin.First, 2 g PBI/PBI-EPA blend polymer and 0.246 g of Epon-828 (equivalent (Eq.) wt. = 190 g/mol-epoxide; Hexion Spe-cialty Chemicals, Inc.) were mixed in 15 g DMAc solvent toform a ∼15 wt.% polymer solution. In the polymer mixture,the functional group ratio of Epon-828 epoxide to imidazole –NH (i.e., [epoxide]/[NH]) was around 1/10. The polymer so-lution was cast on a glass plate with a blade coater and dried at80 °C under a vacuum for 24 h to remove the solvent, and thetemperature was then raised to 135 °C to conduct epoxide andimidazole-NH crosslinking reaction for 3 h. The non-crosslinked neat-PBI and neat-PBI-EPAmembranes were pre-pared using the same solution (i.e., 15 wt.% polymer inDMAc solvent without epoxide resin) casting procedures forreferences. The composition and final thickness of each mem-brane are shown in Table 1.
Membrane characterization
(1) Mechanical tests: Tensile stress–strain tests of the mem-branes without doping with H3PO4 were performed using an
Instron unit (universal testing machine, model 4204) in accor-dance with JIS-K7127. (2) Thermal gravimetric analysis(TGA): The membranes without doping with H3PO4 (samplesize was ∼5-10 mg) were used to conduct TGA studies with amodel Q50 TGA (TA Instruments) under an N2 atmosphere(N2, at a flow rate of 60 mL min−1). The heating rate was10 °C min−1, and the sample size of each measurement was∼5-10 mg. (3) Phosphoric acid doping level (PAdop): Themembranes (3.5×3.5 cm2) were doped with H3PO4 by im-mersion in an 85 wt.% H3PO4 aqueous solution at 70 °C for48 h. The PAdop was defined as PAdop = (W1- W0)/W0×100 %, whereW0 andW1 were the weight of the samplebefore and after doping with H3PO4, respectively. Before W0
and W1 measurements, each membrane was dried at 110 °Cunder a vacuum for more than 5 h to remove the moistureadsorbed in the membrane until an unchanged weight wasobtained. (4) Ionic conductivity (σ) measurements: Thethrough-plane σ of the membrane after doping with H3PO4
was estimated using the equation σ = L/(A × R), where R is themeasured through-plane resistance, A=3.14 cm2 is the cross-section area of the membrane for an R measurement, and L isthe thickness of the membrane. The through-plane Rmeasure-ments were performed at 160 °C with 0.0 % RH by AC-impedance spectroscopy using a Solartron 1260 gain-phaseanalyzer interfaced to a Solartron 1480 multimeter. Each re-ported datum of the membrane characterization measurementwas an average of three measurements.
Membrane electrode assembly (MEA) preparationand single-cell PEMFC performance tests
The membranes prepared as shown in the BMembranepreparation^ section (Table 1) and doped with H3PO4
were used to prepare MEAs. The catalyst was a Pt oncarbon powder support catalyst (Pt-C, 40 wt.% Pt; John-son Matthey), the gas diffusion layer (GDL) was a car-bon paper (SGL, 35BC), and the Pt-C binder was PBI(Mw=∼1.1 × 10⁴ g mol−1 and Mw/Mn=∼1.18) [36]. Inboth the anode and cathode catalyst layers (CLs), the
Fig. 1 Reaction scheme for PBI-CH2CH2-PO3H2 (PBI-EPA) synthesis
J Polym Res (2016) 23:22 Page 3 of 11 22

Pt loadings were 0.5 mg cm−2 with a PBI binder con-tent of ∼ 5 wt.%. The detailed MEA preparation proce-dures were the same as those reported elsewhere [18, 35,36]. Pt-C/PBI/LiCl/DMAc ([Pt-C]/[PBI]/[LiCl]/[DMAc] =9/1/1/190 by wt.) catalyst ink solution was ultrasonicallyspray-coated on the GDL to prepare gas diffusion elec-trodes (GDEs). The solvent in the CL was dried at 80 °Cfor 1 h, followed by drying at 150 °C under a vacuum foranother hour. The GDEs were then immersed in distilledwater to remove the LiCl, and dried under a vacuum for1 h to remove the residue water. They were then immersedin a 10 wt.% H3PO4 aqueous solution at room temperaturefor 24 h and dried under a vacuum for 1 h. The membranedoped with H3PO4 was then sandwiched between twoGDEs, without pressing, to obtain an MEA (active area3.5 × 3.5 cm2). The single-cell performance of each MEA
was tested at 160 °C under ambient pressure using an FC5100-series fuel cell testing system (CHINO Inc., Japan)w i t h non - hum i d i f i e d H 2 /O 2 ( f l ow r a t e s we r e200 mL min−1 for both H2 and O2) and H2/air (flow rateswere 200 mL min−1 and 1000 mL min−1 for H2 and air,respectively) fuel gases. Before i-V measurement, theMEA was activated at a constant current density of i -= 200 mA cm−2 for 8 h. Each i-V curve was obtained bymeasuring the current density i with step decrement of volt-age V by an interval of 0.05 V; and each i-V measurementwas held for 30 s. The impedance measurement of eachMEAwas conducted using the same fuel cell testing systemas that used for i-V measurements with a Model 850e fre-quency response analyzer (Scribner Associates Inc.). Thepotential state was maintained at i= 200 mA cm−2, and thescanning frequency ranged from 104 Hz to 0.1 Hz.
Fig. 2 Chemical structure of PBI-CH2CH2-PO3H2 (PBI-EPA) crosslinked with epoxy resin (Epon 828)
Table 1 Composition andthickness of the membranes membrane PBI
(g)
PBI-EPA
(g)
Epoxide
(g)
Thickness
(μm)
PBI 1.95 ± 0.02 − − 69 ± 3
PBI/EP 2.10± 0.01 − 0.247 ± 0.003 73 ± 2
PBI/PBI-EPA-55/EP 1.03± 0.02 1.01 ± 0.01 0.249 ± 0.001 71 ± 3
PBI/PBI-EPA-46/EP 0.81± 0.01 1.19 ± 0.01 0.246 ± 0.001 70 ± 3
PBI/PBI-EPA-37/EP 0.59± 0.01 1.41 ± 0.01 0.244 ± 0.002 72 ± 3
PBI/PBI-EPA-28/EP 0.41± 0.02 1.59 ± 0.02 0.244 ± 0.002 71 ± 3
PBI/PBI-EPA-19/EP 0.19± 0.01 1.79 ± 0.01 0.246 ± 0.001 73 ± 4
22 Page 4 of 11 J Polym Res (2016) 23:22

Results and discussion
FT-IR studies of epoxide-crosslinked PBI/PBI-EPA/EPblends
The FT-IR and NMR spectra and CHN elemental analysisdata of neat-PBI and neat-PBI-EPAwere shown in a previousreport [18], which demonstrated that the degree of EPAgrafting of PBI-EPA was around 12.0 mol% per mole of im-idazole –NH group. Figure 3 illustrates the IR spectra of neat-PBI (Fig. 3a), PBI-EPA (Fig. 3h), PBI/EP (Fig. 3b), and fivecrosslinked PBI/PBI-EPA/EPs (Fig. 3c–g). These spectrashowed strong absorption at 1605 cm−1 (1500–1750 cm−1)due to the C=C and C=N stretches, strong absorption at1429 cm−1 due to the C=C and C=N in-plane deformation,and absorption at 791 cm−1 due to the =C-H out-plane bend-ing [37, 38]. The IR spectrum of PBI-EPA showed anotherabsorption peak at 1036 cm−1 and a doublet at ∼875 cm−1 dueto the phosphoric acid P=O and P-OH stretching, respectively[37, 38], indicating the grafting of the EPA group on the PBIbackbone. Both PBI (Fig. 3a) and PBI-EPA (Fig. 3h) showedbroad absorption at 2500–3500 cm−1 due to the overlapping ofimidazole N-H (3200–3640 cm−1) and aromatic C-H (∼2800–3100 cm−1) stretching for PBI and the overlapping of imidaz-ole N-H and –EPA O-H stretching with aromatic C-H
(∼3000–3100 cm−1) and EPA aliphatic C-H (∼2800–3000 cm−1) stretching for PBI-EPA. The PBI/EP (Fig. 3b)and PBI/PBI-EPA/EP (Fig. 3c–g) exhibited weaker N-Hstretching absorption than the neat-PBI and neat-PBI-EPA,because of the crosslinking reaction between the epoxideand the imidazole N-H (Fig. 2), which reduced the N-H groupconcentration. The IR spectra of PBI/PBI-EPA/EP polymers(Fig. 3c–h) showed strong absorption at ∼1180–1185 and1230 cm−1 due to the C-O-C stretching of epoxide. The IRspectra of PBI/PBI-EPA/EPs also showed that the absorptionpeak intensity of aliphatic C-H stretching at 2700–3000 cm−1,P=O stretching at 1036 cm−1, and P-OH stretching at∼875 cm−1 increased with increasing PBI-EPA concentrationin the polymer blends from PBI/PBI-EPA-55/EP (Fig. 3c) toPBI/PBI-EPA-19/EP (Fig. 3g). All these spectra were consis-tent with the theoretical chemical structures of polymers.
TGA studies of PBI and PBI-EPA
Good thermal stability at elevated temperatures is required forPEMs for HT-PEMFC applications. The thermal properties ofneat-PBI, neat-PBI-EPA, PBI/EP, and five crosslinked PBI/PBI-EPA/EP polymer blends were studied using TGA.Figure 4 shows the TGA data for these polymers under anN2 atmosphere. Prior to the TGA investigation, the sampleswere stored at room temperature in an ambient environment(∼25 °C and 50 % RH) for at least 1 week. The weight loss attemperatures below 200 °C, which was observed in all thepolymers, was attributed to the evaporation of the moistureabsorbed in the polymers. In Table 2, we summarize the
Fig. 3 IR spectra. (a) PBI; (b) PBI/EP; (c) PBI/PBI-EPA-55/EP; (d) PBI/PBI-EPA-46/EP; (e) PBI/PBI-EPA-37/EP; (f) PBI/PBI-EPA-28/EP; (g)PBI/PBI-EPA19/EP; (h) PBI-EPA
Fig. 4 TGA curves. (a) PBI; (b) PBI/EP; (c) PBI/PBI-EPA-55/EP; (d)PBI/PBI-EPA-46/EP; (e) PBI/PBI-EPA-37/EP; (f) PBI/PBI-EPA-28/EP;(g) PBI/PBI-EPA-19/EP; (h) PBI-EPA
J Polym Res (2016) 23:22 Page 5 of 11 22

moisture content (i.e., the weight loss below 200 °C) of all thesamples. The TGA data revealed that PBI was thermally sta-ble at temperatures below 580 °C and that weight loss oc-curred as the temperature was raised above 580 °C [Fig. 4curve (a)], due to the thermal decomposition of PBI backbone.The PBI/EP TGA curve [Fig. 4 curve (b)] showed that PBI/EPhad lower moisture content (moisture content ∼3.75 wt.%)than PBI (moisture content ∼5.60 wt.%). The crosslinkingbetween PBI imidazole –NH and epoxide functional groupsresulted in a lower polymer free volume in the PBI/EP andthus a lower amount of water molecules absorbed in the poly-mer. The PBI/EP TGA curve also showed two decompositiontemperatures (Tds), in which the lower decomposition temper-ature (Td-1∼241 °C) was due to the decomposition of theepoxide ether –COC– group and the higher decompositiontemperature (Td-2∼ 541 °C) due to the decomposition ofPBI backbone. The PBI-EPA TGA curve (Fig. 4h) showedhigher moisture content (moisture content ∼11.50 wt.%) thanPBI and PBI/EP, due to the hydrophilic property of the grafted–CH2-CH2-PO3H2 side chains. The grafted hydrophilic sidechains also caused the PBI-EPA to have greater free volumeand thus higher moisture content than PBI and PBI/EP. ThePBI-EPA TGA curve also demonstrated two Tds, i.e., Td-1(∼240 °C) and Td-2 (∼530 °C), which were attributed to thedecomposition of EPA side chains and PBI backbones, re-spectively. The TGA curves of PBI/PBI-EPA/EP polymers,which were composed of [PBI]/[PBI-EPA] = 5/5–1/9 by wt.and crosslinked with epoxide resin, demonstrated that theamounts of moisture (weight loss below 200 °C) of thesepolymers were between those of PBI/EP and PBI-EPA, andthe moisture content increased with increasing PBI-EPA con-centration in the blends. The TGA curves of PBI/PBI-EPA/EPpolymers also demonstrated two decomposition temperatures,i.e., Td-1 and Td-2. The Td-1 s of PBI/PBI-EPA/EPs werearound ∼240 °C, which were similar to the Td-1 s of PBI/EPand PBI-EPA. The Td-2 s of PBI/PBI-EPA/EPs were betweenthose of PBI/EP and PBI-EPA, and decreased with increasingPBI-EPA concentration in the blends. The Td-1 and Td-2 data
for all polymers are listed in Table 2. Although the TGA datashowed an obvious difference in thermal stability, it must benoted that all the polymers were stable up to at least ∼240 °C,which was well above the temperature for HT-PEMFCapplications.
Mechanical properties of the membranes
The mechanical properties of the PBI, PBI/EP, PBI/PBI-EPA-55, and five PBI/PBI-EPA/EP (i.e., [PBI]/[PBI-EPA] =5/5∼1/9 bywt.) membranes without dopingwith H3PO4 wereinvestigated at room temperature in an ambient environment(∼25 °C and ∼50% RH). The mechanical strength of the neat-PBI-EPA membrane was low, and its mechanical test was notperformed in this study. Figure 5 shows the tensile stress ver-sus strain curves of these membranes. The maximum tensilestress, tensile strain at break, and Young’s modulus of thesemembranes are summarized in Table 3. These data revealedthat the neat-PBI membrane had a tensile stress and strain of∼74.4 MPa and 8.1 %, respectively. The introduction of ep-oxide crosslinking in the PBI (i.e., PBI/EP) resulted in a mem-brane with higher tensile stress (i.e., ∼97.5 MPa) and lowertensile strain (i.e., 4.3 %) than the neat-PBI membrane, whichare typical properties of crosslinked polymers. The blendingof 50 wt.% PBI-EPA into the PBI membrane (i.e., PBI/PBI-EPA-55) resulted in much lower tensile stress (∼11.6 MPa)and a tensile strain (i.e., ∼2.4 %) than the neat-PBI membrane,due to the presence of the –EPA side chains. The blending ofPBI-EPA into the PBI membrane resulted in the disruption ofPBI inter-polymer hydrogen bonding [32] and an increase infree volume from the presence of the –EPA side chains in the
Table 2 TGAmoisture content and decomposition temperatures of themembranes
Sample Moisture content(wt.%)
Td-1(°C)
Td-2(°C)
PBI 5.60 ± 0.02 580 ± 2
PBI/EP 3.75± 0.01 241 ± 2 541 ± 2
PBI/PBI-EPA-55/EP 6.20± 0.02 240 ± 1 539 ± 1
PBI/PBI-EPA-46/EP 7.40± 0.05 240 ± 2 537 ± 2
PBI/PBI-EPA-37/EP 8.10± 0.04 241 ± 1 535 ± 2
PBI/PBI-EPA-28/EP 8.50± 0.03 239 ± 2 533 ± 1
PBI/PBI-EPA-19/EP 9.00± 0.01 240 ± 3 532 ± 1
PBI-EPA 11.50± 0.03 240 ± 2 530 ± 2
Fig. 5 Tensile stress vs. tensile strain curves. (a) PBI; (b) PBI/EP; (c)PBI/PBI-EPA-55/EP; (d) PBI/PBI-EPA-46/EP; (e) PBI/PBI-EPA-37/EP;(f) PBI/PBI-EPA-28/EP; (g) PBI/PBI-EPA-19/EP; (h) PBI/PBI-EPA-55
22 Page 6 of 11 J Polym Res (2016) 23:22

blend membranes [19]. Both the disruption of inter-polymerhydrogen bonds and the increase in free volume resulted in areduction in membrane tensile stress. As the PBI/PBI-EPA-55blend membrane was crosslinked with 12.3 wt.% epoxy resin(i.e., PBI/PBI-EPA-55/EP), the maximum tensile stress andtensile strain at break were increased to 89.1 MPa and7.5 %, respectively. A further increase of PBI-EPA concentra-tion in the PBI/PBI-EPA blend of the PBI/PBI-EPA/EP mem-brane from 50 wt.% (i.e., PBI/PBI-EPA-55/EP) to 90 wt.%(i.e., PBI/PBI-EPA-19/EP) resulted in reductions in both ten-sile stress and tensile strain, from ∼89.1 MPa to ∼43.8 MPaand from 7.5% to 6.2%, respectively. It was noted that thoughthe PBI/PBI-EPA-55/EP ∼ PBI/PBI-EPA-19/EP membraneshad the same or higher PBI-EPA concentration in comparisonto the PBI/PBI-EPA-55 blend membrane, the introduction of12.3 wt.% of epoxide crosslinkers in the blend membranesimproved the membrane mechanical properties, and thesecrosslinked blend membranes were suitable for HT-PEMFC application, as will be shown in the BSingle-cellPEMFC performance tests^ section.
Phosphoric acid doping levels and conductivitiesof the membranes after doping with phosphoric acid
The PBI, PBI/EP, and five PBI/PBI-EPA/EP (i.e., [PBI]/[PBI-EPA] = 5/5∼ 1/9 by wt.) membranes were doped with an85 wt.% H3PO4 aqueous solution at 70 °C for 48 h. The PAdop
and σ data obtained at 160 °C with 0.0 % RH for these mem-branes are summarized in Table 4. It was previously reportedthat around two H3PO4 bound molecules and more than fourfree H3PO4 molecules were associated with a PBI repeat unitin a H3PO4-doped PBI membrane [39]. The two imidazole –C=N: groups per PBI repeat unit provide coordinating sites forbinding two H3PO4 molecules. The non-bound free H3PO4
molecules are the main contributors to membrane conduc-tance. Table 4 shows that the neat-PBI had a PAdop of∼297 wt.%, which was similar to those reported in literature[10, 11]. Compared to the neat-PBI, PBI/EP had smaller PAdop
and σ values, due to the smaller free volume and the restriction
of polymer chain motion by the covalent crosslinking bonds[19]. The neat PBI-EPA and PBI/PBI-EPA blend membraneswith PBI-EPA concentrations greater than 50 wt.% (i.e., PBI/PBI-EPA-55 ∼ PBI/PBI-EPA-91 blends, in which [PBI]/[PBI-EPA] < 5/5 by wt.) were dissolved when they were doped inan 85 wt.% H3PO4 aqueous solution at 70 °C [18]. To avoiddissolution in H3PO4 aqueous solutions, these blend mem-branes were crosslinked by an epoxide crosslinker (i.e., PBI/PBI-EPA-55/EP ∼ PBI/PBI-EPA-19/EP). Table 4 demon-strates that the crosslinked PBI/PBI-EPA blend (i.e., PBI/PBI-EPA-55/EP ∼ PBI/PBI-EPA-19/EP) membranes hadgreater PAdop and σ values than the neat-PBI and PBI/EPmembranes. Table 4 also shows that the PAdop and σ data ofthe PBI/PBI-EPA/EP membranes increased with the increas-ing PBI-EPA concentration in the PBI/PBI-EPA blend from50 wt.% (i.e., PBI/PBI-EPA-55/EP) to 80 wt.% (i.e., PBI/PBI-EPA-28/EP), and then decreased with increasing PBI-EPAconcentration from 80 wt.% to 90 wt.% (i.e., PBI/PBI-EPA-19/EP). The introduction of hydrophilic PBI-EPA into thePBI/EP resulted in an increase in the free volume because ofthe presence of the grafted –C2H4-PO3H2 side chains. Theincrease in the free volume and the hydrophilic properties ofthe grafted –C2H4-PO3H2 side chains led to greater PAdop andσ in the PBI/PBI-EPA/EP membranes than in the PBI/EPmembrane. However, increasing the PBI-EPA concentrationin the PBI/PBI-EPA/EP membranes also resulted in the
Table 3 Mechanical propertiesof the membranes (room temp.) Membrane Maximum tensile stress
(MPa)
Strain at break
(%)
Young’s modulus
(GPa)
PBI 74.4 ± 0.1 8.1 ± 0.5 2.3 ± 0.1
PBI/PBI-EPA-55 11.6 ± 0.2 2.4 ± 0.5 0.7 ± 0.1
PBI/EP 97.5 ± 0.2 4.3 ± 0.5 3.9 ± 0.1
PBI/PBI-EPA-55/EP 89.1 ± 0.3 7.5 ± 0.5 3.1 ± 0.2
PBI/PBI-EPA-46/EP 78.7 ± 0.2 7.3 ± 0.6 2.4 ± 0.1
PBI/PBI-EPA-37/EP 70.2 ± 0.2 6.7 ± 0.5 1.8 ± 0.2
PBI/PBI-EPA-28/EP 64.1 ± 0.1 6.4 ± 0.5 1.6 ± 0.2
PBI/PBI-EPA-19/EP 43.8 ± 0.1 6.2 ± 0.4 1.3 ± 0.1
Table 4 Phosphoric acid doping levels (PAdops) and protonconductivities (σs; at 160 °C and 0.0 % RH) of the membranes
Membrane PAdop
(wt%)σ(10−2 S cm−1)
PBI 297 ± 2 5.0 ± 0.2
PBI/EP 259 ± 4 3.1 ± 0.2
PBI/PBI-EPA-55/EP 367 ± 6 7.0 ± 0.1
PBI/PBI-EPA-46/EP 376 ± 3 7.2 ± 0.1
PBI/PBI-EPA-37/EP 390 ± 5 7.5 ± 0.2
PBI/PBI-EPA-28/EP 420 ± 3 8.1 ± 0.1
PBI/PBI-EPA-19/EP 401 ± 4 7.7 ± 0.1
J Polym Res (2016) 23:22 Page 7 of 11 22

interaction between the grafted –C2H4-PO3H2 groups and thePBI imidazole -C=N- and >N-H groups, and thus reduced theimidazole -C=N- and >N-H binding sites for the H3PO4 mol-ecules, leading to decreases in both the PAdop and σ of themembrane as the PBI-EPA concentration of PBI/PBI-EPAin the crosslinked blend membranes was increased from80 wt.% (i.e., PBI/PBI-EPA-28/EP) to 90 wt.% (i.e.,PBI/PBI-EPA-19/EP).
In Table 5, we summarize the literature reporting PAdop andσ data of the modified PBI series membranes, including: (1)PBI/PBI-EPA-91 and PBI/PBI-EPA-82 blends [16, 18]; (2)PBI/PBI-BP-82 and PBI/PBI-BP-64 blends, the PBI and abenzyl-methyl-phosphoric acid-grafted PBI (PBI-BP; the de-gree of benzyl-methyl-phosphoric acid grafting was 24mol%)blend membranes, in which [PBI]/[PBI-BP] was 8/2 and 6/4by wt. for PBI/PBI-BP-82 and PBI/PBI-BP-64, respectively[17]; (3) PBI/S-PSU-36 (the PBI and sulfonated polysulfone-36 blend; the degree of sulfonation of S-PSU was 36 mol%and [PBI]/[S-PSU-36] = 3/1 by wt.) and PBI/S-PSU-70 (thePBI and sulfonated polysulfone-70 (S-PSU-70) blend; the de-gree of sulfonation of S-PSU was 70 mol% and [PBI]/[S-PSU-70] = 3/1 by wt.) blend membranes [40]; (4) PBI/PBI-BS-64, a PBI and a butyl sulfonate-grafted PBI (PBI-BS; de-gree of sulfonation was 17.3 mol%) blend membrane, inwhich [PBI]/[PBI-BS] = 6/4 by wt. [30]; (5) PBI-EPA (degreeof EPA grafting was 12.0 mol%) [16]. These results illustratethat blending less than 50 wt.% of functionalized polymers(e.g., S-PSU) or functional group-grafted polymers (e.g.,PBI-BP, PBI-EPA, PBI-BS) into the PBI membrane resultsin the membrane having greater PAdop and σ (Table 5). How-ever, the blend membranes exhibited weak mechanicalstrength and were dissolved when doped in an 85 wt.% phos-phoric acid aqueous solution, as the concentration of the func-tionalized polymer or the functional group-grafted polymer inthe blend membranes was higher than 50 wt.% due to their
hydrophilic properties [18]. The present results demonstratethat introducing epoxide crosslinking in the PBI/PBI-EPAblend membranes containing more than 50 wt.% of PBI-EPA improved the mechanical strength (Table 3 and Fig. 5)and prevented the membranes from dissolving in the phospho-ric acid aqueous solutions. These crosslinked blend mem-branes had greater PAdop and σ values than the neat-PBI andPBI/EP membranes, due to the higher hydrophilic PBI-EPAconcentration in the crosslinked blend membranes. The pres-ent crosslinked PBI/PBI-EPA-55/EP ∼ PBI-EPA-91/EP mem-branes also exhibited greater PAdop and σ values than the non-crosslinked PBI/PBI-EPA blend membranes containing lessthan 50 wt.% of PBI-EPA, i.e., PBI/PBI-EPA-91 ∼ PBI/PBI-EPA-64 [18] (see data shown in Tables 4 and 5).
Single-cell PEMFC performance tests
The PBI, PBI/EP, and five PBI/PBI-EPA/EP (with [PBI]/[PBI-EPA] = 5/5–1/9 by wt.) membranes after doping withH3PO4 were used to prepare MEAs and to perform single-cell tests at 160 °C with non-humidified H2/O2 and H2/air fuelgases. The i-V (current density vs. cell voltage) and i-PD(current density vs. power density) curves obtained usingH2/O2 and H2/air fuel gases are presented in Figs. 6 and 7,respectively. Table 6 summarizes the open circuit voltages(OCVs) and maximum power densities (PDmaxs) obtainedfrom the i-V and i-PD curves, respectively, shown in Figs. 6and 7. These data demonstrate that all MEAs had OCV values
Fig. 6 Single-cell PEMFC test i-V and i-PD curves obtained at 160 °Cwith non-humidified H2/O2 gases for MEAs (active area 3.5 × 3.5 cm2;the anode and cathode Pt loadings were both 0.5 mg cm−2) prepared using(a) PBI; (b) PBI/EP; (c) PBI/PBI-EPA-55/EP; (d) PBI/PBI-EPA-46/EP;(e) PBI/PBI-EPA-37/EP; (f) PBI/PBI-EPA-28/EP; (g) PBI/PBI-EPA-19/EP membranes
Table 5 Phosphoric acid doping levels (PAdops) and conductivities (σs)of the modified PBI membranes. The BTemp^ and BRH^ are thetemperature and relative humidity for σ measurements
Membrane PAdop
(wt.%)σ(10−2 S cm−1)
Temp.(°C)
RH(%)
Reference
PBI/PBI-EPA-91 337 6.5 160 0 [18]
PBI/PBI-EPA-82 350 6.8 160 0 [18]
PBI/PBI-BP-82 260 6.0 160 0 [17]
PBI/PBI-BP-64 263 6.5 160 0 [17]
PBI/S-PSU-36 159 7.5 160 80 [40]
PBI/S-PSU-70 159 10.0 160 80 [40]
PBI/PBI-BS-64 220 3.1 160 0 [30]
PBI-EPA* 51 8.4 25 NA [16]
PBI-EPA* 51 8.3 140 NA [16]
*PBI-EPAwas doped with phosphoric acid aqueous solution at 25 °C
22 Page 8 of 11 J Polym Res (2016) 23:22

larger than 0.9 V, suggesting low gas permeability of thesemembranes. Figures 6 and 7 and Table 6 also show that theMEA fabricated using the PBI/PBI-EPA-28/EP membranehad the highest fuel cell performance among these MEAs,and the fuel cell performance decreased according to the se-quence PBI/PBI-EPA-28/EP > PBI/PBI-EPA-19/EP > PBI/PBI-EPA-37/EP > PBI/PBI-EPA-46/EP > PBI/PBI-EPA-55/EP > PBI > PBI/EP. Since all the MEAs were fabricated usingthe same GDL and the same catalyst layer composition, thedifference in the fuel cell performance among these MEAswas mainly due to the difference in the membrane composi-tion. Comparing the data shown in Figs. 6 and 7 and Table 6with those shown in Table 4, we found that the single fuel celli-Vand PDmax data were consistent with the membrane PAdop
and σ data. The non-crosslinked PBI/PBI-EPA blend mem-branes with PBI-EPA concentrations less than 50 wt.% wereused to prepare MEAs and perform single fuel cell tests at160 °C with non-humidified H2/O2 and H2/air gases in a pre-vious study [18]. Those single-cell tests showed that the MEAprepared using the non-crosslinked PBI/PBI-EPA-82 ([PBI]/[PBI-EPA] = 8/2 by wt.) blend membrane had the largest
Fig. 9 AC impedances obtained at i = 200 mA cm−2 and 160 °C withnon-humidified H2/air gases. The MEAs were prepared from (a) PBI/PBI-EPA-28/EP; (b) PBI/PBI-EPA-19/EP; (c) PBI/PBI-EPA-37/EP; (d)PBI/PBI-EPA-46/EP; (e) PBI/PBI-EPA-55/EP; (f) PBI/EP; (g) PBImembranes
Fig. 8 AC -impedances obtained at i= 200 mA cm−2 and 160 °C withnon-humidified H2/O2 gases. The MEAs were prepared from (a) PBI/PBI-EPA-28/EP; (b) PBI/PBI-EPA-19/EP; (c) PBI/PBI-EPA-37/EP; (d)PBI/PBI-EPA-46/EP; (e) PBI/PBI-EPA-55/EP; (f) PBI/EP; (g) PBImembranes
Table 6 Open circuit voltages (OCVs) and maximum power densities(PDmaxs) of PEMFCs operated at 160 °C with non-humidified H2/O2 andH2/air gases
Membrane H2/O2 H2/air
OCV(V)
PDmax(mW cm−2)
OCV(V)
PDmax(mW cm−2)
PBI 0.95 436 0.91 229
PBI/EP 0.90 420 0.90 221
PBI/PBI-EPA-55/EP 0.92 529 0.90 419
PBI/PBI-EPA-46/EP 0.90 562 0.90 423
PBI/PBI-EPA-37/EP 0.90 620 0.91 456
PBI/PBI-EPA-28/EP 0.93 663 0.92 503
PBI/PBI-EPA-19/EP 0.92 654 0.92 483
Fig. 7 Single-cell PEMFC test i-V and i-PD curves obtained at 160 °Cwith non-humidified H2/air gases for MEAs (active area 3.5 × 3.5 cm2;the anode and cathode Pt loadings were both 0.5 mg cm−2) prepared using(a) PBI; (b) PBI/EP; (c) PBI/PBI-EPA-55/EP; (d) PBI/PBI-EPA-46/EP;(e) PBI/PBI-EPA-37/EP; (f) PBI/PBI-EPA-28/EP; (g) PBI/PBI-EPA-19/EP membranes
J Polym Res (2016) 23:22 Page 9 of 11 22

PDmax of 527 mW cm−2 with non-humidified H2/O2 fuel andthe largest PDmax of 407 mW cm−2 with non-humidified H2/air fuel, which were worse than those of the presentcrosslinked PBI/PBI-EPA-28/EP-based MEAs (Table 6). Itcould be that the covalent crosslinked structure led to higherhydrophilic PBI-EPA concentrations in the PBI/PBI-EPA/EP([PBI]/[PBI-EPA] ≤ 5/5) membranes than in the non-crosslinked PBI/PBI-EPA ([PBI]/[PBI-EPA] > 5/5) blendmembranes and allowed them to maintain good mechanicalstrength. The greater amount of hydrophilic –EPA groups re-sulted in greater PAdop and σ in the PBI/PBI-EPA/EP ([PBI]/[PBI-EPA] ≤ 5/5) membranes than in the PBI/PBI-EPA([PBI]/[PBI-EPA] > 5/5) membranes.
In the next section, we will show the AC impedance mea-surement results and demonstrate that the crosslinked PBI/PBI-EPA/EP ([PBI]/[PBI-EPA] ≤ 5/5)-basedMEAs had lowerohmic resistance Rs than the non-crosslinked PBI/PBI-EPA([PBI]/[PBI-EPA] > 5/5)-based MEAs.
AC impedance studies for single-cell PEMFCs
AC impedance measurements were also carried out to inves-tigate the resistance of the present MEAs. Measurement ofeach MEA was conducted at a fixed current density, i.e., i -= 200 mA cm−2, and at 160 °C with non-humidified H2/O2
and H2/air fuel gases after i-V measurement. The AC
impedance diagrams were simulated using a Z-view program(Scribner Associates, Inc.) and fitted to an equivalent circuit(see the inserted figure in Fig. 8). The circuit consisted of aresistance Rs, which represents the total non-electrode cell ohm-ic resistance in a series, a cathode charge transfer resistanceRcC,and an anode charge transfer resistance RcA. RcC and RcA areparallel to the cathode constant-phase elementCCPEC and anodeconstant-phase element CCPEA, respectively, which representthe cathode and anode porous electrode double layers, respec-tively [41–43]. In a fuel cell, the main contribution to Rs (thehigh-frequency resistance) comes from the proton transport re-sistance of the PEM and the contact resistance between thePEM and the CL. Figures 8 and 9 display the AC impedancediagrams obtained at a constant current i=200 mA cm−2, withinput H2/O2 and H2/air fuels, respectively, for MEAs fabricatedusing neat-PBI, PBI/EP, and five PBI/PBI-EPA blend mem-branes. Tables 7 and 8 summarize the simulated Rs, RcA, RcC,and RcT (where RcT = RcA + RcC) values estimated from theimpedance diagrams of Fig. 8 (i.e., input fuel was H2/O2) andFig. 9 (i.e., input fuel was H2/air), respectively. Figures 8 and 9and Tables 7 and 8 reveal that the Rs value varied with thevariation of the membranes according to the sequence PBI/PBI-EPA-28/EP < PBI/PBI-EPA-19/EP < PBI/PBI-EPA-37/EP < PBI/PBI-EPA-46/EP < PBI/PBI-EPA-55/EP < PBI <PBI/EP, which was consistent with the PAdop and σ values ofthe membranes shown in Table 4 and also consistent with thefuel cell test i-V results (Figs. 6 and 7 and Table 6).
Table 8 AC impedance dataobtained at i= 200 mA cm−2 and160 °C with non-humidified H2/air fuel gases
Membrane Rs
(10−1Ω cm2)
RcC
(10−1Ω cm2)
RcA
(10−1Ω cm2)
RcT
(10−1Ω cm2)
PBI 2.00 ± 0.01 3.60 ± 0.03 1.00 ± 0.01 4.60 ± 0.02
PBI/EP 2.50 ± 0.01 3.70 ± 0.05 0.90 ± 0.02 4.60 ± 0.04
PBI/PBI-EPA-55/EP 1.50 ± 0.01 3.80 ± 0.01 0.70 ± 0.02 4.50 ± 0.02
PBI/PBI-EPA-46/EP 1.14 ± 0.01 3.60 ± 0.01 0.90 ± 0.01 4.50 ± 0.01
PBI/PBI-EPA-37/EP 0.93 ± 0.01 3.70 ± 0.02 0.70 ± 0.01 4.40 ± 0.02
PBI/PBI-EPA-28/EP 0.72 ± 0.01 3.30 ± 0.04 1.00 ± 0.01 4.30 ± 0.03
PBI/PBI-EPA-19/EP 0.85 ± 0.01 3.50 ± 0.01 0.80 ± 0.01 4.30 ± 0.01
Table 7 AC impedance dataobtained at i= 200 mA cm−2
and 160 °C with non-humidifiedH2/O2 fuel gases
Membrane Rs
(10−1Ω cm2)
RcC
(10−1Ω cm2)
RcA
(10−1Ω cm2)
RcT
(10−1Ω cm2)
PBI 1.92 ± 0.01 2.80 ± 0.08 0.80 ± 0.08 3.60 ± 0.08
PBI/EP 2.30 ± 0.01 3.10 ± 0.03 0.50 ± 0.08 3.60 ± 0.06
PBI/PBI-EPA-55/EP 1.21 ± 0.01 2.80 ± 0.03 0.70 ± 0.05 3.50 ± 0.04
PBI/PBI-EPA-46/EP 1.02 ± 0.01 3.00 ± 0.02 0.50 ± 0.08 3.50 ± 0.05
PBI/PBI-EPA-37/EP 0.81 ± 0.01 2.90 ± 0.05 0.50 ± 0.01 3.40 ± 0.03
PBI/PBI-EPA-28/EP 0.62 ± 0.01 2.80 ± 0.01 0.50 ± 0.06 3.30 ± 0.04
PBI/PBI-EPA-19/EP 0.75 ± 0.01 2.90 ± 0.01 0.40 ± 0.01 3.30 ± 0.01
22 Page 10 of 11 J Polym Res (2016) 23:22

Conclusions
We synthesized PBI-EPA, in which ∼12 mol% of PBI back-bone imidazole –NH groups were grafted with EPA sidechains. The PBI-EPA is more compatible with H3PO4 thanthe neat-PBI and is dissolved in H3PO4 aqueous solutiondue to the highly hydrophilic properties of the EPA sidechains. To avoid membrane dissolution in H3PO4 aqueoussolutions and to improve the membrane mechanical strength,in this study we prepared PBI/PBI-EPA ([PBI]/[PBI-EPA] =5/5–1/9 by wt.) blend membranes and conducted covalentcrosslinking reactions using epoxide resin as a crosslinker inthe blend polymers. We demonstrated that the crosslinkedPBI/PBI-EPA/EP membranes had greater PAdop and σ andbetter HT-PEMFC performance than the neat-PBI andepoxide-crosslinked PBI/EP membranes.
Acknowledgments The authors would like to thank the National Sci-ence Council (NSC), Taiwan, for financial support through grant NSC-103-2221-E-155-075.
References
1. Kreuer KD, Paddison SJ, Spohr E, Schuster M (2004) Chem Rev104:4637–4678
2. Rikukawa M, Sanui K (2000) Prog Polym Sci 25:1463–15023. Kreuer KD (2001) J Membr Sci 185(1):29–394. Peighambardoust SJ, Rowshanzamir S, Amjadi M (2010) Int J
Hydrog Energy 35:9349–93845. Zhang H, Shen PK (2012) Chem Rev 12:2780–28326. Smitha B, Sridhar S, Khan AA (2005) J Membr Sci 259:10–267. Wainright JS, Wang J-T, Weng D, Savinell RF, Litt M (1995) J
Electrochem Soc 142:L121–L1238. Chandan A, Hattenberger M, Ei-kharouf A, Du S, Dhir A, Self V,
Pollet BG, IngramA, BujalskiW (2013) J Power Sources 231:264–278
9. Asensio JA, Sanchez EM, Gomez-Romero P (2010) ChemSoc Rev39:3210–3239
10. Li Q, He R, Jensen JO, Bjerrum NJ (2004) Fuel Cells 4:147–15911. Li Q, Jensen JO, Savinell RF, Bjerrum NJ (2009) Prog Polym Sci
34:449–47712. KurdakovaV, Quartarone E,Mustarelli P, Magistris A, Caponetti E,
Saladino ML (2010) J Power Sources 195:7765–776913. Asensio JA, Gomez-Romero P (2005) Fuel Cells 5:336–34314. Lin HL, Huang JR, Chen YT, Su PH, Yu TL, Chan SH (2012) J
Polym Res 19:987515. SadeghiM,Khatti S, ShafieiMR,Ameri E (2012) J PolymRes 19:10
16. Sukumar PR, Wu W, Markova D, Unsal O, Klapper M, Mullen K(2007) Macromol Chem Phys 208:2258–2267
17. Tang TH, Su PH, Liu YC, Yu TL (2014) Int J Hydrog Energy 39:11145–11156
18. Ngamsantivongsa P, Lin HL, Yu TL (2015) J Membr Sci 491:10–21
19. Sperling LH (2006) Introduction to physical polymer science,Wiley-Interscience, 4th ed., Chap 8:p.408
20. Maity S, Sannigrahi A, Ghosh S, Jana T (2013) Eur Polym J 49:2280–2292
21. Bae JM, Honma I, Murata M, Yamamoto T, Rikukawa M, Ogata N(2002) Solid State Ionics 147:189–194
22. Gieselman MB, Reynolds JR (1992) Macromolecules 25:4832–4834
23. Glipa X, HaddadME, Jones DJ, Roziere J (1997) Solid State Ionics97:323–331
24. Jones DJ, Roziere J (2001) J Membr Sci 185:41–5825. Roziere J, Jones DJ, Marrony M, Glipa X, Mula B (2001) Solid
State Ionics 145:61–6826. Jannasch P (2005) Fuel Cells 5:248–26027. Tan N, Xiao G, Yan D, Sun G (2010) J Membr Sci 353:51–5928. Mader JA, Benicewicz BC (2010) Macromolecules 43:6706–671529. Li QF, Rudbeck HC, Chromik A, Jensen JQ, Pan C, Steenberg T
(2010) J Membr Sci 347:260–27030. Lin HL, Hu CR, Lai SW, Yu TL (2012) J Membr Sci 389:399–40631. Chromik A, Kerres JA (2013) Solid State Ionics 252:140–15132. Lin HL, Chen CY, Li CC, Cheng CP, Yu TL (2008) J Power
Sources 181:228–23633. Kerres J, Ullrich A, Meier F, Haring T (1999) Solid State Ionics
125:243–24934. Wang S, Zhao C, MaW, Zhang G, Liu Z, Ni J (2012) J Membr Sci
411–412:54–6335. Lin HL, Chou YC, Lai SW, Yu TL (2012) Int J Hydrog Energy
37(1):383–39236. Su PH, Lin HL, Lin YP, Yu TL (2013) Int J Hydrog Energy 38(31):
13742–1375337. Pavia DL, Lampman GM, Kriz GS (1979) Introduction to spectros-
copy: a guide for students of organic chemistry. Sunders CollegePublishing, Philadelphia, Chap 2
38. Silverstein RM, Bassler GC,Morrill TC (1981) Spectrometric iden-tification of organic compounds, 4th edn. Wiley, New York
39. Ma YL, Wainright JS, Litt MH, Savinell RF (2004) J ElectrochemSoc 151(1):A8–A16
40. Hasiotis C, Li QF, Deimede V, Kallitsis JK, Kontoyannis CG,Bjerrum NJ (2001) J Electrochem Soc 148(5):A513–A519
41. Cooper KR, Ramani V, Fenton JM, Kunz HR (2006) Experimentalmethods and data analyses for polymer electrolyte fuel cells,Scribner Associates, Inc., North Carolina, Laboratory #5-Impedance spectroscopy of PEM fuel cells
42. Andresaen SJ, Jespersen JL, Schaltz E, Kaer SK (2009) Fuel Cells4:463–473
43. Ciureanu M, Roberge R (2001) J Phys Chem B 105:3531–3539
J Polym Res (2016) 23:22 Page 11 of 11 22