andean sinistral transpression and kinematic partitioning in south georgia
TRANSCRIPT
lable at ScienceDirect
Journal of Structural Geology 32 (2010) 464e477
Contents lists avai
Journal of Structural Geology
journal homepage: www.elsevier .com/locate/ jsg
Andean sinistral transpression and kinematic partitioning in South Georgia
Michael L. Curtis a,*, Michael J. Flowerdewa, Teal R. Riley a, Martin J. Whitehouse b, J. Stephen Daly c
aBritish Antarctic Survey, Madingley Road, Cambridge CB3 0ET, UKb Swedish Museum of Natural History, Box 50007, S-104 05 Stockholm, SwedencUCD School of Geological Sciences, University College Dublin, Belfield, Dublin 4, Ireland
a r t i c l e i n f o
Article history:Received 16 October 2009Received in revised form26 January 2010Accepted 17 February 2010Available online 23 February 2010
Keywords:GeochronologyFold appressionBack-arc basinPolyphase deformation
* Corresponding author. Tel.: þ44 (0)1223 221429.E-mail address: [email protected] (M.L. Curtis).
0191-8141/$ e see front matter Crown Copyright � 2doi:10.1016/j.jsg.2010.02.002
a b s t r a c t
The island of South Georgia exposes remnants of a Late Jurassic to Early Cretaceous Andean magmatic arcand marginal basin system that was compressively deformed during the mid-Cretaceous main AndeanOrogeny forming widespread NW-SE trending folds and a coaxial penetrative cleavage displayinga predominantly NE-SW stretching lineation.
Detailed structural studies of the Cooper Bay to Cape Vahsel area of South Georgia reveal that intense,mid-Cretaceous, polyphase deformation was strongly influenced by sinistral strike-slip shear parallel tothe NW-SE regional structural grain, and along a major pre-existing fault, which we interpret as thepartitioned wrench component of bulk transpressional deformation. The relationship between fold axialplane orientation and interlimb angle of widely distributed mesoscale folds is consistent with counter-clockwise rotation and fold appression as a result of sinistral simple shear deformation, suggestingkinematic strain partitioning of the wrench component was on the whole highly efficient. Locally, themodification of steep tectonic anisotropies to shallow inclinations during D2 deformation inducedimperfect or inefficient partitioning with fold arrays exhibiting fold appression characteristic ofa transpressional deformation path.
Our partitioned transpression model for main Andean deformation of South Georgia fits well withtectonic interpretations of the Cordillera Darwin, Patagonia.
Crown Copyright � 2010 Published by Elsevier Ltd. All rights reserved.
1. Introduction
The island of South Georgia lies approximately 1800 km east ofthe southern tip of South America along the Scotia arc, which formsa complex locally emergent submarine ridge linking the south-ernmost Andes, via South Georgia, the South Sandwich Islandsvolcanic arc, South Orkney and South Shetland Islands, and finallythe Antarctic Peninsula (Fig. 1). Established stratigraphical, igneousand tectonic correlations between South Georgia and Tierra delFuego (e.g. Dalziel et al., 1975; Tanner, 1982; Thomson et al., 1982;Macdonald et al., 1987; Mukasa and Dalziel, 1996) together withtectonic reconstructions (e.g. Livermore et al., 2007) indicate that,prior to the Late Oligocene to recent evolution of the Scotia Sea,South Georgia was situated at the southern tip of South Americawhere it formed an extension of the Andean magmatic arc andmarginal basin system (Dalziel et al., 1975; Tanner, 1982; Mukasaand Dalziel, 1996).
The elongate, Late Jurassic to Early Cretaceous Andean marginalbasin exposed in southernmost Patagonia and South Georgia is
010 Published by Elsevier Ltd. All
known as the Rocas Verdesmarginal basin (Dalziel, 1981; Dott et al.,1982; Olivero and Martinioni, 2001; Fildani and Hessler, 2005), andhas been linkedwith the initial opening of theWeddell Sea (Dalziel,1992; König and Jokat, 2006). During the late-Early Cretaceous tomid-Cretaceous a combination of increased sea-floor spreadingrates and a change in the South American pole of rotation relative toAfrica is considered to have increased the convergence ratebetween the Pacific and South American plates (Dalziel, 1986),resulting in the compressive deformation and inversion of theRocas Verdes basin during the mid-Cretaceous main AndeanOrogeny (Dalziel, 1981; Nelson, 1982; Suárez et al., 2000). In SouthGeorgia mid-Cretaceous deformation is manifest as widespreadand locally intense folding of the Early Cretaceous basin filldeposits, and their juxtaposition against basement rocks of theDrygalski Fjord Complex along a regional shear zone referred to asthe Cooper Bay Dislocation Zone (Tanner, 1982).
In this contribution we present new structural, kinematic andgeochronological data from the Cooper BayeCape Vahsel region ofSouth Georgia, providing a detailed model for the kinematicevolution of the adjacent basin fill deposits which are stronglyinfluenced by a component of sinistral wrench tectonics. Wepropose that the main Andean deformation of South Georgia was
rights reserved.
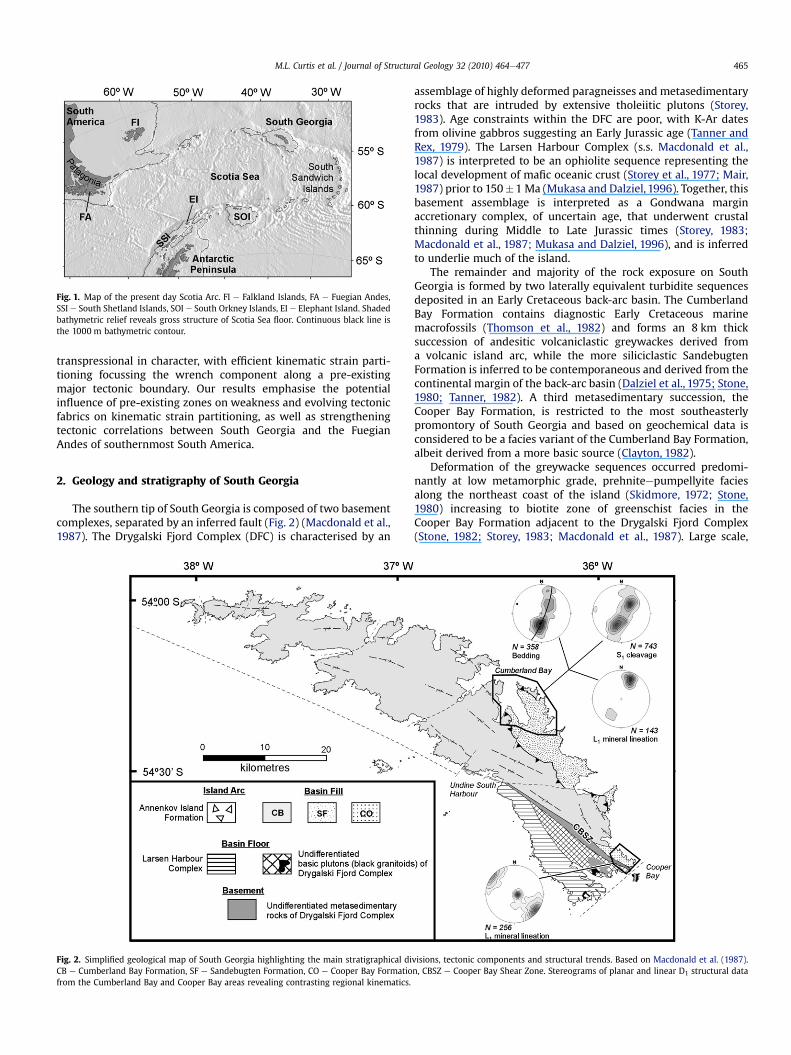
Fig. 1. Map of the present day Scotia Arc. FI e Falkland Islands, FA e Fuegian Andes,SSI e South Shetland Islands, SOI e South Orkney Islands, EI e Elephant Island. Shadedbathymetric relief reveals gross structure of Scotia Sea floor. Continuous black line isthe 1000 m bathymetric contour.
M.L. Curtis et al. / Journal of Structural Geology 32 (2010) 464e477 465
transpressional in character, with efficient kinematic strain parti-tioning focussing the wrench component along a pre-existingmajor tectonic boundary. Our results emphasise the potentialinfluence of pre-existing zones on weakness and evolving tectonicfabrics on kinematic strain partitioning, as well as strengtheningtectonic correlations between South Georgia and the FuegianAndes of southernmost South America.
2. Geology and stratigraphy of South Georgia
The southern tip of South Georgia is composed of two basementcomplexes, separated by an inferred fault (Fig. 2) (Macdonald et al.,1987). The Drygalski Fjord Complex (DFC) is characterised by an
Fig. 2. Simplified geological map of South Georgia highlighting the main stratigraphical diCB e Cumberland Bay Formation, SF e Sandebugten Formation, CO e Cooper Bay Formatiofrom the Cumberland Bay and Cooper Bay areas revealing contrasting regional kinematics.
assemblage of highly deformed paragneisses and metasedimentaryrocks that are intruded by extensive tholeiitic plutons (Storey,1983). Age constraints within the DFC are poor, with K-Ar datesfrom olivine gabbros suggesting an Early Jurassic age (Tanner andRex, 1979). The Larsen Harbour Complex (s.s. Macdonald et al.,1987) is interpreted to be an ophiolite sequence representing thelocal development of mafic oceanic crust (Storey et al., 1977; Mair,1987) prior to 150�1 Ma (Mukasa and Dalziel, 1996). Together, thisbasement assemblage is interpreted as a Gondwana marginaccretionary complex, of uncertain age, that underwent crustalthinning during Middle to Late Jurassic times (Storey, 1983;Macdonald et al., 1987; Mukasa and Dalziel, 1996), and is inferredto underlie much of the island.
The remainder and majority of the rock exposure on SouthGeorgia is formed by two laterally equivalent turbidite sequencesdeposited in an Early Cretaceous back-arc basin. The CumberlandBay Formation contains diagnostic Early Cretaceous marinemacrofossils (Thomson et al., 1982) and forms an 8 km thicksuccession of andesitic volcaniclastic greywackes derived froma volcanic island arc, while the more siliciclastic SandebugtenFormation is inferred to be contemporaneous and derived from thecontinental margin of the back-arc basin (Dalziel et al., 1975; Stone,1980; Tanner, 1982). A third metasedimentary succession, theCooper Bay Formation, is restricted to the most southeasterlypromontory of South Georgia and based on geochemical data isconsidered to be a facies variant of the Cumberland Bay Formation,albeit derived from a more basic source (Clayton, 1982).
Deformation of the greywacke sequences occurred predomi-nantly at low metamorphic grade, prehniteepumpellyite faciesalong the northeast coast of the island (Skidmore, 1972; Stone,1980) increasing to biotite zone of greenschist facies in theCooper Bay Formation adjacent to the Drygalski Fjord Complex(Stone, 1982; Storey, 1983; Macdonald et al., 1987). Large scale,
visions, tectonic components and structural trends. Based on Macdonald et al. (1987).n, CBSZ e Cooper Bay Shear Zone. Stereograms of planar and linear D1 structural data
M.L. Curtis et al. / Journal of Structural Geology 32 (2010) 464e477466
northwestesoutheast trending chevron folds dominate the EarlyCretaceous greywacke successions with a predominantly north-northeastesouth-southwest mineral lineation developed alonga ubiquitous axial planar cleavage (Tanner, 1982; Tanner andMacdonald, 1982). K-Ar whole rock dating of geographicallywidespread slate samples from the Cumberland Bay and Sande-bugten formations range between 51 and 135 Ma, with a bestestimate for the minimum age of deformation and metamorphismbeing 82e91 Ma (Thomson et al., 1982). This estimate is consistentwith the geological history of the Rocas Verdes marginal basin ofsouthern Patagonia, the contiguous region to South Georgia inpalinspastic reconstructions, suggesting that the Early Cretaceousback-arc basin fill of South Georgia was deformed during the mid-Cretaceous main Andean orogeny (e.g. Dalziel et al., 1975; Bruhnand Dalziel, 1977; Nelson et al., 1980; Nelson, 1982; Cunningham,1995; Suárez et al., 2000).
One of the most significant structural components of the SouthGeorgia microcontinental block is the regional scale Cooper BayShear Zone, previously referred to as the Cooper Bay DislocationZone (Macdonald et al., 1987), which juxtaposes the Early Creta-ceous greywacke successions against the basement complexes.Previous geological studies have revealed this ‘dislocation zone’ hasa complex tectonic history displaying both dip-slip and strike-slipmineral lineations that was linked to the structural evolution ofthe adjacent Cooper Bay Formation (Stone, 1982; Storey, 1983). Thestructural and kinematic evolution of the Cooper Bay Formationand adjacent shear zones forms the basis of this study.
3. Structural evolution of the Cooper Bay to Cape Vahsel areas
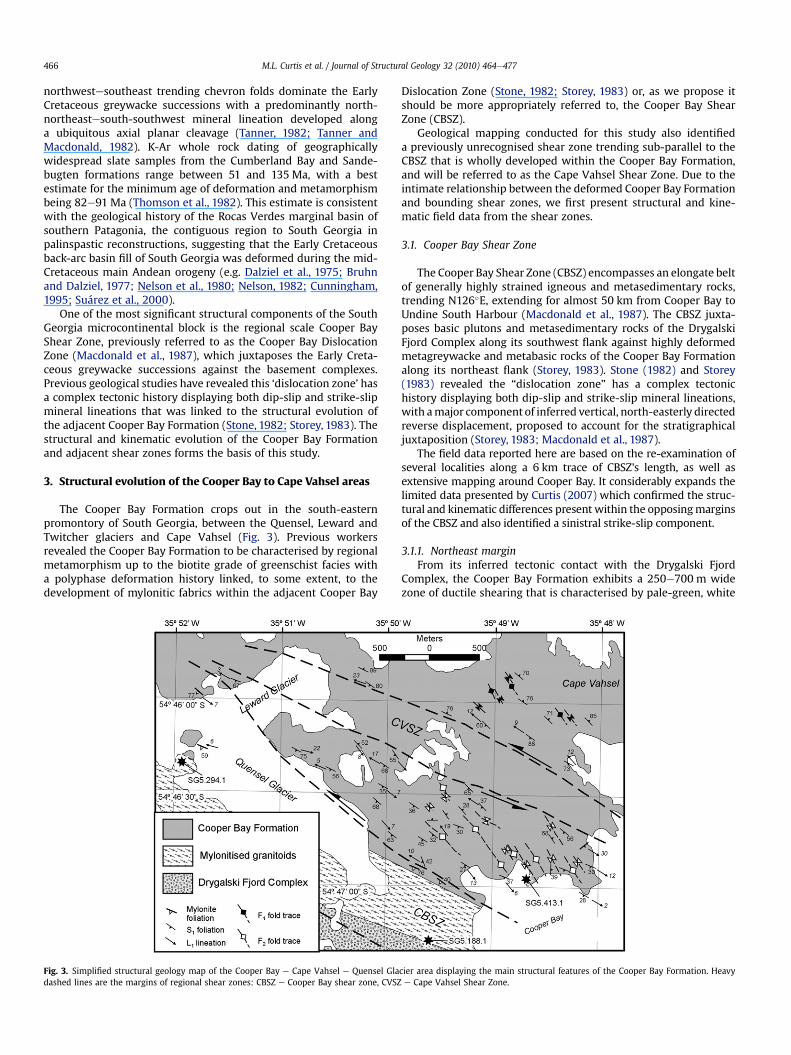
The Cooper Bay Formation crops out in the south-easternpromontory of South Georgia, between the Quensel, Leward andTwitcher glaciers and Cape Vahsel (Fig. 3). Previous workersrevealed the Cooper Bay Formation to be characterised by regionalmetamorphism up to the biotite grade of greenschist facies witha polyphase deformation history linked, to some extent, to thedevelopment of mylonitic fabrics within the adjacent Cooper Bay
Fig. 3. Simplified structural geology map of the Cooper Bay e Cape Vahsel e Quensel Gladashed lines are the margins of regional shear zones: CBSZ e Cooper Bay shear zone, CVSZ
Dislocation Zone (Stone, 1982; Storey, 1983) or, as we propose itshould be more appropriately referred to, the Cooper Bay ShearZone (CBSZ).
Geological mapping conducted for this study also identifieda previously unrecognised shear zone trending sub-parallel to theCBSZ that is wholly developed within the Cooper Bay Formation,and will be referred to as the Cape Vahsel Shear Zone. Due to theintimate relationship between the deformed Cooper Bay Formationand bounding shear zones, we first present structural and kine-matic field data from the shear zones.
3.1. Cooper Bay Shear Zone
The Cooper Bay Shear Zone (CBSZ) encompasses an elongate beltof generally highly strained igneous and metasedimentary rocks,trending N126�E, extending for almost 50 km from Cooper Bay toUndine South Harbour (Macdonald et al., 1987). The CBSZ juxta-poses basic plutons and metasedimentary rocks of the DrygalskiFjord Complex along its southwest flank against highly deformedmetagreywacke and metabasic rocks of the Cooper Bay Formationalong its northeast flank (Storey, 1983). Stone (1982) and Storey(1983) revealed the “dislocation zone” has a complex tectonichistory displaying both dip-slip and strike-slip mineral lineations,with amajor component of inferred vertical, north-easterly directedreverse displacement, proposed to account for the stratigraphicaljuxtaposition (Storey, 1983; Macdonald et al., 1987).
The field data reported here are based on the re-examination ofseveral localities along a 6 km trace of CBSZ's length, as well asextensive mapping around Cooper Bay. It considerably expands thelimited data presented by Curtis (2007) which confirmed the struc-tural and kinematic differences present within the opposingmarginsof the CBSZ and also identified a sinistral strike-slip component.
3.1.1. Northeast marginFrom its inferred tectonic contact with the Drygalski Fjord
Complex, the Cooper Bay Formation exhibits a 250e700 m widezone of ductile shearing that is characterised by pale-green, white
cier area displaying the main structural features of the Cooper Bay Formation. Heavye Cape Vahsel Shear Zone.
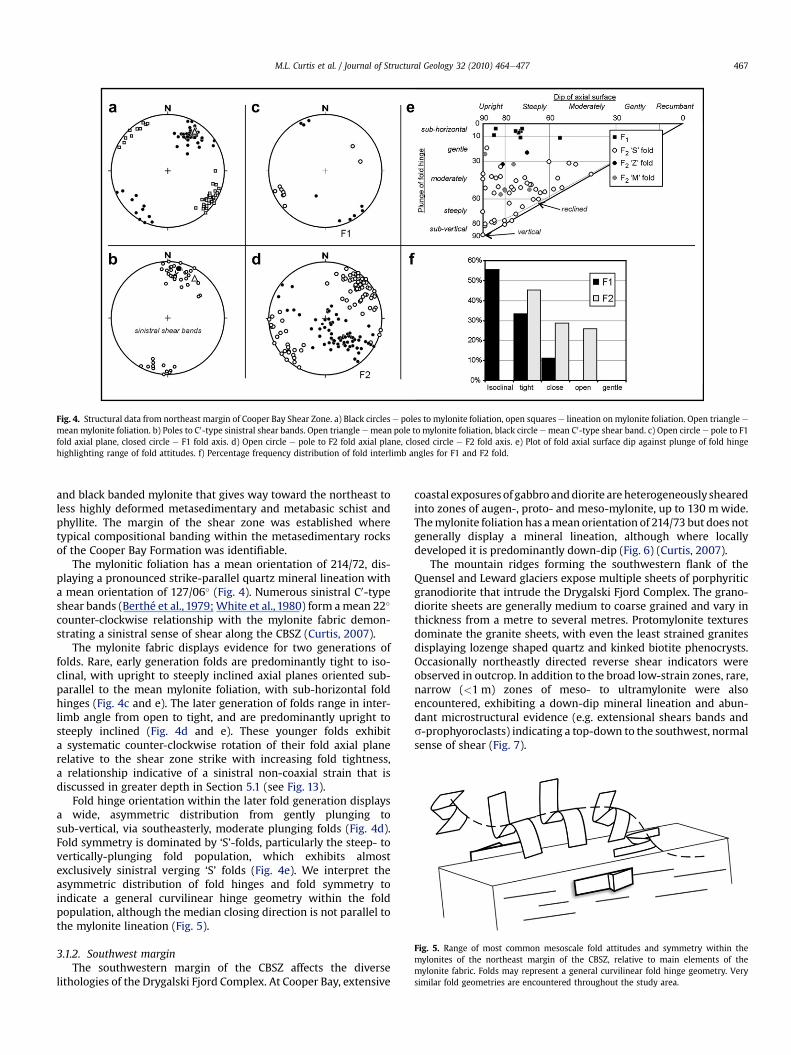
Fig. 4. Structural data from northeast margin of Cooper Bay Shear Zone. a) Black circles e poles to mylonite foliation, open squares e lineation on mylonite foliation. Open triangle e
mean mylonite foliation. b) Poles to C0-type sinistral shear bands. Open triangle emean pole to mylonite foliation, black circle emean C0-type shear band. c) Open circle e pole to F1fold axial plane, closed circle e F1 fold axis. d) Open circle e pole to F2 fold axial plane, closed circle e F2 fold axis. e) Plot of fold axial surface dip against plunge of fold hingehighlighting range of fold attitudes. f) Percentage frequency distribution of fold interlimb angles for F1 and F2 fold.
Fig. 5. Range of most common mesoscale fold attitudes and symmetry within themylonites of the northeast margin of the CBSZ, relative to main elements of themylonite fabric. Folds may represent a general curvilinear fold hinge geometry. Verysimilar fold geometries are encountered throughout the study area.
M.L. Curtis et al. / Journal of Structural Geology 32 (2010) 464e477 467
and black banded mylonite that gives way toward the northeast toless highly deformed metasedimentary and metabasic schist andphyllite. The margin of the shear zone was established wheretypical compositional banding within the metasedimentary rocksof the Cooper Bay Formation was identifiable.
The mylonitic foliation has a mean orientation of 214/72, dis-playing a pronounced strike-parallel quartz mineral lineation witha mean orientation of 127/06� (Fig. 4). Numerous sinistral C0-typeshear bands (Berthé et al., 1979;White et al., 1980) form amean 22�
counter-clockwise relationship with the mylonite fabric demon-strating a sinistral sense of shear along the CBSZ (Curtis, 2007).
The mylonite fabric displays evidence for two generations offolds. Rare, early generation folds are predominantly tight to iso-clinal, with upright to steeply inclined axial planes oriented sub-parallel to the mean mylonite foliation, with sub-horizontal foldhinges (Fig. 4c and e). The later generation of folds range in inter-limb angle from open to tight, and are predominantly upright tosteeply inclined (Fig. 4d and e). These younger folds exhibita systematic counter-clockwise rotation of their fold axial planerelative to the shear zone strike with increasing fold tightness,a relationship indicative of a sinistral non-coaxial strain that isdiscussed in greater depth in Section 5.1 (see Fig. 13).
Fold hinge orientation within the later fold generation displaysa wide, asymmetric distribution from gently plunging tosub-vertical, via southeasterly, moderate plunging folds (Fig. 4d).Fold symmetry is dominated by ‘S’-folds, particularly the steep- tovertically-plunging fold population, which exhibits almostexclusively sinistral verging ‘S’ folds (Fig. 4e). We interpret theasymmetric distribution of fold hinges and fold symmetry toindicate a general curvilinear hinge geometry within the foldpopulation, although the median closing direction is not parallel tothe mylonite lineation (Fig. 5).
3.1.2. Southwest marginThe southwestern margin of the CBSZ affects the diverse
lithologies of the Drygalski Fjord Complex. At Cooper Bay, extensive
coastal exposures of gabbroanddiorite are heterogeneously shearedinto zones of augen-, proto- and meso-mylonite, up to 130 mwide.Themylonite foliation has amean orientation of 214/73 but does notgenerally display a mineral lineation, although where locallydeveloped it is predominantly down-dip (Fig. 6) (Curtis, 2007).
The mountain ridges forming the southwestern flank of theQuensel and Leward glaciers expose multiple sheets of porphyriticgranodiorite that intrude the Drygalski Fjord Complex. The grano-diorite sheets are generally medium to coarse grained and vary inthickness from a metre to several metres. Protomylonite texturesdominate the granite sheets, with even the least strained granitesdisplaying lozenge shaped quartz and kinked biotite phenocrysts.Occasionally northeastly directed reverse shear indicators wereobserved in outcrop. In addition to the broad low-strain zones, rare,narrow (<1 m) zones of meso- to ultramylonite were alsoencountered, exhibiting a down-dip mineral lineation and abun-dant microstructural evidence (e.g. extensional shears bands ands-prophyoroclasts) indicating a top-down to the southwest, normalsense of shear (Fig. 7).
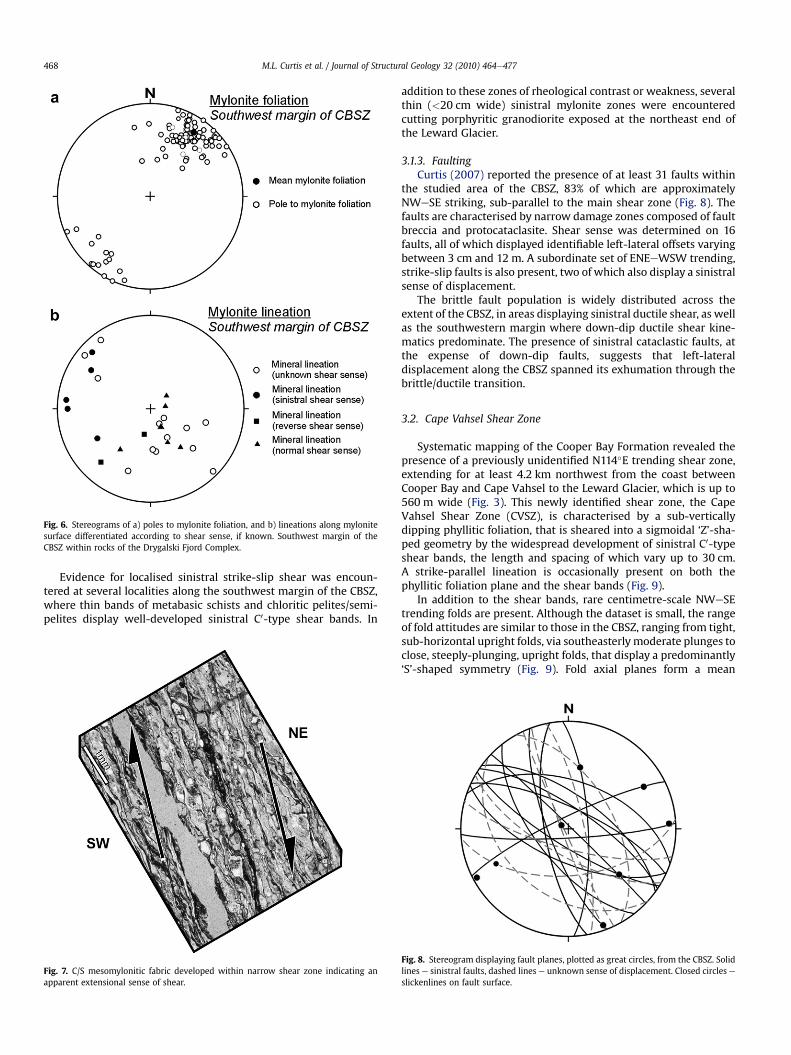
Fig. 6. Stereograms of a) poles to mylonite foliation, and b) lineations along mylonitesurface differentiated according to shear sense, if known. Southwest margin of theCBSZ within rocks of the Drygalski Fjord Complex.
M.L. Curtis et al. / Journal of Structural Geology 32 (2010) 464e477468
Evidence for localised sinistral strike-slip shear was encoun-tered at several localities along the southwest margin of the CBSZ,where thin bands of metabasic schists and chloritic pelites/semi-pelites display well-developed sinistral C0-type shear bands. In
Fig. 7. C/S mesomylonitic fabric developed within narrow shear zone indicating anapparent extensional sense of shear.
addition to these zones of rheological contrast or weakness, severalthin (<20 cm wide) sinistral mylonite zones were encounteredcutting porphyritic granodiorite exposed at the northeast end ofthe Leward Glacier.
3.1.3. FaultingCurtis (2007) reported the presence of at least 31 faults within
the studied area of the CBSZ, 83% of which are approximatelyNWeSE striking, sub-parallel to the main shear zone (Fig. 8). Thefaults are characterised by narrow damage zones composed of faultbreccia and protocataclasite. Shear sense was determined on 16faults, all of which displayed identifiable left-lateral offsets varyingbetween 3 cm and 12 m. A subordinate set of ENEeWSW trending,strike-slip faults is also present, two of which also display a sinistralsense of displacement.
The brittle fault population is widely distributed across theextent of the CBSZ, in areas displaying sinistral ductile shear, as wellas the southwestern margin where down-dip ductile shear kine-matics predominate. The presence of sinistral cataclastic faults, atthe expense of down-dip faults, suggests that left-lateraldisplacement along the CBSZ spanned its exhumation through thebrittle/ductile transition.
3.2. Cape Vahsel Shear Zone
Systematic mapping of the Cooper Bay Formation revealed thepresence of a previously unidentified N114�E trending shear zone,extending for at least 4.2 km northwest from the coast betweenCooper Bay and Cape Vahsel to the Leward Glacier, which is up to560 m wide (Fig. 3). This newly identified shear zone, the CapeVahsel Shear Zone (CVSZ), is characterised by a sub-verticallydipping phyllitic foliation, that is sheared into a sigmoidal ‘Z’-sha-ped geometry by the widespread development of sinistral C0-typeshear bands, the length and spacing of which vary up to 30 cm.A strike-parallel lineation is occasionally present on both thephyllitic foliation plane and the shear bands (Fig. 9).
In addition to the shear bands, rare centimetre-scale NWeSEtrending folds are present. Although the dataset is small, the rangeof fold attitudes are similar to those in the CBSZ, ranging from tight,sub-horizontal upright folds, via southeasterly moderate plunges toclose, steeply-plunging, upright folds, that display a predominantly‘S’-shaped symmetry (Fig. 9). Fold axial planes form a mean
Fig. 8. Stereogram displaying fault planes, plotted as great circles, from the CBSZ. Solidlines e sinistral faults, dashed lines e unknown sense of displacement. Closed circles eslickenlines on fault surface.
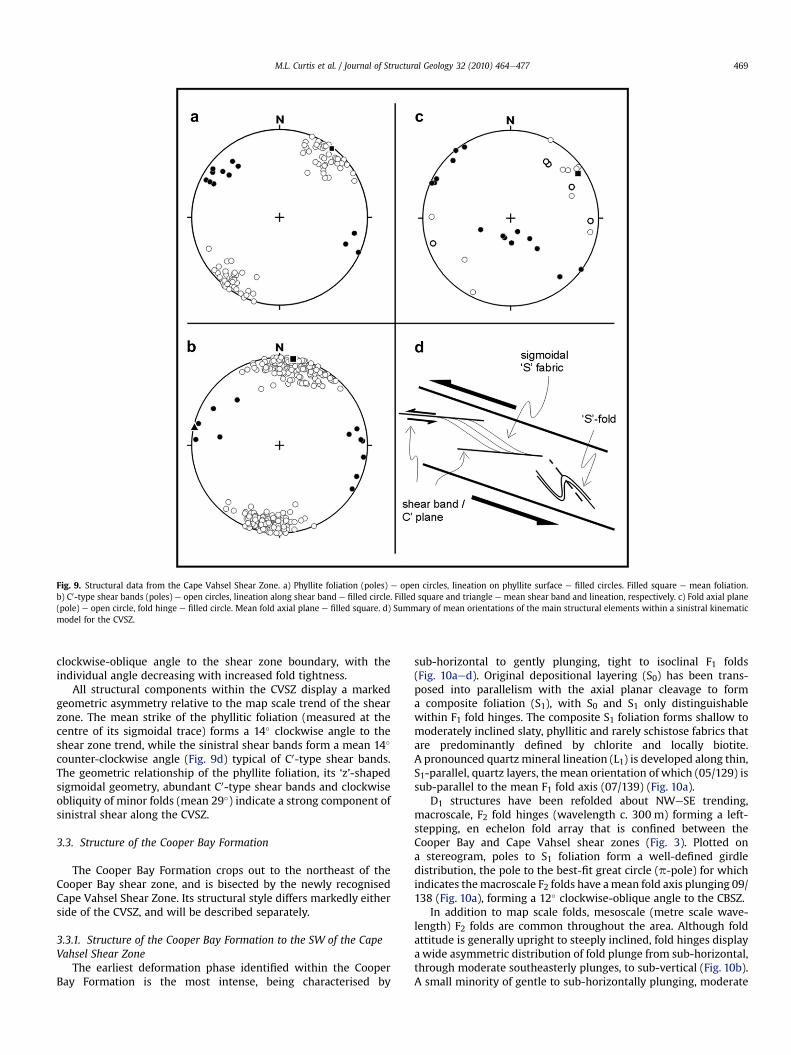
Fig. 9. Structural data from the Cape Vahsel Shear Zone. a) Phyllite foliation (poles) e open circles, lineation on phyllite surface e filled circles. Filled square e mean foliation.b) C0-type shear bands (poles) e open circles, lineation along shear band e filled circle. Filled square and triangle e mean shear band and lineation, respectively. c) Fold axial plane(pole) e open circle, fold hinge e filled circle. Mean fold axial plane e filled square. d) Summary of mean orientations of the main structural elements within a sinistral kinematicmodel for the CVSZ.
M.L. Curtis et al. / Journal of Structural Geology 32 (2010) 464e477 469
clockwise-oblique angle to the shear zone boundary, with theindividual angle decreasing with increased fold tightness.
All structural components within the CVSZ display a markedgeometric asymmetry relative to the map scale trend of the shearzone. The mean strike of the phyllitic foliation (measured at thecentre of its sigmoidal trace) forms a 14� clockwise angle to theshear zone trend, while the sinistral shear bands form a mean 14�
counter-clockwise angle (Fig. 9d) typical of C0-type shear bands.The geometric relationship of the phyllite foliation, its ‘z’-shapedsigmoidal geometry, abundant C0-type shear bands and clockwiseobliquity of minor folds (mean 29�) indicate a strong component ofsinistral shear along the CVSZ.
3.3. Structure of the Cooper Bay Formation
The Cooper Bay Formation crops out to the northeast of theCooper Bay shear zone, and is bisected by the newly recognisedCape Vahsel Shear Zone. Its structural style differs markedly eitherside of the CVSZ, and will be described separately.
3.3.1. Structure of the Cooper Bay Formation to the SW of the CapeVahsel Shear Zone
The earliest deformation phase identified within the CooperBay Formation is the most intense, being characterised by
sub-horizontal to gently plunging, tight to isoclinal F1 folds(Fig. 10aed). Original depositional layering (S0) has been trans-posed into parallelism with the axial planar cleavage to forma composite foliation (S1), with S0 and S1 only distinguishablewithin F1 fold hinges. The composite S1 foliation forms shallow tomoderately inclined slaty, phyllitic and rarely schistose fabrics thatare predominantly defined by chlorite and locally biotite.A pronounced quartz mineral lineation (L1) is developed along thin,S1-parallel, quartz layers, the mean orientation of which (05/129) issub-parallel to the mean F1 fold axis (07/139) (Fig. 10a).
D1 structures have been refolded about NWeSE trending,macroscale, F2 fold hinges (wavelength c. 300 m) forming a left-stepping, en echelon fold array that is confined between theCooper Bay and Cape Vahsel shear zones (Fig. 3). Plotted ona stereogram, poles to S1 foliation form a well-defined girdledistribution, the pole to the best-fit great circle (p-pole) for whichindicates themacroscale F2 folds have amean fold axis plunging 09/138 (Fig. 10a), forming a 12� clockwise-oblique angle to the CBSZ.
In addition to map scale folds, mesoscale (metre scale wave-length) F2 folds are common throughout the area. Although foldattitude is generally upright to steeply inclined, fold hinges displaya wide asymmetric distribution of fold plunge from sub-horizontal,through moderate southeasterly plunges, to sub-vertical (Fig. 10b).A small minority of gentle to sub-horizontally plunging, moderate
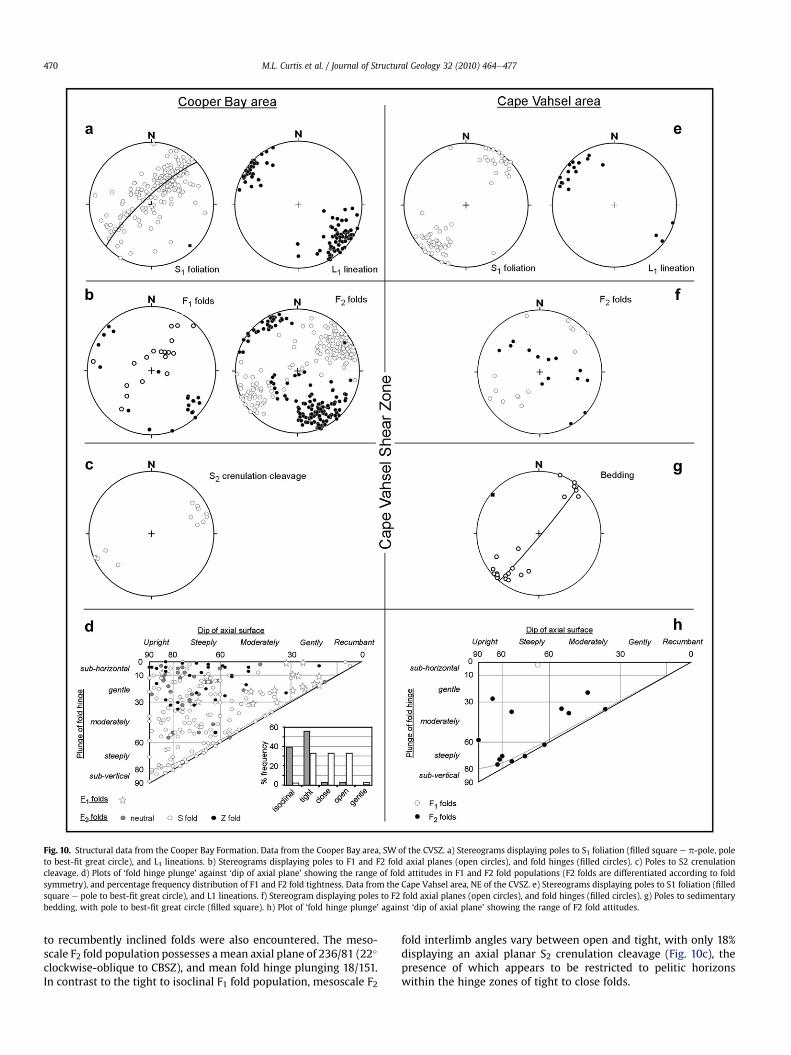
Fig. 10. Structural data from the Cooper Bay Formation. Data from the Cooper Bay area, SW of the CVSZ. a) Stereograms displaying poles to S1 foliation (filled square e p-pole, poleto best-fit great circle), and L1 lineations. b) Stereograms displaying poles to F1 and F2 fold axial planes (open circles), and fold hinges (filled circles). c) Poles to S2 crenulationcleavage. d) Plots of ‘fold hinge plunge’ against ‘dip of axial plane’ showing the range of fold attitudes in F1 and F2 fold populations (F2 folds are differentiated according to foldsymmetry), and percentage frequency distribution of F1 and F2 fold tightness. Data from the Cape Vahsel area, NE of the CVSZ. e) Stereograms displaying poles to S1 foliation (filledsquare e pole to best-fit great circle), and L1 lineations. f) Stereogram displaying poles to F2 fold axial planes (open circles), and fold hinges (filled circles). g) Poles to sedimentarybedding, with pole to best-fit great circle (filled square). h) Plot of ‘fold hinge plunge’ against ‘dip of axial plane’ showing the range of F2 fold attitudes.
M.L. Curtis et al. / Journal of Structural Geology 32 (2010) 464e477470
to recumbently inclined folds were also encountered. The meso-scale F2 fold population possesses amean axial plane of 236/81 (22�
clockwise-oblique to CBSZ), and mean fold hinge plunging 18/151.In contrast to the tight to isoclinal F1 fold population, mesoscale F2
fold interlimb angles vary between open and tight, with only 18%displaying an axial planar S2 crenulation cleavage (Fig. 10c), thepresence of which appears to be restricted to pelitic horizonswithin the hinge zones of tight to close folds.
Table 1Rb-Sr mineral data.
Mineral Rb(ppm)
Sr(ppm)
87Rb/86Sr �2s 87Sr/86Sr �2s 87Sr/86Sri
Sample SG5.413.1 Biotite schist. 54.7820 S, 35.8095 W.Btetitanite isochron 83.7� 1.2 MaBiotite 274.95 13.72 58.39 0.8758 0.778251 0.000022 0.709394Titanite 2.20 44.23 0.14 0.0022 0.708968 0.000061 0.708798
Age calculated using the 87Rb decay constant of 1.42� 10�11 (Steiger and Jäger,1977).
M.L. Curtis et al. / Journal of Structural Geology 32 (2010) 464e477 471
If the mesoscale F2 fold population is differentiated according tofold symmetry, systematic differences are revealed (Fig. 10d).Gentle to sub-horizontal plunging folds display a range of foldsymmetry (60% S-fold, 22% Z-fold, and 18% neutral folds), whereasfolds plunging at >45� are almost exclusively sinistral verging (91%S-shaped, 9% neutral fold).
The broad range of fold symmetries within the gentle to sub-horizontally plunging mesoscale folds are structurally consistentwith them being parasitic to the macroscale F2 folds in the CooperBay area. However, the fold symmetry of the moderate to sub-vertically plunging folds is generally independent of theirposition relative to the macroscale F2 folds indicating they are notsimple parasitic folds, and may be related to heterogeneous sinis-tral shear sub-parallel to the bounding regional shear zones.
3.3.2. Structure of the Cooper Bay Formation to NE of the CapeVahsel Shear Zone
Strain is significantly lower to the northeast of the CVSZ, withbothoriginal sedimentarybedding and tectonic cleavagediscernibleatmost localities. The structural style of this area is characterised bymacroscale, NWeSE trending, tight, upright to steeply-inclined F1folds that have a calculated mean fold axis plunging 02/128 (Figs. 3and 10g). The southwestern limbs of F1 anticlines are generallyoverturned and a pronounced axial planar cleavage is presentthroughout the area (Fig. 10e). The F1 folds form a low angle (14�),clockwise-oblique relationship to the CVSZ.
Strain increases with proximity to the northeast boundary of theCVSZ, as evidenced by the obliteration of original sedimentarylayering and development of a sub-horizontal stretching lineationwithin 220 m of the shear zone margin (Figs. 3 and 10e). Thisincrease in strain accompanies an 8� counter-clockwise rotation ofthe S1 cleavage and, by inference, F1 fold axial surfaces toward theshear zone.
Rare, predominantly tight, decimetre to metre scale, F2 folds arepresent within the Cape Vahsel area displaying a broad range offold attitudes, from moderately-plunging and moderately-inclinedfolds, to steeply-plunging and steeply-inclined (Fig. 10f and h). F2fold symmetry is almost exclusively ‘S’-shaped.
4. Geochronology
One biotite bearing schist sample (SG5.413.1) from the Cooper Bayarea and two granite samples (SG5.188.1 and SG5.294.1) fromwithinthe Cooper Bay shear zone were selected for geochronology in ordertoconstrain the timingofdeformation (Fig. 3). Theschisthasamineralassemblage of biotiteequartzeplagioclaseetitaniteeopaques. Biotiteforms an S1 foliation which has been crenulated during D2. There islittle or no mineral growth after D1. Rb-Sr biotite geochronologyplaces aminimumage constraint on the deformation, while the U-Pbgeochronology places both a maximum age constraint of thedeformation as well as constraining the magmatic evolution withinthe Drygalski Fjord Complex.
4.1. Rb-Sr biotite geochronology
Rb-Sr analyses for biotite and titanite from sample SG5.413.1(Table 1) were undertaken at the School of Geological Sciences,University College Dublin, Ireland. 99% Pure handpicked mineralseparates (c. 0.03 g) were spiked with a mixed 85Rb-84Sr spike anddissolved in a 5:1 HF and HNO3 acid mixture. Chemical separationof Sr used TruSPEC resin whilst separation of Rb used traditionalchromatography. Rb and Sr were analysed on modified VG Micro-mass 30 and VG 354 thermal ionisation mass spectrometers,respectively. Rb/Sr uncertainty is estimated to be 1.5% based onrepeat analysis of the SRM 607K-feldspar standard, while the
87Sr/86Sr 2s analytical uncertainties in Table 1 were used for the agecalculations. During analysis the SRM 987 Sr standard yieldeda 87Sr/86Sr ratio of 0.710241�18 (2s, n¼ 6).
Biotite forms the S1 foliation together with MS1 to MP1 titaniteyield a Rb-Sr isochron of 83.7�1.2 Ma. Although some of thetitanite analysed may have formed after biotite, the open nature ofRb and Sr in biotite mean it was likely in isotopic equilibrium withthe biotite. Moreover, the moderately high Rb/Sr mean there is lessdependence on titanite as an initial ratio, meaning that in all like-lihood the age is reliable and records isotopic closure after the firstdeformation event.
4.2. U-Pb zircon geochronology
U-Pb zircon geochronology on granite samples SG5.188.1 andSG5.294.1 (Table 2) was carried out at the NORDSIM facility usingthe Cameca 1270 ion-microprobe housed at the Swedish Museumof Natural History. The zircons separated were bright prismsgenerally about 200 mm long with aspect ratios of 2:1 and well-formed crystal facets. After mounting the zircons into epoxy andpolishing to expose the interiors of the grains, the mount wasintroduced into an SEM. Under cathodo-luminescence (CL) thegrains exhibited fine growth zoning that is a typical texture forzircon growing from granitic magma (Corfu et al., 2003). Rarezircon inheritance was identified from the CL images as distinctcores, often less luminescent than the rim overgrowths. The greatermajority of the grains were simple and with no inheritance. The CLimages were then used to choose analysis spots once the mountwas introduced into the ion-microprobe. The automated procedureoutlined byWhitehouse and Kamber (2005) was followed for theseanalyses: a defocused primary O2-ion beam resulted in ellipticalanalysis spots 20 mm in diameter. Measured Pb/U ratios, elementalconcentrations and Th/U ratios were calibrated relative to theGeostandards zircon 91500, which has an age of 1065 Ma(Wiedenbeck et al., 1995). Ages were calculated using isoplot(Ludwig, 2003).
Nine of the ten analyses from sample SG5.188.1 yield a concordiaage of 160.2� 0.9 Ma (Fig. 11). The remaining analysis comes froman inherited core which yields a 206Pb/238U age of 186.1�3.1 Ma.Eight of ten analyses from sample SG5.294.1 yield a concordia ageof 160.0�1.4 Ma (Fig. 11). The other analyses were excludedbecause they either represented an older inherited grain or con-tained common Pb and had suffered recent Pb loss. As the precisionof the SIMS zircon geochronology method is likely to be no lessthan 1% (e.g. Stern and Amelin, 2003) we consider the ages of thetwo granites to be indistinguishable at 160� 2 Ma.
5. The structural and kinematic evolution of the Cooper BayFormation and the timing of its development
The sinistral, strike-slip Cape Vahsel Shear Zone has playeda critical role in partitioning deformation within the Cooper BayFormation, with D1 strain increasing significantly from northeast
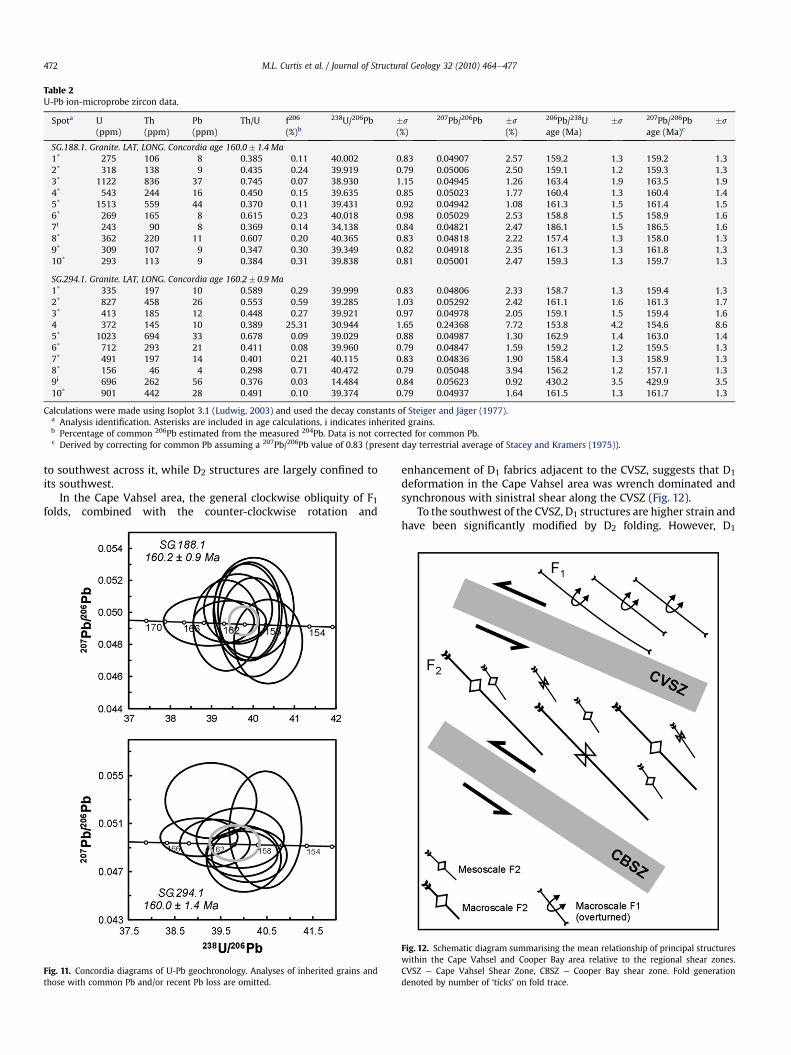
Table 2U-Pb ion-microprobe zircon data.
Spota U(ppm)
Th(ppm)
Pb(ppm)
Th/U f206
(%)b238U/206Pb �s
(%)
207Pb/206Pb �s
(%)
206Pb/238Uage (Ma)
�s 207Pb/206Pbage (Ma)c
�s
SG.188.1. Granite. LAT, LONG. Concordia age 160.0� 1.4 Ma1* 275 106 8 0.385 0.11 40.002 0.83 0.04907 2.57 159.2 1.3 159.2 1.32* 318 138 9 0.435 0.24 39.919 0.79 0.05006 2.50 159.1 1.2 159.3 1.33* 1122 836 37 0.745 0.07 38.930 1.15 0.04945 1.26 163.4 1.9 163.5 1.94* 543 244 16 0.450 0.15 39.635 0.85 0.05023 1.77 160.4 1.3 160.4 1.45* 1513 559 44 0.370 0.11 39.431 0.92 0.04942 1.08 161.3 1.5 161.4 1.56* 269 165 8 0.615 0.23 40.018 0.98 0.05029 2.53 158.8 1.5 158.9 1.67i 243 90 8 0.369 0.14 34.138 0.84 0.04821 2.47 186.1 1.5 186.5 1.68* 362 220 11 0.607 0.20 40.365 0.83 0.04818 2.22 157.4 1.3 158.0 1.39* 309 107 9 0.347 0.30 39.349 0.82 0.04918 2.35 161.3 1.3 161.8 1.310* 293 113 9 0.384 0.31 39.838 0.81 0.05001 2.47 159.3 1.3 159.7 1.3
SG.294.1. Granite. LAT, LONG. Concordia age 160.2� 0.9 Ma1* 335 197 10 0.589 0.29 39.999 0.83 0.04806 2.33 158.7 1.3 159.4 1.32* 827 458 26 0.553 0.59 39.285 1.03 0.05292 2.42 161.1 1.6 161.3 1.73* 413 185 12 0.448 0.27 39.921 0.97 0.04978 2.05 159.1 1.5 159.4 1.64 372 145 10 0.389 25.31 30.944 1.65 0.24368 7.72 153.8 4.2 154.6 8.65* 1023 694 33 0.678 0.09 39.029 0.88 0.04987 1.30 162.9 1.4 163.0 1.46* 712 293 21 0.411 0.08 39.960 0.79 0.04847 1.59 159.2 1.2 159.5 1.37* 491 197 14 0.401 0.21 40.115 0.83 0.04836 1.90 158.4 1.3 158.9 1.38* 156 46 4 0.298 0.71 40.472 0.79 0.05048 3.94 156.2 1.2 157.1 1.39i 696 262 56 0.376 0.03 14.484 0.84 0.05623 0.92 430.2 3.5 429.9 3.510* 901 442 28 0.491 0.10 39.374 0.79 0.04937 1.64 161.5 1.3 161.7 1.3
Calculations were made using Isoplot 3.1 (Ludwig, 2003) and used the decay constants of Steiger and Jäger (1977).a Analysis identification. Asterisks are included in age calculations, i indicates inherited grains.b Percentage of common 206Pb estimated from the measured 204Pb. Data is not corrected for common Pb.c Derived by correcting for common Pb assuming a 207Pb/206Pb value of 0.83 (present day terrestrial average of Stacey and Kramers (1975)).
M.L. Curtis et al. / Journal of Structural Geology 32 (2010) 464e477472
to southwest across it, while D2 structures are largely confined toits southwest.
In the Cape Vahsel area, the general clockwise obliquity of F1folds, combined with the counter-clockwise rotation and
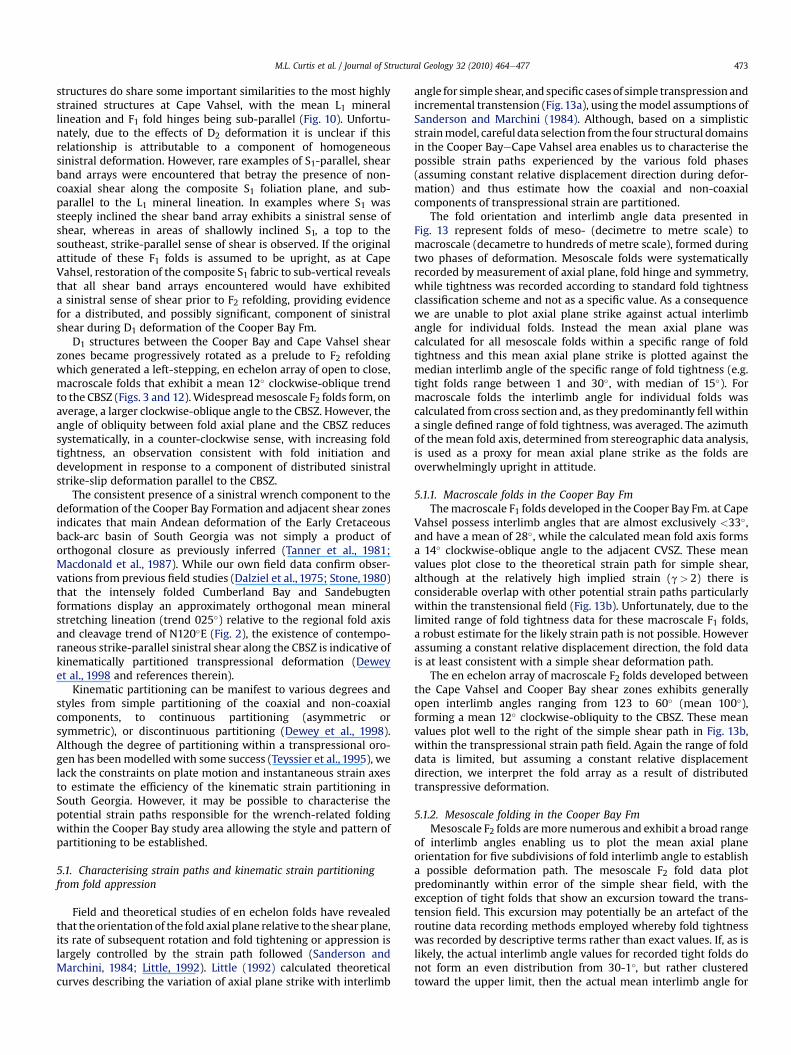
Fig. 11. Concordia diagrams of U-Pb geochronology. Analyses of inherited grains andthose with common Pb and/or recent Pb loss are omitted.
enhancement of D1 fabrics adjacent to the CVSZ, suggests that D1deformation in the Cape Vahsel area was wrench dominated andsynchronous with sinistral shear along the CVSZ (Fig. 12).
To the southwest of the CVSZ, D1 structures are higher strain andhave been significantly modified by D2 folding. However, D1
Fig. 12. Schematic diagram summarising the mean relationship of principal structureswithin the Cape Vahsel and Cooper Bay area relative to the regional shear zones.CVSZ e Cape Vahsel Shear Zone, CBSZ e Cooper Bay shear zone. Fold generationdenoted by number of ‘ticks’ on fold trace.
M.L. Curtis et al. / Journal of Structural Geology 32 (2010) 464e477 473
structures do share some important similarities to the most highlystrained structures at Cape Vahsel, with the mean L1 minerallineation and F1 fold hinges being sub-parallel (Fig. 10). Unfortu-nately, due to the effects of D2 deformation it is unclear if thisrelationship is attributable to a component of homogeneoussinistral deformation. However, rare examples of S1-parallel, shearband arrays were encountered that betray the presence of non-coaxial shear along the composite S1 foliation plane, and sub-parallel to the L1 mineral lineation. In examples where S1 wassteeply inclined the shear band array exhibits a sinistral sense ofshear, whereas in areas of shallowly inclined S1, a top to thesoutheast, strike-parallel sense of shear is observed. If the originalattitude of these F1 folds is assumed to be upright, as at CapeVahsel, restoration of the composite S1 fabric to sub-vertical revealsthat all shear band arrays encountered would have exhibiteda sinistral sense of shear prior to F2 refolding, providing evidencefor a distributed, and possibly significant, component of sinistralshear during D1 deformation of the Cooper Bay Fm.
D1 structures between the Cooper Bay and Cape Vahsel shearzones became progressively rotated as a prelude to F2 refoldingwhich generated a left-stepping, en echelon array of open to close,macroscale folds that exhibit a mean 12� clockwise-oblique trendto the CBSZ (Figs. 3 and 12).Widespreadmesoscale F2 folds form, onaverage, a larger clockwise-oblique angle to the CBSZ. However, theangle of obliquity between fold axial plane and the CBSZ reducessystematically, in a counter-clockwise sense, with increasing foldtightness, an observation consistent with fold initiation anddevelopment in response to a component of distributed sinistralstrike-slip deformation parallel to the CBSZ.
The consistent presence of a sinistral wrench component to thedeformation of the Cooper Bay Formation and adjacent shear zonesindicates that main Andean deformation of the Early Cretaceousback-arc basin of South Georgia was not simply a product oforthogonal closure as previously inferred (Tanner et al., 1981;Macdonald et al., 1987). While our own field data confirm obser-vations from previous field studies (Dalziel et al., 1975; Stone, 1980)that the intensely folded Cumberland Bay and Sandebugtenformations display an approximately orthogonal mean mineralstretching lineation (trend 025�) relative to the regional fold axisand cleavage trend of N120�E (Fig. 2), the existence of contempo-raneous strike-parallel sinistral shear along the CBSZ is indicative ofkinematically partitioned transpressional deformation (Deweyet al., 1998 and references therein).
Kinematic partitioning can be manifest to various degrees andstyles from simple partitioning of the coaxial and non-coaxialcomponents, to continuous partitioning (asymmetric orsymmetric), or discontinuous partitioning (Dewey et al., 1998).Although the degree of partitioning within a transpressional oro-gen has been modelled with some success (Teyssier et al., 1995), welack the constraints on plate motion and instantaneous strain axesto estimate the efficiency of the kinematic strain partitioning inSouth Georgia. However, it may be possible to characterise thepotential strain paths responsible for the wrench-related foldingwithin the Cooper Bay study area allowing the style and pattern ofpartitioning to be established.
5.1. Characterising strain paths and kinematic strain partitioningfrom fold appression
Field and theoretical studies of en echelon folds have revealedthat the orientation of the fold axial plane relative to the shear plane,its rate of subsequent rotation and fold tightening or appression islargely controlled by the strain path followed (Sanderson andMarchini, 1984; Little, 1992). Little (1992) calculated theoreticalcurves describing the variation of axial plane strike with interlimb
angle for simple shear, and specific cases of simple transpression andincremental transtension (Fig.13a), using themodel assumptions ofSanderson and Marchini (1984). Although, based on a simplisticstrainmodel, careful data selection from the four structural domainsin the Cooper BayeCape Vahsel area enables us to characterise thepossible strain paths experienced by the various fold phases(assuming constant relative displacement direction during defor-mation) and thus estimate how the coaxial and non-coaxialcomponents of transpressional strain are partitioned.
The fold orientation and interlimb angle data presented inFig. 13 represent folds of meso- (decimetre to metre scale) tomacroscale (decametre to hundreds of metre scale), formed duringtwo phases of deformation. Mesoscale folds were systematicallyrecorded by measurement of axial plane, fold hinge and symmetry,while tightness was recorded according to standard fold tightnessclassification scheme and not as a specific value. As a consequencewe are unable to plot axial plane strike against actual interlimbangle for individual folds. Instead the mean axial plane wascalculated for all mesoscale folds within a specific range of foldtightness and this mean axial plane strike is plotted against themedian interlimb angle of the specific range of fold tightness (e.g.tight folds range between 1 and 30�, with median of 15�). Formacroscale folds the interlimb angle for individual folds wascalculated from cross section and, as they predominantly fell withina single defined range of fold tightness, was averaged. The azimuthof the mean fold axis, determined from stereographic data analysis,is used as a proxy for mean axial plane strike as the folds areoverwhelmingly upright in attitude.
5.1.1. Macroscale folds in the Cooper Bay FmThemacroscale F1 folds developed in the Cooper Bay Fm. at Cape
Vahsel possess interlimb angles that are almost exclusively <33�,and have a mean of 28�, while the calculated mean fold axis formsa 14� clockwise-oblique angle to the adjacent CVSZ. These meanvalues plot close to the theoretical strain path for simple shear,although at the relatively high implied strain (g> 2) there isconsiderable overlap with other potential strain paths particularlywithin the transtensional field (Fig. 13b). Unfortunately, due to thelimited range of fold tightness data for these macroscale F1 folds,a robust estimate for the likely strain path is not possible. Howeverassuming a constant relative displacement direction, the fold datais at least consistent with a simple shear deformation path.
The en echelon array of macroscale F2 folds developed betweenthe Cape Vahsel and Cooper Bay shear zones exhibits generallyopen interlimb angles ranging from 123 to 60� (mean 100�),forming a mean 12� clockwise-obliquity to the CBSZ. These meanvalues plot well to the right of the simple shear path in Fig. 13b,within the transpressional strain path field. Again the range of folddata is limited, but assuming a constant relative displacementdirection, we interpret the fold array as a result of distributedtranspressive deformation.
5.1.2. Mesoscale folding in the Cooper Bay FmMesoscale F2 folds aremore numerous and exhibit a broad range
of interlimb angles enabling us to plot the mean axial planeorientation for five subdivisions of fold interlimb angle to establisha possible deformation path. The mesoscale F2 fold data plotpredominantly within error of the simple shear field, with theexception of tight folds that show an excursion toward the trans-tension field. This excursion may potentially be an artefact of theroutine data recording methods employed whereby fold tightnesswas recorded by descriptive terms rather than exact values. If, as islikely, the actual interlimb angle values for recorded tight folds donot form an even distribution from 30-1�, but rather clusteredtoward the upper limit, then the actual mean interlimb angle for
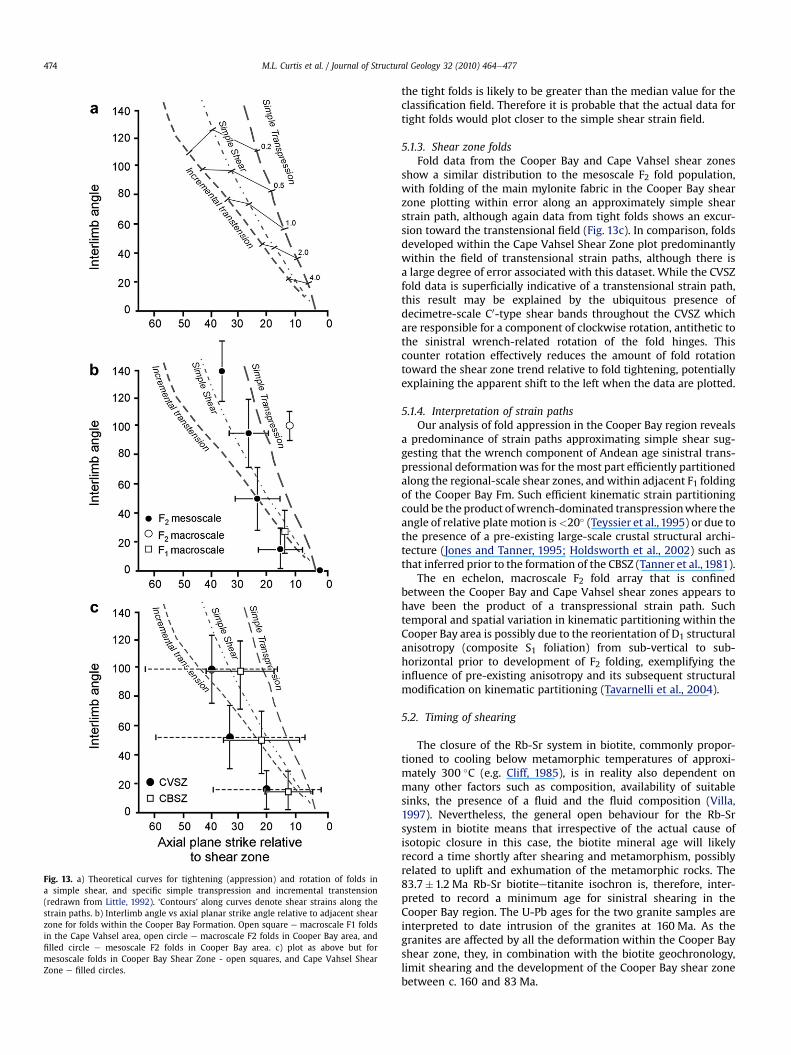
Fig. 13. a) Theoretical curves for tightening (appression) and rotation of folds ina simple shear, and specific simple transpression and incremental transtension(redrawn from Little, 1992). ‘Contours’ along curves denote shear strains along thestrain paths. b) Interlimb angle vs axial planar strike angle relative to adjacent shearzone for folds within the Cooper Bay Formation. Open square e macroscale F1 foldsin the Cape Vahsel area, open circle e macroscale F2 folds in Cooper Bay area, andfilled circle e mesoscale F2 folds in Cooper Bay area. c) plot as above but formesoscale folds in Cooper Bay Shear Zone - open squares, and Cape Vahsel ShearZone e filled circles.
M.L. Curtis et al. / Journal of Structural Geology 32 (2010) 464e477474
the tight folds is likely to be greater than the median value for theclassification field. Therefore it is probable that the actual data fortight folds would plot closer to the simple shear strain field.
5.1.3. Shear zone foldsFold data from the Cooper Bay and Cape Vahsel shear zones
show a similar distribution to the mesoscale F2 fold population,with folding of the main mylonite fabric in the Cooper Bay shearzone plotting within error along an approximately simple shearstrain path, although again data from tight folds shows an excur-sion toward the transtensional field (Fig. 13c). In comparison, foldsdeveloped within the Cape Vahsel Shear Zone plot predominantlywithin the field of transtensional strain paths, although there isa large degree of error associated with this dataset. While the CVSZfold data is superficially indicative of a transtensional strain path,this result may be explained by the ubiquitous presence ofdecimetre-scale C0-type shear bands throughout the CVSZ whichare responsible for a component of clockwise rotation, antithetic tothe sinistral wrench-related rotation of the fold hinges. Thiscounter rotation effectively reduces the amount of fold rotationtoward the shear zone trend relative to fold tightening, potentiallyexplaining the apparent shift to the left when the data are plotted.
5.1.4. Interpretation of strain pathsOur analysis of fold appression in the Cooper Bay region reveals
a predominance of strain paths approximating simple shear sug-gesting that the wrench component of Andean age sinistral trans-pressional deformationwas for the most part efficiently partitionedalong the regional-scale shear zones, and within adjacent F1 foldingof the Cooper Bay Fm. Such efficient kinematic strain partitioningcould be the product ofwrench-dominated transpressionwhere theangle of relative platemotion is<20� (Teyssier et al., 1995) or due tothe presence of a pre-existing large-scale crustal structural archi-tecture (Jones and Tanner, 1995; Holdsworth et al., 2002) such asthat inferred prior to the formation of the CBSZ (Tanner et al., 1981).
The en echelon, macroscale F2 fold array that is confinedbetween the Cooper Bay and Cape Vahsel shear zones appears tohave been the product of a transpressional strain path. Suchtemporal and spatial variation in kinematic partitioning within theCooper Bay area is possibly due to the reorientation of D1 structuralanisotropy (composite S1 foliation) from sub-vertical to sub-horizontal prior to development of F2 folding, exemplifying theinfluence of pre-existing anisotropy and its subsequent structuralmodification on kinematic partitioning (Tavarnelli et al., 2004).
5.2. Timing of shearing
The closure of the Rb-Sr system in biotite, commonly propor-tioned to cooling below metamorphic temperatures of approxi-mately 300 �C (e.g. Cliff, 1985), is in reality also dependent onmany other factors such as composition, availability of suitablesinks, the presence of a fluid and the fluid composition (Villa,1997). Nevertheless, the general open behaviour for the Rb-Srsystem in biotite means that irrespective of the actual cause ofisotopic closure in this case, the biotite mineral age will likelyrecord a time shortly after shearing and metamorphism, possiblyrelated to uplift and exhumation of the metamorphic rocks. The83.7�1.2 Ma Rb-Sr biotiteetitanite isochron is, therefore, inter-preted to record a minimum age for sinistral shearing in theCooper Bay region. The U-Pb ages for the two granite samples areinterpreted to date intrusion of the granites at 160 Ma. As thegranites are affected by all the deformation within the Cooper Bayshear zone, they, in combination with the biotite geochronology,limit shearing and the development of the Cooper Bay shear zonebetween c. 160 and 83 Ma.
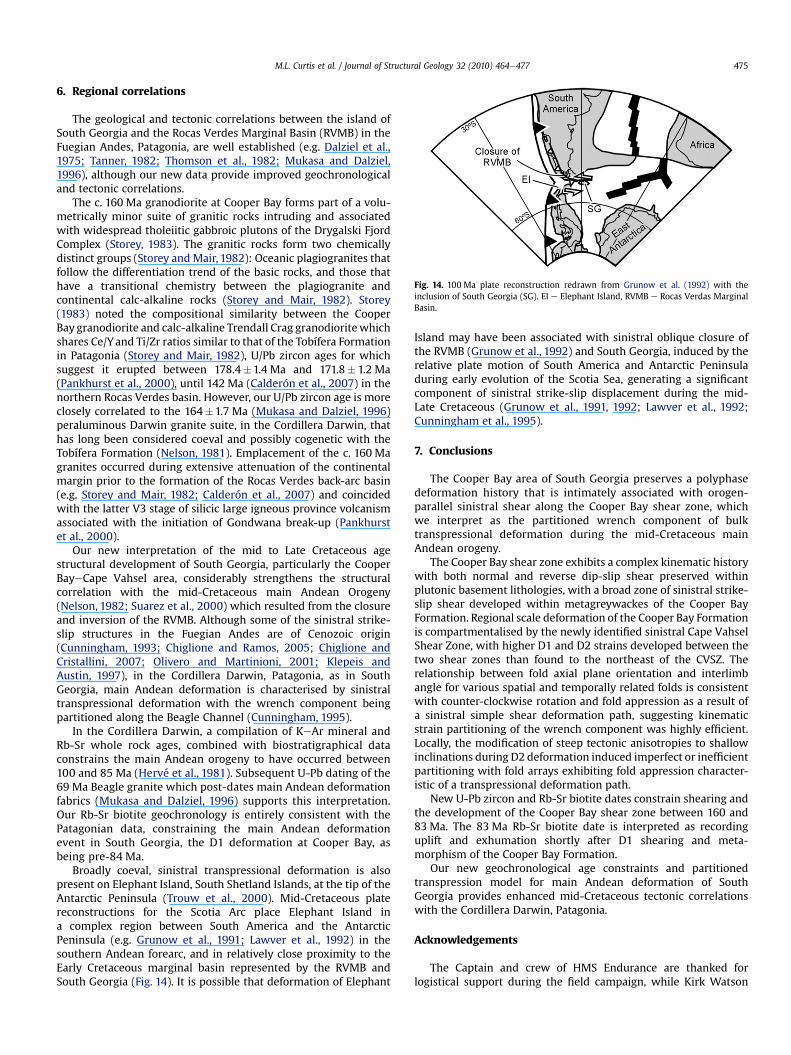
Fig. 14. 100 Ma plate reconstruction redrawn from Grunow et al. (1992) with theinclusion of South Georgia (SG). EI e Elephant Island, RVMB e Rocas Verdas MarginalBasin.
M.L. Curtis et al. / Journal of Structural Geology 32 (2010) 464e477 475
6. Regional correlations
The geological and tectonic correlations between the island ofSouth Georgia and the Rocas Verdes Marginal Basin (RVMB) in theFuegian Andes, Patagonia, are well established (e.g. Dalziel et al.,1975; Tanner, 1982; Thomson et al., 1982; Mukasa and Dalziel,1996), although our new data provide improved geochronologicaland tectonic correlations.
The c. 160 Ma granodiorite at Cooper Bay forms part of a volu-metrically minor suite of granitic rocks intruding and associatedwith widespread tholeiitic gabbroic plutons of the Drygalski FjordComplex (Storey, 1983). The granitic rocks form two chemicallydistinct groups (Storey and Mair, 1982): Oceanic plagiogranites thatfollow the differentiation trend of the basic rocks, and those thathave a transitional chemistry between the plagiogranite andcontinental calc-alkaline rocks (Storey and Mair, 1982). Storey(1983) noted the compositional similarity between the CooperBay granodiorite and calc-alkaline Trendall Crag granodioritewhichshares Ce/Yand Ti/Zr ratios similar to that of the Tobífera Formationin Patagonia (Storey and Mair, 1982), U/Pb zircon ages for whichsuggest it erupted between 178.4�1.4 Ma and 171.8� 1.2 Ma(Pankhurst et al., 2000), until 142 Ma (Calderón et al., 2007) in thenorthern Rocas Verdes basin. However, our U/Pb zircon age is moreclosely correlated to the 164�1.7 Ma (Mukasa and Dalziel, 1996)peraluminous Darwin granite suite, in the Cordillera Darwin, thathas long been considered coeval and possibly cogenetic with theTobífera Formation (Nelson, 1981). Emplacement of the c. 160 Magranites occurred during extensive attenuation of the continentalmargin prior to the formation of the Rocas Verdes back-arc basin(e.g. Storey and Mair, 1982; Calderón et al., 2007) and coincidedwith the latter V3 stage of silicic large igneous province volcanismassociated with the initiation of Gondwana break-up (Pankhurstet al., 2000).
Our new interpretation of the mid to Late Cretaceous agestructural development of South Georgia, particularly the CooperBayeCape Vahsel area, considerably strengthens the structuralcorrelation with the mid-Cretaceous main Andean Orogeny(Nelson, 1982; Suarez et al., 2000) which resulted from the closureand inversion of the RVMB. Although some of the sinistral strike-slip structures in the Fuegian Andes are of Cenozoic origin(Cunningham, 1993; Chiglione and Ramos, 2005; Chiglione andCristallini, 2007; Olivero and Martinioni, 2001; Klepeis andAustin, 1997), in the Cordillera Darwin, Patagonia, as in SouthGeorgia, main Andean deformation is characterised by sinistraltranspressional deformation with the wrench component beingpartitioned along the Beagle Channel (Cunningham, 1995).
In the Cordillera Darwin, a compilation of KeAr mineral andRb-Sr whole rock ages, combined with biostratigraphical dataconstrains the main Andean orogeny to have occurred between100 and 85 Ma (Hervé et al., 1981). Subsequent U-Pb dating of the69 Ma Beagle granite which post-dates main Andean deformationfabrics (Mukasa and Dalziel, 1996) supports this interpretation.Our Rb-Sr biotite geochronology is entirely consistent with thePatagonian data, constraining the main Andean deformationevent in South Georgia, the D1 deformation at Cooper Bay, asbeing pre-84 Ma.
Broadly coeval, sinistral transpressional deformation is alsopresent on Elephant Island, South Shetland Islands, at the tip of theAntarctic Peninsula (Trouw et al., 2000). Mid-Cretaceous platereconstructions for the Scotia Arc place Elephant Island ina complex region between South America and the AntarcticPeninsula (e.g. Grunow et al., 1991; Lawver et al., 1992) in thesouthern Andean forearc, and in relatively close proximity to theEarly Cretaceous marginal basin represented by the RVMB andSouth Georgia (Fig. 14). It is possible that deformation of Elephant
Island may have been associated with sinistral oblique closure ofthe RVMB (Grunow et al., 1992) and South Georgia, induced by therelative plate motion of South America and Antarctic Peninsuladuring early evolution of the Scotia Sea, generating a significantcomponent of sinistral strike-slip displacement during the mid-Late Cretaceous (Grunow et al., 1991, 1992; Lawver et al., 1992;Cunningham et al., 1995).
7. Conclusions
The Cooper Bay area of South Georgia preserves a polyphasedeformation history that is intimately associated with orogen-parallel sinistral shear along the Cooper Bay shear zone, whichwe interpret as the partitioned wrench component of bulktranspressional deformation during the mid-Cretaceous mainAndean orogeny.
The Cooper Bay shear zone exhibits a complex kinematic historywith both normal and reverse dip-slip shear preserved withinplutonic basement lithologies, with a broad zone of sinistral strike-slip shear developed within metagreywackes of the Cooper BayFormation. Regional scale deformation of the Cooper Bay Formationis compartmentalised by the newly identified sinistral Cape VahselShear Zone, with higher D1 and D2 strains developed between thetwo shear zones than found to the northeast of the CVSZ. Therelationship between fold axial plane orientation and interlimbangle for various spatial and temporally related folds is consistentwith counter-clockwise rotation and fold appression as a result ofa sinistral simple shear deformation path, suggesting kinematicstrain partitioning of the wrench component was highly efficient.Locally, the modification of steep tectonic anisotropies to shallowinclinations during D2 deformation induced imperfect or inefficientpartitioning with fold arrays exhibiting fold appression character-istic of a transpressional deformation path.
New U-Pb zircon and Rb-Sr biotite dates constrain shearing andthe development of the Cooper Bay shear zone between 160 and83 Ma. The 83 Ma Rb-Sr biotite date is interpreted as recordinguplift and exhumation shortly after D1 shearing and meta-morphism of the Cooper Bay Formation.
Our new geochronological age constraints and partitionedtranspression model for main Andean deformation of SouthGeorgia provides enhanced mid-Cretaceous tectonic correlationswith the Cordillera Darwin, Patagonia.
Acknowledgements
The Captain and crew of HMS Endurance are thanked forlogistical support during the field campaign, while Kirk Watson
M.L. Curtis et al. / Journal of Structural Geology 32 (2010) 464e477476
provided excellent field assistance. Rudolf Trouw and Bryan Storeyare thanked for constructive reviews. This study was funded by theNatural Environment Research Council and is part of the BritishAntarctic Survey's Polar Science for Planet Earth Programme. This isNordsim publication number 250, the Nordsim facility is operatedunder an agreement between the Swedish Museum of NaturalHistory, the Geological Survey of Finland and the research fundingagencies of Denmark, Sweden and Norway.
References
Berthé, D., Choukroune, P., Gapais, D., 1979. Orientations préférentialles du quartz etorthogeniessification progressive en régime cisaillant. Bulletin of Mineralogy102, 265e272.
Bruhn, R.L., Dalziel, I.W.D., 1977. Destruction of the Early Cretaceous marginal basinin the Andes of Tierra del Fuego. In: Talwani, M., Pitman, W.C. (Eds.), Island Arcs,Deep Sea Trenches and Back-Arc Basins. Maurice Ewing Series 1. AGU, Wash-ington D.C., pp. 395e405.
Calderón, M., Fildani, A., Hervé, F., Fanning, C.M., Weislogel, A., Cordani, U., 2007.Late Jurassic bimodal magmatism in the northern Sea-floor remnant of theRocas Verdes basin, southern Patagonian Andes. Journal of the GeologicalSociety, London 164, 1011e1022.
Chiglione, A.C., Cristallini, E.O., 2007. Have the southernmost Andes been curvedsince Late Cretaceous time? An analogue test for the Patagonia Orocline.Geology 35, 13e16.
Chiglione, A.C., Ramos, V.A., 2005. Progression of deformation and sedimentation inthe southernmost Andes. Tectonophysics 405, 25e46.
Clayton, R.A.S., 1982. A preliminary investigation of the Geochemistry of grey-wackes from South Georgia. British Antarctic Survey Bulletin 51, 89e109.
Cliff, R.A., 1985. Isotopic dating in metamorphic belts. Journal of the GeologicalSociety, London 142, 97e110.
Corfu, F., Hanchar, J.M., Hoskin, P.W.O., Kinny, P., 2003. Atlas of zircon textures. In:Hanchar, J.M., Hoskin, P.W.O. (Eds.), Zircon. Reviews in Mineralogy and Geochemi-stry, vol. 53. Mineralogical Society of America, Geochemical Society, pp. 468e500.
Cunningham, W.D., 1993. Strike-slip faults in the southernmost Andes and devel-opment of the Patagonian Orocline. Tectonics 12, 169e186.
Cunningham, W.D., 1995. Orogenesis at the southern tip of the Americas: thestructural evolution of the Cordillera Darwin metamorphic complex, south-ernmost Chile. Tectonophysics 244, 197e229.
Cunningham, W.D., Dalziel, I.W.D., Lee, T.-Y., Lawver, L.A., 1995. Southernmost SouthAmericaeAntarctic Peninsula relative plate motions since 84 Ma: implicationsfor the tectonic evolution of the Scotia Arc region. Journal of GeophysicalResearch 100, 8257e8266.
Curtis, M.L., 2007. Main Andean sinistral shear along the Cooper Bay DislocationZone, South Georgia? In: Cooper, A.K., Raymond, C.R., et al. (Eds.), Antarctica: AKeystone in a Changing World e Online Proceedings of the 10th ISAES. USGSOpen-File Report 2007-1047, Short Research Paper 034. doi:10.3133/of2007-1047.srp034, 4 pp.
Dalziel, I.W.D., 1981. Back-arc extension in the southern Andes: a review and criticalreappraisal. Philosophical Transactions of the Royal Society of London, Series A300, 319e335.
Dalziel, I.W.D., 1986. Collision and cordilleran orogenesis: an Andean perspective.In: Coward, M.P., Ries, A.C. (Eds.), Collision Tectonics. Geological Society, Lon-don, Special Publication, vol. 19, pp. 389e404.
Dalziel, I.W.D., 1992. Antarctica; a tale of two supercontinents. Annual Review ofEarth and Planetary Sciences 20, 501e526.
Dalziel, I.W.D., Dott, R.H., Winn, R.D., Bruhn, R.L., 1975. Tectonic relations of SouthGeorgia Island to the southernmost Andes. Geological Society of AmericaBulletin 86, 1034e1040.
Dewey, J.F., Holdsworth, R.E., Strachan, R.A., 1998. Transpression and transtensionzones. In: Holdsworth, R.E., Strachen, R.A., Dewey, J.F. (Eds.), ContinentalTranspressional and Transtensional Tectonics. Geological Society, London,Special Publications, vol. 135, pp. 1e14.
Dott, R.H., Winn, R.D., Smith, C.H.L., 1982. Relationship of Late Mesozoic and EarlyCenozoic sedimentation to the Tectonic evolution of the southernmost Andesand Scotia Arc. In: Craddock, C. (Ed.), Antarctic Geoscience. University of Wis-consin Press, Madison, pp. 193e202.
Fildani, A., Hessler, A.M., 2005. Stratigraphic record across a retroarc basin inver-sion: Rocas verdeseMagellanes Basin, Patagonian Andes, Chile. GeologicalSociety of America Bulletin 117, 1596e1614.
Grunow, A.M., Dalziel, I.W.D., Harrison, T.M., Heizler, M.T., 1992. Structural geologyand geochronology of subduction complexes along the margin of Gondwana-land: new data from the Antarctic Peninsula and southernmost Andes.Geological Society of America Bulletin 104, 1497e1514.
Grunow, A.M., Kent, D.V., Dalziel, I.W.D., 1991. New paleomagnetic data fromThurston Island: implications for the tectonics of West Antarctica and WeddellSea opening. Journal of Geophysical Research 96, 17935e17954.
Hervé, F., Nelson, E., Kawashita, K., Suárez, M., 1981. New isotopic ages and thetiming of orogenic events in the Cordillera Darwin, southernmost ChileanAndes. Earth and Planetary Science Letters 55, 257e265.
Holdsworth, R.E., Tavarnelli, E., Clegg, P., Pinheiro, R.V.L., Jones, R.R., McCaffrey, K.-J.W., 2002. Domainal deformation patterns and strain partitioning duringtranspression: an example from the Southern Uplands terrane, Scotland. Jour-nal of the Geological Society, London 159, 401e415.
Jones, R.R., Tanner, P.W.G., 1995. Strain partitioning in transpression zones. Journalof Structural Geology 17, 793e802.
König, M., Jokat, W., 2006. The Mesozoic breakup of the Weddell Sea. Journal ofGeophysical Research 111, B12102. doi:10.1029/2005JB004035.
Klepeis, K.A., Austin, J.A., 1997. Contrasting styles of superimposed deformation inthe southernmost Andes. Tectonics 16, 755e776.
Lawver, L.A., Gahagan, L.M., Coffin, M.F., 1992. The development of palaeoseawaysaround Antarctica. In: Kennett, J.P., Warnke, D. (Eds.), The Antarctic Palae-oenvironment: A Perspective on Global Change. Antarctic Research Series, vol.56. AGU, Washington D.C., pp. 7e30.
Little, T.A., 1992. Development of wrench folds along the Border Ranges faultsystem, southern Alaska, U.S.A. Journal of Structural Geology 14, 343e359.
Livermore, R., Hillenbrand, C.-D., Meredith, M., Eagles, G., 2007. Drake passage andCenozoic climate: an open and shut case? Geochemistry, Geophysics, Geo-systems 8, Q01005. doi:10.1029/2005GC001224.
Ludwig, K.R., 2003. User Manual for isoplot 3.00: a Geochronological Toolkit forMicrosoft Excel. In: Berkeley Geochronology Centre Special Publications, vol. 41e70.
Macdonald, D.I.M., Storey, B.C., Thomson, J.W., 1987. South Georgia, BAS GEOMAPSeries, Sheet 1, 1:250,000, Geological Map and Supplementary Text. BritishAntarctic Survey, Cambridge, 63 pp.
Mair, B.F., 1987. The Geology of South Georgia: VI. Larsen Harbour Formation. BritishAntarctic Survey Scientific Reports No. 111, 60 pp.
Mukasa, S.B., Dalziel, I.W.D., 1996. Southermost Andes and South Georgia Island,North Scotia Ridge: zircon U-Pb and muscovite 40Ar/39Ar age constraints ontectonic evolution of Southwestern Gondwanaland. Journal of South AmericanEarth Sciences 9, 349e365.
Nelson, E.P., 1981. Geological evolution of the Cordillera Darwin orogenic corecomplex, southern Andes. PhD Thesis, New York, Columbia University.
Nelson, E.P., 1982. Post-tectonic uplift of the Cordillera Darwin orogenic corecomplex: evidence from fission track geochronology and closing temper-atureetime relationships. Journal of the Geological Society, London 139, 755e761.
Nelson, E.P., Dalziel, I.W.D., Milnes, A.G., 1980. Structural geology of the CordilleraDarwin e collisional-style orogenesis in the southernmost Chilean Andes.Eclogae Geologicae Helvetiae 73, 727e751.
Olivero, E.B., Martinioni, D.R., 2001. A review of the geology of the ArgentinianFuegian Andes. Journal of South American Earth Sciences 14, 175e188.
Pankhurst, R.J., Riley, T.R., Fanning, C.M., Kelley, S.P., 2000. Episodic silicic volcanismin Patagonia and the Antarctic Pensinsula: chronology of magmatism associatedwith the break-up of Gondwana. Journal of Petrology 41, 605e625.
Sanderson, D.J., Marchini, W.R.D., 1984. Transpression. Journal of Structural Geology6, 449e458.
Skidmore, M.J., 1972. The geology of South Georgia: III. Prince Olav Harbour andStromness Bay areas. British Antarctic Survey Scientific Reports 73, 50 pp.
Stacey, J.S., Kramers, J.D., 1975. Approximation of terrestrial lead evolution by a two-stage model. Earth and Planetary Sciences 26, 207e221.
Steiger, R.H., Jäger, E., 1977. Subcommission on geochronology; convention on theuse of decay constants in geo- and cosmochronology. Earth and PlanetaryScience Letters 36, 359e362.
Stern, R.A., Amelin, Y., 2003. Assessment of errors in SIMS zircon U-Pb geochro-nology using a natural zircon standard and NIST SRM 610 glass. ChemicalGeology 197, 111e142.
Stone, P., 1980. The geology of South Georgia: IV. Barff Peninsula and Royal Bayareas. British Antarctic Survey Scientific Reports 96, 45 pp.
Stone, P., 1982. Geological observations in the Cooper BayeWirik Bay area, SouthGeorgia. British Antarctic Survey Bulletin 36, 129e131.
Storey, B.C., 1983. The geology of South Georgia: V. Drygalski Fjord Complex. BritishAntarctic Survey Scientific Reports 107, 88 pp.
Storey, B.C., Mair, B.F., Bell, C.M., 1977. The occurrence of Mesozoic oceanic floor andancient continental crust on South Georgia. Geological Magazine 114, 203e208.
Storey, B.C., Mair, B.F., 1982. The composite floor of the Cretaceous back-arc basin ofSouth Georgia. Journal of the Geological Society, London 139, 729e737.
Suárez, M., De La Cruz, R., Bell, C.M., 2000. Timing and origin of deformation alongthe Patagonian fold and thrust belt. Geological Magazine 137, 345e353.
Tanner, P.W.G., Macdonald, D.I.M., 1982. Models for the deposition and simple sheardeformation of a turbidite sequence in the South Georgia portion of thesouthern Andes back-arc basin. Journal of the Geological Society, London 139,739e754.
Tanner, P.W.G., Rex, D.C., 1979. Timing of events in an Early Cretaceous Island arc-marginal basin system on South Georgia. Geological Magazine 116, 167e179.
Tanner, P.W.G., 1982. Geological evolution of South Georgia. In: Craddock, C. (Ed.),Antarctic Geoscience. University of Wisconsin Press, Madison, pp. 167e176.
Tanner, P.W.G., Storey, B.C., Macdonald, D.I.M., 1981. Geology of an Upper JurassiceLower Cretaceous island-arc assemblage in Hauge Reef, the Pickersgill Islandsand adjoining areas of South Georgia. British Antarctic Survey Bulletin 53,77e117.
Tavarnelli, E., Holdsworth, R.E., Clegg, P., Jones, R.R., McCaffrey, K.J.W., 2004. Theanatomy and evolution of a transpressional imbricate zone, Southern Uplands,Scotland. Journal of Structural Geology 26, 1341e1360.
Teyssier, C., Tikoff, B., Markley, M., 1995. Oblique plate motion and continentaltectonics. Geology 23, 447e450.

M.L. Curtis et al. / Journal of Structural Geology 32 (2010) 464e477 477
Thomson, M.R.A., Tanner, P.W.G., Rex, D.C., 1982. Fossil and radiometric evidence forages of deposition and metamorphism of the sedimentary sequences on SouthGeorgia. In: Craddock, C. (Ed.), Antarctic Geoscience. University of WisconsinPress, Madison, pp. 177e184.
Trouw, R.A.J., Passchier, C.W., Valeriano, C.M., Simões, L.S.A., Paciullo, F.V.P.,Ribeiro, A., 2000. Deformational evolution of a Cretaceous subduction complex:Elephant Island, South Shetland Islands, Antarctica. Tectonophysics 319,93e110.
Villa, I.M., 1997. Isotopic Closure. Terra Nova 10, 42e47.
White, S.H., Burrows, S.E., Carreras, J., Shaw, N.D., Humphreys, F.J., 1980. Onmylonites in ductile shear zones. Journal of Structural Geology 2, 175e187.
Whitehouse, M.J., Kamber, B.S., 2005. Assigning dates to thin gneissic veins in high-grade metamorphic terranes: a cautionary tale from Akilia, southwestGreenland. Journal of Petrology 46, 291e318.
Wiedenbeck, M., Alle, P., Corfu, F., Griffin, W.L., Meirer, M., Oberli, F., VonQuadt, A., Roddick, J.C., Spiegel, W., 1995. Three natural zircon standards forUeThePb, LueHf, trace element and REE analyses. Geostandards Newsletter19, 1e23.