analyzing survey data
TRANSCRIPT
Analyzing Survey Data
Angelina Hill, Associate Director of Academic Assessment
2009 Academic Assessment WorkshopMay 14th & 15th
UNLV
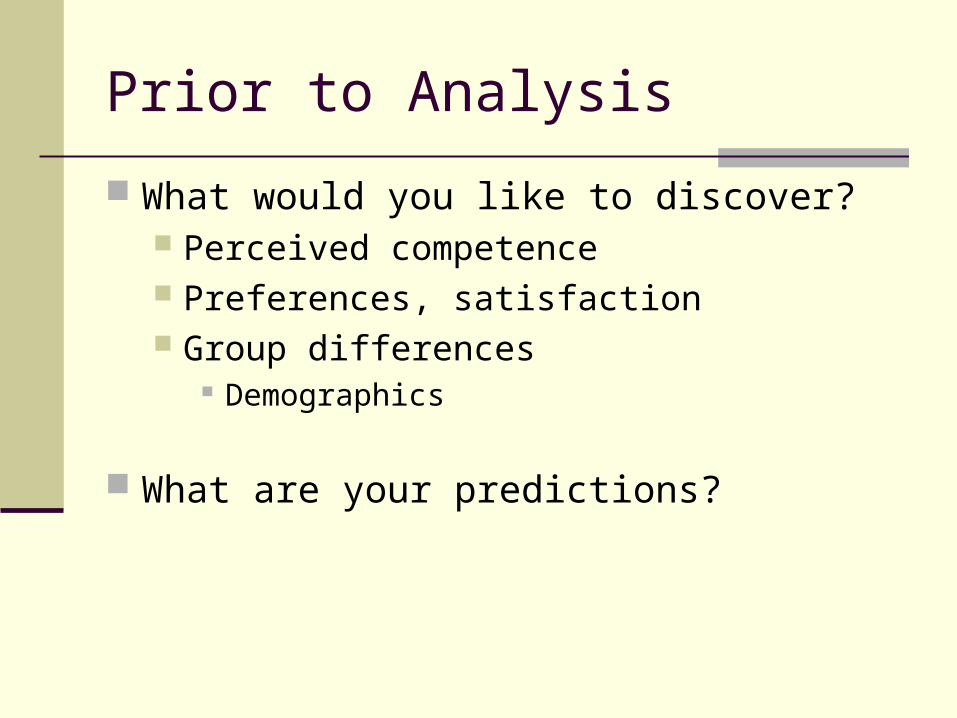
Prior to Analysis What would you like to discover?
Perceived competence Preferences, satisfaction Group differences
Demographics
What are your predictions?
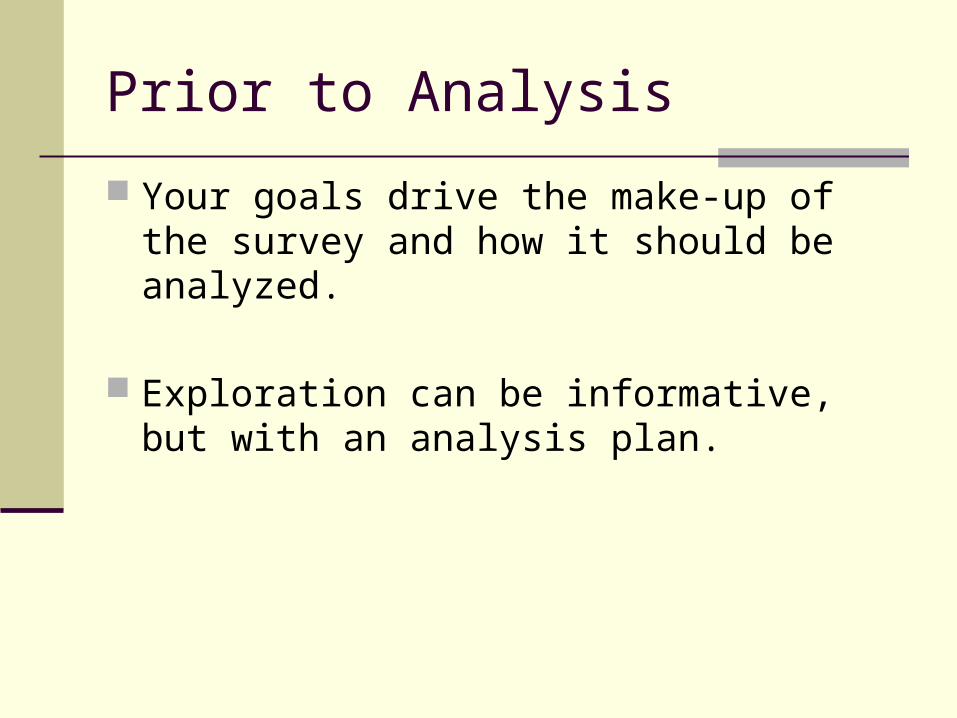
Prior to Analysis Your goals drive the make-up of the survey and how it should be analyzed.
Exploration can be informative, but with an analysis plan.
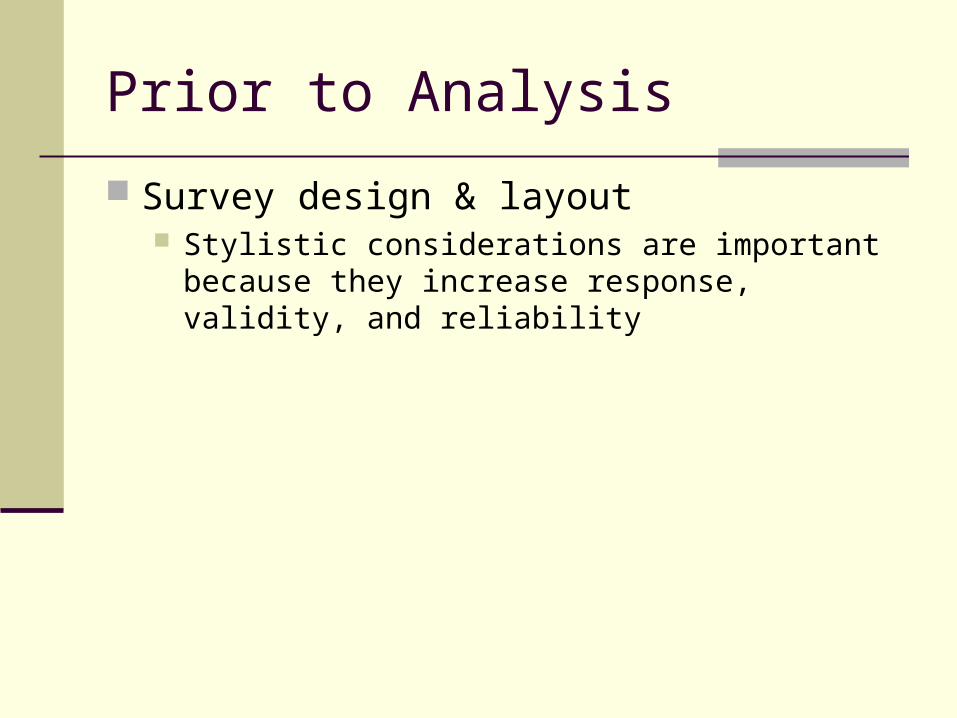
Prior to Analysis Survey design & layout
Stylistic considerations are important because they increase response, validity, and reliability
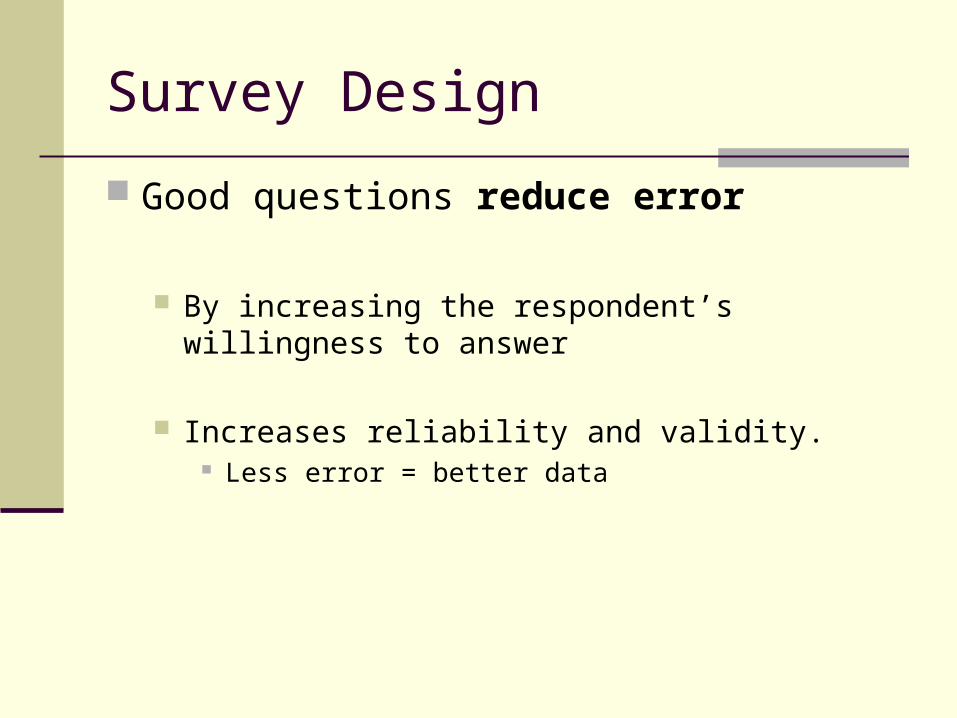
Survey Design Good questions reduce error
By increasing the respondent’s willingness to answer
Increases reliability and validity. Less error = better data
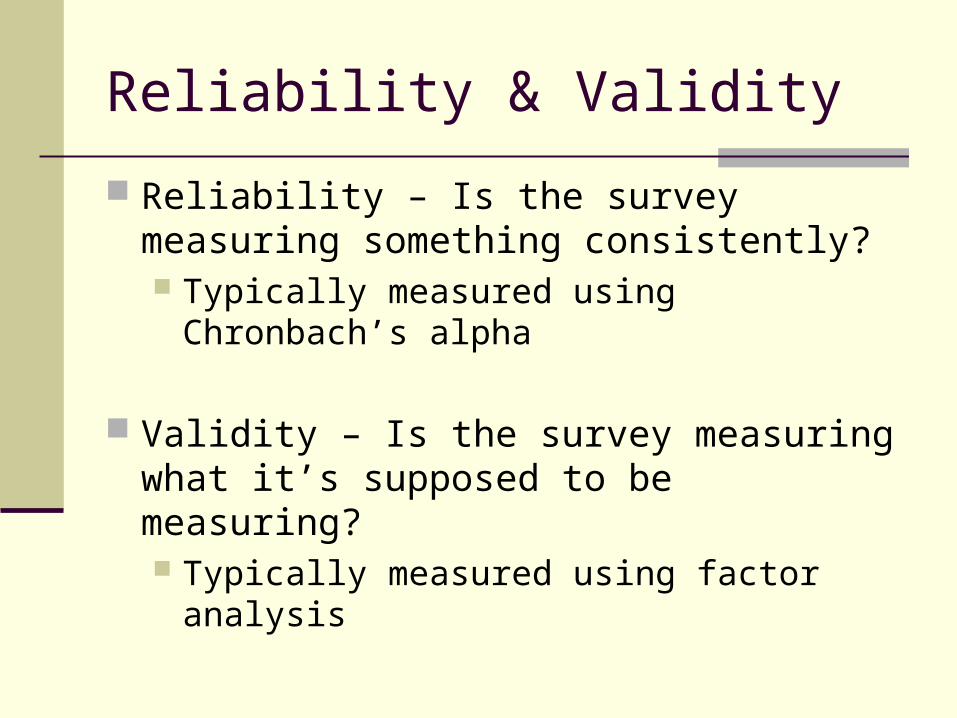
Reliability & Validity Reliability – Is the survey measuring something consistently? Typically measured using Chronbach’s alpha
Validity – Is the survey measuring what it’s supposed to be measuring? Typically measured using factor analysis
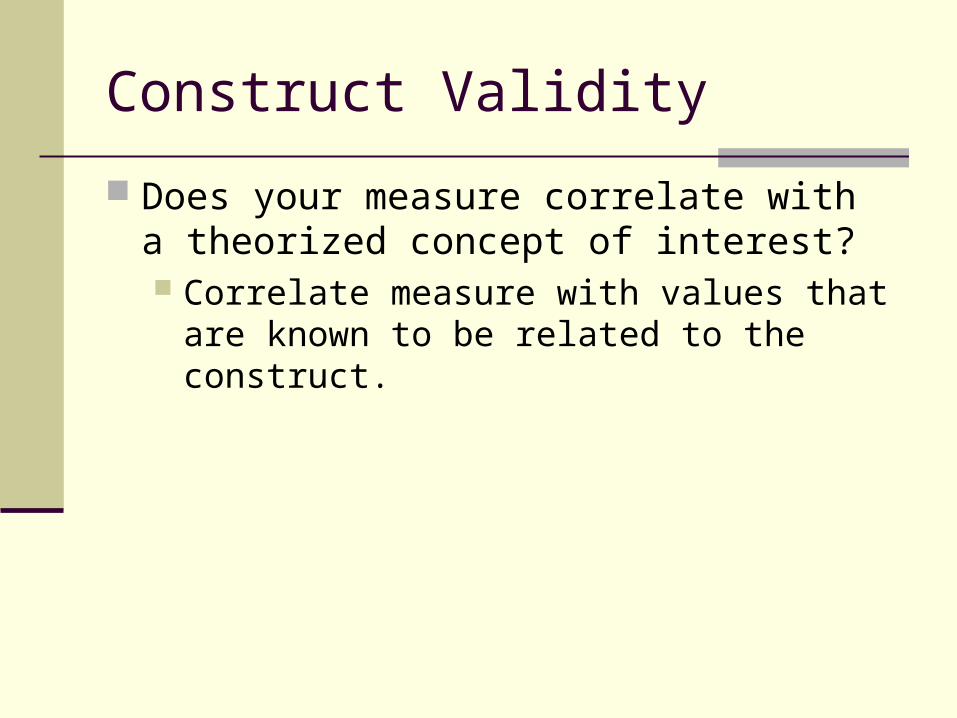
Construct Validity Does your measure correlate with a theorized concept of interest? Correlate measure with values that are known to be related to the construct.
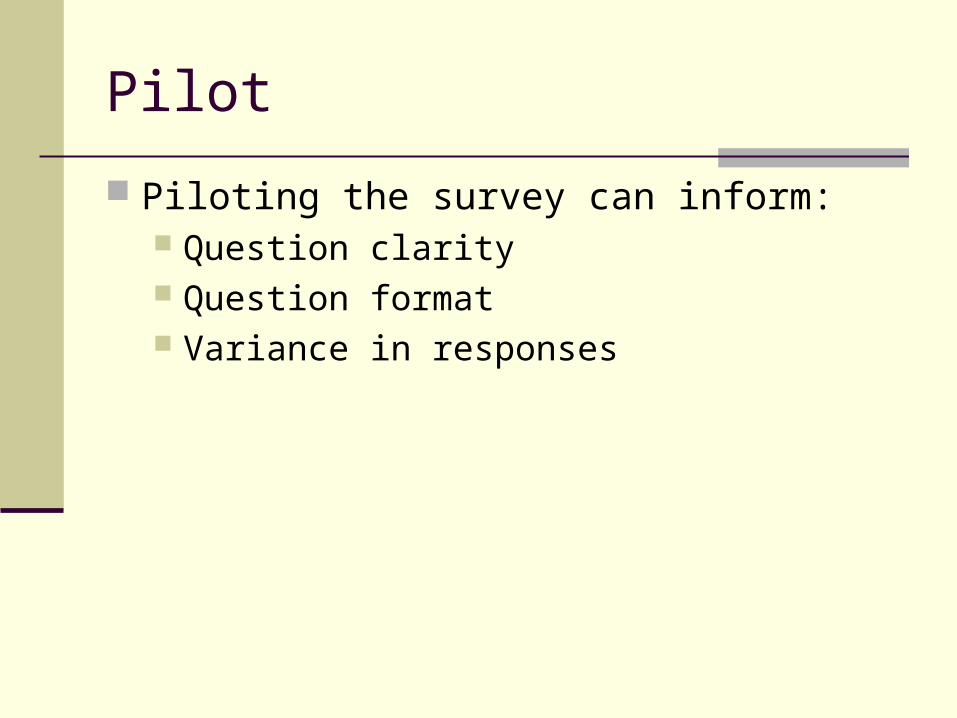
Pilot Piloting the survey can inform:
Question clarity Question format Variance in responses
Survey Analysis Using data from
Paper Surveys SurveyMonkey SelectSurvey.Net
Survey Analysis Paper surveys
Put data in spreadsheet format using excel or SPSS
Columns represent variables Rows represent respondents
Survey Analysis Paper surveys
Create a data matrixVariable name || Numeric Values || Numeric labels
Summarize open-ended questions separately
Response group || frequency
Survey Analysis SurveyMonkey
Available under the analyze results tab
Frequencies & crosstabs Download all responses for further analysis
Select Download responses from menu Choose type of download – select all responses collected
Choose format – select condensed columns and numeric cells.
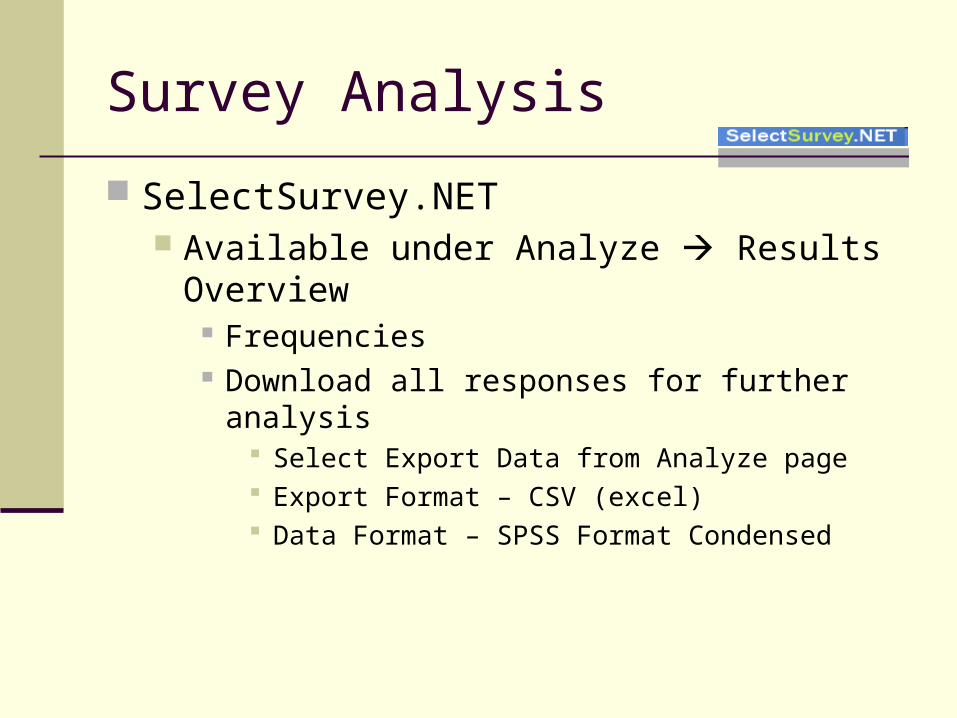
Survey Analysis SelectSurvey.NET
Available under Analyze Results Overview
Frequencies Download all responses for further analysis
Select Export Data from Analyze page Export Format – CSV (excel) Data Format – SPSS Format Condensed
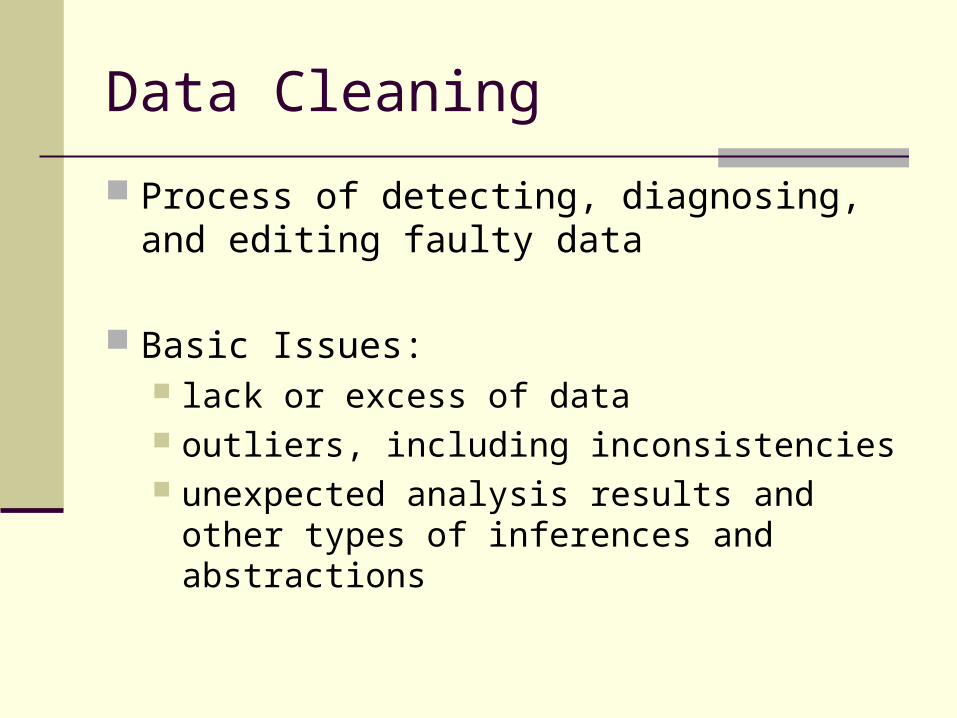
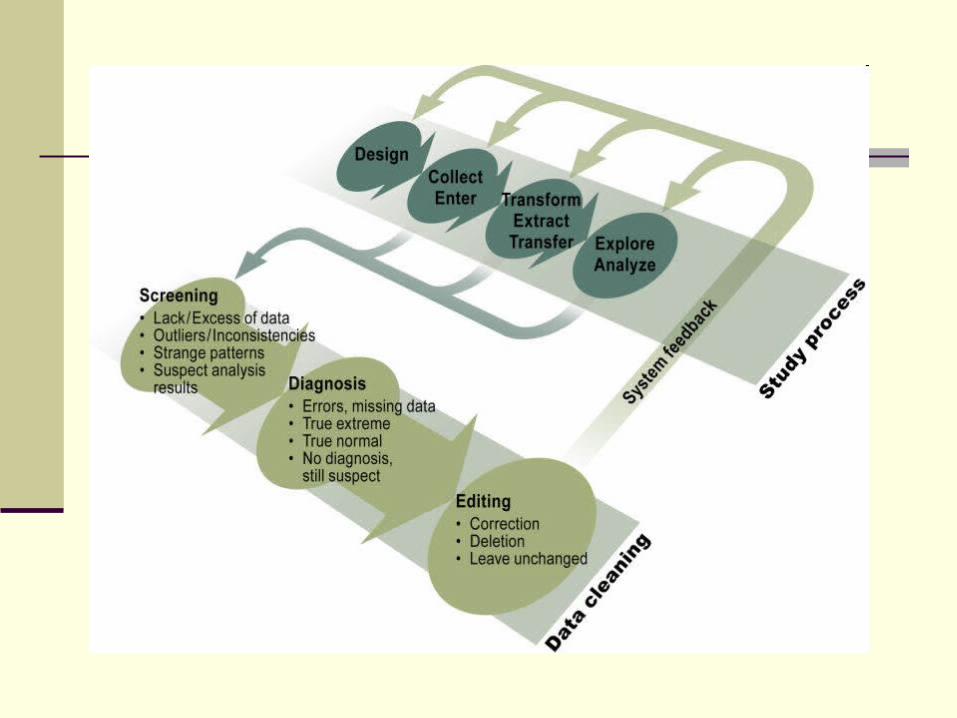
Data Cleaning Process of detecting, diagnosing, and editing faulty data
Basic Issues: lack or excess of data outliers, including inconsistencies unexpected analysis results and other types of inferences and abstractions
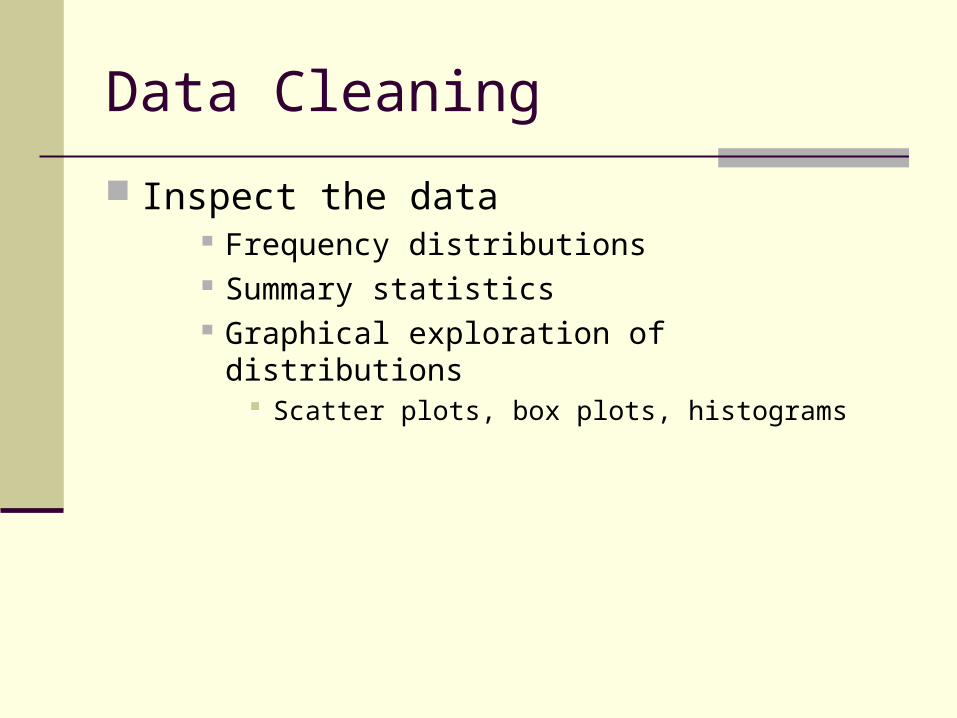
Data Cleaning Inspect the data
Frequency distributions Summary statistics Graphical exploration of distributions
Scatter plots, box plots, histograms
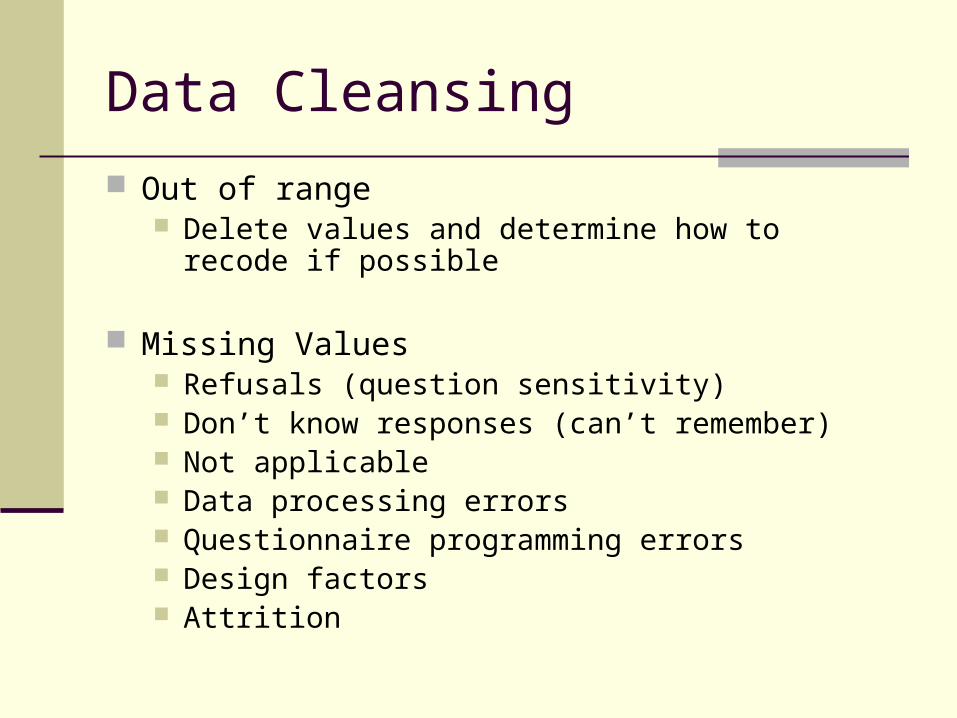
Data Cleansing Out of range
Delete values and determine how to recode if possible
Missing Values Refusals (question sensitivity) Don’t know responses (can’t remember) Not applicable Data processing errors Questionnaire programming errors Design factors Attrition
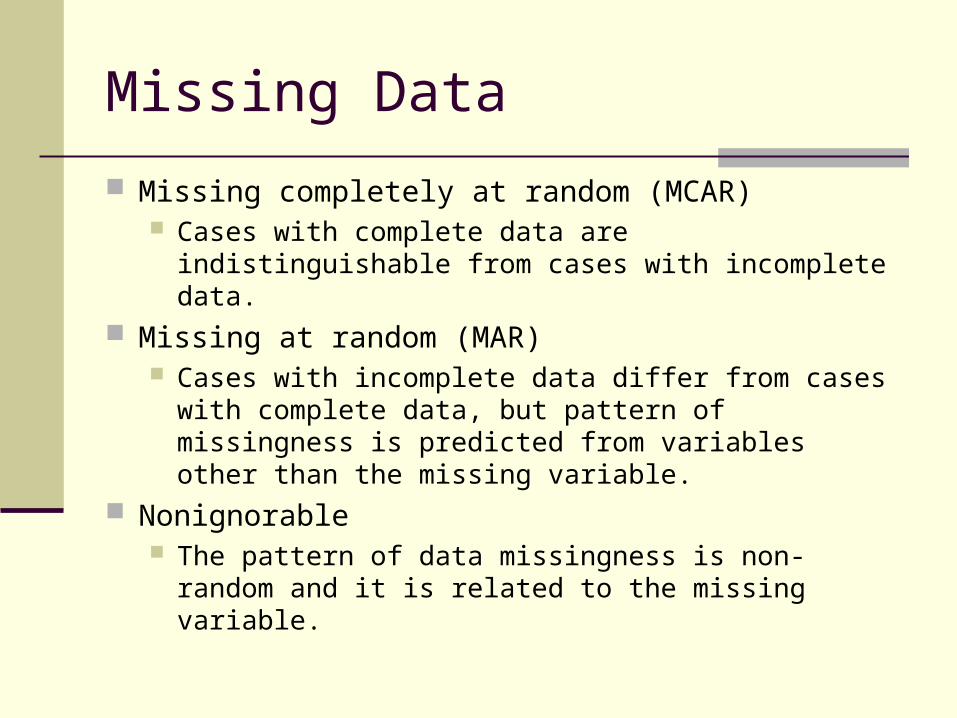
Missing Data Missing completely at random (MCAR)
Cases with complete data are indistinguishable from cases with incomplete data.
Missing at random (MAR) Cases with incomplete data differ from cases with complete data, but pattern of missingness is predicted from variables other than the missing variable.
Nonignorable The pattern of data missingness is non-random and it is related to the missing variable.
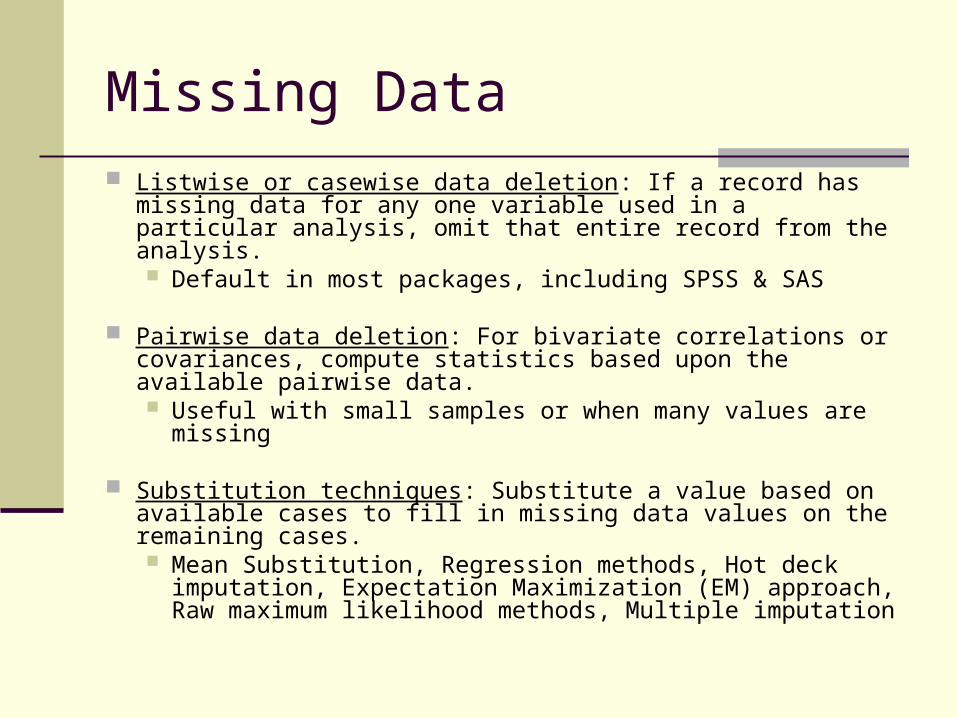
Missing Data Listwise or casewise data deletion: If a record has
missing data for any one variable used in a particular analysis, omit that entire record from the analysis. Default in most packages, including SPSS & SAS
Pairwise data deletion: For bivariate correlations or covariances, compute statistics based upon the available pairwise data. Useful with small samples or when many values are missing
Substitution techniques: Substitute a value based on available cases to fill in missing data values on the remaining cases. Mean Substitution, Regression methods, Hot deck imputation, Expectation Maximization (EM) approach, Raw maximum likelihood methods, Multiple imputation
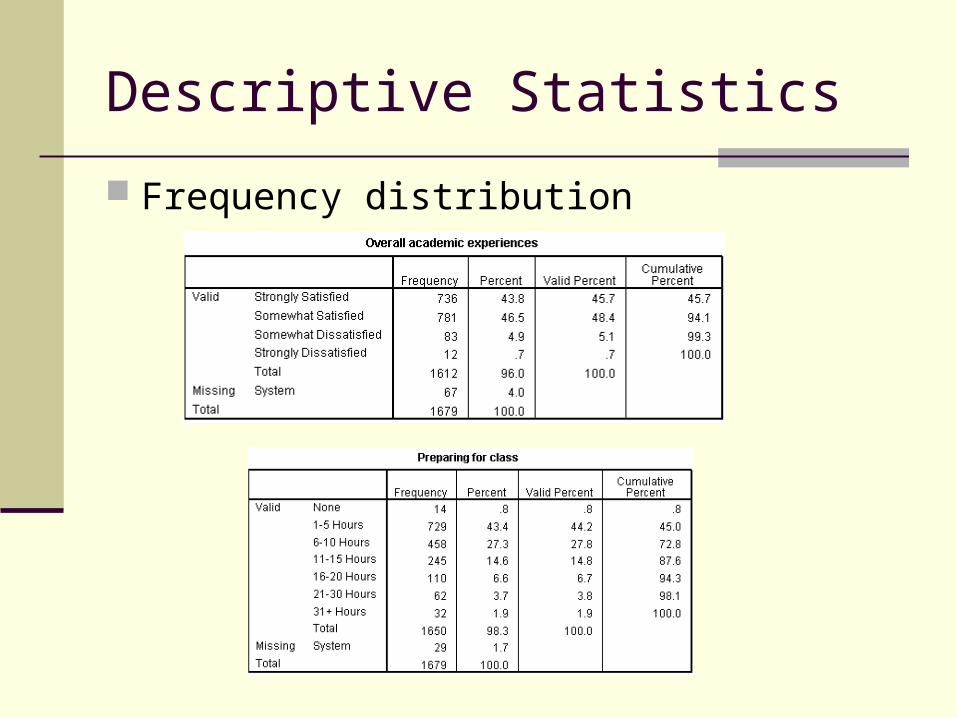
Descriptive Statistics Frequency distribution
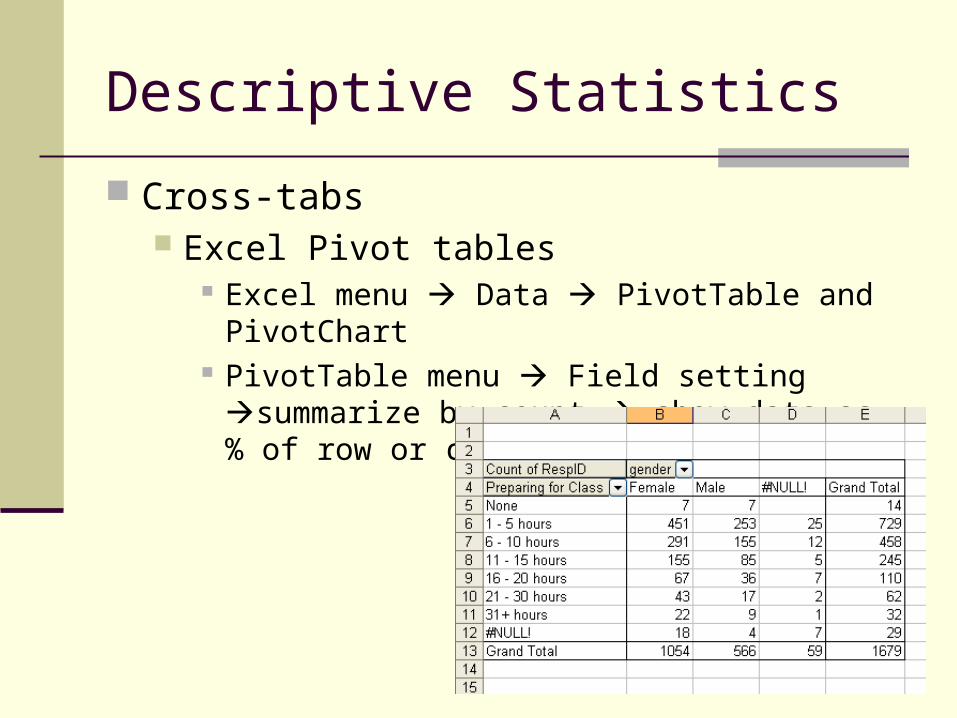
Descriptive Statistics Cross-tabs
Excel Pivot tables Excel menu Data PivotTable and PivotChart
PivotTable menu Field setting summarize by count show data as % of row or column
Data Analysis Measurement scale determines how the data should be analyzed: Nominal, ordinal, interval, ratio
Move from categorical information, to also knowing the order, to also knowing the exact distance between ratings, to also knowing that one measurement in twice as much as another.
Data Analysis Three instructors are evaluating preferences among three methods (lecture, discussion, activities) 1) Identify most, second, and least preferred.
2) Identify your favorite. 3) Rate each method on a 10-point scale, where 1 indicates not at all preferred and 10 indicates strongly preferred.
Data Analysis Nominal & ordinal variables are discrete Can be qualitative or quantitative
Interval & ratio variables are continuous Grades Age
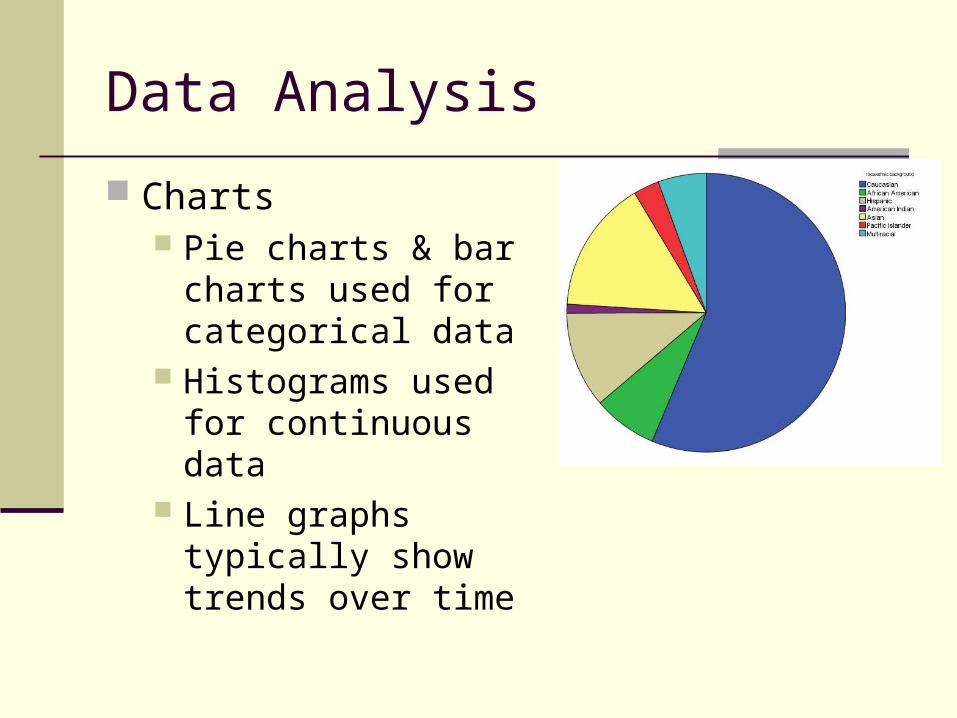
Data Analysis Charts
Pie charts & bar charts used for categorical data
Histograms used for continuous data
Line graphs typically show trends over time
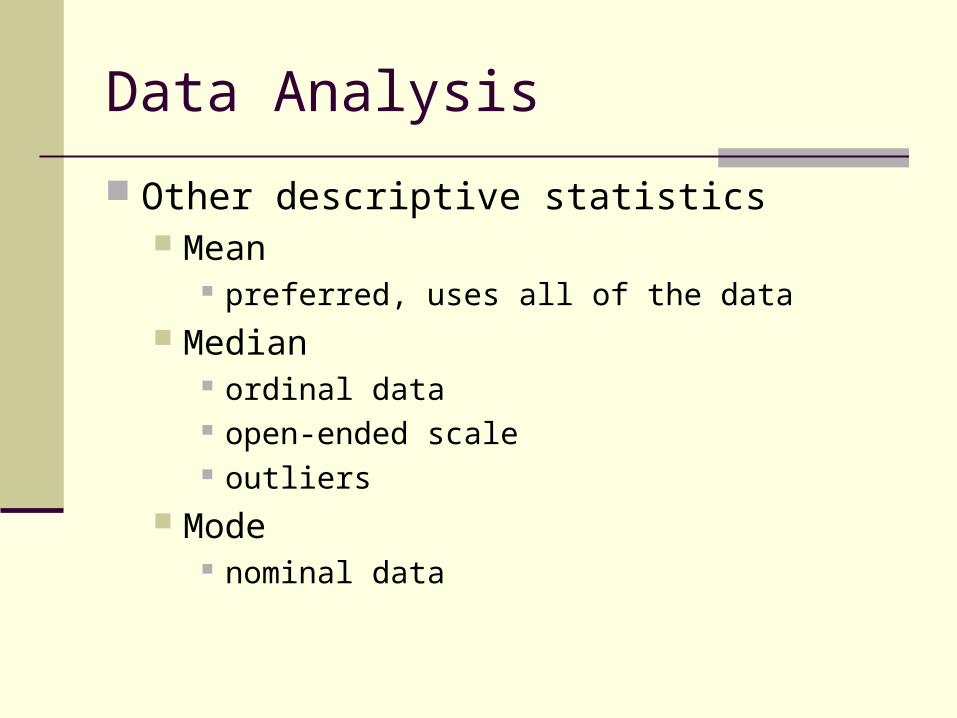
Data Analysis Other descriptive statistics
Mean preferred, uses all of the data
Median ordinal data open-ended scale outliers
Mode nominal data
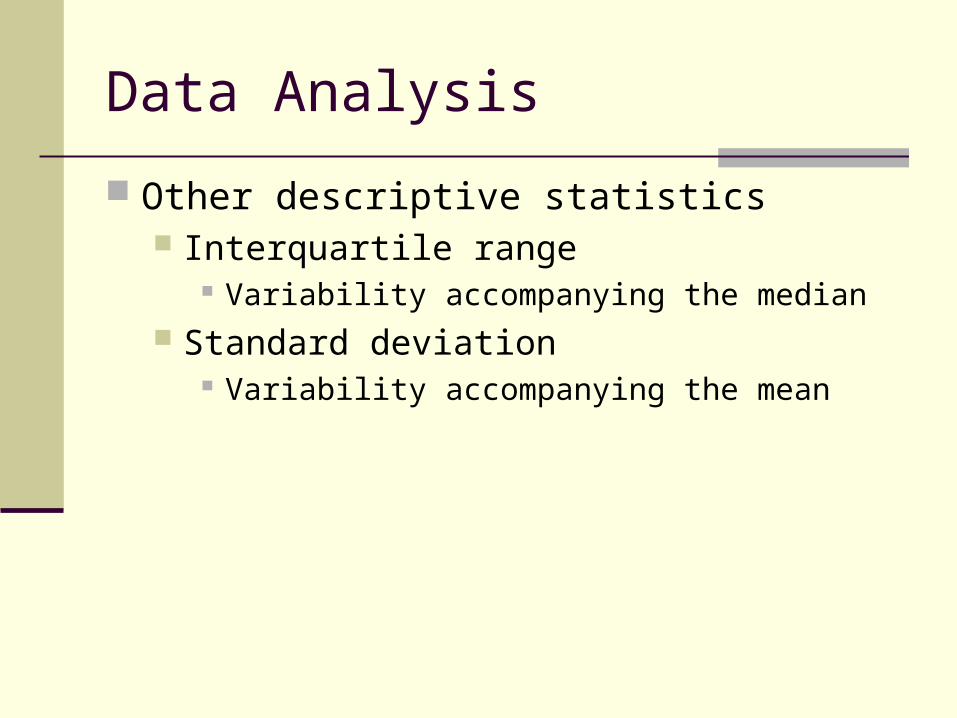
Data Analysis Other descriptive statistics
Interquartile range Variability accompanying the median
Standard deviation Variability accompanying the mean
Correlations Are the variables related?
Determine variables that relate most to your item of interest
Correlate Likert-scale questions with each other
Correlate interval/ratio demographic information (e.g., age) to Likert-scale questions
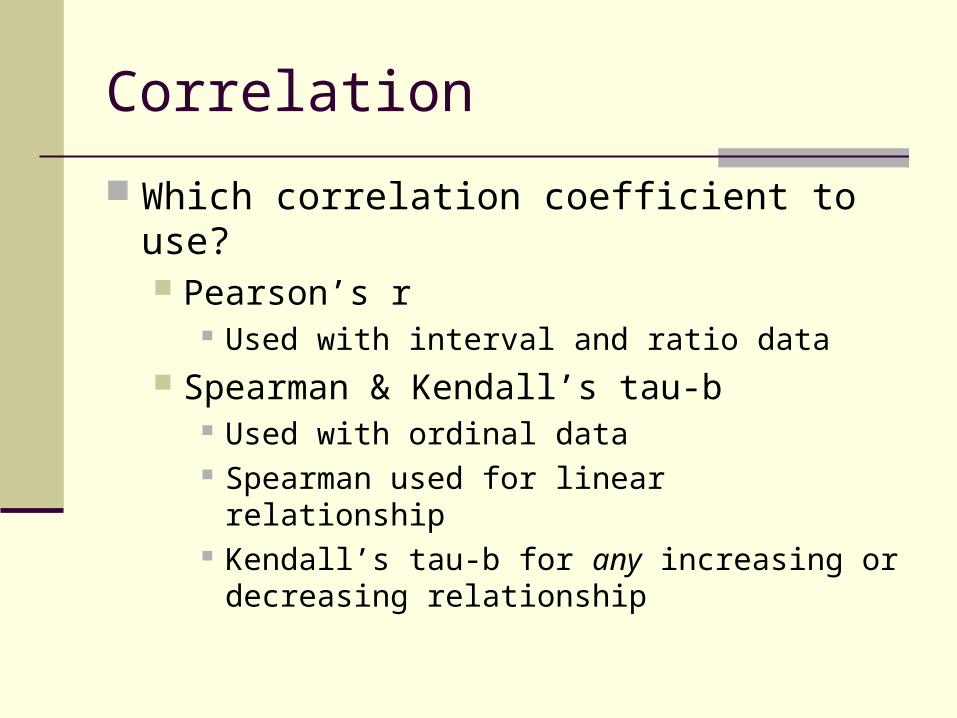
Correlation Which correlation coefficient to use? Pearson’s r
Used with interval and ratio data Spearman & Kendall’s tau-b
Used with ordinal data Spearman used for linear relationship
Kendall’s tau-b for any increasing or decreasing relationship

Mean Differences Are there meaningful differences between groups? class sections instructors on-line vs. off-line courses major vs. non-major
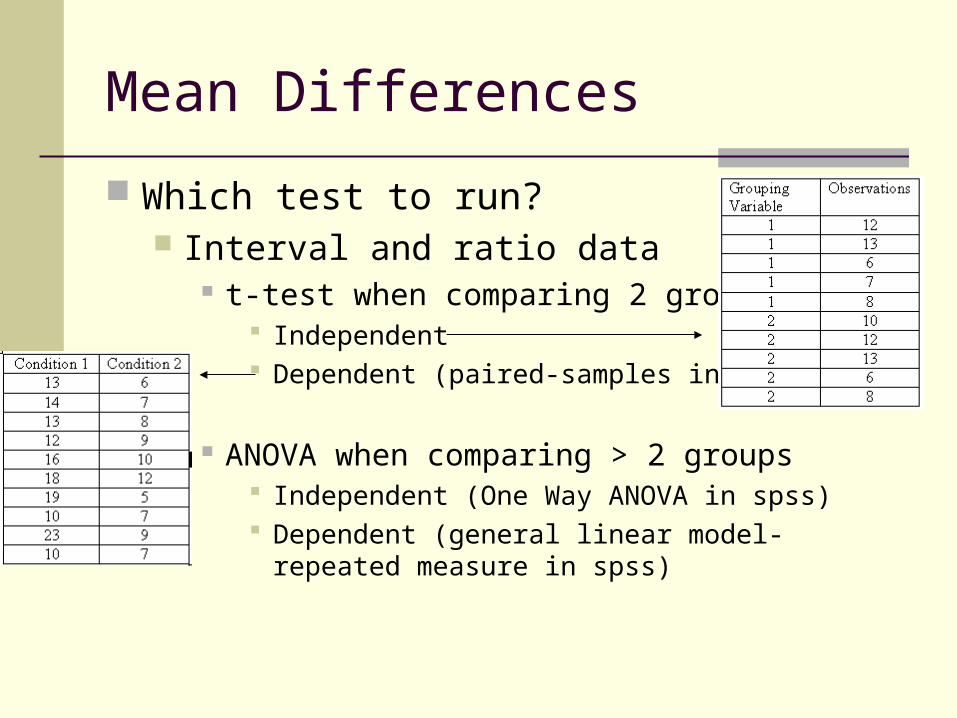
Mean Differences Which test to run?
Interval and ratio data t-test when comparing 2 groups
Independent Dependent (paired-samples in spss)
ANOVA when comparing > 2 groups Independent (One Way ANOVA in spss) Dependent (general linear model-repeated measure in spss)
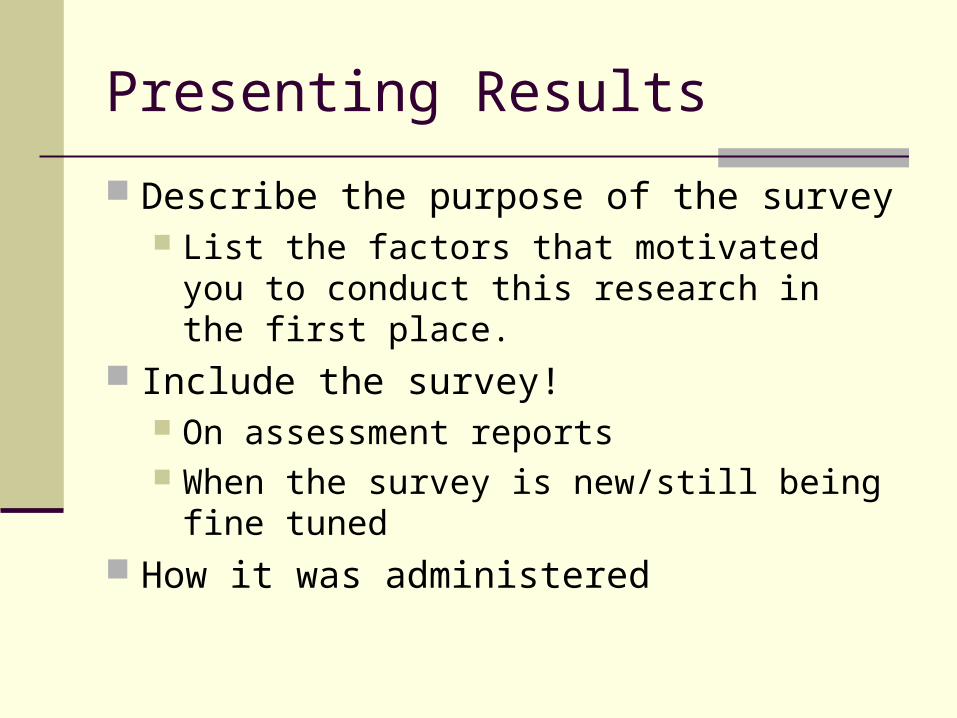
Presenting Results Describe the purpose of the survey
List the factors that motivated you to conduct this research in the first place.
Include the survey! On assessment reports When the survey is new/still being fine tuned
How it was administered
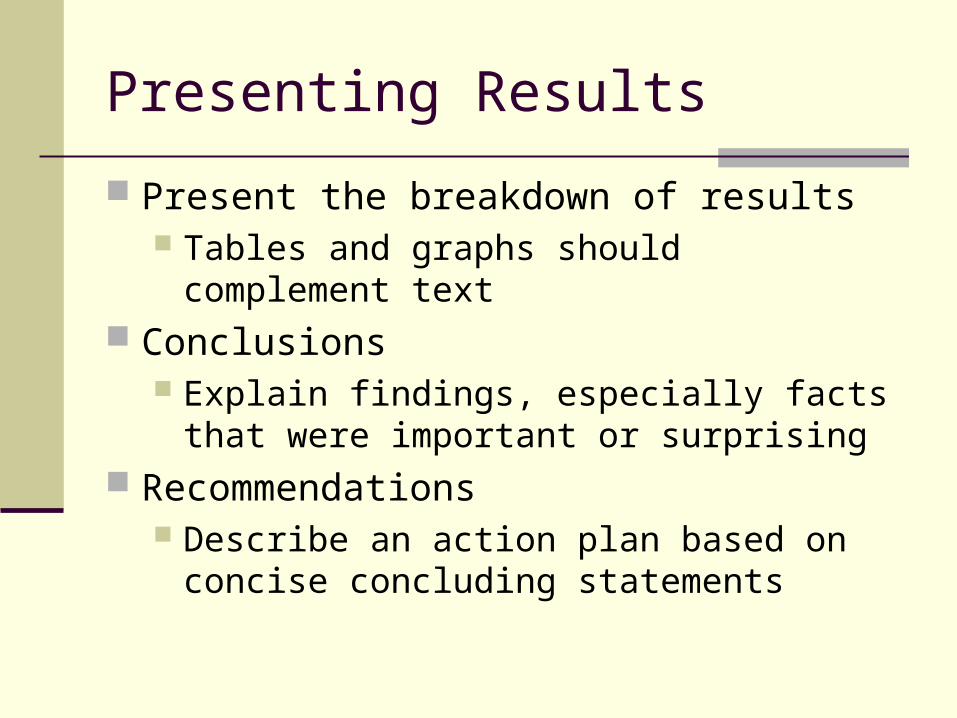
Presenting Results Present the breakdown of results
Tables and graphs should complement text
Conclusions Explain findings, especially facts that were important or surprising
Recommendations Describe an action plan based on concise concluding statements
Presenting Results Share results in formal venues
Familiarize yourself with key findings so that you can mention results at every opportunity
Moving Forward Continuously improve the survey
Delete, add, change questions Evaluate method of administration
Compare results across semesters to look for improvements
Compare with other assessment data for a broader picture