analyzing pathfinder data using virtual reality
TRANSCRIPT
JOURNAL OF GEOPHYSICAL RESEARCH, VOL. 104, NO. E4, PAGES 8889-8906, APRIL 25, 1999
Analyzing Pathfinder data using virtual reality and superresolved imaging
Carol R. Stoker, Eric Zbinden, Theodore T. Blackmon, Bob Kanefsky, Joel Hagen, Charles Neveu, Daryl Rasmussen, Kurt Schwehr, and Michael Sims NASA Ames Research Center, Moffett Field, California
Abstract. The Mars Pathfinder mission used a unique capability to rapidly generate and interactively display three-dimensional (3-D) photorealistic virtual reality (VR) models of the Martian surface. An interactive terrain visualization system creates and renders digital terrain models produced from stereo images taken by the Imager for Mars Pathfinder (IMP) camera. The stereo pipeline, an automated machine vision algorithm, correlates features between the left and right images to determine their disparity and computes the corresponding positions using the known camera geometry. These positions are connected to form a polygonal mesh upon which IMP images are overlaid as textures. During the Pathfinder mission, VR models were produced and displayed almost as fast as images were received. The VR models were viewed using MarsMap, an interface that allows the model to be viewed from any perspective driven by a standard three-button computer mouse. MarsMap incorporates graphical representations of the lander and rover and the sequence and spatial locations at which rover data were taken. Graphical models of the rover were placed in the model to indicate the rover position at the end of each day of the mission. Images taken by Sojourner cameras are projected into the model as 2-D "billboards" to show their proper perspective. Distance and angle measurements can be made on features viewed in the model using a mouse-driven 3-D cursor and a point-and- click interface. MarsMap was used to assist with archiving and planning Sojourner activities and to make detailed measurements of surface features such as wind streaks and
rock size and orientation that are difficult to perform using 2-D images. Superresolution image processing is a computational method for improving image resolution by a factor of n 1/2 by combining n independent images. This technique was used on Pathfinder to obtain better resolved images of Martian surface features. We show results from superresolving IMP camera images of six targets including near- and far-field objects and discuss how the resolution improvement aids interpretation. Similar flood deposits can be seen on both of the Twin Peaks that cannot be resolved in raw images. Millimeter-sized pits are resolved on the rocks Wedge and Halfdome. Other rocks at the Pathfinder site exhibit fine-scale layering that is otherwise invisible. Use of the method resulted in the probable discovery of an artifact of intelligent life on Mars: a part of the Pathfinder spacecraft.
1. Introduction
Pathfinder was the first rover mission to Mars, but it will not be the last. Rover missions are able to perform many of the functions of a field geologist [Stoker, 1996, 1998]. For example, a field geologist is able to look around, construct a mental three-dimensional (3-D) model of the nearby surroundings; perform measurements of nearby objects; determine slopes, strike, and dip of the distant terrain; and construct detailed maps of the region. The geologist also uses binoculars to get improved resolution of distant features, and a hand lens to get improved resolution of close features. In robotic missions, many of these capabilities can be simulated using the down- linked data from the rover and computers to reconstruct mod- els of the terrain. Geologists can interact with these to accom- plish many of the same things they would be able to do in the field.
In this paper we describe the recent application of computer
Copyright 1999 by the American Geophysical Union.
Paper number 1998JE900019. 0148-0227/99/1998JE900019509.00
graphics technologies to the Pathfinder mission. Photo- realistic 3-D models of the terrain surrounding the Pathfinder lander were produced using stereo images from the Imager for Mars Pathfinder (IMP) camera. These 3-D models were dis- played using an interface that allowed seamless real-time ma- nipulation of the data. Using a head-tracked display, a user can experience a feeling of immersion in the 3-D model. Because the model is 3-D, interactive, and immersive, we refer to the model and display system in this paper by the term "virtual reality" or VR [Aukstakalnis and Blather, 1992]. Another tech- nique used on the Pathfinder mission was the automated pro- duction of superresolved images. This technique provided a virtual zoom lens for improved resolution of features of inter- est. Both technologies were used to enhance the understanding of the Martian surface and enabled geologic interpretation and analysis.
From early digital image processing techniques developed during the Viking era [Levinthai et al., 1977; Green, 1977] to our application of photorealistic VR models to the Pathfinder landing site, advances in terrain modeling and visualization have closely followed advances in information technology.
8889
8890 STOKER ET AL.: VIRTUAL REALITY AND SUPERRESOLUTION ON PATHFINDER
Available technologies in the areas of image processing, com- puter graphics hardware and software, visualization, and hu- man-computer interfaces have now reached a maturity level to offer unprecedented capabilities for real-time geographic in- formation systems (GISs) [Jordan, 1996].
The concept of the "digital photo map" was introduced in the early 1970s as a method to augment topographic contour maps used for civil engineering design [Kamiya, 1972]. The advent of digital photogrammetry was quickly followed by de- velopments in automatic stereo correlation algorithms to ob- tain altimetric data from aerial photographs [Kahn et al., 1977; Kelly et al., 1977], distributed processing for the production of digital terrain data [Moellman and Meyer, 1976], and comput- erized measurement systems and drawing aids to help humans extract geological features and analyses from stereo images [Morag, 1974; Real et al., 1974; Johnston and Rosenfeld, 1975]. As early as 1976, image processing techniques had also been developed to enable the reprojection of an aerial photograph with a corresponding elevation data set to produce a stereo mate for stereo visualization [Batson et al., 1976].
The importance of 3-D reconstruction of a scene as an aid to surface mission operations has long been recognized. During the Viking mission, lander camera stereo pairs were displayed using a program called RANGER, which allowed a user to display and move an artificial 3-D cursor through the scene to measure surface features and produce vertical profiles [Liebes and Schwartz, 1977]. These profiles were used to produce a full-scale model of the surface in the vicinity of the lander, which was built in the atrium at the Jet Propulsion Laboratory (JPL, Pasadena, California), thus providing another useful vi- sualization aid.
As computer technology became more powerful through the 1980s, continual improvements were made in the areas of stereo analysis algorithms [Claus, 1984; Herman and Kanade, 1986] and computer graphics [Coquillart and Gangnet, 1984; Kennie and McLaren, 1988] as applied to terrain modeling and visualization. Much of this technology was accelerated by gov- ernment research and development for applications in flight simulators [McLanaghan, 1982; Weber, 1983] and mapping for military intelligence and defense purposes [Faintich, 1986]. More recently, large-scale applications of planetary mapping and synthetic reconstruction of terrain from orbital data sets have come into full fruition [DeJong et al., 1991; Kirk et al., 1992; Batson et al., 1994; Batson and Eliason, 1995; Li et al., 1996].
Also during the mid-1980s, new paradigms for human- computer interaction were being explored [Fisher et al., 1987] that would allow scientists to visualize information with un-
precedented ease and fidelity using the emerging technologies of VR. Recognizing that much of Mars' exploration would likely be done via remote control of planetary rovers [Stoker et al., 1990], NASA established a program in "virtual planetary exploration" to develop and study the use of VR to improve the capabilities of scientists to understand information from robotic exploration vehicles by giving them user interface tools that provide a sense of presence in the remote environment [McGreevy, 1992, 1993]. Related work was also done to develop VR tools as part of the operator interface for controlling such rovers [Stoker et al., 1995; Piguet et al., 1995]. However, because of the necessity of real-time display update rates for VR inter- faces [Liu et al., 1993], such systems typically lacked enough fidelity in the terrain models utilized for display to be useful for scientific purposes.
With recent advances in the rendering power of modern graphics workstations, photorealistic VR interfaces for large- scale GIS data sets have become a reality [Jacobson, 1994]. Several systems have been developed to interface virtual envi- ronment technology with GIS data sets [Grafet al., 1994; Koller et al., 1995; Faust et al., 1996; Neves et al., 1997]. These systems typically render novel perspective views from digital elevation models (DEMs) and images generated by remote sensing tech- niques. Users can thus view, analyze, and interact with their GIS databases in 3-D and in real time. Additional spatial information of scalar quantities as well as 3-D objects such as buildings and vehicles can be inserted into the virtual worlds. However, these systems often rely upon the "two-and-a-half dimensional" representations (made by treating z as a single valued attribute of x, y) found in traditional GIS systems. This can represent a problem when trying to model the full dimen- sional complexity of the world [Raper, 1996]. For example, neither the underhang of a rock nor the ground surface under it can be represented.
For Mars Pathfinder we produced 3-D terrain models of the Martian surface using images from the Imager for Mars Path- finder (IMP) camera [Smith et al., 1997a, b]. IMP images were draped onto the terrain models as textures so that the models looked photorealistic. These models formed the foundation of a powerful new tool for scientific data analysis. The IMP cam- era provided very attractive characteristics for producing 3-D models using automated stereo matching. The relevant IMP characteristics are described by Smith et al. [1997a] and sum- marized by Gaddis et al. [this issue]. The IMP is well- characterized and calibrated and has minimal lens distortion. It
has 15 narrowband filters in wavelengths from 440 to 1100 nm that are used for geological analysis. IMP can also acquire stereo images in three filter sets (440, 670, and 965 nm). The sequences designed for the Pathfinder mission are discussed by Gaddis et al. [this issue]. Immediately after landing, stereo images of the area surrounding the lander base petals were acquired to determine whether the ramps used for rover egress could be successfully deployed. Our first models were con- structed using those images and were used to help determine which side of the lander to send the rover down. Beginning on sol 3, a complete panorama called the "monster pan" was obtained in stereo at 670 nm and downlinked over the next 4
sols. The monster pan formed the basis of 3-D models used during mission operations as discussed in this paper. IMP data were received as 12 bit images then scaled to 8 bits for ease of processing and display on standard monitors.
Kirk et al. [this issue] describe procedures for the production of cartographic products including digital terrain models from IMP images. The advantage of our approach over theirs was that our 3-D models were produced much faster. For example, the monster pan was displayed in VR within 1 hour of receipt of the downlinked data. Another advantage is that the display system we developed is interactive and controllable by the user. Easy-to-use interactive mensuration features are also incorpo- rated in the model. Thus the VR model provided a useful aid to mission operations that was more readily available and ac- cessible than cartographic products produced using more con- ventional methods.
In the sections that follow, we first describe (section 2) the process for creating a photorealistic terrain model from IMP camera images. Next (section 3) we describe MarsMap, the user interface that allowed interaction with the terrain model
and included various mapping and mensuration features. We
STOKER ET AL.: VIRTUAL REALITY AND SUPERRESOLUTION ON PATHFINDER 8891
I Original Stereo Image• r• Preprocessing '•
[Crop and scale Original Stereo •mages] Calibrate and Process Image Intensity ]
A lig n Lefi/•
lst Pass.' Determine Disparity Range ] 2nd Pass:Rough Pixel Disparity value ] 3rd Pass' Fine Pixel Disparity Value ]
I Raw Disparity Map• Raw Disparity Map> /• Disparity Map Filtering 'N
[Remove Low Confidence Disp. Values ] Extrapolate Missing Disp. Values ]
Smooth Disparity Map ]
•CorrectDisp. MapforLensAberatio 5 •:• Filtered Disp. Map>
Dotcloud Creation
Change Reference Frame ] Compute Range from Disparity ]
[ Compute x, y, z Pixel Position ] Create Topological Texture
Dotcloud
Mesh Creation
[ Create Regular Reference Grid ] Create and Validate Triangles ]
[Create and Reference Texture to Mesh ]
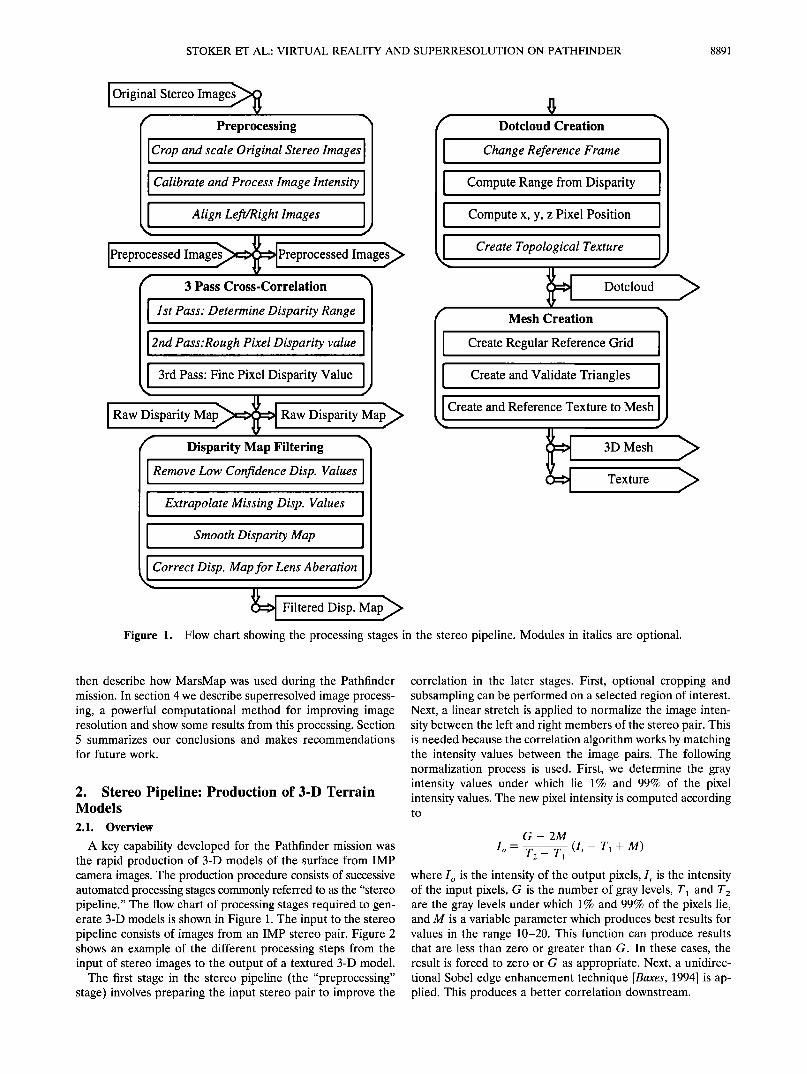
Figure 1. Flow chart showing the processing stages in the stereo pipeline. Modules in italics are optional.
then describe how MarsMap was used during the Pathfinder mission. In section 4 we describe superresolved image process- ing, a powerful computational method for improving image resolution and show some results from this processing. Section 5 summarizes our conclusions and makes recommendations
for future work.
2. Stereo Pipeline: Production of 3-D Terrain Models
2.1. Overview
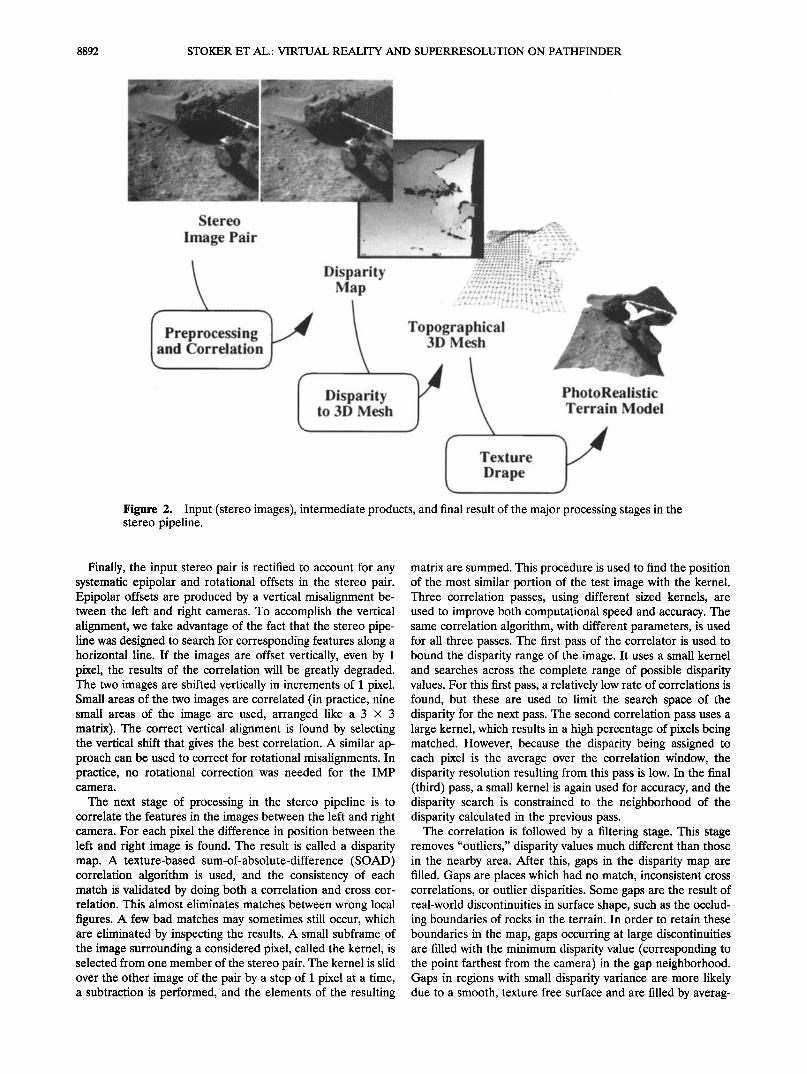
A key capability developed for the Pathfinder mission was the rapid production of 3-D models of the surface from IMP camera images. The production procedure consists of successive automated processing stages commonly referred to as the "stereo pipeline." The flow chart of processing stages required to gen- erate 3-D models is shown in Figure 1. The input to the stereo pipeline consists of images from an IMP stereo pair. Figure 2 shows an example of the different processing steps from the input of stereo images to the output of a textured 3-D model.
The first stage in the stereo pipeline (the "preprocessing" stage) involves preparing the input stereo pair to improve the
correlation in the later stages. First, optional cropping and subsampling can be performed on a selected region of interest. Next, a linear stretch is applied to normalize the image inten- sity between the left and right members of the stereo pair. This is needed because the correlation algorithm works by matching the intensity values between the image pairs. The following normalization process is used. First, we determine the gray intensity values under which lie 1% and 99% of the pixel intensity values. The new pixel intensity is computed according to
G- 2M
Io= T:- T• (I,- T• + M) where I o is the intensity of the output pixels, I i is the intensity of the input pixels, G is the number of gray levels, T• and T 2 are the gray levels under which 1% and 99% of the pixels lie, and M is a variable parameter which produces best results for values in the range 10-20. This function can produce results that are less than zero or greater than G. In these cases, the result is forced to zero or G as appropriate. Next, a unidirec- tional Sobel edge enhancement technique [Baxes, 1994] is ap- plied. This produces a better correlation downstream.
8892 STOKER ET AL.: VIRTUAL REALITY AND SUPERRESOLUTION ON PATHFINDER
'•'•" ' • "•:;•' •' ....-...-..•.5 5.1•<?•..-- •- ß .-- ":' .... ........ .?:3-': • .... :- 5:•: "' .•;.•?...>. ..... : .
.... 'z-. """'::" .... :" •. '7:.. ?v• - .'.
...... •:• •;•..½ ....:..•.. . ....... "•'. v --•.•; 4•,? • .... v. •)•-•
ß ß ß ':'-•.•-"•'•••?'•:•':.'.' ........ .'.......-.--' .... -- :...'•
Image a,r ....
•:•:•?•.½.;•-•;.•.::•:•.• =:•-...•. •-.. •.• .•..--...:•.•=.• k _
/pr.ro .... in Topographical ........ ' !ana Correlation
Disparity PhotoRealistic
to Terrain Model Texture
Drape ....
Figure 2. Input (stereo images), intermediate products, and final result of the major processing stages in the stereo pipeline.
Finally, the input stereo pair is rectified to account for any systematic epipolar and rotational offsets in the stereo pair. Epipolar offsets are produced by a vertical misalignment be- tween the left and right cameras. To accomplish the vertical alignment, we take advantage of the fact that the stereo pipe- line was designed to search for corresponding features along a horizontal line. If the images are offset vertically, even by 1 pixel, the results of the correlation will be greatly degraded. The two images are shifted vertically in increments of 1 pixel. Small areas of the two images are correlated (in practice, nine small areas of the image are used, arranged like a 3 x 3 matrix). The correct vertical alignment is found by selecting the vertical shift that gives the best correlation. A similar ap- proach can be used to correct for rotational misalignments. In practice, no rotational correction was needed for the IMP camera.
The next stage of processing in the stereo pipeline is to correlate the features in the images between the left and right camera. For each pixel the difference in position between the left and right image is found. The result is called a disparity map. A texture-based sum-of-absolute-difference (SOAD) correlation algorithm is used, and the consistency of each match is validated by doing both a correlation and cross cor- relation. This almost eliminates matches between wrong local figures. A few bad matches may sometimes still occur, which are eliminated by inspecting the results. A small subframe of the image surrounding a considered pixel, called the kernel, is selected from one member of the stereo pair. The kernel is slid over the other image of the pair by a step of 1 pixel at a time, a subtraction is performed, and the elements of the resulting
matrix are summed. This procedure is used to find the position of the most similar portion of the test image with the kernel. Three correlation passes, using different sized kernels, are used to improve both computational speed and accuracy. The same correlation algorithm, with different parameters, is used for all three passes. The first pass of the correlator is used to bound the disparity range of the image. It uses a small kernel and searches across the complete range of possible disparity values. For this first pass, a relatively low rate of correlations is found, but these are used to limit the search space of the disparity for the next pass. The second correlation pass uses a large kernel, which results in a high percentage of pixels being matched. However, because the disparity being assigned to each pixel is the average over the correlation window, the disparity resolution resulting from this pass is low. In the final (third) pass, a small kernel is again used for accuracy, and the disparity search is constrained to the neighborhood of the disparity calculated in the previous pass.
The correlation is followed by a filtering stage. This stage removes "outliers," disparity values much different than those in the nearby area. After this, gaps in the disparity map are filled. Gaps are places which had no match, inconsistent cross correlations, or outlier disparities. Some gaps are the result of real-world discontinuities in surface shape, such as the occlud- ing boundaries of rocks in the terrain. In order to retain these boundaries in the map, gaps occurring at large discontinuities are filled with the minimum disparity value (corresponding to the point farthest from the camera) in the gap neighborhood. Gaps in regions with small disparity variance are more likely due to a smooth, texture free surface and are filled by averag-
STOKER ET AL.: VIRTUAL REALITY AND SUPERRESOLUTION ON PATHFINDER 8893
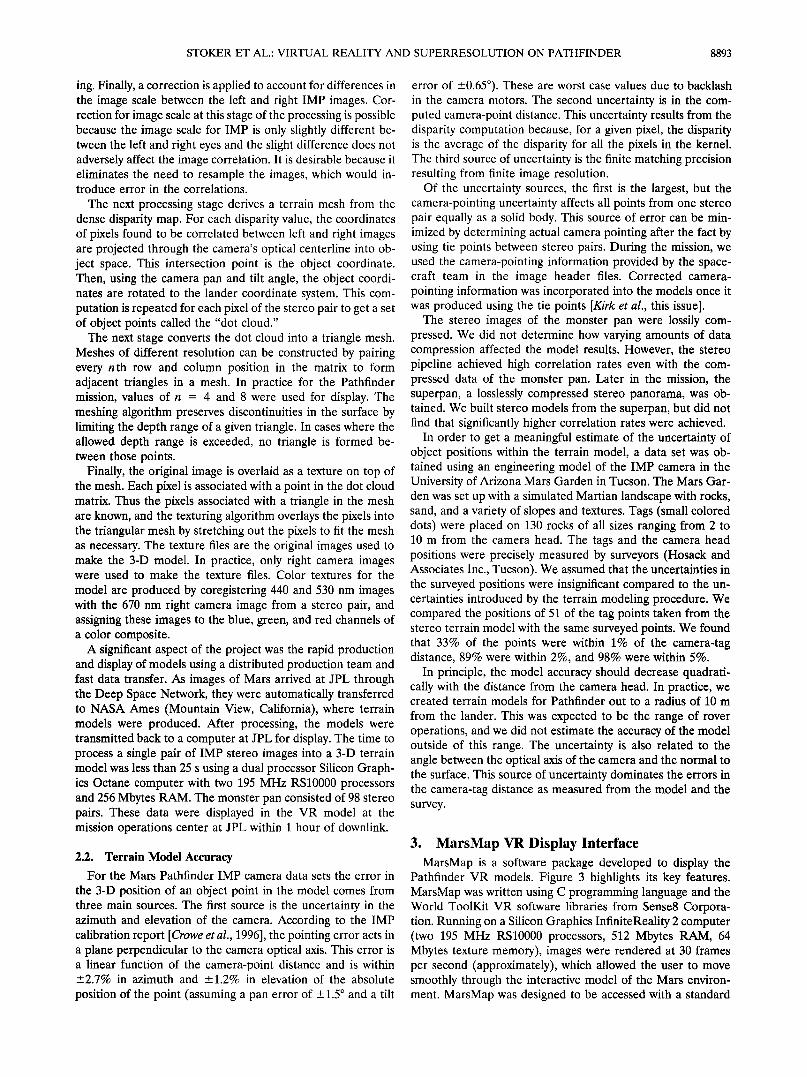
ing. Finally, a correction is applied to account for differences in the image scale between the left and right IMP images. Cor- rection for image scale at this stage of the processing is possible because the image scale for IMP is only slightly different be- tween the left and right eyes and the slight difference does not adversely affect the image correlation. It is desirable because it eliminates the need to resample the images, which would in- troduce error in the correlations.
The next processing stage derives a terrain mesh from the dense disparity map. For each disparity value, the coordinates of pixels found to be correlated between left and right images are projected through the camera's optical centerline into ob- ject space. This intersection point is the object coordinate. Then, using the camera pan and tilt angle, the object coordi- nates are rotated to the lander coordinate system. This com- putation is repeated for each pixel of the stereo pair to get a set of object points called the "dot cloud."
The next stage converts the dot cloud into a triangle mesh. Meshes of different resolution can be constructed by pairing every n th row and column position in the matrix to form adjacent triangles in a mesh. In practice for the Pathfinder mission, values of n = 4 and 8 were used for display. The meshing algorithm preserves discontinuities in the surface by limiting the depth range of a given triangle. In cases where the allowed depth range is exceeded, no triangle is formed be- tween those points.
Finally, the original image is overlaid as a texture on top of the mesh. Each pixel is associated with a point in the dot cloud matrix. Thus the pixels associated with a triangle in the mesh are known, and the texturing algorithm overlays the pixels into the triangular mesh by stretching out the pixels to fit the mesh as necessary. The texture files are the original images used to make the 3-D model. In practice, only right camera images were used to make the texture files. Color textures for the
model are produced by coregistering 440 and 530 nm images with the 670 nm right camera image from a stereo pair, and assigning these images to the blue, green, and red channels of a color composite.
A significant aspect of the project was the rapid production and display of models using a distributed production team and fast data transfer. As images of Mars arrived at JPL through the Deep Space Network, they were automatically transferred to NASA Ames (Mountain View, California), where terrain models were produced. After processing, the models were transmitted back to a computer at JPL for display. The time to process a single pair of IMP stereo images into a 3-D terrain model was less than 25 s using a dual processor Silicon Graph- ics Octane computer with two 195 MHz RS10000 processors and 256 Mbytes RAM. The monster pan consisted of 98 stereo pairs. These data were displayed in the VR model at the mission operations center at JPL within 1 hour of downlink.
2.2. Terrain Model Accuracy For the Mars Pathfinder IMP camera data sets the error in
the 3-D position of an object point in the model comes from three main sources. The first source is the uncertainty in the azimuth and elevation of the camera. According to the IMP calibration report [Crowe et al., 1996], the pointing error acts in a plane perpendicular to the camera optical axis. This error is a linear function of the camera-point distance and is within _+2.7% in azimuth and _+1.2% in elevation of the absolute
position of the point (assuming a pan error of _+ 1.5 ø and a tilt
error of _+0.65ø). These are worst case values due to backlash in the camera motors. The second uncertainty is in the com- puted camera-point distance. This uncertainty results from the disparity computation because, for a given pixel, the disparity is the average of the disparity for all the pixels in the kernel. The third source of uncertainty is the finite matching precision resulting from finite image resolution.
Of the uncertainty sources, the first is the largest, but the camera-pointing uncertainty affects all points from one stereo pair equally as a solid body. This source of error can be min- imized by determining actual camera pointing after the fact by using tie points between stereo pairs. During the mission, we used the camera-pointing information provided by the space- craft team in the image header files. Corrected camera- pointing information was incorporated into the models once it was produced using the tie points [Kirk et al., this issue].
The stereo images of the monster pan were lossily com- pressed. We did not determine how varying amounts of data compression affected the model results. However, the stereo pipeline achieved high correlation rates even with the com- pressed data of the monster pan. Later in the mission, the superpan, a losslessly compressed stereo panorama, was ob- tained. We built stereo models from the superpan, but did not find that significantly higher correlation rates were achieved.
In order to get a meaningful estimate of the uncertainty of object positions within the terrain model, a data set was ob- tained using an engineering model of the IMP camera in the University of Arizona Mars Garden in Tucson. The Mars Gar- den was set up with a simulated Martian landscape with rocks, sand, and a variety of slopes and textures. Tags (small colored dots) were placed on 130 rocks of all sizes ranging from 2 to 10 m from the camera head. The tags and the camera head positions were precisely measured by surveyors (Hosack and Associates Inc., Tucson). We assumed that the uncertainties in the surveyed positions were insignificant compared to the un- certainties introduced by the terrain modeling procedure. We compared the positions of 51 of the tag points taken from the stereo terrain model with the same surveyed points. We found that 33% of the points were within 1% of the camera-tag distance, 89% were within 2%, and 98% were within 5%.
In principle, the model accuracy should decrease quadrati- cally with the distance from the camera head. In practice, we created terrain models for Pathfinder out to a radius of 10 m
from the lander. This was expected to be the range of rover operations, and we did not estimate the accuracy of the model outside of this range. The uncertainty is also related to the angle between the optical axis of the camera and the normal to the surface. This source of uncertainty dominates the errors in the camera-tag distance as measured from the model and the survey.
3. MarsMap VR Display Interface MarsMap is a software package developed to display the
Pathfinder VR models. Figure 3 highlights its key features. MarsMap was written using C programming language and the World ToolKit VR software libraries from Sense8 Corpora- tion. Running on a Silicon Graphics InfiniteReality 2 computer (two 195 MHz RS10000 processors, 512 Mbytes RAM, 64 Mbytes texture memory), images were rendered at 30 frames per second (approximately), which allowed the user to move smoothly through the interactive model of the Mars environ- ment. MarsMap was designed to be accessed with a standard
8894 STOKER ET AL.' VIRTUAL REALITY AND SUPERRESOLUTION ON PATHFINDER
-y
A15
(+Y)
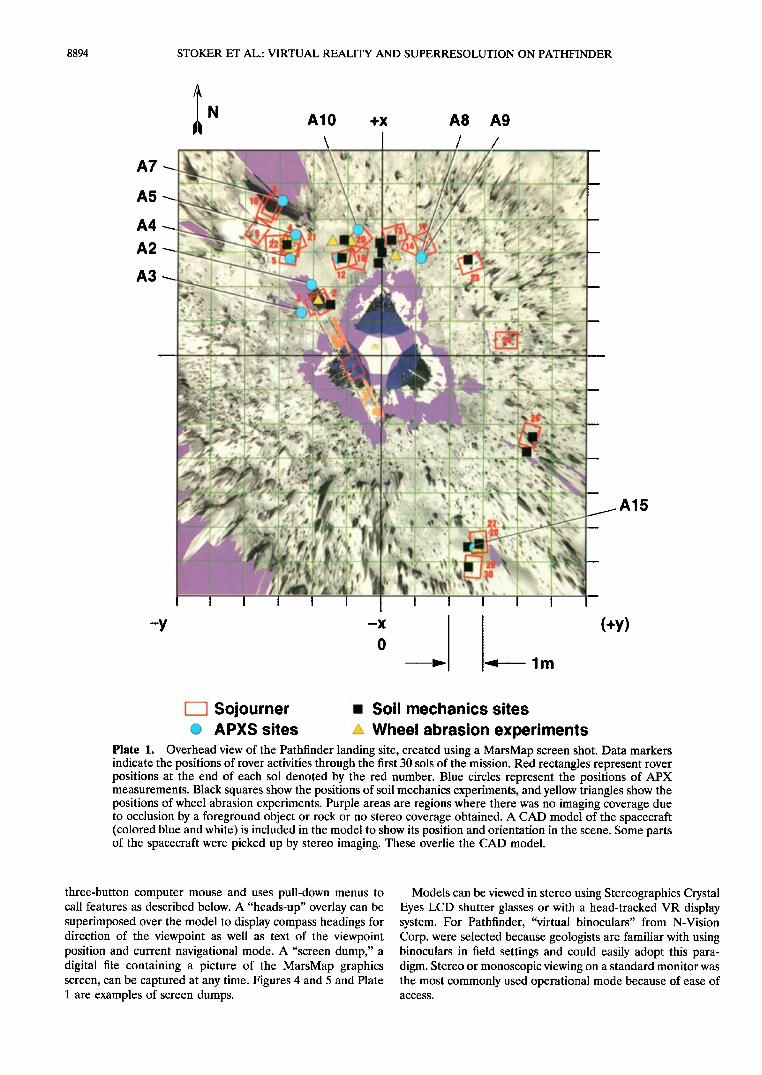
Sojourner a Soil mechanics sites APXS sites Wheel abrasion experiments
Plate 1. Overhead view of the Pathfinder landing site, created using a MarsMap screen shot. Data markers indicate the positions of rover activities through the first 30 sols of the mission. Red rectangles represent rover positions at the end of each sol denoted by the red number. Blue circles represent the positions of APX measurements. Black squares show the positions of soil mechanics experiments, and yellow triangles show the positions of wheel abrasion experiments. Purple areas are regions where there was no imaging coverage due to occlusion by a foreground object or rock or no stereo coverage obtained. A CAD model of the spacecraft (colored blue and white) is included in the model to show its position and orientation in the scene. Some parts of the spacecraft were picked up by stereo imaging. These overlie the CAD model.
three-button computer mouse and uses pull-down menus to call features as described below. A "heads-up" overlay can be superimposed over the model to display compass headings for direction of the viewpoint as well as text of the viewpoint position and current navigational mode. A "screen dump," a digital file containing a picture of the MarsMap graphics screen, can be captured at any time. Figures 4 and 5 and Plate 1 are examples of screen dumps.
Models can be viewed in stereo using Stereographics Crystal Eyes LCD shutter glasses or with a head-tracked VR display system. For Pathfinder, "virtual binoculars" from N-Vision Corp. were selected because geologists are familiar with using binoculars in field settings and could easily adopt this para- digm. Stereo or monoscopic viewing on a standard monitor was the most commonly used operational mode because of ease of access.
STOKER ET AL.: VIRTUAL REALITY AND SUPERRESOLUTION ON PATHFINDER 8895
Interactive
Navigation
Rover hnage Display
MarsMap VR Interface
Feature
Mission Mission
Archive Planning
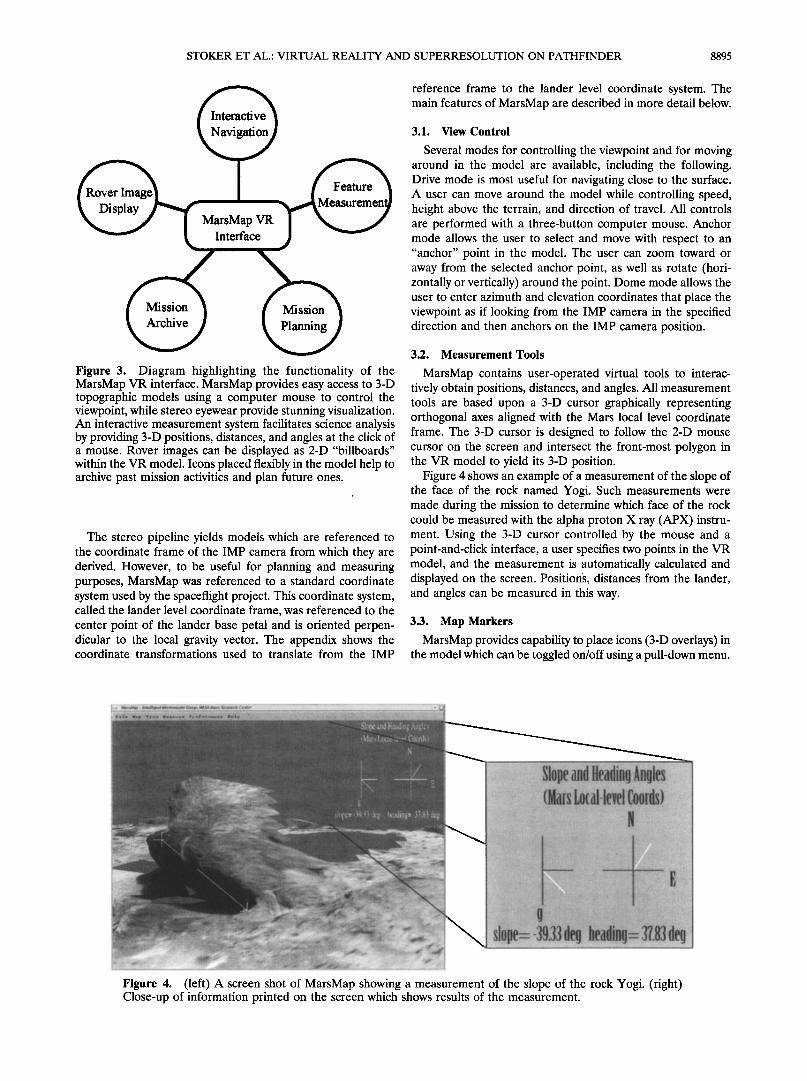
Figure 3. Diagram highlighting the functionality of the MarsMap VR interface. MarsMap provides easy access to 3-D topographic models using a computer mouse to control the viewpoint, while stereo eyewear provide stunning visualization. An interactive measurement system facilitates science analysis by providing 3-D positions, distances, and angles at the click of a mouse. Rover images can be displayed as 2-D "billboards" within the VR model. Icons placed flexibly in the model help to archive past mission activities and plan future ones.
The stereo pipeline yields models which are referenced to the coordinate frame of the IMP camera from which they are derived. However, to be useful for planning and measuring purposes, MarsMap was referenced to a standard coordinate system used by the spaceflight project. This coordinate system, called the lander level coordinate frame, was referenced to the
center point of the lander base petal and is oriented perpen- dicular to the local gravity vector. The appendix shows the coordinate transformations used to translate from the IMP
reference frame to the lander level coordinate system. The main features of MarsMap are described in more detail below.
3.1. View Control
Several modes for controlling the viewpoint and for moving around in the model are available, including the following. Drive mode is most useful for navigating close to the surface. A user can move around the model while controlling speed, height above the terrain, and direction of travel. All controls are performed with a three-button computer mouse. Anchor mode allows the user to select and move with respect to an "anchor" point in the model. The user can zoom toward or away from the selected anchor point, as well as rotate (hori- zontally or vertically) around the point. Dome mode allows the user to enter azimuth and elevation coordinates that place the viewpoint as if looking from the IMP camera in the specified direction and then anchors on the IMP camera position.
3.2. Measurement Tools
MarsMap contains user-operated virtual tools to interac- tively obtain positions, distances, and angles. All measurement tools are based upon a 3-D cursor graphically representing orthogonal axes aligned with the Mars local level coordinate frame. The 3-D cursor is designed to follow the 2-D mouse cursor on the screen and intersect the front-most polygon in the VR model to yield its 3-D position.
Figure 4 shows an example of a measurement of the slope of the face of the rock named Yogi. Such measurements were made during the mission to determine which face of the rock could be measured with the alpha proton X ray (APX) instru- ment. Using the 3-D cursor controlled by the mouse and a point-and-click interface, a user specifies two points in the VR model, and the measurement is automatically calculated and displayed on the screen. Positions, distances from the lander, and angles can be measured in this way.
3.3. Map Markers
MarsMap provides capability to place icons (3-D overlays) in the model which can be toggled on/off using a pull-down menu.
..
Figure 4. (left) A screen shot of MarsMap showing a measurement of the slope of the rock Yogi. (right) Close-up of information printed on the screen which shows results of the measurement.
8896 STOKER ET AL.: VIRTUAL REALITY AND SUPERRESOLUTION ON PATHFINDER
(a) (b)
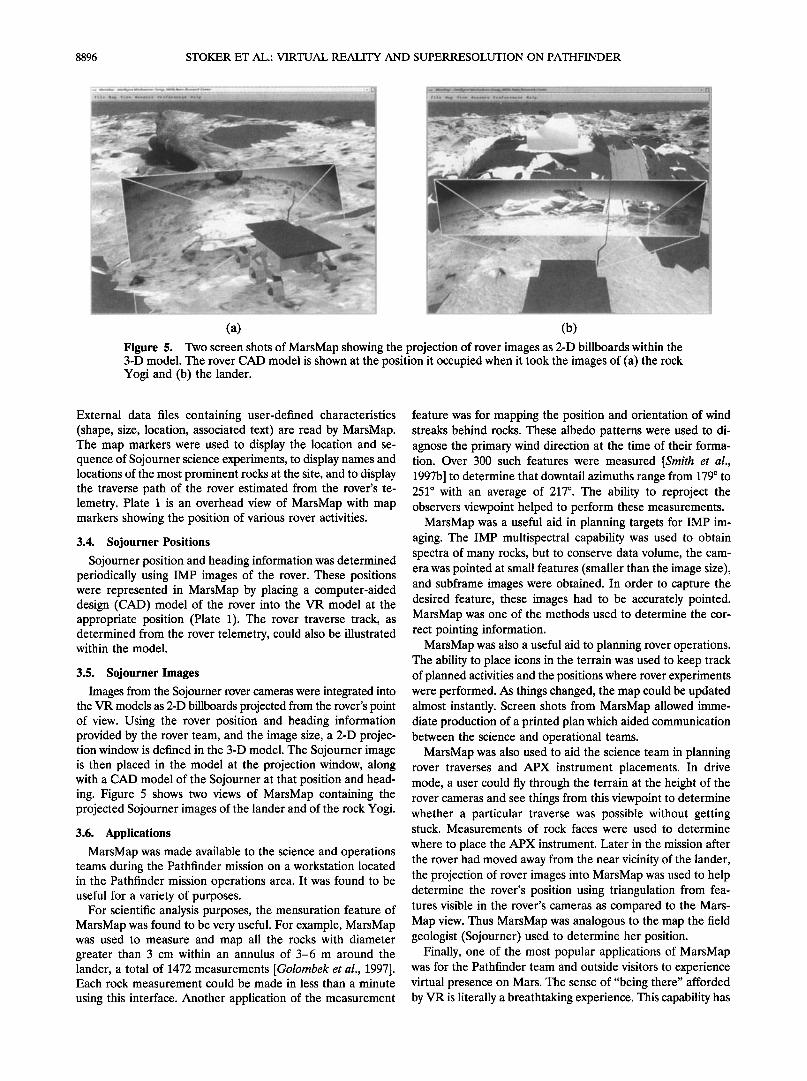
Figure 5. Two screen shots of MarsMap showing the projection of rover images as 2-D billboards within the 3-D model. The rover CAD model is shown at the position it occupied when it took the images of (a) the rock Yogi and (b) the lander.
External data files containing user-defined characteristics (shape, size, location, associated text) are read by MarsMap. The map markers were used to display the location and se- quence of Sojourner science experiments, to display names and locations of the most prominent rocks at the site, and to display the traverse path of the rover estimated from the rover's te- lemetry. Plate 1 is an overhead view of MarsMap with map markers showing the position of various rover activities.
3.4. Sojourner Positions
Sojourner position and heading information was determined periodically using IMP images of the rover. These positions were represented in MarsMap by placing a computer-aided design (CAD) model of the rover into the VR model at the appropriate position (Plate 1). The rover traverse track, as determined from the rover telemetry, could also be illustrated within the model.
3.5. Sojourner Images
Images from the Sojourner rover cameras were integrated into the VR models as 2-D billboards projected from the rover's point of view. Using the rover position and heading information provided by the rover team, and the image size, a 2-D projec- tion window is defined in the 3-D model. The Sojourner image is then placed in the model at the projection window, along with a CAD model of the Sojourner at that position and head- ing. Figure 5 shows two views of MarsMap containing the projected Sojourner images of the lander and of the rock Yogi.
3.6. Applications
MarsMap was made available to the science and operations teams during the Pathfinder mission on a workstation located in the Pathfinder mission operations area. It was found to be useful for a variety of purposes.
For scientific analysis purposes, the mensuration feature of MarsMap was found to be very useful. For example, MarsMap was used to measure and map all the rocks with diameter greater than 3 cm within an annulus of 3-6 m around the lander, a total of 1472 measurements [Golombek et al., 1997]. Each rock measurement could be made in less than a minute
using this interface. Another application of the measurement
feature was for mapping the position and orientation of wind streaks behind rocks. These albedo patterns were used to di- agnose the primary wind direction at the time of their forma- tion. Over 300 such features were measured [Smith et al., 1997b] to determine that downtail azimuths range from 179 ø to 251 ø with an average of 217 ø. The ability to reproject the observers viewpoint helped to perform these measurements.
MarsMap was a useful aid in planning targets for IMP im- aging. The IMP multispectral capability was used to obtain spectra of many rocks, but to conserve data volume, the cam- era was pointed at small features (smaller than the image size), and subframe images were obtained. In order to capture the desired feature, these images had to be accurately pointed. MarsMap was one of the methods used to determine the cor- rect pointing information.
MarsMap was also a useful aid to planning rover operations. The ability to place icons in the terrain was used to keep track of planned activities and the positions where rover experiments were performed. As things changed, the map could be updated almost instantly. Screen shots from MarsMap allowed imme- diate production of a printed plan which aided communication between the science and operational teams.
MarsMap was also used to aid the science team in planning rover traverses and APX instrument placements. In drive mode, a user could fly through the terrain at the height of the rover cameras and see things from this viewpoint to determine whether a particular traverse was possible without getting stuck. Measurements of rock faces were used to determine
where to place the APX instrument. Later in the mission after the rover had moved away from the near vicinity of the lander, the projection of rover images into MarsMap was used to help determine the rover's position using triangulation from fea- tures visible in the rover's cameras as compared to the Mars- Map view. Thus MarsMap was analogous to the map the field geologist (Sojourner) used to determine her position.
Finally, one of the most popular applications of MarsMap was for the Pathfinder team and outside visitors to experience virtual presence on Mars. The sense of "being there" afforded by VR is literally a breathtaking experience. This capability has
STOKER ET AL.: VIRTUAL REALITY AND SUPERRESOLUTION ON PATHFINDER 8897
important applications for sharing the experience of Mars ex- ploration with the public.
4. Superresolved Imaging 4.1. Description
Superresolved image processing is an image analysis tech- nique for producing improved image resolution by combining data from multiple independent, but essentially identical, lower resolution images. The theory behind the method is described in detail by Cheeseman [1996]. The superresolution algorithm takes advantage of the fact that each image is an independent sample of the same scene, and so the scene is oversampled. The pixels from each image do not exactly over- lay each other, and thus they sample the scene differently. In the case of IMP, the pointing imprecision happens to be fairly large, of the order of 10 pixels, but even a motion of the order of 1 pixel would suffice. The key is for the range of possible fractional pixel motions to be sampled randomly. The auto- mated superresolution algorithm first co-registers the indepen- dent images, which ideally differ only in the way the pixels are sampled, and then averages them. It then attempts to invert the point spread function introduced by the camera by using an iterative deconvolution process inspired by Bayesian theory. Finally, it reregisters the original inputs against the sharper result to attain a more precise registration, and repeats the whole process several times to converge on a final output. The theoretical improvement in resolution achievable by the method is a factor of rt 1/2, where n is the number of input images. Thus the cost in data volume is equivalent to imaging the same area through a zoom lens with this magnification power. Previously, the algorithm was applied only to historical data archives such as repeated images of the same area taken by the Viking orbiter for the purpose of imaging cloud mo- tions, overlapping areas in Viking mosaics, and Galileo images of Gaspera. The Pathfinder mission was the first time the algorithm was used with images deliberately acquired for the purpose of improving resolution.
To evaluate the usefulness of superresolution methods on the Mars Pathfinder mission prior to landing on Mars, a set of test images were acquired using the IMP camera engineering model located in the University of Arizona Mars Garden. The superresolution algorithm was used on these test images and yielded promising results. On the basis of these preliminary results, the Geomorphology Science Operations Group (GeoSOG) on Pathfinder decided to use the technique on Mars to obtain improved resolution of interesting features seen in the IMP images.
Superresolution required special image sequences for opti- mal results. For the Pathfinder mission, our approach was to obtain a large number of images (normally, 25 images were acquired of each target) with the camera commanded to move between images. Using an analysis of premission tests of the method from the engineering model of the IMP, and taking into account the characteristics of the IMP drive motor, we found that the best results were obtained if the camera was
moved in both azimuth and elevation and then commanded to
return to a position one to two motor steps away from the previous position. This caused the target to appear on a dif- ferent part of the CCD in each image. This not only assured motion between pointing, giving independent samples, it also had the benefit of averaging out any camera blemishes and CCD defects. Images were acquired uncompressed to elimi-
nate any concern that data compression might alter subpixel information. To limit data volume, sequences were designed to acquire subframe images containing only the desired target. While the full resolution of the IMP camera was 12 bits, the raw images were initially provided as 8 bit data, and only these were used to produce the superresolved images. In each se- quence, a set of images was obtained in each of the color channels (red, green, blue) that would allow the superresolved images to be colorized after the superresolution processing was performed.
The superresolution process was almost entirely automated. The generation of a command to the spacecraft to point the camera and obtain images was a semiautomated process. The user filled out a questionnaire to provide image pointing and desired image time, from which a sequence was automatically created to send to the spacecraft. The program periodically checked to see whether the data were received, and upon receipt, all the steps for producing a superresolved result were performed without human oversight. The algorithm first co- registered the input images, averaged them, inverted the point spread function of the lens, reregistered the inputs against the result and iterated to a solution, then wrote the resulting image file to a Web page, where it could be viewed along with an example input image.
The processed images were consistently an improvement over the input images, often a dramatic one. In all, 19 super- resolution sequences of nine targets were received and pro- cessed. The figures that follow show six illustrative results. All superresolved images produced are archived on the Pathfinder CD-ROM set and in the Planetary Data System.
Figures 6 and 7 show the results from the superresolved imaging of the northern and southern members of the prom- inent horizon features known as the Twin Peaks. The North
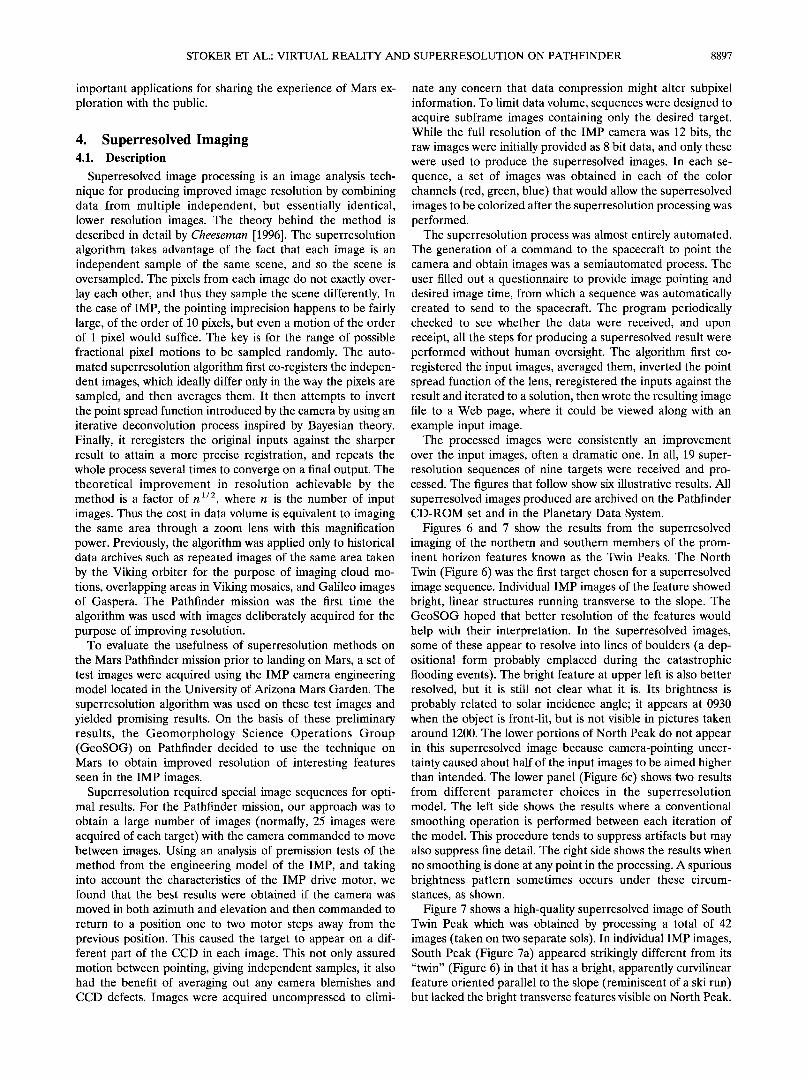
Twin (Figure 6) was the first target chosen for a superresolved image sequence. Individual IMP images of the feature showed bright, linear structures running transverse to the slope. The GeoSOG hoped that better resolution of the features would help with their interpretation. In the superresolved images, some of these appear to resolve into lines of boulders (a dep- ositional form probably emplaced during the catastrophic flooding events). The bright feature at upper left is also better resolved, but it is still not clear what it is. Its brightness is probably related to solar incidence angle; it appears at 0930 when the object is front-lit, but is not visible in pictures taken around 1200. The lower portions of North Peak do not appear in this superresolved image because camera-pointing uncer- tainty caused about half of the input images to be aimed higher than intended. The lower panel (Figure 6c) shows two results from different parameter choices in the superresolution model. The left side shows the results where a conventional
smoothing operation is performed between each iteration of the model. This procedure tends to suppress artifacts but may also suppress fine detail. The right side shows the results when no smoothing is done at any point in the processing. A spurious brightness pattern sometimes occurs under these circum- stances, as shown.
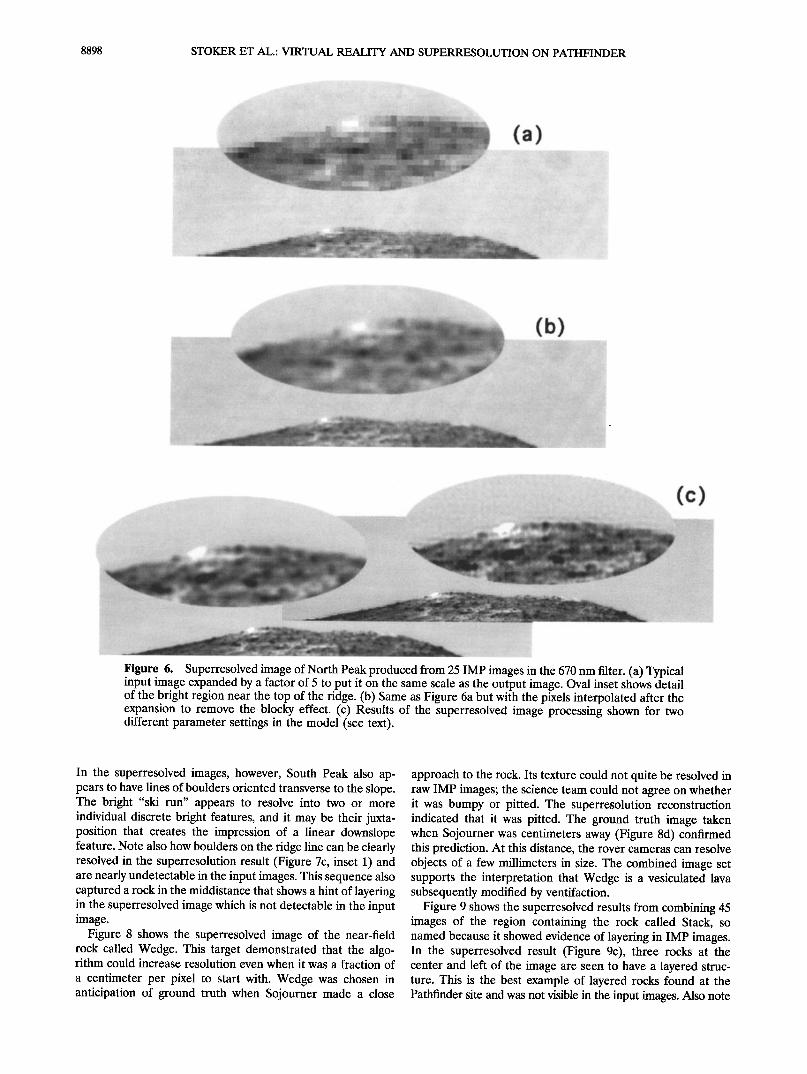
Figure 7 shows a high-quality superresolved image of South Twin Peak which was obtained by processing a total of 42 images (taken on two separate sols). In individual IMP images, South Peak (Figure 7a) appeared strikingly different from its "twin" (Figure 6) in that it has a bright, apparently curvilinear feature oriented parallel to the slope (reminiscent of a ski run) but lacked the bright transverse features visible on North Peak.
8898 STOKER ET AL.' VIRTUAL REALITY AND SUPERRESOLUTION ON PATHFINDER
(b)
(c)
Figure 6. Superresolved image of North Peak produced from 25 IMP images in the 670 nm filter. (a) Typical input image expanded by a factor of 5 to put it on the same scale as the output image. Oval inset shows detail of the bright region near the top of the ridge. (b) Same as Figure 6a but with the pixels interpolated after the expansion to remove the blocky effect. (c) Results of the superresolved image processing shown for two different parameter settings in the model (see text).
In the superresolved images, however, South Peak also ap- pears to have lines of boulders oriented transverse to the slope. The bright "ski run" appears to resolve into two or more individual discrete bright features, and it may be their juxta- position that creates the impression of a linear downslope feature. Note also how boulders on the ridge line can be clearly resolved in the superresolution result (Figure 7c, inset 1) and are nearly undetectable in the input images. This sequence also captured a rock in the middistance that shows a hint of layering in the superresolved image which is not detectable in the input image.
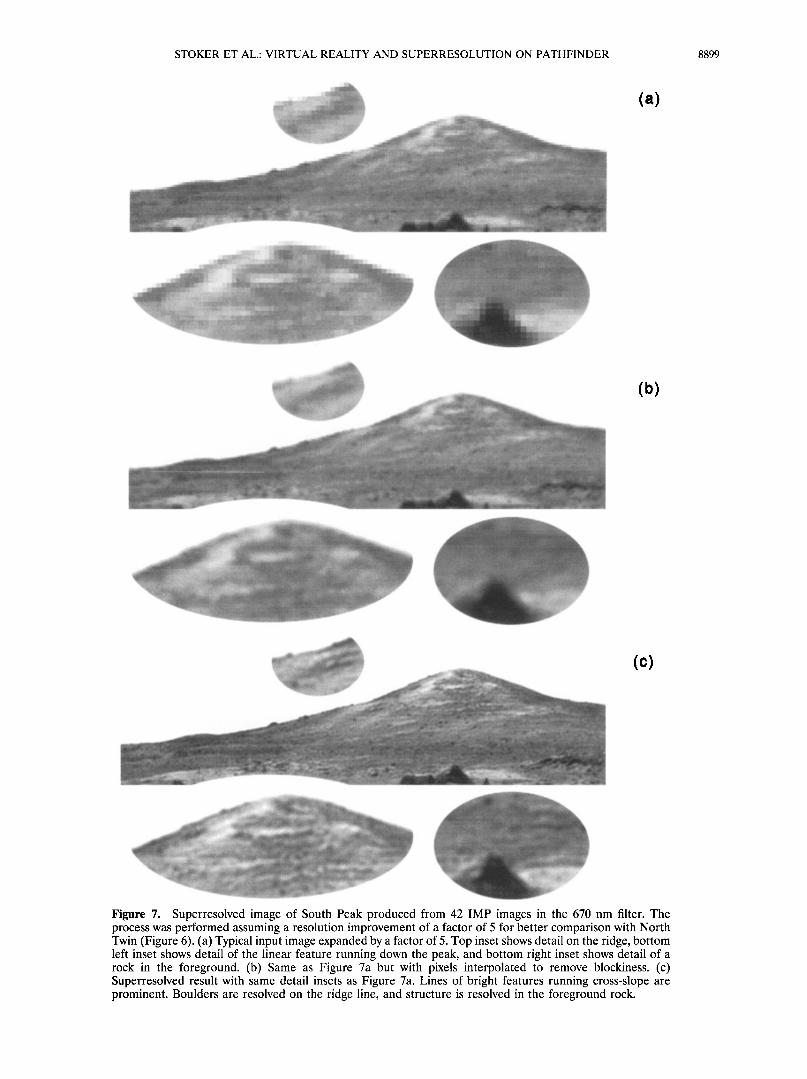
Figure 8 shows the superresolved image of the near-field rock called Wedge. This target demonstrated that the algo- rithm could increase resolution even when it was a fraction of
a centimeter per pixel to start with. Wedge was chosen in anticipation of ground truth when Sojourner made a close
approach to the rock. Its texture could not quite be resolved in raw IMP images; the science team could not agree on whether it was bumpy or pitted. The superresolution reconstruction indicated that it was pitted. The ground truth image taken when Sojourner was centimeters away (Figure 8d) confirmed this prediction. At this distance, the rover cameras can resolve objects of a few millimeters in size. The combined image set supports the interpretation that Wedge is a vesiculated lava subsequently modified by ventifaction.
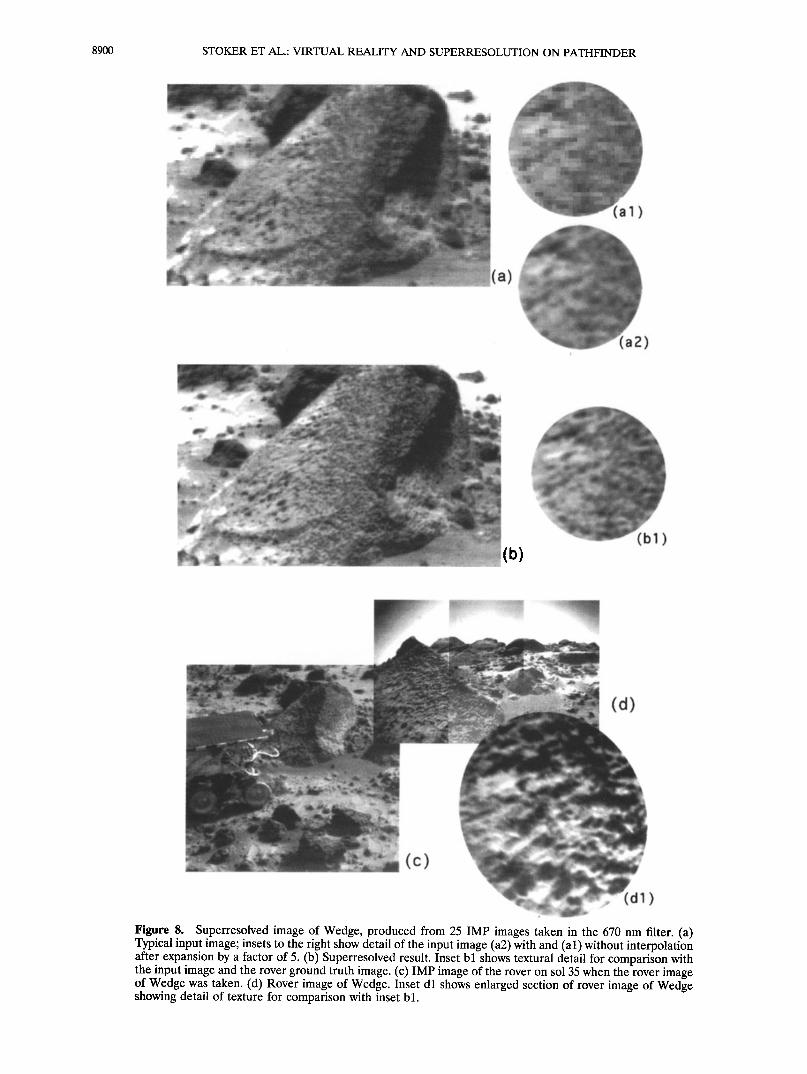
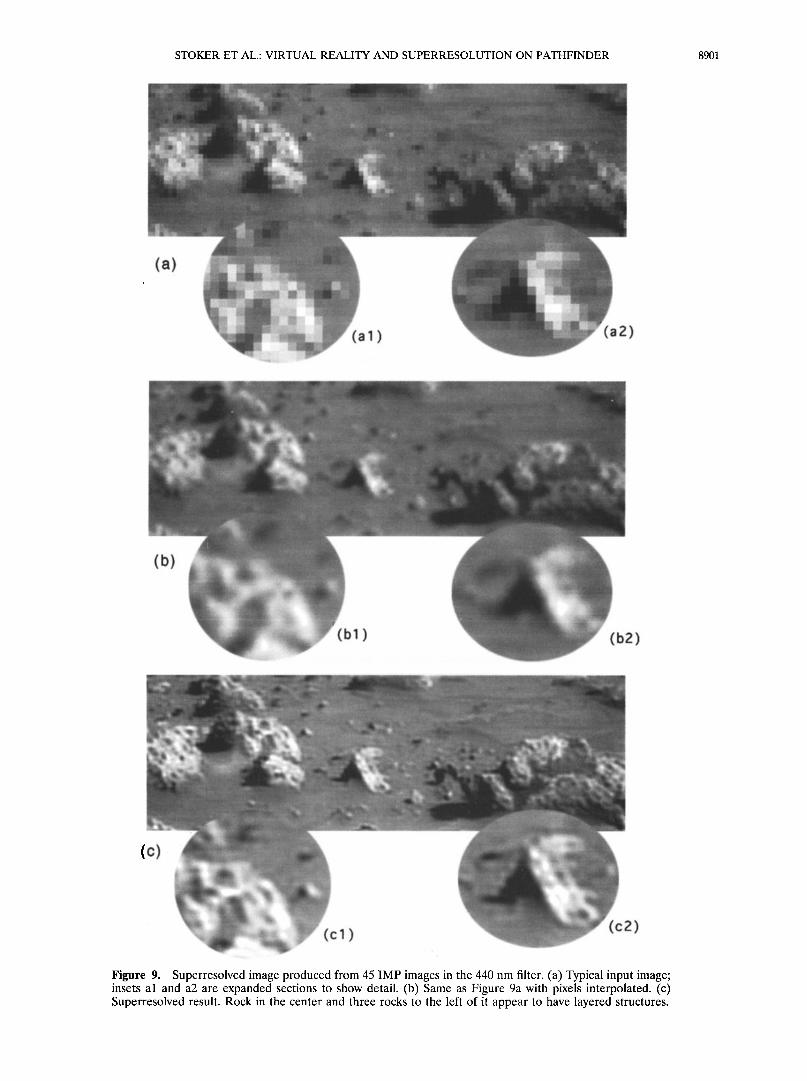
Figure 9 shows the superresolved results from combining 45 images of the region containing the rock called Stack, so named because it showed evidence of layering in IMP images. In the superresolved result (Figure 9c), three rocks at the center and left of the image are seen to have a layered struc- ture. This is the best example of layered rocks found at the Pathfinder site and was not visible in the input images. Also note
STOKER ET AL.: VIRTUAL REALITY AND SUPERRESOLUTION ON PATHFINDER 8899
(a)
' %,:.•.. .... "•..• "• ß ''... ...
(b)
..... fl.../...... ß .• .......... •-:•---,• •:•:: ....... ......
,. :•. ::-:•:• .. •'• ..... • ..... . , • :-•'•..•:.•.,• . •
......-:.. :.' :-.... .... -..:.....:.:. :•:..:1::•'•' .....-:• . ..• ,.,,:,•:' ......... ..
., -., .... :,,-.,• :"--::.. .
.:
:,:-: :...•.:::'•' :,'.7;:.:,..' ....... :. • •/ :• .. •..2.:/..... . /;
.
'.:.... ..
.
•:.....;• .... ...............;.• .•;5• .... :•-- . ..... • . • .• ......... •:•y,. .•::..:•-,,• •:...•..- ............................ .:.•.:,.•;:: , .:?•..• • ',• ....••'"
- ............ . .........
Fi•,re ?. Superresolved image of South Peak produced from 42 IMP images in the 670 nm filter. The process was performed assuming a resolution improvement of a factor of 5 for better comparison with North Twin (Figure 6). (a) Typical input image expanded by a factor of 5. Top inset shows detail on the ridge, bottom left inset shows detail of the linear feature running down the peak, and bottom right inset shows detail of a rock in the foreground. (b) Same as Figure ?a but with pkels interpolated to remove blockiness. (c) Superresolved result with same detail insets as Figure 7a. Lines of bright features running cross-slope are prominent. Boulders are resolved on the ridge line, and structure is resolved in the foreground rock.
8900 STOKER ET AL.: VIRTUAL REALITY AND SUPERRESOLUTION ON PATHFINDER
(b) (bl)
c)
Figure 8. Superresolved image of Wedge, produced from 25 IMP images taken in the 670 nm filter. (a) Typical input image; insets to the right show detail of the input image (a2) with and (al) without interpolation after expansion by a factor of 5. (b) Superresolved result. Inset b l shows textural detail for comparison with the input image and the rover ground truth image. (c) IMP image of the rover on sol 35 when the rover image of Wedge was taken. (d) Rover image of Wedge. Inset dl shows enlarged section of rover image of Wedge showing detail of texture for comparison with inset b l.
STOKER ET AL.: VIRTUAL REALITY AND SUPERRESOLUTION ON PATHFINDER 8901
(a)
Figure 9. Superresolved image produced from 45 IMP images in the 440 nm filter. (a) Typical input image; insets al and a2 are expanded sections to show detail. (b) Same as Figure 9a with pixels interpolated. (c) Superresolved result. Rock in the center and three rocks to the left of it appear to have layered structures.
STOKER ET AL.: VIRTUAL REALITY AND SUPERRESOLUTION ON PATHFINDER 8903
(b)
(c)
(bl)
(cl)
(bZ)
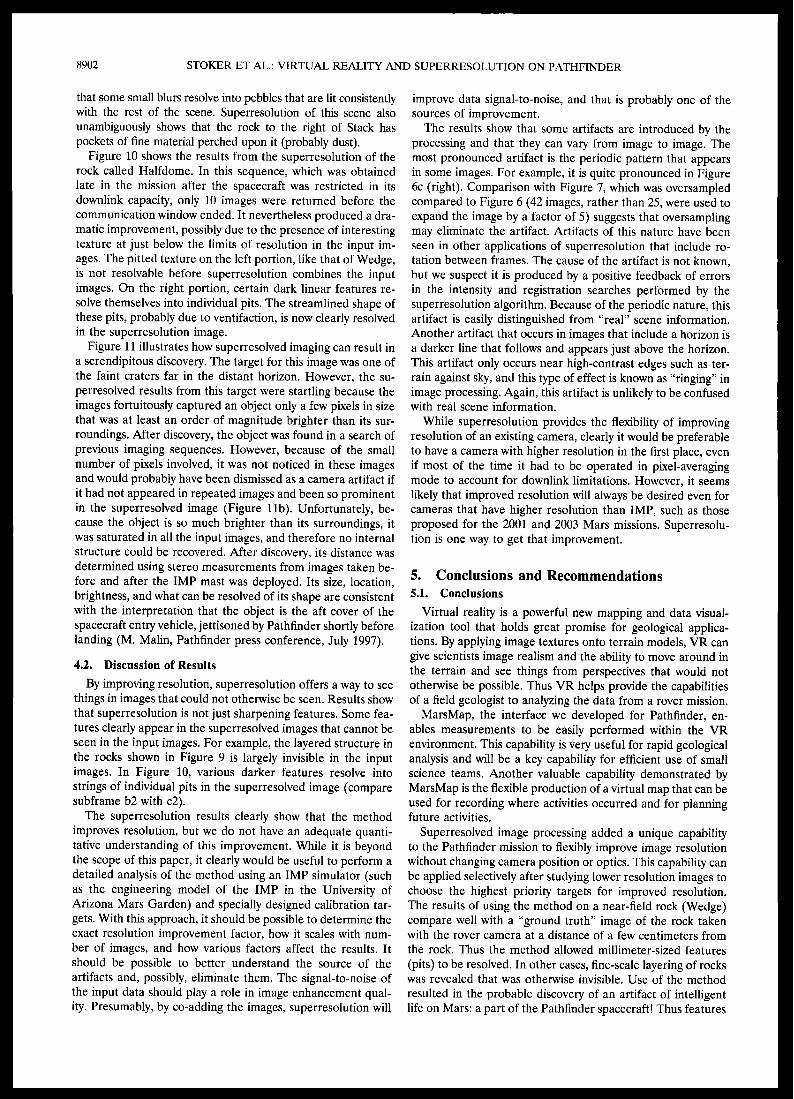
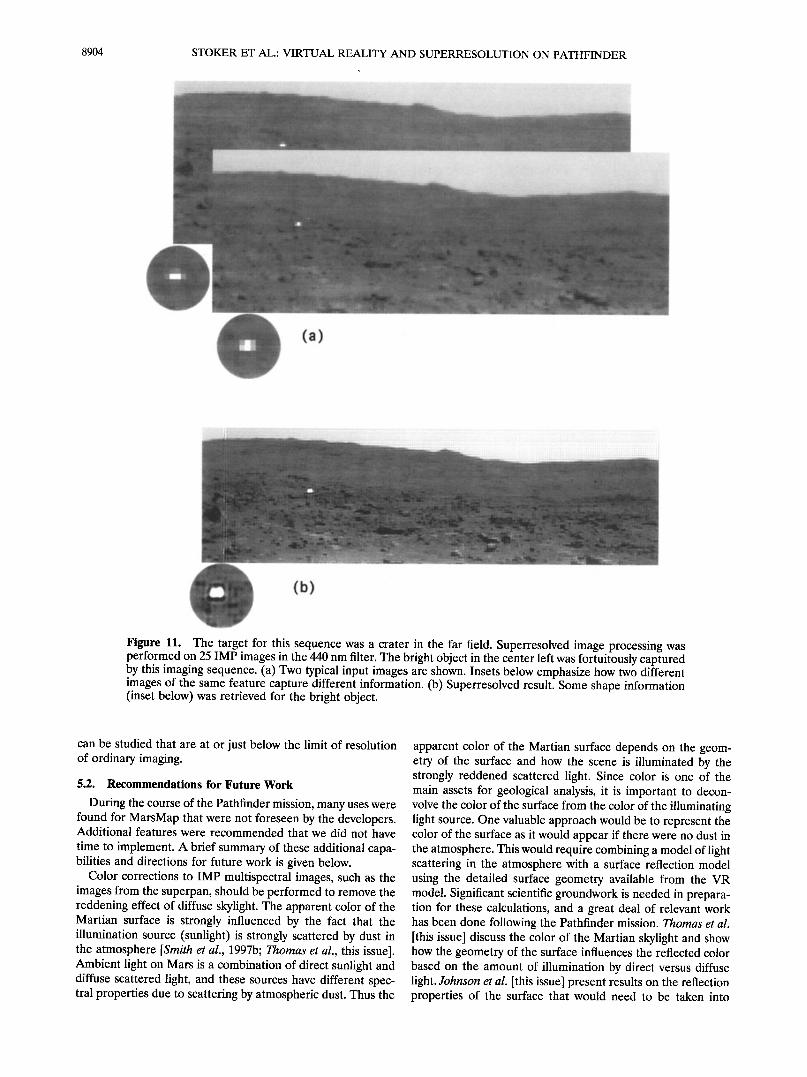
Figure 10. Superresolved image of the rock Halfdome produced from 10 IMP images in the 440 nm filter. Because of the small number of inputs, a 3x expansion factor was used. (a) Typical input image; detail sections al and a2 show textures on the left and right sides of the rock. (b) Same as Figure 10a with pixels interpolated after expansion. (c) Superresolved result.
8904 STOKER ET AL.: VIRTUAL REALITY AND SUPERRESOLUTION ON PATHFINDER
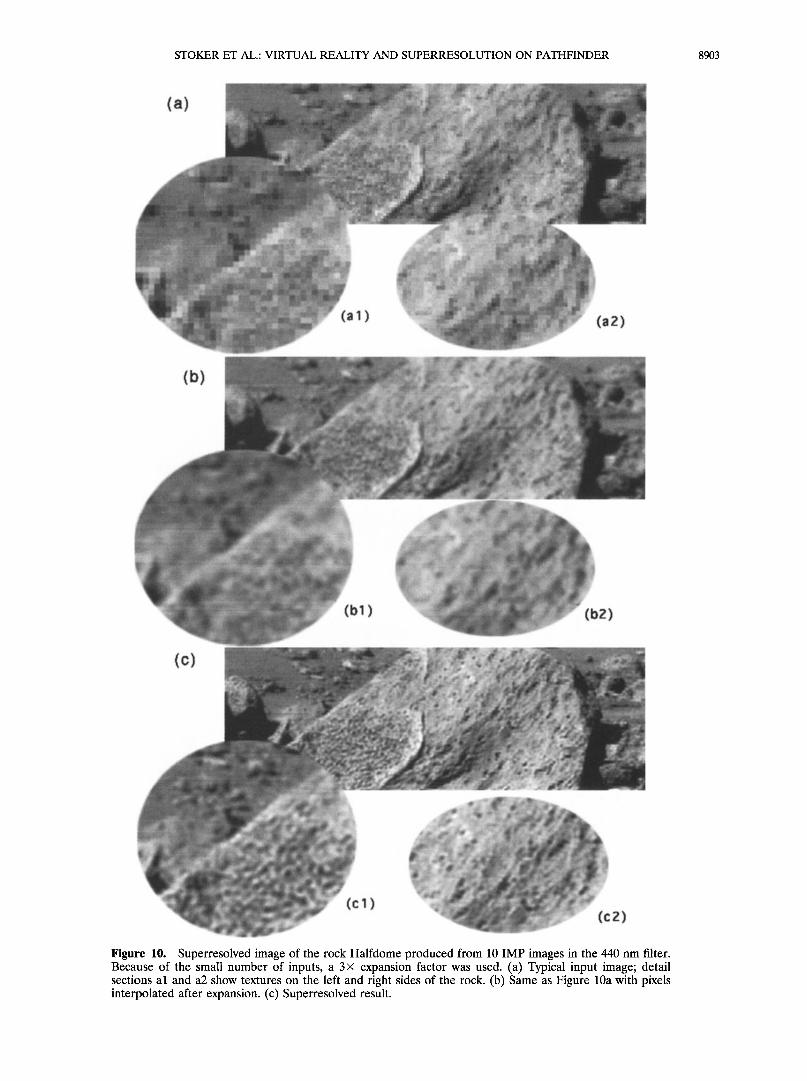
Figure 11. The target for this sequence was a crater in the far field. Superresolved image processing was performed on 25 IMP images in the 440 nm filter. The bright object in the center left was fortuitously captured by this imaging sequence. (a) Two typical input images are shown. Insets below emphasize how two different images of the same feature capture different information. (b) Superresolved result. Some shape information (inset below) was retrieved for the bright object.
can be studied that are at or just below the limit of resolution of ordinary imaging.
5.2. Recommendations for Future Work
During the course of the Pathfinder mission, many uses were found for MarsMap that were not foreseen by the developers. Additional features were recommended that we did not have
time to implement. A brief summary of these additional capa- bilities and directions for future work is given below.
Color corrections to IMP multispectral images, such as the images from the superpan, should be performed to remove the reddening effect of diffuse skylight. The apparent color of the Martian surface is strongly influenced by the fact that the illumination source (sunlight) is strongly scattered by dust in the atmosphere [Smith et al., 1997b; Thomas et al., this issue]. Ambient light on Mars is a combination of direct sunlight and diffuse scattered light, and these sources have different spec- tral properties due to scattering by atmospheric dust. Thus the
apparent color of the Martian surface depends on the geom- etry of the surface and how the scene is illuminated by the strongly reddened scattered light. Since color is one of the main assets for geological analysis, it is important to decon- volve the color of the surface from the color of the illuminating light source. One valuable approach would be to represent the color of the surface as it would appear if there were no dust in the atmosphere. This would require combining a model of light scattering in the atmosphere with a surface reflection model using the detailed surface geometry available from the VR model. Significant scientific groundwork is needed in prepara- tion for these calculations, and a great deal of relevant work has been done following the Pathfinder mission. Thomas et al. [this issue] discuss the color of the Martian skylight and show how the geometry of the surface influences the reflected color based on the amount of illumination by direct versus diffuse light. Johnson et al. [this issue] present results on the reflection properties of the surface that would need to be taken into
STOKER ET AL.: VIRTUAL REALITY AND SUPERRESOLUTION ON PATHFINDER 8905
account in removing the coloration effect of the reddened diffuse light source. The direct and diffuse incident light sources could be modeled using the dust scattering properties presented in the papers by Smith and Letomort [this issue] and Tomasko et al. [this issue].
Rapidly correcting color to remove the diffuse illumination would be very valuable on future missions involving rovers. This would give science teams a better understanding of sur- face colors, enabling them to decide where to make in situ measurements and where to send the rover to obtain samples.
The Pathfinder VR model was implemented only with im- ages taken by the IMP camera. Therefore the model encom- passed a limited area. An important advance will be to create a VR model that includes other relevant images. The model would have varying resolution, reflecting the available infor- mation. For example, the lowest resolution scale could be areas only covered by orbital imaging, the next higher resolution scale could be from the descent imaging, and the highest could be derived from the rover images where available. Producing digital terrain models and merging all this information to- gether smoothly and accurately will be a major challenge for VR researchers. An important step in this direction would be to develop 3-D models from Sojourner images and merge them properly into the IMP-derived 3-D models. However, this task is complicated by the fact that the Sojourner cameras had considerable lens distortion that must be taken into account
when producing 3-D models. Future rover missions are planned for Mars that will be of
much longer duration than expected for Mars Pathfinder. Cost constraints for these long missions dictate that team members must be able to interact effectively from their home institu- tions. Tools such as MarsMap need to be available on work- stations at organizations that are geographically dispersed.
Superresolution is an important capability, but a detailed study of the method needs to be performed under controlled laboratory conditions to better characterize how much resolu- tion improvement is really obtained, how it scales with number of images, and other factors that may affect image quality.
A number of additional superresolution tasks should be per- formed with the Pathfinder data set. For example, the super- pan was a nearly complete panorama of the Martian surface taken in all 15 IMP filters (with eight in the left camera and seven in the right). These images could be combined using the superresolution algorithm to produce a superresolved stereo pair with a resolution improvement of more than a factor of 2. The results could also be produced in color, since the color channels could be applied to the superresolved results. Golombek et al. [this issue] show results from superresolved images of the superpan manually produced using Photoshop. The individual image planes were sharpened using an unsharp mask and then co-added after visual co-registration. The re- sults were colorized as described above. While impressive im- ages resulted, it is important to understand how they compare with results from the superresolution algorithm, which in ad- dition to co-adding the images, is deconvolving the camera's point spread function.
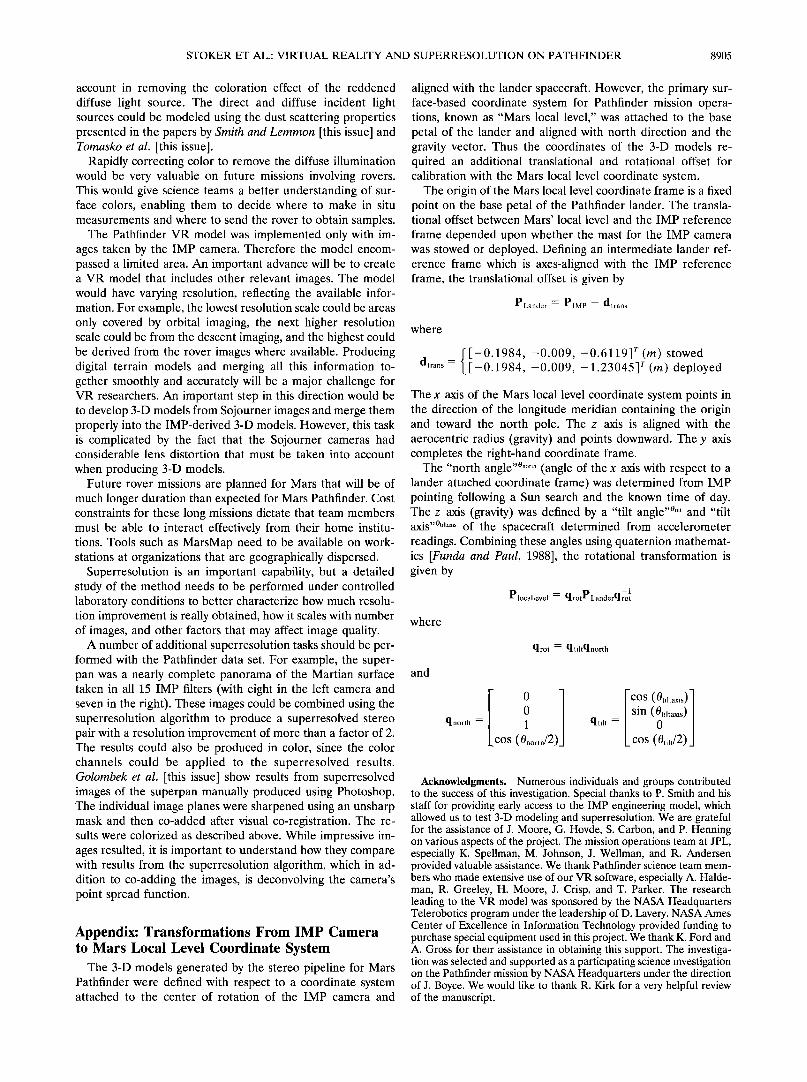
Appendix: Transformations From IMP Camera to Mars Local Level Coordinate System
The 3-D models generated by the stereo pipeline for Mars Pathfinder were defined with respect to a coordinate system attached to the center of rotation of the IMP camera and
aligned with the lander spacecraft. However, the primary sur- face-based coordinate system for Pathfinder mission opera- tions, known as "Mars local level," was attached to the base petal of the lander and aligned with north direction and the gravity vector. Thus the coordinates of the 3-D models re- quired an additional translational and rotational offset for calibration with the Mars local level coordinate system.
The origin of the Mars local level coordinate frame is a fixed point on the base petal of the Pathfinder lander. The transla- tional offset between Mars' local level and the IMP reference
frame depended upon whether the mast for the IMP camera was stowed or deployed. Defining an intermediate lander ref- erence frame which is axes-aligned with the IMP reference frame, the translational offset is given by
PLander = PIMP nt- d trans
where
d { [-0.1984, -0.009, -0.6119] r (m) stowed t .... : [--0 1984, -0 009 -1.23045] r (m) deployed
The x axis of the Mars local level coordinate system points in the direction of the longitude meridian containing the origin and toward the north pole. The z axis is aligned with the aerocentric radius (gravity) and points downward. The y axis completes the right-hand coordinate frame.
The "north angle "ø .... h (angle of the x axis with respect to a lander attached coordinate frame) was determined from IMP pointing following a Sun search and the known time of day. The z axis (gravity) was defined by a "tilt angle "øt'lt and "tilt axis,,0t,l ..... of the spacecraft determined from accelerometer readings. Combining these angles using quaternion mathemat- ics [Funda and Paul, 1988], the rotational transformation is given by
Plocallevel : qrotPLanderqr•lt
where
qrot = qtiltqnorth
and
0
0
qnorth = 1 qtilt =
COS (0north/2)
COS ( 0tiltaxis ) sin ( 0tiltaxis )
0
cos (0tilt/2)
Acknowledgments. Numerous individuals and groups contributed to the success of this investigation. Special thanks to P. Smith and his staff for providing early access to the IMP engineering model, which allowed us to test 3-D modeling and superresolution. We are grateful for the assistance of J. Moore, G. Hovde, S. Carbon, and P. Henning on various aspects of the project. The mission operations team at JPL, especially K. Spellman, M. Johnson, J. Wellman, and R. Andersen provided valuable assistance. We thank Pathfinder science team mem- bers who made extensive use of our VR software, especially A. Halde- man, R. Greeley, H. Moore, J. Crisp, and T. Parker. The research leading to the VR model was sponsored by the NASA Headquarters Telerobotics program under the leadership of D. Lavery. NASA Ames Center of Excellence in Information Technology provided funding to purchase special equipment used in this project. We thank K. Ford and A. Gross for their assistance in obtaining this support. The investiga- tion was selected and supported as a participating science investigation on the Pathfinder mission by NASA Headquarters under the direction of J. Boyce. We would like to thank R. Kirk for a very helpful review of the manuscript.
8906 STOKER ET AL.: VIRTUAL REALITY AND SUPERRESOLUTION ON PATHFINDER
References
Aukstakalnis, S., and D. Blatner, Silicon Mirage: The Art and Science of Virtual Reality, Peachpit Press, Berkeley, Calif., 1992.
Batson, R. M., and E. M. Eliason, Digital maps of Mars, Photogramm. Eng. Remote Sens., 61, 1499-1507, 1995.
Batson, R. M., K. Edwards, and E. M. Eliason, Synthetic stereo and Landsat pictures, Photogramm. Eng. Remote Sens., 42(10), 279-284, 1976.
Batson, R. M., R. L. Kirk, K. Edwards, and H. F. Morgan, Venus cartography, J. Geophys. Res., 99(E10), 21,173-21,181, 1994.
Baxes, G. A., Digital Image Processing Principles and Applications, pp. 350-353, John Wiley, New York, 1994.
Cheeseman, P., Super-resolved surface reconstruction from multiple images, in Maximum Entropy and Bayesian Methods, edited by G. R. Heidbreder, pp. 293-308, Kluwer Acad., Norwell, Mass., 1996.
Claus, M., Digital terrain models through digital stereo correlation, in Specialist Workshop on Pattern Recognition in Photogrammetry, 1983, Photogrammetria, 39(4-6), 183-192, 1984.
Coquillart, S., and M. Gangnet, Shaded display of digital maps, IEEE Comput. Graphics Appl., 4(7), 35-42, 1984.
Crowe, D. G., et al., Imager for Mars Pathfinder Calibration Report, version 1.0, Lunar and Planet. Lab., Univ. of Ariz., Tucson, Sept. 30, 1996.
DeJong, E., S. Saunders, J. Hall, and M. McAuley, Magellan scientists use computer simulated flights to explore Venus, Inf Syst. Newsl., 23, 1-4, 1991.
Faintich, M. B., Digital cartographic databases: Advanced analysis and display technologies, in Proceedings of International Conference on the Acquisition, Management and Presentation of Spatial Data, vol. 1, pp. 412-422, Auto Carto London, 1986.
Faust, N., et al., OpenGL VGIS [virtual GIS], high-fidelity simulation for training, test support, mission rehearsal, and civilian applica- tions, Proc. SPIE Int. Soc. Opt. Eng., 2740, 42-49, 1996.
Fisher, S.S., M. McGreevy, J. Humphries, and W. Robinett, Virtual environment display system (summary paper), 1986 Workshop Inter- active 3D Graphics, 21(1), 4-5, 1987.
Funda, J., and R. P. Paul, A comparison of transforms and quaternions in robotics, in Proceedings of the 1988 IEEE International Conference on Robotics and Automation, vol. 2, pp. 886-891, Inst. of Electr. and Electron. Eng., New York, 1988.
Gaddis, L. R., et al. Digital mapping of the Mars Pathfinder landing site: Design, acquisition, and derivation of cartographic products for science applications, J. Geophys. Res., this issue.
Golombek, M.P., et al., Overview of the Mars Pathfinder mission and assessment of landing site predictions, Science, 278, 1734-1748, 1997.
Golombek, M.P., et al., Overview of the Mars Pathfinder mission: Launch through landing, surface operations, data sets, and science results, J. Geophys. Res., this issue.
Graf, K., et al., Perspective terrain visualization--A fusion of remote sensing, GIS, and computer graphics, Comput. Graphics, 18(6), 795- 802, 1994.
Green, W. B., Computer image processing--The Viking experience, IEEE Trans. Consumer Electron., CE-23(3), 281-299, 1977.
Herman, M., and T. Kanade, Incremental reconstruction of 3-D scenes from multiple, complex images, Artif Intel., 30(3), 289-341, 1986.
Jacobson, R., Applying the virtual worlds paradigm to mapping and surveying data, Virtual Reality World, 2(5), 60-62, 64-69, 1994.
Johnson, J. R., et al., Preliminary results on photometric properties of materials at the Sagan Memorial Station, Mars, J. Geophys. Res., this issue.
Johnston, E.G., and A. Rosenfeld, Digital detection of pits, peaks, ridges, and ravines, IEEE Trans. Syst. Man Cybernetics, SMC-5(4), 472-480, 1975.
Jordan, L. E., III, Dawn of a new era: The image information age, 1996 International Geoscience and Remote Sensing Symposium: Remote Sensing for a Sustainable Future, IGARSS '96, 4, 2228-2230, 1996.
Kahn, E., D. Piquet-Pellorce, and C. Roche, A method of automatic digital correlation to get an altimetric data file, in Proceedings of the NATO Advanced Study Institute on Digital Image Processing and Analysis, pp. 393-399, NATO, Brussels, 1977.
Kamiya, R., The digital photo map, Photogramm. Eng., 38(10), 985- 988, 1972.
Kelly, R. E., P.R.H. McConnell, and S. J. Mildenberger, The Gestalt photomapping system, Photogramm. Eng. Remote Sens., 43(11), 1407-1417, 1977.
Kennie, T.J.M., and R. A. McLaren, Modelling for digital terrain and landscape visualisation, Photogramm. Rec., 12(72), 711-745, 1988.
Kirk, R. L., L. A. Soderblom, and E. M. Lee, Enhanced visualization for interpretation of Magellan radar data, J. Geophys. Res., 97(E10), 16,371-16,380, 1992.
Kirk, R. L., et al., Digital photogrammetric analysis of the IMP camera images: Mapping the Mars Pathfinder landing site in three dimen- sions, J. Geophys. Res., this issue.
Koller, D., et al., Virtual GIS: A real-time 3-D geographic information system, Proc. Visualization '95, 443, 94-100, 1995.
Levinthai, E. C., W. Green, K. L. Jones, and R. Tucker, Processing the Viking lander camera data, J. Geophys. Res., 82(28), 4412-4420, 1977.
Li, P. P., W. H. Duquette, and D. W. Curkendall, RIVA: A versatile parallel rendering system for interactive scientific visualization, IEEE Trans. Visualization Cornput. Graphics, 2(3), 186-201, 1996.
Liebes, S., and J. Schwartz, Viking 1975 Mars lander interactive com- puterized video sterphotogrammetry, J. Geophys. Res., 82(28), 4421- 4429, 1977.
Liu, A., G. Tharp, L. French, S. Lai, and L. Stark, Some of what one needs to know about using head-mounted displays to improve tele- operator performance, IEEE Trans. Robotics Automation, 9(5), 638- 648, 1993.
McGreevy, M. W., The presence of field geologists in Mars-like ter- rain, Presence Teleoperators Virtual Environ., 1(4), 375-403, 1992.
McGreevy, M. W., Virtual reality and planetary exploration, in Virtual Reality: Applications and Explorations, edited by A. Wexelblat, Aca- demic, San Diego, Calif., 1993.
McLanaghan, R., Visual systems in flight simulation, IMACS World Congr. Syst. Simul. Sci. Cornput. loth, 2, 70-72, 1982.
Moellman, D. E., and R. A. Meyer, Application of distributed pro- cessing to the production of digital terrain data, in Proceedings of the 1976 International Conference on Parallel Processing, pp. 18-23, Inst. of Electr. and Electron. Eng., New York, 1976.
Morag, A., Carta/Terra/Quanta: An accurate digital terrain model, Jerusalem Conf Inf Technol. Comput. Soc. Econ. Technol. 2nd, 1, 607-610, 1974.
Neves, N., et al., Cognitive spaces and metaphors: A solution for interacting with spatial data, Comput. Geosci., 23(4), 483-488, 1997.
Piguet, L., et al., VEVI: A virtual reality tool for robotic planetary explorations, Proc. Workshop Simul. Interaction Virtual Environ., 1st, 184-193, 1995.
Raper, J., Virtual environments for three and four dimensional geo- scientific modeling, Int. Conf GeoComput. 1st, 2, 709-710, 1996.
Real, R. R., Y. Fujimoto, H. Moeller, and M. Paulun, An electronic drawing aid for map compiling, IEEE Trans. Geosci. Electron., GE- l2(4), 134-139, 1974.
Smith, P. A., et al., The Imager for Mars Pathfinder experiment, J. Geophys. Res., 102, 4003-4025, 1997a.
Smith, P. A., et al., Results from the Mars Pathfinder camera, Science, 287, 1758-1768, 1997b.
Smith, P. H., and M. Lemmon, Opacity of the Martian atmosphere mea- sured by the Imager for Mars Pathfinder, J. Geophys. Res., this issue.
Stoker, C. R., Scientists on Mars: Science strategy for human exploration, in Strategies for Mars: A Guide to Human Exploration, edited by C. Stoker and C. Emmart, AAS Sci. Technol. Sev., 86, 537-560, 1996.
Stoker, C., The search for life on Mars: The role of rovers, J. Geophys. Res., 103(E12), 28,557-28,575, 1998.
Stoker, C. R., D. R. Barch, B. P. Hine III, and J. Barry, Undersea exploration in Antarctica using a robotic submarine with Telepres- ence user interface, IEEE Expert, IO, 14-24, 1995.
Thomas, N., W. J. Markiewicz, R. M. Sablotny, M. W. Wuttke, H. U. Keller, J. R. Johnson, R. J. Reid, and P. H. Smith, The color of the Martian sky and its influence on the illumination of the Martian surface, J. Geophys. Res., this issue.
Tomasko, M. G., L. R. Doose, M. Lemmon, P. H. Smith, and E. Wegryn, Properties of dust in the Martian atmosphere from the Imager on Mars Pathfinder, J. Geophys. Res., this issue.
Weber, J. W., Real-time terrain image generation, Proc. SPIE Int. Soc. Opt. Eng., 391, 70-74, 1983.
T. T. Blackmon, J. Hagen, P. Henning, B. Kanefsky, C. Neveu, D. Rasmussen, K. Schwehr, M. Sims, C. R. Stoker, and E. Zbinden, NASA Ames Research Center, M5 245-3, Moffett Field, CA 94035. (cstøkes@mail'arc'nasa'gøv)
(Received February 16, 1998; revised September 10, 1998; accepted September 30, 1998.)