analyzing large-scale human mobility data - interacting with
TRANSCRIPT
Knowl Inf Systhttps://doi.org/10.1007/s10115-018-1186-x
SURVEY PAPER
Analyzing large-scale human mobility data: a survey ofmachine learning methods and applications
Eran Toch1 · Boaz Lerner2 · Eyal Ben-Zion2 ·Irad Ben-Gal1
Received: 15 November 2016 / Revised: 5 December 2017 / Accepted: 14 March 2018© Springer-Verlag London Ltd., part of Springer Nature 2018
Abstract Human mobility patterns reflect many aspects of life, from the global spreadof infectious diseases to urban planning and daily commute patterns. In recent years, theprevalence of positioning methods and technologies, such as the global positioning system,cellular radio tower geo-positioning, and WiFi positioning systems, has driven efforts tocollect human mobility data and to mine patterns of interest within these data in order topromote the development of location-based services and applications. The efforts to minesignificant patterns within large-scale, high-dimensional mobility data have solicited use ofadvanced analysis techniques, usually based on machine learning methods, and therefore, inthis paper,we survey and assess different approaches andmodels that analyze and learn humanmobility patterns using mainly machine learning methods. We categorize these approachesand models in a taxonomy based on their positioning characteristics, the scale of analysis,the properties of the modeling approach, and the class of applications they can serve. We findthat these applications can be categorized into three classes: user modeling, place modeling,and trajectorymodeling, each class with its characteristics. Finally, we analyze the short-termtrends and future challenges of human mobility analysis.
Keywords Human mobility patterns · Mobile phones ·Machine learning · Data mining
1 Introduction
According to a 2016 worldwide Pew report, around 90% of people have a mobile phone,and between 45 and 80% have a smartphone [71]. In recent years, we have witnessed amobile computing revolution—mobile technology is now more connected, sophisticated,
B Eran [email protected]
1 Department of Industrial Engineering, Faculty of Engineering, Tel Aviv University, Tel Aviv, Israel
2 Department of Industrial Engineering and Management, Ben-Gurion University of the Negev, BeerSheva, Israel
123
E. Toch et al.
location-based, personal, and powerful than ever. Positioning technologies that serve mobilephones such as the cellular antenna, global navigation satellite systems (such as the GlobalPositioning System—GPS), and the WiFi positioning system (WPS) provide increasinglyaccurate and continuous geographic positions of mobile devices [56]. It is now dramaticallyeasier to track the location of a huge number of mobile devices, leading to a wealth ofinformation about the mobility of humans, vehicles, devices, and practically anything thatcan be fitted with a mobile computing device. The availability and scale of mobility data areexpected to grow exponentially, as more and more physical objects will be connected to theInternet of Things (IoT).
Large-scale location information poses a considerable opportunity for commercial, gov-ernmental, and academic applications that analyze and act upon people’s locations andmovements. However, this opportunity requires researchers and developers to overcomevarious challenges that stem from the scale, complexity, and sensitivity of the mobility data.This opportunity is also apparent in cutting-edge research and development. Mobility datahave been used to answer questions such as how people travel between cities [73] and whatthe patterns are of their daily commute [37, 80], as well as to predict socioeconomic trends[33], find relationships in online social networks [21], identify people’s weight and healthstatus [65], discover employment patterns [28], and follow the spread of infectious diseases[5, 93]. Mobility data were also found to represent human behavior in catastrophic events,e.g., the 2010 Haiti earthquake [9, 57] or the 2011 Japan earthquake [31]. Models of mobilitywere used in designing public transportation systems [11], in taxicab allocation [43], and inperforming crowd-sourcing tasks [76]. In addition, the analysis of mobility patterns leads toa growing field of commercial applications by mobile communication service providers suchas Telefonica1 and Verizon,2 as well as by several companies that have already started to pro-vide location-based services analyzing mobile phone location traces. Mobile phone locationtraces are created through ongoing positioning of the mobile phone, whether stationary ormoving. Advances in mobile positioning including cellular antenna base station geographicpositioning, WiFi antenna triangulation, and global navigation satellite positioning systems(such as GPS) contribute to the increasing number of locatable phones.
Recent advances inmachine learning (ML) andmodeling provide a vast set of tools that cananalyze mobility data, but choosing the right tool for a given task remains confusing. Thereare dozens of different ML (and non-ML) methods associated with mobility patterns, andwhile most of them aim at modeling people’s movements, they make different assumptionson how a location is defined and sensed, and how it should be analyzed. Usually, thesemethods are also tailored to the application and are modified accordingly, and therefore losetheir transferability. As a result, applying the methods developed in one research work toanother is challenging. For example, a mobility model that is focused on the positioning ofusers inside a room may be inapplicable to model daily commutes of users between cities.However, knowledge from one domain may often be useful in another domain. Differentpositioning technologies, such as those described above, can produce traces that can beanalyzed by similar models. That is, knowledge extracted using one mobile location trackingmethod may be very effective in another. For example, the method suggested by Sohn et al.[79] is used by Reddy et al. [74], even though the former uses call detail record data, whilethe latter utilizes combined data from the GPS chip and the accelerometer. Finding commonground between relevant research studies is a crucial, but challenging task, as the researchcommunities working on mobility analysis are quite often diverse, ranging in domains from
1 https://www.telefonica.com/en/.2 https://www.verizonwireless.com/featured/precision/.
123
Analyzing large-scale human mobility data: a survey of…
physics [37, 81], to geography [70], ubiquitous computing [67], and machine learning [39].Because human mobility analysis is inherently interdisciplinary, interpreting and bridgingthese works is essential for advancing both the theoretical and practical aspects of an analysis.
In this survey, we extend previous reviews of methods and approaches for the analysisof mobility patterns that are based on various types of location trace data, such as thosecollected from cellular cell tower positioning records, global navigation satellite positioningsystems, WiFi positioning, and other methods that can produce a large set of geographiclocations. We describe and categorize these methods and approaches by considering both themodel and semantics of the location data, rather than only the way the data were collectedand produced, and extend previous surveys that mainly focused on specific applications orspecific data sources. Previous surveys focused on specific applications that make use ofmobile phone sensing, including location tracking, to facilitate urban operations [40] andurban computing [102, 103], or on anticipatory mobile computing [68]. Others [60] focusedtheir review on trajectory modeling, but overlooked some user modeling applications thatportray longitudinal patterns ofmobility of individuals or places, or analyzed specific locationdata sources such as GPS traces [54] or GPS taxicab traces [17], but ignored data sourcessuch as call detail records (CDRs). Another survey [84] focused on anomaly detection inspatiotemporal data streams as a means to model urban traffic.
In this survey, we take a wider approach to human mobility analysis, reviewing papersfrommultiple disciplines and applications, which are based on various location data sources,including cellular antenna positioning, GPS, WiFi, and other beacon-positioning technolo-gies. We argue that papers from distanced domains to mobility analysis can also be usefulfor this analysis, as the underlying methods may be similar, regardless of the data sourceor the application domain. Due to the interdisciplinary nature of research in this field, wecategorize the approaches according to a general set of application classes: user modeling,place modeling, and trajectory modeling. We analyze these applications according to theirpositioning technology and the resolution level and properties of the data, as well as themodeling methods that are used to extract knowledge from such data.
Section 2 of this survey gives a background of human mobility patterns and their analy-sis. In Sect. 3, we categorize mobility pattern analysis methods in a taxonomy we suggestaccording to: (1) three classes of applications which are served by the methods that are usedfor user, place, and trajectory modeling; (2) the modeling approach; and (3) the trackingproperties of the mobility patterns. In Sect. 4, we thoroughly explore the three applicationclasses. Finally, in Sect. 5, we analyze future challenges and opportunities for large-scalepattern mining of human location traces.
2 Background: human mobility patterns
The first efforts to learn human mobility patterns were associated with classic social sci-ences. Since the nineteenth century, sociologists in what are called time-use or time-budgetstudies have been measuring the time people spend doing different activities throughoutthe day [85]. Transportation forecasting was one of the first research fields that made useof mobility analysis, and mobility patterns have been studied since the late 1950s [24]. Thefirst analytical models implemented pre-calculated probability distributions of possible traveldestinations mainly based on land use and demographics. In the field of Industrial Engineer-ing, activity-based models and mobility analysis have been implemented in work studiestrying to minimize movements of workers, products, and inventories, if such are found to
123
E. Toch et al.
be unnecessary in terms of their added value [7]. Starting in the 1990s, this approach wasgradually enriched by activity-based models, e.g., computerized models that use agent-basedsimulations, where the agents are modeled and driven by specific human activity such aswork, leisure, and shopping [43]. Until recent years, most mobility data used in empiricalgeographic-oriented domains, such as transportation, epidemiology, engineering, and urbanecology, were gathered from user reports: travel diaries, recall interviews, and surveys. Withthe markdown in cellular base tower geographic positioning, GPS, and WiFi positioningtechnologies, more studies have been conducted using automatic location recordings [12].
The availability of massive human location tracking datasets was enabled by mobiletechnologies, such as big-data technologies inmobile telecommunication networks and large-scale deployment of GPS technologies. Large-scale studies analyzed mobility patterns byusing statistical models that captured some general properties of these observed patterns.Gonzalez et al. [37] showed, based on analyzing 100,000 mobile phone traces, that the traveldistances of people follow a power–lawdistribution. Similar patternswere found by analyzingtravel paths of banknotes [13]. The number of diverse patterns was found to be rather limited,providing an encouraging foundation for predicting and analyzing mobility [80].
Another emerging area of social science studies of human mobility relies on complex net-work theory and statistical and information theory tools. These studies, sometimes termed asComputational Social Science, focus on analyzing social relations and aggregating mobilitypatterns frommasses of individuals’ data. For example, in a series of papers, Eagle and Pent-land [25, 26], andEagle et al. [27] studied human social structure usingmobility data thatwerecollected from mobile phones. Aggregating geographic locations for pattern extraction pur-poses has proven to be useful in predicting interactions between people and in modeling thespread of infectious diseases in humans [5], aswell as the spread ofmobile phone viruses [91].
Location tracking and location-based services are being used in a growing number ofcommercial applications. These applications are provided by mobile carriers, such as Tele-fonica (see Footnote 1) and T-Systems,3 a host of startup companies, such as Airsage,4
StreetLightData,5 and TrendIt,6 and by established companies, such as ArcGIS.7 The appli-cations provided by these companies use large-scale location data to analyze the commercialprospects of a business by evaluating the mobility of those customers who visit that busi-ness. In retail industry that suffers from a significant decrease in shoppers to brick-and-mortarstores due to e-commerce competition, newmobility and customer tracking solutions are pro-vided. In particular, companies such as Euclid Analytics,8 ShopperTrack,9 and RetailNext10
analyze the mobility of shoppers into stores and in the store in order to optimize the locationof products and improve the customer experience. Other services are aimed at individuals byproviding value for personal use, including applications that personalize search results (e.g.,Google local search11), help users avoid traffic jams (e.g., Waze12 and Google Maps13),
3 https://www.t-systems.com/de/en/solutions/cloud/solutions/outdoor-analytics/traffic-analysis-75652.4 http://www.airsage.com/.5 http://www.streetlightdata.com/.6 http://www.trendit.net/.7 http://www.esri.com/software/arcgis.8 http://euclidanalytics.com/.9 http://www.shoppertrak.eu/.10 http://retailnext.net/en/home/.11 http://searchengineland.com/new-google-local-search-display-230525.12 https://www.waze.com/en-GB/.13 https://www.google.co.il/maps?source=tldso.
123
Analyzing large-scale human mobility data: a survey of…
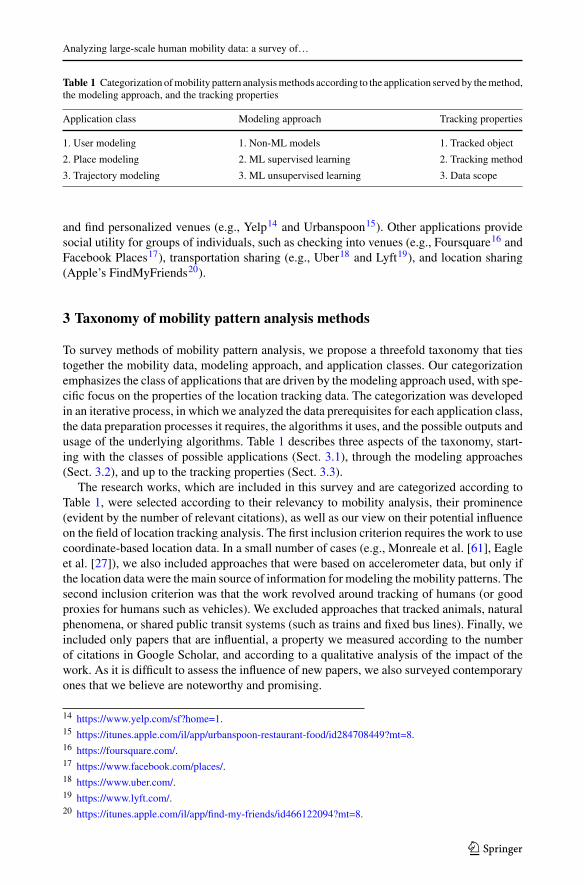
Table 1 Categorization ofmobility pattern analysismethods according to the application served by themethod,the modeling approach, and the tracking properties
Application class Modeling approach Tracking properties
1. User modeling 1. Non-ML models 1. Tracked object
2. Place modeling 2. ML supervised learning 2. Tracking method
3. Trajectory modeling 3. ML unsupervised learning 3. Data scope
and find personalized venues (e.g., Yelp14 and Urbanspoon15). Other applications providesocial utility for groups of individuals, such as checking into venues (e.g., Foursquare16 andFacebook Places17), transportation sharing (e.g., Uber18 and Lyft19), and location sharing(Apple’s FindMyFriends20).
3 Taxonomy of mobility pattern analysis methods
To survey methods of mobility pattern analysis, we propose a threefold taxonomy that tiestogether the mobility data, modeling approach, and application classes. Our categorizationemphasizes the class of applications that are driven by the modeling approach used, with spe-cific focus on the properties of the location tracking data. The categorization was developedin an iterative process, in which we analyzed the data prerequisites for each application class,the data preparation processes it requires, the algorithms it uses, and the possible outputs andusage of the underlying algorithms. Table 1 describes three aspects of the taxonomy, start-ing with the classes of possible applications (Sect. 3.1), through the modeling approaches(Sect. 3.2), and up to the tracking properties (Sect. 3.3).
The research works, which are included in this survey and are categorized according toTable 1, were selected according to their relevancy to mobility analysis, their prominence(evident by the number of relevant citations), as well as our view on their potential influenceon the field of location tracking analysis. The first inclusion criterion requires the work to usecoordinate-based location data. In a small number of cases (e.g., Monreale et al. [61], Eagleet al. [27]), we also included approaches that were based on accelerometer data, but only ifthe location data were the main source of information for modeling the mobility patterns. Thesecond inclusion criterion was that the work revolved around tracking of humans (or goodproxies for humans such as vehicles). We excluded approaches that tracked animals, naturalphenomena, or shared public transit systems (such as trains and fixed bus lines). Finally, weincluded only papers that are influential, a property we measured according to the numberof citations in Google Scholar, and according to a qualitative analysis of the impact of thework. As it is difficult to assess the influence of new papers, we also surveyed contemporaryones that we believe are noteworthy and promising.
14 https://www.yelp.com/sf?home=1.15 https://itunes.apple.com/il/app/urbanspoon-restaurant-food/id284708449?mt=8.16 https://foursquare.com/.17 https://www.facebook.com/places/.18 https://www.uber.com/.19 https://www.lyft.com/.20 https://itunes.apple.com/il/app/find-my-friends/id466122094?mt=8.
123
E. Toch et al.
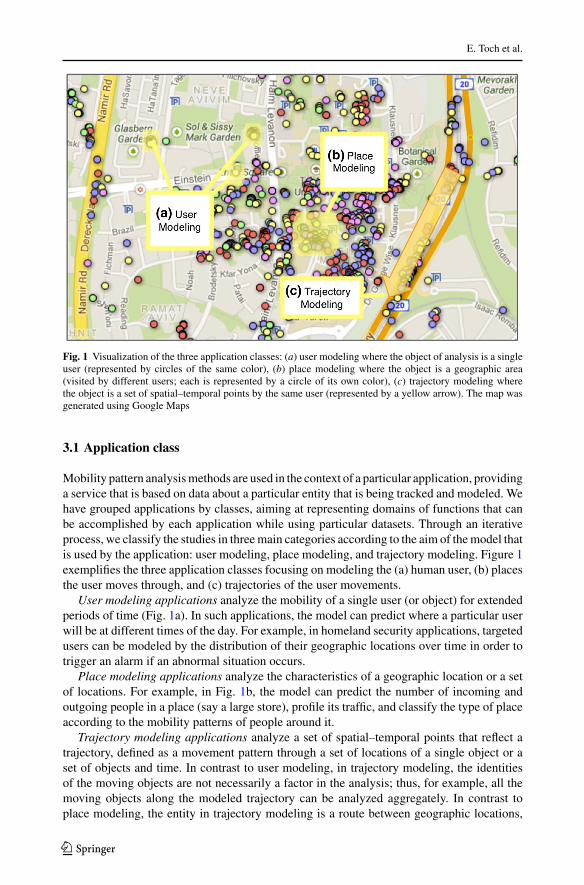
Fig. 1 Visualization of the three application classes: (a) user modeling where the object of analysis is a singleuser (represented by circles of the same color), (b) place modeling where the object is a geographic area(visited by different users; each is represented by a circle of its own color), (c) trajectory modeling wherethe object is a set of spatial–temporal points by the same user (represented by a yellow arrow). The map wasgenerated using Google Maps
3.1 Application class
Mobility pattern analysismethods are used in the context of a particular application, providinga service that is based on data about a particular entity that is being tracked and modeled. Wehave grouped applications by classes, aiming at representing domains of functions that canbe accomplished by each application while using particular datasets. Through an iterativeprocess, we classify the studies in threemain categories according to the aim of themodel thatis used by the application: user modeling, place modeling, and trajectory modeling. Figure 1exemplifies the three application classes focusing on modeling the (a) human user, (b) placesthe user moves through, and (c) trajectories of the user movements.
User modeling applications analyze the mobility of a single user (or object) for extendedperiods of time (Fig. 1a). In such applications, the model can predict where a particular userwill be at different times of the day. For example, in homeland security applications, targetedusers can be modeled by the distribution of their geographic locations over time in order totrigger an alarm if an abnormal situation occurs.
Place modeling applications analyze the characteristics of a geographic location or a setof locations. For example, in Fig. 1b, the model can predict the number of incoming andoutgoing people in a place (say a large store), profile its traffic, and classify the type of placeaccording to the mobility patterns of people around it.
Trajectory modeling applications analyze a set of spatial–temporal points that reflect atrajectory, defined as a movement pattern through a set of locations of a single object or aset of objects and time. In contrast to user modeling, in trajectory modeling, the identitiesof the moving objects are not necessarily a factor in the analysis; thus, for example, all themoving objects along the modeled trajectory can be analyzed aggregately. In contrast toplace modeling, the entity in trajectory modeling is a route between geographic locations,
123
Analyzing large-scale human mobility data: a survey of…
~ Mao
~ Ashbrook
~ Patterson~ Hariharan~ Kang~ Zhou 3
~ Eagle 2
~ Krumm 1
~ Liu
~ Sohn
~ Giannotti
~ Gonzalez
~ Rhee~ Shoval
~ Zheng 1
~ Eagle 1
~ Eagle 3
~ Krings
~ Pelekis
~ Reades
~ Wang
~ Cao~ Farrahi
~ Reddy
~ Zheng 2
~ Andrienko
~ Becker
~ Buthpitiya
~ Li ~ Castro
~ Etter
~ Phithakkitnukoon
~ Wei~ Yan
~ Zhu ~ Do 1
~ Krumm 2
~ Lin
~ Luo
~ Montoliu
~ Ying
~ Fan
~ Song ~ Scellato
~ Do 2~ Zhang 3
~ Cui
~ Grinberger~ Qu
~ Lichman~ Zhang
~ Zhang~ Wang
~ Song
1
10
100
1,000
10,000
100,000
1,000,000
2002 2004 2006 2008 2010 2012 2014 2016Year
log(
Num
bero
ftra
cked
obje
cts)
Application class Place modeling Trajectory modeling User modeling
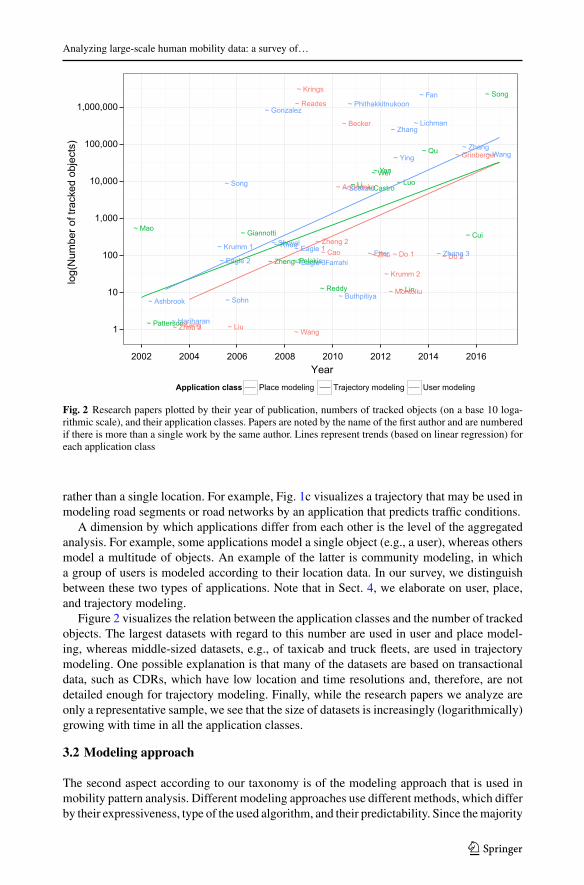
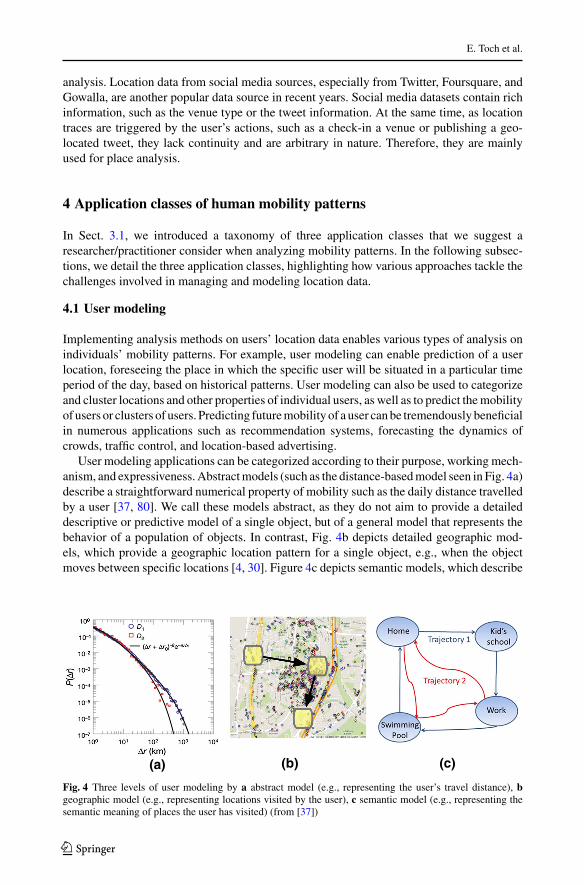
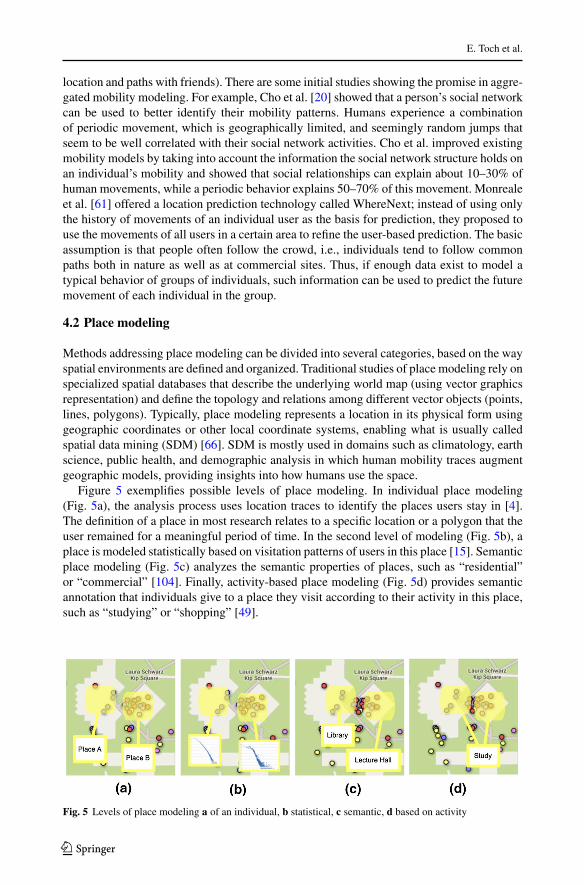
Fig. 2 Research papers plotted by their year of publication, numbers of tracked objects (on a base 10 loga-rithmic scale), and their application classes. Papers are noted by the name of the first author and are numberedif there is more than a single work by the same author. Lines represent trends (based on linear regression) foreach application class
rather than a single location. For example, Fig. 1c visualizes a trajectory that may be used inmodeling road segments or road networks by an application that predicts traffic conditions.
A dimension by which applications differ from each other is the level of the aggregatedanalysis. For example, some applications model a single object (e.g., a user), whereas othersmodel a multitude of objects. An example of the latter is community modeling, in whicha group of users is modeled according to their location data. In our survey, we distinguishbetween these two types of applications. Note that in Sect. 4, we elaborate on user, place,and trajectory modeling.
Figure 2 visualizes the relation between the application classes and the number of trackedobjects. The largest datasets with regard to this number are used in user and place model-ing, whereas middle-sized datasets, e.g., of taxicab and truck fleets, are used in trajectorymodeling. One possible explanation is that many of the datasets are based on transactionaldata, such as CDRs, which have low location and time resolutions and, therefore, are notdetailed enough for trajectory modeling. Finally, while the research papers we analyze areonly a representative sample, we see that the size of datasets is increasingly (logarithmically)growing with time in all the application classes.
3.2 Modeling approach
The second aspect according to our taxonomy is of the modeling approach that is used inmobility pattern analysis. Different modeling approaches use different methods, which differby their expressiveness, type of the used algorithm, and their predictability. Since themajority
123
E. Toch et al.
of the methods are based on machine learning, we classify the approaches into machinelearning methods, which apply either supervised or unsupervised learning, and non-machinelearning methods.
Table 2 organizes the papers according to the modeling approach, analysis method, andapplication class. The differentiation among non-machine learning methods is based on thegeneral approach of the model toward describing mobility data, whether it is in a generalizedor statistical manner. We call the first type of models “generalized” since they represent theentire mobility information by a compact set of formulas or rules that fit the data, or by a“gross” statistical description ofmobility properties, such as the daily travelled distance or theentropy measure of the random walks, rather than providing a detailed granular descriptionof individuals, places, or trajectories. Generalized models rely on a description of mobilitypatterns using universal models or laws, for example, the gravity law in Balcan et al. [5],continuous-time random walk in Song et al. [81], and Levi walks in Kagan and Ben-Gal [41,42], or using a set of rules [63, 77] or a social network [27]. Non-generalized (statistical)models may represent objects (e.g., moving objects, such as people, devices, or vehicles)by using structural schemes that specifically detail mobility information about the objects.These detailed models can characterize or predict the mobility of the object, e.g., a singleindividual, place, or trajectory using statistical models, e.g., regression [79] or Markovianmodels [59].
Machine learning methods can be categorized in a traditional manner to supervised andunsupervised learning, each of which provides a different descriptive and predictive abilityto model mobility patterns. In the supervised learning approach, the algorithm learns a set oftagged (labeled) data instances during the training phase in order to map the instances to theirlabels. Such mapping can then be used to predict new untagged instances. In unsupervisedlearning, labeled instances are not available, and themodel is used to group together instancesthat share the same common behavior (related to their mobility patterns in this case) and tofind similarities and dissimilarities in the data.
Supervised methods are common in user and place modeling, as these provide goodopportunities for obtaining labeled datasets of known users and known places, respectively.Labeled data can be collected automatically (e.g., Monreale et al. [61]) through a semi-manual process that includes some external ground truth, for example, in user modeling [48]or in place modeling by relying on the geographic properties of the places [23]. The mostcommon supervised modeling tasks are classification if the target variable is discrete (ordinalor categorical), and regression if the target variable is continuous. Classification can be used,for example, to find if a user (or a location) belongs to a known class of users (or places). Basedon the classes, the class of mobility patterns of a new user (or that describing a new place) canbe predicted. Possible classification applications focused on users can include location-basedservices, insurance plan optimization based on telematics profiles, and link analysis among agroup of users. Regression models can be used, for example, to predict the exact (numerical)location (say latitude and longitude) of a user or to estimate the expected mileage travelledper month for a specific user or within a specific mall. For both classification and regressionmethods, the output of the supervised model can be a class-conditional probability, where,e.g., in a classification problem, a user (or place) is associatedwith some probability to belongto one class or more. In such cases, a supervised model, such as a decision tree (e.g., CART,C4.5, J48, and CHAID), can estimate this class-conditional probability. Other supervisedmodels used to analyze mobility patterns are Bayesian classifiers, n-grams, random forest[44], and discriminant analysis functions, such as support vectormachines (SVMs) and neuralnets [34, 71], and recently also deep learning [102, 103].
123
Analyzing large-scale human mobility data: a survey of…
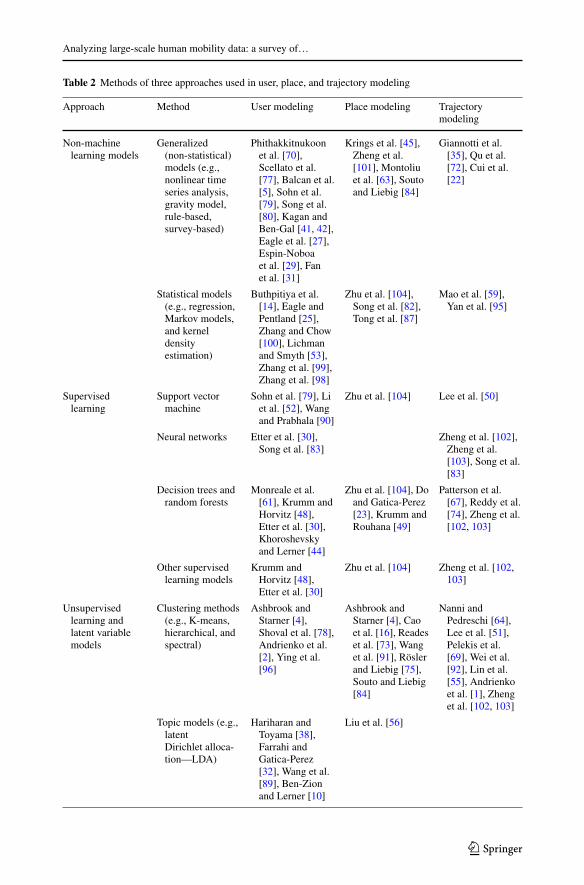
Table 2 Methods of three approaches used in user, place, and trajectory modeling
Approach Method User modeling Place modeling Trajectorymodeling
Non-machinelearning models
Generalized(non-statistical)models (e.g.,nonlinear timeseries analysis,gravity model,rule-based,survey-based)
Phithakkitnukoonet al. [70],Scellato et al.[77], Balcan et al.[5], Sohn et al.[79], Song et al.[80], Kagan andBen-Gal [41, 42],Eagle et al. [27],Espin-Noboaet al. [29], Fanet al. [31]
Krings et al. [45],Zheng et al.[101], Montoliuet al. [63], Soutoand Liebig [84]
Giannotti et al.[35], Qu et al.[72], Cui et al.[22]
Statistical models(e.g., regression,Markov models,and kerneldensityestimation)
Buthpitiya et al.[14], Eagle andPentland [25],Zhang and Chow[100], Lichmanand Smyth [53],Zhang et al. [99],Zhang et al. [98]
Zhu et al. [104],Song et al. [82],Tong et al. [87]
Mao et al. [59],Yan et al. [95]
Supervisedlearning
Support vectormachine
Sohn et al. [79], Liet al. [52], Wangand Prabhala [90]
Zhu et al. [104] Lee et al. [50]
Neural networks Etter et al. [30],Song et al. [83]
Zheng et al. [102],Zheng et al.[103], Song et al.[83]
Decision trees andrandom forests
Monreale et al.[61], Krumm andHorvitz [48],Etter et al. [30],Khoroshevskyand Lerner [44]
Zhu et al. [104], Doand Gatica-Perez[23], Krumm andRouhana [49]
Patterson et al.[67], Reddy et al.[74], Zheng et al.[102, 103]
Other supervisedlearning models
Krumm andHorvitz [48],Etter et al. [30]
Zhu et al. [104] Zheng et al. [102,103]
Unsupervisedlearning andlatent variablemodels
Clustering methods(e.g., K-means,hierarchical, andspectral)
Ashbrook andStarner [4],Shoval et al. [78],Andrienko et al.[2], Ying et al.[96]
Ashbrook andStarner [4], Caoet al. [16], Readeset al. [73], Wanget al. [91], Röslerand Liebig [75],Souto and Liebig[84]
Nanni andPedreschi [64],Lee et al. [51],Pelekis et al.[69], Wei et al.[92], Lin et al.[55], Andrienkoet al. [1], Zhenget al. [102, 103]
Topic models (e.g.,latentDirichlet alloca-tion—LDA)
Hariharan andToyama [38],Farrahi andGatica-Perez[32], Wang et al.[89], Ben-Zionand Lerner [10]
Liu et al. [56]
123
E. Toch et al.
Among the unsupervisedmachine learningmethods, themost popular are clusteringmeth-ods that are especially used in trajectory modeling. One reason for their popularity might bethe fact that these methods do not require any specialized ground truth or a priori knowledge,which is usually difficult to obtain with mobility data and is needed in supervised learning.Furthermore, the spatial–temporal properties of location tracks provide a natural distancemetric (often Euclidean although some information–theoretical measures can be used) thatlends itself easily to clustering. Clustering can be used, for example, to find how objects(users) are similar to each other with respect to their spatial–temporal trajectories, or trajec-tories of the same user are similar to each other [44]. Possible clustering applications caninclude carpooling services based on common trajectories (e.g., Uber), profiling of usersfor transportation and route planning, and collaborative filtering and other association rulestechniques to find which locations are often associated by their trajectories (e.g., how popu-lar is Central Park for people who visit the Statue of Liberty and Times Square) [71]. Otherunsupervised modeling can be exploited by latent variable models to learn human behaviorand lifestyle [10].
Due to the large dimensionality of the mobility data, various dimensionality reductionand feature selection techniques (such as principle component analysis) can be applied tofind which dimensions can best describe an object’s trajectory preferences or be used in aspecific application. Finally, causal modeling (e.g., Bayesian networks) can be used to findthe (possibly hidden) reason why some observed objects follow certain trajectories at certaintimes.
3.3 Tracking properties
All the studieswe surveyed analyze datasets of human location traces.However, these datasetsdiffer according to some tracking properties, such as the type of tracked object, trace time res-olution, and resolution and accuracy of the location positioning technology. These propertiesaffect the types of modeling methods that have to be selected and their performances, and theclasses of applications that can use the location data. Moreover, the type of tracked objectsmay dictate the purpose of the analysis. For example, datasets that are used to investigatethe mobility of taxicabs [17, 52, 59] can be used to better understand urban traffic, but canhardly be used to investigate social relations, whereas a dataset that holds tracks of individualpeople [21, 27] can be used for social network analysis.
We consider the resolution of mobility patterns according to two aspects: time resolution(frequencyof sampling) and location resolution (the spatial accuracyof the location traces).Atone end of the scale, there are analysismethods that rely on (almost) continuous representationor frequent location sampling using dedicated sensors, in which location is tracked everyseveral minutes [14]. At the other end of the scale, CDRs [3] provide sparse temporal recordsbecause they are often generated only when a communication event occurs,21 rendering cellphone users often “location invisible” at all other times [8]. Location resolution in whichlocation traces are recorded is another facet of the tracking method. GPS traces have anaccuracy of severalmeters, whereasCDRs provide traces that are coarse in space because theyexpress locations at the granularity of a cell tower sector, giving an uncertainty approximatelyone square mile or even higher in less populated areas. Thus, a dataset of location tracescollected with a dedicated GPS device will have higher location and time resolutions thana dataset of CDRs collected by mobile service providers. Dedicated GPS trackers provide
21 There are other paging policies that use time and spatial-based approaches for location management, e.g.,as in Krishnamachari et al. [46] and Xiao et al. [94].
123
Analyzing large-scale human mobility data: a survey of…
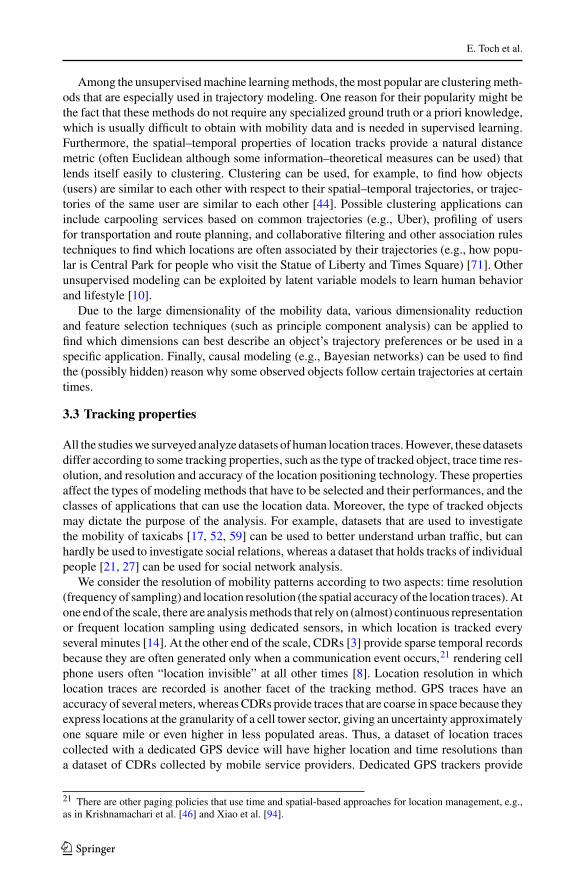
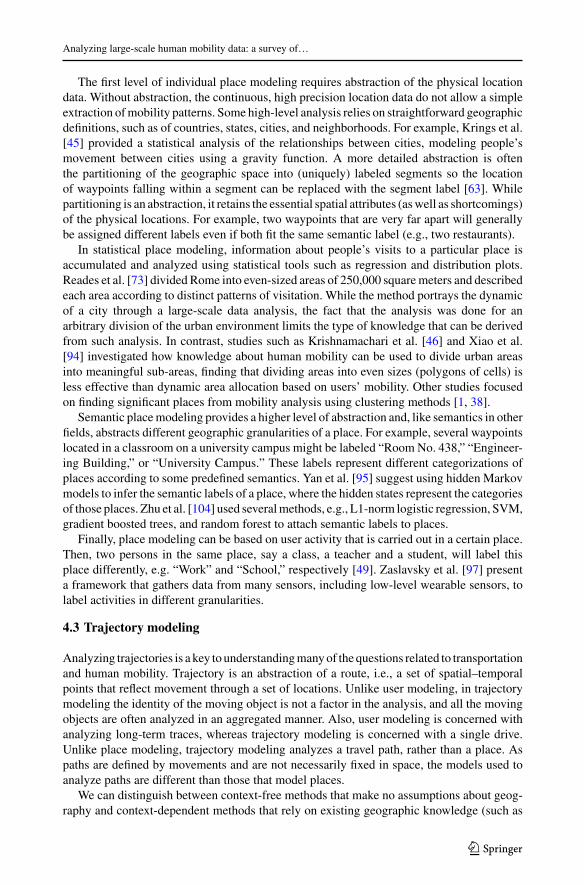
Fig. 3 Number of papers according to year and the source of the dataset
accurate and continuous tracking, whereas use of CDRs provides non-continuous, event-driven tracking, which is relatively inaccurate.
Inmany cases, there is a trade-off between the resolution and the scope of a dataset holdinginformation about trackedobjects. For example,CDRscan include information aboutmillionsof people, whereas dedicated GPS devices mostly use smaller samples. Moreover, the mobileoperators that collect the location data are often exposed only to the CDR-based locationsand not to the GPS-based ones because of privacy restrictions. Thus, a CDR dataset cannotbe used to accurately analyze small-scale movements, while in most cases, a GPS datasetcannot provide solid statistical profiles of an entire large population of users. The trackedobjects in the surveyed studies were mostly people or vehicles. People were tracked withCDR data [8, 37], dedicated GPS devices [4, 48], and lately GPS-equipped smartphones [31,55]. Vehicle tracking was carried out using GPS tracking of fleets of taxicabs [52, 59] ortrucks [35]. The largest datasets were CDR datasets, and the largest of which includes 1.6million users [31].
Figure 3 provides an overview of the use of different data sources in the papers that wesurvey. We see a gradual change in the type of dataset sources used by the works. While mostearlymethods from the 2000’swere using small datasets basedmostly on phone sensing usingdedicated hardware or software, other methods from that era were based on data derivedfrom car fleets and WiFi networks. The prevalence of tracking and positioning systems,especially in taxicab systems, gives rise to datasets, large in volume and duration. Papers thatanalyze taxicab datasets make a considerable part of recent works, providing many technicalachievements, mainly in trajectory and traffic analysis. However, they have some drawbacks.First, taxicab datasets are unlabeled and do not contain information about the types of places,characteristics of drivers and so on. Also, in most taxicab datasets, the identity of the driver orthe cab is not recorded (for privacy reasons), making the datasets mainly relevant to trajectory
123
E. Toch et al.
analysis. Location data from social media sources, especially from Twitter, Foursquare, andGowalla, are another popular data source in recent years. Social media datasets contain richinformation, such as the venue type or the tweet information. At the same time, as locationtraces are triggered by the user’s actions, such as a check-in a venue or publishing a geo-located tweet, they lack continuity and are arbitrary in nature. Therefore, they are mainlyused for place analysis.
4 Application classes of human mobility patterns
In Sect. 3.1, we introduced a taxonomy of three application classes that we suggest aresearcher/practitioner consider when analyzing mobility patterns. In the following subsec-tions, we detail the three application classes, highlighting how various approaches tackle thechallenges involved in managing and modeling location data.
4.1 User modeling
Implementing analysis methods on users’ location data enables various types of analysis onindividuals’ mobility patterns. For example, user modeling can enable prediction of a userlocation, foreseeing the place in which the specific user will be situated in a particular timeperiod of the day, based on historical patterns. User modeling can also be used to categorizeand cluster locations and other properties of individual users, as well as to predict themobilityof users or clusters of users. Predicting futuremobility of a user canbe tremendously beneficialin numerous applications such as recommendation systems, forecasting the dynamics ofcrowds, traffic control, and location-based advertising.
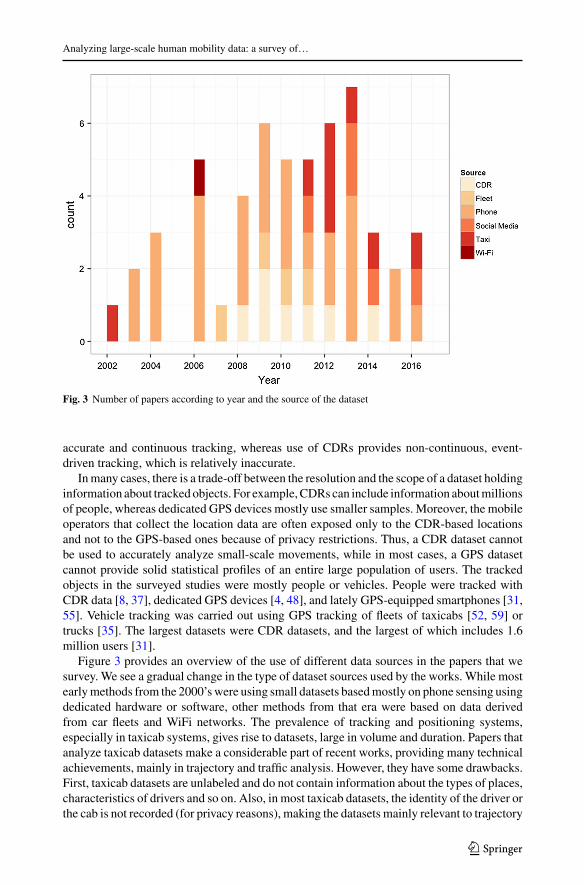
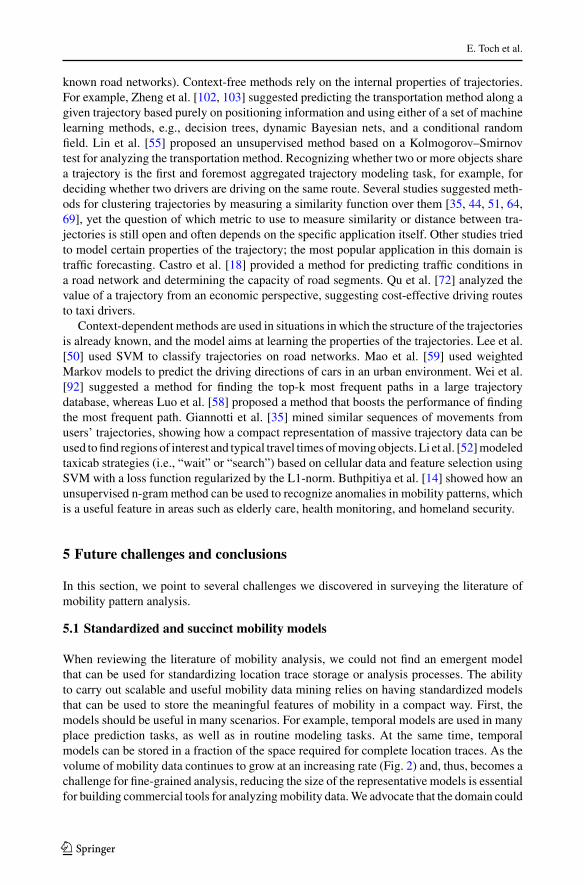
User modeling applications can be categorized according to their purpose, working mech-anism, and expressiveness.Abstractmodels (such as the distance-basedmodel seen in Fig. 4a)describe a straightforward numerical property of mobility such as the daily distance travelledby a user [37, 80]. We call these models abstract, as they do not aim to provide a detaileddescriptive or predictive model of a single object, but of a general model that represents thebehavior of a population of objects. In contrast, Fig. 4b depicts detailed geographic mod-els, which provide a geographic location pattern for a single object, e.g., when the objectmoves between specific locations [4, 30]. Figure 4c depicts semantic models, which describe
(a) (b) (c)
Fig. 4 Three levels of user modeling by a abstract model (e.g., representing the user’s travel distance), bgeographic model (e.g., representing locations visited by the user), c semantic model (e.g., representing thesemantic meaning of places the user has visited) (from [37])
123
Analyzing large-scale human mobility data: a survey of…
a mobility pattern of an object using common and meaningful categories of locations thathave semantic meaning for a place or activity, e.g., “home,” “work,” and “shopping” [32].
The vast majority of a user’s location predictions are based on modeling a location patternfor a single user using machine learning or other statistical models. To accomplish a locationprediction task, Sohn et al. [79] used two-step logistic regression; the first step predictswhether the user is stationary or not, and the second step whether that user is walking ordriving if they were initially predicted as not stationary. In next place prediction, the locationof an object in the near future is predicted according to data on its current location as well ason historical locations. Etter et al. [30] and Wang and Prabhala [90] proposed a user-specificpredictor that learns from the user mobility history and predicts, based on the current context,the next location the user will visit. Such prediction may be based on different machinelearning techniques, e.g., Bayesian methods [48], neural networks [30], and random forest[44]. Gonzalez et al. [37] demonstrated how Levy flight clustering could be used to predictthe user’s next location. Farrahi and Gatica-Perez [32] used topic models to predict the user’snext location with data that contain location, motion, and Bluetooth signals.
Probabilistic models were suggested for recognizing daily activities such as walking,driving, and working. These models were also used to build activity maps, i.e., maps thatclassify places according to the type of activity they represent such as work places, homes,and restaurants. Ekman et al. [28] faced the diversity of daily activities by modeling themusing several sub-models, representing work, home, and travel routines separately, and thenjoining them in a unified framework. Fan et al. [31] used tensor factorization to model andclassify routines of over 1.6 million people and to model how these routines change duringcatastrophic events, such as in the Great East Japan Earthquake of 2011.
Combining semantic information and geographic locations to create a semantic trajectoryfor modeling mobility can result in more robust models than if using either of these alone. Asemantic trajectory22 consists of a sequence of locations labeled with semantic tags (calledsemantic locations) that capture the meaning of the places passed by a user. These semantictags imply the activities being carried out along the trajectory. Consider Fig. 3c, wheretrajectories go through a number of locationswith semantic tags, such as “home,” “school,” or“work.” The figure exemplifies how semantic trajectories can be useful for mobilitymodelingand prediction. For example, let us assume that the two trajectories visualized in Fig. 3c areprevalent in the user’s routine. If the user leaves home and drops the kids at school on theway to work (Trajectory 1), then a mobility model can predict with high probability that theuser will stop at the swimming pool on the way back from work. However, if the user goesswimming on the way to work, then the model can assume that Trajectory 2 holds, and it canpredict that the user would not stop at the swimming pool on the way back from work. Anexample for a semantic model is the SemanPredict framework that combines geographic andsemantic information, showing promising results in location prediction using a small sample[96]. Another example is the mobile application Waze that starts to enrich its navigationcapability by asking the user questions at certain hours that are related to semantic tags, forexample, asking users in the morning: “Are you driving to work?”
Scaling mobility pattern analysis from a single user to multiple users is still an open ques-tion when considering themodels and usage. There are several ways to aggregate informationabout users, for example, in a geographic place (e.g., people living in a single house or inthe same city), having similar travel patterns (e.g., people who visit nightclubs on certainevenings), or relying on online social networks (e.g., Waze that enables users to share their
22 Note the difference to trajectory modeling (Sect. 4.3), in which moving objects along a route are analyzedtogether.
123
E. Toch et al.
location and paths with friends). There are some initial studies showing the promise in aggre-gated mobility modeling. For example, Cho et al. [20] showed that a person’s social networkcan be used to better identify their mobility patterns. Humans experience a combinationof periodic movement, which is geographically limited, and seemingly random jumps thatseem to be well correlated with their social network activities. Cho et al. improved existingmobility models by taking into account the information the social network structure holds onan individual’s mobility and showed that social relationships can explain about 10–30% ofhuman movements, while a periodic behavior explains 50–70% of this movement. Monrealeet al. [61] offered a location prediction technology called WhereNext; instead of using onlythe history of movements of an individual user as the basis for prediction, they proposed touse the movements of all users in a certain area to refine the user-based prediction. The basicassumption is that people often follow the crowd, i.e., individuals tend to follow commonpaths both in nature as well as at commercial sites. Thus, if enough data exist to model atypical behavior of groups of individuals, such information can be used to predict the futuremovement of each individual in the group.
4.2 Place modeling
Methods addressing place modeling can be divided into several categories, based on the wayspatial environments are defined and organized. Traditional studies of place modeling rely onspecialized spatial databases that describe the underlying world map (using vector graphicsrepresentation) and define the topology and relations among different vector objects (points,lines, polygons). Typically, place modeling represents a location in its physical form usinggeographic coordinates or other local coordinate systems, enabling what is usually calledspatial data mining (SDM) [66]. SDM is mostly used in domains such as climatology, earthscience, public health, and demographic analysis in which human mobility traces augmentgeographic models, providing insights into how humans use the space.
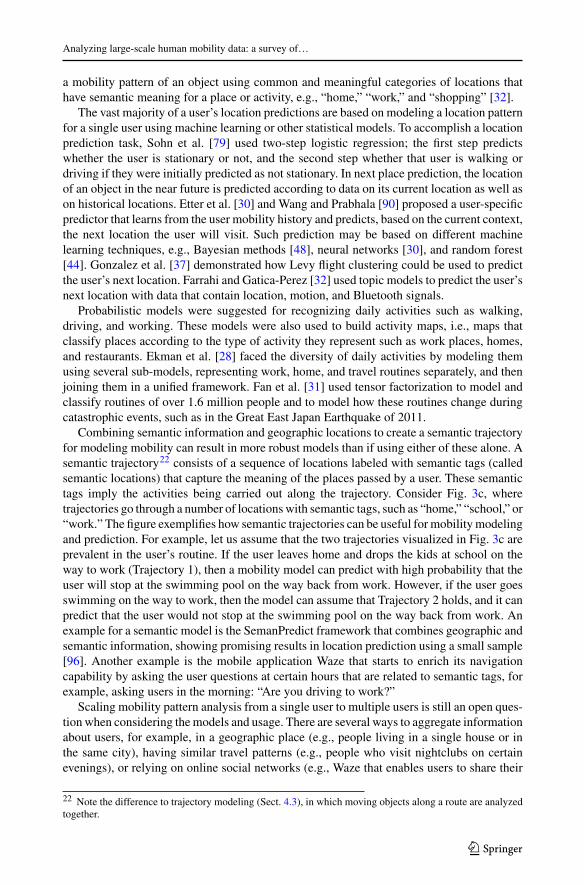
Figure 5 exemplifies possible levels of place modeling. In individual place modeling(Fig. 5a), the analysis process uses location traces to identify the places users stay in [4].The definition of a place in most research relates to a specific location or a polygon that theuser remained for a meaningful period of time. In the second level of modeling (Fig. 5b), aplace is modeled statistically based on visitation patterns of users in this place [15]. Semanticplace modeling (Fig. 5c) analyzes the semantic properties of places, such as “residential”or “commercial” [104]. Finally, activity-based place modeling (Fig. 5d) provides semanticannotation that individuals give to a place they visit according to their activity in this place,such as “studying” or “shopping” [49].
Fig. 5 Levels of place modeling a of an individual, b statistical, c semantic, d based on activity
123
Analyzing large-scale human mobility data: a survey of…
The first level of individual place modeling requires abstraction of the physical locationdata. Without abstraction, the continuous, high precision location data do not allow a simpleextraction ofmobility patterns. Some high-level analysis relies on straightforward geographicdefinitions, such as of countries, states, cities, and neighborhoods. For example, Krings et al.[45] provided a statistical analysis of the relationships between cities, modeling people’smovement between cities using a gravity function. A more detailed abstraction is oftenthe partitioning of the geographic space into (uniquely) labeled segments so the locationof waypoints falling within a segment can be replaced with the segment label [63]. Whilepartitioning is an abstraction, it retains the essential spatial attributes (aswell as shortcomings)of the physical locations. For example, two waypoints that are very far apart will generallybe assigned different labels even if both fit the same semantic label (e.g., two restaurants).
In statistical place modeling, information about people’s visits to a particular place isaccumulated and analyzed using statistical tools such as regression and distribution plots.Reades et al. [73] divided Rome into even-sized areas of 250,000 squaremeters and describedeach area according to distinct patterns of visitation. While the method portrays the dynamicof a city through a large-scale data analysis, the fact that the analysis was done for anarbitrary division of the urban environment limits the type of knowledge that can be derivedfrom such analysis. In contrast, studies such as Krishnamachari et al. [46] and Xiao et al.[94] investigated how knowledge about human mobility can be used to divide urban areasinto meaningful sub-areas, finding that dividing areas into even sizes (polygons of cells) isless effective than dynamic area allocation based on users’ mobility. Other studies focusedon finding significant places from mobility analysis using clustering methods [1, 38].
Semantic placemodeling provides a higher level of abstraction and, like semantics in otherfields, abstracts different geographic granularities of a place. For example, several waypointslocated in a classroom on a university campus might be labeled “Room No. 438,” “Engineer-ing Building,” or “University Campus.” These labels represent different categorizations ofplaces according to some predefined semantics. Yan et al. [95] suggest using hidden Markovmodels to infer the semantic labels of a place, where the hidden states represent the categoriesof those places. Zhu et al. [104] used severalmethods, e.g., L1-norm logistic regression, SVM,gradient boosted trees, and random forest to attach semantic labels to places.
Finally, place modeling can be based on user activity that is carried out in a certain place.Then, two persons in the same place, say a class, a teacher and a student, will label thisplace differently, e.g. “Work” and “School,” respectively [49]. Zaslavsky et al. [97] presenta framework that gathers data from many sensors, including low-level wearable sensors, tolabel activities in different granularities.
4.3 Trajectory modeling
Analyzing trajectories is a key to understandingmanyof the questions related to transportationand human mobility. Trajectory is an abstraction of a route, i.e., a set of spatial–temporalpoints that reflect movement through a set of locations. Unlike user modeling, in trajectorymodeling the identity of the moving object is not a factor in the analysis, and all the movingobjects are often analyzed in an aggregated manner. Also, user modeling is concerned withanalyzing long-term traces, whereas trajectory modeling is concerned with a single drive.Unlike place modeling, trajectory modeling analyzes a travel path, rather than a place. Aspaths are defined by movements and are not necessarily fixed in space, the models used toanalyze paths are different than those that model places.
We can distinguish between context-free methods that make no assumptions about geog-raphy and context-dependent methods that rely on existing geographic knowledge (such as
123
E. Toch et al.
known road networks). Context-free methods rely on the internal properties of trajectories.For example, Zheng et al. [102, 103] suggested predicting the transportation method along agiven trajectory based purely on positioning information and using either of a set of machinelearning methods, e.g., decision trees, dynamic Bayesian nets, and a conditional randomfield. Lin et al. [55] proposed an unsupervised method based on a Kolmogorov–Smirnovtest for analyzing the transportation method. Recognizing whether two or more objects sharea trajectory is the first and foremost aggregated trajectory modeling task, for example, fordeciding whether two drivers are driving on the same route. Several studies suggested meth-ods for clustering trajectories by measuring a similarity function over them [35, 44, 51, 64,69], yet the question of which metric to use to measure similarity or distance between tra-jectories is still open and often depends on the specific application itself. Other studies triedto model certain properties of the trajectory; the most popular application in this domain istraffic forecasting. Castro et al. [18] provided a method for predicting traffic conditions ina road network and determining the capacity of road segments. Qu et al. [72] analyzed thevalue of a trajectory from an economic perspective, suggesting cost-effective driving routesto taxi drivers.
Context-dependent methods are used in situations in which the structure of the trajectoriesis already known, and the model aims at learning the properties of the trajectories. Lee et al.[50] used SVM to classify trajectories on road networks. Mao et al. [59] used weightedMarkov models to predict the driving directions of cars in an urban environment. Wei et al.[92] suggested a method for finding the top-k most frequent paths in a large trajectorydatabase, whereas Luo et al. [58] proposed a method that boosts the performance of findingthe most frequent path. Giannotti et al. [35] mined similar sequences of movements fromusers’ trajectories, showing how a compact representation of massive trajectory data can beused tofind regions of interest and typical travel times ofmovingobjects. Li et al. [52]modeledtaxicab strategies (i.e., “wait” or “search”) based on cellular data and feature selection usingSVM with a loss function regularized by the L1-norm. Buthpitiya et al. [14] showed how anunsupervised n-grammethod can be used to recognize anomalies in mobility patterns, whichis a useful feature in areas such as elderly care, health monitoring, and homeland security.
5 Future challenges and conclusions
In this section, we point to several challenges we discovered in surveying the literature ofmobility pattern analysis.
5.1 Standardized and succinct mobility models
When reviewing the literature of mobility analysis, we could not find an emergent modelthat can be used for standardizing location trace storage or analysis processes. The abilityto carry out scalable and useful mobility data mining relies on having standardized modelsthat can be used to store the meaningful features of mobility in a compact way. First, themodels should be useful in many scenarios. For example, temporal models are used in manyplace prediction tasks, as well as in routine modeling tasks. At the same time, temporalmodels can be stored in a fraction of the space required for complete location traces. As thevolume of mobility data continues to grow at an increasing rate (Fig. 2) and, thus, becomes achallenge for fine-grained analysis, reducing the size of the representative models is essentialfor building commercial tools for analyzingmobility data.We advocate that the domain could
123
Analyzing large-scale human mobility data: a survey of…
benefit from a standard format to manage mobility analysis in Hadoop or in other big-datainfrastructures.
5.2 End user applications
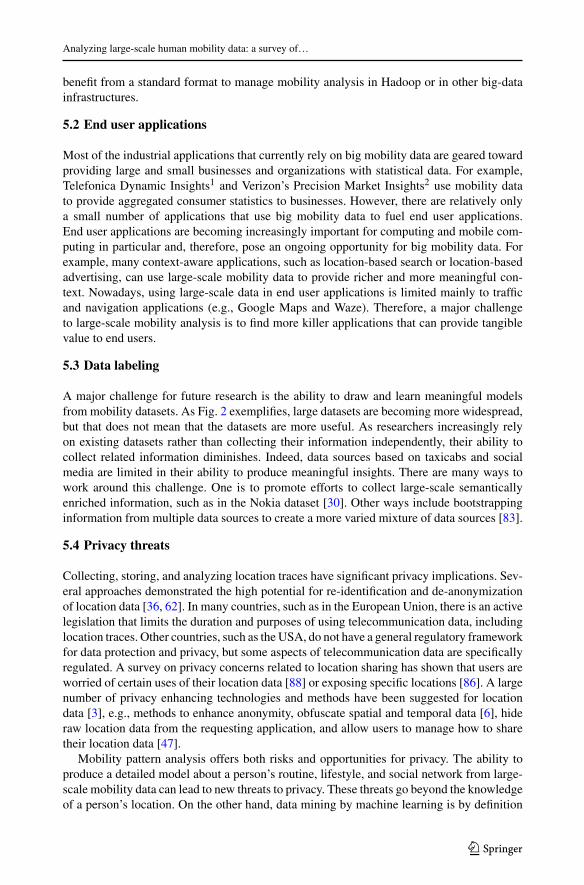
Most of the industrial applications that currently rely on big mobility data are geared towardproviding large and small businesses and organizations with statistical data. For example,Telefonica Dynamic Insights1 and Verizon’s Precision Market Insights2 use mobility datato provide aggregated consumer statistics to businesses. However, there are relatively onlya small number of applications that use big mobility data to fuel end user applications.End user applications are becoming increasingly important for computing and mobile com-puting in particular and, therefore, pose an ongoing opportunity for big mobility data. Forexample, many context-aware applications, such as location-based search or location-basedadvertising, can use large-scale mobility data to provide richer and more meaningful con-text. Nowadays, using large-scale data in end user applications is limited mainly to trafficand navigation applications (e.g., Google Maps and Waze). Therefore, a major challengeto large-scale mobility analysis is to find more killer applications that can provide tangiblevalue to end users.
5.3 Data labeling
A major challenge for future research is the ability to draw and learn meaningful modelsfrom mobility datasets. As Fig. 2 exemplifies, large datasets are becoming more widespread,but that does not mean that the datasets are more useful. As researchers increasingly relyon existing datasets rather than collecting their information independently, their ability tocollect related information diminishes. Indeed, data sources based on taxicabs and socialmedia are limited in their ability to produce meaningful insights. There are many ways towork around this challenge. One is to promote efforts to collect large-scale semanticallyenriched information, such as in the Nokia dataset [30]. Other ways include bootstrappinginformation from multiple data sources to create a more varied mixture of data sources [83].
5.4 Privacy threats
Collecting, storing, and analyzing location traces have significant privacy implications. Sev-eral approaches demonstrated the high potential for re-identification and de-anonymizationof location data [36, 62]. In many countries, such as in the European Union, there is an activelegislation that limits the duration and purposes of using telecommunication data, includinglocation traces. Other countries, such as the USA, do not have a general regulatory frameworkfor data protection and privacy, but some aspects of telecommunication data are specificallyregulated. A survey on privacy concerns related to location sharing has shown that users areworried of certain uses of their location data [88] or exposing specific locations [86]. A largenumber of privacy enhancing technologies and methods have been suggested for locationdata [3], e.g., methods to enhance anonymity, obfuscate spatial and temporal data [6], hideraw location data from the requesting application, and allow users to manage how to sharetheir location data [47].
Mobility pattern analysis offers both risks and opportunities for privacy. The ability toproduce a detailed model about a person’s routine, lifestyle, and social network from large-scale mobility data can lead to new threats to privacy. These threats go beyond the knowledgeof a person’s location. On the other hand, data mining by machine learning is by definition
123
E. Toch et al.
a knowledge aggregation process, which can lead to development of new privacy enhancingtechnologies. For instance, replacing raw location data with semantic places can lead to betterprivacy protection and stronger anonymity. Thus, privacy poses several questions to mobilitydata analysis: Can privacy threats be understood and quantified from mobility data mining?How can we build tools that empower users to manage their mobility privacy? And how canmobility analysis be used as a tool to enhance privacy?
5.5 Conclusions
In this work, we reviewed more than 100 papers that analyze location traces to learn humanmobility patterns. Due to a huge increase in the volume of work on mobility pattern analysis,as well as an increase in diversification of applications and methods, we acknowledge theneed to provide better ways to understand this emerging field. The challenge of miningsignificant patterns within this large-scale, high-dimensional mobility data led us to focusour survey on machine learning methods, which excel in such challenges. We examinedcommon categorization approaches in the field, often executed according to the propertiesof the location traces, together with analysis methods and models, and various potentialapplications for such analyses. Our taxonomy reveals three major classes of applications:user modeling, place modeling, and trajectory modeling. While it is impossible to find aclear-cut distinction between these classes, analyzing studies through our taxonomy can helpresearchers and practitioners to better find and understand mobility modeling technologiesand evaluation studies. Finally, we also discussed several important challenges that are criticalfor future advancement of this new and fascinating research field.
Acknowledgements This work is supported by the Israeli Ministry of Science, Technology, and Space, GrantNo. 3-8709: Learning and mining mobility patterns using stochastic models. We would like to thank OmerBarak and Gabriella Cohen for their help in collecting data for the survey.
References
1. Andrienko G, Andrienko N, Hurter C, Rinzivillo S, Wrobel S (2011) From movement tracks throughevents to places: extracting and characterizing significant places from mobility data. In: 2011 IEEEconference on visual analytics science and technology (VAST). IEEE, pp 161–170
2. Andrienko N, Andrienko G, Stange H, Liebig T, Hecker D (2012) Visual analytics for understandingspatial situations from episodic movement data. Künstliche Intell 26(3):241–251
3. Andrienko G, Divanis AG, Gruteser M, Kopp C, Liebig T, Rechert K (2013) Report from Dagstuhl: theliberation of mobile location data and its implications for privacy research. ACM SIGMOBILE MobComput Commun Rev 17(2):7–18
4. Ashbrook D, Starner T (2003) Using GPS to learn significant locations and predict movement acrossmultiple users. Pers Ubiquitous Comput 7(5):275–286
5. BalcanD,ColizzaV,GonçalvesB,HuH,Ramasco JJ,VespignaniA (2009)Multiscalemobility networksand the spatial spreading of infectious diseases. Proc Natl Acad Sci 106(51):21484–21489
6. Barak O, Cohen G, Toch E (2016) Anonymizing mobility data using semantic cloaking. Pervasive MobComput 28:102–112
7. Barnes RM (1958) Time and motion study. Wiley, New York8. Becker RA, Caceres R, Hanson K, Loh JM, Urbanek S, Varshavsky A, Volinsky C (2011) A tale of one
city: using cellular network data for urban planning. IEEE Pervasive Comput 10(4):18–269. Bengtsson L, Lu X, Thorson A, Garfield R, Von Schreeb J (2011) Improved response to disasters
and outbreaks by tracking population movements with mobile phone network data: a post-earthquakegeospatial study in Haiti. PLoS Med 8(8):1001083
10. Ben-Zion E, Lerner B (2017) Learning human behaviors and lifestyle by capturing temporal relationsin mobility patterns. In: Proceedings of the European symposium on artificial networks, computationalintelligence and machine learning (ESANN), Bruges
123
Analyzing large-scale human mobility data: a survey of…
11. Berlingerio M, Calabrese F, Di Lorenzo G, Nair R, Pinelli F, Sbodio ML (2013) Allaboard: a systemfor exploring urban mobility and optimizing public transport using cellphone data. In: Machine learningand knowledge discovery in databases. Springer, pp 663–666
12. Bricka SG, Sen S, Paleti R, Bhat CR (2012) An analysis of the factors influencing differences in survey-reported and GPS-recorded trips. Transp Res Part C Emerg Technol 21(1):67–88
13. BrockmannD,Hufnagel L,Geisel T (2006)The scaling laws of human travel.Nature 439(7075):462–46514. Buthpitiya S, Zhang Y, Dey AK, Griss M (2011) n-gram geo-trace modeling. In: Lyons K, Hightower J,
Huang EM (eds) Pervasive computing. Lecture notes in computer science, vol 6696. Springer, Berlin,pp 97–114
15. Calabrese F, Colonna M, Lovisolo P, Parata D, Ratti C (2011) Real-time urban monitoring using cellphones: a case study in Rome. IEEE Trans Intell Transp Syst 12(1):141–151
16. Cao X, Cong G, Jensen CS (2010) Mining significant semantic locations from GPS data. Proc VLDBEndow 3:1009–1020
17. Castro PS, Zhang D, Chen C, Li S, Pan G (2013) From taxi GPS traces to social and communitydynamics: a survey. ACM Comput Surv (CSUR) 46(2):17
18. Castro PS, ZhangD, Li S (2012) Urban trafficmodelling and prediction using large scale taxi GPS traces.In: Pervasive computing. Lecture notes in computer science, vol 7319. Springer, Berlin, pp 57–72
19. Cheng AJ, Chen YY, Huang YT, Hsu WH, Liao HYM (2011) Personalized travel recommendationby mining people attributes from community-contributed photos. In: Proceedings of the 19th ACMinternational conference on multimedia. ACM, pp 83–92
20. Cho E, Myers SA, Leskovec J (2011) Friendship and mobility: user movement in location-based socialnetworks. In: Proceedings of the 17th ACM SIGKDD international conference on knowledge discoveryand data mining. ACM, pp 1082–1090
21. Cranshaw J, Toch E, Hong J, Kittur A, Sadeh N (2010) Bridging the gap between physical locationand online social networks. In: Proceedings of the 12th ACM international conference on ubiquitouscomputing. ACM, pp 119–128
22. Cui J, Liu F, Janssens D, An S, Wets G, Cools M (2016) Detecting urban road network accessibilityproblems using taxi GPS data. J Transp Geogr 51:147–157
23. Do T-M-T, Gatica-Perez D (2013) The places of our lives: visiting patterns and automatic labeling fromlongitudinal smartphone data, Technical report EPFL-ARTICLE-192391
24. Douglass CJ, Bovls HW (1957) Predicting local travel in urban regions. Pap Reg Sci 3(1):183–19725. Eagle N, Pentland AS (2006) Reality mining: sensing complex social systems. Pers Ubiquitous Comput
10(4):255–26826. Eagle N, Pentland AS (2009) Eigenbehaviors: identifying structure in routine. Behav Ecol Sociobiol
63(7):1057–106627. Eagle N, Pentland AS, Lazer D (2009) Inferring friendship network structure by using mobile phone
data. Proc Natl Acad Sci 106(36):15274–1527828. Ekman F, Keränen, A, Karvo J, Ott J (2008) Working day movement model. In: Proceedings of the 1st
ACM SIGMOBILE workshop on mobility models. ACM, pp 33–4029. Espin-Noboa L, Lemmerich F, Singer P, Strohmaier M (2016) Discovering and characterizing mobility
patterns in urban spaces: a study of Manhattan taxi data. In: WWW’16 companion, pp 537–54230. Etter V, Kafsi M, Kazemi E (2012) Been there, done that: What your mobility traces reveal about your
behavior. In: Mobile data challenge by Nokia Workshop, in conjunction with international conferenceon pervasive computing, number EPFL-CONF-178426
31. Fan Z, Song X, Shibasaki R (2014) CitySpectrum: a non-negative tensor factorization approach. In:Proceedings of the 2014 ACM international joint conference on pervasive and ubiquitous computing.ACM, pp 213–223
32. Farrahi K, Gatica-Perez D (2011) Discovering routines from large-scale human locations using proba-bilistic topic models. ACM Trans Intell Syst Technol (TIST) 2(1):3
33. Frias-Martinez V, Soguero-Ruiz C, Frias-Martinez E, Josephidou M (2013) Forecasting socioeconomictrends with cell phone records. In: Proceedings of the 3rd ACM symposium on computing for develop-ment. ACM
34. Hastie T, Tibshirani R, Friedman J (2009) The elements of statistical learning, data mining, inference,and prediction. Springer series in statistics. Springer, Berlin
35. Giannotti F, Nanni M, Pedreschi D, Pinelli F (2007) Trajectory pattern mining. In: Proceedings ofthe 13th ACM SIGKDD international conference on knowledge discovery and data mining. ACM, pp330–339
36. Golle P, Partridge K (2009) On the anonymity of home/work location pairs. In: Tokuda H et al. (eds)Pervasive, LNCS 5538. Springer, pp 390–397
123
E. Toch et al.
37. Gonzalez MC, Hidalgo CA, Barabasi A-L (2008) Understanding individual human mobility patterns.Nature 453(7196):779–782
38. Hariharan R, Toyama K (2004) Project lachesis: parsing and modeling location histories. In: EgenhoferMJ et al. (eds) Geographic information science, LNCS 3234. Springer, pp 106–124
39. Jensen B, Larsen JE, Jensen K, Larsen J, Hansen LK (2010) Estimating human predictability frommobile sensor data. In: 2010 IEEE international workshop on machine learning for signal processing(MLSP). IEEE, pp 196–201
40. Jiang S, Fiore GA, Yang Y, Ferreira Jr. J, Frazzoli E, González MC (2013) A review of urban computingfor mobile phone traces: current methods, challenges and opportunities. In: Proceedings of the 2nd ACMSIGKDD international workshop on urban computing. ACM, p 2
41. Kagan E, Ben-Gal I (2013) Probabilistic search for tracking targets: theory and modern applications.Wiley, Hoboken
42. Kagan E, Ben-Gal I (2015) Search and foraging: individual motion and swarm dynamics. CRC Press,Boca Raton
43. Kitamura R, Chen C, Pendyala RM, Narayanan R (2000) Micro-simulation of daily activity-travelpatterns for travel demand forecasting. Transportation 27(1):25–51
44. Khoroshevsky F, Lerner B (2017) Human mobility-pattern discovery and next-place prediction fromGPS data. In: Schwenker F, Scherer S (eds) Multimodal pattern recognition of social signals in humancomputer interaction (MPRSS). Lecture notes in computer science, vol 10183. Springer, Berlin
45. Krings G, Calabrese F, Ratti C, Blondel VD (2009) Urban gravity: a model for inter-city telecommuni-cation flows. J Stat Mech Theory Exp 2009(07):L07003
46. Krishnamachari B, Gau R-H, Wicker SB, Haas ZJ (2004) Optimal sequential paging in cellular wirelessnetworks. Wirel Netw 10(2):121–131
47. Krumm J (2009) A survey of computational location privacy. Pers Ubiquitous Comput 13(6):391–39948. Krumm J, Horvitz E (2006) Predestination: inferring destinations from partial trajectories. In: UbiComp
2006: ubiquitous computing. Springer, pp 243–26049. Krumm J, Rouhana D (2013) Placer: semantic place labels from diary data. In: Proceedings of the 2013
ACM international joint conference on pervasive and ubiquitous computing. ACM, pp 163–17250. Lee J-G, Han J, Li X, Cheng H (2011) Mining discriminative patterns for classifying trajectories on road
networks. IEEE Trans Knowl Data Eng 23(5):713–72651. Lee J-G,Han J,WhangK-Y (2007) Trajectory clustering:A partition-and-group framework. In: Proceed-
ings of the 2007 ACM SIGMOD international conference on management of data. ACM, pp 593–60452. Li B, Zhang D, Sun L, Chen C, Li S, Qi G, Yang Q (2011) Hunting or waiting? Discovering passenger-
finding strategies from a large-scale real-world taxi dataset. In: 2011 IEEE international conference onpervasive computing and communications workshops (PERCOM workshops). IEEE, pp 63–68
53. Lichman M, Smyth P (2014) Modeling human location data with mixtures of kernel densities. In Pro-ceedings of the 20th ACM SIGKDD international conference on knowledge discovery and data mining.ACM, pp 35–44
54. LinM,HsuW-J (2014)MiningGPS data formobility patterns: a survey. PervasiveMobComput 12:1–1655. Lin M, Hsu W-J, Lee ZQ (2013) Detecting modes of transport from unlabelled positioning sensor data.
J Locat Based Serv 7(4):272–29056. Liu H, Darabi H, Banerjee P, Liu J (2007) Survey of wireless indoor positioning techniques and systems.
IEEE Tran Syst Man Cybern Part C (Appl Rev) 37(6):1067–108057. Lu X, Bengtsson L, Holme P (2012) Predictability of population displacement after the 2010 Haiti
earthquake. Proc Natl Acad Sci 109(29):11576–1158158. Luo W, Tan H, Chen L, Ni LM (2013) Finding time period-based most frequent path in big trajectory
data. In: Proceedings of the 2013 ACM SIGMOD international conference on management of data.ACM, pp 713–724
59. Mao B, Cao J, Wu Z, Huang G, Li J (2012) Predicting driving direction with weighted Markov model.In: Advanced data mining and applications. Springer, pp 407–418
60. Mazimpaka JD, Timpf S (2006) Trajectory data mining: a review of methods and applications. J SpatInf Sci 2006(06):61–69
61. Monreale A, Pinelli F, Trasarti R, Giannotti F (2009) WhereNext: a location predictor on trajectorypattern mining. In: Proceedings of the 15th ACM SIGKDD international conference on knowledgediscovery and data mining. ACM, pp 637–646
62. Montjoye Y-A, Hidalgo CA, Verleysen M, Blondel VD (2013) Unique in the crowd: the privacy boundsof human mobility. Sci Rep 3:1376
63. Montoliu R, Blom J, Gatica-Perez D (2013) Discovering places of interest in everyday life from smart-phone data. Multimed Tools Appl 62(1):179–207
123
Analyzing large-scale human mobility data: a survey of…
64. Nanni M, Pedreschi D (2006) Time-focused clustering of trajectories of moving objects. J Intell Inf Syst27(3):267–289
65. Oloritun RO, Ouarda TB, Moturu S, Madan A, Pentland AS, Khayal I (2013) Change in BMI accuratelypredicted by social exposure to acquaintances. PLoS ONE 8(11):79238
66. Orlov YL, Filippov VP, Potapov VN, Kolchanov NA (2002) Construction of stochastic context trees forgenetic texts. Silico Biol 2(3):233–247
67. Patterson DJ, Ding X, Kaufman SJ, Liu K, Zaldivar A (2009) An ecosystem for learning and usingsensor-driven IM status messages. IEEE Pervasive Comput 8(4):42–49
68. PejovicV,MusolesiM (2015)Anticipatorymobile computing: a survey of the state of the art and researchchallenges. ACM Comput Surveys (CSUR) 47(3):47
69. Pelekis N, Kopanakis I, Kotsifakos EE, Frentzos E, Theodoridis Y (2009) Clustering trajectories ofmoving objects in an uncertainworld. In:Ninth IEEE international conference on datamining (ICDM09).IEEE, pp 417–427
70. Phithakkitnukoon S, Smoreda Z, Olivier P (2012) Socio-geography of human mobility: a study usinglongitudinal mobile phone data. PLoS ONE 7(6):39253
71. Poushter J (2016) Smartphone ownership and internet usage continues to climb in emerging economies,Pew Research Center
72. Qu M, Zhu H, Liu J, Liu G, Xiong H (2014) A cost-effective recommender system for taxi drivers.In: Proceedings of the 20th ACM SIGKDD international conference on knowledge discovery and datamining. ACM, pp 45–54
73. Reades J, Calabrese F, Sevtsuk A, Ratti C (2007) Cellular census: explorations in urban data collection.Pervasive Comput IEEE 6(3):30–38
74. Reddy S, Mun M, Burke J, Estrin D, Hansen M, Srivastava M (2010) Using mobile phones to determinetransportation modes. ACM Trans Sens Netw (TOSN) 6(2):13
75. Rösler R, Liebig T (2013) Using data from location based social networks for urban activity clustering.In: Vandenbroucke D, Bucher B, Crompvoets J (eds) Geographic information science at the heart ofEurope. Lecture notes in geoinformation and cartography. Springer, Berlin
76. Sadilek A, Krumm J, Horvitz E (2013) Crowdphysics: planned and opportunistic crowdsourcing forphysical tasks. In: Seventh international AAAI conference on weblogs and social media
77. Scellato S, Musolesi M, Mascolo C, Latora V, Campbell AT (2011) Nextplace: a spatio-temporal predic-tion framework for pervasive systems. In: International conference on pervasive computing. Springer,Berlin, pp 152–169
78. Shoval N et al (2008) The use of advanced tracking technologies for the analysis of mobility inAlzheimer’s disease and related cognitive diseases. BMC Geriatr 8(1):7
79. Sohn T, VarshavskyA, LaMarcaA, ChenMY, Choudhury T, Smith I, Consolvo S, Hightower J, GriswoldWG, De Lara E (2006) Mobility detection using everyday GSM traces. In: UbiComp 2006: ubiquitouscomputing, LNCS 4206. Springer, pp 212–224
80. Song C, Qu Z, Blumm N, Barabási AL (2010) Limits of predictability in human mobility. Science327(5968):1018–1021
81. Song C, Koren T, Wang P, Barabási AL (2010) Modeling the scaling properties of human mobility. NatPhys 6:818–823
82. Song L, Kotz D, Jain R, He X (2006) Evaluating next-cell predictors with extensiveWi-Fi mobility data.IEEE Trans Mob Comput 5(12):1633–1649
83. Song X, Shibasaki R, Yuan NJ, Xie X, Li T, Adachi R (2017) DeepMob: learning deep knowledge ofhuman emergency behavior and mobility from big and heterogeneous data. ACM Trans Inf Syst (TOIS)35(4):41
84. Souto G, Liebig T (2016) On event detection from spatial time series for urban traffic applications. In:Michaelis S, Piatkowski N, StolpeM (eds) Solving large scale learning tasks. Challenges and algorithms.Lecture notes in computer science, vol 9580. Springer
85. Szalai A (1966) Trends in comparative time-budget research. Am Behav Sci 9(9):3–886. Toch E, Cranshaw J, Drielsma PH, Tsai JY, Kelley PG, Springfield J, Cranor L, Hong J, Sadeh N
(2010), Empirical models of privacy in location sharing. In: Proceedings of the 12th ACM internationalconference on ubiquitous computing, Ubicomp 10. ACM, New York, pp 129–138
87. Tong Y, Chen Y, Zhou Z, Chen L, Wang J, Yang, Q, Lv W (2017) The simpler the better: a unifiedapproach to predicting original taxi demands based on large-scale online platforms. In: Proceedings ofthe 23rd ACM SIGKDD international conference on knowledge discovery and data mining. ACM, pp1653–1662
88. Tsai JY,Kelley PG,CranorLF, SadehN (2010)Location-sharing technologies: privacy risks and controls.I/S J Law Policy Inf Soc 6:119
123
E. Toch et al.
89. Wang H, Fu Y,Wang Q, Yin H, Du C, Xiong H (2017) A location-sentiment-aware recommender systemfor both home-town and out-of-town users. In: Proceedings of the 23rd ACM SIGKDD internationalconference on knowledge discovery and data mining. ACM, pp 1135–1143
90. Wang J, Prabhala B (2012) Periodicity based next place prediction. In: Proceeding of the Nokia mobiledata challenge workshop
91. Wang P, González MC, Hidalgo CA, Barabási A-L (2009) Understanding the spreading patterns ofmobile phone viruses. Science 324(5930):1071–1076
92. Wei LY, Zheng Y, Peng WC (2012) Constructing popular routes from uncertain trajectories. In: Pro-ceedings of the 18th ACM SIGKDD international conference on knowledge discovery and data mining.ACM, pp 195–203
93. Wesolowski A, Eagle N, Tatem AJ, Smith DL, Noor AM, Snow RW, Buckee CO (2012) Quantifyingthe impact of human mobility on malaria. Science 338(6104):267–270
94. Xiao Y, Pan Y, Li J (2004) Design and analysis of location management for 3G cellular networks. IEEETrans Parallel Distrib Syst 15(4):339–349
95. Yan Z, Chakraborty D, Parent C, Spaccapietra S, Aberer K (2013) Semantic trajectories: mobility datacomputation and annotation. ACM Trans Intell Syst Technol (TIST) 4(3):49
96. Ying JJ-C, Lee W-C, Tseng VS (2013) Mining geographic-temporal-semantic patterns in trajectoriesfor location prediction. ACM Trans Intell Syst Technol (TIST) 5(1):2
97. Zaslavsky A, Chakraborty D et al. (2011) Recognizing concurrent and interleaved activities in socialinteractions. In: IEEE 9th international conference on dependable, autonomic and secure computing(DASC). IEEE, pp 230–237
98. Zhang C, Zhang K, Yuan Q, Zhang L, Hanratty T, Han J (2016) Gmove: group-level mobility mod-eling using geo-tagged social media. In: KDD: proceedings of international conference on knowledgediscovery and data mining, vol 2016, p 1305
99. Zhang D, Zhang D, Xiong H, Yang LT, Gauthier V (2015) NextCell: predicting location using socialinterplay from cell phone traces. IEEE Trans Comput 64(2):452–463
100. Zhang JD, Chow CY (2013) iGSLR: personalized geo-social location recommendation: a kernel den-sity estimation approach. In: Proceedings of the 21st ACM SIGSPATIAL international conference onadvances in geographic information systems. ACM, pp 334–343
101. Zheng VW, Zheng Y, Xie X, Yang Q (2010) Collaborative location and activity recommendations withGPS history data. In: Proceedings of the 19th international conference on world wide web. ACM, pp1029–1038
102. Zheng Y, Capra L, Wolfson O, Yang H (2014) Urban computing: concepts, methodologies, and appli-cations. ACM Trans Intell Syst Technol (TIST) 5(3):38
103. Zheng D, Hu T, You Q, Kautz H, Luo J (2014) Inferring home location from user’s photo collectionsbased on visual content and mobility patterns. In: Proceedings of the 3rd ACM multimedia workshopon geotagging and its applications in multimedia, pp 21–26
104. Zhu Y, Zhong E, Lu Z, Yang Q (2012) Feature engineering for place category classification. In: Mobiledata challenge byNokia workshop, in conjunction with international conference on pervasive computing
Eran Toch is a Senior Lecturer at the Department of Indus-trial Engineering at Tel Aviv University. He holds a Ph.D.from the Technion—Israel Institute of Technology and wasa postdoctoral fellow at the School of Computer Science atCarnegie Mellon University. Eran’s research interests revolvearound usable privacy and security, human–computer interac-tion, and ubiquitous computing. Eran’s research group is nowworking on various projects that revolve around the computa-tional analysis of human behavior, with applications to smartcities, mobile computing, and cyber-security and privacy. Thegroup’s projects are funded by agencies such as Israel Sci-ence Foundation (ISF), EU Horizon 2020, US DARPA, IsraelMinistry of Science, and other national and international pro-grams. Eran is the founder and the chair of the ACM IsraelSIGCHI chapter and an associate editor and program com-mittee member in several leading journals and conferences.
123
Analyzing large-scale human mobility data: a survey of…
Boaz Lerner is a Professor of Machine Learning in the Industrial Engi-neering and Management (IEM) Department at Ben-Gurion University.He holds a B.A. (Physics and Mathematics), M.Sc. (Electro-OpticalEngineering), and Ph.D. (Computer Engineering) from the HebrewUniversity, Tel Aviv University, and Ben-Gurion University, respec-tively. Before joining IEM, he researched at Aston and CambridgeUniversities (UK). During the last 25 years, Lerner has been investi-gating, developing, teaching, and consulting in machine learning anddata mining. In 2007, he established and had since headed the MachineLearning and Data Mining Lab at IEM in which numerous projects fordifferent agencies, authorities, and companies have been undertaken.Lerner has supervised 40 graduate students and has published nearly100 papers in journals and conference proceedings.
Eyal Ben-Zion was born in Beer Sheva, Israel, in 1977. He receivedthe B.Sc., M.Sc., and Ph.D. degrees in Industrial Engineering and Man-agement from the Ben-Gurion University of the Negev, Beer Sheva,Israel, in 2011, 2014, and 2018, respectively.
Irad Ben-Gal is a full professor and the head of the “AI andBusiness Analytics” Lab at the Faculty of Engineering in TelAviv University. He held a visiting professor position at Stan-ford University, co-heading the TAU/Stanford “Digital Living2030” research initiative. His research interests include monitor-ing of stochastic processes, machine learning and informationtheory applications to industrial and service systems. He wrotethree books, published more than 100 papers and patents andreceived numerous awards for his work. He supervised dozens ofgraduate students, served in the editorial boards of several pro-fessional journals, served as the chair of the Quality Statisticsand Reliability (QSR) society at INFORMS, and worked withcompanies such as Oracle, Intel, GM, AT&T, Siemens, Kim-berly Clark, and Nokia. He is the co-founder and chairman ofCB4 (“See Before”), a startup backed by Sequoia Capital thatprovides predictive analytics solutions to retail organizations.
123