combining dark energy survey science verification data with near-infrared data from the eso vista...
TRANSCRIPT
arX
iv:1
407.
3801
v2 [
astr
o-ph
.CO
] 27
Oct
201
4
Mon. Not. R. Astron. Soc.000, 000–000 (0000) Printed 28 October 2014 (MN LATEX style file v2.2)
Combining Dark Energy Survey Science Verification Data withNear Infrared Data from the ESO VISTA Hemisphere Survey
Manda Banerji1⋆, S. Jouvel1, H. Lin2, R. G. McMahon3,4, O. Lahav1, F. J. Castander5,F. B. Abdalla1, E. Bertin6, S. E. Bosman3, A. Carnero7,8, M. Carrasco Kind9, L. N. daCosta7,8, D. Gerdes10, J. Gschwend7,8, M. Lima11,8, M. A. G. Maia7,8, A. Merson3, C.Miller 10, R. Ogando7,8, P. Pellegrini7,8, S. Reed3, R. Saglia12, C. Sanchez13, S. Allam14,2,J. Annis2, G. Bernstein15, J. Bernstein16, R. Bernstein17, D. Capozzi18, M. Childress19,20,Carlos E. Cunha21, T. M. Davis22,20, D. L. DePoy23, S. Desai24,25, H. T. Diehl2, P. Doel1,J. Findlay3, D. A. Finley2, B. Flaugher2, J. Frieman2, E. Gaztanaga5, K. Glazebrook26,C. Gonzalez-Fernandez3, E. Gonzalez-Solares3, K. Honscheid27, M. J. Irwin3, M. J.Jarvis28,29, A. Kim30, S. Koposov3, K. Kuehn31, A. Kupcu-Yoldas3, D. Lagattuta26,20,J. R. Lewis3, C. Lidman31, M. Makler32, J. Marriner2, Jennifer L. Marshall23, R.Miquel13,33, Joseph J. Mohr24,25,12, E. Neilsen2, J. Peoples2, M. Sako15, E. Sanchez34, V.Scarpine2, R. Schindler35, M. Schubnell10, I. Sevilla34, R. Sharp36, M. Soares-Santos2,M. E. C. Swanson37, G. Tarle11, J. Thaler38, D. Tucker2, S. A. Uddin26,20, R. Wechsler21,W. Wester2, F. Yuan38,19, J. Zuntz39
28 October 2014
ABSTRACT
We present the combination of optical data from the Science Verification phase of theDark Energy Survey (DES) with near infrared data from the ESOVISTA Hemisphere Survey(VHS). The deep optical detections from DES are used to extract fluxes and associated errorsfrom the shallower VHS data. Joint 7-band (grizY JK) photometric catalogues are producedin a single 3 sq-deg DECam field centred at 02h26m−04d36m where the availability of an-cillary multi-wavelength photometry and spectroscopy allows us to test the data quality. Dualphotometry increases the number of DES galaxies with measured VHS fluxes by a factor of∼4.5 relative to a simple catalogue level matching and results in a∼1.5 mag increase in the80% completeness limit of the NIR data. Almost 70% of DES sources have useful NIR fluxmeasurements in this initial catalogue. Photometric redshifts are estimated for a subset ofgalaxies with spectroscopic redshifts and initial results, although currently limited by smallnumber statistics, indicate that the VHS data can help reduce the photometric redshift scat-ter at bothz < 0.5 andz > 1. We present example DES+VHS colour selection criteria forhigh redshift Luminous Red Galaxies (LRGs) atz ∼ 0.7 as well as luminous quasars. Us-ing spectroscopic observations in this field we show that theadditional VHS fluxes enablea cleaner selection of both populations with<10% contamination from galactic stars in thecase of spectroscopically confirmed quasars and< 0.5% contamination from galactic starsin the case of spectroscopically confirmed LRGs. The combined DES+VHS dataset, whichwill eventually cover almost 5000 sq-deg, will therefore enable a range of new science and beideally suited for target selection for future wide-field spectroscopic surveys.
Key words:surveys - catalogues - galaxies: distances and redshifts, galaxies: photometry, (galaxies):quasars: general
⋆ E-mail: [email protected]© 0000 RAS

2 M. Banerji et al.
1 INTRODUCTION
Observational astronomy is currently experiencing a golden age ofdigital data. The advent of sensitive electronic cameras that can bemounted on large aperture telescopes has enabled a new generationof wide-field ground-based galaxy surveys at optical and near in-frared wavelengths. These surveys aim to obtain photometric datafor millions of galaxies over thousands of square degrees ofsky.Wide-field optical survey astronomy was revolutionised by datafrom the Sloan Digital Sky Survey (SDSS; York et al. 2000). DataRelease 9 of SDSS (Ahn et al. 2012) contains more than 930 mil-lion catalogued objects over 14,555 sq-deg of the northern hemi-sphere corresponding to a source density of∼64,000/deg2. The5000 sq-deg Dark Energy Survey (DES) represents the next leapforward in the southern hemisphere with an expected source den-sity of >100,000/deg2 . DES is a wide-field optical survey opti-mised for studies of weak gravitational lensing, large-scale struc-ture and galaxy clusters, in particular from the millimeterwave-length South Pole Telescope (SPT) Sunyaev-Zeldovich (SZ) clus-ter survey. In addition, DES also includes a deeper multi-epoch su-pernova survey over 30 sq-deg. The optical DES data are comple-mented by near infrared (NIR) data from the VISTA HemisphereSurvey (VHS; McMahon et al. 2013). Together these two surveyswill eventually provide a unique 7-band photometric dataset over∼4500 sq-deg of the southern sky. Figure 1 shows the coverage ofall VHS data processed until April 2014 in the DES region, togetherwith the DES Science Verification observations.
DES differs from previous optical surveys like SDSS due tothe red-sensitive CCDs used by the DECam camera and its highthroughput out to wavelengths of almost 1µm in thez andY fil-ters. Near infrared photometry in theJ andK-bands out to∼2µmwould therefore form a natural extension to the DES wavelengthcoverage. The addition of NIR photometry to optical data providesseveral advantages. Firstly, atz & 1.0, the 4000A break in earlytype galaxies which is commonly used as a photometric redshiftdiscriminator, moves from the optical to the NIR bands. The addi-tion of NIR data may therefore lead to significantly more accuratephotometric redshifts for galaxies atz & 1 (Banerji et al. 2008;Jarvis et al. 2013). These galaxies will serve as important probesof the evolution of large-scale structure with redshift. NIR data isalso extremely sensitive to the reddest galaxies which often residein galaxy clusters, as well as active galactic nuclei (AGN) at allredshifts and can therefore help with their identification.Many ofthese sources will be targeted with the next generation of wide-fieldspectroscopic surveys such as DESI (Levi et al. 2013) and 4MOST(de Jong et al. 2012) and it is important to assess the qualityof thephotometric data to judge its suitability for target selection (e.g.Jouvel et al. 2013). The DES+VHS photometric data will also con-tribute significantly to the landscape of multi-wavelengthsurveysin the southern sky over the next decade, providing interesting tar-gets for both the Atacama Large Millimeter Array (ALMA) and theExtremely Large Telescope (E-ELT) and enabling the identifica-tion of optical counterparts for the Square Kilometer Array(SKA)pathfinders and eventually leading up to the full SKA. Finally, itshould be stressed that the techniques for combining the data out-lined here as well as the science applications that are described arejust as relevant to combining optical and near infrared datafrommany other ongoing wide-field galaxy surveys - e.g. VST-ATLAS,VST-KiDS, PanSTARRS, HSC, Skymapper, VISTA VIKING.
In this paper we describe joint optical+ NIR photometric cat-alogues from DES + VHS, produced over a single DECam fieldcovering 3 sq-deg of the DES Science Verification data. We use
the deeper DES detection images to extract fluxes and associatederrors from the shallower NIR data. Section 2 describes the sur-veys used in this work and Section 3 describes the dual photom-etry method. The astrometry, photometry and star-galaxy separa-tion of the combined catalogues are checked in Section 4, 5 and 6respectively. While this sort of dual photometry method hasbeenused extensively in astronomical surveys for the construction ofmulti-wavelength photometric catalogues, it is usually applied todatasets that are comparable in terms of their depth and sensitiv-ity. By contrast, the VHS data is significantly shallower than DES,which means that the majority of DES detections lie below the5σ level of the VHS images. A key aim of this paper is to assesswhether enough useful information can be extracted even from lowsignal-to-noise flux measurements, to enhance the science that willbe possible with DES data alone. With this in mind, we also presentsome illustrative science applications of our combined data includ-ing photometric redshift estimates (Section 7) and target selectionof both Luminous Red Galaxies and quasars (Section 8).
All magnitudes are on the AB system. This is the nativephotometric system for DES and the VHS magnitudes have beenconverted from Vega to AB using the following corrections:JAB=JVega+0.937,KAB=KVega+1.839.
2 SURVEY DATA
2.1 Dark Energy Survey (DES)
The Dark Energy Survey (Flaugher 2005; Frieman et al. 2013) is anoptical survey that is imaging 5000 sq-deg of the southern celestialhemisphere in thegrizY bands using a dedicated camera, DECam(Diehl & Dark Energy Survey Collaboration 2012; Flaugher etal.2012) on the Blanco 4-m telescope in CTIO. The survey aims tounderstand the nature and evolution of dark energy using a multi-probe approach, utilising measurements of large-scale structure,weak gravitational lensing, galaxy cluster counts and a dedicatedmulti-epoch supernova survey over 30 sq-deg. The wide surveywill go down to a nominali-band magnitude limit of 25.3 (5σ;PSF) or 24.0±0.10 (10σ; galaxy). The camera obtained its firstlight images in September 2012 and this was followed by a pe-riod of Commissioning and Science Verification observations (SVhereafter) lasting between October 2012 and February 2013.Sev-eral high priority fields were targetted as part of this SV phase in-cluding well-known spectroscopic training set fields overlappingspectroscopic surveys like VVDS, ACES and zCOSMOS, severalwell-known galaxy clusters as well as∼250 sq-deg of area coveredby the SPT survey.
DECam imaging overlapping data from deep spectroscopicredshift surveys were obtained for the following four fields: SN-X3, SN-C3, VVDS F14, and COSMOS (Sanchez et al. 2014). Eachof the four fields covers about the area of single DECam pointing,or about 3 sq-deg and more details can be found in Sanchez et al.(2014). All fields include imaging in the 6 filtersugrizY . Thedata have been processed to two imaging depths: “main”, corre-sponding to approximately DES main survey exposure times, and“deep”, corresponding to about 3 times the exposure of a singlevisit to a DES supernova deep field (for SN-X3 and SN-C3) ordeeper (for COSMOS). Details of the data reduction and the ex-posure times used are given in Sanchez et al. (2014). In thispaper,we work with the DECam imaging in the SN-X3 field only, pro-cessed to the “main” survey depth. We only use the DESgrizYphotometry asu-band data will not be available for the main wide-field survey. The SN-X3 field has been chosen from among the four
c© 0000 RAS, MNRAS000, 000–000

DES+VHS 3
spectroscopic training set fields as it is the only one with completeoverlap with VHS near infrared imaging. The SN-C3 field is par-tially covered by the VISTA VIKING survey, which complementsVHS and the VVDS F14 and COSMOS fields lie outside the VHSsurvey region.
The data were processed using the same codes used byDES Data Management (DESDM) to process DES imagingdata (Desai et al. 2012; Mohr et al. 2012), in particular for im-age detrending, astrometric calibration (SCAMP; Bertin 2006),image remapping and coaddition (SWarp v2.34.0; Bertin et al.2002) and object detection and photometry (SExtractor v2.18.7;Bertin & Arnouts 1996). The typical photometric calibration uncer-tainty is<5%. Ther-band image was used as the detection imagein construction of these early photometric catalogues although wenote thatriz images are now used by DESDM for object detec-tion in order to provide increased sensitivity to red objects. For thepurposes of our analysis however, ther-band data is significantlydeeper than the NIR VHS data so using ther-band for detectiondoes not affect the statistical properties of the joint optical+NIRsource population although we note that these catalogues are likelyto be incomplete to very rare, extremely red objects. The data weregenerally processed by running these codes in “standalone”modeat Fermilab, rather than by running them within the DESDM pro-cessing framework at NCSA. Running “standalone” was neededasthe DESDM framework was not yet fully setup at the time (Spring2013) to process and calibrate the data for these isolated fields allthe way through to image coaddition.
Though we basically used the DESDM codes, there weresome detailed differences in processing and photometric calibra-tion that are highlighted in Sanchez et al. (2014). For the purposesof this paper however, the DECam imaging over SN-X3 is repre-sentative of the optical photometry that will be available from thefinal DES survey.
2.2 VISTA Hemisphere Survey (VHS)
The VISTA Hemisphere Survey (VHS) is a NIR photometric sur-vey being conducted using the VISTA telescope in Chile, thataimsto cover 18,000 sq-deg of the southern celestial hemisphereto adepth 30 times fainter than the 2MASS survey in at least twowavebands (J andKs). In the South Galactic Cap,∼4500 sq-degof sky overlapping DES is being imaged deeper in order to bet-ter supplement the optical data available from DES. This area isknown as VHS-DES hereafter and goes down to median depths ofJAB = 21.2 andKAB = 20.4 for 5σ detection of a point source.The remainder of the high galactic latitude sky is being imaged intheY JK bands and combined with optical photometry from theVST-ATLAS survey. This VHS-ATLAS area has 5σ nominal mag-nitude limits ofJ = 20.9 andK = 19.8. Some portions of VHS-DES and VHS-ATLAS also include data in theH-band. The lowgalactic latitude sky is known as VHS-GPS and also goes down toK < 19.8. In this paper, we work with the VHS-DES images andcatalogues overlapping the 3 sq-deg DECam pointing centredonthe SN-X3 field.
We now introduce several definitions pertinent to the VHSdata that will be relevant later. The VIRCAM camera used for VHSimaging constitutes a sparse array of 16 individual detectors thatcover a region of 0.595 sq-deg. In order to get contiguous cover-age of the 1.5 sq-deg field-of-view (1.02 deg in RA and 1.48 degin DEC), six exposures are therefore required. These six exposuresare termed pawprints and together they produce a single coadd tile.Due to the smaller size of the VIRCAM field of view relative to
DECam, each DECam pointing overlaps multiple VIRCAM tileswhich are combined as detailed later.
VHS imaging data has been processed using the VISTA DataFlow System (VDFS; Emerson et al. 2004; Hambly et al. 2004;Irwin et al. 2004) operated by the Cambridge Astronomical SurveyUnit (CASU). Data processing steps follow standard proceduresfor infrared photometry instrumental signature removal includingbias, non-linearity, dark, flat and fringing corrections. Sky back-ground tracking and removal are done using all observationsexe-cuted during a night. The pawprint images are then combined intoa coadd tile. Photometric calibration is done using 2MASS ona tileby tile basis and makes use of the 2MASSJHKS stellar photom-etry to calibrate the VHS data as detailed in Hodgkin et al. (2009).Specifically, the following colour equations are derived between the2MASS and VISTAJ andKs filters:
JVISTA = J2MASS − 0.077(J −H)2MASS (1)
KVISTA = K2MASS + 0.010(J −K)2MASS (2)
The photometric calibration in theJ andKs-bands has a typ-ical uncertainty of<1.5% (Hodgkin et al. in preparation). Finally,catalogues are generated using the astrometry, photometry, shapeand Data Quality Control information. All images and cataloguesused in this work are supplied with the appropriate astrometric andphotometric calibrations from VDFS.
2.3 Spectroscopic Catalogue
Spectroscopic follow-up of the DES Supernova Fields (includingthe SN-X3 field), is currently being conducted as part of the OzDESsurvey on the Anglo-Australian Telescope (Yuan et al. in prepa-ration). The fibre fed spectrograph on the AAT allows OzDES topursue several parallel scientific goals. A strong focus is on spec-troscopic follow-up of supernova host galaxies and repeat observa-tions of Active Galactic Nuclei for reverberation mapping.Othertargets include galaxy clusters, Luminous Red Galaxies, Emis-sion Line Galaxies, as well as a flux-limited sample of photomet-ric redshift calibration targets. OzDES is a 5 year survey whichbegan in 2013 and the first season of observations is now com-plete. OzDES redshifts have been combined with other redshifts inthese fields from spectroscopic surveys including SDSS (Ahnet al.2012; Eisenstein et al. 2001; Strauss et al. 2002), 6dF (Jones et al.2009), GAMA (Driver et al. 2011; Hopkins et al. 2013), VVDS(Le Fevre et al. 2005), VIPERS (Garilli et al. 2013) and SNLSsu-pernova hosts (Lidman et al. 2013).
We make use of this master spectroscopic redshift catalogue1
to assess the quality and utility of the DES+VHS catalogues inmuch of the analysis that follows but note here that this doesnot form a homogenous population of spectroscopically confirmedgalaxies. The GAMA and 6dF surveys in particular constitutethebrightest and lowest redshift galaxies in the local Universe whiledeeper surveys like VVDS and VIPERS extend to much higher red-shifts. The OzDES spectroscopically confirmed galaxies toodo notform a uniform flux-limited sample due to the fact that at a fixedmagnitude, redshifts are more easily determinable for certain sub-classes of galaxies in the OzDES survey. These caveats should be
1 http://des-docdb.fnal.gov:8080/cgi-bin/ShowDocument?docid=8084
c© 0000 RAS, MNRAS000, 000–000

4 M. Banerji et al.
Figure 1. The 5yr DES footprint together with DES pointings obtained as part of the DES Science Verification observations (blue) and all VHS pointingsoverlapping DES and processed until the end of April 2014 (red). The location of all the DES deep supernova fields as well asthe DES SN-X3 field used forthis study are also marked.
kept in mind when photometric redshifts for this catalogue are pre-sented in Section 7.
3 METHOD
VHS is by design much shallower than DES but nevertheless rep-resents the deepest near infrared survey that will overlap with mostof the DES area on completion of DES. Most of the DES galaxiesdo not have an NIR counterpart in the VHS 5σ catalogues. Further-more, the VHS catalogue production pipeline is different from thatused by DES which means that different prescriptions for profilefitting as well as different aperture radii have been used to measuremagnitudes in the two surveys. Combining the DES and VHS datain an optimal way requires joint photometry to be carried outon thepixel level data from both surveys. The joint photometry methodcan make use of the deeper DES detections to extract fluxes fromobjects that lie below the signal-to-noise threshold used in the con-struction of the VHS catalogues. The concept is illustratedin Figure2 where we present DESr-band and VHSJ-band images centredon a galaxy cluster in the SN-X3 field which clearly demonstratesthe difference in depth between the two surveys. As is apparentfrom this figure, there is a significant amount of informationin theVHS images below the 5σ threshold used to construct the VHScatalogues. Our aim in this paper is to present the first attempt atextracting this extra information directly from the VHS images bymaking use of the DES detections.
The NIR data represents extra information about the sourcespectral energy distribution at long wavelengths and, as wewilldemonstrate later, even in the presence of noise, it can serve as auseful discriminant in breaking degeneracies between galaxy prop-erties. A consequence of performing joint photometry is also so thatwe ensure that magnitudes are measured consistently acrossbothsurveys thus avoiding biases in the optical-NIR colours dueto sys-
tematic offsets between different magnitude measures for differentgalaxy populations.
We now describe the various stages for combining the DESand VHS data. The first step is to select all VHS images over-lapping the DECam field-of-view which will then be combined toproduce a near infrared image of the same size as the optical DESimage. There are six separate VHS tiles that overlap the 3 sq-degDECam image. Only those images taken under photometric condi-tions are used corresponding to coadd tiles where the seeingand ze-ropoint variation between the individual pawprints are smaller than0.2′′ and 0.2 mag respectively. This ensures that any coadd imageswhere the PSF varies significantly from one pawprint to another,have been removed from the analysis. We note that this seeingandzeropoint cut does not remove any VHS tiles overlapping thissingleDECam field, but would remove∼17% of problematic VHS tilesthat have been observed and overlap the final DES footprint shownin Figure 1. Before coaddition, all VHS images overlapping theDECam image need to be scaled to a common zeropoint which isselected to be 25.0. The zeropoints are first adjusted for theeffectsof different airmass, extinction and exposure time in each image asshown in Eq. 3 before applying this scaling.
ZPeff = MAGZPT−(airmass−1.0)×ext+2.5log10(ExpTime)(3)
Using SWarP, the VHS images are then resampled to produce a30,000×30,000 pixel image with a pixel scale of 0.267′′ per pixel,which therefore directly corresponds to the size and scale of theDECam image. ALANCZOS3 resampling algorithm is used.The original VHS images have a pixel scale of 0.341′′ per pixel.The images are also coadded in regions where they overlap using amedian coaddition. We note here that resampling the VHS imagesonto a finer pixel scale introduces correlated noise betweenthe pix-els which is not dealt with when magnitude errors are produced by
c© 0000 RAS, MNRAS000, 000–000

DES+VHS 5
DESr (260 sources) VHSJ S/N>10 (51 sources) VHSJ S/N>5 (84 sources)
VHS J S/N>3 (111 sources) VHSJ S/N>2 (147 sources) VHSJ S/N>1 (194 sources)
Figure 2. DESr-band (top left) and VHSJ-band images 3×3′ in size centred on a cluster in the DES SN-X3 field demonstrating the difference in depthbetween the two surveys. All the DES detections are shown as the blue circles in the DESr-band image while each of the VHS images show the sources inour joint DES+VHS catalogue as a function of theJ-band signal-to-noise ratio. These cutouts demonstrate the significant amount of information present inthe VHS images below the 5σ threshold used in the construction of VHS catalogues.
Table 1.SExtractor parameters used to produce DES+VHS joint photome-try catalogues.
Parameter Value
DETECT MINAREA 6DETECT THRESH 1.5
ANALYSIS THRESH 1.5DEBLEND NTHRSH 32
DEBLEND MINCONT 0.005BACK SIZE 256
BACK FILTERSIZE 3BACKPHOTO TYPE GLOBAL
our source extraction software. We come back to this point later inthe paper.
Once a VHS coadded image has been produced with the samecenter, size and pixel scale as the DES image, we run SExtractorin dual-photometry mode using the DESr-band image as the de-tection image and the VHS coadd tile as the measurement imagein order to produce a VHS catalogue in theJ andKs-bands in theSN-X3 field. The SExtractor parameters used are summarised inTable 1 and mostly correspond to those used during the SV periodfor the production of DES catalogues.
We would like to check that the photometric properties of ourdata do not significantly depend on the exact choice of parameterssummarised in Table 1, in particular the exact prescriptions usedfor background subtraction. In order to do this, we construct his-
tograms of the pixel values of the VHS images both before and af-ter background subtraction. After excluding the high-σ tail of thisdistribution, which corresponds to real sources, we fit a Gaussian tothe remaining pixels in order to determine both the shift in the meanpixel value resulting from the background subtraction, as well asthe intrinsic width of the pixel distribution. We find that backgroundsubtraction results in a shift to the mean pixel value of0.0143.By comparison, the best-fitσ value of the Gaussian distribution ofpixel values is 0.672. In other words, the background subtractionresults in a systematic shift in the pixel values that is only∼2% ofthe random noise in the images. We have also investigated changesto several other parameters listed in Table 1 - e.g. use of local ver-sus global background subtraction, changes to the background es-timation (BACK SIZE BACK FILTERSIZE) and deblending (DE-BLEND NTHRSH and DEBLENDMINCONT) parameters - andfound no discernible change to the resulting photometry from thesechanges. Similarly, we investigated differences in the photometryresulting from median versus weighted coaddition of imagesandonce again found that there is a negligible impact on the photome-try. These investigations demonstrate that the errors on the photom-etry are dominated by the random sky noise rather than systematiceffects resulting from different processing prescriptions.
We also note that we do not currently include model-fitting tocalculate galaxy magnitudes as this involves PSF homogenisationof the VISTA tiles. As the VISTA tiles are constructed from six ex-posures across 16 sparsely distributed detectors, at any point in the
c© 0000 RAS, MNRAS000, 000–000

6 M. Banerji et al.
Table 2.Summary of median seeing values in all the DES and VHS filters
Filter Median Seeing
DESg 1.24′′
DESr 1.03′′
DESi 0.96′′
DESz 1.12′′
DESY 1.33′′
VHS J 1.12′′
VHS Ks 1.05′′
image, there may be contributions from up to 16×6 PSFs. The ef-fects of variable seeing are corrected for when producing the VHSVDFS 5σ catalogues using a process known asgrouting2. How-ever, these corrections are not applied to the VHS tile images thatare used in this work. The PSF variation across a coadd tile isnoteasily modelled using simple smoothly varying functions and thePSF determination is also complicated by the image resampling.PSF and model-fitting to the VHS images are therefore left forfu-ture work. We note however that at high redshifts ofz & 0.7 wherethe VHS data is likely to add the most value to DES, most galax-ies are unresolved in the VHS images, which have a typical seeingvalue of∼1′′. Model-fitting is therefore not appropriate in thesecases and simple aperture magnitudes are expected to give reason-able galaxy colours and can be used for a range of science applica-tions as we demonstrate in the following analysis. Throughout thispaper, we use the SExtractorMAG AUTO values for magnitudeand colour measurements.
4 ASTROMETRY
Before running the dual photometry on the DES and VHS data,we begin by checking the astrometric calibration between the twosurveys. In order to do this, we match the DES catalogues in theSN-X3 field to the VHS 5σ catalogues using a matching radius of1.0′′. The astrometry for VHS has been calibrated using 2MASSwhile the DES astrometry used in this work has been calibratedusing the SCAMP software and the positions from the Sloan Dig-ital Sky Survey Data Release 8. There are∼38,000 sources thatare matched between the two catalogues. In Figure 3 we plot the2-dimensional distribution of the difference in the RA and DECvalues between DES and VHS. As can be seen, this distributionis strongly peaked at an offset close to zero. The median offsetsare: δRA=RA(DES)-RA(VHS)=0.005′′ and δDEC=DEC(DES)-DEC(VHS)=-0.002′′. The median absolute deviation in these off-sets is 0.12′′ in both RA and DEC corresponding to a standard de-viation of 0.18′′.
Figure 3 also shows the histogram of separations for all theobjects matched between DES and the VHS catalogues. As canbe seen from this figure, the mean separation between DES andVHS sources is 0.15′′. We conclude that the astrometry is thereforeconsistent across the entire DECam field of view between the twosurveys.
5 PHOTOMETRY
The 3 sq-deg DECam pointing in the SN-X3 field contains∼272,000 sources with at least 6 pixels at 1.5σ above the back-
2 http://casu.ast.cam.ac.uk/surveys-projects/software-release/grouting
ground. The DESr-band image is used as the detection imageand SExtractor is run in dual photometry mode using this opti-cal image for detection and calculating photometric properties onthe near infraredJ andKs-band images which directly overlap it.The median seeing values in all the DES bands as well as the twoVHS bands, are quoted in Table 2 and are around∼ 1′′. The see-ing is slightly worse in theg andY -bands as DES survey strategydictates that these exposures, which are not being used for weak-lensing science, are taken during the poorer seeing time. The SEx-tractor parameters for dual photometry are given in Table 1.Thedual photometry therefore allows us to measure VHSJ andKs-band fluxes for all sources that are detected in ther-band. How-ever, many of these correspond to spurious sources and artefacts inthe optical imaging data. In order to remove these, we match theoptical sources to the near infrared sources using a matching ra-dius of 1′′ which essentially removes all sources where centroidsare poorly determined in the near infrared image. We note that thecentroids measured on the NIR images are not actually used forthe forced photometry, which uses the positions from the DESde-tection image. The near infraredJ-band positions are used for thismatching as theJ-band goes deeper than theKs-band. Sourceswith poorly determined centroids that are removed, generally cor-respond to satellite trails, cosmic rays and diffraction spikes aroundbright stars but also include very faint galaxies where there is nodiscernible flux in the near infrared and the source detection algo-rithm can therefore no longer measure a centroid. In crowdedclus-ter fields such as the one shown in Figure 2, multiple DES sourcesthat are blended into a single VHS source are also removed viathisband-merging procedure. The band-merging is therefore used as asimple way of cleaning the catalogues of both spurious detectionsin the optical and extremely low signal-to-noise sources where eventhe forced photometry fluxes are likely to be unreliable.
After band merging, the joint DES+VHS catalogue contains∼182,000 sources with VHS photometry - i.e. 67% of DES sourceshave measured near infrared fluxes. Out of these∼182,000 sources,only ∼38,000 are in the VHS catalogues. Using the DES de-tections, we have therefore significantly increased the numberof sources with near infrared fluxes, albeit now including VHSsources with larger errors on their photometry. Figure 4 shows thehistogram of bothr-band magnitudes and signal-to-noise values inthe J andKs-band for our final catalogue of∼182,000 sourceswhere the signal-to-noise estimates account for correlated noise inthe resampled VHS images as detailed later in this Section. As canbe seen the signal-to-noise distribution peaks at∼1 in both bands.Imposing a bright cut ofi < 22.5, we see that the median signal-to-noise is now∼2-2.5. By contrast, the mediani-band magnitudeof those sources present in the 5σ VHS catalogues, isi ∼ 20.8.
In this section, we first begin by assessing the quality ofthe photometry. To do this, we match the joint DES+VHS cata-logue of∼182,000 sources to deep near infrared data from theVISTA VIDEO survey which has magnitude limits ofJAB=24.4and KAB=23.8 measured in a 2′′ aperture (Jarvis et al. 2013).VIDEO uses the same camera, telescope and filters as VHS andcan therefore be used to verify the VHS photometry. The pub-lic VIDEO data release in this field overlapping deep opticaldatafrom the CFHTLS, only covers the central 1.0 sq-deg of the 3sq-deg DECam pointing. There are∼60,000 sources in our band-merged DES+VHS catalogue that also have VIDEO photometry.The VIDEO data release includes SExtractor output catalogueswithMAG AUTOmeasurements, which are compared to the pho-tometry generated in this paper. In Figure 5 we plot the differencein magnitude in theJ andKs bands between our VHS magni-
c© 0000 RAS, MNRAS000, 000–000

DES+VHS 7
∆ RA (arcsec)
∆ D
EC
(ar
csec
)
−0.8−0.6−0.4−0.2 0 0.2 0.4 0.6 0.8
−0.8
−0.6
−0.4
−0.2
0
0.2
0.4
0.6
0.8
0 0.2 0.4 0.6 0.8 10
500
1000
1500
2000
2500
3000
3500
Separation (arcsecs)
Num
ber
of s
ourc
es
Figure 3. Left: The 2D distribution of the difference in RA and difference inDEC between DES and VHS. The distribution is strongly peakedclose to zeroand confirms that the astrometry between the two surveys agrees over the entire DECam field of view.Right: The distribution of separations between DES andVHS sources has a mean value of∼0.15′′.
16 18 20 22 24 260
1000
2000
3000
4000
5000
6000
rAB
Nu
mb
er
of
sou
rce
s
iAB
<24.0
iAB
<22.5
−2 −1.5 −1 −0.5 0 0.5 1 1.5 20
2000
4000
6000
8000
10000
12000
1σ 5σ
log10(S/N)
Num
ber
of s
ourc
es
J−band (i<24.0)K−band (i<24.0)J−band (i<22.5)K−band (i<22.5)
Figure 4. Left: Histogram ofr-band magnitudes of DES sources.Right: Histogram of signal-to-noise values in theJ andKs-bands for sources in our jointDES+VHS catalogue after accounting for correlated noise asdescribed in Section 5. The distribution is peaked at a signal-to-noise of∼1. TheJ-band goesslightly deeper and therefore is skewed towards slightly higher signal-to-noise values compared to theKs-band. Selecting sources withi < 22.5, we find thatthese distributions peak at a signal-to-noise of∼2-2.5. The VHS catalogues only include objects at signal-to-noise of>5 and as can be seen, this correspondsto the brightest tail of DES sources with a mediani-band magnitude of 20.8.
tudes and the VIDEO magnitudes for these sources. We note thatin the low signal-to-noise regime, the errors on the magnitudes arenon-Gaussian and hence the median difference between the mag-nitudes is not expected to be zero. At faint magnitudes, the VHSestimates begin to get systematically brighter relative toVIDEO.At bright magnitudes and high signal-to-noise however where themagnitude errors are approximately Gaussian, the magnitudes be-tween the two surveys are consistent at the level of∼0.04 mag. Atvery bright magnitudes, the effects of saturation can be seen in theJ-band. While the detector integration time in theJ-band is 30s forVIDEO, 15s integration times have been used instead for VHS soit is possible that bright objects withJ < 15 could be saturated inthe longer VIDEOJ-band exposures.
In Figure 6 we plot the number of sources as a function ofJ andKs-band magnitude in the VHS catalogues, VIDEO cata-logues and the DES+VHS joint forced photometry catalogues pro-
duced in this work. The number counts of all three cataloguesagreevery well at the bright-end. The small offset of∼0.04 mag be-tween VHS and VIDEO noted earlier, does not affect Figure 6where the numbers are calculated in bins of 0.5 mag. The VHS cat-alogue source counts begin to turn over at reasonably brightmagni-tudes. Using the VIDEO data, we derive 80% completeness limitsof 19.9 and 19.3 for theJ-band andKs-band respectively. Notethat these are shallower than the median 5σ point-source depths ofthe survey quoted in Section 2.2 as the number counts in Figure 6are dominated by galaxies and these completeness limits arethere-fore appropriate for extended sources. Even for point sources, the5σ catalogue flux-limits typically translate to a completeness limitof ∼50% on average. The corresponding 80% completeness limitsfor the DES+VHS dual photometry catalogues areJ = 21.2 andK = 20.9. Using the DES detections, we have therefore been ableto extend the near infrared coverage to∼1.5 mag fainter.
c© 0000 RAS, MNRAS000, 000–000

8 M. Banerji et al.
14 16 18 20 22−0.4
−0.3
−0.2
−0.1
0
0.1
0.2
0.3
0.4
VIDEO JAB
∆ J
= V
HS
J − V
IDE
OJ
14 16 18 20 22−0.4
−0.3
−0.2
−0.1
0
0.1
0.2
0.3
0.4
VIDEO KAB
∆ K
= V
HS
K −
VID
EO
K
Figure 5. Difference between the SExtractor VHS forced photometry magnitudes and deeper VISTA VIDEO catalogue magnitudes in theJ andKs bands as afunction of the VIDEO near infrared magnitude. The dashed line corresponds to the median trend whereas the solid line marks an offset of 0 mag. The medianoffsets are +0.04 mag inJ and +0.03 mag inKs relative to VIDEO at the bright end where the logarithmic magnitude distributions are expected to be roughlyGaussian.
16 18 20 22 24
100
1000
10000
JAB
N /
(deg
2 0.5
mag
)
VHS CatalogueDES+VHSVIDEO
16 18 20 22 24
100
1000
10000
KAB
N /
(deg
2 0.5
mag
)
VHS CatalogueDES+VHSVIDEO
Figure 6.VHSJ andKs-band number counts produced by running dual photometry on the VHS coadded images using the DES detection images (DES+VHS)compared to both VHS catalogue counts over the same area as well as deeper data from the VIDEO survey. All three distributions show good agreement atthe bright end. The number counts are dominated by the extended sources and from this plot, the 80% completeness for the VHS catalogues isJ = 19.9 andK = 19.3 (appropriate for galaxies). The corresponding numbers forthe DES+VHS dual photometry catalogue presented in this paper areJ = 21.2 andK = 20.9.
As stated earlier, the resampling of the VHS images onto thefiner DECam pixel scale, introduces correlated noise between thepixels which is not accounted for by SExtractor. The SExtractormagnitude errors are therefore under-estimated. In order to calcu-late the factor by which these errors are under-estimated, we com-pare the SExtractor magnitude errors to those produced by the VHSpipeline for high signal-to-noise sources. The VHS pipeline cor-rectly accounts for correlated noise in the pixels. We find that typi-cally the SExtractor magnitude errors are under-estimatedby a fac-tor of ∼3.5-4. This factor is constant as a function of magnitudeand just corresponds to the ratio of the pixel-to-pixel RMS in theoriginal VHS images versus the resampled VHS images used forthe dual photometry. As a conservative estimate, we therefore scaleall the VHS photometric errors output by SExtractor by a factorof 4, in order to correctly account for correlated noise between thepixels of the resampled VHS images. Throughout the paper, the
noise estimates used and quoted therefore correctly account for thecorrelated noise.
We now consider the colours of galaxies in our jointDES+VHS catalogues. We select galaxies using a crude star/galaxyseparation cut ofi spreadmodel > 0.0028. The use of the newspread model parameter (Desai et al. 2012) in performing star-galaxy separation for DES will be discussed in more detail inSec-tion 6. While this cut does not necessarily represent the most op-timal separation criterion, we show in Section 6 that it allows rea-sonable classifications that are sufficient for our aims and this cut istherefore used throughout this paper. There are∼125,000 galaxiesover the 3 sq-deg pointing when using this selection. The(r − i)versus(J − K) colours of these galaxies is shown in Figure 7.Here we also plot the DES+VISTA colours of galaxies for fourdifferent galaxy templates from Jouvel et al. (2009) spanning theentire range in galaxy types in these mock catalogues. The equiv-alent colour-colour distribution for the deeper VIDEO survey has
c© 0000 RAS, MNRAS000, 000–000

DES+VHS 9
also been plotted. As can be seen from the figure, the main locusof data points in this colour-colour plane overlaps the galaxy tracksthus demonstrating that the forced photometry pipeline is produc-ing reasonable colours for galaxies. Although the deeper VIDEOdata have less scatter in the(J −K) colour by a factor of∼3 com-pared to VHS, Figure 7 clearly demonstrates that the peak of thegalaxy distribution in both datasets roughly coincides, and corre-spond to az ∼ 0.5 star-forming galaxy in terms of its optical+NIRcolour.
6 STAR-GALAXY SEPARATION
For the purposes of this paper, we would like to be able toseparate stars and galaxies in the DES and VHS catalogues.Within DESDM, star-galaxy separation makes use of the newspread model parameter within SExtractor (Desai et al. 2012;Soumagnac et al. 2013). Point sources which are unresolved in theDES images should have aspread model value close to zerowhereas more extended sources will have largerspread modelvalues. Several improvements to the classification are currentlyunder investigation (e.g. Soumagnac et al. 2013) and are notthesubject of the current study. In this work we choose to performstar/galaxy separation using aspread model threshold of 0.0028.
We wish to test the effectiveness of the abovespread modelcut in separating stars from galaxies in the DES+VHS catalogues.The combination of optical and near infrared photometry canef-fectively be used for this as stars and galaxies have been shown toseparate well in the(g − i) versus(J − K) colour-colour plane(Baldry et al. 2010). We split point sources and extended sourcesin our catalogue using the criteria:−0.003 < i spread model <0.0028 andi spread model > 0.0028 respectively. This resultsin ∼40,000 stellar sources and∼125,000 galaxies, and the twopopulations are plotted in thegiJK colour-colour plane in Fig-ure 8. The figure also shows the stellar locus from Jarvis et al.(2013) which is essentially the Baldry et al. (2010) locus used toseparate the two populations, with appropriate small offsets to con-vert from the UKIDSSK-band to the VISTAKs-band. As canbe seen from the figure, the majority of the point sources do in-deed fall below the line while the extended sources lie abovetheline. The significant population of point sources with blue(g − i)but red(J − K) colours and that lie above the locus, are mainlyexpected to be quasars. Using this colour locus for star/galaxyseparation, we find that 85% of extended sources in DES withi spread model > 0.0028, lie in the correct portion of thegiJKcolour-colour plane.
Optimum star-galaxy separation criteria for DES sources willbe investigated in forthcoming studies and the above criteria arenot intended to give highly pure or highly complete samples ofeither population, which are necessary for example for muchofthe cosmological analysis intended with DES. Nevertheless, wecan conclude based on the optical+NIR colours that a simplei spread model > 0.0028 cut is sufficient for the the aims ofthis paper, which are to assess the potential of the NIR data fromVHS in enhancing DES science.
7 DES+VHS PHOTOMETRIC REDSHIFTS
In Banerji et al. (2008) it was demonstrated using early DES+VHSsimulations that the addition of near infrared photometry from VHSto the DES optical data can result in a substantial improvement in
the photometric redshift scatter of DES galaxies at high redshifts. Inparticular, these early simulations indicated that the improvementshould be∼30% atz & 1 and this improvement in photometricredshift performance could also result in a significant improvementin large-scale-structure measurements with DES. In this Section,we would therefore like to test how the DES photometric redshiftschange on addition of the NIR VHS data. Spectroscopic redshiftsare available in the SN-X3 field from OzDES as well as severalother spectroscopic surveys as described in Section 2.3. There are∼9800 galaxies overlapping our DES+VHS catalogues in this field,all with high confidence spectroscopic redshift measurements. Outof these,∼6800 are in the VHS>5σ catalogues so the bright galax-ies are clearly over-represented in this spectroscopic sample rela-tive to the full photometric dataset. More than 70% of these galax-ies are also atz < 0.7 which is not representative of the final red-shift distribution of the DES photometric sample. Figure 9 plots themagnitude distributions in theJ andKs-bands for both the spec-troscopic and photometric datasets and clearly illustrates this point.The photometric redshifts presented in this section shouldthereforebe interpreted with caution as, for the single field used in this pilotstudy, they depend strongly on both the spectroscopic sample beingused as well as the photometric redshift algorithm.
For the purposes of this paper, we run a single template fittingcode: LePhare (Ilbert et al. 2006) on these galaxies in orderto as-sess the photometric redshift performance. LePhare has been com-monly used for the analysis of photometric redshifts in several deepfield galaxy surveys such as VIDEO (Jarvis et al. 2013) and COS-MOS (Ilbert et al. 2009) and use of the same algorithm allows usto benchmark our results against these deeper datasets oversmallerareas of sky. Furthermore, the spectroscopic samples in thesingleDECam pointing used in this pilot study are currently too small toprovide robust and independent training, validation and testing setsfor empirical photometric redshift estimators. A thoroughcompar-ison of different photometric redshift algorithms has beencarriedout by Sanchez et al. (2014) for the DES Science Verificationdataand we note here that the results presented in this Section donotnecessarily constitute the best photometric redshifts that can cur-rently be obtained for DES. Training-set based estimators producemore accurate photometric redshifts than template-fittingmethodslike LePhare when large training samples overlapping the photo-metric sample exist. Rather, the aim here is to look at the rela-tive difference in photometric redshift performance for DES andDES+VHS galaxies in this single field.
The templates used for our photometric redshifts have beenoptimised for the COSMOS photo-z library as described inIlbert et al. (2009). This library is composed of 31 templatesranging from ellipticals to starbursts. It includes three ellipticalgalaxy templates and seven spiral galaxy templates generated byPolletta et al. (2007). In addition, there are 12 starburst templatesfrom Bruzual & Charlot (2003) with ages between 0.03 and 3 Gyr.Additional dust-reddened templates are also constructed for theintermediate and late-type populations using the extinction lawfrom Calzetti et al. (2000) with E(B-V) values in the range 0.1to 0.3. Emission line fluxes have been additionally incorporated(Ilbert et al. 2009; Jouvel et al. 2009). The addition of these emis-sion line fluxes significantly improves the ability to reproducecolours of star-forming galaxies. Figure 7 shows that thesetem-plates overlap the optical+NIR colour-colour plane spanned by ourphotometric data and are therefore appropriate for the photomet-ric redshift analysis carried out here. Finally, adaptive photometricoffsets are also calculated in each of the photometric pass bands
c© 0000 RAS, MNRAS000, 000–000

10 M. Banerji et al.
DES (r−i)
VH
S (
J−K
)
z=0
z=1.5
0 0.5 1 1.5−1
−0.5
0
0.5
1
1.5
2
ESbSdSB
DES (r−i)
VID
EO
(J−
K)
z=0
z=1.5
0 0.5 1 1.5−1
−0.5
0
0.5
1
1.5
2
ESbSdSB
Figure 7. The grey clouds show source densities of galaxies in the DES+VISTA (r − i) versus(J −K) colour-colour plane for both our DES+VHS forcedphotometry catalogue (left) and DES+VIDEO catalogue (right). The coloured tracks mark the expected colours of galaxies from Jouvel et al. (2009) for fourdifferent galaxy templates spanning the full range of galaxy types in those catalogues. The tracks go from redshift 0 to 1.5 with points marking redshift intervalsof 0.04. The observed colours of our galaxies in the DES+VISTA catalogue, overlap well with the predicted colours of galaxies from Jouvel et al. (2009) butthe larger spread in the(J −K) colours in VHS relative to VIDEO results from the larger photometric scatter on the shallower VHS data.
DES (g−i)AB
VH
S (
J−K
s) AB
Extended Sources
0 0.5 1 1.5 2 2.5 3 3.5−1
−0.5
0
0.5
1
1.5
2
DES (g−i)AB
VH
S (
J−K
s) AB
Point Sources
0 0.5 1 1.5 2 2.5 3 3.5 4−1
−0.5
0
0.5
1
1.5
2
Figure 8. Source density plot in the(g − i) versus(J − K) colours of both extended sources (assumed to havei spread model>0.0028; left) and pointsources (assumed to have−0.003 < i spread model <0.0028; right) in the DES+VHS catalogues produced in the SN-X3 field. The locus used to separatethe two populations by Jarvis et al. (2013) is marked in each panel by the thick line. While the extended sources generallylie above this locus, the point sourceslie below as expected.
using the spectroscopically confirmed galaxies, in order tocorrectfor small systematic offsets in the magnitudes.
We begin by making use of a set of relatively simple metrics toassess how the VHS photometry impacts the photo-z performance.The aim is to assess the relative difference in photometric redshiftperformance between the DES only and DES+VHS catalogues. Forthese purposes, we evaluate the bias on the photometric redshift< ∆z/(1+ zs) >, the scatter on the photometric redshift by look-ing at the normalised median absolute deviation (NMAD) of thedifference between the photometric redshift and spectroscopic red-shift:
σz(NMAD) = median
(
1.48×|zp − zs|
(1 + zs)
)
(4)
In addition we also define the outlier fraction to be the fraction ofobjects where|∆z|/(1+z) > 0.15. These are standard definitionsemployed in several other studies (Ilbert et al. 2009; Jarvis et al.2013), that allow us to characterise the photometric redshift perfor-
mance relative to other surveys. With LePhare, we find that the biasdecreases from−0.013 with the DES-only data to−0.007 withDES+VHS. The scatter on the photometric redshift decreasesfrom0.058 to 0.052 and the fraction of outliers decreasing from 13%to 10%. In Jarvis et al. (2013), photometric redshifts were evalu-ated for CFHTLS deep optical data and CFHTLS+VIDEO opti-cal+NIR data where the scatter decreased from 0.025 to 0.023, a10% improvement consistent with our results. The outlier fractiontoo dropped from 7% to 4% in that study. Thirty band photometricredshifts in the deep COSMOS field reach a scatter of 0.012 forcomparison although this scatter increases to 0.06 when NIRdatais added (Ilbert et al. 2009).
The above statistics while useful for comparison to other stud-ies, are not representative of the accuracy with which photometricredshifts will be measurable for all DES+VHS galaxies, given thatthe spectroscopic sample is highly biased towards bright magni-tudes and low redshifts. In order to overcome this bias, we there-fore adopt a weighting method whereby each galaxy in the spectro-scopic sample is assigned a weight so that the distribution of mag-
c© 0000 RAS, MNRAS000, 000–000

DES+VHS 11
14 16 18 20 22 24 260
0.005
0.01
0.015
0.02
0.025
0.03
0.035
JAB
Nor
mal
ised
Cou
nts
SpectroscopicPhotometric
14 16 18 20 22 24 260
0.005
0.01
0.015
0.02
0.025
0.03
0.035
KAB
Nor
mal
ised
Cou
nts
SpectroscopicPhotometric
Figure 9. Magnitude distributions (normalised by the total number ofgalaxies) for both the spectroscopic dataset used for photometric redshift analysis andthe full photometric dataset produced by our forced photometry pipeline. The spectroscopic dataset is clearly biased towards brighter galaxies with evidencefor a bimodal distribution due to the superposition of galaxies from bright surveys such as SDSS, 6dF and GAMA and faintersurveys such as VVDS-Deepand VIPERS, in our master redshift catalogue.
nitudes in this weighted spectroscopic sample is comparable to thedistribution of magnitudes in the final photometric sample.Weightsare computed using the nearest neighbour estimator of Lima et al.(2008) where the spectroscopic galaxy weight is assigned based onthe ratio of the local density of the spectroscopic and photomet-ric samples in the multi-dimensional magnitude plane. Morede-tails can be found in Sanchez et al. (2014). For comparison to theresults obtained in Sanchez et al. (2014) for a variety of differentphotometric redshift algorithms, we also now compute the meanbias,σ68 parameter and fraction of 2 and 3-σ outliers as definedin that paper. To assess how accurately the photometric redshiftdistribution reproduces the spectroscopic redshift distribution, wecalculate the Npoisson and KS-metrics introduced in Sanchez et al.(2014). Finally, in line with DES science requirements, we remove10% of galaxies with the largest photometric redshift errors beforethese metrics are calculated. With these cuts, our results are analo-gous to those presented as Test1 of Sanchez et al. (2014) althoughwe note that our spectroscopic dataset is different from theone usedin that work.
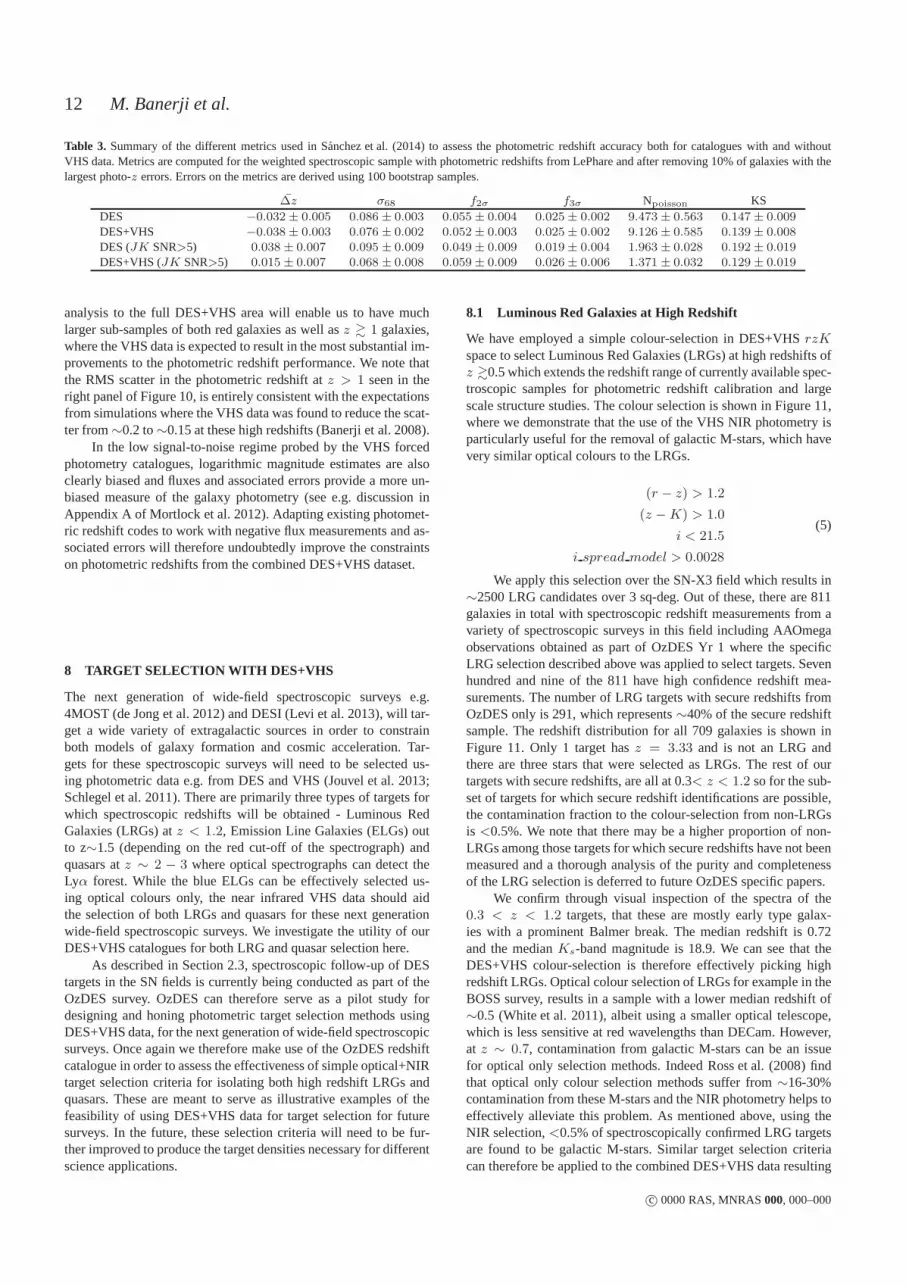
We begin by looking at the overall change in the metrics forDES and DES+VHS using LePhare. These are summarised in Ta-ble 3 and errors on these estimates are calculated using 100 boot-strap samples. We find that most of the metrics show slight im-provements with the addition of VHS data with the most signifi-cant improvement seen in the scatter parameter,σ68. The disper-sion on each of these metrics is however almost always smallerwith the addition of the near infrared data. In other words, quanti-ties like the bias and scatter can be calculated more robustly withthe DES+VHS data than with DES alone. We note that the rela-tively modest change to the photometric redshift performance withthe inclusion of the VHS photometry is expected given the prop-erties of the galaxies that make up the majority of our photometriccatalogue. In Figure 7 we have seen that the average DES galaxy isaz ∼ 0.5 star-forming galaxy with blue optical colours. Given thesignificantly deeper DES data relative to VHS, such a galaxy hasmuch smaller errors on its DES photometry relative to VHS. Thetemplate-fittingχ2 minimisation method therefore assigns a muchlarger weight to the DES photometry when calculating photomet-ric redshifts. We also calculate the photometric redshift metrics foronly those galaxies that are>5σ detections in theJ andKs-bands
and present these in Table 3. While larger improvements in the biasand scatter are now seen as expected, the errors on these parametersare also much larger as these parameters are being estimatedusinga much smaller number of galaxies.
More interesting perhaps than these overall metrics are thetrends in these as a function of redshift. Figure 10 shows both thebias andσ68 as a function of photometric redshift both for DES andDES+VHS estimates of the photometric redshift. These plotsareproduced after weighting the spectroscopic sample of galaxies asdiscussed earlier and also after removing 10% of galaxies with thelargest photometric redshift errors. The bias looks relatively simi-lar for the two datasets although as noted earlier, this biascan beestimated with a smaller error when the VHS data are includedinthe photometric redshift estimates. Looking at the scatterwe findthat, in this single field there is a significant improvement in σ68 inthe redshift binz ∼ 0.4− 0.5, although these results may be proneto cosmic variance. Atz . 0.4 andz & 1 too there is evidencefor a consistent drop in the scatter on addition of VHS data toDES,across multiple redshift bins, although currently the error bars arelarge due to small number statistics in this single DECam pointing,which does not contain enough spectroscopic galaxies at theedgesof the DES redshift distribution. Inspecting the best-fit templatesfor those galaxies where the NIR data reduces the photometric red-shift scatter, we find that quite often the NIR allows us to distin-guish between an early-type SED and a reddened starburst SED.The larger scatter at the low and high redshift ends is drivenmainlyby the poorer sampling of the 4000A break by the DES optical fil-ters in these redshift ranges. At low redshifts,u-band photometrycan help traverse the Balmer break while at higher redshifts, nearinfrared photometry is required. The minimum in the photometricredshift scatter occurs atz ∼0.7 where the 4000A break is in themiddle of the optical filters.
Although the weighting method has been used to try and over-come biases associated with the available spectroscopic sample, inthis single field, the statistics may also be strongly influenced by asmall number of highly weighted galaxies. Nevertheless, these firstresults on the photometric redshifts from DES and VHS data areencouraging and suggest that the near infrared photometry derivedfrom the DES detection images, can be used to improve the DES-only photometric redshift performance. In the future, widening the
c© 0000 RAS, MNRAS000, 000–000
12 M. Banerji et al.
Table 3. Summary of the different metrics used in Sanchez et al. (2014) to assess the photometric redshift accuracy both for catalogues with and withoutVHS data. Metrics are computed for the weighted spectroscopic sample with photometric redshifts from LePhare and afterremoving 10% of galaxies with thelargest photo-z errors. Errors on the metrics are derived using 100 bootstrap samples.
∆z σ68 f2σ f3σ Npoisson KSDES −0.032± 0.005 0.086 ± 0.003 0.055± 0.004 0.025± 0.002 9.473 ± 0.563 0.147± 0.009DES+VHS −0.038± 0.003 0.076 ± 0.002 0.052± 0.003 0.025± 0.002 9.126 ± 0.585 0.139± 0.008DES (JK SNR>5) 0.038 ± 0.007 0.095 ± 0.009 0.049± 0.009 0.019± 0.004 1.963 ± 0.028 0.192± 0.019DES+VHS (JK SNR>5) 0.015 ± 0.007 0.068 ± 0.008 0.059± 0.009 0.026± 0.006 1.371 ± 0.032 0.129± 0.019
analysis to the full DES+VHS area will enable us to have muchlarger sub-samples of both red galaxies as well asz & 1 galaxies,where the VHS data is expected to result in the most substantial im-provements to the photometric redshift performance. We note thatthe RMS scatter in the photometric redshift atz > 1 seen in theright panel of Figure 10, is entirely consistent with the expectationsfrom simulations where the VHS data was found to reduce the scat-ter from∼0.2 to∼0.15 at these high redshifts (Banerji et al. 2008).
In the low signal-to-noise regime probed by the VHS forcedphotometry catalogues, logarithmic magnitude estimates are alsoclearly biased and fluxes and associated errors provide a more un-biased measure of the galaxy photometry (see e.g. discussion inAppendix A of Mortlock et al. 2012). Adapting existing photomet-ric redshift codes to work with negative flux measurements and as-sociated errors will therefore undoubtedly improve the constraintson photometric redshifts from the combined DES+VHS dataset.
8 TARGET SELECTION WITH DES+VHS
The next generation of wide-field spectroscopic surveys e.g.4MOST (de Jong et al. 2012) and DESI (Levi et al. 2013), will tar-get a wide variety of extragalactic sources in order to constrainboth models of galaxy formation and cosmic acceleration. Tar-gets for these spectroscopic surveys will need to be selected us-ing photometric data e.g. from DES and VHS (Jouvel et al. 2013;Schlegel et al. 2011). There are primarily three types of targets forwhich spectroscopic redshifts will be obtained - Luminous RedGalaxies (LRGs) atz < 1.2, Emission Line Galaxies (ELGs) outto z∼1.5 (depending on the red cut-off of the spectrograph) andquasars atz ∼ 2 − 3 where optical spectrographs can detect theLyα forest. While the blue ELGs can be effectively selected us-ing optical colours only, the near infrared VHS data should aidthe selection of both LRGs and quasars for these next generationwide-field spectroscopic surveys. We investigate the utility of ourDES+VHS catalogues for both LRG and quasar selection here.
As described in Section 2.3, spectroscopic follow-up of DEStargets in the SN fields is currently being conducted as part of theOzDES survey. OzDES can therefore serve as a pilot study fordesigning and honing photometric target selection methodsusingDES+VHS data, for the next generation of wide-field spectroscopicsurveys. Once again we therefore make use of the OzDES redshiftcatalogue in order to assess the effectiveness of simple optical+NIRtarget selection criteria for isolating both high redshiftLRGs andquasars. These are meant to serve as illustrative examples of thefeasibility of using DES+VHS data for target selection for futuresurveys. In the future, these selection criteria will need to be fur-ther improved to produce the target densities necessary fordifferentscience applications.
8.1 Luminous Red Galaxies at High Redshift
We have employed a simple colour-selection in DES+VHSrzKspace to select Luminous Red Galaxies (LRGs) at high redshifts ofz &0.5 which extends the redshift range of currently availablespec-troscopic samples for photometric redshift calibration and largescale structure studies. The colour selection is shown in Figure 11,where we demonstrate that the use of the VHS NIR photometry isparticularly useful for the removal of galactic M-stars, which havevery similar optical colours to the LRGs.
(r − z) > 1.2
(z −K) > 1.0
i < 21.5
i spread model > 0.0028
(5)
We apply this selection over the SN-X3 field which results in∼2500 LRG candidates over 3 sq-deg. Out of these, there are 811galaxies in total with spectroscopic redshift measurements from avariety of spectroscopic surveys in this field including AAOmegaobservations obtained as part of OzDES Yr 1 where the specificLRG selection described above was applied to select targets. Sevenhundred and nine of the 811 have high confidence redshift mea-surements. The number of LRG targets with secure redshifts fromOzDES only is 291, which represents∼40% of the secure redshiftsample. The redshift distribution for all 709 galaxies is shown inFigure 11. Only 1 target hasz = 3.33 and is not an LRG andthere are three stars that were selected as LRGs. The rest of ourtargets with secure redshifts, are all at 0.3< z < 1.2 so for the sub-set of targets for which secure redshift identifications arepossible,the contamination fraction to the colour-selection from non-LRGsis <0.5%. We note that there may be a higher proportion of non-LRGs among those targets for which secure redshifts have notbeenmeasured and a thorough analysis of the purity and completenessof the LRG selection is deferred to future OzDES specific papers.
We confirm through visual inspection of the spectra of the0.3 < z < 1.2 targets, that these are mostly early type galax-ies with a prominent Balmer break. The median redshift is 0.72and the medianKs-band magnitude is 18.9. We can see that theDES+VHS colour-selection is therefore effectively picking highredshift LRGs. Optical colour selection of LRGs for examplein theBOSS survey, results in a sample with a lower median redshiftof∼0.5 (White et al. 2011), albeit using a smaller optical telescope,which is less sensitive at red wavelengths than DECam. However,at z ∼ 0.7, contamination from galactic M-stars can be an issuefor optical only selection methods. Indeed Ross et al. (2008) findthat optical only colour selection methods suffer from∼16-30%contamination from these M-stars and the NIR photometry helps toeffectively alleviate this problem. As mentioned above, using theNIR selection,<0.5% of spectroscopically confirmed LRG targetsare found to be galactic M-stars. Similar target selection criteriacan therefore be applied to the combined DES+VHS data resulting
c© 0000 RAS, MNRAS000, 000–000

DES+VHS 13
0 0.5 1 1.5
−0.2
0
0.2
0.4
0.6
0.8
zphot
< ∆
z >
DES+VHSDES
0 0.5 1 1.50
0.1
0.2
0.3
0.4
0.5
zphot
σ 68
DES+VHSDES
Figure 10.The bias on the photometric redshift (left) and the scatter,σ68 (right) in bins of photometric redshift for both the DES and DES+VHS estimates ofthe photometric redshift. Galaxies have been weighted as detailed in Section 7 before constructing these plots and 10% of the galaxies with the largest errorson their photometric redshift have been removed. Errors on the points are computed using 100 bootstrap samples.
(r−z)AB
(z−K
) AB
−0.5 0 0.5 1 1.5 2 2.5 3−1
−0.5
0
0.5
1
1.5
2
2.5
3
3.5
4
M1
M4.5M5.5
M4
0 0.5 1 1.50
20
40
60
80
100
120
Spectroscopic Redshift
Num
ber
of G
alax
ies
Figure 11. Left: Source density plot showing galaxies in the SN-X3 field in theDES+VISTA (r − z) versus(z − K) colour-colour plane. The red linerepresents the colour of a typical early-type galaxy template from Jouvel et al. (2009) in the redshift range0 < z < 2 while the blue line shows a late-typegalaxy template from the same work. The green squares denotesome representative colours of early-type M-stars from Leggett et al. (2000), which havevery similar optical colours to LRGs but are significantly bluer in terms of their infrared colour. Markers indicate redshift steps of 0.4 in these tracks. Ourhigh-redshift LRG selection box for OzDES is represented bythe top right of the plot.Right: Redshift distribution of all LRG targets in the field that havesecure redshift identifications. The median redshift of 0.72 is marked with a vertical line.
from the final 5 year survey in order to select extragalactic LRG tar-gets for wide-field spectroscopic surveys like 4MOST and DESI.
8.2 Quasars
Next-generation wide-field spectroscopic surveys such as DESIalso aim to obtain spectra for quasars atz ∼ 2 − 3 in order tomeasure the Baryon Acoustic Oscillations (BAO) at high redshiftsthrough the Lyα forest. Bright quasars illuminate the intergalacticmedium at these redshifts enabling detailed measurements of theclustering properties of clumps of neutral hydrogen gas along theline of sight between us and the quasar, which show up as absorp-tion features in the quasar spectra. Bright quasars therefore need tobe isolated as targets for spectroscopic surveys from photometriccatalogues like DES+VHS.
Quasars can be distinguished from similarly blue star-forming galaxies through morphological classification. The bright-
est quasars suitable for Lyα forest measurements, appear as unre-solved, nuclear point sources in imaging data and are easilysep-arated from extended sources like galaxies. More difficult is theseparation of quasars from stars which substantially outnumber thequasars in terms of their space density on the sky, particularly atbright magnitudes. The optical colours ofz ∼ 2−3 quasars closelyresemble those of stars and the best separation is seen in theugrcolour-colour plane where the well-known UV-excess of quasarsrelative to stars, can be used as a discriminant between the twopopulations (Richards et al. 2002). However, in the southern hemi-sphere, DES lacksu-band coverage. Alternative selection criteriatherefore need to be devised, for example using quasar variabilityto distinguish them from stars (Schlegel et al. 2011).
It has been known for some time that in addition to the well-known UV excess in quasar spectral energy distributions, they alsodisplay an excess in theK-band relative to stars (Warren et al.2000), a property that has been exploited to conduct wide-field
c© 0000 RAS, MNRAS000, 000–000
14 M. Banerji et al.
quasar surveys using the near infrared (Maddox et al. 2012, 2008).As shown in Maddox et al. (2012), the KX quasars are actuallymore effective than the UVX method in selecting complete sam-ples at2 < z < 3 where the optical quasar colours begin to runinto the stellar locus. Our DES+VHS catalogues may therefore beuseful for photometric quasar selection given the lack ofu-banddata in DES. Maddox et al. (2008) used a simple colour selectionin the gJK colour-colour plane to photometrically select quasarsfrom the SDSS+UKIDSS. Here we present a very similargiK se-lection with the added advantage that at fainter magnitudesit makesuse of the higher signal-to-noisei-band data from DES. We alsomake use ofWISE photometry (Wright et al. 2010) at 3.4µm (W1)and 4.6µm (W2) to further discriminate between quasars and stars.We note that theWISE data contains quasars out to the highest red-shifts (Blain et al. 2013) and can therefore effectively be used totarget bright quasars at all redshifts. The selection for quasars isdefined as follows:
(g − i)AB < 1.1529 × (iAB −KVega)− 1.401
(W 1−W 2) > 0.7
−0.003 < i spreadmodel < 0.0028
i < 21.5
(6)
Applying the DES+VHS colour and morphology selection toour optical+NIR catalogue in the SN-X3 field, we find∼1800i < 21.5 candidates over the 3 sq-deg. These are then matchedto WISE data from theAllWISE release with∼75% yieldingWISEcounterparts. Applying theWISE colour selection, we are left with200 candidates over the 3 sq-deg. In order to test whether theselec-tion has been effective in isolating luminous quasars, we once againmake use of the OzDES master redshift catalogue which includesquasars from VVDS-Deep, VIPERS, spectroscopic follow-up of X-ray selected AGN from Stalin et al. (2010) as well as AAOmegaobservations of the field. Out of the 200 targets, 127 currently havehigh confidence redshift measurements. Fifty one of the 127 spec-troscopic objects are quasars at1.8 < z < 3.5 and only 13 are starsrepresenting a stellar contamination fraction of∼10% for those ob-jects with secure redshifts. In addition, there are 5 galaxies and theremaining objects are all lower redshift quasars. Althoughthe num-bers are small over this single DECam pointing, we conclude thatthe DES+VHS catalogues together withWISE data are proving ef-fective in photometrically selecting quasars. These catalogues havealso been used for target selection of quasars for reverberation map-ping monitoring as part of the OzDES project and the larger quasarcatalogue over the wider field-of-view, will be presented inYuan etal. (in preparation).
9 OTHER APPLICATIONS
In this first paper describing the optical + near infrared cataloguesfrom DES and VHS, we have demonstrated that these cataloguescan be effectively used to improve photometric redshifts from theDES-only data as well as for target selection for wide-field spectro-scopic surveys. Through simple colour selection criteria that havebeen applied to the joint catalogues from the DES Science Ver-ification period, we have shown that DES+VHS can be used forthe selection of both broad-line quasars as well as LuminousRedGalaxies at high redshifts ofz ∼ 0.7. In future work, these se-lection criteria will be honed to provide purer and more completesamples of these populations.
The current work has focussed in particular on photometric
redshifts and target selection with DES+VHS data but we highlightthat the joint photometry catalogue produced from the two surveyswill also enable a range of other investigations which will signif-icantly enhance the science possible from DES alone. We haveshown in Section 6 that the VHS near infrared colours could beuse-ful for star-galaxy separation in DES. The inclusion of nearinfraredphotometry will also result in improved stellar mass estimates forDES galaxies as the older long-lived stellar populations ingalaxiesthat contribute most to their total mass, are redder in colour (e.g.Bell et al. 2003; Drory et al. 2004). Even for the bluest galaxies,near infrared photometry can help break degeneracies in spectralenergy distribution fit parameters (e.g. Banerji et al. 2013) demon-strating the utility of the VHS data in constraining stellarmasses ofDES galaxies. DES is also capable of potentially identifying verymassive (M∗ > 1012M⊙) galaxies atz > 4, should they exist, andthe near infrared data will be useful in distinguishing these galaxiesfrom other contaminant populations (Davies et al. 2013).
9.1 Extremely Red Objects
The VHS data will also be more sensitive than DES to rare pop-ulations of extremely red objects such as high redshift quasars(Mortlock et al. 2011; Venemans et al. 2007; Willott et al. 2009),cool dwarfs in our own Milky Way (e.g. Burningham et al. 2013;Lodieu et al. 2012) as well as the dustiest quasars which repre-sent supermassive black-holes in the process of formation (e.g.Banerji et al. 2012, 2013). Many of these will be undetected or ex-tremely faint in DES but the optical photometry is nevertheless nec-essary in order to verify the extreme colours of these rare sourcesand discriminate between them and other contaminant populations.
Initial investigation of the colours of high redshift quasars inthe DES+VHS Science Verification data shows that the forced pho-tometered VHS fluxes still provide useful colour information forz = 6 quasars. The quasar CFHQS J022743−060530 was dis-covered by the Canada France Hawaii Quasar Survey and lies ata redshift ofz = 6.20 (Willott et al. 2009). It is the only ex-isting high redshift quasar to overlap the DES Science Verifica-tion observations. The search for and discovery of new high red-shift quasars in the DES Science Verification data are presentedin Reed et al. (in preparation). From the DES imaging, we findthat CFHQS0227−0605 is undetected in the DESi-band and hasa z-band PSF magnitude of 22.16. We measure colours in a 1 arcsec aperture of(i − z)=3.66 and(z − J)=0.42 where the lattercomes from the forced photometry DES+VHS catalogue. We notehere that unlike the forced photometry catalogues in the SN-X3field presented in this paper, the joint DES+VHS forced photome-try catalogue overlapping CFHQS J022743−060530 uses therizcombined image for object detection and is therefore sensitive toobjects that are not detected in ther-band. As mentioned in Sec-tion 2.1 however, theser-band drop-outs are extremely rare anduse of ther-band for detection does not affect the conclusions ofthis paper.
CFHQS J022743−060530 is among the faintestz = 6quasars currently known and has a signal-to-noise of∼1 in ourJ-band forced photometry catalogues. The(z − J) colour is typi-cally used to rule out a cool star classification as cool dwarfs in ourown Milky Way are the main contaminants in high redshift quasarsearches. Despite the low signal-to-noise, we find that the measured(z − J) colour of this source is consistent with that of a high red-shift quasar (Willott et al. 2009). A higher signal-to-noise detectionin theJ-band leading to a redder(z − J) colour, would favour acool star identification for this object. Even in the low signal-to-
c© 0000 RAS, MNRAS000, 000–000
DES+VHS 15
noise regime, limits on the near infrared photometry obtained usingthe DES detections can therefore help set important constraints onthe colours for the identification of high redshift quasars.
10 CONCLUSIONS
We have described the construction of a joint optical and near in-frared (grizY JK) photometric catalogue from the Dark EnergySurvey and VISTA Hemisphere Survey over a single 3 sq-deg DE-Cam pointing centred at 02h26−04d36 targeted as part of the DESScience Verification period. The availability of ancillarymulti-wavelength photometric data as well as large spectroscopicsamplesin this field, allows us to validate the quality of our photometric cat-alogues and assess their utility for a range of science applications.The VHS forced photometry catalogues are shown to be robustto within a few per cent to changes in the photometric processingpipeline and the errors on the photometry are dominated by the ran-dom sky noise. We demonstrate that using the deep DES detectionimages to extract fluxes from the VHS images at the DES positionsresults in a factor of∼4.5 increase in the number of sources withoptical+NIR photometry. While a simple catalogue match betweenDES and VHS provides∼10,000/deg2 galaxies with joint opticaland NIR photometry, performing forced photometry allows ustoincrease this number to∼45,000 galaxies/deg2 albeit now withlower average signal-to-noise in the infrared. Almost 70% of DESsources in this field have useful NIR flux measurements through theforced photometry. We show that the near infrared colours ofgalax-ies in this forced photometry catalogue are consistent withtem-plates generated from deep photometry in the COSMOS field. Bymatching our catalogue to deep near infrared data from the VISTAVIDEO survey, we show that the number counts agree very wellwith the VIDEO data over the magnitude range over which the twosurveys overlap but the DES detections allow us to probe∼1.5 magdeeper in the near infrared compared to the VHS 5σ catalogues. Inthis paper we assess how useful this joint catalogue is for a rangeof science applications, concentrating in particular on photomet-ric redshifts and target selection for future wide-field spectroscopicsurveys.
The addition of near infrared VHS data to DES photometryresults in a modest improvement in the overall photometric redshiftperformance in particular reducing the scatter on the photometricredshift by∼7-12% (depending on the metric used to compute thisscatter). We find that the VHS data allow us to quantify both thebias and scatter on the photometric redshift to better accuracy thanwith DES alone and note that there is some evidence that the VHSdata are particularly helpful in reducing the photometric redshiftscatter atz < 0.5 andz > 1. While these results are encouraging,we caution that they are currently affected by the small numberstatistics of available spectroscopic samples overlapping the singlefield where we have conducted our analysis and are also sensitiveto the photometric redshift algorithm used. Our spectroscopic cata-logues are over-represented at low redshifts and bright magnitudeswhere galaxy photometric redshifts are already well estimated withoptical data. While we have attempted to correct for this bias byweighting the spectroscopic sample such that it has the samemag-nitude distribution as our photometric sample, in this single field,the results could be strongly influenced by a small number of highlyweighted galaxies. Nevertheless, the photometric redshift analysisconducted here suggests that the VHS forced photometry is likelyto improve the photometric redshift estimates from DES alone, par-
ticularly when larger samples with higher fractions of bothhigh-redshift and intrinsically red galaxies become available.
We introduce a simple DES+VHS colour selection scheme forthe identification of high redshift Luminous Red Galaxies. Our pro-posed selection in therzK colour-colour plane gives∼900 targetsper sq-deg down to a magnitude limit ofi < 21.5. By match-ing these targets to existing spectroscopic databases as well asAAOmega observations of this field obtained as part of the OzDESproject, we verify that the selection proves extremely effective inisolating high redshift LRGs with a median redshift of 0.72.Con-tamination from non-LRGs is estimated to be<0.5% for those ob-jects with secure redshifts although we note that the contaminationmay be higher for the subset of objects where secure redshiftiden-tifications were not possible. This contamination is considerablylower than found using optical-only colour selection methods andthe additional VHS fluxes are shown to be useful for discriminatingbetween LRGs and galactic M-stars.
For the purposes of quasar selection we propose the use ofDES, VHS andWISE catalogues. As DES will not haveu-band ob-servations, quasars cannot be separated from stars using the tradi-tional UVX method which exploits the excess seen in quasar spec-tra relative to stars at UV wavelengths. Instead, we make useof theKX method and propose a simplegiK colour selection togetherwith a WISE colour cut for the identification of luminous quasars.Our proposed selection gives a target density of∼70 bright quasarsper sq-deg. Once again utilising the many spectroscopic datasetsover this field, we show that a large fraction (∼40%) of the brightquasar targets with secure redshifts lie at1.8 < z < 3.5 and willtherefore be suitable for Lyα forest measurements. Contaminationfrom stars and low redshift galaxies is estimated to be∼14% forthe subset of quasar targets with robust redshift measurements andmost of the remaining sources with secure redshift identificationscorrespond to quasars atz < 1.8.
We conclude that the DES+VHS catalogues will form an im-portant dataset for obtaining good photometric redshifts of galaxiesin the southern hemisphere as well as aiding target selection for fu-ture wide-field spectroscopic surveys. The VHS data will also en-able a range of other science investigations that will not bepossiblefrom DES alone e.g. improved stellar masses for DES galaxies, theidentification of high redshift and highly reddened quasarsand thediscovery of cool, low-mass stars in our own Milky Way. Jointpho-tometry from DES and VHS at the pixel level will eventually resultin an optical+NIR catalogue of more than 200 million galaxies and∼70 million point sources over 4500 sq-deg of the southern sky.Constructing these joint catalogues will therefore enhance the sci-ence possible from both surveys and contribute significantly to thelandscape of wide-field photometric surveys in the southernhemi-sphere over the next decade.
ACKNOWLEDGEMENTS
We thank the referee, Nicholas Cross, for a very useful report onthis manuscript. MB acknowledges a postdoctoral fellowship viaOL’s Advanced European Research Council Grant (TESTDE).
Funding for the DES Projects has been provided by the U.S.Department of Energy, the U.S. National Science Foundation, theMinistry of Science and Education of Spain, the Science and Tech-nology Facilities Council of the United Kingdom, the HigherEd-ucation Funding Council for England, the National Center for Su-percomputing Applications at the University of Illinois atUrbana-Champaign, the Kavli Institute of Cosmological Physics at the Uni-
c© 0000 RAS, MNRAS000, 000–000
16 M. Banerji et al.
versity of Chicago, Financiadora de Estudos e Projetos, FundacaoCarlos Chagas Filho de Amparo a Pesquisa do Estado do Rio deJaneiro, Conselho Nacional de Desenvolvimento Cientıficoe Tec-nologico and the Ministerio da Ciencia e Tecnologia, theDeutscheForschungsgemeinschaft and the Collaborating Institutions in theDark Energy Survey.
The Collaborating Institutions are Argonne National Labora-tories, the University of California at Santa Cruz, the University ofCambridge, Centro de Investigaciones Energeticas, Medioambien-tales y Tecnologicas-Madrid, the University of Chicago, UniversityCollege London, the DES-Brazil Consortium, the EidgenossischeTechnische Hochschule (ETH) Zurich, Fermi National Acceler-ator Laboratory, the University of Edinburgh, the University ofIllinois at Urbana-Champaign, the Institut de Ciencies de l’Espai(IEEC/CSIC), the Institut de Fisica d’Altes Energies, the LawrenceBerkeley National Laboratory, the Ludwig-Maximilians Univer-sitat and the associated Excellence Cluster Universe, theUniver-sity of Michigan, the National Optical Astronomy Observatory,the University of Nottingham, The Ohio State University, the Uni-versity of Pennsylvania, the University of Portsmouth, SLAC Na-tional Laboratory, Stanford University, the University ofSussex,and Texas A&M University.
The DES participants from Spanish institutions are partiallysupported by MINECO under grants AYA2009-13936, AYA2012-39559, AYA2012-39620, and FPA2012-39684, which includeFEDER funds from the European Union.
We are grateful for the extraordinary contributions of ourCTIO colleagues and the DES Camera, Commissioning and Sci-ence Verification teams in achieving the excellent instrument andtelescope conditions that have made this work possible. Thesuc-cess of this project also relies critically on the expertiseand dedi-cation of the DES Data Management organisation.
The analysis presented here is based on observations obtainedas part of the VISTA Hemisphere Survey, ESO Progam, 179.A-2010 (PI: McMahon) and data products from observations madewith ESO Telescopes at the La Silla Paranal Observatory underprogramme ID 179.A-2006 (PI: Jarvis).
Data for the OzDES spectroscopic survey were obtained withthe Anglo-Australian Telescope (program numbers 12B/11 and13B/12). Parts of this research were conducted by the AustralianResearch Council Centre of Excellence for All-sky Astrophysics(CAASTRO), through project number CE110001020. TMD ac-knowledges the support of the Australian Research Council throughFuture Fellowship, FT100100595.
REFERENCES
Ahn C. P., et al., 2012, ApJS, 203, 21Baldry I. K., et al., 2010, MNRAS, 404, 86Banerji M., Abdalla F. B., Lahav O., Lin H., 2008, MNRAS, 386,1219
Banerji M., et al., 2013, MNRAS, 431, 2209Banerji M., McMahon R. G., Hewett P. C., Alaghband-Zadeh S.,Gonzalez-Solares E., Venemans B. P., Hawthorn M. J., 2012,MNRAS, 427, 2275
Banerji M., McMahon R. G., Hewett P. C., Gonzalez-Solares E.,Koposov S. E., 2013, MNRAS, 429, L55
Bell E. F., McIntosh D. H., Katz N., Weinberg M. D., 2003, ApJS,149, 289
Bertin E., 2006, in Gabriel C., Arviset C., Ponz D., Enrique S.,eds, Astronomical Data Analysis Software and Systems XV
Vol. 351 of Astronomical Society of the Pacific Conference Se-ries, Automatic Astrometric and Photometric Calibration withSCAMP. p. 112
Bertin E., Arnouts S., 1996, A&AS, 117, 393Bertin E., Mellier Y., Radovich M., Missonnier G., Didelon P.,Morin B., 2002, in Bohlender D. A., Durand D., Handley T. H.,eds, Astronomical Data Analysis Software and Systems XIVol. 281 of Astronomical Society of the Pacific Conference Se-ries, The TERAPIX Pipeline. p. 228
Blain A. W., Assef R., Stern D., Tsai C.-W., Eisenhardt P., BridgeC., Benford D., Jarrett T., Cutri R., Petty S., Wu J., Wright E. L.,2013, ApJ, 778, 113
Bruzual G., Charlot S., 2003, MNRAS, 344, 1000Burningham B., et al., 2013, MNRAS, 433, 457Calzetti D., Armus L., Bohlin R. C., Kinney A. L., Koornneef J.,Storchi-Bergmann T., 2000, ApJ, 533, 682
Davies L. J. M., et al., 2013, MNRAS, 434, 296de Jong R. S., et al., 2012, in Society of Photo-Optical Instrumen-tation Engineers (SPIE) Conference Series Vol. 8446 of Societyof Photo-Optical Instrumentation Engineers (SPIE) ConferenceSeries, 4MOST: 4-metre multi-object spectroscopic telescope
Desai S., et al., 2012, ApJ, 757, 83Diehl H. T., Dark Energy Survey Collaboration 2012, in Ameri-can Astronomical Society Meeting Abstracts #219 Vol. 219 ofAmerican Astronomical Society Meeting Abstracts, The DarkEnergy Survey Camera (DECam). p. 413.05
Driver S. P., et al., 2011, MNRAS, 413, 971Drory N., Bender R., Feulner G., Hopp U., Maraston C., SnigulaJ., Hill G. J., 2004, ApJ, 608, 742
Eisenstein D. J., et al., 2001, AJ, 122, 2267Emerson J. P., Irwin M. J., Lewis J., Hodgkin S., Evans D.,Bunclark P., McMahon R., Hambly N. C., Mann R. G., BondI., Sutorius E., Read M., Williams P., Lawrence A., Stewart M.,2004, in Quinn P. J., Bridger A., eds, Optimizing Scientific Re-turn for Astronomy through Information Technologies Vol. 5493of Society of Photo-Optical Instrumentation Engineers (SPIE)Conference Series, VISTA data flow system: overview. pp 401–410
Flaugher B., 2005, International Journal of Modern PhysicsA, 20,3121
Flaugher B. L., et al., 2012, in Society of Photo-Optical Instru-mentation Engineers (SPIE) Conference Series Vol. 8446 of So-ciety of Photo-Optical Instrumentation Engineers (SPIE) Con-ference Series, Status of the Dark Energy Survey Camera (DE-Cam) project
Frieman J., et al., 2013, in American Astronomical Society Meet-ing Abstracts Vol. 221 of American Astronomical Society Meet-ing Abstracts, The Dark Energy Survey: Overview. p. 335.01
Garilli B., et al., 2013, ArXiv e-printsHambly N. C., Mann R. G., Bond I., Sutorius E., Read M.,Williams P., Lawrence A., Emerson J. P., 2004, in QuinnP. J., Bridger A., eds, Optimizing Scientific Return for Astron-omy through Information Technologies Vol. 5493 of Society ofPhoto-Optical Instrumentation Engineers (SPIE) Conference Se-ries, VISTA data flow system survey access and curation: theWFCAM science archive. pp 423–431
Hodgkin S. T., Irwin M. J., Hewett P. C., Warren S. J., 2009, MN-RAS, 394, 675
Hopkins A. M., et al., 2013, MNRAS, 430, 2047Ilbert O., et al., 2006, A&A, 457, 841Ilbert O., et al., 2009, ApJ, 690, 1236Irwin M. J., Lewis J., Hodgkin S., Bunclark P., Evans D., McMa-
c© 0000 RAS, MNRAS000, 000–000
DES+VHS 17
hon R., Emerson J. P., Stewart M., Beard S., 2004, in QuinnP. J., Bridger A., eds, Optimizing Scientific Return for Astron-omy through Information Technologies Vol. 5493 of Society ofPhoto-Optical Instrumentation Engineers (SPIE) Conference Se-ries, VISTA data flow system: pipeline processing for WFCAMand VISTA. pp 411–422
Jarvis M. J., et al., 2013, MNRAS, 428, 1281Jones D. H., et al., 2009, MNRAS, 399, 683Jouvel S., Abdalla F. B., Lahav O., Kirk D., Lin H., Annis J., KronR., Frieman J. A., 2013, ArXiv e-prints
Jouvel S., et al., 2009, A&A, 504, 359Le Fevre O., et al., 2005, A&A, 439, 845Leggett S. K., Allard F., Dahn C., Hauschildt P. H., Kerr T. H.,Rayner J., 2000, ApJ, 535, 965
Levi M., et al., 2013, ArXiv e-printsLidman C., et al., 2013, pasa, 30, 1Lima M., Cunha C. E., Oyaizu H., Frieman J., Lin H., SheldonE. S., 2008, MNRAS, 390, 118
Lodieu N., et al., 2012, A&A, 548, A53Maddox N., Hewett P. C., Peroux C., Nestor D. B., Wisotzki L.,2012, MNRAS, 424, 2876
Maddox N., Hewett P. C., Warren S. J., Croom S. M., 2008, MN-RAS, 386, 1605
McMahon R. G., Banerji M., Gonzalez E., Koposov S. E., BejarV. J., Lodieu N., Rebolo R., the VHS collaboration 2013, TheMessenger, 154, 35
Mohr J. J., Armstrong R., Bertin E., Daues G., Desai S., GowerM., Gruendl R., Hanlon W., Kuropatkin N., Lin H., MarrinerJ., Petravic D., Sevilla I., Swanson M., Tomashek T., TuckerD., Yanny B., 2012, in Society of Photo-Optical Instrumenta-tion Engineers (SPIE) Conference Series Vol. 8451 of Societyof Photo-Optical Instrumentation Engineers (SPIE) ConferenceSeries, The Dark Energy Survey data processing and calibrationsystem
Mortlock D. J., Patel M., Warren S. J., Hewett P. C., VenemansB. P., McMahon R. G., Simpson C., 2012, MNRAS, 419, 390
Mortlock D. J., Warren S. J., Venemans B. P., Patel M., HewettP. C., McMahon R. G., Simpson C., Theuns T., Gonzales-SolaresE. A., Adamson A., Dye S., Hambly N. C., Hirst P., Irwin M. J.,Kuiper E., Lawrence A., Rottgering H. J. A., 2011, Nature, 474,616
Polletta M., et al., 2007, ApJ, 663, 81Richards G. T., et al., 2002, AJ, 123, 2945Ross N. P., Shanks T., Cannon R. D., Wake D. A., Sharp R. G.,Croom S. M., Peacock J. A., 2008, MNRAS, 387, 1323
Sanchez C., et al., 2014, arXiv:1406.4407Schlegel D., et al., 2011, ArXiv e-printsSoumagnac M. T., et al., 2013, ArXiv e-printsStalin C. S., Petitjean P., Srianand R., Fox A. J., CoppolaniF.,Schwope A., 2010, MNRAS, 401, 294
Strauss M. A., et al., 2002, AJ, 124, 1810Venemans B. P., McMahon R. G., Warren S. J., Gonzalez-SolaresE. A., Hewett P. C., Mortlock D. J., Dye S., Sharp R. G., 2007,MNRAS, 376, L76
Warren S. J., Hewett P. C., Foltz C. B., 2000, MNRAS, 312, 827White M., et al., 2011, ApJ, 728, 126Willott C. J., et al., 2009, AJ, 137, 3541Wright E. L., et al., 2010, AJ, 140, 1868York D. G., et al., 2000, AJ, 120, 1579
AFFILIATIONS
1Department of Physics & Astronomy, University College London, GowerStreet, London WC1E 6BT, UK.2 Fermi National Accelerator Laboratory, P.O. Box 500, Batavia, IL 60510USA3 Institute of Astronomy, University of Cambridge, Madingley Road,Cambridge CB3 0HA, UK.4 Kavli Institute for Cosmology, University of Cambridge, MadingleyRoad, Cambridge CB3 0HA, UK.5 Institut de Ciencies de l’Espai, IEEC-CSIC, Campus UAB, Facultat deCiencies, Torre C5 par-2, 08193 Bellaterra, Barcelona, Spain.6 Institut d’Astrophysique de Paris, Univ. Pierre et Marie Curie & CNRSUMR7095, F-75014 Paris, France.7 Observatorio Nacional, Rua Gal. Jose Cristino 77, Rio de Janeiro, RJ -20921-400, Brazil.8 Laboratorio Interinstitucional de e-Astronomia - LIneA,Rua Gal. JoseCristino 77, Rio de Janeiro, RJ - 20921-400, Brazil.9 Department of Astronomy, University of Illinois, Urbana, IL 61820,USA.10 Department of Physics, University of Michigan, Ann Arbor, Michigan48109, USA.11Departamento de Fısica Matematica, Instituto de Fısica, Universidade deSao Paulo, Sao Paulo, SP CP 66318, CEP 05314-970, Brazil12 Max-Planck-Institut fur extraterrestrische Physik, Giessenbachstr.85748 Garching, Germany13 Institut de Fısica d’Altes Energies, Universitat Autonoma de Barcelona,E-08193 Bellaterra (Barcelona), Spain.14 Space Telescope Science Institute (STScI), 3700 San MartinDrive,Baltimore, MD 21218 USA.15 Department of Physics and Astronomy, University of Pennsylvania,Philadelphia, PA 19104, USA.16 Argonne National Laboratory, 9700 South Cass Avenue, Lemont, IL60439, USA.17 Carnegie Observatories, 813 Santa Barbara St., Pasadena, CA91101,USA.18 Institute of Cosmology & Gravitation, University of Portsmouth,Portsmouth, PO1 3FX, UK.19 Research School of Astronomy and Astrophysics, The AustralianNational University, Canberra, ACT 2611, Australia.20 ARC Centre of Excellence for All-sky Astrophysics (CAASTRO).21 Kavli Institute for Particle Astrophysics and Cosmology 452 LomitaMall, Stanford University, Stanford, CA, 94305.22 School of Mathematics and Physics, University of Queensland, QLD,4072, Australia.23 George P. and Cynthia Woods Mitchell Institute for FundamentalPhysics and Astronomy, and Department of Physics and Astronomy, TexasA & M University, College Station, TX 77843-4242, USA.24 Department of Physics, Ludwig-Maximilians-Universitat, Scheinerstr.1, 81679, Munchen, Germany.25 Excellence Cluster Universe, Boltzmannstr. 2, 85748 Garching,Germany.26 Centre for Astrophysics and Supercomputing, Swinburne University ofTechnology, Hawthorn, VIC 3122, Australia.27 Department of Physics, The Ohio State University, Columbus, OH43210, USA.28 Oxford Astrophysics, Department of Physics, Keble Road, Oxford, OX13RH, UK.29 Physics Department, University of the Western Cape, Bellville, 7535,South Africa.30 Lawrence Berkeley National Laboratory, 1 Cyclotron Road, Berkeley,CA 94720, USA.31 Australian Astronomical Observatory, North Ryde, NSW 2113, Aus-tralia.32ICRA, Centro Brasileiro de Pesquisas Fısicas, Rua Dr. Xavier Sigaud150, CEP 22290-180, Rio de Janeiro, RJ, Brazil.33 Institucio Catalana de Recerca i Estudis Avancats, E-08010 Barcelona,Spain.
c© 0000 RAS, MNRAS000, 000–000

18 M. Banerji et al.
34 Centro de Investigaciones Energeticas, Medioambientales y Tec-nologicas (CIEMAT), Avda. Complutense 40, Madrid, Spain35 SLAC National Accelerator Laboratory, Menlo Park, CA 94025, USA.36 Research School of Astronomy and Astrophysics, The AustralianNational University, Canberra, ACT 2611, Australia.37 National Center for Supercomputing Applications, 1205 West Clark St.,Urbana, IL, USA 61801.38 Department of Physics, University of Illinois, 1110 W. Green St.,Urbana, IL 61801, USA.39 Jodrell Bank Centre for Astrophysics, University of Manchester,Manchester M13 9PL, UK.
c© 0000 RAS, MNRAS000, 000–000