analysis of networks in european framework programmes (1984-2006)
TRANSCRIPT

Ana
lysi
s of
Net
wor
ks in
Eur
opea
n F
ram
ewor
k P
rogr
amm
es (
1984
-200
6)
LF-N
A-24759-E
N-C
ISBN 978-92-79-19714-7
Analysis of Networks in EuropeanFramework Programmes
(1984-2006)
EUR 24759 EN - 2011
9 789279 197147
Authors: Barbara Heller-Schuh, Michael Barber, Luisa Henriques,Manfred Paier, Dimitrios Pontikakis, Thomas Scherngell,
Giuseppe A. Veltri, Matthias Weber


Analysis of Networks in European FrameworkProgrammes(1984-2006)
Authors:
Barbara Heller-Schuh, Michael Barber,
Luisa Henriques, Manfred Paier,
Dimitrios Pontikakis, Thomas Scherngell,
Giuseppe A. Veltri, Matthias Weber
2011
EUR 24759 EN

European CommissionJoint Research Centre
Institute for Prospective Technological Studies
Contact informationAddress: Edificio Expo. c/ Inca Garcilaso, 3. E-41092 Seville (Spain)
E-mail: [email protected].: +34 954488318Fax: +34 954488300
http://ipts.jrc.ec.europa.euhttp://www.jrc.ec.europa.eu
Legal NoticeNeither the European Commission nor any person acting on behalf
of the Commission is responsible for the use which might be made of this publication.
Europe Direct is a service to help you find answersto your questions about the European Union
Freephone number (*):00 800 6 7 8 9 10 11
(*) Certain mobile telephone operators do not allow access to 00 800 numbers or these calls may be billed.
A great deal of additional information on the European Union is available on the Internet.
It can be accessed through the Europa serverhttp://europa.eu/
JRC 63467
EUR 24759 ENISBN 978-92-79-19714-7
ISSN 1018-5593doi:10.2791/54167
Luxembourg: Publications Office of the European Union
© European Union, 2011
Reproduction is authorised provided the source is acknowledged
Printed in Spain
The mission of the JRC-IPTS is to provide customer-driven support to the EU policy-making process by
developing science-based responses to policy challenges that have both a socio-economic as well as a
scientific/technological dimension.

3
Ana
lysis
of N
etw
orks
in E
urop
ean
Fram
ewor
k Pr
ogra
mm
es (1
984-
2006
)Table of Contents
About this report 9
Executive summary 11
Acknowledgements 15
Chapter 1: Introduction 17
Chapter 2: Methodology 212.1 Data sources 21
2.2 Network analysis and centrality measures 23
2.3 Selection of topics and instruments in FPs 25
Chapter 3: Networks of collaborative R&D in the FPs 273.1 Structural features of FP networks 27
3.2 Top 100 organisations in FP networks by centrality and participation 30
Chapter 4: Thematic networks and their functions 394.1 Network metrics for selected themes and instruments 39
4.2 Instrumental functions of themes 44
4.3 Structural functions of themes 48
4.4 Crossing instruments with themes and typology of networks 51
Chapter 5: Core organisations by themes and instruments in FP4 to FP6 535.1 Core organisations by countries in themes and instruments 53
5.2 Core organisations by organisation type in themes and instruments 55
Chapter 6: Key player organisations and universities by themes and instruments
in FP5 and FP6 596.1 Key player organisations by themes and instruments 59
6.2 Key universities by themes and instruments in FP6 74
Chapter 7: Future research directions 837.1 Introduction 83
7.2 ERA monitoring using the spatial dimension of R&D networks 83
7.3 Impact of R&D networks 85
7.4 Feasibility of extending network analysis to alternative data sources (COST, ERC, EUREKA) 88

4
Tabl
e of
Con
tent
s
Chapter 8: Policy Implications for ERA 938.1 Structural features 93
8.2 Instruments 95
References 97
Annex 1011. Abbreviations 101
2. Tables 103
3. Figures 113
5
Ana
lysis
of N
etw
orks
in E
urop
ean
Fram
ewor
k Pr
ogra
mm
es (1
984-
2006
)
List of Tables
Table 1: Measures of fragmentation of the organisation networks FP1-FP6 29
Table 2: Cluster coefficient of organisations in FP1-FP6 29
Table 3: Structural characteristics of organisation networks in FP1-FP6 29
Table 4: Distribution of top 100 core organisations by organisation type, FP1-FP6 (%) 31
Table 5: Distribution of top 100 core organisations by countries, FP1-FP6 (%) 32
Table 6: Distribution of returning actors and new entrants within the 100 core organisations (%) 34
Table 7: Names of the top 10 key players (organisations by number of participations), FP1-FP6 35
Table 8: Distribution of top 100 key players (nr participations) by country, FP1-FP6 (%) 36
Table 9: Distribution of top 100 key players (nr participations) by organisation type, FP1-FP6 (%) 36
Table 10: Names of top 10 central organisations (composite indicator), FP1-FP6 37
Table 11: Distribution of top 100 central organisations (centrality) by country, FP1-FP6 (%) 38
Table 12: Distribution of top 100 central organisations (centrality) by organisation type, FP1-FP6 (%) 38
Table 13: Structural features of the Aerospace theme networks for the CSC/STREP instrument across FP4, FP5 and FP6. 39
Table 14: Structural features of the Energy and Environment theme networks for the CSC/STREP instrument across FP4, FP5 and FP6. 40
Table 15: Structural features of the Information and Communication Technologies theme networks for the CSC/STREP instrument across FP4, FP5 and FP6. 40
Table 16: Structural features of the Life Sciences theme networks for the CSC/STREP instrument across FP4, FP5 and FP6. 41
Table 17: Characteristics of the organisation projection of FP four thematic priorities in Integrated Projects (IP) 42
Table 18: Characteristics of the organisation projection of FP four thematic priorities in Networks of Excellence (NoE) 42
Table 19: Exploration- vs. exploitation-orientation of instrument types in FP5 and FP6 45
Table 20: Set-up of FP5 sub-programmes in terms of project types 46
Table 21: Set-up of FP6 sub-programmes in terms of project types 46
Table 22: Structural parameters of R&D collaboration organisation networks in the FP5 by theme 48
Table 23: Structural parameters of R&D collaboration organisation networks in the FP6 by theme 49
Table 24: Comparison of instrumental and structural functions (FP5 and FP6 sub programmes) 52
Table 25: Top 20 key player organisations in FP5 in the thematic priority of Aerospace 60
Table 26: Top 20 key player organisations in FP6 in the thematic priority of Aerospace 60
Table 27: Top 20 key player organisations in FP5 in the thematic priority Aerospace crossed by the CSC instrument 61
6
Tabl
e of
Con
tent
s Table 28: Top 20 key player organisations in FP6 in the thematic priority of Aerospace crossed by instrument IP 61
Table 29: Top 20 Key player organisations in FP6 in the thematic priority of Aerospace crossed by instrument NoE 62
Table 30: Top 20 key player organisations in FP6 in the thematic priority of Aerospace crossed by instrument STREP 62
Table 31: Top 20 key player organisations in FP5 in the thematic priority of Energy and Environment 63
Table 32: Top 20 key player organisations in FP6 in the thematic priority of Energy and Environment 63
Table 33: Top 20 key player organisations in FP5 in the thematic priority Energy and Environment crossed by the CSC instrument 64
Table 34: Top 20 key player organisations in FP6 in the thematic priority of Energy and Environment crossed by instrument IP 65
Table 35: Top 20 key player organisations in FP6 in the thematic priority of Energy and Environment crossed by instrument NoE 65
Table 36: Top 20 key player organisations in FP6 in the thematic priority of Energy and Environment crossed by instrument STREP 66
Table 37: Top 20 key player organisations in FP5 in the thematic priority of ICT 67
Table 38: Top 20 key player organisations in FP6 in the thematic priority of ICT 67
Table 39: Top 20 key player organisations in FP5 in the thematic priority ICT crossed by the CSC instrument 68
Table 40: Top 20 key player organisations in FP6 in the thematic priority of ICT crossed by instrument IP 68
Table 41: Top 20 key player organisations in FP6 in the thematic priority of ICT crossed by instrument NoE 69
Table 42: Top 20 key player organisations in FP6 in the thematic priority of ICT crossed by instrument STREP 69
Table 43: Top 20 key player organisations in FP5 in the thematic priority of Life Sciences 70
Table 44: Top 20 key player organisations in FP6 in the thematic priority of Life Sciences 71
Table 45: Top 20 key player organisations in FP5 in the thematic priority Life Sciences crossed by the CSC instrument 72
Table 46: Top 20 key player organisations in FP6 in the thematic priority of Life Sciences crossed by instrument IP 72
Table 47: Top 20 key player organisations in FP6 in the thematic priority of Life Sciences crossed by instrument NoE 73
Table 48: Top 20 key player organisations in FP6 in the thematic priority of Life Sciences crossed by instrument STREP 74
Table 49: Top universities in FP6 in Aerospace priority crossed by IP instrument 76
Table 50: Top universities in FP6 in Aerospace priority crossed by NoE instrument 76
Table 51: Top universities in FP6 in Aerospace priority crossed by STREP instrument 77
Table 52: Top universities in FP6 in Energy and Environment priorities crossed by IP 77
Table 54: Top universities in FP6 in Energy and Environment priorities crossed by STREP instrument 78

7
Ana
lysis
of N
etw
orks
in E
urop
ean
Fram
ewor
k Pr
ogra
mm
es (1
984-
2006
) Table 55: Top universities in FP6 in Information Communications Technologies priorities crossed by IP instrument 78
Table 56: Top universities in FP6 in Information Communications Technologies priorities crossed by NoE instrument 79
Table 57: Top universities in FP6 in Information Communications Technologies priorities crossed by STREP instrument 80
Table 58: Top universities in FP6 in Life Sciences priorities crossed by IP instrument 81
Table 59: Top universities in FP6 in Life Sciences priorities crossed by NoE instrument 82
Table 60: Top universities in FP6 in Life Sciences priorities crossed by STREP instrument 82
Table 61: Feature comparison of databases of European collaborative R&D instruments 89
Table 62: Thematic sub-programmes of the RTD Framework Programmes 102
Table 63: Distribution of core organisations by countries and theme (AERO) for CSC/STREP (%) 103
Table 64: Distribution of core organisations by countries and theme (ENV) for CSC/STREP (%) 104
Table 65: Distribution of core organisations by countries and theme (ICT) for CSC/STREP (%) 105
Table 66: Distribution of core organisations by countries and theme (LIFESCI) for CSC/STREP (%) 106
Table 67: Distribution of core organisation by countries and by theme (AERO), FP6 instruments (IP, NoE, STREP) (%) 107
Table 68: Distribution of core organisation by countries and by theme (ENV), FP6 instruments (IP, NoE, STREP) (%) 108
Table 69: Distribution of core organisation by countries and by theme (ICT), FP6 instruments (IP, NoE, STREP) (%) 109
Table 70: Distribution of core organisation by countries and by theme (LIFESCI), FP6 instruments (IP, NoE, STREP) (%) 110
Table 71: Distribution of core organisations in FP4 to FP6 by organisation type and theme (AERO) of CSC/STREP instrument 110
Table 72: Distribution of core organisations in FP4 to FP6 by organisation type and theme (ENV) of CSC/STREP instrument 111
Table 73: Distribution of core organisations in FP4 to FP6 by organisation type and theme (ICT) of CSC/STREP instrument 111
Table 74: Distribution of core organisations in FP4 to FP6 by organisation type and theme (LIFESCI) of CSC/STREP instrument 111
Table 75: Distribution of core organisations by organisation type and theme (AERO) of FP6 instruments 111
Table 76: Distribution of core organisations by organisation type and theme (ENV) of FP6 instruments 112
Table 77: Distribution of core organisations by organisation type and theme (ICT) of FP6 instruments 112
Table 78: Distribution of core organisations by organisation type and theme (LIFESCI) of FP6 instruments 112
8
Tabl
e of
Con
tent
s
List of Figures Figure 1: Number of nodes (N) in network organisations in FP1-FP6 27
Figure 2: Number of edges (M) in organisation networks in FP1-FP6 28
Figure 3: Percentages of type of core organisations by organisation type and FP programme 31
Figure 4: Percentages of type of core organisations by countries and FP programme 33
Figure 5: Mean clustering coefficient across themes in the CSC/STREP instrument over time 41
Figure 6: Number of vertices N, FP6 43
Figure 7: Number of edges M, FP6 43
Figure 8: Exploration- vs. exploitation-orientation of FP5 and FP6 sub-programmes 47
Figure 9: Individual involvement and network connectivity in FP5 and FP6 sub-networks (organisation projection) 50
Figure 10: A structural classification of FP5 and FP6 sub-networks (organisation projection) 50
Figure 11: Distribution of organisations and core organisations by countries in FP4 to FP6 by countries and theme (AERO) 53
Figure 12: Distribution of organisations and core organisations by countries in FP4 to FP6 by countries and theme (ENV) 54
Figure 13: Distribution of core organisations in FP4 to FP6 by countries and theme (ICT) 54
Figure 14: Distribution of core organisations in FP4 to FP6 by countries and theme (LIFESCI) 54
Figure 15: Distribution of core organisations in FP4 to FP6 by organisation type and theme (AERO) 55
Figure 16: Distribution of core organisations in FP4 to FP6 by organisation type and theme (ENV) 56
Figure 17: Distribution of core organisations in FP4 to FP6 by organisation type and theme (ICT) 57
Figure 18: Distribution of core organisations in FP4 to FP6 by organisation type and theme (LIFESCI) 57
Figure 19: 'Top of the top': top 20 universities according to their frequency of participation (restricted for universities appearing in the top ranks in the four themes) FP6 75
Figure 20: Position of European collaborative R&D instruments 88
Figure 21: Common elements of analysis 90
Figure 22: Network of core organisations (AERO_4_CSC) 113
Figure 23: Network of core organisations (AERO_5_CSC) 114
Figure 24: Network of core organisations (AERO_6_STREP) 115
Figure 25: Network of core organisations (AERO_6_IP) 116
Figure 26: Network of core organisations (AERO_6_NoE) 117
Figure 27: Network of core organisations (ENV_4_CSC) 118
Figure 28: Network of core organisations (ENV_5_CSC) 120
Figure 29: Network of core organisations (ENV_6_STREP) 122
Figure 30: Network of core organisations (ENV_6_IP) 123
Figure 31: Network of core organisations (ENV_6_NoE) 124
Figure 32: Network of core organisations (ICT_4_CSC) 125
Figure 33: Network of core organisations (ICT_5_CSC) 126
Figure 34: Network of core organisations (ICT_6_STREP) 128
Figure 35: Network of core organisations (ICT_6_IP) 129
Figure 36: Network of core organisations (ICT_6_NoE) 130
Figure 37: Network of core organisations (LIFESCI_4_CSC) 131
Figure 38: Network of core organisations (LIFESCI_5_CSC) 132
Figure 39: Network of core organisations (LIFESCI_6_STREP) 133
Figure 40: Network of core organisations (LIFESCI_6_IP) 134
Figure 41: Network of core organisations (LIFESCI_6_NoE) 135

9
Ana
lysis
of N
etw
orks
in E
urop
ean
Fram
ewor
k Pr
ogra
mm
es (1
984-
2006
)
About this report
In line with the Europe 2020 vision, there is an increasing need for adequate analytical tools to
monitor progress towards the European Research Area (ERA).
The projects “Network analysis study on participations in Framework Programmes” conducted by ARC
sys (now AIT Austrian Institute of Technology), under the framework of the European Techno-Economic
Policy Support Networks (ETEPS)1 and “Centrality Analysis in Research Networks” done by the Knowledge
for Growth Unit of the Institute for Prospective and Technological Studies (IPTS), Joint Research Centre (JRC),
European Commission2, respond to the on-going need for data and analytical insights on the characteristics
and evolution of the ERA.
The present report presents the synthesised findings of the abovementioned studies. More specifically,
it applies novel methodological tools to data on European Framework Programme (FP) participations to
advance our understanding of transnational networks of collaborative research.
The FP is the main instrument of EU research policy. With €17.5bn devoted to FP6 (rising to €51bn
in FP7) it funds a substantial proportion of collaborative research activity in the EU and is, by far, the most
prominent funding mechanism for transnational research globally.
Therefore the analysis of the structure of European networks of collaboration in the FPs, from FP1 to
FP6, is a valuable tool in understanding the contribution of European policies in transforming the fabric of
research within the ERA, as well as in identifying a possible backbone for the ERA.
Traditional indicators of transnational research collaboration are limited to cross-tabulations of co-
participation in the FP (as well as co-publications and co-patenting in bibliometrics) at high levels of
aggregation (national/regional). By contrast, the use of social network analysis methods takes into account
the relative position of individual research actors in collaborative networks, and thus affords greater
analytical detail.
1 This project was performed under the Specific contract Nr. C. 150083. X32 implemented under the framework contract Nr. 150083-2005-02 BE
2 This project was performed under the FP 7 contract COH7-AA-2008-232064


11
Ana
lysis
of N
etw
orks
in E
urop
ean
Fram
ewor
k Pr
ogra
mm
es (1
984-
2006
)
Executive summary
Analysing the collaboration structures of the European Framework Programmes (FPs) is an important
analytical tool for the overall evaluation of results and impact of R&D policies in the EU and for informing
future policy development.
FPs have been pivotal for transforming informal nation-based networks of research collaborations within
epistemic communities of academics and industrial researchers into formal collaboration arrangements
between organisations at European level. The networks formed by the organisations have become almost
as important an outcome of FPs as the scientific and technological results of research projects conducted
by them.
The analysis of the characteristics and structural properties of the networks, built through the six
Framework Programmes, implemented until 2006, provides a plausible indication whether this new fabric
of European Research and Technology Development (RTD) has become more cohesive and integrative
during the past more than 20 years. It is valuable for understanding the contribution of European policies
for transforming the fabric of research within the ERA, as well for identifying the emergence of a possible
backbone of key research organisations in Europe. The study aims to explore this kind of issues by exploiting
the richness of FP collaboration data using advanced methods of social network analysis.
The above analysis of structural features of FP5 and FP6 networks suggests several implications for
ERA. First of all, comparing the evolution of the FPs over time, we observe extensive instrumental and
structural change. For the same type of instruments and for the same themes, the networks emerging are
more integrated and more tightly knit. This could be interpreted as a signal of self-reinforcing pan-European
thematic communities built on trust and a common operational framework that has evolved to its present
state alongside the FP. Secondly, the overall success of the FP, in involving research teams from new member
states and integrating smaller peripheral communities into wider European networks, is compatible with
the view that it is contributing to the construction of the ‘backbone’ of the ERA.
The identification of three kinds of networks as resulting from different types of sub-programmes – small
world networks, distributed clusters networks and networked communities – has further repercussions for
the implementation of ERA.
Small world networks tend to favour knowledge diffusion and building up of expertise across time but
might be less effective to foster wider integration because of the difficulties that new players have in joining
them. According to FP data for FP5 and FP6, small world networks (with high clustering) emerge in sub-
programmes that are strongly oriented towards applied research and development. Such kind of networks
are known for their resilience and their resistance to change due to the filtering apparatus of using highly
connected nodes (or ‘hubs’), and their high effectiveness in relaying information while keeping the number
of links required to connect a network to a minimum.
Distributed cluster networks are found in programmes with a strong exploitative component and
knowledge transfer functions. Such networks are less clustered than small world networks and represent
a balance of expertise accumulation and integration, with lower barriers to joining in. Favouring the

12
Exec
utiv
e su
mm
ary
advancement of knowledge and efficient transfer within relatively closed cliques, they represent an
interesting tool for ERA.
Finally, there are very evenly distributed network structures, the so-called ‘networked communities’
with a lower clustering coefficient, which are associated with basic research. Such networks are better
suited for cutting-edge research and allow a tighter integration since links are easily formed. However, they
may be less suited for an efficient diffusion and exploitation of knowledge.
Generally speaking, different kinds of networks represent different answers to ERA priorities. Positioned
in between the two main purposes of knowledge creation and of knowledge diffusion, there are irreducible
trade-offs in opting for different kinds of orientations of sub-programmes in future FPs.
We identify the following main dimensions along the lines of which different network types are
relevant: building strengths and the cohesion of the European Research Area.
The actors that play a key role for achieving both dimensions are universities. In many thematic areas,
they are at the core of the networks built by the FPs through time, and have increased their centrality and
share of participations. Because of the stability in the top positions and the wide representation of some
of universities in different thematic networks, they play a double role of furthering both excellence and of
contributing to cohesion. Together with Research and Technology Organisations (RTOs), universities form
the building blocks of the ERA, acting as harbours of stability. Stability over time also suggests that policy
interventions will need to take into account the specificities of these top actors and the networks in which
they participate. It is therefore important that their central role is recognised in any discussion on the future
evolution of the ERA.
The analysis of Integrated Projects (IP) and Networks of Excellence (NoE) in specific topics is of
particular interest from an ERA perspective, as they were tasked with strengthening the ERA by enhancing
collaboration at programmatic level. Both aimed at the facilitation of common research agendas, at the
integration of smaller research communities and new member states and at the promotion of virtual centres
of excellence that are visible at a global scale. In accordance with the expectations attached to them, we
found that they favoured large projects with many participants, but it remains to be seen whether these
large-scale networks will have a structural effect on ERA after the end of funding.
Organisation rankings by theme indicate wide variation across themes but, within a given theme,
relative homogeneity across instruments. Within each theme, we can distinguish between a core of stable
presences in the top ranks and others that are rather volatile. Core organisations have played the role of
integrator and coordinator in the building a European-level research agenda for a given topic.
Consistent with the ERA vision that sees coordination and cooperation as contributing to existing
strengths and integrating the knowledge periphery, the ‘top of the top’ universities participating in FP6 in
those instruments are spread across different countries, large and small, generic and specialised universities
are all involved in the FPs.
The role of the FP in structuring the ERA could be enhanced by the suitable design of instruments
that are tailored to the needs of thematic communities. Our analysis points to significant differences in
the resulting networks across thematic priorities. We also observe that the exact shape of the knowledge
triangle is thematically conditioned: the composition of resulting networks varies in terms of leading

13
Ana
lysis
of N
etw
orks
in E
urop
ean
Fram
ewor
k Pr
ogra
mm
es (1
984-
2006
)
organisation type, with Aerospace at one extreme (where industry is dominant) and Life Sciences at the
other (where academia dominate). The even mix of organisation types represented in the top ranks of ICT is
indicative of a priority that is conducive to knowledge sharing between different organisation types. Energy
and Environment has allowed a better integration of new organisations in the FP networks. This can be
seen as a consequence of the public-good nature of much of the knowledge produced and diffused in this
programme; a characteristic that requires more inclusive networks to be built. As such, this priority might
represent an example of how the FP could contribute to the tackling of ‘Grand Challenges’.


15
Ana
lysis
of N
etw
orks
in E
urop
ean
Fram
ewor
k Pr
ogra
mm
es (1
984-
2006
)
Acknowledgements
This report was jointly produced by Luisa Henriques, Dimitrios Pontikakis and Giuseppe Veltri at the
JRC-IPTS's Knowledge for Growth Unit (Head of Unit: Xabier Goenaga) and Michael Barber, Barbara Heller-
Schuh, Manfred Paier, Thomas Scherngell and Matthias Weber at the AIT, Austrian Institute of Technology's
Foresight & Policy Development Department.
We would like to thank for their contribution to the design of the project and suggestions: Antoine
Schoen and Rene van Bavel (JRC-IPTS), Johan Stierna (DG RTD), Robin Cowan (Université Louis Pasteur,
BETA) and Nick von Tunzelmann (University of Sussex, SPRU).
In addition, we are grateful to our workshop’s participants: Joaquin Azagra Caro, Dilek Cetin, Michele
Cincera, Claudio Cozza, Ana Fernandez Zubieta, Raquel Ortega-Argiles (all from JRC-IPTS) and Marco
Vivarelli (Università Cattolica del Sacro Cuore).

17
Ana
lysis
of N
etw
orks
in E
urop
ean
Fram
ewor
k Pr
ogra
mm
es (1
984-
2006
)
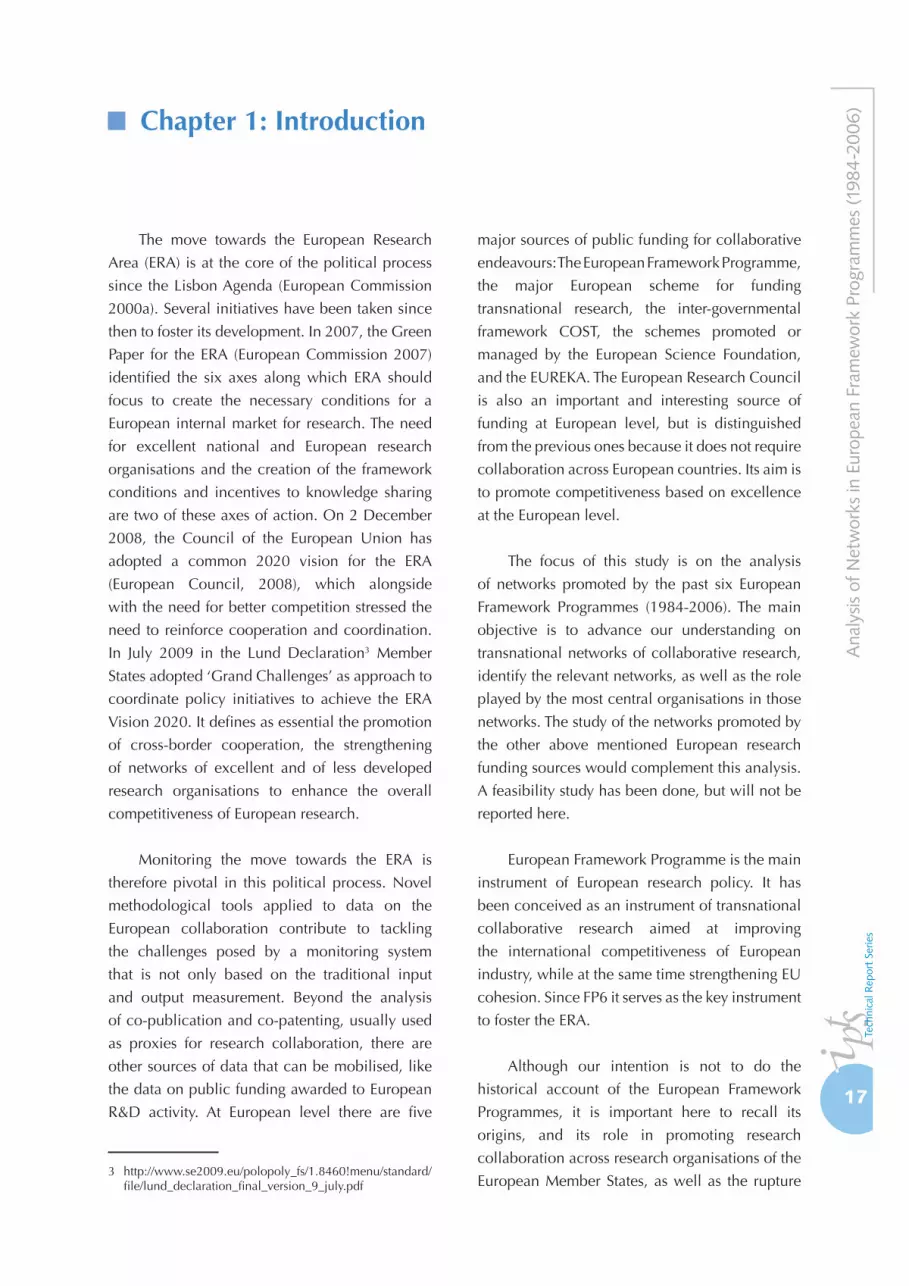
Chapter 1: Introduction
The move towards the European Research
Area (ERA) is at the core of the political process
since the Lisbon Agenda (European Commission
2000a). Several initiatives have been taken since
then to foster its development. In 2007, the Green
Paper for the ERA (European Commission 2007)
identified the six axes along which ERA should
focus to create the necessary conditions for a
European internal market for research. The need
for excellent national and European research
organisations and the creation of the framework
conditions and incentives to knowledge sharing
are two of these axes of action. On 2 December
2008, the Council of the European Union has
adopted a common 2020 vision for the ERA
(European Council, 2008), which alongside
with the need for better competition stressed the
need to reinforce cooperation and coordination.
In July 2009 in the Lund Declaration3 Member
States adopted ‘Grand Challenges’ as approach to
coordinate policy initiatives to achieve the ERA
Vision 2020. It defines as essential the promotion
of cross-border cooperation, the strengthening
of networks of excellent and of less developed
research organisations to enhance the overall
competitiveness of European research.
Monitoring the move towards the ERA is
therefore pivotal in this political process. Novel
methodological tools applied to data on the
European collaboration contribute to tackling
the challenges posed by a monitoring system
that is not only based on the traditional input
and output measurement. Beyond the analysis
of co-publication and co-patenting, usually used
as proxies for research collaboration, there are
other sources of data that can be mobilised, like
the data on public funding awarded to European
R&D activity. At European level there are five
3 http://www.se2009.eu/polopoly_fs/1.8460!menu/standard/file/lund_declaration_final_version_9_july.pdf
major sources of public funding for collaborative
endeavours: The European Framework Programme,
the major European scheme for funding
transnational research, the inter-governmental
framework COST, the schemes promoted or
managed by the European Science Foundation,
and the EUREKA. The European Research Council
is also an important and interesting source of
funding at European level, but is distinguished
from the previous ones because it does not require
collaboration across European countries. Its aim is
to promote competitiveness based on excellence
at the European level.
The focus of this study is on the analysis
of networks promoted by the past six European
Framework Programmes (1984-2006). The main
objective is to advance our understanding on
transnational networks of collaborative research,
identify the relevant networks, as well as the role
played by the most central organisations in those
networks. The study of the networks promoted by
the other above mentioned European research
funding sources would complement this analysis.
A feasibility study has been done, but will not be
reported here.
European Framework Programme is the main
instrument of European research policy. It has
been conceived as an instrument of transnational
collaborative research aimed at improving
the international competitiveness of European
industry, while at the same time strengthening EU
cohesion. Since FP6 it serves as the key instrument
to foster the ERA.
Although our intention is not to do the
historical account of the European Framework
Programmes, it is important here to recall its
origins, and its role in promoting research
collaboration across research organisations of the
European Member States, as well as the rupture

18
Cha
pter
1: I
ntro
duct
ion
introduced in the range of both geographical and
modes of collaboration of research organisations.
The FPs are one of the answers of Europe to the
challenges posed by the knowledge production
of generic technologies, like the information and
communication technologies or biotechnology,
developed through the combination of different
disciplines and skills through collaboration
of heterogeneous actors (Callon, Larédo et al.
1995). The development of these technologies
imply a cooperative process between knowledge
producers and consequently the implementation
of novel processes for sharing knowledge and
resources in order to cope with the need of
reducing lead times and the fast pace of technology
development and diffusion (Onida and Malerba
1989; Freeman 1991).
European Framework Programmes were
modelled based on the success of ESPRIT I, the
information technologies (IT) programme for
collaborative research at the European level,
created in 1982 by the European Commission.
ESPRIT was promoted by the Commissioner for
Industry, Étienne Davignon, with the support
and advice from the European Round Table of
the twelve biggest European companies in the
IT sector. The First Framework Programme for
Research and Technology Development (RTD) was
created two years later, which included the ESPRIT
programme and other sub-programmes in a variety
of topics, to address the development of generic
technologies within a multi-annual framework.
Since then other FPs have been implemented
regularly with an enlarged scope and a diversified
set of funding instruments. The rationale behind
was that universities, research institutes and firms
(even competitors) from Member States should
work in cooperation to reduce the technology
gap of Europe in relation to the United States and
Japan and increase its competitiveness. Therefore
the projects funded by the FP focus either on
the development of new technologies and
products or on the development of technological
standards. The projects have to be carried out by
a consortium of research organisations, from at
least two different countries, preferably with the
involvement of knowledge producers, exploiters
and users.
FPs were pivotal in changing the traditional
nation-based informal research collaboration
within epistemic communities into formal
arrangements between research organisations
at the European level. The durable networks of
research collaboration formed by the organisations
participating in FPs are almost as important as the
scientific and technological outcomes of research
projects supported by them.
The collaborative links established by the
European projects can be equated to paths
through which the knowledge circulates between
the organisations, and eventually joint knowledge
is produced. The analysis of the characteristics
and structural properties of these networks can
plausible give an indication on the nature and
characteristics of the new fabric of European
RTD, and on the degree of its cohesiveness and
integration. In addition, the analysis sheds light
on the contribution of the European research
policies to the transformation of research within
the ERA and aims at identifying a possible
backbone.
The main objective of the study was to
exploit the richness of FP data through social
network analysis (structure of research networks
and actors centrality) to contribute to the process
of monitoring the move towards the ERA. The
research questions addressed in the study were
the following:
1) Does the density of collaborative
organisational links increase over time?
2) Is it possible to identify optimal network
structures by areas of research and
funding instruments?
3) Is it possible to identify a backbone
of core research organisations in the
European Research Area?
4) Who are the key players in the FPs, and
where are they located within the FP
networks?

19
Ana
lysis
of N
etw
orks
in E
urop
ean
Fram
ewor
k Pr
ogra
mm
es (1
984-
2006
)
The report is structured in the following
way. The next chapter introduces the
methodology adopted. The second part of the
report, which includes chapters three to six,
presents an aggregate view of collaborative
research networks in the FPs and closer look at
thematic sub-networks including distribution
of core organisations by theme, instrument,
country and organisation type. The third and
last part, which contains chapters seven to
eight, examines the feasibility of extending the
analysis conducted in the present study and
outlines potentially interesting future research
directions. Finally, it elaborates on some policy
implications for the ERA emanating from the
study’s findings.


21
Ana
lysis
of N
etw
orks
in E
urop
ean
Fram
ewor
k Pr
ogra
mm
es (1
984-
2006
)
Chapter 2: Methodology
The study employs a combination of
quantitative and qualitative methods. The
produced metrics are the result of the application
of social network analysis to joint research projects
sponsored by the six Framework Programmes
executed until 2006. The analysis of the networks
and the interpretation of the results were supported
by extensive use of publicly available secondary
sources, such as the evaluation reports of the
framework programmes and a review of relevant
academic literature.
This section describes succinctly the
methodological approach. First, it describes the
process applied in the retrieval and cleaning of FP
data and documents the problems identified and
the choices taken. Then, it explains how social
network analysis was applied and briefly presents
the chosen network metrics and the ranking
methods used.
2.1 Data sources
The Austrian Institute of Technology (AIT)
developed the EUPRO database built on available
data in the CORDIS projects database (Barber et
al. 2008). CORDIS, the Community Research
and Development Information Service, maintains
online databases of FP-funded research (e.g. http://
cordis.europa.eu/fp6/projects.htm). The CORDIS
database is run by a subcontractor who receives
raw data from different General Directorates (DGs)
in charge of thematic areas of the FP. The project
data was retrieved from CORDIS by AIT, and then
cleaned, standardised and consolidated into the
EUPRO database (version 1.0.3), which was used
in this project to calculate the network metrics.
The CORDIS projects database contains a
great deal of information about FP-funded research
projects and project participants. In principle, the
CORDIS projects database contains information
on: 1) project objectives and achievements, 2)
project costs and 3) total funding, 4) start and
end date, 5) contract type, 6) a standardised
subject index, and a freely specified index, and 7)
information on the call in which the project was
funded. On project participants, it ideally lists
information on 8) the participating organisation,
9) the actual participating department, 10)
contact person, 11) complete contact details,
12) organisation type and 13) URL. Until the
recent change of the front end of the database,
it also included email addresses, telephone
and fax numbers of contact persons, as well as
information on the organisation size. However, in
practice, and according to the experience of AIT
in retrieving data from CORDIS, the records are
rarely complete4.
The process of retrieving and cleaning
CORDIS data is cumbersome as information is
not immediately available and can change over
time. In fact, there are delays before information
on projects and participants becomes available.
For instance, a sizeable amount of information on
FP6 was only available in 2006, the last year of its
existence. Secondly, information is not available
on strength and duration of partner’s involvement
in each project or on partner changes during a
project’s lifetime – the only way to find out is
to retrieve the data regularly from the CORDIS
projects database.
Data on organisation types is available for
77% of the records, but tend to be inconsistent.
4 The project records are complete on 94% on contract types, 95% on start date and 93% on end dates and about 89% on information on sub-programme (ideally corresponding to specific calls). Other fields have lower level of completeness like information on project acronyms (50%), objectives (55%), project costs (48%), project funding (53%), project status (96%) and achievements (15%).

22
Cha
pter
2: M
etho
dolo
gy In principle, there are seven organisation types
(Education, Research, Industry, Government,
Consulting, Non-Commercial and Other). In
practice, participants choose the organisation
type (or a combination of types) they deem
appropriate. As a result, raw data on participant’s
lists varies from two to six different organisation
types for the same organisation.
In addition to this, the available raw data on
participating organisations tend to be inconsistent.
Organisations may be spelled in up to four languages
(e.g. the case of Swiss organisations), and labelled
non-homogeneously. Entries may range from large
corporate groupings, such as EADS, Siemens and
Philips, or large public research organisations, such
as CNR, CNRS and CSIC, to individual departments
and labs. Moreover, organisations are subject to
change, which may reflect in changing organisation
names. Department labels are in general
incoherent, ranging from the organisation name
to meaningful subunits like faculties, subsidiaries,
institutes, centres, laboratories, to unidentifiable
acronyms. The labels not only represent different
organisational scales, but are also apparently self-
selected by project participants resulting in an
inconsistent labelling of organisations that partake
in multiple projects. Information on older entries
and the substructure of firms tends to be less
complete.
Because of raw data shortcomings, the
application of a fully automated standardisation
method was not feasible. Rather, the data had
to be cleaned and completed manually, in a
four step process involving: 1) identification
of unique organisation name; 2) identification
of unique organisation type; 3) creation of
economically meaningful sub entities, and 4)
regionalisation.
In step one the boundary of organisations
was defined by its legal entity and entries assigned
to unique organisations using the most recent
available organisation name. In this process, all
available additional contact information was used
and missing information completed.
In step two, organisation types were
homogenised. Cleaning and completing this
information improves the quality of raw data
considerably. The process itself is relatively
straightforward; the only challenge is the
distinction between public and industrial research
centres.
Step three was key for the mitigation of the
bias that arises from different organisation scales
at which participants appear in the dataset.
Ideally, the laboratory or organisational unit
that participates in each project is taken, but in
practice, this information is only available for a
subset of records, particularly for firms. Taking
the definition of an organisation as a coherent
bundle of resources (or competencies), sub-
entities of large organisations in general are
created to operate in fairly coherent activity
areas. Therefore, universities were disaggregated
whenever possible into faculties or schools and
large public research organisations into institutes
or research fields. Due to incomplete information
on the organisational structure of firms, it was
not feasible to define meaningful sub-entities
representing different activity areas of the firm.
Thus, sub-entities for global corporations firms
were taken for the country-specific subsidiaries5.
Apart from the analyses on the positioning of key
universities in different themes and instruments in
Chapter 6, we have used in the present study the
lowest organisational level of aggregation, i.e. the
sub-entities of organisations.
The final step was the regionalisation of
the dataset according to the European NUTS
classification system6, ideally down to the
NUTS3 level, using information on postal codes
5 Though we have information on different department or sections, it is often not possible to assign them to broader divisions or departments. The definition of country specific subsidiaries as sub-entities is appropriate when we assume that subsidiaries in different countries act in different research fields.
6 European Commission (2005), Nomenclature of territorial units for statistics - NUTS Statistical Regions of Europe. http://europa.eu.int/comm/eurostat/ramon/nuts/home_regions_en.html.
23
Ana
lysis
of N
etw
orks
in E
urop
ean
Fram
ewor
k Pr
ogra
mm
es (1
984-
2006
)
or the information on the regional localisation
of each participant.
The cleaned database, EUPRO database
(version 1.0.3), used in this report comprises
information on 50,590 projects. It covers the period
from 1984 (first project starting dates) to 2025 (last
scheduled project end date). At its present state
of standardisation, the database includes 49,624
separate organisations that were involved in at
least one project. This figure increases to 55,555
when sub entities are considered. Information on
these projects was retrieved from the CORDIS
projects database in January 2007. Data on the
first four FPs is complete according to the CORDIS
website. In FP5, a handful of R&D projects are
still missing (161 projects). For FP6 the existing
data appears quite representative. Considering
for FP6 only sub-programmes that support mainly
collaborative research7, the database includes
about 90% of all FP6 projects8.
2.2 Network analysis and centrality measures
Networks metrics and actor metrics were
calculated in order to capture the networks that
can be pivotal in the emerging ERA. Network
metrics were calculated for the organisations as
nodes. The classification applied is the type of
organisation according to the typology defined
by the European Commission. For the themes, the
option was to keep the thematic organisation of
sub-programmes to avoid a complex reconstruction
of fields in technologies that combines several
scientific disciplines.
7 FP6-MOBILITY focuses primarily on research grants for individual researchers.
8 For some programs the sysres EUPRO database includes up to 90% of the FP6 projects (FP6-COORDINATION, FP6-INFRASTRUCTURE, FP6-CITIZENS, FP6-IST, and FP6-INNOVATION), 60-80% of the projects are retrieved for FP6-FOOD, FP6-INCO, FP6-NMP, FP6-SOCIETY, FP6-AEROSPACE and FP6-SUSTDEV). 40-50% of the projects are missing in FP6-LIFESCIHEALTH, FP6-SME, FP6-NEST and FP6-POLICIES.
The analysis was done in two levels of
aggregation. One level focused on the networks
of the FP, ignoring the sub-division on themes or
instruments, while in the other the themes were
crossed with instruments to have an in-depth
analysis of actors and networks in each of them.
At the aggregated level, network metrics
were calculated to identify the structural features
and characteristics of networks built by each
FP. The characteristics of networks were then
compared over time to understand their evolution
towards a more integrated or fragmented status.
The key nodes (organisations) that form part
of the backbone of the ERA were identified for
every FP. A ranking of the position of such key
organisations in the European landscape had to
go beyond simple counts of participations. To
decide if an actor is a core player it is necessary to
calculate centrality measures that show how well
actors are connected, and identify which role they
are performing in the network (Wassermann and
Faust 1994). Several centrality measures, some
of them recently developed, were applied in the
study, as well as a composite indicator developed
for ranking organisations and topics.
At disaggregated level, characteristics and
behaviour of actors were identified through
network metrics in a group of funding instruments
in four main topics. The rationale for the selection
of topics and funding instruments is described in
the next section. As for the aggregated level at the
topic and instrument levels, the core players in the
scientific and technological communities were
identified through rankings based on centrality
measures. The definitions of network metrics used
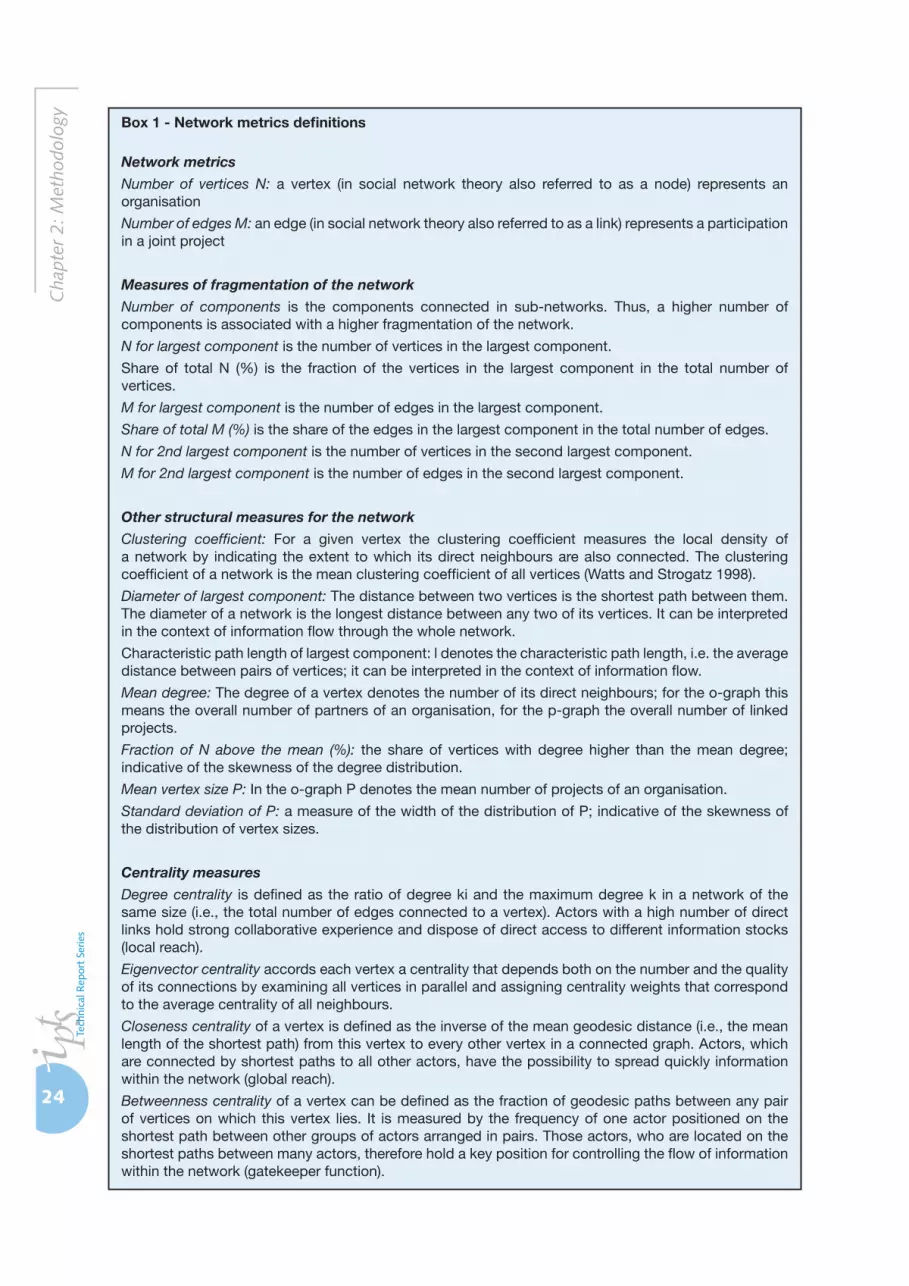
in the study are reported in Box 1.
To facilitate rankings, we developed a simple
composite indicator of centrality measures. The
centrality measures selected for the indicator
combined the different types of connectedness
with role and positioning in the landscape. The
four centrality measures were local [Degree
Centrality] and global connectedness [Closeness
Centrality], the ability to control information
24
Cha
pter
2: M
etho
dolo
gy Box 1 - Network metrics definitions
Network metrics
Number of vertices N: a vertex (in social network theory also referred to as a node) represents an organisation
Number of edges M: an edge (in social network theory also referred to as a link) represents a participation in a joint project
Measures of fragmentation of the network
Number of components is the components connected in sub-networks. Thus, a higher number of components is associated with a higher fragmentation of the network.
N for largest component is the number of vertices in the largest component.
Share of total N (%) is the fraction of the vertices in the largest component in the total number of vertices.
M for largest component is the number of edges in the largest component.
Share of total M (%) is the share of the edges in the largest component in the total number of edges.
N for 2nd largest component is the number of vertices in the second largest component.
M for 2nd largest component is the number of edges in the second largest component.
Other structural measures for the network
Clustering coefficient: For a given vertex the clustering coefficient measures the local density of a network by indicating the extent to which its direct neighbours are also connected. The clustering coefficient of a network is the mean clustering coefficient of all vertices (Watts and Strogatz 1998).
Diameter of largest component: The distance between two vertices is the shortest path between them. The diameter of a network is the longest distance between any two of its vertices. It can be interpreted in the context of information flow through the whole network.
Characteristic path length of largest component: l denotes the characteristic path length, i.e. the average distance between pairs of vertices; it can be interpreted in the context of information flow.
Mean degree: The degree of a vertex denotes the number of its direct neighbours; for the o-graph this means the overall number of partners of an organisation, for the p-graph the overall number of linked projects.
Fraction of N above the mean (%): the share of vertices with degree higher than the mean degree; indicative of the skewness of the degree distribution.
Mean vertex size P: In the o-graph P denotes the mean number of projects of an organisation.
Standard deviation of P: a measure of the width of the distribution of P; indicative of the skewness of the distribution of vertex sizes.
Centrality measures
Degree centrality is defined as the ratio of degree ki and the maximum degree k in a network of the same size (i.e., the total number of edges connected to a vertex). Actors with a high number of direct links hold strong collaborative experience and dispose of direct access to different information stocks (local reach).
Eigenvector centrality accords each vertex a centrality that depends both on the number and the quality of its connections by examining all vertices in parallel and assigning centrality weights that correspond to the average centrality of all neighbours.
Closeness centrality of a vertex is defined as the inverse of the mean geodesic distance (i.e., the mean length of the shortest path) from this vertex to every other vertex in a connected graph. Actors, which are connected by shortest paths to all other actors, have the possibility to spread quickly information within the network (global reach).
Betweenness centrality of a vertex can be defined as the fraction of geodesic paths between any pair of vertices on which this vertex lies. It is measured by the frequency of one actor positioned on the shortest path between other groups of actors arranged in pairs. Those actors, who are located on the shortest paths between many actors, therefore hold a key position for controlling the flow of information within the network (gatekeeper function).

25
Ana
lysis
of N
etw
orks
in E
urop
ean
Fram
ewor
k Pr
ogra
mm
es (1
984-
2006
)
flow in the network [Betweenness Centrality]
and connectedness to other central nodes
[Eigenvector Centrality]. These were combined
into a composite centrality ranking or a weighted
centrality index. It merges normalised values
of different metric indicators (i.e. centrality
measures) to an aggregated index by a linear-
additive combination.
To explore structural features of FP networks
in relation to the functions on knowledge
production and circulation, an experiment was
done using FP5 and FP6 networks. Structural
characteristics of knowledge-related functions
were identified. Then an aggregation of network
characteristics was done in order to define which
type of networks is built in the thematic sub-
networks of FPs. More details on this experiment
can be found in Chapter 4 – Thematic networks
and their functions.
In the following sections, the terminology
about roles and properties of actors are defined
as follows: ‘’core’’ for the organisations that had
a much higher degree centrality than the average,
‘’central’’ for the ones ranked by the composite
indicator, ‘’key’’ for organisations ranked by
number of participations in FPs projects.
2.3 Selection of topics and instruments in FPs
Choices were taken for the analysis
at disaggregated level in order to achieve
meaningful results in a reasonable period and
resources, taking into account the complexity of
six multi-annual Framework Programmes with
a time span of more than 20 years. As is natural
over such a long period, rationales and specific
objectives of European research policy shifted,
with a corresponding impact on the modes of
implementation and priorities assigned to thematic
areas. In accordance with our emphasis on the
recent evolution of the ERA, and due to resource
limitations, a decision was taken to constrain the
analysis to the three latest FPs (FP4, 5 and 6), and
then for a subset of themes and instruments.
Theme and instrument selection is not a trivial
task. The three last FPs selected vary considerably
in rationale, priorities and type of instrument.
The solution found was to use FP6 as a point of
reference and look backwards to previous FPs for
themes and instruments that display continuity.
The final selection included the following themes:
Aerospace (AERO), Energy and Environment (ENV),
Information and Communication Technologies
(ICT), and Life Sciences (LIFESCI).
It has to be noted that it is not intended
to compare FP4, 5 and 6 as a whole, or even
(because of the rather tenuous link between
FPs) a one-for-one comparison between specific
thematic programmes with intended ‘follow-up’
programmes, but to have an exploratory analysis
of networks evolution over time.
Aside from the establishment of broad
thematic priorities, early FPs adopted a generic
approach to the implementation of joint research
undertakings (shared costs actions). The desire
to better serve the needs and increase the
participation of excellent actors from across the
research spectrum as well as to serve greater
political aims (such as the creation of the ERA)
led to the customisation of contracts into purpose-
minded ‘instruments’.
Starting in FP6, several cross-cutting
instruments were introduced including Integrated
Projects (IP), Specific Targeted Research Projects
(STREP) and Networks of Excellence (NoE)9. IP aim
at generating the knowledge required to increase
Europe’s competitiveness or to address major
societal needs. Specifically, IP address the needs
of exploratory projects (including long-term or
“risky research”) that are often innovation-related
9 The description that follows draws heavily from EC, “Classification of FP6 Instruments”. (ftp://ftp.cordis.europa.eu/pub/fp6/docs/annex_on_instruments.pdf) and Marimon, (2004), “Evaluation of the effectiveness of new instruments in Framework Programme VI”. (http://ec.europa.eu/energy/evaluations/doc/2004_research_fp6.pdf).
26
Cha
pter
2: M
etho
dolo
gy and require the concentration of considerable
resources, both human and financial. Although
IP are objective driven, the implementation of
projects is subject to a certain amount of flexibility,
reflecting their exploratory nature.
STREP (the post-FP6 evolution of shared costs
actions – identified here as Cost Shared Contracts,
CSC) fund collaborative research and technology
development projects that address European
competitiveness and societal needs. In contrast to
IP, STREP is limited in scope, focusing on a single
issue and is often monodisciplinary. They are also
generally smaller than IP in terms of resources,
reflecting the less ambitious and more piecemeal
strategic approach of STREP projects.
By virtue of their characteristics, IP and STREP
are generally considered as particularly suitable to
collaborations between industry, public research
organisations and universities. STREP in particular
are usually preferred by small- and medium-sized
enterprises (SMEs).
The NoE instrument envisages the durable
integration of the participant’s research capacities,
while potentially supporting their joint research
activities. As such, NoE have been conceived
with the explicit aim of tackling fragmentation
and reaching the critical mass needed to structure
excellent research. NoE are framed according to
disciplines or clearly defined research themes.
NoE are generally targeted at universities and more
basic-type research organisations, though some
companies also make use of this instrument.
Our choice was to focus on these four
instruments as they combine continuity (STREP)
and rupture with the introduction of more policy-
driven research instruments (IP, NoE). The Marie
Curie actions were also considered a potentially
interesting instrument but the information contained
in the CORDIS database was found to be insufficient
for identifying network links. In addition, the
database contains no information on the direction
of mobility, as it does not systematically distinguish
between source and host organisations.

27
Ana
lysis
of N
etw
orks
in E
urop
ean
Fram
ewor
k Pr
ogra
mm
es (1
984-
2006
)
Chapter 3: Networks of collaborative R&D in the FPs
3.1 Structural features of FP networks
European projects are establishing and
expanding collaborative links between
organisations, which can be equated as paths
through which knowledge circulate and diffuse
between organisations, and joint knowledge might
be produced. The analysis of the characteristics and
structural properties of the networks built by the six
framework programmes, implemented until 2006,
can give some plausible indication on whether this
new fabric of European RTD is more cohesive and
integrated.
FP networks are increasing in size
Network analysis can provide several
measures and identify the characteristics of the
collaboration promoted by the FPs over time.
The number of vertices or nodes (M) and of edges
or ties (N) in a network relates to its size and
degree of connectedness. If M is increasing, it
means that more organisations are participating
in projects funded by FP and becoming engaged
in the collaborative effort. Figure 1 shows that the
number of organisations has grown fast until FP5,
from 2,116 in FP1 to 25,840 in FP5, and decrease
in FP6 to 17,632. There might be two explanations
for this sharp decrease in FP6 shown in the
data. First as we mentioned before, the EUPRO
database is not yet complete for FP6, second
there is certainly a decrease even if not so sharp
related to a lower success rate in FP6 (number
accepted proposals in relation to the number of
submitted ones) in comparison with the previous
one. The success rate has decreased from 26%
to 18%10, implying fewer projects awarded and
participations.
10 Final evaluation of FP 6 Report by Rietschel, Arnold et al. (2009).
Figure 1: Number of nodes (N) in network organisations in FP1-FP6

28
Cha
pter
3: N
etw
orks
of
colla
bora
tive
R&
D in
the
FPs
The evolution of the degree of collaboration
in the FPs can be given by the number of edges
or ties between the organisations that are linked
by their participation in collaborative project (M).
The number of links in FPs increased significantly
from FP1 to FP5 from 9,489 to 385,740, and has
stabilised around 392,879 in FP6 (Figure 2).
Increasing in cohesiveness
The networks have increased in size and
have became more cohesive as collaboration
has evolved with time, with the positive learning
processes on how to overcome barriers for
collaboration, like the differences in culture,
languages and other involved in multi-
national collaboration in Europe. Measures of
fragmentation/cohesiveness of networks are
the number of sub-networks that compose the
network (number of components), the size of the
largest component (N for the largest component)
their shares in terms of vertices and edges in
relation to the total, and the size of the second
largest component and its shares. According to
data, there is a giant network in every FP. Its
presence indicates that two arbitrary vertices are
connected either directly or indirectly through
a path of connected vertices (Table 1). These
giant-components ensure that information flows
easily between the participants in FPs, allowing
coordination and alignment of networks, and
promoting a common language and shared
culture between them.
Table 1 also presents other measures, like
the number of sub-networks (No of components).
These sub-networks that have increased until FP5
have drastically reduced in FP6, showing that
the objective for cohesion is being attained with
a concentration of the previous sub-networks.
The second largest component remains constant
around more or less nine nodes.
High clustering effects with characteristics of
“small world”
The evolution of cluster coefficient reflects
how the intensity of collaborative links is
evolving over time from FP1 to FP6. The cluster
coefficient quantifies how close organisations
(the nodes or vertices in the social network
theory) are from each other through direct
links or can be considered associated of their
neighbouring organisations through indirect
linkages. It measures the local density of a
network by the mean clustering coefficient of all
Figure 2: Number of edges (M) in organisation networks in FP1-FP6

29
Ana
lysis
of N
etw
orks
in E
urop
ean
Fram
ewor
k Pr
ogra
mm
es (1
984-
2006
)
vertices (Watts and Strogatz 1998). The higher
the value of the coefficient, the more connected
is the network, closer to what sociologists call a
“clique”, meaning a cohesive group with shared
values, behaviour and norms. If the FP cluster
coefficient increases over time it means that intra-
European collaboration is developing and there
is a move towards a more integrated ERA. From
the calculations done, the cluster coefficient
increases slightly from FP1 (0.65) to FP5 (0.76)
(Table 2). The increasing trend continues up to
FP6 reaching the value of 0.80. However, this
last value could be a reflection of the effect of the
new FP6 instruments aiming at the integration of
teams, which foresaw an increase of the size of
funded projects.
A high coefficient degree in the networks
formed by FP means that a knitted fabric for the
European research is taking place, promoting
knowledge creation and diffusion and facilitating
learning processes. This indication is compatible
with the move towards the ERA, with the FP being
a crucial instrument in this process through the
creation of a well-connected European research
community.
Combining a high clustering coefficient with a
small diameter of the largest component (Table 3),
FP networks can be characterised as belonging to
the small-world type (Watts and Strogatz, 1998). In
terms of what we presently know about knowledge
creation and knowledge diffusion in social
networks (Cowan 2006), this is a positive result.
When path lengths are short, new knowledge can
spread rapidly and widely through the population
and thus fuel local knowledge creation.
The mean degree in the R&D collaboration
networks is roughly constant until FP5, with a
value around 23, but it shows a sharp jump for
FP6 to 44.6 indicating that organisations have
increased their number of ties and diversified
their connections.
Table 1: Measures of fragmentation of the organisation networks FP1-FP6
FP1 FP2 FP3 FP4 FP5 FP6
No. of components 53 45 123 364 630 26
N for largest component 1,969 5,631 8,669 20,753 24,364 17,542
Share of total N (%) 93.1 97.8 95.9 96.1 94.2 99.5
M for largest component 9,327 62,044 108,388 237,632 384,316 392,705
Share of total M (%) 98.3 99.8 99.6 99.6 99.6 99.9
N for 2nd largest component 8 6 9 10 12 9
M for 2nd largest component 44 30 72 90 132 72
Table 2: Cluster coefficient of organisations in FP1-FP6
FP1 FP2 FP3 FP4 FP5 FP6
0.65 0.74 0.74 0.78 0.76 0.80
Table 3: Structural characteristics of organisation networks in FP1-FP6
FP1 FP2 FP3 FP4 FP5 FP6
Diameter of largest component 9 7 8 11 10 7
l for largest component 3.6 3.2 3.3 3.4 3.3 3.0
Mean degree 9.0 21.6 24.1 22.1 29.9 44.6
Fraction of N above the mean (%) 29.4 28.0 23.6 22.4 23.5 26.1
Mean vertex size P 3.0 3.1 3.3 3.0 2.8 2.7
Standard deviation of P 5.0 6.1 7.7 7.9 6.8 5.4
30
Cha
pter
3: N
etw
orks
of
colla
bora
tive
R&
D in
the
FPs Overall, in their twenty-odd year period
of implementation, the FPs have created a new
layer in the European research systems based on
transnational collaborative research. Over time,
European collaborative networks were able to
create a highly dense and integrated structure.
From the analysis, it can also be argued that
framework programmes have been promoting
actively the move towards the ERA, through the
construction of a European research community
where knowledge is created jointly and that
information flows fast through network channels.
3.2 Top 100 organisations in FP networks by centrality and participation
The embedding within networks is a basic
condition for successful research, technological
development and innovation. Networks offer
access to new knowledge and other resources
through every new partnership and therefore help
to create new knowledge. Furthermore, networks
between reliable partners may be utilised to jointly
exploit and deepen existing knowledge in specific
areas. The position of an actor within the network
determines the likelihood that knowledge flows
have an economically successful impact. In this
process, direct relations are as relevant for the
innovation process as indirect second- or third-
degree relations, which can develop a variety of
knowledge sources or partnerships.
One way for ranking organisations in the
European landscape is to count the number of
projects they participate in. However, participating
in many projects is not sufficient for being
a decisive player. We also take into account
centrality, a measure of how well actors are
connected (Wassermann and Faust 1994). We
select four different centrality measures (accounting
for local and global connectedness, the ability
to control information flow in the network and
the connectedness to other central nodes), and
combine them to a composite centrality ranking
(see Section 2.2).
Degree centrality shows to what extent an
actor is integrated into a network by the number
of direct links to other actors. The stronger the
integration of an actor within a network through
direct connections, the higher is his experience in
co-operations and his ability to extract information
from these direct contacts (local reach) and
consequently is ability of exert power over the
network.
Having many connections surely affords
influence and power, but not all connections are
the same. Typically, connections to actors who
are themselves well connected (high degree)
will provide actors with more influence than
connections to poorly connected (low degree)
actors. Eigenvector centrality thus accords
each vertex a centrality that depends both on
the number and quality of its connections by
examining all vertices in parallel and assigning
centrality weights that correspond to the average
centrality of all neighbours.
Another way to define centrality is based on
network paths. Assuming that information takes
the shortest paths when spreading in a network,
vertices that are at a short distance from any other
are likely to receive them more quickly than more
distant vertices. This idea is quantified by the
closeness centrality. Actors, which are connected
by shortest paths to all other actors, have the
possibility to quickly spread information within
the network (global reach).
Based on the same logic, the betweenness
centrality measures the frequency of one actor
positioned on the shortest path between other
groups of actors arranged in pairs. If an actor is
located at many links between other actors, he/
she can more easily access information within
the network, manipulate this information and
distribute it. Those actors who are located on the
shortest paths between many actors therefore
hold a key position for controlling the flow of
information within the network (gate keeper
function).

31
Ana
lysis
of N
etw
orks
in E
urop
ean
Fram
ewor
k Pr
ogra
mm
es (1
984-
2006
)
In R&D networks, a small number of well-
connected organisations can be expected to yield
a substantial amount of control over the flow
of information. By virtue of their position, such
organisations could be called ‘core’. Using the
number of connections as a criterion, we can
identify as ‘core’ those organisations that had a
much higher centrality than the average. Actors
with a high number of direct links hold strong
collaborative experience and dispose of direct
access to different information stocks (local
reach).
Drawing data from the EUPRO database,
we firstly identify the top 100 core network
nodes (organisations with much larger degree
centrality than the average) for FP1 to FP6;
secondly we identify the top 100 key players, as
the organisations that have the highest level of
participation in FP1 to FP6, and thirdly we rank
the top 100 central organisations (organisations
with highest centrality values measured by the
composite indicator.
Top 100 core organisations
Core organisations by organisation type
Table 4 and Figure 3 present a distribution
of the top 100 core nodes by organisation type.
We observe that from FP1 to FP6 educational
Table 4: Distribution of top 100 core organisations by organisation type, FP1-FP6 (%)
FP1 FP2 FP3 FP4 FP5 FP6
core all core all core all core all core all core all
CON 1 1.1 1 1.8 0 2.2 0 2.3 0 2.8 0 1.7
EDU 35 27.6 28 27 49 26.8 33 16.9 37 16.8 47 22.3
GOV 1 3 7 3.9 0 4.4 2 4.7 0 4.3 0 3.9
IND 32 42.8 26 40.7 24 41.7 28 53.1 18 43.2 15 34.6
OTH 0 2.2 1 2.8 0 3.2 0 6 0 15.7 0 17.3
ROR 31 23.1 37 23.2 27 20.7 37 16.4 45 16.5 38 19.6
Note: Explanation of abbreviations, see in Annex
Figure 3: Percentages of type of core organisations by organisation type and FP programme

32
Cha
pter
3: N
etw
orks
of
colla
bora
tive
R&
D in
the
FPs institutions and research organisations accounted
for the greatest proportion of core organisations.
Contrarily, industrial and government organisations
have a comparatively lower percentage of
core organisations. The percentage of core
organisations from industry has decreased over
time. Consultancy and organisations of type ‘other’
had no or only negligible representation among
core organisations. Educational organisations
were dominant among core organisations in
FP6 with 48 per cent of participations, followed
closely by research organisations with 38 per cent.
Taken together these two types of organisations
accounted for 85 per cent of core organisations.
Core organisations by countries
Table 5 and Figure 4 present a distribution
of the top 100 core nodes (core organisations) by
countries. Whereas France, Germany, the United
Kingdom and Italy accounted for the bulk of
core organisations in FP1, their relative position
declined over time. It is interesting to note that
while France was the dominant country among
core organisations in FP1, from FP2 onwards the
United Kingdom took the lead. New member
states are particularly underrepresented among
core organisations, with organisation from only
Poland, Hungary and Cyprus making it to the top
100. Among associated states, the presence of
Swiss organisations in the core group is notable (3
per cent in FP6), with only minimal representation
from Norway and Turkey.
Core organisations by returning actors and new
entrants
The percentage of organisations belonging
to the group of returning actors (i.e. which have
taken part in previous FPs) and the percentage
of organisations belonging to the group of new
entrants were calculated. Of those they reported
Table 5: Distribution of top 100 core organisations by countries, FP1-FP6 (%)
FP1 FP2 FP3 FP4 FP5 FP6
core all core all core all core all core all core all
AUT 0 0.1 0 0.8 0 1.2 0 2.6 1 2.8 1 3
BEL 10 5.8 10 5.2 6 4.7 3 4.4 3 3.7 3 3.9
CHE 0 0.2 0 1.5 0 1.4 1 1.5 2 1.9 3 2.4
CYP 0 0 0 0 0 0 0 0.1 1 0.3 1 0.3
DEU 16 17.7 16 16.8 12 16.9 13 15.2 11 14.6 13 13.7
DNK 4 5.1 2 4.2 2 3.7 1 2.7 0 2.6 1 2.5
ESP 1 6.4 6 8.2 3 8.4 6 7.6 7 8.3 4 7.4
FIN 0 0.5 1 1.1 1 1.2 3 2.3 4 2.2 2 2
FRA 27 19 18 16.9 18 14.7 17 11.5 16 10.4 16 9.6
GBR 15 16.7 18 13.8 20 12.8 19 13.3 20 11.4 18 9.4
GRC 3 3.2 2 3.8 7 4.3 6 3.5 6 3.3 3 2.6
HUN 0 0 0 0 0 0.1 0 0.6 1 1.2 0 1.7
IRL 1 2.9 3 2.3 2 2.4 0 1.9 0 1.4 1 1.4
ITA 12 12.6 8 11.7 11 11.2 10 9.1 14 9.7 11 8.7
NLD 8 5.5 11 5.7 12 5.4 13 5.8 7 5 10 4.3
NOR 0 0.3 0 1 0 1.3 0 1.5 1 1.7 0 2
POL 0 0 0 0 0 0.1 0 0.7 1 1.6 3 2.7
PRT 3 2.4 3 3.1 4 3.1 3 2.9 1 2.3 1 1.8
SWE 0 0.8 2 2 2 2.2 5 3.7 4 3.1 8 2.9
TUR 0 0 0 0 0 0 0 0.1 0 0.2 1 0.7
Note: For an explanation of abbreviations see Annex.
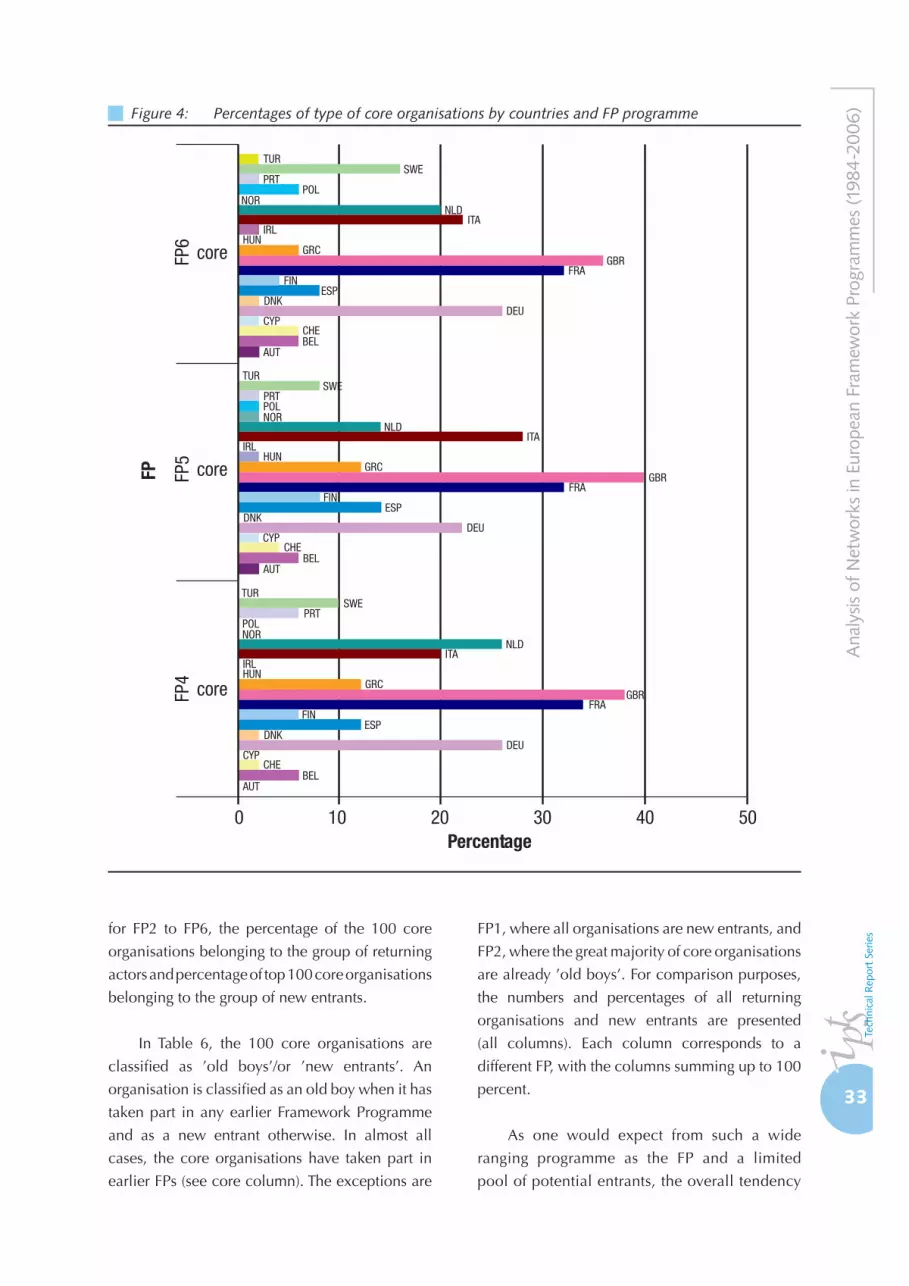
33
Ana
lysis
of N
etw
orks
in E
urop
ean
Fram
ewor
k Pr
ogra
mm
es (1
984-
2006
)
for FP2 to FP6, the percentage of the 100 core
organisations belonging to the group of returning
actors and percentage of top 100 core organisations
belonging to the group of new entrants.
In Table 6, the 100 core organisations are
classified as ’old boys’/or ’new entrants’. An
organisation is classified as an old boy when it has
taken part in any earlier Framework Programme
and as a new entrant otherwise. In almost all
cases, the core organisations have taken part in
earlier FPs (see core column). The exceptions are
FP1, where all organisations are new entrants, and
FP2, where the great majority of core organisations
are already ’old boys’. For comparison purposes,
the numbers and percentages of all returning
organisations and new entrants are presented
(all columns). Each column corresponds to a
different FP, with the columns summing up to 100
percent.
As one would expect from such a wide
ranging programme as the FP and a limited
pool of potential entrants, the overall tendency
Figure 4: Percentages of type of core organisations by countries and FP programme
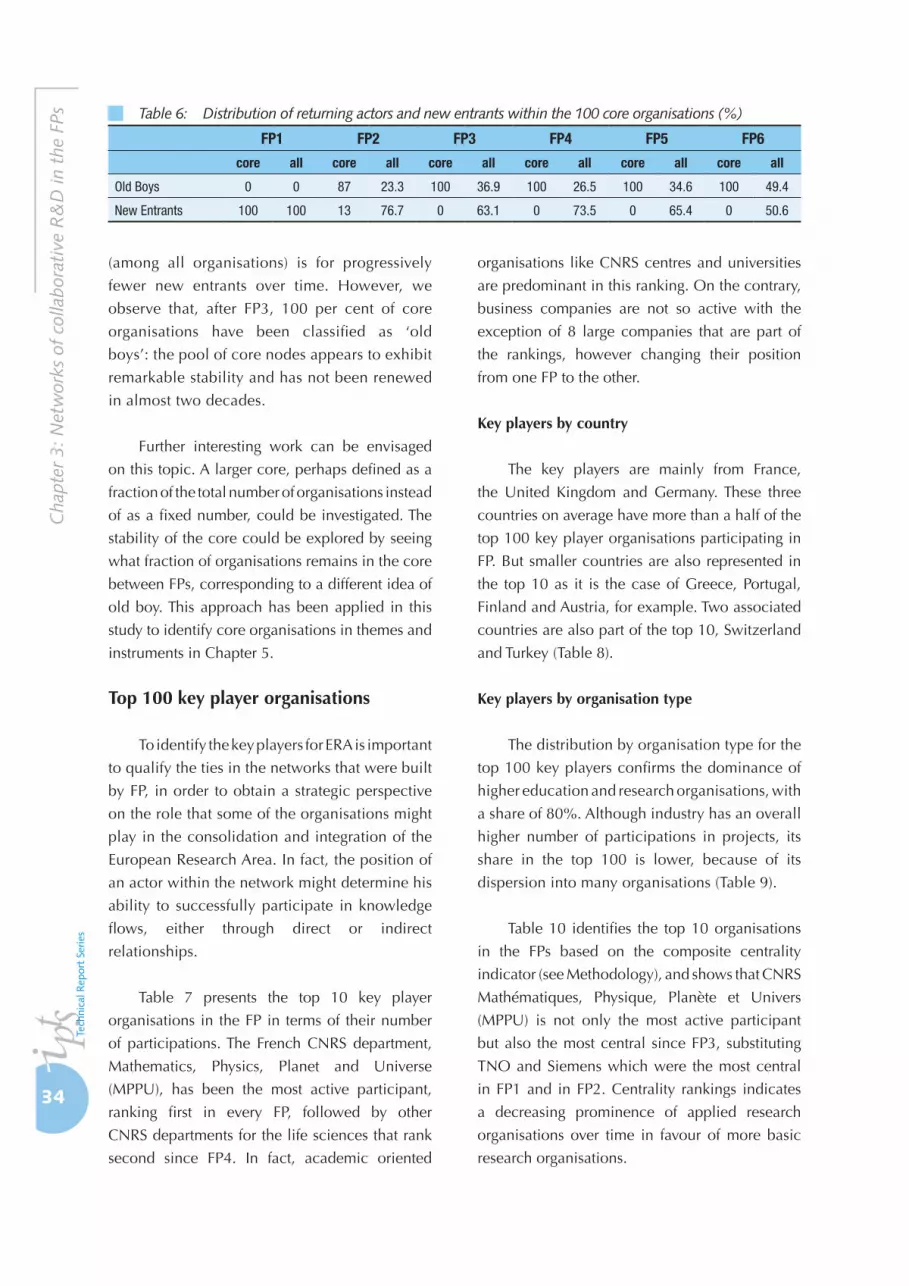
34
Cha
pter
3: N
etw
orks
of
colla
bora
tive
R&
D in
the
FPs
(among all organisations) is for progressively
fewer new entrants over time. However, we
observe that, after FP3, 100 per cent of core
organisations have been classified as ‘old
boys’: the pool of core nodes appears to exhibit
remarkable stability and has not been renewed
in almost two decades.
Further interesting work can be envisaged
on this topic. A larger core, perhaps defined as a
fraction of the total number of organisations instead
of as a fixed number, could be investigated. The
stability of the core could be explored by seeing
what fraction of organisations remains in the core
between FPs, corresponding to a different idea of
old boy. This approach has been applied in this
study to identify core organisations in themes and
instruments in Chapter 5.
Top 100 key player organisations
To identify the key players for ERA is important
to qualify the ties in the networks that were built
by FP, in order to obtain a strategic perspective
on the role that some of the organisations might
play in the consolidation and integration of the
European Research Area. In fact, the position of
an actor within the network might determine his
ability to successfully participate in knowledge
flows, either through direct or indirect
relationships.
Table 7 presents the top 10 key player
organisations in the FP in terms of their number
of participations. The French CNRS department,
Mathematics, Physics, Planet and Universe
(MPPU), has been the most active participant,
ranking first in every FP, followed by other
CNRS departments for the life sciences that rank
second since FP4. In fact, academic oriented
organisations like CNRS centres and universities
are predominant in this ranking. On the contrary,
business companies are not so active with the
exception of 8 large companies that are part of
the rankings, however changing their position
from one FP to the other.
Key players by country
The key players are mainly from France,
the United Kingdom and Germany. These three
countries on average have more than a half of the
top 100 key player organisations participating in
FP. But smaller countries are also represented in
the top 10 as it is the case of Greece, Portugal,
Finland and Austria, for example. Two associated
countries are also part of the top 10, Switzerland
and Turkey (Table 8).
Key players by organisation type
The distribution by organisation type for the
top 100 key players confirms the dominance of
higher education and research organisations, with
a share of 80%. Although industry has an overall
higher number of participations in projects, its
share in the top 100 is lower, because of its
dispersion into many organisations (Table 9).
Table 10 identifies the top 10 organisations
in the FPs based on the composite centrality
indicator (see Methodology), and shows that CNRS
Mathématiques, Physique, Planète et Univers
(MPPU) is not only the most active participant
but also the most central since FP3, substituting
TNO and Siemens which were the most central
in FP1 and in FP2. Centrality rankings indicates
a decreasing prominence of applied research
organisations over time in favour of more basic
research organisations.
Table 6: Distribution of returning actors and new entrants within the 100 core organisations (%)
FP1 FP2 FP3 FP4 FP5 FP6
core all core all core all core all core all core all
Old Boys 0 0 87 23.3 100 36.9 100 26.5 100 34.6 100 49.4
New Entrants 100 100 13 76.7 0 63.1 0 73.5 0 65.4 0 50.6

35
Ana
lysis
of N
etw
orks
in E
urop
ean
Fram
ewor
k Pr
ogra
mm
es (1
984-
2006
)
Tabl
e 7:
N
ames
of t
he to
p 10
key
pla
yers
(org
anis
atio
ns b
y nu
mbe
r of p
artic
ipat
ions
), FP
1-FP
6
Rank
Rank
ing
FP1
Rank
ing
FP2
Rank
ing
FP3
Rank
ing
FP4
Rank
ing
FP5
Rank
ing
FP6
11
CNRS
/Mat
hém
atiq
ues,
Ph
ysiq
ue, P
lanè
te e
t Un
iver
s (M
PPU)
1CN
RS/M
athé
mat
ique
s,
Phys
ique
, Pla
nète
et
Univ
ers
(MPP
U)
1CN
RS/M
athé
mat
ique
s,
Phys
ique
, Pla
nète
et
Univ
ers
(MPP
U)
1CN
RS/M
athé
mat
ique
s,
Phys
ique
, Pla
nète
et
Univ
ers
(MPP
U)
1CN
RS/M
athé
mat
ique
s,
Phys
ique
, Pla
nète
et
Univ
ers
(MPP
U)
1CN
RS/M
athé
mat
ique
s,
Phys
ique
, Pla
nète
et
Univ
ers
(MPP
U)
22
BAE
Syst
ems
PLC
2Si
emen
s AG
(DEU
) 2
Biot
echn
olog
y an
d Bi
olog
ical
Sci
ence
s Re
sear
ch C
ounc
il (B
BSRC
)
2CN
RS/S
cien
ces
du v
ivan
t (S
DV)
2CN
RS/S
cien
ces
du v
ivan
t (S
DV)
2CN
RS/S
cien
ces
du v
ivan
t (S
DV)
33
Unite
d Ki
ngdo
m A
tom
ic
Ener
gy A
utho
rity
(UKA
EA)
3Ph
ilips
NV
(NLD
) 3
CNRS
/Sci
ence
s du
viv
ant
(SDV
)3
Thal
es G
roup
(FRA
) 3
FIAT
Gru
ppo
3HH
G/De
utsc
hes
Zent
rum
fü
r Luf
t- u
nd R
aum
fahr
t (D
LR)
44
Univ
ersi
té C
atho
lique
de
Louv
ain
4BA
E Sy
stem
s PL
C4
Siem
ens
AG (D
EU)
4Bi
otec
hnol
ogy
and
Biol
ogic
al S
cien
ces
Rese
arch
Cou
ncil
(BBS
RC)
4Th
ales
Gro
up (F
RA)
4Fr
aunh
ofer
-Ges
ells
chaf
t zu
r För
deru
ng d
er
ange
wan
dten
For
schu
ng
e.V.
54
TNO
- Ne
ther
land
s Or
gani
satio
n fo
r App
lied
Scie
ntifi
c Re
sear
ch
5CN
RS/S
cien
ces
du v
ivan
t (S
DV)
5Th
ales
Gro
up (F
RA)
5FI
AT G
rupp
o5
HHG/
Deut
sche
s Ze
ntru
m
für L
uft-
und
Rau
mfa
hrt
(DLR
)
5Th
ales
Gro
up (F
RA)
66
Biot
echn
olog
y an
d Bi
olog
ical
Sci
ence
s Re
sear
ch C
ounc
il (B
BSRC
)
6Un
ited
King
dom
Ato
mic
En
ergy
Aut
horit
y (U
KAEA
)6
CNRS
/Sci
entifi
que
Chim
ie
(SC)
6Na
tura
l Env
ironm
ent
Rese
arch
Cou
ncil
(NER
C)6
Biot
echn
olog
y an
d Bi
olog
ical
Sci
ence
s Re
sear
ch C
ounc
il (B
BSRC
)
6FI
AT G
rupp
o
77
Impe
rial C
olle
ge L
ondo
n (Im
peria
lCL)
7Bi
otec
hnol
ogy
and
Biol
ogic
al S
cien
ces
Rese
arch
Cou
ncil
(BBS
RC)
7Na
tura
l Env
ironm
ent
Rese
arch
Cou
ncil
(NER
C)7
EADS
Eur
opea
n Ae
rona
utic
De
fenc
e an
d Sp
ace
Com
pany
(FRA
)
7KU
L/Fa
culty
of E
ngin
eerin
g7
CEA/
Dire
ctio
n de
la
rech
erch
e te
chno
logi
que
88
Natu
ral E
nviro
nmen
t Re
sear
ch C
ounc
il (N
ERC)
8UT
L/In
stitu
to S
uper
ior
Tecn
ico
(IST)
(Hig
her
Tech
nica
l Ins
titut
e)
8UT
L/In
stitu
to S
uper
ior
Tecn
ico
(IST)
(Hig
her
Tech
nica
l Ins
titut
e)
8Si
emen
s AG
(DEU
) 8
Siem
ens
AG (D
EU)
8Si
emen
s AG
(DEU
)
99
CNRS
/Sci
entifi
que
Chim
ie
(SC)
9Na
tura
l Env
ironm
ent
Rese
arch
Cou
ncil
(NER
C)9
EADS
Eur
opea
n Ae
rona
utic
De
fenc
e an
d Sp
ace
Com
pany
(FRA
)
9Fi
nmec
cani
ca S
PA (I
TA)
9UT
L/In
stitu
to S
uper
ior
Tecn
ico
(IST)
(Hig
her
Tech
nica
l Ins
titut
e)
9IN
SERM
/ADR
Par
is V
1010
Univ
ersi
té L
ibre
de
Brux
elle
s (U
LB)
10Th
ales
Gro
up (F
RA)
10EN
EA -
Ent
e pe
r le
Nuov
e te
cnol
ogie
, Ene
rgia
e
Ambi
ente
10CU
/Sch
ool o
f Phy
sica
l Sc
ienc
es9
Natu
ral E
nviro
nmen
t Re
sear
ch C
ounc
il (N
ERC)
10EA
DS E
urop
ean
Aero
naut
ic
Defe
nce
and
Spac
e Co
mpa
ny (D
EU)
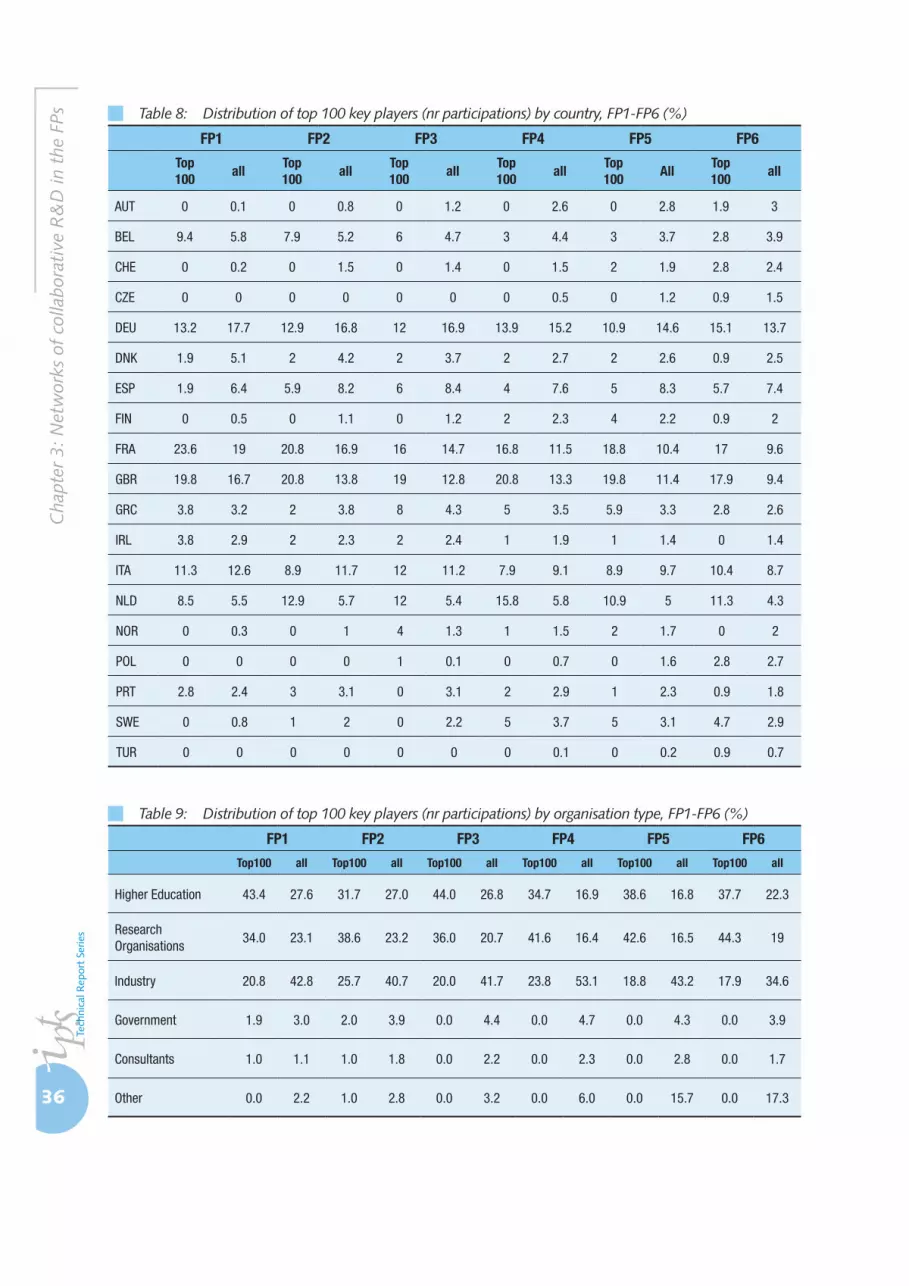
36
Cha
pter
3: N
etw
orks
of
colla
bora
tive
R&
D in
the
FPs Table 8: Distribution of top 100 key players (nr participations) by country, FP1-FP6 (%)
FP1 FP2 FP3 FP4 FP5 FP6
Top 100
allTop 100
allTop 100
allTop 100
allTop 100
AllTop 100
all
AUT 0 0.1 0 0.8 0 1.2 0 2.6 0 2.8 1.9 3
BEL 9.4 5.8 7.9 5.2 6 4.7 3 4.4 3 3.7 2.8 3.9
CHE 0 0.2 0 1.5 0 1.4 0 1.5 2 1.9 2.8 2.4
CZE 0 0 0 0 0 0 0 0.5 0 1.2 0.9 1.5
DEU 13.2 17.7 12.9 16.8 12 16.9 13.9 15.2 10.9 14.6 15.1 13.7
DNK 1.9 5.1 2 4.2 2 3.7 2 2.7 2 2.6 0.9 2.5
ESP 1.9 6.4 5.9 8.2 6 8.4 4 7.6 5 8.3 5.7 7.4
FIN 0 0.5 0 1.1 0 1.2 2 2.3 4 2.2 0.9 2
FRA 23.6 19 20.8 16.9 16 14.7 16.8 11.5 18.8 10.4 17 9.6
GBR 19.8 16.7 20.8 13.8 19 12.8 20.8 13.3 19.8 11.4 17.9 9.4
GRC 3.8 3.2 2 3.8 8 4.3 5 3.5 5.9 3.3 2.8 2.6
IRL 3.8 2.9 2 2.3 2 2.4 1 1.9 1 1.4 0 1.4
ITA 11.3 12.6 8.9 11.7 12 11.2 7.9 9.1 8.9 9.7 10.4 8.7
NLD 8.5 5.5 12.9 5.7 12 5.4 15.8 5.8 10.9 5 11.3 4.3
NOR 0 0.3 0 1 4 1.3 1 1.5 2 1.7 0 2
POL 0 0 0 0 1 0.1 0 0.7 0 1.6 2.8 2.7
PRT 2.8 2.4 3 3.1 0 3.1 2 2.9 1 2.3 0.9 1.8
SWE 0 0.8 1 2 0 2.2 5 3.7 5 3.1 4.7 2.9
TUR 0 0 0 0 0 0 0 0.1 0 0.2 0.9 0.7
Table 9: Distribution of top 100 key players (nr participations) by organisation type, FP1-FP6 (%)
FP1 FP2 FP3 FP4 FP5 FP6
Top100 all Top100 all Top100 all Top100 all Top100 all Top100 all
Higher Education 43.4 27.6 31.7 27.0 44.0 26.8 34.7 16.9 38.6 16.8 37.7 22.3
Research Organisations
34.0 23.1 38.6 23.2 36.0 20.7 41.6 16.4 42.6 16.5 44.3 19
Industry 20.8 42.8 25.7 40.7 20.0 41.7 23.8 53.1 18.8 43.2 17.9 34.6
Government 1.9 3.0 2.0 3.9 0.0 4.4 0.0 4.7 0.0 4.3 0.0 3.9
Consultants 1.0 1.1 1.0 1.8 0.0 2.2 0.0 2.3 0.0 2.8 0.0 1.7
Other 0.0 2.2 1.0 2.8 0.0 3.2 0.0 6.0 0.0 15.7 0.0 17.3
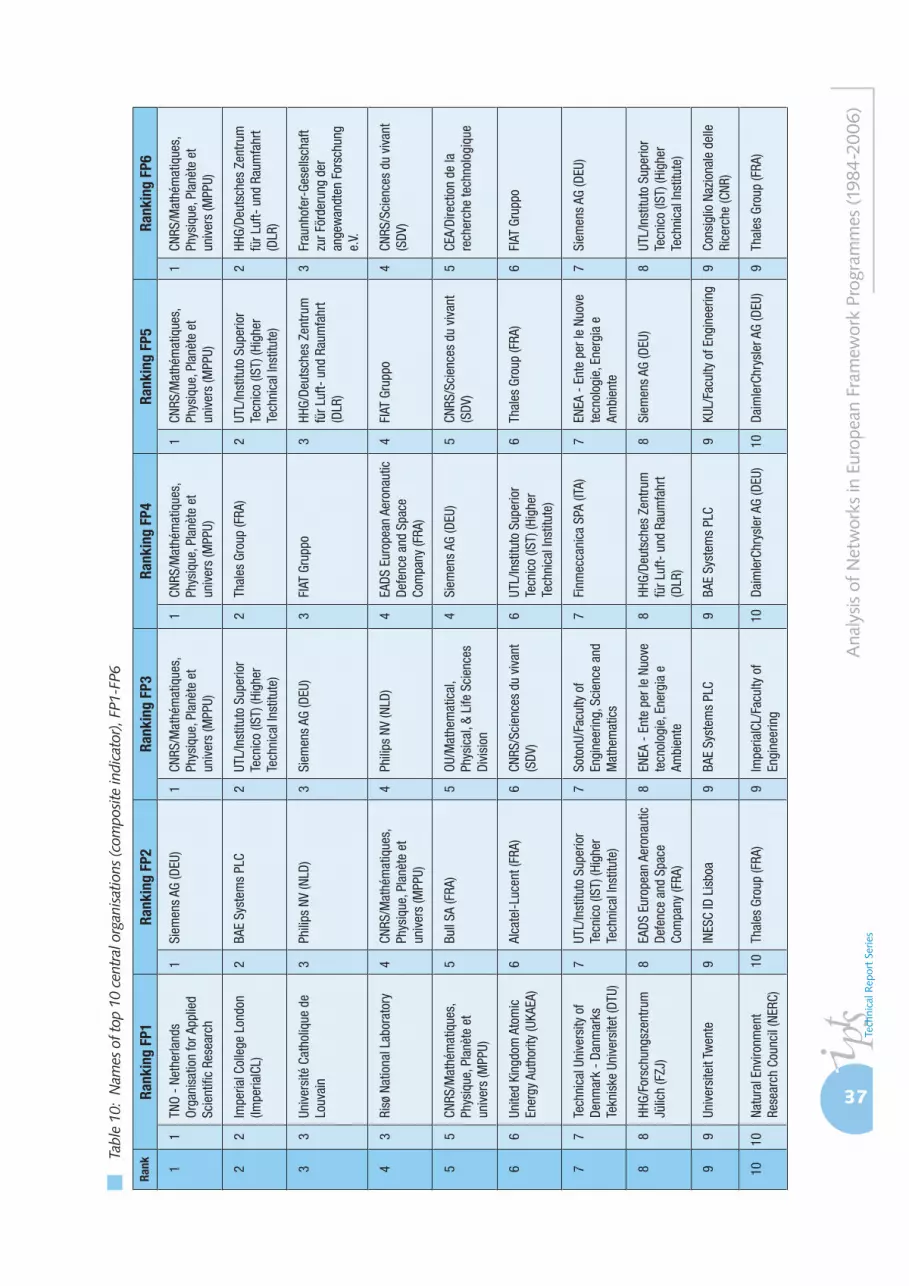
37
Ana
lysis
of N
etw
orks
in E
urop
ean
Fram
ewor
k Pr
ogra
mm
es (1
984-
2006
)
Tabl
e 10
: N
ames
of t
op 1
0 ce
ntra
l org
anis
atio
ns (c
ompo
site
indi
cato
r), F
P1-F
P6
Rank
Rank
ing
FP1
Rank
ing
FP2
Rank
ing
FP3
Rank
ing
FP4
Rank
ing
FP5
Rank
ing
FP6
11
TNO
- Ne
ther
land
s Or
gani
satio
n fo
r App
lied
Scie
ntifi
c Re
sear
ch
1Si
emen
s AG
(DEU
) 1
CNRS
/Mat
hém
atiq
ues,
Ph
ysiq
ue, P
lanè
te e
t un
iver
s (M
PPU)
1CN
RS/M
athé
mat
ique
s,
Phys
ique
, Pla
nète
et
univ
ers
(MPP
U)
1CN
RS/M
athé
mat
ique
s,
Phys
ique
, Pla
nète
et
univ
ers
(MPP
U)
1CN
RS/M
athé
mat
ique
s,
Phys
ique
, Pla
nète
et
univ
ers
(MPP
U)
22
Impe
rial C
olle
ge L
ondo
n (Im
peria
lCL)
2BA
E Sy
stem
s PL
C2
UTL/
Inst
ituto
Sup
erio
r Te
cnic
o (IS
T) (H
ighe
r Te
chni
cal I
nstit
ute)
2Th
ales
Gro
up (F
RA)
2UT
L/In
stitu
to S
uper
ior
Tecn
ico
(IST)
(Hig
her
Tech
nica
l Ins
titut
e)
2HH
G/De
utsc
hes
Zent
rum
fü
r Luf
t- u
nd R
aum
fahr
t (D
LR)
33
Univ
ersi
té C
atho
lique
de
Louv
ain
3Ph
ilips
NV
(NLD
) 3
Siem
ens
AG (D
EU)
3FI
AT G
rupp
o3
HHG/
Deut
sche
s Ze
ntru
m
für L
uft-
und
Rau
mfa
hrt
(DLR
)
3Fr
aunh
ofer
-Ges
ells
chaf
t zu
r För
deru
ng d
er
ange
wan
dten
For
schu
ng
e.V.
43
Risø
Nat
iona
l Lab
orat
ory
4CN
RS/M
athé
mat
ique
s,
Phys
ique
, Pla
nète
et
univ
ers
(MPP
U)
4Ph
ilips
NV
(NLD
) 4
EADS
Eur
opea
n Ae
rona
utic
De
fenc
e an
d Sp
ace
Com
pany
(FRA
)
4FI
AT G
rupp
o4
CNRS
/Sci
ence
s du
viv
ant
(SDV
)
55
CNRS
/Mat
hém
atiq
ues,
Ph
ysiq
ue, P
lanè
te e
t un
iver
s (M
PPU)
5Bu
ll SA
(FRA
) 5
OU/M
athe
mat
ical
, Ph
ysic
al, &
Life
Sci
ence
s Di
visi
on
4Si
emen
s AG
(DEU
) 5
CNRS
/Sci
ence
s du
viv
ant
(SDV
)5
CEA/
Dire
ctio
n de
la
rech
erch
e te
chno
logi
que
66
Unite
d Ki
ngdo
m A
tom
ic
Ener
gy A
utho
rity
(UKA
EA)
6Al
cate
l-Luc
ent (
FRA)
6
CNRS
/Sci
ence
s du
viv
ant
(SDV
)6
UTL/
Inst
ituto
Sup
erio
r Te
cnic
o (IS
T) (H
ighe
r Te
chni
cal I
nstit
ute)
6Th
ales
Gro
up (F
RA)
6FI
AT G
rupp
o
77
Tech
nica
l Uni
vers
ity o
f De
nmar
k -
Danm
arks
Te
knis
ke U
nive
rsite
t (DT
U)
7UT
L/In
stitu
to S
uper
ior
Tecn
ico
(IST)
(Hig
her
Tech
nica
l Ins
titut
e)
7So
tonU
/Fac
ulty
of
Engi
neer
ing,
Sci
ence
and
M
athe
mat
ics
7Fi
nmec
cani
ca S
PA (I
TA)
7EN
EA -
Ent
e pe
r le
Nuov
e te
cnol
ogie
, Ene
rgia
e
Ambi
ente
7Si
emen
s AG
(DEU
)
88
HHG/
Fors
chun
gsze
ntru
m
Jülic
h (F
ZJ)
8EA
DS E
urop
ean
Aero
naut
ic
Defe
nce
and
Spac
e Co
mpa
ny (F
RA)
8EN
EA -
Ent
e pe
r le
Nuov
e te
cnol
ogie
, Ene
rgia
e
Ambi
ente
8HH
G/De
utsc
hes
Zent
rum
fü
r Luf
t- u
nd R
aum
fahr
t (D
LR)
8Si
emen
s AG
(DEU
) 8
UTL/
Inst
ituto
Sup
erio
r Te
cnic
o (IS
T) (H
ighe
r Te
chni
cal I
nstit
ute)
99
Univ
ersi
teit
Twen
te9
INES
C ID
Lis
boa
9BA
E Sy
stem
s PL
C9
BAE
Syst
ems
PLC
9KU
L/Fa
culty
of E
ngin
eerin
g9
Cons
iglio
Naz
iona
le d
elle
Ri
cerc
he (C
NR)
1010
Natu
ral E
nviro
nmen
t Re
sear
ch C
ounc
il (N
ERC)
10Th
ales
Gro
up (F
RA)
9Im
peria
lCL/
Facu
lty o
f En
gine
erin
g10
Daim
lerC
hrys
ler A
G (D
EU)
10Da
imle
rChr
ysle
r AG
(DEU
) 9
Thal
es G
roup
(FRA
)
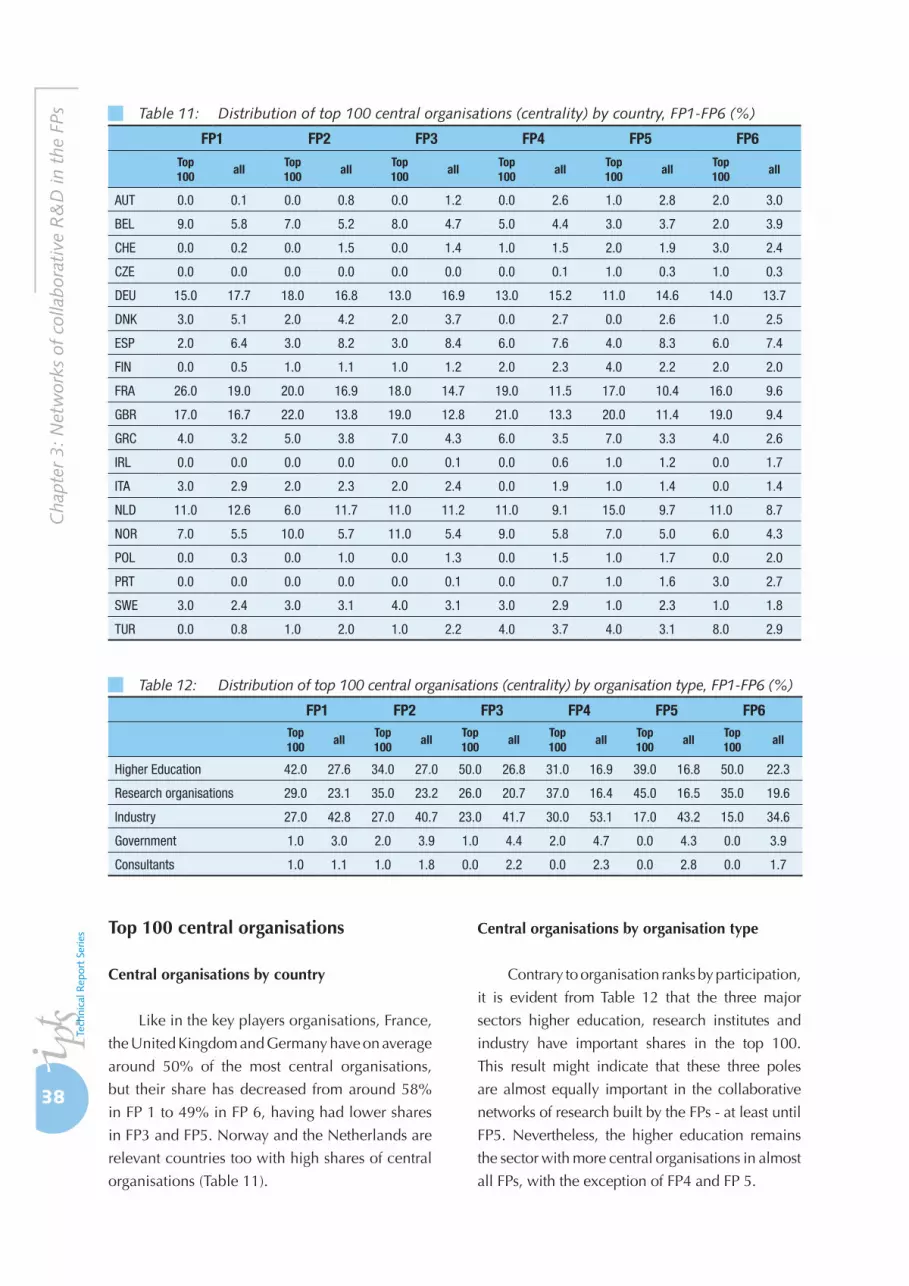
38
Cha
pter
3: N
etw
orks
of
colla
bora
tive
R&
D in
the
FPs
Top 100 central organisations
Central organisations by country
Like in the key players organisations, France,
the United Kingdom and Germany have on average
around 50% of the most central organisations,
but their share has decreased from around 58%
in FP 1 to 49% in FP 6, having had lower shares
in FP3 and FP5. Norway and the Netherlands are
relevant countries too with high shares of central
organisations (Table 11).
Central organisations by organisation type
Contrary to organisation ranks by participation,
it is evident from Table 12 that the three major
sectors higher education, research institutes and
industry have important shares in the top 100.
This result might indicate that these three poles
are almost equally important in the collaborative
networks of research built by the FPs - at least until
FP5. Nevertheless, the higher education remains
the sector with more central organisations in almost
all FPs, with the exception of FP4 and FP 5.
Table 11: Distribution of top 100 central organisations (centrality) by country, FP1-FP6 (%)
FP1 FP2 FP3 FP4 FP5 FP6Top 100
allTop 100
allTop 100
allTop 100
allTop 100
allTop 100
all
AUT 0.0 0.1 0.0 0.8 0.0 1.2 0.0 2.6 1.0 2.8 2.0 3.0
BEL 9.0 5.8 7.0 5.2 8.0 4.7 5.0 4.4 3.0 3.7 2.0 3.9
CHE 0.0 0.2 0.0 1.5 0.0 1.4 1.0 1.5 2.0 1.9 3.0 2.4
CZE 0.0 0.0 0.0 0.0 0.0 0.0 0.0 0.1 1.0 0.3 1.0 0.3
DEU 15.0 17.7 18.0 16.8 13.0 16.9 13.0 15.2 11.0 14.6 14.0 13.7
DNK 3.0 5.1 2.0 4.2 2.0 3.7 0.0 2.7 0.0 2.6 1.0 2.5
ESP 2.0 6.4 3.0 8.2 3.0 8.4 6.0 7.6 4.0 8.3 6.0 7.4
FIN 0.0 0.5 1.0 1.1 1.0 1.2 2.0 2.3 4.0 2.2 2.0 2.0
FRA 26.0 19.0 20.0 16.9 18.0 14.7 19.0 11.5 17.0 10.4 16.0 9.6
GBR 17.0 16.7 22.0 13.8 19.0 12.8 21.0 13.3 20.0 11.4 19.0 9.4
GRC 4.0 3.2 5.0 3.8 7.0 4.3 6.0 3.5 7.0 3.3 4.0 2.6
IRL 0.0 0.0 0.0 0.0 0.0 0.1 0.0 0.6 1.0 1.2 0.0 1.7
ITA 3.0 2.9 2.0 2.3 2.0 2.4 0.0 1.9 1.0 1.4 0.0 1.4
NLD 11.0 12.6 6.0 11.7 11.0 11.2 11.0 9.1 15.0 9.7 11.0 8.7
NOR 7.0 5.5 10.0 5.7 11.0 5.4 9.0 5.8 7.0 5.0 6.0 4.3
POL 0.0 0.3 0.0 1.0 0.0 1.3 0.0 1.5 1.0 1.7 0.0 2.0
PRT 0.0 0.0 0.0 0.0 0.0 0.1 0.0 0.7 1.0 1.6 3.0 2.7
SWE 3.0 2.4 3.0 3.1 4.0 3.1 3.0 2.9 1.0 2.3 1.0 1.8
TUR 0.0 0.8 1.0 2.0 1.0 2.2 4.0 3.7 4.0 3.1 8.0 2.9
Table 12: Distribution of top 100 central organisations (centrality) by organisation type, FP1-FP6 (%)
FP1 FP2 FP3 FP4 FP5 FP6Top100
allTop100
allTop100
allTop100
allTop100
allTop100
all
Higher Education 42.0 27.6 34.0 27.0 50.0 26.8 31.0 16.9 39.0 16.8 50.0 22.3
Research organisations 29.0 23.1 35.0 23.2 26.0 20.7 37.0 16.4 45.0 16.5 35.0 19.6
Industry 27.0 42.8 27.0 40.7 23.0 41.7 30.0 53.1 17.0 43.2 15.0 34.6
Government 1.0 3.0 2.0 3.9 1.0 4.4 2.0 4.7 0.0 4.3 0.0 3.9
Consultants 1.0 1.1 1.0 1.8 0.0 2.2 0.0 2.3 0.0 2.8 0.0 1.7

39
Ana
lysis
of N
etw
orks
in E
urop
ean
Fram
ewor
k Pr
ogra
mm
es (1
984-
2006
)
Chapter 4: Thematic networks and their functions
4.1 Network metrics for selected themes and instruments
In view of knowledge-related exchange
processes within inter-organisational networks,
there are theoretically and empirically
grounded assumptions that thematic areas of the
Framework Programmes differ systematically
with respect to their collaboration network
structures. An indication as to the type of activity
involved can often be deduced from a project’s
thematic area and instrument or a combination
of both. In this section, we therefore focus on
the thematically more coherent sub-programme
level and select various sub-networks to explore
such differences in global network structure.
This section presents the properties of the
organisation networks in different thematic
priorities and different instruments (CSC/STREP, IP
and NoE). The definitions of the various network
metrics discussed here and the rationale for the
selection of themes and instruments are provided
in the section 2.3.
We employ two types of metrics here: first,
we present the evolution of network properties of
CSC/STREP from FP4 to FP6 programmes and in
the four thematic priorities. Second, we compare
the properties of networks in the new instruments
introduced in FP6 (IP and NoE) across the four
thematic priorities.
Networks properties of CSC/STREP
In Table 13 the network structures of the
thematic sub-programme AEROSPACE are
summarised. Only the sub-networks in Aerospace
differ in some respects and show, especially for FP4
and FP5, even highly intensified clustering: The
number of participating organisations compared
to other thematic priorities is smaller (number of
vertices), but the mean number of partners in FP4
(27) and FP5 (58) as well as the clustering coefficient
Table 13: Structural features of the Aerospace theme networks for the CSC/STREP instrument across FP4, FP5 and FP6.
Graph Characteristic AERO_4_CSC AERO_5_CSC AERO_6_STREP
No. of vertices N 321 801 620
No. of edges M 4,354 23,463 5,993
No. of components 1 1 3
N for largest component 321 801 607
Share of total N (%) 100.0 100.0 97.90
M for largest component 4,354 23,463 5,995
Share of total M (%) 100.0 100.0 99.37
N for 2nd largest component 0 0 8
M for 2nd largest component 0 0 56
Mean clustering coefficient 0.85 0.89 0.87
Diameter of largest component 3 4 6
Characteristic path length of largest component 2.10 2.16 2.63
Mean degree 27.13 35.33 23.87
Fraction of N above the mean (%) 27.73 35.33 23.87
Mean vertex size 3.06 2.34 1.86
Standard deviation 5.57 4.71 2.84
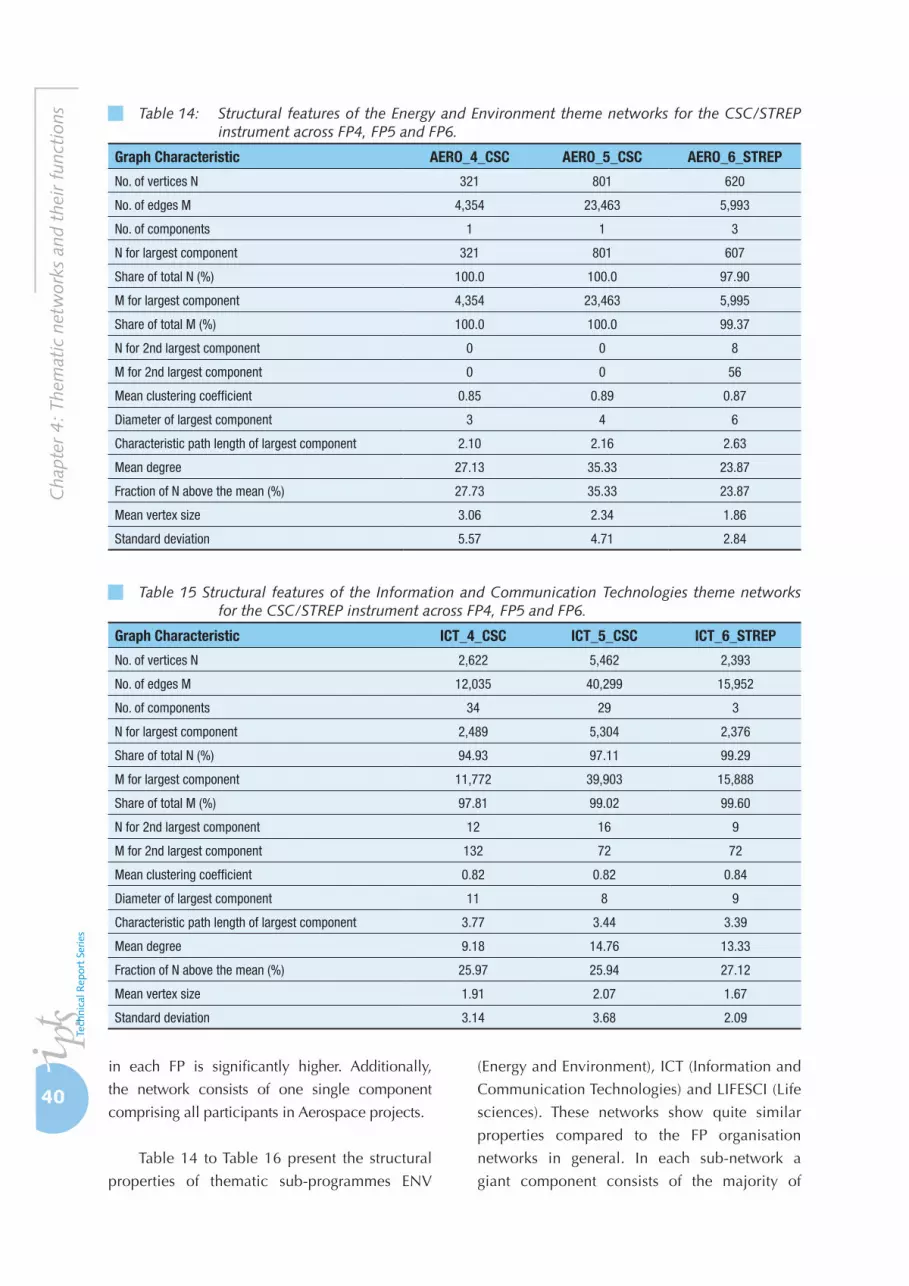
40
Cha
pter
4: T
hem
atic
net
wor
ks a
nd t
heir
fun
ctio
ns
in each FP is significantly higher. Additionally,
the network consists of one single component
comprising all participants in Aerospace projects.
Table 14 to Table 16 present the structural
properties of thematic sub-programmes ENV
(Energy and Environment), ICT (Information and
Communication Technologies) and LIFESCI (Life
sciences). These networks show quite similar
properties compared to the FP organisation
networks in general. In each sub-network a
giant component consists of the majority of
Table 14: Structural features of the Energy and Environment theme networks for the CSC/STREP instrument across FP4, FP5 and FP6.
Graph Characteristic AERO_4_CSC AERO_5_CSC AERO_6_STREP
No. of vertices N 321 801 620
No. of edges M 4,354 23,463 5,993
No. of components 1 1 3
N for largest component 321 801 607
Share of total N (%) 100.0 100.0 97.90
M for largest component 4,354 23,463 5,995
Share of total M (%) 100.0 100.0 99.37
N for 2nd largest component 0 0 8
M for 2nd largest component 0 0 56
Mean clustering coefficient 0.85 0.89 0.87
Diameter of largest component 3 4 6
Characteristic path length of largest component 2.10 2.16 2.63
Mean degree 27.13 35.33 23.87
Fraction of N above the mean (%) 27.73 35.33 23.87
Mean vertex size 3.06 2.34 1.86
Standard deviation 5.57 4.71 2.84
Table 15 Structural features of the Information and Communication Technologies theme networks for the CSC/STREP instrument across FP4, FP5 and FP6.
Graph Characteristic ICT_4_CSC ICT_5_CSC ICT_6_STREP
No. of vertices N 2,622 5,462 2,393
No. of edges M 12,035 40,299 15,952
No. of components 34 29 3
N for largest component 2,489 5,304 2,376
Share of total N (%) 94.93 97.11 99.29
M for largest component 11,772 39,903 15,888
Share of total M (%) 97.81 99.02 99.60
N for 2nd largest component 12 16 9
M for 2nd largest component 132 72 72
Mean clustering coefficient 0.82 0.82 0.84
Diameter of largest component 11 8 9
Characteristic path length of largest component 3.77 3.44 3.39
Mean degree 9.18 14.76 13.33
Fraction of N above the mean (%) 25.97 25.94 27.12
Mean vertex size 1.91 2.07 1.67
Standard deviation 3.14 3.68 2.09
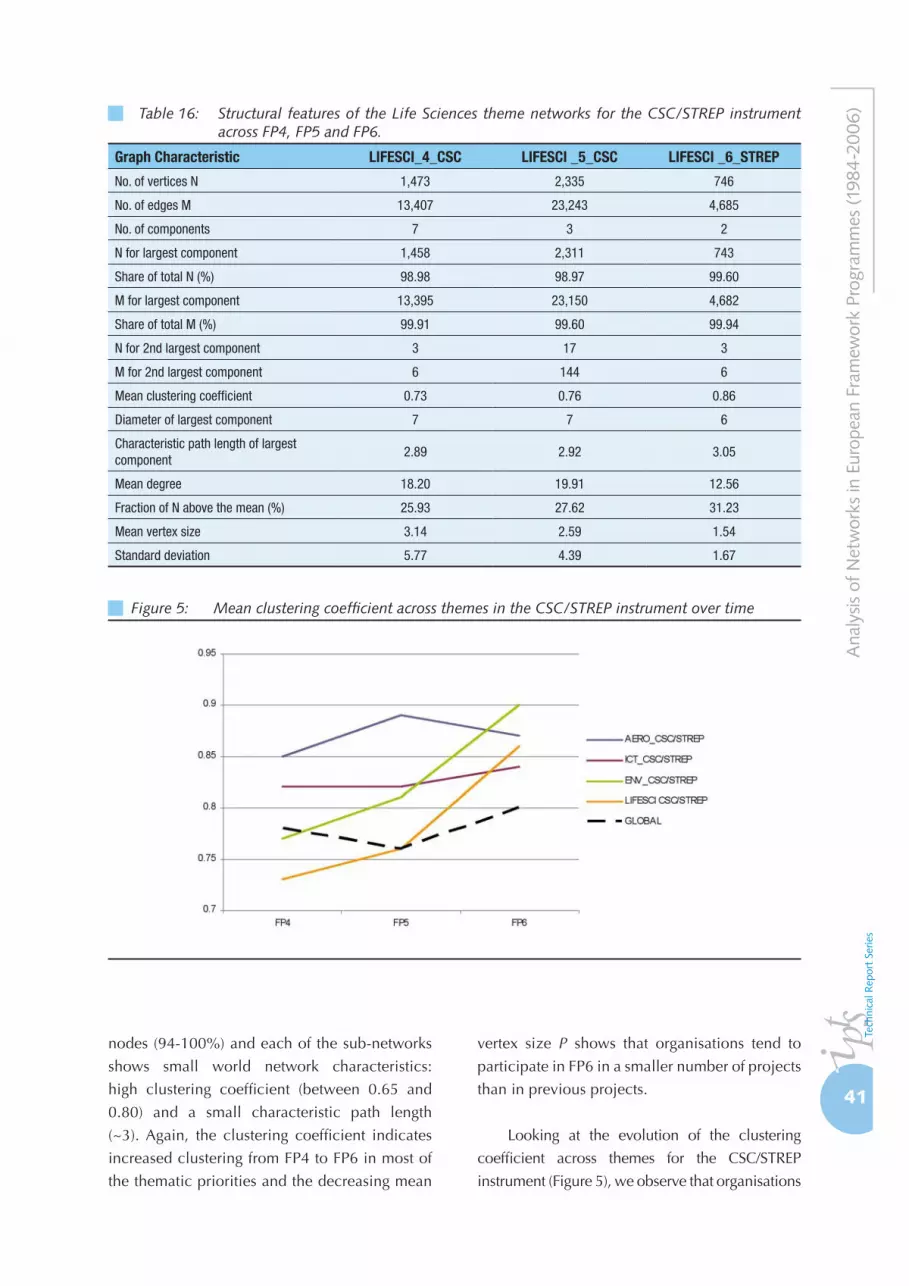
41
Ana
lysis
of N
etw
orks
in E
urop
ean
Fram
ewor
k Pr
ogra
mm
es (1
984-
2006
)
nodes (94-100%) and each of the sub-networks
shows small world network characteristics:
high clustering coefficient (between 0.65 and
0.80) and a small characteristic path length
(~3). Again, the clustering coefficient indicates
increased clustering from FP4 to FP6 in most of
the thematic priorities and the decreasing mean
vertex size P shows that organisations tend to
participate in FP6 in a smaller number of projects
than in previous projects.
Looking at the evolution of the clustering
coefficient across themes for the CSC/STREP
instrument (Figure 5), we observe that organisations
Table 16: Structural features of the Life Sciences theme networks for the CSC/STREP instrument across FP4, FP5 and FP6.
Graph Characteristic LIFESCI_4_CSC LIFESCI _5_CSC LIFESCI _6_STREP
No. of vertices N 1,473 2,335 746
No. of edges M 13,407 23,243 4,685
No. of components 7 3 2
N for largest component 1,458 2,311 743
Share of total N (%) 98.98 98.97 99.60
M for largest component 13,395 23,150 4,682
Share of total M (%) 99.91 99.60 99.94
N for 2nd largest component 3 17 3
M for 2nd largest component 6 144 6
Mean clustering coefficient 0.73 0.76 0.86
Diameter of largest component 7 7 6
Characteristic path length of largest component
2.89 2.92 3.05
Mean degree 18.20 19.91 12.56
Fraction of N above the mean (%) 25.93 27.62 31.23
Mean vertex size 3.14 2.59 1.54
Standard deviation 5.77 4.39 1.67
Figure 5: Mean clustering coefficient across themes in the CSC/STREP instrument over time

42
Cha
pter
4: T
hem
atic
net
wor
ks a
nd t
heir
fun
ctio
ns
in Environment and Life Sciences have consistently
moved towards higher values, an indication of
more tightly knit networks and perhaps of closer
collaboration. For ICT this tendency only applies to
the move from FP5 to FP6 and is less pronounced.
As observed earlier, the evolution of clustering
in Aerospace differs considerably though. After a
notable increase from FP4 to FP5, unlike the other
themes (as well as the FP as a whole), the move to
FP6 was marked by a decrease.
Table 17: Characteristics of the organisation projection of FP four thematic priorities in Integrated Projects (IP)
Graph Characteristic AERO_6_IP ENV_6_IP ICT_6_IP LIFESCI_6_IP
No. of vertices N 595 1953 2119 917
No. of edges M 16,630 47,658 41,885 15,370
No. of components 1 2 1 2
N for largest component 595 1,936 2,119 909
Share of total N (%) 100.00 99.13 100.00 99.13
M for largest component 16,630 47,522 41,885 15,342
Share of total M (%) 100.00 99.71 100.00 99.82
N for 2nd largest component 0 17 0 8
M for 2nd largest component 0 272 0 56
Mean clustering coefficient 0.89 0.88 0.87 0.83
Diameter of largest component 4 5 4 4
Characteristic path length of largest component
2.05 2.61 2.56 2.33
Mean degree 55.90 48.80 39.53 33.52
Fraction of N above the mean (%) 38.32 28.67 29.87 30.75
Mean vertex size 1.56 1.47 1.69 1.75
Standard deviation 1.59 1.26 2.17 1.98
Table 18: Characteristics of the organisation projection of FP four thematic priorities in Networks of Excellence (NoE)
Graph Characteristic AERO_6_NOE ENV_6_ NOE ICT_6_ NOE LIFESCI_6_ NOE
No. of vertices N 43 449 914 568
No. of edges M 394 10,905 24,231 17,158
No. of components 1 1 1 1
N for largest component 43 449 914 568
Share of total N (%) 100 100 100 100
M for largest component 394 10,905 24,231 17,158
Share of total M (%) 100 100 100 100
N for 2nd largest component 0 0 0 0
M for 2nd largest component 0 0 0 0
Mean clustering coefficient 0.95 0.94 0.86 0.88
Diameter of largest component 2 5 4 3
Characteristic path length of largest component 1.53 2.41 2.24 2.03
Mean degree 18.33 48.57 53.02 60.42
Fraction of N above the mean (%) 53.49 43.88 37.64 29.93
Mean vertex size 1.14 1.18 1.58 1.50
Standard deviation 0.46 0.51 1.33 1.13

43
Ana
lysis
of N
etw
orks
in E
urop
ean
Fram
ewor
k Pr
ogra
mm
es (1
984-
2006
)
As a general observation, it is apparent
that for CSC/STREP, a principally industry-
oriented instrument, the tendencies have not
always coincided with those prevalent across
the FP, demonstrating that the customisation of
instruments can have an observable effect on the
dynamics of emerging networks.
Network properties of IP and NoE in FP 6
Table 17 and Table 18 summarise the
network features for the instruments IP and
NoE in FP6. Such comparison is limited to FP6
because the above mentioned instruments were
first introduced in it and therefore data are not
available for previous FPs.
The differences between instruments showed
in Table 17 and Table 18 correspond to different
project sizes. Integrated Projects and Networks
of Excellence involve large projects with many
participants; therefore the mean number of
partners per organisation (mean degree) as well
as the clustering coefficient in these networks
Figure 6: Number of vertices N, FP6
Figure 7: Number of edges M, FP6

44
Cha
pter
4: T
hem
atic
net
wor
ks a
nd t
heir
fun
ctio
ns is higher than in networks based on projects
of instrument Cost Shared Contracts (CSC and
STREP).
After a closer examination of the differences
across themes in terms of the number of
vertices and number of edges, the behaviour of
organisations in Life Sciences clearly stands out
(Figure 6 and Figure 7). The theme exhibits a
high edges/vertices ratio regardless of instrument.
The greater number of edges in NoE than IP in
this theme is probably a reflection of the intense
participation of non-industrial actors.
As a general observation, the various
differences highlighted support the view that both
themes and instruments exert some influence on
collaboration structures.
4.2 Instrumental functions of themes
Each project in the FP runs under certain
contractual provisions referred to as instruments.
The EURPO database contains 16 different
instruments, e.g. Shared-Cost Actions or Thematic
Networks. With respect to the instrumental
functions of thematic sub-programmes, we use
the following analytical framework. Instruments
are taken to be manifestations of a function of
the project intended by R&D policy. Thus, the
‘instrumental function’ of a project is defined as
its instrument and – using policy documents –
an exploratory and an exploitative component is
assigned to its activities (European Commission
2003).
In the case of FP5, we select three prominent
instruments – according to their expected ability
to differentiate the programmes with respect to
exploration-exploitation, the ease of attribution of
a network-related function, and last but not least
due to limited resources. It has to be emphasised
that this somewhat arbitrary choice is merely
made in order to show the applicability of the
method, and that an exhaustive analysis should
include all instruments. The selected instruments
are Cost Shared Contracts (CSC), Thematic
Networks (THN), and Cooperative Research
Contracts (CRC):
Under CSC, we consider the Shared-Cost
Actions, collaborative RTD projects with the
aim of obtaining new knowledge, demonstration
projects with the aim of showing the viability
of new technologies, and support measures for
access to research infrastructures. They require a
minimum of two partners.
Thematic Networks (THN) aim at co-
ordinating a group (’cluster’) of projects funded
at the community, national or private level, or at
establishing and developing general networking
activities which can contribute significantly to
achieving the objectives of the FP (European
Commission 2000b).
The group of instruments subsumed under
CRC comprises specific actions for SMEs, namely
Cooperative research projects (CRAFT), that enable
small and medium-sized enterprises (SME) unable
to do research work themselves to either entrust
the resolution of their common technological
problems to third legal entities with appropriate
research capacities or to jointly try to resolve
them. A minimum of three SMEs is required.
For FP6, the attributions of instrumental
functions to the instruments are taken from the
Instrument description issued by the European
Commission and from related communication
documents (European Commission, 2003). For
similar reasons as argued above, we pick Integrated
Projects (IP), Specific Targeted Research Projects
(STREP), Networks of Excellence (NoE), and
Co-operative Research and Collective Research
activities (CRC) in FP6:
Integrated Projects (IP) are a new instrument in
FP6 devoted to basic as well as applied objective-
driven research with a ’programme approach.’ IP
are expected to assemble the necessary critical
mass of activities, expertise and resources to achieve
ambitious objectives. In practice, organisations
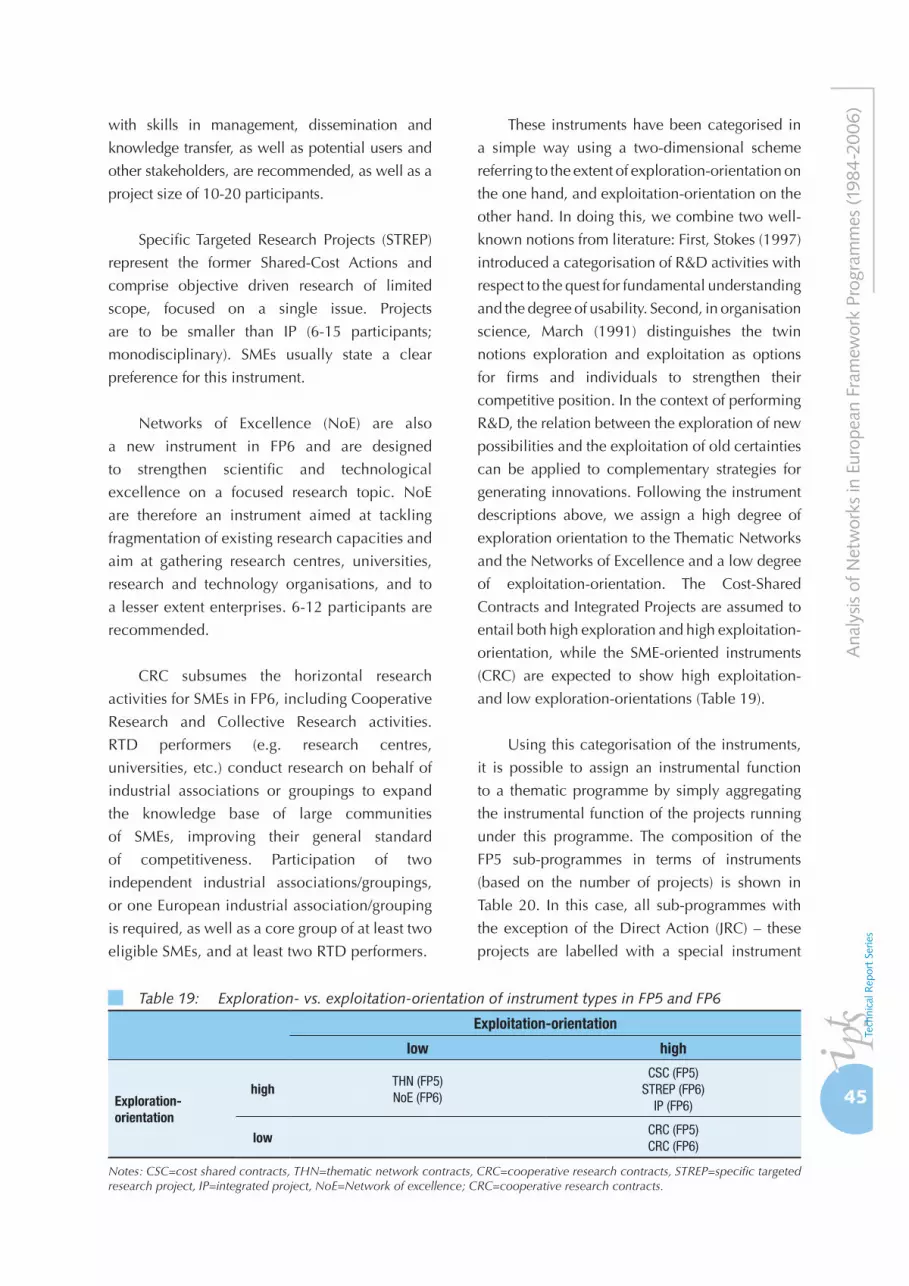
45
Ana
lysis
of N
etw
orks
in E
urop
ean
Fram
ewor
k Pr
ogra
mm
es (1
984-
2006
)
with skills in management, dissemination and
knowledge transfer, as well as potential users and
other stakeholders, are recommended, as well as a
project size of 10-20 participants.
Specific Targeted Research Projects (STREP)
represent the former Shared-Cost Actions and
comprise objective driven research of limited
scope, focused on a single issue. Projects
are to be smaller than IP (6-15 participants;
monodisciplinary). SMEs usually state a clear
preference for this instrument.
Networks of Excellence (NoE) are also
a new instrument in FP6 and are designed
to strengthen scientific and technological
excellence on a focused research topic. NoE
are therefore an instrument aimed at tackling
fragmentation of existing research capacities and
aim at gathering research centres, universities,
research and technology organisations, and to
a lesser extent enterprises. 6-12 participants are
recommended.
CRC subsumes the horizontal research
activities for SMEs in FP6, including Cooperative
Research and Collective Research activities.
RTD performers (e.g. research centres,
universities, etc.) conduct research on behalf of
industrial associations or groupings to expand
the knowledge base of large communities
of SMEs, improving their general standard
of competitiveness. Participation of two
independent industrial associations/groupings,
or one European industrial association/grouping
is required, as well as a core group of at least two
eligible SMEs, and at least two RTD performers.
These instruments have been categorised in
a simple way using a two-dimensional scheme
referring to the extent of exploration-orientation on
the one hand, and exploitation-orientation on the
other hand. In doing this, we combine two well-
known notions from literature: First, Stokes (1997)
introduced a categorisation of R&D activities with
respect to the quest for fundamental understanding
and the degree of usability. Second, in organisation
science, March (1991) distinguishes the twin
notions exploration and exploitation as options
for firms and individuals to strengthen their
competitive position. In the context of performing
R&D, the relation between the exploration of new
possibilities and the exploitation of old certainties
can be applied to complementary strategies for
generating innovations. Following the instrument
descriptions above, we assign a high degree of
exploration orientation to the Thematic Networks
and the Networks of Excellence and a low degree
of exploitation-orientation. The Cost-Shared
Contracts and Integrated Projects are assumed to
entail both high exploration and high exploitation-
orientation, while the SME-oriented instruments
(CRC) are expected to show high exploitation-
and low exploration-orientations (Table 19).
Using this categorisation of the instruments,
it is possible to assign an instrumental function
to a thematic programme by simply aggregating
the instrumental function of the projects running
under this programme. The composition of the
FP5 sub-programmes in terms of instruments
(based on the number of projects) is shown in
Table 20. In this case, all sub-programmes with
the exception of the Direct Action (JRC) – these
projects are labelled with a special instrument
Table 19: Exploration- vs. exploitation-orientation of instrument types in FP5 and FP6
Exploitation-orientation
low high
Exploration-orientation
high THN (FP5) NoE (FP6)
CSC (FP5) STREP (FP6)
IP (FP6)
lowCRC (FP5) CRC (FP6)
Notes: CSC=cost shared contracts, THN=thematic network contracts, CRC=cooperative research contracts, STREP=specific targeted research project, IP=integrated project, NoE=Network of excellence; CRC=cooperative research contracts.

46
Cha
pter
4: T
hem
atic
net
wor
ks a
nd t
heir
fun
ctio
ns
that refers only to the JRC - are included. Based on
the number of funded projects that use a certain
instrument, we calculated characteristic profiles
of the sub-programmes. In order to keep the
exploratory analysis simple, the resulting shares
were grouped in five categories referring to ‘very
high’, ‘high’, ‘medium’, ‘low’, and ‘very low’
share of this instrument in the sub-programme.
Likewise, the profiles of FP6 sub-programmes
are calculated in terms of instruments. Seven
Sub-programmes are included either for reasons
of comparability with corresponding sub-
programmes in FP5 (e.g. IST, LIFESCIHEALTH),
or because they were specific new programmes
in FP6 and relevant for the structure/function
issue addressed here. The exact shares of
instruments are again categorised as shown in
Table 21.
By combining the functions (exploration vs.
exploitation) assigned to the instruments (Table 19)
with the set-up of the thematic sub-programmes
(Table 20 and Table 21), we are able to assign an
instrumental function to entire sub-programmes.
The orientation of an instrument towards a certain
function, e.g. exploration, is valued with -1
(low) and +1 (high) respectively. Henceforth, the
shares of the different instruments within a sub-
programme is valued from 0 (zero share), 1 (low
share), up to 5 (very high share). By simple linear
combination of these parameters, we obtain a
classification of the sub-programmes with respect
to their instrumental functions. Figure 5 shows the
result of this quantitative analysis of selected FP5
and FP6 sub-programmes.
At first glance, the sub-programmes in FP5 are
mutually more similar in terms of their exploration
versus exploitation orientation (see Figure 8), as
their ‘follow-up programmes’ in FP6. There are no
outliers in FP5, in contrast to FP6. This observation
may partly result from the broader thematic
orientation of the sub-programmes in FP5, as
Table 20: Set-up of FP5 sub-programmes in terms of project types
Share of instruments types
FP5 sub-programme CSC THN CRC
IST very high high low
EESD high low Low
GROWTH high very high very high
LIFE high high low
HUMAN very low - very low
INCO medium - very low
SME very low - low
Note: Explanation of abbreviations see Annex
Table 21: Set-up of FP6 sub-programmes in terms of project types
Share of instrument types
FP6 sub-programme STREP IP NoE CRC
IST medium high medium -
AEROSPACE high high low -
NMP medium very high medium -
LIFESCIHEALTH medium very high high -
CITIZENS medium low very high -
SME - - - very high
NEST very high - - -
Note: Explanation of abbreviations see Annex
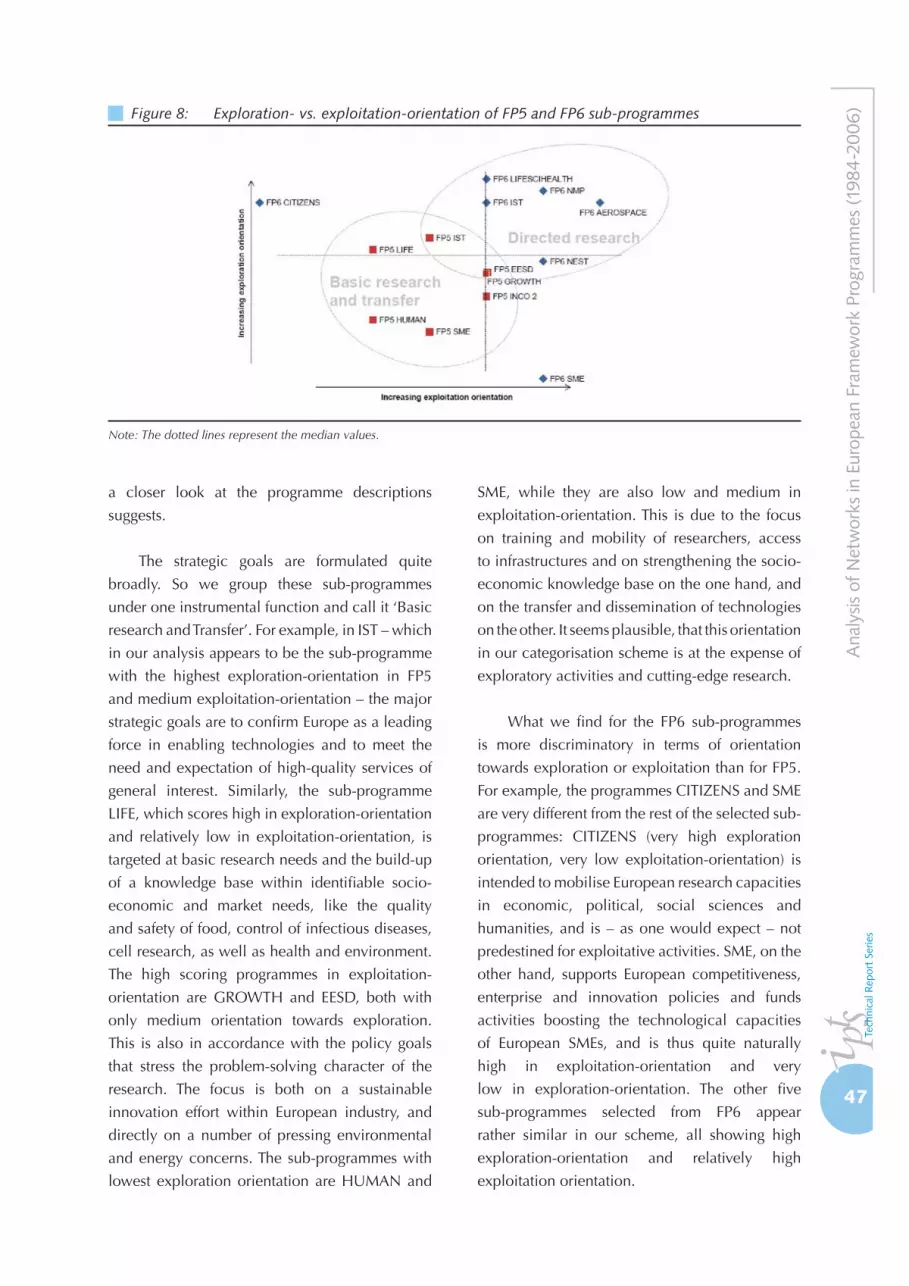
47
Ana
lysis
of N
etw
orks
in E
urop
ean
Fram
ewor
k Pr
ogra
mm
es (1
984-
2006
)
a closer look at the programme descriptions
suggests.
The strategic goals are formulated quite
broadly. So we group these sub-programmes
under one instrumental function and call it ‘Basic
research and Transfer’. For example, in IST – which
in our analysis appears to be the sub-programme
with the highest exploration-orientation in FP5
and medium exploitation-orientation – the major
strategic goals are to confirm Europe as a leading
force in enabling technologies and to meet the
need and expectation of high-quality services of
general interest. Similarly, the sub-programme
LIFE, which scores high in exploration-orientation
and relatively low in exploitation-orientation, is
targeted at basic research needs and the build-up
of a knowledge base within identifiable socio-
economic and market needs, like the quality
and safety of food, control of infectious diseases,
cell research, as well as health and environment.
The high scoring programmes in exploitation-
orientation are GROWTH and EESD, both with
only medium orientation towards exploration.
This is also in accordance with the policy goals
that stress the problem-solving character of the
research. The focus is both on a sustainable
innovation effort within European industry, and
directly on a number of pressing environmental
and energy concerns. The sub-programmes with
lowest exploration orientation are HUMAN and
SME, while they are also low and medium in
exploitation-orientation. This is due to the focus
on training and mobility of researchers, access
to infrastructures and on strengthening the socio-
economic knowledge base on the one hand, and
on the transfer and dissemination of technologies
on the other. It seems plausible, that this orientation
in our categorisation scheme is at the expense of
exploratory activities and cutting-edge research.
What we find for the FP6 sub-programmes
is more discriminatory in terms of orientation
towards exploration or exploitation than for FP5.
For example, the programmes CITIZENS and SME
are very different from the rest of the selected sub-
programmes: CITIZENS (very high exploration
orientation, very low exploitation-orientation) is
intended to mobilise European research capacities
in economic, political, social sciences and
humanities, and is – as one would expect – not
predestined for exploitative activities. SME, on the
other hand, supports European competitiveness,
enterprise and innovation policies and funds
activities boosting the technological capacities
of European SMEs, and is thus quite naturally
high in exploitation-orientation and very
low in exploration-orientation. The other five
sub-programmes selected from FP6 appear
rather similar in our scheme, all showing high
exploration-orientation and relatively high
exploitation orientation.
Figure 8: Exploration- vs. exploitation-orientation of FP5 and FP6 sub-programmes
Note: The dotted lines represent the median values.

48
Cha
pter
4: T
hem
atic
net
wor
ks a
nd t
heir
fun
ctio
ns Among the five remaining FP6 sub-
programmes, AEROSPACE obtains the highest
degree of exploitation-orientation, which is
in accordance with its strong reliance on the
European Aeronautics industry and the space
technology sector. The highest exploration-
orientation together with high exploitation-
orientation is attributed to LIFESCIHEALTH,
which aims at exploiting breakthroughs achieved
in genomics and supporting the European
biotechnology industry. Neither IST nor NMP
appear in surprising positions: Both programmes
are dedicated to the development of leading-edge
technologies for the competitiveness of European
industry, and thus are both high in exploration-
and exploitation-orientation. Somewhat surprising
is the horizontal basic research programme NEST,
but considering its focused nature with only small
research projects (STREP) and the lack of NoE
explains that its exploration-orientation is only
medium. Hence we attribute the instrumental
function ‘Directed research‘. As Figure 8 suggests,
this category mostly entails strong governance by
industry, thus it is plausible that this function also
applies to the FP5 sub programmes IST, EESD, and
GROWTH.
Summing up, the instrumental function of FP
sub-programmes is revealed from the orientation
of the different instruments towards the knowledge
exploration and knowledge exploitation activities,
and the relative importance of these instruments
within the sub-programmes. We find roughly two
discernable instrumental functions, namely ‘Basic
research and Transfer’, and Directed research’.
Another important finding of this analysis is the
increasing specialisation of the sub-programmes
in terms of exploration-vs.exploitation-orientation
from FP5 to FP6.
4.3 Structural functions of themes
In this section the focus is on the structure
of the collaboration networks that have emerged
within these sub-programmes and provide some
arguments for the suitability of these structures for
certain knowledge-related functions. We construct
the organisation projection of the collaboration
networks associated with the thematic sub-
programmes of FP5 and FP6 and present a set of
structural parameters that characterise their global
structural features (Table 22 and Table 23).
Table 22: Structural parameters of R&D collaboration organisation networks in the European Framework Programmes (FP5) by theme
Graph Characteristic IST EESD GROWTH LIFE HUMAN INCO2 SME
No. of vertices N 8,296 6,181 8,829 5,392 2,514 1,974 496
No. of edges M 90,906 77,330 130,335 59,838 19,503 12,118 3,236
No. of components 150 105 280 243 14 46 23
N for largest component 7,844 5,894 8,119 4,874 2,466 1,751 358
Share of total N (%) 94.6 95.4 92 90.4 98.1 88.7 72.2
M for largest component 90,159 76,959 129,482 59,438 19,388 11,597 2,701
Share of total M (%) 99.2 99.5 99.3 99.3 99.4 95.7 83.5
N for 2nd largest component 12 8 12 9 10 12 20
M for 2nd largest component 132 44 112 72 90 72 380
Mean clustering coefficient 0.8 0.8 0.8 0.7 0.8 0.9 0.9
Diameter of largest component 10 8 8 8 8 13 9
Characteristic path length of largest component 3.4 3.2 3.2 3.2 3.5 4.3 3.3
Mean degree 21.9 25 29.5 22.2 15.5 12.3 13
Fraction of N above the mean (%) 22.6 27.8 25.9 25.7 31.1 27.2 29
Mean vertex size P 2.2 2.3 2 2.5 2.1 1.5 1.4
Standard deviation of P 4 4 3.8 4.8 3 1.2 1.3

49
Ana
lysis
of N
etw
orks
in E
urop
ean
Fram
ewor
k Pr
ogra
mm
es (1
984-
2006
)
A first comparison of FP5 and FP6 networks
reveals several differences on the programme as
well as on the sub-programme level. The time-lag
in data capture on the programme level leads to
considerably fewer projects and organisations in our
FP6 networks, which we have to take into account
when we interpret size-dependent structural
parameters. Moving to the sub-programme level,
we also observe large differences in network
size due to the different budgets devoted to the
thematic programmes. For example, in the field
of Information Society Technologies (FP6-IST) a
total budget of 3,984 million Euros was available,
while in the programme for New and Emerging
Technologies (FP6-NEST) 215 million Euro were
foreseen. Thus, the network in FP6-NEST comprises
only 400 organisations while the FP6-IST network
involves 4,745 organisations, and in FP5, the
GROWTH programme comprises no less than
8,829 organisations.
While the number of projects per organisation
remains virtually the same in FP5 and FP6, the
diameter of the network is significantly smaller in
FP6. This is, of course related with network size, but
also due to the fact that projects in FP6 are on average
larger in terms of participants, so that network
connectivity is higher than in FP5. Moreover, Figure
9 shows that the sub-programmes differ greatly
in the degree of involvement of organisations in
EU research: the number of projects that a single
organisation participates in (see also ‘Mean vertex
size P’ in Table 22 and Table 23) is much lower
in SME-oriented programmes than, e.g. in IST
programmes. This explains the lower connectivity
in the SME programmes and the larger diameter
of these sub-programme networks. SMEs, INCO
partners or basic research actors in the NEST
programme are more likely one-time participants,
which leads to low global connectivity.
In the context of information and knowledge
flows, is highly important that multiple project
participation and large projects reduce the
average distance in the network, and increase the
potential of information exchange between these
organisations.
As a next step, we focus on the potential
of different network structures for knowledge
Table 23: Structural parameters of R&D collaboration organisation networks in the European Framework Programmes (FP6) by theme
Graph Characteristic ISTAERO SPACE
NMPLIFESCIHEALTH
CITIZENS SME NEST
No. of vertices N 4,745 1,135 2,678 1,838 979 2,463 400
No. of edges M 88,511 22,682 41,614 38,554 14,427 18,113 1,470
No. of components 5 5 3 13 4 50 19
N for largest component 4,718 1,116 2,667 1,813 965 1,955 289
Share of total N (%) 99.4 98.3 99.6 98.6 98.6 79.4 72.3
M for largest component 88,429 22,637 41,589 38,533 14,397 15,715 1,184
Share of total M (%) 99.9 99.8 99.9 99.9 99.8 86.8 80.5
N for 2nd largest component 9 8 6 5 7 30 13
M for 2nd largest component 72 56 30 12 42 258 84
Mean clustering coefficient 0.82 0.88 0.87 0.81 0.87 0.96 0.93
Diameter of largest component 6 4 6 5 6 12 10
Characteristic path length of largest component
2.8 2.37 2.84 2.45 2.63 4.6 4.19
Mean degree 37.31 39.97 31.08 41.95 29.47 14.71 7.35
Fraction of N above the mean (%) 27.8 35.1 35.5 27.9 36.2 32.5 22.3
Mean vertex size P 2.24 2.02 1.61 2.27 1.59 1.15 1.21
Standard deviation of P 3.97 3.68 1.75 3.66 1.38 1.07 0.62
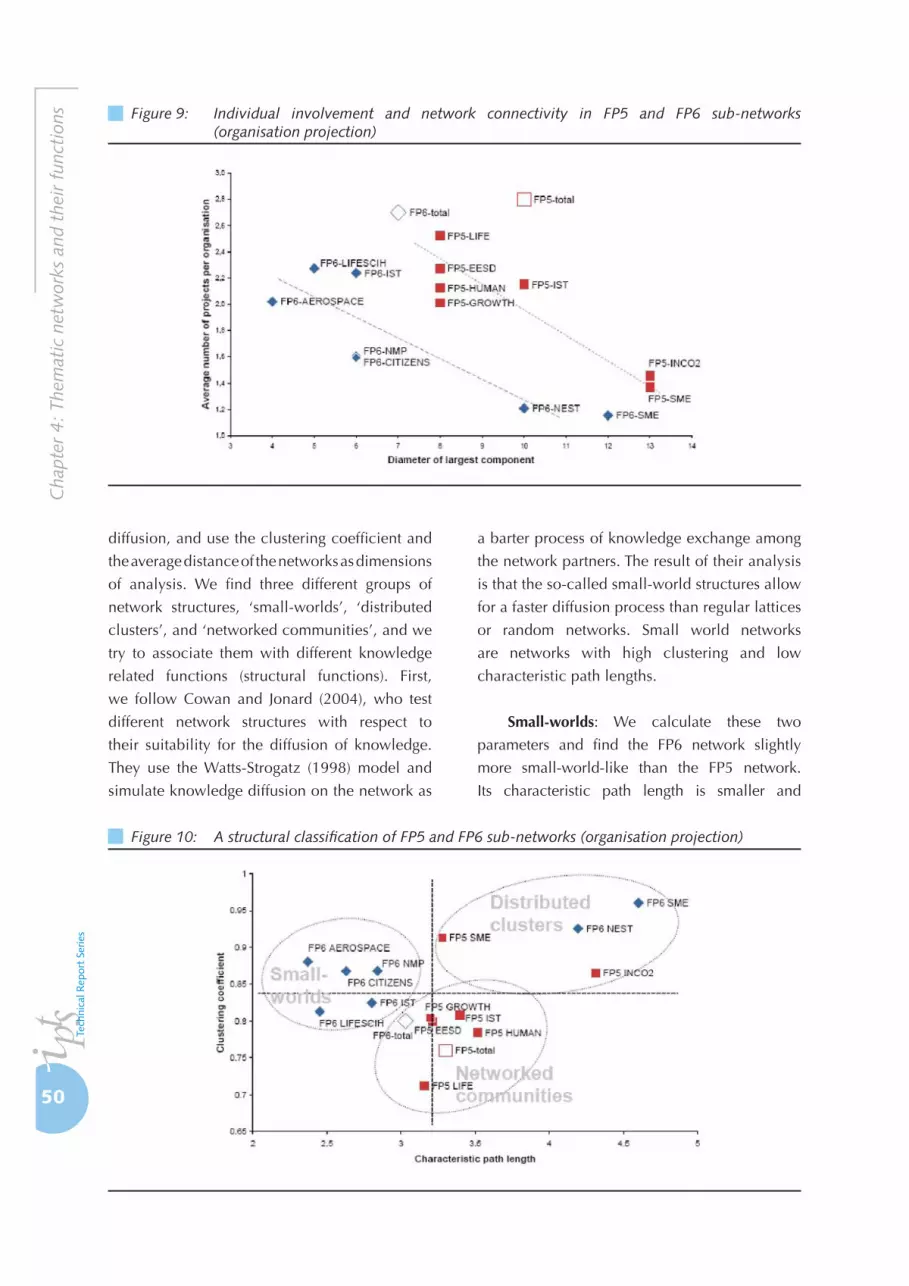
50
Cha
pter
4: T
hem
atic
net
wor
ks a
nd t
heir
fun
ctio
ns
diffusion, and use the clustering coefficient and
the average distance of the networks as dimensions
of analysis. We find three different groups of
network structures, ‘small-worlds’, ‘distributed
clusters’, and ‘networked communities’, and we
try to associate them with different knowledge
related functions (structural functions). First,
we follow Cowan and Jonard (2004), who test
different network structures with respect to
their suitability for the diffusion of knowledge.
They use the Watts-Strogatz (1998) model and
simulate knowledge diffusion on the network as
a barter process of knowledge exchange among
the network partners. The result of their analysis
is that the so-called small-world structures allow
for a faster diffusion process than regular lattices
or random networks. Small world networks
are networks with high clustering and low
characteristic path lengths.
Small-worlds: We calculate these two
parameters and find the FP6 network slightly
more small-world-like than the FP5 network.
Its characteristic path length is smaller and
Figure 9: Individual involvement and network connectivity in FP5 and FP6 sub-networks (organisation projection)
Figure 10: A structural classification of FP5 and FP6 sub-networks (organisation projection)

51
Ana
lysis
of N
etw
orks
in E
urop
ean
Fram
ewor
k Pr
ogra
mm
es (1
984-
2006
)
its clustering coefficient is larger. On the sub
programme level, this difference is even more
distinctive: Especially, the sub-networks FP6-
AEROSPACE, FP6-CITIZENS, and FP6-NMP
explicitly show the small-world feature: They
have an above-median clustering coefficient
and a characteristic path length that is well
below the median value of all sub-programmes.
But also FP6-IST and FP6-LIFESCIHEALTH may
be categorised as small-world networks. In the
context of our structural functions analysis, we are
led to call this group of networks ‘small-worlds’
(Figure 10). According to the high clustering,
we can attribute to these small-worlds a high
potential to jointly perform exploitation-oriented,
thematically focused R&D activities, and also the
ability to diffuse knowledge efficiently all over the
network.
Distributed clusters: In contrast, FP6-NEST
and FP6-SME show much higher characteristic
path lengths, although their clustering coefficient
is substantially high. The same is true for FP5-SME
and FP5-INCO2. These networks exhibit local
clusters weakly interlinked. Thus we categorise
these four sub-programmes as ‘distributed
clusters’ (Figure 10). Diffusion is well supported
in these network structures, but with a limited
reach. The focus of activity is laid on scientific
advancement or efficient transfer of knowledge
within the own clique while long-range relations
play a minor role.
Networked communities: Data analysis
reveals a third group of sub-networks, all emerging
from FP5 sub-programmes that are medium in
characteristic path-length but considerably lower
(below-median) in clustering. Within this group,
we find the more industry-oriented programmes
FP5-GROWTH, FP5-IST, but also FP5-EESD, and
the socio-economic programme FP5-HUMAN.
FP5-LIFE exhibits a surprisingly low clustering
coefficient, but nevertheless can be categorised as
a ‘networked community’ (Figure 10). As the low
clustering stems to a large extent from the smaller
size of the projects (in terms of participants), these
structures may support focused cutting-edge
research, but the general ability to diffuse knowledge
may be lower than in the small-worlds.
Summing up, in this section we categorise
selected sub-programmes of FP5 and FP6
according to their clustering and connectivity
structure, and from this, we attribute a
‘structural function’ to them. We find three
groups of networks, namely the ‘small-worlds’,
the ‘distributed clusters’, and the ‘networked
communities’. The small-worlds, with high
clustering and low average distances, can be
associated with the function of thematically
focused, exploitation-oriented R&D, and also
the ability to diffuse knowledge efficiently.
The distributed clusters, with high clustering
and high average distances, can be interpreted
as structures supporting the advancement
of knowledge and efficient transfer within
relatively closed cliques. The networked
communities, showing weak internal clustering
and medium distances, seem to be best suited
for cutting-edge research, but may be less
suited for the diffusion and exploitation of
knowledge.
4.4 Crossing instruments with themes and typology of networks
Finally, we compare instrumental and
structural function of the sub-networks
and valuate the degree to which these two
characterisations of the sub-programmes
conform. It must, however, be emphasised
that matching the instrumental and structural
functions is closely related with the problem
of finding optimal project structures for certain
functions – an area of ongoing research. This
part of our approach is thus to be seen as
exploratory.
Summing up, we observe small world
networks (with high clustering and short
global distances) in sub-programmes with a
strong emphasis on directed research, mostly
with industrial character. Distributed cluster

52
Cha
pter
4: T
hem
atic
net
wor
ks a
nd t
heir
fun
ctio
ns
networks are found in programmes with a strong
exploitative component and knowledge transfer
functions. More evenly distributed network
structures with lower clustering are associated
with basic research and broader orientations
entailing also transfer activities.
Comparing FP5 to FP6 (Table 24), we
observe extensive instrumental and structural
change. Specifically, the thematic priorities IST,
EESD, GROWTH (FP5) / AEROSPACE (FP6),
LIFEQUALITY (FP5) / LIFESCIHEALTH (FP6)
changed their instrumental function from basic
research and transfer to directed research. The same
thematic priorities changed their structural function
from networked community to small world type
networks. GROWTH/AEROSPACE too exhibits the
same instrumental and structural functions.
Table 24: Comparison of instrumental and structural functions (FP5 and FP6 sub programmes)
Acronym Instrumental function Structural function
FP5 (1998-2002)
IST Basic research and transfer, Directed research Networked community
EESD Basic research and transfer, Directed research Networked community
GROWTH Basic research and transfer, Directed research Networked community
LIFE QUALITY Basic research and transfer Networked community
HUMAN POTENTIAL Basic research and transfer Networked community
INCO 2 Basic research and transfer Distributed clusters
INNOVATION-SME Basic research and transfer Distributed clusters
FP6 (2002-2006)
IST Directed research Small world
AEROSPACE Directed research Small world
NMP Directed research Small world
LIFESCIHEALTH Directed research Small world
CITIZENS Outlier (Exploratory research) Small world
SME Outlier (Exploitation of results) Distributed clusters
NEST Directed research Distributed clusters

53
Ana
lysis
of N
etw
orks
in E
urop
ean
Fram
ewor
k Pr
ogra
mm
es (1
984-
2006
)
Chapter 5: Core organisations by themes and instruments
in FP4 to FP6
Using the number of connections as a criterion,
we can identify ‘core’ organisations as those that
had a much higher degree than the average. These
organisations form centrally located and highly
interlinked nodes in FP networks that dramatically
affect the way a network is connected. To define
the core in thematic networks we used in this
chapter a fraction (square root) of the total number
of organisations in each sub-network.
5.1 Core organisations by countries in themes and instruments
In this section, a more detailed view of
core organisations across countries is offered,
considering the selected thematic areas and the
relevant FP programmes. Table 63 to Table 66 in the
Annex show the distribution of core organisations
with largest degree (compared to the total number
of organisations) in projects of instrument CSC
and STREP, in the four selected thematic priorities
from FP4 to FP6 (see Methodology). Such step
allows the identification of the involvement of
different countries in specific topics across FPs.
Additionally, the distribution of core
organisations in different instruments in FP6
(STREP, IP, NoE) in the thematic priorities is
presented in Table 67 to Table 70 in Annex, which
enables to compare the extent of participation of
each country in different types of instruments in
FP6 that represents the strengthening, integration
and structuring of the European Research Area
(ERA). Figure 11 to Figure 14 include the most
active countries (share above 5% in any of the
instruments) in each theme and compares share
of organisations in total with the share of core
organisations in each theme.
Aerospace
Aerospace shows a strong and stable
participation of organisations from France,
Germany, and United Kingdom in smaller research
projects (CSC, STREP), for FP4 to FP6 (Figure 11).
Organisations from Italy represent a high share of
core organisations in FP4, but this share decreases
in the following FP. With respect to the different
instruments in FP6, organisations from France
(25%) and United Kingdom (25%) represent one
half of the core organisations in Integrated Projects,
while core organisations in STREP originate
mainly from France (32%) and Germany (24%).
Nearly one half of the core organisations in NoE
come from Germany (42%). This is in contrast to
Figure 11: Distribution of organisations and core organisations by countries in FP4 to FP6 by countries and theme (AERO)
Note: Explanation of abbreviations see Annex

54
Cha
pter
5: C
ore
orga
nisa
tion
s by
the
mes
and
inst
rum
ents
in F
P4 t
o FP
6
the general trend where the United Kingdom is
dominant among core organisations.
Energy and Environment
In FP4, Energy/Environment is characterised
by a strong attendance of core organisations
from United Kingdom (21.6%), which declines
significantly in the following FPs (Figure 12). Only
in FP6 NoE projects organisations from the United
Kingdom hold a high share. On the contrary, an
increasing importance of organisations from
Germany and France can be observed in this topic
in the later FPs, especially as core organisations
in STREP. Increased interest in this topic can be
observed for organisations from Netherlands and
Figure 12: Distribution of organisations and core organisations by countries in FP4 to FP6 by countries and theme (ENV)
Note: Explanation of abbreviations see Table 62 Annex
Figure 13: Distribution of core organisations in FP4 to FP6 by countries and theme (ICT)
Note: Explanation of abbreviations see Annex
Figure 14: Distribution of core organisations in FP4 to FP6 by countries and theme (LIFESCI)
Note: Explanation of abbreviations see Annex

55
Ana
lysis
of N
etw
orks
in E
urop
ean
Fram
ewor
k Pr
ogra
mm
es (1
984-
2006
)
Sweden (share of organisations above average).
This is consistent with the overall representation
of core organisations from these two countries:
they were among a small group of older member
states (together with Germany) whose overall
share increased in FP6.
ICT
In ICT, German (25.5%) and French
organisations (21.6%) represent a high share
of core organisations in FP4, but their share
decreases in the following FPs in CSC and STREP
(Figure 13). Instead of attending small research
projects, French organisations concentrate on
large IP (21.7% of core organisations) and NoE
(20% of core organisations). The declining share
of organisations from Germany and France is
complemented by an increasing share of Italian
(core) organisations (16%). Organisations from
Greece show increased activities in ICT (share
of core organisations above average in NoE and
STREP).
Life Sciences
Finally, Life Sciences can be characterised
by a growing number of core organisations from
Germany (esp. in NoE) (Figure 14). Organisations
from the United Kingdom show a strong but
decreasing participation in small research projects,
but a high share of core organisations in IP and
NoE - comparable to France in ICT. Life Sciences
appear as research topic of increased interest
for organisations from Netherlands, Sweden and
Switzerland, that represent a significant share of
core organisations; Italy participates in Life Science
projects frequently, but only few organisations
collaborate with many different partners (i.e. only
few core organisations).
5.2 Core organisations by organisation type in themes and instruments
Tables 75 to 78 in the Annex present the
distribution of core organisations, in terms of
organisation type, in projects of instrument CSC/
STREP in four selected thematic priorities from FP4
to FP6. The extent to which (core) organisations
from science and industry participate in different
topics corresponds to underlying technological
regimes and allows for the characterisation of
thematic sub networks. The following figures
compare the share of organisations in total with
the share of core organisations in each theme and
instrument.
Aerospace
Aerospace in general can be described
as an industry-university topic, which is lead
by companies (Figure 15). It shows a strong
involvement of industry partners in CSC, STREP and
Figure 15: Distribution of core organisations in FP4 to FP6 by organisation type and theme (AERO)
Note: Explanation of abbreviations see Annex
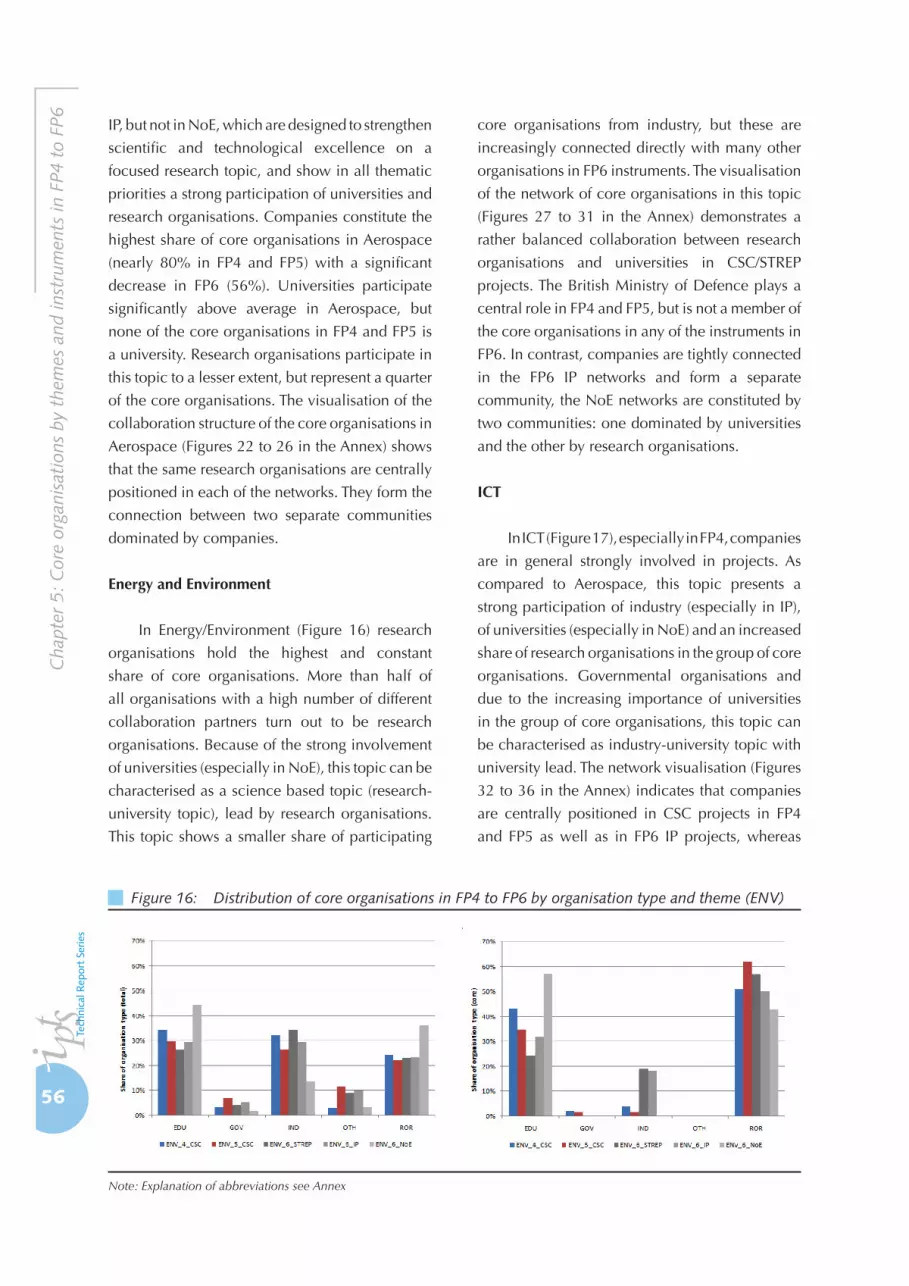
56
Cha
pter
5: C
ore
orga
nisa
tion
s by
the
mes
and
inst
rum
ents
in F
P4 t
o FP
6
IP, but not in NoE, which are designed to strengthen
scientific and technological excellence on a
focused research topic, and show in all thematic
priorities a strong participation of universities and
research organisations. Companies constitute the
highest share of core organisations in Aerospace
(nearly 80% in FP4 and FP5) with a significant
decrease in FP6 (56%). Universities participate
significantly above average in Aerospace, but
none of the core organisations in FP4 and FP5 is
a university. Research organisations participate in
this topic to a lesser extent, but represent a quarter
of the core organisations. The visualisation of the
collaboration structure of the core organisations in
Aerospace (Figures 22 to 26 in the Annex) shows
that the same research organisations are centrally
positioned in each of the networks. They form the
connection between two separate communities
dominated by companies.
Energy and Environment
In Energy/Environment (Figure 16) research
organisations hold the highest and constant
share of core organisations. More than half of
all organisations with a high number of different
collaboration partners turn out to be research
organisations. Because of the strong involvement
of universities (especially in NoE), this topic can be
characterised as a science based topic (research-
university topic), lead by research organisations.
This topic shows a smaller share of participating
core organisations from industry, but these are
increasingly connected directly with many other
organisations in FP6 instruments. The visualisation
of the network of core organisations in this topic
(Figures 27 to 31 in the Annex) demonstrates a
rather balanced collaboration between research
organisations and universities in CSC/STREP
projects. The British Ministry of Defence plays a
central role in FP4 and FP5, but is not a member of
the core organisations in any of the instruments in
FP6. In contrast, companies are tightly connected
in the FP6 IP networks and form a separate
community, the NoE networks are constituted by
two communities: one dominated by universities
and the other by research organisations.
ICT
In ICT (Figure 17), especially in FP4, companies
are in general strongly involved in projects. As
compared to Aerospace, this topic presents a
strong participation of industry (especially in IP),
of universities (especially in NoE) and an increased
share of research organisations in the group of core
organisations. Governmental organisations and
due to the increasing importance of universities
in the group of core organisations, this topic can
be characterised as industry-university topic with
university lead. The network visualisation (Figures
32 to 36 in the Annex) indicates that companies
are centrally positioned in CSC projects in FP4
and FP5 as well as in FP6 IP projects, whereas
Figure 16: Distribution of core organisations in FP4 to FP6 by organisation type and theme (ENV)
Note: Explanation of abbreviations see Annex

57
Ana
lysis
of N
etw
orks
in E
urop
ean
Fram
ewor
k Pr
ogra
mm
es (1
984-
2006
)
collaboration between core organisations from
science and industry seem to be more balanced
in FP6 STREP projects.
Life Sciences
Finally, Life Science is the topic with the
highest participation of universities and research
organisations (Figure 18). Compared to other
topics, Life Science exhibits the smallest share of
core organisations from industry. The visualisation
of the network of core organisations in this topic
(Figures 37 to 41 in the Annex) shed light on the
role of research organisations in Life Science.
Their share is lower in all instruments and FPs
than the share of universities; nevertheless
research organisations constitute the centre of
nearly all collaboration networks. The FP6 NoE
networks are an exception. In this case all core
organisations are evenly strongly connected with
each other.
Figure 17: Distribution of core organisations in FP4 to FP6 by organisation type and theme (ICT)
Note: Explanation of abbreviations see Annex
Figure 18: Distribution of core organisations in FP4 to FP6 by organisation type and theme (LIFESCI)
Note: Explanation of abbreviations see Annex


59
Ana
lysis
of N
etw
orks
in E
urop
ean
Fram
ewor
k Pr
ogra
mm
es (1
984-
2006
)
Chapter 6: Key player organisations and universities by
themes and instruments in FP5 and FP6
In this section we calculate the ranks of key
organisations based on their level of participation
in the four selected priorities - Aerospace, Energy
& Environment, ICT and Life Sciences - crossed
with the three selected instruments, the two new
ones, IP and NoE, and the typical instrument of
FPs, the STREP for FP5 and FP6. Then the ranks
are specifically calculated for the universities in
FP 6 in the same selected areas and instruments.
Ideally, an analysis of the position of key
organisations and universities in networks should
be based on measures of centrality rather than
participation. However this information could
not be produced given the resource limitations
of the study. Nevertheless, there are good reasons
to expect that such rankings can provide relevant
information. Many research organisations,
particularly large and important ones, participate
in several projects. The frequency of their
participation can be expected to be related to
their thematic specialisation. Therefore for a
given thematic priority and/or a combination of
thematic priorities and instruments, the number of
participations may provide valuable information
as to the specialisation and strategic orientation
(basic/applied – exploratory-/exploitation-
oriented).
However the precise position of individual
organisations should not be overemphasised.
First, the participation to the FP is not necessarily a
reflection of specialisation or strategic orientation
– lack of national sources of funding and other
factors could be strong motivators. Second,
the ranks are used here as a summary device
(intended to reduce the amount of information
extracted and assist in its analysis), not as some
sort of contest, and should not therefore be used
for direct comparisons. The intention is rather to
find out more about the general characteristics of
organisations involved in each subprogramme and
infer broad patterns about the recent evolution of
the ERA.
Organisations and universities were
ranked in each thematic priority crossed by
type of instrument, in terms of their number of
participations in projects. Even without a rank by
centrality, it is possible to position the most active
organisations and universities in the four thematic
priorities and understand their preferences in
terms of instruments. With this approach it is also
possible to know the choices taken by each actor
in terms of their positioning in the coordination
of research and technology development through
the take up of the two new instruments or in
collaborative research with the STREP instrument
in the four thematic priorities.
6.1 Key player organisations by themes and instruments
Aerospace
In the thematic priority Aerospace, due to
its highly specialised nature, one would expect
a relatively small number of actors and relatively
little change over time. Indeed, some industrial
(Airbus, EADS), public (DLR, CNR, CNRS) and
academic actors are present in the top positions
in both FP5 and FP6 (Table 25 and Table 26). The
various parts of Airbus and EADS dominate the top
positions. With the exception of small differences
in ranks, the pool of participants remained
relatively stable over the two FPs examined here.
The pool of industrial actors is relatively small
and is constrained to a handful of relatively large
manufacturers who can afford the high capital
costs associated with the sector. No universities
appear in the top ranks for FP5, whereas only two
universities (University of Patras and University of
Cranfield) make it to the top 20 in FP6.
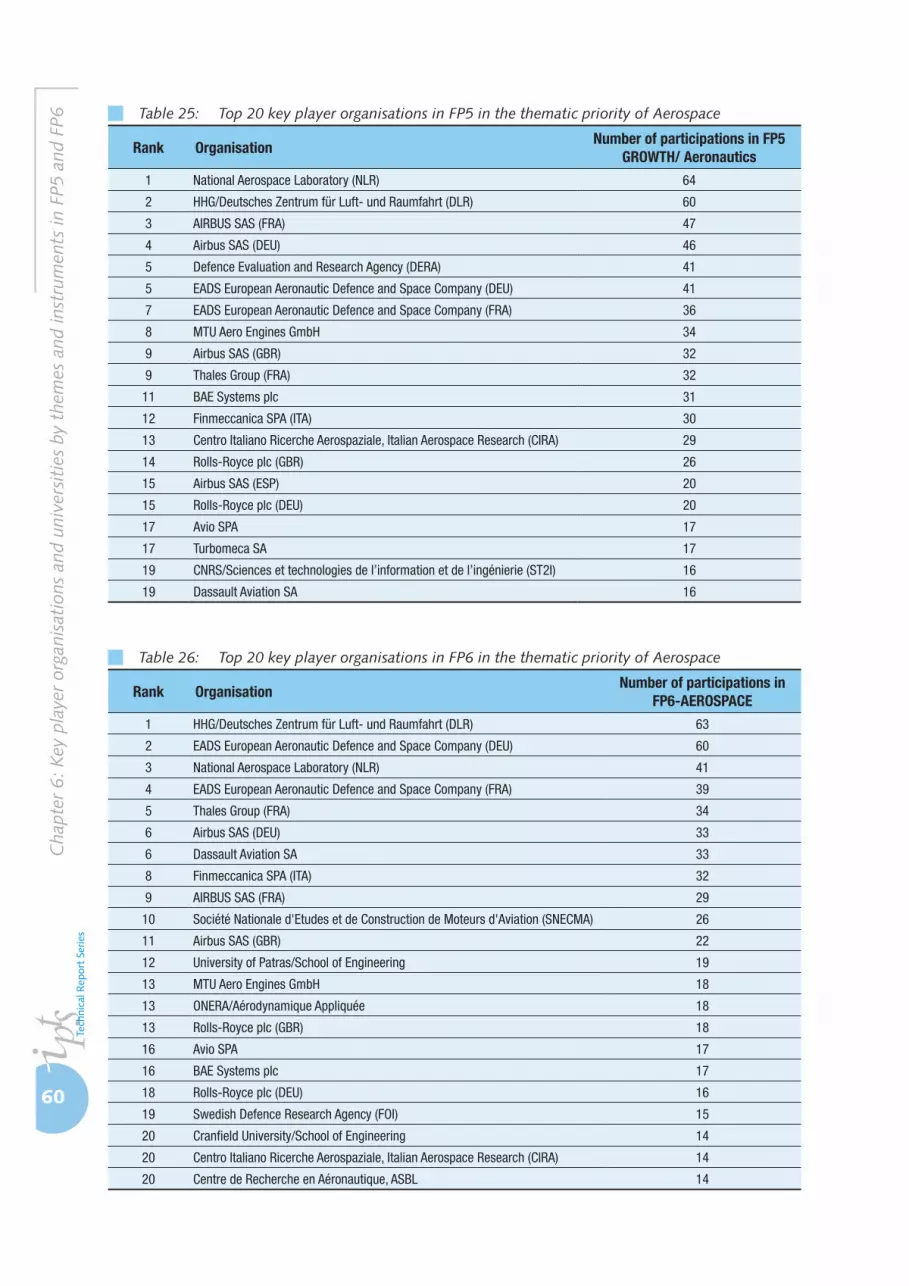
60
Cha
pter
6: K
ey p
laye
r or
gani
sati
ons
and
univ
ersi
ties
by
them
es a
nd in
stru
men
ts in
FP5
and
FP6 Table 25: Top 20 key player organisations in FP5 in the thematic priority of Aerospace
Rank OrganisationNumber of participations in FP5
GROWTH/ Aeronautics
1 National Aerospace Laboratory (NLR) 64
2 HHG/Deutsches Zentrum für Luft- und Raumfahrt (DLR) 60
3 AIRBUS SAS (FRA) 47
4 Airbus SAS (DEU) 46
5 Defence Evaluation and Research Agency (DERA) 41
5 EADS European Aeronautic Defence and Space Company (DEU) 41
7 EADS European Aeronautic Defence and Space Company (FRA) 36
8 MTU Aero Engines GmbH 34
9 Airbus SAS (GBR) 32
9 Thales Group (FRA) 32
11 BAE Systems plc 31
12 Finmeccanica SPA (ITA) 30
13 Centro Italiano Ricerche Aerospaziale, Italian Aerospace Research (CIRA) 29
14 Rolls-Royce plc (GBR) 26
15 Airbus SAS (ESP) 20
15 Rolls-Royce plc (DEU) 20
17 Avio SPA 17
17 Turbomeca SA 17
19 CNRS/Sciences et technologies de l’information et de l’ingénierie (ST2I) 16
19 Dassault Aviation SA 16
Table 26: Top 20 key player organisations in FP6 in the thematic priority of Aerospace
Rank OrganisationNumber of participations in
FP6-AEROSPACE
1 HHG/Deutsches Zentrum für Luft- und Raumfahrt (DLR) 63
2 EADS European Aeronautic Defence and Space Company (DEU) 60
3 National Aerospace Laboratory (NLR) 41
4 EADS European Aeronautic Defence and Space Company (FRA) 39
5 Thales Group (FRA) 34
6 Airbus SAS (DEU) 33
6 Dassault Aviation SA 33
8 Finmeccanica SPA (ITA) 32
9 AIRBUS SAS (FRA) 29
10 Société Nationale d'Etudes et de Construction de Moteurs d'Aviation (SNECMA) 26
11 Airbus SAS (GBR) 22
12 University of Patras/School of Engineering 19
13 MTU Aero Engines GmbH 18
13 ONERA/Aérodynamique Appliquée 18
13 Rolls-Royce plc (GBR) 18
16 Avio SPA 17
16 BAE Systems plc 17
18 Rolls-Royce plc (DEU) 16
19 Swedish Defence Research Agency (FOI) 15
20 Cranfield University/School of Engineering 14
20 Centro Italiano Ricerche Aerospaziale, Italian Aerospace Research (CIRA) 14
20 Centre de Recherche en Aéronautique, ASBL 14
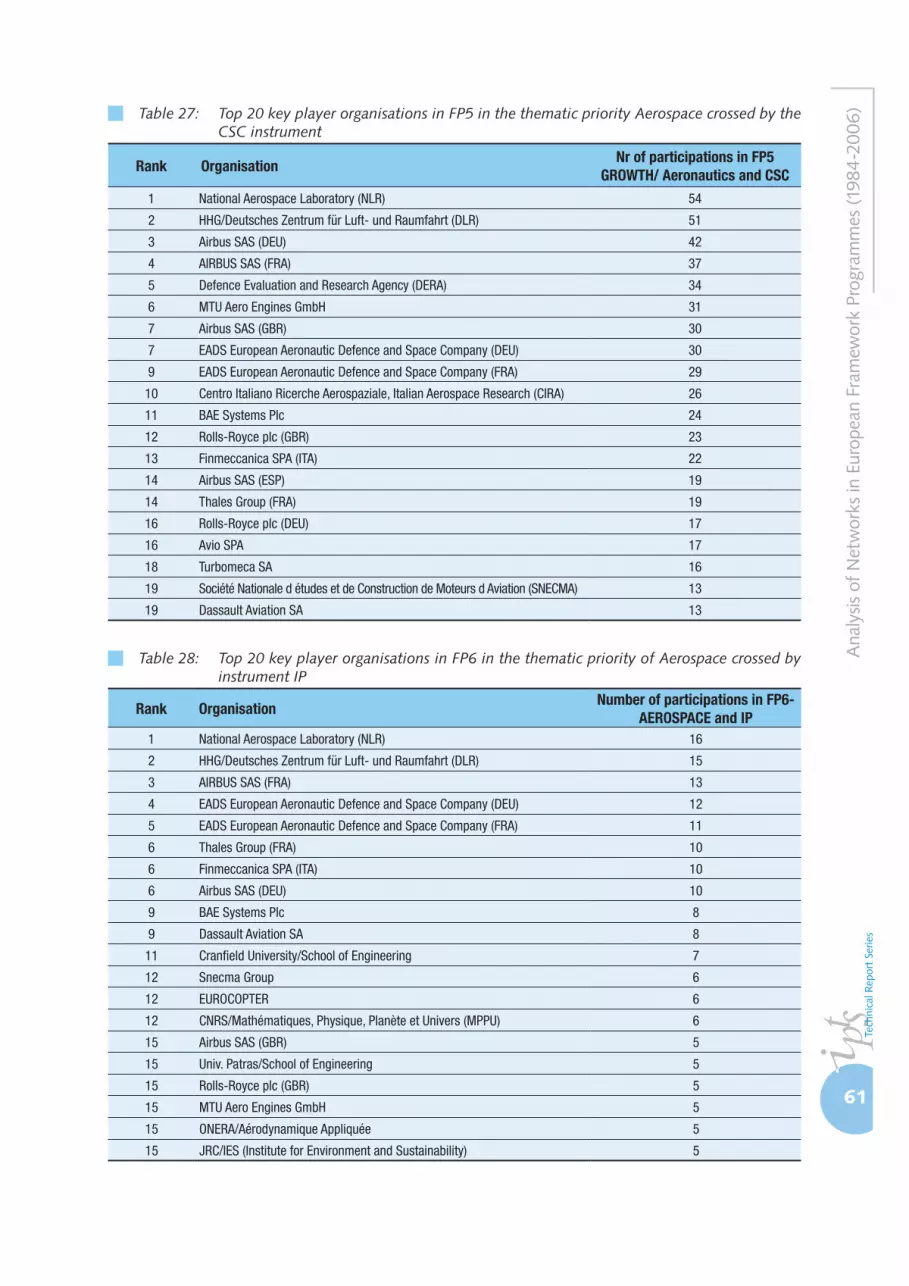
61
Ana
lysis
of N
etw
orks
in E
urop
ean
Fram
ewor
k Pr
ogra
mm
es (1
984-
2006
)Table 27: Top 20 key player organisations in FP5 in the thematic priority Aerospace crossed by the CSC instrument
Rank OrganisationNr of participations in FP5
GROWTH/ Aeronautics and CSC
1 National Aerospace Laboratory (NLR) 54
2 HHG/Deutsches Zentrum für Luft- und Raumfahrt (DLR) 51
3 Airbus SAS (DEU) 42
4 AIRBUS SAS (FRA) 37
5 Defence Evaluation and Research Agency (DERA) 34
6 MTU Aero Engines GmbH 31
7 Airbus SAS (GBR) 30
7 EADS European Aeronautic Defence and Space Company (DEU) 30
9 EADS European Aeronautic Defence and Space Company (FRA) 29
10 Centro Italiano Ricerche Aerospaziale, Italian Aerospace Research (CIRA) 26
11 BAE Systems Plc 24
12 Rolls-Royce plc (GBR) 23
13 Finmeccanica SPA (ITA) 22
14 Airbus SAS (ESP) 19
14 Thales Group (FRA) 19
16 Rolls-Royce plc (DEU) 17
16 Avio SPA 17
18 Turbomeca SA 16
19 Société Nationale d études et de Construction de Moteurs d Aviation (SNECMA) 13
19 Dassault Aviation SA 13
Table 28: Top 20 key player organisations in FP6 in the thematic priority of Aerospace crossed by instrument IP
Rank OrganisationNumber of participations in FP6-
AEROSPACE and IP1 National Aerospace Laboratory (NLR) 16
2 HHG/Deutsches Zentrum für Luft- und Raumfahrt (DLR) 15
3 AIRBUS SAS (FRA) 13
4 EADS European Aeronautic Defence and Space Company (DEU) 12
5 EADS European Aeronautic Defence and Space Company (FRA) 11
6 Thales Group (FRA) 10
6 Finmeccanica SPA (ITA) 10
6 Airbus SAS (DEU) 10
9 BAE Systems Plc 8
9 Dassault Aviation SA 8
11 Cranfield University/School of Engineering 7
12 Snecma Group 6
12 EUROCOPTER 6
12 CNRS/Mathématiques, Physique, Planète et Univers (MPPU) 6
15 Airbus SAS (GBR) 5
15 Univ. Patras/School of Engineering 5
15 Rolls-Royce plc (GBR) 5
15 MTU Aero Engines GmbH 5
15 ONERA/Aérodynamique Appliquée 5
15 JRC/IES (Institute for Environment and Sustainability) 5
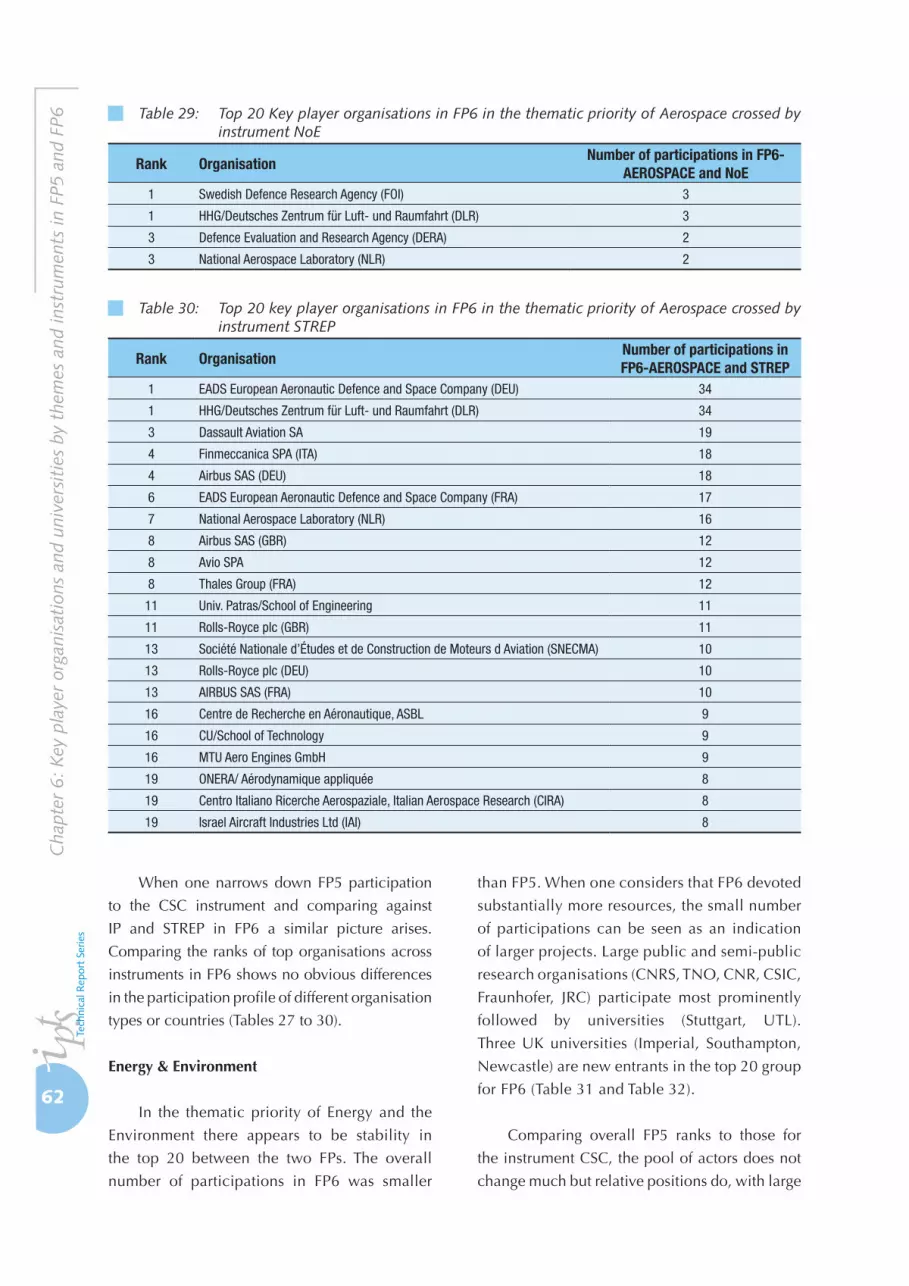
62
Cha
pter
6: K
ey p
laye
r or
gani
sati
ons
and
univ
ersi
ties
by
them
es a
nd in
stru
men
ts in
FP5
and
FP6 Table 29: Top 20 Key player organisations in FP6 in the thematic priority of Aerospace crossed by
instrument NoE
Rank OrganisationNumber of participations in FP6-
AEROSPACE and NoE1 Swedish Defence Research Agency (FOI) 3
1 HHG/Deutsches Zentrum für Luft- und Raumfahrt (DLR) 3
3 Defence Evaluation and Research Agency (DERA) 2
3 National Aerospace Laboratory (NLR) 2
Table 30: Top 20 key player organisations in FP6 in the thematic priority of Aerospace crossed by instrument STREP
Rank OrganisationNumber of participations in FP6-AEROSPACE and STREP
1 EADS European Aeronautic Defence and Space Company (DEU) 34
1 HHG/Deutsches Zentrum für Luft- und Raumfahrt (DLR) 34
3 Dassault Aviation SA 19
4 Finmeccanica SPA (ITA) 18
4 Airbus SAS (DEU) 18
6 EADS European Aeronautic Defence and Space Company (FRA) 17
7 National Aerospace Laboratory (NLR) 16
8 Airbus SAS (GBR) 12
8 Avio SPA 12
8 Thales Group (FRA) 12
11 Univ. Patras/School of Engineering 11
11 Rolls-Royce plc (GBR) 11
13 Société Nationale d’Études et de Construction de Moteurs d Aviation (SNECMA) 10
13 Rolls-Royce plc (DEU) 10
13 AIRBUS SAS (FRA) 10
16 Centre de Recherche en Aéronautique, ASBL 9
16 CU/School of Technology 9
16 MTU Aero Engines GmbH 9
19 ONERA/ Aérodynamique appliquée 8
19 Centro Italiano Ricerche Aerospaziale, Italian Aerospace Research (CIRA) 8
19 Israel Aircraft Industries Ltd (IAI) 8
When one narrows down FP5 participation
to the CSC instrument and comparing against
IP and STREP in FP6 a similar picture arises.
Comparing the ranks of top organisations across
instruments in FP6 shows no obvious differences
in the participation profile of different organisation
types or countries (Tables 27 to 30).
Energy & Environment
In the thematic priority of Energy and the
Environment there appears to be stability in
the top 20 between the two FPs. The overall
number of participations in FP6 was smaller
than FP5. When one considers that FP6 devoted
substantially more resources, the small number
of participations can be seen as an indication
of larger projects. Large public and semi-public
research organisations (CNRS, TNO, CNR, CSIC,
Fraunhofer, JRC) participate most prominently
followed by universities (Stuttgart, UTL).
Three UK universities (Imperial, Southampton,
Newcastle) are new entrants in the top 20 group
for FP6 (Table 31 and Table 32).
Comparing overall FP5 ranks to those for
the instrument CSC, the pool of actors does not
change much but relative positions do, with large

63
Ana
lysis
of N
etw
orks
in E
urop
ean
Fram
ewor
k Pr
ogra
mm
es (1
984-
2006
)Table 31: Top 20 key player organisations in FP5 in the thematic priority of Energy and Environment
Rank OrganisationNumber of participations
in FP5 EESD1 CNRS/Mathématiques, Physique, Planète et Univers (MPPU) 133
2 Natural Environment Research Council (NERC) 100
3 HHG/Deutsches Zentrum für Luft- und Raumfahrt (DLR) 56
4 UTL/Instituto Superior Tecnico (IST) (Higher Technical Institute) 53
4 TNO/Built Environment and Geosciences 53
6 Center For Renewable Energy Sources (CRES) 51
7 ENEA - Ente per le Nuove tecnologie, Energia e Ambiente 49
8 Uni Stuttgart/Fakultät für Maschinenbau 47
9 ENVIRA/NILU - Norwegian Institute for Air Research (Norsk Institutt for Luftforskning) 46
10 JRC/IES (Institute for Environment and Sustainability) 45
10 FHG/Fraunhofer-Institut für Solare Energiesysteme (ISE) 45
12 CNRS/Sciences du vivant (SDV) 43
13 CSIC/Recursos Naturales 39
14 CNRS/Environnement et Développement Durable 37
15 CEA/Direction des Sciences de la Matière 36
16 CU/School of Physical Sciences 35
17 CNRS/Sciences et technologies de l’information et de l’ingénierie (ST2I) 32
17 HHG/Forschungszentrum Jülich (FZJ) 32
19 Electricité de France (EDF) 31
20 Danish Meteorological Institute (DMI) 30
Table 32: Top 20 key player organisations in FP6 in the thematic priority of Energy and Environment
Rank OrganisationNumber of participations in
FP6-SUSTDEV1 FIAT Gruppo 35
2 Natural Environment Research Council (NERC) 32
3 UTL/Instituto Superior Técnico (IST) (Higher Technical Institute) 29
4 Siemens AG (DEU) 26
5 HHG/Deutsches Zentrum für Luft- und Raumfahrt (DLR) 25
6 CNRS/Mathématiques, Physique, Planète et Univers (MPPU) 23
7 Alstom (FRA) 21
8 Uni Stuttgart/Fakultät für Maschinenbau 19
8 JRC/IES (Institute for Environment and Sustainability) 19
10 DaimlerChrysler AG (DEU) 18
10 Institut Français du Pétrole (IFP) 18
10 NCL/Faculty of Science, Agriculture and Engineering 18
10 CEA/Direction de la recherche technologique 18
10 Det Norske Veritas A/S (NOR) 18
15 Volvo Group (SWE) 17
15 CNRS/Sciences du Vivant (SDV) 17
17 HHG/Umweltforschungszentrum Leipzig-Halle (UFZ) 16
17 RWTH/Fakultät für Maschinenwesen 16
19 TNO/Built Environment and Geosciences 15
19 ASCZE/Section of Bio-Ecological Sciences 15
19 WGL/Potsdam-Institut für Klimafolgenforschung, Potsdam 15
19 VUA/Faculty of Earth and Life Sciences 15
19 PAS/Division IV Technical Sciences 15
19 HHG/Alfred-Wegener-Institut für Polar- und Meeresforschung (AWI) 15

64
Cha
pter
6: K
ey p
laye
r or
gani
sati
ons
and
univ
ersi
ties
by
them
es a
nd in
stru
men
ts in
FP5
and
FP6 Table 33: Top 20 key player organisations in FP5 in the thematic priority Energy and Environment
crossed by the CSC instrument
Rank OrganisationNumber of participations
in FP5 EESD and CSC1 CNRS/Mathématiques, Physique, Planète et Univers (MPPU) 92
2 Natural Environment Research Council (NERC) 74
3 HHG/Deutsches Zentrum für Luft- und Raumfahrt (DLR) 45
4 ENVIRA/NILU - Norwegian Institute for Air Research (Norsk Institutt for Luftforskning) 40
5 Uni Stuttgart/Fakultät für Maschinenbau 35
5 JRC/IES (Institute for Environment and Sustainability) 35
5 CNRS/Environnement et Développement Durable 35
8 TNO/Built Environment and Geosciences 34
9 CEA/Direction des Sciences de la Matière 33
10 CU/School of Physical Sciences 31
11 CNRS/Sciences du vivant (SDV) 30
12 Danish Meteorological Institute (DMI) 29
12 UTL/Instituto Superior Tecnico (IST) (Higher Technical Institute) 29
14 CSIC/Recursos Naturales 28
15 Center For Renewable Energy Sources (CRES) 27
16 CNRS/Sciences et technologies de l’information et de l’ingénierie (ST2I) 26
17 ENEA - Ente per le Nuove tecnologie, Energia e Ambiente 25
17 SU/Faculty of Natural Sciences 25
17 Ministry of Defence (UK)/Met Office 25
20 FHG/Fraunhofer-Institut für Solare Energiesysteme (ISE) 24
public organisations faring marginally better in
CSC (Table 33). With regard to the ranking of
organisations by instrument, there is again a clear
distinction between the profile of participation
in NoE and IP and STREP. In that respect, the
relative ranking of organisations can be seen
as indicative of the position of their research
(basic vs. more close to the market). In NoE in
particular organisations from new member states
(Poland and the Czech Republic) are in the top
20. In agreement with the instrument’s political
expectations, in FP6 IP (Table 34) a number of
industrial actors make it to the top 20 (Daimler-
Chrysler, Fiat, Volvo, Alstom and Siemens). The
picture with regard to industrial participation is
similar in FP6 STREP (Table 36), but also with
some representation of smaller companies
(Cybernetix, BMT).
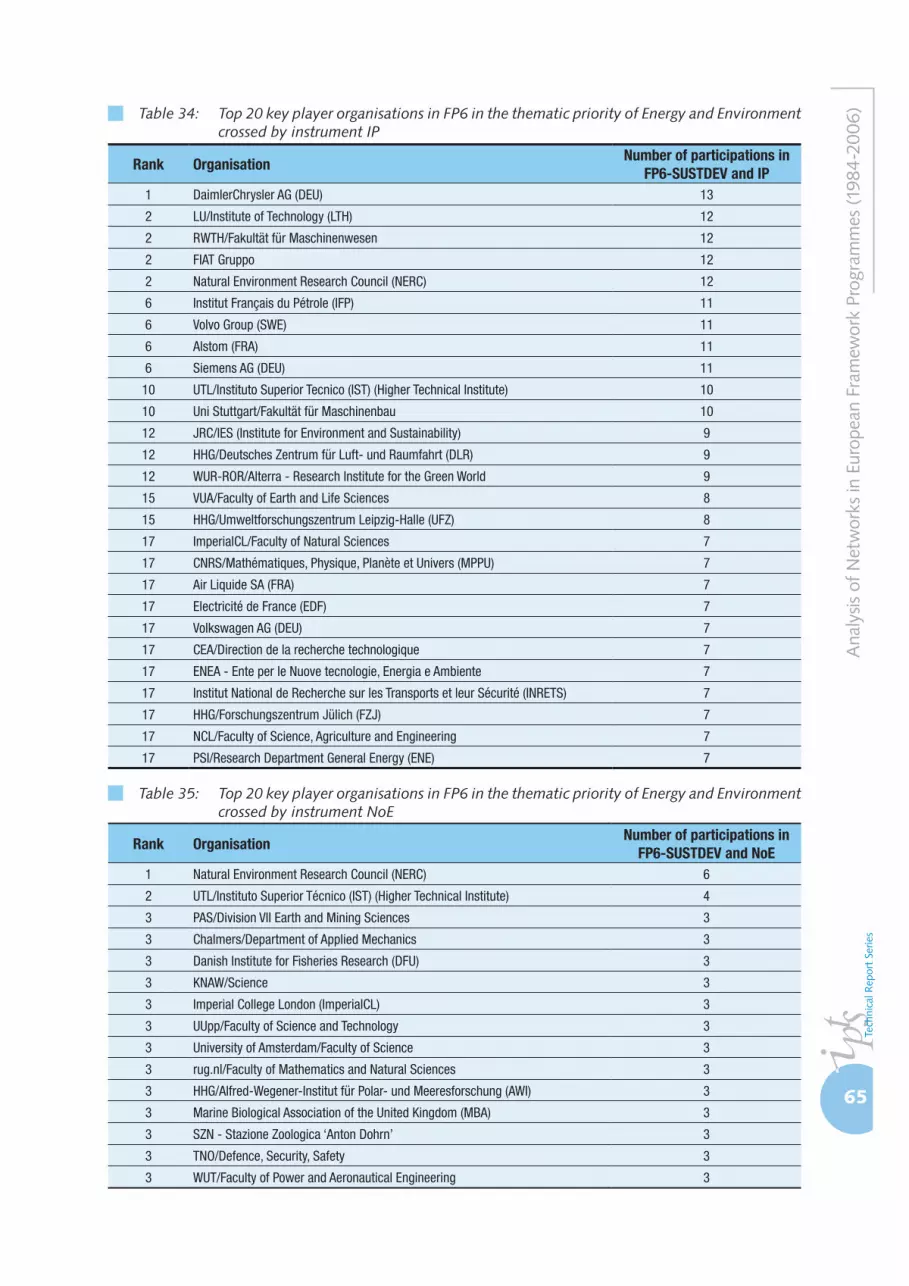
65
Ana
lysis
of N
etw
orks
in E
urop
ean
Fram
ewor
k Pr
ogra
mm
es (1
984-
2006
)Table 34: Top 20 key player organisations in FP6 in the thematic priority of Energy and Environment crossed by instrument IP
Rank OrganisationNumber of participations in
FP6-SUSTDEV and IP1 DaimlerChrysler AG (DEU) 13
2 LU/Institute of Technology (LTH) 12
2 RWTH/Fakultät für Maschinenwesen 12
2 FIAT Gruppo 12
2 Natural Environment Research Council (NERC) 12
6 Institut Français du Pétrole (IFP) 11
6 Volvo Group (SWE) 11
6 Alstom (FRA) 11
6 Siemens AG (DEU) 11
10 UTL/Instituto Superior Tecnico (IST) (Higher Technical Institute) 10
10 Uni Stuttgart/Fakultät für Maschinenbau 10
12 JRC/IES (Institute for Environment and Sustainability) 9
12 HHG/Deutsches Zentrum für Luft- und Raumfahrt (DLR) 9
12 WUR-ROR/Alterra - Research Institute for the Green World 9
15 VUA/Faculty of Earth and Life Sciences 8
15 HHG/Umweltforschungszentrum Leipzig-Halle (UFZ) 8
17 ImperialCL/Faculty of Natural Sciences 7
17 CNRS/Mathématiques, Physique, Planète et Univers (MPPU) 7
17 Air Liquide SA (FRA) 7
17 Electricité de France (EDF) 7
17 Volkswagen AG (DEU) 7
17 CEA/Direction de la recherche technologique 7
17 ENEA - Ente per le Nuove tecnologie, Energia e Ambiente 7
17 Institut National de Recherche sur les Transports et leur Sécurité (INRETS) 7
17 HHG/Forschungszentrum Jülich (FZJ) 7
17 NCL/Faculty of Science, Agriculture and Engineering 7
17 PSI/Research Department General Energy (ENE) 7
Table 35: Top 20 key player organisations in FP6 in the thematic priority of Energy and Environment crossed by instrument NoE
Rank OrganisationNumber of participations in
FP6-SUSTDEV and NoE1 Natural Environment Research Council (NERC) 6
2 UTL/Instituto Superior Técnico (IST) (Higher Technical Institute) 4
3 PAS/Division VII Earth and Mining Sciences 3
3 Chalmers/Department of Applied Mechanics 3
3 Danish Institute for Fisheries Research (DFU) 3
3 KNAW/Science 3
3 Imperial College London (ImperialCL) 3
3 UUpp/Faculty of Science and Technology 3
3 University of Amsterdam/Faculty of Science 3
3 rug.nl/Faculty of Mathematics and Natural Sciences 3
3 HHG/Alfred-Wegener-Institut für Polar- und Meeresforschung (AWI) 3
3 Marine Biological Association of the United Kingdom (MBA) 3
3 SZN - Stazione Zoologica ‘Anton Dohrn’ 3
3 TNO/Defence, Security, Safety 3
3 WUT/Faculty of Power and Aeronautical Engineering 3
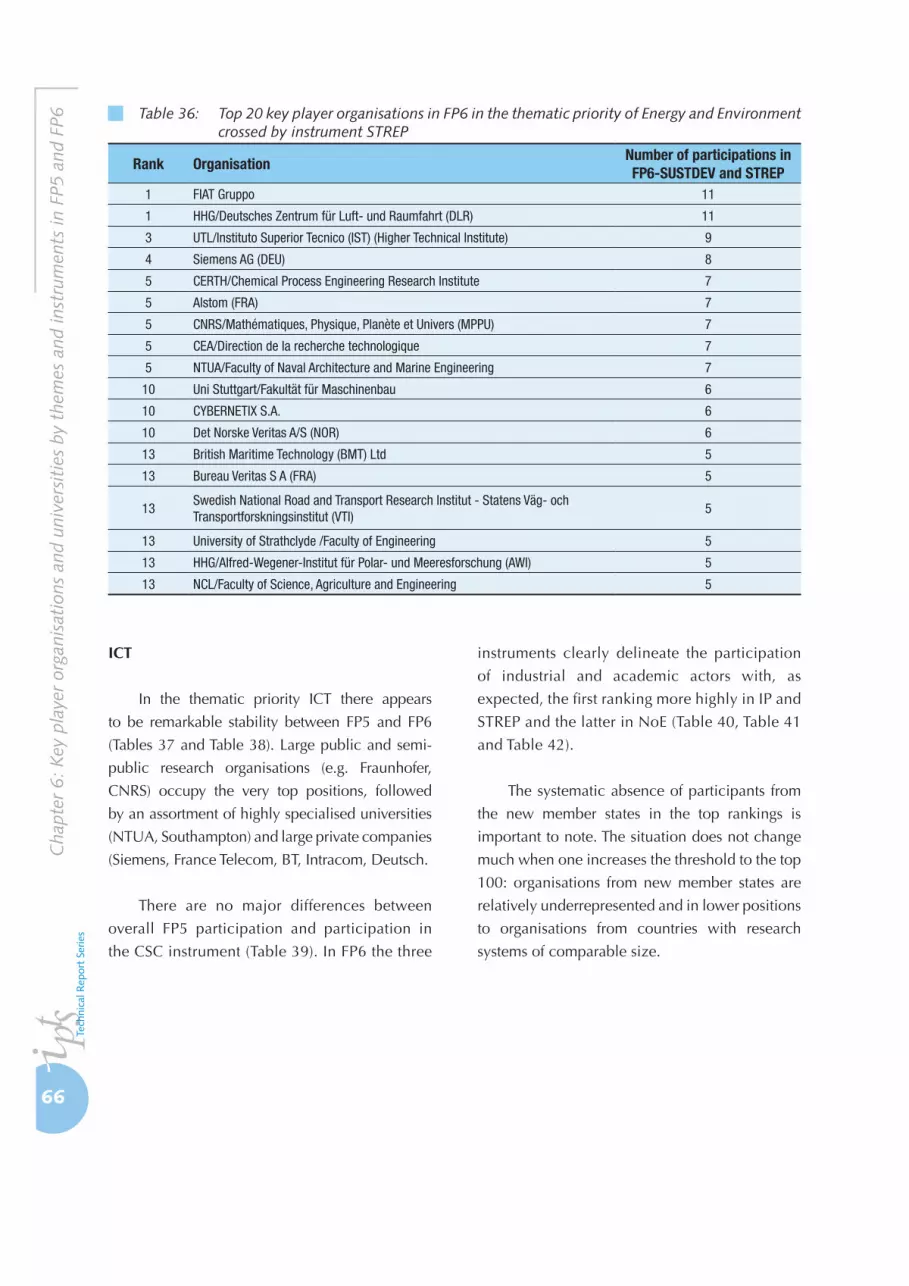
66
Cha
pter
6: K
ey p
laye
r or
gani
sati
ons
and
univ
ersi
ties
by
them
es a
nd in
stru
men
ts in
FP5
and
FP6 Table 36: Top 20 key player organisations in FP6 in the thematic priority of Energy and Environment
crossed by instrument STREP
Rank OrganisationNumber of participations in FP6-SUSTDEV and STREP
1 FIAT Gruppo 11
1 HHG/Deutsches Zentrum für Luft- und Raumfahrt (DLR) 11
3 UTL/Instituto Superior Tecnico (IST) (Higher Technical Institute) 9
4 Siemens AG (DEU) 8
5 CERTH/Chemical Process Engineering Research Institute 7
5 Alstom (FRA) 7
5 CNRS/Mathématiques, Physique, Planète et Univers (MPPU) 7
5 CEA/Direction de la recherche technologique 7
5 NTUA/Faculty of Naval Architecture and Marine Engineering 7
10 Uni Stuttgart/Fakultät für Maschinenbau 6
10 CYBERNETIX S.A. 6
10 Det Norske Veritas A/S (NOR) 6
13 British Maritime Technology (BMT) Ltd 5
13 Bureau Veritas S A (FRA) 5
13Swedish National Road and Transport Research Institut - Statens Väg- och Transportforskningsinstitut (VTI)
5
13 University of Strathclyde /Faculty of Engineering 5
13 HHG/Alfred-Wegener-Institut für Polar- und Meeresforschung (AWI) 5
13 NCL/Faculty of Science, Agriculture and Engineering 5
ICT
In the thematic priority ICT there appears
to be remarkable stability between FP5 and FP6
(Tables 37 and Table 38). Large public and semi-
public research organisations (e.g. Fraunhofer,
CNRS) occupy the very top positions, followed
by an assortment of highly specialised universities
(NTUA, Southampton) and large private companies
(Siemens, France Telecom, BT, Intracom, Deutsch.
There are no major differences between
overall FP5 participation and participation in
the CSC instrument (Table 39). In FP6 the three
instruments clearly delineate the participation
of industrial and academic actors with, as
expected, the first ranking more highly in IP and
STREP and the latter in NoE (Table 40, Table 41
and Table 42).
The systematic absence of participants from
the new member states in the top rankings is
important to note. The situation does not change
much when one increases the threshold to the top
100: organisations from new member states are
relatively underrepresented and in lower positions
to organisations from countries with research
systems of comparable size.

67
Ana
lysis
of N
etw
orks
in E
urop
ean
Fram
ewor
k Pr
ogra
mm
es (1
984-
2006
)Table 37: Top 20 key player organisations in FP5 in the thematic priority of ICT
Rank OrganisationNumber of participations in
FP5 IST1 CNRS/Mathématiques, Physique, Planète et Univers (MPPU) 147
2 Thales Group (FRA) 97
3 Siemens AG (DEU) 78
4 INRIA/Unité de Recherche Rocquencourt 62
5 France Telecom (FRA) 60
6 Intracom SA 59
7 Philips NV (NLD) 58
8 CEA/Direction de la recherche technologique 57
9 NTUA/Faculty of Electrical and Computer Engineering 55
10 Telecom Italia SPA (ITA) 53
10 FIAT Gruppo 53
12 Infineon Technologies AG (DEU) 47
13 EADS European Aeronautic Defence and Space Company (FRA) 44
13 Soton University/Faculty of Engineering, Science and Mathematics 44
15 British Telecom PLC (BT) (GBR) 43
16 Telefonica de Espana SA 42
17 KUL/Faculty of Engineering 40
18 DaimlerChrysler AG (DEU) 39
18 Deutsche Telekom AG 39
20 Atos Origin (ESP) 38
20 CSIC/Ciencias Y Tecnologia Fisicas 38
Table 38: Top 20 key player organisations in FP6 in the thematic priority of ICT
Rank OrganisationNumber of participations in
FP6-IST1 Fraunhofer-Gesellschaft zur Förderung der angewandten Forschung e.V. 100
2 Thales Group (FRA) 75
3 Telefonica de Espana SA 68
4 CNRS/Mathématiques, Physique, Planète et Univers (MPPU) 64
5 Siemens AG (DEU) 61
6 FRANCE TELECOM (FRA) 60
7 CEA/Direction de la recherche technologique 52
8 INRIA/Unite de Recherche Rocquencourt 49
9 NTUA/Faculty of Electrical and Computer Engineering 46
10 Philips NV (NLD) 43
11 FIAT Gruppo 41
12 Telecom Italia SPA (ITA) 37
13 Consiglio Nazionale delle Ricerche (CNR) 36
14 Alcatel-Lucent (FRA) 35
15 Atos Origin (ESP) 33
16 SAP AG 32
17 CNRS/Sciences du vivant (SDV) 30
17 EPFL/School of Engineering (STI) 30
19 IMEC/Microsystems, Components & Packaging (MCP) 29
20 Royal Institute of Technology - Kungliga Tekniska Högskolan(KTH) 26

68
Cha
pter
6: K
ey p
laye
r or
gani
sati
ons
and
univ
ersi
ties
by
them
es a
nd in
stru
men
ts in
FP5
and
FP6 Table 39: Top 20 key player organisations in FP5 in the thematic priority ICT crossed by the CSC
instrument
Rank OrganisationNumber of participations in
FP5 IST and CSC1 CNRS/Mathématiques, Physique, Planète et Univers (MPPU) 105
2 Thales Group (FRA) 73
3 Siemens AG (DEU) 56
4 France Telecom (FRA) 53
5 Intracom SA 49
6 INRIA/Unité de Recherche Rocquencourt 44
7 NTUA/Faculty of Electrical and Computer Engineering 43
7 Telecom Italia SPA (ITA) 43
9 CEA/Direction de la recherche technologique 40
9 Philips NV (NLD) 40
11 FIAT Gruppo 38
12 SotonU/Faculty of Engineering, Science and Mathematics 35
12 Deutsche Telekom AG 35
14 Atos Origin (ESP) 32
15 Telefonica de Espana SA 31
15 EADS European Aeronautic Defence and Space Company (FRA) 31
15 Nokia Corporation (FIN) 31
18 British Telecom PLC (BT) (GBR) 29
19 EPFL/School of Engineering (STI) 28
19 DaimlerChrysler AG (DEU) 28
Table 40: Top 20 key player organisations in FP6 in the thematic priority of ICT crossed by instrument IP
Rank OrganisationNumber of participations in
FP6-IST and IP1 Telefonica de Espana SA 33
2 Fraunhofer-Gesellschaft zur Förderung der angewandten Forschung e.V. 31
3 Siemens AG (DEU) 29
4 Thales Group (FRA) 27
5 France Telecom (FRA) 26
6 Telecom Italia SPA (ITA) 20
7 CNRS/Mathématiques, Physique, Planète et Univers (MPPU) 18
7 Philips NV (NLD) 18
9 SAP AG 17
9 FIAT Gruppo 17
9 NTUA/Faculty of Electrical and Computer Engineering 17
12 INRIA/Unité de Recherche Rocquencourt 16
12 British Telecom PLC (BT) (GBR) 16
14 Alcatel-Lucent (FRA) 15
15 CEA/Direction de la recherche technologique 13
16 Deutsches Forschungszentrum für Künstliche Intelligenz GmbH 12
16 Nokia Corporation (FIN) 12
16 DaimlerChrysler AG (DEU) 12
19 Microsoft Corporation (DEU) 11
19 Consiglio Nazionale delle Ricerche (CNR) 11
19 Deutsche Telekom AG 11
19 EPFL/School of Engineering (STI) 11
19 Motorola INC (FRA) 11
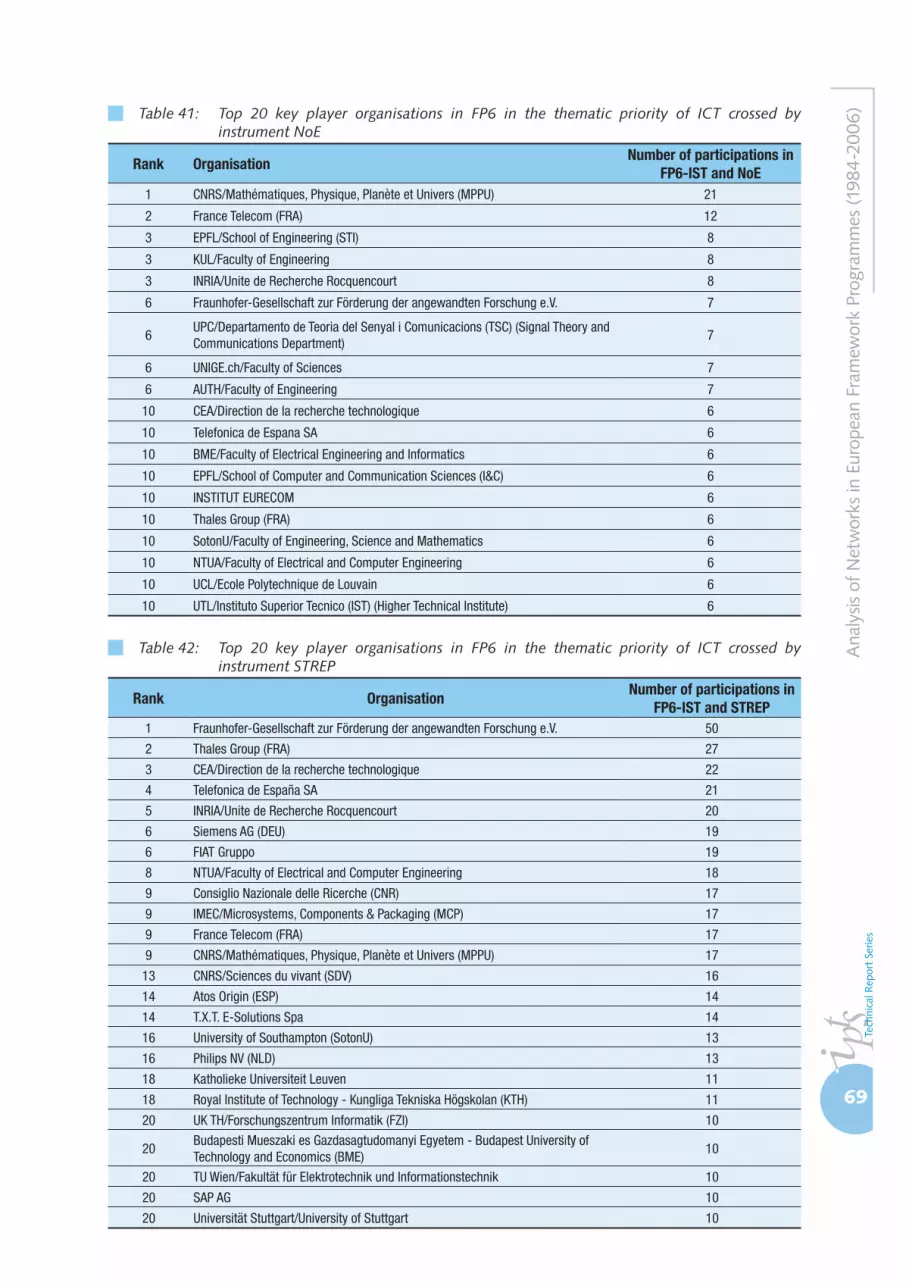
69
Ana
lysis
of N
etw
orks
in E
urop
ean
Fram
ewor
k Pr
ogra
mm
es (1
984-
2006
)Table 41: Top 20 key player organisations in FP6 in the thematic priority of ICT crossed by instrument NoE
Rank OrganisationNumber of participations in
FP6-IST and NoE 1 CNRS/Mathématiques, Physique, Planète et Univers (MPPU) 21
2 France Telecom (FRA) 12
3 EPFL/School of Engineering (STI) 8
3 KUL/Faculty of Engineering 8
3 INRIA/Unite de Recherche Rocquencourt 8
6 Fraunhofer-Gesellschaft zur Förderung der angewandten Forschung e.V. 7
6UPC/Departamento de Teoria del Senyal i Comunicacions (TSC) (Signal Theory and Communications Department)
7
6 UNIGE.ch/Faculty of Sciences 7
6 AUTH/Faculty of Engineering 7
10 CEA/Direction de la recherche technologique 6
10 Telefonica de Espana SA 6
10 BME/Faculty of Electrical Engineering and Informatics 6
10 EPFL/School of Computer and Communication Sciences (I&C) 6
10 INSTITUT EURECOM 6
10 Thales Group (FRA) 6
10 SotonU/Faculty of Engineering, Science and Mathematics 6
10 NTUA/Faculty of Electrical and Computer Engineering 6
10 UCL/Ecole Polytechnique de Louvain 6
10 UTL/Instituto Superior Tecnico (IST) (Higher Technical Institute) 6
Table 42: Top 20 key player organisations in FP6 in the thematic priority of ICT crossed by instrument STREP
Rank OrganisationNumber of participations in
FP6-IST and STREP1 Fraunhofer-Gesellschaft zur Förderung der angewandten Forschung e.V. 50
2 Thales Group (FRA) 27
3 CEA/Direction de la recherche technologique 22
4 Telefonica de España SA 21
5 INRIA/Unite de Recherche Rocquencourt 20
6 Siemens AG (DEU) 19
6 FIAT Gruppo 19
8 NTUA/Faculty of Electrical and Computer Engineering 18
9 Consiglio Nazionale delle Ricerche (CNR) 17
9 IMEC/Microsystems, Components & Packaging (MCP) 17
9 France Telecom (FRA) 17
9 CNRS/Mathématiques, Physique, Planète et Univers (MPPU) 17
13 CNRS/Sciences du vivant (SDV) 16
14 Atos Origin (ESP) 14
14 T.X.T. E-Solutions Spa 14
16 University of Southampton (SotonU) 13
16 Philips NV (NLD) 13
18 Katholieke Universiteit Leuven 11
18 Royal Institute of Technology - Kungliga Tekniska Högskolan (KTH) 11
20 UK TH/Forschungszentrum Informatik (FZI) 10
20Budapesti Mueszaki es Gazdasagtudomanyi Egyetem - Budapest University of Technology and Economics (BME)
10
20 TU Wien/Fakultät für Elektrotechnik und Informationstechnik 10
20 SAP AG 10
20 Universität Stuttgart/University of Stuttgart 10
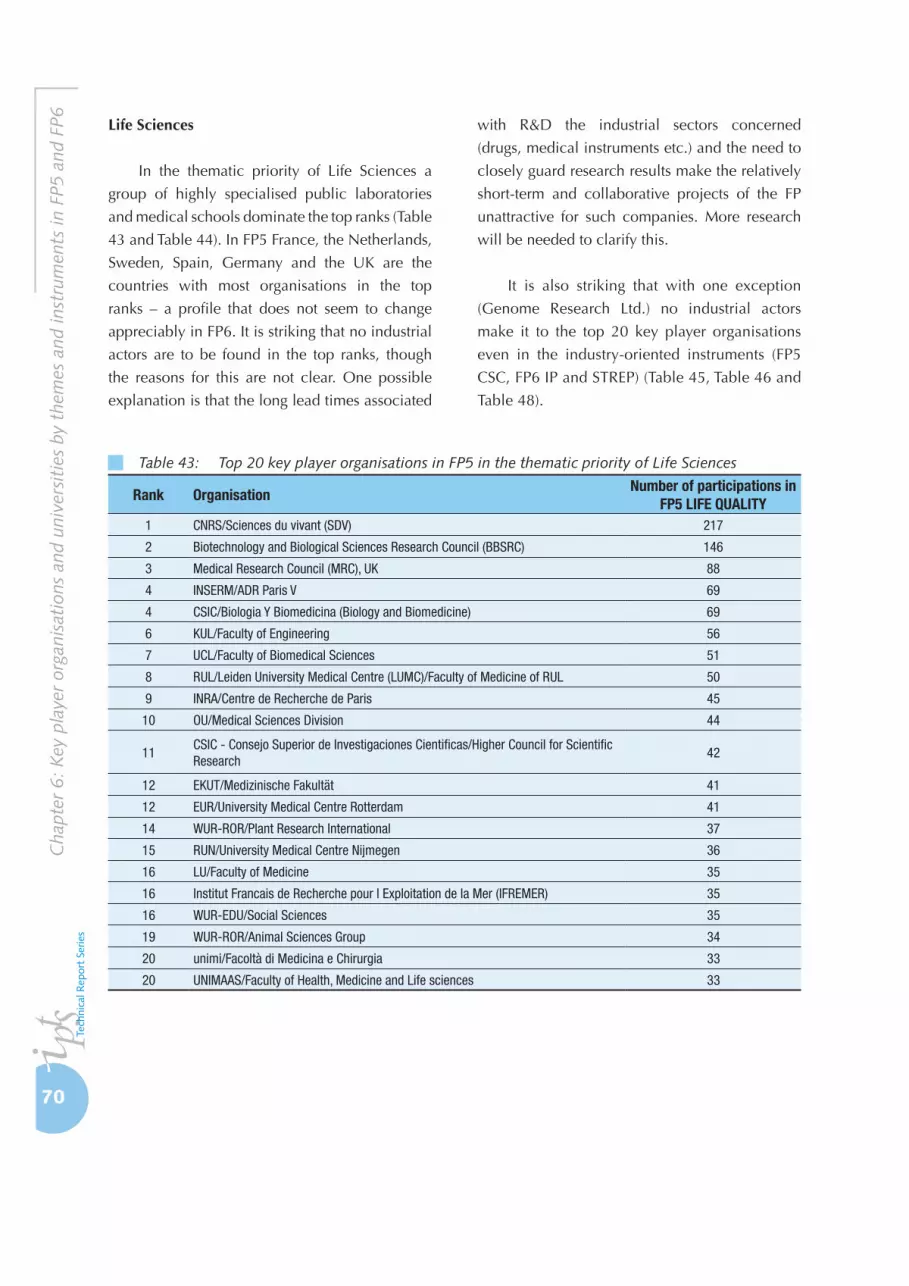
70
Cha
pter
6: K
ey p
laye
r or
gani
sati
ons
and
univ
ersi
ties
by
them
es a
nd in
stru
men
ts in
FP5
and
FP6 Life Sciences
In the thematic priority of Life Sciences a
group of highly specialised public laboratories
and medical schools dominate the top ranks (Table
43 and Table 44). In FP5 France, the Netherlands,
Sweden, Spain, Germany and the UK are the
countries with most organisations in the top
ranks – a profile that does not seem to change
appreciably in FP6. It is striking that no industrial
actors are to be found in the top ranks, though
the reasons for this are not clear. One possible
explanation is that the long lead times associated
with R&D the industrial sectors concerned
(drugs, medical instruments etc.) and the need to
closely guard research results make the relatively
short-term and collaborative projects of the FP
unattractive for such companies. More research
will be needed to clarify this.
It is also striking that with one exception
(Genome Research Ltd.) no industrial actors
make it to the top 20 key player organisations
even in the industry-oriented instruments (FP5
CSC, FP6 IP and STREP) (Table 45, Table 46 and
Table 48).
Table 43: Top 20 key player organisations in FP5 in the thematic priority of Life Sciences
Rank OrganisationNumber of participations in
FP5 LIFE QUALITY1 CNRS/Sciences du vivant (SDV) 217
2 Biotechnology and Biological Sciences Research Council (BBSRC) 146
3 Medical Research Council (MRC), UK 88
4 INSERM/ADR Paris V 69
4 CSIC/Biologia Y Biomedicina (Biology and Biomedicine) 69
6 KUL/Faculty of Engineering 56
7 UCL/Faculty of Biomedical Sciences 51
8 RUL/Leiden University Medical Centre (LUMC)/Faculty of Medicine of RUL 50
9 INRA/Centre de Recherche de Paris 45
10 OU/Medical Sciences Division 44
11CSIC - Consejo Superior de Investigaciones Cientificas/Higher Council for Scientific Research
42
12 EKUT/Medizinische Fakultät 41
12 EUR/University Medical Centre Rotterdam 41
14 WUR-ROR/Plant Research International 37
15 RUN/University Medical Centre Nijmegen 36
16 LU/Faculty of Medicine 35
16 Institut Francais de Recherche pour l Exploitation de la Mer (IFREMER) 35
16 WUR-EDU/Social Sciences 35
19 WUR-ROR/Animal Sciences Group 34
20 unimi/Facoltà di Medicina e Chirurgia 33
20 UNIMAAS/Faculty of Health, Medicine and Life sciences 33
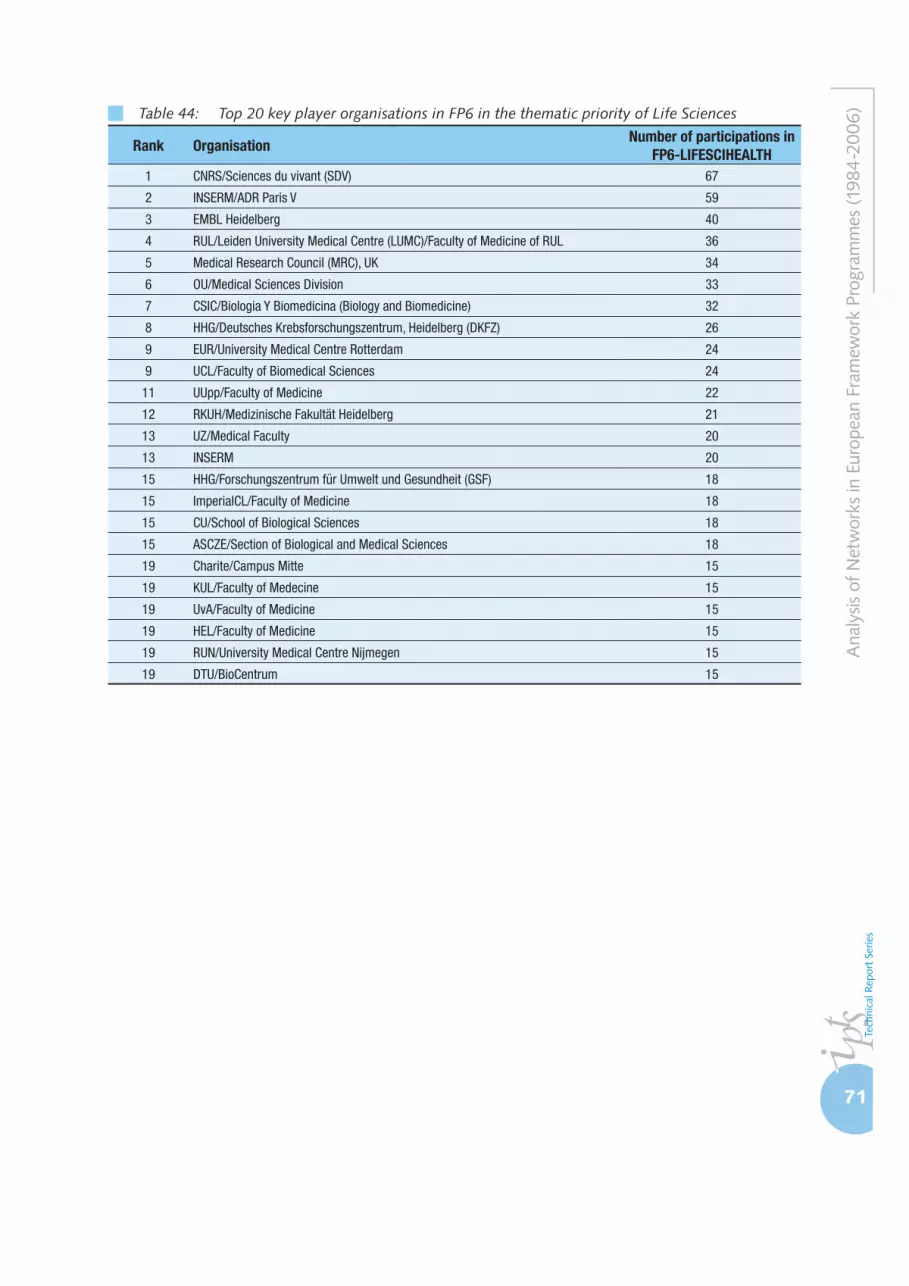
71
Ana
lysis
of N
etw
orks
in E
urop
ean
Fram
ewor
k Pr
ogra
mm
es (1
984-
2006
)Table 44: Top 20 key player organisations in FP6 in the thematic priority of Life Sciences
Rank OrganisationNumber of participations in
FP6-LIFESCIHEALTH1 CNRS/Sciences du vivant (SDV) 67
2 INSERM/ADR Paris V 59
3 EMBL Heidelberg 40
4 RUL/Leiden University Medical Centre (LUMC)/Faculty of Medicine of RUL 36
5 Medical Research Council (MRC), UK 34
6 OU/Medical Sciences Division 33
7 CSIC/Biologia Y Biomedicina (Biology and Biomedicine) 32
8 HHG/Deutsches Krebsforschungszentrum, Heidelberg (DKFZ) 26
9 EUR/University Medical Centre Rotterdam 24
9 UCL/Faculty of Biomedical Sciences 24
11 UUpp/Faculty of Medicine 22
12 RKUH/Medizinische Fakultät Heidelberg 21
13 UZ/Medical Faculty 20
13 INSERM 20
15 HHG/Forschungszentrum für Umwelt und Gesundheit (GSF) 18
15 ImperialCL/Faculty of Medicine 18
15 CU/School of Biological Sciences 18
15 ASCZE/Section of Biological and Medical Sciences 18
19 Charite/Campus Mitte 15
19 KUL/Faculty of Medecine 15
19 UvA/Faculty of Medicine 15
19 HEL/Faculty of Medicine 15
19 RUN/University Medical Centre Nijmegen 15
19 DTU/BioCentrum 15
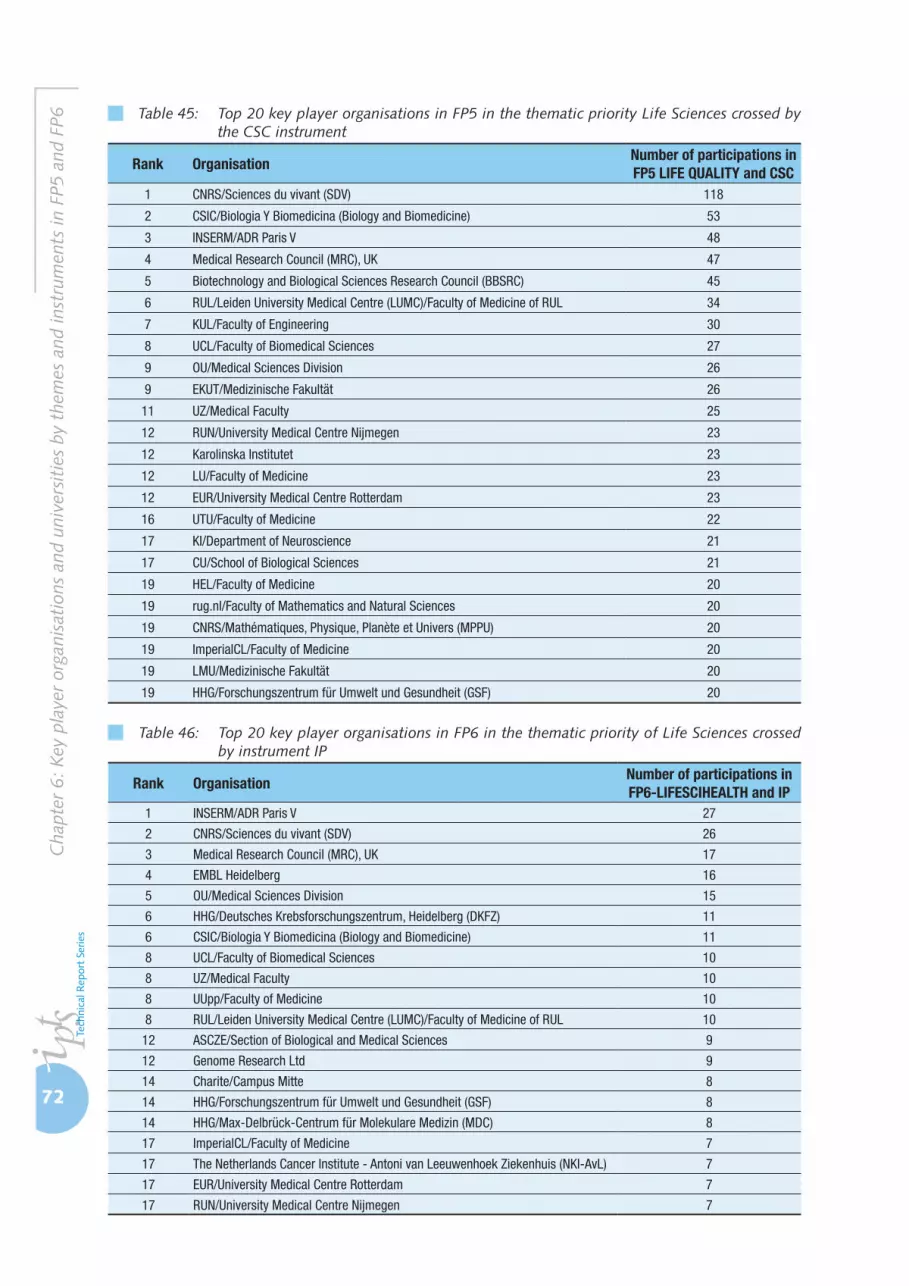
72
Cha
pter
6: K
ey p
laye
r or
gani
sati
ons
and
univ
ersi
ties
by
them
es a
nd in
stru
men
ts in
FP5
and
FP6 Table 45: Top 20 key player organisations in FP5 in the thematic priority Life Sciences crossed by
the CSC instrument
Rank OrganisationNumber of participations in FP5 LIFE QUALITY and CSC
1 CNRS/Sciences du vivant (SDV) 118
2 CSIC/Biologia Y Biomedicina (Biology and Biomedicine) 53
3 INSERM/ADR Paris V 48
4 Medical Research Council (MRC), UK 47
5 Biotechnology and Biological Sciences Research Council (BBSRC) 45
6 RUL/Leiden University Medical Centre (LUMC)/Faculty of Medicine of RUL 34
7 KUL/Faculty of Engineering 30
8 UCL/Faculty of Biomedical Sciences 27
9 OU/Medical Sciences Division 26
9 EKUT/Medizinische Fakultät 26
11 UZ/Medical Faculty 25
12 RUN/University Medical Centre Nijmegen 23
12 Karolinska Institutet 23
12 LU/Faculty of Medicine 23
12 EUR/University Medical Centre Rotterdam 23
16 UTU/Faculty of Medicine 22
17 KI/Department of Neuroscience 21
17 CU/School of Biological Sciences 21
19 HEL/Faculty of Medicine 20
19 rug.nl/Faculty of Mathematics and Natural Sciences 20
19 CNRS/Mathématiques, Physique, Planète et Univers (MPPU) 20
19 ImperialCL/Faculty of Medicine 20
19 LMU/Medizinische Fakultät 20
19 HHG/Forschungszentrum für Umwelt und Gesundheit (GSF) 20
Table 46: Top 20 key player organisations in FP6 in the thematic priority of Life Sciences crossed by instrument IP
Rank OrganisationNumber of participations in FP6-LIFESCIHEALTH and IP
1 INSERM/ADR Paris V 27
2 CNRS/Sciences du vivant (SDV) 26
3 Medical Research Council (MRC), UK 17
4 EMBL Heidelberg 16
5 OU/Medical Sciences Division 15
6 HHG/Deutsches Krebsforschungszentrum, Heidelberg (DKFZ) 11
6 CSIC/Biologia Y Biomedicina (Biology and Biomedicine) 11
8 UCL/Faculty of Biomedical Sciences 10
8 UZ/Medical Faculty 10
8 UUpp/Faculty of Medicine 10
8 RUL/Leiden University Medical Centre (LUMC)/Faculty of Medicine of RUL 10
12 ASCZE/Section of Biological and Medical Sciences 9
12 Genome Research Ltd 9
14 Charite/Campus Mitte 8
14 HHG/Forschungszentrum für Umwelt und Gesundheit (GSF) 8
14 HHG/Max-Delbrück-Centrum für Molekulare Medizin (MDC) 8
17 ImperialCL/Faculty of Medicine 7
17 The Netherlands Cancer Institute - Antoni van Leeuwenhoek Ziekenhuis (NKI-AvL) 7
17 EUR/University Medical Centre Rotterdam 7
17 RUN/University Medical Centre Nijmegen 7
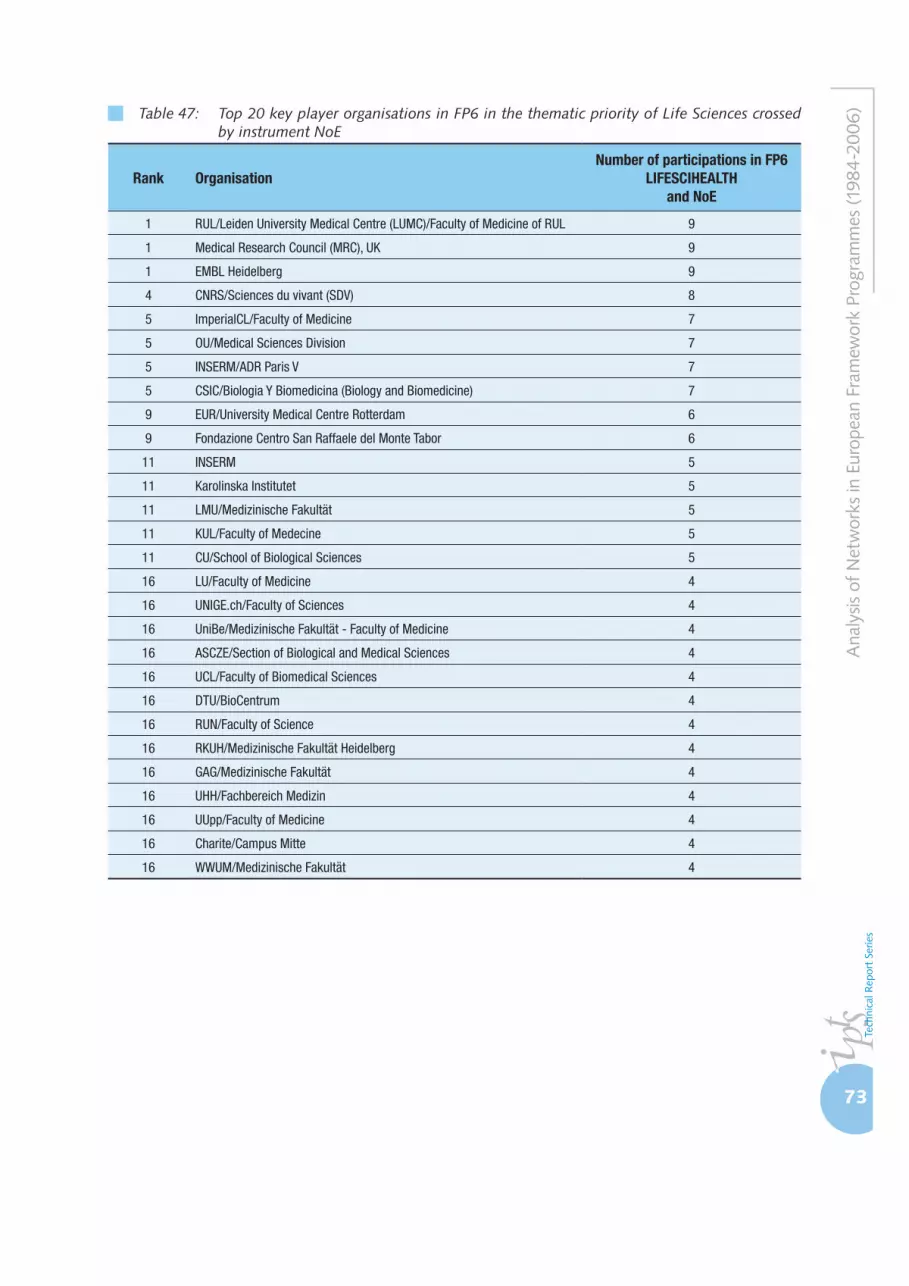
73
Ana
lysis
of N
etw
orks
in E
urop
ean
Fram
ewor
k Pr
ogra
mm
es (1
984-
2006
)Table 47: Top 20 key player organisations in FP6 in the thematic priority of Life Sciences crossed by instrument NoE
Rank OrganisationNumber of participations in FP6
LIFESCIHEALTHand NoE
1 RUL/Leiden University Medical Centre (LUMC)/Faculty of Medicine of RUL 9
1 Medical Research Council (MRC), UK 9
1 EMBL Heidelberg 9
4 CNRS/Sciences du vivant (SDV) 8
5 ImperialCL/Faculty of Medicine 7
5 OU/Medical Sciences Division 7
5 INSERM/ADR Paris V 7
5 CSIC/Biologia Y Biomedicina (Biology and Biomedicine) 7
9 EUR/University Medical Centre Rotterdam 6
9 Fondazione Centro San Raffaele del Monte Tabor 6
11 INSERM 5
11 Karolinska Institutet 5
11 LMU/Medizinische Fakultät 5
11 KUL/Faculty of Medecine 5
11 CU/School of Biological Sciences 5
16 LU/Faculty of Medicine 4
16 UNIGE.ch/Faculty of Sciences 4
16 UniBe/Medizinische Fakultät - Faculty of Medicine 4
16 ASCZE/Section of Biological and Medical Sciences 4
16 UCL/Faculty of Biomedical Sciences 4
16 DTU/BioCentrum 4
16 RUN/Faculty of Science 4
16 RKUH/Medizinische Fakultät Heidelberg 4
16 GAG/Medizinische Fakultät 4
16 UHH/Fachbereich Medizin 4
16 UUpp/Faculty of Medicine 4
16 Charite/Campus Mitte 4
16 WWUM/Medizinische Fakultät 4

74
Cha
pter
6: K
ey p
laye
r or
gani
sati
ons
and
univ
ersi
ties
by
them
es a
nd in
stru
men
ts in
FP5
and
FP6
From these analyses, we can draw some
general conclusions. First, in the theme of
Aerospace, firms from a small group of countries
are dominant players. Universities from several
countries participate in the theme, presumably
ones possessing sector-specific capabilities.
Second, the theme of Energy and Environment
is in direct contrast to Aerospace dominated by
public organisations, with industrial actors only
represented in the top 20 for the IP instrument.
This is the only theme where organisations from
the new member states are represented in the
top 20. Third, in the field of ICT industrial and
academic actors are equally represented in
the top 20, coming mainly from older member
states. Fourth, in the theme of Life sciences,
we observe the complete absence of industrial
actors in the top 20, with public organisations
and universities being the only participants.
6.2 Key universities by themes and instruments in FP6
Universities are recognised as major players in
the development of the European Research Area,
because of their mission that comprises nowadays
three main roles: training the new generations,
producing codified and embodied knowledge,
and diffusing knowledge throughout the economy
and society. As demonstrated before, universities
are at the core of the networks built by the FPs
through time, increasing their centrality and share
of participation. Large and small, generic and
specialised universities are all involved in the FPs.
Figure 19 provides a summative view of the
’top of the top’: that is the top 20 universities in
terms of their overall frequency of participation,
restricted for universities appearing in the top ranks
in the four themes in the FP6. These universities
are from ten European countries with diverse
size and research intensity. The United Kingdom
Table 48: Top 20 key player organisations in FP6 in the thematic priority of Life Sciences crossed by instrument STREP
Rank OrganisationNumber of participations in FP6-
LIFESCIHEALTH and STREP1 CNRS/Sciences du vivant (SDV) 25
2 INSERM/ADR Paris V 20
3 EMBL Heidelberg 14
4 RUL/Leiden University Medical Centre (LUMC)/Faculty of Medicine of RUL 12
5 CSIC/Biologia Y Biomedicina (Biology and Biomedicine) 11
6 INSERM 10
6 HHG/Deutsches Krebsforschungszentrum, Heidelberg (DKFZ) 10
8 HEL/Faculty of Medicine 9
9 OU/Medical Sciences Division 7
9 HHG/Forschungszentrum für Umwelt und Gesundheit (GSF) 7
9 rug.nl/Faculty of Medical Sciences 7
9 RKUH/Medizinische Fakultät Heidelberg 7
13 UZ/Medical Faculty 6
13 INSERM/ADR Paris VI 6
13 EUR/University Medical Centre Rotterdam 6
13 DTU/BioCentrum 6
13 UCL/Faculty of Biomedical Sciences 6
18 ALUF/Fakultät für Medizin 5
18 RUN/Faculty of Science 5
18 Federation Nationale des Centres de Lutte Contre le Cancer (FNLCC) 5
18 Fondazione Telethon 5
18 UUpp/Faculty of Medicine 5
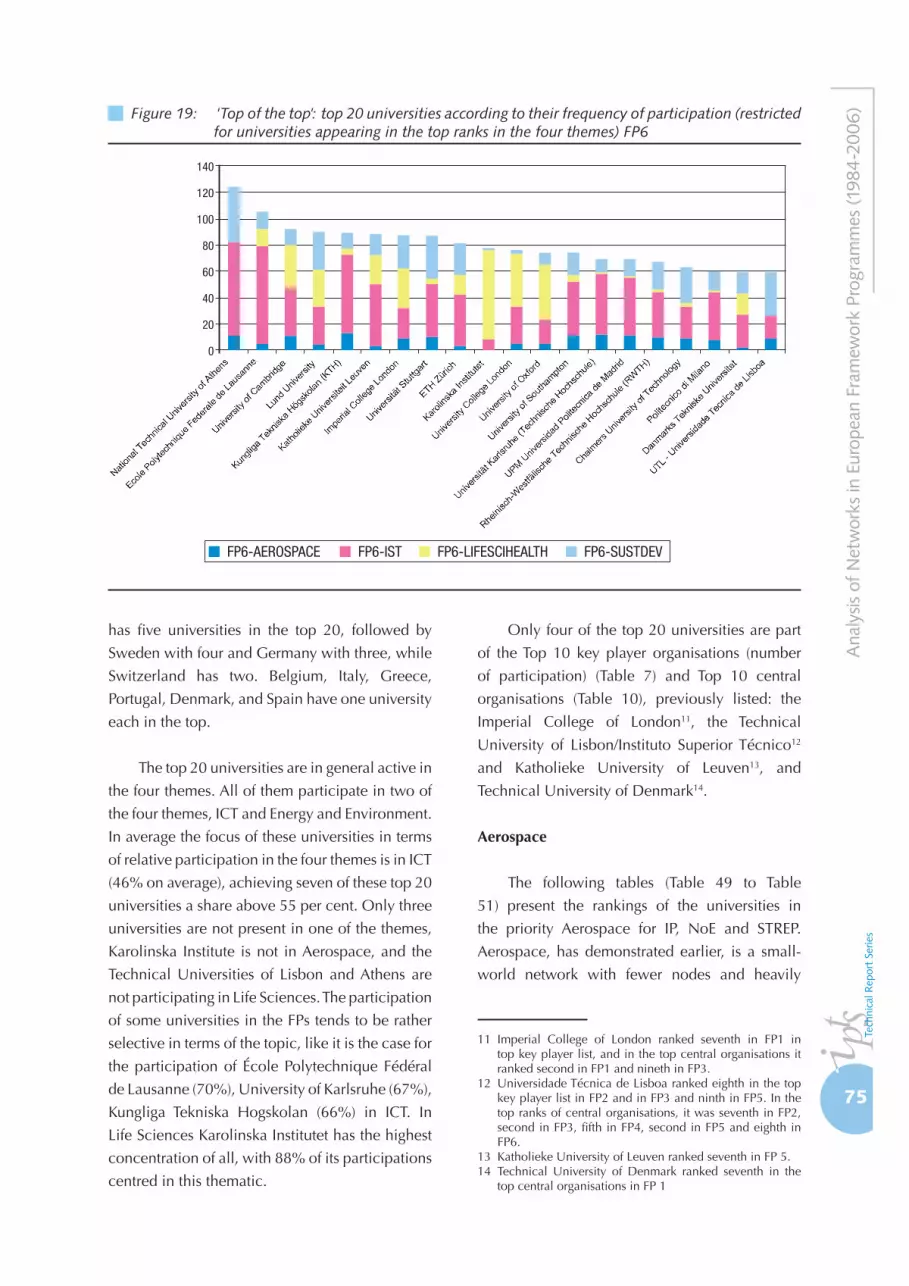
75
Ana
lysis
of N
etw
orks
in E
urop
ean
Fram
ewor
k Pr
ogra
mm
es (1
984-
2006
)
has five universities in the top 20, followed by
Sweden with four and Germany with three, while
Switzerland has two. Belgium, Italy, Greece,
Portugal, Denmark, and Spain have one university
each in the top.
The top 20 universities are in general active in
the four themes. All of them participate in two of
the four themes, ICT and Energy and Environment.
In average the focus of these universities in terms
of relative participation in the four themes is in ICT
(46% on average), achieving seven of these top 20
universities a share above 55 per cent. Only three
universities are not present in one of the themes,
Karolinska Institute is not in Aerospace, and the
Technical Universities of Lisbon and Athens are
not participating in Life Sciences. The participation
of some universities in the FPs tends to be rather
selective in terms of the topic, like it is the case for
the participation of École Polytechnique Fédéral
de Lausanne (70%), University of Karlsruhe (67%),
Kungliga Tekniska Hogskolan (66%) in ICT. In
Life Sciences Karolinska Institutet has the highest
concentration of all, with 88% of its participations
centred in this thematic.
Only four of the top 20 universities are part
of the Top 10 key player organisations (number
of participation) (Table 7) and Top 10 central
organisations (Table 10), previously listed: the
Imperial College of London11, the Technical
University of Lisbon/Instituto Superior Técnico12
and Katholieke University of Leuven13, and
Technical University of Denmark14.
Aerospace
The following tables (Table 49 to Table
51) present the rankings of the universities in
the priority Aerospace for IP, NoE and STREP.
Aerospace, has demonstrated earlier, is a small-
world network with fewer nodes and heavily
11 Imperial College of London ranked seventh in FP1 in top key player list, and in the top central organisations it ranked second in FP1 and nineth in FP3.
12 Universidade Técnica de Lisboa ranked eighth in the top key player list in FP2 and in FP3 and ninth in FP5. In the top ranks of central organisations, it was seventh in FP2, second in FP3, fifth in FP4, second in FP5 and eighth in FP6.
13 Katholieke University of Leuven ranked seventh in FP 5. 14 Technical University of Denmark ranked seventh in the
top central organisations in FP 1
Figure 19: ' Top of the top': top 20 universities according to their frequency of participation (restricted for universities appearing in the top ranks in the four themes) FP6

76
Cha
pter
6: K
ey p
laye
r or
gani
sati
ons
and
univ
ersi
ties
by
them
es a
nd in
stru
men
ts in
FP5
and
FP6 Table 49: Top universities in FP6 in Aerospace priority crossed by IP instrument
Rank UniversityNumber of participations in
FP6-AEROSPACE and IP1 Cranfield University (CranfieldU) 8
2 National Technical University of Athens (NTUA) 6
3 Royal Institute of Technology - Kungliga Tekniska Högskolan (KTH) 5
3 Universität Stuttgart/University of Stuttgart 5
3 University of Patras 5
6 University of Dublin - Trinity College (TCD) 4
6 University of Southampton (SotonU) 4
8 Technische Universität München/Technical University of Munich 3
8 Universität Karlsruhe (Technische Hochschule) /Karlsruhe University of Technology 3
8 University of Malta (MaltaU) 3
8 Imperial College London (ImperialCL) 3
8 Universitá degli Studi di Firenze, University of Florence 3
8 Technische Universität Darmstadt/Darmstadt University of Technology 3
8 Universität Bremen/University of Bremen 3
8 Delft University of Technology 3
8 Technische Universität Dresden/Dresden University of Technology 3
8 Chalmers University of Technology 3
Table 50: Top universities in FP6 in Aerospace priority crossed by NoE instrument
Rank UniversityNumber of participations in FP6-AEROSPACE and NoE
1 University of Sheffield (SheffU) 1
1 University of Patras 1
1 University of Oslo - Universitetet I Oslo 1
1 Universität Salzburg/University of Salzburg 1
1 Universität Karlsruhe (Technische Hochschule) /Karlsruhe University of Technology 1
1 Universitá di Roma “La Sapienza”, University of Rome “La Sapienza” 1
1 Universitá degli Studi della Basilicata, University of Basilicata 1
1Technische Universität Bergakademie Freiberg/Freiberg University of Mining and Technology
1
1 Technical University of Denmark - Danmarks Tekniske Universitet (DTU) 1
1 National Technical University of Athens (NTUA) 1
1 National and Kapodistrian University of Athens (UOA) 1
1 Manchester Metropolitan University (MMU) 1
1 Linköping University (LIU) 1
1 King’s College London (KCL), (UOL) 1
1 Bergische Universität - Gesamthochschule Wuppertal 1
connected between them, with stronger emphasis
in IP and STREP instruments. From the analysis
of actor’s position in the three rankings for each
instrument, some preliminary observations might
be made which need to be explored further.
Universities tend to participate heavily in one
of the three instruments. This is the case for the
University of Cambridge that participates mostly
in STREP ranked second, and both Universidad
Politécnica de Madrid (ranked 3rd in STREPs) and
RWTH Aachen University (ranked 4th in IP). If
there is a participation in two instruments that will
be a combination of IP and STREP. An example of
this is the Cranfield Institute, which ranks first in IP
and fourth in STREP. It is rare to have a university
participating in all three instruments, in fact only
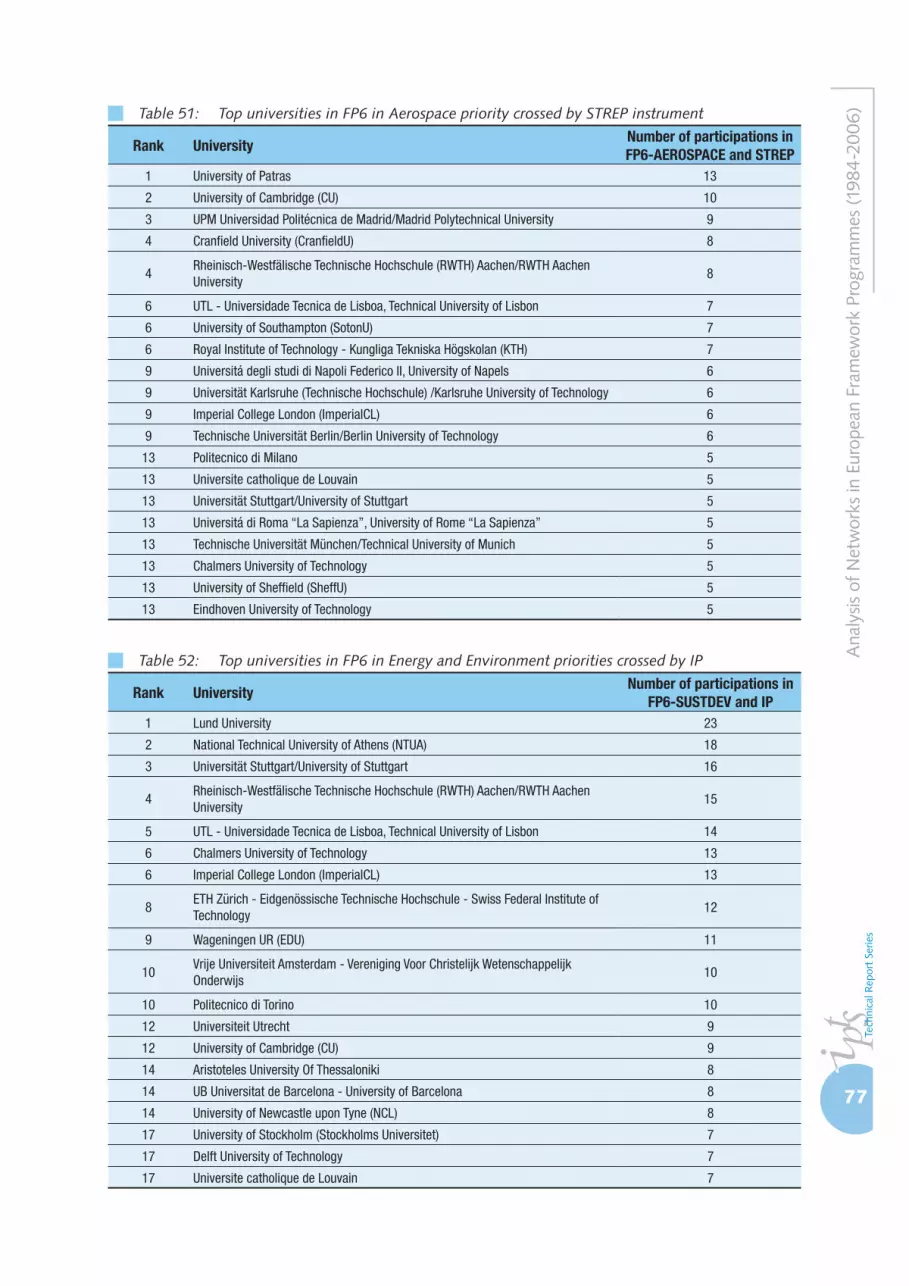
77
Ana
lysis
of N
etw
orks
in E
urop
ean
Fram
ewor
k Pr
ogra
mm
es (1
984-
2006
)Table 51: Top universities in FP6 in Aerospace priority crossed by STREP instrument
Rank UniversityNumber of participations in FP6-AEROSPACE and STREP
1 University of Patras 13
2 University of Cambridge (CU) 10
3 UPM Universidad Politécnica de Madrid/Madrid Polytechnical University 9
4 Cranfield University (CranfieldU) 8
4Rheinisch-Westfälische Technische Hochschule (RWTH) Aachen/RWTH Aachen University
8
6 UTL - Universidade Tecnica de Lisboa, Technical University of Lisbon 7
6 University of Southampton (SotonU) 7
6 Royal Institute of Technology - Kungliga Tekniska Högskolan (KTH) 7
9 Universitá degli studi di Napoli Federico II, University of Napels 6
9 Universität Karlsruhe (Technische Hochschule) /Karlsruhe University of Technology 6
9 Imperial College London (ImperialCL) 6
9 Technische Universität Berlin/Berlin University of Technology 6
13 Politecnico di Milano 5
13 Universite catholique de Louvain 5
13 Universität Stuttgart/University of Stuttgart 5
13 Universitá di Roma “La Sapienza”, University of Rome “La Sapienza” 5
13 Technische Universität München/Technical University of Munich 5
13 Chalmers University of Technology 5
13 University of Sheffield (SheffU) 5
13 Eindhoven University of Technology 5
Table 52: Top universities in FP6 in Energy and Environment priorities crossed by IP
Rank UniversityNumber of participations in
FP6-SUSTDEV and IP1 Lund University 23
2 National Technical University of Athens (NTUA) 18
3 Universität Stuttgart/University of Stuttgart 16
4Rheinisch-Westfälische Technische Hochschule (RWTH) Aachen/RWTH Aachen University
15
5 UTL - Universidade Tecnica de Lisboa, Technical University of Lisbon 14
6 Chalmers University of Technology 13
6 Imperial College London (ImperialCL) 13
8ETH Zürich - Eidgenössische Technische Hochschule - Swiss Federal Institute of Technology
12
9 Wageningen UR (EDU) 11
10Vrije Universiteit Amsterdam - Vereniging Voor Christelijk Wetenschappelijk Onderwijs
10
10 Politecnico di Torino 10
12 Universiteit Utrecht 9
12 University of Cambridge (CU) 9
14 Aristoteles University Of Thessaloniki 8
14 UB Universitat de Barcelona - University of Barcelona 8
14 University of Newcastle upon Tyne (NCL) 8
17 University of Stockholm (Stockholms Universitet) 7
17 Delft University of Technology 7
17 Universite catholique de Louvain 7

78
Cha
pter
6: K
ey p
laye
r or
gani
sati
ons
and
univ
ersi
ties
by
them
es a
nd in
stru
men
ts in
FP5
and
FP6
Table 54: Top universities in FP6 in Energy and Environment priorities crossed by STREP instrument
Rank UniversityNumber of participations in FP6-SUSTDEV and STREP
1 National Technical University of Athens (NTUA) 15
2 Universität Stuttgart/University of Stuttgart 12
3 UTL - Universidade Tecnica de Lisboa, Technical University of Lisbon 9
4 Chalmers University of Technology 8
5 Aristoteles University Of Thessaloniki 7
5 Technische Universität Berlin/Berlin University of Technology 7
5 Politecnico di Milano 7
8 Technical University of Denmark - Danmarks Tekniske Universitet (DTU) 6
8 Katholieke Universiteit Leuven 6
8Norwegian University of Science and Technology - Norges Teknisk-Naturvitenskapelige Universitet (NTNU)
6
8 Delft University of Technology 6
8 University of Strathclyde (StrathU) 6
13 Technische Universität Wien/ Technical University Vienna (TU Wien) 5
13 University of Newcastle upon Tyne (NCL) 5
13Ecole Polytechnique Federale de Lausanne - EPFL - Swiss Federal Institute of Technology, Lausanne
5
13Budapesti Mueszaki es Gazdasagtudomanyi Egyetem - Budapest University of Technology and Economics (BME)
5
13 Imperial College London (ImperialCL) 5
13 Alborg Universitet 5
13 Warsaw University of Technology / Politechnika Warszawska 5
Table 53: Top universities in FP6 in Energy and Environment priorities crossed by NoE
Rank UniversityNumber of participations in
FP6-SUSTDEV and NoE1 University of Southampton (SotonU) 5
1 Imperial College London (ImperialCL) 5
3 UTL - Universidade Tecnica de Lisboa, Technical University of Lisbon 4
3 Warsaw University of Technology / Politechnika Warszawska 4
3 Chalmers University of Technology 4
6Royal Netherlands Academy of Arts & Sciences - Koninklijke Nederlandse Akademie van Wetenschappen - KNAW
3
6 Universiteit van Amsterdam 3
6 Rijksuniversiteit Groningen 3
6 National Technical University of Athens (NTUA) 3
6 Universitá di Roma “La Sapienza”, University of Rome “La Sapienza” 3
6 Politecnico di Milano 3
6 University of Birmingham (BirmU) 3
6 UPM Universidad Politécnica de Madrid/Madrid Polytechnical University 3
6 University of Göteborg 3
6 University of Uppsala 3
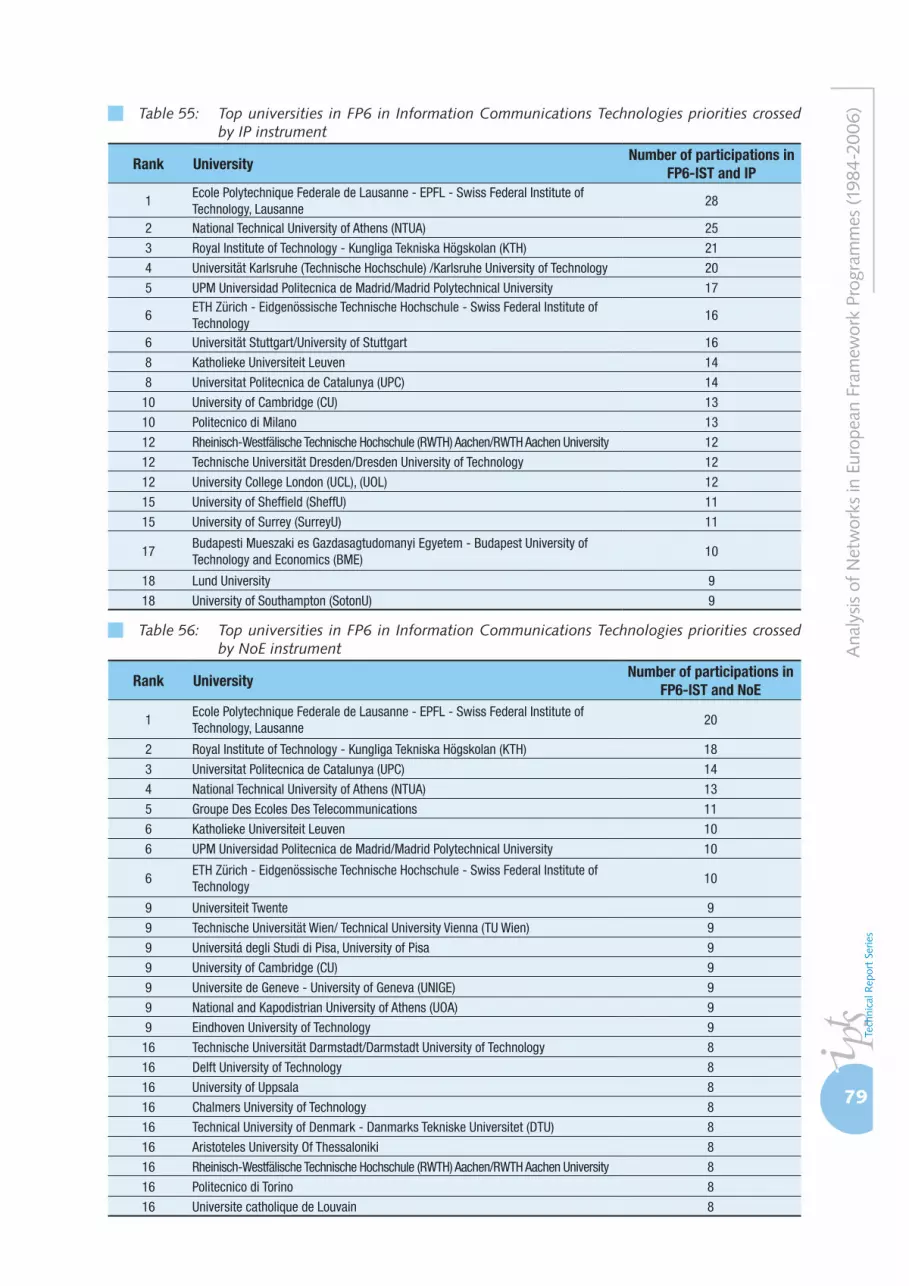
79
Ana
lysis
of N
etw
orks
in E
urop
ean
Fram
ewor
k Pr
ogra
mm
es (1
984-
2006
)Table 55: Top universities in FP6 in Information Communications Technologies priorities crossed by IP instrument
Rank UniversityNumber of participations in
FP6-IST and IP
1Ecole Polytechnique Federale de Lausanne - EPFL - Swiss Federal Institute of Technology, Lausanne
28
2 National Technical University of Athens (NTUA) 25
3 Royal Institute of Technology - Kungliga Tekniska Högskolan (KTH) 21
4 Universität Karlsruhe (Technische Hochschule) /Karlsruhe University of Technology 20
5 UPM Universidad Politecnica de Madrid/Madrid Polytechnical University 17
6ETH Zürich - Eidgenössische Technische Hochschule - Swiss Federal Institute of Technology
16
6 Universität Stuttgart/University of Stuttgart 16
8 Katholieke Universiteit Leuven 14
8 Universitat Politecnica de Catalunya (UPC) 14
10 University of Cambridge (CU) 13
10 Politecnico di Milano 13
12 Rheinisch-Westfälische Technische Hochschule (RWTH) Aachen/RWTH Aachen University 12
12 Technische Universität Dresden/Dresden University of Technology 12
12 University College London (UCL), (UOL) 12
15 University of Sheffield (SheffU) 11
15 University of Surrey (SurreyU) 11
17Budapesti Mueszaki es Gazdasagtudomanyi Egyetem - Budapest University of Technology and Economics (BME)
10
18 Lund University 9
18 University of Southampton (SotonU) 9
Table 56: Top universities in FP6 in Information Communications Technologies priorities crossed by NoE instrument
Rank UniversityNumber of participations in
FP6-IST and NoE
1Ecole Polytechnique Federale de Lausanne - EPFL - Swiss Federal Institute of Technology, Lausanne
20
2 Royal Institute of Technology - Kungliga Tekniska Högskolan (KTH) 18
3 Universitat Politecnica de Catalunya (UPC) 14
4 National Technical University of Athens (NTUA) 13
5 Groupe Des Ecoles Des Telecommunications 11
6 Katholieke Universiteit Leuven 10
6 UPM Universidad Politecnica de Madrid/Madrid Polytechnical University 10
6ETH Zürich - Eidgenössische Technische Hochschule - Swiss Federal Institute of Technology
10
9 Universiteit Twente 9
9 Technische Universität Wien/ Technical University Vienna (TU Wien) 9
9 Universitá degli Studi di Pisa, University of Pisa 9
9 University of Cambridge (CU) 9
9 Universite de Geneve - University of Geneva (UNIGE) 9
9 National and Kapodistrian University of Athens (UOA) 9
9 Eindhoven University of Technology 9
16 Technische Universität Darmstadt/Darmstadt University of Technology 8
16 Delft University of Technology 8
16 University of Uppsala 8
16 Chalmers University of Technology 8
16 Technical University of Denmark - Danmarks Tekniske Universitet (DTU) 8
16 Aristoteles University Of Thessaloniki 8
16 Rheinisch-Westfälische Technische Hochschule (RWTH) Aachen/RWTH Aachen University 8
16 Politecnico di Torino 8
16 Universite catholique de Louvain 8
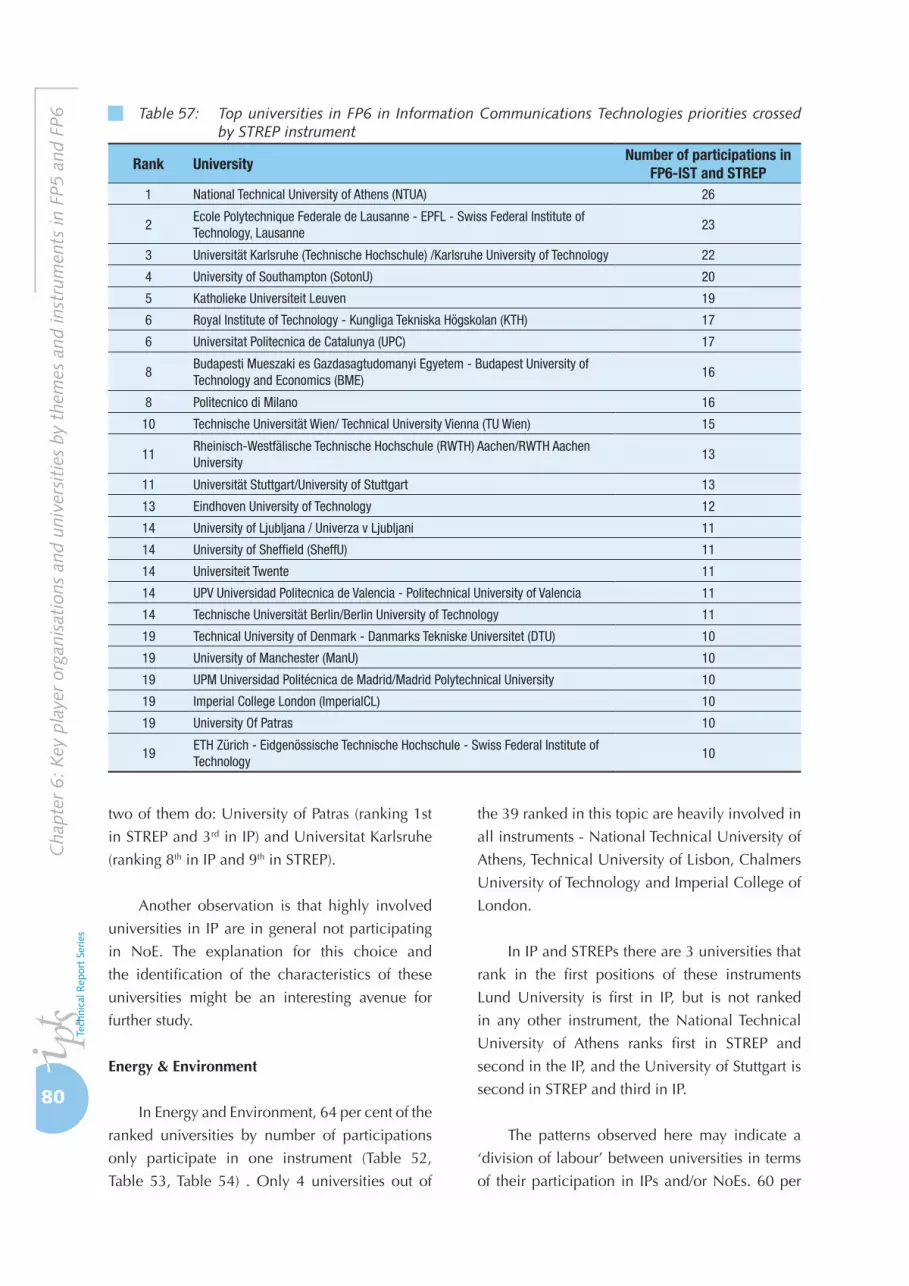
80
Cha
pter
6: K
ey p
laye
r or
gani
sati
ons
and
univ
ersi
ties
by
them
es a
nd in
stru
men
ts in
FP5
and
FP6
two of them do: University of Patras (ranking 1st
in STREP and 3rd in IP) and Universitat Karlsruhe
(ranking 8th in IP and 9th in STREP).
Another observation is that highly involved
universities in IP are in general not participating
in NoE. The explanation for this choice and
the identification of the characteristics of these
universities might be an interesting avenue for
further study.
Energy & Environment
In Energy and Environment, 64 per cent of the
ranked universities by number of participations
only participate in one instrument (Table 52,
Table 53, Table 54) . Only 4 universities out of
the 39 ranked in this topic are heavily involved in
all instruments - National Technical University of
Athens, Technical University of Lisbon, Chalmers
University of Technology and Imperial College of
London.
In IP and STREPs there are 3 universities that
rank in the first positions of these instruments
Lund University is first in IP, but is not ranked
in any other instrument, the National Technical
University of Athens ranks first in STREP and
second in the IP, and the University of Stuttgart is
second in STREP and third in IP.
The patterns observed here may indicate a
‘division of labour’ between universities in terms
of their participation in IPs and/or NoEs. 60 per
Table 57: Top universities in FP6 in Information Communications Technologies priorities crossed by STREP instrument
Rank UniversityNumber of participations in
FP6-IST and STREP1 National Technical University of Athens (NTUA) 26
2Ecole Polytechnique Federale de Lausanne - EPFL - Swiss Federal Institute of Technology, Lausanne
23
3 Universität Karlsruhe (Technische Hochschule) /Karlsruhe University of Technology 22
4 University of Southampton (SotonU) 20
5 Katholieke Universiteit Leuven 19
6 Royal Institute of Technology - Kungliga Tekniska Högskolan (KTH) 17
6 Universitat Politecnica de Catalunya (UPC) 17
8Budapesti Mueszaki es Gazdasagtudomanyi Egyetem - Budapest University of Technology and Economics (BME)
16
8 Politecnico di Milano 16
10 Technische Universität Wien/ Technical University Vienna (TU Wien) 15
11Rheinisch-Westfälische Technische Hochschule (RWTH) Aachen/RWTH Aachen University
13
11 Universität Stuttgart/University of Stuttgart 13
13 Eindhoven University of Technology 12
14 University of Ljubljana / Univerza v Ljubljani 11
14 University of Sheffield (SheffU) 11
14 Universiteit Twente 11
14 UPV Universidad Politecnica de Valencia - Politechnical University of Valencia 11
14 Technische Universität Berlin/Berlin University of Technology 11
19 Technical University of Denmark - Danmarks Tekniske Universitet (DTU) 10
19 University of Manchester (ManU) 10
19 UPM Universidad Politécnica de Madrid/Madrid Polytechnical University 10
19 Imperial College London (ImperialCL) 10
19 University Of Patras 10
19ETH Zürich - Eidgenössische Technische Hochschule - Swiss Federal Institute of Technology
10

81
Ana
lysis
of N
etw
orks
in E
urop
ean
Fram
ewor
k Pr
ogra
mm
es (1
984-
2006
)Table 58: Top universities in FP6 in Life Sciences priorities crossed by IP instrument
Rank UniversityNumber of participations in FP6-LIFESCIHEALTH and IP
1 Karolinska Institutet 28
2 University College London (UCL), (UOL) 19
3 University of Oxford (OU) 18
4 University of Cambridge (CU) 14
5 Universitá degli Studi di Milano, University of Milan 12
5 Imperial College London (ImperialCL) 12
5 University of Uppsala 12
8 Universität Zürich - University of Zürich (UZ) 11
8 Universiteit Leiden /Leiden University 11
8 King’s College London (KCL), (UOL) 11
11 Katholieke Universiteit Leuven 10
11 Ludwig-Maximilians-Universität München 10
11 Lund University 10
11 Radboud Universiteit Nijmegen 10
15 Johann Wolfgang Goethe-Universität Frankfurt am Main 9
15 Ruprecht-Karls-Universität Heidelberg 9
17 Eberhard Karls Universität Tübingen/Eberhard Karls University of Tübingen 8
17 University of Manchester (ManU) 8
17Ecole Polytechnique Federale de Lausanne - EPFL - Swiss Federal Institute of Technology, Lausanne
8
17 University of Arhus - Arhus Universitet (AU) 8
17 Universiteit van Amsterdam 8
17 Charite - Universitätsmedizin Berlin 8
17 St George’s Hospital Medical School (SGHMS), (UOL) 8
17 Erasmus Universiteit Rotterdam 8
cent of the ranked universities in the NoE are not
involved in any of the other two instruments.
ICT
ICT was the first theme for which a collaborative
research funding mode was developed at the European
level (ESPRIT I). Probably because of this long standing
collaborative effort key players are more involved in
the three instruments compared to the other themes,
some of which have done so successively over time
as previously demonstrated. Moreover in this theme,
universities that are highly involved in IP tend to
be highly involved in NoE as well, in contrast to
Aeronautics and Energy and Environment themes.
In Energy and Environment there are four
universities participating in the three instruments,
in ICT this level of participation is achieved by
eight universities (Table 55, Table 56,Table 57). The
universities highly ranked in the three instruments
are Ecole Polytechnique Fédéral de Lausanne,
ranked first in IP and in NoE, and second in
STREP, National Technical University of Athens
first in STREP and second in IP and fourth in NoE,
and Kungliga Tekmiska Hogskolan second in the
NoE and third in IP and sixth in STREP.
To summarise, the following general
observations can be made. The ranks of the top
universities differ by themes. In Life Sciences and
ICT, maybe because of a large basic research base,
the same universities are represented equally in
the top ranks of the three instruments. On the
contrary, Aerospace and Energy and Environment,
more applied research fields, universities that
participate in NoE tend not to be involved in IP
and STREP.
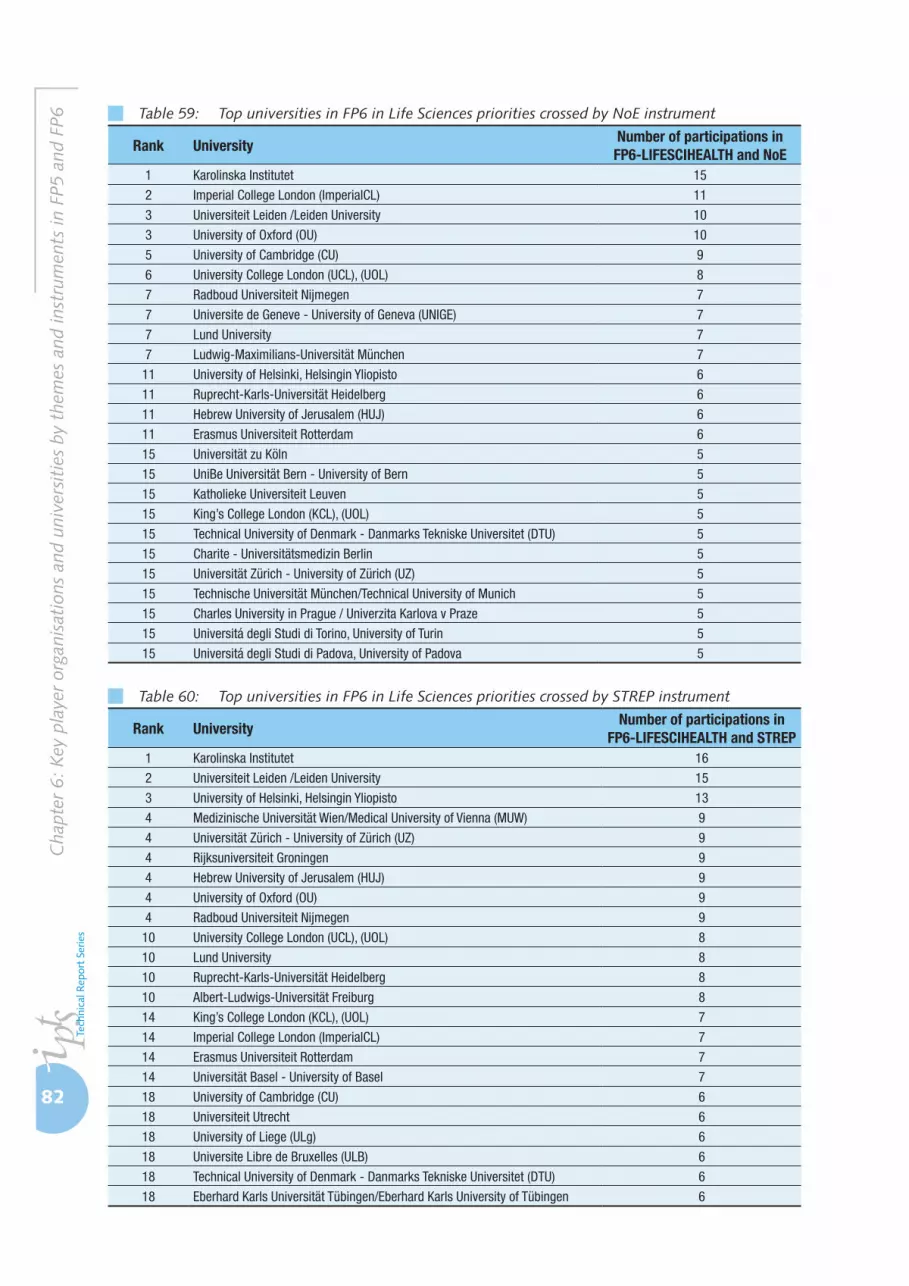
82
Cha
pter
6: K
ey p
laye
r or
gani
sati
ons
and
univ
ersi
ties
by
them
es a
nd in
stru
men
ts in
FP5
and
FP6 Table 59: Top universities in FP6 in Life Sciences priorities crossed by NoE instrument
Rank UniversityNumber of participations in FP6-LIFESCIHEALTH and NoE
1 Karolinska Institutet 15
2 Imperial College London (ImperialCL) 11
3 Universiteit Leiden /Leiden University 10
3 University of Oxford (OU) 10
5 University of Cambridge (CU) 9
6 University College London (UCL), (UOL) 8
7 Radboud Universiteit Nijmegen 7
7 Universite de Geneve - University of Geneva (UNIGE) 7
7 Lund University 7
7 Ludwig-Maximilians-Universität München 7
11 University of Helsinki, Helsingin Yliopisto 6
11 Ruprecht-Karls-Universität Heidelberg 6
11 Hebrew University of Jerusalem (HUJ) 6
11 Erasmus Universiteit Rotterdam 6
15 Universität zu Köln 5
15 UniBe Universität Bern - University of Bern 5
15 Katholieke Universiteit Leuven 5
15 King’s College London (KCL), (UOL) 5
15 Technical University of Denmark - Danmarks Tekniske Universitet (DTU) 5
15 Charite - Universitätsmedizin Berlin 5
15 Universität Zürich - University of Zürich (UZ) 5
15 Technische Universität München/Technical University of Munich 5
15 Charles University in Prague / Univerzita Karlova v Praze 5
15 Universitá degli Studi di Torino, University of Turin 5
15 Universitá degli Studi di Padova, University of Padova 5
Table 60: Top universities in FP6 in Life Sciences priorities crossed by STREP instrument
Rank UniversityNumber of participations in
FP6-LIFESCIHEALTH and STREP1 Karolinska Institutet 16
2 Universiteit Leiden /Leiden University 15
3 University of Helsinki, Helsingin Yliopisto 13
4 Medizinische Universität Wien/Medical University of Vienna (MUW) 9
4 Universität Zürich - University of Zürich (UZ) 9
4 Rijksuniversiteit Groningen 9
4 Hebrew University of Jerusalem (HUJ) 9
4 University of Oxford (OU) 9
4 Radboud Universiteit Nijmegen 9
10 University College London (UCL), (UOL) 8
10 Lund University 8
10 Ruprecht-Karls-Universität Heidelberg 8
10 Albert-Ludwigs-Universität Freiburg 8
14 King’s College London (KCL), (UOL) 7
14 Imperial College London (ImperialCL) 7
14 Erasmus Universiteit Rotterdam 7
14 Universität Basel - University of Basel 7
18 University of Cambridge (CU) 6
18 Universiteit Utrecht 6
18 University of Liege (ULg) 6
18 Universite Libre de Bruxelles (ULB) 6
18 Technical University of Denmark - Danmarks Tekniske Universitet (DTU) 6
18 Eberhard Karls Universität Tübingen/Eberhard Karls University of Tübingen 6

83
Ana
lysis
of N
etw
orks
in E
urop
ean
Fram
ewor
k Pr
ogra
mm
es (1
984-
2006
)
Chapter 7: Future research directions
7.1 Introduction
The focus of the current study has been the
analysis of networks emerging within the European
Research Area (ERA) as captured by joint R&D
projects funded within the FPs. The objective was
to produce various kinds of network analyses
focussed on FP network properties (network
metrics), on participating institutions (actor
metrics), disaggregated by different thematic
priorities and types of instruments.
However, there remains much space for further
empirical analyses and theoretical explorations.
In light of the analyses in this project as well as of
the relevant empirical and theoretical literature,
we focus on four main blocks of potential future
research directions:
• Theinvestigationoftheprogresstowards
ERA is an important research area,
both from a scientific as well as from
a European policy perspective. Various
kinds of empirical analyses of European
R&D networks could yield valuable
insights for policy.
• The exploration of the impact of
R&D networks on the economic
performance and innovative behaviour
of organisations, regions and countries
will be one of the key challenges of the
empirical research on innovation and
networks in the near future.
• Theempiricalliteraturethatinvestigates
the relationship between function,
structure and governance of R&D
networks is still in an unsatisfactory stage
of development and some extensions
could be envisaged.
• Further investigation and modelling of
the dynamic evolution of R&D networks
are strongly needed to improve our
understanding of the processes and
mechanisms on such networks.
7.2 ERA monitoring using the spatial dimension of R&D networks
The ERA has become a key reference for
research policy in Europe. Endorsed at the
European Council in Lisbon 2000, ERA is intended
to implement an integrated European market
for research, where researchers, technology and
knowledge can diffuse freely. This requires an
effective European-level coordination of national
and regional research activities, programmes and
policies, as well as the implementation of initiatives
funded at the European level. The EU FPs are
explicitly designed to support the creation of ERA
and its funding has been substantially increased
with the current 7th Framework Programme.
However, as noted in the ERA Green Paper
2007, there is still much further to go to build
ERA, particularly to overcome the fragmentation
of research activities, programmes and policies
across Europe. In this context, it is essential to
constantly monitor progress towards the ERA. Thus,
one of the potential future research directions may
focus on enriching and complementing on-going
work on the monitoring progress towards ERA by
using indicators of networking at various levels of
aggregation and analysing them using a variety of
methodological tools.
Analysing European integration in research
Autant-Bernard et al. (2007) argue that
the geographical analysis of European R&D
networks may provide important insight into
84
Cha
pter
7: F
utur
e re
sear
ch d
irec
tion
s
the progress towards an integrated European
research area. Scherngell and Barber (2009)
follow this approach and focus on cross-
region R&D collaborations as captured by
joint FP5 projects by modelling the influence
of geographical space – while controlling for
economic, technological and cultural effects – on
the variation of cross-region R&D collaborations
within a spatial interaction modelling framework.
The approach of Scherngell and Barber (2009)
may be used for a deeper analysis of various
R&D networks at different points in time and in
different thematic fields, and provide important
additional empirical insight into the progress
towards ERA.
In addition, European integration in research
could be assessed using statistical measures of
spatial dependence for R&D variables (for some
preliminary results see Pontikakis and Azagra-
Caro, 2009), including those derived from the
analysis of networks in the FPs.
Analysing science-industry collaborations in
ERA
As noted in the ERA Green Paper 2007,
bringing together the scientific communities
and companies is one of the key challenges.
Thus, research on (spatial) patterns of science
industry interactions is crucial, for instance
concerning the question of how far different
companies/universities look for collaborators
in R&D. Empirical analyses that put emphasis
on science-industry interaction may widen
our understanding on these issues. Various
descriptive analyses of science-industry relations
in Europe by using different indicators, such as
joint FP projects, disaggregated by different
thematic fields and at different points in time
(for a preliminary analysis see Azagra-Caro et
al., 2009) can be envisaged. On the other hand,
various social network analysis techniques
and different econometric approaches, such
as discrete choice models or, again, spatial
interactions models, can be used to characterize
such science-industry interactions.
Analysing R&D specialisation of actors, regions
and countries
The identification and distribution of thematic
priorities is another important issue regarding
the monitoring of ERA. There are various studies
that investigate R&D specialisation in Europe
using different indicators. However, thematic
specialisation using data on FP projects have not
been used for this purpose before now. The sysres
EUPRO database provides detailed information
on the thematic orientation of funded FP projects,
for instance by the assignment of subject indices.
Using these subject indices, we are able to provide
a rich picture of R&D specialisation across actors,
regions and countries in Europe (e.g. differentiation
of participation profiles of member states – across
FP instruments and thematic priorities – reflecting
national research strategies). Economic Geography
provides a rich toolset of spatial concentration
indices that may be used (see Combes, Mayer
and Thisse 2008 for an overview), including
concentration measures such as the Isard Index,
the Herfindahl Index or the Theil index, as well as
measures for spatial clustering such Moran`s I or
Geary`s C (see Anselin, 1995).
Analysing the transnational dimension of R&D
policy
More coherent implementation of national
and European research activities and closer
relations between the various organisations
of scientific and technological cooperation in
Europe is, as indicated by the ERA Green Paper
2007, a further step towards the key objectives in
ERA. The trans-national dimension of European
R&D activities can be analysed by expanding
the spatial interaction framework with variables
accounting for country borders between
organisations. Furthermore, variables that account
for the probability of cooperation between border
regions may be added to the model. Additional
qualitative (e.g. identification of thematic priorities
of joint projects) and quantitative analysis of
selected border regions can be useful to identify
networking behaviour between border regions.

85
Ana
lysis
of N
etw
orks
in E
urop
ean
Fram
ewor
k Pr
ogra
mm
es (1
984-
2006
)
Analysing the mobility of researchers within
ERA
Policies for human resources within ERA focus
to a large extent on the mobility of researchers.
Possible lines of analysis in this context involve
the investigation of Marie Curie Fellowships in
the sysres EUPRO database. However, additional
efforts in primary data collection, for instance in
the form of a representative survey that addresses
issues like incentives for researchers to move,
individual history of researchers’ mobility, etc.,
may be needed.
Identifying the main actors and institutional
backdrop of ERA
This issue has already been addressed at the
level of FP1-FP6 in this study. However, this line
of research can be expanded by identifying main
players in different thematic sub-programmes or
communities. The identification of main players
is based on a ranking of central players in the
European research landscape. One way is to
count the number of projects they participate
in. However, participating in many projects is
not sufficient for being a decisive player. Thus,
centrality should also be taken into account, a
measure of how well actors are connected.
Four different centrality measures come to
mind, accounting for local [Degree Centrality] and
global connectedness [Closeness Centrality], the
ability to control information flow in the network
[Betweenness Centrality] and the connectedness
to other central nodes [Eigenvector Centrality],
and combined into a composite centrality ranking
or a weighted centrality index. The latter merges
normalised values of different metric indicators
(i.e. centrality measures) to an aggregated index
by a linear-additive combination. Additionally,
connections may be made between funding
programmes and structurally determined sub-
networks.
Building on recent research into identification
of communities within networks, sub-networks
reflective of the interactions realised within
European R&D networks can be identified, and
their similarities and differences from policy-based
groupings can be investigated (see Fortunato and
Castellano, 2008).
Positioning of top research universities in
different thematic fields
Rankings of universities, though controversial,
have become increasingly popular (e.g. Academic
Ranking of World Universities, Leiden, Die
Zeit, Times) – and influential. Most of them
are focusing on accomplishments within the
scientific community, and comprise indicators
of established reputation and contemporaneous
academic performance. Policy makers are paying
increasing attention to the international standing of
European universities, but an appraisal of the role
of the FP in that regard is lacking. For instance, the
analysis of top research university participation to
FP6 by Henriques et al. (2009) could be extended
to previous FPs.
As regards industrial relevance of university
research, however, established rankings are often
less relevant. This problem could be tackled
by comparing some of the common university
rankings to rankings developed by analysing FP
networks (Nokkala et al., 2009). In an econometric
framework university rankings are validated against
the developed ranking of network embeddedness
in different thematic fields. Thus, we are able to
identify those sub-indicators of university rankings
delivering results that are more closely related with
centrality measures in the EU FPs. These results
would be relevant for the strategic orientation of
universities in the context of an increasing need for
third-party funding.
7.3 Impact of R&D networks
One of the fundamental questions raised by
the theoretical and empirical research concerns
the impact of R&D networks. This is an issue
taken up in the strategic management literature

86
Cha
pter
7: F
utur
e re
sear
ch d
irec
tion
s
(Gilsing et al. 2008; Ahuja 2000; Shan et al.
1994). Much of the work is relatively ad hoc
vis-à-vis the underlying theory of performance
and network position, and refers explicitly
to firms. On the theoretical side the existing
literature could be improved by providing better
underpinnings; on the empirical side different
types of actors (universities, research labs etc.)
could be introduced, for whom innovation is a
primary rather than an instrumental goal.
Up to now, there are only very few empirical
studies that have investigated the link between
R&D networks and economic output, innovative
performance and organisational behaviour.
Thus, this research direction aims to explore the
impact of R&D networks from both a micro- and
macroeconomic perspective, i.e. at the level of
organisations as well as regions and countries.
When talking about impact, we shift attention to
understanding the relationship of R&D networks
and innovative and economic performance. This
requires the definition of a suitable conceptual
and theoretical framework. The impact of R&D
networks may be captured by employing different
quantitative methods, in particular coming from
(spatial) econometrics and network analysis
techniques.
In this block of potential future research
directions we distinguish three levels of analysis:
The link between R&D networks and European
integration
Using an appropriate econometric
modeling framework, indicators derived from
the analysis of FP networks could be used to
appreciate the contribution of the FP to an
integrated ERA. Work that explicitly compares
the forces of geography to those of networks
by, for instance, substituting measures of
geographic distance for network distance
could also help assess the contribution of FP
to European integration.
The link between R&D networks and innovative
output
The first level of analysis is intended to
disclose the relationship between R&D networks
–as, for instance, networks of organisations
participating in joint projects funded by the
European Framework Programmes– and innovative
output of participating organisations. Innovative
output will be measured by proxy indicators
widely used in empirical innovation studies, such
as patents or publications. From a methodological
point of view, the relationship between
knowledge inputs –such as human resources,
R&D expenditures and (as an intermediary form)
R&D networks– and knowledge outputs may
be characterised by a class of (spatial) panel
data models used in previous studies of similar
spirit (see, for instance, Fischer, Scherngell and
Reismann, 2009) or spatially-aware knowledge
production functions with network effects (see,
for instance, Varga and Pontikakis, 2009).
The link between R&D networks and economic
performance
The second level of analysis goes a step further
and investigates how R&D networks influence the
economic performance of organisations, regions
and countries. A key concept that could be used to
investigate the outcome/impact of R&D networks
is the concept of Total Factor Productivity (TFP)
referring to the component of output growth not
attributable to the accumulation of conventional
inputs, such as labour and physical capital. It is
not only a question whether or not a relationship
between TFP and R&D networks exists, but
also whether or not quantitative, especially
(spatial) econometric studies, can –in spite of all
measurement difficulties– characterise such a
relationship in a satisfactory manner, in particular
at the regional level of observation.
Dynamics of R&D networks
A better understanding of the dynamic
evolution of European R&D networks is strongly

87
Ana
lysis
of N
etw
orks
in E
urop
ean
Fram
ewor
k Pr
ogra
mm
es (1
984-
2006
)
needed in order to get a deeper insight into the
processes and mechanisms of such networks.
In particular the question of how scientific
communities evolve over time is of crucial interest
in this context. These questions can be addressed
by using data of the sysres EUPRO database. It
provides rich material allowing for not only
cross-sectional, but also detailed longitudinal
investigation.
Methodologically, this may include the
description of the global and local characteristics
of the networks over time, a study of network
formation mechanisms (attachment rules), the
identification of stable actor configurations
and homogeneous subgroups, as well as the
presumably shifting thematic priorities of the
collaborative research we are able to observe.
Another aspect that can be studied within the
scope of this research direction is the geographical
evolution of the research networks in the European
Framework Programmes. However, to get a deeper
understanding of the evolution of communities in
European R&D networks, further methodological
advances are required, for instance regarding the
identification of communities within networks.
A community of a network is a portion of the
network whose members are more tightly linked
to one another than to other members of the
network. Further, understanding the dynamic
evolution of networks is an area of active research;
the construction of meaningful time series of R&D
networks thus can draw on cutting edge research,
but also presents significant challenges.
A specific opportunity lies with the closer
examination of the New Member States. As
their participation in FPs is both relatively recent
and growing, their accession provides a natural
experiment with which to examine the effects
of FP networking activity. In addition, recent
FPs have, in their calls, emphasised the value
of including partners from New Member States.
Until very recently, FP participants in EU-15
countries have had little contact with and know
little about institutions and potential partners in
New Member States. One interesting question is
how old participants get information about new
and comparatively unknown participants. It seems
likely that there is some information network other
than the FP network on which information about
potential partners travels. Seeing how this works
is a way of asking how new information enters a
network generally, but also how new participants
join the FP, ERA network specifically. If this is
addressed quickly, there may be an opportunity
to gather relevant data (perhaps through adding
questions to the CIS) as the participation from the
New Member States grows rapidly.
One of the key issues from a systemic point
of view is how networks combine with other
governance forms, such as markets and hierarchies
(both corporate and political); moreover, there
is growing interest in, but to date only limited
analysis of, the interrelationships among the
networks themselves. Most individuals and
organisations who constitute the present database
are also members of other networks (disciplinary,
topic oriented, policy-oriented, etc.). This
potential profusion of networking gives scope for
possibilities of ‘network failure’ (akin to ‘market
failure’, ‘government failure’, etc.), at the level of
both the specific network and of the systems of
networks (‘networks of networks’). Such issues are
examined in the still underdeveloped literature on
‘network alignment’ (von Tunzelmann, 2007). A
key issue is how the structure of projects (e.g. in
a FP – the objects of the network) aligns with the
structure of subjects (e.g. the technologies) and
with the structure of the agents themselves.
Function and structure of R&D networks
In chapter 4 we stress issues concerning the
link between the specific knowledge functions
(exploration-exploitation) and the structural
properties of R&D networks (see, for instance,
March, 1991; Stokes, 1997; Cowan and Jonard,
2004; Cowan, 2006). The results provide some
preliminary and basic insights into this topic
and present an analytical framework that may be
developed further. Further research efforts in this

88
Cha
pter
7: F
utur
e re
sear
ch d
irec
tion
s
direction are strongly needed from a European
policy perspective: on the one hand, to identify
ways to create and appraise desirable network
structures for realising key functions of R&D
collaboration networks, and, on the other hand,
to analyse the impact of governance rules on the
realisation of network functions.
From this perspective, this research direction
could produce quantitative statements about
desirable network structures and suitable
governance rules shaping the emergence of different
types of collaboration networks. To advance in this
direction one would have to investigate which
typologies of networks exist with respect to network
function and governance rules.
There has been a small amount previous work
along these lines, but none having to do with ERA.
In addition, previous work has focussed almost
exclusively on small world properties of networks
(with a limited amount of attention to scale free
networks). It should be possible to move beyond
these two characterisations. Social network
analysis has developed a battery of statistics
for network description, and the challenge is to
understand which of these is relevant for different
aspects of network performance.
7.4 Feasibility of extending network analysis to alternative data sources (COST, ERC, EUREKA)
European R&D policy instruments in perspective
European RTD policy is formulated
at multiple levels of governance, with EU
competences overlapping with those of national
and regional authorities. The current landscape
is conditioned by a long history of common
research policies and the coordination of national
research policies. Historically, the benefits of
common policies for basic research, in terms of
knowledge diffusion, capability development
and critical mass effects, have been obvious.
Hence, the development of a common budget
for pre-competitive collaborative research in
the form of ESPRIT and later the FP has been a
largely uncontentious matter.
Figure 20: Position of European collaborative R&D instruments
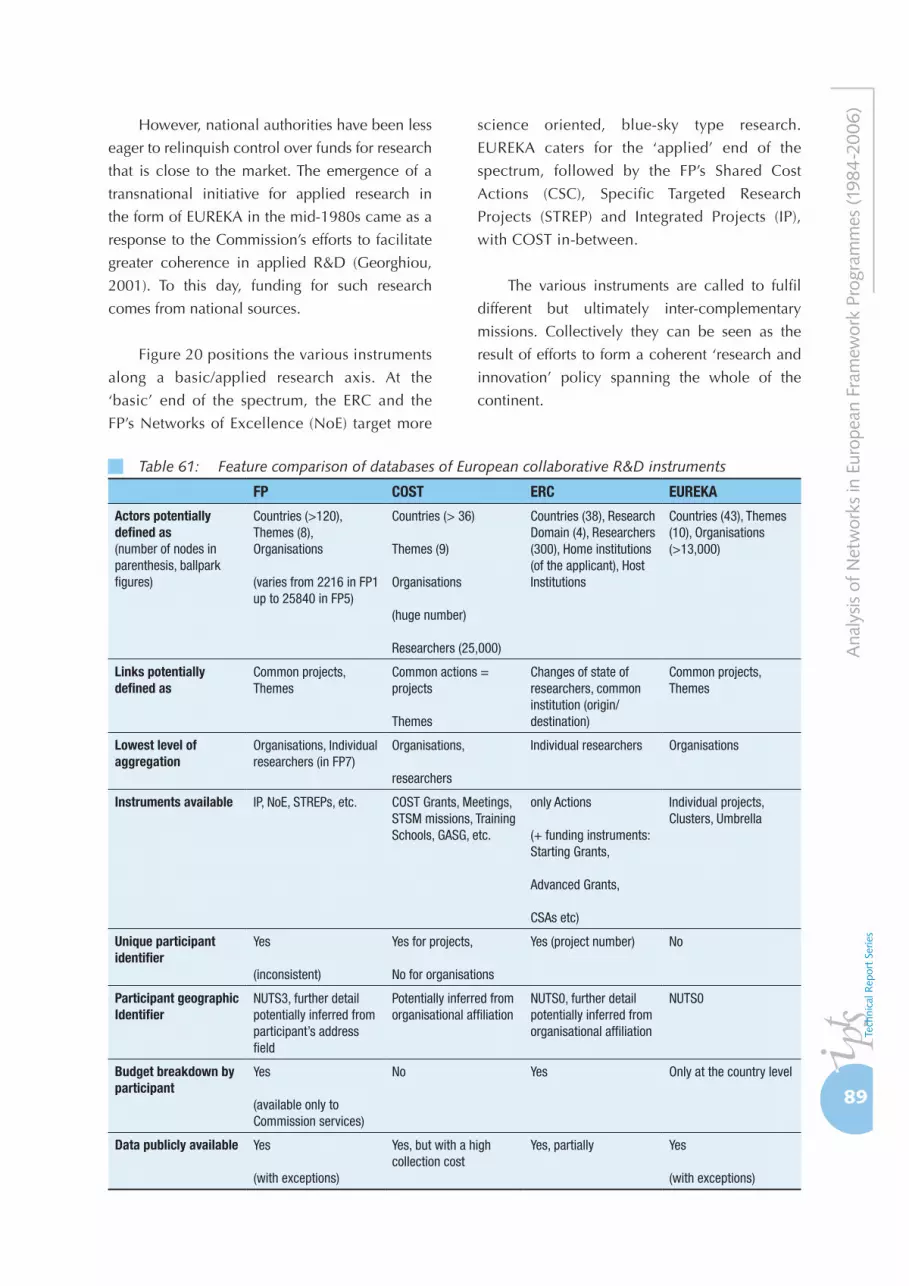
89
Ana
lysis
of N
etw
orks
in E
urop
ean
Fram
ewor
k Pr
ogra
mm
es (1
984-
2006
)
However, national authorities have been less
eager to relinquish control over funds for research
that is close to the market. The emergence of a
transnational initiative for applied research in
the form of EUREKA in the mid-1980s came as a
response to the Commission’s efforts to facilitate
greater coherence in applied R&D (Georghiou,
2001). To this day, funding for such research
comes from national sources.
Figure 20 positions the various instruments
along a basic/applied research axis. At the
‘basic’ end of the spectrum, the ERC and the
FP’s Networks of Excellence (NoE) target more
science oriented, blue-sky type research.
EUREKA caters for the ‘applied’ end of the
spectrum, followed by the FP’s Shared Cost
Actions (CSC), Specific Targeted Research
Projects (STREP) and Integrated Projects (IP),
with COST in-between.
The various instruments are called to fulfil
different but ultimately inter-complementary
missions. Collectively they can be seen as the
result of efforts to form a coherent ‘research and
innovation’ policy spanning the whole of the
continent.
Table 61: Feature comparison of databases of European collaborative R&D instruments
FP COST ERC EUREKA
Actors potentially defined as(number of nodes in parenthesis, ballpark figures)
Countries (>120), Themes (8), Organisations
(varies from 2216 in FP1 up to 25840 in FP5)
Countries (> 36)
Themes (9)
Organisations
(huge number)
Researchers (25,000)
Countries (38), Research Domain (4), Researchers (300), Home institutions (of the applicant), Host Institutions
Countries (43), Themes (10), Organisations (>13,000)
Links potentially defined as
Common projects, Themes
Common actions = projects
Themes
Changes of state of researchers, common institution (origin/destination)
Common projects, Themes
Lowest level of aggregation
Organisations, Individual researchers (in FP7)
Organisations,
researchers
Individual researchers Organisations
Instruments available IP, NoE, STREPs, etc. COST Grants, Meetings, STSM missions, Training Schools, GASG, etc.
only Actions
(+ funding instruments: Starting Grants,
Advanced Grants,
CSAs etc)
Individual projects, Clusters, Umbrella
Unique participant identifier
Yes
(inconsistent)
Yes for projects,
No for organisations
Yes (project number) No
Participant geographic Identifier
NUTS3, further detail potentially inferred from participant’s address field
Potentially inferred from organisational affiliation
NUTS0, further detail potentially inferred from organisational affiliation
NUTS0
Budget breakdown by participant
Yes
(available only to Commission services)
No Yes Only at the country level
Data publicly available Yes
(with exceptions)
Yes, but with a high collection cost
Yes, partially Yes
(with exceptions)

90
Cha
pter
7: F
utur
e re
sear
ch d
irec
tion
s
Data availability and potential for analysis
There is a sprawling literature examining
specific forms of R&D collaboration, such as those
recorded in scientific publications and patenting, but
relatively little is known about R&D collaborations
facilitated by policy. Comparing the analysis of the
FP with those of alternative data sources could help
towards ascertaining its individual characteristics
and this way better understand its role in the
European research system.
This section presents a feasibility assessment
of extending network analysis performed thusfar
on the FP to other European instruments for
collaborative R&D. Table 61 presents a feature
comparison of the respective databases of the
aforementioned instruments and the FPTable 61.
In terms of data quantity and public availability,
the FP and the EUREKA databases are the most
voluminous and most easily accessible data
sources. COST too has potentially voluminous
data of very high value for policy-relevant analysis,
but it is currently in a form that is costly to collect,
process and analyse (the current lack of studies is
probably a testament to this). ERC could also evolve
into a valuable resource, but it is simply too new
to produce meaningful insights at the European
level. Its value instead may lie in shedding light on
the dynamics of human resource mobility within
specific disciplines, offering a snapshot of the
upper-tail of the quality distribution.
The type and amount of information available
indicate that all three data sources are receptive to
some form of network analysis, though the precise
scope will vary in each case. A conceptualisation
of common elements of analysis is presented in
Figure 21. It is obvious from this figure and our
discussion so far that variation in data availability,
in the types of programmes and research themes/
domains renders the possibility of cross-instrument
analysis remote. Crucially, the differences in
rationales between instruments may mean that
even when cross-instrument analysis is possible,
it may not be meaningful. A holistic analysis of
European R&D instruments may be better served
by an approach that treats them as separate but
inter-complementary components.
The processing of COST, ERC and
EUREKA data in a form that is suitable for
network analysis, would form a valuable asset
on its own right and could pave the way to
additional policy-relevant studies. One could
for instance, investigate the possibility to link
COST, ERC and EUREKA with research output
data (publications, patents, copyrights), along
the lines of on-going work in the FP, and thus
get a feel for the impact of each instrument in
terms of R&D outputs.
A particularly fascinating possibility arising
from the availability of a complete dataset on all
four instruments (FP, COST, ERC, EUREKA) is the
Figure 21: Common elements of analysis

91
Ana
lysis
of N
etw
orks
in E
urop
ean
Fram
ewor
k Pr
ogra
mm
es (1
984-
2006
)
joint examination of the participation of the same
actors across the various instruments. For example,
network analysis that treats the instruments as
nodes could identify those instruments that are
central in framing research in particular disciplines
and chart the evolution of such centrality over
time. It would highlight the key organisations
facilitating the flow of knowledge from the basic-
research end of the spectrum to the applied one
(and vice versa). In doing so, it would unravel the
structure and properties of the emerging ‘system
of instruments’ and thus contribute to a better
understanding of the breadth of European RTD
policy levers.


93
Ana
lysis
of N
etw
orks
in E
urop
ean
Fram
ewor
k Pr
ogra
mm
es (1
984-
2006
)
Chapter 8: Policy Implications for ERA
The application of network analysis on data
from the FPs contributes to the emerging evidence
base for the design of ERA-related policies.
The present analysis highlights the following
implications for the ‘ERA Vision 202015’.
In the first part we highlight the general
structural features emerged in the analysis of FPs
and we discuss their policy implications. In the
second part we examine insights derived from the
analysis of instruments.
8.1 Structural features
A network analysis of the FPs is an important
analytical tool for the overall evaluation of
results and impact of R&D policies in the EU.
The above analysis of structural features of FP5
and FP6 networks suggests several implications
for ERA. The distinction between three kinds of
networks – small world networks, distributed
clusters networks and networked communities-
as the outcome of different sub programmes
has repercussions for the implementation of
ERA.
In the context of ERA, small world networks
might favour knowledge diffusion and building up
expertise across time but might be less effective to
foster wider integration because of the difficulties
that new players have in joining in. In general,
different kinds of networks represent different
answers to ERA priorities, between the two main
aims of building up expertise and of knowledge
diffusion, there are irreducible trade-offs in opting
for sub-programmes in future FPs.
15 Council of the European Union (2009), “The first steps towards the realisation of European Research Area (Vision 2020)”, Brussels, May 18
Comparing the evolution of the FPs over time,
we observe extensive instrumental and structural
change. Over time, for the same type of instruments
and for the same themes, the networks emerging
are more integrated and more tightly knitted. This
could be interpreted as a signal of self-reinforcing
pan-European thematic communities built on
trust and a common operational framework that
has evolved in its present state alongside the FP.
According to FP data for FP5 and FP6,
small world networks (with high clustering) in
sub-programmes emerge for sub programmes
strongly oriented on direct research. Such kind of
networks are known for their resilience over time
and their resistance to change due to the filtering
apparatus of using highly connected nodes (or
‘hubs’), and its better effectiveness in relaying
information while keeping the number of links
required to connect a network to a minimum. In
other words, in the context of ERA, such networks
might favour knowledge and building up expertise
across time but might be less effective to foster
wider integration because of the difficulties that
new players have in joining in.
Distributed cluster networks are found in
programmes with a strong exploitative component
and knowledge transfer functions. Such networks
are less clustered than small world networks and
represent a balance of expertise accumulation
and integration, with less high obstacle in joining
in. Favouring the advancement of knowledge and
efficient transfer within relatively closed cliques,
they represent an interesting tool for ERA.
Finally, there are more evenly distributed
network structures, the so called ‘networked
communities’ that with a lower clustering are
associated with basic research. Such networks are
better suited for cutting-edge research and allow
a wider integration since links are easily formed
94
Cha
pter
8: P
olic
y Im
plic
atio
ns f
or E
RA
(due to the small nature of the projects involved).
However, they might be less suited for an efficient
diffusion and exploitation of knowledge.
In general, different kinds of networks
represent different answers to ERA priorities,
between the two main aims of building up
expertise and of knowledge diffusion, there
are irreducible trade-offs in opting for sub-
programmes in future FPs. We identify the
following main dimensions along which different
network types are relevant:
• Buildingstrengths.The identified distinction
between three kinds of networks as the
outcome of different sub programmes has
repercussions for the implementation of
ERA. In the context of ERA, small world
networks might favour knowledge and
building up expertise across time but might
be less effective to foster wider integration
because of the difficulties that new players
have in joining in. In general, different kinds
of networks represent different answers to
ERA priorities, between the two main aims
of building up expertise and of knowledge
diffusion, there are irreducible trade-offs in
opting for sub-programmes in future FPs.
Comparing the evolution of the FPs over
time, we observe extensive instrumental and
structural change. Over time, for the same
type of instruments and for the same themes,
the networks emerging are more integrated
and more tightly knitted. This could be
interpreted as a signal of self-reinforcing pan-
European thematic communities built on
trust and a common operational framework
that has evolved in its present state alongside
the FP.
• Cohesion of the European Research Area.
Distributed cluster networks are found
in programmes with a strong exploitative
component and knowledge transfer
functions. Such networks are less clustered
than small world networks and represent
a balance of expertise accumulation and
integration, with less high obstacle in joining
in. Favouring the advancement of knowledge
and efficient transfer within relatively
closed cliques, they represent an interesting
cohesion tool for ERA. The overall success
of the FP in involving research teams from
new member states and integrating smaller
peripheral communities into wider European
networks shows that it is contributing to the
construction of the ‘backbone’ of the ERA.
Core organisations have played the role of
integrator and coordinator in the building
a European-level research agenda for a
given topic. However, the rankings of top
organisations provide some indications of
high entry costs. Aerospace in particular, is
dominated by industry, exhibiting relative
stability in the ranks of universities and
research organisations, with some mobility
in the ranks of industrial actors over time.
High entry costs are also reflected in more
inclusive thematic priorities (such as ICT),
with the top ranks dominated by organisations
from older member states. Discussions on
the future evolution of the ERA should take
into account the high entry costs for new
participants and take the necessary steps to
facilitate entry.
The actors that can achieve in both
dimensions are universities that are at the
core of the networks built by the FPs through
time, increasing their centrality and share of
participation. Because of stability in the top
positions and, as observed previously, the wide
representation of some of universities in different
thematic networks, they play a double role of
capacity building and cohesion. Stability over
time also suggests that policy interventions will
need to take into account the specificities of
these top actors and the networks in which they
participate. Of all organisation types, universities
are the ones that form the building blocks of the
ERA, acting as harbours of stability. It is therefore
important that their central role is recognised
in any discussion on the future evolution of the
ERA.

95
Ana
lysis
of N
etw
orks
in E
urop
ean
Fram
ewor
k Pr
ogra
mm
es (1
984-
2006
)
8.2 Instruments
The analysis by instrument is of particular
interest from an ERA perspective, given that two
of the instruments examined (IP, NoE) were tasked
with strengthening the ERA: IP and NoE aimed at
the facilitation of common research agendas, at
the integration of smaller research communities
and new Member States (NMS), and at the
promotion of virtual centres of excellence that are
visible at the global level.
In accordance with the expectations attached
to IP and NoE, we found that they favoured large
projects with many participants.
The top 20 positions of universities are
spread across different countries, in contrast to the
typical concentration found in academic ranking
tables. Large and small, generic and specialised
universities are all involved in the FPs. This
image is consistent with the ERA vision that sees
coordination and cooperation (as promoted by
the FP, but also other instruments such as COST
and EUREKA) as contributing on existing strengths
and integrating the knowledge periphery.
Analysis suggests that Energy and Environment
has allowed a better integration of new
organisations. This can be seen as a reflection of
a topic dealing with the production and diffusion
of public good-type knowledge, which requires
more inclusive networks. As such, this priority
might represent an exemplar of how the FP could
contribute to the tackling of ‘Grand Challenges’.
In real-world networks, this likelihood
tends to be greater than the average probability
of a tie randomly established between two
nodes (Holland and Leinhardt, 1971; Watts and
Strogatz, 1998) is higher than in networks based
on Cost Shared Contracts (CSC and STREP). The
above can be taken as an indication that the two
ERA instruments shaped the structure of research
collaboration networks across Europe.
The overall success of the FP in involving
research teams from new member states and
integrating smaller peripheral communities
into wider European networks is compatible
with the view that it is contributing to the
construction of the ‘backbone’ of the ERA. Core
organisations have played the role of integrator
and coordinator in the building a European-
level research agenda for a given topic.
Our analysis points to significant
differences in the resulting networks across
thematic priorities. We also observe that the
exact shape (distribution) of the knowledge
triangle is thematically conditioned: the
composition of resulting networks varies
in terms of leading organisation type with
Aerospace in one extreme (where industry is
dominant) and Life Sciences in the other (where
universities dominate). The above observations
suggest that the role of the FP in structuring the
ERA could be enhanced by the suitable design
of instruments that are tailored to the needs of
thematic communities.
The even mix of organisation types
represented in the top ranks of ICT is indicative
of a priority that is conducive to knowledge
sharing between different organisation types.
The above observations suggest that the role
of the FP in structuring the ERA could be
enhanced by the suitable design of instruments
that are tailored to the needs of thematic
communities.
Organisation rankings indicate wide
variation across themes but, within a given
theme, relative homogeneity across instruments.
In other words, representation in the top ranks
is primarily thematically conditioned. Within
each theme, we can distinguish between a
core of stable presences in the top ranks and
others that are rather volatile. We observe a
different mix of organisations across the various
thematic priorities.


97
Ana
lysis
of N
etw
orks
in E
urop
ean
Fram
ewor
k Pr
ogra
mm
es (1
984-
2006
)
References
Ahuja, G. (2000), Collaboration networks, structural holes and innovation: A longitudinal Study,
Administrative Science Quarterly, 45, 425-455.
Anselin, L. (1995), Local indicators of spatial association – LISA, Geographical Analysis, 27, 93-115.
Archibugi, L. and Pianta, M. (1992), The technological specialization of advanced countries: A report to the
CEC on international science and technology activities, Kluwer, Norwell and Dordrecht.
Autant-Bernard, C., Mairesse, J. and Massard, N. (2007), Spatial knowledge diffusion through collaborative
networks, Papers in Regional Science, 86, 341-350.
Azagra-Caro, J.M., Carat, G. and Pontikakis, D. (2009), University-industry cooperation in the Research
Framework Programme”, JRC Technical Reports, No. 54072, EUR 24078, Luxembourg: Office for Official
Publications of the European Communities. http://ipts.jrc.ec.europa.eu/publications/pub.cfm?id=2839
Barber, M. J., Heller-Schuh, B., Roediger-Schluga, T. und Scherngell, T. (2008), NEMO - Network Models,
Governance and R&D Collaboration Networks. Deliverable D4.1: The sysres EUPRO database manual.
Austrian Research Centers GmbH – ARC
Barber, M., Paier, M., and Scherngell, T. (2009), Analyzing and modelling European R&D collaborations:
Challenges and opportunities from a large social network, in Emmert-Streib, F., und M. Dehmer (Eds.),
Complex Networks. New York: Wiley [forthcoming].
Callon, M., Larédo, P. and Mustar, P., (1995), La gestion stratégique de la recherche et de la technologie:
l’évaluation des programmes, Paris, Economica.
Caloghirou, Y., Vonortas, N.S. and Ioannides, S. (2004) (Eds.), European collaboration in research and
development, Northampton, Edward Elgar.
Combes, P.-P., Mayer, T. and Thisse, J.-F. (2008), Economic geography. The integration of regions and nations,
Princeton, Princeton University Press.
COST (2008), About COST 2008, http://www.cost.esf.org/module/download/4875.
COST (2009), About COST 2009, http://www.cost.esf.org/module/download/6238.
Cowan, R. and Jonard, N. (2004), Network structure and the diffusion of knowledge, Journal of Economic
Dynamics and Control, 28(8), 1557-75.
Cowan, R. (2006), Network models of innovation and knowledge diffusion, in Breschi, S. and Malerba, F.
(Eds.), Clusters, networks and innovation, vol. 29-53, Oxford, Oxford University Press.
98
Ref
eren
ces
Dumont, M. and Meeusen, W. (1999), Further elaboration of a graph-theoretical analysis of R&D
collaboration, Paper prepared at the workshop of the OECD-NIS Focus Group on Innovative Firms and
Firm Networks, Vienna, http://www.oecd.org/dataoecd/13/25/2093327.pdf.
Elhorst, J.P. (2003), Specification and estimation of spatial panel data models, International Regional
Science Review 26(3), 244-268.
EUREKA (2009), Eureka website, http://www.eureka.be/home.do.
European Commission (1972), Objectives and instruments of a common policy for scientific research and
technological development, COM (72) 700, CEE Brussels, Bulletin of the European Communities 6/72.
European Commission (2000a), Communication from the Commission to the Council, the European
Parliament, the Economic and Social Committee and the Committee of the Regions - Towards a European
Research Area, Brussels
European Commission (2000b), Guidance notes on thematic networks. Rev.1, ftp://ftp.cordis.europa.eu/
pub/growth/docs/c_guidance_notes_tn_200002.pdf, accessed 30 Jan 2009.
European Commission (2003), Participation Rules Vademecum, European Commission. http://cordis.
europa.eu/fp5/management/particip/v_participation.htm, accessed 8 Jan 2009.
European Commission (2007), The European research area: New perspectives - Green Paper 04.04.2007,
Brussels, Research Directorate General.
European Commission (2008), Annual Report on the ERC activities and achievements in 2007, prepared
under the authority of the ERC Scientific Council, EUR 23185, ISBN 978-92-79-07998-6.
European Council (2008), 2891st Competitiveness (Internal Market, Industry and Research) Council
meeting Brussels, Conclusions on the definition of a 2020 Vision for the European Research Area, Brussels,
European Council.
Feldman, M.P. and Lichtenberg, F. (1997), The Impact and organization of publicly-funded research and
development in the European Community, NBER Working Paper Series, No. 6040, National Bureau of
Economic Research, Cambridge: MA.
Fischer, M.M., Scherngell, T. and Reismann, M. (2009), Knowledge spillovers and total factor productivity.
Evidence using a spatial panel data model, Geographical Analysis [forthcoming].
Fortunato, S. and Castellano, C. (2008), Community structure in graphs. Encyclopedia of Complexity and
System Science, Eprint arXiv:0712.2716.
Freeman, C. (1991), Networks of innovators: A synthesis of research issues, Research Policy, 20, 499-514.
Georghiou, L. (2001), Evolving frameworks for European collaboration in research and technology, Research
Policy, 30(6), 891-903.

99
Ana
lysis
of N
etw
orks
in E
urop
ean
Fram
ewor
k Pr
ogra
mm
es (1
984-
2006
)
Gilsing, V., Nooteboom, B., Vanhaverbeke, W., Duysters, G. and van den Oord, A. (2008), Network
embeddedness and the exploration of novel technologies: Technological distance, betweenness centrality
and density, Research Policy, 37(10), 1717 - 1731.
Henriques, L., Schoen, A. and Pontikakis, D. (2009), Europe’s top research universities in FP6: scope and
drivers of participation, JRC Technical Reports, No. 53681, EUR 24006, Luxembourg: Office for Official
Publications of the European Communities. http://ipts.jrc.ec.europa.eu/publications/pub.cfm?id=2839.
Holland, P.W. and Leinhardt, S. (1971), Transitivity in structural models of small groups, Comparative
Group Studies 2, 107–124
Jackson, M.O. (2008), Social and Economic Networks, Princeton, Princeton University Press.
March, J. (1991), Exploration and exploitation in organizational learning, Organization Science, 2, 71-87.
Nokkala T., Heller-Schuh B., Paier M. (2011), Ranking lists and European Framework Programmes: Does
university status matter for performance in Framework Programmes? In: Teixeira, P. N. und Dill, D. D.
(eds.) Public Vices, Private Virtues? Assessing the Effects of Marketization in Higher Education, Rotterdam,
Boston, Taipei, Sense Publishers, 111-139. [In press].
Onida, E and Malerba, F. (1989), R & D cooperation between industry, universities and research organisations
in Europe, Technovation, 9, 131-191.
Papon, P. (2004), European scientific cooperation and research infrastructures: Past tendencies and future
prospects, Minerva, 42(1), 61-76.
Pontikakis, D. and Azagra-Caro, J.M. (2009), Quantifying progress towards the European Research Area:
Alternative Indicators of European integration in the field of research, ENID Conference, 3rd European
Network of Indicators Designers (ENID) Conference on STI Indicators for policymaking and strategic
decision, March 3-5th, Paris, http://www.enid-europe.org/conference/abstracts/pontikakis_2_abstract.pdf.
PREST, coordination I. Miles (1997), COST Evaluation Brussels, COST Secretariat
(note: one volume, COST Evaluation - Main Report authored by I Miles)
Rietschel, E.T., Arnold, E. et al. (2009), Evaluation of the six Framework Programmes for research and
technological development - 2002-2006, (Report of the Expert Group).
Scherngell, T. and Barber, M.J. (2009), Spatial interaction modelling of cross-region R&D collaborations:
empirical evidence from the 5th EU framework programme. Papers in Regional Science, 88, 3, 531-547
Sen, A. and Smith, T.E. (1995), Gravity models of spatial interaction behaviour, Heidelberg, Berlin and New
York, Springer.
Shan, W. J., Walker, G. and Kogut, B. (1994), Interfirm cooperation and startup innovation in the
biotechnology industry, Strategic Management Journal, 15(5), 387-394.
100
Ref
eren
ces
Stokes, D. E. (1997), Pasteur’s Quadrant: Basic Science and Technological Innovation: Brookings Institution
Press.
Varga, A. and Pontikakis, D. (2009), Is networking a substitute or a complement to regional innovation
capacity? Evidence from the EU’s 5th Framework Programme, JRC Scientific and Technical Reports, No.
51996, EUR 23836, Luxembourg: Office for Official Publications of the European Communities. http://ipts.
jrc.ec.europa.eu/publications/pub.cfm?id=2299
von Tunzelmann, N. (2007), Analysing network alignment. Deliverable prepared for the UKNOW project
in FP6, SPRU, Brighton.
Wassermann, S. and Faust, K. (1994), Social network analysis. Methods and applications. Cambridge:
Cambridge University Press.
Watts, D. J. and Strogatz, S. H. (1998), Collective dynamics of ‚small-world‘ networks, Nature, 393(6684),
440-442.
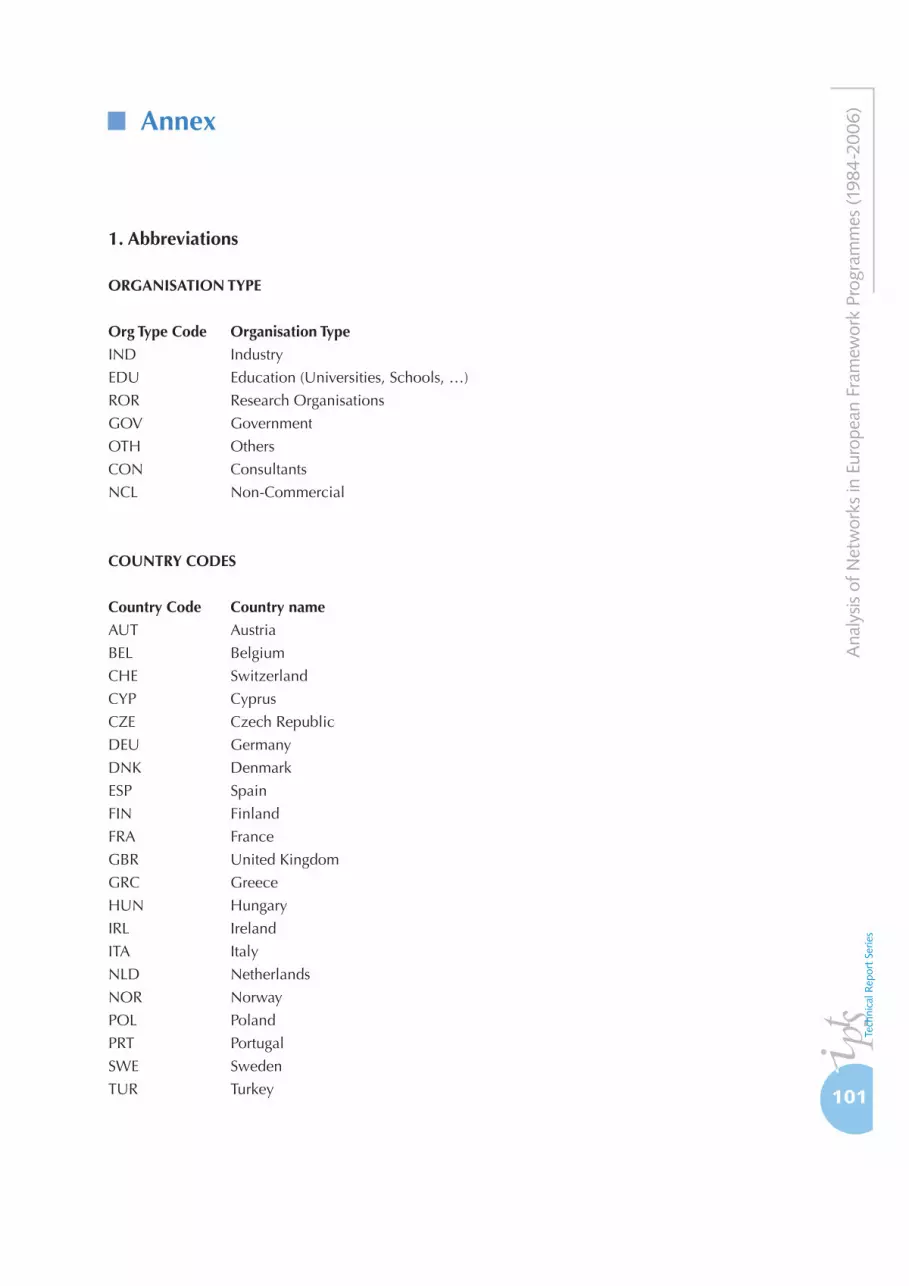
101
Ana
lysis
of N
etw
orks
in E
urop
ean
Fram
ewor
k Pr
ogra
mm
es (1
984-
2006
)
Annex
1. Abbreviations
ORgANISATION TyPE
Org Type Code Organisation Type
IND Industry
EDU Education (Universities, Schools, …)
ROR Research Organisations
GOV Government
OTH Others
CON Consultants
NCL Non-Commercial
COUNTRy CODES
Country Code Country name
AUT Austria
BEL Belgium
CHE Switzerland
CYP Cyprus
CZE Czech Republic
DEU Germany
DNK Denmark
ESP Spain
FIN Finland
FRA France
GBR United Kingdom
GRC Greece
HUN Hungary
IRL Ireland
ITA Italy
NLD Netherlands
NOR Norway
POL Poland
PRT Portugal
SWE Sweden
TUR Turkey

102
Ann
ex Table 62: Thematic sub-programmes of the RTD Framework Programmes
Acronym Title
Number of collaborative
projects in the database
FP5 (1998-2002)
IST User-friendly information society 2,424
EESD Energy, environment and sustainable development 1,714
GROWTH Competitive and sustainable growth 2,019
LIFE QUALITY Quality of life and management of living resources 2,076
HUMAN POTENTIAL Improving the human research potential and the socio-economic knowledge base 738
INCO 2 Confirming the international role of Community research 429
INNOVATION-SME Promotion of innovation and encouragement of participation of SMEs 84
FP6 (2002-2006)
IST Information society technologies 874
AEROSPACE Aeronautics and space 147
NMPNanotechnologies and nano-sciences, knowledge-based multifunctional materials and new production processes and devices
305
LIFESCIHEALTH Life sciences, genomics and biotechnology for health 324
CITIZENS Citizens and governance in a knowledge-based society 120
SME Specific SME activities 256
NEST New and Emerging Science and Technology 85
Source: sysres EUPRO database.

103
Ana
lysis
of N
etw
orks
in E
urop
ean
Fram
ewor
k Pr
ogra
mm
es (1
984-
2006
)
2. Tables
Table 63: Distribution of core organisations by countries and theme (AERO) for CSC/STREP (%)
AERO_4_CSC AERO_5_CSC AERO_6_STREP
core all core all core all
AUT 0.0 0.3 0.0 1.4 0.0 3.1
BEL 0.0 5.3 3.6 3.9 4.0 5.2
BGR 0.0 0.0 0.0 0.0 0.0 0.0
CHE 0.0 1.6 0.0 1.4 0.0 2.1
CYP 0.0 0.0 0.0 0.0 0.0 0.3
CZE 0.0 0.0 0.0 0.9 0.0 1.9
DEU 22.2 15.9 21.4 20.1 24.0 14.5
DNK 0.0 1.9 0.0 0.7 0.0 1.1
ESP 5.6 4.4 10.7 6.7 4.0 7.7
FIN 0.0 0.3 0.0 0.7 0.0 0.5
FRA 27.8 23.4 32.1 24 32.0 19.2
GBR 16.7 19.6 17.9 15.6 12.0 11.9
GRC 0.0 3.1 0.0 1.7 4.0 5.0
HUN 0.0 0.0 0.0 0.0 0.0 0.8
IRL 0.0 2.8 0.0 1.7 0.0 0.8
ISR 0.0 0.9 0.0 0.6 4.0 2.1
ITA 16.7 8.7 7.1 8.9 8.0 8.2
NLD 5.6 4.0 3.6 2.9 4.0 3.2
NOR 0.0 0.3 0.0 0.9 0.0 1.1
POL 0.0 0.0 0.0 0.7 0.0 1.5
PRT 0.0 1.9 0.0 0.6 4.0 1.3
ROU 0.0 0.0 0.0 0.6 0.0 1.0
RUS 0.0 0.3 0.0 0.4 0.0 1.1
SVK 0.0 0.0 0.0 0.0 0.0 0.2
SVN 0.0 0.0 0.0 0.1 0.0 1.1
SWE 5.6 5.3 3.6 3.1 0.0 3.7
USA 0.0 0.0 0.0 1.1 0.0 0.0
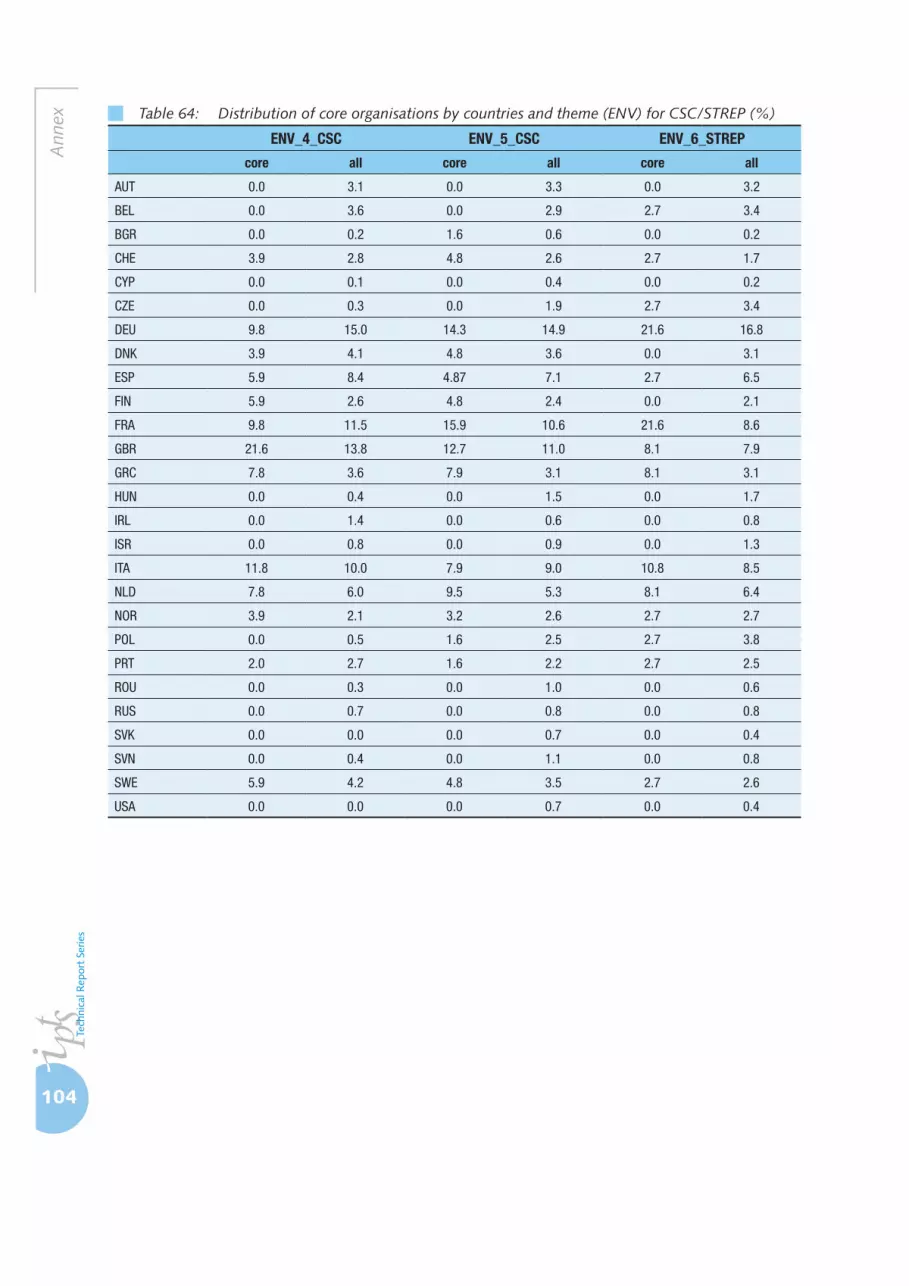
104
Ann
ex Table 64: Distribution of core organisations by countries and theme (ENV) for CSC/STREP (%)
ENV_4_CSC ENV_5_CSC ENV_6_STREP
core all core all core all
AUT 0.0 3.1 0.0 3.3 0.0 3.2
BEL 0.0 3.6 0.0 2.9 2.7 3.4
BGR 0.0 0.2 1.6 0.6 0.0 0.2
CHE 3.9 2.8 4.8 2.6 2.7 1.7
CYP 0.0 0.1 0.0 0.4 0.0 0.2
CZE 0.0 0.3 0.0 1.9 2.7 3.4
DEU 9.8 15.0 14.3 14.9 21.6 16.8
DNK 3.9 4.1 4.8 3.6 0.0 3.1
ESP 5.9 8.4 4.87 7.1 2.7 6.5
FIN 5.9 2.6 4.8 2.4 0.0 2.1
FRA 9.8 11.5 15.9 10.6 21.6 8.6
GBR 21.6 13.8 12.7 11.0 8.1 7.9
GRC 7.8 3.6 7.9 3.1 8.1 3.1
HUN 0.0 0.4 0.0 1.5 0.0 1.7
IRL 0.0 1.4 0.0 0.6 0.0 0.8
ISR 0.0 0.8 0.0 0.9 0.0 1.3
ITA 11.8 10.0 7.9 9.0 10.8 8.5
NLD 7.8 6.0 9.5 5.3 8.1 6.4
NOR 3.9 2.1 3.2 2.6 2.7 2.7
POL 0.0 0.5 1.6 2.5 2.7 3.8
PRT 2.0 2.7 1.6 2.2 2.7 2.5
ROU 0.0 0.3 0.0 1.0 0.0 0.6
RUS 0.0 0.7 0.0 0.8 0.0 0.8
SVK 0.0 0.0 0.0 0.7 0.0 0.4
SVN 0.0 0.4 0.0 1.1 0.0 0.8
SWE 5.9 4.2 4.8 3.5 2.7 2.6
USA 0.0 0.0 0.0 0.7 0.0 0.4

105
Ana
lysis
of N
etw
orks
in E
urop
ean
Fram
ewor
k Pr
ogra
mm
es (1
984-
2006
)Table 65: Distribution of core organisations by countries and theme (ICT) for CSC/STREP (%)
ICT_4_CSC ICT_5_CSC ICT_6_STREP
core all core all core all
AUT 2.0 2.8 1.4 2.7 4.1 2.8
BEL 3.9 4.4 2.7 3.9 8.2 3.0
BGR 0.0 0.0 0.0 0.4 0.0 0.8
CHE 2.0 2.2 5.4 2.7 2.0 2.8
CYP 0.0 0.1 0.0 0.4 0.0 0.2
CZE 0.0 0.1 0.0 0.9 0.0 1.0
DEU 25.5 17.1 14.9 15.5 16.3 15.9
DNK 0.0 2.5 0.0 1.7 0.0 1.6
ESP 5.9 8.4 8.1 8.1 8.2 7.2
FIN 2.0 2.1 1.4 2.4 2.0 2.3
FRA 21.6 12.9 14.9 11.8 12.2 9.4
GBR 15.7 14.8 13.5 11.8 6.1 10.7
GRC 2.0 4.0 8.1 5.8 8.2 4.8
HUN 0.0 0.3 0.0 0.8 2.0 2.7
IRL 0.0 2.5 0.0 1.4 0.0 2.0
ISR 0.0 1.0 0.0 1.8 0.0 2.0
ITA 13.7 10.5 16.2 12.0 16.3 10.9
NLD 2.0 5.0 4.1 4.2 6.1 3.6
NOR 2.0 1.7 2.7 1.5 0.0 1.8
POL 0.0 0.2 0.0 1.2 0.0 3.3
PRT 0.0 2.3 1.4 1.8 0.0 1.3
ROU 0.0 0.1 0.0 0.3 0.0 1.2
RUS 0.0 0.0 0.0 0.1 0.0 0.4
SVK 0.0 0.1 0.0 0.9 2.0 1.3
SVN 0.0 0.1 0.0 0.4 2.0 0.8
SWE 2.0 3.6 4.1 3.1 2.0 2.6
USA 0.0 0.2 0.0 0.7 0.0 0.2

106
Ann
ex Table 66: Distribution of core organisations by countries and theme (LIFESCI) for CSC/STREP (%)
LIFESCI_4_CSC LIFESCI _5_CSC LIFESCI_6_STREP
core all core all core all
AUT 0.0 3.3 0.0 3.0 0.0 4.3
BEL 5.3 4.3 4.2 3.3 0.0 3.2
BGR 0.0 0.1 0.0 0.3 0.0 0.4
CHE 2.6 3.5 4.2 2.9 7.4 4.2
CYP 0.0 0.0 0.0 0.1 0.0 0.0
CZE 0.0 0.3 0.0 1.0 0.0 1.1
DEU 15.8 17.7 20.8 14.6 29.6 17.0
DNK 2.6 3.7 6.3 3.8 3.7 4.0
ESP 2.6 6.7 2.1 6.8 3.7 5.6
FIN 0.0 3.0 6.3 2.5 3.7 2.7
FRA 13.2 12.4 12.5 11.3 18.5 11.3
GBR 28.9 12.8 20.8 13.3 11.1 10.5
GRC 2.6 2.0 0.0 3.1 0.0 0.8
HUN 0.0 0.3 0.0 1.2 0.0 1.7
IRL 0.0 1.8 0.0 1.4 0.0 0.7
ISR 0.0 1.0 0.0 1.7 0.0 2.3
ITA 0.0 12.2 4.2 11.1 3.7 12.1
NLD 18.4 6.0 12.5 4.5 14.8 4.4
NOR 0.0 1.4 0.0 1.7 0.0 1.3
POL 0.0 0.1 0.0 1.7 0.0 2.0
PRT 0.0 1.5 0.0 1.8 0.0 0.9
ROU 0.0 0.0 0.0 0.2 0.0 0.3
RUS 0.0 0.0 0.0 0.2 0.0 0.3
SVK 0.0 0.1 0.0 0.5 0.0 0.4
SVN 0.0 0.1 0.0 0.4 0.0 0.9
SWE 7.9 4.8 6.3 3.6 3.7 4.0
USA 0.0 0.1 0.0 0.8 0.0 0.4
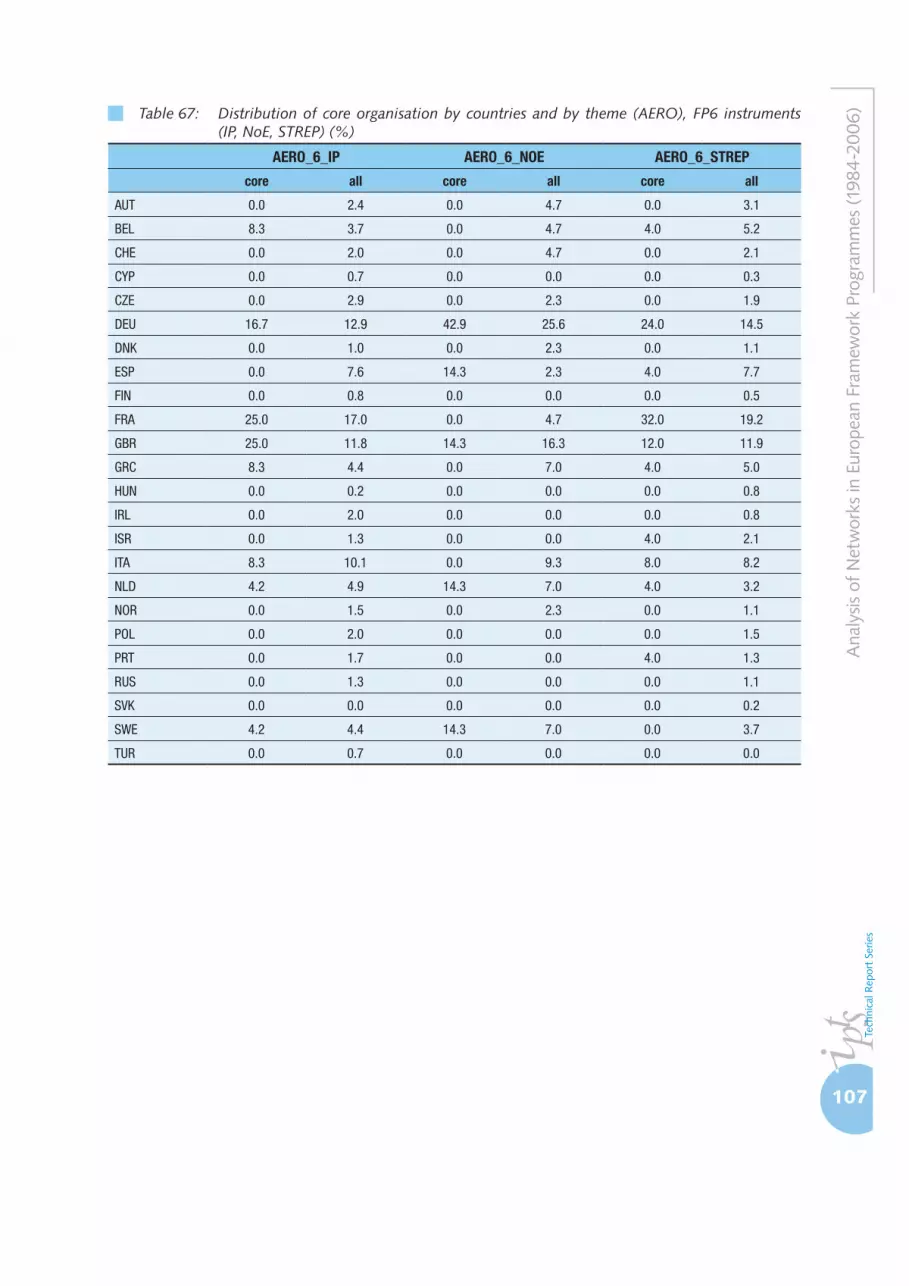
107
Ana
lysis
of N
etw
orks
in E
urop
ean
Fram
ewor
k Pr
ogra
mm
es (1
984-
2006
)Table 67: Distribution of core organisation by countries and by theme (AERO), FP6 instruments (IP, NoE, STREP) (%)
AERO_6_IP AERO_6_NOE AERO_6_STREP
core all core all core all
AUT 0.0 2.4 0.0 4.7 0.0 3.1
BEL 8.3 3.7 0.0 4.7 4.0 5.2
CHE 0.0 2.0 0.0 4.7 0.0 2.1
CYP 0.0 0.7 0.0 0.0 0.0 0.3
CZE 0.0 2.9 0.0 2.3 0.0 1.9
DEU 16.7 12.9 42.9 25.6 24.0 14.5
DNK 0.0 1.0 0.0 2.3 0.0 1.1
ESP 0.0 7.6 14.3 2.3 4.0 7.7
FIN 0.0 0.8 0.0 0.0 0.0 0.5
FRA 25.0 17.0 0.0 4.7 32.0 19.2
GBR 25.0 11.8 14.3 16.3 12.0 11.9
GRC 8.3 4.4 0.0 7.0 4.0 5.0
HUN 0.0 0.2 0.0 0.0 0.0 0.8
IRL 0.0 2.0 0.0 0.0 0.0 0.8
ISR 0.0 1.3 0.0 0.0 4.0 2.1
ITA 8.3 10.1 0.0 9.3 8.0 8.2
NLD 4.2 4.9 14.3 7.0 4.0 3.2
NOR 0.0 1.5 0.0 2.3 0.0 1.1
POL 0.0 2.0 0.0 0.0 0.0 1.5
PRT 0.0 1.7 0.0 0.0 4.0 1.3
RUS 0.0 1.3 0.0 0.0 0.0 1.1
SVK 0.0 0.0 0.0 0.0 0.0 0.2
SWE 4.2 4.4 14.3 7.0 0.0 3.7
TUR 0.0 0.7 0.0 0.0 0.0 0.0

108
Ann
ex Table 68: Distribution of core organisation by countries and by theme (ENV), FP6 instruments (IP, NoE, STREP) (%)
ENV_6_IP ENV_6_NOE ENV_6_STREP
core all core all core all
AUT 2.3 2.9 0.0 2.2 0.0 3.2
BEL 2.3 4.0 0.0 4.5 2.7 3.4
CHE 6.8 2.8 0.0 1.1 2.7 3.4
CYP 0.0 0.2 0.0 0.0 0.0 0.2
CZE 2.3 2.2 4.8 1.1 2.7 1.7
DEU 22.7 17.0 23.8 14.3 21.6 16.8
DNK 0.0 3.3 4.8 2.9 0.0 3.1
ESP 0.0 5.8 0.0 7.1 2.7 6.5
FIN 4.5 2.2 0.0 2.7 0.0 2.1
FRA 13.6 9.1 4.8 10.9 21.6 8.6
GBR 9.1 11.4 19.0 12.9 8.1 7.9
GRC 2.3 2.8 0.0 2.2 8.1 3.1
HUN 0.0 1.3 0.0 1.3 0.0 1.7
IRL 0.0 0.6 0.0 1.1 0.0 0.8
ISR 0.0 0.4 0.0 0.7 0.0 1.3
ITA 11.4 8.0 4.8 7.3 10.8 8.5
NLD 9.0 5.6 14.3 6.2 8.1 6.4
NOR 4.5 3.2 0.0 4.2 2.7 2.7
POL 0.0 2.3 4.8 3.3 2.7 3.8
PRT 2.3 1.2 4.8 2.2 2.7 2.5
RUS 0.0 0.8 0.0 0.9 0.0 0.8
SVK 0.0 0.0 4.8 0.9 0.0 0.4
SWE 6.8 5.0 9.5 4.2 2.7 2.6
TUR 0.0 0.5 0.0 0.7 0.0 0.7

109
Ana
lysis
of N
etw
orks
in E
urop
ean
Fram
ewor
k Pr
ogra
mm
es (1
984-
2006
)Table 69: Distribution of core organisation by countries and by theme (ICT), FP6 instruments (IP, NoE, STREP) (%)
ICT_6_IP ICT_6_NOE ICT_6_STREP
core all core all core all
AUT 0.0 3.4 3.3 2.6 4.1 2.8
BEL 0.0 3.9 6.7 3.9 8.2 3.0
CHE 2.2 3.8 10.0 2.8 2.0 2.8
CYP 0.0 0.4 3.3 0.1 2.0 0.4
CZE 0.0 1.1 0.0 1.0 0.0 1.0
DEU 26.1 17.9 3.3 14.3 16.3 15.9
DNK 0.0 1.9 0.0 2.8 0.0 1.6
ESP 6.5 7.1 6.7 6.3 8.2 7.2
FIN 4.3 2.2 3.3 2.3 2.0 2.3
FRA 21.7 10.4 20.0 11.1 12.2 9.4
GBR 6.5 12.1 6.7 12.0 6.1 10.7
GRC 2.2 3.5 20.0 4.6 8.2 4.8
HUN 0.0 0.7 3.3 0.8 2.0 2.7
IRL 0.0 1.4 0.0 1.5 0.0 1.3
ISR 0.0 1.7 0.0 1.1 0.0 2.0
ITA 10.9 11.6 6.7 10.5 16.3 10.9
NLD 10.9 3.7 0.0 4.0 6.1 3.6
NOR 0.0 1.1 0.0 1.9 0.0 1.8
POL 0.0 1.7 0.0 1.9 0.0 3.3
PRT 0.0 1.3 3.3 2.0 0.0 1.3
RUS 0.0 0.4 0.0 0.4 0.0 0.4
SVK 0.0 0.2 0.0 0.3 2.0 0.6
SWE 6.5 3.3 0.0 5.8 2.0 2.6
TUR 0.0 0.3 3.3 1.0 0.0 0.6

110
Ann
ex Table 70: Distribution of core organisation by countries and by theme (LIFESCI), FP6 instruments (IP, NoE, STREP) (%)
LIFESCI_6_IP LIFESCI_6_NOE LIFESCI_6_STREP
core all core all core all
AUT 0.0 2.5 0.0 2.5 0.0 4.3
BEL 0.0 5.1 4.2 4.4 0.0 3.2
CHE 10.0 3.5 8.3 3.9 7.4 4.2
CYP 0.0 0.0 0.0 0.0 0.4 0.0
CZE 3.3 0.8 0.0 1.1 0.0 1.1
DEU 23.3 16.2 37.5 15.1 29.6 17.0
DNK 3.3 3.6 0.0 3.7 3.7 4.0
ESP 3.3 6.0 4.2 5.8 3.7 5.6
FIN 0.0 2.1 0.0 1.4 3.7 2.7
FRA 10.0 11.1 4.2 12.5 18.5 11.3
GBR 26.7 13.1. 16.7 13.6 11.1 10.5
GRC 0.0 1.5 0.0 0.7 0.0 0.8
HUN 0.0 0.9 0.0 1.8 0.0 1.7
IRL 0.0 0.0 0.0 0.7 0.0 0.7
ISR 0.0 1.1 0.0 2.3 0.0 2.3
ITA 0.0 11.9 4.2 12.5 3.7 12.1
NLD 10.0 4.5 12.5 5.1 14.8 4.4
NOR 0.0 0.7 0.0 0.4 0.0 1.3
POL 0.0 1.4 0.0 2.1 0.0 2.0
PRT 0.0 0.7 0.0 1.4 0.0 0.9
RUS 0.0 0.4 0.0 0.4 0.0 0.3
SVK 0.0 0.3 0.0 0.2 0.0 0.4
SWE 10.0 6.2 8.3 4.4 3.7 4.0
TUR 0.0 0.1 0.0 0.4 0.0 0.0
Table 71: Distribution of core organisations in FP4 to FP6 by organisation type and theme (AERO) of CSC/STREP instrument
AERO_4_CSC AERO_5_CSC AERO_6_STREP
core all core all core all
CON 0.0 0.9 0.0 0.9 0.0 1.3
EDU 0.0 34.9 0.0 23.5 20.0 30.5
GOV 0.0 0.9 0.0 1.0 0.0 1.3
IND 77.8 42.4 78.6 54.1 56.0 39.2
OTH 0.0 3.4 0.0 6.7 0.0 5.3
ROR 22.2 17.4 21.4 13.7 24.0 22.3

111
Ana
lysis
of N
etw
orks
in E
urop
ean
Fram
ewor
k Pr
ogra
mm
es (1
984-
2006
)Table 72: Distribution of core organisations in FP4 to FP6 by organisation type and theme (ENV) of CSC/STREP instrument
ENV_4_CSC ENV_5_CSC ENV_6_STREP
core all core all core all
CON 0.0 2.0 0.0 2.3 0.0 2.3
EDU 43.1 34.5 34.9 29.8 24.3 26.5
GOV 2.0 3.4 1.6 6.8 0.0 4.0
IND 3.9 32.3 1.6 26.6 18.9 34.5
OTH 0.0 2.9 0.0 11.6 0.0 8.9
ROR 51.0 24.3 61.9 22.3 56.8 23.2
Table 73: Distribution of core organisations in FP4 to FP6 by organisation type and theme (ICT) of CSC/STREP instrument
ICT_4_CSC ICT_5_CSC ICT_6_STREP
core all core all core all
CON 0.0 2.8 0.0 2.3 0.0 1.5
EDU 15.7 15.0 35.1 25.0 44.9 29.3
GOV 0.0 2.2 0.0 4.6 0.0 3.8
IND 62.7 64.1 37.8 41.1 28.6 36.2
OTH 0.0 3.7 0.0 13.6 0.0 14.4
ROR 21.6 11.9 27.0 13.0 26.5 14.5
Table 74: Distribution of core organisations in FP4 to FP6 by organisation type and theme (LIFESCI) of CSC/STREP instrument
LIFESCI_4_CSC LIFESCI_5_CSC LIFESCI_6_STREP
core all core all core all
CON 0.0 0.3 0.0 0.3 0.0 0.4
EDU 55.3 47.5 68.8 45.0 63.0 48.7
GOV 0.0 1.4 0.0 2.5 0.0 0.4
IND 2.6 20.2 4.2 14.3 3.7 18.2
OTH 0.0 2.1 0.0 5.0 0.0 3.9
ROR 42.1 27.8 27.1 32.5 33.3 28.0
Table 75: Distribution of core organisations by organisation type and theme (AERO) of FP6 instruments
AERO_6_IP AERO_6_NoE AERO_6_STREP
core all core all core all
CON 0.0 1.0 0.0 0.0 0.0 1.3
EDU 12.5 23.0 0.0 34.9 20.0 30.5
GOV 0.0 3.2 0.0 2.3 0.0 1.3
IND 66.7 42.5 14.3 11.6 56.0 39.2
OTH 0.0 9.4 0.0 7.0 0.0 5.3
ROR 20.8 20.3 85.7 44.2 24.0 22.3

112
Ann
ex Table 76: Distribution of core organisations by organisation type and theme (ENV) of FP6 instruments
ENV_6_IP ENV_6_NoE ENV_6_STREP
core all core all core all
CON 0.0 1.6 0.0 0.7 0.0 2.3
EDU 31.8 29.5 57.1 44.3 24.3 26.5
GOV 0.0 5.1 0.0 1.8 0.0 4.0
IND 18.2 29.6 0.0 13.6 18.9 34.5
OTH 0.0 10.1 0.0 3.3 0.0 8.9
ROR 50.0 23.3 42.9 36.3 56.8 23.2
Table 77: Distribution of core organisations by organisation type and theme (ICT) of FP6 instruments
ICT_6_IP ICT_6_NoE ICT_6_STREP
core all core all core all
CON 0.0 1.6 0.0 0.0 0.0 1.5
EDU 15.2 29.1 66.7 62.9 44.9 29.3
GOV 0.0 2.8 0.0 0.8 0.0 3.8
IND 63.0 39.6 10.0 12.0 28.6 36.2
OTH 0.0 11.7 0.0 4.4 0.0 14.4
ROR 21.7 14.8 23.3 19.9 26.5 14.5
Table 78: Distribution of core organisations by organisation type and theme (LIFESCI) of FP6 instruments
LIFESCI_6_IP LIFESCI_6_NoE LIFESCI_6_STREP
core all core all core all
CON 0.0 0.5 0.0 0.2 0.0 0.4
EDU 60.0 46.5 79.2 53.0 63.0 48.7
GOV 0.0 0.4 0.0 0.2 0.0 0.4
IND 3.3 20.0 0.0 11.1 3.7 18.2
OTH 0.0 4.1 0.0 7.0 0.0 3.9
ROR 36.7 28.2 20.8 28.0 33.3 28.0

113
Ana
lysis
of N
etw
orks
in E
urop
ean
Fram
ewor
k Pr
ogra
mm
es (1
984-
2006
)
3. F
igur
es
Figu
re 2
2:
Net
wor
k of
cor
e or
gani
sati
ons
(AER
O_4
_CSC
)

114
Ann
ex
Figu
re 2
3:
Net
wor
k of
cor
e or
gani
sati
ons
(AER
O_5
_CSC
)
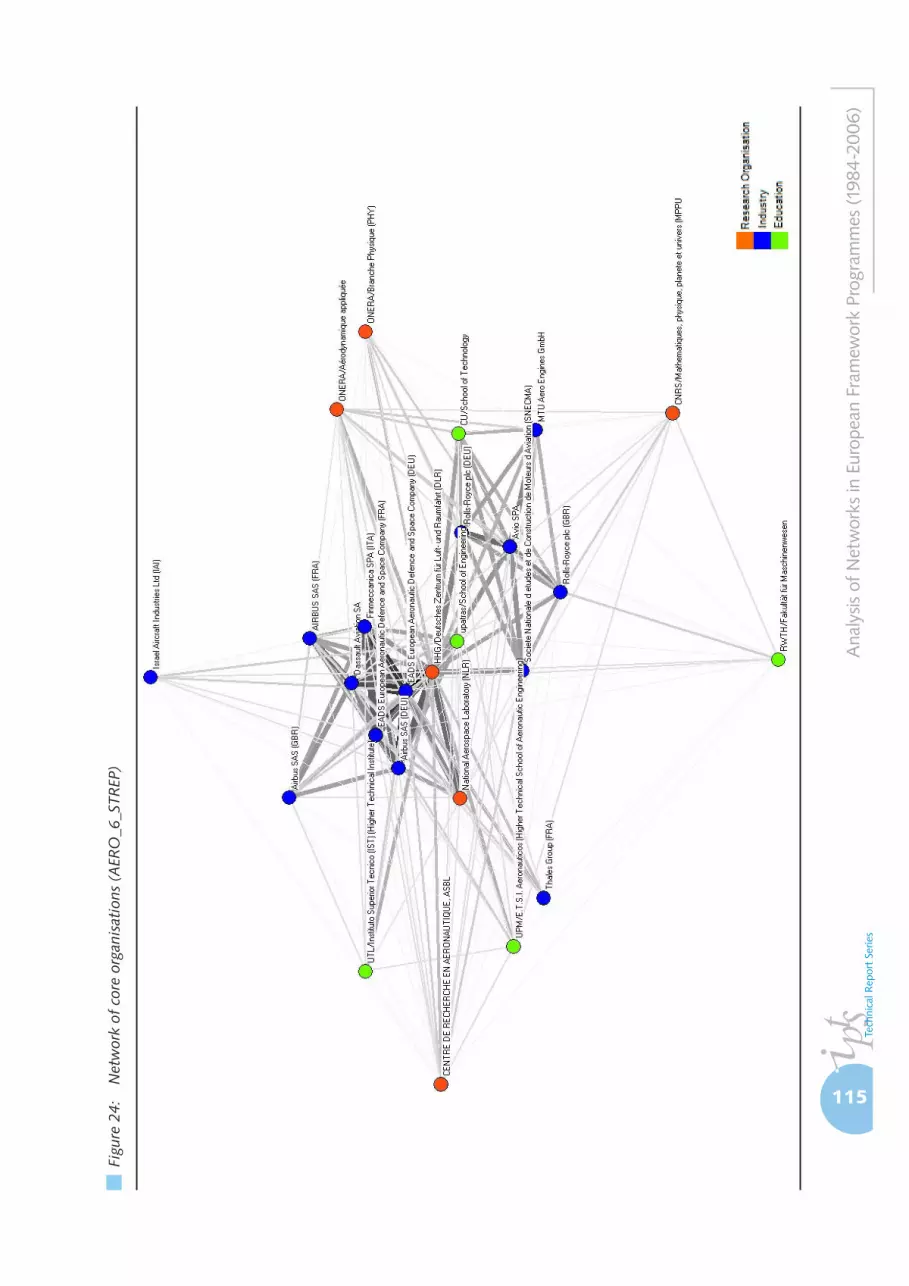
115
Ana
lysis
of N
etw
orks
in E
urop
ean
Fram
ewor
k Pr
ogra
mm
es (1
984-
2006
)
Figu
re 2
4:
Net
wor
k of
cor
e or
gani
sati
ons
(AER
O_6
_STR
EP)

116
Ann
ex
Figu
re 2
5:
Net
wor
k of
cor
e or
gani
sati
ons
(AER
O_6
_IP)

117
Ana
lysis
of N
etw
orks
in E
urop
ean
Fram
ewor
k Pr
ogra
mm
es (1
984-
2006
)
Figu
re 2
6:
Net
wor
k of
cor
e or
gani
sati
ons
(AER
O_6
_NoE
)

118
Ann
ex
Figu
re 2
7:
Net
wor
k of
cor
e or
gani
sati
ons
(EN
V_4
_CSC
)
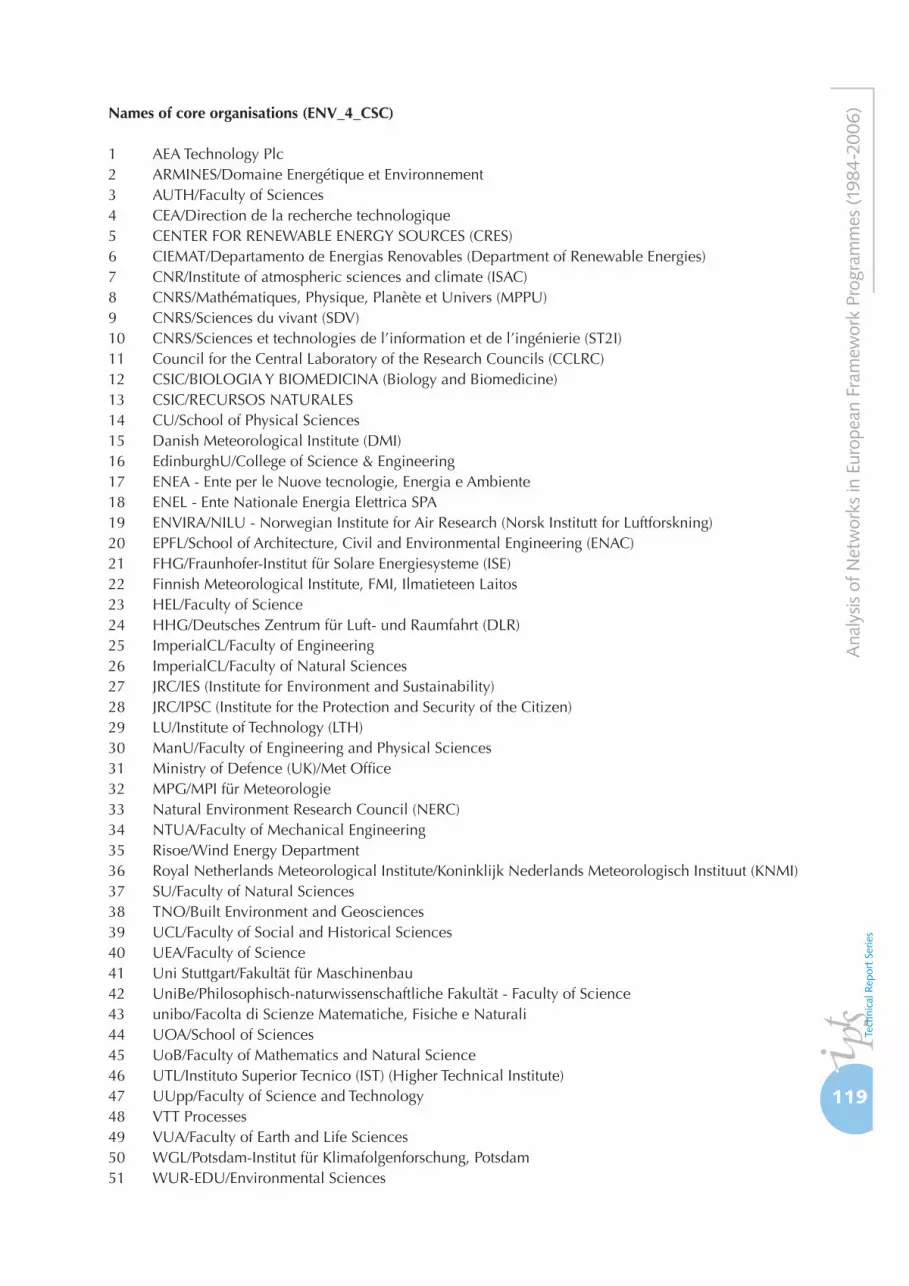
119
Ana
lysis
of N
etw
orks
in E
urop
ean
Fram
ewor
k Pr
ogra
mm
es (1
984-
2006
)Names of core organisations (ENV_4_CSC)
1 AEA Technology Plc2 ARMINES/Domaine Energétique et Environnement3 AUTH/Faculty of Sciences4 CEA/Direction de la recherche technologique5 CENTER FOR RENEWABLE ENERGY SOURCES (CRES)6 CIEMAT/Departamento de Energias Renovables (Department of Renewable Energies)7 CNR/Institute of atmospheric sciences and climate (ISAC)8 CNRS/Mathématiques, Physique, Planète et Univers (MPPU)9 CNRS/Sciences du vivant (SDV)10 CNRS/Sciences et technologies de l’information et de l’ingénierie (ST2I)11 Council for the Central Laboratory of the Research Councils (CCLRC)12 CSIC/BIOLOGIA Y BIOMEDICINA (Biology and Biomedicine)13 CSIC/RECURSOS NATURALES14 CU/School of Physical Sciences15 Danish Meteorological Institute (DMI)16 EdinburghU/College of Science & Engineering17 ENEA - Ente per le Nuove tecnologie, Energia e Ambiente18 ENEL - Ente Nationale Energia Elettrica SPA19 ENVIRA/NILU - Norwegian Institute for Air Research (Norsk Institutt for Luftforskning)20 EPFL/School of Architecture, Civil and Environmental Engineering (ENAC)21 FHG/Fraunhofer-Institut für Solare Energiesysteme (ISE)22 Finnish Meteorological Institute, FMI, Ilmatieteen Laitos23 HEL/Faculty of Science24 HHG/Deutsches Zentrum für Luft- und Raumfahrt (DLR)25 ImperialCL/Faculty of Engineering26 ImperialCL/Faculty of Natural Sciences27 JRC/IES (Institute for Environment and Sustainability)28 JRC/IPSC (Institute for the Protection and Security of the Citizen)29 LU/Institute of Technology (LTH)30 ManU/Faculty of Engineering and Physical Sciences31 Ministry of Defence (UK)/Met Office32 MPG/MPI für Meteorologie33 Natural Environment Research Council (NERC)34 NTUA/Faculty of Mechanical Engineering35 Risoe/Wind Energy Department36 Royal Netherlands Meteorological Institute/Koninklijk Nederlands Meteorologisch Instituut (KNMI)37 SU/Faculty of Natural Sciences38 TNO/Built Environment and Geosciences39 UCL/Faculty of Social and Historical Sciences40 UEA/Faculty of Science41 Uni Stuttgart/Fakultät für Maschinenbau42 UniBe/Philosophisch-naturwissenschaftliche Fakultät - Faculty of Science43 unibo/Facolta di Scienze Matematiche, Fisiche e Naturali44 UOA/School of Sciences45 UoB/Faculty of Mathematics and Natural Science46 UTL/Instituto Superior Tecnico (IST) (Higher Technical Institute)47 UUpp/Faculty of Science and Technology48 VTT Processes49 VUA/Faculty of Earth and Life Sciences50 WGL/Potsdam-Institut für Klimafolgenforschung, Potsdam51 WUR-EDU/Environmental Sciences

120
Ann
ex
Figu
re 2
8:
Net
wor
k of
cor
e or
gani
sati
ons
(EN
V_5
_CSC
)

121
Ana
lysis
of N
etw
orks
in E
urop
ean
Fram
ewor
k Pr
ogra
mm
es (1
984-
2006
)Names of core organisations (ENV_5_CSC)
1 AUTH/Faculty of Engineering2 AUTH/Faculty of Sciences3 BAS/Department of Earth Sciences4 CEA/Direction des Sciences de la Matiere5 Center For Renewable Energy Sources (Cres)6 Centro Elettronico Sperimentale Italiano (CESI) Giacinto Motta SPA7 CIEMAT/Departamento de Energias Renovables (Department of Renewable Energies)8 CNR/Institute of atmospheric sciences and climate (ISAC)9 CNRS/Environnement et Développement Durable10 CNRS/Mathématiques, Physique, Planète et Univers (MPPU)11 CNRS/Sciences du vivant (SDV)12 CNRS/Sciences et technologies de l’information et de l’ingénierie (ST2I)13 CNRS/Scientifique Chimie (SC)14 Csic/Ciencias Y Tecnologia Quimicas15 Csic/Recursos Naturales16 CU/School of Physical Sciences17 Danish Meteorological Institute (DMI)18 DUT/Faculty of Civil Engineering and Geosciences19 EAWAG Eidgenössische Anstalt für Wasserversorgung - Swiss Federal Institute Of Environmental S&T20 ECN/Hydrogen and Clean Fossil Fuels21 EdinburghU/College of Science & Engineering22 electricite de France (EDF)23 ENEA - Ente per le Nuove tecnologie, Energia e Ambiente24 ENVIRA/NILU - Norwegian Institute for Air Research (Norsk Institutt for Luftforskning)25 EPFL/School of Architecture, Civil and Environmental Engineering (ENAC)26 FHG/Fraunhofer-Institut für Solare Energiesysteme (ISE)27 Finnish Meteorological Institute, FMI, Ilmatieteen Laitos28 FV Berlin/Institut für Gewässerökologie und Binnenfischerei29 Geological Survey of Denmark and Greenland (GEUS)30 GU/Faculty of Natural Science31 HEL/Faculty of Science32 Hellenic Centre For Marine Research33 HHG/Alfred-Wegener-Institut für Polar- und Meeresforschung (AWI)34 HHG/Deutsches Zentrum für Luft- und Raumfahrt (DLR)35 HHG/Forschungszentrum Geesthacht (GKSS)36 HHG/Forschungszentrum Jülich (FZJ)37 HHG/Umweltforschungszentrum Leipzig-Halle (UFZ)38 ImperialCL/Faculty of Engineering39 Institut Français de Recherche pour l Exploitation de la Mer (IFREMER)40 Istituto Nazionale di Geofisica e Vulcanologia (INGV)41 JRC/IES (Institute for Environment and Sustainability)42 KU/Faculty of Sciences43 LeedsU/Faculty of Environment44 Ministry of Defence (UK)/Met Office45 MPG/MPI für Meteorologie46 Natural Environment Research Council (NERC)47 PAS/Division VII Earth and Mining Sciences48 Royal Netherlands Institute for Sea Research (NIOZ)49 Royal Netherlands Meteorological Institute/Koninklijk Nederlands Meteorologisch Instituut (KNMI)50 SotonU/Faculty of Engineering, Science and Mathematics51 SU/Faculty of Natural Sciences52 Swedish Meteorological and Hydrological Institute - Sveriges meteorologiska och hydrologiska institut (SMHI)53 SYKE/Research Department54 TNO/Built Environment and Geosciences55 UEA/Faculty of Science56 Uni Stuttgart/Fakultät für Maschinenbau57 UniBe/Philosophisch-naturwissenschaftliche Fakultät - Faculty of Science58 UOA/School of Sciences59 UoB/Faculty of Mathematics and Natural Science60 UP VI/Pôle Espace Environnement ecologie61 UPS/UFR Sciences de la Vie et de la Terre (SVT)62 UTL/Instituto Superior Tecnico (IST) (Higher Technical Institute)63 UU/Faculty of Geosciences

122
Ann
ex
Figu
re 2
9:
Net
wor
k of
cor
e or
gani
sati
ons
(EN
V_6
_STR
EP)
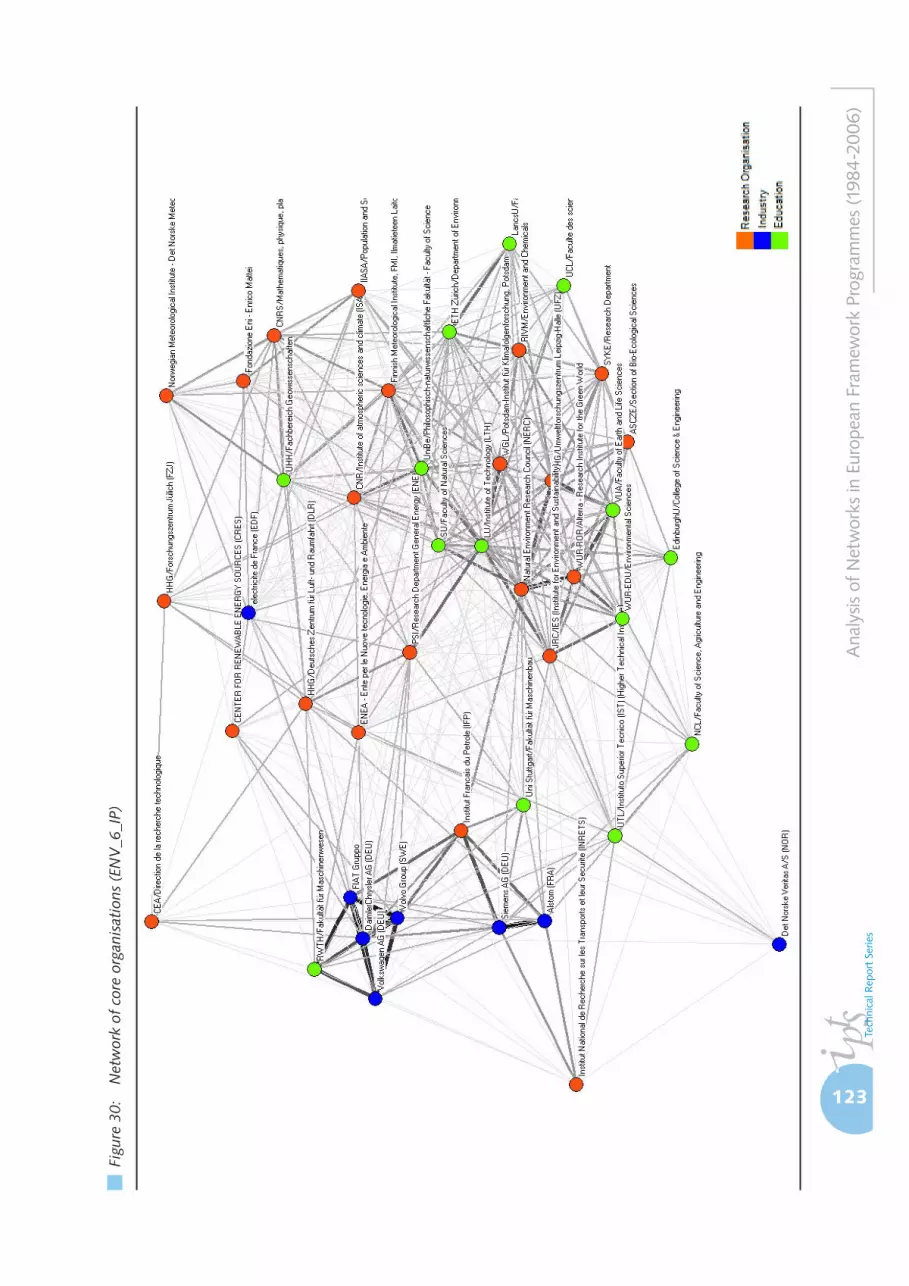
123
Ana
lysis
of N
etw
orks
in E
urop
ean
Fram
ewor
k Pr
ogra
mm
es (1
984-
2006
)
Figu
re 3
0:
Net
wor
k of
cor
e or
gani
sati
ons
(EN
V_6
_IP)

124
Ann
ex
Figu
re 3
1:
Net
wor
k of
cor
e or
gani
sati
ons
(EN
V_6
_NoE
)

125
Ana
lysis
of N
etw
orks
in E
urop
ean
Fram
ewor
k Pr
ogra
mm
es (1
984-
2006
)
Figu
re 3
2:
Net
wor
k of
cor
e or
gani
sati
ons
(IC
T_4_
CSC
)
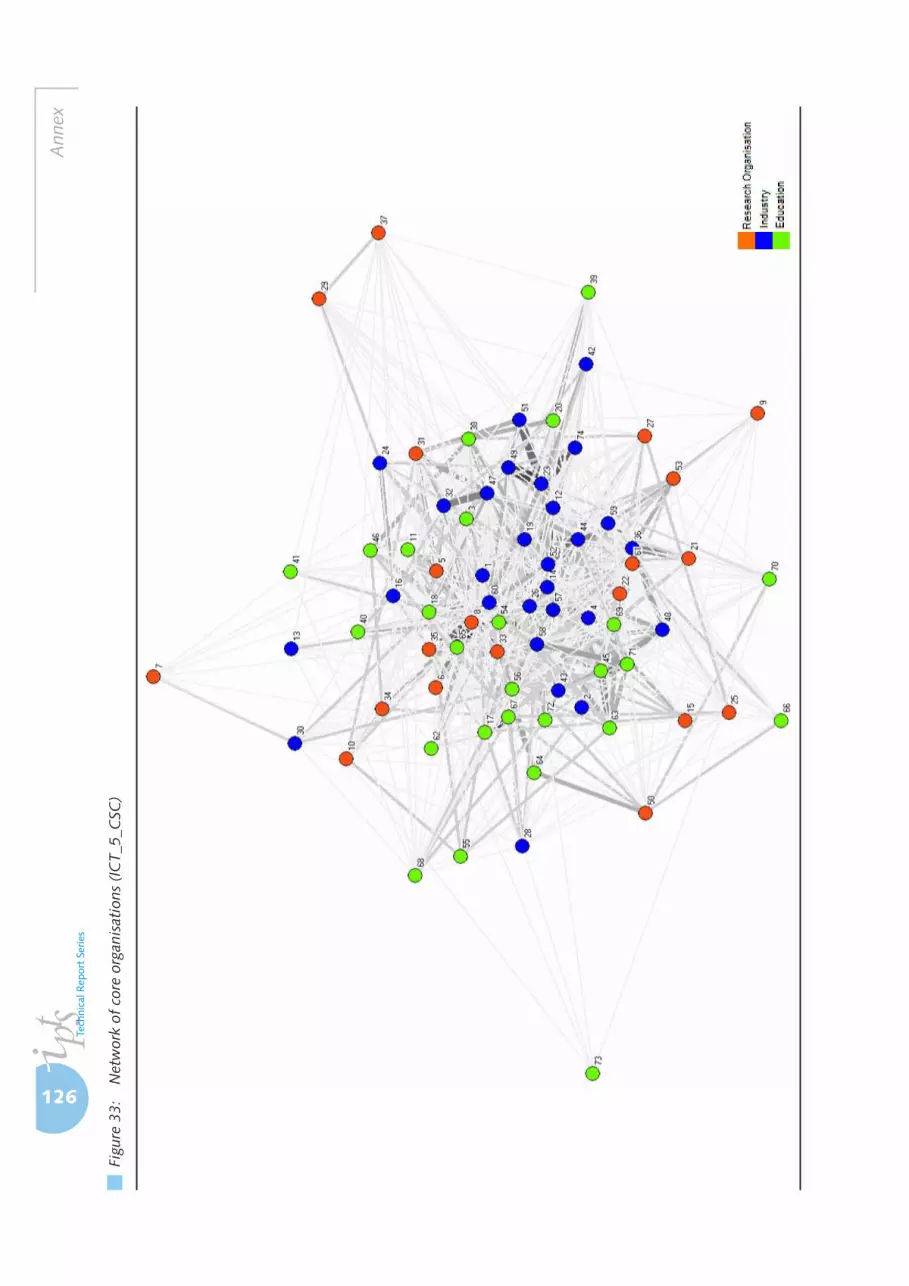
126
Ann
ex
Figu
re 3
3:
Net
wor
k of
cor
e or
gani
sati
ons
(IC
T_5_
CSC
)

127
Ana
lysis
of N
etw
orks
in E
urop
ean
Fram
ewor
k Pr
ogra
mm
es (1
984-
2006
)Names of core organisations (ICT_5_CSC)
1 Alcatel-Lucent (FRA) 2 Atos Origin (ESP)3 BrisU/Faculty of Engineering4 British Telecom PLC (BT) (GBR) 5 CEA/Direction de la recherche technologique6 CEA/Direction des Sciences de la Matière7 CERTH/Informatics and Telematics Institute (I.T.I.)8 CNRS/Mathématiques, Physique, Planète et Univers (MPPU)9 Council for the Central Laboratory of the Research Councils (CCLRC)10 Csic/Ciencias Y Tecnología Físicas11 CU/School of Technology12 DaimlerChrysler AG (DEU) 13 Datamat Ingegneria die Sistemi SPA14 Deutsche Telekom AG15 Deutsches Forschungszentrum für Künstliche Intelligenz GmbH16 EADS European Aeronautic Defence and Space Company (FRA) 17 EPFL/School of Computer and Communication Sciences (I&C)18 EPFL/School of Engineering (STI)19 Ericsson AB (Telefonaktiebolaget LM Ericsson) (SWE) 20 ETH Zürich/Department of Information Technology and Electrical Engineering (D-ITET)21 FHG/Fraunhofer-Institut für Graphische Datenverarbeitung (IGD)22 FHG/Fraunhofer-Institut für Offene Kommunikationssysteme (FOKUS)23 FIAT Gruppo24 Finmeccanica SPA (ITA) 25 FORTH/Institute Of Computer Science (ICS)26 France Telecom (FRA) 27 Fraunhofer-Gesellschaft zur Förderung der angewandten Forschung e.V.28 Giunti Multimedia SRL29 HHG/Deutsches Zentrum für Luft- und Raumfahrt (DLR)30 Ibermatica SA31 IMEC/Microsystems, Components & Packaging (MCP)32 Infineon Technologies AG (DEU) 33 INRIA/Unité de Recherche Rocquencourt34 Instituto Nazionale per la Fisica della Materia (INFM)35 Instituto Trentino di Cultura36 Intracom SA37 JRC/IES (Institute for Environment and Sustainability)38 KUL/Faculty of Engineering39 LancsU/Faculty of Science and Technology40 LIU/Institute of Technology41 ManU/Faculty of Engineering and Physical Sciences42 Mizar Automazione SPA43 Motorola INC (FRA) 44 Nokia Corporation (FIN) 45 NTUA/Faculty of Electrical and Computer Engineering46 OU/Mathematical, Physical, & Life Sciences Division47 Philips NV (NLD) 48 Portugal Telecom SA49 Renault SAS (FRA) 50 Research Academic Computer Technology Institute51 Robert Bosch GmbH (DEU) 52 Siemens AG (DEU) 53 SINTEF Information and Communication Technology (ICT)54 SotonU/Faculty of Engineering, Science and Mathematics55 SSSUP/DIVISIONE RICERCHE56 SurreyU/Faculty of Engineering and Physical Sciences57 Telecom Italia SPA (ITA) 58 Telefonica de Espana SA59 Telenor ASA60 Thales Group (FRA) 61 TNO/Defence, Security, Safety62 TU Wien/Fakultät für Informatik63 UCL/Faculty of Engineering Sciences64 UCY/Faculty of Pure and Applied Sciences65 UJF/Direction Scientifique Mathématiques et Informatique (DS1)66 Uni Stuttgart/Fakultät für Maschinenbau67 UNIGE.ch/Faculty of Sciences68 unige.it/Facolta Di Science Mathematiche Fisiche E Naturali69 UniRoma1/Faculty Of Mathematics And Natural Sciences70 Univ. Patras/School of Engineering71 UPC/Departament de Teoria del Senyal i Comunicacions (TSC)72 UPM/E.T.S.I. Telecomunicacion (Higher Technical School of Telecommunication Engineering)73 UvA/Faculty of Social and Behavioural Sciences
74 Volvo Group (SWE)

128
Ann
ex
Figu
re 3
4:
Net
wor
k of
cor
e or
gani
sati
ons
(IC
T_6_
STR
EP)
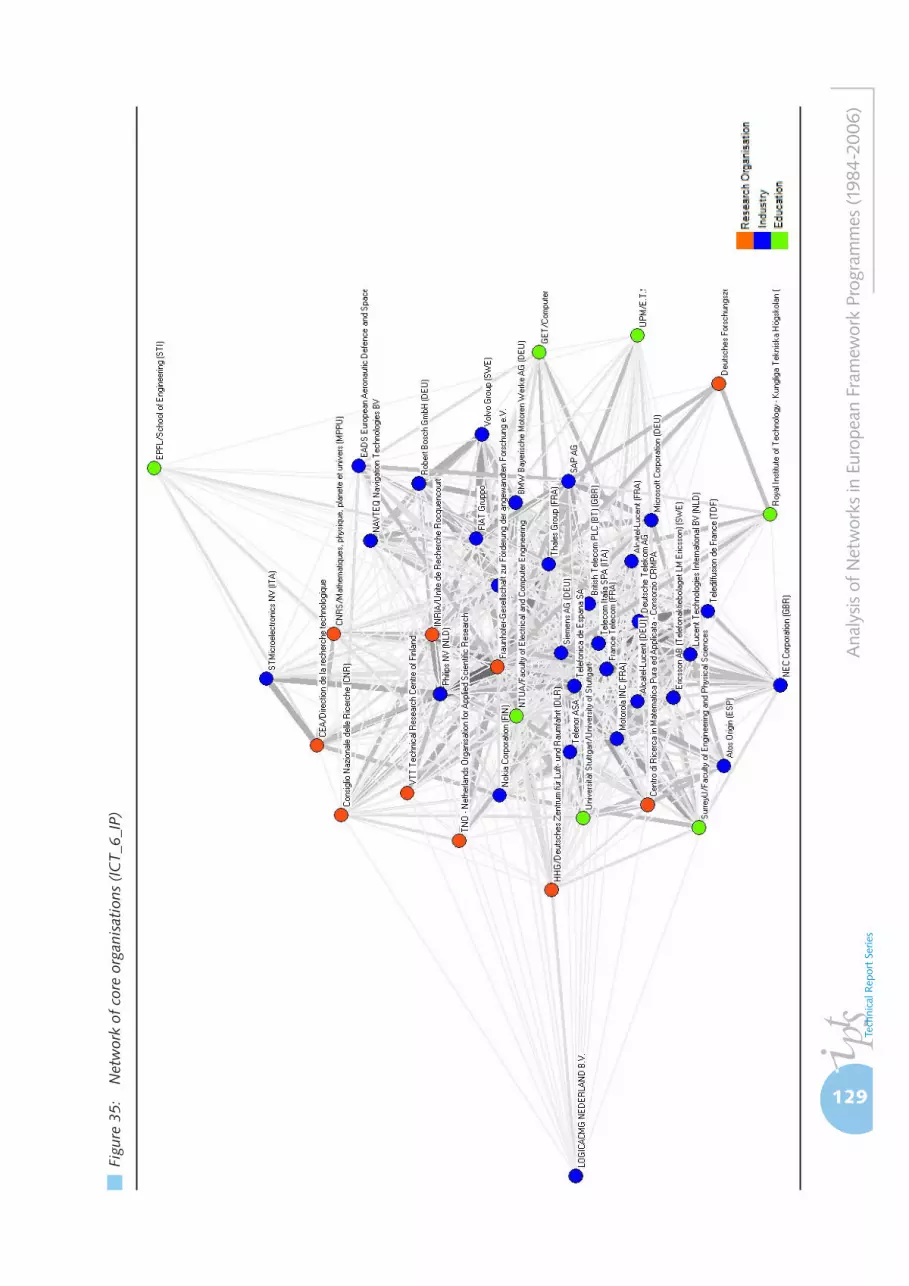
129
Ana
lysis
of N
etw
orks
in E
urop
ean
Fram
ewor
k Pr
ogra
mm
es (1
984-
2006
)
Figu
re 3
5:
Net
wor
k of
cor
e or
gani
sati
ons
(IC
T_6_
IP)
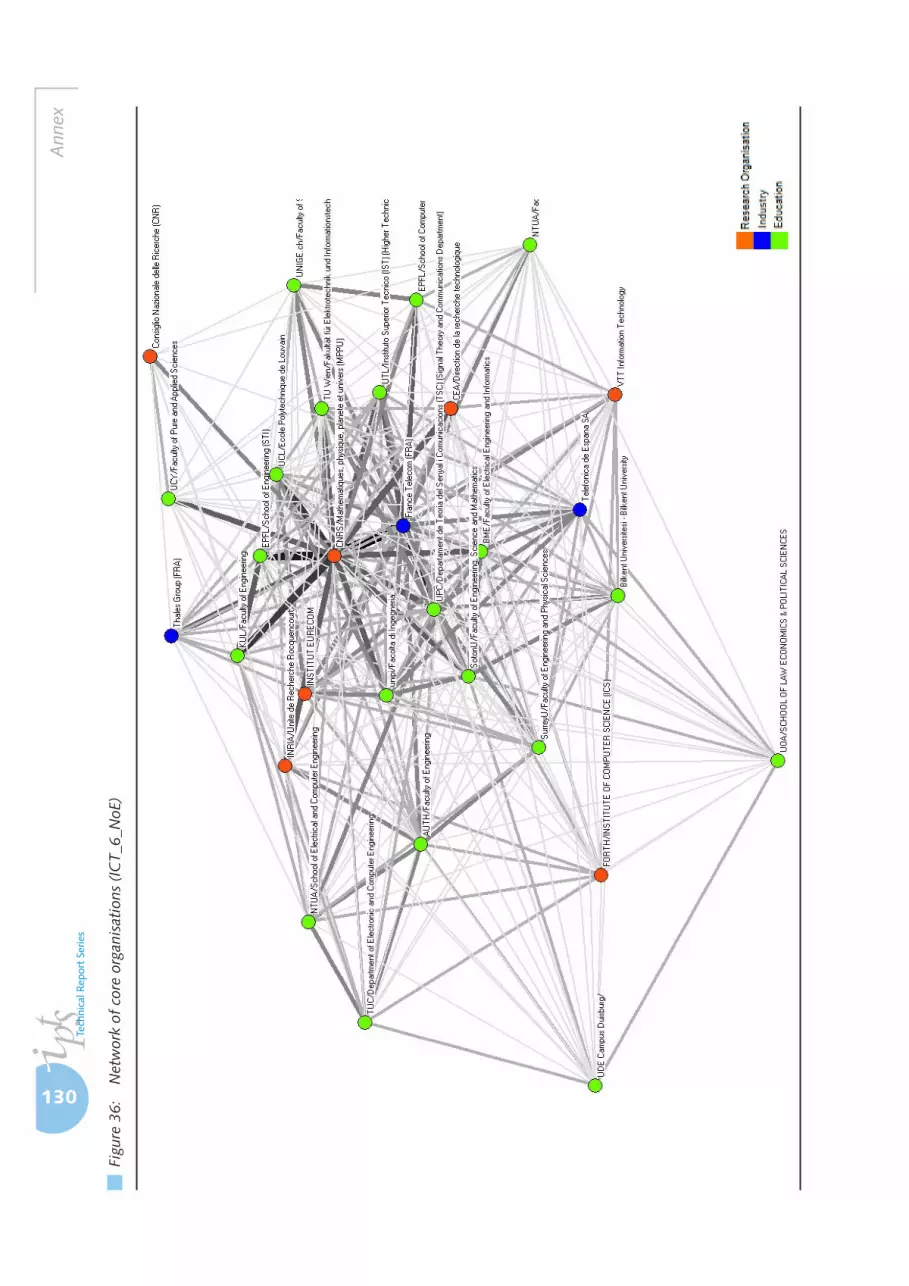
130
Ann
ex
Figu
re 3
6:
Net
wor
k of
cor
e or
gani
sati
ons
(IC
T_6_
NoE
)
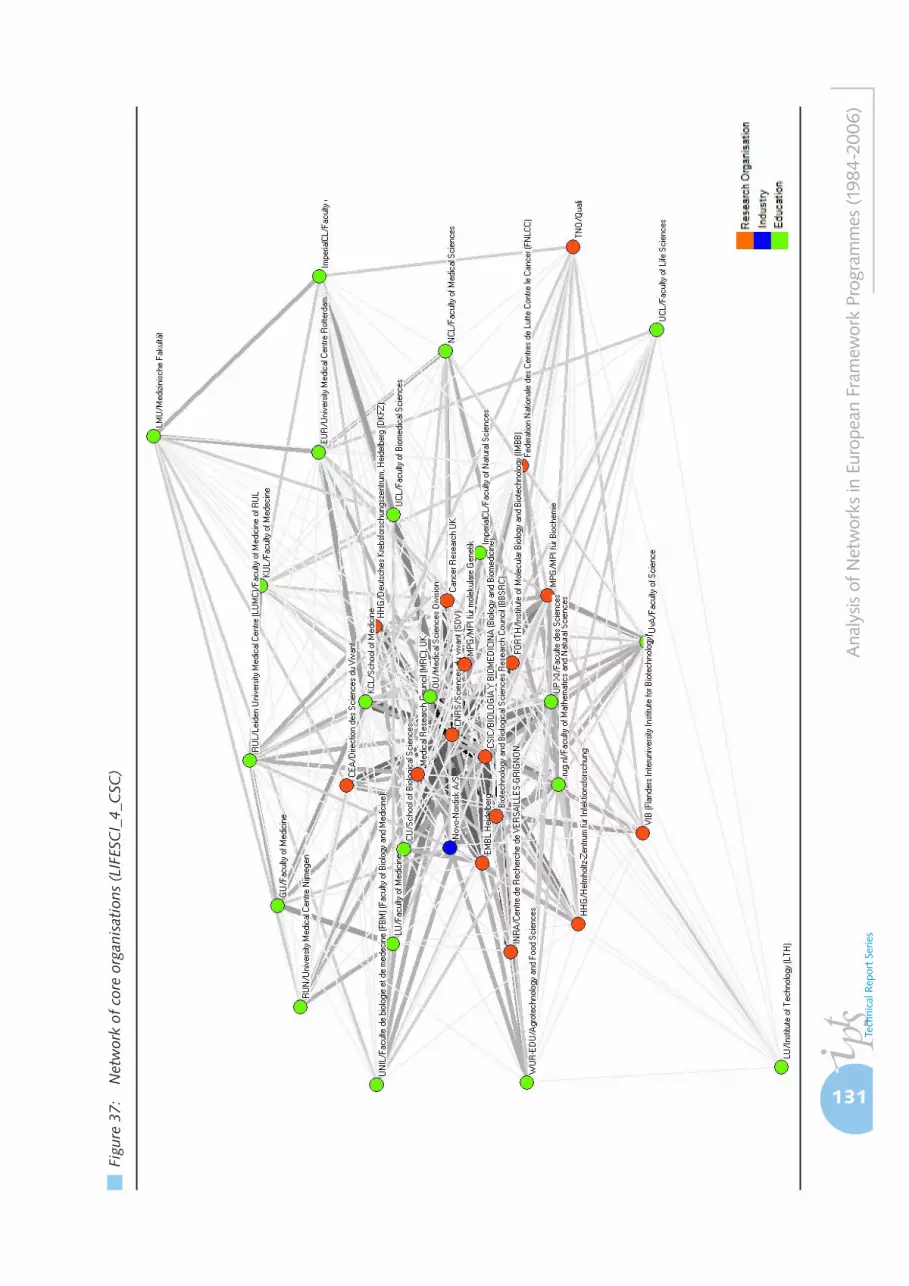
131
Ana
lysis
of N
etw
orks
in E
urop
ean
Fram
ewor
k Pr
ogra
mm
es (1
984-
2006
)
Figu
re 3
7:
Net
wor
k of
cor
e or
gani
sati
ons
(LIF
ESC
I_4_
CSC
)

132
Ann
ex
Figu
re 3
8:
Net
wor
k of
cor
e or
gani
sati
ons
(LIF
ESC
I_5_
CSC
)

133
Ana
lysis
of N
etw
orks
in E
urop
ean
Fram
ewor
k Pr
ogra
mm
es (1
984-
2006
)
Figu
re 3
9:
Net
wor
k of
cor
e or
gani
sati
ons
(LIF
ESC
I_6_
STR
EP)

134
Ann
ex
Figu
re 4
0:
Net
wor
k of
cor
e or
gani
sati
ons
(LIF
ESC
I_6_
IP)
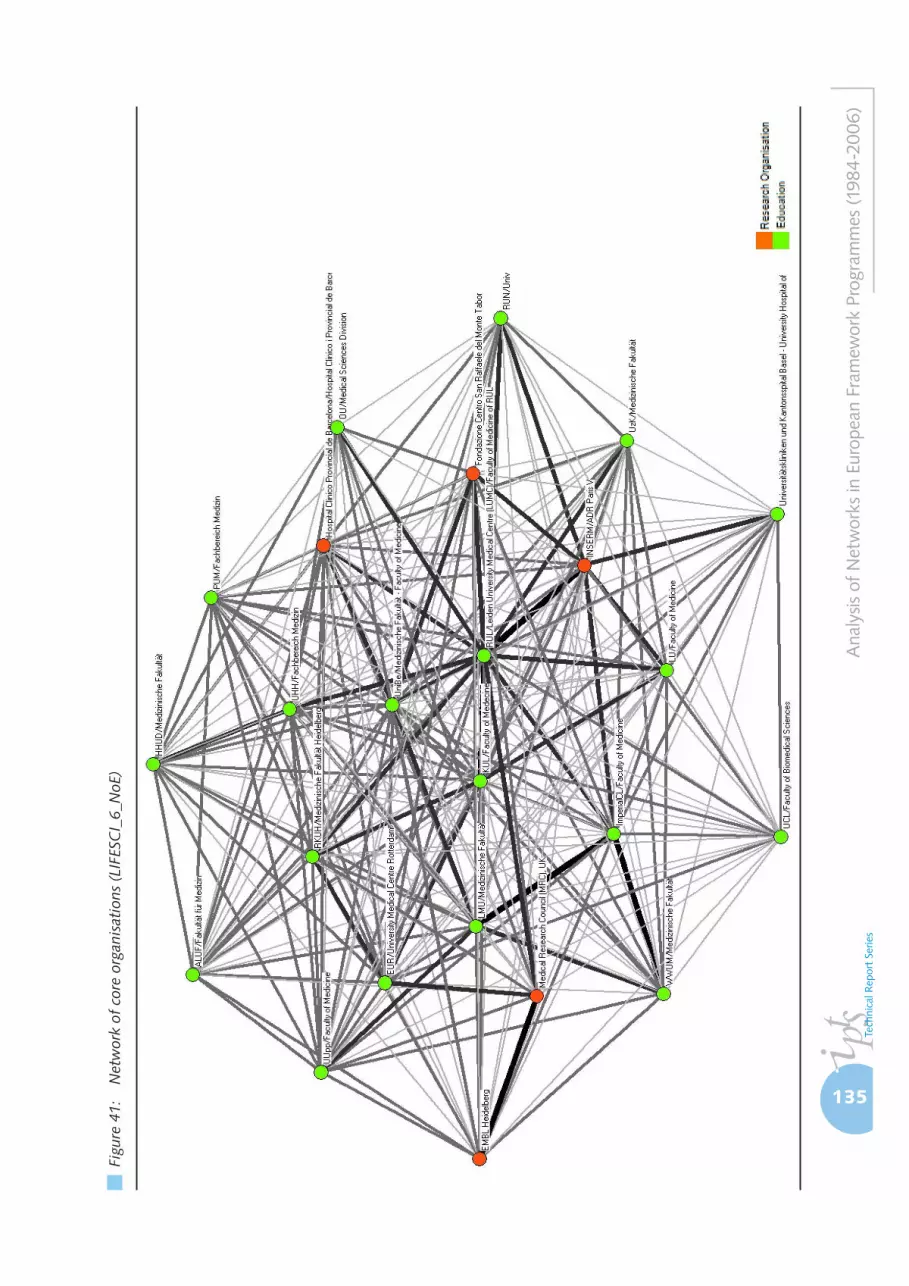
135
Ana
lysis
of N
etw
orks
in E
urop
ean
Fram
ewor
k Pr
ogra
mm
es (1
984-
2006
)
Figu
re 4
1:
Net
wor
k of
cor
e or
gani
sati
ons
(LIF
ESC
I_6_
NoE
)


137
European Commission
EUR 24759 EN — Joint Research Centre — Institute for Prospective Technological Studies
Title: Analysis of Networks in European Framework Programmes (1984-2006)
Authors: Barbara Heller-Schuh, Michael Barber, Luisa Henriques, Manfred Paier, Dimitrios Pontikakis, Thomas Scherngell, Giuseppe A. Veltri, Matthias Weber
Luxembourg: Publications Office of the European Union2011
EUR — Scientific and Technical Research series — ISSN 1018-5593ISBN 978-92-79-19714-7 doi:10.2791/54167
Abstract
In line with the Europe 2020 vision, there is an increasing need for adequate analytical tools to monitor
progress towards the European Research Area (ERA). The Framework Programme (FP) is the main
instrument of EU research policy. With 17.5 billion euros devoted to FP6 (rising to 51billion euros in
FP7), it funds a substantial proportion of collaborative research activity in the EU and is, by far, the most
prominent funding mechanism for transnational research globally. Therefore, the analysis of the structure
of European networks of collaboration in the FPs, from FP1 to FP6, is a valuable tool in understanding
the contribution of European policies in transforming the fabric of research within the ERA, as well as in
identifying a possible backbone of research actors in the ERA. Within this context, the projects "Network
analysis study on participations in Framework Programmes" conducted by ARC sys (now Austrian Institute
of Technology) and "Centrality Analysis in Research Networks" carried out by the Knowledge for Growth
Unit of the Institute for Prospective and Technological Studies (IPTS), Joint Research Centre (JRC), European
Commission, respond to the on-going need for data and analysis on the characteristics and evolution of
the ERA. This report presents findings of the above-mentioned studies and discusses them in a policy
context. In addition, it applies novel methodological tools for analysing data on FP participations and
improving our understanding of transnational networks of collaborative research.

The mission of the Joint Research Centre is to provide customer-driven scientific and technical support for
the conception, development, implementation and monitoring of European Union policies. As a service
of the European Commission, the Joint Research Centre functions as a reference centre of science and
technology for the Union. Close to the policy-making process, it serves the common interest of the Member
States, while being independent of special interests, whether private or national.
How to obtain EU publications
Our priced publications are available from EU Bookshop (http://bookshop.europa.eu), where you can place
an order with the sales agent of your choice.
The Publications Office has a worldwide network of sales agents. You can obtain their contact details by
sending a fax to (352) 29 29-42758.
138

Ana
lysi
s of
Net
wor
ks in
Eur
opea
n F
ram
ewor
k P
rogr
amm
es (
1984
-200
6)
LF-N
A-24759-E
N-C
ISBN 978-92-79-19714-7
Analysis of Networks in EuropeanFramework Programmes
(1984-2006)
EUR 24759 EN - 2011
9 789279 197147
Authors: Barbara Heller-Schuh, Michael Barber, Luisa Henriques,Manfred Paier, Dimitrios Pontikakis, Thomas Scherngell,
Giuseppe A. Veltri, Matthias Weber