analysis of food for toxic elements
TRANSCRIPT
REVIEW
Analysis of food for toxic elements
Stephen G. Capar & William R. Mindak & John Cheng
Received: 9 April 2007 /Revised: 6 June 2007 /Accepted: 11 June 2007# Springer-Verlag 2007
Abstract The levels of the toxic elements Al, As, Cd, Hg, Pband Sn are routinely monitored in food to protect theconsumer. Increasingly, the chemical forms of As and Hgare also monitored. Analyses are performed to enforceregulatory standards and to accumulate background levelsfor assessing long-term exposure. The analytical proceduresused for these activities evolve as requirements to determinelower levels arise and as both the types and sheer number ofdifferent foods that need to be analyzed increase. This reviewhighlights recent work addressing improvements in theanalysis of toxic elements in food. The topics covered includecontamination control, analytical sample treatment and thecommon analytical techniques used for food analysis.
Keywords Review . Food . Analysis . Toxic elements
AbbreviationsCRM certified reference materialCVAAS cold vapor atomic absorption spectrometryCVAFS cold vapor atomic fluorescence spectrometryETAAS electrothermal atomic absorption spectrometryFAAS flame atomic absorption spectrometryHGAAS hydride generation atomic absorption
spectrometryHGAFS hydride generation atomic fluorescence
spectrometryHPLC high-performance liquid chromatographyICP– inductively coupled plasma–atomic emission
AES spectrometryICP–MS inductively coupled plasma–mass spectrometryTDA–AAS
thermal decomposition–amalgamation–atomicabsorption spectrometry
Introduction
The most frequently monitored toxic elements in food areAs, Cd, Hg, Pb and, to a lesser extent, Al and Sn. Toxicelement levels are monitored in food both to enforceregulatory standards and to assess long-term exposure.National governments and supranational organizations suchas the European Union [1] establish regulatory standards forfood and international organizations set harmonized stan-dards to facilitate world trade and improve the health ofcitizens of all nations. The Codex Alimentarius Commission(CAC) [2] is recognized by the World Trade Organization asan international reference point for trade dispute resolution[3]. CAC has established standards for toxic elements incertain foods as listed in Table 1. In addition, the Joint FAO/WHO Expert Committee on Food Additives (JECFA) [4] hasestablished Provisional Tolerable Weekly Intakes (PTWI) oftoxic elements from food [5]. Most regulatory standards areestablished only after analytical procedures for enforcementhave been validated through interlaboratory trials or have beenshown to comply with specified analytical criteria. In addition,the procedures must use readily available technology.
Foods with the highest levels of As are fish, shellfish andseaweed. However, most of the As is in a nontoxic organicform (e.g., arsenobetaine) [6]. Certain types of seaweedsuch as Hijiki are high in both total and inorganic arsenic[7]. Typical concentrations of As in other types of foodare relatively low compared to those in seafood, and thehighest levels are found in meats and grain products [6].
Anal Bioanal ChemDOI 10.1007/s00216-007-1433-6
S. G. Capar (*) :W. R. Mindak : J. ChengU.S. Food and Drug Administration,Center for Food Safety and Applied Nutrition,Harvey W. Wiley Federal Building, 5100 Paint Branch Parkway,College Park, MD 20740-3835, USAe-mail: [email protected]
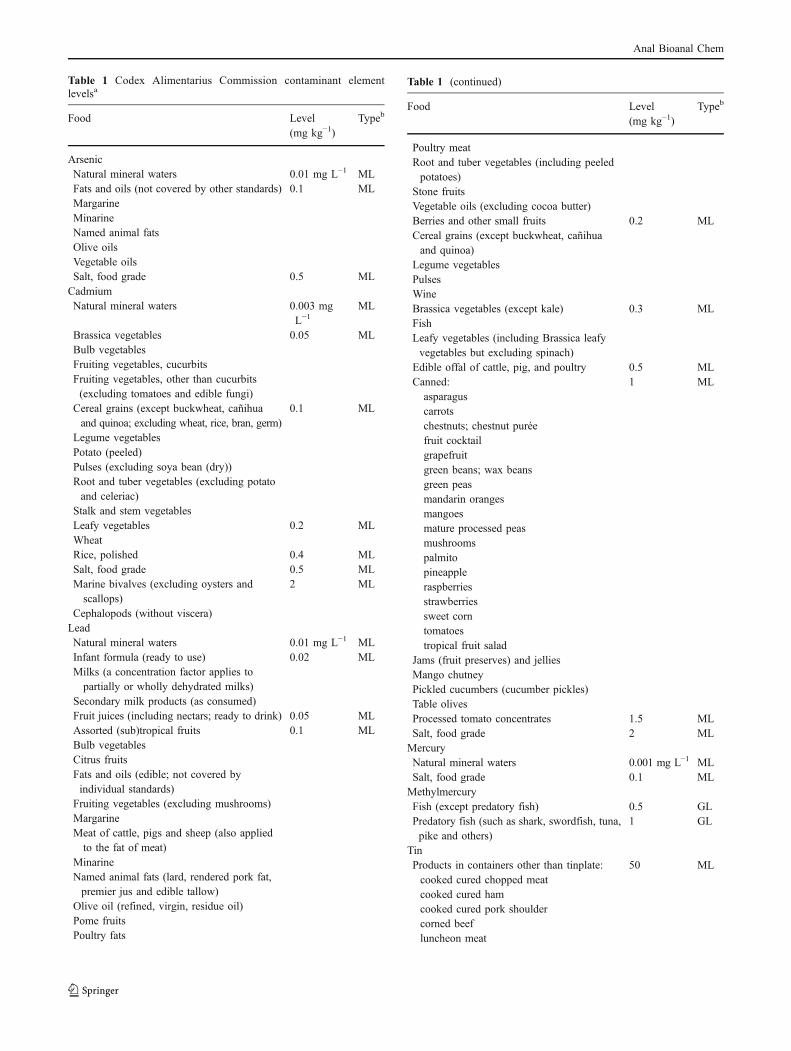
Table 1 Codex Alimentarius Commission contaminant elementlevelsa
Food Level(mg kg−1)
Typeb
ArsenicNatural mineral waters 0.01 mg L−1 MLFats and oils (not covered by other standards) 0.1 MLMargarineMinarineNamed animal fatsOlive oilsVegetable oilsSalt, food grade 0.5 MLCadmiumNatural mineral waters 0.003 mg
L−1ML
Brassica vegetables 0.05 MLBulb vegetablesFruiting vegetables, cucurbitsFruiting vegetables, other than cucurbits(excluding tomatoes and edible fungi)
Cereal grains (except buckwheat, cañihuaand quinoa; excluding wheat, rice, bran, germ)
0.1 ML
Legume vegetablesPotato (peeled)Pulses (excluding soya bean (dry))Root and tuber vegetables (excluding potatoand celeriac)
Stalk and stem vegetablesLeafy vegetables 0.2 MLWheatRice, polished 0.4 MLSalt, food grade 0.5 MLMarine bivalves (excluding oysters andscallops)
2 ML
Cephalopods (without viscera)LeadNatural mineral waters 0.01 mg L−1 MLInfant formula (ready to use) 0.02 MLMilks (a concentration factor applies topartially or wholly dehydrated milks)
Secondary milk products (as consumed)Fruit juices (including nectars; ready to drink) 0.05 MLAssorted (sub)tropical fruits 0.1 MLBulb vegetablesCitrus fruitsFats and oils (edible; not covered byindividual standards)
Fruiting vegetables (excluding mushrooms)MargarineMeat of cattle, pigs and sheep (also appliedto the fat of meat)
MinarineNamed animal fats (lard, rendered pork fat,premier jus and edible tallow)
Olive oil (refined, virgin, residue oil)Pome fruitsPoultry fats
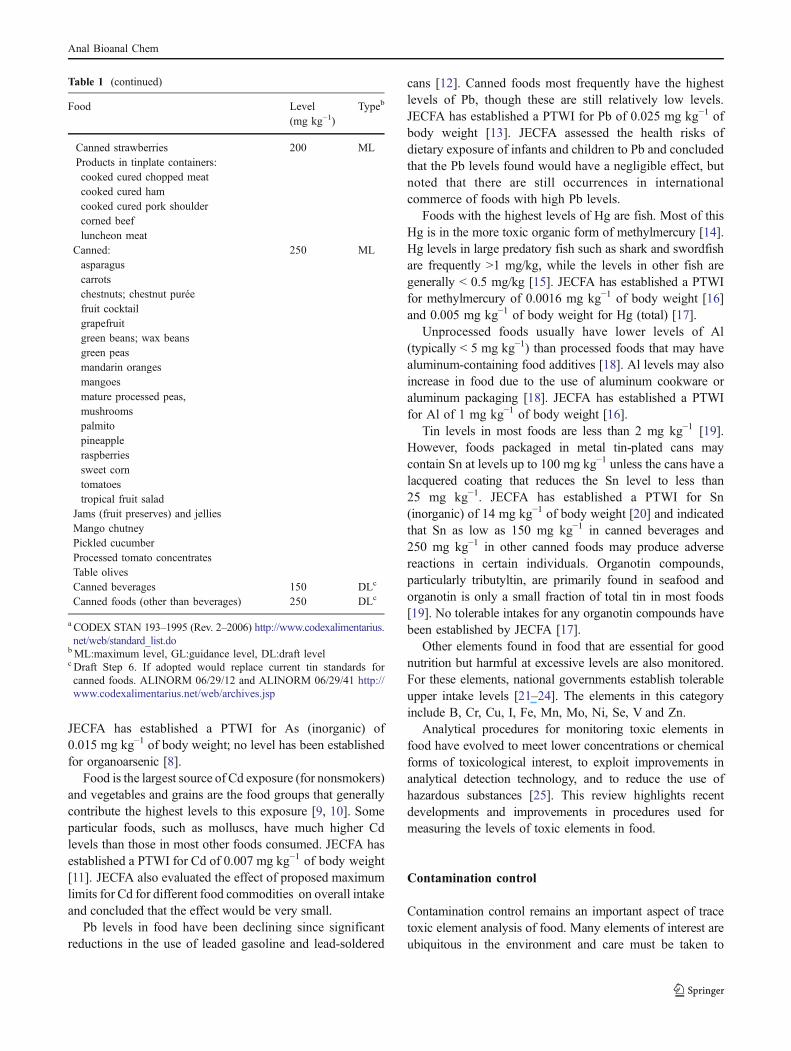
Table 1 (continued)
Food Level(mg kg−1)
Typeb
Poultry meatRoot and tuber vegetables (including peeledpotatoes)
Stone fruitsVegetable oils (excluding cocoa butter)Berries and other small fruits 0.2 MLCereal grains (except buckwheat, cañihuaand quinoa)
Legume vegetablesPulsesWineBrassica vegetables (except kale) 0.3 MLFishLeafy vegetables (including Brassica leafyvegetables but excluding spinach)
Edible offal of cattle, pig, and poultry 0.5 MLCanned: 1 MLasparaguscarrotschestnuts; chestnut puréefruit cocktailgrapefruitgreen beans; wax beansgreen peasmandarin orangesmangoesmature processed peasmushroomspalmitopineappleraspberriesstrawberriessweet corntomatoestropical fruit salad
Jams (fruit preserves) and jelliesMango chutneyPickled cucumbers (cucumber pickles)Table olivesProcessed tomato concentrates 1.5 MLSalt, food grade 2 MLMercuryNatural mineral waters 0.001 mg L−1 MLSalt, food grade 0.1 MLMethylmercuryFish (except predatory fish) 0.5 GLPredatory fish (such as shark, swordfish, tuna,pike and others)
1 GL
TinProducts in containers other than tinplate: 50 MLcooked cured chopped meatcooked cured hamcooked cured pork shouldercorned beefluncheon meat
Anal Bioanal Chem
JECFA has established a PTWI for As (inorganic) of0.015 mg kg−1 of body weight; no level has been establishedfor organoarsenic [8].
Food is the largest source of Cd exposure (for nonsmokers)and vegetables and grains are the food groups that generallycontribute the highest levels to this exposure [9, 10]. Someparticular foods, such as molluscs, have much higher Cdlevels than those in most other foods consumed. JECFA hasestablished a PTWI for Cd of 0.007 mg kg−1 of body weight[11]. JECFA also evaluated the effect of proposed maximumlimits for Cd for different food commodities on overall intakeand concluded that the effect would be very small.
Pb levels in food have been declining since significantreductions in the use of leaded gasoline and lead-soldered
cans [12]. Canned foods most frequently have the highestlevels of Pb, though these are still relatively low levels.JECFA has established a PTWI for Pb of 0.025 mg kg−1 ofbody weight [13]. JECFA assessed the health risks ofdietary exposure of infants and children to Pb and concludedthat the Pb levels found would have a negligible effect, butnoted that there are still occurrences in internationalcommerce of foods with high Pb levels.
Foods with the highest levels of Hg are fish. Most of thisHg is in the more toxic organic form of methylmercury [14].Hg levels in large predatory fish such as shark and swordfishare frequently >1 mg/kg, while the levels in other fish aregenerally < 0.5 mg/kg [15]. JECFA has established a PTWIfor methylmercury of 0.0016 mg kg−1 of body weight [16]and 0.005 mg kg−1 of body weight for Hg (total) [17].
Unprocessed foods usually have lower levels of Al(typically < 5 mg kg−1) than processed foods that may havealuminum-containing food additives [18]. Al levels may alsoincrease in food due to the use of aluminum cookware oraluminum packaging [18]. JECFA has established a PTWIfor Al of 1 mg kg−1 of body weight [16].
Tin levels in most foods are less than 2 mg kg−1 [19].However, foods packaged in metal tin-plated cans maycontain Sn at levels up to 100 mg kg−1 unless the cans have alacquered coating that reduces the Sn level to less than25 mg kg−1. JECFA has established a PTWI for Sn(inorganic) of 14 mg kg−1 of body weight [20] and indicatedthat Sn as low as 150 mg kg−1 in canned beverages and250 mg kg−1 in other canned foods may produce adversereactions in certain individuals. Organotin compounds,particularly tributyltin, are primarily found in seafood andorganotin is only a small fraction of total tin in most foods[19]. No tolerable intakes for any organotin compounds havebeen established by JECFA [17].
Other elements found in food that are essential for goodnutrition but harmful at excessive levels are also monitored.For these elements, national governments establish tolerableupper intake levels [21–24]. The elements in this categoryinclude B, Cr, Cu, I, Fe, Mn, Mo, Ni, Se, V and Zn.
Analytical procedures for monitoring toxic elements infood have evolved to meet lower concentrations or chemicalforms of toxicological interest, to exploit improvements inanalytical detection technology, and to reduce the use ofhazardous substances [25]. This review highlights recentdevelopments and improvements in procedures used formeasuring the levels of toxic elements in food.
Contamination control
Contamination control remains an important aspect of tracetoxic element analysis of food. Many elements of interest areubiquitous in the environment and care must be taken to
Table 1 (continued)
Food Level(mg kg−1)
Typeb
Canned strawberries 200 MLProducts in tinplate containers:cooked cured chopped meatcooked cured hamcooked cured pork shouldercorned beefluncheon meat
Canned: 250 MLasparaguscarrotschestnuts; chestnut puréefruit cocktailgrapefruitgreen beans; wax beansgreen peasmandarin orangesmangoesmature processed peas,mushroomspalmitopineappleraspberriessweet corntomatoestropical fruit salad
Jams (fruit preserves) and jelliesMango chutneyPickled cucumberProcessed tomato concentratesTable olivesCanned beverages 150 DLc
Canned foods (other than beverages) 250 DLc
a CODEX STAN 193–1995 (Rev. 2–2006) http://www.codexalimentarius.net/web/standard_list.do
bML:maximum level, GL:guidance level, DL:draft levelc Draft Step 6. If adopted would replace current tin standards forcanned foods. ALINORM 06/29/12 and ALINORM 06/29/41 http://www.codexalimentarius.net/web/archives.jsp
Anal Bioanal Chem
prevent contamination of the sample. Efforts must be made tominimize the potential for contamination throughout theanalytical procedure. Ideally, the preparation of the food fortrace element analysis is performed in a special clean room orat least in an area with laminar flow clean air to minimizeadventitious contamination from particles in the laboratory air[26, 27]. Other less expensive means of contamination controlsuch as the use of an environmental evaporation chamber [28]are a beneficial alternative. All stages of the analysis arepotential sources of contamination, from collection andtransportation to the laboratory through homogenization,mineralization and measurement of the analyte [29, 30]. Everysurface in contact with the sample must be considered to be apotential source of contamination, including sample contain-ers, cutting boards, utensils (i.e., knives, spoons), homogeni-zation equipment, laboratory sample containers, laboratoryware, and laboratory gloves. The potential for contaminationis reduced or eliminated by using cleaned materials that havebeen found not to contaminate the analytes of interest. Acid-cleaned plastic materials, ceramic or polytetrafluoroethyleneare used when feasible. In addition, the analytical instru-ment’s sample introduction system should be arranged tohave Class 100 clean air conditions by having a suitable cleanair module positioned around the system.
Various types of equipment are used to prepare ahomogeneous analytical sample by either blending, chop-ping, grinding or mixing depending on food matrix. Thisinitial step in the laboratory analysis continues to be apotential source of contamination [31, 32]. Razagui andBarlow [33] reduced contamination by cleaning equipmentwith 2% ethylenediaminetetraacetic acid and 2% citric acid.Possible elimination of this potential source of contamina-tion may be achieved by replacing stainless steel compo-nents with components made of materials of less interest,such as Ti, W, Zr, or by coating components withpolytetrafluoroethylene. Commercial cryogenic grindingequipment has the potential for obtaining sufficientlyhomogeneous analytical samples, although contaminationshould be more thoroughly evaluated [34–36].
Analytical sample treatment
Treatment of the analytical sample involves the proceduresrequired to prepare a portion of the analytical sample into aform for introduction of the element(s) of interest into theanalytical instrument. This treatment usually takes muchmore time than the instrumental determination of the elementconcentration. Procedures for decreasing sample preparationtime prior to instrumental analysis are the focus of muchresearch [37]. A multitude of treatments are used to preparefoods for determination of elements [38]. The basic modes of
treatment of the analytical sample are most often a wet (acid)digestion [39] or dry ashing [40] to remove the organicmatrix and retain the analytes of interest in a solution forintroduction into the analytical instrument. While theseprocedures have long been used, precautions are stillwarranted to avoid losses for volatile elements (e.g., As,Cd, Hg) when using these techniques for food analysis [41].Method blanks must also be processed through the treatmentprocedure and analyzed to ensure that the treatment does notbias the accuracy of the food analytical results.
Green Chemistry is the concept of the design ofenvironmentally friendly chemical products and processesthat reduce or eliminate the use and generation of hazardoussubstances [42]. One way to reduce the use of hazardoussubstances in toxic element analysis is to use mineralizationprocedures that consume less acid. This usually necessitatesthe analysis of smaller analytical portion masses. Analysis ofa relatively small analytical portion places a greater burdenon obtaining a homogeneous analytical sample from thelaboratory sample. Nonhomogeneity of an analyte may stillbe present even after extensive preparation of the analyticalsample. Nonhomogeneity precluded the assignment of acertified value for Pb in a candidate reference material afterextensive preparation procedures [43].
Dry ashing is a traditional means of treatment for thedetermination of Pb, Cd and other elements. Losses andcontamination can be controlled with proper procedures[44]. A dry ash method for determining Cd and Pb byETAAS and Cu, Fe, and Zn by FAAS [45] has beensuccessfully collaboratively studied. However, Fecher andRuhnke [46] had Cd and Pb cross-contamination issuesduring dry ashing and low recoveries of Al and Pb by dryashing have been reported by Moeller et al. [47].
For the determination of As by a hydride generationtechnique, a rigorous digestion of the analytical sample isrequired to completely mineralize stable arsenic compoundsor residual organic compounds [48–51]. These stable Ascompounds are known to be present in foods from marinesources. A dry ashing procedure has been found to beapplicable when determining As and Se by ETAAS withoutlosses in terrestrial plant materials but with losses foraquatic plant materials by Vassileva et al. [52]. Mindak andDolan [53] found a combined microwave digestion and dryashing procedure was effective for determining As and Sein a variety of foods using HGAAS. An open vesselmicrowave digestion using HNO3–H2SO4 was shown todigest organoarsenic in seafood for determining As usingHGAFS according to Vilanó and Rubio [54].
The volatility of Hg requires special consideration whentreating the analytical sample. Only variations of wetdigestion are used and the traditional use of digestionapparatus with condensers has largely been replaced by theuse of microwave digestion [55, 56]. A microwave
Anal Bioanal Chem
digestion procedure that demonstrated the stabilizing effectof chloride was validated by Hight and Cheng [57] for thedetermination of Hg in a variety of seafood using CVAAS.Ortiz et al. [58] determined that lyophilization of theanalytical sample can also be a source of Hg loss. Julshamnand Brenna [59] completed a successful interlaboratory trialof a microwave digestion method for Hg in seafood byCVAAS.
Wet digestion assisted by microwaves is a frequentlyused treatment procedure for multielement analysis of food[54]. Jorhem and Engman [60] conducted a multilaboratorytrial to validate a method using microwave digestion fordetermining Cd and Pb by ETAAS and Cu, Fe, and Zn byFAAS. Dolan and Capar [61] developed a microwavedigestion procedure for multielement analysis of food byICP–AES that allows the use of a single microwaveprogram by digesting a mass that varies depending on thefood’s energy content. For accurate measurement of Al infoods, especially those high in Si, a special treatment of theanalytical sample with HF is required [62–65]. Otherelements associated with silicates, for example Sb, inplant-based foods also require this HF treatment [66, 67]for accurate concentration measurement.
Lamble and Hill [55] found that a predigestion isbeneficial for most foods to avoid excessive pressureduring the microwave digestion when closed vessels areused. Predigestion is performed by allowing the analyticalportion with added acid to remain at room temperature orwith mild heating [28] in the unsealed digestion vessel for aperiod of time (several hours to overnight) or with heatingin the unsealed vessel. For determinations by ICP–MS, asecond digestion stage with H2O2 may be required toreduce potentially interfering carbon content. However,obtaining H2O2 with a sufficiently low concentration ofimpurity elements may be difficult, which emphasizes theneed to analyze the method and reagent blanks in order toensure accurate results [68].
Bruhn et al. [69] evaluated variables of a microwave-pseudo-digestion procedure for the analysis of musselswhere the acidified analytical portion was heated in amicrowave oven for about 2 min. The liquid digestate wascollected after centrifugation, with an additional washing ofthe solid residue. FAAS was used to determine Ca, Cu, Fe,Mg and Zn, and ETAAS was used for As, Cd, Co, Cr, Mn,Pb and Se. Optimum microwave-pseudo-digestion param-eters were determined for each element.
Microwave digestion with HNO3 is not 100% efficient atoxidizing organic compounds. Thus, not all organoarseniccompounds are oxidized to inorganic forms. This can causelow results with tungsten coil ETAAS [70, 71] and HGAAS[71]. Various secondary oxidation steps have been appliedafter initial microwave digestion to complete the oxidationof persistent species. Based on results for a CRM, As
results did not agree with the certified value for microwavedigestion alone, but did agree within uncertainty whenusing UV photooxidation or a thermal heating block as asecondary oxidation step [70].
High-temperature and high-pressure digestion technology(e.g., high-pressure autoclaves) is able to obtain higherdigestion temperatures for the complete oxidation of organiccompounds [50]. This complete oxidation is critical whenusing hydride generation techniques and techniques inwhich residual carbon interferes. Maichin et al. [72] appliedthis technique to a number of biological reference materials,and agreement was obtained to certified values for As, Cd,Hg, and Pb. The residual carbon content was <3% for thevarious materials tested.
Use of ultrasound to assist extraction or digestion of foodfor trace element analysis is under investigation. Ultrasound[73–77] has been used as a way to reduce the time oftreatment and consumption of reagents. Cava-Montesinoset al. [78] evaluated ultrasound-assisted leaching of milkwith aqua regia for 45 elements by ICP–MS, includingAl, As, Cd, Sn, Hg, and Pb. Direct slurry introductionwas performed, and only Cr, Hg, Li, Pb, Sr and Ti couldnot be measured due to interferences. Bermejo-Barreraet al. [79] utilized ultrasound-assisted acid leaching oflyophilized seafood for the determination of As, Cd, Co, Cr,Mn, Pb and Se by ETAAS, Ca, Cu, Fe, Mg and Zn byFAAS and Hg by CVAAS. Optimum leaching parameterswere determined for each element. Se required more severeleaching conditions. A more oxidative acid solution andH2O2 were needed for quantitative Fe results. García-Reyet al. [80] used ultrasound-assisted leaching of raw meat.Results were quantitative for Cu and Pb determined byETAAS and Ca by FAAS, but they were not quantitativefor Cd and Cr determined by ETAAS or Fe, Mg and Zn byFAAS. A general approach for ultrasonic solid-liquidextraction ETAAS has been proposed, and the use of anultrasonic probe has been suggested by Capelo et al. [81].Maduro et al. [82] compared three different ultrasonic-based procedures for the determination of Cd and Pb byETAAS in reference materials. Results were mixed, but thebest performance was obtained with an automated ultra-sonic slurry sampling procedure.
Moreda-Piñeiro et al. [83] investigated pressurized liquidextraction as another means of leaching elements from foodmore quickly and using less corrosive reagents. Theprocedure was evaluated using formic acid for the analysisof seafood reference materials. ICP–AES was used for thedetermination of Al, As, Cd, Co, Cu, Fe, Hg, Li, Mn, Pb,Se, Sr, V and Zn. The leaching is completed in about 12minutes, and all of the elements except Al and Cu wereleached quantitatively with the conditions used.
Enzymatic digestion in conjunction with sonication hasgreatly reduced treatment times and enhanced extractions of
Anal Bioanal Chem

analytes. The procedure has gained interest not only for totalelement determinations, but more importantly for elementspeciation determinations, as reported by Bermejo et al. [84].García et al. [85] applied enzyme digestion in determiningthe bioavailability of Cr in duplicate diets by ETAAS.Ackerman et al. [86] used an enzymatic extraction to mimiccooked rice entering the human digestive system; the resultswere compared to those obtained using a trifluoroacetic acidextraction for determining As species in rice, and there wasgood agreement for both inorganic As and dimethylarsinic acid.
Cal-Prieto et al. [87] introduced food slurries directly intothe analytical instrument to satisfy Green Chemistry princi-ples and to eliminate the mineralization step with its resultingissues of contamination and loss. Obtaining a homogeneousanalytical sample is critical to good analytical performanceof slurry sampling. Cryogenic grinding techniques [35] andmicrowave heating and magnetic shaking [88] have beenused for the direct determination of Pb or Cd by ETAAS. Inaddition, slurried sampling has been applied to baby foods(already puréed) for Cd, Pb and Se [89], Al and Cr [90] andHg [91] by ETAAS and seafood for Hg by CV ETAAS [92].
Direct solid sampling is another means of eliminatingpotential contamination and losses from the mineralizationof food while satisfying Green Chemistry principles. Valeet al. [93] reviewed the technique with respect to ETAAS anddiscussed the many improvements that have strengthened itsadvantages. Detcheva and Grobecke [94] developed a solidsampling ETAAS procedure that uses different masses ofCRMs to standardize the ETAAS instrument. Validation wasperformed by analyzing various seafood-based CRMs forCd, Hg, Pb, Mn and Sn.
Analytical procedures
AAS
ETAAS is widely used for the determination of toxic elementsin food and advances continue to be made in instrumentationto enhance sensitivity and versatility [95, 96].
Amorim et al. [97] optimized ETAAS conditions fordetermination of Al in soft drinks by conventional andmultivariate procedures and determined that analyticalcharacteristics were better when using the multivariateprocedure. The Al limit of quantification for the conven-tional procedure was 59.3 μg L–1 and for the multivariateprocedure, 37.7 μg L–1. However, for the levels found insoft drinks, both procedures were adequate.
Dias and Cardoso [98] developed a simple ETAASprocedure for determining Pb in fat-free sugar products(e.g., hard candies) in which samples are dissolved in diluteHNO3 without ashing and analyzed by ETAAS using aprogram without an ashing step and with aqueous standards
and rhodium modifier. Water CRMs, water CRMs withsugar added and Pb-spiked sugar samples all producedgood results. The estimated limit of quantification was0.095 mg kg–1.
Pereira-Filho et al. [99] used a simultaneous sampledigestion with thermospray flame furnace AAS with slurrysample introduction for determination of Cd, Cu and Pb inCRMs and tomato purée. A nickel tube is placed in the air/acetylene flame and a ceramic capillary acts as a flame-heated thermospray nozzle. The slurry is prepared in HNO3
and the acid vapor inside the nickel tube oxidizes thesamples at temperatures above 1000 °C.
TDA–AAS
TDA–AAS is becoming more widely used for the determina-tion of Hg in fish since a procedure for the technique wasissued by the US Environmental Protection Agency [100].The Green Chemistry value of the technique and the rapidityof the procedure are assets coveted by food analysislaboratories. The technique produces minor amounts oflaboratory waste, and the laboratory sample requires littlepreparation prior to determination. The technique is beingused to provide data on the levels of Hg in food [101–103].
Cizdziel et al. [104] evaluated a TDA–AAS procedurefor analysis of fish muscle and other fish tissues for Hg.Results of CRMs were in good agreement with certifiedvalues. Results obtained by TDA–AAS were equivalent toresults obtained by CVAAS when normalized for recovery.The estimated limit of detection for Hg was 0.9 μg kg−1.Also evaluated was the use of small fish tissue plugsinstead of homogenization of tissue. A sampling techniqueand an anatomical location for obtaining the tissue plugs isrecommended.
Levine et al. [105] performed a study of Hg levels incommercially processed and unprocessed seafood samplesusing TDA–AAS. Precision of replicate analysis wasgenerally less than 10% relative standard deviation whensamples were freeze-dried and homogenized prior toanalysis. Recovery results from samples fortified withCRMs demonstrated a lack of matrix effects, a potentialproblem when directly analyzing standards and samples ofdissimilar matrices.
Lasrado et al. [106] compared results for Hg in fish byTDA–AAS to results obtained by ICP–MS. Results were ingood agreement and the estimated limit of detection for Hgusing the TDA–AAS procedure was 0.1 mg kg–1. Hayneset al. [107] compared Hg in fish results determined byTDA–AAS with results obtained by CVAAS and CVAFS.There was good agreement between the techniques. Hgresults obtained from a three-plug sampling protocol forfish fillet tissue were representative of results obtained fromanalytical portions of the homogenized fish fillet.
Anal Bioanal Chem
ICP
ICP–MS is becoming prevalent throughout the world as theinstrument of choice for monitoring the levels of toxicelements in food [108]. ICP–MS requires assessment andcorrection for both spectral and nonspectral interferences[109] that vary depending on the food matrix. Spectralinterferences, such as 40Ar35Cl on 75As and 40Ar12C on52Cr, must be corrected for or reduced to manageablelevels. Many of the spectral interferences can be resolvedusing double-focusing ICP–MS that is capable of separat-ing these species [110]. However, the expense andsophistication of this equipment precludes its routine usein many food analysis laboratories. Instead, most laborato-ries use a quadrupole ICP–MS and interelement correctionalgorithms to correct for the spectral interference or colli-sion and reaction cell technologies to reduce or eliminatethe spectral interferences. The broad range of elementalcomposition of food requires that potential interferences beevaluated for each matrix under study. Internal standardsare used to correct for nonspectral interferences such asinstrumental drift and suppressions or enhancements inresponse caused by the matrix.
Cubadda et al. [111] validated an analytical protocol basedon reference materials for routine analysis of food usingclosed-vessel microwave digestion with HNO3–H2O2 andquadrupole ICP–MS for Al, As, Cd, Co, Cr, Fe, Mn, Mo, Ni,Pb, Se, Sn, V and Zn. Rh was used as an internal standard.Spectral interferences were corrected by mathematicalequations determined by measuring the spectral interferencescaused by C, Cl and Ca. Some foods may require treatmentwith HF to obtain accurate results for Al [65, 66].
Melnyk et al. [112] analyzed diet composites using open-vessel microwave digestion with HNO3 and quadrupoleICP–MS. Results were validated for Al, Cd, Cr, Cu, Pb, Mn,Ni, V and Zn but they could not be validated for As and Babecause of erratic recoveries. Guidance for homogenizationis provided as well as quality control for routine analyses.As, Ba, and Se were excluded from the scope of theprocedure due to poor validation results.
Noël et al. [113] rigorously validated an analyticalprocedure for analysis of food products of animal origin(e.g., fish, meat, milk) using closed-vessel microwavedigestion with HNO3 and quadrupole ICP–MS for determi-nation of As, Cd, Hg and Pb. Bi, In, and Sc were used asinternal standards to correct for drift and matrix effects. Theestimated limits of quantification were 0.060 mg kg−1for As,0.010 mg kg−1for Cd, 0.055 mg kg−1 for Hg and 0.042 mgkg−1for Pb.
Chan et al. [114] validated an analytical protocol usingCRMs and fortified food for routine analysis of food usingclosed-vessel microwave digestion with HNO3 followed byconcentration of the analytical solution by evaporation and
the use of quadrupole ICP–MS for determination of As, Cd,Cr, Hg, Pb, Sb and Sn. For plant materials, analyticalsolutions were redigested with HF. Ge and In were used asinternal standards to correct for physical interferences andequations were used to correct for spectral interferences. Inaddition, 13C was monitored for completeness of digestion.Quality control guidance is provided for routine analyses.
Adhesion of Hg to the walls of the sample introductionsystem of the ICP–MS causes a number of analyticalproblems for Hg, including long washout times andnonlinear standardization curves. Fatemian et al. [115] usedAu to reduce these memory effects. Harrington et al. [116]found that the addition of 2-mercaptoethanol was effectivefor alleviating the memory effect using flow injectionanalysis. Yufeng et al. [117] evaluated a number of reagentsfor eliminating the Hg memory effect with the conclusionthat L-cysteine is recommended for addition to analyticalsolutions.
Perring and Basic-Dvorza [118] developed a procedurefor determining Sn in canned food using axial ICP–AESand either high-pressure or microwave digestions fortreatment of the analytical sample. Only the use of the189.927 nm Sn emission line provided satisfactory results.The estimated limit of quantification was 0.8 mg kg−1.Spike recovery of Sn and precision were good and internalstandard correction did not improve method performance.Interference from elements commonly found in food wasstudied. Appropriate CRMs were not available for valida-tion of the procedure.
Mercury speciation
Research and development of new or improved methodsfor the determination of mercury species in seafoodcontinues to be very active. Hyphenated techniquesinvolving gas or liquid chromatographic separations withdetection by element-specific detectors such as ICP–MSand atomic absorption/emission are the most commonlyreported. The influence of Green Chemistry can be seen inthe general trend toward elimination or reduction of theuse of hazardous chemicals for sample extraction. Non-chromatographic methods for determination of mercuryspecies have been reported that are easier to implementand potentially more economical.
Chiou et al. [119] extracted Hg species from fish usinga 2-min microwave-assisted extraction with L-cysteine and2-mercaptoethanol. Liquid chromatography was used toseparate inorganic Hg(II), methylmercury and ethylmercurywith the effluent introduced into a vapor generation systembefore determination of Hg by ICP–MS. Analysis of aCRM produced good results and the sum of the mercuryspecies measured in a swordfish sample agreed with totalHg analysis.
Anal Bioanal Chem
Gelaude et al. [120] used a solid sampling electrothermalvaporization ICP–MS procedure with seafood CRMs fordirect and simultaneous determination of inorganic Hg andmethylmercury. No sample preparation was required. Asolid sample is inserted into a graphite furnace, heated witha temperature program to separate, by vaporization,methylmercury and inorganic mercury that are transportedto an ICP–MS by an argon carrier gas. Quantification wasby species-unspecific isotope dilution. Estimated detectionlimits were 6 μg kg−1 for inorganic Hg and 2 μg kg−1 formethylmercury.
Rai et al. [121] evaluated a procedure for determininginorganic Hg(II) and methylmercury in fish using enzymatichydrolysis with Protease type XIV to extract the Hg species.The species were separated using HPLC and Hg wasdetected using ICP–MS. The good recoveries (92–107%)of Hg from CRMs and spiked fish samples (lyophilized)validated the procedure. In addition, total Hg results from theprocedure compared well with results by microwavedigestion with HNO3 and determination by ICP–MS.
Río Segade and Tyson [122] evaluated two flow injectionsystems for the determination of mercury species in slurriedfish CRMs and mussel tissue using CVAAS. Sample slurrieswere prepared with HCl and Triton X-100. The first systemused an oxidation coil temperature to differentiate betweentotal and inorganic Hg, and the second system used thedifferent reducing power of sodium borohydride as afunction of the reaction medium to differentiate thesespecies. The latter system was the preferred procedurebecause it provided lower detection limits and was simplerand faster to use. In addition, this system was used tomeasure methylmercury in the samples by selectivelyextracting methylmercury using 1 mol dm−3 HCl and using0.1% m/v sodium borohydride that did not reduce Hgoccluded into the solid particles of the sample slurry. Theestimated limits of detection (dry weight) for total Hg,inorganic Hg and methylmercury were 4 μg kg−1, 1 μg kg−1
and 11 μg kg−1, respectively.Hight and Cheng [123] validated a procedure for the
determination of methylmercury and the estimation of totalHg in seafood using HPLC and ICP–MS. Seafood isextracted with L-cysteine HCl–H2O with heating for120 min at 60 °C. Hg compounds are separated by HPLCusing a C-18 column and Hg is detected in the effluent byICP–MS. Total Hg is calculated as the sum of methylmercuryand inorganic Hg. Extensive validation of the procedurewas performed. CRMs and spiked seafood were used forvalidation. In addition, total Hg results were compared tototal Hg results obtained by microwave digestion with HNO3
and CVAAS. The estimated limit of quantification was 5 μgkg−1 for inorganic Hg and 7 μg kg−1 for methylmercury. Theuse of polypropylene vessels was found to adversely affectmethylmercury stability.
Wu et al. [124] developed a nonchromatographicseparation procedure for inorganic Hg and methylmercuryin fish using a knotted reactor and flow injection on-linesorption preconcentration coupled to CVAFS. The proce-dure was validated with CRMs and spiked fish samples.The analytical sample was treated with HCl and sonicatedto release the Hg species. Results obtained by the procedurecompared well with total Hg results for samples preparedby microwave digestion with HNO3-H2O2.
Vallant et al. [125] developed an HPLC ICP–MSprocedure for the determination of inorganic Hg andmethylmercury using a polymer-based cation-exchangecolumn with a mobile phase of pyridine, L-cysteine andmethanol. In addition, a simple analytical sample treatmentprocedure was employed using HCl and sonication.
Perna et al. [126] determined inorganic Hg and methyl-mercury in fish by isotope dilution gas chromatography(GC) ICP–MS. Lyophilized samples were spiked withisotopically enriched methyl- and inorganic mercury priorto alkaline digestion. Derivatized mercury compounds wereseparated by GC with ICP–MS detection. The use ofspecies-specific isotope dilution reduces errors associatedwith sample preparation and the measurement process. Theprocedure was validated by analyses of CRMs andcomparison of the species sum to total mercury results bymicrowave digestion cold vapor ICP–MS.
Arsenic speciation
Heitkemper et al. [127] determined As species in rice usingion chromatography coupled to ICP–MS. The As speciesinvestigated were total inorganic As [As(III)+As(V)], mono-methylarsonic acid and dimethylarsinic acid. The extractionprocedure providing best extraction efficiency was 2 Mtrifluoroacetic acid for 6 h at 100 °C. The procedure wasvalidated by the analysis of a CRM and rice samples spikedwith As(III), As(V), and dimethylarsinic acid. The estimatedlimits of detection were 6 μg kg−1 for As(III), 17 μg kg−1 forAs(V), 13 μg kg−1 for methylarsonic acid and 6 μg kg−1 fordimethylarsinic acid. There was partial reduction of As(V) toAs(III) during the extraction process, so these species could notbe reliably distinguished by the procedure. However, the totalinorganic As value was reliable. Validation of this procedurewas extended to a variety of infant food products [128].
Vela et al. [129] extracted As species from carrots(lyophilized) using accelerated solvent extraction and deter-mined using liquid chromatography ICP–MS. The speciesstudied were As(III), As(V), monomethylarsonic acid,dimethylarsinic acid and arsenobetaine. Optimum conditionsused “Ottawa sand” dispersing agent. The estimated limits ofdetection were 8 μg kg−1 for As(III), 6 μg kg−1 for As(V),7 μg kg−1 for monomethylarsonic acid, 12 μg kg−1 fordimethylarsinic acid, and 7 μg kg−1 for arsenobetaine. As
Anal Bioanal Chem
species spiked into carrots were quantitatively recovered. Anunidentified As compoundwas present in some carrot samplesthat also had relatively high levels of methylarsonic acid.
Hovanec [130] found that 2-butoxyethanol was the mostefficient solvent for extracting As species from de-fatted(acetone) peanut butter. Ion chromatography ICP–MS wasused to determine As(III), As(V), monomethylarsonic acid anddimethylarsinic acid. Isotopically enriched Se(IV) (m/z 78)was used as the internal standard for the chromatography. TotalAs levels were determined using a HNO3–H2O2 digestion anddetection by ICP–MS.
Larsen et al. [131] determined inorganic As in fish usingmicrowave-assisted alkaline alcoholic digestion and HPLC–ICP–MS. The digestion was performed with NaOH inethanol that oxidized As(III) to As(V), providing one speciesfor the determination. The estimated limit of detection was3 μg kg−1. Recovery of fish spiked with As(III) indicatedgood recovery except for one high-fat fish. Total As levels inthe fish were also determined using microwave digestionwith HNO3-H2O2 and detection by ICP–MS.
Sánchez-Rodas and Gómez-Ariza [132] developed aprocedure to extract As(III), As(V), monomethylarsonicacid and dimethylarsinic acid from lyophilized chickentissue. The extraction procedure that performed best wasmethanol–water (1:1) followed by microwave oven heatingand sonication. Measurement of the As species was madeusing HPLC–HGAFS with on-line photooxidation. Spikedsamples and CRMs were used to validate the procedure.
Concluding remarks
Many new and innovative approaches to the analysis offood for toxic elements continue to appear in the literature,driven by regulatory considerations, technological advan-ces, the trend toward speciation of elements and—to alesser extent—the constant push for lower detection limitsand the demand for increased laboratory efficiency. A widevariety of instrumental techniques continues to be used,such as ETAAS, ICP–AES, ICP–MS, etc. The need forproper contamination control, effective and efficient ana-lytical sample treatment, and reliable analytical proceduresinfluence and sometimes dictate how procedures andmethods are developed. A decision to consider a newprocedure is guided by the fitness of the procedure toaddress the purpose of the required analysis. The fitness ofthe procedure is evaluated based on the validation data andother performance measures. Guidelines and protocols formethod validation are readily available [133, 134] andshould be considered when developing and publishinganalytical procedures. Regulatory agencies seeking en-dorsement and recognition for methods may chose to fullyvalidate a few select analytical procedures by conducting
interlaboratory trials under the auspices of organizationssuch as AOAC International [135]. These expensiveventures provide documented intra- and interlaboratorymethod performance, and are only undertaken after athorough in-house validation of the method.
References
1. European Commission (2006) Off J Eur Comm L364:5–242. Codex Alimentarius Commission (2006) Homepage. http://www.
codexalimentarius.net/web/index_en.jsp. Cited 24 June 20073. Berg T, Licht D (2002) Food Addit Contam 19:916–9274. Joint FAO/WHO Expert Committee on Food Additives (JECFA)
(2007) Homepage. http://www.fao.org/ag/agn/agns/jecfa_index_en.asp. Cited 24 June 2007
5. FAO (2006) Summary of evaluations performed by the JointFAO/WHO Expert Committee on Food Additives. http://jecfa.ilsi.org/. Cited 24 June 2007
6. Chou S, Harper C, Osier M, Odin M, Chappell L, Sage G (2005)Draft toxicological profile for arsenic. US Agency for ToxicSubstances and Disease Registry, Atlanta, GA (http://www.atsdr.cdc.gov/toxpro2.html. Cited 24 June 2007)
7. Almela C, Clemente MJ, Vélez D, Montoro R (2006) FoodChem Toxicol 44:1901–1908
8. WHO (1989) Part 3: Comments on specific food additives andcontaminants (WHO Technical Report Series, No. 776). WorldHealth Organization, Geneva, pp 27–28 (http://www.who.int/ipcs/publications/jecfa/reports/en/index.html. Cited 24 June 2007)
9. Taylor J, DeWoskin R, Ennever FK (1999) Toxicological profilefor cadmium. US Agency for Toxic Substances and DiseaseRegistry, Atlanta, GA (http://www.atsdr.cdc.gov/toxpro2.html.Cited 24 June 2007)
10. Egan SK, Tao SS-H, Pennington JAT, Bolger PM (2002) FoodAddit Contam 19:103–125
11. WHO (2006) Part 3.3: Cadmium—impact assessment of differentmaximum limits (WHO Technical Report Series, No. 930). WorldHealth Organization, Geneva, pp 26–31 (http://www.who.int/ipcs/publications/jecfa/reports/en/index.html. Cited 24 June 2007)
12. Abadin H, Ashizawa A, Stevens Y-W, Llados F, Diamond G,Sage G, Citra M, Quinones A. Bosch SJ, Swarts SG (2005) Drafttoxicological profile for lead. US Agency for Toxic Substancesand Disease Registry, Atlanta, GA (http://www.atsdr.cdc.gov/toxpro2.html. Cited 24 June 2007)
13. WHO (2000) Part 6.1: lead (WHO Technical Report Series, No.896). World Health Organization, Geneva, pp 81–87 (http://www.who.int/ipcs/publications/jecfa/reports/en/index.html. Cited24 June 2007)
14. Risher J, DeWoskin R (1999) Toxicological profile for mercury.US Agency for Toxic Substances and Disease Registry, Atlanta,GA (http://www.atsdr.cdc.gov/toxpro2.html. Cited 24 June 2007)
15. US FDA (2006) Mercury levels in commercial fish and shellfish.US Food and Drug Administration, Washington, DC (http://www.cfsan.fda.gov/~frf/sea-mehg.html. Cited 24 June 2007)
16. JECFA (2006) JECFA Monographs 3: Annex 1, Part 3—foodcontaminants evaluated toxicologically. Joint FAO/WHO ExpertCommittee on Food Additives, WHO, Geneva, pp 82–83 (http://www.fao.org/ag/agn/jecfa/works_en.stm. Cited 24 June 2007)
17. WHO (1978) Annex 2: Tolerable intakes (WHO Technical ReportSeries, No. 63). World Health Organization, Geneva, pp 35–36(http://www.who.int/ipcs/publications/jecfa/reports/en/index.html. Cited 24 June 2007)
18. Keith S, Jones D, Rosemond Z, Ingerman L, Chappell L (2006)Draft toxicological profile for aluminum. US Agency for Toxic
Anal Bioanal Chem
Substances and Disease Registry, Atlanta, GA (http://www.atsdr.cdc.gov/toxpro2.html. Cited 24 June 2007)
19. Harper C, Llados F, Diamond G, Chappell LL (2005) Toxico-logical profile for tin and tin compounds. US Agency for ToxicSubstances and Disease Registry, Atlanta, GA (http://www.atsdr.cdc.gov/toxpro2.html. Cited 24 June 2007)
20. WHO (2006) Part 3.4: Inorganic tin (WHO Technical ReportSeries, No. 930). World Health Organization, Geneva, pp 40–43(http://www.who.int/ipcs/publications/jecfa/reports/en/index.html. Cited 24 June 2007)
21. Food and Nutrition Board, Institute of Medicine (2001) Dietaryreference intakes for vitamin A, vitamin K, arsenic, boron,chromium, copper, iodine, iron, manganese, molybdenum,nickel, silicon, vanadium, and zinc. National Academies Press,Washington, DC (http://www.iom.edu/CMS/3788/4574/8521.aspx. Cited 24 June 2007)
22. Food and Nutrition Board, Institute of Medicine (2000) Dietaryreference intakes for vitamin C, vitamin E, selenium, andcarotenoids. National Academies Press, Washington, DC (http://www.iom.edu/CMS/3788/4574/8511.aspx. Cited 24 June 2007)
23. SCF (2003) Tolerable upper intake levels for vitamins andminerals. Scientific Committee on Food, European Commission,Brussels (http://ec.europa.eu/food/fs/sc/scf/out80_en.html. Cited24 June 2007)
24. Expert Group on Vitamins and Minerals (2003) Safe upper levelsfor vitamins and minerals. Food Standards Agency, London(http://www.food.gov.uk/multimedia/webpage/vitandmin/. Cited24 June 2007)
25. Capar SG, Szefer P (2005) Determination and speciation of traceelements in foods. In: Otles S, (ed) Methods of analysis of foodcomponents and additives. CRC Press, Boca Raton, FL, pp 111–158, Ch 6
26. IAEA (2003) Clean laboratories and clean rooms for analysis ofradionuclides and trace elements (IAEA-TECDOC-1339). Inter-national Atomic Energy Agency, Vienna, Austria (http://www.iaea.org/Publications/index.html. Cited 24 June 2007)
27. EPA (1996) Guidance on establishing trace metal clean rooms inexisting facilities (EPA 821-B-96-001). US EnvironmentalProtection Agency, Washington, DC (http://yosemite.epa.gov/water/owrccatalog.nsf/. Cited 24 June 2007)
28. Rhoades CB, Jr, Levine KE, Salido A, Jones BT (1998) ApplSpectrosc 52:200–204
29. Hoenig M (2001) Talanta 54:1021–103830. Knapp G, Schramel P (2003) Sources of analyte contamination
and loss during the analytical process. In: Mester Z, Sturgeon R(eds) Sample preparation for trace element analysis (Wilson andWilson’s Comprehensive Analytical Chemistry, Vol. 41). Elsevier,Amsterdam, pp 23–45, Ch 2
31. Stringari G, Pancheri I, Möller F, Failla O (1998) Accred QualAssur (1998) 3:122–126
32. Cubadda F, Baldini M, Carcea M, Pasqui LA, Raggi A, StacchiniP (2001) Food Addit Contam 18:778–787
33. Razagui IB, Barlow PJ (1992) Food Chem 44:309–31234. Gouveia ST, Lopes GS, Fatibello-Filho O, Nogueira ARA,
Nóbrega JA (2002) J Food Engineer 51:59–6335. Santos D, Barbosa F, Tomazelli AC, Krug FJ, Nóbrega JA,
Arruda MAZ (2002) Anal Bioanal Chem 373:183–18936. Carrilho ENVM, Gonzalez MH, Nogueira ARA, Cruz GM,
Nóbrega JA (2002) J Agric Food Chem 50:4164–416837. Morales-Muñoz S, Luque-García JL, Luque de Castro MD
(2003) Crit Rev Environ Sci Technol 33:391–42138. Ihnat M (2003) Sample preparation for food analysis. In: Mester
Z, Sturgeon R (eds) Sample preparation for trace elementanalysis (Wilson and Wilson’s Comprehensive Analytical Chem-istry, Vol. 41). Elsevier, Amsterdam, pp 765–856, Ch 25
39. Matusiewicz H (2003) Wet digestion methods. In: Mester Z,Sturgeon R (eds) Sample preparation for trace element analysis(Wilson and Wilson’s Comprehensive Analytical Chemistry,Vol. 41). Elsevier, Amsterdam, pp 193–233, Ch 6
40. Hoenig M (2003) Dry ashing. In: Mester Z, Sturgeon R (eds)Sample preparation for trace element analysis (Wilson andWilson’s Comprehensive Analytical Chemistry, Vol. 41). Elsevier,Amsterdam, pp 235–255, Ch 7
41. Hu Z, Liu L (2002) Accred Qual Assur 7:106–11042. Anastas PT (1999) Crit Rev Anal Chem 29:167–17543. Sharpless KE, Anderson DL, Betz JM, Butler TA, Capar SG,
Cheng J, Fraser CA, Gardner G, Gay ML, Howell DW, Ihara T,Khan MA, Lam JW, Long SE, McCooeye M, Mackey EA,Mindak WR, Mitvalsky S, Murphy KE, Nguyenpho A, PhinneyKW, Porter BJ, Roman M, Sander LC, Satterfield MB, ScriverC, Sturgeon R, Thomas JB, Vocke RD Jr, Wise SA, Wood LJ,Yang L, Yen JH, Ziobro GC (2006) J AOAC Int 89:1483–1495
44. Jorhem L (1995) Mikrochim Acta 119:211–21845. Jorhem L (2000) J AOAC Int 83:1204–121146. Fecher P, Ruhnke G (2002) Anal Bioanal Chem 373:787–79147. Moeller A, Ambrose RF, Que Hee SS (2001) Food Addit
Contam 18:19–2948. Šlejkovec Z, van Elteren JT, Woroniecka UD (2001) Anal Chim
Acta 443:277–28249. Narukawa T, Kuroiwa T, Inagaki K, Takatsu A, Chiba K (2005)
Appl Organomet Chem 19:239–24550. Wasilewska M, Goessler W, Zischka M, Maichin B, Knapp G
(2002) J Anal Atom Spectrom 17:1121–112551. Goessler W, Pavkov M (2003) Analyst 128:796–80252. Vassileva E, Dočekalová H, Baeten H, Vanhentenrijk S, Hoenig
M (2001) Talanta 54:187–19653. Mindak WR, Dolan SP (1999) J Food Compos Anal 12:111–12254. Vilanó M, Rubio R (2001) J AOAC Int 84:551–55555. Lamble KJ, Hill SJ (1998) Analyst 123:103R–133R56. Schnitzer G, Soubelet A, Testu C, Chafey C (1995) Mikrochim
Acta 119:199–20957. Hight SC, Cheng J (2005) Food Chem 91:557–57058. Ortiz AIC, Albarrán YM, Rica CC (2002) J Anal Atom
Spectrom 17:1595–160159. Julshamn K, Brenna J (2002) J AOAC Int 85:626–63160. Jorhem L, Engman J (2000) J AOAC Int 83:1189–120361. Dolan SP, Capar SG (2002) J Food Compos Anal 15:593–61562. Schelenz R, Zeiller E (1993) Fresenius J Anal Chem 345:68–7163. Sun D-H, Waters JK, Thomas P, Mawhinney TP (1997) J Agric
Food Chem 45:2115–211964. Feng X, Wu S, Wharmby A, Wittmeier A (1999) J Anal Atom
Spectrom 14:939–94665. Sun D-H, Waters JK, Mawhinney TP (2000) J AOAC Int
83:1218–122466. Sucharová J, Suchara I (2006) Anal Chim Acta 576:163–17667. Engström E, Stenberg A, Senioukh S, Edelbro R, Baxter DC,
Rodushkin I (2004) Anal Chim Acta 521:123–13568. WuS, FengX,Wittmeir A (1997) JAnal AtomSpectrom 12:797–80669. Bermejo-Barrera P, Moreda-Piñeiro A, Muñiz-Naveiro O,
Gómez-Fernández AMJ, Bermejo-Barrera A (2000) SpectrochimActa Part B 55:1351–1371
70. Bruhn CG, Bustos CJ, Sáez KL, Neira JY, Alvarez SE (2007)Talanta 71:81–89
71. Cullen R, Dodd M (1988) Appl Organomet Chem 2:1–772. Maichin B, Zischka M, Knapp G (2003) Anal Bioanal Chem
376:715–72073. Priego-Capote F, Luque de Castro MD (2007) Anal Bioanal
Chem 387:249–25774. Luque-García JL, Luque de Castro MD (2003) Trends Anal
Chem 22:41–47
Anal Bioanal Chem
75. Capelo-Martínez JL, Ximénez-Embún P, Madrid Y, Cámara C(2004) Trends Anal Chem 23:331–340
76. Priego-Capote F, Luque de Castro MD (2004) Trends AnalChem 23:644–653
77. Chemat S, Lagha A, Amar HA, Chemat F (2004) UltrasonSonochem 11:5–8
78. Cava-Montesinos P, Cervera ML, Pastor A, de la Guardia M(2005) Anal Chim Acta 531:111–123
79. Bermejo-Barrera P, Muñiz-Naveiro O, Moreda-Piñeiro A,Bermejo-Barrera A (2001) Anal Chim Acta 439:211–227
80. García-Rey RM, Quiles-Zafra R, Luque de Castro MD (2003)Anal Bioanal Chem 377:316–321
81. Capelo JL, Maduro C, Vilhena C (2005) Ultrason Sonochem12:225–232
82. Maduro C, Vale G, Alves S, Galesio M, Gomes da Silva MDR,Fernandez C, Catarino S, Rivas MG, Mota AM, Capelo JL(2006) Talanta 68:1156–1161
83. Moreda-Piñeiro J, Alonso-Rodríguez E, López-Mahía P,Muniategui-Lorenzo S, Fernández-Fernández E, Prada-RodríguezD, Moreda-Piñeiro A, Bermejo-Barrera A, Bermejo-Barrera P(2006) Anal Chim Acta 572:172–179
84. Bermejo P, Capelo JL, Mota A, Madrid Y, Cámara C (2004)Trends Anal Chem 23:654–663
85. García E, Cabrera C, Lorenzo ML, López MC, Sánchez J (2001)Food Addit Contam 18:601–606
86. Ackerman AH, Creed PA, Parks AN, Fricke MW, Schwegel CA,Creed JT, Heitkemper DT, Vela NP (2005) Environ Sci Technol39:5241–5246
87. Cal-Prieto MJ, Felipe-Sotelo M, Carlosena A, Andrade JM,López-Mahía P, Muniategui S, Prada D (2002) Talanta 56:1–51
88. Pérez Cid B, Silva C, Boia C (2002) Anal Bioanal Chem 374:477–48389. Viñas P, Pardo-Martínez M, Hernández-Córdoba M (2000) Anal
Chim Acta 412:121–13090. Viñas P, Pardo-Martínez M, Hernández-Córdoba M (2001) J
AOAC Int 84:1187–119391. Viñas P, Pardo-Martínez M, López-García I, Hernández-Córdoba
M (2001) J Anal Atom Spectrom 16:633–63792. Moreda-Piñeiro J, López-Mahía P, Muniategui-Lorenzo S,
Fernández-Fernández E, Prada-Rodríguez D (2002) Anal ChimActa 460:111–122
93. Vale MGR, Oleszczuk N, dos Santos WNL (2006) ApplSpectrosc Rev 41:377–400
94. Detcheva A, Grobecker KH (2006) Spectrochim Acta B 61:454–45995. Butcher DJ (2006) Appl Spectrosc Rev 41:15–3496. Borges DLG, da Silva AF, Welz B, Curtius AJ, Heitmann U
(2006) J Anal Atom Spectrom 21:763–76997. Amorim FR, Bof C, Franco MB, Silva JBB, Nascentes CC
(2006) Microchem J 82:168–17398. Dias VMC, Cardoso ASB (2006) Food Addit Contam 23:479–48399. Pereira-Filho ER, Berndt H, Arruda MAZ (2002) J Anal Atom
Spectrom 17:1308–1315100. US EPA (1998) Method 7473. US Environmental Protection
Agency, Washington, DC (http://www.epa.gov/SW-846/pdfs/7473.pdf. Cited 24 June 2007)
101. Shim SM, Dorworth LE, Lasrado JA Santerre CR (2004) J FoodSci 69:C681–C684
102. Shim SM, Lasrado JA, Dorworth LE, Santerre CR (2005) J FoodProtect 68:633–635
103. Chen YC, Chen MH (2006) J Food Drug Anal 14:373–378104. Cizdziel JV, Hinners TA, Heithmar EM (2002) Water Air Soil
Pollut 135:355–370
105. Levine KE, Levine MA, Weber FX, Henderson JP, Grohse PM(2005) Bull Environ Contam Toxicol 74:973–979
106. Lasrado JA, Santerre CR, Shim SM, Stahl JR (2005) J FoodProtect 68:879–881
107. Haynes S, Gragg RD, Johnson E, Robinson L, Orazio CE (2006)Water Air Soil Pollut 172:359–374
108. Cubadda F (2004) J AOAC Int 87:173–204109. Crews HM (1996) Inductively coupled plasma-mass spectrom-
etry (ICP-MS) for the analysis of trace element contaminants infoods. In: Gilbert J (ed) Progress in food contaminant analysis.Blackie, London, Ch 4, pp 147–186
110. Moens L, Jakubowski N (1998) Anal Chem 70:251A–256A111. Cubadda F, Raggi A, Testoni A, Zanasi F (2002) J AOAC Int
85:113–121112. Melnyk LJ, Morgan JN, Fernando R, Pellizzari ED, Akinbo O
(2003) J AOAC Int 86:439–447113. Noël L, Dufailly V, Lemahieu N, Vastel C, Guérin T (2005) J
AOAC Int 88:1811–1821114. Chan KC, Yip YC, Chu HS, Sham WC (2006) J AOAC Int
89:469–479115. Fatemian E, Allibone J, Walker PJ (1999) Analyst 124:
1233–1236116. Harrington CF, Merson SA, D’ Silva TM (2004) Anal Chim Acta
505:247–254117. Yufeng Li Y, Chen C, Li B, Sun J, Wang J, Gao Y, Zhao Y, Chai
Z (2006) J Anal Atom Spectrom 21:94–96118. Perring L, Basic-Dvorzak M (2002) Anal Bioanal Chem
374:235–243119. Chiou C-S, Jiang S-J, Danadurai KSK (2001) Spectrochim Acta
Part B 56:1133–1142120. Gelaude I, Dams R, Resano M, Vanhaecke F, Moens L (2002)
Anal Chem 74:3833–3842121. Rai R, Maher W, Kirkowa F (2002) J Anal Atom Spectrom
17:1560–1563122. Río Segade S, Tyson JF (2003) J Anal Atom Spectrom 18:
268–273123. Hight SC, Cheng J (2006) Anal Chim Acta 567:160–172124. Wu H, Jin Y, Han W, Miao Q, Bi S (2006) Spectrochim Acta
Part B 61:831–840125. Vallant B, Kadnar R, Goessler W (2007) J Anal Atom Spectrom
22:322–325126. Perna L, LaCroix-Fralish A, Stürup S (2005) J Anal Atom
Spectrom 20:236–238127. Heitkemper DT, Vela NP, Stewart KR, Westphal C (2001) J Anal
Atom Spectrom 16:299–306128. Vela NP, Heitkemper DT (2004) J AOAC Int 87:244–252129. Vela NP, Heitkemper DT, Stewart KR (2001) Analyst 126:
1011–1017130. Hovanec BM (2004) J Anal Atom Spectrom 19:1141–1144131. Larsen EH, Engman J, Sloth JJ, Hansen M, Jorhem L (2005)
Anal Bioanal Chem 381:339–346132. Sánchez-Rodas D, Gómez-Ariza JL, Oliveira V (2006) Anal
Bioanal Chem 385:1172–1177133. EURACHEM (1998) EURACHEM guide: the fitness for
purpose of analytical methods—a laboratory guide to methodvalidation and related topics. LGC, Teddington, UK (http://www.eurachem.org/. Cited 24 June 2007)
134. Thompson M, Ellison SLR, Wood R (2002) Pure Appl Chem74:835–855
135. AOAC International (2007) Homepage. http://www.aoac.org.Cited 24 June 2007
Anal Bioanal Chem