factors affecting the distribution of potentially toxic elements in surface soils around an...
TRANSCRIPT
1 23
Environmental Earth Sciences ISSN 1866-6280Volume 65Number 3 Environ Earth Sci (2012) 65:823-833DOI 10.1007/s12665-011-1127-4
Factors affecting the distribution ofpotentially toxic elements in surfacesoils around an industrialized area ofnorthwestern Greece
Alexandra Petrotou, KonstantinosSkordas, Georgios Papastergios &Anestis Filippidis

1 23
Your article is protected by copyright and
all rights are held exclusively by Springer-
Verlag. This e-offprint is for personal use only
and shall not be self-archived in electronic
repositories. If you wish to self-archive your
work, please use the accepted author’s
version for posting to your own website or
your institution’s repository. You may further
deposit the accepted author’s version on a
funder’s repository at a funder’s request,
provided it is not made publicly available until
12 months after publication.
ORIGINAL ARTICLE
Factors affecting the distribution of potentially toxic elementsin surface soils around an industrialized area of northwesternGreece
Alexandra Petrotou • Konstantinos Skordas •
Georgios Papastergios • Anestis Filippidis
Received: 1 April 2010 / Accepted: 13 May 2011 / Published online: 26 May 2011
� Springer-Verlag 2011
Abstract In order to investigate the factors influencing
the distribution of 32 potentially toxic elements in the
Ptolemais–Kozani basin, northwestern Greece, 38 soil
samples were collected and analyzed. Concentrations of
Al, Ca, Fe, K, Mg, Mn, Na, P, Ti, Ba, Co, Cr, Cu, La, Li,
Ni, Pb, Sc, Sr, V, Y, and Zn were determined by ICP-AES
and concentrations of As, Bi, Cd, Cs, Mo, Rb, Sb, Th, Tl,
and U by ICP-MS. Bivariate analysis, principal component
analysis, and geostatistical analysis were employed to
investigate the factors influencing the distribution of the
elements determined in the study area. The results indicate
that the distribution of the majority of elements deter-
mined, especially for Cr, Ni, and associated elements, is
greatly influenced by the geology and geomorphology of
the study area. Principal component analysis has yielded
four factors that explain over 77% of the total variance in
the data. These factors are as follows: lithophilic elements
that are associated with Al silicates minerals of K (factor I:
29.4%), ultramafic rocks (factor II: 20.5%), elements that
are coprecipitated with Fe and Mn oxides (factor III:
18.0%), and anthropogenic activities (factor IV: 9.3%).
The anthropogenic activities that influence the distribution
of several potentially toxic elements (i.e., Cd, Cu, Pb, Zn)
are agricultural practices and the deposition of fly ash in the
vicinity of the local power stations.
Keywords Soil � Geochemistry � Environment �Principal component analysis � GIS � Ptolemais
Introduction
Natural processes (e.g., weathering, pedogenesis) and
human activities (e.g., industry, agriculture) are the main
factors influencing the content of potentially toxic elements
(PTEs) in soils. The study of PTEs’ distribution in soils is
an important and, at the same time, complex task, because
soils are considered as the principal sinks for such elements
and, moreover, appropriate means for monitoring contam-
ination (Cui et al. 2005; Fernandez-Turiel et al. 2001;
Hesterberg 1998; Kabata-Pendias and Pendias 2001;
Kelepertsis et al. 2006; Papastergios et al. 2010a, 2011;
Skordas and Kelepertsis 2005; Stalikas et al. 1997). High
levels of PTEs in soils may result in an increased uptake of
PTEs by crops and vegetables, which in its turn may have a
negative effect on animals and, consequently human health
Electronic supplementary material The online version of thisarticle (doi:10.1007/s12665-011-1127-4) contains supplementarymaterial, which is available to authorized users.
A. Petrotou
Department of Earth Sciences, Royal Holloway
University of London, Egham Hill, Egham TW20 0EX, UK
Present Address:A. Petrotou
Frixou 2, 41222 Larissa, Greece
e-mail: [email protected]
K. Skordas
Department of Ichthyology and Aquatic Environment,
University of Thessaly, Fitokou str., N. Ionia,
38446 Volos, Greece
e-mail: [email protected]
G. Papastergios (&) � A. Filippidis
Department of Mineralogy-Petrology-Economic Geology,
School of Geology, Aristotle University of Thessaloniki,
54124 Thessaloniki, Greece
e-mail: [email protected]; [email protected]
A. Filippidis
e-mail: [email protected]
123
Environ Earth Sci (2012) 65:823–833
DOI 10.1007/s12665-011-1127-4
Author's personal copy
(Kabata-Pendias and Pendias 2001; Papadopoulos et al.
2007).
Approximately more than 60% of the electrical power
requirements of Greece are generated through the utiliza-
tion of lignite (Kavouridis 2008; Kavouridis and Koukou-
zas 2008; Kaldellis et al. 2009). The lignite used in these
power plants is characterized by high moisture levels, high
calcium and ash content, and low calorific value and are
thus considered as one of the poorest fossil fuels world-
wide. The quality of the mined lignite is strongly connected
to the quality of the organic matter (rank), the inorganic
impurities, and the nature of the sterile layers that are
excavated with the lignite (Christanis et al. 1998; Fernan-
dez-Turiel et al. 2004; Filippidis et al. 1996; Georgako-
poulos et al. 1995; Kolovos et al. 2002a, b, c; Sotiropoulos
et al. 2005). Using such fuels may produce huge amounts
of flue gases and other types of wastes (i.e., bottom ash, fly
ash, water polluted with radionuclides and PTEs, etc.) that
are disposed off in the environment (Fernandez-Turiel et al.
2004; Karamanis et al. 2009; Kolovos et al. 2002a; Pa-
pastergios et al. 2005, 2007; Sotiropoulos et al. 2005;
Triantafyllou 2003; Vatalis and Kaliampakos 2006).
Additionally, slagging and fouling severely affect the
power plants’ use of these lignites (Fernandez-Turiel et al.
2004).
The Western Macedonian Lignite Center (WMLC) in
the Florina–Ptolemais–Kozani basin, northern Greece, and
the Megalopolis Lignite Center (MLC) in the Peloponnese,
southern Greece, are the two main coal-mining districts in
the country; most of the lignite used in the aforementioned
power plants is mined from these centers. The lignite
mined in these opencast mines is used to generate elec-
tricity in the power plants of Liptol, Amynteon, Ptolemais,
Kardia and Agios Dimitrios in the WMLC, and Megalop-
olis A and Megalopolis B in the MLC. These plants con-
sume more than 70 Mt of lignite annually and produce
almost 13 Mt of fly ash per year, thus making Greece the
second lignite producer in the EU and fourth in the world
(Fernandez-Turiel et al. 2004; Kaldellis et al. 2009; Ka-
vouridis 2008; Kavouridis and Koukouzas 2008; Kolovos
et al. 2002a, b; Triantafyllou et al. 2006). Fly ash particles
are regarded as highly contaminating, since on their high
surface area may accumulate PTEs and other pollutants
(Fernandez-Turiel et al. 2004; Iordanidis et al. 2008a, b;
Kolovos et al. 2002a, b; Papastergios et al. 2005, 2007;
Querol et al. 1996; Tsikritzis 2005).
Knowledge of the content of PTEs in soils, as well as the
origin of these contaminants constitute priority objectives
in the European Union, in this case, especially for countries
that utilize fossil fuels (i.e., lignite) as an energy source.
The results and the methodology followed in the present
work offer a new insight regarding the distribution and
origin of several PTEs in the surface soils of an
industrialized area that utilizes lignite for the production of
electricity and, since, numerous similar areas exist around
the world, could prove useful in other occasions, as well.
Study area
The study area is situated in the Ptolemais–Kozani basin,
northwestern Greece and includes the WMLC and two
power plants, namely these of Kardia, and Agios Dimitrios
(Fig. 1a, b). The cultivation of mainly corn, wheat, alfalfa,
potatoes, tobacco, various vegetables, and fruit trees in
some small parts of the study area is common (Gikas et al.
2009). In the area, weak to moderate winds blow, mostly
from the north and northwest (Gikas et al. 2009; Papado-
poulos et al. 2007; Samara 2005).
Geological setting
The basement of the basin consists mainly of Palaeozoic
and Mesozoic metamorphic and plutonic rocks underlying
Cretaceous limestone and flysch (Fig. 1b). The basement
rocks are divided into four distinctive tectonic units (Di-
amantopoulos 2005, 2006; Mountrakis 1983; van Hins-
bergen et al. 2006):
1. The pre-Alpine Pelagonian Basement, separated into
the Schist sub-unit, the Gneiss sub-unit, the granitoid
mylonites and the granites;
2. The Almopia Unit, with Triassic-Lower Jurassic
marbles and meta-sediments of Late Jurassic age;
3. The Ultramafic–mafic Unit of Mesozoic age, with
ophiolites, composed by many occurrences of serpen-
tines; and
4. The Cretaceous Transgression Unit, with rudist-bear-
ing, platform limestones and Maastrichtian flysch.
The Neogene-Quaternary sediments of the basin are
characterized as limnic marls and clays and host the lignite
seams (Kolovos et al. 2002b; Koufos and Pavlides 1988;
Owen et al. 2010; Pavlides 1985; Pavlides and Mountrakis
1987).
Materials and methods
Thirty-eight surface (0–15 cm) soil samples were col-
lected, in distances greater than 50 m from the road, in
order to avoid contamination associated with vehicle
emissions. From each sampling site around 1 kg soil
(obtained from 5 different locations) was taken, in order to
collect representative samples. The five sub-samples were
used to composite one sample, which was eventually
analyzed. Sub-samples improve sampling precision and
824 Environ Earth Sci (2012) 65:823–833
123
Author's personal copy
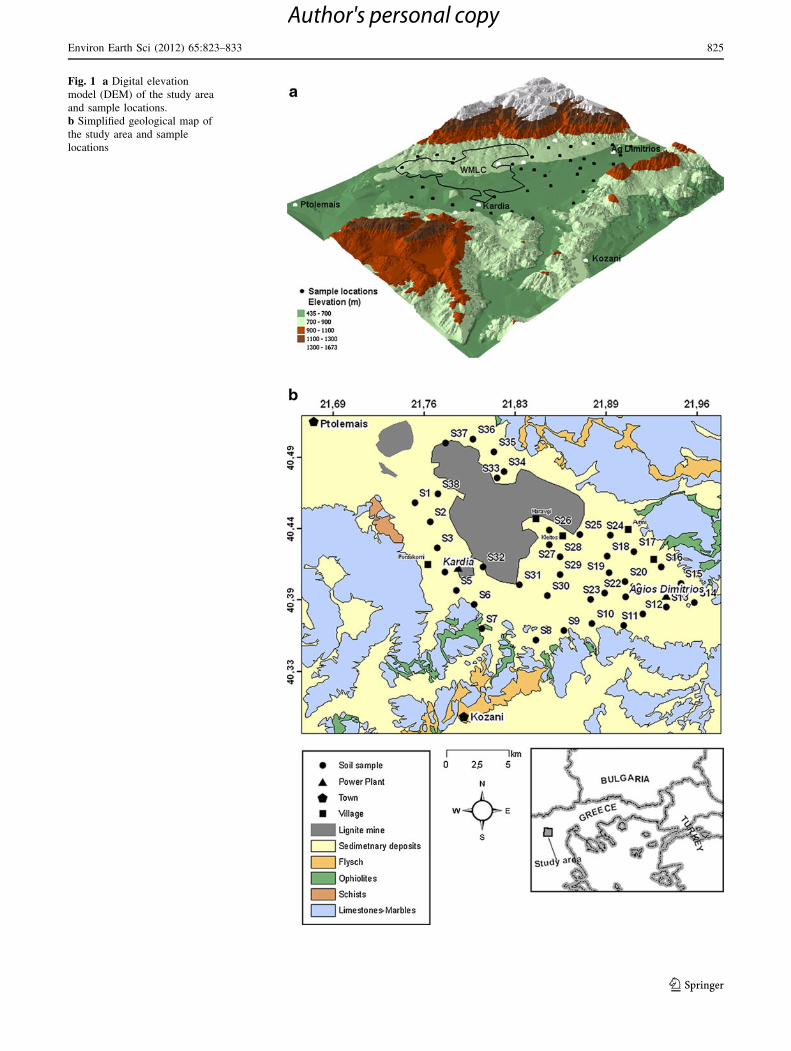
Fig. 1 a Digital elevation
model (DEM) of the study area
and sample locations.
b Simplified geological map of
the study area and sample
locations
Environ Earth Sci (2012) 65:823–833 825
123
Author's personal copy
thus, minimize random error derived from the heteroge-
neity of the site. All samples were dried at 60�C, sieved
under 90 lm, and stored in high-density polyethylene bags,
to prevent contamination. The fine fraction of the soil was
selected for analysis because it is probable that larger
particles and rock fragments would contain, on a weight
basis, considerably less contaminant than the smaller ones.
Approximately 0.2 g of the powder samples were
weighed and placed into 25 ml polytetrafluoroethylene
crucibles. Then, 6 ml of HClO4/HF acid (1:2) was added to
each crucible. The tray of crucibles was placed on a hot-
plate in the fume cupboard and evaporated to dryness for
3–4 h. After cooling, 2 ml of HNO3 were added to each
crucible. Each crucible was toped up with distilled water to
3/4 and warmed on the hotplate for 15–20 min. Once the
crucibles were cooled, solutions of 20.8 g on a top pan
balance were made by using distilled water. These solu-
tions were placed in appropriately labeled tubes and, after
shaking well, they were ready for analysis.
The concentrations of Al, Ca, Fe, K, Mg, Mn, Na, P, Ti,
Ba, Co, Cr, Cu, La, Li, Ni, Pb, Sc, Sr, V, Y, and Zn were
determined by Inductively Coupled Plasma–Atomic
Emission Spectrometry (ICP–AES), while the concentra-
tions of As, Bi, Cd, Cs, Mo, Rb, Sb, Th, Tl, and U were
determined by Inductively Coupled Plasma–Mass Spec-
trometry (ICP–MS). The analyses were performed at the
Royal Holloway University of London. For reasons of
quality control, several blanks, two certified reference
materials (GBW07312 and GBW07405), and four internal
standards of the latter University were used during the
procedure. The recoveries of the reference materials ran-
ged, for the majority of the determined elements, between
90 and 105%. Some exceptions were noted (i.e., Sc: 30%),
probably due to the low concentrations of these elements in
the reference materials. Furthermore, the instrumental and
sampling precisions were estimated. Both factors were
satisfactory for the work objectives (average values of RSD
were 1.85 and 3.23%, respectively).
Results and discussion
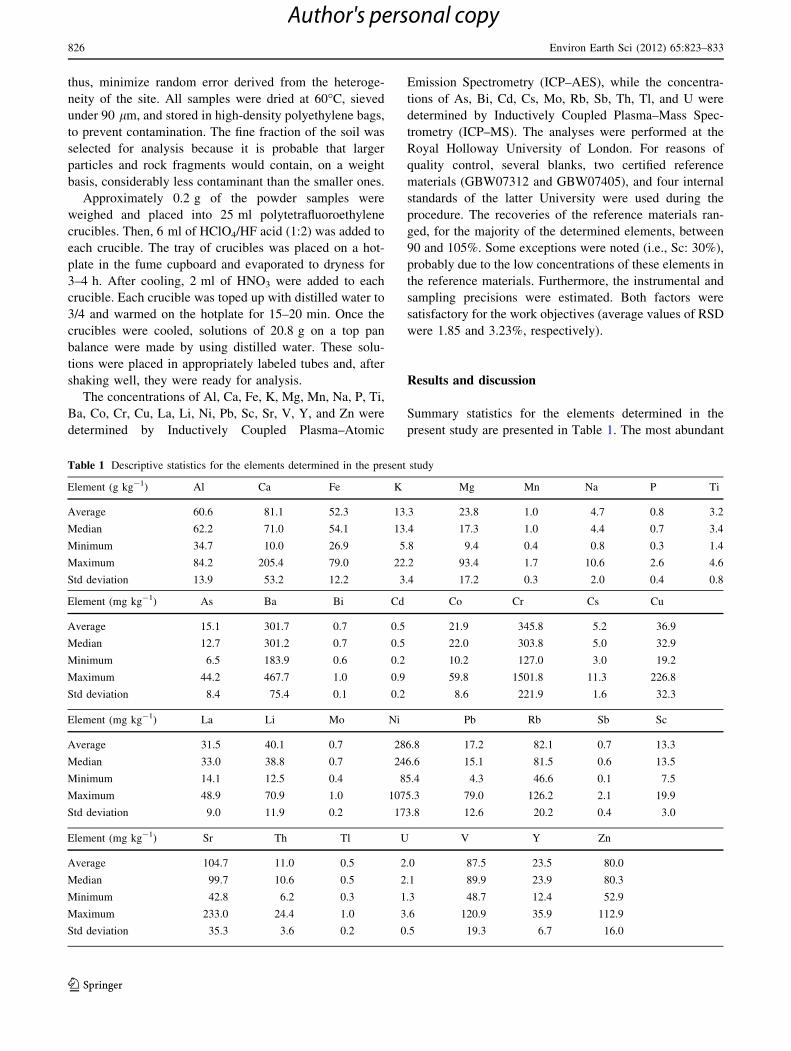
Summary statistics for the elements determined in the
present study are presented in Table 1. The most abundant
Table 1 Descriptive statistics for the elements determined in the present study
Element (g kg-1) Al Ca Fe K Mg Mn Na P Ti
Average 60.6 81.1 52.3 13.3 23.8 1.0 4.7 0.8 3.2
Median 62.2 71.0 54.1 13.4 17.3 1.0 4.4 0.7 3.4
Minimum 34.7 10.0 26.9 5.8 9.4 0.4 0.8 0.3 1.4
Maximum 84.2 205.4 79.0 22.2 93.4 1.7 10.6 2.6 4.6
Std deviation 13.9 53.2 12.2 3.4 17.2 0.3 2.0 0.4 0.8
Element (mg kg-1) As Ba Bi Cd Co Cr Cs Cu
Average 15.1 301.7 0.7 0.5 21.9 345.8 5.2 36.9
Median 12.7 301.2 0.7 0.5 22.0 303.8 5.0 32.9
Minimum 6.5 183.9 0.6 0.2 10.2 127.0 3.0 19.2
Maximum 44.2 467.7 1.0 0.9 59.8 1501.8 11.3 226.8
Std deviation 8.4 75.4 0.1 0.2 8.6 221.9 1.6 32.3
Element (mg kg-1) La Li Mo Ni Pb Rb Sb Sc
Average 31.5 40.1 0.7 286.8 17.2 82.1 0.7 13.3
Median 33.0 38.8 0.7 246.6 15.1 81.5 0.6 13.5
Minimum 14.1 12.5 0.4 85.4 4.3 46.6 0.1 7.5
Maximum 48.9 70.9 1.0 1075.3 79.0 126.2 2.1 19.9
Std deviation 9.0 11.9 0.2 173.8 12.6 20.2 0.4 3.0
Element (mg kg-1) Sr Th Tl U V Y Zn
Average 104.7 11.0 0.5 2.0 87.5 23.5 80.0
Median 99.7 10.6 0.5 2.1 89.9 23.9 80.3
Minimum 42.8 6.2 0.3 1.3 48.7 12.4 52.9
Maximum 233.0 24.4 1.0 3.6 120.9 35.9 112.9
Std deviation 35.3 3.6 0.2 0.5 19.3 6.7 16.0
826 Environ Earth Sci (2012) 65:823–833
123
Author's personal copy
element is Ca with an average concentration of
81.1 g kg-1, followed by Al, Fe, Mg, K, Na, Ti, Mn, and P,
in descending order. From the trace elements, Cr, Ba, Ni,
and Sr have average concentrations above 100 mg kg-1, V,
Rb, Zn, Zr, Li, Cu, La, Y, Co, Pb, As, Sc, Th, Cs, and U
have average concentrations between 100 and 1 mg kg-1
and Bi, Mo, Sb, Cd, and Tl have average concentrations
below 1 mg kg-1.
Bivariate analysis
For most of the elements, the arithmetic mean (average)
was almost equal to the median (Table 1); thus, it was
assumed that the elements determined approximate the
normal distribution. The correlation matrix regarding all
the elements was computed and, for reasons of conciseness,
is presented as supplementary material (Appendix 1). SPSS
16.0 was applied for all the statistical analyses.
Examining Appendix 1 reveals that strong, positive
correlation exists among many elements (i.e., between Fe,
Mg, As, Co, Cr, and Ni, between Cu and Pb, between P and
Cd, between Ca and Sr, etc.). This observation suggests
common sources for the elements with high correlation
coefficients. For example, elements such as Cr and Ni may
have their primary source in the ultramafic rocks (ophio-
lites) that occur in the area, while the elevated concentra-
tions of Ca and Sr to the carbonate rocks in the margins of
the basin. Calcium correlates positively with Sr, and both
correlate negatively with almost all the other determined
elements. The latter observations are clearly depicted in the
interpolation maps created for the study area (Figs. 2, 3, 4,
5).
Principal component analysis
In order to further evaluate the geochemical data and the
associations among the elements determined, principal
component analysis (PCA) was applied. PCA is often used
in exploratory data analysis in order to (Kelepertsis et al.
2006; Skordas and Kelepertsis 2005; Skordas et al. 2007):
(a) reduce the complex pattern of correlations among many
variables to simpler sets of relationships between fewer
variables, (b) select a subset of variables from a larger set,
based on which original variables have the highest corre-
lations with the factors, and (c) uncover the underlying
structure of a relatively large set of variables. In the present
study, PCA is used to elucidate the data with the aim to
explain the dimensions associated with data variability, to
investigate variables (elements) and sources, and to deter-
mine which elements have a common origin. Due to the
restricted number of samples, the results of factor analysis
are merely indicative. However, an attempt was made to
explain the elements with common origin and identify their
sources.
The PCA yielded four factors, explaining over 77% of
the total variance in the data (Table 2). Factor I explains
29.4% of the total variance and is loaded by Al, K, Ba, Bi,
Cs, La, Li, Rb, Th, Tl, U, and V, with factor coefficients
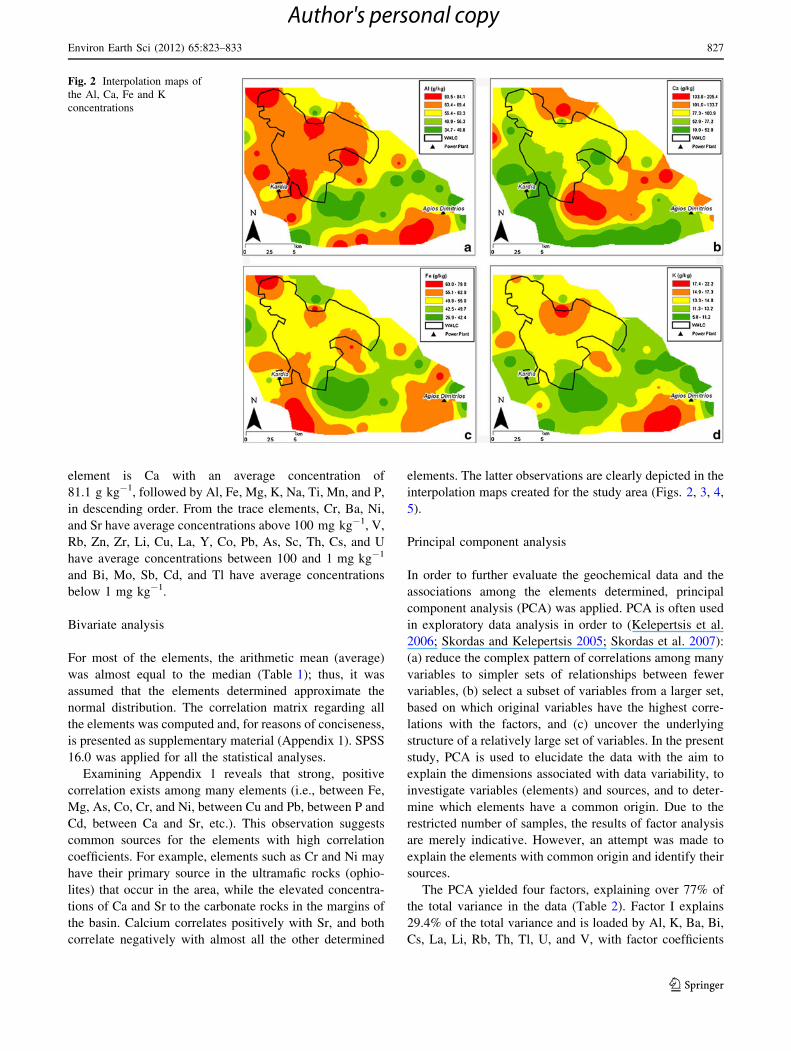
Fig. 2 Interpolation maps of
the Al, Ca, Fe and K
concentrations
Environ Earth Sci (2012) 65:823–833 827
123
Author's personal copy
oscillating between 0.54 and 0.97. This factor probably
indicates a group of mainly lithophilic elements that are
associated with Al–silicate minerals of K. Their most
possible origin is the weathering of rocks, such as granites
and gneisses, which occur in the broad area (Fig. 1b).
Factor II explains 20.5% of the total variance and is
loaded by Fe, Mg, As, Co, Cr, Mn, Ni, Sb, and Sc, with
factor coefficients oscillating between 0.56 and 0.94. The
strong associations among Ni, Cr, Co, and Mg in the soils
suggest that they have the same input sources and common
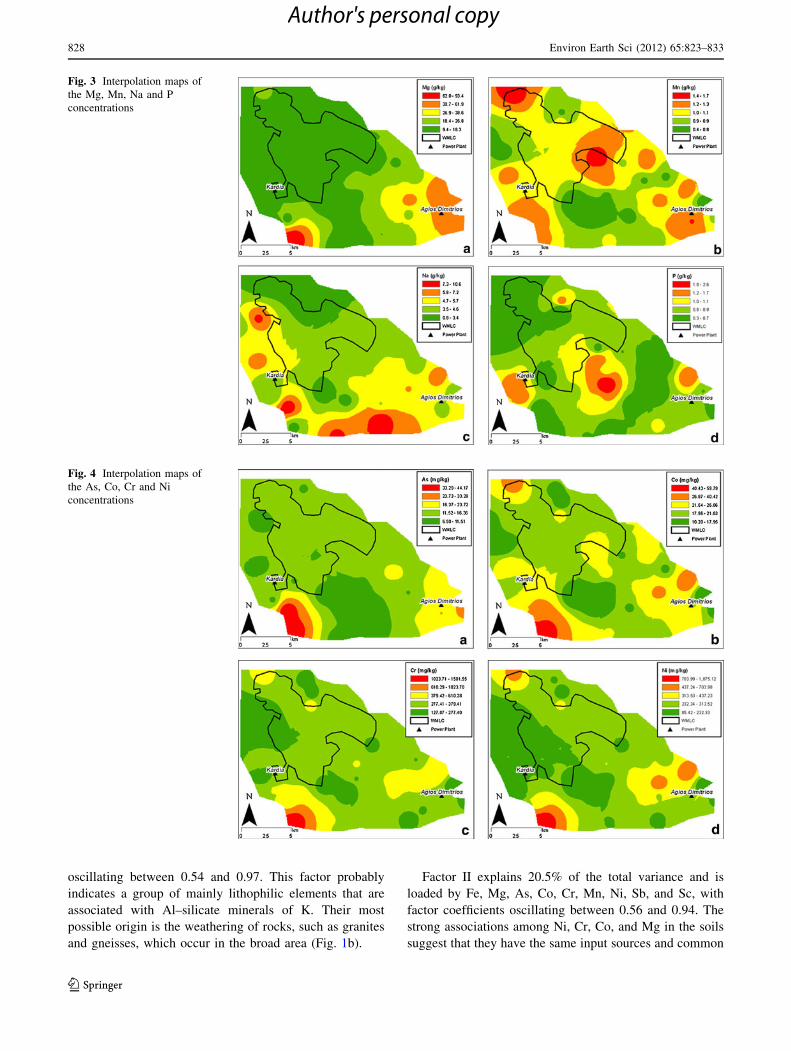
Fig. 3 Interpolation maps of
the Mg, Mn, Na and P
concentrations
Fig. 4 Interpolation maps of
the As, Co, Cr and Ni
concentrations
828 Environ Earth Sci (2012) 65:823–833
123
Author's personal copy
geochemical characteristics reflecting the influence of the
ultramafic rocks (ophiolites) on the soils. In Table 3 are
given the average values of Cr and Ni reported for several
other Greek regions, as well as the target and intervention
values of the Dutch list regarding these elements. In gen-
eral, all other regions used for comparison have lower
values, with the exception of central Euboea. Details
regarding the comparison with international guidelines can
be found in Petrotou et al. (2010).
Factor III explains 18.0% of the total variance and is
loaded by Al, Fe, Mn, Na, La, Sc, Tl, V, Y, and Zn, with
factor coefficients oscillating between 0.51 and 0.86. This
factor possibly reflects the elements that are coprecipitated
with Fe and Mn oxides. Once Fe2? is released from silicate
minerals, it becomes oxidized and precipitates as Fe oxides
and hydrous oxides. Alkaline conditions promote the pre-
cipitation of Fe (Kabata-Pendias and Pendias 2001). Dur-
ing weathering, Mn compounds are oxidized under
atmospheric conditions and the released Mn oxides are
reprecipitated in the form of secondary Mn minerals.
According to Bartlett (1986), the Mn concretions in soils
are reported to accumulate Fe and several trace elements.
Usually, As is associated with iron oxides and hydrous
oxides; however, this is not the case in this study. A pos-
sible explanation for this behavior could be that As is found
in noteworthy amounts (4 mg kg-1, Georgakopoulos et al.
2002a) in the ophiolites of the area and, thus, is associated
with factor II and not factor III. This hypothesis was
reached because As is more closely correlated with ele-
ments deriving from the ultramafic rocks (i.e., Co, Cr, Ni)
than with Fe (see Appendix 1). In addition, the spatial
distribution of As is almost identical to Co, Cr, and Ni, thus
supporting the former speculation (Figs. 3, 4).
Factor IV explains 9.3% of the total variance and is
loaded by P, Cu, Cd, Pb, and Zn with factor coefficients
oscillating between 0.57 and 0.78. This factor possibly
reflects anthropogenic activities such as agriculture,
through the application of phosphate and other fertilizers
and pesticides, used in certain parts of the area, or/and the
local power plants. Other studies (Gikas et al. 2009; Pa-
padopoulos et al. 2007) have also reported the extensive
cultivation taking place in the area as a source of P and,
possibly, associated elements. Regularly, phosphoric fer-
tilizer products contain large amounts of Cu, Cd, Pb, Zn,
and other elements, which are considered as essential
nutrients to plants. That is why elevated values of these
elements have been reported in areas where these products
are being manufactured or applied (Kabata-Pendias and
Pendias 2001; Papastergios et al. 2009, 2010b, 2011).
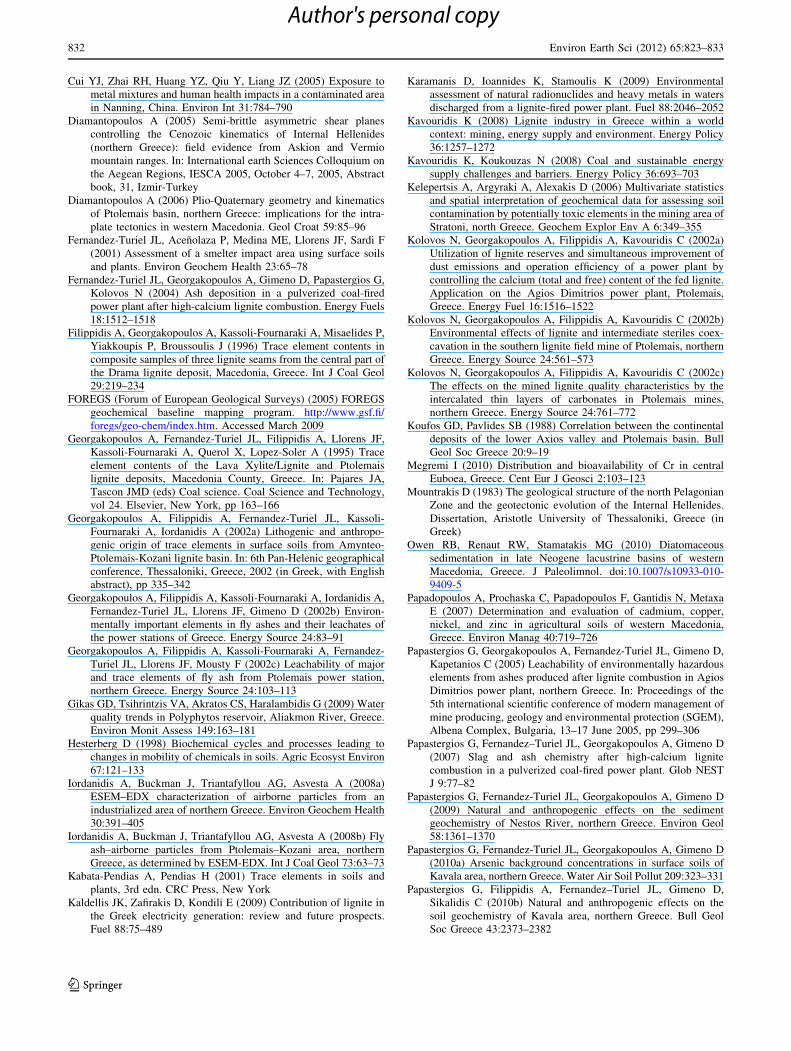
Furthermore, a comparison between the chemistry of the
fly ash (as given by Georgakopoulos et al. 2002a, b, c;
Papastergios et al. 2007) and the surface soils of the study
area (Table 4) reveals that they have similar concentra-
tions regarding the elements of factor IV. According to
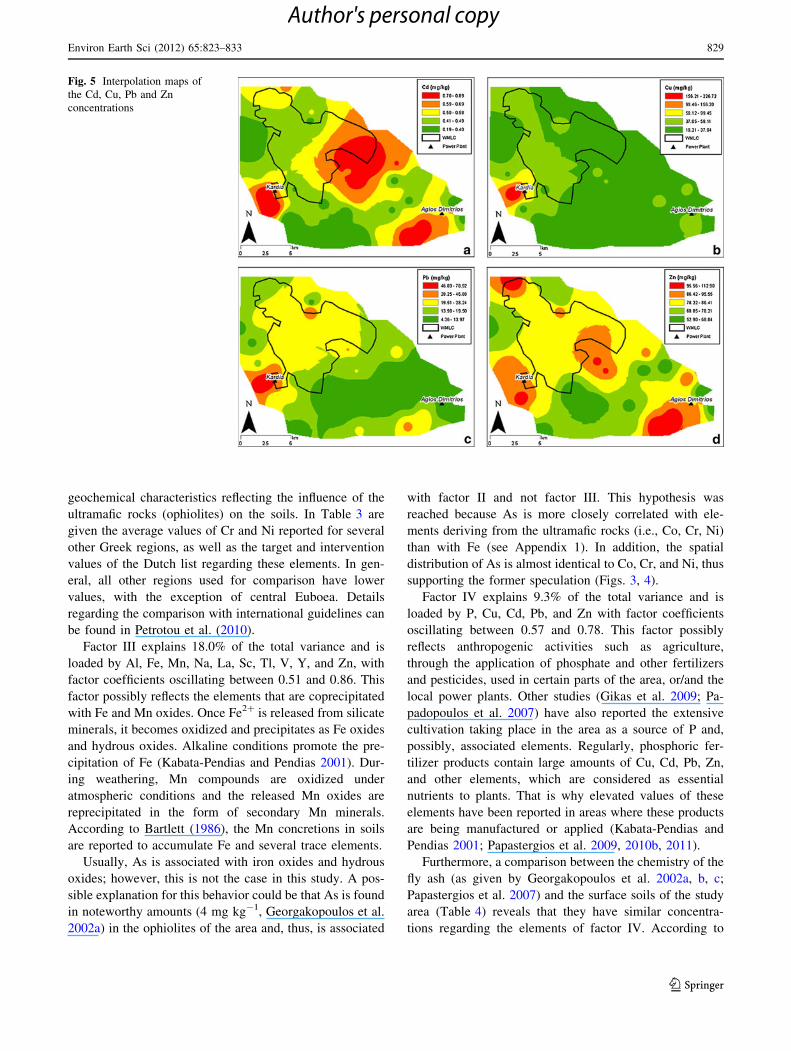
Fig. 5 Interpolation maps of
the Cd, Cu, Pb and Zn
concentrations
Environ Earth Sci (2012) 65:823–833 829
123
Author's personal copy
Iordanidis et al. (2008a, b) and Petaloti et al. (2006), larger
fly ash particles (C10 lm) are mostly deposited in the
vicinity of power stations; hence, surface soils around these
locations could be enriched in elements (i.e., Cu, Cd, Pb
and Zn) found with elevated concentrations in fly ash.
Since the most common wind direction is from the north
and northwest (Gikas et al. 2009; Papadopoulos et al. 2007;
Samara 2005), the elevated concentrations that these ele-
ments have near the power stations could be attributed to
the deposition of fly ash. Finally, a minor contribution of
factor IV could be invoked from the weathering of flysch
sedimentary rocks.
Spatial analysis
Geochemical mapping is an important tool in the hands of
environmental scientists who make efforts to assess the
spatial associations between areas with elevated concen-
trations of PTEs and their potential sources, either natural
or anthropogenic (Bolviken et al. 1996; Chen et al. 1999,
2001; FOREGS 2005; Kelepertsis et al. 2006; Papastergios
et al. 2010a, 2011; Salminen 2007). In order to study the
distribution of the determined elements in the Ptolemais–
Kozani area, interpolation maps of their concentrations
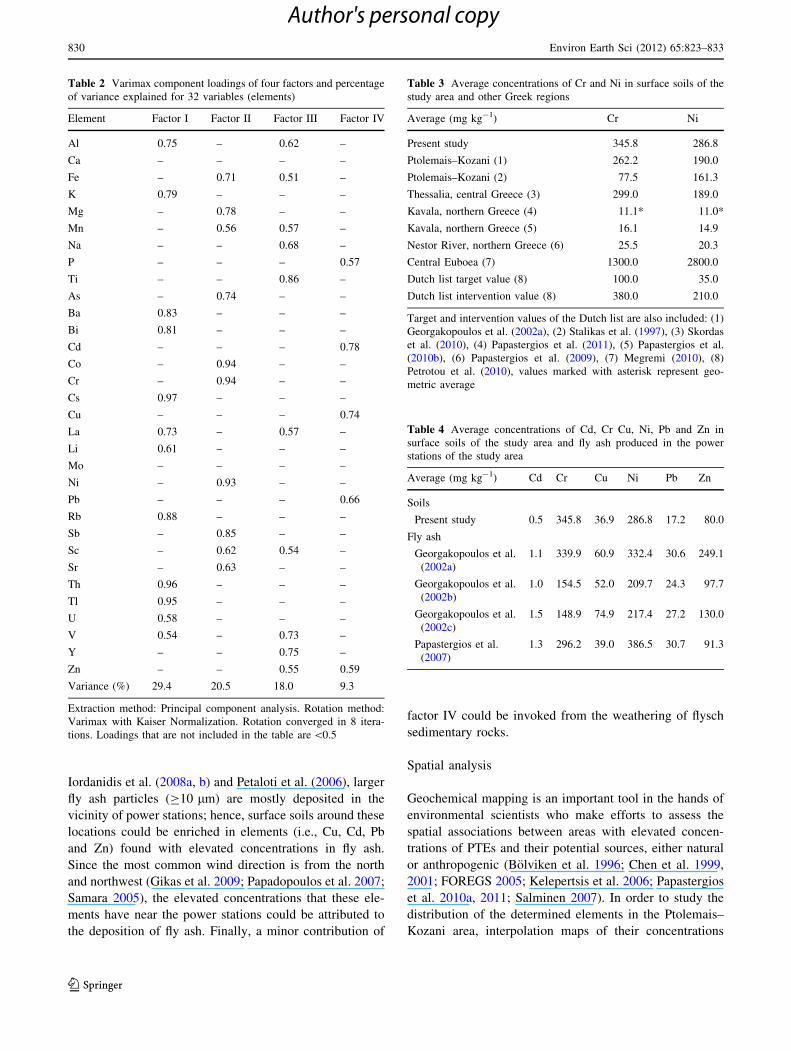
Table 2 Varimax component loadings of four factors and percentage
of variance explained for 32 variables (elements)
Element Factor I Factor II Factor III Factor IV
Al 0.75 – 0.62 –
Ca – – – –
Fe – 0.71 0.51 –
K 0.79 – – –
Mg – 0.78 – –
Mn – 0.56 0.57 –
Na – – 0.68 –
P – – – 0.57
Ti – – 0.86 –
As – 0.74 – –
Ba 0.83 – – –
Bi 0.81 – – –
Cd – – – 0.78
Co – 0.94 – –
Cr – 0.94 – –
Cs 0.97 – – –
Cu – – – 0.74
La 0.73 – 0.57 –
Li 0.61 – – –
Mo – – – –
Ni – 0.93 – –
Pb – – – 0.66
Rb 0.88 – – –
Sb – 0.85 – –
Sc – 0.62 0.54 –
Sr – 0.63 – –
Th 0.96 – – –
Tl 0.95 – – –
U 0.58 – – –
V 0.54 – 0.73 –
Y – – 0.75 –
Zn – – 0.55 0.59
Variance (%) 29.4 20.5 18.0 9.3
Extraction method: Principal component analysis. Rotation method:
Varimax with Kaiser Normalization. Rotation converged in 8 itera-
tions. Loadings that are not included in the table are \0.5
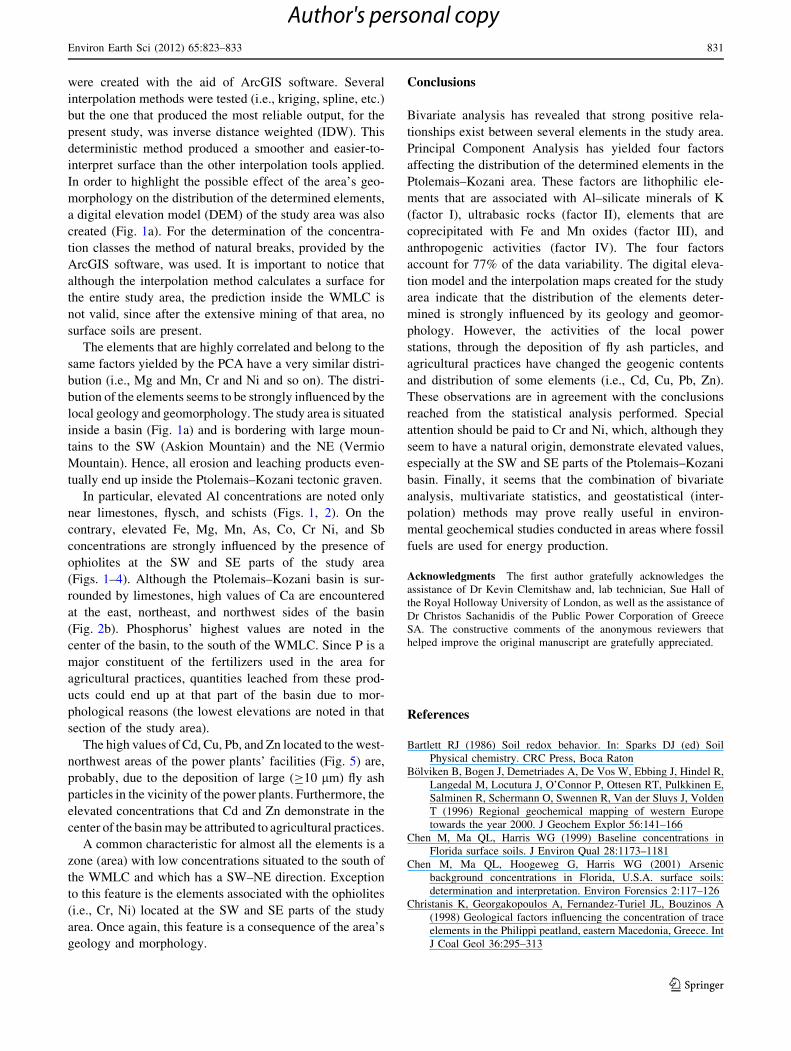
Table 3 Average concentrations of Cr and Ni in surface soils of the
study area and other Greek regions
Average (mg kg-1) Cr Ni
Present study 345.8 286.8
Ptolemais–Kozani (1) 262.2 190.0
Ptolemais–Kozani (2) 77.5 161.3
Thessalia, central Greece (3) 299.0 189.0
Kavala, northern Greece (4) 11.1* 11.0*
Kavala, northern Greece (5) 16.1 14.9
Nestor River, northern Greece (6) 25.5 20.3
Central Euboea (7) 1300.0 2800.0
Dutch list target value (8) 100.0 35.0
Dutch list intervention value (8) 380.0 210.0
Target and intervention values of the Dutch list are also included: (1)
Georgakopoulos et al. (2002a), (2) Stalikas et al. (1997), (3) Skordas
et al. (2010), (4) Papastergios et al. (2011), (5) Papastergios et al.
(2010b), (6) Papastergios et al. (2009), (7) Megremi (2010), (8)
Petrotou et al. (2010), values marked with asterisk represent geo-
metric average
Table 4 Average concentrations of Cd, Cr Cu, Ni, Pb and Zn in
surface soils of the study area and fly ash produced in the power
stations of the study area
Average (mg kg-1) Cd Cr Cu Ni Pb Zn
Soils
Present study 0.5 345.8 36.9 286.8 17.2 80.0
Fly ash
Georgakopoulos et al.
(2002a)
1.1 339.9 60.9 332.4 30.6 249.1
Georgakopoulos et al.
(2002b)
1.0 154.5 52.0 209.7 24.3 97.7
Georgakopoulos et al.
(2002c)
1.5 148.9 74.9 217.4 27.2 130.0
Papastergios et al.
(2007)
1.3 296.2 39.0 386.5 30.7 91.3
830 Environ Earth Sci (2012) 65:823–833
123
Author's personal copy
were created with the aid of ArcGIS software. Several
interpolation methods were tested (i.e., kriging, spline, etc.)
but the one that produced the most reliable output, for the
present study, was inverse distance weighted (IDW). This
deterministic method produced a smoother and easier-to-
interpret surface than the other interpolation tools applied.
In order to highlight the possible effect of the area’s geo-
morphology on the distribution of the determined elements,
a digital elevation model (DEM) of the study area was also
created (Fig. 1a). For the determination of the concentra-
tion classes the method of natural breaks, provided by the
ArcGIS software, was used. It is important to notice that
although the interpolation method calculates a surface for
the entire study area, the prediction inside the WMLC is
not valid, since after the extensive mining of that area, no
surface soils are present.
The elements that are highly correlated and belong to the
same factors yielded by the PCA have a very similar distri-
bution (i.e., Mg and Mn, Cr and Ni and so on). The distri-
bution of the elements seems to be strongly influenced by the
local geology and geomorphology. The study area is situated
inside a basin (Fig. 1a) and is bordering with large moun-
tains to the SW (Askion Mountain) and the NE (Vermio
Mountain). Hence, all erosion and leaching products even-
tually end up inside the Ptolemais–Kozani tectonic graven.
In particular, elevated Al concentrations are noted only
near limestones, flysch, and schists (Figs. 1, 2). On the
contrary, elevated Fe, Mg, Mn, As, Co, Cr Ni, and Sb
concentrations are strongly influenced by the presence of
ophiolites at the SW and SE parts of the study area
(Figs. 1–4). Although the Ptolemais–Kozani basin is sur-
rounded by limestones, high values of Ca are encountered
at the east, northeast, and northwest sides of the basin
(Fig. 2b). Phosphorus’ highest values are noted in the
center of the basin, to the south of the WMLC. Since P is a
major constituent of the fertilizers used in the area for
agricultural practices, quantities leached from these prod-
ucts could end up at that part of the basin due to mor-
phological reasons (the lowest elevations are noted in that
section of the study area).
The high values of Cd, Cu, Pb, and Zn located to the west-
northwest areas of the power plants’ facilities (Fig. 5) are,
probably, due to the deposition of large (C10 lm) fly ash
particles in the vicinity of the power plants. Furthermore, the
elevated concentrations that Cd and Zn demonstrate in the
center of the basin may be attributed to agricultural practices.
A common characteristic for almost all the elements is a
zone (area) with low concentrations situated to the south of
the WMLC and which has a SW–NE direction. Exception
to this feature is the elements associated with the ophiolites
(i.e., Cr, Ni) located at the SW and SE parts of the study
area. Once again, this feature is a consequence of the area’s
geology and morphology.
Conclusions
Bivariate analysis has revealed that strong positive rela-
tionships exist between several elements in the study area.
Principal Component Analysis has yielded four factors
affecting the distribution of the determined elements in the
Ptolemais–Kozani area. These factors are lithophilic ele-
ments that are associated with Al–silicate minerals of K
(factor I), ultrabasic rocks (factor II), elements that are
coprecipitated with Fe and Mn oxides (factor III), and
anthropogenic activities (factor IV). The four factors
account for 77% of the data variability. The digital eleva-
tion model and the interpolation maps created for the study
area indicate that the distribution of the elements deter-
mined is strongly influenced by its geology and geomor-
phology. However, the activities of the local power
stations, through the deposition of fly ash particles, and
agricultural practices have changed the geogenic contents
and distribution of some elements (i.e., Cd, Cu, Pb, Zn).
These observations are in agreement with the conclusions
reached from the statistical analysis performed. Special
attention should be paid to Cr and Ni, which, although they
seem to have a natural origin, demonstrate elevated values,
especially at the SW and SE parts of the Ptolemais–Kozani
basin. Finally, it seems that the combination of bivariate
analysis, multivariate statistics, and geostatistical (inter-
polation) methods may prove really useful in environ-
mental geochemical studies conducted in areas where fossil
fuels are used for energy production.
Acknowledgments The first author gratefully acknowledges the
assistance of Dr Kevin Clemitshaw and, lab technician, Sue Hall of
the Royal Holloway University of London, as well as the assistance of
Dr Christos Sachanidis of the Public Power Corporation of Greece
SA. The constructive comments of the anonymous reviewers that
helped improve the original manuscript are gratefully appreciated.
References
Bartlett RJ (1986) Soil redox behavior. In: Sparks DJ (ed) Soil
Physical chemistry. CRC Press, Boca Raton
Bolviken B, Bogen J, Demetriades A, De Vos W, Ebbing J, Hindel R,
Langedal M, Locutura J, O’Connor P, Ottesen RT, Pulkkinen E,
Salminen R, Schermann O, Swennen R, Van der Sluys J, Volden
T (1996) Regional geochemical mapping of western Europe
towards the year 2000. J Geochem Explor 56:141–166
Chen M, Ma QL, Harris WG (1999) Baseline concentrations in
Florida surface soils. J Environ Qual 28:1173–1181
Chen M, Ma QL, Hoogeweg G, Harris WG (2001) Arsenic
background concentrations in Florida, U.S.A. surface soils:
determination and interpretation. Environ Forensics 2:117–126
Christanis K, Georgakopoulos A, Fernandez-Turiel JL, Bouzinos A
(1998) Geological factors influencing the concentration of trace
elements in the Philippi peatland, eastern Macedonia, Greece. Int
J Coal Geol 36:295–313
Environ Earth Sci (2012) 65:823–833 831
123
Author's personal copy
Cui YJ, Zhai RH, Huang YZ, Qiu Y, Liang JZ (2005) Exposure to
metal mixtures and human health impacts in a contaminated area
in Nanning, China. Environ Int 31:784–790
Diamantopoulos A (2005) Semi-brittle asymmetric shear planes
controlling the Cenozoic kinematics of Internal Hellenides
(northern Greece): field evidence from Askion and Vermio
mountain ranges. In: International earth Sciences Colloquium on
the Aegean Regions, IESCA 2005, October 4–7, 2005, Abstract
book, 31, Izmir-Turkey
Diamantopoulos A (2006) Plio-Quaternary geometry and kinematics
of Ptolemais basin, northern Greece: implications for the intra-
plate tectonics in western Macedonia. Geol Croat 59:85–96
Fernandez-Turiel JL, Acenolaza P, Medina ME, Llorens JF, Sardi F
(2001) Assessment of a smelter impact area using surface soils
and plants. Environ Geochem Health 23:65–78
Fernandez-Turiel JL, Georgakopoulos A, Gimeno D, Papastergios G,
Kolovos N (2004) Ash deposition in a pulverized coal-fired
power plant after high-calcium lignite combustion. Energy Fuels
18:1512–1518
Filippidis A, Georgakopoulos A, Kassoli-Fournaraki A, Misaelides P,
Yiakkoupis P, Broussoulis J (1996) Trace element contents in
composite samples of three lignite seams from the central part of
the Drama lignite deposit, Macedonia, Greece. Int J Coal Geol
29:219–234
FOREGS (Forum of European Geological Surveys) (2005) FOREGS
geochemical baseline mapping program. http://www.gsf.fi/
foregs/geo-chem/index.htm. Accessed March 2009
Georgakopoulos A, Fernandez-Turiel JL, Filippidis A, Llorens JF,
Kassoli-Fournaraki A, Querol X, Lopez-Soler A (1995) Trace
element contents of the Lava Xylite/Lignite and Ptolemais
lignite deposits, Macedonia County, Greece. In: Pajares JA,
Tascon JMD (eds) Coal science. Coal Science and Technology,
vol 24. Elsevier, New York, pp 163–166
Georgakopoulos A, Filippidis A, Fernandez-Turiel JL, Kassoli-
Fournaraki A, Iordanidis A (2002a) Lithogenic and anthropo-
genic origin of trace elements in surface soils from Amynteo-
Ptolemais-Kozani lignite basin. In: 6th Pan-Helenic geographical
conference, Thessaloniki, Greece, 2002 (in Greek, with English
abstract), pp 335–342
Georgakopoulos A, Filippidis A, Kassoli-Fournaraki A, Iordanidis A,
Fernandez-Turiel JL, Llorens JF, Gimeno D (2002b) Environ-
mentally important elements in fly ashes and their leachates of
the power stations of Greece. Energy Source 24:83–91
Georgakopoulos A, Filippidis A, Kassoli-Fournaraki A, Fernandez-
Turiel JL, Llorens JF, Mousty F (2002c) Leachability of major
and trace elements of fly ash from Ptolemais power station,
northern Greece. Energy Source 24:103–113
Gikas GD, Tsihrintzis VA, Akratos CS, Haralambidis G (2009) Water
quality trends in Polyphytos reservoir, Aliakmon River, Greece.
Environ Monit Assess 149:163–181
Hesterberg D (1998) Biochemical cycles and processes leading to
changes in mobility of chemicals in soils. Agric Ecosyst Environ
67:121–133
Iordanidis A, Buckman J, Triantafyllou AG, Asvesta A (2008a)
ESEM–EDX characterization of airborne particles from an
industrialized area of northern Greece. Environ Geochem Health
30:391–405
Iordanidis A, Buckman J, Triantafyllou AG, Asvesta A (2008b) Fly
ash–airborne particles from Ptolemais–Kozani area, northern
Greece, as determined by ESEM-EDX. Int J Coal Geol 73:63–73
Kabata-Pendias A, Pendias H (2001) Trace elements in soils and
plants, 3rd edn. CRC Press, New York
Kaldellis JK, Zafirakis D, Kondili E (2009) Contribution of lignite in
the Greek electricity generation: review and future prospects.
Fuel 88:75–489
Karamanis D, Ioannides K, Stamoulis K (2009) Environmental
assessment of natural radionuclides and heavy metals in waters
discharged from a lignite-fired power plant. Fuel 88:2046–2052
Kavouridis K (2008) Lignite industry in Greece within a world
context: mining, energy supply and environment. Energy Policy
36:1257–1272
Kavouridis K, Koukouzas N (2008) Coal and sustainable energy
supply challenges and barriers. Energy Policy 36:693–703
Kelepertsis A, Argyraki A, Alexakis D (2006) Multivariate statistics
and spatial interpretation of geochemical data for assessing soil
contamination by potentially toxic elements in the mining area of
Stratoni, north Greece. Geochem Explor Env A 6:349–355
Kolovos N, Georgakopoulos A, Filippidis A, Kavouridis C (2002a)
Utilization of lignite reserves and simultaneous improvement of
dust emissions and operation efficiency of a power plant by
controlling the calcium (total and free) content of the fed lignite.
Application on the Agios Dimitrios power plant, Ptolemais,
Greece. Energy Fuel 16:1516–1522
Kolovos N, Georgakopoulos A, Filippidis A, Kavouridis C (2002b)
Environmental effects of lignite and intermediate steriles coex-
cavation in the southern lignite field mine of Ptolemais, northern
Greece. Energy Source 24:561–573
Kolovos N, Georgakopoulos A, Filippidis A, Kavouridis C (2002c)
The effects on the mined lignite quality characteristics by the
intercalated thin layers of carbonates in Ptolemais mines,
northern Greece. Energy Source 24:761–772
Koufos GD, Pavlides SB (1988) Correlation between the continental
deposits of the lower Axios valley and Ptolemais basin. Bull
Geol Soc Greece 20:9–19
Megremi I (2010) Distribution and bioavailability of Cr in central
Euboea, Greece. Cent Eur J Geosci 2:103–123
Mountrakis D (1983) The geological structure of the north Pelagonian
Zone and the geotectonic evolution of the Internal Hellenides.
Dissertation, Aristotle University of Thessaloniki, Greece (in
Greek)
Owen RB, Renaut RW, Stamatakis MG (2010) Diatomaceous
sedimentation in late Neogene lacustrine basins of western
Macedonia, Greece. J Paleolimnol. doi:10.1007/s10933-010-
9409-5
Papadopoulos A, Prochaska C, Papadopoulos F, Gantidis N, Metaxa
E (2007) Determination and evaluation of cadmium, copper,
nickel, and zinc in agricultural soils of western Macedonia,
Greece. Environ Manag 40:719–726
Papastergios G, Georgakopoulos A, Fernandez-Turiel JL, Gimeno D,
Kapetanios C (2005) Leachability of environmentally hazardous
elements from ashes produced after lignite combustion in Agios
Dimitrios power plant, northern Greece. In: Proceedings of the
5th international scientific conference of modern management of
mine producing, geology and environmental protection (SGEM),
Albena Complex, Bulgaria, 13–17 June 2005, pp 299–306
Papastergios G, Fernandez–Turiel JL, Georgakopoulos A, Gimeno D
(2007) Slag and ash chemistry after high-calcium lignite
combustion in a pulverized coal-fired power plant. Glob NEST
J 9:77–82
Papastergios G, Fernandez-Turiel JL, Georgakopoulos A, Gimeno D
(2009) Natural and anthropogenic effects on the sediment
geochemistry of Nestos River, northern Greece. Environ Geol
58:1361–1370
Papastergios G, Fernandez-Turiel JL, Georgakopoulos A, Gimeno D
(2010a) Arsenic background concentrations in surface soils of
Kavala area, northern Greece. Water Air Soil Pollut 209:323–331
Papastergios G, Filippidis A, Fernandez–Turiel JL, Gimeno D,
Sikalidis C (2010b) Natural and anthropogenic effects on the
soil geochemistry of Kavala area, northern Greece. Bull Geol
Soc Greece 43:2373–2382
832 Environ Earth Sci (2012) 65:823–833
123
Author's personal copy
Papastergios G, Filippidis A, Fernandez–Turiel JL, Gimeno D,
Sikalidis C (2011) Surface soil geochemistry for environmental
assessment in Kavala area, northern Greece. Water Air Soil
Pollut 216:141–152
Pavlides SB (1985) Neotectonic evolution of the Florina-Vegoritis-
Ptolemais basin (W. Macedonia. Greece). Dissertation, Aristotle
University of Thessaloniki, Greece (in Greek, with English
summary)
Pavlides SB, Mountrakis DM (1987) Extensional tectonics of
northwestern Macedonia, Greece, since the late Miocene.
J Struct Geol 9:385–392
Petaloti C, Triantafyllou A, Kouimtzis T, Samara C (2006) Trace
elements in atmospheric particulate matter over a coal burning
power production area of western Macedonia, Greece. Chemo-
sphere 65:2233–2243
Petrotou A, Skordas K, Papastergios G, Filippidis A (2010) Concen-
trations and bioavailability of potentially toxic elements in soils
of an industrialised area of northwestern Greece. Fresen Environ
Bull 19:2769–2776
Querol X, Alastuey AS, Lopez-Soler A, Mantillai E, Plana F (1996)
Mineral composition of atmospheric particulates around a large
coal-fired power station. Atmos Environ 30:3557–3572
Salminen R (2007) Geochemical Atlas of Europe. http://www.
gtk.fi/publ/foregsatlas/. Accessed March 2009
Samara C (2005) Chemical mass balance source apportionment of
TSP in a lignite-burning area of western Macedonia, Greece.
Atmos Environ 39:6430–6443
Skordas K, Kelepertsis A (2005) Soil contamination by toxic metals
in the cultivated region of Agia, Thessaly, Greece. Identification
of sources of contamination. Environ Geol 48:615–624
Skordas K, Alexakis D, Kelepertsis E, Kelepertsis A (2007)
Environmental geochemical research for the levels and the
sources of toxic metals in the agricultural soils of Dimitra-
Eleftherion and Platycampos region, Thessaly, Greece. Res J
Chem Environ 11:7–18
Skordas K, Pateras D, Papastergios G, Lolas A, Filippidis A (2010)
Spatial distribution and concentrations of Fe, Mg, Co, Cr and Ni
in surface soils of central Greece as affected by parent rocks.
Geochem Mineral Petrol, Sofia 48:95–102
Sotiropoulos D, Georgakopoulos A, Kolovos N (2005) Impact of free-
calcium oxide content of the fly ash on dust and sulfur dioxide
emissions in a lignite-fired power plant. J Air Waste Manag
Assoc 55:1042–1049
Stalikas DC, Chaidou IC, Pilidis AG (1997) Enrichment of PAHs and
heavy metals in soils in the vicinity of the lignite-fired power
plants of west Macedonia (Greece). Sci Total Environ
204:134–146
Triantafyllou AG (2003) Levels and trend of suspended particles
around large lignite power stations. Environ Monit Assess
89:15–34
Triantafyllou AG, Zoras S, Evagelopoulos V (2006) Particulate
matter over a seven year period in urban and rural areas within,
proximal and far from mining and power station operations in
Greece. Environ Monit Assess 122:41–60
Tsikritzis LI (2005) Chemometrics of the distribution and origin of226Ra, 228Ra, 40K and 137Cs in plants near the west Macedonia
lignite center (Greece). J Radioanal Nucl Chem 264:651–656
van Hinsbergen DJJ, van der Meer DG, Zachariasse WJ, Meulenkamp
JE (2006) Deformation of western Greece during Neogene
clockwise rotation and collision with Apulia. Int J Earth Sci
95:463–490
Vatalis KI, Kaliampakos DC (2006) An overall index of environ-
mental quality in coal mining areas and energy facilities.
Environ Manag 38:1031–1045
Environ Earth Sci (2012) 65:823–833 833
123
Author's personal copy