tracing toxic elements sources using lead isotopes: an example from the san antonio–el triunfo...
TRANSCRIPT
Applied Geochemistry 59 (2015) 23–32
Contents lists available at ScienceDirect
Applied Geochemistry
journal homepage: www.elsevier .com/ locate/apgeochem
Tracing toxic elements sources using lead isotopes: An example from theSan Antonio–El Triunfo mining district, Baja California Sur, México
http://dx.doi.org/10.1016/j.apgeochem.2015.03.0110883-2927/� 2015 Elsevier Ltd. All rights reserved.
⇑ Corresponding author at: Instituto Mexicano del Petróleo, Eje Central LázaroCárdenas Norte 152, Distrito Federal 07730, Mexico. Fax: +52 55 9175 6000.
E-mail address: [email protected] (L. Gutiérrez-Caminero).
Leopoldo Gutiérrez-Caminero a,⇑, Bodo Weber a, Jobst Wurl b, Mariela Carrera-Muñoz a
a Departamento de Geología, Centro de Investigación Científica y de Educación Superior de Ensenada (CICESE), Carretera Ensenada-Tijuana 3918, Ensenada 22860, Mexicob Departamento de Geología Marina, Universidad Autónoma de Baja California Sur (UABCS), Carretera al Sur, km 5.5, La Paz 23080, Mexico
a r t i c l e i n f o
Article history:Available online 26 March 2015Editorial handling by Peter Birkle
a b s t r a c t
Pollution of sediments and water bodies with toxic elements around the San Antonio–El Triunfo miningdistrict, Baja California Sur, México is probably sourced from the tailings of abandoned mines that arehosted in mineralized Cretaceous granitoids. However, there is evidence to suggest local hot springsrelated to recent faults may be an additional source for contamination in the area. In this study, lead iso-tope signatures are applied to draw conclusions with regard to potential sources of toxic elements. Leadisotope ratios were analyzed from sulfides and scoria from the abandoned mines, fluvial sediments, andigneous rocks with secondary disseminated mineralization. To differentiate between superposed sec-ondary and residual primary lead, leaching experiments were performed, and both leachate and residueswere analyzed separately. Most of the residues from sediment samples have lead isotope ratios similar tothose from the sulfides and scoria of the mining district, indicating that most of the lead in the detritus isrelated to the mineralized plutons. However, there is evidence of an additional detrital component. Leadisotope ratios from the leachates indicate a different source for the superimposed lead that is bestexplained by the contamination with the average Mexican industrial lead. Secondary disseminatedmineralization that is related to younger, deep structures (hot springs) has different lead isotope ratioscompared to massive vein sulfides and accounts for a significant amount in areas with high contam-ination levels. Thus, lead isotope systematics is a feasible method for tracing sources of toxic elementsto distinguish between different natural, metallurgical, and anthropogenic inputs.
� 2015 Elsevier Ltd. All rights reserved.
1. Introduction
The wastes from abandoned mines adjacent to the villages ofSan Antonio and El Triunfo Baja California Sur, México (Fig. 1), herereferred to as the San Antonio–El Triunfo mining district (SA–ET),contain high concentrations of toxic elements, in particular Pb,As, Cd, Hg, and Zn (Duffus, 2002; Posada-Ayala, 2011;Marmolejo-Rodríguez et al., 2011). Waste rock piles have inter-acted with the environment for over a century. Since then, in theabsence of regulation and remediation processes, the erosiveagents have dispersed significant amounts of toxic elements intothe environment of the surrounding valleys (Carrillo-Chávezet al., 2000; Posada-Ayala, 2011; Marmolejo-Rodríguez et al.,2011). To improve successful remediation techniques and preventmajor damages to the environment it is important to recognize thesources and the dispersion mechanisms of the toxic elements.
The SA–ET is located at the southern tip of the Baja CaliforniaPeninsula (inset Fig. 1). The conditions in the area favor the trans-port of wastes from the SA–ET towards the Pacific Ocean throughthe El Carrizal Basin and to the Gulf of California through the SanJuan de los Planes (SJP) Basin. The mining prospects towards thesouth of the SA–ET are connected to the Pacific Ocean throughthe Canada Honda Basin (Fig. 1).
Previous studies in the area include geochemical (Posada-Ayala,2011), sedimentological (Del Rosal Pardo, 2003), hydrological(Marmolejo-Rodríguez et al., 2011), and environmental character-izations (Volke-Sepúlveda et al., 2003; Naranjo-Pulido et al., 2002).These studies reported concentrations of toxic elements alongwatersheds and soils around the SA–ET. The data show that thehighest concentrations of toxic elements are consistently close tothe abandoned mines, decreasing with increasing distance to theSA–ET (Fig. 2). The studies further suggest the hydrological system,e.g., pluvial drainage and groundwater flow, as the main diffusionmechanism for mine wastes from the SA–ET into the surroundingbasins.
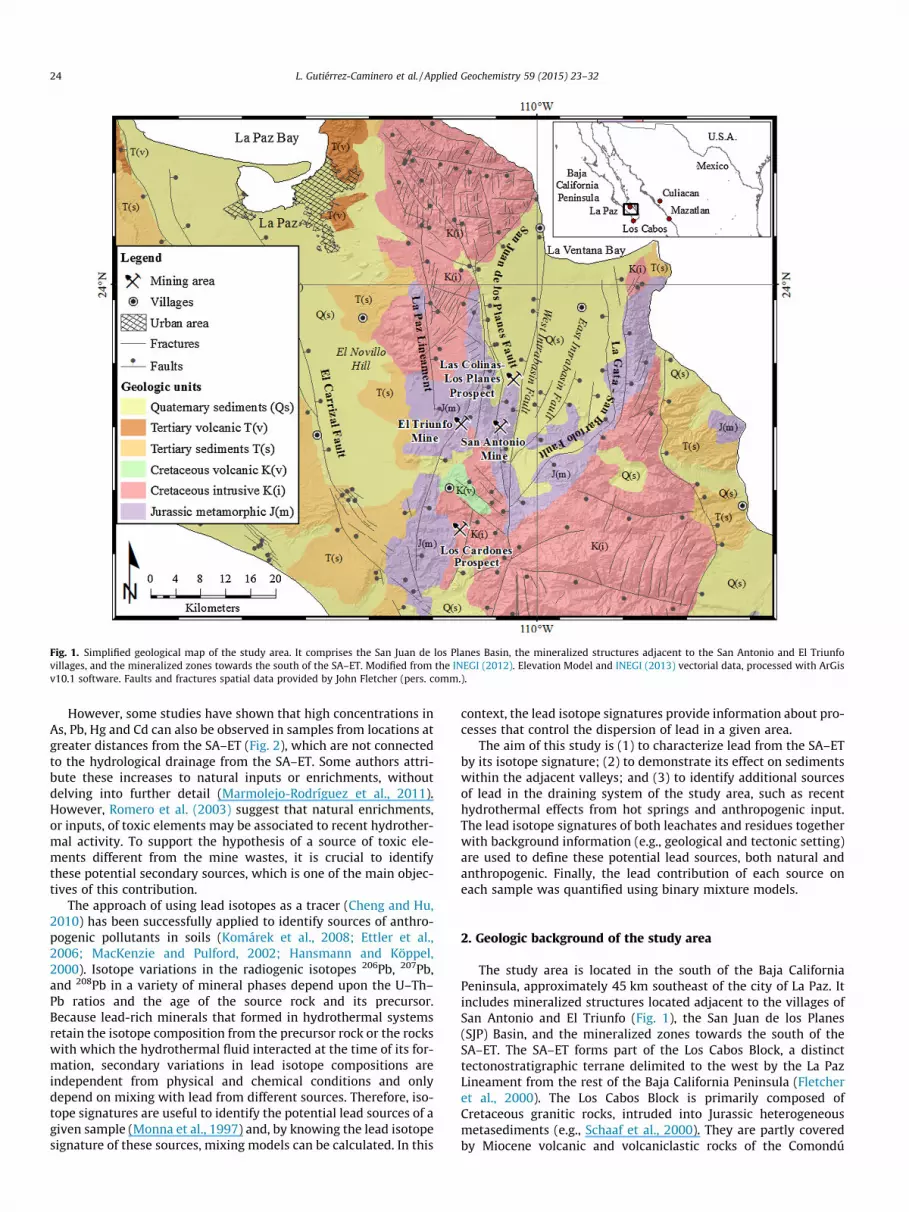
Fig. 1. Simplified geological map of the study area. It comprises the San Juan de los Planes Basin, the mineralized structures adjacent to the San Antonio and El Triunfovillages, and the mineralized zones towards the south of the SA–ET. Modified from the INEGI (2012). Elevation Model and INEGI (2013) vectorial data, processed with ArGisv10.1 software. Faults and fractures spatial data provided by John Fletcher (pers. comm.).
24 L. Gutiérrez-Caminero et al. / Applied Geochemistry 59 (2015) 23–32
However, some studies have shown that high concentrations inAs, Pb, Hg and Cd can also be observed in samples from locations atgreater distances from the SA–ET (Fig. 2), which are not connectedto the hydrological drainage from the SA–ET. Some authors attri-bute these increases to natural inputs or enrichments, withoutdelving into further detail (Marmolejo-Rodríguez et al., 2011).However, Romero et al. (2003) suggest that natural enrichments,or inputs, of toxic elements may be associated to recent hydrother-mal activity. To support the hypothesis of a source of toxic ele-ments different from the mine wastes, it is crucial to identifythese potential secondary sources, which is one of the main objec-tives of this contribution.
The approach of using lead isotopes as a tracer (Cheng and Hu,2010) has been successfully applied to identify sources of anthro-pogenic pollutants in soils (Komárek et al., 2008; Ettler et al.,2006; MacKenzie and Pulford, 2002; Hansmann and Köppel,2000). Isotope variations in the radiogenic isotopes 206Pb, 207Pb,and 208Pb in a variety of mineral phases depend upon the U–Th–Pb ratios and the age of the source rock and its precursor.Because lead-rich minerals that formed in hydrothermal systemsretain the isotope composition from the precursor rock or the rockswith which the hydrothermal fluid interacted at the time of its for-mation, secondary variations in lead isotope compositions areindependent from physical and chemical conditions and onlydepend on mixing with lead from different sources. Therefore, iso-tope signatures are useful to identify the potential lead sources of agiven sample (Monna et al., 1997) and, by knowing the lead isotopesignature of these sources, mixing models can be calculated. In this
context, the lead isotope signatures provide information about pro-cesses that control the dispersion of lead in a given area.
The aim of this study is (1) to characterize lead from the SA–ETby its isotope signature; (2) to demonstrate its effect on sedimentswithin the adjacent valleys; and (3) to identify additional sourcesof lead in the draining system of the study area, such as recenthydrothermal effects from hot springs and anthropogenic input.The lead isotope signatures of both leachates and residues togetherwith background information (e.g., geological and tectonic setting)are used to define these potential lead sources, both natural andanthropogenic. Finally, the lead contribution of each source oneach sample was quantified using binary mixture models.
2. Geologic background of the study area
The study area is located in the south of the Baja CaliforniaPeninsula, approximately 45 km southeast of the city of La Paz. Itincludes mineralized structures located adjacent to the villages ofSan Antonio and El Triunfo (Fig. 1), the San Juan de los Planes(SJP) Basin, and the mineralized zones towards the south of theSA–ET. The SA–ET forms part of the Los Cabos Block, a distincttectonostratigraphic terrane delimited to the west by the La PazLineament from the rest of the Baja California Peninsula (Fletcheret al., 2000). The Los Cabos Block is primarily composed ofCretaceous granitic rocks, intruded into Jurassic heterogeneousmetasediments (e.g., Schaaf et al., 2000). They are partly coveredby Miocene volcanic and volcaniclastic rocks of the Comondú

Fig. 2. Maps of the study area showing toxic element concentrations in fluvial sediments reported by Posada-Ayala (2011), (A) lead, (B) arsenic, (C) cadmium, and (D) zinc.Note: the highest values are observed close to SA–ET, decreasing with increasing distance from SA–ET. High concentrations are also observed close to the main normal faultswithin the SJP basin (Fig. 1).
L. Gutiérrez-Caminero et al. / Applied Geochemistry 59 (2015) 23–32 25
Formation, which predates the opening of the Gulf of California(Schaaf et al., 2000).
The SJP basin is an active Graben structure, flanked to the westby the San Juan de los Planes normal fault and to the east by the
San Bartolo-La Gata normal fault (Fig. 1). A gravity profile acrossthe SJP basin (Busch et al., 2011) suggests the maximum depth ofthe basin is next to a bedrock height at the east, which is inter-preted in terms of a west-dipping intrabasin fault. Towards the
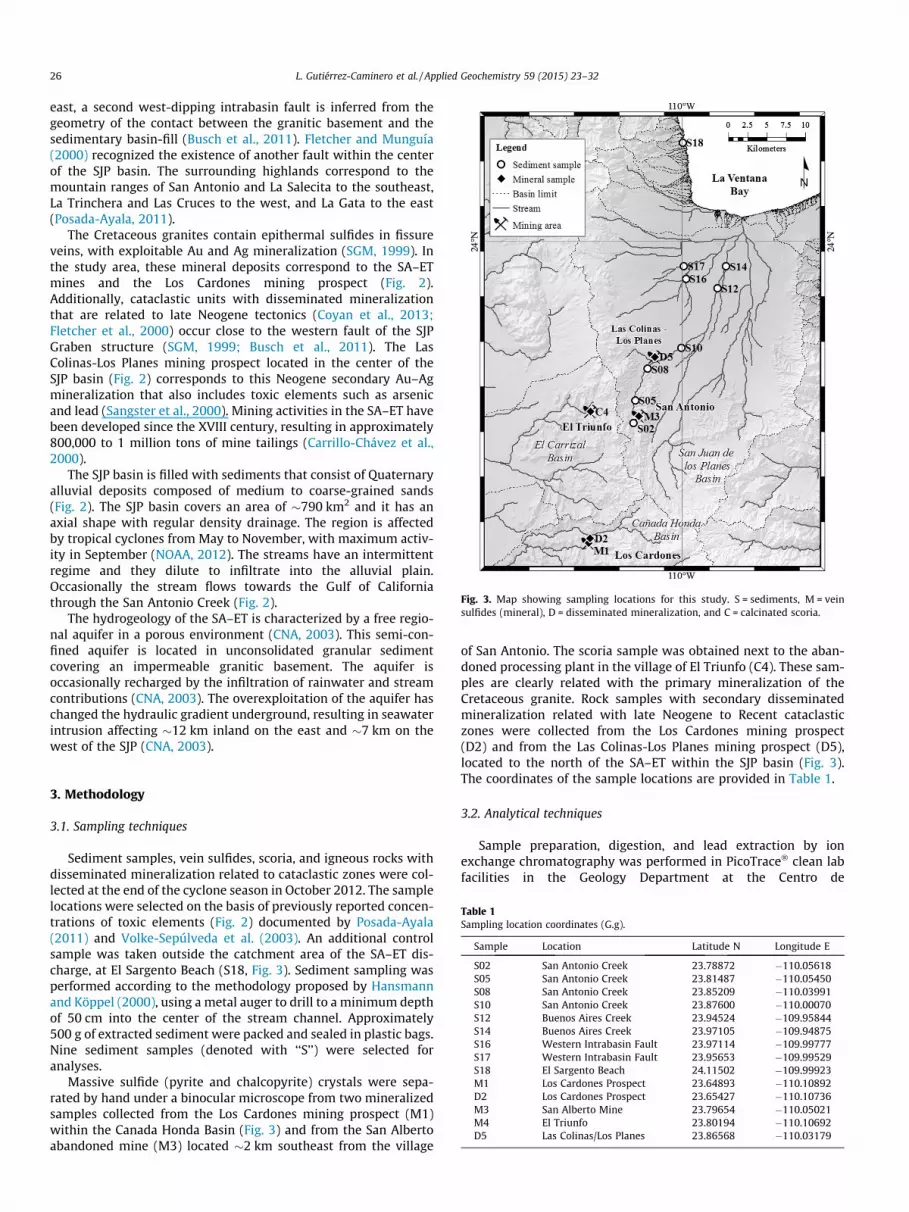
Fig. 3. Map showing sampling locations for this study. S = sediments, M = veinsulfides (mineral), D = disseminated mineralization, and C = calcinated scoria.
26 L. Gutiérrez-Caminero et al. / Applied Geochemistry 59 (2015) 23–32
east, a second west-dipping intrabasin fault is inferred from thegeometry of the contact between the granitic basement and thesedimentary basin-fill (Busch et al., 2011). Fletcher and Munguía(2000) recognized the existence of another fault within the centerof the SJP basin. The surrounding highlands correspond to themountain ranges of San Antonio and La Salecita to the southeast,La Trinchera and Las Cruces to the west, and La Gata to the east(Posada-Ayala, 2011).
The Cretaceous granites contain epithermal sulfides in fissureveins, with exploitable Au and Ag mineralization (SGM, 1999). Inthe study area, these mineral deposits correspond to the SA–ETmines and the Los Cardones mining prospect (Fig. 2).Additionally, cataclastic units with disseminated mineralizationthat are related to late Neogene tectonics (Coyan et al., 2013;Fletcher et al., 2000) occur close to the western fault of the SJPGraben structure (SGM, 1999; Busch et al., 2011). The LasColinas-Los Planes mining prospect located in the center of theSJP basin (Fig. 2) corresponds to this Neogene secondary Au–Agmineralization that also includes toxic elements such as arsenicand lead (Sangster et al., 2000). Mining activities in the SA–ET havebeen developed since the XVIII century, resulting in approximately800,000 to 1 million tons of mine tailings (Carrillo-Chávez et al.,2000).
The SJP basin is filled with sediments that consist of Quaternaryalluvial deposits composed of medium to coarse-grained sands(Fig. 2). The SJP basin covers an area of �790 km2 and it has anaxial shape with regular density drainage. The region is affectedby tropical cyclones from May to November, with maximum activ-ity in September (NOAA, 2012). The streams have an intermittentregime and they dilute to infiltrate into the alluvial plain.Occasionally the stream flows towards the Gulf of Californiathrough the San Antonio Creek (Fig. 2).
The hydrogeology of the SA–ET is characterized by a free regio-nal aquifer in a porous environment (CNA, 2003). This semi-con-fined aquifer is located in unconsolidated granular sedimentcovering an impermeable granitic basement. The aquifer isoccasionally recharged by the infiltration of rainwater and streamcontributions (CNA, 2003). The overexploitation of the aquifer haschanged the hydraulic gradient underground, resulting in seawaterintrusion affecting �12 km inland on the east and �7 km on thewest of the SJP (CNA, 2003).
Table 1Sampling location coordinates (G.g).
Sample Location Latitude N Longitude E
S02 San Antonio Creek 23.78872 �110.05618S05 San Antonio Creek 23.81487 �110.05450S08 San Antonio Creek 23.85209 �110.03991S10 San Antonio Creek 23.87600 �110.00070S12 Buenos Aires Creek 23.94524 �109.95844S14 Buenos Aires Creek 23.97105 �109.94875S16 Western Intrabasin Fault 23.97114 �109.99777S17 Western Intrabasin Fault 23.95653 �109.99529S18 El Sargento Beach 24.11502 �109.99923M1 Los Cardones Prospect 23.64893 �110.10892D2 Los Cardones Prospect 23.65427 �110.10736M3 San Alberto Mine 23.79654 �110.05021M4 El Triunfo 23.80194 �110.10692D5 Las Colinas/Los Planes 23.86568 �110.03179
3. Methodology
3.1. Sampling techniques
Sediment samples, vein sulfides, scoria, and igneous rocks withdisseminated mineralization related to cataclastic zones were col-lected at the end of the cyclone season in October 2012. The samplelocations were selected on the basis of previously reported concen-trations of toxic elements (Fig. 2) documented by Posada-Ayala(2011) and Volke-Sepúlveda et al. (2003). An additional controlsample was taken outside the catchment area of the SA–ET dis-charge, at El Sargento Beach (S18, Fig. 3). Sediment sampling wasperformed according to the methodology proposed by Hansmannand Köppel (2000), using a metal auger to drill to a minimum depthof 50 cm into the center of the stream channel. Approximately500 g of extracted sediment were packed and sealed in plastic bags.Nine sediment samples (denoted with ‘‘S’’) were selected foranalyses.
Massive sulfide (pyrite and chalcopyrite) crystals were sepa-rated by hand under a binocular microscope from two mineralizedsamples collected from the Los Cardones mining prospect (M1)within the Canada Honda Basin (Fig. 3) and from the San Albertoabandoned mine (M3) located �2 km southeast from the village
of San Antonio. The scoria sample was obtained next to the aban-doned processing plant in the village of El Triunfo (C4). These sam-ples are clearly related with the primary mineralization of theCretaceous granite. Rock samples with secondary disseminatedmineralization related with late Neogene to Recent cataclasticzones were collected from the Los Cardones mining prospect(D2) and from the Las Colinas-Los Planes mining prospect (D5),located to the north of the SA–ET within the SJP basin (Fig. 3).The coordinates of the sample locations are provided in Table 1.
3.2. Analytical techniques
Sample preparation, digestion, and lead extraction by ionexchange chromatography was performed in PicoTrace� clean labfacilities in the Geology Department at the Centro de
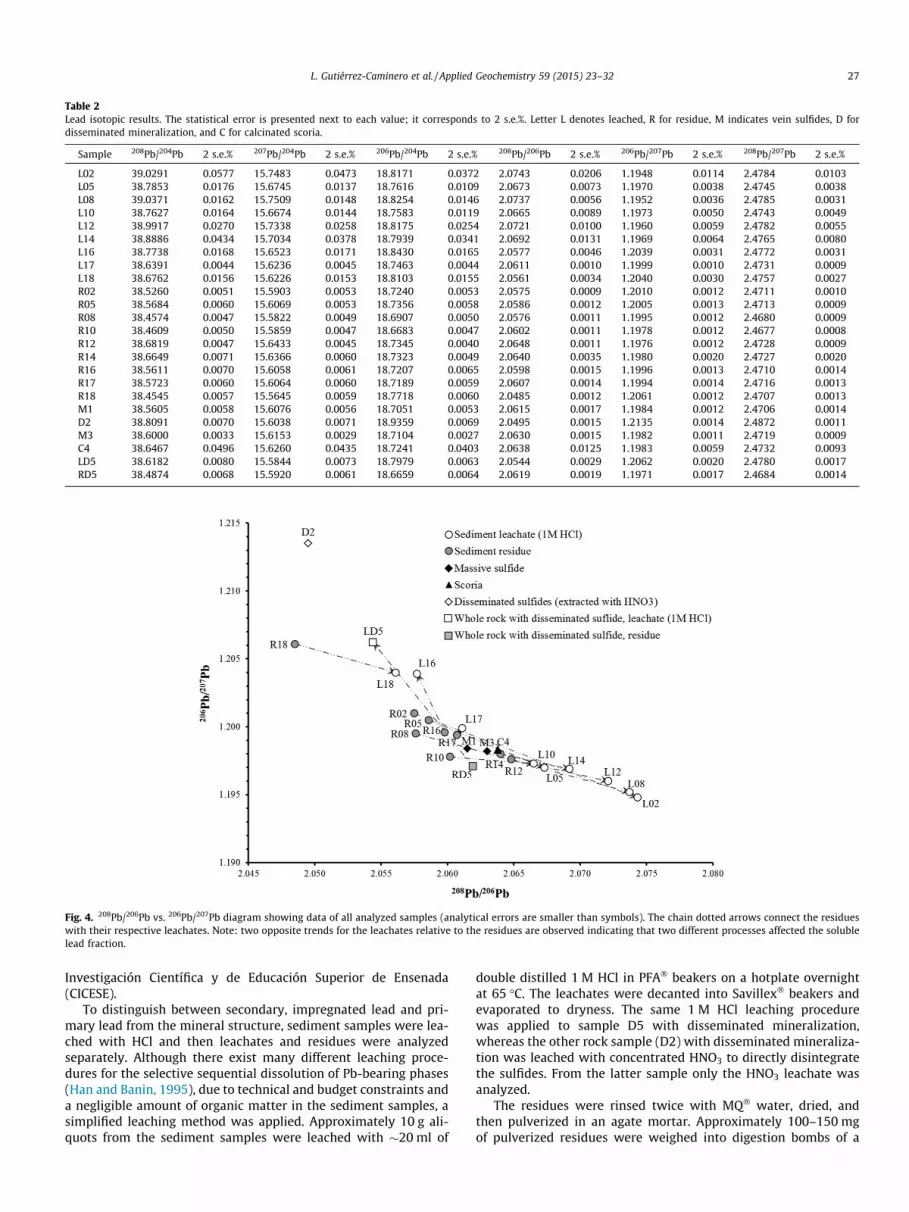
Table 2Lead isotopic results. The statistical error is presented next to each value; it corresponds to 2 s.e.%. Letter L denotes leached, R for residue, M indicates vein sulfides, D fordisseminated mineralization, and C for calcinated scoria.
Sample 208Pb/204Pb 2 s.e.% 207Pb/204Pb 2 s.e.% 206Pb/204Pb 2 s.e.% 208Pb/206Pb 2 s.e.% 206Pb/207Pb 2 s.e.% 208Pb/207Pb 2 s.e.%
L02 39.0291 0.0577 15.7483 0.0473 18.8171 0.0372 2.0743 0.0206 1.1948 0.0114 2.4784 0.0103L05 38.7853 0.0176 15.6745 0.0137 18.7616 0.0109 2.0673 0.0073 1.1970 0.0038 2.4745 0.0038L08 39.0371 0.0162 15.7509 0.0148 18.8254 0.0146 2.0737 0.0056 1.1952 0.0036 2.4785 0.0031L10 38.7627 0.0164 15.6674 0.0144 18.7583 0.0119 2.0665 0.0089 1.1973 0.0050 2.4743 0.0049L12 38.9917 0.0270 15.7338 0.0258 18.8175 0.0254 2.0721 0.0100 1.1960 0.0059 2.4782 0.0055L14 38.8886 0.0434 15.7034 0.0378 18.7939 0.0341 2.0692 0.0131 1.1969 0.0064 2.4765 0.0080L16 38.7738 0.0168 15.6523 0.0171 18.8430 0.0165 2.0577 0.0046 1.2039 0.0031 2.4772 0.0031L17 38.6391 0.0044 15.6236 0.0045 18.7463 0.0044 2.0611 0.0010 1.1999 0.0010 2.4731 0.0009L18 38.6762 0.0156 15.6226 0.0153 18.8103 0.0155 2.0561 0.0034 1.2040 0.0030 2.4757 0.0027R02 38.5260 0.0051 15.5903 0.0053 18.7240 0.0053 2.0575 0.0009 1.2010 0.0012 2.4711 0.0010R05 38.5684 0.0060 15.6069 0.0053 18.7356 0.0058 2.0586 0.0012 1.2005 0.0013 2.4713 0.0009R08 38.4574 0.0047 15.5822 0.0049 18.6907 0.0050 2.0576 0.0011 1.1995 0.0012 2.4680 0.0009R10 38.4609 0.0050 15.5859 0.0047 18.6683 0.0047 2.0602 0.0011 1.1978 0.0012 2.4677 0.0008R12 38.6819 0.0047 15.6433 0.0045 18.7345 0.0040 2.0648 0.0011 1.1976 0.0012 2.4728 0.0009R14 38.6649 0.0071 15.6366 0.0060 18.7323 0.0049 2.0640 0.0035 1.1980 0.0020 2.4727 0.0020R16 38.5611 0.0070 15.6058 0.0061 18.7207 0.0065 2.0598 0.0015 1.1996 0.0013 2.4710 0.0014R17 38.5723 0.0060 15.6064 0.0060 18.7189 0.0059 2.0607 0.0014 1.1994 0.0014 2.4716 0.0013R18 38.4545 0.0057 15.5645 0.0059 18.7718 0.0060 2.0485 0.0012 1.2061 0.0012 2.4707 0.0013M1 38.5605 0.0058 15.6076 0.0056 18.7051 0.0053 2.0615 0.0017 1.1984 0.0012 2.4706 0.0014D2 38.8091 0.0070 15.6038 0.0071 18.9359 0.0069 2.0495 0.0015 1.2135 0.0014 2.4872 0.0011M3 38.6000 0.0033 15.6153 0.0029 18.7104 0.0027 2.0630 0.0015 1.1982 0.0011 2.4719 0.0009C4 38.6467 0.0496 15.6260 0.0435 18.7241 0.0403 2.0638 0.0125 1.1983 0.0059 2.4732 0.0093LD5 38.6182 0.0080 15.5844 0.0073 18.7979 0.0063 2.0544 0.0029 1.2062 0.0020 2.4780 0.0017RD5 38.4874 0.0068 15.5920 0.0061 18.6659 0.0064 2.0619 0.0019 1.1971 0.0017 2.4684 0.0014
Fig. 4. 208Pb/206Pb vs. 206Pb/207Pb diagram showing data of all analyzed samples (analytical errors are smaller than symbols). The chain dotted arrows connect the residueswith their respective leachates. Note: two opposite trends for the leachates relative to the residues are observed indicating that two different processes affected the solublelead fraction.
L. Gutiérrez-Caminero et al. / Applied Geochemistry 59 (2015) 23–32 27
Investigación Científica y de Educación Superior de Ensenada(CICESE).
To distinguish between secondary, impregnated lead and pri-mary lead from the mineral structure, sediment samples were lea-ched with HCl and then leachates and residues were analyzedseparately. Although there exist many different leaching proce-dures for the selective sequential dissolution of Pb-bearing phases(Han and Banin, 1995), due to technical and budget constraints anda negligible amount of organic matter in the sediment samples, asimplified leaching method was applied. Approximately 10 g ali-quots from the sediment samples were leached with �20 ml of
double distilled 1 M HCl in PFA� beakers on a hotplate overnightat 65 �C. The leachates were decanted into Savillex� beakers andevaporated to dryness. The same 1 M HCl leaching procedurewas applied to sample D5 with disseminated mineralization,whereas the other rock sample (D2) with disseminated mineraliza-tion was leached with concentrated HNO3 to directly disintegratethe sulfides. From the latter sample only the HNO3 leachate wasanalyzed.
The residues were rinsed twice with MQ� water, dried, andthen pulverized in an agate mortar. Approximately 100–150 mgof pulverized residues were weighed into digestion bombs of a
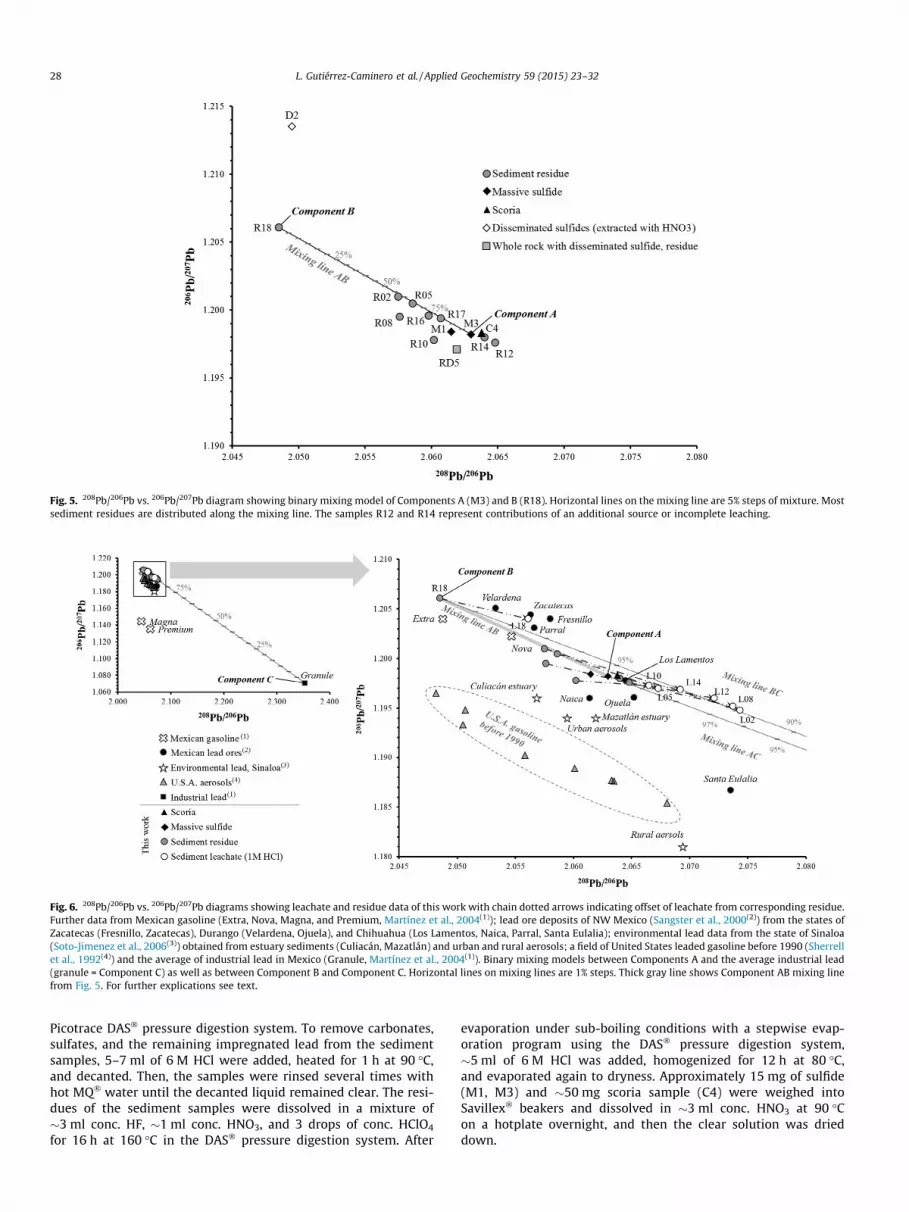
Fig. 5. 208Pb/206Pb vs. 206Pb/207Pb diagram showing binary mixing model of Components A (M3) and B (R18). Horizontal lines on the mixing line are 5% steps of mixture. Mostsediment residues are distributed along the mixing line. The samples R12 and R14 represent contributions of an additional source or incomplete leaching.
Fig. 6. 208Pb/206Pb vs. 206Pb/207Pb diagrams showing leachate and residue data of this work with chain dotted arrows indicating offset of leachate from corresponding residue.Further data from Mexican gasoline (Extra, Nova, Magna, and Premium, Martínez et al., 2004(1)); lead ore deposits of NW Mexico (Sangster et al., 2000(2)) from the states ofZacatecas (Fresnillo, Zacatecas), Durango (Velardena, Ojuela), and Chihuahua (Los Lamentos, Naica, Parral, Santa Eulalia); environmental lead data from the state of Sinaloa(Soto-Jimenez et al., 2006(3)) obtained from estuary sediments (Culiacán, Mazatlán) and urban and rural aerosols; a field of United States leaded gasoline before 1990 (Sherrellet al., 1992(4)) and the average of industrial lead in Mexico (Granule, Martínez et al., 2004(1)). Binary mixing models between Components A and the average industrial lead(granule = Component C) as well as between Component B and Component C. Horizontal lines on mixing lines are 1% steps. Thick gray line shows Component AB mixing linefrom Fig. 5. For further explications see text.
28 L. Gutiérrez-Caminero et al. / Applied Geochemistry 59 (2015) 23–32
Picotrace DAS� pressure digestion system. To remove carbonates,sulfates, and the remaining impregnated lead from the sedimentsamples, 5–7 ml of 6 M HCl were added, heated for 1 h at 90 �C,and decanted. Then, the samples were rinsed several times withhot MQ� water until the decanted liquid remained clear. The resi-dues of the sediment samples were dissolved in a mixture of�3 ml conc. HF, �1 ml conc. HNO3, and 3 drops of conc. HClO4
for 16 h at 160 �C in the DAS� pressure digestion system. After
evaporation under sub-boiling conditions with a stepwise evap-oration program using the DAS� pressure digestion system,�5 ml of 6 M HCl was added, homogenized for 12 h at 80 �C,and evaporated again to dryness. Approximately 15 mg of sulfide(M1, M3) and �50 mg scoria sample (C4) were weighed intoSavillex� beakers and dissolved in �3 ml conc. HNO3 at 90 �Con a hotplate overnight, and then the clear solution was drieddown.
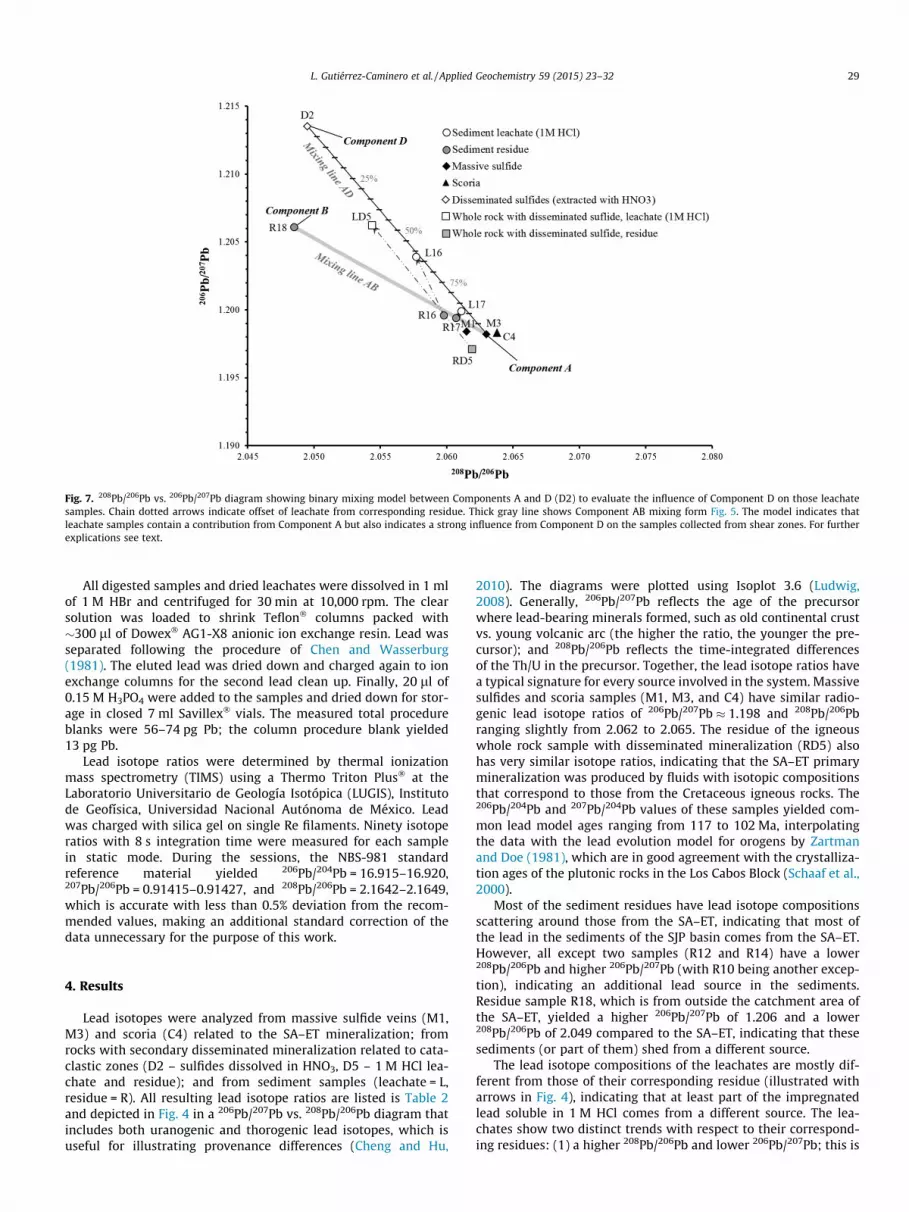
Fig. 7. 208Pb/206Pb vs. 206Pb/207Pb diagram showing binary mixing model between Components A and D (D2) to evaluate the influence of Component D on those leachatesamples. Chain dotted arrows indicate offset of leachate from corresponding residue. Thick gray line shows Component AB mixing form Fig. 5. The model indicates thatleachate samples contain a contribution from Component A but also indicates a strong influence from Component D on the samples collected from shear zones. For furtherexplications see text.
L. Gutiérrez-Caminero et al. / Applied Geochemistry 59 (2015) 23–32 29
All digested samples and dried leachates were dissolved in 1 mlof 1 M HBr and centrifuged for 30 min at 10,000 rpm. The clearsolution was loaded to shrink Teflon� columns packed with�300 ll of Dowex� AG1-X8 anionic ion exchange resin. Lead wasseparated following the procedure of Chen and Wasserburg(1981). The eluted lead was dried down and charged again to ionexchange columns for the second lead clean up. Finally, 20 ll of0.15 M H3PO4 were added to the samples and dried down for stor-age in closed 7 ml Savillex� vials. The measured total procedureblanks were 56–74 pg Pb; the column procedure blank yielded13 pg Pb.
Lead isotope ratios were determined by thermal ionizationmass spectrometry (TIMS) using a Thermo Triton Plus� at theLaboratorio Universitario de Geología Isotópica (LUGIS), Institutode Geofísica, Universidad Nacional Autónoma de México. Leadwas charged with silica gel on single Re filaments. Ninety isotoperatios with 8 s integration time were measured for each samplein static mode. During the sessions, the NBS-981 standardreference material yielded 206Pb/204Pb = 16.915–16.920,207Pb/206Pb = 0.91415–0.91427, and 208Pb/206Pb = 2.1642–2.1649,which is accurate with less than 0.5% deviation from the recom-mended values, making an additional standard correction of thedata unnecessary for the purpose of this work.
4. Results
Lead isotopes were analyzed from massive sulfide veins (M1,M3) and scoria (C4) related to the SA–ET mineralization; fromrocks with secondary disseminated mineralization related to cata-clastic zones (D2 – sulfides dissolved in HNO3, D5 – 1 M HCl lea-chate and residue); and from sediment samples (leachate = L,residue = R). All resulting lead isotope ratios are listed is Table 2and depicted in Fig. 4 in a 206Pb/207Pb vs. 208Pb/206Pb diagram thatincludes both uranogenic and thorogenic lead isotopes, which isuseful for illustrating provenance differences (Cheng and Hu,
2010). The diagrams were plotted using Isoplot 3.6 (Ludwig,2008). Generally, 206Pb/207Pb reflects the age of the precursorwhere lead-bearing minerals formed, such as old continental crustvs. young volcanic arc (the higher the ratio, the younger the pre-cursor); and 208Pb/206Pb reflects the time-integrated differencesof the Th/U in the precursor. Together, the lead isotope ratios havea typical signature for every source involved in the system. Massivesulfides and scoria samples (M1, M3, and C4) have similar radio-genic lead isotope ratios of 206Pb/207Pb � 1.198 and 208Pb/206Pbranging slightly from 2.062 to 2.065. The residue of the igneouswhole rock sample with disseminated mineralization (RD5) alsohas very similar isotope ratios, indicating that the SA–ET primarymineralization was produced by fluids with isotopic compositionsthat correspond to those from the Cretaceous igneous rocks. The206Pb/204Pb and 207Pb/204Pb values of these samples yielded com-mon lead model ages ranging from 117 to 102 Ma, interpolatingthe data with the lead evolution model for orogens by Zartmanand Doe (1981), which are in good agreement with the crystalliza-tion ages of the plutonic rocks in the Los Cabos Block (Schaaf et al.,2000).
Most of the sediment residues have lead isotope compositionsscattering around those from the SA–ET, indicating that most ofthe lead in the sediments of the SJP basin comes from the SA–ET.However, all except two samples (R12 and R14) have a lower208Pb/206Pb and higher 206Pb/207Pb (with R10 being another excep-tion), indicating an additional lead source in the sediments.Residue sample R18, which is from outside the catchment area ofthe SA–ET, yielded a higher 206Pb/207Pb of 1.206 and a lower208Pb/206Pb of 2.049 compared to the SA–ET, indicating that thesesediments (or part of them) shed from a different source.
The lead isotope compositions of the leachates are mostly dif-ferent from those of their corresponding residue (illustrated witharrows in Fig. 4), indicating that at least part of the impregnatedlead soluble in 1 M HCl comes from a different source. The lea-chates show two distinct trends with respect to their correspond-ing residues: (1) a higher 208Pb/206Pb and lower 206Pb/207Pb; this is
30 L. Gutiérrez-Caminero et al. / Applied Geochemistry 59 (2015) 23–32
true for most sediment samples, and the effect is variable but thetendency is approximately parallel and independent to the isotopiccomposition of the residue (compare, e.g., R18–L18 and R5–L5); (2)a higher 206Pb/207Pb and lower 208Pb/206Pb, with respect to theircorresponding residue, were obtained from 1 M HCl leachates ofthe igneous rock with disseminated mineralization (LD5), the sedi-ment sample L16, and in a minor almost insignificant manner fromsediment sample L17 as well. All three samples came from close toone of the primary normal faults in the SJP basin (Fig. 3). Part of thesoluble lead of these samples is probably related to the secondarydisseminated mineralization. This interpretation is further sup-ported by the lead isotope ratios of the sulfides dissolved with con-centrated HNO3 from the igneous rock sample D2 withdisseminated mineralization that has by far the highest206Pb/207Pb (1.213) and a lower 208Pb/206Pb (2.050).
5. Mixing models and discussion
To decipher the variability in lead isotope compositionsobtained from different samples (massive sulfides, scoria, dissemi-nated sulfides, and sediments) from the study area, several two-component mixing models are proposed in the following sectionand illustrated in Figs. 5–7. For the secondary, impregnated leadmeasured from leachates, additional anthropogenic input is con-sidered and its contribution is estimated.
5.1. Variation in detrital input to the SJB basin
In a first approach, typical, massive sulfide lead is comparedwith lead from the previously leached sediment samples fromthe SJB basin. Lead that was extracted by the SA–ET mining activi-ties is represented by the massive sulfide and scoria samples. Forthe mixing models, the isotope ratios of sample M3 (between M1and C4) were used as end member values for the SA–ET lead andreferred to as Component A (Figs. 5–7). The leached sediment sam-ples (residues) reflect the lead from the detrital minerals that shedinto the SJP basin. In Fig. 5 the isotope ratios of the sediment resi-dues are shown together with a mixing line for a two-componentmixing between Component A and the distinct reference sampleR18, from outside the catchment area of the SA–ET, referred to asComponent B. The latter is considered to represent a second locallead source from the mountain ranges to the NW (Fig. 1). Lead iso-topes from four sediment samples (R02, R05, R16, and R17) areexplained by mixing 16–37% of Component B with lead from theSA–ET, whereas samples R08 and R10 are not on this mixing line,indicating an additional, unknown source was admixed to theSA–ET lead. Samples R12 and R14 plot on the lower right side ofComponent A (Fig. 5). The latter data may be a consequence ofincomplete leaching of the impregnated lead by 1 M HCl from sam-ples with the SA–ET lead (see below).
5.2. External anthropogenic lead
In this paper, external anthropogenic lead is referred to as leadfrom manufactured products with an origin different from those ofthe study area, such as gasoline lead, pollution by aerosols, urbanwastes or any other environmental lead dumped in the area.Such lead is added to the sediments by river wash and precipitatedonto the detrital grains after drying, typically in form of carbonateor sulfate, or adsorbed to clay minerals or hydroxides. The 1 M HClleaching procedure employed in this study partially dissolves thementioned phases along with the adsorbed lead, making the ana-lyzed leachates a good estimate of the soluble fraction of toxic ele-ments in the SJB basin sediments.
Fig. 6 shows lead isotope ratios of the sediment samples whoseleachates display an offset towards a higher 208Pb/206Pb and alower 206Pb/207Pb values relative to their residues. The results indi-cate that the sediments are impregnated with lead from a differentsource than the Component A–Component B mixture describedabove. Therefore, we suggest this additional impregnated leadhas an external anthropogenic nature. Such anthropogenic lead isitself a mixture of different sources that are distributed in the areaby industrial and agricultural activities as well as domestic wastes;this fact difficult a conclusive provenance analyses, because theparticular contaminant and its isotopic composition are unknown.
However, it is remarkable that the offsets in the isotope ratios ofthe leachates from most residues have almost the same direction,suggesting a similar external component that displaces the isotopecompositions towards a higher 208Pb/206Pb and a lower206Pb/207Pb. Due to the high abundance of lead from the SA–ET inthe area, it is obvious that the leachates are dominated by leadfrom this source. If this suggestion is true, then the external con-taminant requires highly different isotope ratios to obtain a signifi-cant shift in the isotope ratios in a given mixture.
Fig. 6 also includes the 208Pb/206Pb and 206Pb/207Pb valuesreported from different types of lead sources, such as (1)Mexican gasoline (Martínez et al., 2004) prior to the introductionof unleaded fuels in the 1990s (Extra and Nova) and after then(Magna and Premium); (2) some important lead ore deposits ofnorthern Mexico (Sangster et al., 2000); (3) urban and rural aero-sols, as well as estuarine sediments from Culiacán and Mazatlánareas (Sinaloa, Soto-Jimenez et al., 2006) that have been linked toan anthropogenic input; (4) the approximate range of UnitedStates gasoline lead prior to 1990 (Sherrell et al., 1992); and (5)the average industrial lead in Mexico (Martínez et al., 2004).
Most lead ore deposits of northern Mexico as well as Extra andNova gasolines have lead isotope ratios similar to SA–ET and sur-rounding mountain ranges, plotting close to the Mixing line ofcomponents A and B. However, none of these sources might changethe isotope ratios significantly with only a few percent in the mix-ture. Santa Eulalia, Chihuahua, ore deposit as well as Magna andPremium gasolines have significantly lower 206Pb/207Pb ratio butthe corresponding 208Pb/206Pb ratio is too low to explain theobserved offset in the leachates. Leaded gasoline from the UnitedStates and anthropogenic lead from Sinaloa (estuaries and aero-sols) plot below the Component A–Component B mixing line andcannot explain lead from the leachates.
Martínez et al. (2004) recommended reference values of 2.353for 208Pb/206Pb and 1.071 for 206Pb/207Pb for the average industriallead in Mexico. These isotope ratios were obtained from pelletsfabricated from granule of recycled industrial products and areinterpreted to represent the isotope composition of the averageindustrial lead in Mexico. The application of such average isotoperatios in the model might not be adequate for a field study insouthern Baja California. It is remarkable, however, that this aver-age industrial lead has extremely high 208Pb/206Pb and low206Pb/207Pb compared to any other data presented here.Therefore, the isotope ratios recommended by Martínez et al.(2004) for the average industrial lead in Mexico were used in ourhypothetical model and are referred to as Component C (insetFig. 6). To estimate the effect of contamination with such an indus-trial lead, mixing lines were calculated for Component A and C aswell as for Component B and C (Fig. 6). Considering all assumptionsand inconsistencies mentioned above, admixing 1–6% ofComponent C to any natural AB mixture best explains the offsetstowards a higher 208Pb/206Pb together with a lower 206Pb/207Pbas observed in the leachates. Therefore, it is plausible to suggestadditional contamination with industrial lead spilled and dis-tributed through the SJP basin. However, detailed investigation isnecessary to proof this hypothesis.
L. Gutiérrez-Caminero et al. / Applied Geochemistry 59 (2015) 23–32 31
5.3. Secondary disseminated mineralization effects
Secondary hydrothermal activity and the corresponding dis-seminated mineralization in the study area occurs in cataclasticzones associated with normal and detachment faults of theNeogene to Recent SJP Graben structure (SGM, 1999). The leadisotope composition of the disseminated mineralization froman igneous rock sample in a cataclastic zone of the LosCardones prospect (D2) noticeably differs from those of massivevein type sulfides (pyrite) from the same area (M1). The former,here referred to as Component D, has lower 208Pb/206Pb andhigher 206Pb/207Pb values compared to Component A, indicatinga younger source with a lower time-integrated Th/U for the dis-seminated mineralization compared to the sources of theCretaceous igneous rocks and the related vein type mineraliza-tion. This evidence clearly indicates that the late stage fault-re-lated mineralization contains lead that has no direct relation tothe SA–ET. This is an important finding because it provides atool to distinguish between the toxic elements contaminationfrom primary mining activities in the SA–ET and the toxic ele-ments from a secondary mineralization distributed by hotsprings as suggested by Romero et al. (2003).
Fig. 7 shows a mixing line between the secondary mineraliza-tion lead isotope compositions (Component D) and the massivesulfide lead of the SA–ET (Component A), illustrating the resultsfrom the second igneous rock sample with a disseminated mineral-ization (D5) from a cataclastic zone in the Las Colinas-Los Planesprospect. This sample was leached with 1 M HCl (LD5) using thesame procedure as with the sediments, and the residue wasdigested and analyzed separately (RD5). Whereas the lead isotoperatios of the leached rock (residue) agree almost perfectly with thelead from sulfides of the SA–ET, the leachate is a mixture of �60%Component D with �40% component A, confirming that most ofthe secondary disseminated mineralization has a different source.Sediment samples S16 and S17 were collected from the intrabasinfault running east, documented by Busch et al. (2011) (see Fig. 3).Sample S17 shows almost no difference between the analyzed lea-chate and residue. In contrast to all other analyzed sediment sam-ples, S16 displays an offset of the leachate (L16) towards lower208Pb/206Pb and higher 206Pb/207Pb values, suggesting that mostof the impregnated lead comes from the secondary disseminatedmineralization related to the fault. A slight clockwise deviation ofthe R16–L16 connecting arrow from the Component A–D mixingline (Fig. 7) can be explained by the additional external anthro-pogenic contamination of the sample (Component C). It is impor-tant to note that sample S16 was collected from a site close tothat location within the SJP basin, where Posada-Ayala (2011)reported the highest concentrations of Pb (�4,000 ppm), Cd(22.5 ppm), and especially As (�120,000 ppm) in sampled sedi-ments (see Fig. 2).
5.4. Considerations with regard to toxic element contamination
A priori direct relationships between lead and other toxic ele-ments, such as As and Cd are not always indicated. This phe-nomenon is especially true for external anthropogeniccontamination, e.g., by gasoline, paints, and other industrial waste,because industrial products mostly contain only one or a few par-ticular toxic elements, such as lead in gasoline and paints (PbO2
white), cadmium in batteries or as stabilizer in PVC (polyvinylchlo-ride). However, natural lead sources can be associated with sourcesof other toxic elements that have the same origin (e.g. Espinosaet al., 2009; Miller et al., 2002). During epithermal mineralization,metals and metalloids (e.g., Pb, Hg, Cd, Zn, and As) precipitatetogether with the elements of interest (e.g. Sangster et al., 2000).In the SA–ET, Au and Ag are included in typical mineral phases,
such as sphalerite, arsenopyrite, galena, chalcopyrite, and bornite(SGM, 1999). Therefore, a direct genetic relationship between leadand other toxic elements is given (Marmolejo-Rodríguez et al.,2011). This is also supported by similar variations in the elementconcentrations of Pb, As, Cd, and Zn throughout the study area(see Fig. 2). Whereas some metals (e.g., Pb, Cd, and Hg) have simi-lar, immobile geochemical behavior, arsenic acts geochemicallydifferent because of its changing oxidation states and solubilities(e.g. Roussel et al., 2000). However, all elements are transportedin the same environment and through the same diffusion mecha-nisms. Previous geochemical surveys identified locations with pro-portional increases between elements in the same locations(Posada-Ayala, 2011), i.e., locations with high concentrations oflead also contain high concentrations of other toxic elements, suchas As, Hg and Cd (compare Fig. 2).
6. Conclusions
The massive vein type mineralization of the SA–ET is character-ized by its typical lead isotopic composition. As to be expected,most of the toxic elements in the SA–ET are originated from thismineralization. However, an additional natural lead source withdifferent isotopic composition is identified that is mixed withSA–ET lead in the sediments of the SJP basin.
Another major source for toxic elements is related with fault-bounded mineralization. This source could be clearly distinguishedby its lead isotope compositions and it is possible to quantify itscontribution to the sediments by binary mixing models.Therefore, lead isotope ratios are a powerful tool for further studiesof toxic element contamination in the area with a high potential foridentifying and quantifying the contributions of SA–ET miningactivities and Neogene to Recent fault-bounded hydrothermalactivities.
The soluble lead from most sediment samples differs signifi-cantly from the corresponding residues in a way that cannot beexplained by SA–ET mining activities, other local natural lead, orthe fault-bounded mineralization. The data indicate external con-tamination with anthropogenic lead from an unknown source withdistinct isotopic composition. Several options are considered ofwhich an average Mexican industrial lead type best explains theobserved variations. However, such a model is highly speculativeas long as no detailed information and data from the potential con-taminant are available.
Considering the recent interest of the mining industry in thearea, we are convinced that this study provides a guide to tracethe transport paths of toxic elements in the area, which in turncan help to design remediation techniques and avoid affectationsin the environment and the population.
Acknowledgments
This work is the outcome of a master’s thesis that was sup-ported by the Mexican Council of Science and Technology scholar-ships (CONACYT Grant 263406), CICESE Internal Project #644141and the Universidad Autónoma de Baja California Sur Grants(PROMEP-IDCA 618, code: UABCS-CA-19). We are grateful to theLUGIS staff, Peter Schaaf, Gabriela Solís Pichardo, and VianneyMeza García for their technical support during the isotope analysis.Thanks to Gabriel Rendón, Susana Rosas, and Víctor Pérez (CICESE)for assisting with the sample preparation. We specially thank JohnFletcher (CICESE) and Ernesto Ramos Velázquez (UABCS) for pro-viding valuable data from the study area. We are grateful toApplied Geochemistry associate editor Peter Birkle and threeanonymous reviewers whose comments and recommendationshelped to improve considerably the manuscript.
32 L. Gutiérrez-Caminero et al. / Applied Geochemistry 59 (2015) 23–32
References
Busch, M.M., Arrowsmith, J.R., Umhoefer, P.J., Coyan, J.A., Maloney, S.J., Gutiérrez,G.M., 2011. Geometry and evolution of rift-margin, normal-fault–boundedbasins from gravity and geology, La Paz-Los Cabos region, Baja California Sur,Mexico. Lithosphere 3, 110–127.
Carrillo-Chávez, A., Drever, J.I., Martínez, M., 2000. Arsenic content andgroundwater geochemistry of the San Antonio–El Triunfo, Carrizal and LosPlanes aquifers in southernmost Baja California, Mexico. Environ. Geol. 39,1295–1303.
Chen, J.H., Wasserburg, G.J., 1981. Precise isotopic analysis of uranium in picomoleand subpicomole quantities. Anal. Chem. 53, 2060–2067.
Cheng, H., Hu, Y., 2010. Lead (Pb) isotopic fingerprinting and its applications in leadpollution studies in China: a review. Environ. Pollut. 158, 1134–1146.
Comisión Nacional de Agua (CNA), 2003. Determinación de la Disponibilidad deAgua en el Acuífero (0323) Los Planes, Estado de Baja California Sur.
Coyan, M.M., Arrowsmith, J.R., Umhoefer, P., Coyan, J., Kent, G., Driscoll, N.,Gutíerrez, G.M., 2013. Geometry and Quaternary slip behavior of the San Juande los Planes and Saltito fault zones, Baja California Sur, Mexico:characterization of rift-margin normal faults. Geosphere 9, 1–18.
Del Rosal Pardo, A., 2003. Recarga natural en la cuenca de San Juan de los Planes,Baja California Sur, México. Bachelor Thesis. Universidad Autónoma de BajaCalifornia Sur; La Paz, Baja California Sur, México.
Duffus, J.H., 2002. ‘‘Heavy metals’’ – a meaningless term? (IUPAC technical report).Pure Appl. Chem. 74, 793–807.
Espinosa, E., Armienta, M.A., Cruz, O., Aguayo, A., Ceniceros, N., 2009. Geochemicaldistribution of arsenic, cadmium, lead and zinc in river sediments affected bytailings in Zimapán, a historical polymetalic mining zone of México. Environ.Geol. 58, 1467–1477.
Ettler, V., Mihaljevic, M., Šebek, O., Molek, M., Grygar, T., Zeman, J., 2006.Geochemical and Pb isotopic evidence for sources and dispersal of metalcontamination in stream sediments from the mining and smelting district ofPríbram, Czech Republic. Environ. Pollut. 142, 409–417.
Fletcher, J.M., Munguía, L., 2000. Active continental rifting in southern BajaCalifornia, Mexico: implications for plate motion partitioning and thetransition to seafloor spreading in the Gulf of California. Tectonics 19, 1107–1123.
Fletcher, J.M., Kohn, B.P., Foster, D.A., Gleadow, A.J., 2000. Heterogeneous Neogenecooling and exhumation of the Los Cabos block, southern Baja California:evidence from fission-track thermochronology. Geology 28, 107–110.
Han, F.X., Banin, A., 1995. Selective sequential dissolution techniques for tracemetals in arid-zone soils: the carbonate dissolution step. Commun. Soil Sci.Plant Anal. 26, 553–576.
Hansmann, W., Köppel, V., 2000. Lead-isotopes as tracers of pollutants in soils.Chem. Geol. 171, 123–144.
Instituto Nacional de Estadística Geografía e Informática (INEGI), 2012. Continúo deelevaciones mexicano CEM (2.0).
Instituto Nacional de Estadística Geografía e Informática (INEGI), 2013. Conjunto dedatos vectoriales de la serie topográfica y de recursos naturales escala.1:1,000,000.
Komárek, M., Ettler, V., Chrastny, V., Mihaljevic, M., 2008. Lead isotopes inenvironmental sciences: a review. Environ. Int. 34, 562–577.
Ludwig, K.R., 2008. Isoplot 3.60. Berkeley Geochronol. Cent. Spec. Publ. 4, 77.
MacKenzie, A.B., Pulford, I.D., 2002. Investigation of contaminant metal dispersalfrom a disused mine site at Tyndrum, Scotland, using concentration gradientsand stable Pb isotope ratios. Appl. Geochem. 17, 1093–1103.
Marmolejo-Rodríguez, A.J., Sánchez-Martínez, M.A., Romero-Guadarrama, J.A.,Sánchez-González, A., Magallanes-Ordóñez, V.R., 2011. Migration of As, Hg,Pb, and Zn in arroyo sediments from a semiarid coastal system influenced bythe abandoned gold mining district at El Triunfo, Baja California Sur, Mexico. J.Environ. Monitor. 13, 2182–2189.
Martínez, T., Lartigue, J., Juárez, F., Ávila-Pérez, P., Zarazua, G., Márquez, C., Orta,M.P., Álvarez, V., 2004. Application of Lead isotopic ratios in atmosphericpollution studies in the Valley of México. J. Atmos. Chem. 49, 415–424.
Miller, J.R., Lechler, P.J., Hudson-Edwards, K.A., Macklin, M.G., 2002. Lead isotopicfingerprinting of heavy metal contamination, Rio Pilcomayo basin, Bolivia.Geochem.: Explor. Environ., Anal. 2, 225–233.
Monna, F., Lancelot, J., Croudace, I.W., Cundy, A.B., Lewis, J.T., 1997. Pb isotopiccomposition of airborne particulate material from France and the southernUnited Kingdom: implications for Pb pollution sources in urban areas. Environ.Sci. Technol. 31, 2277–2286.
Naranjo-Pulido, A., Romero-Schmidt, H., Méndez-Rodríguez, L., Acosta-Vargas, B.,Ortega-Rubio, A., 2002. Soil arsenic contamination in the Cape Region, B.C.S.,Mexico. J. Environ. Biol. 23, 347–352.
National Oceanic and Atmospheric Administration (NOAA), National HurricaneCenter, 2012. Eastern Pacific Hurricane Season.
Posada-Ayala, I.H., 2011. Geoquímica ambiental del distrito minero San Antonio,sedimentos de los arroyos de la cuenca de San Juan de los Planes y plataformacontinental de Bahía La Ventana, BCS, México. Master Thesis. InstitutoPolitécnico Nacional, Centro Interdisciplinario De Ciencias Marinas; La Paz,Baja California Sur, México.
Romero, L., Alonso, H., Campano, P., Fanfani, L., Cidu, R., Dadea, C., Keeganc, T.,Thorntonc, I., Farago, M., 2003. Arsenic enrichment in waters and sediments ofthe Rio Loa (Second Region, Chile). Appl. Geochem. 18, 1399–1416.
Roussel, C., Néel, C., Bril, H., 2000. Minerals controlling arsenic and lead solubility inan abandoned gold mine tailings. Sci. Total Environ. 263, 209–219.
Sangster, D.F., Outridge, P.M., Davis, W.J., 2000. Stable lead isotope characteristics oflead ore deposits of environmental significance. Environ. Rev. 8, 115–147.
Schaaf, P., Böhnel, H., Pérez-Venzor, J.A., 2000. Pre-Miocene palaeogeography of theLos Cabos Block, Baja California Sur: geochronological and palaeomagneticconstraints. Tectonophysics 318, 53–69.
Servicio Geológico Mexicano, 1999. Monografía Geológico – Minera del Estado deBaja California Sur, first ed. Pachuca, Mexico.
Sherrell, R.M., Boyle, E.A., Hamelin, B., 1992. Isotopic equilibration betweendissolved and suspended particulate lead in the Atlantic Ocean: evidencefrom 210Pb and stable Pb isotopes. J. Geophys. Res. 97, 11257–11268.
Soto-Jimenez, M.F., Hibdon, S.A., Rankin, C.W., Aggarawl, J., Ruiz-Fernandez, A.C.,Paez-Osuna, F., Flegal, A.R., 2006. Chronicling a century of lead pollution inMexico: stable lead isotopic composition analyses of dated sediment cores.Environ. Sci. Technol. 40, 764–770.
Volke-Sepúlveda, T., Solórzano, G., Rosas, A., Izumikawa, Ch., Encarnación, G.,Velasco, J.A., Flores, S., 2003. Remediación de sitios contaminados por metalesprovenientes de jales mineros en los distritos de El Triunfo–San Antonio y SantaRosalía, Baja California Sur. Informe Final.
Zartman, R.E., Doe, B.R., 1981. Plumbotectonics—the model. Tectonophysics 75,135–162.