analysis of (co) variance components and estimation ... - plos
TRANSCRIPT

RESEARCH ARTICLE
Analysis of (co) variance components and
estimation of breeding value of growth and
production traits in Dahlem Red chicken using
pedigree relationship in an animal model
U. RajkumarID*, L. Leslie Leo PrinceID, K. S. Rajaravindra, S. Haunshi, M. Niranjan, R.
N. Chatterjee
ICAR-Directorate of Poultry Research, Rajendranagar, Hyderabad, Telangana, India
Abstract
Variance and covariance components of growth and production traits were analyzed employ-
ing REML animal model to assess the Dahlem Red (PD-3) chicken population for direct addi-
tive genetic, maternal effects and to estimate the estimated breeding value (EBV), genetic
parameters, genetic trends and rate of inbreeding (ΔF) utilizing seven generation’s data. The
generation and hatch had significant (P�0.01) effect on the body weight at 0 day (BW0), 2
(BW2), 4 (BW4) and 6 weeks (BW6) and shank length at six weeks of age (SL6). The average
least squares means (LSM) for BW6 and SL6 were 273.93±0.62 g and 53.97±0.05 mm,
respectively. All the production traits were significantly (P�0.01) influenced by generation
and hatch. The average LSM for age at sexual maturity (ASM), egg production up to 40
weeks (EP40) and egg mass up to 40 weeks (EM40) were 168.82±0.25 d, 72.60±0.41 eggs
and 4.21±0.07 kg, respectively. Model 5 with additive direct, maternal genetic, maternal per-
manent environmental and residual variance components was the best for BW0, BW2 and
BW4 based on the AIC values obtained in WOMBAT. Model 4 was the best model for BW6,
SL6, ASM, EP40 and EM40 with additive direct, maternal permanent environmental and
residual variance components. Maternal effects were higher during early age, decreased with
age, and remained present until 20 weeks of age. The heritability (h2) estimates were low to
moderate in magnitude for all the growth traits and ranged from 0.02±0.03 to 0.19±0.03. The
maternal heritability was high at hatch (0.35±0.06), decreased gradually until 4th week (0.02
±0.01) and ceased afterwards. The heritabilities of EP40 (0.11±0.03) and EM40 (0.12±0.04)
were low. The direct additive genetic correlations (ra) between BW2, BW4, BW6 and SL6
were high and positive (P� 0.05). The additive genetic and maternal permanent environmen-
tal correlation between EP40 and EM40 were high and positive (P� 0.05). The EBV of EM40
was significant (P� 0.05) with 0.48 kg/generation in PD-3 chicken at the end of the seventh
generation. The EBV of EP40 showed an increasing trend with a genetic gain of 1.87 eggs
per generation. The average inbreeding coefficient of the population was 0.019 and average
ΔF was 0.007 over the last seven generations of selection. The EBV trends for primary and
associated traits showed linear trends in the desired direction and negligible inbreeding.
PLOS ONE
PLOS ONE | https://doi.org/10.1371/journal.pone.0247779 March 3, 2021 1 / 21
a1111111111
a1111111111
a1111111111
a1111111111
a1111111111
OPEN ACCESS
Citation: Rajkumar U, Prince LLL, Rajaravindra KS,
Haunshi S, Niranjan M, Chatterjee RN (2021)
Analysis of (co) variance components and
estimation of breeding value of growth and
production traits in Dahlem Red chicken using
pedigree relationship in an animal model. PLoS
ONE 16(3): e0247779. https://doi.org/10.1371/
journal.pone.0247779
Editor: Grzegorz Woźniakowski, University of
Nicolaus Copernicus in Torun, POLAND
Received: November 24, 2020
Accepted: February 16, 2021
Published: March 3, 2021
Copyright: © 2021 Rajkumar et al. This is an open
access article distributed under the terms of the
Creative Commons Attribution License, which
permits unrestricted use, distribution, and
reproduction in any medium, provided the original
author and source are credited.
Data Availability Statement: Data are available at
repository maintained by ICAR research data
repository for knowledge management (http://
krishi.icar.gov.in/jspui/handle/123456789/45388).
Funding: The authors received no specific funding
for this work.
Competing interests: The authors have declared
that no competing interests exist.
Introduction
Poultry production has grown exponentially in structure and operation from a traditional
backyard activity into a major commercial agri based industry over the years. Development of
high yielding layer (310–340 eggs) and broiler (2.4–2.6 kg at 6 weeks) varieties together with
standardized practices on nutrition, housing, management and disease control [1] have con-
tributed to spectacular growth rates in the egg (8.5% per annum) and broiler production (7.8%
per annum) in India [2]. Backyard poultry contributes about 17% (17.09 billion) to the total
egg production (103.32 billion) of the country and chicken meat is 50% (4.06 MMT) of the
total meat production (8.10 MMT) in India [2]. India ranks 3rd in egg production and 5th in
meat production in the world, but the availability of chicken products is far below the recom-
mended levels. The per capita availability is about 79 eggs and 3.2 kg chicken meat per annum
against the recommended level of 180 eggs and 10.25 kgs meat as per the Indian Council of
Medical Research. Backyard poultry farming with improved chicken varieties such as Vanar-aja, Gramapriya, Srinidhi, and Rajasree is promoted by the Government as it is one of the
proven technologies for poverty alleviation and nutritional security in rural and tribal areas of
the country. A wide gap exists between the availability and requirement of chicken products,
thus providing an opportunity to expand the poultry farming in the commercial as well as the
backyard sectors. Since commercial poultry has inherent difficulties for expansion in rural and
tribal areas, the backyard poultry has bright scope in these areas. Promoting the backyard
poultry farming among the rural masses is going to increase its share in total poultry produc-
tion apart from providing healthy animal protein in terms of eggs and meat. Dahlem Red (PD-
3) is the female parent of Gramapriya, an improved backyard chicken layer variety propagated
across the country. The improvement in egg production, egg mass, growth and other eco-
nomic traits in the terminal cross is being achieved through the application of selection in the
parent lines.
The estimated breeding value (EBV) determines the rate of improvement in the primary
trait of selection. Variability in the population is the basis for any genetic improvement pro-
gram in livestock and poultry. Genetic improvement is determined by the response to selec-
tion in the primary as well as other correlated traits of economic importance. Thorough
knowledge on the genetic basis, gene action and the environmental effect is essential for plan-
ning breeding programs for genetic improvement of the desired traits in poultry. Selection
response of trait depends on the population size, gene frequency, mutation, allelic fixation,
random drift and physiological limits [3]. The magnitude and direction of correlated responses
play a major role in developing effective breeding strategies for improved productivity, more
so among positively correlated traits due to linkage and pleiotropy [4].
Partition of variance into every possible source and their interaction effects reduces the
error variance and minimizes over-weightage to some components, leading to precision in the
estimates. Animal model accommodates additional components of variance, which makes the
estimates less biased by confounding environmental variation and precise modeling [5]. The
traditional models ignore the maternal and permanent environmental effects in chicken lead-
ing to overestimation of additive genetic variance resulting in high h2 estimates. The maternal
effect is defined as the situation where the phenotype of the offspring is determined not only
by the environment and its genotype, but also by the genotype and environment of their
mother. A maternal effect is a situation wherein traits are influenced by the genotype and envi-
ronment of the mother. Maternal effects are important in the development and expression of
the economic traits due to genetic or environmental differences between dams or by the com-
bination of genetic or environmental differences [6, 7]. The egg weight is a major factor con-
tributing to maternal effects for body weight, however, others like hatch weight, incubation
PLOS ONE (co) variance components and breeding value of economic traits in Dahlem Red chicken
PLOS ONE | https://doi.org/10.1371/journal.pone.0247779 March 3, 2021 2 / 21
conditions, nutrition, etc. may also play a role. Correlations of egg weight with hatching weight
and with the subsequent body weight of chicks may also reflect maternal effects. The inclusion
of maternal effects in the model reduces the bias and increases the precision of genetic parame-
ters [8]. Many authors estimated the genetic parameters without considering the maternal
effects in chicken [9–16]. Some publications with additive, maternal and permanent effects on
various economic traits using animal model [4, 17] and diallel analysis [10, 18] were reported
in chicken. However, studies with large data sets over the generations utilizing an animal
model in PD-3 line are limited from India. The analysis of data using traditional models over-
estimated the genetic parameters and lead to inadequate inferences affecting the long term
breeding experiment especially in India.
Therefore, the present study was taken up with an aim to estimate the breeding value,
genetic trends of economic traits, genetic (additive and maternal) and non-genetic environ-
mental effects and performance of important economic traits in (PD-3 line using Average
Information Restricted Maximum Likelihood (AIREML) animal model.
Materials and methods
The study was carried out at the experimental poultry farm of ICAR-Directorate of Poultry
Research, Hyderabad, Telangana, India. Hyderabad is in Deccan plateau placed between 17˚
23’ N and 78˚ 28’ E at 500 m from mean sea level. The climate is hot tropical with maximum
temperature ranging from 20˚C in winter to 45˚C in summer.
Ethic and biosafety statement
The experiment was approved by the Institutional Animal Ethics Committee (IAEC/DPR/17/
4). The manuscript does not contain clinical studies and patient data.
Population and management
PD-3 population was selected over the generations [19, 20] for higher egg production and egg
mass. It is the female parent line of Gramapriya, a popular brown egg layer suitable for rural
poultry farming developed by ICAR-Directorate of Poultry Research. PD-3 line was developed
from Dahlem Red breed. The work on the development of PD-3 line as a female line for pro-
duction of egg type rural poultry was started in 1998–99. A pedigreed population of this line
was produced for the first time (S-0) in 2000–01. After recording the performance for 6 gener-
ations, a random mating program using pooled semen for two generations was followed. The
variability in the existing population was increased subsequently with the addition of DahlemRed population from Anand Agriculture University, Anand, Gujarat, India. The base popula-
tion was stabilized for two generations with random inter se mating and the third generation
was considered as the base population with the initiation of pedigreed mating and selection.
The population was selected for higher 40 week egg mass (EM40) during the last seven
generations.
About 3500 to 4000 healthy chicks were produced in 7–8 hatches in each generation in a
pedigreed mating with 50 sires and 250 dams. These chicks were wing banded and reared on
deep litter in an open sided poultry house under standard management. About 600 females
and 200 males were housed in individual cages in each generation at 12–14 weeks of age. The
chicks were fed ad-libitum layer starter diet (2800 Kcal: ME and 18%: CP) based on maize-soy-
bean meal up to 6 weeks of age in each generation, with layer grower ration (2700 Kcal: ME
and 18% CP) until 16 weeks of age and with layer breeder ration (2650 Kcal: ME, 16.50% CP
and Calcium: 3.5%) until 40 weeks of age. The chicks were vaccinated against Marek’s disease
(MD) on the 1st day; Newcastle disease (ND) on the 5th and 14th days; infectious bursal disease
PLOS ONE (co) variance components and breeding value of economic traits in Dahlem Red chicken
PLOS ONE | https://doi.org/10.1371/journal.pone.0247779 March 3, 2021 3 / 21
(IBD) on the 24th day and fowl pox (FP) on the 42nd day, ND with R2B at the 9th week, infec-
tious coryza at the 12th week and ND, IBD and infectious bronchitis (IB) combined vaccine at
the 18th and the 40th weeks of age.
Data and traits
Data on growth and production traits of 16,292 PD-3 birds descended from 336 sires and 1076
dams collected over seven generations (S1 to S7) from 2012–13 to 2018–19 were utilized in the
study. In each generation, juvenile body weight at 0 day (BW0), 2nd (BW2), 4th (BW4) and 6th
(BW6) week of age; shank length at 6th week (SL6); adult body weight at 20th (BW20) and 40th
(BW40) weeks were measured. The body weight was measured to 0.1g accuracy using digital
balance, while shank length was measured to the nearest of 0.01mm accuracy using digital Ver-
nier Calipers. Age at sexual maturity (ASM); egg weight at 28 (EW28) and 40 (EW40) weeks;
egg production (EP40) and egg mass (EM40) up to 40 weeks of age were recorded. The weight
of eggs was recorded using a digital balance to an accuracy of 0.01g. The data were not
recorded on BW0 in S-3 and S-7; BW2 in S-6 and hatch 8; BW40 in S-7 generation. The
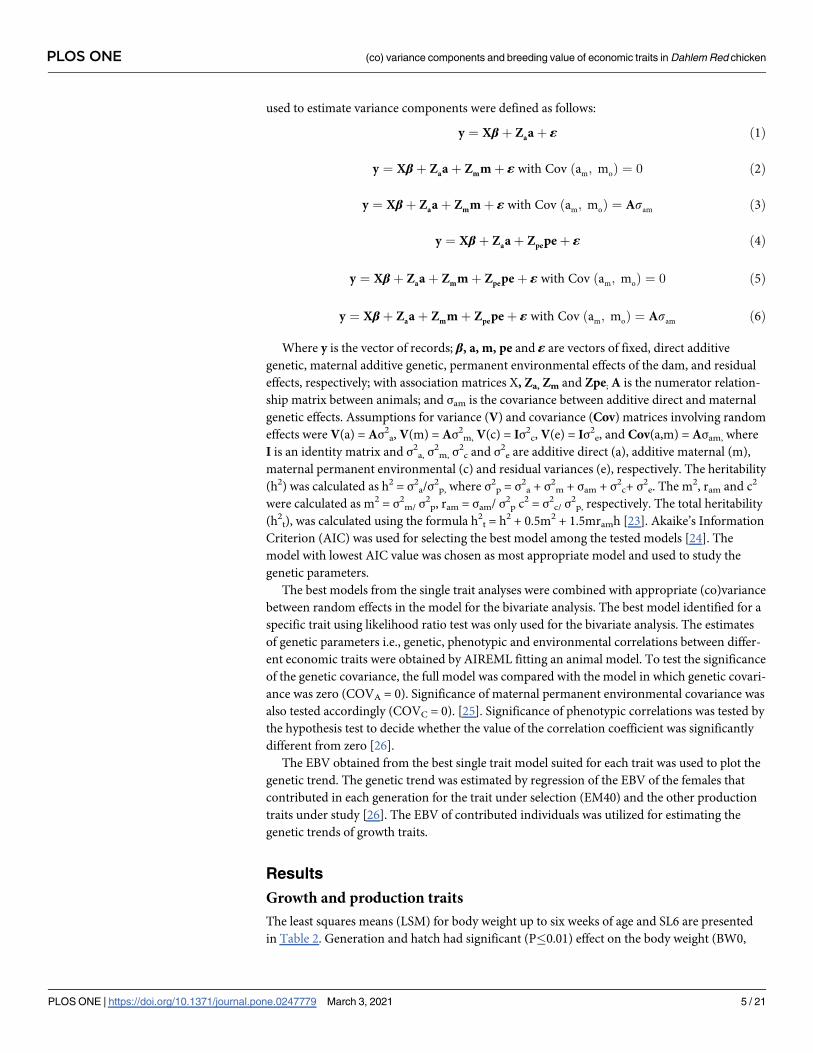
descriptive statistics of growth and production data are presented in Table 1.
Statistical analysis
Variance and covariance components were estimated by average information restricted maxi-
mum likelihood (AIREML) fitting an animal model [21]. Data were first analyzed by least
squares analysis of variance (SPSS 12) to identify the fixed effects to be included in the model
[22]. Two statistical models were used for identifying the significant effects on the traits. For
BW0, BW2, BW4, BW6, SL6, ASM, BW20, BW40, EP40 and EM40, the statistical model
included the fixed effect of generations (7 levels) and hatch number (8 levels). Only significant
effects (P�0.05) were included in the models, which were subsequently used for the genetic
analysis. Convergence was assumed when change of value of the natural logarithm of the likeli-
hood function in two consecutive iterations was lower than 5× 10⁻⁴. Univariate animal models
were fitted to estimate (co)variance components for all the traits. The six single–trait models
Table 1. Characteristics of data on growth and production traits in the PD-3 line.
Trait1 No. of birds with records No. of sires No. of sires with records and progeny No. of dams No. of dams with records and progeny Mean SD
BW0, g 10606 276 144 744 468 36.40 3.72
BW2, g 12917 315 153 919 505 79.02 19.63
BW4, g 14271 331 231 1025 890 158.86 43.87
BW6, g 14433 335 286 1029 934 280.35 73.52
SL6, mm 14199 335 283 1028 917 54.31 6.46
ASM, d 4261 328 - 887 807 167.68 16.69
BW20, g 4059 327 - 888 753 1323.28 196.87
BW40, g 3216 277 - 683 590 1691.04 231.55
EP40, no 4277 328 - 893 817 74.07 26.26
EM40,
kg
3287 324 - 835 698 4.289 1.267
EW28, g 3467 325 - 863 710 49.68 4.20
EW40, g 3290 324 - 835 699 53.84 4.62
1BW0: Day old body weight, BW2: 2nd week body weight, BW4: 4th week body weight, BW6: 6th week body weight, SL6: 6th week shank length, BW20: 20th week body
weight, BW40: 40th week body weight, ASM: Age at sexual maturity, EP40: 40 weeks egg production, EM40: Egg mass up to 40 week, EW28: 28th week egg weight,
EW40: 40th week egg weight.
https://doi.org/10.1371/journal.pone.0247779.t001
PLOS ONE (co) variance components and breeding value of economic traits in Dahlem Red chicken
PLOS ONE | https://doi.org/10.1371/journal.pone.0247779 March 3, 2021 4 / 21
used to estimate variance components were defined as follows:
y ¼ Xβþ Zaaþ ε ð1Þ
y ¼ Xβþ Zaaþ Zmmþ ε with Cov ðam; moÞ ¼ 0 ð2Þ
y ¼ Xβþ Zaaþ Zmmþ ε with Cov ðam; moÞ ¼ Asam ð3Þ
y ¼ Xβþ Zaaþ Zpepeþ ε ð4Þ
y ¼ Xβþ Zaaþ Zmmþ Zpepeþ ε with Cov ðam; moÞ ¼ 0 ð5Þ
y ¼ Xβþ Zaaþ Zmmþ Zpepeþ ε with Cov ðam; moÞ ¼ Asam ð6Þ
Where y is the vector of records; β, a, m, pe and ε are vectors of fixed, direct additive
genetic, maternal additive genetic, permanent environmental effects of the dam, and residual
effects, respectively; with association matrices X, Za, Zm and Zpe; A is the numerator relation-
ship matrix between animals; and σam is the covariance between additive direct and maternal
genetic effects. Assumptions for variance (V) and covariance (Cov) matrices involving random
effects were V(a) = Aσ2a, V(m) = Aσ2
m, V(c) = Iσ2c, V(e) = Iσ2
e, and Cov(a,m) = Aσam, where
I is an identity matrix and σ2a, σ2
m, σ2c and σ2
e are additive direct (a), additive maternal (m),
maternal permanent environmental (c) and residual variances (e), respectively. The heritability
(h2) was calculated as h2 = σ2a/σ2
p, where σ2p = σ2
a + σ2m + σam + σ2
c+ σ2e. The m2, ram and c2
were calculated as m2 = σ2m/ σ2
p, ram = σam/ σ2p c2 = σ2
c/ σ2p, respectively. The total heritability
(h2t), was calculated using the formula h2
t = h2 + 0.5m2 + 1.5mramh [23]. Akaike’s Information
Criterion (AIC) was used for selecting the best model among the tested models [24]. The
model with lowest AIC value was chosen as most appropriate model and used to study the
genetic parameters.
The best models from the single trait analyses were combined with appropriate (co)variance
between random effects in the model for the bivariate analysis. The best model identified for a
specific trait using likelihood ratio test was only used for the bivariate analysis. The estimates
of genetic parameters i.e., genetic, phenotypic and environmental correlations between differ-
ent economic traits were obtained by AIREML fitting an animal model. To test the significance
of the genetic covariance, the full model was compared with the model in which genetic covari-
ance was zero (COVA = 0). Significance of maternal permanent environmental covariance was
also tested accordingly (COVC = 0). [25]. Significance of phenotypic correlations was tested by
the hypothesis test to decide whether the value of the correlation coefficient was significantly
different from zero [26].
The EBV obtained from the best single trait model suited for each trait was used to plot the
genetic trend. The genetic trend was estimated by regression of the EBV of the females that
contributed in each generation for the trait under selection (EM40) and the other production
traits under study [26]. The EBV of contributed individuals was utilized for estimating the
genetic trends of growth traits.
Results
Growth and production traits
The least squares means (LSM) for body weight up to six weeks of age and SL6 are presented
in Table 2. Generation and hatch had significant (P�0.01) effect on the body weight (BW0,
PLOS ONE (co) variance components and breeding value of economic traits in Dahlem Red chicken
PLOS ONE | https://doi.org/10.1371/journal.pone.0247779 March 3, 2021 5 / 21
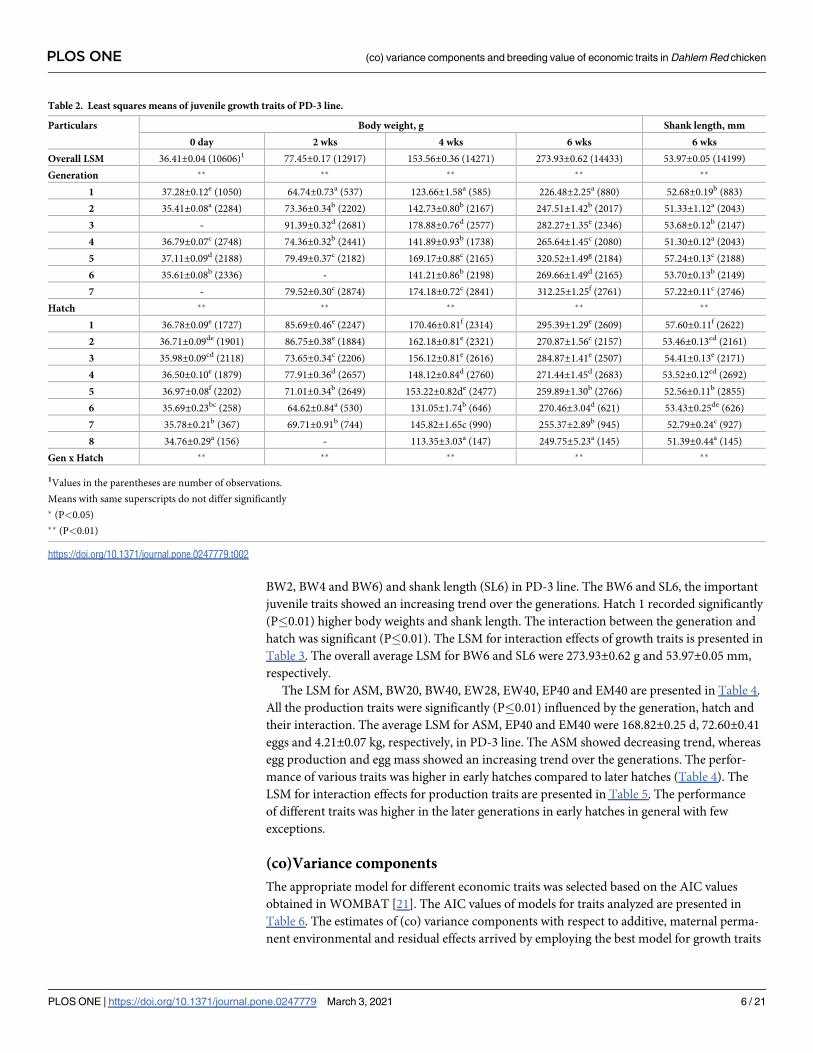
BW2, BW4 and BW6) and shank length (SL6) in PD-3 line. The BW6 and SL6, the important
juvenile traits showed an increasing trend over the generations. Hatch 1 recorded significantly
(P�0.01) higher body weights and shank length. The interaction between the generation and
hatch was significant (P�0.01). The LSM for interaction effects of growth traits is presented in
Table 3. The overall average LSM for BW6 and SL6 were 273.93±0.62 g and 53.97±0.05 mm,
respectively.
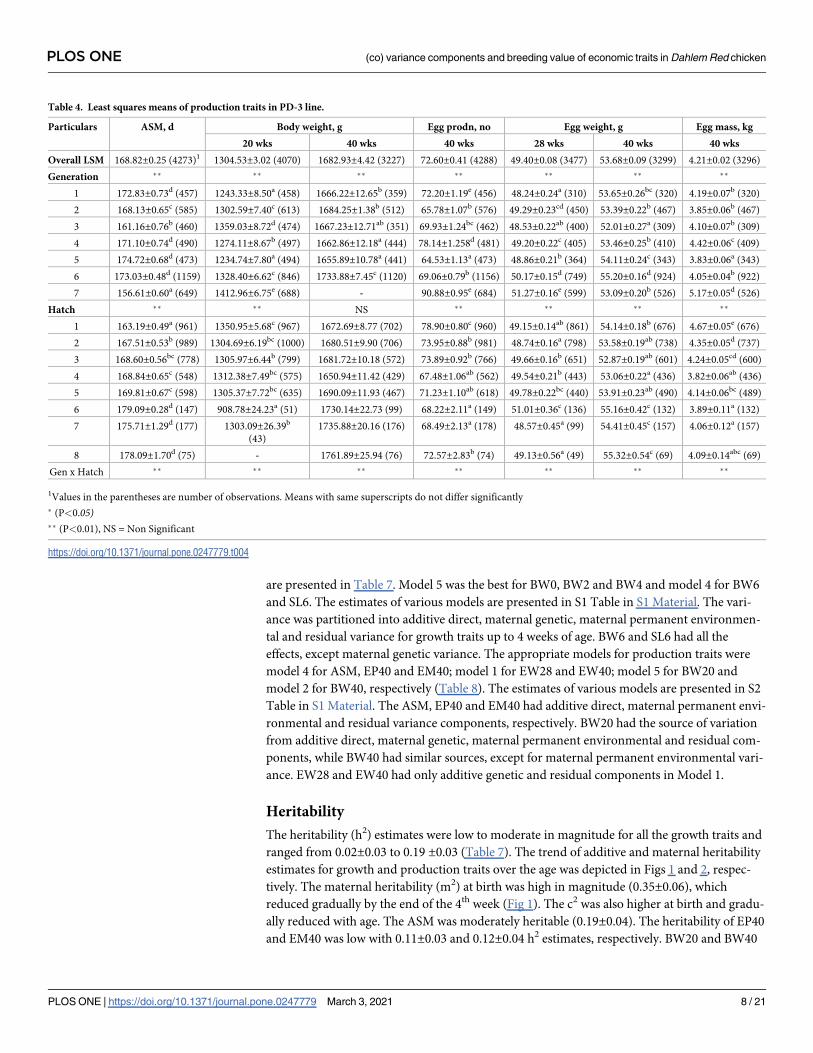
The LSM for ASM, BW20, BW40, EW28, EW40, EP40 and EM40 are presented in Table 4.
All the production traits were significantly (P�0.01) influenced by the generation, hatch and
their interaction. The average LSM for ASM, EP40 and EM40 were 168.82±0.25 d, 72.60±0.41
eggs and 4.21±0.07 kg, respectively, in PD-3 line. The ASM showed decreasing trend, whereas
egg production and egg mass showed an increasing trend over the generations. The perfor-
mance of various traits was higher in early hatches compared to later hatches (Table 4). The
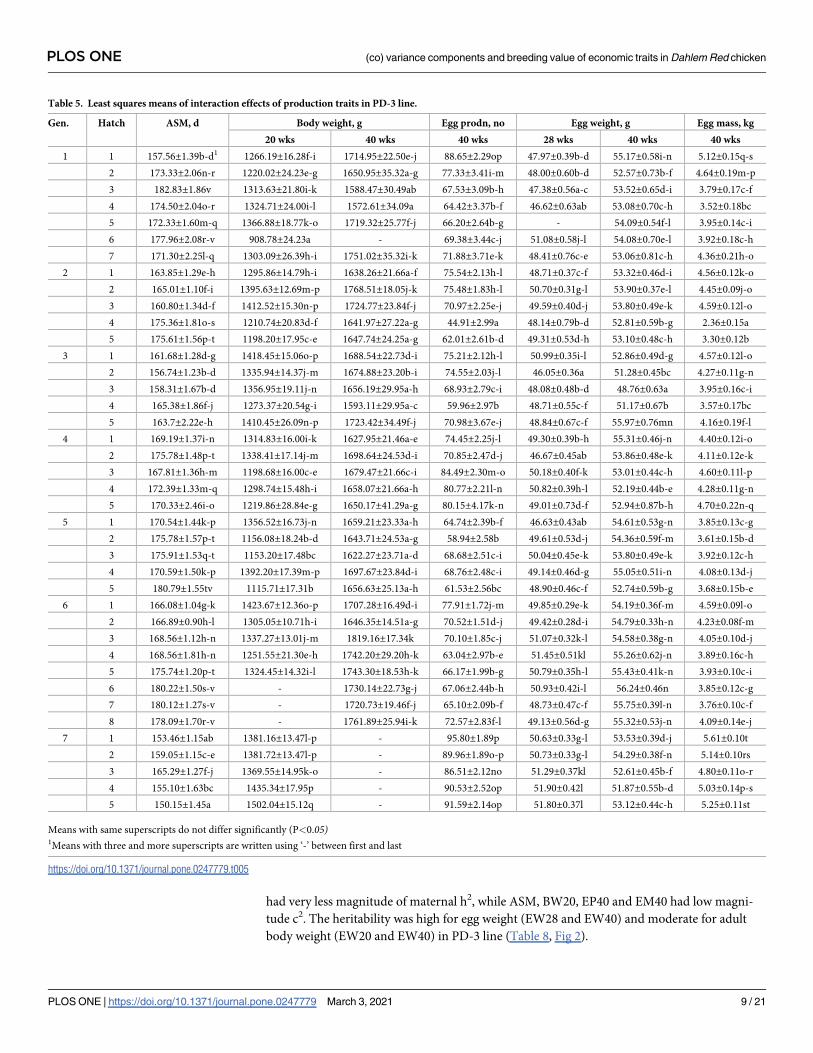
LSM for interaction effects for production traits are presented in Table 5. The performance
of different traits was higher in the later generations in early hatches in general with few
exceptions.
(co)Variance components
The appropriate model for different economic traits was selected based on the AIC values
obtained in WOMBAT [21]. The AIC values of models for traits analyzed are presented in
Table 6. The estimates of (co) variance components with respect to additive, maternal perma-
nent environmental and residual effects arrived by employing the best model for growth traits
Table 2. Least squares means of juvenile growth traits of PD-3 line.
Particulars Body weight, g Shank length, mm
0 day 2 wks 4 wks 6 wks 6 wks
Overall LSM 36.41±0.04 (10606)1 77.45±0.17 (12917) 153.56±0.36 (14271) 273.93±0.62 (14433) 53.97±0.05 (14199)
Generation �� �� �� �� ��
1 37.28±0.12e (1050) 64.74±0.73a (537) 123.66±1.58a (585) 226.48±2.25a (880) 52.68±0.19b (883)
2 35.41±0.08a (2284) 73.36±0.34b (2202) 142.73±0.80b (2167) 247.51±1.42b (2017) 51.33±1.12a (2043)
3 - 91.39±0.32d (2681) 178.88±0.76d (2577) 282.27±1.35e (2346) 53.68±0.12b (2147)
4 36.79±0.07c (2748) 74.36±0.32b (2441) 141.89±0.93b (1738) 265.64±1.45c (2080) 51.30±0.12a (2043)
5 37.11±0.09d (2188) 79.49±0.37c (2182) 169.17±0.88c (2165) 320.52±1.49g (2184) 57.24±0.13c (2188)
6 35.61±0.08b (2336) - 141.21±0.86b (2198) 269.66±1.49d (2165) 53.70±0.13b (2149)
7 - 79.52±0.30c (2874) 174.18±0.72c (2841) 312.25±1.25f (2761) 57.22±0.11c (2746)
Hatch �� �� �� �� ��
1 36.78±0.09e (1727) 85.69±0.46e (2247) 170.46±0.81f (2314) 295.39±1.29e (2609) 57.60±0.11f (2622)
2 36.71±0.09de (1901) 86.75±0.38e (1884) 162.18±0.81e (2321) 270.87±1.56c (2157) 53.46±0.13cd (2161)
3 35.98±0.09cd (2118) 73.65±0.34c (2206) 156.12±0.81e (2616) 284.87±1.41e (2507) 54.41±0.13e (2171)
4 36.50±0.10e (1879) 77.91±0.36d (2657) 148.12±0.84d (2760) 271.44±1.45d (2683) 53.52±0.12cd (2692)
5 36.97±0.08f (2202) 71.01±0.34b (2649) 153.22±0.82de (2477) 259.89±1.30b (2766) 52.56±0.11b (2855)
6 35.69±0.23bc (258) 64.62±0.84a (530) 131.05±1.74b (646) 270.46±3.04d (621) 53.43±0.25de (626)
7 35.78±0.21b (367) 69.71±0.91b (744) 145.82±1.65c (990) 255.37±2.89b (945) 52.79±0.24c (927)
8 34.76±0.29a (156) - 113.35±3.03a (147) 249.75±5.23a (145) 51.39±0.44a (145)
Gen x Hatch �� �� �� �� ��
1Values in the parentheses are number of observations.
Means with same superscripts do not differ significantly
� (P<0.05)
�� (P<0.01)
https://doi.org/10.1371/journal.pone.0247779.t002
PLOS ONE (co) variance components and breeding value of economic traits in Dahlem Red chicken
PLOS ONE | https://doi.org/10.1371/journal.pone.0247779 March 3, 2021 6 / 21
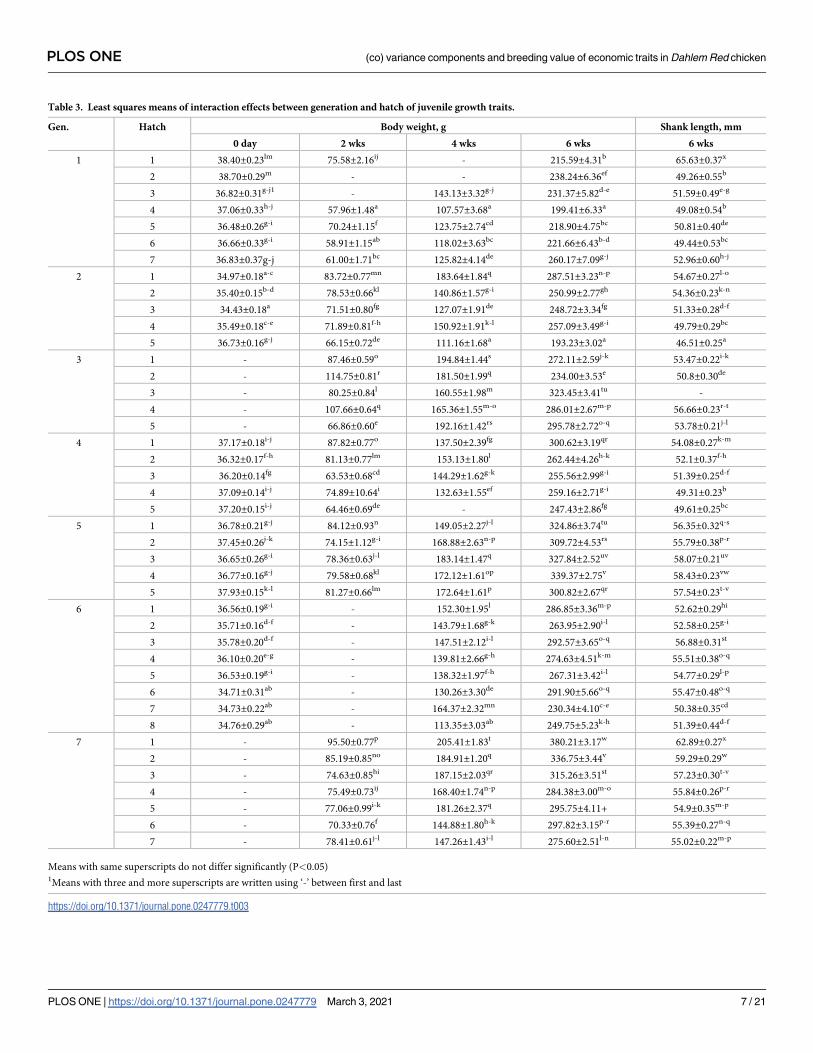
Table 3. Least squares means of interaction effects between generation and hatch of juvenile growth traits.
Gen. Hatch Body weight, g Shank length, mm
0 day 2 wks 4 wks 6 wks 6 wks
1 1 38.40±0.23lm 75.58±2.16ij - 215.59±4.31b 65.63±0.37x
2 38.70±0.29m - - 238.24±6.36ef 49.26±0.55b
3 36.82±0.31g-j1 - 143.13±3.32g-j 231.37±5.82d-e 51.59±0.49e-g
4 37.06±0.33h-j 57.96±1.48a 107.57±3.68a 199.41±6.33a 49.08±0.54b
5 36.48±0.26g-i 70.24±1.15f 123.75±2.74cd 218.90±4.75bc 50.81±0.40de
6 36.66±0.33g-i 58.91±1.15ab 118.02±3.63bc 221.66±6.43b-d 49.44±0.53bc
7 36.83±0.37g-j 61.00±1.71bc 125.82±4.14de 260.17±7.09g-j 52.96±0.60h-j
2 1 34.97±0.18a-c 83.72±0.77mn 183.64±1.84q 287.51±3.23n-p 54.67±0.27l-o
2 35.40±0.15b-d 78.53±0.66kl 140.86±1.57g-i 250.99±2.77gh 54.36±0.23k-n
3 34.43±0.18a 71.51±0.80fg 127.07±1.91de 248.72±3.34fg 51.33±0.28d-f
4 35.49±0.18c-e 71.89±0.81f-h 150.92±1.91k-l 257.09±3.49g-i 49.79±0.29bc
5 36.73±0.16g-j 66.15±0.72de 111.16±1.68a 193.23±3.02a 46.51±0.25a
3 1 - 87.46±0.59o 194.84±1.44s 272.11±2.59j-k 53.47±0.22i-k
2 - 114.75±0.81r 181.50±1.99q 234.00±3.53e 50.8±0.30de
3 - 80.25±0.84l 160.55±1.98m 323.45±3.41tu -
4 - 107.66±0.64q 165.36±1.55m-o 286.01±2.67m-p 56.66±0.23r-t
5 - 66.86±0.60e 192.16±1.42rs 295.78±2.72o-q 53.78±0.21j-l
4 1 37.17±0.18i-j 87.82±0.77o 137.50±2.39fg 300.62±3.19qr 54.08±0.27k-m
2 36.32±0.17f-h 81.13±0.77lm 153.13±1.80l 262.44±4.26h-k 52.1±0.37f-h
3 36.20±0.14fg 63.53±0.68cd 144.29±1.62g-k 255.56±2.99g-i 51.39±0.25d-f
4 37.09±0.14i-j 74.89±10.64i 132.63±1.55ef 259.16±2.71g-i 49.31±0.23b
5 37.20±0.15i-j 64.46±0.69de - 247.43±2.86fg 49.61±0.25bc
5 1 36.78±0.21g-j 84.12±0.93n 149.05±2.27j-l 324.86±3.74tu 56.35±0.32q-s
2 37.45±0.26j-k 74.15±1.12g-i 168.88±2.63n-p 309.72±4.53rs 55.79±0.38p-r
3 36.65±0.26g-i 78.36±0.63j-l 183.14±1.47q 327.84±2.52uv 58.07±0.21uv
4 36.77±0.16g-j 79.58±0.68kl 172.12±1.61op 339.37±2.75v 58.43±0.23vw
5 37.93±0.15k-l 81.27±0.66lm 172.64±1.61p 300.82±2.67qr 57.54±0.23t-v
6 1 36.56±0.19g-i - 152.30±1.95l 286.85±3.36m-p 52.62±0.29hi
2 35.71±0.16d-f - 143.79±1.68g-k 263.95±2.90i-l 52.58±0.25g-i
3 35.78±0.20d-f - 147.51±2.12i-l 292.57±3.65o-q 56.88±0.31st
4 36.10±0.20e-g - 139.81±2.66g-h 274.63±4.51k-m 55.51±0.38o-q
5 36.53±0.19g-i - 138.32±1.97f-h 267.31±3.42i-l 54.77±0.29l-p
6 34.71±0.31ab - 130.26±3.30de 291.90±5.66o-q 55.47±0.48o-q
7 34.73±0.22ab - 164.37±2.32mn 230.34±4.10c-e 50.38±0.35cd
8 34.76±0.29ab - 113.35±3.03ab 249.75±5.23k-h 51.39±0.44d-f
7 1 - 95.50±0.77p 205.41±1.83t 380.21±3.17w 62.89±0.27x
2 - 85.19±0.85no 184.91±1.20q 336.75±3.44v 59.29±0.29w
3 - 74.63±0.85hi 187.15±2.03qr 315.26±3.51st 57.23±0.30t-v
4 - 75.49±0.73ij 168.40±1.74n-p 284.38±3.00m-o 55.84±0.26p-r
5 - 77.06±0.99i-k 181.26±2.37q 295.75±4.11+ 54.9±0.35m-p
6 - 70.33±0.76f 144.88±1.80h-k 297.82±3.15p-r 55.39±0.27n-q
7 - 78.41±0.61j-l 147.26±1.43i-l 275.60±2.51l-n 55.02±0.22m-p
Means with same superscripts do not differ significantly (P<0.05)1Means with three and more superscripts are written using ‘-’ between first and last
https://doi.org/10.1371/journal.pone.0247779.t003
PLOS ONE (co) variance components and breeding value of economic traits in Dahlem Red chicken
PLOS ONE | https://doi.org/10.1371/journal.pone.0247779 March 3, 2021 7 / 21
are presented in Table 7. Model 5 was the best for BW0, BW2 and BW4 and model 4 for BW6
and SL6. The estimates of various models are presented in S1 Table in S1 Material. The vari-
ance was partitioned into additive direct, maternal genetic, maternal permanent environmen-
tal and residual variance for growth traits up to 4 weeks of age. BW6 and SL6 had all the
effects, except maternal genetic variance. The appropriate models for production traits were
model 4 for ASM, EP40 and EM40; model 1 for EW28 and EW40; model 5 for BW20 and
model 2 for BW40, respectively (Table 8). The estimates of various models are presented in S2
Table in S1 Material. The ASM, EP40 and EM40 had additive direct, maternal permanent envi-
ronmental and residual variance components, respectively. BW20 had the source of variation
from additive direct, maternal genetic, maternal permanent environmental and residual com-
ponents, while BW40 had similar sources, except for maternal permanent environmental vari-
ance. EW28 and EW40 had only additive genetic and residual components in Model 1.
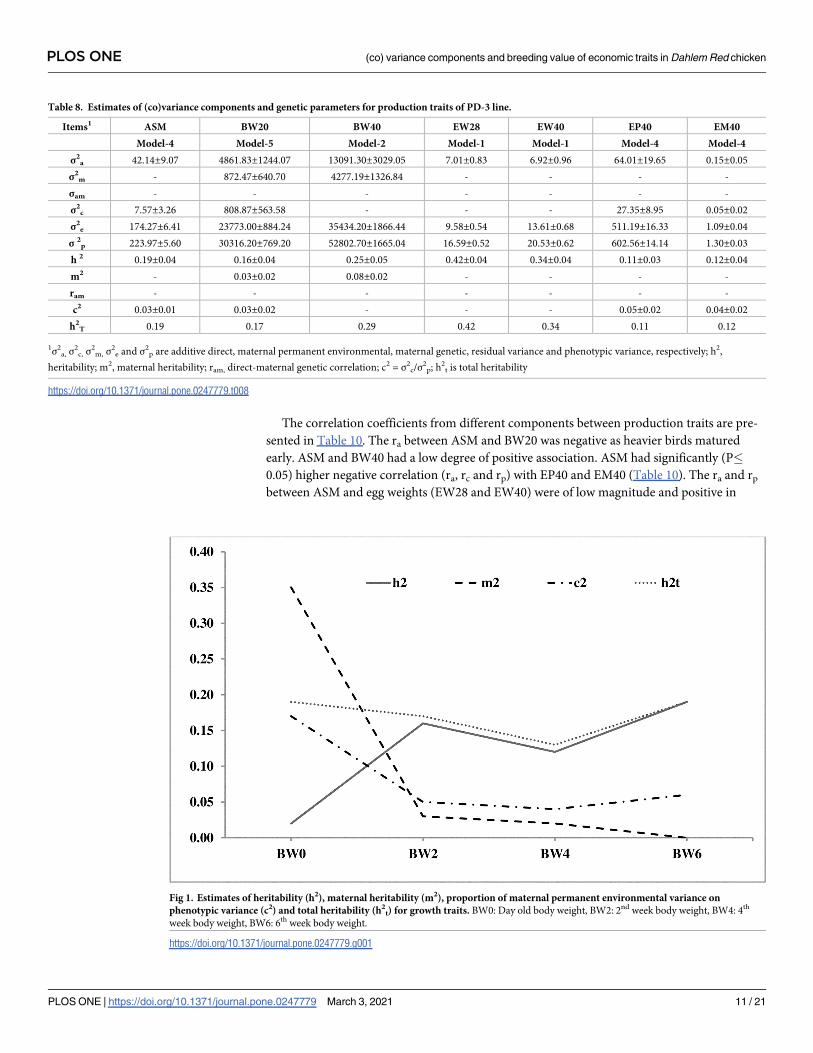
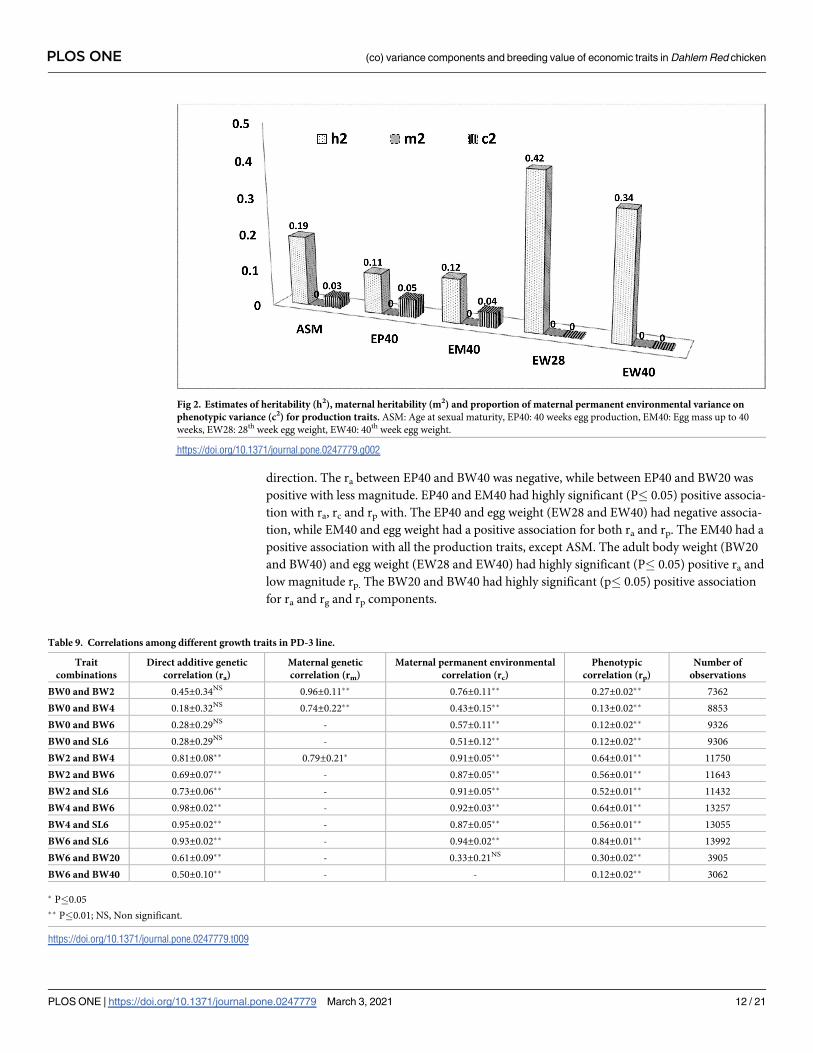
Heritability
The heritability (h2) estimates were low to moderate in magnitude for all the growth traits and
ranged from 0.02±0.03 to 0.19 ±0.03 (Table 7). The trend of additive and maternal heritability
estimates for growth and production traits over the age was depicted in Figs 1 and 2, respec-
tively. The maternal heritability (m2) at birth was high in magnitude (0.35±0.06), which
reduced gradually by the end of the 4th week (Fig 1). The c2 was also higher at birth and gradu-
ally reduced with age. The ASM was moderately heritable (0.19±0.04). The heritability of EP40
and EM40 was low with 0.11±0.03 and 0.12±0.04 h2 estimates, respectively. BW20 and BW40
Table 4. Least squares means of production traits in PD-3 line.
Particulars ASM, d Body weight, g Egg prodn, no Egg weight, g Egg mass, kg
20 wks 40 wks 40 wks 28 wks 40 wks 40 wks
Overall LSM 168.82±0.25 (4273)1 1304.53±3.02 (4070) 1682.93±4.42 (3227) 72.60±0.41 (4288) 49.40±0.08 (3477) 53.68±0.09 (3299) 4.21±0.02 (3296)
Generation �� �� �� �� �� �� ��
1 172.83±0.73d (457) 1243.33±8.50a (458) 1666.22±12.65b (359) 72.20±1.19e (456) 48.24±0.24a (310) 53.65±0.26bc (320) 4.19±0.07b (320)
2 168.13±0.65c (585) 1302.59±7.40c (613) 1684.25±1.38b (512) 65.78±1.07b (576) 49.29±0.23cd (450) 53.39±0.22b (467) 3.85±0.06b (467)
3 161.16±0.76b (460) 1359.03±8.72d (474) 1667.23±12.71ab (351) 69.93±1.24bc (462) 48.53±0.22ab (400) 52.01±0.27a (309) 4.10±0.07b (309)
4 171.10±0.74d (490) 1274.11±8.67b (497) 1662.86±12.18a (444) 78.14±1.258d (481) 49.20±0.22c (405) 53.46±0.25b (410) 4.42±0.06c (409)
5 174.72±0.68d (473) 1234.74±7.80a (494) 1655.89±10.78a (441) 64.53±1.13a (473) 48.86±0.21b (364) 54.11±0.24c (343) 3.83±0.06a (343)
6 173.03±0.48d (1159) 1328.40±6.62c (846) 1733.88±7.45c (1120) 69.06±0.79b (1156) 50.17±0.15d (749) 55.20±0.16d (924) 4.05±0.04b (922)
7 156.61±0.60a (649) 1412.96±6.75e (688) - 90.88±0.95e (684) 51.27±0.16e (599) 53.09±0.20b (526) 5.17±0.05d (526)
Hatch �� �� NS �� �� �� ��
1 163.19±0.49a (961) 1350.95±5.68c (967) 1672.69±8.77 (702) 78.90±0.80c (960) 49.15±0.14ab (861) 54.14±0.18b (676) 4.67±0.05e (676)
2 167.51±0.53b (989) 1304.69±6.19bc (1000) 1680.51±9.90 (706) 73.95±0.88b (981) 48.74±0.16a (798) 53.58±0.19ab (738) 4.35±0.05d (737)
3 168.60±0.56bc (778) 1305.97±6.44b (799) 1681.72±10.18 (572) 73.89±0.92b (766) 49.66±0.16b (651) 52.87±0.19ab (601) 4.24±0.05cd (600)
4 168.84±0.65c (548) 1312.38±7.49bc (575) 1650.94±11.42 (429) 67.48±1.06ab (562) 49.54±0.21b (443) 53.06±0.22a (436) 3.82±0.06ab (436)
5 169.81±0.67c (598) 1305.37±7.72bc (635) 1690.09±11.93 (467) 71.23±1.10ab (618) 49.78±0.22bc (440) 53.91±0.23ab (490) 4.14±0.06bc (489)
6 179.09±0.28d (147) 908.78±24.23a (51) 1730.14±22.73 (99) 68.22±2.11a (149) 51.01±0.36c (136) 55.16±0.42c (132) 3.89±0.11a (132)
7 175.71±1.29d (177) 1303.09±26.39b
(43)
1735.88±20.16 (176) 68.49±2.13a (178) 48.57±0.45a (99) 54.41±0.45c (157) 4.06±0.12a (157)
8 178.09±1.70d (75) - 1761.89±25.94 (76) 72.57±2.83b (74) 49.13±0.56a (49) 55.32±0.54c (69) 4.09±0.14abc (69)
Gen x Hatch �� �� �� �� �� �� ��
1Values in the parentheses are number of observations. Means with same superscripts do not differ significantly
� (P<0.05)�� (P<0.01), NS = Non Significant
https://doi.org/10.1371/journal.pone.0247779.t004
PLOS ONE (co) variance components and breeding value of economic traits in Dahlem Red chicken
PLOS ONE | https://doi.org/10.1371/journal.pone.0247779 March 3, 2021 8 / 21
had very less magnitude of maternal h2, while ASM, BW20, EP40 and EM40 had low magni-
tude c2. The heritability was high for egg weight (EW28 and EW40) and moderate for adult
body weight (EW20 and EW40) in PD-3 line (Table 8, Fig 2).
Table 5. Least squares means of interaction effects of production traits in PD-3 line.
Gen. Hatch ASM, d Body weight, g Egg prodn, no Egg weight, g Egg mass, kg
20 wks 40 wks 40 wks 28 wks 40 wks 40 wks
1 1 157.56±1.39b-d1 1266.19±16.28f-i 1714.95±22.50e-j 88.65±2.29op 47.97±0.39b-d 55.17±0.58i-n 5.12±0.15q-s
2 173.33±2.06n-r 1220.02±24.23e-g 1650.95±35.32a-g 77.33±3.41i-m 48.00±0.60b-d 52.57±0.73b-f 4.64±0.19m-p
3 182.83±1.86v 1313.63±21.80i-k 1588.47±30.49ab 67.53±3.09b-h 47.38±0.56a-c 53.52±0.65d-i 3.79±0.17c-f
4 174.50±2.04o-r 1324.71±24.00i-l 1572.61±34.09a 64.42±3.37b-f 46.62±0.63ab 53.08±0.70c-h 3.52±0.18bc
5 172.33±1.60m-q 1366.88±18.77k-o 1719.32±25.77f-j 66.20±2.64b-g - 54.09±0.54f-l 3.95±0.14c-i
6 177.96±2.08r-v 908.78±24.23a - 69.38±3.44c-j 51.08±0.58j-l 54.08±0.70e-l 3.92±0.18c-h
7 171.30±2.25l-q 1303.09±26.39h-i 1751.02±35.32i-k 71.88±3.71e-k 48.41±0.76c-e 53.06±0.81c-h 4.36±0.21h-o
2 1 163.85±1.29e-h 1295.86±14.79h-i 1638.26±21.66a-f 75.54±2.13h-l 48.71±0.37c-f 53.32±0.46d-i 4.56±0.12k-o
2 165.01±1.10f-i 1395.63±12.69m-p 1768.51±18.05j-k 75.48±1.83h-l 50.70±0.31g-l 53.90±0.37e-l 4.45±0.09j-o
3 160.80±1.34d-f 1412.52±15.30n-p 1724.77±23.84f-j 70.97±2.25e-j 49.59±0.40d-j 53.80±0.49e-k 4.59±0.12l-o
4 175.36±1.81o-s 1210.74±20.83d-f 1641.97±27.22a-g 44.91±2.99a 48.14±0.79b-d 52.81±0.59b-g 2.36±0.15a
5 175.61±1.56p-t 1198.20±17.95c-e 1647.74±24.25a-g 62.01±2.61b-d 49.31±0.53d-h 53.10±0.48c-h 3.30±0.12b
3 1 161.68±1.28d-g 1418.45±15.06o-p 1688.54±22.73d-i 75.21±2.12h-l 50.99±0.35i-l 52.86±0.49d-g 4.57±0.12l-o
2 156.74±1.23b-d 1335.94±14.37j-m 1674.88±23.20b-i 74.55±2.03j-l 46.05±0.36a 51.28±0.45bc 4.27±0.11g-n
3 158.31±1.67b-d 1356.95±19.11j-n 1656.19±29.95a-h 68.93±2.79c-i 48.08±0.48b-d 48.76±0.63a 3.95±0.16c-i
4 165.38±1.86f-j 1273.37±20.54g-i 1593.11±29.95a-c 59.96±2.97b 48.71±0.55c-f 51.17±0.67b 3.57±0.17bc
5 163.7±2.22e-h 1410.45±26.09n-p 1723.42±34.49f-j 70.98±3.67e-j 48.84±0.67c-f 55.97±0.76mn 4.16±0.19f-l
4 1 169.19±1.37i-n 1314.83±16.00i-k 1627.95±21.46a-e 74.45±2.25j-l 49.30±0.39b-h 55.31±0.46j-n 4.40±0.12i-o
2 175.78±1.48p-t 1338.41±17.14j-m 1698.64±24.53d-i 70.85±2.47d-j 46.67±0.45ab 53.86±0.48e-k 4.11±0.12e-k
3 167.81±1.36h-m 1198.68±16.00c-e 1679.47±21.66c-i 84.49±2.30m-o 50.18±0.40f-k 53.01±0.44c-h 4.60±0.11l-p
4 172.39±1.33m-q 1298.74±15.48h-i 1658.07±21.66a-h 80.77±2.21l-n 50.82±0.39h-l 52.19±0.44b-e 4.28±0.11g-n
5 170.33±2.46i-o 1219.86±28.84e-g 1650.17±41.29a-g 80.15±4.17k-n 49.01±0.73d-f 52.94±0.87b-h 4.70±0.22n-q
5 1 170.54±1.44k-p 1356.52±16.73j-n 1659.21±23.33a-h 64.74±2.39b-f 46.63±0.43ab 54.61±0.53g-n 3.85±0.13c-g
2 175.78±1.57p-t 1156.08±18.24b-d 1643.71±24.53a-g 58.94±2.58b 49.61±0.53d-j 54.36±0.59f-m 3.61±0.15b-d
3 175.91±1.53q-t 1153.20±17.48bc 1622.27±23.71a-d 68.68±2.51c-i 50.04±0.45e-k 53.80±0.49e-k 3.92±0.12c-h
4 170.59±1.50k-p 1392.20±17.39m-p 1697.67±23.84d-i 68.76±2.48c-i 49.14±0.46d-g 55.05±0.51i-n 4.08±0.13d-j
5 180.79±1.55tv 1115.71±17.31b 1656.63±25.13a-h 61.53±2.56bc 48.90±0.46c-f 52.74±0.59b-g 3.68±0.15b-e
6 1 166.08±1.04g-k 1423.67±12.36o-p 1707.28±16.49d-i 77.91±1.72j-m 49.85±0.29e-k 54.19±0.36f-m 4.59±0.09l-o
2 166.89±0.90h-l 1305.05±10.71h-i 1646.35±14.51a-g 70.52±1.51d-j 49.42±0.28d-i 54.79±0.33h-n 4.23±0.08f-m
3 168.56±1.12h-n 1337.27±13.01j-m 1819.16±17.34k 70.10±1.85c-j 51.07±0.32k-l 54.58±0.38g-n 4.05±0.10d-j
4 168.56±1.81h-n 1251.55±21.30e-h 1742.20±29.20h-k 63.04±2.97b-e 51.45±0.51kl 55.26±0.62j-n 3.89±0.16c-h
5 175.74±1.20p-t 1324.45±14.32i-l 1743.30±18.53h-k 66.17±1.99b-g 50.79±0.35h-l 55.43±0.41k-n 3.93±0.10c-i
6 180.22±1.50s-v - 1730.14±22.73g-j 67.06±2.44b-h 50.93±0.42i-l 56.24±0.46n 3.85±0.12c-g
7 180.12±1.27s-v - 1720.73±19.46f-j 65.10±2.09b-f 48.73±0.47c-f 55.75±0.39l-n 3.76±0.10c-f
8 178.09±1.70r-v - 1761.89±25.94i-k 72.57±2.83f-l 49.13±0.56d-g 55.32±0.53j-n 4.09±0.14e-j
7 1 153.46±1.15ab 1381.16±13.47l-p - 95.80±1.89p 50.63±0.33g-l 53.53±0.39d-j 5.61±0.10t
2 159.05±1.15c-e 1381.72±13.47l-p - 89.96±1.89o-p 50.73±0.33g-l 54.29±0.38f-n 5.14±0.10rs
3 165.29±1.27f-j 1369.55±14.95k-o - 86.51±2.12no 51.29±0.37kl 52.61±0.45b-f 4.80±0.11o-r
4 155.10±1.63bc 1435.34±17.95p - 90.53±2.52op 51.90±0.42l 51.87±0.55b-d 5.03±0.14p-s
5 150.15±1.45a 1502.04±15.12q - 91.59±2.14op 51.80±0.37l 53.12±0.44c-h 5.25±0.11st
Means with same superscripts do not differ significantly (P<0.05)1Means with three and more superscripts are written using ‘-’ between first and last
https://doi.org/10.1371/journal.pone.0247779.t005
PLOS ONE (co) variance components and breeding value of economic traits in Dahlem Red chicken
PLOS ONE | https://doi.org/10.1371/journal.pone.0247779 March 3, 2021 9 / 21
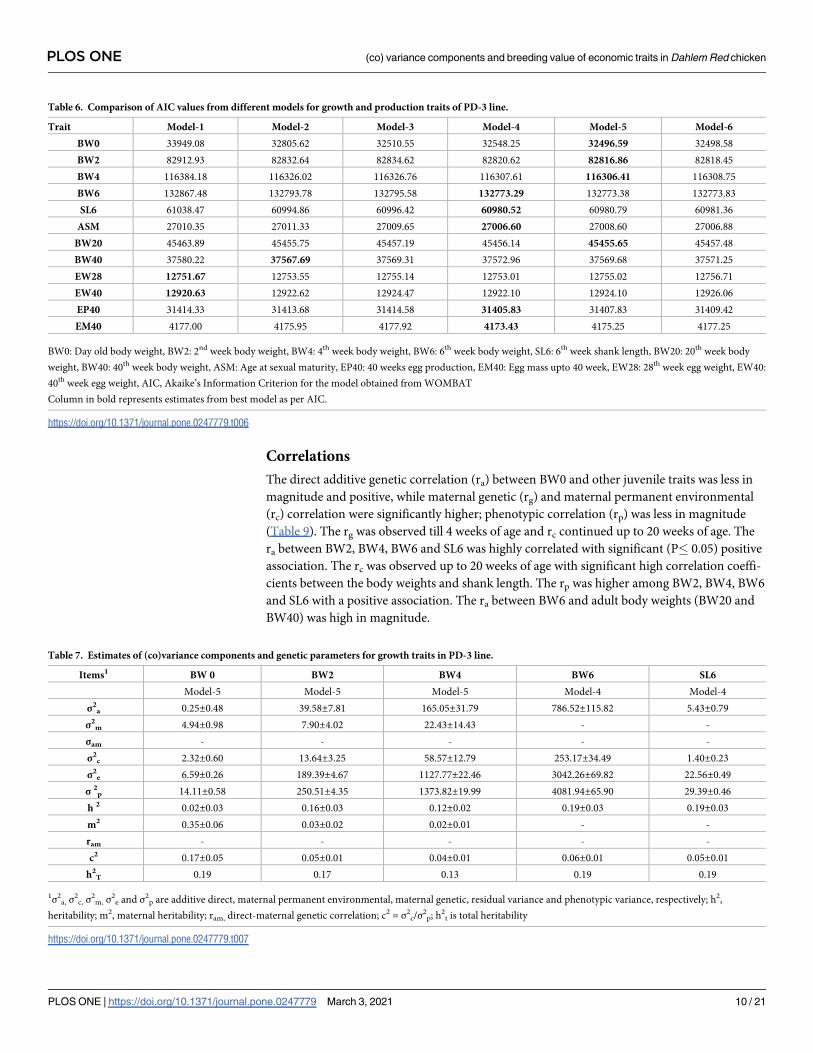
Correlations
The direct additive genetic correlation (ra) between BW0 and other juvenile traits was less in
magnitude and positive, while maternal genetic (rg) and maternal permanent environmental
(rc) correlation were significantly higher; phenotypic correlation (rp) was less in magnitude
(Table 9). The rg was observed till 4 weeks of age and rc continued up to 20 weeks of age. The
ra between BW2, BW4, BW6 and SL6 was highly correlated with significant (P� 0.05) positive
association. The rc was observed up to 20 weeks of age with significant high correlation coeffi-
cients between the body weights and shank length. The rp was higher among BW2, BW4, BW6
and SL6 with a positive association. The ra between BW6 and adult body weights (BW20 and
BW40) was high in magnitude.
Table 6. Comparison of AIC values from different models for growth and production traits of PD-3 line.
Trait Model-1 Model-2 Model-3 Model-4 Model-5 Model-6
BW0 33949.08 32805.62 32510.55 32548.25 32496.59 32498.58
BW2 82912.93 82832.64 82834.62 82820.62 82816.86 82818.45
BW4 116384.18 116326.02 116326.76 116307.61 116306.41 116308.75
BW6 132867.48 132793.78 132795.58 132773.29 132773.38 132773.83
SL6 61038.47 60994.86 60996.42 60980.52 60980.79 60981.36
ASM 27010.35 27011.33 27009.65 27006.60 27008.60 27006.88
BW20 45463.89 45455.75 45457.19 45456.14 45455.65 45457.48
BW40 37580.22 37567.69 37569.31 37572.96 37569.68 37571.25
EW28 12751.67 12753.55 12755.14 12753.01 12755.02 12756.71
EW40 12920.63 12922.62 12924.47 12922.10 12924.10 12926.06
EP40 31414.33 31413.68 31414.58 31405.83 31407.83 31409.42
EM40 4177.00 4175.95 4177.92 4173.43 4175.25 4177.25
BW0: Day old body weight, BW2: 2nd week body weight, BW4: 4th week body weight, BW6: 6th week body weight, SL6: 6th week shank length, BW20: 20th week body
weight, BW40: 40th week body weight, ASM: Age at sexual maturity, EP40: 40 weeks egg production, EM40: Egg mass upto 40 week, EW28: 28th week egg weight, EW40:
40th week egg weight, AIC, Akaike’s Information Criterion for the model obtained from WOMBAT
Column in bold represents estimates from best model as per AIC.
https://doi.org/10.1371/journal.pone.0247779.t006
Table 7. Estimates of (co)variance components and genetic parameters for growth traits in PD-3 line.
Items1 BW 0 BW2 BW4 BW6 SL6
Model-5 Model-5 Model-5 Model-4 Model-4
σ2a 0.25±0.48 39.58±7.81 165.05±31.79 786.52±115.82 5.43±0.79
σ2m 4.94±0.98 7.90±4.02 22.43±14.43 - -
σam - - - - -
σ2c 2.32±0.60 13.64±3.25 58.57±12.79 253.17±34.49 1.40±0.23
σ2e 6.59±0.26 189.39±4.67 1127.77±22.46 3042.26±69.82 22.56±0.49
σ 2p 14.11±0.58 250.51±4.35 1373.82±19.99 4081.94±65.90 29.39±0.46
h 2 0.02±0.03 0.16±0.03 0.12±0.02 0.19±0.03 0.19±0.03
m2 0.35±0.06 0.03±0.02 0.02±0.01 - -
ram - - - - -
c2 0.17±0.05 0.05±0.01 0.04±0.01 0.06±0.01 0.05±0.01
h2T 0.19 0.17 0.13 0.19 0.19
1σ2a, σ2
c, σ2m, σ2
e and σ2p are additive direct, maternal permanent environmental, maternal genetic, residual variance and phenotypic variance, respectively; h2,
heritability; m2, maternal heritability; ram, direct-maternal genetic correlation; c2 = σ2c/σ2
p; h2t is total heritability
https://doi.org/10.1371/journal.pone.0247779.t007
PLOS ONE (co) variance components and breeding value of economic traits in Dahlem Red chicken
PLOS ONE | https://doi.org/10.1371/journal.pone.0247779 March 3, 2021 10 / 21
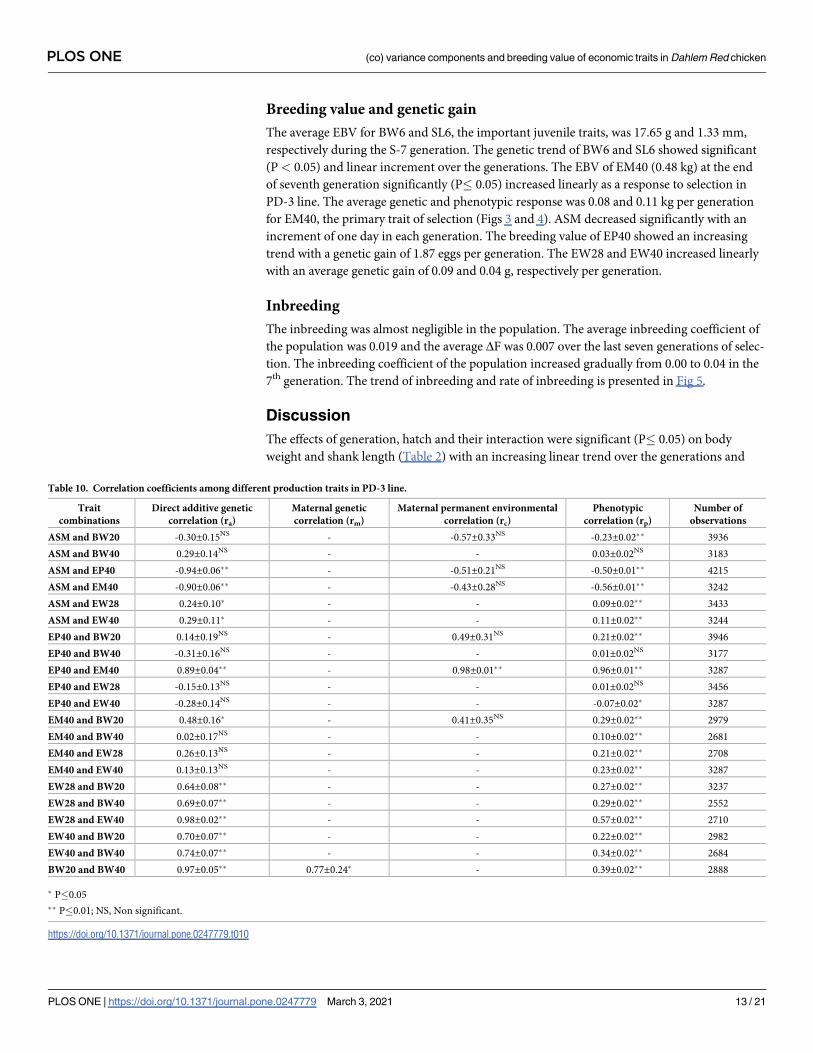
The correlation coefficients from different components between production traits are pre-
sented in Table 10. The ra between ASM and BW20 was negative as heavier birds matured
early. ASM and BW40 had a low degree of positive association. ASM had significantly (P�
0.05) higher negative correlation (ra, rc and rp) with EP40 and EM40 (Table 10). The ra and rp
between ASM and egg weights (EW28 and EW40) were of low magnitude and positive in
Table 8. Estimates of (co)variance components and genetic parameters for production traits of PD-3 line.
Items1 ASM BW20 BW40 EW28 EW40 EP40 EM40
Model-4 Model-5 Model-2 Model-1 Model-1 Model-4 Model-4
σ2a 42.14±9.07 4861.83±1244.07 13091.30±3029.05 7.01±0.83 6.92±0.96 64.01±19.65 0.15±0.05
σ2m - 872.47±640.70 4277.19±1326.84 - - - -
σam - - - - - - -
σ2c 7.57±3.26 808.87±563.58 - - - 27.35±8.95 0.05±0.02
σ2e 174.27±6.41 23773.00±884.24 35434.20±1866.44 9.58±0.54 13.61±0.68 511.19±16.33 1.09±0.04
σ 2p 223.97±5.60 30316.20±769.20 52802.70±1665.04 16.59±0.52 20.53±0.62 602.56±14.14 1.30±0.03
h 2 0.19±0.04 0.16±0.04 0.25±0.05 0.42±0.04 0.34±0.04 0.11±0.03 0.12±0.04
m2 - 0.03±0.02 0.08±0.02 - - - -
ram - - - - - - -
c2 0.03±0.01 0.03±0.02 - - - 0.05±0.02 0.04±0.02
h2T 0.19 0.17 0.29 0.42 0.34 0.11 0.12
1σ2a, σ2
c, σ2m, σ2
e and σ2p are additive direct, maternal permanent environmental, maternal genetic, residual variance and phenotypic variance, respectively; h2,
heritability; m2, maternal heritability; ram, direct-maternal genetic correlation; c2 = σ2c/σ2
p; h2t is total heritability
https://doi.org/10.1371/journal.pone.0247779.t008
Fig 1. Estimates of heritability (h2), maternal heritability (m2), proportion of maternal permanent environmental variance on
phenotypic variance (c2) and total heritability (h2t) for growth traits. BW0: Day old body weight, BW2: 2nd week body weight, BW4: 4th
week body weight, BW6: 6th week body weight.
https://doi.org/10.1371/journal.pone.0247779.g001
PLOS ONE (co) variance components and breeding value of economic traits in Dahlem Red chicken
PLOS ONE | https://doi.org/10.1371/journal.pone.0247779 March 3, 2021 11 / 21
direction. The ra between EP40 and BW40 was negative, while between EP40 and BW20 was
positive with less magnitude. EP40 and EM40 had highly significant (P� 0.05) positive associa-
tion with ra, rc and rp with. The EP40 and egg weight (EW28 and EW40) had negative associa-
tion, while EM40 and egg weight had a positive association for both ra and rp. The EM40 had a
positive association with all the production traits, except ASM. The adult body weight (BW20
and BW40) and egg weight (EW28 and EW40) had highly significant (P� 0.05) positive ra and
low magnitude rp. The BW20 and BW40 had highly significant (p� 0.05) positive association
for ra and rg and rp components.
Fig 2. Estimates of heritability (h2), maternal heritability (m2) and proportion of maternal permanent environmental variance on
phenotypic variance (c2) for production traits. ASM: Age at sexual maturity, EP40: 40 weeks egg production, EM40: Egg mass up to 40
weeks, EW28: 28th week egg weight, EW40: 40th week egg weight.
https://doi.org/10.1371/journal.pone.0247779.g002
Table 9. Correlations among different growth traits in PD-3 line.
Trait
combinations
Direct additive genetic
correlation (ra)
Maternal genetic
correlation (rm)
Maternal permanent environmental
correlation (rc)
Phenotypic
correlation (rp)
Number of
observations
BW0 and BW2 0.45±0.34NS 0.96±0.11�� 0.76±0.11�� 0.27±0.02�� 7362
BW0 and BW4 0.18±0.32NS 0.74±0.22�� 0.43±0.15�� 0.13±0.02�� 8853
BW0 and BW6 0.28±0.29NS - 0.57±0.11�� 0.12±0.02�� 9326
BW0 and SL6 0.28±0.29NS - 0.51±0.12�� 0.12±0.02�� 9306
BW2 and BW4 0.81±0.08�� 0.79±0.21� 0.91±0.05�� 0.64±0.01�� 11750
BW2 and BW6 0.69±0.07�� - 0.87±0.05�� 0.56±0.01�� 11643
BW2 and SL6 0.73±0.06�� - 0.91±0.05�� 0.52±0.01�� 11432
BW4 and BW6 0.98±0.02�� - 0.92±0.03�� 0.64±0.01�� 13257
BW4 and SL6 0.95±0.02�� - 0.87±0.05�� 0.56±0.01�� 13055
BW6 and SL6 0.93±0.02�� - 0.94±0.02�� 0.84±0.01�� 13992
BW6 and BW20 0.61±0.09�� - 0.33±0.21NS 0.30±0.02�� 3905
BW6 and BW40 0.50±0.10�� - - 0.12±0.02�� 3062
� P�0.05
�� P�0.01; NS, Non significant.
https://doi.org/10.1371/journal.pone.0247779.t009
PLOS ONE (co) variance components and breeding value of economic traits in Dahlem Red chicken
PLOS ONE | https://doi.org/10.1371/journal.pone.0247779 March 3, 2021 12 / 21
Breeding value and genetic gain
The average EBV for BW6 and SL6, the important juvenile traits, was 17.65 g and 1.33 mm,
respectively during the S-7 generation. The genetic trend of BW6 and SL6 showed significant
(P< 0.05) and linear increment over the generations. The EBV of EM40 (0.48 kg) at the end
of seventh generation significantly (P� 0.05) increased linearly as a response to selection in
PD-3 line. The average genetic and phenotypic response was 0.08 and 0.11 kg per generation
for EM40, the primary trait of selection (Figs 3 and 4). ASM decreased significantly with an
increment of one day in each generation. The breeding value of EP40 showed an increasing
trend with a genetic gain of 1.87 eggs per generation. The EW28 and EW40 increased linearly
with an average genetic gain of 0.09 and 0.04 g, respectively per generation.
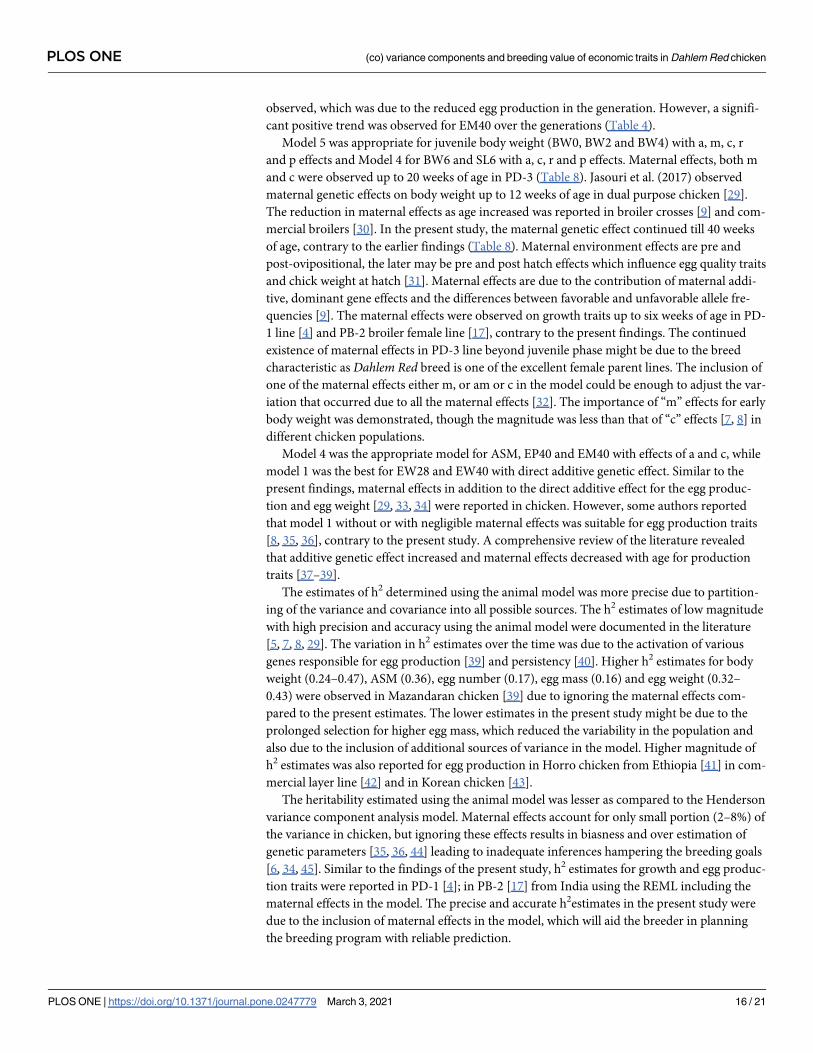
Inbreeding
The inbreeding was almost negligible in the population. The average inbreeding coefficient of
the population was 0.019 and the average ΔF was 0.007 over the last seven generations of selec-
tion. The inbreeding coefficient of the population increased gradually from 0.00 to 0.04 in the
7th generation. The trend of inbreeding and rate of inbreeding is presented in Fig 5.
Discussion
The effects of generation, hatch and their interaction were significant (P� 0.05) on body
weight and shank length (Table 2) with an increasing linear trend over the generations and
Table 10. Correlation coefficients among different production traits in PD-3 line.
Trait
combinations
Direct additive genetic
correlation (ra)
Maternal genetic
correlation (rm)
Maternal permanent environmental
correlation (rc)
Phenotypic
correlation (rp)
Number of
observations
ASM and BW20 -0.30±0.15NS - -0.57±0.33NS -0.23±0.02�� 3936
ASM and BW40 0.29±0.14NS - - 0.03±0.02NS 3183
ASM and EP40 -0.94±0.06�� - -0.51±0.21NS -0.50±0.01�� 4215
ASM and EM40 -0.90±0.06�� - -0.43±0.28NS -0.56±0.01�� 3242
ASM and EW28 0.24±0.10� - - 0.09±0.02�� 3433
ASM and EW40 0.29±0.11� - - 0.11±0.02�� 3244
EP40 and BW20 0.14±0.19NS - 0.49±0.31NS 0.21±0.02�� 3946
EP40 and BW40 -0.31±0.16NS - - 0.01±0.02NS 3177
EP40 and EM40 0.89±0.04�� - 0.98±0.01�� 0.96±0.01�� 3287
EP40 and EW28 -0.15±0.13NS - - 0.01±0.02NS 3456
EP40 and EW40 -0.28±0.14NS - - -0.07±0.02� 3287
EM40 and BW20 0.48±0.16� - 0.41±0.35NS 0.29±0.02�� 2979
EM40 and BW40 0.02±0.17NS - - 0.10±0.02�� 2681
EM40 and EW28 0.26±0.13NS - - 0.21±0.02�� 2708
EM40 and EW40 0.13±0.13NS - - 0.23±0.02�� 3287
EW28 and BW20 0.64±0.08�� - - 0.27±0.02�� 3237
EW28 and BW40 0.69±0.07�� - - 0.29±0.02�� 2552
EW28 and EW40 0.98±0.02�� - - 0.57±0.02�� 2710
EW40 and BW20 0.70±0.07�� - - 0.22±0.02�� 2982
EW40 and BW40 0.74±0.07�� - - 0.34±0.02�� 2684
BW20 and BW40 0.97±0.05�� 0.77±0.24� - 0.39±0.02�� 2888
� P�0.05
�� P�0.01; NS, Non significant.
https://doi.org/10.1371/journal.pone.0247779.t010
PLOS ONE (co) variance components and breeding value of economic traits in Dahlem Red chicken
PLOS ONE | https://doi.org/10.1371/journal.pone.0247779 March 3, 2021 13 / 21
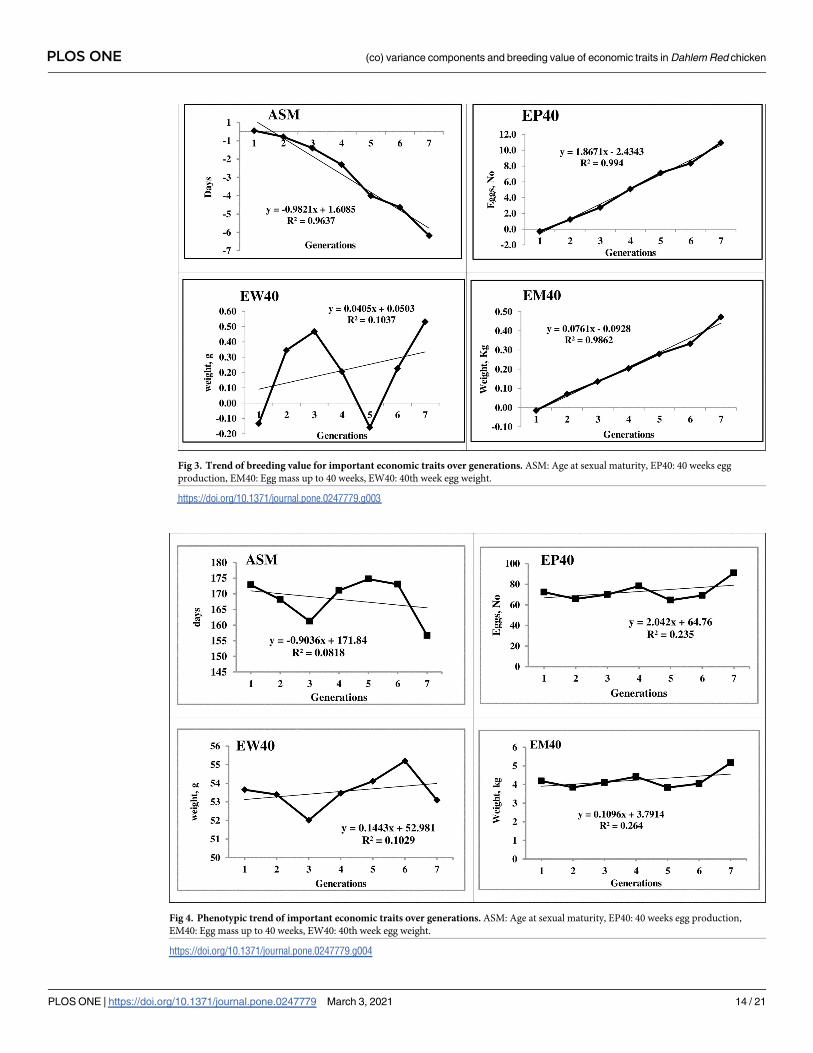
Fig 3. Trend of breeding value for important economic traits over generations. ASM: Age at sexual maturity, EP40: 40 weeks egg
production, EM40: Egg mass up to 40 weeks, EW40: 40th week egg weight.
https://doi.org/10.1371/journal.pone.0247779.g003
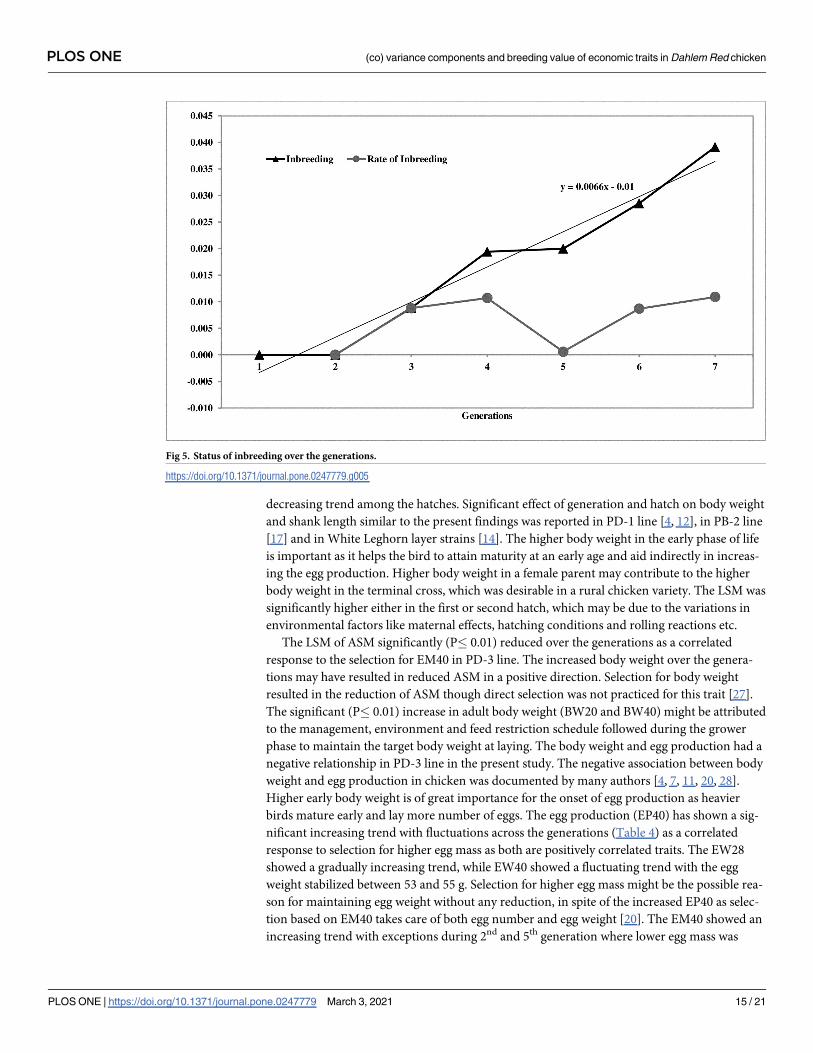
Fig 4. Phenotypic trend of important economic traits over generations. ASM: Age at sexual maturity, EP40: 40 weeks egg production,
EM40: Egg mass up to 40 weeks, EW40: 40th week egg weight.
https://doi.org/10.1371/journal.pone.0247779.g004
PLOS ONE (co) variance components and breeding value of economic traits in Dahlem Red chicken
PLOS ONE | https://doi.org/10.1371/journal.pone.0247779 March 3, 2021 14 / 21
decreasing trend among the hatches. Significant effect of generation and hatch on body weight
and shank length similar to the present findings was reported in PD-1 line [4, 12], in PB-2 line
[17] and in White Leghorn layer strains [14]. The higher body weight in the early phase of life
is important as it helps the bird to attain maturity at an early age and aid indirectly in increas-
ing the egg production. Higher body weight in a female parent may contribute to the higher
body weight in the terminal cross, which was desirable in a rural chicken variety. The LSM was
significantly higher either in the first or second hatch, which may be due to the variations in
environmental factors like maternal effects, hatching conditions and rolling reactions etc.
The LSM of ASM significantly (P� 0.01) reduced over the generations as a correlated
response to the selection for EM40 in PD-3 line. The increased body weight over the genera-
tions may have resulted in reduced ASM in a positive direction. Selection for body weight
resulted in the reduction of ASM though direct selection was not practiced for this trait [27].
The significant (P� 0.01) increase in adult body weight (BW20 and BW40) might be attributed
to the management, environment and feed restriction schedule followed during the grower
phase to maintain the target body weight at laying. The body weight and egg production had a
negative relationship in PD-3 line in the present study. The negative association between body
weight and egg production in chicken was documented by many authors [4, 7, 11, 20, 28].
Higher early body weight is of great importance for the onset of egg production as heavier
birds mature early and lay more number of eggs. The egg production (EP40) has shown a sig-
nificant increasing trend with fluctuations across the generations (Table 4) as a correlated
response to selection for higher egg mass as both are positively correlated traits. The EW28
showed a gradually increasing trend, while EW40 showed a fluctuating trend with the egg
weight stabilized between 53 and 55 g. Selection for higher egg mass might be the possible rea-
son for maintaining egg weight without any reduction, in spite of the increased EP40 as selec-
tion based on EM40 takes care of both egg number and egg weight [20]. The EM40 showed an
increasing trend with exceptions during 2nd and 5th generation where lower egg mass was
Fig 5. Status of inbreeding over the generations.
https://doi.org/10.1371/journal.pone.0247779.g005
PLOS ONE (co) variance components and breeding value of economic traits in Dahlem Red chicken
PLOS ONE | https://doi.org/10.1371/journal.pone.0247779 March 3, 2021 15 / 21
observed, which was due to the reduced egg production in the generation. However, a signifi-
cant positive trend was observed for EM40 over the generations (Table 4).
Model 5 was appropriate for juvenile body weight (BW0, BW2 and BW4) with a, m, c, r
and p effects and Model 4 for BW6 and SL6 with a, c, r and p effects. Maternal effects, both m
and c were observed up to 20 weeks of age in PD-3 (Table 8). Jasouri et al. (2017) observed
maternal genetic effects on body weight up to 12 weeks of age in dual purpose chicken [29].
The reduction in maternal effects as age increased was reported in broiler crosses [9] and com-
mercial broilers [30]. In the present study, the maternal genetic effect continued till 40 weeks
of age, contrary to the earlier findings (Table 8). Maternal environment effects are pre and
post-ovipositional, the later may be pre and post hatch effects which influence egg quality traits
and chick weight at hatch [31]. Maternal effects are due to the contribution of maternal addi-
tive, dominant gene effects and the differences between favorable and unfavorable allele fre-
quencies [9]. The maternal effects were observed on growth traits up to six weeks of age in PD-
1 line [4] and PB-2 broiler female line [17], contrary to the present findings. The continued
existence of maternal effects in PD-3 line beyond juvenile phase might be due to the breed
characteristic as Dahlem Red breed is one of the excellent female parent lines. The inclusion of
one of the maternal effects either m, or am or c in the model could be enough to adjust the var-
iation that occurred due to all the maternal effects [32]. The importance of “m” effects for early
body weight was demonstrated, though the magnitude was less than that of “c” effects [7, 8] in
different chicken populations.
Model 4 was the appropriate model for ASM, EP40 and EM40 with effects of a and c, while
model 1 was the best for EW28 and EW40 with direct additive genetic effect. Similar to the
present findings, maternal effects in addition to the direct additive effect for the egg produc-
tion and egg weight [29, 33, 34] were reported in chicken. However, some authors reported
that model 1 without or with negligible maternal effects was suitable for egg production traits
[8, 35, 36], contrary to the present study. A comprehensive review of the literature revealed
that additive genetic effect increased and maternal effects decreased with age for production
traits [37–39].
The estimates of h2 determined using the animal model was more precise due to partition-
ing of the variance and covariance into all possible sources. The h2 estimates of low magnitude
with high precision and accuracy using the animal model were documented in the literature
[5, 7, 8, 29]. The variation in h2 estimates over the time was due to the activation of various
genes responsible for egg production [39] and persistency [40]. Higher h2 estimates for body
weight (0.24–0.47), ASM (0.36), egg number (0.17), egg mass (0.16) and egg weight (0.32–
0.43) were observed in Mazandaran chicken [39] due to ignoring the maternal effects com-
pared to the present estimates. The lower estimates in the present study might be due to the
prolonged selection for higher egg mass, which reduced the variability in the population and
also due to the inclusion of additional sources of variance in the model. Higher magnitude of
h2 estimates was also reported for egg production in Horro chicken from Ethiopia [41] in com-
mercial layer line [42] and in Korean chicken [43].
The heritability estimated using the animal model was lesser as compared to the Henderson
variance component analysis model. Maternal effects account for only small portion (2–8%) of
the variance in chicken, but ignoring these effects results in biasness and over estimation of
genetic parameters [35, 36, 44] leading to inadequate inferences hampering the breeding goals
[6, 34, 45]. Similar to the findings of the present study, h2 estimates for growth and egg produc-
tion traits were reported in PD-1 [4]; in PB-2 [17] from India using the REML including the
maternal effects in the model. The precise and accurate h2estimates in the present study were
due to the inclusion of maternal effects in the model, which will aid the breeder in planning
the breeding program with reliable prediction.
PLOS ONE (co) variance components and breeding value of economic traits in Dahlem Red chicken
PLOS ONE | https://doi.org/10.1371/journal.pone.0247779 March 3, 2021 16 / 21
Genetic correlation plays a significant role in the success of the breeding experiment, as
selection for one trait improves the performance in other traits as a positive correlated
response, whereas negative association depresses the performance [7, 11]. In addition, ra, rc
continue to exist up to 20 weeks of age (Table 9) indicating the existence of prolonged mater-
nal effects as PD-3 line is a female line, contrary to the findings in other lines wherein the
maternal effects ceased at an early age [4, 17]. The factors like hatch conditions, egg size and
uterus have considerable influence on early body weight leading to the high effect of c, which
reduces or becomes negligible at later stages of life [4]. However, in this study, effect of c pro-
longed up to 40 weeks of age. The rg between growth traits (Body weight and Shank length)
was high in magnitude in PD-3 line in the present study, similar to the reports in PD-1 line [4]
in PB-2 broiler line [17]; in Mazandaran chicken [39]; in Thai native chicken [46].
The correlation (ra, rc and rp) between ASM and EP40 was significant with a high degree of
negative association in PD-3 line. A similar significant inverse relationship between ASM and
egg production in chicken was reported by many authors [4, 11, 17]. The correlation between
ASM and egg weight was positive as the birds matured late laid heavier eggs. The association
between ASM and BW20 was negative and was in the desirable direction as heavier birds
matured earlier. A similar association between ASM and egg weight; and ASM and BW20
were reported by many authors [11, 14]. The association (ra) between BW40 and EP40 was
negative (Table 10). The inverse relationship between body weight and egg production was an
established fact in chicken [7, 11, 28]. The EM40 had a direct positive association with EP40,
EW28 and EW40, while had an antagonistic relationship with ASM. The direct positive associ-
ation was justified as egg mass is the product of egg number and egg weight, and the higher
number of eggs with better egg weight resulted in higher egg mass. The selection for egg mass
maintains both egg number and egg weight at an optimum level, which is commonly practiced
in breeder lines [20]. The early matured bird recorded higher egg mass with an inverse rela-
tionship as these birds produced more number of eggs with optimum egg weight leading to
higher egg mass. The direction, magnitude and precision of correlation enable the breeder to
fix the favourable traits in selection for improvement of the traits simultaneously [4]. Multi
trait selection with adequate importance to each trait is the better option for optimal growth
and egg production in chicken as these traits have antagonistic relationships making it more
complex.
The average EBV of EM40, the primary trait of selection recorded a significant linear trend
over the generations indicating the positive selection response in the population with signifi-
cant improvement (Fig 3). The positive genetic trend was observed in BW6 and SL6 as corre-
lated responses to selection, though the selection was not practiced for growth traits in this
line. Similar observations of indirect response in correlated traits were reported in other
chicken lines [4, 17, 20]. The direct positive genetic trend for BW6 and SL6 was observed in
PD-6, a rural male parent line [47]. The EBV of ASM reduced linearly over the generations as
an indirect response to selection for egg mass. The EBV of EP 40 showed a linear increasing
trend with an average genetic gain of 1.87 eggs per generation (Fig 3), while the phenotypic
trend showed fluctuations (Fig 4). The positive genetic and phenotypic gains in the population
might be due to the effect of selection for egg mass, which improved both egg production and
egg weight. The EW40 showed a linear increasing trend with fluctuations over the generations
as selection for egg mass maintained the egg weight in the population. The EBV and the
genetic trend observed in all the production traits was due to the correlated response to selec-
tion for egg mass as the direct selection was not practiced for those traits.
The ΔF in the population was very low (0.007), which may be due to the ideal breeding
strategy followed in the PD-3 line, wherein close relatives were not included in the mating
plan. The number of sires and dams utilized and contributed was higher than those required
PLOS ONE (co) variance components and breeding value of economic traits in Dahlem Red chicken
PLOS ONE | https://doi.org/10.1371/journal.pone.0247779 March 3, 2021 17 / 21
for maintaining effective population size. The inbreeding coefficient of the population at the
end of the 7th generation was 0.019. The inbreeding was not set in PD-3 chicken or negligible
after 7 generations of selection. The delayed onset of inbreeding in pedigreed breeding popula-
tions similar to the present study was reported in pureline chicken [20, 47]. The PD-3 popula-
tion was in ideal condition with respect to genetic architecture after seven generations;
however, the inbreeding coefficient may increase in further generations of selection.
Conclusion
The EBV of primary and associated traits was positive with a linear trend in the desired direc-
tion indicating the efficacy of selection practiced in PD-3 line with negligible inbreeding over
the seven generations. Partitioning of variance into additive, maternal genetic, maternal
genetic permanent environmental and residual sources improved the precision of the BV and
genetic parameters. The accuracy in EBV and the genetic parameters aids in selecting the suit-
able breeding strategy for genetic improvement of PD-3 line. The study concluded that the
positive genetic gains with respect to economic traits in PD-3 line lead to improvement in ter-
minal crosses intended for backyard poultry farming.
Supporting information
S1 Material.
(PDF)
Acknowledgments
The authors are thankful to the Director, ICAR-Directorate of Poultry Research, Hyderabad
for his constant support and encouragement. The technical services provided by the farm and
hatchery staffs are duly acknowledged.
Author Contributions
Conceptualization: U. Rajkumar.
Data curation: L. Leslie Leo Prince, S. Haunshi.
Formal analysis: L. Leslie Leo Prince.
Investigation: S. Haunshi.
Methodology: U. Rajkumar, L. Leslie Leo Prince, K. S. Rajaravindra, S. Haunshi, M. Niranjan.
Project administration: R. N. Chatterjee.
Resources: R. N. Chatterjee.
Software: L. Leslie Leo Prince.
Supervision: U. Rajkumar, K. S. Rajaravindra, M. Niranjan.
Writing – original draft: U. Rajkumar.
Writing – review & editing: U. Rajkumar, K. S. Rajaravindra.
References1. Chatterjee RN, Rajkumar U. An overview of poultry production in India. Indian Journal of Animal Health,
2015; 54(2): 89–108.
PLOS ONE (co) variance components and breeding value of economic traits in Dahlem Red chicken
PLOS ONE | https://doi.org/10.1371/journal.pone.0247779 March 3, 2021 18 / 21
2. BAHS. Basic Animal Husbandry Statistics. Department of Animal Husbandry and Dairying. Ministry of
Fisheries, Animal Husbandry and Dairying, Government of India 2019.
3. Falconer DS, Mackay TFC. Introduction to Quantitative Genetics. Longman, Essex; 1996.
4. Rajkumar U, Prince LLL, Paswan C, Haunshi S, Chatterjee RN. Variance component analysis of growth
and production traits in Vanaraja male line chicken using animal model. Asian-Australasian Journal of
Animal Sciences. 2020; https://doi.org/10.5713/ajas.19.0826
5. Kruuk LEB, Hadfield JD. How to separate genetic and environmental causes of similarity between rela-
tives. Journal of Evolution Biology. 2007; 20: 1890–1903. https://doi.org/10.1111/j.1420-9101.2007.
01377.x PMID: 17714306
6. Grosso JL, Balieiro JC, JEler P, Ferraz JB, EMattos C, Filho TM. Comparison of different models to esti-
mate genetic parameters for carcass traits in a commercial broiler line. Genetic Molecular Research.
2010; 9: 908–918.
7. Mohammadi A, Naderi Y, Nabavi R, Jafari F. Determination of the best model for estimation of genetic
parameters on the Fars native chicken traits using Bayesian and REML methods. Genetica. 2018; 50:
431–447.
8. Ghorbani S, Kamali MA, Abbasi MA, Ghafouri-Kesbi F. Estimation of maternal effects on some eco-
nomic traits of north Iranian native fowls using different models. Journal of Agricultural Science Technol-
ogy. 2012; 14: 95–103.
9. Rajkumar U, Rajaravindra KS, Niranjan M, Reddy BLN, Bhattacharya TK, Chatterjee RN, et al. Evalua-
tion of Naked neck broiler genotypes under tropical environment. Indian Journal of Animal Sciences.
2010; 80: 463–467.
10. Rajkumar U, Sharma RP, Padhi MK, Rajaravindra KS, Reddy BLN, Niranjan M, et al. Genetic analysis
of juvenile growth and carcass traits in a full diallel mating in selected coloured broiler lines. Tropical Ani-
mal Health Production. 2011; 43: 1129–1136. https://doi.org/10.1007/s11250-011-9812-6 PMID:
21360012
11. Rajkumar U, Rajaravindra KS, Haunshi S, Niranjan M, Bhattacharya TK, Chatterjee RN. Genetic archi-
tecture of growth and production parametres in a laying cycle of 72 weeks in naked neck chickens.
Indian Journal of Animal Sciences. 2012; 82: 615–619.
12. Rajkumar U, Padhi MK, Haunshi S, Chatterjee RN. Genetic and phenotypic response in PD-1 (Vanaraja
Male line) line chicken under short term selection experiment. Indian Journal of Animal Sciences. 2016;
86:1287–1296.
13. Haunshi S, Shanmugam M, Padhi MK, Niranjan M, Rajkumar U, Reddy MR, et al. Evaluation of two
Indian native chicken breeds for reproduction traits and heritability of juvenile growth traits. Tropical Ani-
mal Health Production. 2012; 44 (5): 969–973. https://doi.org/10.1007/s11250-011-9994-y PMID:
22068634
14. Haunshi S, Padhi MK, Chatterjee RN, Bhattacharya TK, Rajaravindra KS. Genetic characterization of
layer germplasm evolved by AICRP on poultry breeding. Indian Journal of Animal Sciences. 2016; 86
(12): 1431–1435.
15. Kamali MA, Ghorbani SH, Sharbabak MM, Zamiri MJ. Heritability and genetic correlation of economic
traits in Iranian native fowl and estimated genetic trend and inbreeding coefficients. British Poultry Sci-
ence. 2007; 48: 443–448. https://doi.org/10.1080/00071660701505013 PMID: 17701497
16. Padhi MK, Chatterjee RN, Haunshi S, Rajkumar U, Bhattacharya TK, Bhanja SK. Evaluation of male
line of Vanaraja (PD1), Vanaraja and control broiler in respect to juvenile traits and genetic analysis of
juvenile traits inPD1. Indian Journal of Animal Sciences. 2015; 85: 991–995.
17. Prince LLL, Rajaravindra KS, Rajkumar U, Reddy BLN, Paswan C, Haunshi S, et al. Genetic analysis of
growth and egg production traits in synthetic coloured broiler female line using animal model. Tropical
Animal Health and Production. 2020; https://doi.org/10.1007/s11250-020-02340-4.
18. Nath M, Singh BP, Saxena VK, Singh RV. Analysis of crossbreeding parameters for juvenile body
weights in broiler chicken. Journal of Applied Animal Research. 2007; 32: 101–106.
19. Haunshi S, Reddy BLN, Niranjan M, Rajkumar U, Padhi MK, Raja KSR, et al. 2015. Status of genetic
resources of chicken evolved at ICAR, DPR, Hyderabad. 2015; Pp 1–101.
20. Rajkumar U, Niranjan M, Prince LLL, Paswan C, Haunshi S, Reddy BLN. Genetic evaluation of growth
and production performance and short term selection response for egg mass in Gramapriya female
line. Indian Journal of Animal Sciences. 2020, 90 (3): 401–406.
21. Meyer K. WOMBAT: A tool for mixed model analyses in quantitative genetics by restricted maximum
likelihood (REML). Journal of Zhejiang University Science B. 2007; 8: 815–821. https://doi.org/10.
1631/jzus.2007.B0815 PMID: 17973343
22. SSPS. SPSS for Windows, Brief Guide, Version 12.0. SPSS Inc. Chicago, IL. 2004.
PLOS ONE (co) variance components and breeding value of economic traits in Dahlem Red chicken
PLOS ONE | https://doi.org/10.1371/journal.pone.0247779 March 3, 2021 19 / 21
23. Willham RL. The role of maternal effects in animal breeding, III. Biometrical aspects of maternal effects
in animals. Journal of Animal Sciences. 1972; 35: 1288–1293.
24. Akaike H. A new look at the statistical model identification. IEEE Trans. Automat. Control. 1974, 19:
716–723.
25. Wilson AJ, Reale D, Clements MN, Morrissey MB, Postma E, Walling CA, et al. An ecologist’s guide to
the animal model. Journal of Animal Ecology. 2010; 79: 13–26. https://doi.org/10.1111/j.1365-2656.
2009.01639.x PMID: 20409158
26. Snedecor GW, Cochran WG. Statistical Methods. 8th Edn. Iowa State Press, Iowa, USA. 1989.
27. Reddy BLN, Chatterjee RN, Rajkumar U, Niranjan M, Rajaravindra KS, Bhattacharya TK. Genetic eval-
uation of short-term selection in synthetic coloured broiler male and female lines-Direct and correlated
responses. Indian Journal of Animal Sciences. 2013; 83: 285–289.
28. Niknafs S, Abdi H, Fatemi SA, Zandi MB, Baneh H. Genetic trend and inbreeding coefficients effects for
growth and reproductive traits in Mazandaran indigenous chicken. Journal of Biology. 2013; 3: 25–31.
29. Jasouri M, Zamani P, Alijani S. Dominance genetic and maternal effects for genetic evaluation of egg
production traits in dual purpose chicken. British Poultry Science. 2017; 58: 498–505. https://doi.org/
10.1080/00071668.2017.1336748 PMID: 28556686
30. Mebratie W, Madsen P, Hawken R, Jensen J. Multi trait estimation of genetic parameters for body
weight in a commercial broiler chicken population. Livestock Science. 2018; 217: 15–18.
31. Prado-Goonzalez E, Ramirez–Avila I, Segura-Correa. Genetic parameters for body weights of Croele
chickens from southeastern Mexico using an animal model. Livestock Research and Rural Develop-
ment. 2003; 15: 59–64.
32. Meyer K. Variance components due to direct and maternal effects for growth traits of Australian beef
cattle. Livestock Production Science, 1992; 31: 179–204.
33. Misztal I, Besbes B. Estimation of parental dominance and full sib permanent environmental variance in
laying hens. J. Anim. Sci. 2000; 71: 421–426.
34. Yousefi AZ, Alijani S, Rafa SA, Abbasi MA, Daghigh HK. Estimation of maternal effects on the north Ira-
nian native chicken traits using Bayesian and REML methods. Slovak Journal of Animal Science. 2013;
46: 52–60.
35. Le Bihan-Duval E, Mignon-Grasteau S, Millet N, Beamont C. Genetic analysis of a selection experiment
on increased body weight and breast muscle weight as well as on limited abdominal fat weight. British
Poultry Science.1998; 39:346–353. https://doi.org/10.1080/00071669888881 PMID: 9693814
36. Norris D, Ngambi J. Genetic parameter estimates for body weights in local Venda chicken. Tropical Ani-
mal Health Production. 2006; 38: 605–609. https://doi.org/10.1007/s11250-006-4420-6 PMID:
17265777
37. Engstrom G, Liljedahl LE, Wilhelmson M, Johansson K. The pattern of genetic and environmental varia-
tion in relation to ageing in laying hens. Genetic Selection Evolution. 1992; 24: 265–275.
38. Ledur MC, Liljedahl LE, McMillan I, Asselstine L, Fairfull RW. Genetic effects of aging on fitness and
non fitness traits in laying hens housed three per cage, Journal of Poultry Science. 2003; 82: 1223–
1234. https://doi.org/10.1093/ps/82.8.1223 PMID: 12943292
39. Niknafs S, Javaremi AN, Yeganch HM, Fatemi SA. Estimation of genetic parameters for body weight
and production traits in Mazandaran native chicken. Tropical Animal Health Production. 2012; 44:
1437–1443. https://doi.org/10.1007/s11250-012-0084-6 PMID: 22286525
40. Wolc A, Szwaczkowski K. Estimation of genetic parameters for monthly egg production in laying hens
based on random regression models. Journal of Applied Genetics. 2009; 50: 41–46. https://doi.org/10.
1007/BF03195650 PMID: 19193981
41. Dana N, Vander Waaij E, Van Arendonk J. Genetic and phenotypic parameter estimates for body
weights and egg production in Horro chicken of Ethiopia. Tropical Animal Health and Production. 201;
43: 21–28. https://doi.org/10.1007/s11250-010-9649-4 PMID: 20625931
42. Wolc A, Stricker C, Arango J, Setta P, Fulton JE, O’Sullivan NP, et al. Breeding value prediction for pro-
duction traits in layer chickens using pedigree or genomic relationships in a reduced animal model.
Genetic Selection Evolution. 2011; 435: https://doi.org/10.1186/1297-9686-43-5 PMID: 21255418
43. Sang BD, Kong HS, Kim HK, Cho CH, Kim D, Cho YM, et al. Estimation of genetic parameters for eco-
nomic traits in Korean native chickens. Asian-Australasian Journal of Animal Sciences. 2006; 19: 319–
323.
44. Rahaman A, Hafezian H, Rahimi GH, Farhadi A, Baneh H. Inbreeding depression for economically
important traits of Mazandaran native fowls. British Poultry Science. 2015; 56: 22–29. https://doi.org/
10.1080/00071668.2014.989490 PMID: 25410984
PLOS ONE (co) variance components and breeding value of economic traits in Dahlem Red chicken
PLOS ONE | https://doi.org/10.1371/journal.pone.0247779 March 3, 2021 20 / 21
45. Clement V, Bibe B, Verrier E, Elsen JM, Manfredi E, Bouix J, et al. Simulation analysis to test the influ-
ence of model adequacy and data structure on the estimation of genetic parameters for traits with direct
and maternal effects. Genetic Selection Evolution. 2001; 33: 369–395. https://doi.org/10.1186/1297-
9686-33-4-369 PMID: 11563370
46. Tongsiri S, Jeyaruben MG, Hermesch S, van der Werf JHJ, L Li Chormai T. Genetic parameters and
inbreeding effects for production traits in Thai native chickens. Asian-Australasian Journal of Animal
Sciences. 2019; 32: 930–938. https://doi.org/10.5713/ajas.18.0690 PMID: 30744369
47. Rajkmuar U, Prince LLL, Haunshi S, Paswan C, Chatterjee RN. Estimation of breeding value, genetic
parameters and maternal effects of economic traits in rural male parent line chicken using pedigree rela-
tionships in an animal model. The Journal of Animal Breeding and Genetics. 2020; https://doi.org/10.
1111/jbg.12531 PMID: 33354802
PLOS ONE (co) variance components and breeding value of economic traits in Dahlem Red chicken
PLOS ONE | https://doi.org/10.1371/journal.pone.0247779 March 3, 2021 21 / 21