analysis of cake build-up and removal in cross-flow microfiltration of caco3 suspensions under...
TRANSCRIPT

Journal of Membrane Science 175 (2000) 267–283
Analysis of cake build-up and removal in cross-flow microfiltration ofCaCO3 suspensions under varying conditions
A. Ould-Dris, M.Y. Jaffrin∗,1, D. Si-Hassen, Y. NeggazDepartment of Biological Engineering, University of Technology of Compiègne, U.M.R. 6600, BP 20529, 60205 Compiègne, France
Received 24 November 1999; received in revised form 28 March 2000; accepted 10 April 2000
Abstract
This paper investigates the effect of cyclic variations of transmembrane pressure (TMP), velocity and concentration on theparticle cake formed on an organic membrane during the microfiltration of CaCO3 suspension. The steady-state permeateflux was measured in a series of tests in which the TMP was varied between 0.25 and 3 bar, the velocity was changed between0.25 and 2 m/s and the particle concentration was successively raised and diluted between 1 and 700 g/l. In these tests, thepermeate flux was observed to exhibit an important hysteresis due to the irreversibility of the cake formed. When the changein operating conditions resulted in cake growth (TMP or concentration increase, velocity decrease), the permeate flux wasfound to be governed simultaneously by the resistance of the cake layer and concentration polarization with shear-induceddiffusion. When the TMP or concentration were reduced, the cake thickness remained constant because of particle cohesion.When the velocity was increased, the cake thickness also remained constant until a critical velocity corresponding to theerosion shear stress for the cake was reached. Above this critical velocity, the cake was progressively eroded, starting fromthe membrane outlet, and completely removed if the velocity became high enough. This critical velocity decreased when theconcentration rose because the suspension viscosity and density increased. The erosion shear stress was found to be a linearfunction of the normal stress on the cake surface. The main conclusion is that, when a cake has been formed, the permeateflux is governed not only by the present operating conditions but also by the previous ones. © 2000 Elsevier Science B.V. Allrights reserved.
Keywords:Cake formation; Cake removal; Microfiltration of mineral suspensions; Concentration polarization
1. Introduction
Cross-flow microfiltration of particulate suspen-sions is widely used for waste water treatment, clar-ification of beverages, biotechnological applicationsetc. In most instances, when transmembrane pressure(TMP) is sufficiently high, a particle cake forms on the
∗ Corresponding author. Tel.:+33-344-23-4398;fax: +33-344-20-4813.E-mail address:[email protected] (M.Y. Jaffrin)
1 Member of Institut Universitaire de France.
membrane and limits the permeate flux. Cake removalby chemical cleaning requires stoppage of the processand isolation of the membrane from the processedfluid. This has stimulated interest for hydrodynamicmethods of fouling control and cake removal by back-flushing [1], intermittent filtration [2,3] and pulsatileflow [4–6]. The stability or irreversibility of the cakeunder changing TMP and shear stress conditions isa crucial factor for the efficiency of these methods.Therefore, we propose in this study, which is an exten-sion of an earlier one [7], to investigate experimentallythe stability of particulate cakes formed from calcium
0376-7388/00/$ – see front matter © 2000 Elsevier Science B.V. All rights reserved.PII: S0376-7388(00)00411-7

268 A. Ould-Dris et al. / Journal of Membrane Science 175 (2000) 267–283
carbonate on organic membranes when the TMP, fluidvelocity and particle concentration are varied accord-ing to a cycle. Cake irreversibility, partial or complete,will be revealed by permeate flux hysteresis. We willalso try to interpret the observed permeate flux vari-ations by combining a model of cake formation con-trolled by hydrodynamic diffusion published recently[8] with a model of cake erosion by shear stress.
1.1. Previous models
Most published investigations on the cross-flow fil-tration of particulate suspensions have been concernedwith prediction of the steady-state permeate flux un-der constant pressure and velocity conditions. Mech-anisms leading to steady state have been postulatedto be either shear-induced diffusion [8–11], axial con-vection [12,13] or the instability of particles locatedon the top layer of the cake resulting in their transporttowards the outlet [14,15,17,20].
Vassilieff et al. [12] postulated the formation ofclose packed cake on the membrane, which, depend-ing upon the shear stress magnitude, can be stagnantor flowing. If the shear stress exerted by the fluid onthe cake is lower than its yield stress, the cake remainsstagnant and its thickness grows, resulting in an in-crease in shear stress on its surface, due to reduced lu-men diameter. When the shear stress exceeds the cakeyield stress, the upper layer of the cake starts flowingtangentially and the cake stops growing, permittingthe permeate flux to reach a steady state. This flow-ing cake has a lower specific cake resistance than thestagnant one. The authors tested their concept usingkaolinite in water [12] and bentonite suspensions [13]and obtained a value of the steady-state shear stresson the cake surface in agreement with published mea-surements of the yield stress of bentonite.
Blake et al. [14] tried to predict the steady-statepermeate flux using a force balance model based on thesliding motion of particles on the cake surface. Usingmonodisperse latex particle suspensions of 0.55 and1.8mm, they suggested a linear relationship betweenpermeate fluxJf and shear stressτ on the surface ofthe cake:
Jf = k1dpτ + k0 (1)
wheredp is the particle diameter, andk1 and k0 are
constants characterizing, respectively, the friction ex-perienced by a particle sliding on the surface and theinterparticle forces. They confirmed experimentallythe linear dependence of permeate flux on shear stress,but the coefficientk1 for larger particles was twice thevalue for smaller particles.
Holdich et al. [15] also observed a linear relation-ship for the-pseudo steady-state permeate flux withshear stress in the cross-flow filtration of magnesiumhydroxide slurries ranging from 13 to 24% in vol-ume concentration. The agreement was better whenthe cake thickness was taken into account for the de-termination of the shear stress. Since their suspensionwas polydisperse, they could not check the effect ofparticle diameter on the coefficients of Eq. (1).
Several authors [16,17] have suggested the follow-ing condition necessary for a deposited particle to slidealong the cake surface:
Ft ≥ Fnk (2)
whereFt andFn denote the tangential and normal dragforces exerted, respectively, by the tangential velocityVt and the permeate fluxJf on the particle andk isthe friction factor on the upper surface of the cake.Expressing the drag forces with Stokes’ law withoutcorrection for the presence of the cake, Ebner [16] hasshown that Eq. (2) reduces to
Vt ≥ kJf (3)
Lu and Ju [17] derived a relationship for thesteady-state permeate flux by considering the momentof all hydrodynamic forces acting on a spherical par-ticle with respect to its contact point with the cakesurface. Stokes’ law was used to calculate the normaland tangential drag forces, but with correction factorsCp andCt to account for the presence of the cake. Thenormal drag force due to permeate flux is given by
Fn = 3πµsdpJf Cp (4)
whereCp has been given by Goren [18] as a functionof cake thickness and resistance.
The tangential force is estimated by calculatingVtat distancedp/2 with the wall shear rate:
Ft = 3
2πµsd
2pγwCt (5)
with Ct=1.7 as suggested by O’Neil [19].

A. Ould-Dris et al. / Journal of Membrane Science 175 (2000) 267–283 269
The model predicts that the maximum diameter ofdeposited particles gradually decreases with the decayof permeate flux.
This approach was extended by Chang et al. [20]to include lateral lift forces, Van der Waals and dou-ble layer repulsion forces, which are important forsubmicronic particles and tested with microfiltrationof dilute suspensions of monodisperse polystyrene la-tex particles 0.3, 1 and 3mm in size. They found thatthe quasi-steady permeate flux increased linearly withshear rate for the smaller particles and with a largerexponent for the 3mm particles, in qualitative agree-ment with results of [14].
Shluep and Widmer [21] have adapted a modelbased on volume balance deposited particles to de-scribe transient effects during the cake build-up period.They assumed that the return particle flux to the bulksuspension is proportional to the cross-flow velocitycalculated at a particle radius from the cake surfaceusing the wall shear rate. They showed that the steadycake thickness was proportional to1pc/τ where1pcis the pressure drop across the cake. An excellent re-view of various models of cake formation has beengiven by Belfort et al. [22].
The present work differs from the previously pre-sented models in the sense that we will use thestability condition of the top monolayer of the par-ticles, not for predicting cake formation, but ratherfor predicting its removal when the velocity is raisedor when the TMP or particle concentration aredecreased.
2. Theoretical background
Our concentration polarization model with shear-induced diffusion starts by predicting the localsteady-state permeate flux as a function of the phys-ical parameters, particle diameter, concentration,TMP and entering velocity. The local flux is thenintegrated over the membrane length to provide thesurface-averaged permeate flux which is the measur-able parameter. More details can be found in [8].
Following Romero and Davis [10], we introduce acritical lengthxcr which is the distance from the inletbeyond which the cake is formed.
For x≤xcr, the cake has not yet formed andJf (x) iscalculated from Darcy’s law:
Jf = TMP
µ0Rm(6)
For x≥xcr, the cake is formed andJf (x) is calculatedwith the following equation:
Jf (x) = 0.052γw(x)
(a4
d
x
)1/3
lnφwmax
φ0(7)
wheread is the diffusive average particle diameter forpolydisperse particles. The best fit was obtained in [8]for ad=8.2mm, while the Sauter mean diameter of thesuspension is 4.65mm.
The critical length is calculated by equating the lo-cal fluxes given from the concentration polarizationmodel and from Darcy’s law with a cake-free mem-brane. The TMP is assumed constant along the 5 cmmembrane length since the pressure drop is small:
TMP
µ0Rm= 0.052γw0
(a4
d
xcr
)1/3
lnφwmax
φ0(8)
The critical length is obtained as
xcr =(
0.052µ0Rm
TMPγw0a
4/3d ln
φwmax
φ0
)3
(9)
The bulk volumetric fraction is related to the CaCO3densityρs and its concentrationC0 by
φ0 = C0/ρs
1 + (C0/ρs)(10)
andφwmax = 1−εw = 0.622 is the particle volumetricfraction on the cake surface which is constant sine thecake surface porosityεw is constant. The particle frac-tion was obtained from permeametry measurements[7], using a small column with limited particle massand suspending volume to reduce particle segregation.
Assuming constant flow rate along the short mem-brane, the shear rateγ w(x) can be calculated from
γw(x) = γw0
(R
R − e(x)
)3
(11)
But since the local cake thicknesse(x) is not knowna priori, an additional equation, Darcy’s law, must beused to calculate the local flux beyondxcr:
Jf (x) = TMP
µ0(Rm + Rc(x))(12)
270 A. Ould-Dris et al. / Journal of Membrane Science 175 (2000) 267–283
where the cake resistance is given by the Kozeny–Carman equation:
Rc(x) = (1 − ε(x))r(x)ρsR lnR
R − e(x)(13)
whereε(x) is the cake porosity averaged over its thick-ness and has been measured by permeametry [7]. Thespecific resistance is defined by
r(x) = 1801 − ε(x)
ε(x)3
1
ρs(ϕd̄c)2(14)
whereϕ is the particle sphericity estimated from pho-tographs to be 0.82 for CaCO3 particles, anddc is thecake particle average diameter which was found bygranulometry to be less than the Sauter mean diameterof the suspension. A value of 0.8mm for dc has beenused in our calculations of the theoretical flux with thepresent model. The results as a function of the trans-verse pressure gradient inside the cake are representedby the following equation [8]:
ε(x) = 2.985εw
(TMP − µRmJf (x)
e(x)
)−0.095
(15)
whereεw=0.378.The local permeate flux was calculated by solving
Eqs. (7) and (11)–(15). The surface-averaged fluxJ̄fLis then computed by integration as
J̄fL = 1
L
[∫ xcr
0
TMP
µRmdx + 0.052 ln
φwmax
φ0a
4/3d
×∫ L
xcr
γw(x)1
x1/3dx
](16)
3. Materials and methods
Tests have been carried out on a single 5 cm longpolysulfone membrane tube of 2.7 mm inner di-ameter with an average pore diameter of 0.1mm.The membrane resistanceRm was measured to be1.95×1012 m−1. The resistance was almost com-pletely restored after each test by circulating pure wa-ter in the module at about 2 m/s. A CaCO3 suspensionof 4.65mm Sauter mean diameter prepared form purewater (pH=7) has been chosen to get a 100% particlerejection. Its viscosity is 1.9×10⁻³ Pa s at a concen-tration of 100 g/l and a temperature of 20◦C and its
diameter distribution has been reported in a previouspaper [8]. The short membrane used minimizes vari-ations of the TMP, flow rate and concentration alongthe membrane. The membrane was fed by a tube ofthe same inner diameter with a special connector toavoid entry effects.
The experimental setup is shown in Fig. 1. Testswere carried out under cyclical variations of the TMP,concentration or velocity. The test suspension in thestirred reservoir was circulated by a peristaltic pump(Masterflex) through the membrane. A second peri-staltic pump was used to continuously add pure waterat a controlled flow rate in order to perform testsunder a decreasing concentration. The concentrationwas either maintained constant by recycling the per-meate flow to the reservoir or increased by discardingthe permeate flux. All presented results were recordedunder steady state that is assumed to be reached whenthe continuously measured permeate flux is steady.The feed flow to the module was measured by anelectromagnetic flow meter (Spectramed, Gould Elec-tronics, USA) and the permeate flux by an electronicscale connected to a microcomputer. The inlet, outlet,and permeate pressures were measured by transduc-ers (Validyne Eng. Corp., USA) via a data acquisitionsystem. Membrane resistance was measured usingpure water at low velocity and cake resistance was cal-culated from flux, permeate viscosity and TMP usingDarcy’s law. Tests were performed at 20◦C. The flowwas generally laminar except at large velocity andlow concentration. The Reynolds number at a concen-tration of 100 g/l and a velocity of 1 m/s was 1420.
4. Results and discussion
We now present a series of measurements of perme-ate flux taken under equilibrium conditions when theTMP, the CaCO3 concentration and the fluid velocitywere varied successively according to a cycle with thesame final and initial conditions. After each parameterchange, ample time, up to 1 h, was given to allow thepermeate flux to get stabilized, so that each test rep-resented 8–10 h of filtration time including membranecleaning. The experimental data will be compared withthe concentration polarization model presented above.Since the permeate flux generally presents a hysteresisunder a cyclical variation due to partial irreversibility

A. Ould-Dris et al. / Journal of Membrane Science 175 (2000) 267–283 271
Fig. 1. Experimental microfiltration setup. P1, P2 and Pf denote pressure transducers and Q the flowmeter.
of fouling or cake structure, the theoretical model,which ignores this irreversibility, can only be expectedto fit half of the experimental cycle. The rest of thecycle will be interpreted by using another concept.
4.1. Permeate flux variations under a TMP cycle
In these experiments, the CaCO3 concentration andthe velocity were kept constant and the TMP was var-ied in steps from 0.25 to 2.5 bar and then back to0.25 bar. Fig. 2 represents the data relative to a con-centration of 100 g/l and a velocity of 0.8 m/s. We havealso indicated on the graph the pure water flux.
The starting point is denoted as A and the finalone as C. Data at different velocities follow the samepattern. Several interesting observations can be made.First, fouling is completely absent until the TMPreaches 0.9 bar since the permeate flux coincides withthe one for pure water. Fouling increases progres-sively, causing the flux to level off until the highestpressure is reached at point B. Secondly, when theTMP is lowered, the permeate flux decays linearlywith pressure, indicating that the fouling layer resis-tance remains constant and equal to its value at point
B. This, in turn, means that the cake thickness andstructure must remain constant when the pressure isdecreased. This conclusion is supported by previouspermeametry experiments [7] which showed that theCaCO3 cake consolidation is irreversible, meaningthat its particles remain in a consolidated state whenthe pressure is lowered. As a result, the permeate fluxvariation presents a hysteresis and remains below thecorresponding flux at the same pressure during thefirst part of the cycle. The calculation of permeate fluxusing the concentration polarization model describedpreviously, also shown in Fig. 2, closely follows theexperimental data when the TMP is increased. Sincethe actual permeate flux is reduced in the second part(B–C) of the cycle while remaining in the steadystate, it follows that the return particle flux to the bulksuspension must be reduced in the same proportionas the volume flux. If the return flux is still governedby shear-induced diffusion, this must imply that theparticle concentration at the edge of the cake must belower than that during the first part of the cycle, andtherefore, lower than the cake concentration.
Variation in the cake resistanceRc for the cyclegiven in Fig. 2, illustrated in Fig. 3, confirms the

272 A. Ould-Dris et al. / Journal of Membrane Science 175 (2000) 267–283
Fig. 2. Variation in experimental (Jf measured), and theoretical (Jth) permeate fluxes under a cyclical variation in TMP at constant velocityand concentration.
absence of fouling from the start of the cycle until aTMP of 0.9 bar is reached.
After the cake resistance has reached its maximumat the highest pressure (point B), it remains constantwhen the TMP is decreased until point C. Thus, themean permeate flux during this part (B–C) of the cyclemay be expressed as
J̄f = TMP
µ0(Rm + R̄cmax)(17)
where R̄cmax is the maximum cake resistance atpoint B.
4.2. Permeate flux variation under a concentrationcycle
Fig. 4 represents the variation in permeate flux withconcentration at a constant velocity of 0.2 m/s and aconstant TMP of 1 bar. This concentration process wascarried out in two stages, from 20 to 220 g/l first andthen from 350 to 700 g/l.
The permeate flux decays rapidly at low con-centration and more slowly at concentrations above200 g/l until point b. When the concentration is de-creased by feeding the tank with water, the permeateflux remains constant until the initial concentrationof 20 g/l is reached. It is interesting to note thatthe reduction in concentration leads to the samecake irreversibility as the reduction in TMP. This isprobably due to cohesive forces acting on CaCO3particles and the cake can only be eroded if theshear stress exceeds a certain critical value and notby a mere reduction in concentration gradient or inTMP.
Attempts to fit the experimental data with ourconcentration polarization model (Fig. 4) were notas successful as for the TMP cycle. The calculatedpermeate flux drops below the measured one whenthe concentration exceeds 200 g/l. A possible expla-nation may be that our model underestimates theshear-induced diffusivity at high concentration whenthe fluid ceases to be Newtonian.

A. Ould-Dris et al. / Journal of Membrane Science 175 (2000) 267–283 273
Fig. 3. Cake resistance variation under the cyclical TMP variation given in Fig. 2.
The variation in cake resistance, plotted in Fig. 5,confirms that it rises rapidly up to a concentration of60 g/l, then continues to rise at a lower and constantrate up to the maximum concentration. This cake re-sistance is higher than that for the previous TMP cy-cle because of lower velocity. Since the permeate fluxand TMP are constant during the dilution phase, thecake resistance is of course constant and equal to itsmaximum value. The apparent discontinuity betweenconcentrations of 250 and 350 g/l is due to the transi-tion between the two steps of the experiment.
4.3. Permeate flux variation under a velocity cycle
The measured permeate flux under a velocity cyclefrom 0.3 to 1.7 m/s at a fixed concentration of 100 g/land a TMP of 1 bar is illustrated in Fig. 6. The filtrationis first carried out at 0.3 m/s during which a relativelythick cake is formed since the velocity is low. Whena steady state is reached (point A′), the velocity is in-creased in steps, waiting for the new steady state tobe reached before raising the velocity again. It can be
observed that, below a velocity of 1.1 m/s (point B′),the flux remains constant and equal to 3.3×10⁻⁵ m/s.Above this velocity, which must correspond to an ero-sion shear stress, the permeate flux increases rapidlyuntil point C′ (V=1.75 m/s) which is close to the purewater flux. When the velocity is decreased again, theflux remains constant until point D′ (V=0.75 m/s) be-fore returning to the initial state (point A′). It is in-teresting to note that the erosion velocity at which thecake starts getting eroded (1.1 m/s) is higher than thevelocity at which the cake starts to form (0.83 m/s)when the velocity is reduced. It is also interesting tocompare the variation in cake resistance with velocityplotted in Fig. 7 with that during a TMP cycle given inFig. 3 since the concentration was the same. For a TMPof 1 bar and a velocity of 0.8 m/s, the cake resistancewas, respectively, 0 and 1.4×10¹² m−1 during the twophases of the TMP cycles and 1011 and 1.8×10¹² m−1
for the corresponding phases of the velocity cycle. Thedifferences are not significant, confirming the repro-ducibility of the experiments. The calculated flux, alsorepresented in Fig. 6, is close to the measured one in

274 A. Ould-Dris et al. / Journal of Membrane Science 175 (2000) 267–283
Fig. 4. Variation in experimental and theoretical permeate fluxes under a cyclical variation in concentration at constant TMP and velocity.
the second part of the cycle when the velocity is re-duced (C′–D′–A′). During the part C′–D′, the modelpredicts that no cake is formed on the membrane, andas a result, it slightly overestimates the permeate fluxby giving the pure water flux.
We represent in Fig. 8 three velocity cycles per-formed successively at concentrations of 100, 80 and60 g/l. After the first cycle performed at a constantconcentration of 100 g/l, the concentration is reducedto 80 g/l by addition of pure water to the reservoir andanother cycle is started with the same initial condi-tions as those in the first one. The same procedure isrepeated for the cycle of 60 g/l. This dilution does notmodify the cake structure and thickness. By changingthe concentration, and therefore, the fluid density andviscosity, it is thus possible to modify the shear stressat the same velocity and to verify whether the shearstress rather the velocity is the governing parameter.
It can be observed in Fig. 8 that the threshold veloc-ity at which the permeate flux starts to rise increaseswith decreasing concentration. This phenomenon may
be interpreted by assuming that the permeate fluxstarts to increase when the shear stress on the cakeexceeds the erosion shear stress. Since the suspensionviscosity and density decrease when the concentrationis reduced, the velocity must be increased in order toobtain the same critical shear stress. As a result, whenthe permeate flux rises (part B′–C′ of the cycle), it ishigher at the same velocity when the concentrationis higher. This unexpected result is due to the factthat, when the velocity is increased, the top layer ofthe cake is eroded sooner at larger concentrations.The maximum permeate flux at each concentration isfound to be the same and close to the pure water flux.
4.4. Determination of cake erosion stress withincreasing velocity
4.4.1. Cake thickness profilesIn order to predict the rise in permeate flux when the
velocity increases from B′ to C′, we must calculate thevariation in cake thickness along the membrane and

A. Ould-Dris et al. / Journal of Membrane Science 175 (2000) 267–283 275
Fig. 5. Cake resistance variation under the cyclical concentration variation given in Fig. 4.
Fig. 6. Variation in experimental and theoretical permeate fluxes under a cyclical variation in velocity at constant TMP and concentration.

276 A. Ould-Dris et al. / Journal of Membrane Science 175 (2000) 267–283
Fig. 7. Cake resistance variation under the cyclical velocity variation given in Fig. 6 at a concentration of 100 g/l.
Fig. 8. Measured permeate flux variation under a cyclical variation in velocity at different concentrations.

A. Ould-Dris et al. / Journal of Membrane Science 175 (2000) 267–283 277
Fig. 9. Variation in cake thickness profiles when the velocity is increased over the threshold velocityVB.
its diminution when the velocity is raised. The initialcake thicknesse0(x) at point A′ is calculated as in [7]by solving the system of Eqs. (7), (11) and (13)–(15)for five unknownsJf (x), γ w(x), e(x), r(x) andε(x) asis represented in Fig. 9. Since the cake thickness is thesame at points A′ and B′ of the cycle, the curvee0(x)also describes the initial thickness profile at point B′just before the permeate flux starts to rise. The perme-ate flux rises because the cake is progressively eroded,starting from the membrane outlet as the velocity in-creases. We assume that erosion occurs at a criticalshear stress. Thus, for each valueV1 of the velocityaboveVB (velocity at point B′, equal to 1.1 m/s), thecake thickness stabilizes at a value such that the shearstress on the cake surface is equal to the critical value.The cake thickness remains constant downstream of anabscissax1 such thate0(x1)=e1 since it must be sub-mitted to the same shear stress. Therefore, as shownin Fig. 9, the cake thickness profile is given by
x < x1 e = e0(x) (18)
x ≥ x1 e = e0(x1) (19)
The value ofx1 and the eroded cake thickness are cal-culated by equating the theoretical mean flux with themeasured one. The theoretical mean flux is calculatedby
J̄fL = 1
L
[∫ x1
0Jf 1(x) dx +
∫ L
x1
Jf 2(x) dx
](20)
where
Jf 1(x) = TMP
µ0(Rm + (1 − ε(x))r(x)ρsR ln(R/(R − e0(x)))
(21a)
Jf2(x) = TMP
µ0(Rm + (1 − ε(x))r(x)ρsR ln(R/(R − e0(x1)))
(21b)
whereε(x) andr(x) are given by Eqs. (15) and (16)with the appropriate cake thickness. The cake thick-ness profiles at each velocity measurement of the partB′–C′ of Fig. 7 for a concentration of 100 g/l are plot-ted in Fig. 9. At the highest velocity of 1.72 m/s, the
278 A. Ould-Dris et al. / Journal of Membrane Science 175 (2000) 267–283
cake is eroded along most of its length and its thick-ness is reduced from 35mm at point B′ to about 1mm.Similar cake thickness profiles were calculated in thesame manner for the other concentrations.
4.4.2. Calculation of the erosion shear stressWe have defined the erosion shear stress as the
shear stress under which the top layer of the cake getseroded. This shear stress can be calculated for eachpair of inlet velocity and cake thickness data by
τwl(x) = 4µsVR2
(R − e(x))3(22)
in the laminar flow regime (Poiseuille flow), whereµsis the suspension viscosity calculated using an empir-ical equation from Leighton and Acrivos [23]:
µs = µ0
[1 + 1.5φ
1 − (φ/0.58)
]2
(23)
In the turbulent regime, the shear stress is given by
τwt(x) = ρV 2fR4
2(R − e(x))4(24)
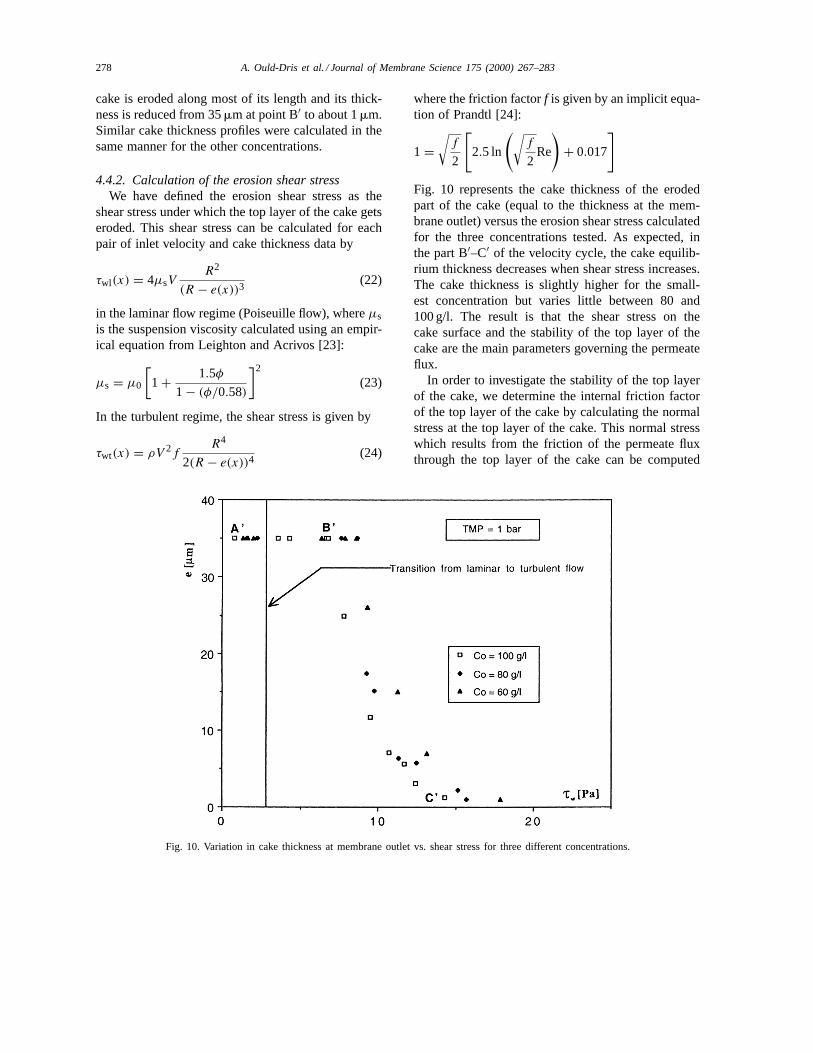
Fig. 10. Variation in cake thickness at membrane outlet vs. shear stress for three different concentrations.
where the friction factorf is given by an implicit equa-tion of Prandtl [24]:
1 =√
f
2
[2.5 ln
(√f
2Re
)+ 0.017
]
Fig. 10 represents the cake thickness of the erodedpart of the cake (equal to the thickness at the mem-brane outlet) versus the erosion shear stress calculatedfor the three concentrations tested. As expected, inthe part B′–C′ of the velocity cycle, the cake equilib-rium thickness decreases when shear stress increases.The cake thickness is slightly higher for the small-est concentration but varies little between 80 and100 g/l. The result is that the shear stress on thecake surface and the stability of the top layer of thecake are the main parameters governing the permeateflux.
In order to investigate the stability of the top layerof the cake, we determine the internal friction factorof the top layer of the cake by calculating the normalstress at the top layer of the cake. This normal stresswhich results from the friction of the permeate fluxthrough the top layer of the cake can be computed

A. Ould-Dris et al. / Journal of Membrane Science 175 (2000) 267–283 279
Fig. 11. Variation in the erosion shear stress with the normal stress at the top particle monolayer.
from the Kozeny–Carman equation as
N = 1PN =∣∣∣∣∂p∂r
∣∣∣∣R−e
dc = 180µ(1 − εw)2
ε3w
× 1
(ϕd̄c)2Jf (x)
R
R − e(x)d̄c (25)
where the top monolayer thickness is assumed to beequal to the mean cake particle diameterdc chosen tobe 0.8mm.
The erosion shear stress calculated from Eqs. (22)–(24) is plotted versus the normal one calculated fromEq. (25) in Fig. 11 for the three concentrations. Thedata points follow a linear regression according to theCoulomb criterion [25]:
τe = k1PN + c (26a)
where k=0.105 is the internal friction factor andc=2.66 Pa is the cohesion. The criterion for cakeerosion can be expressed as
τw ≥ τe (26b)
Both factorsk and c depend upon the nature of theparticles and the degree of consolidation of the layer.This regression line represents the limit of stability. Inorder to erode the cake, the shear stress exerted on thetop layer of the cake must be equal or superior to theerosion stress at the corresponding normal pressuregradient on the cake surface.
The observations of cake structure irreversibil-ity occurring with TMP and concentration cyclesof Figs. 2 and 4 can be interpreted in terms of thisstability criterion. Fig. 12 represents the relation be-tween the shear stress for a concentration of 100 g/ltogether with the stability limit of Fig. 11. The TMP,concentration and velocity cycles are identified, re-spectively, by letters A–B–C, a–b–c and A′–B′–C′–D′.
It is seen that the TMP and concentration cycleslie entirely in the stable domain below the stabilitylimit, which explains the irreversibility of cake struc-ture during these cycles. On the contrary, the partB–C of the velocity cycle coincides with the stability

280 A. Ould-Dris et al. / Journal of Membrane Science 175 (2000) 267–283
Fig. 12. Representation of the TMP, concentration, velocity cycles and stability limit in the shear stress–normal stress plane.
boundary permitting the permeate flux to increase byerosion of the cake.
4.5. Cake stability
We have represented the domain of cake stability inthe shear stress versus normal stress plane in Fig. 12.The cake structure will be irreversible when the rep-resentative point is below the straight line, while thecake will be eroded if this point is above this line. Weexamine now what happens when, for a fixed veloc-ity, the cake thickness is changed. From Eqs. (22) and(25), it can be shown, respectively, that
∂τw
∂e> 0 for e < 0.84 mm (27a)
∂N
∂e< 0 for e < 0.84 mm (27b)
The derivation of Eq. (27b) is given in Appendix A.Therefore, if the cake thickness imposed by the ero-
sion stress is reduced,τw decreases, whileN increases.
Thus, the pointX0 (Fig. 12) representing a stablesituation will move toX below X0 and further awayfrom the stability boundary into the stable region. Theconverse is true since, whene is increased, the corre-sponding pointX′ will soon get into the unstable regionand the cake will be eroded. Consequently, the cakestructure can be regarded as stable at a fixed velocitysince small perturbations in cake thickness will not re-sult in cake growth or disappearance. This conclusionof course is invalid in the case of velocity changesresulting in permeate flux change since from Eq. (22),
∂τw
∂V> 0 (28)
When the velocity is increased so as to exceed theerosion stress, the cake thickness will decrease toreach a new equilibrium value. In order to determinewhether the resulting shear stress increases or de-creases, one must see how the normal stress will varywhen the cake thickness is decreased. We obtained,from the analysis presented in Appendix A, that, for

A. Ould-Dris et al. / Journal of Membrane Science 175 (2000) 267–283 281
a cake thickness lower than 8.4×10⁻⁴ m, the normalstressN increases when the cake thickness is reduced.Since in our velocity cycle tests, the maximum cakethickness obtained was only 3.5×10⁻⁵ m, the nor-mal stress should increase with the cake thicknessreduction in accordance with Eq. (27b).
Since the representative point of the equilibrium inFig. 12 must be located on the stability line, it willmove along this line towards higher values of shear andnormal stresses as was the case in our experimentalresults. Thus, the prediction of the model presented isin good agreement with experimental data.
5. Concluding remarks
The cyclic variation in TMP, concentration and ve-locity in microfiltration tests appears to be a usefultool for investigating which mechanism controls ei-ther cake formation or its removal under certain condi-tions. The first finding of our work is that, at least forCaCO3 suspensions, the mechanisms controlling thepermeate flux are completely different, depending onwhether the operating parameters are varied in such away that they result in cake build-up, its stability or itsremoval. The second finding is that, when a cake hasbeen formed on the membrane, the permeate flux willbe governed by not only the instantaneous operatingparameters, TMP, velocity and particle concentrationbut also by the past history of these parameters in thecross-flow process. For instance, if the TMP selectedhas resulted in a close-packed cake, a subsequent de-crease in TMP or in particle concentration will notreduce the cake resistance which remains set at thevalue corresponding to the maximum TMP and con-centration reached previously in the process.
The role played by the third operating parameter,the tangential velocity, is different from the other two.Only a rise in velocity can cancel the influence of thepast history of the process, provided that the shearstress generated on the cake surface becomes equalto or larger than the erosion stress capable of erod-ing it. The particle lying on the cake surface will becarried out to the membrane outlet or it will diffuseinto the bulk suspension and a new steady state willbe reached when the thickness has decreased in sucha way that the new shear stress on the cake surfacehas been reduced below the erosion stress. Thus, the
linear variation in permeate flux with shear stress re-ported by many authors [14,15,17,20] is indeed validwhen comparing different tests performed at differentvelocities or if the velocity is increased above the crit-ical value corresponding to the cake erosion stress, butis certainly not valid in the part A′–B′ of the velocitycycle shown in Figs. 6 and 8.
This cake behavior is due to the cohesive propertiesof CaCO3 particles and may not be observed with othertypes of cake that are made of bacteria or from flexibleand smooth particles. In this case, a phenomenon likethe flowing cake concept of Vassilieff and co-workers[12,13] may be observed.
Our data has led us to conclude that the steady-stateCaCO3 particle cake was governed by concentrationpolarization with shear-induced diffusion as alreadypostulated in [8] and not by erosion stress which wouldnot reproduce the observed permeate flux decay at ahigher concentration. But we have shown that erosionstress does control the new steady-state permeate fluxwhen a cake formed already is eroded by increasingthe shear stress above the erosion stress. In this sit-uation, the cake will start getting eroded at a lowervelocity when the particle concentration increases, be-cause of higher bulk fluid viscosity. The yield stressis then attained at a lower velocity.
The effect of particle diameter was not tested sincewe have used the same type of polydisperse suspensionin all tests. But, according to Eq. (25), the normal stressshould decrease when the particle diameter increasesfor the same flux and concentration and a cake formedof large particles will be eroded at a lower stress thana cake of small particles.
A practical implication of this work is that, dur-ing the cross-flow filtration of mineral suspension,the TMP and concentration should not be increasedabove their final levels and the velocity should not bedecreased below its final value, because of the riskof irreversible cake build-up. Similarly, in an inter-mittent filtration process, it is important to select avelocity which is higher than the critical velocity forcake erosion.
6. Nomenclature
ad particle radius considered in shear-induceddiffusion (m)

282 A. Ould-Dris et al. / Journal of Membrane Science 175 (2000) 267–283
c cohesionC0 suspension concentration (g/l)Cp correction factor of the normal force
expressed with Stokes’ lawCw concentration at the membrane wall (g/l)dc average diameter of cake particles (m)dp particle diameter (m)e(x) cake thickness (m)e0(x) initial cake thickness along the
membrane (m)e0(x1) cake thickness in the limit of stability
at the membrane outlet (m)f friction factorFt, Fn tangential and normal drag forces (N)Jf average permeate flux (m/s)k internal friction factor of the cakeL membrane length (m)N normal stress exerted at the top
monolayer of particles (N)P pressure (Pa)R membrane radius (m)Rc cake resistance (m−1)Rm membrane resistance (m−1)r(x) specific resistance (m−1)V, V1, Vt axial velocities (m/s)TMP average transmembrane pressure (Pa)
Greek symbolsγ 0 (γ w) shear rate at the membrane
(cake) wall (s−1)ε(x) average porosity in the cakeεw cake surface porosityφ0 particle volume fraction of the
bulk suspensionφwmax particle volume fraction on
the cake surfaceµ0 permeate viscosity (Pa s)µs suspension viscosity (Pa s)ρs CaCo3 density (kg/m3)τw shear stress (Pa)τe erosion stress (Pa)
Acknowledgements
The financial support of the Regional Council ofPicardy and the technical contribution of P. Paullierare gratefully acknowledged.
Appendix A. Derivation of Eq. (27b)
According to Eq. (13), the permeate flux decreaseswhen the cake resistance increases and the correspond-ing derivative is calculated as follows:
∂Jf (x)
∂Rc(x)=− TMP
µ[Rm + Rc(x)]2= − Jf (x)
[Rm + Rc(x)]< 0
(A.1)
Assuming that the average porosity and average spe-cific resistance of the cake remain constant for smallvariation in the cake thickness, the cake resistance isfound to increase with the cake thickness, since
∂Rc(x)
∂e(x)= r(x)(1 − ε(x))ρsR
1
R − e(x)> 0 (A.2)
From Eqs. (A.1) and (A.2), the derivative of the localpermeate flux with respect to the cake thickness iscalculated as
∂Jf (x)
∂e(x)= ∂Jf (x)
∂Rc(x)
∂Rc(x)
∂e(x)
= − Jf (x)
[Rm + Rc(x)]r(x)(1 − ε(x))ρsR
× 1
R − e(x)< 0 (A.3)
From Eq. (25),
∂N(x)
∂e(x)= 180µ
(1 − εw)2
ε3w
1
(ϕd̄c)2dc
∂
∂e(x)
×[Jf (x)
R
R − e(x)
](A.4)
∂N(x)
∂e(x)=A
[R
R−e(x)
∂Jf (x)
∂e(x)+Jf (x)
R
[R − e(x)]2
](A.5)
with
A = 180µ(1 − εw)2
ε3w
1
(ϕd̄c)2d̄c (A.6)
Substituting Eq. (A.1) in (A.5), we obtain
∂N(x)
∂e(x)= A
Jf (x)R
[R − e(x)]2
×[− r(x)(1 − ε(x))ρsR
[Rm + Rc(x)]+ 1
](A.7)

A. Ould-Dris et al. / Journal of Membrane Science 175 (2000) 267–283 283
The condition for the normal stress to decrease withthe cake thickness is
− r(x)(1 − ε(x))ρsR
[Rm + Rc(x)]+ 1 < 0
with
Rc(x) = (1 − ε(x))r(x)ρsR lnR
R − e(x)(13)
Thus, Eq. (27b) (∂N/∂e < 0) will require
e(x)<R
[1 − 1
exp(1 − (Rm/(1 − ε(x))r(x)ρsR))
](A.8)
Taking a value of average porosityε(x) equal to 0.18,which is approximately the value we have found in allthe tests, we obtain
e(x) < 0. 84 mm (A.9)
In our tests carried out under a velocity cycle, themaximum cake thickness reached is 3.5×10⁻⁵ m. Theresult is that, when the cake thickness decreases be-low the initial value of 3.5×10⁻⁵ m, the normal stresson the top monolayer particles must increase. Conse-quently, the erosion stress and the normal stress varytowards higher values along the stability line when thecake thickness is reduced under conditions of an in-crease in velocity.
References
[1] V.G.J. Rodgers, R.F. Sparks, Effect of transmembranepressure pulsing on concentration polarization, J. Membr. Sci.68 (1992) 149–160.
[2] D.A. White, P. Lesecq, Optimization of intermittentlyoperated microfiltration processes, Chem. Eng. J. 52 (1993)73–77.
[3] D. Si-Hassen, A. Ould-Dris, M.Y. Jaffrin, Y.K. Benkahla,Optimization of an intermittent cross-flow filtration processof mineral suspensions, J. Membr. Sci. 118 (1996) 185–198.
[4] E. Spiazzi, H. Bolleau, J. Lenoir, A. Grangeon, A newgenerator of unsteady-state flow regime in tubular membranesas an anti-fouling technique, hydrodynamic approach, J.Membr. Sci. 80 (1993) 49–57.
[5] M.Y. Jaffrin, B.B. Gupta, P. Paullier, Energy saving pulsatilemode cross-flow filtration, J. Membr. Sci. 86 (1994)281–290.
[6] D.E. Hadzismajlovic, C.D. Bertram, Flux enhancement inturbulent cross-flow microfiltration of yeast using a collapsibletube pulsation generation, J. Membr. Sci. 163 (1999) 123–134.
[7] Y.K. Benkahla, A. Ould-Dris, M.Y. Jaffrin, D. Si-Hassen,Cake growth mechanism in cross-flow microfiltration ofmineral suspensions, J. Membr. Sci. 98 (1995) 107–117.
[8] A. Ould-Dris, M.Y. Jaffrin, D. Si-Hassen, Y. Neggaz, Effectof cake thickness and particle polydispersity on prediction ofpermeate flux in microfiltration of particulate suspensions bya hydrodynamic model, J. Membr. Sci. 164 (2000) 211–227.
[9] A.L. Zydney, C.K. Colton, A concentration polarisation modelfor the filtrate flux in cross-flow microfiltration of particulatesuspensions, Chem. Eng. Commun. 41 (1986) 1–21.
[10] C.A. Romero, R.H. Davis, Global model of cross-flowmicrofiltration based on hydrodynamic particle diffusion, J.Membr. Sci. 39 (1988) 157–185.
[11] M.W. Chudacek, A. Fane, The dynamics of polarisation inunstirred and stirred ultrafiltration, J. Membr. Sci. 21 (1984)145–160.
[12] C.S. Vassilieff, I.G. Momtchilova, R.A. Krustev, Cross-flowmicrofiltration of Kaolite-in-water dispersions, Colloids andSurfaces A 92 (1994) 231–247.
[13] C.S. Vassilieff, T.A. Doneva, L.G. Ljutov, Cross-flowmicrofiltration of Kaolite-in-water dispersions: initial transienteffects at low concentration, J. Membr. Sci. 119 (1996) 65–80.
[14] N.J. Blake, I.W. Cumming, M. Streat, Prediction ofsteady-state cross-flow filtration using a force balance model,J. Membr. Sci. 68 (1992) 205–216.
[15] R.G. Holdich, I.W. Cumming, B. Ismail, The variation ofcrossflow filtration rate with wall shear stress and effect ofdeposit thickness, Trans. Ichem. 73 (Part A) (1995).
[16] H. Ebner, Die kontinuierliche microfiltration von essig, Chem.Eng. Technol. 53 (1) (1981) 25.
[17] W.M. Lu, S.C. Ju, Selective particle deposition in cross-flowfiltration, Sep. Sci. Technol. 24 (1989) 512–540.
[18] S.L. Goren, The hydrodynamic force resisting the approachof a sphere to a plane permeable wall, J. Colloid InterfaceSci. 69 (1979) 78–85.
[19] M.E. O’Neill, A sphere in contact with a plane wall in slowlinear shear flow, Chem. Eng. Sci. 23 (1968) 1293–1297.
[20] D.-J. Chang, F.-C. Hsu, S.-J. Hwang, Steady-state flux ofcross-flow microfiltration, J. Membr. Sci. 98 (1995) 133–145.
[21] T. Schluep, F. Widmer, Initial transient effects during crossflow microfiltration of yeast suspensions, J. Membr. Sci. 115(1996) 97–106.
[22] G. Belfort, R.H. Davis, A.L. Zydney, The behavior ofsuspensions and macromolecular solutions in crossflowmicrofiltration, J. Membr. Sci. 96 (1994) 1–58.
[23] D. Leighton, A. Acrivos, Viscous resuspension, Chem. Eng.Sci. 41 (1986) 1377–1384.
[24] N. Midoux, Mécanique et rhéologie des fluides en géniechimique, Technique et documentation Lavoisier, 1985.
[25] R.M. Nedermann, Statics and Kinematics of GranulaMaterials, Cambridge University Press, Cambridge, 1992.