heavy metals in salt cake from secondary aluminum production
TRANSCRIPT
Proceedings
2011 World Congress on
Engineering and Technology
Oct. 28-Nov.2, 2011, Shanghai, China
Proceedings 2011 World Congress on Engineering and
Technology Copyright and Reprint Permission: Abstracting is permitted with credit to the source. Libraries are permitted to photocopy beyond the limit of U.S. copyright law for private use of patrons those articles in this volume that carry a code at the bottom of the first page, provided the per-copy fee indicated in the code is paid through Copyright Clearance Center, 222 Rosewood Drive, Danvers, MA 01923. For other copying, reprint or republication permission, write to IEEE Copyrights Manager, IEEE Operations Center, 445 Hoes Lane, Piscataway, NJ 08854. All rights reserved. Copyright ©2011 by IEEE. Compliant PDF Files
IEEE Catalog Number: CFP 1148N -ART ISBN: 978-1-61284-365-0
Conference CD-ROM Version IEEE Catalog Number: CFP 1148N-CDR ISBN: 978-1-61284-363-6
Print Version IEEE Catalog Number: CFP 1148N -PRT ISBN: 978-1-61284-362-9
Publisher: Institute of Electrical and Electronics Engineers, Inc.
Printed in Beijing, China
2011 World Congress on Engineering and Technology
(CET 2011)
http://www.engii.org/cet2011/ Oct. 28-Nov.2, 2011, Shanghai, China
Sponsors: - IEEE Beijing Section - IEEE Wuhan Section - Tongji University - Wuhan University - Engineering Information Institute
Welcome
On behalf of the Organizing Committee of 2011 World Congress on Engineering and Technology (CET 2011), it is my great pleasure to present this proceedings of the conference held in Shanghai, China, Oct. 28th to Nov.2nd, 2011. I would like to take this opportunity to thank all the authors and participants for their support to our conference.
With the development of technology, a great variety of research results are emerging. Following the rapid development trend, CET 2011 serves as a forum for the academic professionals and researchers to exchange the most updated information and achievements in those exciting research areas.
I would like to express our gratitude to our sponsors: IEEE Beijing Section, IEEE Wuhan Section, Tongji University, Wuhan University, and Engineering Information Institute. At the same time, we appreciate the contributions from our paper reviewers and the committee members. Your efforts make the conference a success.
Thanks again for your attention and support to our conference.
We are looking forward to seeing you again next year.
Dr. Victor Jin
CET 2011 General Chair
Conference Organizing Committee
Honorary General Chair
Prof. Daniel N.Riahi, University of Illinois at Urbana-Champaign-uiuc, USA
General Chair
Dr. Victor Jin, Ohio State University, USA
Technical Program Committee Chair
Prof. Nickolas S. Sapidis, University of Western Macedonia, Greece
Technical Program Committee Co-Chair
Prof. Weidong Zhao, Tongji University, Shanghai, China
Technical Program Committee
Prof. Harald Morgner, Physical Chemistry, University Leipzig, Germany Dr. Wenyuan Liao, University of Calgary, Alberta, Canada Prof. Andrzej Kloczkowski, Iowa State University, USA Dr. Serge Lawrencenko, National University of Science and Technology (Moscow),
Russia Dr. Ahn Jong-Hoon, Hanyang University, Seoul, Korea (South) Dr. Peihua Qiu, University of Minnesota, USA Dr. Yu Zhuang, Texas Tech University, USA Dr. Zhenyu Yan, Fair ISAAC Corporation (FICO), Research Division, USA Dr. Zhen-Xing Tang, Hangzhou Wahaha Co. Ltd, Hangzhou, Zhejiang, China Dr. Weiping Zhang, Shanghai Jiao Tong University, China Prof. Bin Zheng, University of Pittsburgh, USA Dr. Lijuan zhang, University of Auckland, New Zealand
Prof. Ravi Janardan, University of Minnesota--Twin Cities, USA Dr. Shyh-Feng Chen, China University of Science and Technology, USA Dr. Zhuming Bi, Purdue University at IPFW Campus, USA Dr. José Reinaldo Silva, University of São Paulo, France Dr. Jianwen Fang, University of Kansas, USA Dr. Alessandro Margherita, University of Salento, Italy Prof. Petar M. Mitrasinovic, Indian Institute of Technology Roorkee, India Prof. Inmaculada Zamora, University of the Basque Country, Spain Prof. Gianluca Elia, University of Salento, Italy Prof. Imed Kacem, University Paul Verlaine – Metz (UPV-M), France Prof. Eugene Levner, Holon Institute of Technology, Holon, Israel Prof. Irinel Dragan, University of Texas at Arlington, USA Prof. Zuo-Guang Ye, Simon Fraser University, Canada Prof. George A. Gravvanis, Democritus University of Thrace, Greece Prof. Wanyang Dai, Nanjing University, Nanjing, China Dr. Chaoyi Pang, the Australian e-Health Research Centre, CSIRO, Australia Prof. Hui Tang, Kunming University of Science and Technology,Yunnan, China Dr. Amal Kumar Mondal, Vidyasagar University,Midnapore, West Bengal, India Dr. Ki Young Kim, Samsung Advanced Institute of Technology, Yongin, Korea (South) Dr. Sajjad Haider, College of Engineering King Saud University, Saudi-arabia Prof. Kewen Zhao, University of Qiongzhou, China Dr. Chiranjib Chakraborty, Vellore Institute of Technology, India Dr. Raj Kumar, Institute of Nuclear Medicine and Allied Sciences, India Prof. Abdul Q. M. Khaliq, Middle Tennessee State University, USA
Dr. Yufeng Wang, University of Texas, USA Prof. Atef Sayed Abdel-Razek, National Research Centre, Egypt, Egypt Dr. Zhongming Zhao, Vanderbilt University Medical Center, USA Prof. Shuying Qu, Yantai University, China Dr. Chiranjib Chakraborty, VIT University, India Prof. Jean-Claude Thill, University of North Carolina at Charlotte, USA Prof. Abderrahmane BAÏRI, Université Paris Ouest, France Prof. Yu-Ran Luo, University of Science and Technology of China, China Prof. Feng-Biao Guo, University of Electronic Science and Technology of China, China Prof. Celin Hin, MIT, USA Prof. Ulrich H.E. Hansmann, Michigan Technological University, USA Prof. Agassi Melikov, Institute of Cybernetics, Azerbaijan
Publication Chair Mengqi Zhou, IEEE Beijing Section, China
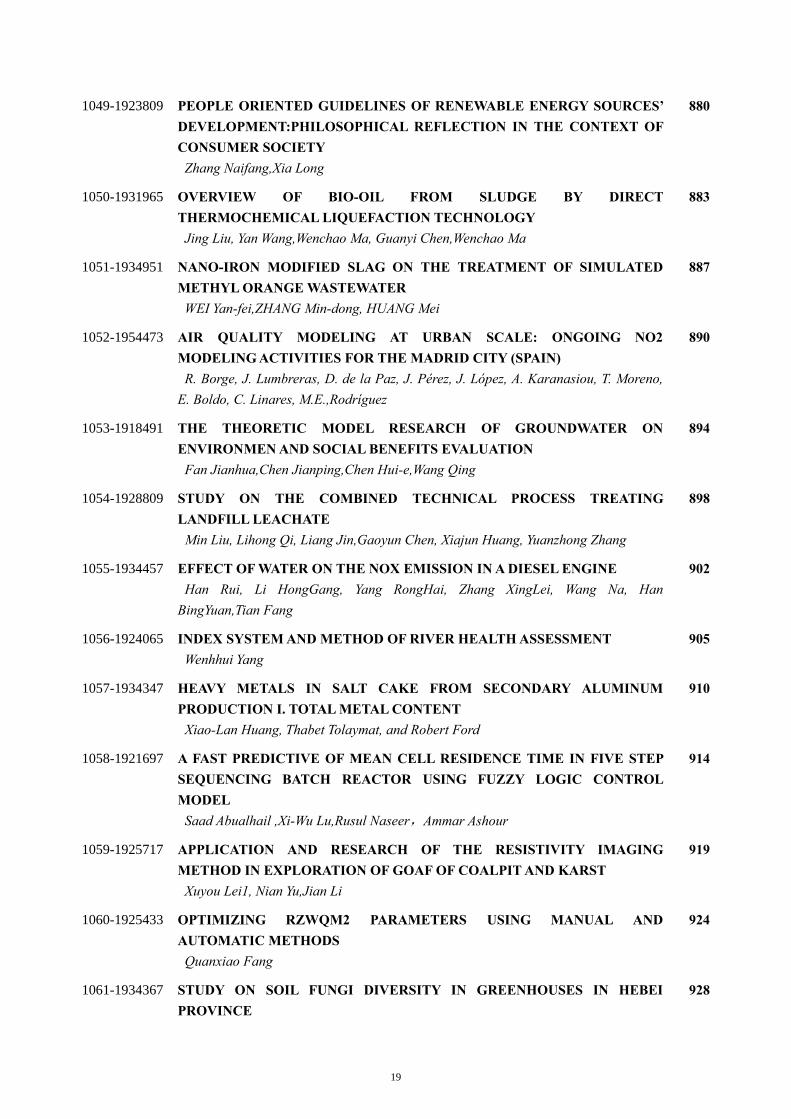
1049-1923809 PEOPLE ORIENTED GUIDELINES OF RENEWABLE ENERGY SOURCES’ DEVELOPMENT:PHILOSOPHICAL REFLECTION IN THE CONTEXT OF CONSUMER SOCIETY
880
Zhang Naifang,Xia Long 1050-1931965 OVERVIEW OF BIO-OIL FROM SLUDGE BY DIRECT
THERMOCHEMICAL LIQUEFACTION TECHNOLOGY 883
Jing Liu, Yan Wang,Wenchao Ma, Guanyi Chen,Wenchao Ma 1051-1934951 NANO-IRON MODIFIED SLAG ON THE TREATMENT OF SIMULATED
METHYL ORANGE WASTEWATER 887
WEI Yan-fei,ZHANG Min-dong, HUANG Mei 1052-1954473 AIR QUALITY MODELING AT URBAN SCALE: ONGOING NO2
MODELING ACTIVITIES FOR THE MADRID CITY (SPAIN) 890
R. Borge, J. Lumbreras, D. de la Paz, J. Pérez, J. López, A. Karanasiou, T. Moreno, E. Boldo, C. Linares, M.E.,Rodríguez
1053-1918491 THE THEORETIC MODEL RESEARCH OF GROUNDWATER ON
ENVIRONMEN AND SOCIAL BENEFITS EVALUATION 894
Fan Jianhua,Chen Jianping,Chen Hui-e,Wang Qing 1054-1928809 STUDY ON THE COMBINED TECHNICAL PROCESS TREATING
LANDFILL LEACHATE 898
Min Liu, Lihong Qi, Liang Jin,Gaoyun Chen, Xiajun Huang, Yuanzhong Zhang 1055-1934457 EFFECT OF WATER ON THE NOX EMISSION IN A DIESEL ENGINE 902 Han Rui, Li HongGang, Yang RongHai, Zhang XingLei, Wang Na, Han
BingYuan,Tian Fang
1056-1924065 INDEX SYSTEM AND METHOD OF RIVER HEALTH ASSESSMENT 905 Wenhhui Yang 1057-1934347 HEAVY METALS IN SALT CAKE FROM SECONDARY ALUMINUM
PRODUCTION I. TOTAL METAL CONTENT 910
Xiao-Lan Huang, Thabet Tolaymat, and Robert Ford 1058-1921697 A FAST PREDICTIVE OF MEAN CELL RESIDENCE TIME IN FIVE STEP
SEQUENCING BATCH REACTOR USING FUZZY LOGIC CONTROL MODEL
914
Saad Abualhail ,Xi-Wu Lu,Rusul Naseer,Ammar Ashour 1059-1925717 APPLICATION AND RESEARCH OF THE RESISTIVITY IMAGING
METHOD IN EXPLORATION OF GOAF OF COALPIT AND KARST 919
Xuyou Lei1, Nian Yu,Jian Li 1060-1925433 OPTIMIZING RZWQM2 PARAMETERS USING MANUAL AND
AUTOMATIC METHODS 924
Quanxiao Fang 1061-1934367 STUDY ON SOIL FUNGI DIVERSITY IN GREENHOUSES IN HEBEI
PROVINCE 928
19
Heavy Metals in Salt Cake from Secondary Aluminum Production
I. Total Metal Content
Xiao-Lan Huang Pegasus Technical Services, Inc.
46 E. Hollister Street, Cincinnati, OH 45219. U.S.A.
Thabet Tolaymat, and Robert Ford National Risk Management Research Laboratory Office of Research and Development, U.S. EPA
Cincinnati, OH 45224, U. S. A [email protected];
Abstract—Salt cake is the byproduct of secondary aluminum production and is often disposed of in the United States using landfills. A systematic approach to understanding the characteristics of salt cake and the reactivity of salt cake with water was conducted by the US EPA in cooperation with the Aluminum Association and Environmental Research & Education Foundation, 39 samples from 10 facility throughout America were collected to cover a wide range of processes and sources. Digested by the EPA’s SW846 Method 3051A, total heavy metals (As, Cr, Cd, Cu, Mn, Se, Pb, and Zn) in salt cake was investigated. It was confirmed that all heavy metals in salt cake samples have a positive correlation with the amount of aluminum in the sample with a high level of variability, the general order of heavy metals content in salt cake is Mn > Cu > Zn > Cr >> Pb > As > Se >> Cd.
Keywords-component; aluminum recycle; salt cake; heavy metals
I. INTRODUCTION Aluminum is one of the dominant non-ferrous metals in use
today, and it is employed in a huge number of products, either alone or as alloys, which usually contain different amount heavy metals, including As, Cr, Cd, Cu, Mn, Se, Pb, and Zn[1]. Since recycling scrap aluminum requires only 5% of the energy used to produce aluminum from raw materials, and avoids approximately 95% of the emissions associated with producing new aluminum from ore [2-6], the recycle aluminum production play important role for aluminum production. The recycling of scrap aluminum often produces various types of wastes referred to as secondary aluminum processing (SAP) waste. How to treat and dispose the waste from aluminum production as well as the presence of byproducts of the aluminum recycling process is becoming not only a problem in the United States, but a global problem[7]. In the US, most secondary aluminum is produced through the use of rotary furnaces with the addition of salt fluxes to improve recovery and reduce oxidation of the aluminum metal[8].
Aluminum dross represents a residue both from primary and secondary aluminum production, and is formed during
refining and by air oxidation of the liquid metal during melting, holding, and casting operations. Drosses from secondary smelting operations (so-called “black drosses”) typically contain a mixture of aluminum/alloy oxides and slag, and frequently show recoverable aluminum contents ranging from 12 to 18% [3, 4, 8-10]. Commercial smelting of both white and black dross is often done in a rotary salt furnace. The nonmetallic byproduct residue, which results from such dross smelting operations, is frequently termed “salt cake (salt slag)” and contains 3 to 10% residual metallic aluminum [3, 4, 8-10]. The formation of dross and the amount of dross formed depend on different factors like type and quality of input material (e.g. aluminium scraps in secondary industry), operating conditions, and type of technology and furnace applied [3, 4, 8-10].
Traditionally, salt cake is disposed as landfill. Almost one million tons of salt cake are annually landfilled in the United States [11]. Worldwide, the aluminum industry produces nearly 5 million tons of furnace waste (salt cake, black dross) each year [12], and this number continues to grow with the increase in aluminum consumption, mainly recycled metal [13]. Since many heavy metals are constitutes of aluminum alloys, it is important to understand the fate of heavy metals in these wastes, especially the salt cake. Here we report the total heavy metals content in 39 salt cake samples from 10 facilities throughout America, the main waste from secondary aluminum production. Based on our knowledge, it is the largest number of sample collected for the characteristics in America and world.
II. METHODS
A. Sample Collection and Preparation Salt cake samples were collected from 10 secondary
aluminum-processing facilities, usually each facility once a month for four months with pre-cleaned sampling equipment. The facilities were identified in collaboration with the Aluminum Association and the Environmental Research and Education Foundation to cover a wide range of processes. Before collection, the salt cake was piled at the generation site. After cooling (usually 72-120 h), each pile was reduced following ASTM Method C702 -98 “Standard practice for
This project is supported by the Aluminum Association and Environmental Research & Education Foundation (EREF). ___________________________________ 978-1-61284-365-0/11/$26.00 ©2011 IEEE
910
reducing samples of aggregate to testing size” [14]. Each sample was processed by placing them into a stainless steel pan and crushing them to a size less than 9 mm, 2 mm, and 0.05 mm.
B. Total Elements Analysis The salt cake samples were acid digested following EPA’s SW846 Method 3051A [15]. Because of the need for aluminum quantification, a mixture of hydrochloric and nitric acid (1 part HCl and 3 parts HNO3) was employed. Furthermore, the microwave temperature was set at 185 °C rather than the 175 °C that is specified in the method. The holding time was also extended from 10 to 30 minutes. The weight of the salt cake samples was approximately 0.1 g instead of 0.5 g. After acid digestion, major metal compositions, which included Al, Ca, Cu, Fe, K, Mn, Na, S, and Zn, were determined following EPA’s SW846 Method 6010C using a Thermo ICP-AES [16]. The heavy metals As, Cd, Cr, Pb, and Se were analyzed by a Perkin-Elmer graphite furnace AA (GFAA) separately [17]. The method detection limit (MDL) of Al, Cu, Mn, and Zn by ICP was 33, 2.0, 5.0, and 2.3 μg L-1, respectively. The MDL of As, Cd, Cr, Pb and Se by GFAA was 1.3, 0.01, 0.85, 0.40, and 0.57 μg L-1, respectively. The method reporting limit (MRL) of Al, As, Cd, Cr, Cu, Pb, Mn, Se and Zn content in this study was 47, 1.3, 0.02, 1.3, 3.5, 0.6, 7.2, 1.0 and 3.5 mg Kg-1, respectively. Standard reference material 1633b (Coal Fly Ash) was also digested during each batch for the quality control. The average recovery of spiked Al in blank, 1633b, and salt cake samples (2452-B, 2433-C, 2502-F, 2046-H, 2512-J, 2490-L and 2613-M) was 104, 103, and 93 (56-139) %, respectively.
C. Statistical analysis The Statistical analysis was performed using JMP 9.0, and
SigmaPlot 11.0. The Pearson product-moment correlation and Spearman's rank correlation have been employed to determine the correlations among the different metals.
III. RESULTS
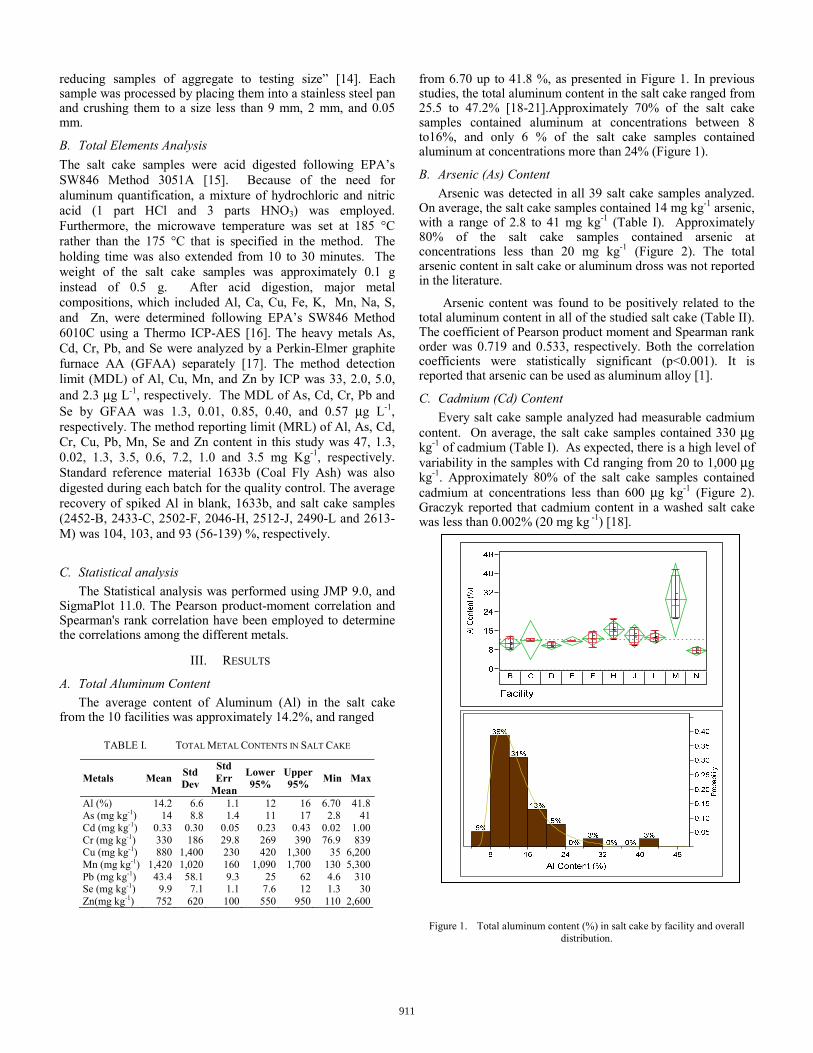
A. Total Aluminum Content The average content of Aluminum (Al) in the salt cake
from the 10 facilities was approximately 14.2%, and ranged
TABLE I. TOTAL METAL CONTENTS IN SALT CAKE
Metals Mean Std Dev
Std Err
Mean
Lower 95%
Upper 95% Min Max
Al (%) 14.2 6.6 1.1 12 16 6.70 41.8As (mg kg-1) 14 8.8 1.4 11 17 2.8 41Cd (mg kg-1) 0.33 0.30 0.05 0.23 0.43 0.02 1.00Cr (mg kg-1) 330 186 29.8 269 390 76.9 839Cu (mg kg-1) 880 1,400 230 420 1,300 35 6,200Mn (mg kg-1) 1,420 1,020 160 1,090 1,700 130 5,300Pb (mg kg-1) 43.4 58.1 9.3 25 62 4.6 310Se (mg kg-1) 9.9 7.1 1.1 7.6 12 1.3 30Zn(mg kg-1) 752 620 100 550 950 110 2,600
from 6.70 up to 41.8 %, as presented in Figure 1. In previous studies, the total aluminum content in the salt cake ranged from 25.5 to 47.2% [18-21].Approximately 70% of the salt cake samples contained aluminum at concentrations between 8 to16%, and only 6 % of the salt cake samples contained aluminum at concentrations more than 24% (Figure 1).
B. Arsenic (As) Content Arsenic was detected in all 39 salt cake samples analyzed.
On average, the salt cake samples contained 14 mg kg-1 arsenic, with a range of 2.8 to 41 mg kg-1 (Table I). Approximately 80% of the salt cake samples contained arsenic at concentrations less than 20 mg kg-1 (Figure 2). The total arsenic content in salt cake or aluminum dross was not reported in the literature.
Arsenic content was found to be positively related to the total aluminum content in all of the studied salt cake (Table II). The coefficient of Pearson product moment and Spearman rank order was 0.719 and 0.533, respectively. Both the correlation coefficients were statistically significant (p<0.001). It is reported that arsenic can be used as aluminum alloy [1].
C. Cadmium (Cd) Content Every salt cake sample analyzed had measurable cadmium
content. On average, the salt cake samples contained 330 μg kg-1 of cadmium (Table I). As expected, there is a high level of variability in the samples with Cd ranging from 20 to 1,000 μg kg-1. Approximately 80% of the salt cake samples contained cadmium at concentrations less than 600 μg kg-1 (Figure 2). Graczyk reported that cadmium content in a washed salt cake was less than 0.002% (20 mg kg -1) [18].
Figure 1. Total aluminum content (%) in salt cake by facility and overall
distribution.
911
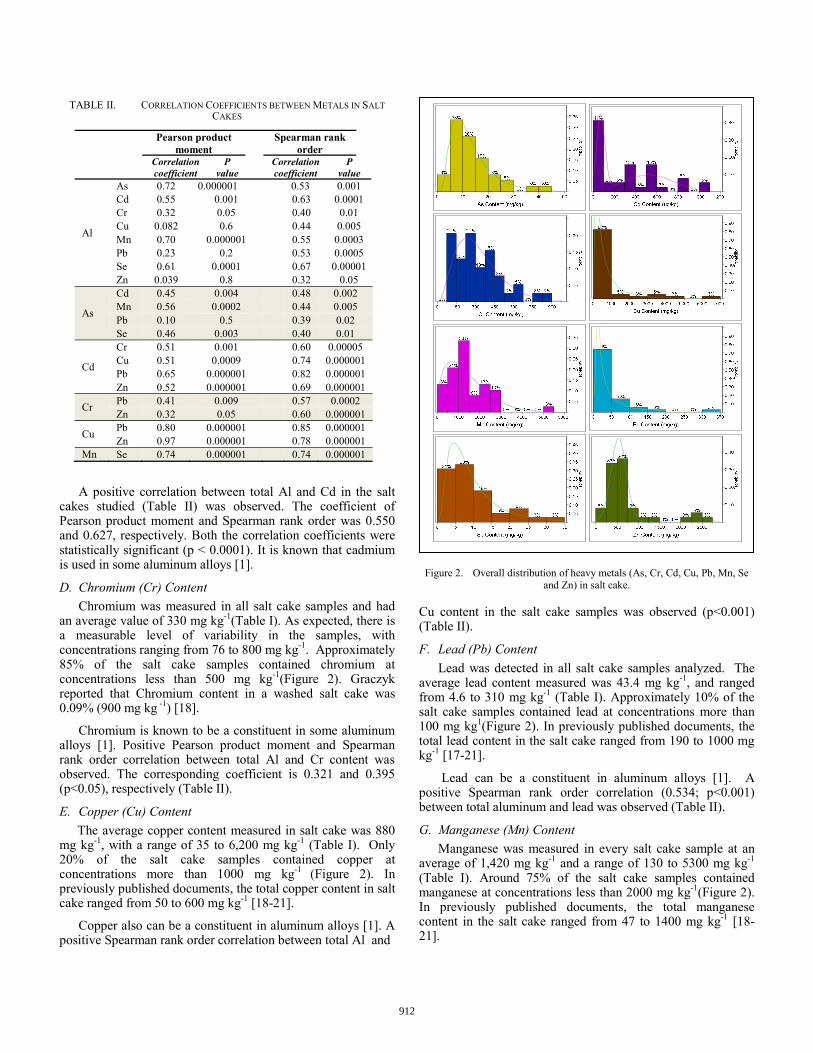
TABLE II. CORRELATION COEFFICIENTS BETWEEN METALS IN SALT CAKES
Pearson product moment Spearman rank
order Correlation
coefficient P
value Correlation coefficient
P value
Al
As 0.72 0.000001 0.53 0.001 Cd 0.55 0.001 0.63 0.0001 Cr 0.32 0.05 0.40 0.01 Cu 0.082 0.6 0.44 0.005 Mn 0.70 0.000001 0.55 0.0003 Pb 0.23 0.2 0.53 0.0005 Se 0.61 0.0001 0.67 0.00001 Zn 0.039 0.8 0.32 0.05
As
Cd 0.45 0.004 0.48 0.002 Mn 0.56 0.0002 0.44 0.005 Pb 0.10 0.5 0.39 0.02 Se 0.46 0.003 0.40 0.01
Cd
Cr 0.51 0.001 0.60 0.00005 Cu 0.51 0.0009 0.74 0.000001 Pb 0.65 0.000001 0.82 0.000001 Zn 0.52 0.000001 0.69 0.000001
Cr Pb 0.41 0.009 0.57 0.0002 Zn 0.32 0.05 0.60 0.000001
Cu Pb 0.80 0.000001 0.85 0.000001 Zn 0.97 0.000001 0.78 0.000001
Mn Se 0.74 0.000001 0.74 0.000001
A positive correlation between total Al and Cd in the salt cakes studied (Table II) was observed. The coefficient of Pearson product moment and Spearman rank order was 0.550 and 0.627, respectively. Both the correlation coefficients were statistically significant (p < 0.0001). It is known that cadmium is used in some aluminum alloys [1].
D. Chromium (Cr) Content Chromium was measured in all salt cake samples and had
an average value of 330 mg kg-1(Table I). As expected, there is a measurable level of variability in the samples, with concentrations ranging from 76 to 800 mg kg-1. Approximately 85% of the salt cake samples contained chromium at concentrations less than 500 mg kg-1(Figure 2). Graczyk reported that Chromium content in a washed salt cake was 0.09% (900 mg kg -1) [18].
Chromium is known to be a constituent in some aluminum alloys [1]. Positive Pearson product moment and Spearman rank order correlation between total Al and Cr content was observed. The corresponding coefficient is 0.321 and 0.395 (p<0.05), respectively (Table II).
E. Copper (Cu) Content The average copper content measured in salt cake was 880
mg kg-1, with a range of 35 to 6,200 mg kg-1 (Table I). Only 20% of the salt cake samples contained copper at concentrations more than 1000 mg kg-1 (Figure 2). In previously published documents, the total copper content in salt cake ranged from 50 to 600 mg kg-1 [18-21].
Copper also can be a constituent in aluminum alloys [1]. A positive Spearman rank order correlation between total Al and
Figure 2. Overall distribution of heavy metals (As, Cr, Cd, Cu, Pb, Mn, Se
and Zn) in salt cake.
Cu content in the salt cake samples was observed (p<0.001) (Table II).
F. Lead (Pb) Content Lead was detected in all salt cake samples analyzed. The
average lead content measured was 43.4 mg kg-1, and ranged from 4.6 to 310 mg kg-1 (Table I). Approximately 10% of the salt cake samples contained lead at concentrations more than 100 mg kg1(Figure 2). In previously published documents, the total lead content in the salt cake ranged from 190 to 1000 mg kg-1 [17-21].
Lead can be a constituent in aluminum alloys [1]. A positive Spearman rank order correlation (0.534; p<0.001) between total aluminum and lead was observed (Table II).
G. Manganese (Mn) Content Manganese was measured in every salt cake sample at an
average of 1,420 mg kg-1 and a range of 130 to 5300 mg kg-1 (Table I). Around 75% of the salt cake samples contained manganese at concentrations less than 2000 mg kg-1(Figure 2). In previously published documents, the total manganese content in the salt cake ranged from 47 to 1400 mg kg-1 [18-21].
912
Manganese can be a constituent in aluminum alloy [1]. A positive linear correlation between the total manganese and aluminum was observed in all studied salt cakes (r2= 0.494, p <0.001) (Table II).
H. Selenium (Se) Content The salt cake samples contained measureable
concentrations of selenium. Selenium content was measured in every salt cake sample at an average of 9.9 mg kg-1 and a range of 1.3 to 30 mg kg-1(Table I). Around 80% of the salt cake samples contained selenium at concentrations less than15 mg kg-1(Figure 2). Hagelstein reported the selenium content in salt cake from 0.18 up to 156 mg kg-1 [22].
Selenium can be a constituent in aluminum alloys [1]. A significant correlation between selenium and aluminum was observed; the coefficient of Pearson product moment and Spearman rank order was 0.61 and 0.67 (p < 0.0001), respectively (Table II).
I. Zinc (Zn) Content Zinc was detected in all salt cake samples. The
average zinc content measured was 752 mg kg-1 with a range of 110 to 2,600 mg kg-1. Approximately 80% of the salt cake samples contained zinc at concentrations less than 1,000 mg kg-1(Figure 2). In previously published documents, the total zinc content in the salt cake ranged from 120 to 3000 mg kg-1 [18-21].
Zinc can be a constituent in aluminum alloys [1]. A positive correlation between total zinc and aluminum content in the studied salt cake was observed, and the coefficient of Spearman rank order was 0.32 (p < 0.05) (Table II).
SUMMARY AND DISCUSSION Aluminum is often used in alloyed form and
aluminum recycling is in fact the recycle of rather large family of different alloys. Since different Al alloys, which contain different the heavy metals [1, 3], are the main sources for secondary aluminum production, heavy metals, including As, Cd, Cr, Cu, Mn, Pb, Se, and Zn, were detectable in salt cake. The general order is Mn > Cu > Zn > Cr >> Pb > As > Se >> Cd. As expected, significant correlations between the content of total Al and As, Cd, Cr, Cu, Mn, Pb, Se, and Zn were found. On the other hand, many heavy metals coexist in the same salt cake due to the similarity between elements. Significant correlations between metals, e.g., As vs. Mn, Pb and Se; Cd vs. Cr, Cu, Pb and Zn; Cr vs. Pb, and Zn; Cu vs. Pb and Zn; and Mn vs. Se were observed in the studied salt cakes (Table II).
ACKNOWLEDGMENT Xiao-Lan Huang would like to acknowledge Mr. Jim Voit, Dr. Todd Luxton (U.S. EPA), Dr. Raghuraman Venkatapathy, Mr. Ross Schneider, Ms. Dounia El Khatib (Pegasus Technical Services, Inc), Dr. Gune Silva (Shaw Environmental Inc.) and Mr. Phillip Cluxton
(Cluxton Instruments, Inc) for providing the instrumental support and help for this project.
REFERENCES
[1] J. R. Davis, Aluminum and Aluminum Alloys (Asm Specialty Handbook) ASM International, 1993.
[2] J. A. S. Green, Ed., Aluminum Recycling and Processing for Energy Conservation and Sustainability. Materials Park, OH: ASM International, 2007, p.^pp. Pages.
[3] M. E. Schlesinger, Aluminum Recycling. Boca Raton, FL: CRC Press, 2007.
[4] C. J. Schmitz, Handbook of Aluminum Recycling: Vulkan-Verlag GmbH, 2007.
[5] K. Hagelstein, "Globally sustainable manganese metal production and use," Journal of Environmental Management, vol. 90, pp. 3736-3740, 2009.
[6] IAI, "Global Aluminium Recycling: A Cornerstone of Sustainable Development," International Aluminium Institute2009.
[7] A. Gil, "Management of the salt cake from secondary aluminum fusion processes," Industrial & Engineering Chemistry Research, vol. 44, p. 8852, 2005.
[8] J. Y. Hwang, X. Huang and Z. Xu, "Recovery of Metals from Aluminum Dross and Salt Cake," Journal of Minerals & Materials Characterization & Engineering, vol. 5, pp. 47-62, 2006.
[9] G. J. Kulik and J. C. Daley, "Aluminum dross processing in the 90's," in Second International Symposium: Recycling of Metals and Engineered Materials, J. H. van Linden, et al., Eds., ed: The Minerals, Metals & Materials Society, 1990, pp. 427-437.
[10] R. D. Peterson and L. Newton, "Review of aluminum dross processing," Light Metals, pp. 1029-1037, 2002.
[11] USDOE, "Recycling of aluminum dross/salt cake," Office of industrial technologies,Energy Efficiency and Renewable Energy, U.S. Department of Energy1999.
[12] Azom, "Aluminium Dross Recycling – A New Technology for Recycling Aluminium Waste Products," ed: The A to Z of Materials, 2003.
[13] P. Harrison. (2010, Dec 25,2010). Recycle Aluminum. Available: http://www.benefits-of-recycling.com/recyclealuminum.html
[14] ASTM, "Standard Practice for Reducing Samples of Aggregate to Testing Size ", ed: American Society for Testing and Materials 2003, p. 4.
[15] USEPA, "Test Methods for Evaluating Solid Waste, Physical/Chemical Methods 3051A," in Microwave-assisted acid digestion of sediments, sludges, soils and oils, ed: USEPA, 2007, pp. 1-14.
[16] USEPA, "Test Methods for Evaluating Solid Waste, Physical/Chemical Methods, 6010C," in Inductively Coupled Plasma-Atomic Emission Spectrometry, ed. USEPA: USEPA, 2007.
[17] USEPA, "Test Methods for Evaluating Solid Waste, Physical/Chemical methods, 7010," in Graphite Furnace Atomic Absorption Spectrophotometry, ed, 2007.
[18] D. G. Graczyk, et al., "Analytical chemistry of aluminum salt cake," in 126th Annual Meeting of the Minerals, Metals, and Materials Society, Symposium on Aluminum Dross and Salt Cake Processing, Orlando FL, 1997, p. 6
[19] W. J. Bruckard and J. T. Woodcock, "Characterisation and treatment of Australian salt cakes by aqueous leaching," Minerals Engineering, vol. 20, pp. 1376-1390, 2007.
[20] B. Lucheva, Ts. Tsonev and R. Petkov, "Non-Waste Aluminum Dross Recycling," Journal of the University of Chemical Technology and Metallurgy, vol. 40, pp. 335-338, 2005.
[21] H. N. Yoshimura, et al., "Evaluation of aluminum dross waste as raw material for refractories," Ceramics International, vol. 34, pp. 581-591, 2008.
[22] K. Hagelstein, "The Environmental Management of Selenium in Aluminum Processing," JOM, vol. 55, pp. 51-54, 2003.
913