an integrated geomatics research program for mountain gorilla behavior and conservation
TRANSCRIPT
Conservation in the 21st Century: Gorillas as a Case Study
Edited by
T.S. StoinskiThe Dian Fossey Gorilla Fund InternationalAtlanta, Georgia, USA
andZoo AtlantaAtlanta, Georgia, USA
H.D. SteklisThe Dian Fossey Gorilla Fund InternationalAtlanta, Georgia, USA
andDepartment of AnthropologyRutgers UniversityNew Brunswick, New Jersey, USA
P.T. MehlmanThe Dian Fossey Gorilla Fund InternationalAtlanta, Georgia, USA
FM.qxd 28/7/07 5:37 PM Page iii
1. Background
1.1. IntroductionThe mountain gorilla (Gorilla beringei beringei) of the Virunga volcanoesregion of Central-East Africa has been the focus of much research and con-servation activities since Schaller’s pioneering field study in the late 1950s.Despite large declines in this population during the 1970s and early 1980s dueto poaching and habitat loss, active research, protection, and a successfulecotourism program resulted in the population’s recovery by the mid-1980s toa size of about 380 individuals by late 2003 (Kalpers et al., 2003; Fawcett,pers. comm.). Nevertheless, the Virunga mountain gorilla population is smallfrom the standpoint of an effective breeding population size (Steklis andGerald Steklis, 2001), is isolated, and is surrounded by a dense, growinghuman population. Its long-term survival continues to be threatened by theintroduction of human disease, habitat loss and degradation, and poaching.The IUCN Red Book classifies the population as “Critically Endangered.”
The threatened status of this population calls for management strategiesthat, in addition to a high level of protection and monitoring, rely on innova-tive research that addresses fundamental problems such as: 1) the dynamics ofcontinued population growth in a limited habitat; 2) density and distributionof gorilla groups in relation to habitat quality; and 3) the effects of humanuse of the habitat on gorilla behavior and biology. Such management issuesand their connected research agendas also concern other African ape popu-lations (e.g., Walsh et al., 2003), and many primate species the world over areequally threatened with extinction (Jernvall and Wright, 1998), frequentlydue to the combined threats of disease, human population growth, and habi-tat loss. In response to this growing conservation crisis, conservation biolo-gists have increasingly begun to rely on geographic information system (GIS)technologies , including Global Positioning System (GPS), satellite imaging,
228
Chapter 11An Integrated Geomatics ResearchProgram for Mountain GorillaBehavior and Conservation
H. Dieter Steklis, Scott Madry, Nick Faust, Netzin Gerald Steklis,and Eugene Kayijamahe
Ch11.qxd 28/7/07 5:30 PM Page 228
and other remote sensing tools. This technology, developed during the 1970sand 1980s, has come to play a vital role in providing quantitative, visuallybased tools for both conservation assessment and modeling of impacts andoutcomes over large temporal (e.g., decades) and spatial scales (e.g., entirenations, ecological zones). We turned to this technology in the early 1990s, ascivil war began to plague the Virunga region, and field work in this interna-tional border area became dangerous and at times impossible, as a meansinitially for habitat assessment and monitoring over the entire Virungaregion. More generally, our objective has grown to understand the dynamicrelationship between the Virunga gorillas, their habitat, and human neigh-bors and to apply this knowledge to the sustained, effective management ofthe gorilla population and its habitat.
Our purpose in this chapter is to review this corpus of work, employingwhat we prefer to call a “Geomatics” approach (see below) to mountaingorilla conservation, in the hope that both our methods and results, and“lessons learned,” will be of use to other primatologists and conservationistsfaced with similar conservation challenges.
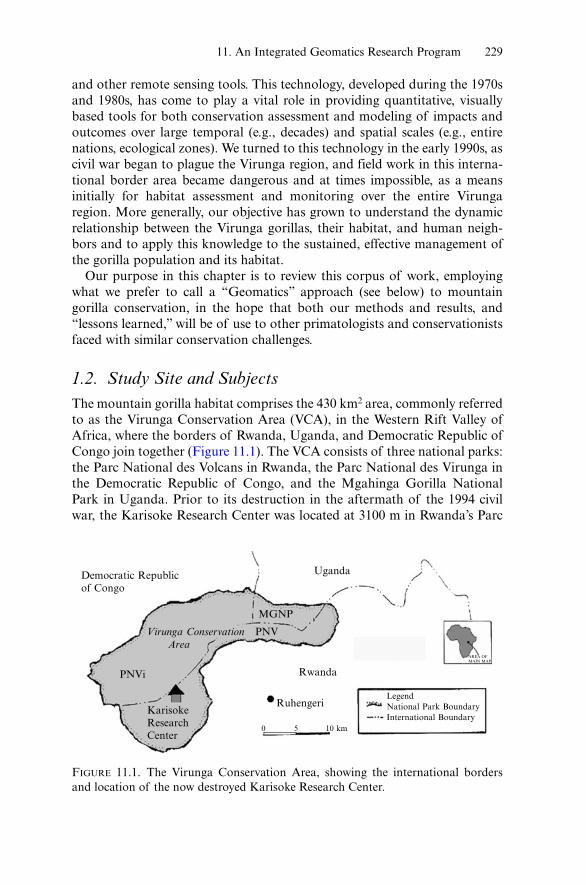
1.2. Study Site and SubjectsThe mountain gorilla habitat comprises the 430 km2 area, commonly referredto as the Virunga Conservation Area (VCA), in the Western Rift Valley ofAfrica, where the borders of Rwanda, Uganda, and Democratic Republic ofCongo join together (Figure 11.1). The VCA consists of three national parks:the Parc National des Volcans in Rwanda, the Parc National des Virunga inthe Democratic Republic of Congo, and the Mgahinga Gorilla NationalPark in Uganda. Prior to its destruction in the aftermath of the 1994 civilwar, the Karisoke Research Center was located at 3100 m in Rwanda’s Parc
11. An Integrated Geomatics Research Program 229
Democratic Republicof Congo
PNVi
Uganda
AREA OFMAIN MAP
MGNP
PNV
Rwanda
Ruhengeri
0 5 10 km
KarisokeResearchCenter
LegendNational Park BoundaryInternational Boundary
Virunga Conservation Area
FIGURE 11.1. The Virunga Conservation Area, showing the international bordersand location of the now destroyed Karisoke Research Center.
Ch11.qxd 28/7/07 5:30 PM Page 229
National des Volcans (Figure 11.1), where it served as a base for researchersand conservationists, including members of our Geomatics research team.The center’s cumulative database on the life history, demography, behavior,and ecology of mountain gorillas as well as human illegal activity (poaching)serves as a powerful resource for conservation biology (Steklis and Steklis,Chapter 6, this volume) and for multi-faceted research projects of the sort weare reviewing here.
Within a few decades of the mountain gorilla’s scientific discovery in1902, its imperiled status became clear as habitat loss and poaching tooktheir toll. The human population encircling the VCA has grown dramati-cally since 1902, with a current staggering density of 400–600individuals/km2 (Weber, 1995). The majority of these are subsistence farmersthat historically have relied on the forest as a source of construction materi-als, bushmeat, firewood, water, and land for livestock grazing. Populationpressure and consequent need for agricultural lands soon led to the loss ofgorilla habitat. The greatest loss of habitat occurred in the Rwandan portionof the VCA, where large tracts of forest were given to local farmers in thelate 1960s, mostly for Pyrethrum cultivation, reducing the size of Rwanda’snational park to less than half its original size. This massive habitat loss—much of it the most fertile lowlands (1600–2600 m)—by the mid-1970s hadeffected a drastic decline in the mountain gorilla population (Weber andVedder, 1983). To this day, human population growth and habitat loss ordegradation from encroachment persist as significant threats to gorilla sur-vival (Plumptre and Williamson, 2001). Unlike the lowland forest habitat ofgorilla populations found to the west of the Virungas, much of the Virungahabitat, because of its higher altitude, is classified as Afro-montane forestwith very little closed canopy. It is mixed with patches of bamboo andherbaceous vegetation, and yields to sparse, low shrub sub-alpine and alpinevegetation zones above 3300 m (White, 1978; Fischer and Hinkel, 1992). Theprimarily folivorous diet of mountain gorillas is much less diverse than thatof their lowland neighbors, consisting primarily of herbaceous vegetationfound on the slopes of and saddles between volcanoes. Fruit is rare in theirdiet, as there is generally very little fruit availability, with the exception ofthe lower lying Mixed Forest zone (2000–2550 m) in the lower parts of theDRC, where gorilla groups may make greater use of fruit resources(McNeilage, 2001).
There is significant variation in abundance and distribution of foodresources, human disturbance, and other factors that, collectively, com-prise “suitable habitat” for the gorillas. While the potential effects of thishabitat heterogeneity on gorilla diet, group size, structure, social organiza-tion, population density, ranging, and ultimately habitat carrying capacityhave been recognized and begun to be addressed by research (McNeilage,2001), they deserve significantly more research effort if we are to fullyunderstand the effects of habitat change or human activity on gorillabiology and behavior.
230 H. Dieter Steklis et al.
Ch11.qxd 28/7/07 5:30 PM Page 230
1.3. Project ObjectivesThe overall aim of our research over the past decade, using GIS technologyin combination with extensive field work, has been the identification andquantification of the variables that define “suitable gorilla habitat” in theVirungas, and to understand the effects of habitat change on gorilla behaviorand population biology. Our intent is to make our results available and use-ful to government and park officials, rangers, and other field personnel whoare charged with the protection and management of the mountain gorilla andits habitat. Our first objective was to treat the VCA as a single habitat, and todefine as closely as possible the environmental features of this habitat. Thisis achieved in a GIS through a single geo-referenced map that contains (asseparate GIS data layers) the major vegetation types, topographic (elevation)and geographic (streams and trails) features, and political-cultural features(park and international borders, local place names). Second, we wanted tobring into this GIS environment both historical and current data on gorillagroup ranging and human illegal activity, so as to assess, both historically andpresently, how habitat features and human activity influence gorilla habitat use.
1.4. A Geomatics Approach to ConservationGeomatics is a recent concept, developed and advanced in Canada, and onethat is particularly appropriate for this research project. It expands upon thetools of GIS and remote sensing, and provides a true multidisciplinary,multiperspective, and multitechnology environment for regional and environ-mental analysis. Geomatics is defined as the functional integration of GIS,GPS, remote sensing, simulation and visualization, databases, spatial statistics,and related technologies all conducted within an inherently multidisciplinarycontext. The Geomatics approach takes multiple advanced spatial technologiesand integrates them so that the information can be interpreted by multiple specialists with different backgrounds, fields of expertise, and technical skills.
GIS is the heart of the Geomatics approach. GIS computer systemsallow both mapping and spatial analysis and have developed rapidly overthe past decades. Any information that can be represented on a map can beentered into a GIS. Typically, a GIS database includes human-derived datasuch as political boundaries, zoning and tax maps, roads, and socioeco-nomic information, as well as physical data such as hydrography, land useand land cover, soils, geology, wetlands, elevation, slope, and aspect. Dataderived from satellite imagery, scanned aerial photographs, and historicmaps can also be entered into the system. Electronic maps are thought ofas “data layers” because they represent a single set of attributes or cate-gories of a landscape. All data are co-registered to a common map projec-tion, coordinate system, and datum, so that new combinations of data, evendata derived from different sources at different scales, can be collated andtheir relationships analyzed. Maps can also be tied to existing tabular
11. An Integrated Geomatics Research Program 231
Ch11.qxd 28/7/07 5:30 PM Page 231
databases that contain data derived from many sources, including field work,GPS, etc. A GIS lends itself to the production of compelling graphics thatcan easily be tailored to particular needs. Output in the form of color mapsat any scale, tables, charts, etc. can be created as needed. Three-dimensionalrepresentations showing any combination of data layers draped over the ele-vation can also be viewed on the screen or 3-D maps can be produced. Suchsystems also have the ability to include multimedia capabilities, such asthe ability to incorporate video, field photographs, sound, and scanneddocuments into a single information environment.
Once we have the information from various sources in our system, we canconduct a wide variety of analyses. The ease of testing hypothetical scenar-ios encourages looking at multiple alternatives before we commit ourselves toa given course of action that carries with it financial, environmental, andpolitical costs. GIS also promotes logical problem-solving methods and pro-duces analyses that are easily replicable, based on quantitative methods, andthat are defensible in public meetings and the political process. These appli-cations require only the basic GIS tools. Beyond these basics, powerful spa-tial, statistical, and physical process modeling are all possible using modernGIS technology (e.g., see Scott et al., 2002).
GIS adds a cumulative perspective to long-term analyses. In the past, eachresearcher would conduct fieldwork and publish a paper with a few maps orgraphics. These results would not be cumulative, however, as the nextresearcher would have to start essentially from scratch again. GIS allows usto create a long-term and integrative research system that builds upon previ-ous work, facilitating the testing of new hypotheses over time. GIS tools havebeen used in a variety of ways to help define, model, and solve conservationissues, usually by bringing together into a digital, visual environment separatedata layers, such as processed satellite images of vegetation cover and otherland features, digitized topographic maps, aerial photos of terrain or habitat,and spatial distribution of wildlife (e.g., from GPS data). Commonly,ArcView or Arc/Info software packages, easily run on either a desktop or lap-top computer, provide the GIS environment for the analyses. Most analysesare concerned with a quantitative assessment of the relationship between cur-rent, past, or projected habitat characteristics and a target species’ distribu-tion and abundance. By incorporating data layers across time, GIS analysescan be retrospective and/or prospective in modeling impacts of environmen-tal change on wildlife populations.
2. Data Sources and Processing Methods
Our effort began in 1992 at Rutgers University with a small United StatesAgency for International Development (USAID) grant to the Dian FosseyGorilla Fund International’s (DFGFI) Karisoke Research Center thatincluded the creation of a mountain gorilla habitat map. Although there hadbeen some effort made in that direction in the late 1980s by John Kinneman
232 H. Dieter Steklis et al.
Ch11.qxd 28/7/07 5:30 PM Page 232
and colleagues, it had not resulted in the sought-after habitat map and vege-tation classification. As a result, one of us (HDS), then director of DFGFI’sKarisoke Research Center in Rwanda, contacted his Rutgers colleague ScottMadry at Rutgers’ Center for Remote Sensing and Spatial Analysis(CRSSA), to see whether we could produce a vegetation and topographicmap for the VCA. What began as a seemingly simple project has grown intoa complex, long-term, multidisciplinary collaboration among primatologistsand field biologists, image-processing experts, and GIS specialists, who haveby necessity joined forces in a Geomatics approach to the problem at hand.
In order to achieve our objectives, we required 1) cartographic, remotesensing, and other data to provide a detailed characterization of the gorillahabitat. Such a “base map,” which includes basic environmental and culturalfeatures (elevation contours, streams, trails, national boundaries, parkboundaries, roads) would serve as our GIS foundation, to which all subse-quently acquired data and analyses could be geo-referenced; and 2) dataon gorilla ranging behavior and human activity in the VCA, so as toanalyze gorilla ranging behavior in relation to both environmental features ofthe habitat and patterns of human activity.
2.1. Habitat GISIdeally, a GIS base map is digitized from existing maps of the region that con-tain the environmental and cultural features. While the layers of these featurescan be derived from any source, they must all be appropriately geo-referencedso that all data are in reference to the same geodetic datum and coordinate sys-tem. In our case, what might ordinarily be a relatively straightforward task wascomplicated by the fact that the VCA is comprised of three countries with dif-ferent colonial mapping histories and traditions and different levels of access.In addition, the region is generally poorly mapped and cloud covered most ofthe year. For example, there were no useful maps of the DRC (then Zaire), asthere was a civil war underway in the region, and possession of topographicmaps or aerial photographs was politically sensitive. Unfortunately, the DRCarea accounts for more than half of the VCA (Figure 11.1).
2.1.1. Cartographic Data
We did acquire a set of four 1:50,000 Rwandan topographic maps from the1960s (courtesy of the Institut Géographique National, Paris, France) thatcover Rwanda’s part of the VCA and surrounding area. These did not includeany portions of DRC or Uganda. We also acquired a 1:50,000 topographicmap covering the Ugandan portion of the VCA, which was produced in the1970s by the British Royal Ordnance Survey, using a different datum and mapprojection from the Rwandan maps. Using these maps, we manually digitized,as GIS data layers, the location of national park boundaries, the internationalboundaries, streams, and contours employing the GRASS GIS software, v. 4.2,as developed by the U.S. Army Corps of Engineers, Construction Engineering
11. An Integrated Geomatics Research Program 233
Ch11.qxd 28/7/07 5:30 PM Page 233
Research Laboratory, Champaign, IL (Goren et al., 1993), running on SunUNIX computers. When the Rwandan and Ugandan data were corrected forboth datum and map projection and displayed, it became clear that they didnot correspond, even after extensive digital “massaging.” Nothing matched—contours, the international boundary, streams—all were in different locations.This was clearly an unsatisfactory solution, as nearly one half of the VCA(DRC) was not available, and the available data were dated and questionable atbest. While another source was needed for our base map, the environmentaland cultural features were retained as data layers in our GIS.
In the mid-1990s, we initiated a search for a single topographic map-setthat would cover the entire study area. Our best bet was to find some historicBelgian colonial maps of the region, as the VCA was part of the BelgianCongo. With the help of a Belgian colleague, a search of the Belgian ColonialService records located a 1936–1938 set of four 1:100,000 topographic maps(including elevation contours, roads, streams, lakes, for the entire VCA) at theBelgian Royal Museum of Central Africa in Tervuren. The contours andother features were manually digitized from these maps, as before, using theGRASS GIS module v.digit.
A set of nine 1:50,000 maps from the same period was also acquired. Thesemaps were without contours, but they did show the hydrology, politicalboundaries, roads, and major settlements in more detail. Hence, these fea-tures were also manually digitized as GIS data layers.
These historic maps are still, amazingly enough, the most recent compre-hensive maps of the entire area (covering Rwanda, Uganda, and DRC portionsof the VCA) with significant detail. In modern terms, they are poor in qualityand control, and we have little information about how they were produced.Nevertheless, they provide an important “snapshot” of the entire region as itwas before modern overpopulation, deforestation, and human development.
In 2004, we were fortunate to obtain from the Center for GIS and RemoteSensing of the National University of Rwanda a 1:50,000 scanned map ofthe Rwandan portion of the VCA. This was a mosaic of the four 1960s mapswe had digitized earlier. Because this map was in a Gauss-Kruger projection(Clarke 1880 spheroid and ARC 1960 datum), we re-projected it intoUniversal Transverse Mercator (UTM), zone 35 S, WGS 84, so that it wouldbe compatible with our GPS data as well as that of our collaborators. Thisprovided us with our best approximation of spatial accuracy, given the sourcesat hand. All existing data were converted to this new coordinate system andmap projection, which serves as the base map for all subsequent GIS analyses.
2.1.2. Global Positioning System (GPS) Data
A final but critical data source for our GIS base map consisted of groundtruthing points (e.g., on the ground location of trails, roads, streams) collectedwith GPS units. We began training field staff in 1993, using Trimble GeoExplorerreceivers, and later switched to Garmin GPS 12 units. The GPS units were also
234 H. Dieter Steklis et al.
Ch11.qxd 28/7/07 5:30 PM Page 234
used to map park boundaries and other major features in the area for use in geo-referencing the subsequently acquired satellite imagery. The U.S. government’sdisabling of the Selective Availability (SA) feature on May 2, 2000, improved theGPS data precision from ± 100 m to ± 7 m (95% of readings).
All GPS field data are summarized in spreadsheets. This growing GPSdatabase (near continuous from 1993 to 2003) provides us with the ability toinclude direct field observations into the GIS.
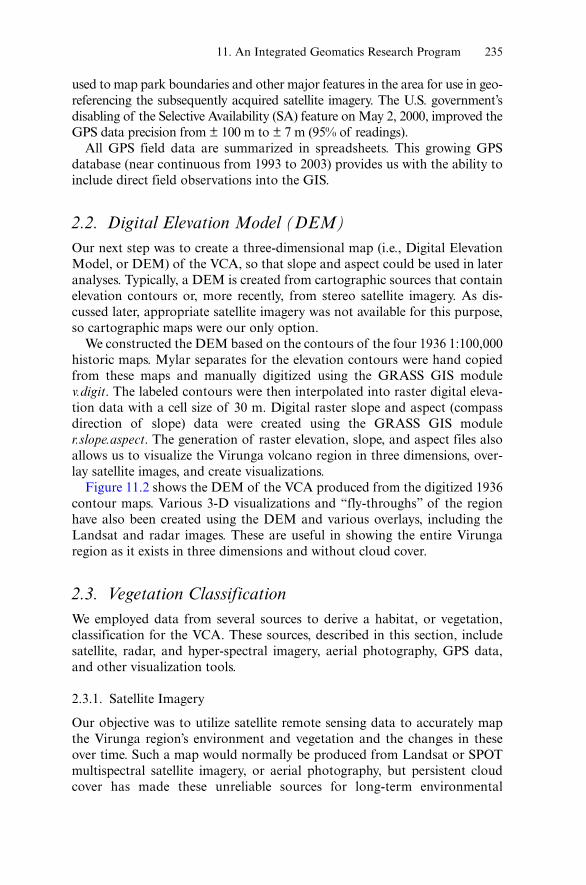
2.2. Digital Elevation Model (DEM)Our next step was to create a three-dimensional map (i.e., Digital ElevationModel, or DEM) of the VCA, so that slope and aspect could be used in lateranalyses. Typically, a DEM is created from cartographic sources that containelevation contours or, more recently, from stereo satellite imagery. As dis-cussed later, appropriate satellite imagery was not available for this purpose,so cartographic maps were our only option.
We constructed the DEM based on the contours of the four 1936 1:100,000historic maps. Mylar separates for the elevation contours were hand copiedfrom these maps and manually digitized using the GRASS GIS modulev.digit. The labeled contours were then interpolated into raster digital eleva-tion data with a cell size of 30 m. Digital raster slope and aspect (compassdirection of slope) data were created using the GRASS GIS moduler.slope.aspect. The generation of raster elevation, slope, and aspect files alsoallows us to visualize the Virunga volcano region in three dimensions, over-lay satellite images, and create visualizations.
Figure 11.2 shows the DEM of the VCA produced from the digitized 1936contour maps. Various 3-D visualizations and “fly-throughs” of the regionhave also been created using the DEM and various overlays, including theLandsat and radar images. These are useful in showing the entire Virungaregion as it exists in three dimensions and without cloud cover.
2.3. Vegetation ClassificationWe employed data from several sources to derive a habitat, or vegetation,classification for the VCA. These sources, described in this section, includesatellite, radar, and hyper-spectral imagery, aerial photography, GPS data,and other visualization tools.
2.3.1. Satellite Imagery
Our objective was to utilize satellite remote sensing data to accurately mapthe Virunga region’s environment and vegetation and the changes in theseover time. Such a map would normally be produced from Landsat or SPOTmultispectral satellite imagery, or aerial photography, but persistent cloudcover has made these unreliable sources for long-term environmental
11. An Integrated Geomatics Research Program 235
Ch11.qxd 28/7/07 5:30 PM Page 235
monitoring in the Virunga area, because this region, due to its specific micro-climate, is often shrouded in mist and clouds. Indeed, a scene search of exist-ing archives for Landsat and SPOT data back to 1984 was conducted, andonly one, mostly cloud-free, Landsat 5 image from August 1987 of the entireregion was available at the start of the project.
To analyze the 1987 Landsat multispectral data, several digital processeshad to be performed. In these and later analyses of remote sensing data, weused ERDAS Imagine software. (Later, we converted all GIS data over tothe ESRI ArcInfo, ArcView 3.X, and ArcGIS 8.X environments runningunder MS Windows, with some additional processing work conductedusing Idrisi.) First, the imagery had to be geometrically corrected to be ableto compare with existing map and GIS data sets. The Landsat system hascrude data on the satellite orbit and sensor parameters that allow the imageto be “calibrated” so that each pixel in the satellite image is related to acoordinate on the ground in a map projection appropriate for our studyarea. Unfortunately, the “calibration” only allows the image pixel to belocated with an accuracy of 500 m to 1 km. This is not sufficiently accurateto correctly tie the image data to previously generated map data for vegetationor other GIS data that had been obtained as discussed above. GIS data wereused to identify Ground Control Points (GCPs) that could be located both inthe imagery and in the GIS data sets. This included road intersections, pointsat which streams crossed roads, and other prominent points. Using polynomialapproximation, we were able from these data sets to increase the placementaccuracy of the image data.
236 H. Dieter Steklis et al.
FIGURE 11.2. Digital Elevation Model of the VCA based on 1936 topographic maps.
Ch11.qxd 28/7/07 5:31 PM Page 236
Once the image rectification process was completed, image enhancementfunctions were performed on the multi-spectral imagery to increase the con-trast between vegetation types in the imagery. Using the enhanced imagery, atechnique known as multi-spectral pattern recognition was performed to sep-arate out vegetation classes within the multi-spectral imagery. Two types ofpattern recognition techniques were attempted: Supervised and unsupervisedclassification. Supervised classification is a technique where, if a user canvisually identify specific regions of different vegetation types in the image bymanually drawing polygons on the imagery and extracting statistics, then thecomputer can find regions in the image that have the same or a similar spec-tral signature. Since at the time the only “ground truth” information thatexisted was McNeilage’s (1995) vegetation map at a much coarser scale, hisvegetation map was overlaid on the imagery and used to try to identifyregions that corresponded to color variations in the Landsat. This techniquewas not as satisfactory as subsequent unsupervised classification techniques.In this technique, the computer analyzes all spectral bands of Landsat (sixbands in the visible and near infrared) and automatically determines whichpixels in the image “look alike” based on some parameters provided by theuser. The user selects the number of classes to be separated, and based onspectral distance calculations, the computer algorithms take each pixel andcategorize it into one of those classes. The initial classifications used 50classes. Once the unsupervised classification had been performed, the userwas required to identify (again from limited “ground truth” data) what eachcategory represented in terms of vegetation. This initial classification showedmore detail than McNeilage’s vegetation map, but it had never been checkedin the field with higher resolution data sets.
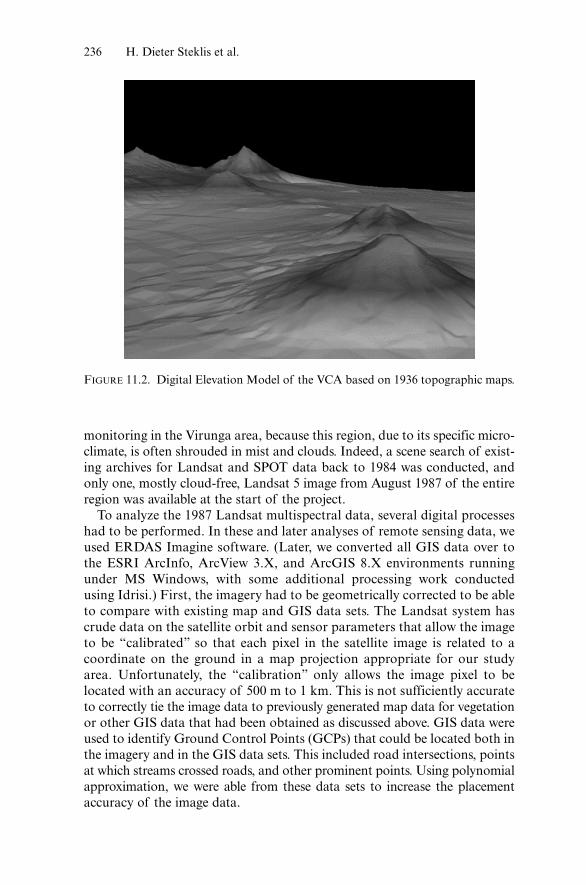
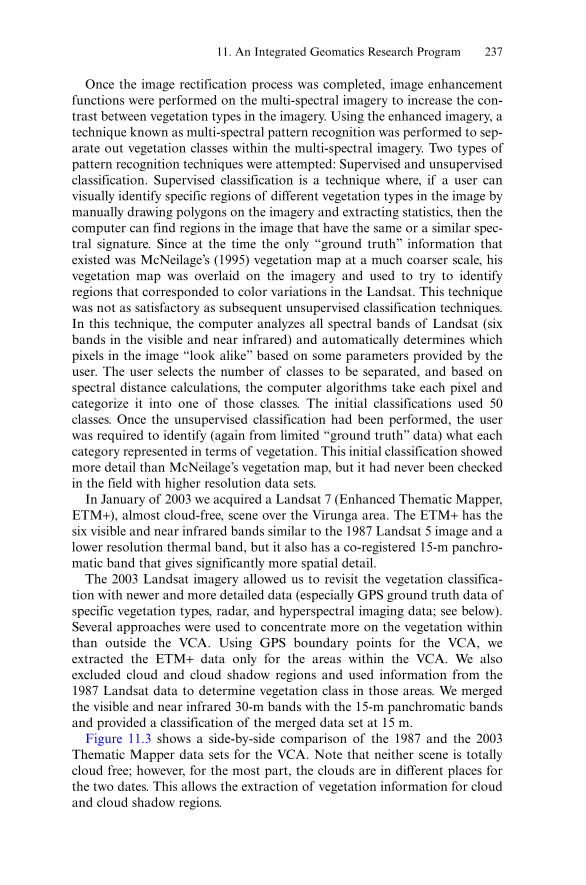
In January of 2003 we acquired a Landsat 7 (Enhanced Thematic Mapper,ETM+), almost cloud-free, scene over the Virunga area. The ETM+ has thesix visible and near infrared bands similar to the 1987 Landsat 5 image and alower resolution thermal band, but it also has a co-registered 15-m panchro-matic band that gives significantly more spatial detail.
The 2003 Landsat imagery allowed us to revisit the vegetation classifica-tion with newer and more detailed data (especially GPS ground truth data ofspecific vegetation types, radar, and hyperspectral imaging data; see below).Several approaches were used to concentrate more on the vegetation withinthan outside the VCA. Using GPS boundary points for the VCA, weextracted the ETM+ data only for the areas within the VCA. We alsoexcluded cloud and cloud shadow regions and used information from the1987 Landsat data to determine vegetation class in those areas. We mergedthe visible and near infrared 30-m bands with the 15-m panchromatic bandsand provided a classification of the merged data set at 15 m.
Figure 11.3 shows a side-by-side comparison of the 1987 and the 2003Thematic Mapper data sets for the VCA. Note that neither scene is totallycloud free; however, for the most part, the clouds are in different places forthe two dates. This allows the extraction of vegetation information for cloudand cloud shadow regions.
11. An Integrated Geomatics Research Program 237
Ch11.qxd 28/7/07 5:31 PM Page 237
2.3.2. Space Radar
A relatively new and powerful technology, space imaging radar, is now avail-able from several civilian satellite systems, including advanced systems devel-oped by NASA. RADAR stands for radio detection and ranging. It refers toelectronic equipment that detects the presence, composition, direction, height,and distance of objects by using reflected electromagnetic energy. Unlike otherenvironmental satellite systems like Landsat and SPOT, the electromagneticenergy wavelengths used in imaging radar can penetrate clouds (and even drysand in some cases), and an imaging radar system can acquire data day ornight. This is because radar satellites are “active” systems, meaning that theycarry their own energy source that is transmitted to the ground. The reflectedenergy is recorded, stored, and digitally processed to make an image or map.
In 1994, NASA was flying its third research radar system (The SpaceborneImaging Radar–Version C and the X-band Synthetic Aperture Radar, or SIR-C/X-SAR) on the Space Shuttle Endeavor (Jordan et al., 1991; Stuhr, et al.,1995). A colleague at NASA arranged for the VCA to be imaged during theApril and October 1994 shuttle flights. Before the SIR-C/X-SAR mission, radarimaging satellites used a single band and polarization for each image. Thismeant that each dataset could only produce a black-and-white image. SIR-C/X-SAR allowed for multiple simultaneous bands (C, L, and X) and polar-izations, which could be combined to create color images (see below).
The resulting data are very accurate with regard to locating features on theground, and have a 15-m spatial resolution. However, radar imagery requiresa great deal of processing and computer manipulation to produce an image,much more than passive remote sensing systems such as Landsat. The data,therefore, were pre-processed at the Jet Propulsion Laboratory, which
238 H. Dieter Steklis et al.
FIGURE 11.3. Landsat images from 1987 (on left) and 2003 showing the VCA withdifferent patterns of cloud cover (in white).
Ch11.qxd 28/7/07 5:31 PM Page 238
included geometric correction of the data, and then sent to us in digital for-mat for further analysis and integration with our other GIS data.
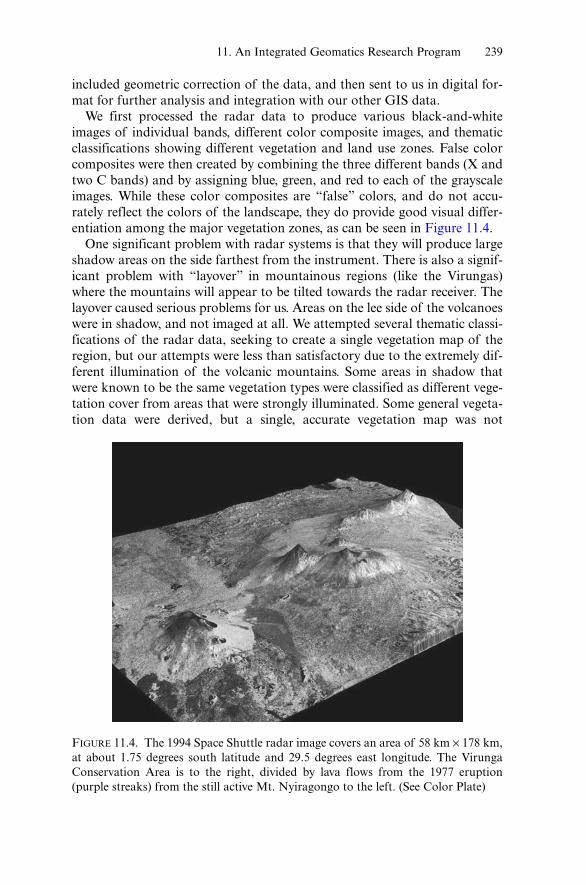
We first processed the radar data to produce various black-and-whiteimages of individual bands, different color composite images, and thematicclassifications showing different vegetation and land use zones. False colorcomposites were then created by combining the three different bands (X andtwo C bands) and by assigning blue, green, and red to each of the grayscaleimages. While these color composites are “false” colors, and do not accu-rately reflect the colors of the landscape, they do provide good visual differ-entiation among the major vegetation zones, as can be seen in Figure 11.4.
One significant problem with radar systems is that they will produce largeshadow areas on the side farthest from the instrument. There is also a signif-icant problem with “layover” in mountainous regions (like the Virungas)where the mountains will appear to be tilted towards the radar receiver. Thelayover caused serious problems for us. Areas on the lee side of the volcanoeswere in shadow, and not imaged at all. We attempted several thematic classi-fications of the radar data, seeking to create a single vegetation map of theregion, but our attempts were less than satisfactory due to the extremely dif-ferent illumination of the volcanic mountains. Some areas in shadow thatwere known to be the same vegetation types were classified as different vege-tation cover from areas that were strongly illuminated. Some general vegeta-tion data were derived, but a single, accurate vegetation map was not
11. An Integrated Geomatics Research Program 239
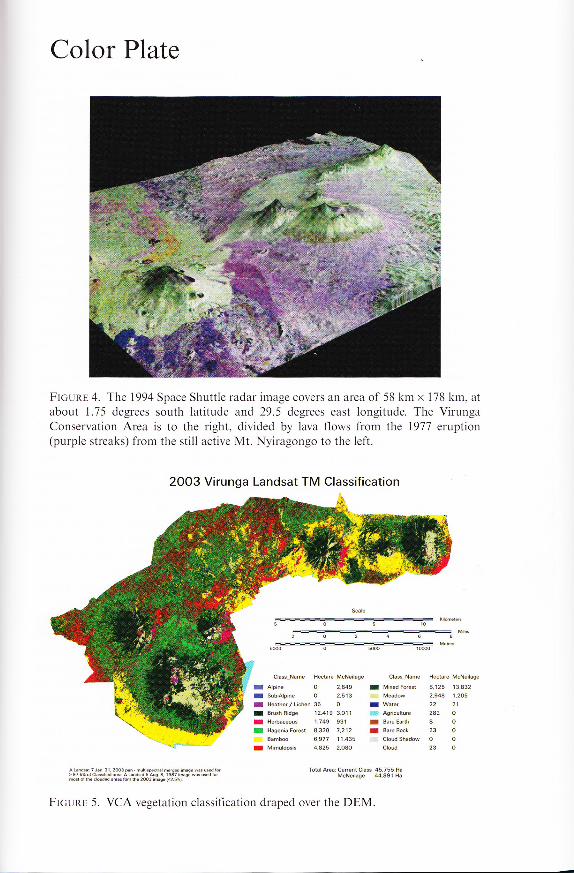
FIGURE 11.4. The 1994 Space Shuttle radar image covers an area of 58 km × 178 km,at about 1.75 degrees south latitude and 29.5 degrees east longitude. The VirungaConservation Area is to the right, divided by lava flows from the 1977 eruption (purple streaks) from the still active Mt. Nyiragongo to the left. (See Color Plate)
Ch11.qxd 28/7/07 5:31 PM Page 239
produced. Nevertheless, several areas within the VCA that contained accu-rate vegetation data proved helpful to our final vegetation classification.
2.3.4. Aerial Photography
Vertical aerial photography is the source of most cartographic products andmaps. Such photographs are excellent sources of high-resolution vegetationand land use data. They can be used to assist in identifying vegetation cate-gories, to provide information about changes over time, and to assist in clas-sifying satellite data. Our search for aerial photos turned up several setscovering Rwanda at the Institut Géographique National (IGN) in Paris, butwe could not get copies without permission of the Rwandan government,which at that time was in turmoil. McNeilage (1995), however, did haveaccess to a second generation set of high-altitude 1950s black-and-whiteaerial photographs of the region. These photographs were 35-mm copies ofthe original 9 × 9 inch Rwandan mapping photos.
These aerial photographs were photo interpreted using stereo pairs and azoom transfer scope by McNeilage (McNeilage, 1995) at Rutgers’ CRSSA.A zoom transfer scope is a manual photo interpretation and mapping devicethat uses mirrors to allow the user to plot features on a photograph accu-rately onto a map. Aerial photographs are very useful, but they contain sig-nificant spatial error due to various types of displacement of features on thephotograph caused by elevation differences, camera lens imperfections, andradial displacement out from the nadir point directly under the lens. In thiscase, these errors were worsened by the fact that the photographs are secondgeneration, taken by a 35-mm camera held over the original mapping photos.Therefore, features on an uncontrolled aerial photograph cannot be directlytransferred to a map without significant spatial error. The zoom transferscope avoids this problem for the most part.
Based on these photos, the 1:100,000 topographic map, and his extensivefield experience, McNeilage produced a vegetation classification of the VCAthat showed eight habitat types. The aerial photos served to delimit each ofthe eight habitat types as polygons in a GIS. While this polygon classificationmethod is relatively crude and does not likely reflect the heterogeneity withinthe polygons, it was nevertheless an important first step in a quantitative def-inition of the VCA’s major vegetation zones. Moreover, this map served wellin our subsequent satellite imagery classification process.
2.3.5. Hyperspectral Imagery
In August 1999, we acquired data of higher spatial (approximately 5 m) andspectral (hyper-spectral imagery) resolution over the Virunga area (courtesy ofa collaboration between Earth Search Sciences Incorporated [ESSI], DFGFI,and the National Geographic Society). Hyper-spectral imagery may have asmany as 512 spectral bands that cover the visible and near infrared parts ofthe spectrum. Computational analysis of this massive amount of data can
240 H. Dieter Steklis et al.
Ch11.qxd 28/7/07 5:31 PM Page 240
provide more detailed discrimination of vegetation types than is possibleeither from panchromatic or multi-spectral data (e.g., Landsat or Spot).
The hyper-spectral data were acquired from a light plane equipped with thesensor (ESSI’s Probe 1) and flown over the Virunga area over the course oftwo days. Numerous flight lines of data were acquired (about 45) in order tomap as much as possible of the habitat. As is customary, the mountains werecovered with clouds, and flights had to be modified to steer around or under(not always possible) clouds. Most of the flight lines recorded had significantproblems with roll and yaw of the aircraft and the presence of haze andclouds that prevented a clear image of the surface below. The pilot triedto keep the plane at an altitude such that the pixel size on the ground wasrelatively consistent, but this was not always possible. Even though the Probe1 instrument can record 128 spectral bands, only 64 of the bands containedmeaningful data, possibly due to calibration or sensitivity issues. We decidedto use the hyper-spectral data as a kind of “ground truth” for the limited areasin which we had coverage since the higher spatial resolution gives a moredetailed understanding of the vegetation distribution.
2.3.6. GPS and Visualizations
As mentioned previously, we have accumulated a large database of GPS posi-tions with associated habitat attributes. Since the mid-1990s, our Karisokefield staff have collected such attribute data when GPS positions are recordedfor the location of gorilla nests and group locations at noon. Moreover, wehave made a systematic effort since 1993 to collect GPS data for all vegeta-tion types (following McNeilage and others, see below) during the frequentfield trips by members of the Geomatics team. This database was a criticalresource for deriving the final VCA vegetation classification (Section 3).
2.4. Gorilla RangingIn this section, we discuss the data sources used in our analyses of gorillaranging behavior. For our analysis of recent group ranges, these data include,principally, GPS field data of group movement. In order to bring a historicaldimension to gorilla group ranging behavior, we also make use of archivalranging maps prepared during the 1980s.
2.4.1. GPS Data
Our field staff has been logging daily gorilla group movements since 1993. Thedaily gorilla group location data, for three to four groups in the Karisoke sec-tor, consists of the previous night’s nest location in the morning (i.e., thegroup’s starting point for the day’s travel at sunup) and group position at noon(essentially, the position of the group every six hours during the day). GPSdata are also recorded for lone males as well as interactions between groups.
11. An Integrated Geomatics Research Program 241
Ch11.qxd 28/7/07 5:31 PM Page 241
2.4.2. Fossey Maps
Our archival library includes the original, hand-drawn gorilla movement mapscreated by Fossey as part of her 1984–1985 research on gorilla group habitatuse. These maps were created each month in the field for three to four groups,as well as lone males, in the Karisoke sector of the VCA, and we have a totalof 23 monthly maps (September 1984 is missing). Fossey produced these byenlarging the area around the volcanoes Karisimbi and Visoke on the 1930svolcanology map (Belgian Geological Survey). This topographic map,described earlier, was the only map available to Fossey and other researchersat Karisoke at that time. Fossey used a commercial Xerox machine severaltimes (with different amounts of magnification) to enlarge the area betweenthe volcanoes where she followed gorillas. The daily locations and trails of thegroups and the lone males, were drawn on a Mylar overlay for each day.
These maps permitted us to extend our analysis of gorilla ranging to theyears prior to 1993, when we first began collecting gorilla ranging and poach-ing data with GPS technology. Although of great historical value, there wereseveral problems with these maps. First, they are in very poor condition (e.g.,stains, rips, and tears). More importantly, there are several watermarks wherethe patterns of gorilla movement (marked in non-waterproof ink!) areobliterated. It appears that several different Xerox background volcanologymaps of different magnifications were used, so geo-referencing them waschallenging. We used various volcanic lakes on the scanned modern maps asreference marks. Not all group locations are marked on all days, and some ofthe monthly movement patterns are in such a tight pattern that instead ofshowing a clear line, they more resemble a plate of spaghetti. In these cases,we utilized an automated GIS line thinning function with limited success. Inthe maps where we could not discern the movement pattern over some days,we created a polygon to represent the area of gorilla activity over those days.
The digitized Fossey maps, in combination with the ranging data from the1990s onward, allows us to compare gorilla ranging behavior and examinepatterns of continuity and change in the Karisoke sector over a 20-year timeframe. The final GIS database can be queried, and individual days or monthscan be called up for individual groups. All groups can be viewed on a givenday, or specific groups can be visually tracked over a given period of time. Thismakes possible our analysis of gorilla movement patterns in relation to vari-ous environmental and cultural data such as vegetation zones, distance to parkboundary, elevation zones, slope, and poaching activity.
2.5. Human Activity Data Sources2.5.1. Anti-poaching Records and GPS
The anti-poaching records kept by field staff go back to 1978, but prior to1993, they do not contain GPS location data. For the present exploratoryanalyses, we used 2003 GPS data collected by the Karisoke anti-poachingpatrols. The GPS data include attribute data for all evidence of poaching
242 H. Dieter Steklis et al.
Ch11.qxd 28/7/07 5:31 PM Page 242
(e.g., snare traps, footprints, shelters, cut wood, weapons) encountered by thepatrol on a given day.
3. Analysis and Results
In this section, we present our results to date on the Virunga habitat classifi-cation and analyses of gorilla ranging behavior in relation to human activity.Our gorilla ranging behavior analyses must be regarded as preliminary. Wehave selected some initial analyses more to convey the utility of theGeomatics approach than to reach any conclusions about the dynamics ofgorilla ranging behavior.
3.1. Virunga Habitat GISPrior to conducting the GIS analyses, it was necessary to manipulate the datainto the proper raster, vector, or point data format. Some raster data werethen reclassified, re-combined, buffered, or otherwise manipulated in orderto get the data into the proper categories and structure for the final analyses.This process is referred to as intermediate data processing. The final analysisand modeling routines are conducted using raster data for each of the indi-vidual study areas with a cell resolution of 30 m. This cell size was chosenbecause the digital elevation, slope, and Landsat-derived landcover data allhave 30-m cell sizes. Each 30 × 30 m cell in each “layer” in the GIS containsan individual value for each layer in the database.
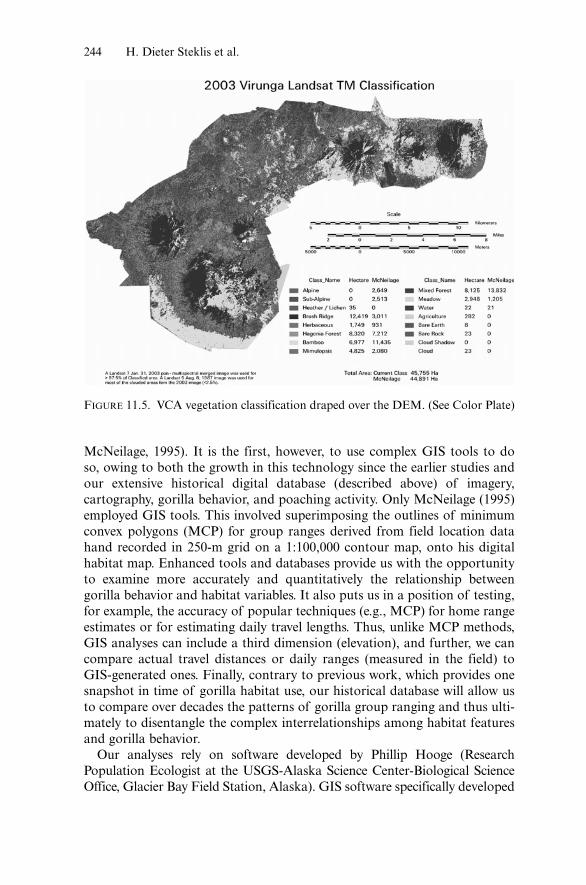
Figure 11.5 shows our vegetation classification. As stated earlier, this clas-sification was derived from the 2003 Landsat data along with the variousother sources described earlier, and the resulting classified Landsat image hasbeen draped over the DEM developed earlier. Our classification consists of12 habitat types, which, with the exception of the Heather/Lichen, BareEarth, Bare Rock, and Agriculture classes follows the definitions provided byMcNeilage (1995). The habitat GIS database, of course, contains much addi-tional information, as separate data layers, such as streams and trails that canbe utilized in later analyses.
As McNeilage (1995) provides the only GIS-based vegetation classificationfor the Virungas, Figure 11.5 also compares the percentages of each of eight ofthe classifications provided by us and McNeilage. McNeilage used subalpine(3300–3600 m) and alpine (3600 m and above) altitude classes. Since the latter classes are not habitat types per se, in our classification we derived habitatclasses (e.g., Heather/Lichen) within the sub-alpine and alpine classes.
3.2. Gorilla Ranging BehaviorOur analysis of gorilla group ranging in the Virungas is not the first toexamine the variables that determine gorilla ranging behavior or habitat use(e.g., Fossey, 1974; Fossey and Harcourt, 1977; Vedder, 1984; Watts, 1991;
11. An Integrated Geomatics Research Program 243
Ch11.qxd 28/7/07 5:31 PM Page 243
McNeilage, 1995). It is the first, however, to use complex GIS tools to doso, owing to both the growth in this technology since the earlier studies andour extensive historical digital database (described above) of imagery,cartography, gorilla behavior, and poaching activity. Only McNeilage (1995)employed GIS tools. This involved superimposing the outlines of minimumconvex polygons (MCP) for group ranges derived from field location datahand recorded in 250-m grid on a 1:100,000 contour map, onto his digitalhabitat map. Enhanced tools and databases provide us with the opportunityto examine more accurately and quantitatively the relationship betweengorilla behavior and habitat variables. It also puts us in a position of testing,for example, the accuracy of popular techniques (e.g., MCP) for home rangeestimates or for estimating daily travel lengths. Thus, unlike MCP methods,GIS analyses can include a third dimension (elevation), and further, we cancompare actual travel distances or daily ranges (measured in the field) toGIS-generated ones. Finally, contrary to previous work, which provides onesnapshot in time of gorilla habitat use, our historical database will allow usto compare over decades the patterns of gorilla group ranging and thus ulti-mately to disentangle the complex interrelationships among habitat featuresand gorilla behavior.
Our analyses rely on software developed by Phillip Hooge (ResearchPopulation Ecologist at the USGS-Alaska Science Center-Biological ScienceOffice, Glacier Bay Field Station, Alaska). GIS software specifically developed
244 H. Dieter Steklis et al.
FIGURE 11.5. VCA vegetation classification draped over the DEM. (See Color Plate)
Ch11.qxd 28/7/07 5:31 PM Page 244

for use in wildlife tracking and analysis is rare, and most generic GIS functions are not well suited for this analysis. Hooge had written a series ofsoftware extensions to the popular ArcView Spatial Analyst 2.x/3.X softwarethat was specifically designed for the spatial analysis of animal movements(Hooge and Eichenlaub, 2000). His “Animal Movement” software containsmore than 40 routines that are specifically designed to analyze animal move-ment patterns. Many of the functions are implementations of algorithmsderived from reviews of the published scientific literature such as fixed kernelhome range utilization distribution, minimum convex polygons, descriptivestatistics of the animal location point patterns, and point in polygon analysisand histograms, to name a few. The software is written in the Avenue script-ing language, and there are no plans to port the code to Visual Basic to rununder ArcGIS. This necessitated our running both ArcView and ArcGISenvironments, but the tailored capabilities of the software for this applicationmake it worth the effort.
For our initial analyses, we generated several monthly and complete annualranges for the three Karisoke groups during 2003 using the MCP function ofthe Animal Movement program. The results were used to 1) compare overlapin a sample of monthly group ranges to that of annual ranges; and 2) deter-mine range size in relation to group size (obtained from our long-termdemography database).
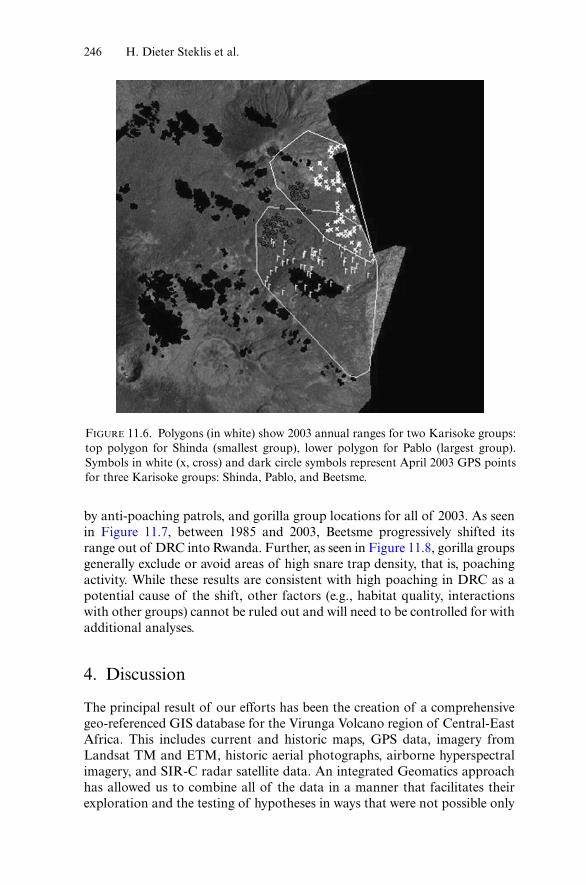
Figure 11.6 shows each of the three groups’ ranges for April 2003 (indi-cated by the daily GPS locations) and their 2003 annual ranges (indicatedby the polygons). Although a statistical comparison is not possible, dif-ferences in group size (i.e., Shinda, upper polygon is smaller than Pablo’s)appear to correspond well with differences in annual range size, a findingconsistent with previously established correlations between daily traveldistance and group size (Watts, 1991) and between group biomass andrange size (McNeilage, 1995).
In comparing the annual range of Beetsme group for 2003 to that plottedby McNeilage (1995), it is apparent that on McNeilage’s map (representing1991–1993 data) Beetsme extended its range far deeper into DRC than it didduring 2003.
This difference in the extent of home range for Beetsme’s group prompteda second analysis in which we explored the possible reasons for the apparentshift in Beetsme’s range. One reason for the change might be the reportedincreased poaching activity in DRC (primarily buffalo) and refugee move-ment through the gorilla habitat during and following the 1994 civil war. Onetest is to compare the recent home range of Beetsme’s group as established byFossey in 1985 to that estimated by McNeilage and by us in both 2002 and2003. Another test is to examine the 2003 group ranges in relation to loca-tions of poaching activity from the same year entered into the GIS database.
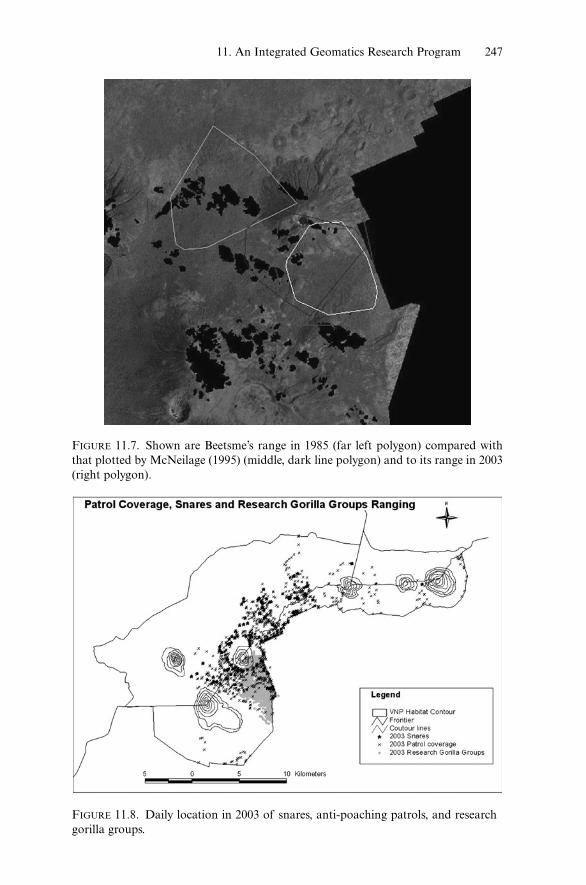
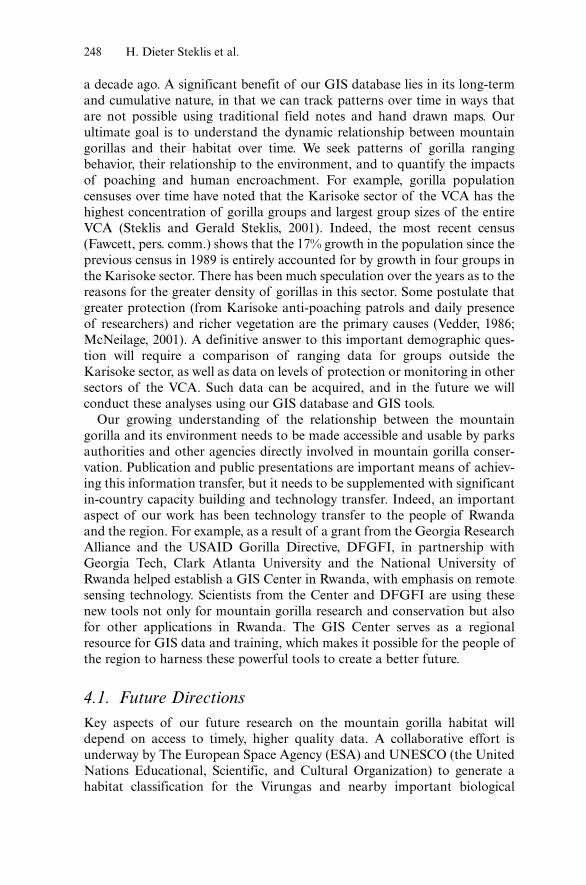
Figure 11.7 provides a comparison of the ranges of Beetsme’s group between1985 and 2003, while Figure 11.8 shows the relationship between the daily location of poaching activity (i.e., snares set for antelope and hyrax), coverage
11. An Integrated Geomatics Research Program 245
Ch11.qxd 28/7/07 5:31 PM Page 245
by anti-poaching patrols, and gorilla group locations for all of 2003. As seenin Figure 11.7, between 1985 and 2003, Beetsme progressively shifted itsrange out of DRC into Rwanda. Further, as seen in Figure 11.8, gorilla groupsgenerally exclude or avoid areas of high snare trap density, that is, poachingactivity. While these results are consistent with high poaching in DRC as apotential cause of the shift, other factors (e.g., habitat quality, interactionswith other groups) cannot be ruled out and will need to be controlled for withadditional analyses.
4. Discussion
The principal result of our efforts has been the creation of a comprehensivegeo-referenced GIS database for the Virunga Volcano region of Central-EastAfrica. This includes current and historic maps, GPS data, imagery fromLandsat TM and ETM, historic aerial photographs, airborne hyperspectralimagery, and SIR-C radar satellite data. An integrated Geomatics approachhas allowed us to combine all of the data in a manner that facilitates theirexploration and the testing of hypotheses in ways that were not possible only
246 H. Dieter Steklis et al.
FIGURE 11.6. Polygons (in white) show 2003 annual ranges for two Karisoke groups:top polygon for Shinda (smallest group), lower polygon for Pablo (largest group).Symbols in white (x, cross) and dark circle symbols represent April 2003 GPS pointsfor three Karisoke groups: Shinda, Pablo, and Beetsme.
Ch11.qxd 28/7/07 5:31 PM Page 246
11. An Integrated Geomatics Research Program 247
FIGURE 11.7. Shown are Beetsme’s range in 1985 (far left polygon) compared withthat plotted by McNeilage (1995) (middle, dark line polygon) and to its range in 2003(right polygon).
FIGURE 11.8. Daily location in 2003 of snares, anti-poaching patrols, and researchgorilla groups.
Ch11.qxd 28/7/07 5:31 PM Page 247
a decade ago. A significant benefit of our GIS database lies in its long-termand cumulative nature, in that we can track patterns over time in ways thatare not possible using traditional field notes and hand drawn maps. Ourultimate goal is to understand the dynamic relationship between mountaingorillas and their habitat over time. We seek patterns of gorilla rangingbehavior, their relationship to the environment, and to quantify the impactsof poaching and human encroachment. For example, gorilla populationcensuses over time have noted that the Karisoke sector of the VCA has thehighest concentration of gorilla groups and largest group sizes of the entireVCA (Steklis and Gerald Steklis, 2001). Indeed, the most recent census(Fawcett, pers. comm.) shows that the 17% growth in the population since theprevious census in 1989 is entirely accounted for by growth in four groups inthe Karisoke sector. There has been much speculation over the years as to thereasons for the greater density of gorillas in this sector. Some postulate thatgreater protection (from Karisoke anti-poaching patrols and daily presenceof researchers) and richer vegetation are the primary causes (Vedder, 1986;McNeilage, 2001). A definitive answer to this important demographic ques-tion will require a comparison of ranging data for groups outside theKarisoke sector, as well as data on levels of protection or monitoring in othersectors of the VCA. Such data can be acquired, and in the future we willconduct these analyses using our GIS database and GIS tools.
Our growing understanding of the relationship between the mountaingorilla and its environment needs to be made accessible and usable by parksauthorities and other agencies directly involved in mountain gorilla conser-vation. Publication and public presentations are important means of achiev-ing this information transfer, but it needs to be supplemented with significantin-country capacity building and technology transfer. Indeed, an importantaspect of our work has been technology transfer to the people of Rwandaand the region. For example, as a result of a grant from the Georgia ResearchAlliance and the USAID Gorilla Directive, DFGFI, in partnership withGeorgia Tech, Clark Atlanta University and the National University ofRwanda helped establish a GIS Center in Rwanda, with emphasis on remotesensing technology. Scientists from the Center and DFGFI are using thesenew tools not only for mountain gorilla research and conservation but alsofor other applications in Rwanda. The GIS Center serves as a regionalresource for GIS data and training, which makes it possible for the people ofthe region to harness these powerful tools to create a better future.
4.1. Future DirectionsKey aspects of our future research on the mountain gorilla habitat willdepend on access to timely, higher quality data. A collaborative effort isunderway by The European Space Agency (ESA) and UNESCO (the UnitedNations Educational, Scientific, and Cultural Organization) to generate ahabitat classification for the Virungas and nearby important biological
248 H. Dieter Steklis et al.
Ch11.qxd 28/7/07 5:31 PM Page 248
regions. At the 52nd International Astronautical Congress in October 2001in Toulouse, France, ESA and UNESCO presented their new initiative on themonitoring of World Heritage sites using space technology, including Earthobservation satellites. The Virunga region is the first test case. A new satellite,ENVISat, will have a powerful radar imager, and ESA has committed toacquire numerous images of the region for several years. A major product willbe a new 1:25,000 basemap of the VCA, to be generated collaboratively by ourteam and others. The overall goal is to create a new remote sensing unit insidethe UNESCO World Heritage Center, to create a new virtual network of co-operating entities, and to increase the capabilities in the areas of remote sens-ing and monitoring within developing countries. DFGFI is participating inthis new, international collaboration that will provide important new data tomonitor natural and human-induced changes in the Virunga region.
New radar imagery recently acquired by NASA can also significantlyimprove the accuracy of our Virunga DEM. In 2000, NASA and theNational Image and Mapping Agency (now National Geospatial Agency) ofthe U.S. Defense Department flew a third flight of the SIR-C radar. The SIR-C/X-SAR missions of 1994 proved that interferometry from space waspractical using the system. Interferometry is the creation of DEMs using twodifferent radar images taken from different angles. The Shuttle Radar TerrainMapping (SRTM) Mission flew February 11–22, 2000, using a modifiedversion of the same radar instrument that comprised the SIR-C/X-SAR in1994. SRTM was designed to collect 3-D measurements of the Earth’ssurface (NASA, 2003). To collect the 3-D data, engineers added a 60-m(approximately 200-ft) mast, installed additional C-band and X-band anten-nas, and improved tracking and navigation devices. The mission is a cooper-ative project between NASA, the National Imagery and Mapping Agency(NIMA) of the U.S. Department of Defense (DOD), and the German andItalian space agencies. It is managed by NASA’s Jet Propulsion Laboratory(JPL), Pasadena, California, for NASA’s Earth Science Enterprise,Washington, D.C.
Once these data are made available, they will give us a superbly accurate90-m resolution DEM of the entire region for analysis (or possibly 30 m if itwill be released to us). The data have already been processed at JPL, but havenot been released outside of NASA and DOD. Once released, the imagerywill be a great improvement over the original DEM produced from 1930scontour maps, as described earlier. We will compare the two datasets, and willhave to re-run our analyses if there are significant differences.
A future direction of our research program concerns the historical devel-opment of the VCA. This includes the changes in the park boundaries,human population and encroachment patterns, and vegetation changes overtime going back to the origins of the Albert National Park. The incorpora-tion of historical cartographic data into GIS analysis is a fairly recent devel-opment (Knowles, 2002), but one that has significant potential benefit to ourresearch.
11. An Integrated Geomatics Research Program 249
Ch11.qxd 28/7/07 5:31 PM Page 249
We have acquired historic cartographic and photographic data through vis-its to the Royal Museum of Central Africa (Musee Royal de l’AfriqueCentral), Tervuren, Belgium, and the British National Archives in London in2003. There we found significant new information regarding the 1936–19381:100,000 and 1:50,000 maps, the volcanology map used by Fossey, and otherhistorical data for the Virunga region. These data are currently beingprocessed into our Virunga GIS database.
In London, we reviewed text documents and original maps from theBritish Ministry of Defense, the Colonial Office, and the Foreign Office, alllocated at the National Archives. Again, high-resolution color scans of 14maps, dating from between 1906 and 1922, were provided to us on CD-ROM.These data are also currently being processed into our GIS system, and,together with the Belgian historical data, they will provide the basis for ourdocumentation of historic changes in the VCA.
Finally, we plan to expand the scope of our gorilla ranging analyses toinclude further cross-sectional and longitudinal analyses using environmentaland demographic variables contained in our long-term database. Theseanalyses will add to our understanding of gorilla biology and behaviorand, most importantly, will provide a sound knowledge base for rational andeffective conservation management.
Acknowledgements The initial GIS database development and imageryanalyses were conducted at the CRSSA, Rutgers University. Later and cur-rent work has been conducted at the University of North Carolina atChapel Hill, Informatics International, Inc. of Chapel Hill, NorthCarolina, and the Georgia Tech Research Institute of Atlanta, Georgia.Many research associates and students have contributed their time andexpertise to this project over the years. We particularly thank Rich Bochkay(CRSSA, Rutgers University), Paul Beatty (Georgia Institute ofTechnology), Bob Wiencek (CRSSA, Rutgers University), Dr. Larry Lass(University of Idaho–Moscow), Jen LeClair (Rutgers University), AmyJacobson (Rutgers University), and Theresa McReynolds (University ofNorth Carolina, Chapel Hill).
We also wish to express our appreciation to the NASA/Cal Tech JetPropulsion Laboratory SIR-C/X-SAR Program staff for their assistance inacquiring the SIR-C data. Stephan Maas located the historic Belgian1:50:000 and 100,000 maps for us, and we are grateful to the Belgian RoyalMuseum of Central Africa in Tervuren and the British National Archives inLondon for their assistance in providing archival maps of the region. We alsothank Dr. Annette Lanjouw of the International Gorilla ConservationProgram for the contribution of the Virunga toponym data. Grateful appre-ciation is extended to the staff, donors, and supporters of the Dian FosseyGorilla Fund International. Significant funding for this research wasprovided by the U.S. Agency for International Development and the Georgia
250 H. Dieter Steklis et al.
Ch11.qxd 28/7/07 5:31 PM Page 250
Research Alliance. Additional funding was provided by the MacArthurFoundation, the Daniel K. Thorne Foundation, the National GeographicSociety, and ESSI. In-kind donations of equipment and software have beenprovided by Trimble GPS, ERDAS, and the iPIX Corporation. We thank thethree national parks authorities of Rwanda (ORTPN), DRC (ICCN), andUganda (UWA) for permitting and facilitating our research in the Virungaregion. We also thank Sir Arthur C. Clarke for his continuing inspiration andfor his assistance in facilitating aspects of this project. Finally, we wish toexpress our heartfelt thanks and respect to the expatriate DFGFI staff of theKarisoke Research Center, and particularly to the Center’s Rwandan fieldstaff, many of whom lost their lives protecting the mountain gorillas, andwhose courageous, tireless efforts assure the gorillas’ continued survival. Inthe end, we acknowledge the mountain gorillas of the Virungas, and theirright to exist. Information about our research and products can be viewed onthe following websites: www.gorillafund.org, www.informatics.org/gorilla.
ReferencesFischer, E., and Hinkel, H. (1992). Natur Ruandas: La Nature du Rwanda. Rhein-
Main Druck, Mainz.Fossey, D. (1974). Observations on the home range of one group of mountain goril-
las (Gorilla gorilla beringei). Animal Behaviour. 22:568–581.Fossey, D., and Harcourt, A.H. (1977). Feeding ecology of free-ranging mountain
gorilla (Gorilla gorilla beringei). In: Clutton-Brock, T. H. (ed.) Primate Ecology:Studies of Feeding and Ranging Behaviour in Lemurs, Monkeys, and Apes. AcademicPress, New York, pp. 415–447.
Gerald, C.N. (1995). Demography of the Virunga mountain gorilla (Gorilla gorillaberingei). MSc. Disseration, Princeton University, Princeton, NJ.
Goren, et al., (1993). GRASS 4.2 Users Manual. Army Corps of EngineersConstruction Engineering Research Laboratories, Champaign, IL.
Harcourt, A.H. (1995). Population viability estimates: theory and practice for a wildgorilla population. Conservation Biology. 9:134-142.
Harcourt, A.H. (1999). Biogeographic relationships of primates on South-East AsianIslands. Global Ecology and Biogeography. 8(1):55–61.
Hooge, P.N., and Eichenlaub, B. (2000). Animal movement extension to Arcview.Alaska Science Office, U.S. Geological Survey, Anchorage, AK.
IUCN (2002). 2002 IUCN Redlist of Threatened Species. IUCN, Gland, Switzerland.Jernvall, J., and Wright, P.C. (1998). Diversity components of impending primate
extinctions. Proc. Natl. Acad. Sci. USA. 95:11279–11283.Jordan, R.L., Huneycutt, B.L., and Werner, M. (1991). The SIR-C/X-SAR Synthetic
Aperture Radar System. Proc. of the IEEE. 79:827–838.Kalpers, J., Williamson, E.A., Robbins, M.M., McNeilage, A., Nzamurambaho,
A., Lola, N., and Mugiri, G. (2003). Gorillas in the crossfire: population dynam-ics of the Virunga mountain gorillas over the past three decades. Oryx.37(3):326–337.
Knowles, A.K. (2002). Past Time, Past Place: GIS for History. Esri Press, Redlands, CA.
11. An Integrated Geomatics Research Program 251
Ch11.qxd 28/7/07 5:31 PM Page 251
McNeilage, A.J. (1995). Mountain Gorillas in the Virunga Volcanoes: Ecology andCarrying Capacity. Ph.D. Dissertation. School of Biological Sciences. University ofBristol, Bristol, UK.
McNeilage, A.J. (2001). Diet and habitat use of two mountain gorilla groups in con-trasting habitats in the Virungas. In: Robbins, Sicotte, P., and Stewart, K. J. (eds.)Mountain Gorillas: Three Decades of Research at Karisoke. Cambridge UniversityPress, Cambridge, pp. 265–292.
Plumptre, A.J., and Williamson, E. A. (2001). Conservation-oriented research in theVirunga Region. In: Robbins, M. M., Sicotte, P., and Stewart, K. J. (eds.) MountainGorillas: Three Decades of Research at Karisoke. Cambridge University Press,Cambridge, pp. 361–389.
Robbins, M.M., Sicotte, P., and Stewart, K.J. (2001). Mountain Gorillas: ThreeDecades of Research at Karisoke. Cambridge University Press, Cambridge.
Scott, J.M., Heglund, P.J., Morrison, M.L., Haufler, J.B., Raphael, M.G., Wall, W.A.,and Samson, F.B. (eds.) (2002). Predicting Species Occurrences: Issues of Accuracyand Scale. Island Press, Washington, D.C.
Steklis, H.D., and Gerald-Steklis, N. (2001). Status of the Virunga mountain gorillapopulation. In: Robbins, M.M., Sicotte, P., and Stewart, K.J. (eds.) MountainGorillas: Three Decades of Research at Karisoke. Cambridge University Press,Cambridge, pp. 391–412.
Steklis, H.D., Gerald-Steklis, N., and Madry, S. (1996/1997). The mountain gorilla:Conserving an endangered primate in conditions of extreme political Instability.Primate Conservation. 17:145–151.
Stuhr, F., Jordan, R., and Werner, M. (1995). SIR-C/X-SAR: A multifaceted radar.Aerospace and Electronic Systems Magazine, IEEE. 10(10):15–24.
Vedder, A. (1984). Movement patterns of a group of free ranging mountain gorillas(G.g. beringei) and their relationship to food availability. American Journal ofPrimatology. 7:73–88.
Vedder, A. (1986). Diet selectivity in one group of mountain gorillas (G. gorillaberingei). Primate Report. 1986:134.
Walsh, P.D., Abernethy, K.A., Bermejo, M., Beyers, R., Wachter, P.D., Akou, M.E.,Huijbregts, B., Mambounga, D.I., Toham, A.K., Kilbourn, A.M., Lahm, S.A.,Latour, S., Maisels, F., Mbina, C., Minhindou, Y., Obiang, S.N., Effa, E.N.,Starkey, M.P., Telfer, P., Thibault, M., Tutin, C.E.G., White, L.J.T., and Wilkie, D.S.(2003). Catastrophic ape decline in western equatorial Africa. Nature. (April 6,2003), pp. 1–3.
Watts, D.P. (1991). Habitat use strategies of mountain gorillas. Folia Primatologica.56:1–16.
Weber, A.W., and Vedder, A. (1983). Population dynamics of the Virunga gorillas.Biological Conservation. 26:341–366.
Weber, B. (1995). Le Parc National des Volcans Biosphere Reserve, Rwanda: the roleof development in conservation. Parks. 10(3):19–21.
White, F. (1978) The afromontane region. In: Werger, M.J.A. (ed.) Biogeography andEcology of Southern Africa. The Hague, Junk. pp. 463–513.
252 H. Dieter Steklis et al.
Ch11.qxd 28/7/07 5:31 PM Page 252