an appraisal of the heat transfer properties of metallic open-cell foams for strongly...
TRANSCRIPT

Chemical Engineering Journal 198–199 (2012) 512–528
Contents lists available at SciVerse ScienceDirect
Chemical Engineering Journal
journal homepage: www.elsevier .com/locate /ce j
An appraisal of the heat transfer properties of metallic open-cell foams for stronglyexo-/endo-thermic catalytic processes in tubular reactors
Enrico Bianchi a,b, Tobias Heidig b, Carlo Giorgio Visconti a, Gianpiero Groppi a, Hannsjörg Freund b,Enrico Tronconi a,⇑a Dipartimento di Energia, Politecnico di Milano, Piazza Leonardo da Vinci 32, 20133 Milano, Italyb Max Planck Institute for Dynamics of Complex Technical Systems, Sandtorstr. 1, D-39106 Magdeburg, Germany
h i g h l i g h t s
" Heat transfer characteristics of open-cell metal foams were assessed." FeCrAlY and Al foams, 5–11% relative density and 10–40 PPI, were tested." Conduction within the solid is the dominant contribution to ker." ker enhanced by high material conductivity and low porosity." In the case of highly conductive foams, hw becomes the controlling parameter.
a r t i c l e i n f o
Article history:Received 13 February 2012Received in revised form 12 May 2012Accepted 14 May 2012Available online 22 May 2012
Keywords:Metallic foamsSpongesCatalyst supportEffective radial conductivityProcess intensificationHeat transfer
1385-8947/$ - see front matter � 2012 Elsevier B.V. Ahttp://dx.doi.org/10.1016/j.cej.2012.05.045
⇑ Corresponding author. Tel.: +39 02 2399 3264; faE-mail address: [email protected] (E. Tron
a b s t r a c t
We assess the heat transfer properties of open-cell foams, i.e. cellular materials made of interconnectedstruts, in view of their use as catalyst carriers. Metallic foams made of FeCrAlY and aluminum with 89–95% porosities and 10–40 PPI (pores per linear in.) pore densities were investigated. Geometrical mea-surements of all samples were performed using optical microscopy. X-ray micro-computed tomographytechniques were applied for a detailed morphological characterization of selected samples. Heat transferdata were collected in heating and cooling flow experiments, under operating conditions expected toinvolve conductive as well as both convective and radiative heat exchange, using N2 flow rates from15 to 35 Nl min�1 in the 400–800 K T-range. The effective radial and axial conductivities and the wallheat transfer coefficient were estimated from the measured steady-state temperature profiles. The esti-mates of the effective radial conductivity were between 0.3 W m�1 K�1 and 0.9 W m�1 K�1 for FeCrAlYsamples with �95% porosity, while they increased up to 7.7 W m�1 K�1 for aluminum samples with�89% porosity. The latter value is comparable with or higher than typical effective radial thermal conduc-tivities in technical packed bed reactors. The role of heat conduction in the foam solid matrix was alsoanalyzed by solving the Laplace heat diffusion equation in a 3D mesh of foam samples virtually recon-structed by micro-computed tomography. It was found that the conductive mechanism is the dominantcontribution to the effective radial conductivity for both FeCrAlY and Al foams. In the case of highly con-ductive materials, such as Al, the convective and radiative contributions are essentially negligible, and thewall coefficient (hw) becomes the controlling heat transfer parameter. The estimates of the wall heattransfer coefficient exhibit an inverse dependency on the foam cell size, but are unaffected by changesin the porosity and in the fabrication material of the foams.
� 2012 Elsevier B.V. All rights reserved.
1. Introduction
Open-cell foams, also called solid sponges by some authors [1],are irregular structures belonging to the family of cellular materi-als. Their characteristic structure of interconnected void cells
ll rights reserved.
x: +39 02 2399 3318.coni).
makes them attractive as catalyst supports because of high exter-nal surface areas combined with low densities, which results in alower pressure drop compared to beds of packed catalyst pellets[2,3]. In addition, high gas/solid heat and mass transfer rates canbe obtained [4–7]. Moreover, the thermal behavior of foams seemspromising, too: foam ligaments normal to the flow direction mayresult in boundary layer disruption and enhanced mixing [8], whilethermal conduction in the solid struts is expected to enhance axialand radial heat transfer. In this respect the adoption of metallic

Nomenclature
List of symbolsCHT cooling run at the highest set point temperatureCLT cooling run at the lowest set point temperatureHHT heating run at the highest set point temperatureHLT heating run at the lowest set point temperatureke (Wm�1K�1) effective conductivityA (m2) area of boundary mesh faceCd (–) thermal dispersion coefficientcp (kJ kg�1 K�1) specific heat capacityCRoss. (–) constant of Rosseland coefficientD (m) inner pipe diameterDFOAM (m) external diameter of cylindrical foam sampledp (m) average pore inner diameterdc (m) average cell inner diameterh (m) equivalent thickness of reconstructed samplehw (W m�2 K�1) wall heat transfer coefficientJ (W m�2) diffusion flux vectork (W m�1 K�1) thermal conductivityK (m2) permeabilitykLemlich (W m�1 K�1) effective conductivity according to Lemlich’s
theoryke,r (W m�1 K�1) effective radial conductivity of the foam bedke,a (W m�1 K�1) effective axial conductivity of the foam bedke,0 (W m�1 K�1) effective stagnant conductivity of saturated
mediumkd (W m�1 K�1) dispersive conductivitykRoss. (W m�1 K�1) Rosseland equivalent radiative conductivityL (m) length of foam bedLFOAM (m) length of foam samplePD (PPI) average pore densityPr (–) Prandtl number, lcpf
kfPre (–) effective Prandtl number, lcpf
ke
r (m) radial coordinateR (m) radius of pipeRee (–) Reynolds number, Windc
eHlReK (–) Reynolds number based on permeability, Win
ffiffiffiKp
lS (m2) face of reconstructed meshSv (m�1) geometric interfacial area density, or volumetric sur-
face, of foamts (m) average strut thickness in the middletn (m) average thickness of the conjunction section of strutsT (K) temperatureTx,r (K) temperature at axial coordinate x and radial coordinate
rTx,w (K) tube temperature at axial coordinate xuin (m s�1) superficial velocity inside the pipeVFOAM (m3) volume of foam samplewin Air
FOAM (kg) weight of foam sample saturated with air
win EthanolFOAM (kg) weight of foam sample saturated with ethanol
Win (kg s�1 m�2) specific mass velocityx (m) axial coordinate
Greek symbolse(–) void fractionDT temperature differenceeT (–) total porosity of foam sampleeH (–) hydraulic porosity of foam sampleb (m�1) Rosseland mean extinction coefficientl (kg s�1 m�1) dynamic viscosity of fluidq (kg m�3) mass densityqEthanol (kg m�3) ethanol mass densityqFOAM (kg m�3) foam mass densityqHS (kg m�3) mass density of hollow strutsqSolid (kg m�3) mass density of bulk materialqT(–) total solid fraction, (1-eT)r (W m�2 K�4) Stefan–Boltzmann constant
Superscriptsin Air saturating fluid is airin Ethanol saturating fluid is ethanol
Subscriptsa axialc referred to celld dispersiveEthanol referred to ethanolFeCrAlY referred to FeCrAlYH hydraulicin referred to inlet condictionsK based on permeabilityLemlich referred to Lemlich’s theoryp referred to porer radialR at a radial coordinate equal to the pipe radiusRoss. RosselandSolid referred to the bulk materialT totalx referred to the axial coordinate0 static propertiese effectiveFOAM referred to foamf fluid propertiesHS hollow struts solid propertiesw wall�1 undisturbed condition
E. Bianchi et al. / Chemical Engineering Journal 198–199 (2012) 512–528 513
foams, instead of more common ceramic materials, is expected toboost the bulk conductivity of the catalytic support, an importantfactor in highly endothermic (e.g. steam reforming) and exother-mic (e.g. selective oxidation, methanation, Fischer–Tropsch) reac-tions: high conductivity catalyst carriers can help to minimizethe hot spots and to prevent mechanical-strength and thermal-shock limitations. Actually, the heat transfer properties of open-celled metal foams are so promising that such structures are usedalready as multifunctional heat exchangers [9], as compact heatsinks for cooling of microelectronic devices such as computer chipsor power electronics [10,11], or as receiver dishes in solar reform-ing of methane [12].
In the open literature several papers are available which focuson the thermal properties of foams in order to characterize theirperformances as compact room temperature heat sinks. Most ofthem, however, are interested in the evaluation of an overall heattransfer parameter [13]. On the other hand, when the one dimen-sional approach is applied to model tubular reactors with pro-nounced reaction heat effects, the assumption of a uniformtemperature over the reactor cross section is well known to beinaccurate, as the mean temperatures may deviate significantlyfrom the real local values [14].
There are in the literature many experimental and theoreticalworks on the effective stagnant conductivity of foams fully

514 E. Bianchi et al. / Chemical Engineering Journal 198–199 (2012) 512–528
saturated with a medium, where thermal radiation and convectionare negligible. These literature studies can be classified in: (1)asymptotic solutions, (2) unit cell approaches, and (3) empiricalcorrelations.
(1) The first group includes theoretical correlations which rep-resent limiting cases for the effective conductivity. In manycases such equations were originally derived for the esti-mation of the electric conductivity, but by analogy theycan also be used for the prediction of the thermal conduc-tivity [15]. Already in 1891 Maxwell [16] derived a correla-tion for the effective electric conductivity of a dispersion ofspheres in a continuous phase with high volumetric solidfractions. In the opposite case of high void fractions,Lemlich [17] theoretically found that the relative volumet-ric density is equal to three times the ratio of the effectiveto the bulk electric conductivity. The same approach hasbeen later extended to the estimation of the thermal con-ductivity of foams by other authors [18–20], who confirmedexperimentally that the ratio of the effective thermal con-ductivity to the bulk conductivity is close to one third ofthe relative density. According to another approach, theeffective porous medium conductivity is upper boundedby the parallel connection of the thermal resistancesoffered by solid and fluid phases and lower bounded bythe series connection of the two resistances. Accordingly,some authors [21,22] proposed a linear combination ofthe two limiting cases, estimating a weight parameter tofit their data.
(2) Many authors have proposed also theoretical models basedon simplified descriptions of the foam cell structure. Whenthe structure is periodic, the overall conductivity of thefoam is represented by that of a single unit cell, for whichseveral schematic representations have been proposed:examples include the cubic cell with square struts byDul’nev [23] and Fourie et al. [24], the hexagonal cell withlumps of material at the intersection of fibers by Calmidiand Mahajan [25] and Bhattacharya et al. [22], the tetrakai-decahedral cell with cylindrical ligaments attached to cubicnodes by Boomsma and Poulikakos [26] and improvedversions [27,28], the cubic cell with lumped material atthe nodes as a function of porosity, by Edouard [29], andthe cell regarded as the negative of an ideal packing ofspheres by Krishnan et al. [30]. Despite the accuracy inthe description of the cell shape, this class of models stillrequires geometrical fitting parameters, and is consistentwith experimental data only in a narrow range of foamgeometrical properties.
(3) Empirical correlations have been proposed by severalauthors to fit their experimental data without making anyassumptions on the shape of the single cell [11,22,25,31].Peng and Richardson [32] derived correlations for heattransfer coefficients accounting also for radiation and con-vection, although they relied on experimental data collectedon a single foam sample.
In conclusion, in spite of the great interest in the potential ofthese new materials as catalyst supports, there are still notenough data or satisfactory engineering correlations in the openliterature for the estimation of effective heat transfer coefficientsin foam filled tubes [33] under temperatures and flow rateconditions relevant for chemical processes. The purpose of thiswork is therefore to evaluate the heat transfer properties ofdifferent metallic foams, both by theoretical approaches and by2D model analysis of heat transfer experiments in a tubularreactor configuration.
2. Materials and methods
2.1. Investigated foam samples
Samples investigated in this work were open-cell metal foamsmade of FeCrAlY and Al-alloy. FeCrAlY samples were supplied byPorvair (Samples A and B in Fig. 1), while the aluminum foamswere purchased from ERG Aerospace (Samples C–E in Fig. 1).
FeCrAlY (Fe �73%, Cr �20%, Al �5% and Y �2%) is a materialused for high temperature applications up to 1100–1300 �C andfeatures a thermal conductivity of about 15 W m�1 K�1 at roomtemperature. From the composition of the alloy [34] the solid con-ductivity can be expressed as a linear function of temperature [35]:
kFeCrAlY½W m�1 K�1� ¼ 11:103þ 0:0143T½K�; 270 K < T < 1200 K
ð1Þ
Al-alloy (6101 T6) is composed of �98% Al enriched with tracesof other elements (Si,Mg) and artificially aged [36] to increase itsmechanical properties for aircraft and automotive applications.At room temperature the thermal conductivity of this alloy isabove 218 W m�1 K�1 [36], which is slightly less than that of purealuminum, 240 W m�1 K�1 [37], but still one order of magnitudehigher than that of FeCrAlY. A correlation of the conductivity of thisAl-alloy as a function of temperature is not available in the temper-ature range of interest, but trends of similar Al-alloys show a con-stant conductivity with only little variations in the interval from300 to 800 K [37].
In order to investigate also the effect of the foam geometry, thesamples for the present study were selected at two different levelsof porosity (e) and pore density (pore per inch, PPI). The nominalrelative density (1 � e) of the tested foams was 4–6% for the lighterones (Samples A, B and E), and 10–12% for the denser ones (Sam-ples C and D). Also the pore size was varied on two levels: foamswith the bigger pore diameter had a nominal pore density of10 PPI (Samples A and D) while the highest investigated nominalpore density was 40 PPI (Samples B, C and E).
2.2. Morphological characterization
Due to the geometrical complexity and the random orientationof the solid phase of the porous medium, the real geometry offoams is not easy to characterize unless using sophisticated meth-ods of volume image analysis such as Magnetic Resonance Imaging(MRI) or X-ray micro-computed tomography (lCT) [38]. Accord-ingly, geometric idealizations of the foam cell have been largelyemployed for analytical and computational studies. In fact, in spiteof variations in the detailed morphology between different materi-als, open cellular foams consist in general of cells with 12–14 pen-tagonal or hexagonal faces [39], with ligaments of triangular orcylindrical cross-section [40] and material clustering at the standvertices. Once the shape of the elementary cell is fixed, foamscan therefore be ideally characterized by their porosity and byone microscopic geometrical parameter, such as the pore or celldiameter, the strut thickness or length. This approach can be suffi-cient for a simplified analysis of foam properties.
2.2.1. Gravimetric analysisThe open-void fraction in a cellular solid is defined as the ratio
between the accessible void volume and the total volume. Fromthe inspection of the structure by optical microscopy and from pre-vious considerations [6,41], it can be concluded that the struts ofthe tested FeCrAlY foams are not solid, like in the Al foams, but hol-low (Fig. 2c). Thus, it is possible to identify two different porosities:the total porosity eT, which includes all kinds of void space, and thehydrodynamic porosity eH which only considers the macroscopic

Fig. 1. Cellular structure of the tested foam samples. Images obtained with optical microscope.
E. Bianchi et al. / Chemical Engineering Journal 198–199 (2012) 512–528 515
accessible void space [42]. The open-volume fractions can be ex-pressed in terms of densities as follows:
eH ¼ 1� qFOAM
qHS; ð2Þ
eT ¼ 1� qFOAM
qSOLID; ð3Þ
where qFOAM is the foam density, qHS is the density of the hollowstruts and qSOLID is the density of the solid phase. The foam densitywas estimated by dividing the weight of the foam cylindrical sam-ple by its total measured volume:
qFOAM ¼win Air
FOAM
VFOAM¼ win Air
FOAM
p D2FOAM4 LFOAM
; ð4Þ
whereas the density of the hollow struts was determined using astandard pycnometry method, based on the measurement of thebuoyancy of the samples in ethanol (balance Sartorius YDK 01):
qHS ¼win Air
FOAMqEthanol
win AirFOAM �win Ethanol
FOAM
; ð5Þ
Pure ethanol was used for the measurements because waterwas unable to access the entire void volume inside the foam, leav-ing air bubbles attached to the structure due to surface tension ef-fects [6].
The hydrodynamic porosity is the relevant parameter for inves-tigations regarding mass transfer and pressure drop of foams usedas catalyst supports [6], while the total porosity must be taken intoaccount in the evaluation of the effective heat conductivity.
2.2.2. Optical microscope analysisMicrographs were taken with an optical microscope (Olympus
SZ-CTV 40 with a magnification between 6.7 and 40) for each sam-ple, as shown in Fig. 1, to identify pores situated at the same depthand to measure their diameters and the strut dimensions. Becauseof different approaches in the previous literature, it is necessary to

Fig. 2. (a) Identification of cell and pore diameters in foams; (b) slim section and lumped intersection of foam ligaments; (c) hollow section of strut in FeCrAlY foam; (d) strutthickness for triangular and circular cross section.
516 E. Bianchi et al. / Chemical Engineering Journal 198–199 (2012) 512–528
precisely define the characteristic lengths. According to Giani et al.[6] and to ERG-Aerospace [40], the unit cell is defined as each oneof the bubbles (Fig. 2a) constituting the packed structure of foams,and can be generally represented by polyhedra of 12 or 14 reticu-lated windows. The polygonal opening of each window betweentwo adjacent cells is referred to as a pore (Fig. 2a). In any givenbubble, the polygonal pores actually may be of two or three differ-ent characteristic sizes and shapes, but they are generally simpli-fied to a single average size and to a circular shape. The numberof these pores that would subtend one linear inch is used by foammanufacturers to designate the foam pore density (pores per inch,PPI). In such a way an average pore diameter is between 50% and70% of the diameter of its parent bubble, thus for example a10 PPI foam would have roughly 5–7 bubbles (or cells) per inch.
Moreover, also the strut cross section is not constant, but be-comes larger moving from the center of the filament towards theintersections with other struts. This may have a substantial influ-ence on heat conduction in the solid: according to Coquard et al.[43] at fixed porosity the concentration of the solid phase at theends of the ligaments results in diminishing the heat conduction,which is limited by the thinnest strut section. For this reason boththe smallest strut thickness and the size of the node section weremeasured for each foam sample, as shown in Fig. 2b [44]. For cylin-drical struts, the measured section is equal to the circle diameter,while it is the length of a side of the triangle for struts of triangularshape, as shown in Fig. 2d. Each geometrical parameter estimate ofthe studied foams is the average of sufficiently replicated measure-ments (at least 30) to ensure an error range less than 10% at a con-fidence level a = 95%.
2.2.3. Volume computed tomographyThe foam Samples B–D were scanned with an X-ray micro-
computed tomography machine, available at the Chair for ThermalProcess Engineering of the Otto von Guericke University
Magdeburg, Germany, to obtain an in-depth morphological charac-terization of the porous media tested in the heat transfer experi-mental setup. This technique uses X-rays to collect projections ofthe object with resolution in the micrometer range. The measure-ments were taken on a ProCon stand-alone CT-ALPHA system,which can provide a maximal resolution in the 1 lm range onsmall samples and a maximal X-ray voltage of 225 kV. Foam Bwas scanned with a resolution of 14.3 lm/pel (micron per pixel)to identify the hollow struts, foam C with a resolution of 52 lm/pel, and foam D with a resolution of 50 lm/pel. Each sample wasplaced on a rotating table in a cone beam of the X-ray source, thenthe camera recorded X-ray images for a set of equally spaced rota-tional positions. The main advantage of this technique is to gener-ate measurements of the internal structures of the sample with anon-destructive method. In order to carry out geometrical mea-surements it is necessary to perform a post-processing of the raw3D images from the X-ray micro-computed tomography. For thistask, we used the software tool iMorph, which is an open source3D image analysis software originally developed at IUSTI labora-tory [45]. The calculation was run on the computer cluster of theMax Planck Institute for Dynamics of Complex Technical Systems,Magdeburg, Germany, the reconstruction and analysis of thescanned volumes requiring a vast amount of memory (up to80 GB) and up to 8 h (for Sample B, scanned with the highest res-olution). An example of a volume reconstructed from filteredimages is shown in Fig. 3. To access the structural properties, thefirst step consists in identifying the voxels (3D pixels) associatedwith the fluid and with the solid phase, selecting a threshold grayvalue for post-processing of the images. This threshold is set for thecomplete reconstructed volume in such a way that the porosity dif-ference between real and reconstructed sample is minimized. Theresult obtained with this approach also lies close to the inflectionpoint of the specific surface plotted against the threshold, as showne.g. in Fig. 4 for Sample C. Once voxels belonging to each phase are

Fig. 3. Foam Sample D. Example of splitting solid from region at a given threshold and reconstructed 3D surface of a cuboid volume (11 � 11 � 40 mm).
Fig. 4. Foam Sample C. Example of determination of optimum threshold value. Themeasured void fraction is the value from gravimetric analysis.
E. Bianchi et al. / Chemical Engineering Journal 198–199 (2012) 512–528 517
identified, it is then possible to extract the overall porosity and thespecific surface area by counting the volume or the surface of eachvoxel belonging to the solid mesh. Then, from the segmentation ofthe resulting 3D image, the cell and pore diameters as well as thestrut and node thicknesses are calculated. The segmentation stepconsists of individualizing each cell and the corresponding strutswith the maximal ball approach. Each cell is supposed to containonly one totally included maximal ball and cell labels are propa-
gated until all voxels are assigned, then to retrieve the solid struc-ture voxels of these images are selected according to Plateau’s laws[46].
2.3. Heat transfer measurements
2.3.1. Experimental rigFlow heat transfer runs were performed in a dedicated test rig
in the laboratories of Politecnico di Milano, Italy. The set up con-sists of an horizontal tubular reactor (also called test tube in thefollowing because non-reactive runs were carried out in this work)inserted into a thermostatic oven with air recirculation (MazzaliThermotest) and loaded with the foam samples, and of a secondoven to preheat the gas stream fed to the tube.
The tested foam samples were cylinders of 28 mm diameter, ob-tained from the original metal foam panels by electro erosion, thusproducing a precise cut with no damage to the structure. Thelength of the cylinders was 25 mm for Sample A, 100 mm for Sam-ple B, and 50 mm for Samples C–E. One or more foam samples wereloaded in series inside the test pipe in order to reach a total lengthof 100 mm. Moreover, each sample had three axial through holes of3.28 mm diameter located at different radial positions, namely atthe centerline, and at 7 mm and 9 mm from the centerline(Fig. 5a). Tightly fitted 1/800 thermowells were inserted in the holeswith sliding K-type thermocouples inside which enabled us tomeasure the internal temperature profiles. The presence of thethree holes affected the porosity of the sample, which was slightlyincreased compared to the original foam.
The inner diameter of the stainless steel test tube (Fig. 5b) isequal to the outer diameter of the foam samples in order to ensure

Fig. 5. Experimental set-up for heat transfer measurements. (a) Cross section of a foam sample with the three through holes at 0–7–9 mm from the center. (b) Test section ofthe tube filled with the foam sample: the picture shows also the static mixer prior to the foam bed and the positions of the thermocouples.
518 E. Bianchi et al. / Chemical Engineering Journal 198–199 (2012) 512–528
a good thermal contact between the foam and the tube and toavoid bypass at the wall. The test tube is also equipped with exter-nal fins for a better external heat transfer, the optimal contact ofthe fins with the test tube being ensured by a thin copper foil rolledaround the tube, except in the section upstream of the foam bed,which was shielded for insulation. Upstream from the test sampleswe loaded an additional cylindrical FeCrAlY foam, used as a staticmixer to minimize entry length effects and to ensure uniform gasflow and temperature distributions (Fig. 5b).
2.3.2. Experimental methodsThe flowing gas used was Nitrogen 4.5 (99.995 vol.%), fed at
atmospheric pressure and controlled by a mass flow meter. Foreach operating condition and foam sample, five different flow rateswere used: 15–20–25–30–35 Nl/min. The feed flows through thetwo ovens, which can be set at different temperatures in order tostudy several operating conditions. The first oven is used as pre-heater and can reach temperatures up to 1000 �C; the second oneis used as thermostatic chamber to control the temperature ofthe test tube section where the foams are located. The followingoperating modes were explored:
� Heating mode: ‘‘cold’’ feed gas enters the thermostatic chamberwhich is set at 300 �C (low temperature, LT) or 500 �C (hightemperature, HT);� Cooling mode: the gas feed stream is preheated to a higher tem-
perature than the thermostatic chamber, which is set at either100 �C (low temperature, LT) or 400 �C (300 �C for Al foams),(high temperature, HT).
Experimental tests were run in these conditions for all the sam-ples, resulting in a total of over 80 runs.
After reaching steady-state conditions, temperature profileswere measured with a spatial resolution of 5 mm along the bedlength at the wall and inside the foams. The skin temperaturewas recorded sliding a thermocouple inside a thermowell con-strained by the grip of the external fins to be tightly connectedto the external tube wall. Each temperature profile was taken atleast twice during each run to check its reproducibility. The mainsources of error in the present heat transfer experiments weredue to the measurement errors and to conduction losses in the testtube. The latter ones are not accountable, while the error associ-ated with thermocouples is 0.4% of the measured temperatureand the maximum absolute error connected with the positioningof the probes is less than 2%.
2.3.3. Two dimensional heat transfer modelThe collected two dimensional temperature profiles were used
to estimate the heat transfer parameters of each foam sample. Inconsideration of the high interphase (gas/solid) heat transfer coef-ficients in foams [5] and because we are interested in steady stateconditions, solid matrix and fluid were assumed to be in thermalequilibrium and considered like a single pseudo-homogeneousphase. Based on [5], the greatest T-difference between gas and so-lid phases was estimated to be less than 1 �C. Accordingly, the en-ergy balance on the differential element of the foam bed under thehypothesis of steady state conditions, axial symmetry, absence ofchemical reactions, and neglecting viscous dissipation and pres-sure work, is written in cylindrical coordinates as follows:
Wincp@T@x¼ ke;r
1r@T@rþ @
2T@r2
!þ ke;a
@2T@x2
!ð6Þ
On the radial coordinate, we assume a symmetry boundary con-dition at the centerline, and describe the heat transfer between theouter edge of the structured support and the skin of the test tubeby means of a wall heat transfer coefficient:
@T@r ¼ 0; at : r ¼ 0;
ke;r@T@r ¼ hwðTx;w � Tx;r¼RÞ; at : r ¼ R;
(ð7a-bÞ
Along the axial coordinate, the entry thermal flux is propor-tional to the difference between the undisturbed temperature ofthe fluid (Tx=�1) and the measured temperature at the zero axialcoordinate, while an adiabatic condition is imposed at the exit ofthe bed:
ke;a@T@x ¼WincpðTx¼0;r � Tx¼�1;rÞ; at : x ¼ 0;
@T@x ¼ 0; at : x ¼ L;
(ð8a-bÞ
The controlling parameters of the model are the effective radialconductivity (ke,r) of the foam bed, the effective axial conductivity(ke,a) and the wall heat transfer coefficient (hw). All of them have tobe regarded as global coefficients, including effects of conductionbut also of convection and potentially of radiative heat transfer.
The estimates of these three parameters were obtained by non-linear regression on the experimental 2D temperature profiles ofeach run, covering all the studied structures and flow rates. At eachiteration of the regression routine, the model PDE was solvednumerically applying the finite difference method of second orderin the axial direction and the orthogonal collocation method in theradial coordinate [47]. The measured radial temperature profile atthe inlet section was described with a 3rd order fitting polynomial.

E. Bianchi et al. / Chemical Engineering Journal 198–199 (2012) 512–528 519
2.4. Heat conductivity of reconstructed foams
From the reconstructed 3D structure of the foam samples it ispossible to derive a solid mesh where one can solve the heat con-duction equation without any simplifying assumption regardingthe geometry. The C++ open source finite volume library Open-FOAM� [48] was used to mesh the highly complex geometry ofreconstructed volumes and to implement and solve the Laplaceheat diffusion equation. The post-processing analysis and thevisualization of results were carried out using the open sourceapplication ParaView [49]. To solve the heat transport equation,the preprocessing and calculations were run in parallel on thecomputer cluster of the Max Planck Institute for Dynamics ofComplex Technical Systems Magdeburg. The use of the computercluster was especially necessary for the grid generation in thecomplex structures, which needed more than 40 GB of memory.The computer cluster consists of 48 computer nodes with 12 or24 CPU cores and a fast InfiniBand network connection. A storagesystem with 24 TB completes the cluster. Nodes with 12 and with24 cores are equipped with 48 GB and with 96 GB of RAM, respec-tively. For a sample size between 9 and 50 million elements themesh generation took from around 30 min up to more than 3 h.The simulation of heat conduction in the generated mesh (solvingthe steady state Laplace heat equation) needed about 15 min till1 h.
Firstly, the isotropy of the effective conductivity was evaluatedfor the foams studied in the heat transfer measurements. Differentcuboid sub-volumes of each sample, with such a side length to ex-clude the aforementioned through holes for probe placing, werechosen for reconstruction and the foam effective conductivitywas evaluated along the three Cartesian coordinates in each vol-ume. In a second step, also the effective radial and axial conductiv-ity of the sample was calculated in the real cylindrical geometry,including the through holes. The amount of computer memory,processors, and the time required to generate a mesh is strictlydependent on the resolution and on the dimensions of the volumeto be reconstructed. For this reason, it was possible to reconstructthe whole cylindrical sample only for foams C and D which werescanned with lower resolution.
The mono-directional effective conductivity (Eq. (9)) was calcu-lated solving the Laplace equation for steady state thermal diffu-sion in the solid phase:
ke ¼�R
A J � dADT � S h; ð9Þ
In Eq. (9) J is the diffusion flux vector obtained from the simulation,dA is the outward pointing area vector, S is the area of the face, h isthe equivalent thickness of the sample, and DT the temperature dif-ference in the considered direction. A temperature gradient is im-posed between the two opposite faces normal to the consideredaxis, and adiabatic conditions are set on all the other surfaces.
Table 1Geometrical properties of the investigated metal foam samples. Optical microscope (OM) mavailable.
Foam Material 1 � eH 1 � eT dc (mm
Grav. (%) Grav. (%) lCT (%) OM
A FeCrAlY 6.0 5.1 – 5.09B FeCrAlY 6.9 6.3 6.2 1.55C Al-6101 11.0 11.0 10.9 2.03D Al-6101 10.3 10.3 10.2 3.59E Al-6101 5.5 5.5 – 2.00
3. Results
3.1. Geometrical analysis of the foam samples
The geometrical properties of the investigated metal foams arereported in Table 1, where the optical measurements are comparedwith those available from X-ray micro-computed tomography.These estimates are derived from averages on the whole samplevolume, while optical measurements are possible only on theexternal surface, nevertheless the results generated by the twotechniques are generally in good agreement. As expected, the bestagreement is obtained for samples with higher cell diameter,where the identification of cells and struts with microscopy tech-niques is easier.
Another aspect to take into account is the fact that only a part ofthe sample is reconstructed and analyzed with X-ray micro-com-puted tomography, mainly because the resolution of the collectedpictures is inversely proportional to the dimension of the scannedobject. The hypothesis that the measured properties are valid forthe whole foam involves the implicit assumptions of: (i) isotropicmaterial, (ii) reconstructed volume bigger than the minimum rep-resentative elementary volume (REV). Recent studies [50] showedthat for cellular materials it is not possible to identify a uniqueminimum REV, but this volume should be defined for each physicalproperty and given precision. With iMorph the reconstruction ofselected volumes is not automatic and so it was not possible to col-lect enough data to validate the REV. However, geometrical mea-surements were performed for each sample within a number ofcuboids, with side length in the range between 0.5 cell diameterand the maximum reconstructible length. For cuboids with sidelength greater than three cell diameters, i.e. the REV size proposedin the literature [51], the estimated parameters diverge less than5% from those evaluated on the biggest reconstructed volumes.For this reason only the geometrical properties of the maximumreconstructed volume are reported in this work for each foamsample.
The analysis of the 3D reconstructed samples enabled also thecharacterization of the cell shape by counting the number of neigh-boring bubbles, reported in Table 2. It is worth emphasizing thatthe average value is close, but different from those of polyhedralshapes with minimum surface energy (such as Kelvin or Weaire–Phelan structures [52]). This is consistent with the different mate-rial and process conditions between liquid and solid foams, wherethe higher viscosity of the latter ones results in stopping the forma-tion process before reaching an equilibrium structure [53].
Another important parameter extracted from the X-ray micro-computed tomography analysis is the geometrical specific surface,which is highly relevant to interphase heat and mass transfer andtherefore to catalytic applications of the supports. Several morpho-logical models are described in the literature to determine the out-er geometrical surface of foams without using complex imagingmethods [38]. In Table 3 the specific surfaces measured in the foam
easurements are compared with X-ray micro-computed tomography (lCT) data where
) dp (mm) ts (mm) tn (mm)
lCT OM lCT OM lCT OM lCT
– 2.20 – 0.45 – 0.85 –1.78 0.86 0.93 0.14 0.18 0.28 0.262.45 0.86 1.29 0.28 0.31 0.45 0.463.58 1.83 1.85 0.44 0.39 0.72 0.66– 0.81 – 0.27 – 0.40 –
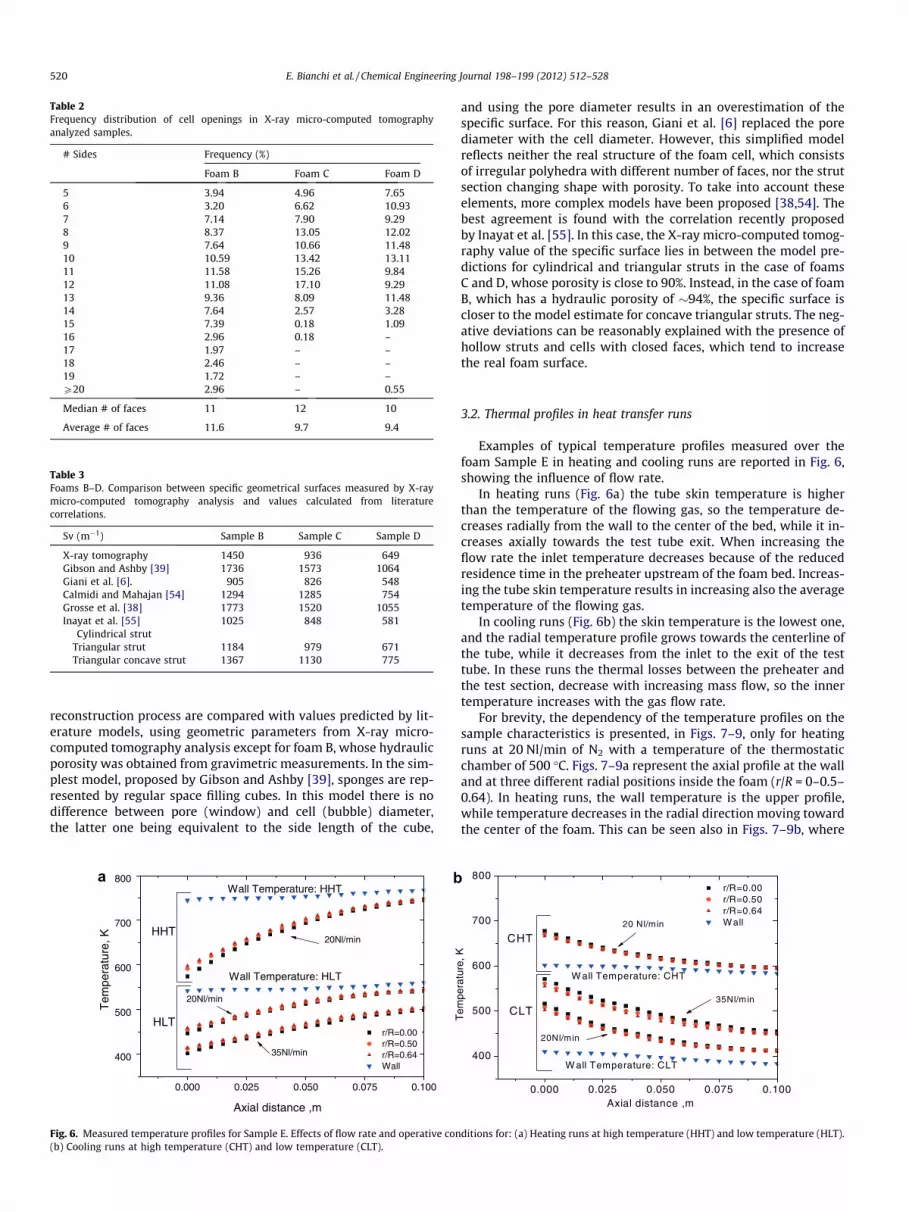
Table 2Frequency distribution of cell openings in X-ray micro-computed tomographyanalyzed samples.
# Sides Frequency (%)
Foam B Foam C Foam D
5 3.94 4.96 7.656 3.20 6.62 10.937 7.14 7.90 9.298 8.37 13.05 12.029 7.64 10.66 11.4810 10.59 13.42 13.1111 11.58 15.26 9.8412 11.08 17.10 9.2913 9.36 8.09 11.4814 7.64 2.57 3.2815 7.39 0.18 1.0916 2.96 0.18 –17 1.97 – –18 2.46 – –19 1.72 – –P20 2.96 – 0.55
Median # of faces 11 12 10
Average # of faces 11.6 9.7 9.4
Table 3Foams B–D. Comparison between specific geometrical surfaces measured by X-raymicro-computed tomography analysis and values calculated from literaturecorrelations.
Sv (m�1) Sample B Sample C Sample D
X-ray tomography 1450 936 649Gibson and Ashby [39] 1736 1573 1064Giani et al. [6]. 905 826 548Calmidi and Mahajan [54] 1294 1285 754Grosse et al. [38] 1773 1520 1055Inayat et al. [55]
Cylindrical strut1025 848 581
Triangular strut 1184 979 671Triangular concave strut 1367 1130 775
520 E. Bianchi et al. / Chemical Engineering Journal 198–199 (2012) 512–528
reconstruction process are compared with values predicted by lit-erature models, using geometric parameters from X-ray micro-computed tomography analysis except for foam B, whose hydraulicporosity was obtained from gravimetric measurements. In the sim-plest model, proposed by Gibson and Ashby [39], sponges are rep-resented by regular space filling cubes. In this model there is nodifference between pore (window) and cell (bubble) diameter,the latter one being equivalent to the side length of the cube,
ba
0.000 0.025 0.050 0.075 0.100
400
500
600
700
800
HHT
HLT
35Nl/min
20Nl/min
Wall Temperature: HLT
r/R=0.00 r/R=0.50 r/R=0.64 Wall
Tem
pera
ture
, K
Axial distance ,m
Wall Temperature: HHT
20Nl/min
Fig. 6. Measured temperature profiles for Sample E. Effects of flow rate and operative con(b) Cooling runs at high temperature (CHT) and low temperature (CLT).
and using the pore diameter results in an overestimation of thespecific surface. For this reason, Giani et al. [6] replaced the porediameter with the cell diameter. However, this simplified modelreflects neither the real structure of the foam cell, which consistsof irregular polyhedra with different number of faces, nor the strutsection changing shape with porosity. To take into account theseelements, more complex models have been proposed [38,54]. Thebest agreement is found with the correlation recently proposedby Inayat et al. [55]. In this case, the X-ray micro-computed tomog-raphy value of the specific surface lies in between the model pre-dictions for cylindrical and triangular struts in the case of foamsC and D, whose porosity is close to 90%. Instead, in the case of foamB, which has a hydraulic porosity of �94%, the specific surface iscloser to the model estimate for concave triangular struts. The neg-ative deviations can be reasonably explained with the presence ofhollow struts and cells with closed faces, which tend to increasethe real foam surface.
3.2. Thermal profiles in heat transfer runs
Examples of typical temperature profiles measured over thefoam Sample E in heating and cooling runs are reported in Fig. 6,showing the influence of flow rate.
In heating runs (Fig. 6a) the tube skin temperature is higherthan the temperature of the flowing gas, so the temperature de-creases radially from the wall to the center of the bed, while it in-creases axially towards the test tube exit. When increasing theflow rate the inlet temperature decreases because of the reducedresidence time in the preheater upstream of the foam bed. Increas-ing the tube skin temperature results in increasing also the averagetemperature of the flowing gas.
In cooling runs (Fig. 6b) the skin temperature is the lowest one,and the radial temperature profile grows towards the centerline ofthe tube, while it decreases from the inlet to the exit of the testtube. In these runs the thermal losses between the preheater andthe test section, decrease with increasing mass flow, so the innertemperature increases with the gas flow rate.
For brevity, the dependency of the temperature profiles on thesample characteristics is presented, in Figs. 7–9, only for heatingruns at 20 Nl/min of N2 with a temperature of the thermostaticchamber of 500 �C. Figs. 7–9a represent the axial profile at the walland at three different radial positions inside the foam (r/R = 0–0.5–0.64). In heating runs, the wall temperature is the upper profile,while temperature decreases in the radial direction moving towardthe center of the foam. This can be seen also in Figs. 7–9b, where
0.000 0.025 0.050 0.075 0.100
400
500
600
700
800 r/R=0.00 r/R=0.50 r/R=0.64 W all
CLT
CHT
20Nl/min
20 Nl/min
W all Temperature: CLT
W all Temperature: CHT
Tem
pera
ture
, K
Axial distance ,m
35Nl/min
ditions for: (a) Heating runs at high temperature (HHT) and low temperature (HLT).

0.00 0.25 0.50 0.75 1.00
500
600
700
800
r/R=0.00 r/R=0.50 r/R=0.64 wall
Foam B: FeCrAlY (ρT ~ 6%)
Tem
pera
ture
, K
Dimensionless axial coordinate (x/L)
a b
0.00 0.25 0.50 0.75 1.00
500
600
700
800
x/L=0.00 x/L=0.25 x/L=0.50 x/L=0.75 x/L=1.00
Tem
pera
ture
, K
Dimensionless radial coordinate (r/R)
Foam B: FeCrAlY (ρT ~ 6%) Wall
Fig. 7. Temperature profiles measured over Sample B (FeCrAlY: qT � 6%) in the heating mode (TSP = 500 �C), feeding N2 at 20 Nl/min. (a) Measured (symbol) and fitted (dottedline) axial temperature profiles at different radial positions (r/R = 0–0.5–0.64-wall). (b) Measured (symbol) and fitted (line) radial temperature profiles at different axialpositions (x/L = 0–0.25–0.5–0.75–1).
0.00 0.25 0.50 0.75 1.00
500
600
700
800
r/R=0 r/R=0.5 r/R=0.64 wallT
empe
ratu
re, K
Dimensionless axial distance (x/L)
Foam E: Al-alloy (ρT~ 5%)
0.00 0.25 0.50 0.75 1.00
500
600
700
800
x/L=0.00 x/L=0.25 x/L=0.50 x/L=0.75 x/L=1.00Foam E: A l-alloy (ρ
T~ 5% )
Tem
pera
ture
, K
Dimensionless radial coordinate (r/R)
W alla b
Fig. 8. Temperature profiles measured over Sample E (Al-alloy: qT � 5%) in the same heating mode (TSP = 500 �C), feeding N2 at 20 Nl/min. (a) Measured (symbol) and fitted(dotted line) axial temperature profiles at different radial positions (r/R = 0–0.5–0.64-wall). (b) Measured (symbol) and fitted (line) radial temperature profiles at differentaxial positions (x/L = 0–0.25–0.5–0.75–1).
0.00 0.25 0.50 0.75 1.00
500
600
700
800
r/R=0.00 r/R=0.50 r/R=0.64 Wall
Tem
pera
ture
, K
Dimensionless axial distance (x/L)
Foam C: Al-alloy (ρT ~ 11%)
0.00 0.25 0.50 0.75 1.00
500
600
700
800
x/L=0.00 x/L=0.25 x/L=0.50 x/L=0.75 x/L=1.00
Foam C: Al-alloy (ρT ~ 11%)
Tem
pera
ture
, K
Dimensionless radial coordinate (r/R)
Walla b
Fig. 9. Temperature profiles measured over Sample C (Al-alloy: qT � 11%) in the same heating mode (TSP = 500 �C), feeding N2 at 20 Nl/min. (a) Measured (symbol) and fitted(dotted line) axial temperature profiles at different radial positions (r/R = 0–0.5–0.64-wall). (b) Measured (symbol) and fitted (line) radial temperature profiles at differentaxial positions (x/L = 0–0.25–0.5–0.75–1).
E. Bianchi et al. / Chemical Engineering Journal 198–199 (2012) 512–528 521
the radial profiles are shown at four different axial positions alongthe sample (x/L = 0–0.25–0.5–0.75–1).
3.3. Estimated heat transfer coefficients
Using the model illustrated in Section 2.3.1, the effective radial(ke,r) and axial (ke,a) thermal conductivities as well as the wall heattransfer coefficient (hw) were estimated by regression on each
individual heat transfer run, fitting the measured temperature dis-tributions. The range of the estimates of the heat transfer coeffi-cients, organized according to the test operating conditions, isreported for each sample in Table 4. The variation within eachrange accounts for the dependency of the parameters on the runtemperature and the gas flow rate. The effective radial conductivityof Sample A increases from 0.3 W m�1 K�1, in heating runs at lowtemperature, to 0.95 W m�1 K�1 in cooling runs at high

Table 4Effective radial conductivity (ke,r) and wall heat transfer coefficient (hw): ranges of the estimates for all the investigated metal foam samples as a function of the test operatingmode.
Sample Run
HLT CLT HHT CHT
ke,r (W m�1 K�1) hw (W m�2 K�1) ke,r (W m�1 K�1) hw (W m�2 K�1) ke,r (W m�1 K�1) hw (W m�2 K�1) ke,r (W m�1 K�1) hw (W m�2 K�1)
A 0.30–0.41 49–55 0.29–0.50 50–65 0.38–0.50 89–95 0.54–0.95 84–111B 0.45–0.60 171–185 0.48–0.68 167–194 0.63–0.70 176–213 0.67–0.97 237–245C 7.73–7.74 117–127 7.73–7.73 150–182 7.73–7.74 150–180 7.73–7.74 223–260D 7.21–7.25 97–103 7.20–7.21 104–120 7.22–7.22 120–132 7.22–7.22 151–158E 3.86–3.87 104–116 3.86–3.87 111–145 3.87–3.88 138–149 3.87–3.87 186–242
522 E. Bianchi et al. / Chemical Engineering Journal 198–199 (2012) 512–528
temperature, and from 0.45 to 0.97 W m�1 K�1 for Sample B in thesame operative conditions. In the case of Samples C–E, on the otherhand, the effective conductivity is almost constant, independent ofthe run mode, and equal to 7.73, 7.22 and 3.86 W m�1 K�1 respec-tively. The wall heat transfer coefficient varies instead from aminimum of 49 W m�2 K�1, for Sample A in heating mode at lowtemperature and minimum flow rate, to a maximum of260 W m�2 K�1, for Sample C in cooling mode at high temperatureand flow rate. The 95%confidence intervals for the estimates of theeffective radial conductivity and the wall coefficient are found tobe less than 4% on the average.
3.3.1. Effective radial conductivity3.3.1.1. Influence of the conductivity of the solid phase. The most evi-dent effects on the measured temperature profiles are those con-nected with changing the solid conductivity of the foams. In thecase of FeCrAlY Samples A and B the 28 mm diameter of the testtube is sufficient to induce a pronounced radial temperature gradi-ent, as apparent in Fig. 7a, where distinct axial temperature pro-files are apparent for each radial location inside the foam. On thecontrary, for the Al foam E (Fig. 8a), associated with a porosityand with a pore density similar to those of Sample B, the radialtemperature gradient is almost flat and the axial temperature pro-files are almost overlapped. Looking at thermal profiles in Figs. 7aand 8a, the most important factor in the enhancement of the effec-
15 20 25 30 350.00
0.25
0.50
0.75
1.00
7.50
8.00
8.50
Sample C: Al
k e,r ,
Wm
-1K
-1
Flow Rate, Nlmin-1
HHT HLT CHT CLT
Sample A: FeCrAlY
Fig. 10. Effective radial conductivity in all the operative conditions with N2 feed infunction of flow rate (Section 2.3.2). HHT: heating high temperature; HLT: heatinglow temperature; CHT: cooling high temperature. CLT: cooling low temperature.Sample A (filled symbols): FeCrAlY, eT � 95%, 10 nominal PPI; Sample C (hollowsymbols): Al-alloy, eT � 89%, 40 nominal PPI.
tive radial conductivity is clearly the intrinsic conductivity of thesolid matrix. In fact, the maximum value of this parameter for FeC-rAlY foams is only 1 W m�1 K�1, while the smallest value of the AlSample E, which presents a similar porosity, is almost four timeshigher. In spite of this, it is important to notice that the conductiv-ity of the Al alloy is around ten times the FeCrAlY conductivity;accordingly, it is evident that the increase of the foam effectiveconductivity is less than proportional to the solid conductivity.
3.3.1.2. Influence of porosity. Because of the importance of the solidproperties, variations in the volume fraction of the solid matrix areexpected to have large consequences on the effective conductivity.This is confirmed by comparing Samples E and C (Figs. 8 and 9),which share the same pore size and bulk material, but exhibit dif-ferent porosities. The estimates in Table 4 show that, against a dou-bled solid fraction of Sample C versus E, also the effectiveconductivity of foam C is a bit more than doubled.
3.3.1.3. Influence of cell size. For a given porosity, decreasing thepore size increments the interfacial surface area, which would en-hance heat and mass transfer between the metal foam and thefluid, but apparently this does not affect also the effective conduc-tivity to a great extent. In our data, samples with higher pore den-sity, namely Sample B for FeCrAlY and Sample C for Al, areassociated with slightly higher coefficients than the correspondingsamples with lower PPI, i.e. Samples A and D, respectively. But thisis not a sufficient basis to prove a significant influence of the poresize. In fact, according to the literature [25,26,43] the characteristicsize of the cells constituting the foam has no impact on its effectiveconductivity. Our estimates could be probably more affected byminor differences in porosity, which incidentally is a bit lower justin the foams with smaller pores.
3.3.1.4. Influence of operative conditions. The estimates in Table 4exhibit variations not only depending on the sample propertiesbut also on the operating conditions of the heat transfer runs. Asan example, the effective radial conductivities collected in bothheating and cooling runs at high and low temperatures are plottedversus the flow rate in Fig. 10 for Sample A (FeCrAlY, eT � 95%, 10nominal PPI) and Sample C (Al-alloy, eT � 89%, 40 nominal PPI).The data show a more pronounced dependency of the effective ra-dial conductivity on the operative conditions for the FeCrAlY foam,while such a dependency is negligible for the Al sample. This sug-gests that in highly conductive foams heat transfer contributionsdue to convection and radiation are scarcely important, while theymay become significant in the case of foams made of poorly con-ductive materials. In this case, on moving from runs at lower tem-perature to runs at higher temperature the estimated effectiveradial conductivity grows because both the solid and gas conduc-tivity grow with increasing temperature and also because radiationeffects are more relevant. Effective radial conductivities (ke,r) of

E. Bianchi et al. / Chemical Engineering Journal 198–199 (2012) 512–528 523
Sample A (Fig. 10) in cooling runs seem to be higher than in heatingruns, but this effect is again most likely due to a temperature effect.In fact in our experiments cooling runs involve a higher averagetemperature than the corresponding heating runs. Moreover, fora specific heating or cooling condition a variation of the parameterestimates is detected also upon changing the flow rate, denotingsome convective contribution.
3.3.2. Effective axial conductivityThe assumption of constant geometrical properties of the foam
samples both in the axial and in the radial direction should resultalso in a uniform effective thermal conductivity, an assumptionadopted also by Calmidi and Mahajan [54]. However, some authorssimplify the energy equation for foam beds either by eliminatingthe axial coefficients [32], or neglecting the contribution of the so-lid phase [56,57] in the axial direction. In principle this could bevalid for common packed beds with an unconsolidated solid matrixor for low conductive bulk materials. In case of the continuous,highly conductive metal foams investigated in this work, however,such simplifications are definitely not adequate. Accordingly, ourmodel takes into account the contribution of the axial conductivityin the energy balance. As expected, the calculated values werefound to be similar to the radial ones.
It is worth noticing, however, that the estimates of the axialconductivity are affected by significant uncertainty, because theregression on thermal profiles shows a very weak dependency onthis parameter. In this respect a sensitivity analysis has been per-formed, setting the effective axial conductivity equal either tothe radial one or to the gas conductivity: variations of less than10% on the estimates of the other two fitting parameters, ke,r andhw, have been found. Based on these results, it was decided to carryout no further analysis of this coefficient, the focus of this workbeing indeed on the more important radial conductivity.
3.3.3. Wall heat transfer coefficientAlthough radial temperature profiles were flat inside the con-
ductive Al foams (see Figs. 8a and 9a), the gas temperature at theoutlet of the test section did not reach the skin temperature ofthe pipe in our heat transfer runs. In fact, the radial profiles inFigs. 7b, 8b and 9b show that the temperature gradient was mostlyconfined at the inner tube wall. Accordingly, the heat transfer coef-ficient at the wall, hw, turns out to be the controlling heat transfer
15 20 25 30 350
50
100
150
h W ,
Wm
-2K
-1
Flow Rate, Nlmin-1
HHT HLT CHT CLT
Fig. 11. Effects of N2 flow rate and temperature on the estimates of the wall heattransfer coefficient for heating and cooling test modes. Sample A: FeCrAlY, eT � 95%,nominal PPI = 10.
parameter in our study, at least in the case of the Al foam sampleswith high effective thermal conductivities (i.e. Samples C–E).
3.3.3.1. Influence of the foam properties. Inspection of the estimatesof hw obtained by regression of the flow heat transfer runs reveals asignificant dependency on the foam geometry, the wall heat trans-fer coefficients growing with increasing cell density. As an exam-ple, for Samples C and D, featuring a nominal PPI of 40 and 10,the estimated hw was 180 and 132 W m�2 K�1, respectively, inHT heating runs with a N2 flow rate of 20 Nl/min. This suggestsan inverse dependency of the wall coefficient on the foam cell size.Notably, the corresponding estimates of ke,r did not differ to a sig-nificant extent, being 7.19 and 7.74 W m�1 K�1, respectively.
On the other hand, the estimates of hw do not point out anyclear dependency both on the foam fabrication material and onthe foam solid volume fraction. For example, comparing sampleswith similar PPI, the estimated wall heat transfer coefficients inHT heating runs were 180 and 190 W m�2 K�1 for Samples C andE, both made of Al but with relative densities differing by a factorof two, while an estimate of 200 W m�2 K�1 was found for SampleB made of FeCrAly.
3.3.3.2. Influence of the operating conditions. The estimates in Table 4show that, in the explored conditions, the wall heat transfer coef-ficient exhibits a positive dependency on the temperature: thismay be related to the beneficial effect of temperature either onthe gas properties, and specifically on its conductivity, or on theradiative contribution. In addition to that, the estimates of hw alsoexhibited a weak positive dependency on the gas flow rate. Fig. 11displays both of these effects in the case of Sample A.
In summary, the analysis of the heat transfer runs herein pre-sented identifies the foam cell size and, possibly, the thermal con-ductivity of the process gas as the two main parameters controllingthe wall heat transfer coefficient in foam-loaded tubular reactors.The dependency of hw on the gas properties will be specifically ad-dressed in our future work by dedicated flow heat transfer runsusing helium gas instead of nitrogen.
3.4. Theoretically estimated conductivity of the solid matrix
Results presented in Table 4 show, in particular for Al foams, aradial effective conductivity weakly dependent on the flow rateand the operative conditions, and suggest a determining role ofthermal conduction. Unfortunately, estimates from literature mod-els for pure conduction in foams are spread out on a wide range ofvalues, while our experimental measurements include also convec-tive and radiative contributions. Thus, in order to investigate sep-arately the conductive contribution to effective radial heattransfer, the 3D reconstructed volumes obtained from the X-raymicro-computed tomography scanned foam samples were usedto theoretically calculate the effective directional conductivity inthe solid phase. Following the same considerations already pre-sented in the section on geometrical characterization, it is evidentthat a representative volume must be considered that allowsextending the estimated thermal properties to the whole foam.Therefore, the effective conductivity of the scanned foams was
Table 5Foams B–D. Average mono-directional effective thermal conductivity computed byFVM in reconstructed cuboid volumes.
ke,s (W m�1 K�1) Foam B FeCrAlY Foam C Al Foam D Al
Cube: side � 3dc 0.28 ± 0.05 6.6 ± 0.7 –Cube: side � 11 mm 0.31 ± 0.05 6.6 ± 0.7 6.8 ± 0.9Cuboid: 11 � 11 � 40 mm – 6.4 ± 0.8 6.4 ± 0.9

Fig. 12. 3D surface of a cube volume (11 � 11 � 11) of foam C (a), and 3D mesh for FV analysis at different degrees of refinement: 2.5 million (b) and 9 million (c) cells.
Table 6Foams C and D. Total porosity, radial and axial effective thermal conductivitycomputed by FVM in reconstructed mesh.
Sample type and sizes Total porosity(%)
ke,a
(Wm�1K�1)ke,r
(Wm�1K�1)
Sample C: Al –Ø28 � 25 mm
89.3 6.9 ± 0.5 7.0 ± 0.5
Sample D: Al –Ø28 � 50 mm
90.1 6.8 ± 0.5 6.5 ± 0.7
524 E. Bianchi et al. / Chemical Engineering Journal 198–199 (2012) 512–528
evaluated in volumes of different dimensions. However, the recon-structed volume was upper bounded by the geometry of thescanned sample while as a lower bound only volumes bigger thanthe REV reported by Brun et al. [51] were considered, because it ismeaningless to calculate an effective conductivity on a domain thatis not geometrically consistent.
First of all, to evaluate the thermal isotropy of the samples themono-directional conductivity of the solid matrix has been calcu-lated in cubic volumes, with a side length equal to three timesthe cell diameter and to the maximum available length avoidingthe holes for thermocouples (approx. 11 mm), except for foam Dwhere the two dimensions overlap. Then, for foams C and D itwas also possible to measure the conductivity in each axis in a big-ger volume: a cuboid with 40 mm thickness in the Z direction, par-allel to the longer sample axis, and a side length in the othercoordinates of approx. 11 mm. The mesh dimensions were also
limited by the maximum memory available in the computer clus-ter, the request increasing with the resolution of the X-ray micro-computed tomography images and with the size of the recon-structed volume. For this reason, the biggest volumes recon-structed belong to Samples C and D, scanned with a resolutionclose to 50 lm. Table 5 reports the effective conductivities of thesolid phase extracted from the reconstructed cuboids. The valuesfound in each direction diverge up to 15%, but, despite the highervalue in the Z direction, this seems to be related to a different soliddistribution in the sides normal to each axis. The solution waschecked to be mesh independent by increasing the mesh grid untila stable result was reached. In Fig. 12a a cube of foam C of 11 mmlength was reconstructed and meshed with 2.5 million (Fig. 12b)and 9 million elements, respectively, being the minimum numberrequired to obtain a consistent domain on the one hand and themaximum number that could reasonably be handled on the otherhand. The calculated effective conductivity in the last case is about70% higher of that of the first case, but only 5% higher of the con-ductivity of a mesh of about 6 million elements. However, thenumber of mesh elements is limited again by the memory require-ment and also by the mesh quality (skewness, aspect ratio) accept-able not to impair the results [58]. The grid dimension alsodepends on the strut thickness of the foam: thinner or hollowstruts require smaller elements for their detailed representation,and this means a much higher number of elements to generatethe mesh of a same volume in comparison to foams with thickerstruts. For all these reasons, the reconstruction of a cylindrical
0.88 0.90 0.92 0.94 0.96 0.980.00
0.01
0.02
0.03
0.04
0.05
0.06
[k]
[j]
[g]
[i]
[b]
[f]
[a] Calmidi et al.: Al/air [b] Peak et al. : Al/air [c] Coquard et al. : FeCrAlY /air [c] Coquard et al. : Ni-Cr /air [d] Sadeghi et al. : Al/air [e] Schmierer et al.: Al /vacuum
Foam B: FeCrAlY Foam C: Al Foam D: Al
[f] Lemlich: Model [g] Langlois et al. : Model [b] Peak et al.: Model [h] Dietrich et al.: Model [i] Bhattacharya et al.: Model [j] Eduard: Model "Fat" [k] Ashby et al. : Modelk e/ k
s , [-
]
void fraction, [-]
[h]
Fig. 13. Effective conductivities computed in cuboid meshes of scanned samples (open symbols) are compared with available literature experimental data for metal foams(solid symbols), and with literature correlations (lines). References: (a) Calmidi and Mahajan [25]; (b) Peak et al. [65]; (c) Coquard et al. [66]; (d) Sadeghi et al. [67]; (e)Schmierer and Razani [20]; (f) Lemlich [17]; (g) Langlois and Coeuret [18]; (h) Dietrich et al. [21]; (i) Bhattacharya et al. [22]; (j) Edouard [29]; (k) Ashby [15].
0 1 2 3 4 5 6 7 8 9 100
1
2
3
4
5
6
7
8
9
10 Foam A: FeCrAlY Foam B: FeCrAlY Foam C: Al-alloy Foam D: Al-alloy Foam E: Al-alloy
- 25%
k e, L
emlic
h , W
m-1K
-1
ke,r
, Wm-1K-1
+25%
Fig. 14. Parity plot: estimates of ke,r [W m�1 K�1] (this work) versus predictions ofLemlich model, for the purely conductive contribution, Eq. (11). j: Sample A; N:Sample B; h: Sample C; H: Sample D; d: Sample E.
E. Bianchi et al. / Chemical Engineering Journal 198–199 (2012) 512–528 525
sample with the internal through holes was possible only for Sam-ples C and D (with the lower resolution of approx. 50 lm), whilefor Sample C only half of the axial length could be reconstructed.
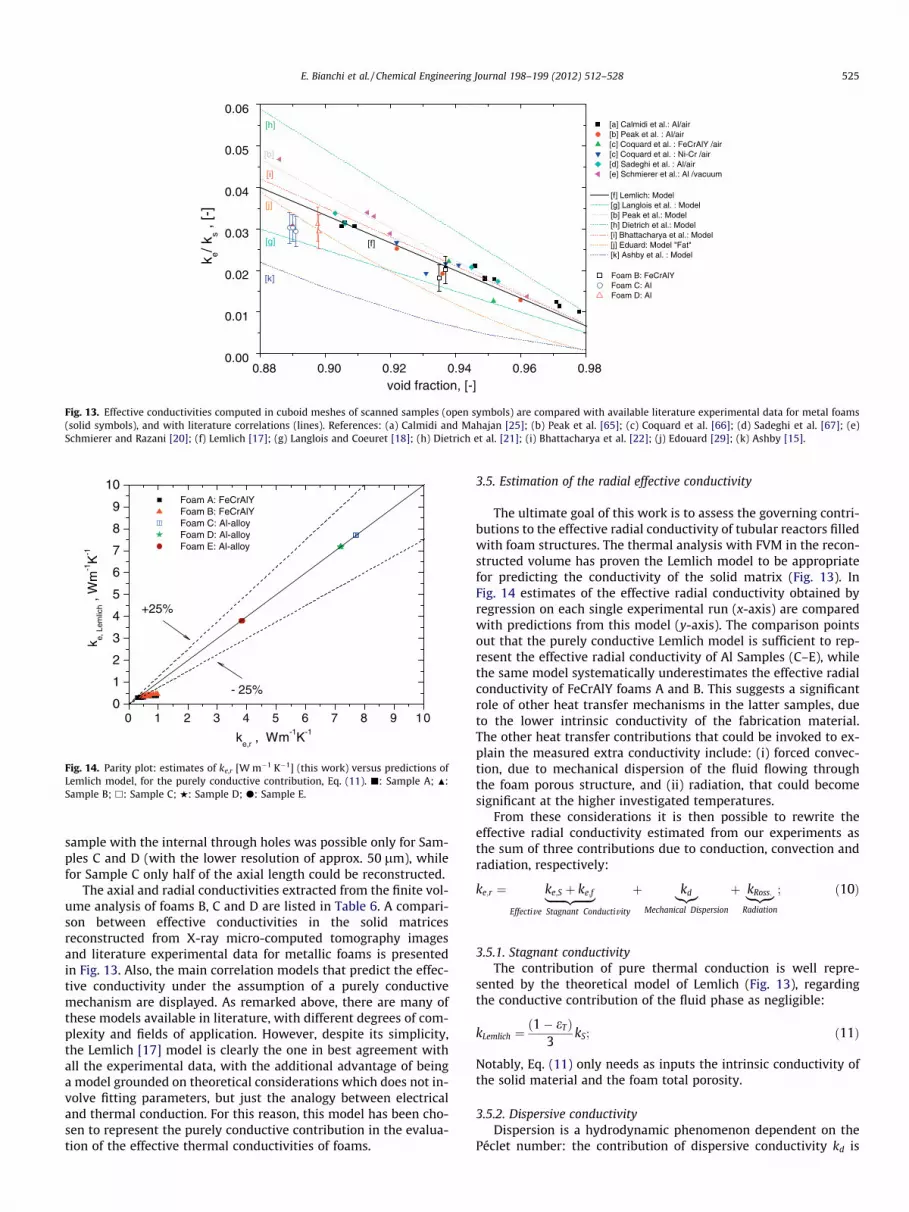
The axial and radial conductivities extracted from the finite vol-ume analysis of foams B, C and D are listed in Table 6. A compari-son between effective conductivities in the solid matricesreconstructed from X-ray micro-computed tomography imagesand literature experimental data for metallic foams is presentedin Fig. 13. Also, the main correlation models that predict the effec-tive conductivity under the assumption of a purely conductivemechanism are displayed. As remarked above, there are many ofthese models available in literature, with different degrees of com-plexity and fields of application. However, despite its simplicity,the Lemlich [17] model is clearly the one in best agreement withall the experimental data, with the additional advantage of beinga model grounded on theoretical considerations which does not in-volve fitting parameters, but just the analogy between electricaland thermal conduction. For this reason, this model has been cho-sen to represent the purely conductive contribution in the evalua-tion of the effective thermal conductivities of foams.
3.5. Estimation of the radial effective conductivity
The ultimate goal of this work is to assess the governing contri-butions to the effective radial conductivity of tubular reactors filledwith foam structures. The thermal analysis with FVM in the recon-structed volume has proven the Lemlich model to be appropriatefor predicting the conductivity of the solid matrix (Fig. 13). InFig. 14 estimates of the effective radial conductivity obtained byregression on each single experimental run (x-axis) are comparedwith predictions from this model (y-axis). The comparison pointsout that the purely conductive Lemlich model is sufficient to rep-resent the effective radial conductivity of Al Samples (C–E), whilethe same model systematically underestimates the effective radialconductivity of FeCrAlY foams A and B. This suggests a significantrole of other heat transfer mechanisms in the latter samples, dueto the lower intrinsic conductivity of the fabrication material.The other heat transfer contributions that could be invoked to ex-plain the measured extra conductivity include: (i) forced convec-tion, due to mechanical dispersion of the fluid flowing throughthe foam porous structure, and (ii) radiation, that could becomesignificant at the higher investigated temperatures.
From these considerations it is then possible to rewrite theeffective radial conductivity estimated from our experiments asthe sum of three contributions due to conduction, convection andradiation, respectively:
ke;r ¼ ke;S þ ke;f|fflfflfflfflfflffl{zfflfflfflfflfflffl}Effective Stagnant Conductiv ity
þ kd|{z}Mechanical Dispersion
þ kRoss:|ffl{zffl}Radiation
; ð10Þ
3.5.1. Stagnant conductivityThe contribution of pure thermal conduction is well repre-
sented by the theoretical model of Lemlich (Fig. 13), regardingthe conductive contribution of the fluid phase as negligible:
kLemlich ¼ð1� eTÞ
3kS; ð11Þ
Notably, Eq. (11) only needs as inputs the intrinsic conductivity ofthe solid material and the foam total porosity.
3.5.2. Dispersive conductivityDispersion is a hydrodynamic phenomenon dependent on the
Péclet number: the contribution of dispersive conductivity kd is

526 E. Bianchi et al. / Chemical Engineering Journal 198–199 (2012) 512–528
more important the smaller the stagnant conductivity is. Previousworks [8] which attempted to quantify the dispersion in porousmedia concluded that kd [W m�1 K�1] is linearly proportional tothe local flow velocity at high Péclet numbers. Calmidi and Maha-jan [54], studying the forced convection of air in high porosity alu-minum foams at room temperature, proposed the following model,in accordance with the literature [8], for the isotropic dispersiveconductivity:
kd
ke;0¼ CdReK Pre; ð12Þ
where Cd is the coefficient of thermal dispersion, the Prandtl num-ber is based on the effective conductivity ke and the Reynolds num-ber on the square root of the permeability K [m2], defined as [59]:
K
d2p
¼ 0:00073ð1� eÞ�0:224 ts
dp
� ��1:11
; ð13Þ
The authors obtained a reasonable fit with Cd = 0.06 for theexperimental data of Hunt and Tien [8] collected on low conductiv-ity foams. The same coefficient is proposed by Edouard et al. [57]
0 1 2 3 4 5 6 7 8 9 100
1
2
3
4
5
6
7
8
9
10 Foam A: FeCrAlY Foam B: FeCrAlY Foam C: Al-alloy Foam D: Al-alloy Foam E: Al-alloy
-25%
k e,M
odel ,
Wm
-1K
-1
ke,r
(this work), Wm-1K-1
+25%
Fig. 15. Parity plot: estimates of ke,r [W m�1 K�1] (this work) versus predictions ofEq. (10). Conduction model: Lemlich [17]. Dispersion model: Calmidi and Mahajan[54] Radiation model: Glicksman et al. [60].
Fig. 16. Contributions of heat transfer mechanisms to the effective radial conductivity ofat 25 Nl/min in different operative conditions. (a) Sample B, made of FeCrAlY; (b) Sampcooling runs with oven temperature set at 100 �C; HHT, heating runs with oven temperatuand 300 �C for Sample E. Conduction, convection and radiation models as in Fig. 15.
for their polyurethane (PU) and silicon carbide (SiC) foams, usinghowever the cell diameter as the characteristic length in the Rey-nolds number and a Prandtl number based on gas conductivity.
3.5.3. Effective radiative conductivityThe third main heat transfer mechanism which can have an
important influence is radiation, whose contribution increases rap-idly with temperature [35]. Under the assumptions that the localradiative heat flux mainly depends on the local temperature gradi-ent it is possible to identify an equivalent radiative conductivitythat can be inserted directly into the Fourier equation. The formu-lation of the effective radiative conductivity is based on a modifieddiffusion approximation of the Rosseland equation, as proposed byGlicksman et al. [60]:
kRoss: ¼16rT3
3b; ð14Þ
where r = 5.669 � 10�8 [W m�2 K�4] is the Stefan–Boltzmann con-stant and b [m�1] is the Rosseland mean extinction coefficient. Con-ceptually this coefficient, which is the sum of absorption andscattering coefficients, is the inverse of the penetration thicknessof radiation. Experimentally, this coefficient could be estimated byspectrophotometric measurements, integrating the monochromaticextinction coefficient over the whole spectrum. However, this ap-proach is quite complex and therefore in the literature empiricalrelations were developed connecting the extinction coefficient withgeometrical characteristics of foams, such as pore size and porosity[61], while the influence of solid emissivity on the equivalent radi-ative conductivity was found to be negligible [62]. Later, Loretzet al. [63] proposed the following correlation to calculate b as afunction of the structural properties of foams:
b ¼ CRoss:
ffiffiffiffiffiffiffiffiffiffiffiffiffiffiffiffiffiffið1� eHÞ
pdc
; ð15Þ
wherein CRoss. is a geometrical fitting parameter, estimated tobe = 2.65. Using the same approach, Glicksman et al. [60] estimateda significantly higher value of CRoss. = 4.09.
3.5.4. Role of the different contributions to the overall effective radialconductivity
Predictions of ke,r have been generated according to Eq. (10),adding convective [54,57] and radiative [23,60,61,63] contribu-tions predicted by several different literature models to the con-ductive term according to the Lemlich model in Eq. (11). Ingeneral, the results were widely scattered in the case of poorly
foams with different solid conductivity but similar porosity (eT � 94% and PPI � 30)le E, made of Al alloy. HLT, heating runs with oven temperature set at 300 �C; CLT,re set at 500 �C; CHT, cooling runs with oven temperature set at 400 �C for Sample B
E. Bianchi et al. / Chemical Engineering Journal 198–199 (2012) 512–528 527
conductive FeCrAlY foams, for which the convective and radiativeterms are more important, and thus it was not possible to identifya single unifying correlation describing accurately all of our data.
As an example, Fig. 15 shows a parity plot of all the radial con-ductivity estimates obtained in this work from regression on eachindividual heat transfer run versus the corresponding predictionsobtained using Calmidi’s approach [54] for the dispersion contribu-tion and the correlation by Glicksman et al. [60] for the radiativecontribution. A better, although not yet fully satisfactory match,is achieved in comparison with Fig. 14, thus confirming that non-conductive contributions are significant for FeCrAlY samples. Onthe opposite, such contributions are clearly marginal in the caseof foams made of Aluminium, which exhibit a much higher effec-tive radial conductivity thanks to the excellent conductivity oftheir bulk material.
To further qualify this point, Fig. 16 compares the relativeweight of the three relevant heat transfer mechanisms for twofoam samples in FeCrAlY (B) and Al-alloy (E), which have differentintrinsic solid conductivity, but share a similar geometry (eT � 94%and PPI � 30). It is evident from Fig. 16 that in Al samples the lar-gely dominant mode of radial thermal transport is conductionthrough the solid phase. In fact, although the value of kd is severaltimes higher than the fluid conductivity, its effect on the radialconductivity is practically negligible. The same is also true forthe equivalent Rosseland conductivity. On the other hand, boththe dispersive and the radiative terms contribute significantly tothe effective radial conductivity in the case of less conductive FeC-rAlY foams, even though pure conduction remains still the domi-nant mechanism.
4. Conclusions
Foams made of FeCrAlY and of Aluminum, which cover therange of one order of magnitude in intrinsic solid conductivity ra-tio, with various geometrical features, from about 89% to 95% ofporosity and from 10 to 40 PPI, were geometrically characterizedboth with optical methods and by X-ray micro-computedtomography.
The thermal properties of the foams have been investigatedexperimentally in a dedicated rig in view of their use as catalystsupports in tubular reactors. Heat transfer runs in N2 flow wereperformed in a temperature range from 400 to 800 K in both heat-ing and cooling mode, providing measurements of temperatureprofiles both in axial and in radial direction. By fitting such dataaccording to a pseudo-homogeneous 2D heat transfer model itwas possible to estimate the effective radial (ke,r) and axial (ke,a)conductivities of the foam bed, as well as the wall heat transfercoefficients (hw).
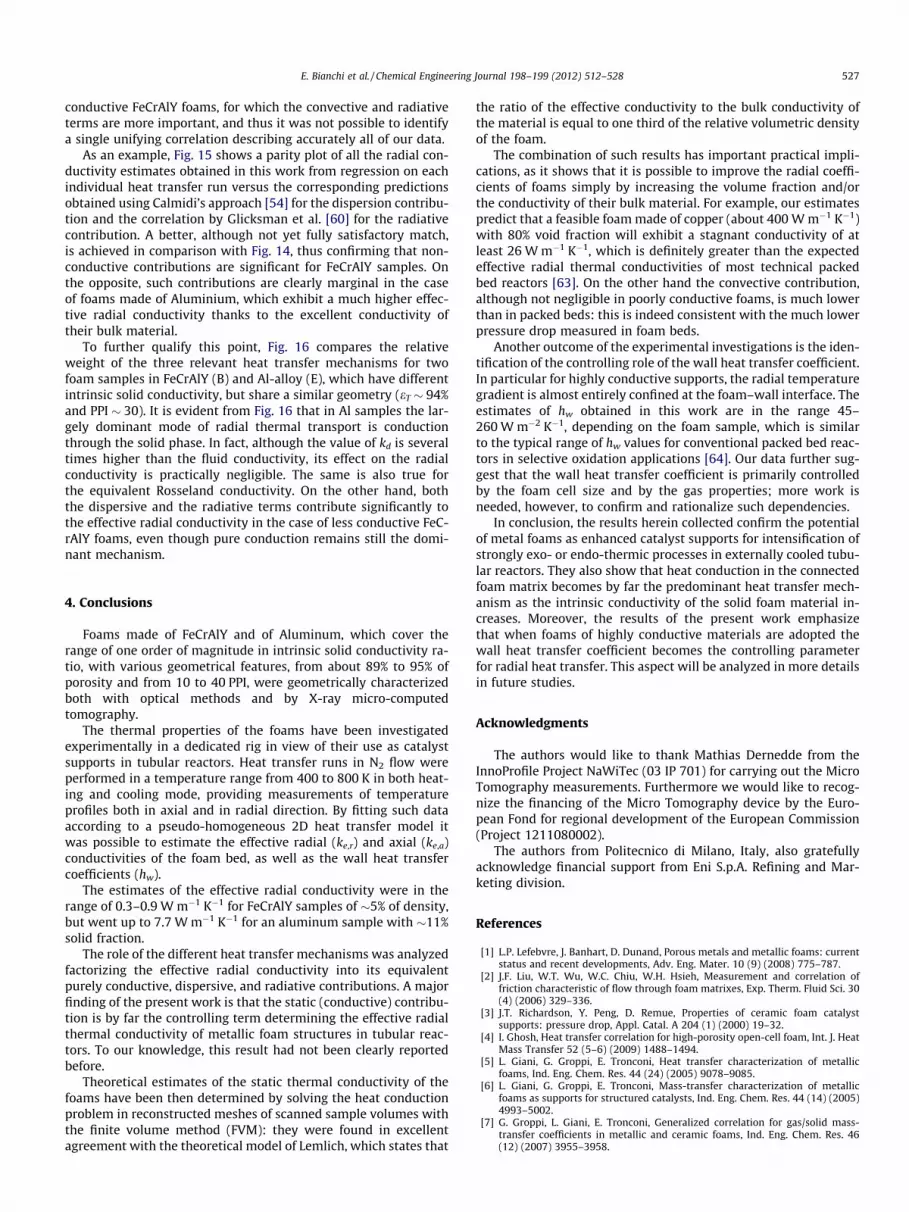
The estimates of the effective radial conductivity were in therange of 0.3–0.9 W m�1 K�1 for FeCrAlY samples of �5% of density,but went up to 7.7 W m�1 K�1 for an aluminum sample with �11%solid fraction.
The role of the different heat transfer mechanisms was analyzedfactorizing the effective radial conductivity into its equivalentpurely conductive, dispersive, and radiative contributions. A majorfinding of the present work is that the static (conductive) contribu-tion is by far the controlling term determining the effective radialthermal conductivity of metallic foam structures in tubular reac-tors. To our knowledge, this result had not been clearly reportedbefore.
Theoretical estimates of the static thermal conductivity of thefoams have been then determined by solving the heat conductionproblem in reconstructed meshes of scanned sample volumes withthe finite volume method (FVM): they were found in excellentagreement with the theoretical model of Lemlich, which states that
the ratio of the effective conductivity to the bulk conductivity ofthe material is equal to one third of the relative volumetric densityof the foam.
The combination of such results has important practical impli-cations, as it shows that it is possible to improve the radial coeffi-cients of foams simply by increasing the volume fraction and/orthe conductivity of their bulk material. For example, our estimatespredict that a feasible foam made of copper (about 400 W m�1 K�1)with 80% void fraction will exhibit a stagnant conductivity of atleast 26 W m�1 K�1, which is definitely greater than the expectedeffective radial thermal conductivities of most technical packedbed reactors [63]. On the other hand the convective contribution,although not negligible in poorly conductive foams, is much lowerthan in packed beds: this is indeed consistent with the much lowerpressure drop measured in foam beds.
Another outcome of the experimental investigations is the iden-tification of the controlling role of the wall heat transfer coefficient.In particular for highly conductive supports, the radial temperaturegradient is almost entirely confined at the foam–wall interface. Theestimates of hw obtained in this work are in the range 45–260 W m�2 K�1, depending on the foam sample, which is similarto the typical range of hw values for conventional packed bed reac-tors in selective oxidation applications [64]. Our data further sug-gest that the wall heat transfer coefficient is primarily controlledby the foam cell size and by the gas properties; more work isneeded, however, to confirm and rationalize such dependencies.
In conclusion, the results herein collected confirm the potentialof metal foams as enhanced catalyst supports for intensification ofstrongly exo- or endo-thermic processes in externally cooled tubu-lar reactors. They also show that heat conduction in the connectedfoam matrix becomes by far the predominant heat transfer mech-anism as the intrinsic conductivity of the solid foam material in-creases. Moreover, the results of the present work emphasizethat when foams of highly conductive materials are adopted thewall heat transfer coefficient becomes the controlling parameterfor radial heat transfer. This aspect will be analyzed in more detailsin future studies.
Acknowledgments
The authors would like to thank Mathias Dernedde from theInnoProfile Project NaWiTec (03 IP 701) for carrying out the MicroTomography measurements. Furthermore we would like to recog-nize the financing of the Micro Tomography device by the Euro-pean Fond for regional development of the European Commission(Project 1211080002).
The authors from Politecnico di Milano, Italy, also gratefullyacknowledge financial support from Eni S.p.A. Refining and Mar-keting division.
References
[1] L.P. Lefebvre, J. Banhart, D. Dunand, Porous metals and metallic foams: currentstatus and recent developments, Adv. Eng. Mater. 10 (9) (2008) 775–787.
[2] J.F. Liu, W.T. Wu, W.C. Chiu, W.H. Hsieh, Measurement and correlation offriction characteristic of flow through foam matrixes, Exp. Therm. Fluid Sci. 30(4) (2006) 329–336.
[3] J.T. Richardson, Y. Peng, D. Remue, Properties of ceramic foam catalystsupports: pressure drop, Appl. Catal. A 204 (1) (2000) 19–32.
[4] I. Ghosh, Heat transfer correlation for high-porosity open-cell foam, Int. J. HeatMass Transfer 52 (5–6) (2009) 1488–1494.
[5] L. Giani, G. Groppi, E. Tronconi, Heat transfer characterization of metallicfoams, Ind. Eng. Chem. Res. 44 (24) (2005) 9078–9085.
[6] L. Giani, G. Groppi, E. Tronconi, Mass-transfer characterization of metallicfoams as supports for structured catalysts, Ind. Eng. Chem. Res. 44 (14) (2005)4993–5002.
[7] G. Groppi, L. Giani, E. Tronconi, Generalized correlation for gas/solid mass-transfer coefficients in metallic and ceramic foams, Ind. Eng. Chem. Res. 46(12) (2007) 3955–3958.

528 E. Bianchi et al. / Chemical Engineering Journal 198–199 (2012) 512–528
[8] M.L. Hunt, C.L. Tien, Effects of thermal dispersion on forced convection infibrous media, Int. J. Heat Mass Transfer 31 (2) (1988) 301–309.
[9] D.P. Haack, K.R. Butcher, T. Kim, T.J. Lu, Novel lightweight metal foam heatexchangers, Proc. ASME Int. Mechanical Engineering Congress Expo 2001, NewYork, NY (2001) 1–7.
[10] J. Banhart, Manufacture, characterisation and application of cellular metalsand metal foams, Prog. Mater. Sci. 46 (6) (2001) 559–632.
[11] T.J. Lu, H.A. Stone, M.F. Ashby, Heat transfer in open-cell metal foams, ActaMater. 46 (10) (1998) 3619–3635.
[12] T. Kodama, A. Kiyama, K.I. Shimizu, Catalytically activated metal foamabsorber for light-to-chemical energy conversion via solar reforming ofmethane, Energy Fuels 17 (1) (2003) 13–17.
[13] S. Mahjoob, K. Vafai, A synthesis of fluid and thermal transport models formetal foam heat exchangers, Int. J. Heat Mass Transfer 51 (15–16) (2008)3701–3711.
[14] G.F. Froment, Design of fixed-bed catalytic reactors based on effectivetransport models, Chem. Eng. Sci. 17 (11) (1962) 849–859.
[15] M.F. Ashby, A.G. Evans, N.A. Fleck, L.J. Gibson, J.W. Hutchinson, H.N.G. Wadley,Metal Foams: A Design Guide, Butterworth Heinemann, Oxford, 2000.
[16] J.C. Maxwell, A Treatise on Electricity and Magnetism, 1, Clarendon Press,1873.
[17] R. Lemlich, A theory for the limiting conductivity of polyhedral foam at lowdensity, J. Colloid Interface Sci. 64 (1) (1978) 107–110.
[18] S. Langlois, F. Coeuret, Flow-through and flow-by porous electrodes of nickelfoam. I. Material characterization, J. Appl. Electrochem. 19 (1) (1989) 43–50.
[19] B. Ozmat, B. Leyda, B. Benson, Thermal applications of open-cell metal foams,Mater. Manuf. Process. 19 (5) (2004) 839–862.
[20] E.N. Schmierer, A. Razani, Self-consistent open-celled metal foam model forthermal applications, J. Heat Transfer 128 (2006) 1194–1203.
[21] B. Dietrich, G. Schell, E.C. Bucharsky, R. Oberacker, M.J. Hoffmann, W. Schabel,M. Kind, H. Martin, Determination of the thermal properties of ceramicsponges, Int. J. Heat Mass Transfer 53 (1–3) (2009) 198–205.
[22] A. Bhattacharya, V.V. Calmidi, R.L. Mahajan, Thermophysical properties of highporosity metal foams, Int. J. Heat Mass Transfer 45 (5) (2002) 1017–1031.
[23] G.N. Dul’nev, Heat transfer through solid disperse systems, J. Eng. Phys. 9 (3)(1965) 399–404.
[24] J.G. Fourie, J.P. Du Plessis, Effective and coupled thermal conductivities ofisotropic open-cellular foams, AIChE Journal 50 (3) (2004) 547–556.
[25] V.V. Calmidi, R.L. Mahajan, Effective thermal conductivity of high porosityfibrous metal foams, J. Heat Transfer 121 (2) (1999) 466–471.
[26] K. Boomsma, D. Poulikakos, On the effective thermal conductivity of a three-dimensionally structured fluid-saturated metal foam, Int. J. Heat Mass Transfer44 (4) (2001) 827–836.
[27] K. Boomsma, D. Poulikakos, Corrigendum for the paper: K. Boomsma, D.Poulikakos’’, On the effective thermal conductivity of a three-dimensionallystructured fluid-saturated metal foam’’[International Journal of Heat and MassTransfer 44 (2001) 827–836], Int. J. Heat Mass Transfer 54 (1) (2011) 746–748.
[28] Z. Dai, K. Nawaz, Y.G. Park, J. Bock, A.M. Jacobi, Correcting and extending theBoomsma–Poulikakos effective thermal conductivity model for three-dimensional, fluid-saturated metal foams, Int. Commun. Heat Mass Transfer37 (6) (2010) 575–580.
[29] D. Edouard, The effective thermal conductivity for ‘‘Slim’’ and ‘‘Fat’’ foams,AIChE J. 57 (6) (2010) 1646–1651.
[30] S. Krishnan, S.V. Garimella, J.Y. Murthy, Simulation of thermal transport inopen-cell metal foams: effect of periodic unit-cell structure, J. Heat Transfer130 (2008). 024503/1–5.
[31] R. Singh, H.S. Kasana, Computational aspects of effective thermal conductivityof highly porous metal foams, Appl. Therm. Eng. 24 (13) (2004) 1841–1849.
[32] Y. Peng, J.T. Richardson, Properties of ceramic foam catalyst supports: one-dimensional and two-dimensional heat transfer correlations, Appl. Catal. A266 (2) (2004) 235–244.
[33] W. Lu, C.Y. Zhao, S.A. Tassou, Thermal analysis on metal-foam filled heatexchangers. Part I: metal-foam filled pipes, Int. J. Heat Mass Transfer 49 (15–16) (2006) 2751–2761.
[34] J.P. Holman, Heat Transfer, McGraw-Hill, New York, 1989 (SI Metric edition).[35] C.Y. Zhao, T.J. Lu, H.P. Hodson, J.D. Jackson, The temperature dependency of
effective thermal conductivity of open-celled steel alloy foams, Mater. Sci. Eng.A 367 (1–2) (2004) 123–131.
[36] J.R. Davis, Aluminum and Aluminum Alloys, vol. 1, M.P.A. International, 1993.p. 784 (ASM International: Handbook Committee ed).
[37] F.P. Incropera, D.P. De Witt, Fundamentals of Heat and Mass Transfer, seconded., John Wiley and Sons Inc., New York (NY), USA, 1985. p. 832.
[38] J. Grosse, B. Dietrich, G. Incera Garrido, P. Habisreuther, N. Zarzalis, H. Martin,M. Kind, B. Kraushaar-Czarnetzki, Morphological characterization of ceramicsponges for applications in chemical engineering, Ind. Eng. Chem. Res. 48 (23)(2009) 10395–10401.
[39] L.J. Gibson, M.F. Ashby, Cellular Solids, 2nd Edn., Cambridge University Press,Cambridge, UK, 1997.
[40] ERG, Duocel� Foam Properties, <http://www.ergaerospace.com/foamproperties/introduction.htm> (retrived 13.02.12).
[41] C.Y. Zhao, T.J. Lu, H.P. Hodson, Thermal radiation in ultralight metal foams withopen cells, Int. J. Heat Mass Transfer 47 (14–16) (2004) 2927–2939.
[42] G. Incera Garrido, F.C. Patcas, S. Lang, B. Kraushaar-Czarnetzki, Mass transferand pressure drop in ceramic foams: a description for different pore sizes andporosities, Chem. Eng. Sci. 63 (21) (2008) 5202–5217.
[43] R. Coquard, M. Loretz, D. Baillis, Conductive heat transfer in metallic/ceramicopen-cell foams, Adv. Eng. Mater. 10 (4) (2008) 323–337.
[44] M. Loretz, R. Coquard, D. Baillis, E. Maire, Metallic foams: radiative properties/comparison between different models, J. Quant. Spectrosc. Radiat. Transfer 109(1) (2008) 16–27.
[45] E. Brun, J. Vicente, F. Topin, R. Occelli, iMorph: A 3D morphological tool to fullyanalyse all kind of cellular materials, in: Cellmet08, Dresden, Germany, 2008.
[46] E. Brun, De l’imagerie 3D des structures à l’étude des mécanismes de transporten milieux cellulaires, Thèse de doctorat, 2009.
[47] B.A. Finlayson, Nonlinear Analysis in Chemical Engineering, McGraw-Hill,London and New York, 1980.
[48] OpenFOAM �, <http://www.openfoam.com> (retrived 13.02.12).[49] ParaView, <http://www.paraview.org/> (retrived 13.02.12).[50] T. Kanit, S. Forest, I. Galliet, V. Mounoury, D. Jeulin, Determination of the size of
the representative volume element for random composites: statistical andnumerical approach, Int. J. Solids Struct. 40 (13) (2003) 3647–3679.
[51] E. Brun, J. Vicente, F. Topin, R. Occelli, M. Clifton, Microstructure and transportproperties of cellular materials: representative volume element, Adv. Eng.Mater. 11 (10) (2009) 805–810.
[52] R. Phelan, D. Weaire, K. Brakke, Computation of equilibrium foam structuresusing the surface evolver, Exp. Math. 4 (1995) 181–192.
[53] M.D. Montminy, A.R. Tannenbaum, C.W. Macosko, The 3D structure of realpolymer foams, J. Colloid Interface Sci. 280 (1) (2004) 202–211.
[54] V.V. Calmidi, R.L. Mahajan, Forced convection in high porosity metal foams, J.Heat Transfer 122 (3) (2000) 557–565.
[55] A. Inayat, H. Freund, T. Zeiser, W. Schwieger, Determining the specific surfacearea of ceramic foams: The tetrakaidecahedra model revisited, Chem. Eng. Sci.66 (6) (2011) 1179–1188.
[56] B. Dietrich, M. Kind, H. Martin, Axial two-phase thermal conductivity ofceramic sponges – experimental results and correlation, Int. J. Heat MassTransfer 54 (11–12) (2011) 2276–2282.
[57] D. Edouard, T.T. Huu, C.P. Huu, F. Luck, D. Schweich, The effective thermalproperties of solid foam beds: experimental and estimated temperatureprofiles, Int. J. Heat Mass Transfer 53 (19–20) (2010) 3807–3816.
[58] J. Tu, G.H. Yeoh, C. Liu, Computational Fluid Dynamics: A Practical Approach,Butterworth Heinemann, Oxford, 2008.
[59] V.V. Calmidi, Transport Phenomena in High Porosity Fibrous Metal Foams, Ph.D. thesis, University of Colorado, 1998.
[60] L. Glicksman, M. Schuetz, M. Sinofsky, Radiation heat transfer in foaminsulation, Int. J. Heat Mass Transfer 30 (1) (1987) 187–197.
[61] P.-f. Hsu, J.R. Howell, Measurements of thermal conductivity and opticalproperties of porous partially stabilized zirconia, Exp. Heat Transfer 5 (4)(1992) 293–313.
[62] C.Y. Zhao, S.A. Tassou, T.J. Lu, Analytical considerations of thermal radiation incellular metal foams with open cells, Int. J. Heat Mass Transfer 51 (3–4) (2008)929–940.
[63] M. Loretz, E. Maire, D. Baillis, Analytical modelling of the radiative propertiesof metallic foams: contribution of X-ray tomography, Adv. Eng. Mater. 10 (4)(2008) 352–360.
[64] B.D. Kulkarni, L.K. Doraiswamy, Estimation of effective transport properties inpacked bed reactors, Catal. Rev. Sci. Eng. 22 (3) (1980) 431–483.
[65] J.W. Paek, B.H. Kang, S.Y. Kim, J.M. Hyun, Effective thermal conductivity andpermeability of aluminum foam materials, Int. J. Thermophys. 21 (2) (2000)453–464.
[66] R. Coquard, D. Rochais, D. Baillis, Experimental investigations of the coupledconductive and radiative heat transfer in metallic/ceramic foams, Int. J. HeatMass Transfer 52 (21–22) (2009) 4907–4918.
[67] E. Sadeghi, S. Hsieh, M. Bahrami, Thermal conductivity and contact resistanceof metal foams, J. Phys. D Appl. Phys. 44 (2011) 125406/1–7.