an analytical model to predict specific shear energy in high-speed turning of inconel 718
TRANSCRIPT
ARTICLE IN PRESS
International Journal of Machine Tools & Manufacture 49 (2009) 979–990
Contents lists available at ScienceDirect
International Journal of Machine Tools & Manufacture
0890-69
doi:10.1
� Corr
E-m
journal homepage: www.elsevier.com/locate/ijmactool
An analytical model to predict specific shear energy in high-speed turningof Inconel 718
R.S. Pawade, Harshad A. Sonawane, Suhas S. Joshi �
Mechanical Engineering Department, Indian Institute of Technology Bombay, Mumbai 400 076, India
a r t i c l e i n f o
Article history:
Received 10 October 2008
Received in revised form
31 May 2009
Accepted 4 June 2009Available online 24 June 2009
Keywords:
High-speed machining
Inconel 718
Specific shearing energy
Oblique cutting
Ploughing forces
Size-effect
55/$ - see front matter & 2009 Elsevier Ltd. A
016/j.ijmachtools.2009.06.007
esponding author. Tel.: +91 22 2576 7527; fax
ail address: [email protected] (S.S. Joshi).
a b s t r a c t
Machining of Inconel 718 at higher cutting speeds is expected to provide some relief from the machining
difficulties. Therefore, to understand the material behavior at higher cutting speeds, this paper presents
an analytical model that predicts specific shearing energy of the work material in shear zone. It
considers formation of shear bands that occur at higher cutting speeds during machining, along with
the elaborate evaluation of the effect of strain, strain rate, and temperature dependence of the shear
flow stress using Johnson–Cook equation. The model also considers the ‘size-effect’ in machining in
terms of occurrence of ‘ploughing forces’ during machining. The theoretical results show that the shear
band spacing in chip formation increases linearly with an increase in the feedrate and is of the order of
0.2–0.9 mm depending upon the processing conditions. The model shows excellent agreement with the
experimental values with an error between 0.5% and 7% for various parametric conditions.
& 2009 Elsevier Ltd. All rights reserved.
1. Introduction
Inconel 718 is a high-temperature resistant alloy (HTRA) usedin the applications that include space station: nickel hydrogenbatteries, aerospace: gas turbine engines, space exploration:space shuttle engine, and for the cryogenic tanks and chemicalindustries [1,2]. Most of these applications are in the componentshaving disc or cylindrical shape, and are produced by a turningprocess. However, machining of this material is still a difficult taskdue to its high specific strength and poor thermal properties,which gave rise to higher tool wear and poor surface integrity [3].Recently, the use of higher cutting speeds has shown promise inthe reduction in tool wear and cutting forces and thus improvingthe machined surface quality to some extent [4,5]. Thus, high-speed machining is expected to provide a suitable technology forthe bulk material removal in machining of the aerospacecomponents of this material. In this context, it is important tounderstand the chip formation mechanism and the mechanics athigher cutting speeds, which govern the quality and integrity ofmachined surfaces [6–9]. It is known that minor changes in thechip formation mechanics may lead to problems like high cuttingforces, short tool life, poor surface topography and surfaceintegrity during or after machining.
ll rights reserved.
: +9122 2572 6875.
An important aspect of the machining mechanics is the specificcutting energy consumed in shear deformation during machining.It is evident from the literature that the researchers have modeledthe specific cutting energy in orthogonal [10–13] and obliquemachining of materials other than Inconel 718 that includes plaincarbon steels (0.19–0.58% C) and titanium alloy. They consideredsome specific characteristics of cutting mechanics of this materialfor modeling [13–17]. Some researchers have included effects ofparameters like work material properties and cutting conditions[18,19], tool nose radius [20], and end cutting edge geometry [21]while formulating the models. Also, attempts have been made tocorrelate the cutting conditions to the shear band spacing andflow localization parameter in chip formation while machiningtitanium alloy Ti–6Al–4V. Even though many of these phenomenaexist while machining superalloys, they to a great extent havenot been incorporated in the theoretical models on machiningof Inconel 718 [12,22]. Further, there are few studies in theliterature on modeling of chip formation mechanism in machiningof Inconel 718. In the FEA-based approach, Hou and Komanduri[23] have modeled the shear localized chip formation inmachining of Inconel 718 and analytically determined tempera-ture rise in the primary deformation zone that contributesto formation of shear localized chips. In another model, thephenomenon of chip formation and its separation duringorthogonal machining of Inconel 718 has been simulated using adamage parameter. It is emphasized that when the value of thisparameter exceeds unity, the chip separates from the workmaterial [24]. Again, there are a few studies on the estimation

ARTICLE IN PRESS
Chip
Shear band Region 2
Nomenclature
ap depth of cut (mm)A material shear strength (MPa)Ac undeformed chip cross-section (mm2)bw width of cut (mm)B material constantC material constantCo Kronenberg’s equation constantCv specific heat (J/kg 1C)F feedrate (mm/rev)Fs shear force (N)Fcp ploughing force component in cutting direction (N)Ftp ploughing force component in thrust direction (N)F00s resultant force of Fpc and Fpt in the direction of shear
plane (N)Fx feed force (N)Fy radial force (N)Fz cutting force (N)I inclination angle (1)k thermal conductivity (W/m 1C)kr tool approach angle (1)Ks unit cutting force (N/mm2)L cutting edge length (mm)M strain rate hardening coefficientN strain hardening exponent
rn cutting edge radius (mm)T undeformed chip thickness (mm)tc chip thickness (mm)T tool temperature (1C)Tm melting temperature (1C)To room temperature (1C)Vc cutting speed (m/min)Vs shear velocity (m/min)Dy shear band spacing (mm)as side clearance angle (1)b flow localization parametergn normal rake angle (1)go orthogonal rake angle (1)gx side rake angle (1)gy back rake angle (1)w1 Taylor–Quinney coefficient �0.9e plastic equivalent strain_e strain rate (per s)_e equivalent plastic strain rate (per s)_e o reference plastic strain rate (per s)fn normal shear angle (1)r density of work material (kg/m3)Zc chip flow angle (1)Zs shear flow angle (1)s flow stress of work material (MPa)
R.S. Pawade et al. / International Journal of Machine Tools & Manufacture 49 (2009) 979–990980
of cutting forces and specific cutting energy that consider thematerial properties such as flow stress, the chip formationmechanisms such as shear band formation [22,24]. However,their effects on cutting forces and specific cutting energies havenot been explicitly considered in these models.
In view of the above, this paper presents an analytical model todetermine specific shearing energy in the primary deformationzone with a consideration to shear instability phenomena thatoccurs during chip formation during high-speed machining ofInconel 718. The paper begins with a description of the approachand important assumptions based on which the model has beenformulated. It is followed by use of three-dimensional obliquecutting model to determine the shearing forces and specific shearenergy by incorporating temperature and strain rate dependenceof flow stress, and the shear bands (thickness) that occur duringthe chip formation. The model is finally validated by performingmachining tests on Inconel 718.
Shear band spacing, Δy
Region 1
Tool
Workpiece
Fig. 1. Schematic showing shear localized chip formation in oblique machining of
Inconel 718.
2. An analytical model for specific shear energy
Specific cutting energy is the energy consumed in unit volumeof material removal. Specific cutting energy is an importantparameter that is directly related to chip formation phenomena,cutting forces, tool wear and machined surface integrity. It isknown that the total specific cutting energy is a sum of theenergies consumed in primary, secondary, and tertiary deforma-tion zones in machining [25]. In this model, an attempt has beenmade to predict the specific shear energy consumed in thedeformation on shear plane during machining of Inconel 718.
It is known from the literature that the mechanism of chipformation in Inconel 718 involves formation of shear bands.During machining, the temperature in the machining regionincreases when the cutting speed crosses a critical value (above60 m/min). As a result, the decrease in flow stress in the sheardeformation zone exceeds the increase in flow stress due to an
increase in strain hardening. This condition promotes the shearlocalization in primary deformation zone. Thus the shearcontinues but concentrates along a narrow band, called as shearband. Thus, there are two deformation regions in a chip asdepicted in Fig. 1. The first region (Region 1) is where the shearconcentrates along a narrow zone and is characterized by ashear band of width Dy. In the second region (Region 2), how-ever virtually no deformation occurs. Thus, the deformationpredominantly involves thermal softening and almost no strainhardening during machining of Inconel 718.

ARTICLE IN PRESS
R.S. Pawade et al. / International Journal of Machine Tools & Manufacture 49 (2009) 979–990 981
2.1. Approach
A systematic approach adopted in this model formulation issummarized below and is also depicted in Fig. 2. It involves thefollowing:
�
Evaluation of shear strength using Johnson–Cook constitutivematerial model. � Evaluation of shear band spacing in the serrated chip based onXie et al. [12] model.
� Determination of mean chip temperature in the primarydeformation zone using analysis by Kronenberg [27].
� Evaluation of shearing forces with the theory of 3D obliquecutting.
� Evaluation of theoretical specific cutting energy using shearstrength of the work material, shear strain in machiningdeformation and material strain hardening exponent.
� Evaluation of contribution of the ploughing effect in thespecific cutting energy. This is based on the length of cuttingedge and cutting edge radius.
� Determination of experimental values of specific shear energyusing measured values of cutting forces.
Oblique cutting model
Theoretical specific shearing energy
Shear strength evaluation
Based on JCook m
Shear band spacing
evaluation
Based onal. mo
Shear zone temperature
Kronenbanaly
Experimental specific shearing energy
Experimental cutting forces
Fx, Fy, Fz
Ploughing effect
Based on Wet al. m
Fig. 2. Flowchart illustrating m
�
Comparison between theoretical (with and without ploughingeffect) and experimental values of the specific shearingenergy.2.2. Assumptions
The following assumptions are made while formulating themodel:
�
ohnode
Xiedel
ergsis
alode
eth
Workpiece material is considered as incompressible andelastic–viscoplastic.
� Temperature-dependant isotropic elastic properties, i.e.Young’s modulus and Poisson’s ratio are assumed to remainconstant.
� Elastic deformation in the primary shear zone is neglected. � During the mechanism of chip formation, the location ofmaximum strain rate is assumed to contain within the shearband.
� No heat transfer occurs between surfaces of the workpiece,chip, and cutting tool, and the surrounding environment.
� Convective and radiation losses of heat energy at the surfacessurrounded by atmosphere are ignored.
Work material
Process
Process
(i, �n, �s = �s-�s)
(Vs, Vc, ap, t)
Cutting tool
son l
et
’s
Parameters
Work material related (k, Cv)
Cutting tool related (Co)
Process related (Vc, Fc, Ac)
(Flow stress, A, B, C, n, m, Tm)
(Strain, Strain rate, Vs, Vc, ap, t)
Work material (k, Cv, �, ∂�/∂T)
Cutting tool (�n)
Process (f, Vc, χ)
dorf l
Process
(Fcp, Ftp, Fs’’)
Cutting tool
(re, rn, kr, l)
odology of the model.

ARTICLE IN PRESS
R.S. Pawade et al. / International Journal of Machine Tools & Manufacture 49 (2009) 979–990982
�
X
FigInco
The mean cutting tool temperature during machining, eval-uated using the analysis by Kronenberg [27], has beenconsidered as the temperature of work material in the shearzone.
� In the following sections, various steps (see Fig. 2) in the modelformulation, its evaluation, and validation are discussed.
2.3. Theory of oblique cutting
In order to incorporate the shear band characteristics inmachining of Inconel 718, a three-dimensional oblique machiningaxes system is considered in this model. In oblique machining,tool cutting edge is inclined to the velocity vector. Three mutuallyperpendicular components of forces are determined with refer-ence to the tool cutting edge. The measured components are alongthe x-, y- and z-axis. Here, the x-axis represents the directionalong the work surface parallel to cutting velocity Vc, y-axisrepresents the direction along the work surface normal to Vc andz-axis is perpendicular to both x- and y-direction (see Fig. 3).
However, the components of resultant force in the plane of thetool face are along the directions x0, y0 and z0. The direction x0 isnormal to the tool face, y0 is along the cutting edge, and z0 isnormal to the cutting edge in the plane of the tool face (see Fig. 3).Hence, the force components with reference to the tool faceare [10]
FX0
Fy0
Fz0
264
375 ¼
cos i �sin i 0
cos gn sin i cos gn cos i sin gn
sin gn sin i �sin gn cos i cos gn
264
375
Fx
Fy
Fz
264
375 ð1Þ
The force components after solving the above matrix will be asfollows:
FX0 ¼ cos iFx � sin iFy
Fy0 ¼ cos gnsin iFx þ cos gncos iFy þ sin gnFz
Fz0 ¼ sin gnsin iFx � sin gncos iFy þ cos gnFz ð2Þ
where Fx, Fy, and Fz are referred to as the forces measured along x-,y- and z-direction, respectively, and the gn and go are the normalrake angle and the orthogonal rake angle, which are determinedusing
Normal rake angle gn ¼ tan�1ftan go cos ig ð3Þ
where go is the orthogonal rake angle
go ¼ tan�1ftan gysinas þ tan gxcosasg ð4Þ
VcZ’
X’
i
ZFZ
FX
Fc
FtY’
F
�n
Feed
Depth of cut
Y
�
. 3. Schematic showing cutting force components in oblique machining of
nel 718.
2.4. Evaluation of theoretical specific shearing energy
It is known from the theory of metal cutting that the specificcutting energy consumed in machining is the energy required formetal removal in three deformation zones—primary, secondary,and tertiary deformation zones [10]. In this model, only thespecific cutting energy in primary deformation zone (Ps) has beenmodeled. The energy required for shearing the work material inprimary deformation zone is given as [10]
Ps ¼ KFsVs
btVcð5Þ
where K is a material constant. It is known that the machiningforces involve ploughing forces due to non-sharpness of cuttingedge. These forces are known to increase the total specific cuttingenergy to some extent. Fs, i.e. the shearing force in the aboveequation, will change as a result of the presence of ploughingforces. Therefore, now Fs is assumed to consist of two parts, onedue to machining operation and, the second, due to ploughingphenomenon and is given by
Fs ¼ Fsc þ Fsp ð6Þ
In the above equation, Fsc is the shearing force due to cuttingand Fsp is the ploughing force component in the shear direction.Therefore, Eq. (5) now can be written as
Ps ¼ðFsc þ FspÞcosBsVs
btVcð7Þ
Ps ¼ KFscVs
btVcþ
Fspcos zsVs
btVcð8Þ
Now replacing the first term on R.H.S. of the above equation byappropriate expression (as explained in the following section)indicating energy of the material deformation [28], we get
Ps ¼ Kse þ Fspcos zsVs
btVcð9Þ
Thus, the total shearing energy can be written as
Ps ¼ Psshearingþ Psploughing
ð10Þ
The ploughing force is known to act normal to the tool envelopand the tool tip, and around the Z-direction. Therefore, ploughingforces interfere mostly the Fz or thrust component of forces inoblique cutting. But when the cutting is assumed to be perfectlysharp, these forces are not considered in the analysis.
In the following sections, the procedure to evaluate both thecomponents of the total shearing energy has been described.
2.4.1. Evaluation of theoretical specific shearing energy due to
shearing, Ps_shearing
Knowing the stress–strain relationship, the shear strain energyper unit volume, i.e. strain energy density due to cutting inEq. (10) can be written as [28]
Psshearing¼
Zes de ¼ C
enþ1
nþ 1¼
senþ 1
ð11Þ
In the above equation s is the effective stress in the shear zone,C is the specific stress and e is the shear strain. In the followingsections, evaluation of sand e is described.
ARTICLE IN PRESS
R.S. Pawade et al. / International Journal of Machine Tools & Manufacture 49 (2009) 979–990 983
2.4.1.1. Evaluation of e. In this evaluation it is assumed that e isequivalent to the shearing strain in machining. It is known thatthe shearing strain in oblique cutting is given by [10]
e ¼ tanðfn � gnÞ þ cotfn
cosZs
ð12Þ
2.4.1.2. Evaluation of flow stress, s. The flow stress, s, representsthe stress necessary to initiate yielding of a work material duringmachining. It is known that the cutting speeds used in the ma-chining experiments are usually very high. As a consequence,the temperatures, strain, and strain rates in machining are alsohigh. Besides, in Inconel 718 machining, work hardening andthermal softening compete each other and these propertieschange with machining conditions considerably. Therefore, eva-luation of the quantity s gives work material flow stress in ma-chining under the influence of strain hardening, strain ratehardening, and thermal softening. It governs the material flowstress in machining [29–31]. To obtain the flow stress of workmaterial dependant on strain, strain rate and temperature, theJohnson–Cook material model has been applied in various mate-rial deformation processes, including machining [32]. It is givenby Eq. (13) as
s ¼ ½Aþ BðeÞn� 1þ CIn_e_e o
!" #1�
T � To
Tm � To
� �m� �ð13Þ
where material constants B, C, n can be obtained by Split Hop-kinson Bar (SHPB) test [26].
In the model presented in this paper, the above equation hasbeen used. To apply the JC equation to a given situation, strain rate_e and temperature T need to be evaluated, as explained in thefollowing sections.
2.4.1.3. Evaluation of strain rate _e . During the evaluation of strainrate _e , it is necessary to consider the effect of shear band forma-tion that takes place in machining of Inconel 718. The shear bandformation is characterized by its width Dy as shown in Fig. 1.Thus knowing shear strain from Eq. (12), we get strain rate inmachining in terms of Dy and the other cutting variables as givenby [10]
_e ¼ tanðfn � gnÞ þ cotfn
cosZs
Vs
Dyð14Þ
In the above equation the quantities Zs, fn, gn, Vs, and Dy arerequired besides T in Eq. (13). These quantities are defined as [10]
Shear flow angle Zs ¼ tan�1 tan icosðfn � gnÞ � tanZc sinfn
cos gn
� �ð15Þ
Dy ¼w1m2f sinfnffiffiffi
3p
cos gn½n=eþ 0:9ð@t=@TÞ=rCð1þ 1:328ffiffiffiffiffiffiffiffiffiffiffiffiffiffiffiKe=Vcf
pÞ�½nþ 1� 0:664
ffiffiffiffiffiffiffiffiffiffiffiffiffiffiffiKe=Vcf
p=1þ 1:328
ffiffiffiffiffiffiffiffiffiffiffiffiffiffiffiKe=Vcf
p�
ð21Þ
Chip flow angle Zc ¼ cos�1 bc
bc=cos i
� �ð16Þ
_e ¼ffiffiffi3p
Vc cos2 gn½tanðfn � gnÞ þ cotfn�½n=eþ 0:9ð@t=@TÞ=rCð1þ 1:328p
w1m2f sinfn cosZs cosð
Normal shear angle fn ¼ tan�1 ðt=tcÞcos gn
1� ðt=tcÞsin gn
� �ð17Þ
Shear velocity Vs ¼Vc cos gn
cosðfn � gnÞð18Þ
Dy, which represents shear band spacing and machiningtemperature T, are evaluated as explained in the next twosections.
2.4.1.4. Evaluation of shear band spacing, Dy. It is well known thatthe shear localization phenomenon prevails in chip formationduring high-speed machining of Inconel 718. This induces adia-batic shear bands in the serrated or shear localized chips (Fig. 1).These adiabatic shear bands result due to onset of shear locali-zation. The expression for the shear band spacing Dy in the shearlocalized chips is derived from the critical localization conditionwhen the instability occurs in the softening region on thestress–strain curve, i.e. Hco0, where Hc is the slope of stress–strain curve [22]. Shear band spacing Dy is a function ofwork material properties, cutting tool geometry during machin-ing, and the machining conditions. It also depends on the locali-zation behavior of the work material due to plastic deformat-ion and the fraction of plastic work converted into heat duringmachining.
The shear band spacing, Dy, in machining of Ti–6Al–4Valloy is given by Eq. (19) [22]. In this work, it is assumedthat the shear band spacing can be evaluated by the sameequation:
Dy ¼ w1
mf sinfn
b cosgn
� �ð19Þ
where w1 is a Taylor–Quinney coefficient that signifies thefraction of plastic work converted into heat. b is a flow locali-zation parameter defined below and can be estimatedas [12]
b ¼ �ffiffiffi3p
m
n
e þ0:9ð@t=@TÞ
rCvð1þ 1:328ffiffiffiffiffiffiffiffiffiffiffiffiffiffike=Vcf
pÞ
!"
� nþ 1�0:664
ffiffiffiffiffiffiffiffiffiffiffiffiffiffike=Vcf
p1þ 1:328
ffiffiffiffiffiffiffiffiffiffiffiffiffiffike=Vcf
p !#
ð20Þ
A quantity (qt/qT) in the above equation is a thermal softeningparameter, which is determined from the slope of the tempera-ture dependence of shear stress. By substituting Eq. (20) intoEq. (19), theoretical shear band spacing can be determined asfollows:
After substituting Eq. (21) into Eq. (14), the strain rate inmachining will be given by
ffiffiffiffiffiffiffiffiffiffiffiffiffiffiffiKe=Vcf Þ�½nþ 1� 0:664
ffiffiffiffiffiffiffiffiffiffiffiffiffiffiffiKe=Vcf
p=1þ 1:328
ffiffiffiffiffiffiffiffiffiffiffiffiffiffiffiKe=Vcf
p�
fn � gnÞð22Þ
ARTICLE IN PRESS
R.S. Pawade et al. / International Journal of Machine Tools & Manufacture 49 (2009) 979–990984
2.4.1.5. Evaluation of temperature T. The temperature in machiningregion in the shear zone is considered as the cutting tool tem-perature given by Kronenberg’s [27] analysis:
T ¼CoKsV0:44
c A0:22c
k0:44C0:56v
ð23Þ
In Eq. (23), Co is Kronenbrg’s constant. Thus, Eq. (23) can beused to determine the temperature in the shear zone. Hence, theshear zone temperature as determined above has been used in theJC constitutive material model to evaluate the temperature T�,which is defined as
T� ¼T � T0
Tm � T0
� �ð24Þ
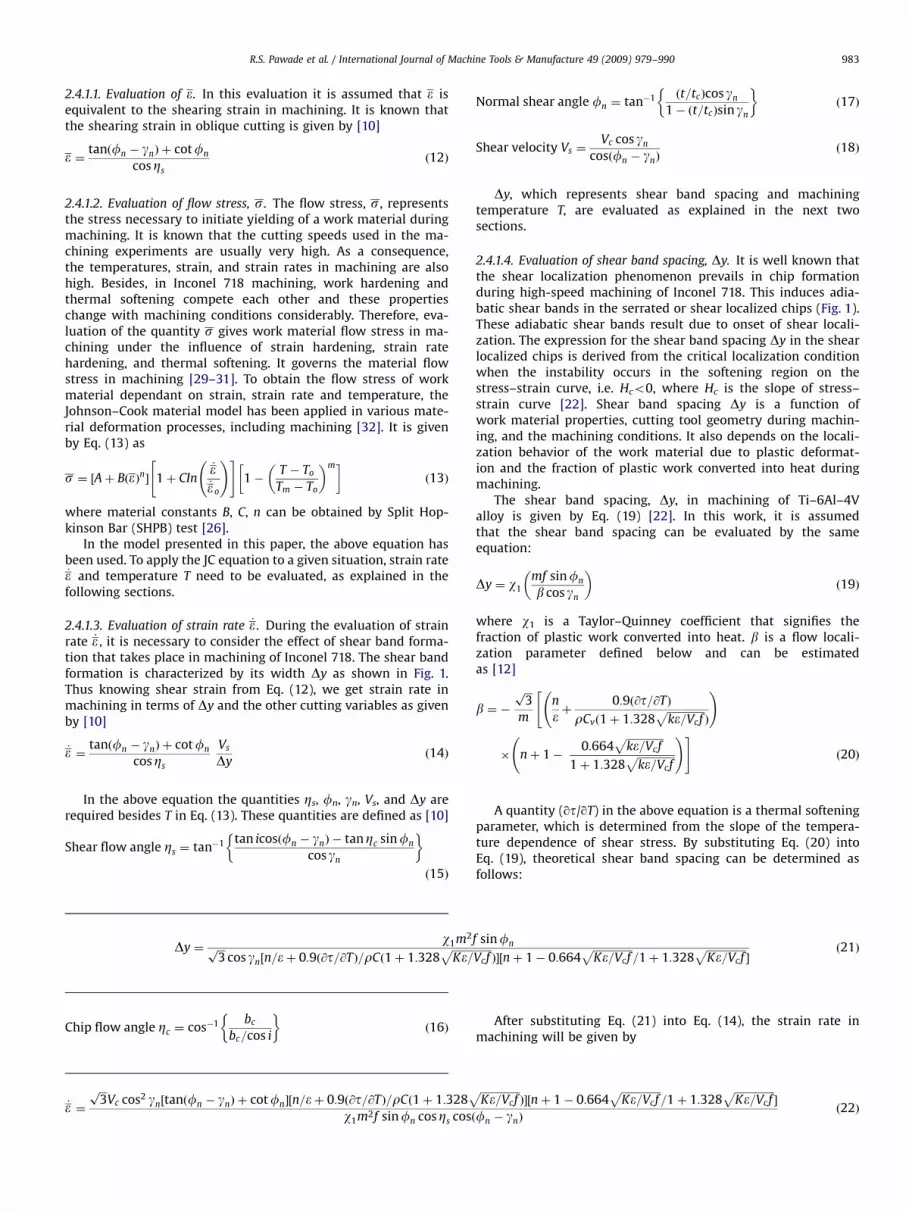
2.4.2. Evaluation of specific energy due to ploughing, Ps_ploughing
It is known that the forces that act along the radius of cuttingedge and which do not contribute to the cutting action are calledas ploughing forces. In general, they increase the total specificcutting energy. The ploughing force components are consideredalong the direction of cutting as well as thrust force as shown inFig. 4. In order to determine the force components due toploughing, the equations in Ref. [33], which are based on a slipline field model for a rigid wedge sliding on a half-space and fororthogonal cutting, have been used. The ploughing forcecomponents acting on the tool in the direction of cutting, Fcp,and that in the direction of feed, Ftp (see Fig. 4) can be determinedas given below. The resultant of the two forces, Fs
00 is given by [33]
Fs00 ¼ ðFcp cosfÞ þ ðFtp cosð90þfÞÞ ð25Þ
Therefore, the ploughing forces Fcp and Ftp are given as follows:[33]
Fcp ¼ slrrn tanp4þg2
ð26Þ
Ftp ¼ slrrn 1þp2
tan
p4þg2
ð27Þ
where l is the active cutting edge length, rn the cutting edgeradius, and s the shear strength of the material. Noting that thewidth of cut is the active cutting edge length, which encompassesstraight and round parts of the cutting edge involved in cutting,l is given by
l ¼ re kr þ sin�1 f
2re
� �� þ
ap � re½1� cosðkrÞ�
sinðkrÞ
�ð28Þ
Ft
Tool
Workpiece
Ftp
Fcp
in the direction of Fs
Fc
Resultant of Ftp and Fcp i.e. F″
�
Fig. 4. Direction of ploughing force components and their resultant force in the
shear force direction.
where re is the tool nose radius, kr is the approach angle, f is thefeed, and ap is the depth of cut.
Psploughing¼
Fs00Vs cos zs
apfVcð29Þ
2.5. Evaluation of experimental specific shearing energy
As we know, the specific cutting energy in shear deformationin oblique cutting is given by [10]
PSexpt ¼Fs cos zsVs
apfVcð30Þ
where Fs (shear force) is the component of the force along theshear plane which is given by
Fs ¼ ½ð�Fx cos iþ Fy sin iÞ2 þ ðFy cosfn cos i� Fz sin gnÞ2�1=2 ð31Þ
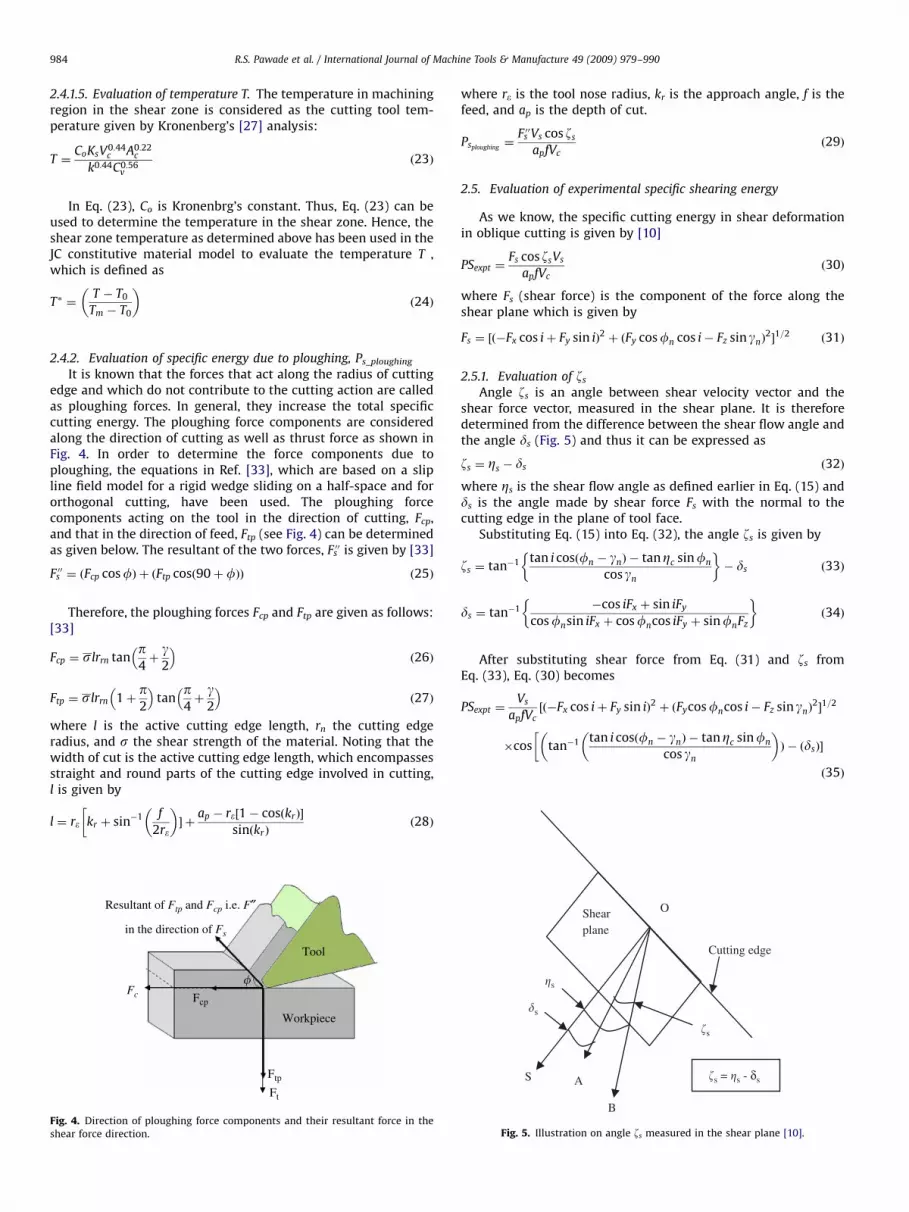
2.5.1. Evaluation of zs
Angle zs is an angle between shear velocity vector and theshear force vector, measured in the shear plane. It is thereforedetermined from the difference between the shear flow angle andthe angle ds (Fig. 5) and thus it can be expressed as
zs ¼ Zs � ds ð32Þ
where Zs is the shear flow angle as defined earlier in Eq. (15) andds is the angle made by shear force Fs with the normal to thecutting edge in the plane of tool face.
Substituting Eq. (15) into Eq. (32), the angle zs is given by
zs ¼ tan�1 tan i cosðfn � gnÞ � tanZc sinfn
cos gn
� �� ds ð33Þ
ds ¼ tan�1 �cos iFx þ sin iFy
cosfnsin iFx þ cosfncos iFy þ sinfnFz
� �ð34Þ
After substituting shear force from Eq. (31) and zs fromEq. (33), Eq. (30) becomes
PSexpt ¼Vs
apfVc½ð�Fx cos iþ Fy sin iÞ2 þ ðFycosfncos i� Fz sin gnÞ
2�1=2
�cos tan�1 tan i cosðfn � gnÞ � tanZc sinfn
cos gn
� �Þ � ðdsÞ�
��ð35Þ
Shear plane
Cutting edge
O
B
S A
�s
�s
�s
�s = �s - δs
Fig. 5. Illustration on angle zs measured in the shear plane [10].

ARTICLE IN PRESS
Table 1Material constants of Inconel 718 [34].
R.S. Pawade et al. / International Journal of Machine Tools & Manufacture 49 (2009) 979–990 985
Thus, Eq. (35) can be used to determine experimental specificshearing energy in the primary deformation zone.
Fig. 6. Stress–strain curves for Inconel 718 [37].
A (MPa) B (MPa) C m N Tm
1241 622 0.0134 1.90 0.6522 1300
3. Model analysis and validationIt involves detailed account of experimental procedure used formodel validation, procedure to evaluate the model parameters,analysis of results of the theoretical model and its comparisonwith the experimental results. Accordingly, in the followingparagraphs, initially, experimental procedure is described fol-lowed by the analysis of the theoretical model.
3.1. Experimental procedure
In this section, a small portion of the elaborate experimentalprocedure cited elsewhere [4] is presented. The oblique turningexperiments were performed as per the specifications in Table 2 tovalidate the model of specific shear energy during machining ofInconel 718 (see Table 2). A CNC turning lathe (EMCO/PCTURNModel 345-II, make-Austria) of 13 kW capacity was used. Thework material used was annealed Inconel 718 rings of size (OD70 mm and ID 60) with 5 mm thickness. The chemical composi-tion of work material has 54.95 Ni; 17.90 Cr; 16.54 Fe; 2.96 Mo;0.92 Ti; 4.85 Nb; 0.92 Co; 0.52 Al; 0.131 W; 0.073 Mn. No cuttingfluids were used during the experiments. A rhomboid-shaped 801negative PCBN (45% CBN content) cutting insert (0.4 mm noseradius) was used as a cutting tool. Three different cutting toolswith varying edge preparation CW1: Chamfered (100mm�301),CW2: Chamfered (100mm�201), CH: Chamfered (100mm�301)plus honed edge were used. The machining parameters werevaried as follows: cutting speed Vc (125; 300; 475 m/min),feedrate f (0.05; 0.10; 0.15 mm/rev), and depth of cut ap (0.50;0.75; 1.00 mm). The cutting forces were measured using a Kistlerpiezoelectric dynamometer (Model 9257A) with a charge ampli-fier (Model 5015A) and data acquisition software. The chips werecollected during each experiment and examined offline usingNikon measuroscope (Japan make) and the chip thickness and thecorresponding width were recorded. The measured values of thecutting forces and the chip dimensions are given in Table 2.
3.2. Model evaluation
In the model evaluation, initially the theoretical shear energyPs�theory is evaluated using Eq. (11), by substituting the values offlow stress s and shear strain (e). The flow stress in Eq. (11) isdetermined using Eq. (13). The material constants (A, B, C, m, andn) for Inconel 718 used in Eq. (13) are taken from Ahmed et al. [34]and the corresponding values are shown in Table 1. In Eq. (13), thestrain rate _e used to determine flow stress is evaluated usingEq. (14), wherein the tool geometry related parameters such asshear flow angle Zs, chip flow angle Zc, and the normal shear anglefn are obtained by Eqs. (15)–(17) and shear velocity by Eq. (18). Toevaluate the shear band spacing Dy, Eq. (20) is used, wherein theterms thermal conductivity k, density r and specific heat Cv ofInconel 718 are taken from Ref. [35]. A Taylor–Quinney coefficientw1 is required in Eq. (19). In the literature, value of Taylor–Quinneycoefficient is taken as 0.9 for Titanium alloy [12] and (0.85–0.95)for other alloys [36,37]. Therefore, in this model, this coefficient isassumed to be 0.9. A flow localization parameter b is determinedusing Eq. (20). A thermal softening parameter used in the aboveequation is determined from the slope of the shear stress–straincurve. For this, the values of the shear stress are calculated fromtrue stress–strain curves in Ref. [38], see Fig. 6. The value of thethermal softening parameter thus calculated is �0.20 as shown in
Table 3 [38]. Further, by substituting the terms fn, gn, Zs, and Vs,the strain rate is determined using Eq. (22).
To evaluate the temperature, Kornenberg’s equation is used(Eq. (23)). The cutting speed (Vc) and area of chip cross-section(Ac) (calculated from the chip dimensions) are used in thisequation. The constant Co in Kronenberg’s equation (23) isdetermined from the available value of machining temperatureand the corresponding cutting conditions during machining ofInconel 718 from Ref. [5]. Its value is evaluated to be 0.7. Thetemperature evaluated is used in determining the flow stress inEq. (13). Knowing the terms fn, i, and Fx, Fy, Fz, the angle ds, isevaluated using Eq. (34). Then, the angle between the shearvelocity vector and the shear force vector in shear plane (zs) isevaluated using Eq. (33). Finally, the theoretical specific shearingenergy (Ps�theory) is evaluated by substituting flow stress (Eq. (13))and shear strain (Eq. (22)), in Eq. (11).
The experimental specific shearing energy (Ps�expt.) is thendetermined using the shear force obtained from the experimentalcutting forces using Eq. (29). By substituting the values of depthof cut ap, feedrate f and cutting velocity Vc, shear velocity Vs
obtained by Eq. (18), the experimental specific shearing energy isdetermined using Eq. (35).
A sample calculation to evaluate the theoretical as well asexperimental specific shearing energy is presented in Appendix A.The results of model evaluation are presented in Table 2.
3.3. Analysis of theoretical shear band spacing
The shear band thickness observed during machining ofInconel 718 has been determined based on the theoretical model(Eq. (21)) for some of the experimental runs in Table 2. A plot ofshear band spacing vs. feedrates for various cutting speeds isshown in Fig. 7. It is observed that the shear band spacing

ARTICLE IN PRESS
Table 2Experimental parameters, measured cutting forces, and a comparison between theoretical and experimental specific shearing energy values.
Sr
no.
Vc
(m/min)
f
(mm/rev)
ap
(mm)
EG Cutting
forces (N)
Chip size
(mm)
Shear band
spacing (Mm)
Shear energy
(GN/m2)
Shear energy (GN/m2)
(with ploughing)
Percetage error between
7theory and expt.
Fx Fy Fz ao aw Dy Expt. Theory
1 125 0.05 0.50 CW1 139.19 166.54 253.48 0.160 0.52 0.1201 10.40 10.06 �3.3
2 125 0.05 0.75 CW2 366.79 386.32 388.28 0.215 0.94 0.2172 14.25 14.47 1.5
3 125 0.05 1.00 CH 686.20 482.05 609.04 0.418 0.75 0.2144 15.97 15.88 �0.5
4 125 0.15 0.75 CW1 462.52 348.23 687.18 0.236 0.74 0.7884 3.63 3.86 5.9
5 300 0.10 0.75 CW1 501.58 247.62 518.19 0.216 1.09 0.4011 9.35 9.45 1.0
6 475 0.10 0.75 CW2 158.73 140.17 398.04 0.227 1.09 0.461 3.75 3.63 �3.3
7 475 0.10 1.00 CH 232.96 175.33 451.77 0.626 1.04 0.3472 3.36 3.18 �5.6
8 475 0.15 0.50 CW2 188.03 146.03 499.63 0.289 1.08 0.7201 3.25 3.36 3.2
9 475 0.15 0.75 CH 200.73 192.91 489.86 0.259 0.84 0.751 2.88 2.95 2.3
10 475 0.15 1.00 CW1 296.46 186.08 646.15 0.245 1.16 0.7718 2.71 2.93 7.5
Fig. 7. Variation of shear band spacing (theoretical) in high-speed turning of
Inconel 718 with feedrates at different cutting speeds. Fig. 8. Variation of experimental specific shear energy in high-speed turning of
Inconel 718 with feedrates at different cutting speeds.
R.S. Pawade et al. / International Journal of Machine Tools & Manufacture 49 (2009) 979–990986
increases linearly with an increase in the feedrate from 0.05 to0.10 mm/rev at 125 and 475 m/min cutting speeds. These resultsshow similar trend as that of the shear band spacing observedwhile machining Titanium Alloys in Ref. [22]. It can be attributedto the corresponding increase in the area of cross-section of thematerial undergoing plastic deformation with an increase in thefeedrate. The increased area causes an increase in the percentageof localization of work material in the shearing zone and thereforethe shear bands spacing increases. However, the magnitudeof the band spacing in the case of Inconel 718 is in the rangefrom 0.2 to 0.9 mm compared to the Titanium Alloy, theoretical(0.25–0.45 mm), and experimental (0.3–0.5 mm) obtained by inRef. [22]. In their experiments, the feedrate was in the range of0.40–1 mm/rev.
3.4. Comparison between experimental and theoretical specific
shear energies
The plots showing the effects of feedrate on the experimentalspecific shear energy at different cutting speeds are given in Fig. 8.It is observed that the experimental specific shear energy is higherat the lowest feedrates (0.05 mm/rev). This is nothing but the‘size-effect’ [39], which could be attributed to the smaller area ofcross-section involved in shearing deformation. The proportion ofploughing forces to the cutting forces increases as the cross-
sectional area in shear gets reduced, and therefore, larger specificshear energy is required in machining. Further increase in thefeedrate to 0.10 mm/rev reduces the shear energy. Also, it isobserved that the magnitude of specific shearing energy (size-effect) is the largest at the lowest cutting speed (125 m/min) andreduces thereafter as the cutting speeds reduces to 300 and475 m/min. A comparison between the predicted (theoretical) andthe experimental specific cutting energies for 10 machining testsis shown in Fig. 9. It is observed from the plots in Fig. 9 that thetheoretical and experimental values match extremely well. Thepercentage difference between the theoretical and experimentalspecific cutting energies upon considering the effect of theploughing forces lies between 0.5% and 7%, see Table 2.
3.5. Sensitivity analysis of the shear energy model
Sensitivity analysis is a useful technique to understand thevariations in output of a model, qualitatively or quantitatively todifferent sources of variation [40]. It identifies the most importantfactors governing changes in the model output. In this study, themachining performance is measured in terms of specific shearenergy produced in machining (Table 3).
In this model given by Eq. (35), the parameters such ascutting forces (Fx, Fy, Fz), chip flow angle Zc, shear flow

ARTICLE IN PRESS
R.S. Pawade et al. / International Journal of Machine Tools & Manufacture 49 (2009) 979–990 987
angle fn, and strain rates are computed from the experimentalobservations and are directly used in the model. However,some parameters, which are determined from the empiricalrelations containing constants related to material behavior and
Table 3Quantities used to determine thermal softening parameter [37].
Temperature
(1C) (T)
Tensile
strain e0.2
Tensile stress
(s) (MPa)
Shear stress
(t) (MPa)
Thermal softening
parameter (qt/qT)
1020 0.2 295 176 �0.20
1060 0.2 280 167
Fig. 9. Comparison of experimental and theoretical specific shear energy in high-
speed turning of Inconel 718 (f ¼ 0.05–0.10–0.15 mm/rev; Vc ¼ 125–475 m/min).
Table 4Effect of input variables of the model on the variation of specific shear energy.
Type of model input
coefficient
Model input coefficient Values
Work material property
dependant
1. Material constant, A 111
124
136
2. Material constant, B 56
62
68
3. Material constant, C 0
0
0
4. Coefficient, n 0
0
0
5. Coefficient, m 1
1
2
Process-dependant
parameters
6. Kronenberg’s constant,
C0
0
0
0
7. Taylor–Quinney
coefficient, w1
0
0
0
8. Flow localization
parameter, b0
0
0
9. Shear strain, A 4
4
4
10. Strain rate, _e 305652
308740
311827
Graphical representation of relative importance (percentage) of the parameters in the
the machining process such as Kronenberg’s temperature con-stant C0, and m, b, and w1 are the constants used to deriveshear band spacing Dy. Since these are the assumed parameters,it is necessary to check their effect on the model output.Thus, the model coefficients are divided into two categories (seeTable 4). The first one includes the work material property-dependant coefficients, such as material constants A, B, C, andstrain rate hardening exponent n, and strain rate sensitivity m. Thesecond one includes the process-dependant parameters such asTaylor–Quinney coefficient w1, Kronenberg’s constant Co, andflow localization parameter b, which govern the variation inshear band spacing and thus the flow stress of a material. Themodel output is the specific shear energy in the primarydeformation zone. The model susceptibility has been checkedfor the above parameters for the #1st experimental run. Table 4lists the variation of model input variables, which cover 710%range of the variables.
The graphical representation of the sensitivity analysis ofspecific shear energy involving relative importance of the modelparameters (in percentage) is also indicated at the bottom of Table4. It is observed that Kronenberg’s temperature constant C0 hasthe highest contribution on the changes in the model output. Itindicates that the effect of machining temperature on the flowproperties of the work material plays an important role indetermining the shearing strength of the work material on theshear plane. Further, the material constants A, B, and C are alsosignificant deciding the magnitude of specific shear energy,besides the machining shear strain. It implies that the strainhardening (material constants A and B) and machining shearstrain eare more significant than strain rate hardening (materialconstant C). However, all the remaining model coefficients are lesssensitive to the changes in the model output (20% change in inputcauses less than 10% variation in the output).
(710% range) Specific shear energy
(GN/m2)
% change in the specific
shear energy
7 10.02 4.215
1 10.40
5 10.9
0 9.85 5.779
2 10.40
4 11.07
.0121 10.66 0.128
.0134 10.40
.0147 10.66
.5869 10.46 0.006
.6522 10.40
.7174 10.46
.71 10.46 0.006
.90 10.40
.09 10.46
.63 12.26 14.88
.7 10.40
.77 9.14
.81 9.81 0.006
.90 10.40
.99 9.81
.301 9.81 0.006
.334 10.40
.367 9.81
.900 8.82 10.132
.9496 10.40
.999 10.81
6 9.81 0.006
0 10.40
4 9.81
model

ARTICLE IN PRESS
R.S. Pawade et al. / International Journal of Machine Tools & Manufacture 49 (2009) 979–990988
4. Conclusions
The following conclusions are drawn from the analyticalmodeling and the analysis of specific shear energy duringmachining of Inconel 718.
1.
An analytical model is formulated to predict specific shearenergy in machining considering the characteristics, such as (i)shear band spacing during chip formation, (ii) flow stress as afunction of strain rate and temperature using Johnson–Cookmaterial constitutive model, and (iii) machining temperaturebased on the analysis of Kronenberg (iv) and ploughing forcesin machining.2.
It is found that the shear band spacing during chip formationincreases linearly with an increase in the feedrate. Based onthe theoretical model, the absolute value of shear band spacingfor Inconel 718 was found to be 0.2–0.9 mm.3.
The specific shearing energy is a strong function offeedrate; it increases with a decrease in the feedrate showingthe presence of size-effect. Further, it is observed that themagnitude of specific shearing energy (size-effect) isthe largest at the lowest cutting speed (125 m/min) andreduces thereafter as the cutting speeds reduces to 300 and475 m/min.4.
An excellent agreement between the experimental andtheoretical shear energies was found at high speed/highfeedrate conditions when the ploughing forces were consid-ered in the theoretical model.5.
Sensitivity analysis of the specific shear energy model showsthat the model output is the most sensitive to thermalsoftening, strain hardening, and the magnitude of shearingstrain during machining of Inconel 718.Acknowledgments
The authors are thankful to the Department of Science andTechnology, Government of India, for funding the FIST PrecisionPrototyping Cell in Mechanical Engineering Department andAeronautical Research Development Board (ARDB) for providingfinancial support for the equipment and cutting tools to conductthe experiments.
Appendix A. : Sample calculation of specific cutting energy
The sample calculation to determine the theoretical as well asexperimental specific cutting energy in machining for experi-mental run 1 is given below.
Theoretical specific cutting energy
Theoretical specific cutting energy is given by
Pstheory¼
se1:6522
where flow stress _s is determined as
s ¼ ½Aþ BðeÞn� 1þ CInee0
� �� �1�
T � To
Tm � To
� �m
�
�
In this model, the material constants A, B, C, n and m forInconel 718 has been obtained from Ahmed et al. [34]. These arementioned in Table 1.
Further strain rate in machining can be determined as
_e ¼ tanðfn � gnÞ þ cotfn
cosZs
Vs
Dy
shear velocity is given below as–
Vs ¼Vccosgn
cosðfn � gnÞ¼
125� cos 4:72
cosð19:02� 4:72Þ¼ 129:012 m=min
The terms in the above equation are determined as follows:go is the orthogonal rake angle given as
go ¼ tan�1ftan gy sinas þ tan gx cosasg
¼ tan�1ftanð�6Þ sin 11þ tanð6Þ cos 11g ¼ 4:753
Hence, the normal rake angle gn will be determined as
gn ¼ tan�1ftan go cos ig ¼ tan�1ftan 4:72 cosð�6Þg ¼ 4:723
Normal shear angle fn is given as
fn ¼ tan�1 ðt=tcÞ cosgn
1� ðt=tcÞ sin gn
� �¼ tan�1 ð0:16=0:05Þ cos 4:72
1� ð0:16=0:05Þ sin 4:72
� �
¼ 16:8423
Chip flow angle Zc is determined as
Zc ¼ cos�1 bc
bw=cos i
� �¼ cos�1 0:519
1:6608=cosð�6Þ
� �¼ 71:93
Therefore, shear flow angle will be
Zs ¼ tan�1 tan icosðfn � gnÞ � tanZc sinfn
cos gn
� �
¼ tan�1 tanð�6Þ cosð16:842� 4:72Þ � tan 71:9 sin 16:842
cos 4:72
� �
¼ �44:8673
Temperature in the shear zone (T) is obtained as
T ¼C0KsV0:44
c A0:22c
k0:44C0:56v
¼0:7� 253:48� 9:81� ð2:083Þ0:44
ð0:08304� 10�6Þ0:22
0:025� ð11:4Þ0:44ð430Þ0:56
¼ 317:5 3C
Shear band spacing
Shear band spacing can be determined as
Dy ¼ w1
mf sinfn
b cos gn
� �
where b is given by Eq. (14)
b ¼ �ffiffiffi3p
1:9
0:6522
4:9496þ
0:9ð�0:20Þ
8220� 430½1þ 1:328ðffiffiffiffiffiffiffiffiffiffiffiffiffiffiffiffiffiffiffiffiffiffiffiffiffiffiffiffiffiffiffiffiffiffiffiffiffiffiffiffiffiffiffiffiffiffiffiffiffiffiffiffiffiffiffiffiffi11:4� 4:9496=125� 0:05
p�
" #
� 0:6522þ 1�0:664ð
ffiffiffiffiffiffiffiffiffiffiffiffiffiffiffiffiffiffiffiffiffiffiffiffiffiffiffiffiffiffiffiffiffiffiffiffiffiffiffiffiffiffiffiffiffiffiffiffiffiffiffiffiffiffiffiffiffi11:4� 4:9496=125� 0:05
pÞ
1þ 1:328ðffiffiffiffiffiffiffiffiffiffiffiffiffiffiffiffiffiffiffiffiffiffiffiffiffiffiffiffiffiffiffiffiffiffiffiffiffiffiffiffiffiffiffiffiffiffiffiffiffiffiffiffiffiffiffiffiffi11:4� 4:9496=125� 0:05
pÞ
" #
b ¼ 0:1201
Therefore, shear band spacing is
Dy ¼ w1
mf sinfn
b cos gn
� �¼ 0:9
1:9� 0:05� sin 19:02
0:1201� cos 4:72
� �¼ 0:2068 mm

ARTICLE IN PRESS
R.S. Pawade et al. / International Journal of Machine Tools & Manufacture 49 (2009) 979–990 989
Shear strain
The shear strain in machining can be calculated by Eq. (5)below as–
e ¼ tanðfn � gnÞ þ cotfn
cosZs
¼tanð16:842� 4:72Þ þ cot 16:842
cosð�44:867Þ
¼ 4:9496
Flow stress
Now the flow stress in the machining deformation can bedetermined from the following equation as
s ¼ ½1241þ 622ð4:9496Þ0:6522� 1þ 0:0134ln
3:087� 106
1� 106
!" #"
� 1�436:8� 25
1300� 25
� �1:9" ##
¼ 2861:057 MPa
Strain rate
Strain rate in the machining deformation is–
_e ¼ tanðfn � gnÞ þ cotfn
cosZs
Vs
Dy
¼tanð16:842� 4:72Þ þ cotð16:842Þ
cosð�44:867Þ
ð129:01� 103Þ
ð0:2068Þ
¼ 3:087� 106 s�1
Determination of angle zs
zs ¼ Zs � ds ¼ ð�44:867� ð�25:56ÞÞ ¼ �19:307
Theoretical specific cutting energy
Hence theoretical specific cutting energy can be determined byEq. (4) as
PStheory ¼se
1:6522¼
2867:057� 4:9496
1:6522¼ 8:5711 GN=m2
Experimental specific cutting energy
However, experimental specific cutting energy is given byEq. (25) as
PSexpt ¼FsVs cos zs
apfVc
where Fs ¼ [(�Fxcos i+Fysin i)2+(Fycosfncos i�Fzsin gn)2]1/2
Fs ¼ ½ð�139:19 cosð�6Þ þ 166:54 sinð�6ÞÞ2
þð166:54 cosð16:842Þ cosð�6Þ � 253:48 sin 4:72Þ2�1=2
Fs ¼ 272:27 N
Hence, experimental specific cutting energy is–
PSexpt ¼236:27� 106
� cosð�19:307Þ � 129:01
0:5� 0:05� 125¼ 10:4055 GN=m2
The theoretical and experimental specific cutting energy inshear deformation is given by Eqs. (11) and (33), respectively.
Specific energy due to ploughing
l ¼ re kr þ sin�1 f
2re
� �� þ
a� re½1� cosðkrÞ�
sinðkrÞ
�
l ¼ 1:6 1:483þ sin�1 0:05
2� 1:6
� �� þ
0:5� 1:6� ½1� cosð85Þ�
sinð85Þ
�¼ 1:4312 mm
Fcp ¼ slrrn tanp4þg2
Fcp ¼ 2867:057� 1:4312� 0:8� tan
p4þ
4:72
2
� �¼ 180:39 N
Ftp ¼ slrrn 1þp2
tan
p4þg2
Ftp ¼ 2867:057� 1:4312� 0:8� 1þ
p2
tan
p4þ
4:72
2
� �
¼ 463:7 N
Fs00 ¼ ðFcp cosfÞ þ ðFtp cosð90þ fÞÞ
Fs00 ¼ ð180:39 cos 16:842Þ þ ð463:7 cosð90þ 16:842ÞÞ ¼ 38:288 N
Psploughing¼
Fs00Vs cos zs
apfVc
Psploughing¼
38:288� 129:01� cosð�19:307Þ
0:5� 0:05� 125¼ 1:492 GN=m2
Pstotal¼ Psshearing
þ Psploughing¼ 8:5711þ 1:492 ¼ 10:062 GN=m2
References
[1] E.O. Ezugwu, J. Bonney, Y. Yamane, An overview of the machinability ofaeroengine alloy, Journal of Materials Processing Technology 135 (2003)233–253.
[2] R. Arunachalam, M.A. Mannan, Machinability of nickel-based high tempera-ture alloys, Machining Science and Technology 4 (1) (2000) 127–168.
[3] E.O. Ezugwu, Z.M. Wang, A.R. Machado, The machinability of nickel basedalloys: a review, Journal of Materials Processing Technology 86 (1999) 1–16.
[4] R.S. Pawade, S.S. Joshi, P.K. Brahmankar, Effect of cutting edge geometry andmachining parameters on surface integrity of high-speed turned Inconel 718,International Journal of Machine Tools and Manufacture 48 (1) (2008) 15–28.
[5] R.T. Coelho, L.R. Silva, A. Braghini Jr., A.A. Bezerra, Some effects of cutting edgepreparation and geometric modifications when turning Inconel 718 at highcutting speeds, Journal of Materials Processing Technology 148 (1) (2004)147–153.
[6] R.S. Pawade, S.S. Joshi, P.K. Brahmankar, M. Rahman, An investigation ofcutting forces and surface damage in high-speed turning of Inconel 718,Journal of Materials Processing Technology 192–193 (2007) 139–146.
[7] R.S. Pawade, S.S. Joshi, P.K. Brahmankar, M. Rahman, Some investigations ofhigh-speed turned Inconel 718, in: V.S. Raja, Kuppan (Eds.), Proc.eedings ofthe of the 21st AIMTDR Conference, VIT, Vellore, 2004, pp. 41–47, (December21–23).
[8] Muammer Nalbant, Abdullah Altyn, Hasan Gokkaya, The effect of coatingmaterial and geometry of cutting tool and cutting speed on machinabilityproperties of Inconel 718 super alloys, Materials and Design 28 (5) (2007)1719–1724.
[9] Erdogan Kose, Abdullah Kurt, Ulvi Seker, The effects of the feedrate on thecutting tool stresses in machining of Inconel 718, Journal of MaterialsProcessing Technology 196 (1–3) (2008) 165–173.
[10] M.C. Shaw, Metal Cutting Principles, Clarendon Press, Oxford, 1997, p. 434.[11] M.B. Bever, E.R. Marshall, L.B. Tichenor, The energy stored in metal chip
during orthogonal cutting, Journal of Applied Physics 24 (1953) 117–1179.[12] J.Q. Xie, A.E. Bayoumi, H.M. Zbib, Analytical and experimental study of shear
localization in chip formation in orthogonal machining, Journal of MaterialsEngineering and Performance, ASM International 4 (1995) 32–39.
[13] G.C. Lin, P.L.B. Oxley, Mechanics of oblique machining: predicting chipgeometry and cutting forces from work material properties and cuttingconditions, Proceedings of Institution of Mechanical Engineering 196 (1972)813–820.
[14] E. Usui, A. Hirota, M. Masuko, Analytical prediction of three dimensionalcutting process part 1 basic cutting model and energy approach, Journal ofEngineering for Industry 100 (1978) 222–228.
[15] E. Usui, T. Shirakashi, T. Kitagawa, Analytical prediction of three dimensionalcutting process part 3 cutting temperature and crater wear of carbide tool,Journal of Engineering for Industry 100 (1978) 236–243.

ARTICLE IN PRESS
R.S. Pawade et al. / International Journal of Machine Tools & Manufacture 49 (2009) 979–990990
[16] E. Usui, A. Hirota, Analytical prediction of three dimensional cutting processpart 2 chip formation and cutting force with conventional single-point tool,Journal of Engineering for Industry 100 (1978) 229–235.
[17] G.C. Lin, Prediction of cutting forces and chip geometry in oblique machiningfrom flow stress properties and cutting conditions, International Journal ofMachine Tool Design Research 18 (1978) 117–130.
[18] R.G. Fenton, P.L.B. Oxley, Predicting Cutting Forcesforces at Super High CuttingSpeedssuper high cutting speeds from Work Material Propertiesworkmaterial properties and Cutting Conditionscutting conditions, in: Proc.eed-ings of 8ththe Eigth MTDR Conference, 1969, pp. 247–258.
[19] W.F. Hastings, P. Mathew, P.L.B. Oxley, A machining theory for predicting chipgeometry, cutting forces etc. from work material properties and cuttingconditions, Proceedings of Royal Society of London A 371 (1980) 569–587.
[20] T. Young, P. Mathew, P.L.B. Oxley, Allowing for nose radius effects in predictingthe chip flow direction and cutting forces in bar turning, Proceedings ofInstitution of Mechanical Engineering 201 (C3) (1987) 213–226.
[21] R.S. Hu, P. Mathew, P.L.B. Oxley, H.T. Young, Allowing for end cutting edgeeffects in predicting forces in bar turning with oblique machining conditions,Proceedings of Institution of Mechanical Engineering 200 (C2) (1986) 89–99.
[22] J. Huang, E.C. Aifantis, A note on the problem of shear localization during chipformation in orthogonal machining, Journal of Materials Engineering andPerformance, ASM International 6 (1997) 25–26.
[23] Z.B. Hou, R. Komanduri, Modeling of thermo mechanical shear instability inmachining, International Journal of Mechanical Sciences 11 (1997) 1273–1314.
[24] S.L. Soo, D.K. Aspinwall, R.C. Dewes, 3D FE modeling of the cutting of Inconel718, Journal of Materials Processing Technology 150 (1–2) (2004) 116–123.
[25] Geoffery Boothroyd, W.A. Knight, Fundamentals of Machining and MachineTools, 2ndsecond ed., Mercel Dekker, New York, 1989, pp. 82–85.
[26] G.R. Johnson, W.H. Cook, Fracture characteristics of three metals subjected tovarious strains, strain rates, temperatures and pressures, Engineering FractureMechanics 21 (1) (1985) 31–49.
[27] M. Kronenberg, Machining Science and Application Theory and Practice forOperation and Development of Machining Processes, 1stfirst ed., PergamonPress, Oxford, 1966, pp. 53–54.
[28] J.H. Dautzenberg, P.C. Veernstra, A.C.H. Van der Wolf, The minimum energyprinciple for the cutting process in theory and experiment, Annals of the CIRP30 (1) (1981) 1–4.
[29] D. Kececioglu, Shear-strain rate in metal cutting and its effects on shear-flowstress, Transactions of ASME 80 (1958) 158–168.
[30] D. Kececioglu, Shear zone temperature in metal cutting and its effects onshear-flow stress, Transactions of ASME 80 (1958) 541–546.
[31] P.D. Murarka, S. Hinduja, G. Barrow, Influence of strain, strain rate andtemperature on the flow stress in the primary deformation zone in metalcutting, International Journal of Machine Tool Design and Research 21 (1981)207–216.
[32] N. Fang, A new quantitative sensitivity analysis of the flow stress of 18engineering materials in machining, Transactions of the ASME, Journal ofEngineering Materials and Technology 27 (2005) 192–196.
[33] D.J. Waldorf, A simplified model for ploughing forces in turning, Transactionof NAMRI of SME 32 (2004) 447–454.
[34] N. Ahmed, A.V. Mitrofanov, V.I. Babitsky, V.V. Silberschmidt, Analysis ofmaterial response to ultrasonic vibration loading in turning Inconel 718,Materials Science and Engineering: A 424 (1–2) (2006) 318–325.
[35] ASM International, Properties and Selection: Irons, Steels and High Perfor-mance Alloys, Vol.vol. 1, 10th ed., 1990, p. 960.
[36] C.Z. Duan, M.J. Wang, Characteristics of adiabatic shear bands in theorthogonal cutting of 30CrNi3MoV steel, Journal of Materials ProcessingTechnology 168 (2005) 102–106.
[37] D.E. Grady, D.A. Bensen, Fragmentation of metal rings by electromagneticloading, Experimental Mechanics 23 (1983) 393–400.
[38] H. Yuan, W.C. Liu, Effect of the d phase on the hot deformation behaviorof Inconel 718, Materials Science and Engineering A408 (1–2) (2005)281–289.
[39] S.S. Joshi, S.N. Melkote, An explanation for the size effect in machining usingstrain gradient plasticity, Transactions of ASME, Journal of ManufacturingScience and Engineering 126 (4) (2004) 679–684.
[40] A. Saltelli, K. Chan, E.M. Scott, Sensitivity Analysis, Wiley, Chichester, England,2000.