air quality progress report 2013 - carlisle city council
TRANSCRIPT
2013 Air Quality Progress Report for Carlisle City Council In fulfillment of Part IV of the Environment Act 1995 Local Air Quality Management
April 2013

April 2013 Carlisle City Council – England
LAQM Progress Report 2013 1
Local Authority Officer
Mathew Proudfoot
Department Environmental Health Local Environment
Address
Civic Centre Rickergate Carlisle CA3 8QG
Telephone 01228 817000
e-mail [email protected]
Report Reference number
PR 04/13
Date April 2013
April 2013 Carlisle City Council – England
LAQM Progress Report 2013 2
Executive Summary
The Government published the revised Air Quality Strategy for England, Scotland, Wales and Northern Ireland in July 2007. At the centre of this Air Quality Strategy are the use of air quality standards, which enable air quality to be measured and assessed. These standards also provide the means to set air quality objectives and timescales. The air quality objectives had to be achieved between 2003 and 2010.
Local Authorities are required to review and assess the air quality in their areas to determine whether the air quality objectives are likely to be met. Where the likelihood of exceedences of the air quality objectives are identified, in areas of significant public exposure, a detailed assessment of that area will be required. Depending upon the findings, an Air Quality Management Area (AQMA) may need to be declared, followed by a further assessment and the formulation of an Action Plan to help reduce these exceedences.
This report represents the second stage of the fifth round of review and assessment of local air quality in Carlisle and the surrounding district. Carlisle City Council has previously undertaken 4 rounds of review and assessment and this has concluded that overall air quality within the district is good. There are, however, small pockets within the city where the annual mean objective level for nitrogen dioxide is being exceeded due to road traffic sources. As a consequence 6 Air Quality Management Areas have been declared between 2005 and 2008. One of these AQMA’s (AQMA 3) was subsequently extended in 2010.
The three principal pollutants that are currently monitored by Carlisle City Council include; nitrogen dioxide, particulate matter (PM10 and PM 2.5) and benzene. For comparison purposes this report presents both the historical and the most recent results for 2012. The latest results for PM10, PM2.5 and Benzene show that levels remain consistently below the objective and all have shown year on year reductions since 2010.
New monitoring data for nitrogen dioxide indicates that the annual mean NO2 concentrations have decreased at many of the monitoring locations across the district, compared to 2011. There are still locations within all 6 of our AQMA’s which remain above, or borderline of, the annual mean objective level. This Progress Report has also identified one exceedence of the NO2 annual mean objective outside of our existing AQMA’s. There are strong indications that this exceedence was due to prolonged traffic disruption associated with a new city centre supermarket development and nearby Shaddongate Resource Centre. These major developments resulted in increased congestion from March to October 2012 at this particular location. The work is now complete and it is expected that NO2 annual mean concentrations will stabilise. The new monitoring data has not identified the need to proceed to a Detailed Assessment for any pollutant.
This report identifies the new developments which have been proposed for the district, since the last round of review and assessment, which may have air quality implications. It also details any large developments currently being considered by the planning department. In most cases the prospective developers have been asked to demonstrate the likely impacts and mitigation measures by submitting an Air Quality Impact Assessment (AQIA). Depending on the conclusions of these and in the event of a
April 2013 Carlisle City Council – England
LAQM Progress Report 2013 3
granted application, it can be necessary to proceed to a detailed assessment. This report concludes that there are no new or proposed developments that have predicted impacts which are sufficient to warrant further detailed investigation.
The most significant development in the district since the previous round of review and assessment has been the completion of the Carlisle Northern Development Route (CNDR) in February 2012. The Further Assessment (2007) indicated that the opening of the CNDR will have a major impact on nitrogen dioxide levels along A7 (AQMA 1) bringing levels to below the objective level. A Further Assessment undertaken in 2009 also indicated that the CNDR will have a significant positive impact on air quality along the A595 (AQMA’s 3 and 4).
At this stage it is not feasible to draw firm conclusions as to the full effects of the CNDR on air quality monitoring data. Early indications from traffic counts and local observation suggested that the bypass was having a significant effect on congestion and traffic volume in some of the key arterial routes through the city. One month after the opening of the bypass two major new developments resulted in significant traffic disruption in the city centre for around 8 months. During 2012 reductions in NO2 annual means were observed in AQMAS 1, 3 and 4 however it is expected that this traffic disruption will have had a negative impact on NO2 concentrations in several areas. It is hoped that 2013 will provide the first full year of representative data since the opening of the CNDR. This will be reported upon in Progress Report 2014 and any trends in the traffic count data will also be examined.
In order to enable accurate ‘before and after’ comparisons to be drawn as to the long term impact of the CNDR at key locations it is anticipated that much of the monitoring network will remain unchanged during 2013.
Some minor changes were made to the diffusion tube monitoring network in 2012 to allow for the new major developments on Castle Way and to begin monitoring NO2 at residential properties along the route of the CNDR. Initial investigation has shown that so far there are no exceedences of the objective at any of the newly identified receptors along the CNDR route. This is likely to be due to the distance of these properties to the road, the open rural environment and the free flowing nature of the traffic. Previous Air Quality Impact Assessment work carried out in the planning stages of the development also supports this conclusion.
This report summarises the current policies adopted by the council which relate to air quality including the Local Transport Plan 3, Air Quality Planning Policies and Climate Change Strategies. It also includes a summary of the measures detailed in the newly revised Air Quality Action Plan which are expected to have a positive effect on air quality in the city. It provides an update on the progress made in implementing these measures and the timescales in which they are likely to run.
The revised Air Quality Action Plan 2012 is now available to view on the City Council website at: http://www.carlisle.gov.uk/environment_and_waste/environmental_health/air_quality/air_quality_documents.aspx
April 2013 Carlisle City Council – England
LAQM Progress Report 2013 4
Table of Contents
1 Introduction 8
1.1 Description of Local Authority Area 8
1.2 Purpose of Progress Report 8
1.3 Air Quality Objectives 9
1.4 Summary of Previous Review and Assessments 10
2 New Monitoring Data 16
2.1 Summary of Monitoring Undertaken 16
2.2 Comparison of Monitoring Results with Air Quality Objectives 23
3 New Local Developments 49
3.1 Road Traffic Sources 49
3.2 Other Transport Sources 50
3.3 Industrial Sources 50
3.4 Commercial and Domestic Sources 51
3.5 New Developments with Fugitive or Uncontrolled Sources 51
4 Planning Applications 52
5 Air Quality Planning Policies 55
6 Local Transport Plans and Strategies 57
7 Climate Change Strategies 58
8 Implementation of Action Plans 61
9 Conclusions and Proposed Actions 67
9.1 Conclusions from New Monitoring Data 67
9.2 Conclusions relating to New Local Developments 68
9.3 Other Conclusions 68
10 References 70
April 2013 Carlisle City Council – England
LAQM Progress Report 2013 5
List of Tables
Table 1.1 Air Quality Objectives included in Regulations for the purpose of Local Air Quality Management in England.
Table 2.1 Details of Automatic Monitoring Sites Table 2.2 Details of Non- Automatic Monitoring Sites Table 2.3 Results of Automatic Monitoring for Nitrogen Dioxide: Comparison with Annual Mean Objective Table 2.4 Results of Automatic Monitoring for Nitrogen Dioxide: Comparison with 1-
hour Mean Objective Table 2.5 Results of Nitrogen Dioxide Diffusion Tubes in 2012 Table 2.5a NO2 diffusion tube results at monitoring locations in area A. Table 2.5b NO2 diffusion tube results at monitoring locations in area B. Table 2.5c NO2 diffusion tube results at monitoring locations in area C. Table 2.5d NO2 diffusion tube results at monitoring locations in area D. Table 2.5e NO2 diffusion tube results at monitoring locations in area E. Table 2.5f NO2 diffusion tube results at monitoring locations in area F. Table 2.5f NO2 diffusion tube results at monitoring locations in area G. Table 2.5h NO2 diffusion tube results at monitoring locations in area H. Table 2.6 Results of Automatic Monitoring of PM10: Comparison with Annual Mean Objective Table 2.7 Results of Automatic Monitoring of PM10: Comparison with 24-hour Mean Objective Table 2.8 Results of Benzene Monitoring: Comparison with Running Annual Mean
Objective Table 2.9 Results of PM2.5 Automatic Monitoring: Comparison with Annual Mean
Objective Table 8.1 Action Plan Progress
April 2013 Carlisle City Council – England
LAQM Progress Report 2013 6
List of Figures
Figure 1.1 Map of all AQMA Boundaries.
Figure 1.2 Maps of individual AQMA Boundaries
Figure 2.1 Maps of Automatic Monitoring Sites.
Figure 2.2 Map of Non Automatic Monitoring Sites.
Figure 2.3 Trends in Annual Mean Nitrogen Dioxide Concentration Measured at Automatic Monitoring Sites.
Figure 2.4 Results of Hourly Automatic Monitoring for Nitrogen Dioxide: Comparison with 1-hour Mean Objective at Paddys Market.
Figure 2.5 Results of Hourly Automatic Monitoring for Nitrogen Dioxide: Comparison with 1-hour Mean Objective at Stanwix Bank.
Figure 2.6 Map of diffusion tube locations in area A.
Figure 2.7 Chart showing NO2 diffusion tube trends at monitoring locations in area A.
Figure 2.8 Map of diffusion tube locations in area B
Figure 2.9 Chart showing NO2 diffusion tube trends at monitoring locations in area B.
Figure 2.10 Map of diffusion tube locations in area C
Figure 2.11 Chart showing NO2 diffusion tube trends at monitoring locations in area C.
Figure 2.12 Map of diffusion tube locations in area D.
Figure 2.13 Chart showing NO2 diffusion tube trends at monitoring locations in area D.
Figure 2.14 Map of diffusion tube locations in area E.
Figure 2.15 Chart showing NO2 diffusion tube trends at monitoring locations in area E.
Figure 2.16 Map of diffusion tube locations in area F.
Figure 2.17 Chart showing NO2 diffusion tube trends at monitoring locations in area F.
Figure 2.18 Map of diffusion tube locations in area G.
Figure 2.19 Chart showing NO2 diffusion tube trends at monitoring locations in area G
Figure 2.20 Maps of diffusion tube locations in area H.
Figure 2.21 Chart showing NO2 diffusion tube trends at monitoring locations in area H
Figure 2.22 Trends in Annual Mean PM10 Concentrations.
Figure 2.23 Results of PM10 Automatic Monitoring: Comparison with 24-hour Mean Objective
April 2013 Carlisle City Council – England
LAQM Progress Report 2013 7
Appendices
Appendix A: Quality Assurance / Quality Control (QA/QC) Data
Appendix B: Monthly NO2 diffusion tube results 2012(Raw Data)
Appendix C: NO2 diffusion tube results 2012 (Calculated Data)
Appendix D: Maps Showing Locations of Potential New Developments.
April 2013 Carlisle City Council – England
LAQM Progress Report 2013 8
1 Introduction
1.1 Description of Local Authority Area
Carlisle City Council is the most northerly of the 6 Cumbrian authorities and covers more than 400 square miles. The City of Carlisle supports the highest population concentration in Cumbria with over 70,000 people living within the urban area. The rural towns of Brampton and Longtown support the next two highest population concentrations, around 4000 and 2000 respectively. Carlisle is remote from other centres of population being 300 miles from London, more than 120 miles from Manchester, more than 90 miles from Glasgow and Edinburgh, and 60 miles from Newcastle Upon Tyne. Consequently Carlisle is the regional, commercial, administrative and retail centre serving a catchment population of around 450,000 who live within an hours travelling time of the city. Today’s economy is characterised by food processing, agricultural support, automotive component manufactures and engineering. The dominant sectors are branch operation in warehousing, retailing, manufacturing, public administration and health services.
Carlisle is also a significant transport hub for rail services and the national road transport network.
1.2 Purpose of Progress Report
This report fulfils the requirements of the Local Air Quality Management process as set out in Part IV of the Environment Act (1995), the Air Quality Strategy for England, Scotland, Wales and Northern Ireland 2007 and the relevant Policy and Technical Guidance documents. The LAQM process places an obligation on all local authorities to regularly review and assess air quality in their areas, and to determine whether or not the air quality objectives are likely to be achieved. Where exceedences are considered likely, the local authority must then declare an Air Quality Management Area (AQMA) and prepare an Air Quality Action Plan (AQAP) setting out the measures it intends to put in place in pursuit of the objectives. Progress Reports are required in the intervening years between the three-yearly Updating and Screening Assessment reports. Their purpose is to maintain continuity in the Local Air Quality Management process. They are not intended to be as detailed as Updating and Screening Assessment Reports, or to require as much effort. However, if the Progress Report identifies the risk of exceedence of an Air Quality Objective, the Local Authority (LA) should undertake a Detailed Assessment immediately, and not wait until the next round of Review and Assessment.
April 2013 Carlisle City Council – England
LAQM Progress Report 2013 9
1.3 Air Quality Objectives
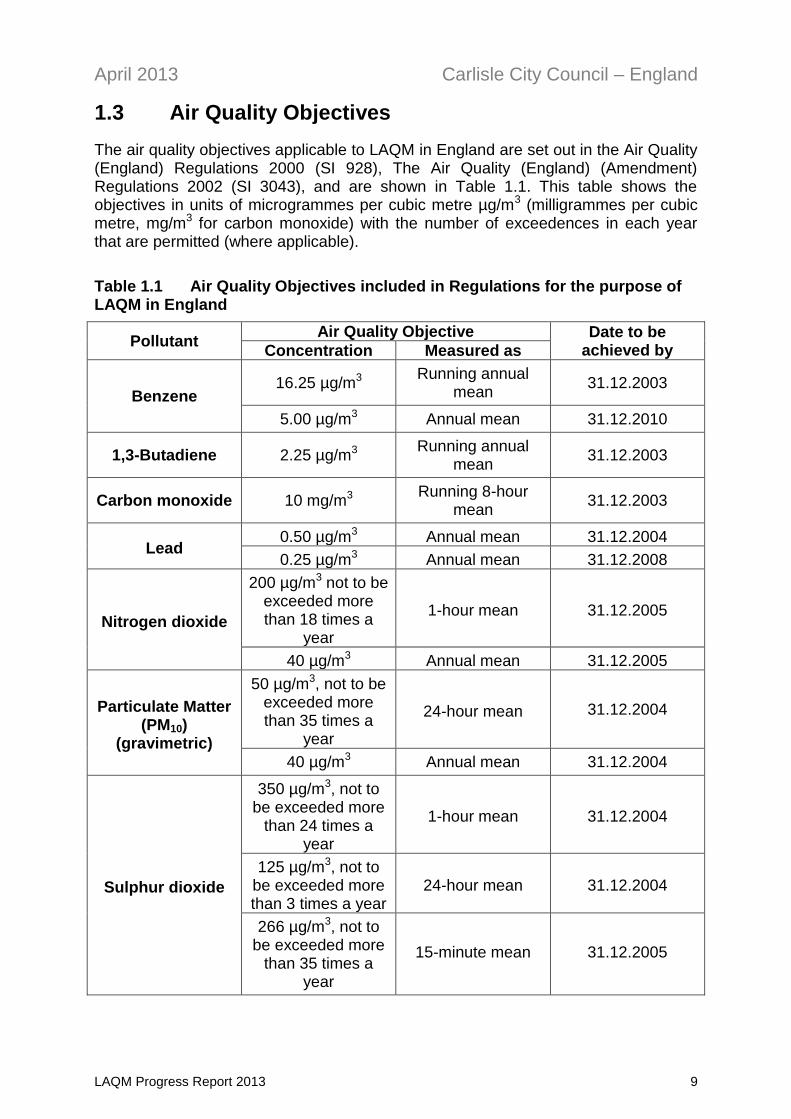
The air quality objectives applicable to LAQM in England are set out in the Air Quality (England) Regulations 2000 (SI 928), The Air Quality (England) (Amendment) Regulations 2002 (SI 3043), and are shown in Table 1.1. This table shows the objectives in units of microgrammes per cubic metre µg/m3 (milligrammes per cubic metre, mg/m3 for carbon monoxide) with the number of exceedences in each year that are permitted (where applicable).
Table 1.1 Air Quality Objectives included in Regulations for the purpose of LAQM in England
Pollutant Air Quality Objective Date to be
achieved by Concentration Measured as
Benzene 16.25 µg/m3 Running annual
mean 31.12.2003
5.00 µg/m3 Annual mean 31.12.2010
1,3-Butadiene 2.25 µg/m3 Running annual
mean 31.12.2003
Carbon monoxide 10 mg/m3 Running 8-hour
mean 31.12.2003
Lead 0.50 µg/m3 Annual mean 31.12.2004
0.25 µg/m3 Annual mean 31.12.2008
Nitrogen dioxide
200 µg/m3 not to be exceeded more than 18 times a
year
1-hour mean 31.12.2005
40 µg/m3 Annual mean 31.12.2005
Particulate Matter (PM10)
(gravimetric)
50 µg/m3, not to be exceeded more than 35 times a
year
24-hour mean 31.12.2004
40 µg/m3 Annual mean 31.12.2004
Sulphur dioxide
350 µg/m3, not to be exceeded more
than 24 times a year
1-hour mean 31.12.2004
125 µg/m3, not to be exceeded more than 3 times a year
24-hour mean 31.12.2004
266 µg/m3, not to be exceeded more
than 35 times a year
15-minute mean 31.12.2005
April 2013 Carlisle City Council – England
LAQM Progress Report 2013 10
1.4 Summary of Previous Review and Assessments
Since 1996 Carlisle City Council has been monitoring pollution levels in Carlisle and comparing them with the national air quality objectives, as part of a process known as review and assessment. Our review and assessment work has concluded that air quality within our local authority is generally very good. For the majority of pollutants the concentrations found in Carlisle are well below the governments health based objectives and are not of any concern. However there are small pockets within the city where the annual mean objective for nitrogen dioxide is not being met due to road traffic emissions. The local authority has subsequently declared six Air Quality Management Areas within the city.
Stage 1 Report 1996 - concluded that a stage 2 assessment would be required for nitrogen dioxide and particulates
Stage 2 Report 1998 - concluded that a detailed stage 3 assessment would be required in respect to nitrogen dioxide and particulates.
Stage 3 Report 2000 - concluded that it was unlikely that an air quality objective would be exceeded.
Updating and Screening Assessment 2003 – concluded that a detailed assessment would be required for nitrogen dioxide and particulates.
Detailed Assessment 2004 – concluded that it was likely that the annual mean objective for nitrogen dioxide would be exceeded at locations alongside the A7. As a consequence Air Quality Management Area No.1 was declared in 2005
Progress Report 2005 – concluded that it was likely that the annual mean objective for nitrogen dioxide would be exceeded at locations alongside Currock Street. As a consequence Air Quality Management Area No.2 was declared in Dec 2006
Updating and Screening Assessment 2006 - concluded that a detailed assessment would be required in respect to the annual mean nitrogen dioxide at 4 locations within the City i.e. Wigton Rd, Bridge St, London Rd and Dalston Rd.
Progress Report 2007 – update on air quality issues.
Detailed Assessment 2007 – concluded that it was likely that the annual mean objective for nitrogen dioxide would be exceeded at locations alongside Wigton Rd, Bridge St, London Rd and Dalston Rd. As a consequence Air Quality Management Areas No’s. 3, 4, 5 and 6 were declared in 2008.
Further Assessment Report 2007 – confirmed that AQMA boundaries for AQMA No’s 1 and 2 were correct.
Progress Report 2008 – update on air quality issues
Further Assessment Report 2009 – confirmed that the boundaries AQMA’s No’s. 4- 6 are correct. It recommends that the boundary of AQMA No.3 be extended to the bottom of Caldewgate roundabout.
April 2013 Carlisle City Council – England
LAQM Progress Report 2013 11
Updating and Screening Assessment 2009 - concludes that the existing boundary of AQMA No.3 on Wigton Rd will need to be extended to the Caldewgate roundabout and include properties on Caldcotes.
Progress Report 2010 – update on Air Quality issues. Confirmed that the recent extension of AQMA No.3 had taken place and gave an update on progress with action plan measures.
Progress Report 2011 – update on Air Quality issues. Confirmed no further changes required to AQMA’s and gave an update on progress with action plan measures.
Updating and Screening Assessment 2012 - Concludes that no further amendments to AQMA’s are required. Overall improvement seen in every AQMA compared to previous year. Some minor changes were introduced to monitoring network to include new receptors on newly built Carlisle Northern Development Route (CNDR). Action Plan 2012 – Introduced a revised concise set of measures to be implemented over the following 5 years the major improvement being the opening of the new Carlisle bypass (CNDR).
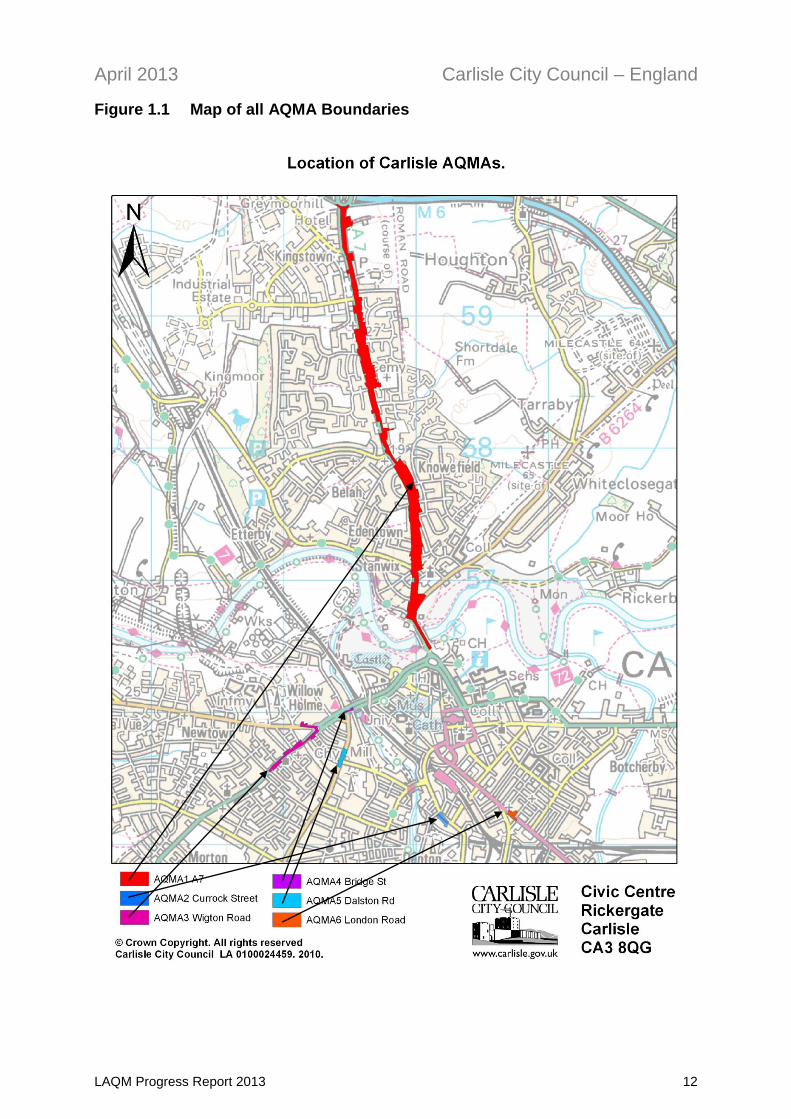
The following maps show all six of the AQMA’s that have been declared in the district. All of the AQMA’s have been declared due to exceedences of the nitrogen dioxide annual mean objective. Figure 1.1 shows all of the AQMA’s on one large map and the subsequent figures show the individual AQMA’s in more detail.
April 2013 Carlisle City Council – England
LAQM Progress Report 2013 12
Figure 1.1 Map of all AQMA Boundaries
April 2013 Carlisle City Council – England
LAQM Progress Report 2013 13
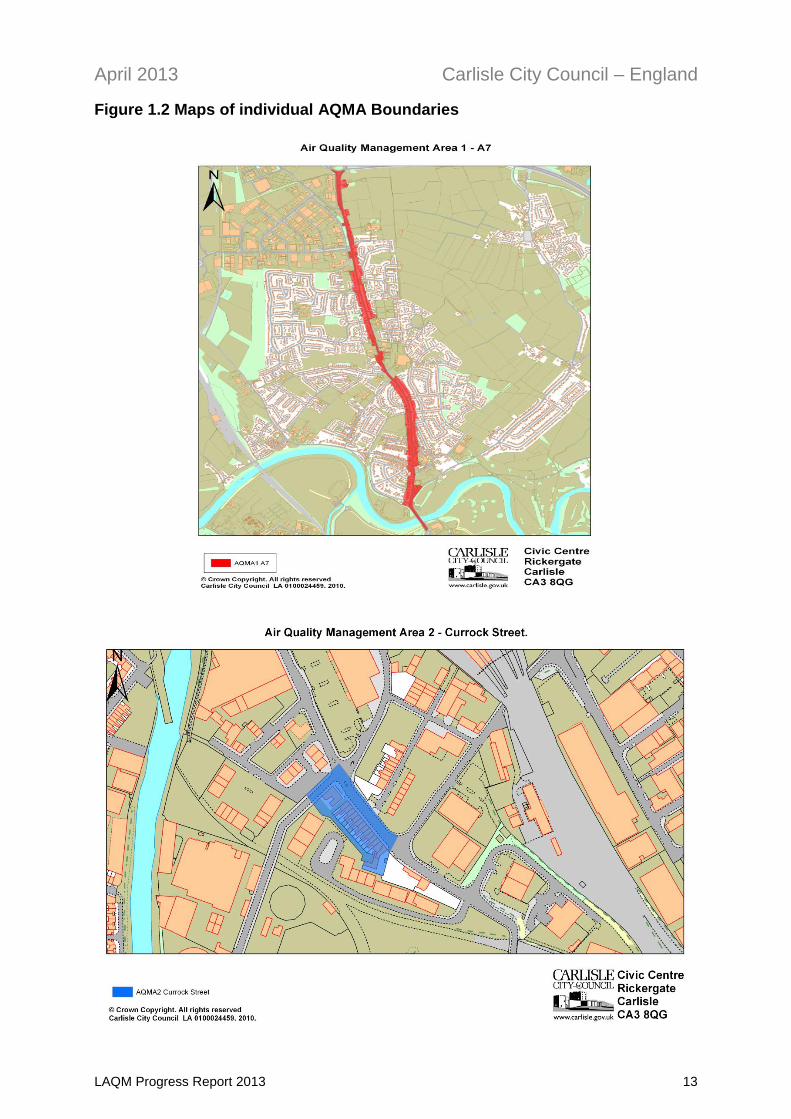
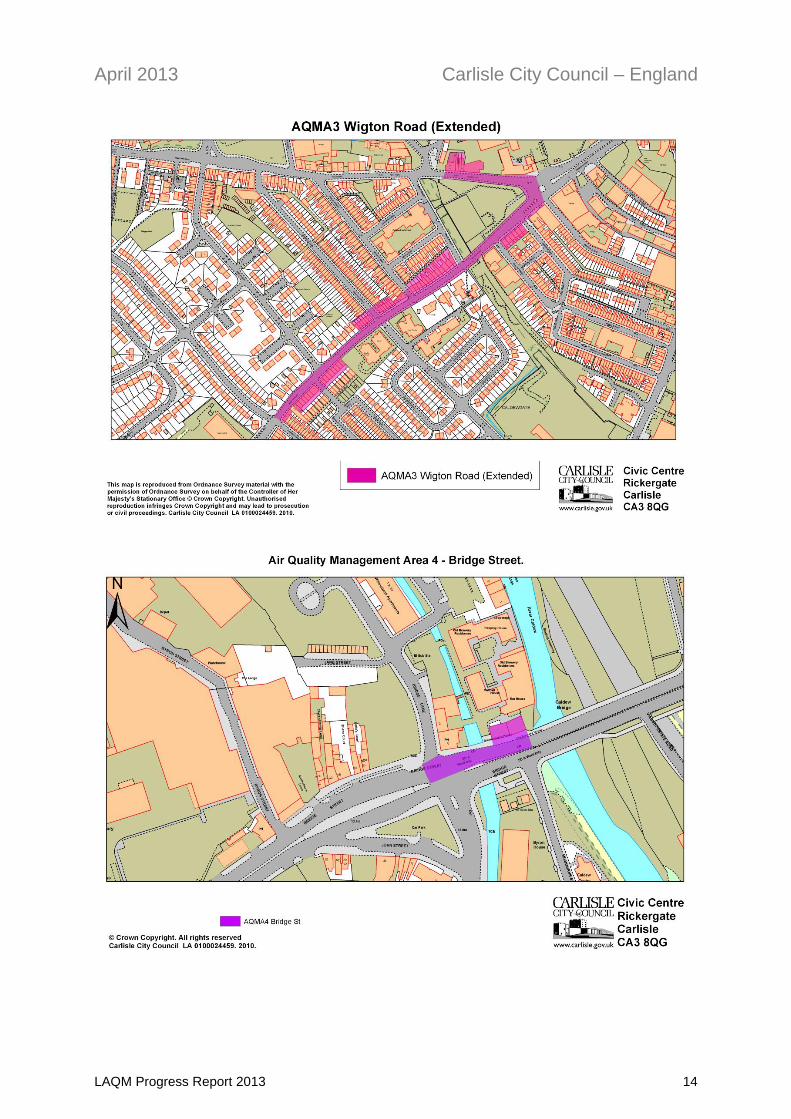
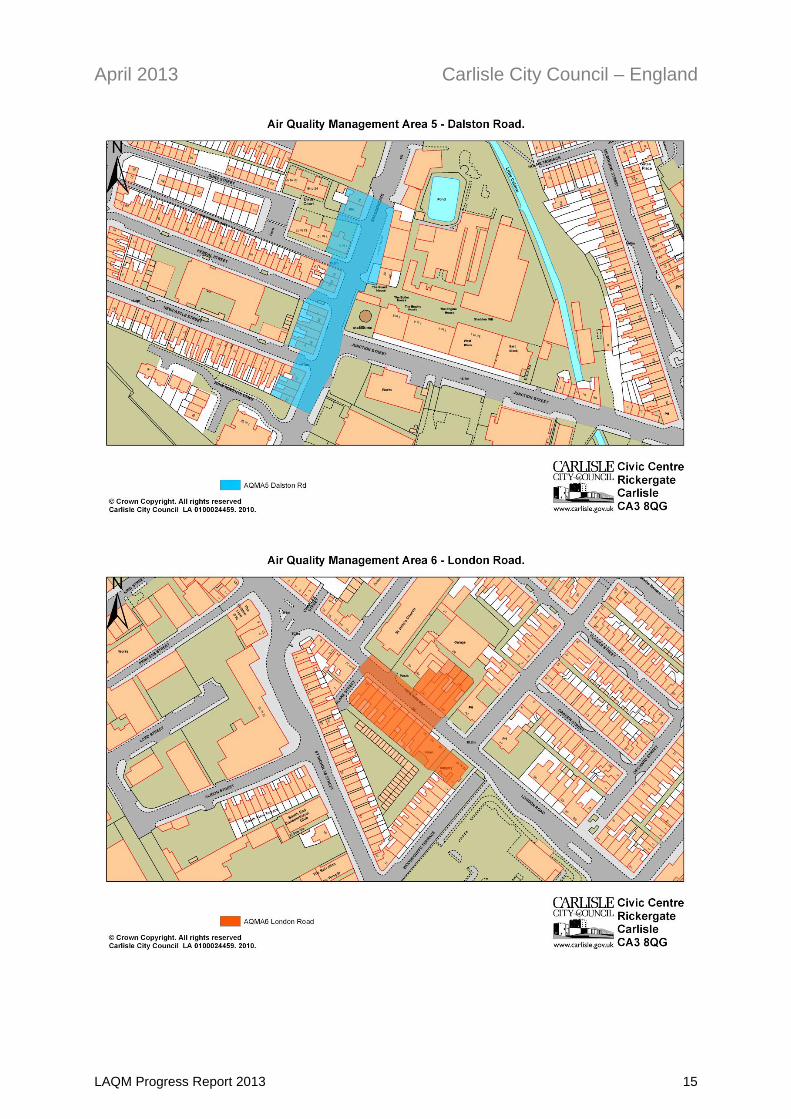
Figure 1.2 Maps of individual AQMA Boundaries
April 2013 Carlisle City Council – England
LAQM Progress Report 2013 14
April 2013 Carlisle City Council – England
LAQM Progress Report 2013 15
April 2013 Carlisle City Council – England
LAQM Progress Report 2013 16
2 New Monitoring Data
2.1 Summary of Monitoring Undertaken
Air quality monitoring in Carlisle City Council is driven by the local air quality management process and in particular the review and assessment of air quality. Carlisle City Council currently monitors for 3 pollutants; nitrogen dioxide, particulates and benzene and employs two principle methods of monitoring; diffusion tubes and continuous monitoring. Nitrogen dioxide (NO2) and nitric oxide (NO) are both oxides of nitrogen and are collectively referred to as nitrogen oxides (NOx). All combustion processes produce NOx emissions, largely in the form of NO, which is then converted to NO2, mainly as a result of reaction with ozone in the atmosphere. The principle source of nitrogen dioxide within the district is road transport. Particulates are the fraction of suspended airborne particles, these small particles can be breathed into the lungs carrying with them a range of both natural and man made substances. Particulate Matter 10 or PM10 is the fraction of particulate matter less than 10µm (Ten micrometres) in aerodynamic diameter. This comes from a wide range of sources known as primary i.e. combustion processes such as vehicle exhaust emissions, secondary i.e. formed in the atmosphere and course i.e. from suspended soils, dust and construction etc. In Carlisle the dominating sources are likely to be:
Local traffic
Resuspension of road dust
Agriculture
Background PM10 carried from other parts of the UK and continental Europe. The PM2.5 fraction of particulate matter differs from PM10 only in respect of the size of the particles, these particles are much smaller, less than 2.5µm (2.5 micrometres) in aerodynamic diameter. Carlisle City Council began measuring PM 2.5 at the Paddy’s Market monitoring station in March 2009. Benzene is a recognised genotoxic human carcinogen. The main sources of benzene in the UK are petrol engine vehicles, petrol refining and the distribution and uncontrolled emissions from petrol station forecourts without vapour recovery systems. Whilst the local authority does not have any sources within the area which are likely to exceed the objective levels Carlisle has been monitoring benzene since April 2008. Benzene monitoring is undertaken at the Paddy’s Market station using a pumped tube sampler with sorbent tubes containing Carbopack X, as part of the Non Automatic Hydrocarbon Network (NAHN).
April 2013 Carlisle City Council – England
LAQM Progress Report 2013 17
2.1.1 Automatic Monitoring Sites
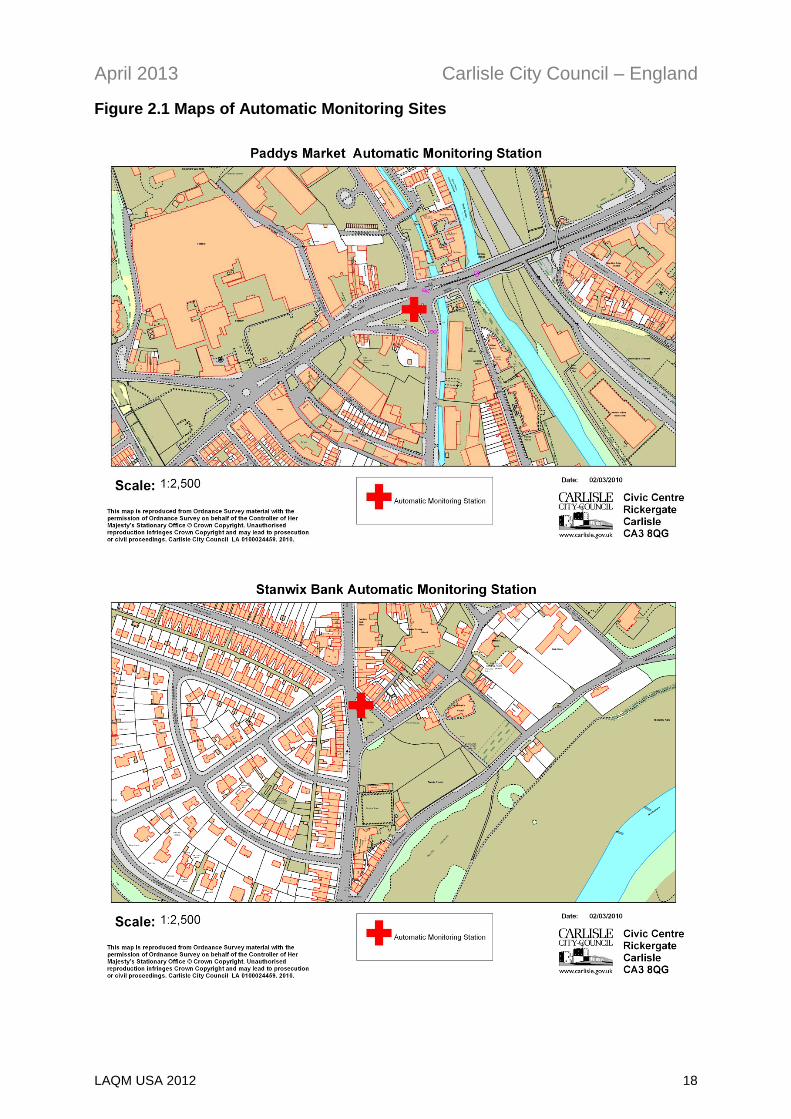
There are two continuous monitoring stations in Carlisle. These are located at Paddy’s Market and Stanwix Bank.
Paddy’s Market in Caldewgate has been used as a roadside monitoring site since 2005. As well as benzene, the pollutants measured include oxides of nitrogen using a Chemiluminescent Analyser and particulate matter (PM10) using a Tapered Element Oscillating Microbalance (TEOM). In March 2009 an additional TEOM to measure smaller sized particles (PM2.5) was installed in Paddy’s Market monitoring station by Defra. Both TEOM’s have been upgraded to include a Filter Dynamics Measurement System (FDMS) to allow better equivalence to the objective level. The site is now partly funded by Defra.
Since February 2008 the site has been affiliated to the Automatic Urban and Rural Network (AURN) and the network quality assurance and control procedures are implemented. The benzene monitoring forms part of the Non Automatic Hydrocarbons Network (NAHN).
Stanwix Bank is a site that has been in operation since the beginning of 2007 and measures nitrogen dioxide with a chemiluminescent analyser. During 2012 the data collected at the site was managed by Casella Monitor on behalf of Carlisle City Council. The data management contract was passed over to Supporting U in April 2013, which is where it remains. Both Cassella and Supporting U have defined quality assurance and quality control systems in place. The service and maintenance contracts for both NOx analysers were passed from Casella to Enviro Technology Services PLC in April 2012, as part of a novation agreement. The contracts for both Stanwix bank and Paddys Market monitoring sites have subsequently ended and were moved to Supporting U in April 2013.
Daily data from both monitoring stations is available to the public on Carlisle City Councils website.
Appendix A contains further details on our automatic monitoring including information on co-location study, quality control and quality assurance measures.
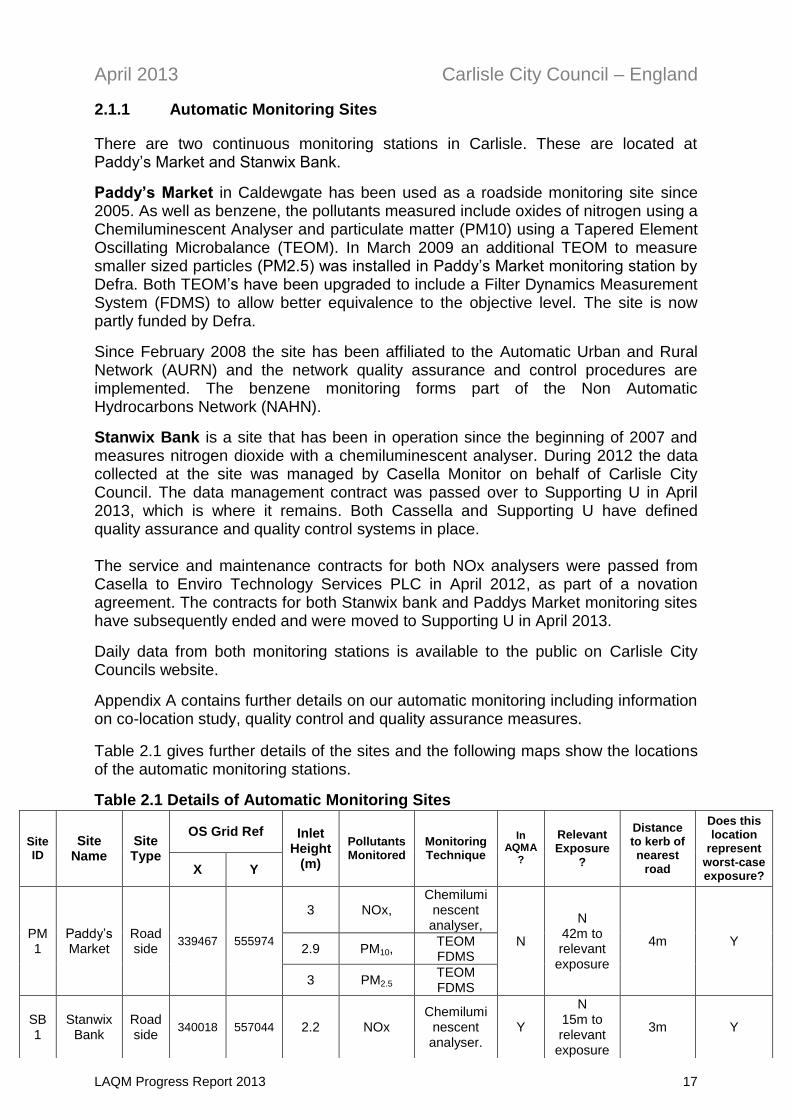
Table 2.1 gives further details of the sites and the following maps show the locations of the automatic monitoring stations.
Table 2.1 Details of Automatic Monitoring Sites
Site ID
Site Name
Site Type
OS Grid Ref Inlet Height
(m)
Pollutants Monitored
Monitoring Technique
In
AQMA?
Relevant Exposure
?
Distance to kerb of nearest
road
Does this location
represent worst-case exposure?
X Y
PM1
Paddy’s Market
Roadside
339467 555974
3 NOx, Chemilumi
nescent analyser,
N
N 42m to relevant
exposure
4m Y 2.9 PM10,
TEOM FDMS
3 PM2.5 TEOM FDMS
SB1
Stanwix Bank
Roadside
340018 557044 2.2 NOx Chemilumi
nescent analyser.
Y
N 15m to relevant
exposure
3m Y
April 2013 Carlisle City Council – England
LAQM USA 2012 18
Figure 2.1 Maps of Automatic Monitoring Sites
April 2013 Carlisle City Council – England
LAQM Progress Report 2013 19
2.1.2 Non-Automatic Monitoring Sites
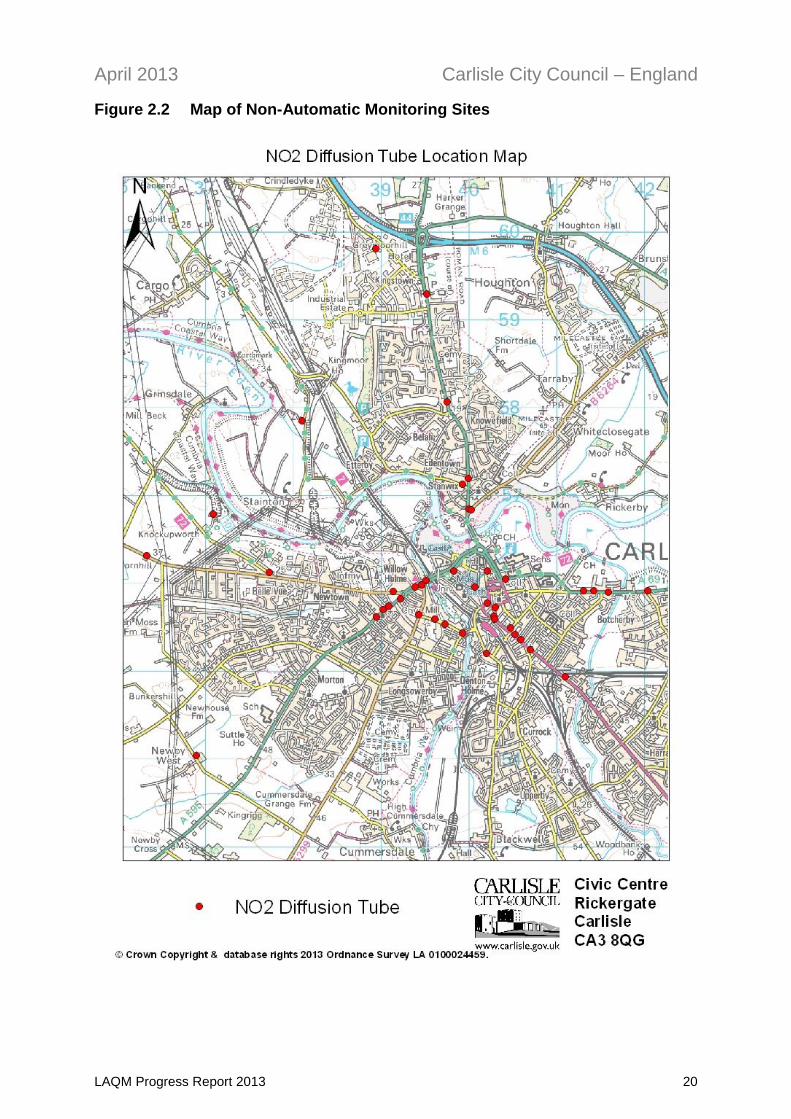
Benzene The council operates a pumped tube benzene sampler as part of the UK Non-Automatic Hydrocarbon Network. The benzene station is located within the Paddy’s Market Unit and has been in operation since April 2008. It is entirely funded by Defra. Nitrogen Dioxide Carlisle City Council operates an extensive network of Nitrogen Dioxide diffusion tubes across the district. Since February 2009 the council has utilised tubes prepared with 20% Triethanolamine (TEA) in water, prepared and analysed by Gradko Environmental Ltd. Throughout 2012 the council has obtained a full twelve months of monitoring data from most of the diffusion tube monitoring locations. Some locations have slightly fewer monthly results due to problems with individual tubes such as laboratory issues and dislodging or unauthorised removal of a tube from its mounting. Monitoring at four new locations on the newly opened Carlisle Northern Development Route began in May 2012. This data required further adjustment in order to estimate the mean pollutant concentration for the whole calendar year as the collected data covered less than 75% of 2012. The methodology and calculations carried out for this data adjustment can be found in appendix A. Appendix A contains further details on the NO2 diffusion tube analysis including bias adjustment and Quality control measures. All of the monthly diffusion tube results for 2012 can be found in appendix B. The bias adjusted annual mean data and other calculated results can be found in appendix C. Further detail relating to each specific monitoring location is provided in Table 2.2. The majority of the diffusion tube monitoring locations are shown on the following map (Figure 2.2). Accurate close up maps showing more detail of each location within each monitoring area are provided later in this chapter.
April 2013 Carlisle City Council – England
LAQM Progress Report 2013 20
Figure 2.2 Map of Non-Automatic Monitoring Sites
April 2013 Carlisle City Council – England
LAQM Progress Report 2013 21
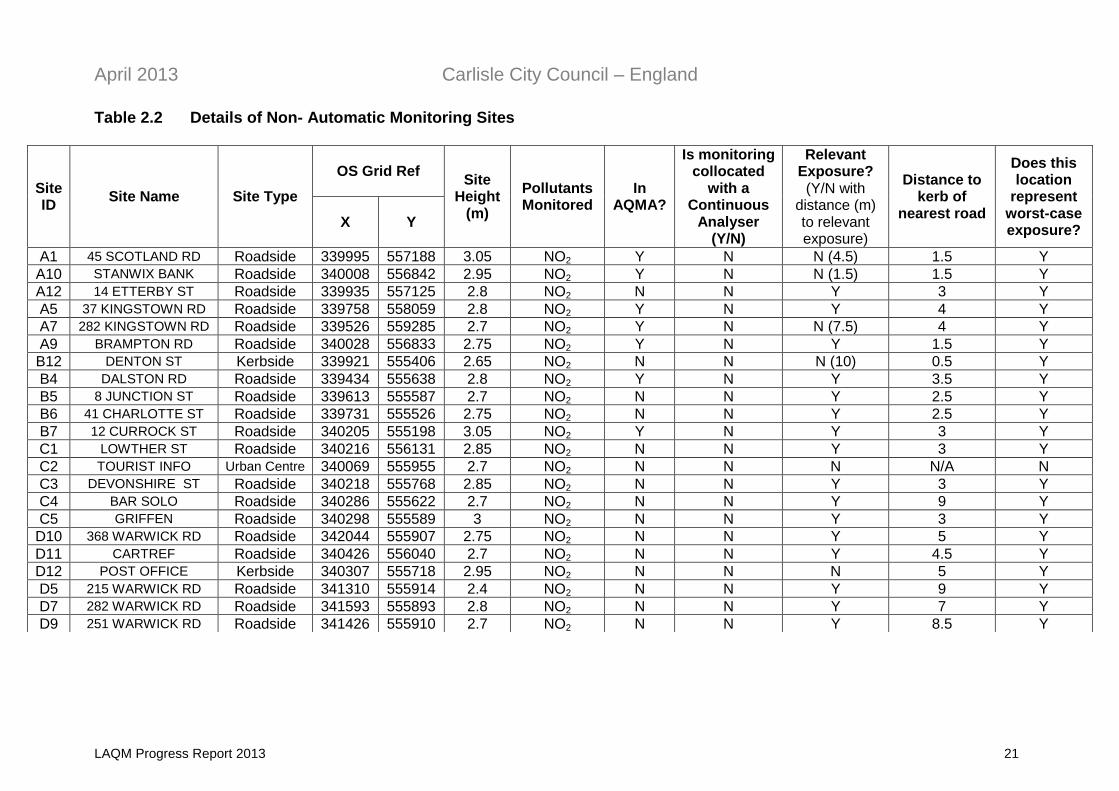
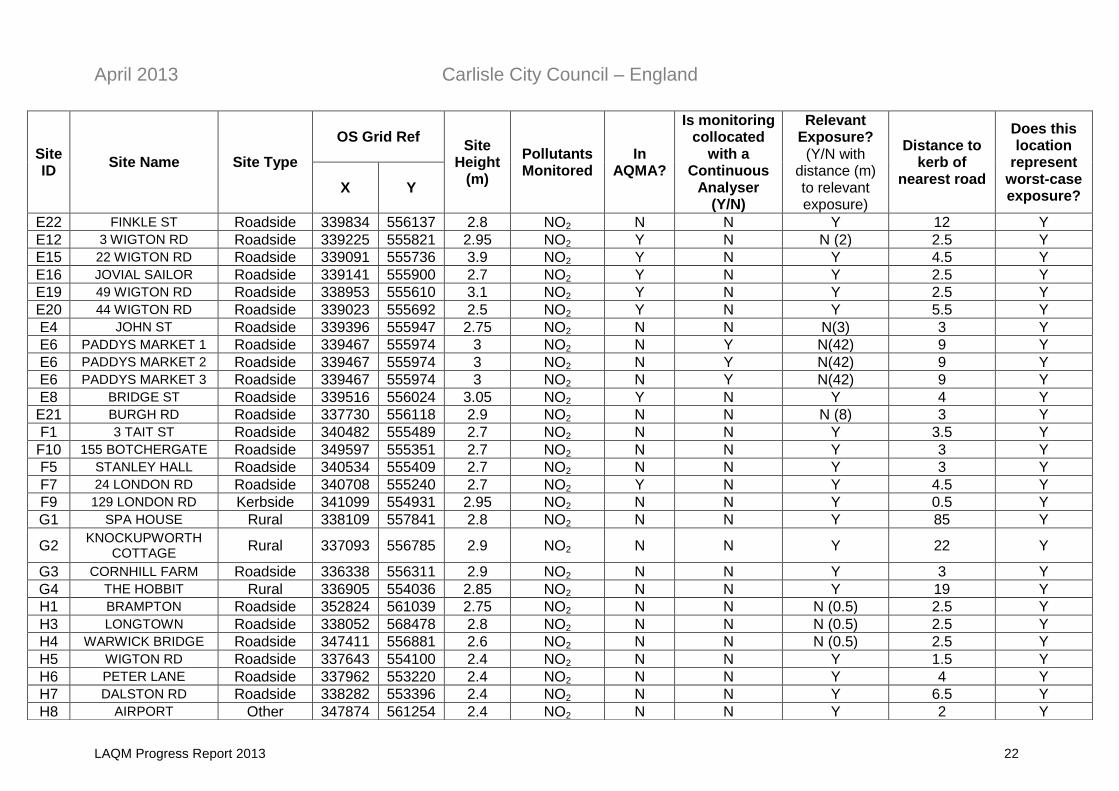
Table 2.2 Details of Non- Automatic Monitoring Sites
Site ID
Site Name Site Type
OS Grid Ref Site
Height (m)
Pollutants Monitored
In AQMA?
Is monitoring collocated
with a Continuous
Analyser (Y/N)
Relevant Exposure? (Y/N with
distance (m) to relevant exposure)
Distance to kerb of
nearest road
Does this location
represent worst-case exposure?
X Y
A1 45 SCOTLAND RD Roadside 339995 557188 3.05 NO2 Y N N (4.5) 1.5 Y
A10 STANWIX BANK Roadside 340008 556842 2.95 NO2 Y N N (1.5) 1.5 Y
A12 14 ETTERBY ST Roadside 339935 557125 2.8 NO2 N N Y 3 Y
A5 37 KINGSTOWN RD Roadside 339758 558059 2.8 NO2 Y N Y 4 Y
A7 282 KINGSTOWN RD Roadside 339526 559285 2.7 NO2 Y N N (7.5) 4 Y
A9 BRAMPTON RD Roadside 340028 556833 2.75 NO2 Y N Y 1.5 Y
B12 DENTON ST Kerbside 339921 555406 2.65 NO2 N N N (10) 0.5 Y
B4 DALSTON RD Roadside 339434 555638 2.8 NO2 Y N Y 3.5 Y
B5 8 JUNCTION ST Roadside 339613 555587 2.7 NO2 N N Y 2.5 Y
B6 41 CHARLOTTE ST Roadside 339731 555526 2.75 NO2 N N Y 2.5 Y
B7 12 CURROCK ST Roadside 340205 555198 3.05 NO2 Y N Y 3 Y
C1 LOWTHER ST Roadside 340216 556131 2.85 NO2 N N Y 3 Y
C2 TOURIST INFO Urban Centre 340069 555955 2.7 NO2 N N N N/A N
C3 DEVONSHIRE ST Roadside 340218 555768 2.85 NO2 N N Y 3 Y
C4 BAR SOLO Roadside 340286 555622 2.7 NO2 N N Y 9 Y
C5 GRIFFEN Roadside 340298 555589 3 NO2 N N Y 3 Y
D10 368 WARWICK RD Roadside 342044 555907 2.75 NO2 N N Y 5 Y
D11 CARTREF Roadside 340426 556040 2.7 NO2 N N Y 4.5 Y
D12 POST OFFICE Kerbside 340307 555718 2.95 NO2 N N N 5 Y
D5 215 WARWICK RD Roadside 341310 555914 2.4 NO2 N N Y 9 Y
D7 282 WARWICK RD Roadside 341593 555893 2.8 NO2 N N Y 7 Y
D9 251 WARWICK RD Roadside 341426 555910 2.7 NO2 N N Y 8.5 Y
April 2013 Carlisle City Council – England
LAQM Progress Report 2013 22
Site ID
Site Name Site Type
OS Grid Ref Site
Height (m)
Pollutants Monitored
In AQMA?
Is monitoring collocated
with a Continuous
Analyser (Y/N)
Relevant Exposure? (Y/N with
distance (m) to relevant exposure)
Distance to kerb of
nearest road
Does this location
represent worst-case exposure?
X Y
E22 FINKLE ST Roadside 339834 556137 2.8 NO2 N N Y 12 Y
E12 3 WIGTON RD Roadside 339225 555821 2.95 NO2 Y N N (2) 2.5 Y
E15 22 WIGTON RD Roadside 339091 555736 3.9 NO2 Y N Y 4.5 Y
E16 JOVIAL SAILOR Roadside 339141 555900 2.7 NO2 Y N Y 2.5 Y
E19 49 WIGTON RD Roadside 338953 555610 3.1 NO2 Y N Y 2.5 Y
E20 44 WIGTON RD Roadside 339023 555692 2.5 NO2 Y N Y 5.5 Y
E4 JOHN ST Roadside 339396 555947 2.75 NO2 N N N(3) 3 Y
E6 PADDYS MARKET 1 Roadside 339467 555974 3 NO2 N Y N(42) 9 Y
E6 PADDYS MARKET 2 Roadside 339467 555974 3 NO2 N Y N(42) 9 Y
E6 PADDYS MARKET 3 Roadside 339467 555974 3 NO2 N Y N(42) 9 Y
E8 BRIDGE ST Roadside 339516 556024 3.05 NO2 Y N Y 4 Y
E21 BURGH RD Roadside 337730 556118 2.9 NO2 N N N (8) 3 Y
F1 3 TAIT ST Roadside 340482 555489 2.7 NO2 N N Y 3.5 Y
F10 155 BOTCHERGATE Roadside 349597 555351 2.7 NO2 N N Y 3 Y
F5 STANLEY HALL Roadside 340534 555409 2.7 NO2 N N Y 3 Y
F7 24 LONDON RD Roadside 340708 555240 2.7 NO2 Y N Y 4.5 Y
F9 129 LONDON RD Kerbside 341099 554931 2.95 NO2 N N Y 0.5 Y
G1 SPA HOUSE Rural 338109 557841 2.8 NO2 N N Y 85 Y
G2 KNOCKUPWORTH
COTTAGE Rural 337093 556785 2.9 NO2 N N Y 22 Y
G3 CORNHILL FARM Roadside 336338 556311 2.9 NO2 N N Y 3 Y
G4 THE HOBBIT Rural 336905 554036 2.85 NO2 N N Y 19 Y
H1 BRAMPTON Roadside 352824 561039 2.75 NO2 N N N (0.5) 2.5 Y
H3 LONGTOWN Roadside 338052 568478 2.8 NO2 N N N (0.5) 2.5 Y
H4 WARWICK BRIDGE Roadside 347411 556881 2.6 NO2 N N N (0.5) 2.5 Y
H5 WIGTON RD Roadside 337643 554100 2.4 NO2 N N Y 1.5 Y
H6 PETER LANE Roadside 337962 553220 2.4 NO2 N N Y 4 Y
H7 DALSTON RD Roadside 338282 553396 2.4 NO2 N N Y 6.5 Y
H8 AIRPORT Other 347874 561254 2.4 NO2 N N Y 2 Y
April 2013 Carlisle City Council – England
LAQM Progress Report 2013 23
2.2 Comparison of Monitoring Results with Air Quality Objectives
2.2.1 Nitrogen Dioxide (NO2)
Automatic Monitoring Data
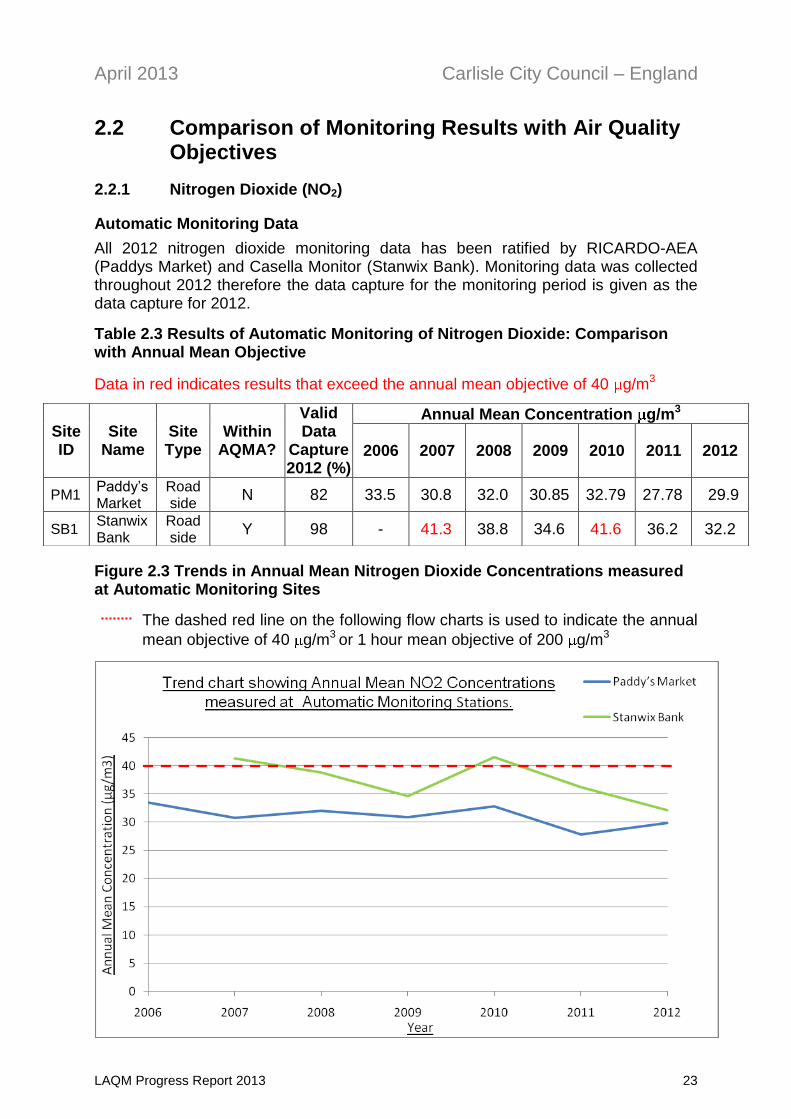
All 2012 nitrogen dioxide monitoring data has been ratified by RICARDO-AEA (Paddys Market) and Casella Monitor (Stanwix Bank). Monitoring data was collected throughout 2012 therefore the data capture for the monitoring period is given as the data capture for 2012.
Table 2.3 Results of Automatic Monitoring of Nitrogen Dioxide: Comparison with Annual Mean Objective
Data in red indicates results that exceed the annual mean objective of 40 g/m3
Figure 2.3 Trends in Annual Mean Nitrogen Dioxide Concentrations measured at Automatic Monitoring Sites
The dashed red line on the following flow charts is used to indicate the annual
mean objective of 40 g/m3 or 1 hour mean objective of 200 g/m3
Site ID
Site Name
Site Type
Within AQMA?
Valid Data
Capture 2012 (%)
Annual Mean Concentration g/m3
2006 2007 2008 2009 2010 2011 2012
PM1 Paddy’s Market
Roadside
N 82 33.5 30.8 32.0 30.85 32.79 27.78 29.9
SB1 Stanwix Bank
Roadside
Y 98 - 41.3 38.8 34.6 41.6 36.2 32.2

April 2013 Carlisle City Council – England
LAQM Progress Report 2013 24
The above trend chart indicates that nitrogen dioxide levels at the Paddys Market roadside unit have remained relatively constant since 2006. During 2012 there has been a slight increase in the annual mean compared to 2011 however it is still marginally less than all other previous years of monitoring. The Stanwix Bank unit has shown a gradual reduction in nitrogen dioxide levels between 2007 and 2009. In 2010 there was a sharp increase which is believed to be due to meteorological conditions. Since 2010 the annual mean has reduced year on year and is now at the lowest since monitoring began.
Table 2.4 Results of Automatic Monitoring for Nitrogen Dioxide: Comparison with 1-hour mean Objective
It is clear from the table above that the NO2 data capture for Paddys Market was less than 90% during 2012, for this reason it was necessary to calculate the 99.8th percentile using the data archive on the Defra (UK Air) website. The 99.8th percentile of the hourly measured NO2 concentrations was found to be 109µg/m3. A result of over 200µg/m3 would indicate that there could potentially be an exceedence of the objective level. This shows that concentrations at Paddys Market are still significantly below the objective levels.
Figure 2.4 Results of Hourly Automatic Monitoring for Nitrogen Dioxide: Comparison with 1-hour Mean Objective at Paddys Market.
Site ID
Site Name
Site Type
Within AQMA?
Valid Data
Capture 2012 (%)
Number of Exceedences of Hourly Mean
(200 g/m3)
2006 2007 2008 2009 2010 2011 2012
PM1 Paddy’s Market
Roadside
N 82 0 0 0 0 0 0 0
SB1 Stanwix Bank
Roadside
Y 98 0 0 0 0 0 0 0
April 2013 Carlisle City Council – England
LAQM Progress Report 2013 25
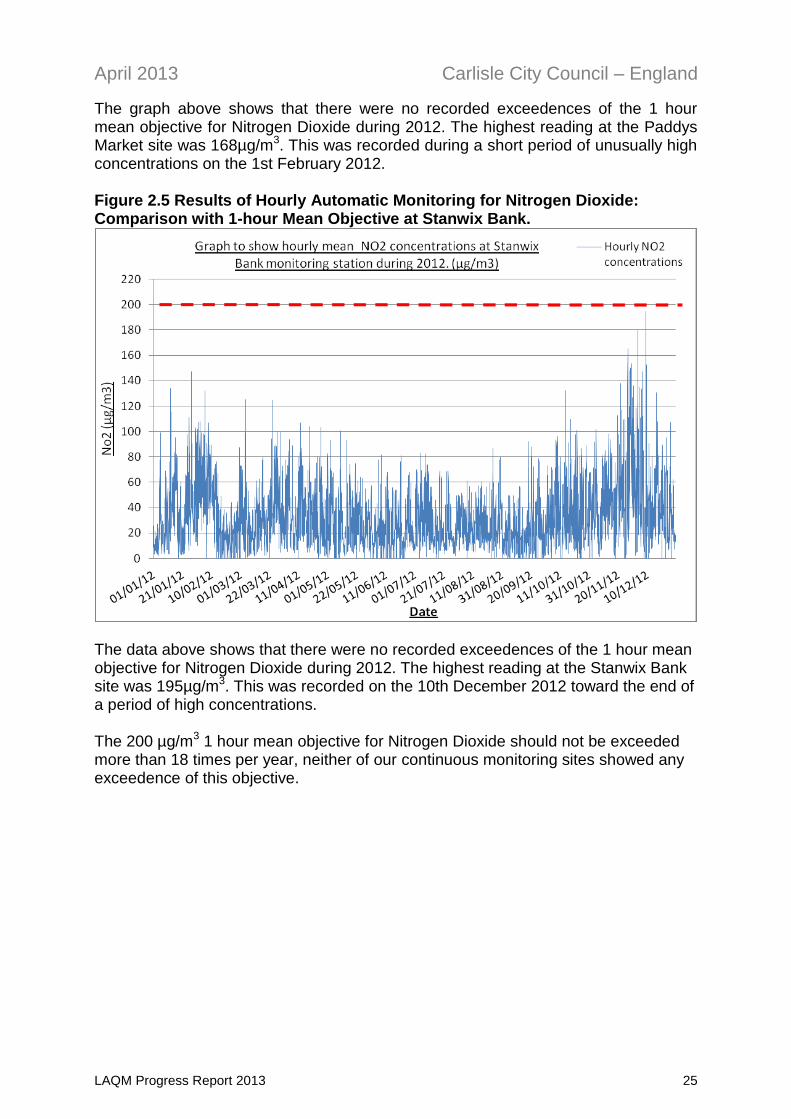
The graph above shows that there were no recorded exceedences of the 1 hour mean objective for Nitrogen Dioxide during 2012. The highest reading at the Paddys Market site was 168µg/m3. This was recorded during a short period of unusually high concentrations on the 1st February 2012. Figure 2.5 Results of Hourly Automatic Monitoring for Nitrogen Dioxide: Comparison with 1-hour Mean Objective at Stanwix Bank.
The data above shows that there were no recorded exceedences of the 1 hour mean objective for Nitrogen Dioxide during 2012. The highest reading at the Stanwix Bank site was 195µg/m3. This was recorded on the 10th December 2012 toward the end of a period of high concentrations. The 200 µg/m3 1 hour mean objective for Nitrogen Dioxide should not be exceeded more than 18 times per year, neither of our continuous monitoring sites showed any exceedence of this objective.
April 2013 Carlisle City Council – England
LAQM Progress Report 2013 26
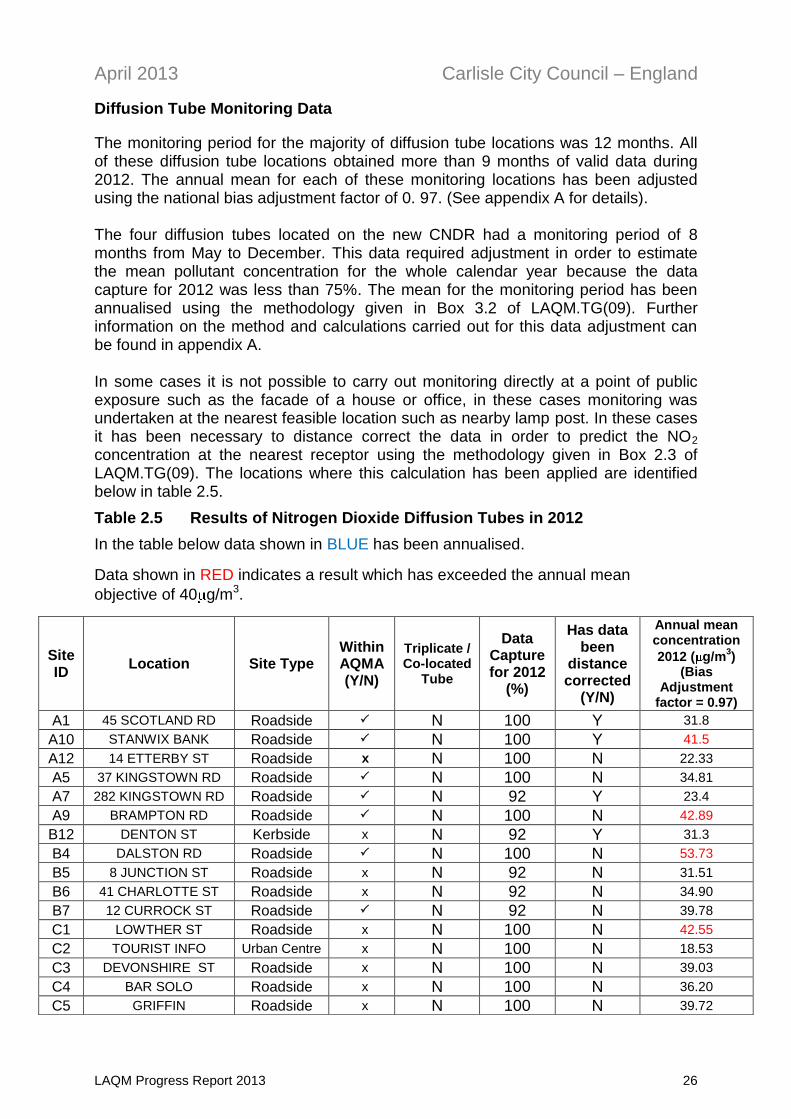
Diffusion Tube Monitoring Data
The monitoring period for the majority of diffusion tube locations was 12 months. All of these diffusion tube locations obtained more than 9 months of valid data during 2012. The annual mean for each of these monitoring locations has been adjusted using the national bias adjustment factor of 0. 97. (See appendix A for details). The four diffusion tubes located on the new CNDR had a monitoring period of 8 months from May to December. This data required adjustment in order to estimate the mean pollutant concentration for the whole calendar year because the data capture for 2012 was less than 75%. The mean for the monitoring period has been annualised using the methodology given in Box 3.2 of LAQM.TG(09). Further information on the method and calculations carried out for this data adjustment can be found in appendix A. In some cases it is not possible to carry out monitoring directly at a point of public exposure such as the facade of a house or office, in these cases monitoring was undertaken at the nearest feasible location such as nearby lamp post. In these cases it has been necessary to distance correct the data in order to predict the NO2 concentration at the nearest receptor using the methodology given in Box 2.3 of LAQM.TG(09). The locations where this calculation has been applied are identified below in table 2.5.
Table 2.5 Results of Nitrogen Dioxide Diffusion Tubes in 2012
In the table below data shown in BLUE has been annualised.
Data shown in RED indicates a result which has exceeded the annual mean
objective of 40 g/m3.
Site ID
Location Site Type Within AQMA (Y/N)
Triplicate / Co-located
Tube
Data Capture for 2012
(%)
Has data been
distance corrected
(Y/N)
Annual mean concentration
2012 ( g/m3)
(Bias Adjustment
factor = 0.97)
A1 45 SCOTLAND RD Roadside N 100 Y 31.8
A10 STANWIX BANK Roadside N 100 Y 41.5
A12 14 ETTERBY ST Roadside x N 100 N 22.33
A5 37 KINGSTOWN RD Roadside N 100 N 34.81
A7 282 KINGSTOWN RD Roadside N 92 Y 23.4
A9 BRAMPTON RD Roadside N 100 N 42.89
B12 DENTON ST Kerbside x N 92 Y 31.3
B4 DALSTON RD Roadside N 100 N 53.73
B5 8 JUNCTION ST Roadside x N 92 N 31.51
B6 41 CHARLOTTE ST Roadside x N 92 N 34.90
B7 12 CURROCK ST Roadside N 92 N 39.78
C1 LOWTHER ST Roadside x N 100 N 42.55
C2 TOURIST INFO Urban Centre x N 100 N 18.53
C3 DEVONSHIRE ST Roadside x N 100 N 39.03
C4 BAR SOLO Roadside x N 100 N 36.20
C5 GRIFFIN Roadside x N 100 N 39.72
April 2013 Carlisle City Council – England
LAQM Progress Report 2013 27
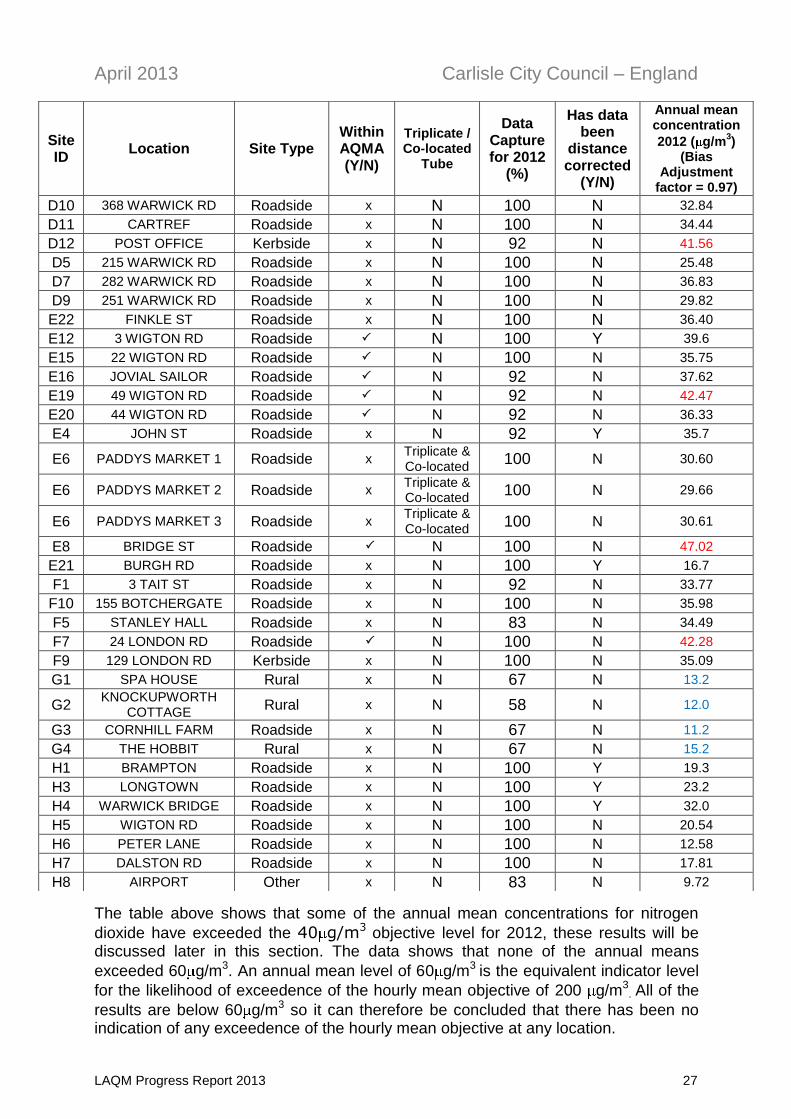
The table above shows that some of the annual mean concentrations for nitrogen
dioxide have exceeded the 40 g/m3 objective level for 2012, these results will be discussed later in this section. The data shows that none of the annual means
exceeded 60 g/m3. An annual mean level of 60 g/m3 is the equivalent indicator level
for the likelihood of exceedence of the hourly mean objective of 200 g/m3. All of the
results are below 60 g/m3 so it can therefore be concluded that there has been no indication of any exceedence of the hourly mean objective at any location.
Site ID
Location Site Type Within AQMA (Y/N)
Triplicate / Co-located
Tube
Data Capture for 2012
(%)
Has data been
distance corrected
(Y/N)
Annual mean concentration
2012 ( g/m3)
(Bias Adjustment
factor = 0.97)
D10 368 WARWICK RD Roadside x N 100 N 32.84
D11 CARTREF Roadside x N 100 N 34.44
D12 POST OFFICE Kerbside x N 92 N 41.56
D5 215 WARWICK RD Roadside x N 100 N 25.48
D7 282 WARWICK RD Roadside x N 100 N 36.83
D9 251 WARWICK RD Roadside x N 100 N 29.82
E22 FINKLE ST Roadside x N 100 N 36.40
E12 3 WIGTON RD Roadside N 100 Y 39.6
E15 22 WIGTON RD Roadside N 100 N 35.75
E16 JOVIAL SAILOR Roadside N 92 N 37.62
E19 49 WIGTON RD Roadside N 92 N 42.47
E20 44 WIGTON RD Roadside N 92 N 36.33
E4 JOHN ST Roadside x N 92 Y 35.7
E6 PADDYS MARKET 1 Roadside x Triplicate & Co-located
100 N 30.60
E6 PADDYS MARKET 2 Roadside x Triplicate & Co-located
100 N 29.66
E6 PADDYS MARKET 3 Roadside x Triplicate & Co-located
100 N 30.61
E8 BRIDGE ST Roadside N 100 N 47.02
E21 BURGH RD Roadside x N 100 Y 16.7
F1 3 TAIT ST Roadside x N 92 N 33.77
F10 155 BOTCHERGATE Roadside x N 100 N 35.98
F5 STANLEY HALL Roadside x N 83 N 34.49
F7 24 LONDON RD Roadside N 100 N 42.28
F9 129 LONDON RD Kerbside x N 100 N 35.09
G1 SPA HOUSE Rural x N 67 N 13.2
G2 KNOCKUPWORTH
COTTAGE Rural x N 58 N 12.0
G3 CORNHILL FARM Roadside x N 67 N 11.2
G4 THE HOBBIT Rural x N 67 N 15.2
H1 BRAMPTON Roadside x N 100 Y 19.3
H3 LONGTOWN Roadside x N 100 Y 23.2
H4 WARWICK BRIDGE Roadside x N 100 Y 32.0
H5 WIGTON RD Roadside x N 100 N 20.54
H6 PETER LANE Roadside x N 100 N 12.58
H7 DALSTON RD Roadside x N 100 N 17.81
H8 AIRPORT Other x N 83 N 9.72
April 2013 Carlisle City Council – England
LAQM Progress Report 2013 28
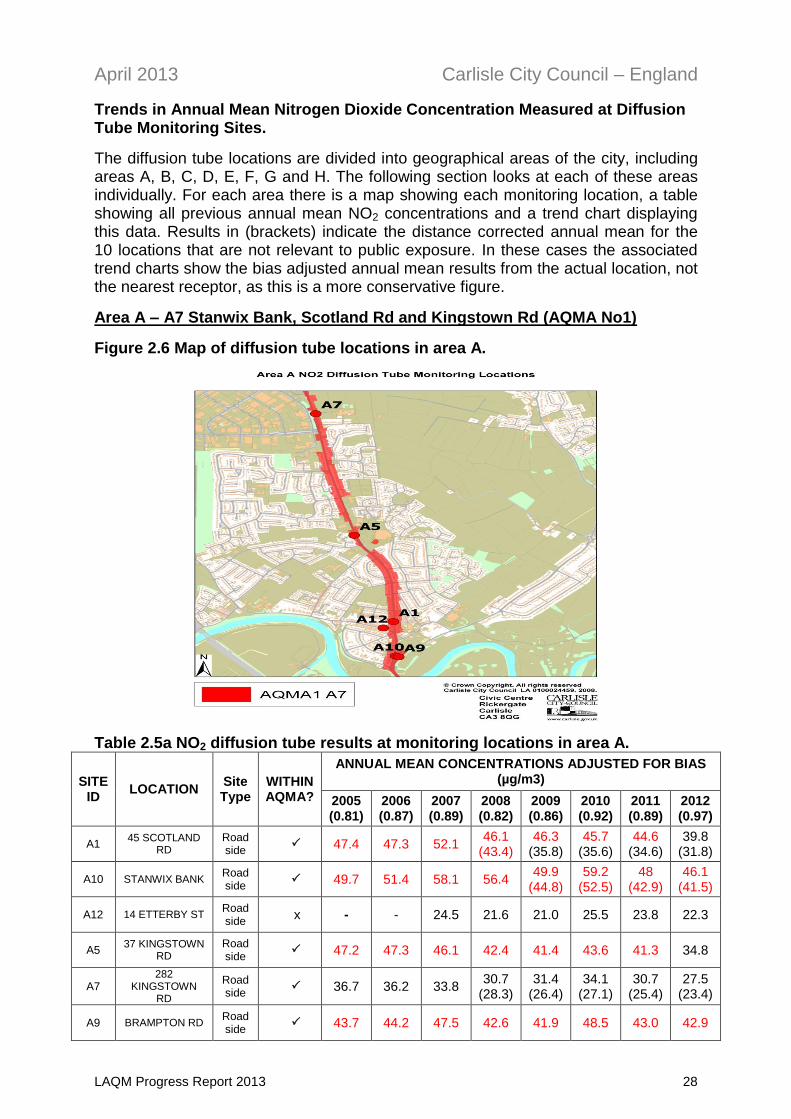
Trends in Annual Mean Nitrogen Dioxide Concentration Measured at Diffusion Tube Monitoring Sites.
The diffusion tube locations are divided into geographical areas of the city, including areas A, B, C, D, E, F, G and H. The following section looks at each of these areas individually. For each area there is a map showing each monitoring location, a table showing all previous annual mean NO2 concentrations and a trend chart displaying this data. Results in (brackets) indicate the distance corrected annual mean for the 10 locations that are not relevant to public exposure. In these cases the associated trend charts show the bias adjusted annual mean results from the actual location, not the nearest receptor, as this is a more conservative figure.
Area A – A7 Stanwix Bank, Scotland Rd and Kingstown Rd (AQMA No1)
Figure 2.6 Map of diffusion tube locations in area A.
Table 2.5a NO2 diffusion tube results at monitoring locations in area A.
SITE ID
LOCATION Site Type
WITHIN AQMA?
ANNUAL MEAN CONCENTRATIONS ADJUSTED FOR BIAS (µg/m3)
2005 (0.81)
2006 (0.87)
2007 (0.89)
2008 (0.82)
2009 (0.86)
2010 (0.92)
2011 (0.89)
2012 (0.97)
A1 45 SCOTLAND
RD Road side
47.4 47.3 52.1 46.1
(43.4) 46.3
(35.8) 45.7
(35.6) 44.6
(34.6) 39.8
(31.8)
A10 STANWIX BANK Road side
49.7 51.4 58.1 56.4 49.9
(44.8) 59.2
(52.5) 48
(42.9) 46.1
(41.5)
A12 14 ETTERBY ST Road side
x - - 24.5 21.6 21.0 25.5 23.8 22.3
A5 37 KINGSTOWN
RD Road side
47.2 47.3 46.1 42.4 41.4 43.6 41.3 34.8
A7 282
KINGSTOWN RD
Road side
36.7 36.2 33.8 30.7
(28.3) 31.4
(26.4) 34.1
(27.1) 30.7
(25.4) 27.5
(23.4)
A9 BRAMPTON RD Road side
43.7 44.2 47.5 42.6 41.9 48.5 43.0 42.9
April 2013 Carlisle City Council – England
LAQM Progress Report 2013 29
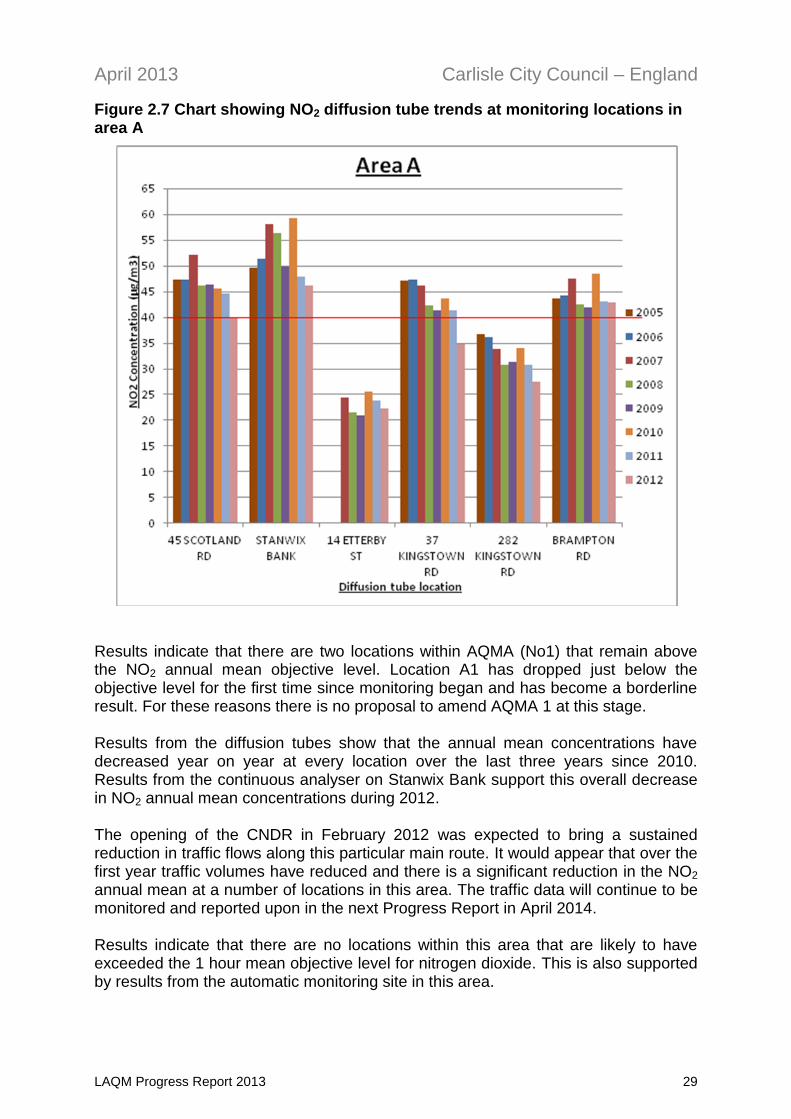
Figure 2.7 Chart showing NO2 diffusion tube trends at monitoring locations in area A
Results indicate that there are two locations within AQMA (No1) that remain above the NO2 annual mean objective level. Location A1 has dropped just below the objective level for the first time since monitoring began and has become a borderline result. For these reasons there is no proposal to amend AQMA 1 at this stage. Results from the diffusion tubes show that the annual mean concentrations have decreased year on year at every location over the last three years since 2010. Results from the continuous analyser on Stanwix Bank support this overall decrease in NO2 annual mean concentrations during 2012. The opening of the CNDR in February 2012 was expected to bring a sustained reduction in traffic flows along this particular main route. It would appear that over the first year traffic volumes have reduced and there is a significant reduction in the NO2 annual mean at a number of locations in this area. The traffic data will continue to be monitored and reported upon in the next Progress Report in April 2014. Results indicate that there are no locations within this area that are likely to have exceeded the 1 hour mean objective level for nitrogen dioxide. This is also supported by results from the automatic monitoring site in this area.
April 2013 Carlisle City Council – England
LAQM Progress Report 2013 30
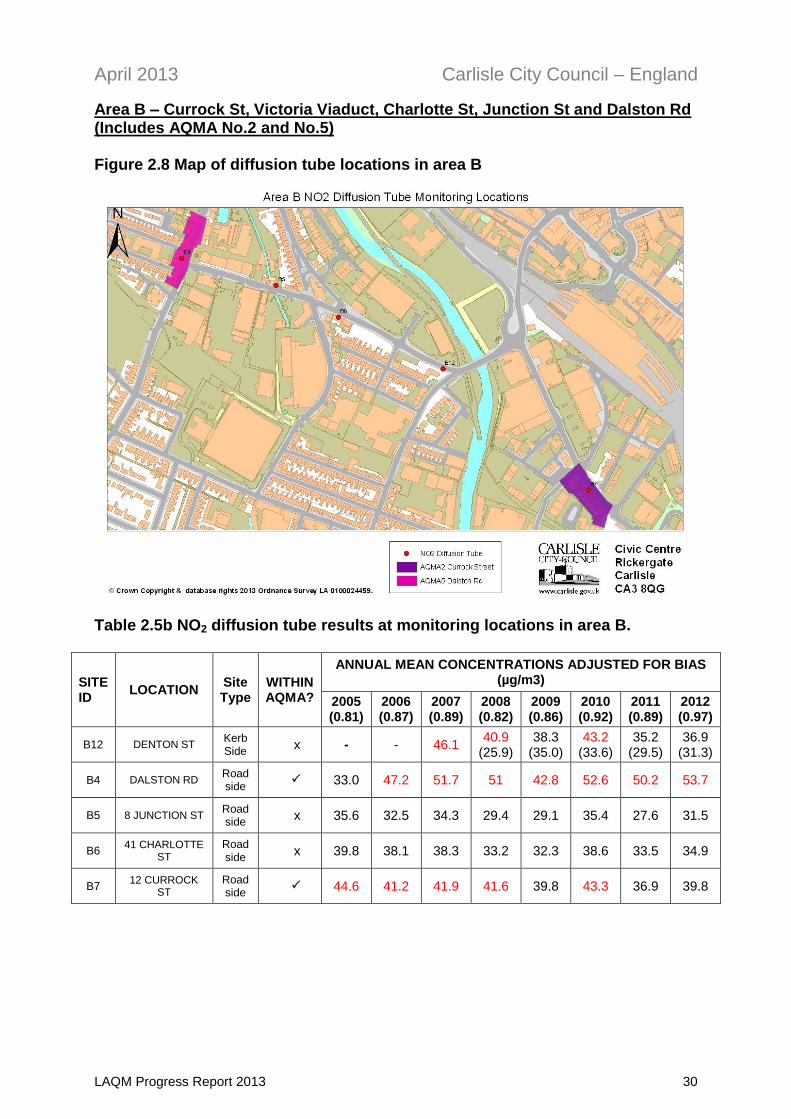
Area B – Currock St, Victoria Viaduct, Charlotte St, Junction St and Dalston Rd (Includes AQMA No.2 and No.5) Figure 2.8 Map of diffusion tube locations in area B
Table 2.5b NO2 diffusion tube results at monitoring locations in area B.
SITE ID
LOCATION Site Type
WITHIN AQMA?
ANNUAL MEAN CONCENTRATIONS ADJUSTED FOR BIAS (µg/m3)
2005 (0.81)
2006 (0.87)
2007 (0.89)
2008 (0.82)
2009 (0.86)
2010 (0.92)
2011 (0.89)
2012 (0.97)
B12 DENTON ST Kerb Side
x - - 46.1 40.9
(25.9) 38.3
(35.0) 43.2
(33.6) 35.2
(29.5) 36.9
(31.3)
B4 DALSTON RD Road side
33.0 47.2 51.7 51 42.8 52.6 50.2 53.7
B5 8 JUNCTION ST Road side
x 35.6 32.5 34.3 29.4 29.1 35.4 27.6 31.5
B6 41 CHARLOTTE
ST Road side
x 39.8 38.1 38.3 33.2 32.3 38.6 33.5 34.9
B7 12 CURROCK
ST Road side
44.6 41.2 41.9 41.6 39.8 43.3 36.9 39.8
April 2013 Carlisle City Council – England
LAQM Progress Report 2013 31
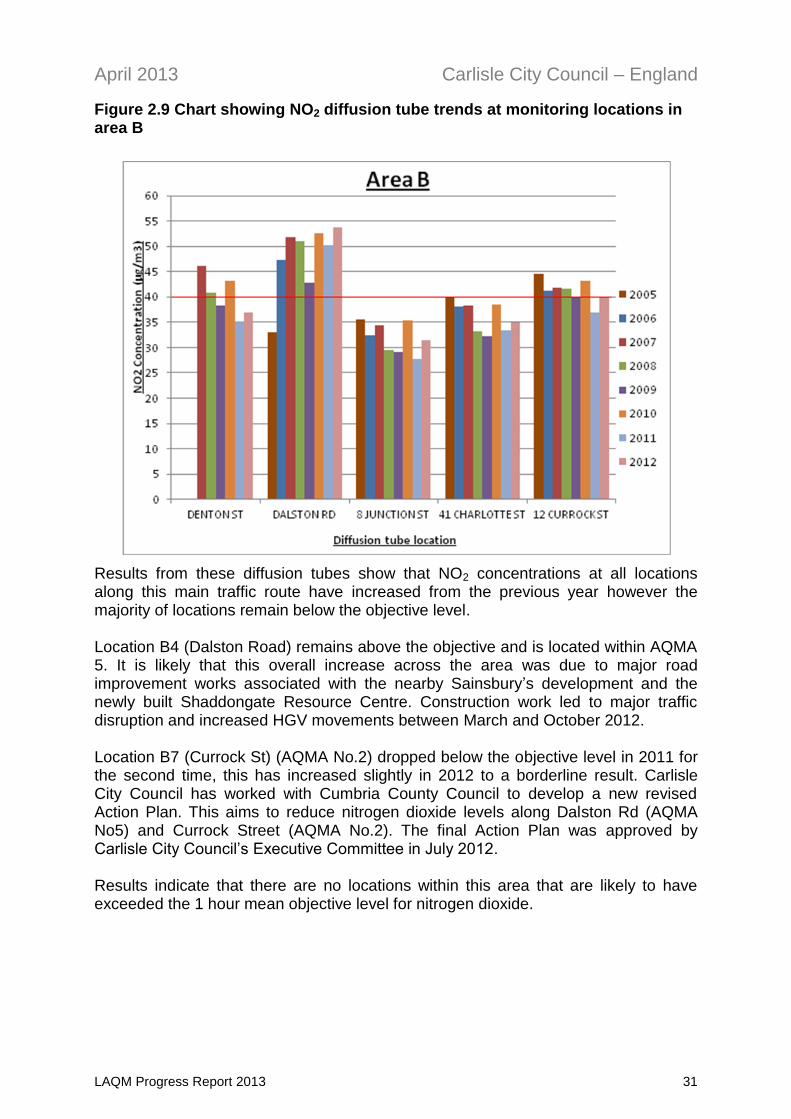
Figure 2.9 Chart showing NO2 diffusion tube trends at monitoring locations in area B
Results from these diffusion tubes show that NO2 concentrations at all locations along this main traffic route have increased from the previous year however the majority of locations remain below the objective level. Location B4 (Dalston Road) remains above the objective and is located within AQMA 5. It is likely that this overall increase across the area was due to major road improvement works associated with the nearby Sainsbury’s development and the newly built Shaddongate Resource Centre. Construction work led to major traffic disruption and increased HGV movements between March and October 2012. Location B7 (Currock St) (AQMA No.2) dropped below the objective level in 2011 for the second time, this has increased slightly in 2012 to a borderline result. Carlisle City Council has worked with Cumbria County Council to develop a new revised Action Plan. This aims to reduce nitrogen dioxide levels along Dalston Rd (AQMA No5) and Currock Street (AQMA No.2). The final Action Plan was approved by Carlisle City Council’s Executive Committee in July 2012. Results indicate that there are no locations within this area that are likely to have exceeded the 1 hour mean objective level for nitrogen dioxide.
April 2013 Carlisle City Council – England
LAQM Progress Report 2013 32
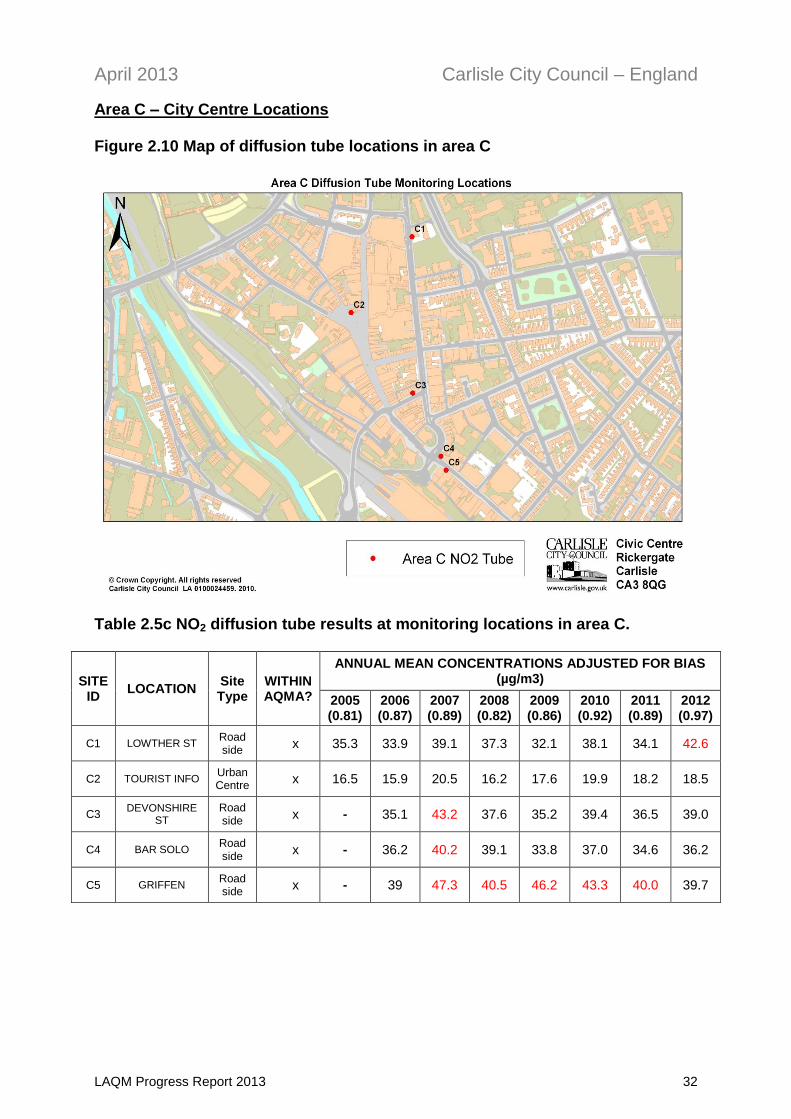
Area C – City Centre Locations Figure 2.10 Map of diffusion tube locations in area C
Table 2.5c NO2 diffusion tube results at monitoring locations in area C.
SITE ID
LOCATION Site Type
WITHIN AQMA?
ANNUAL MEAN CONCENTRATIONS ADJUSTED FOR BIAS (µg/m3)
2005 (0.81)
2006 (0.87)
2007 (0.89)
2008 (0.82)
2009 (0.86)
2010 (0.92)
2011 (0.89)
2012 (0.97)
C1 LOWTHER ST Road side
x 35.3 33.9 39.1 37.3 32.1 38.1 34.1 42.6
C2 TOURIST INFO Urban Centre
x 16.5 15.9 20.5 16.2 17.6 19.9 18.2 18.5
C3 DEVONSHIRE
ST Road side
x - 35.1 43.2 37.6 35.2 39.4 36.5 39.0
C4 BAR SOLO Road side
x - 36.2 40.2 39.1 33.8 37.0 34.6 36.2
C5 GRIFFEN Road side
x - 39 47.3 40.5 46.2 43.3 40.0 39.7
April 2013 Carlisle City Council – England
LAQM Progress Report 2013 33
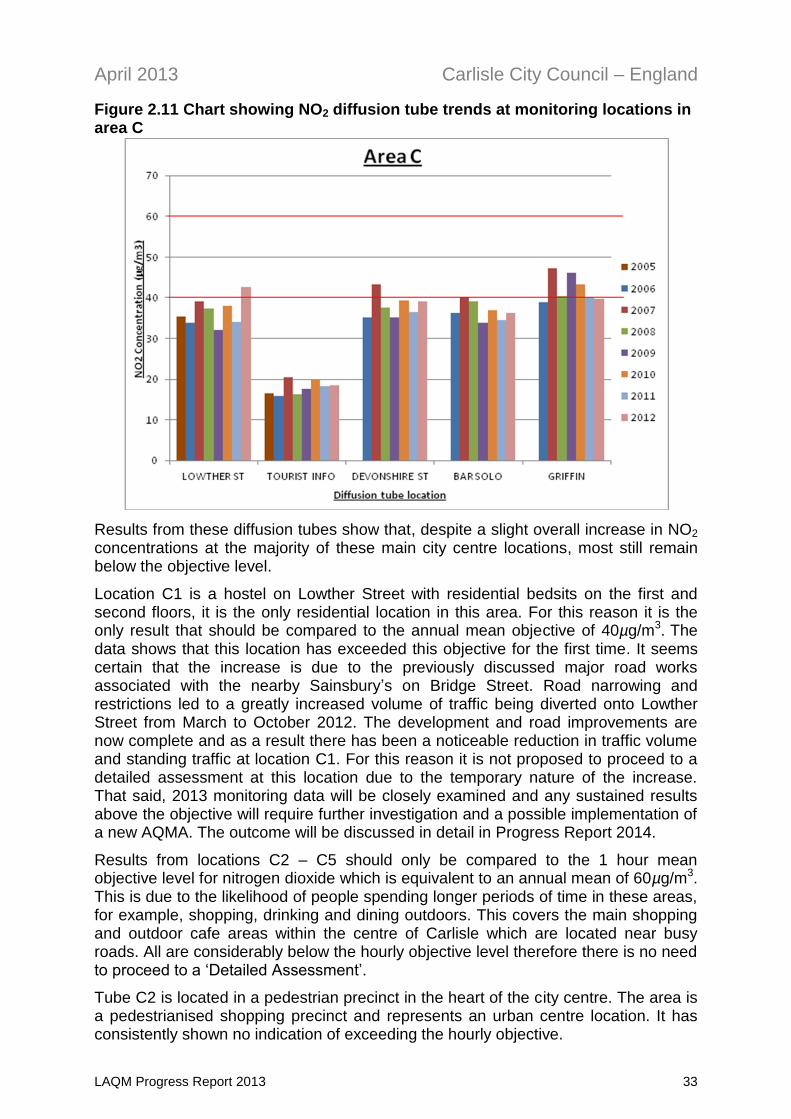
Figure 2.11 Chart showing NO2 diffusion tube trends at monitoring locations in area C
Results from these diffusion tubes show that, despite a slight overall increase in NO2 concentrations at the majority of these main city centre locations, most still remain below the objective level.
Location C1 is a hostel on Lowther Street with residential bedsits on the first and second floors, it is the only residential location in this area. For this reason it is the only result that should be compared to the annual mean objective of 40µg/m3. The data shows that this location has exceeded this objective for the first time. It seems certain that the increase is due to the previously discussed major road works associated with the nearby Sainsbury’s on Bridge Street. Road narrowing and restrictions led to a greatly increased volume of traffic being diverted onto Lowther Street from March to October 2012. The development and road improvements are now complete and as a result there has been a noticeable reduction in traffic volume and standing traffic at location C1. For this reason it is not proposed to proceed to a detailed assessment at this location due to the temporary nature of the increase. That said, 2013 monitoring data will be closely examined and any sustained results above the objective will require further investigation and a possible implementation of a new AQMA. The outcome will be discussed in detail in Progress Report 2014.
Results from locations C2 – C5 should only be compared to the 1 hour mean objective level for nitrogen dioxide which is equivalent to an annual mean of 60µg/m3.
This is due to the likelihood of people spending longer periods of time in these areas, for example, shopping, drinking and dining outdoors. This covers the main shopping and outdoor cafe areas within the centre of Carlisle which are located near busy roads. All are considerably below the hourly objective level therefore there is no need to proceed to a ‘Detailed Assessment’.
Tube C2 is located in a pedestrian precinct in the heart of the city centre. The area is a pedestrianised shopping precinct and represents an urban centre location. It has consistently shown no indication of exceeding the hourly objective.
April 2013 Carlisle City Council – England
LAQM Progress Report 2013 34
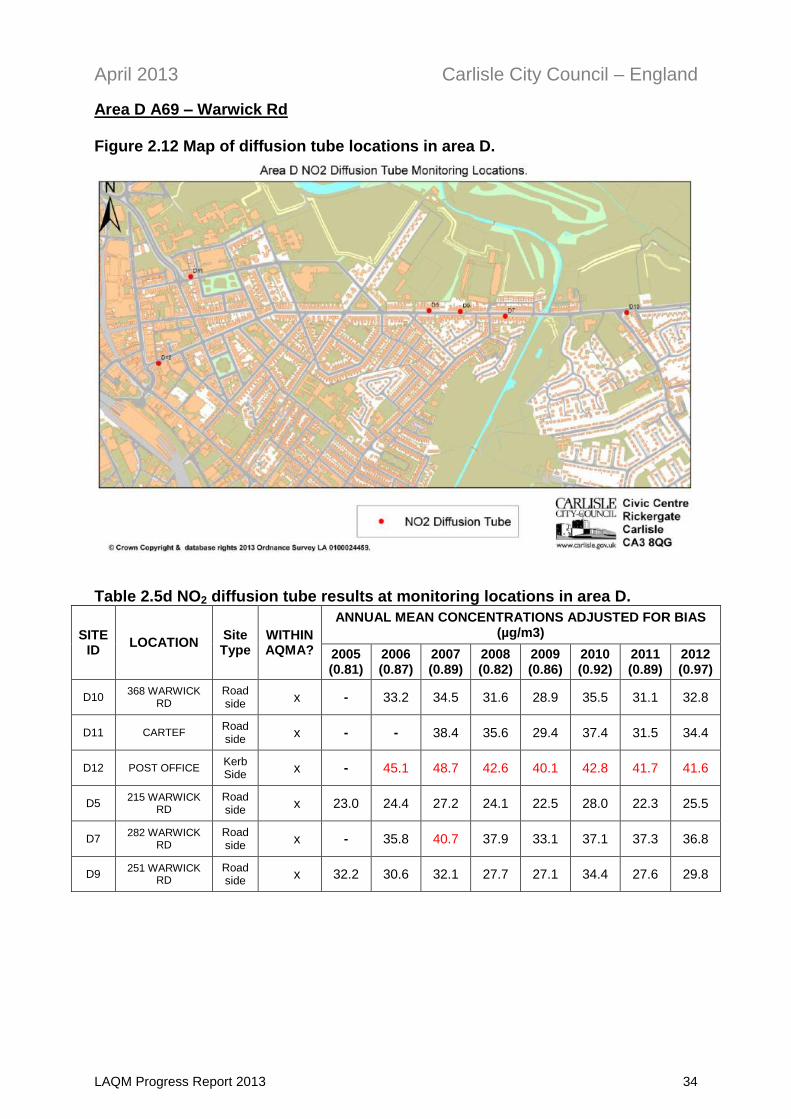
Area D A69 – Warwick Rd Figure 2.12 Map of diffusion tube locations in area D.
Table 2.5d NO2 diffusion tube results at monitoring locations in area D.
SITE ID
LOCATION Site Type
WITHIN AQMA?
ANNUAL MEAN CONCENTRATIONS ADJUSTED FOR BIAS (µg/m3)
2005 (0.81)
2006 (0.87)
2007 (0.89)
2008 (0.82)
2009 (0.86)
2010 (0.92)
2011 (0.89)
2012 (0.97)
D10 368 WARWICK
RD Road side
x - 33.2 34.5 31.6 28.9 35.5 31.1 32.8
D11 CARTEF Road side
x - - 38.4 35.6 29.4 37.4 31.5 34.4
D12 POST OFFICE Kerb Side
x - 45.1 48.7 42.6 40.1 42.8 41.7 41.6
D5 215 WARWICK
RD Road side
x 23.0 24.4 27.2 24.1 22.5 28.0 22.3 25.5
D7 282 WARWICK
RD Road side
x - 35.8 40.7 37.9 33.1 37.1 37.3 36.8
D9 251 WARWICK
RD Road side
x 32.2 30.6 32.1 27.7 27.1 34.4 27.6 29.8
April 2013 Carlisle City Council – England
LAQM Progress Report 2013 35
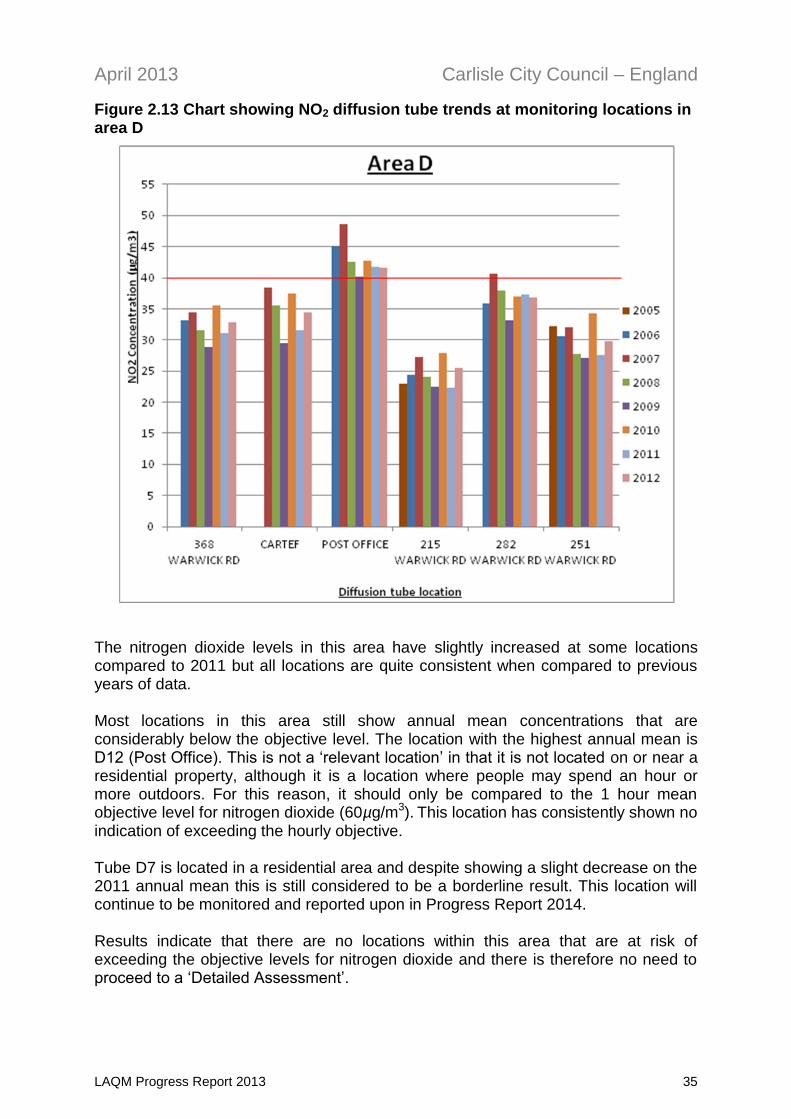
Figure 2.13 Chart showing NO2 diffusion tube trends at monitoring locations in area D
The nitrogen dioxide levels in this area have slightly increased at some locations compared to 2011 but all locations are quite consistent when compared to previous years of data. Most locations in this area still show annual mean concentrations that are considerably below the objective level. The location with the highest annual mean is D12 (Post Office). This is not a ‘relevant location’ in that it is not located on or near a residential property, although it is a location where people may spend an hour or more outdoors. For this reason, it should only be compared to the 1 hour mean objective level for nitrogen dioxide (60µg/m3). This location has consistently shown no indication of exceeding the hourly objective. Tube D7 is located in a residential area and despite showing a slight decrease on the 2011 annual mean this is still considered to be a borderline result. This location will continue to be monitored and reported upon in Progress Report 2014.
Results indicate that there are no locations within this area that are at risk of exceeding the objective levels for nitrogen dioxide and there is therefore no need to proceed to a ‘Detailed Assessment’.
April 2013 Carlisle City Council – England
LAQM Progress Report 2013 36
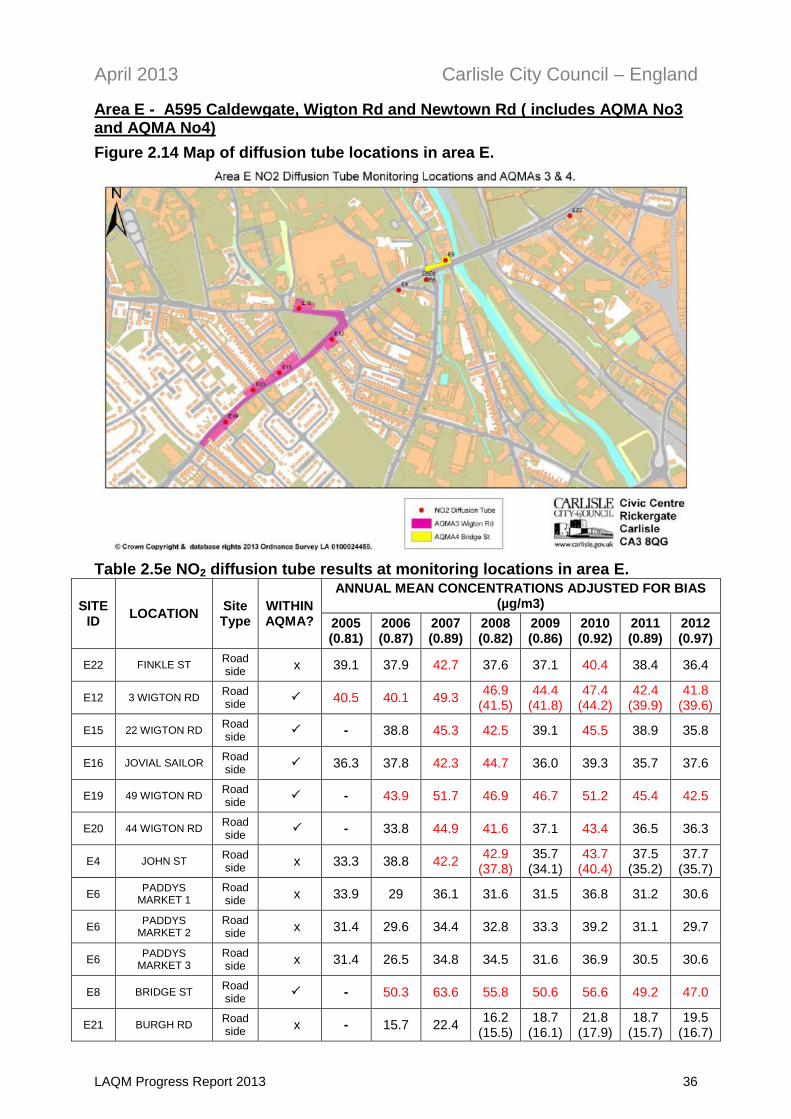
Area E - A595 Caldewgate, Wigton Rd and Newtown Rd ( includes AQMA No3 and AQMA No4)
Figure 2.14 Map of diffusion tube locations in area E.
Table 2.5e NO2 diffusion tube results at monitoring locations in area E.
SITE ID
LOCATION Site Type
WITHIN AQMA?
ANNUAL MEAN CONCENTRATIONS ADJUSTED FOR BIAS (µg/m3)
2005 (0.81)
2006 (0.87)
2007 (0.89)
2008 (0.82)
2009 (0.86)
2010 (0.92)
2011 (0.89)
2012 (0.97)
E22 FINKLE ST Road side
x 39.1 37.9 42.7 37.6 37.1 40.4 38.4 36.4
E12 3 WIGTON RD Road side
40.5 40.1 49.3 46.9
(41.5) 44.4
(41.8) 47.4
(44.2) 42.4
(39.9) 41.8
(39.6)
E15 22 WIGTON RD Road side
- 38.8 45.3 42.5 39.1 45.5 38.9 35.8
E16 JOVIAL SAILOR Road side
36.3 37.8 42.3 44.7 36.0 39.3 35.7 37.6
E19 49 WIGTON RD Road side
- 43.9 51.7 46.9 46.7 51.2 45.4 42.5
E20 44 WIGTON RD Road side
- 33.8 44.9 41.6 37.1 43.4 36.5 36.3
E4 JOHN ST Road side
x 33.3 38.8 42.2 42.9
(37.8) 35.7
(34.1) 43.7
(40.4) 37.5
(35.2) 37.7
(35.7)
E6 PADDYS
MARKET 1 Road side
x 33.9 29 36.1 31.6 31.5 36.8 31.2 30.6
E6 PADDYS
MARKET 2 Road side
x 31.4 29.6 34.4 32.8 33.3 39.2 31.1 29.7
E6 PADDYS
MARKET 3 Road side
x 31.4 26.5 34.8 34.5 31.6 36.9 30.5 30.6
E8 BRIDGE ST Road side
- 50.3 63.6 55.8 50.6 56.6 49.2 47.0
E21 BURGH RD Road side
x - 15.7 22.4 16.2
(15.5) 18.7
(16.1) 21.8
(17.9) 18.7
(15.7) 19.5
(16.7)
April 2013 Carlisle City Council – England
LAQM Progress Report 2013 37
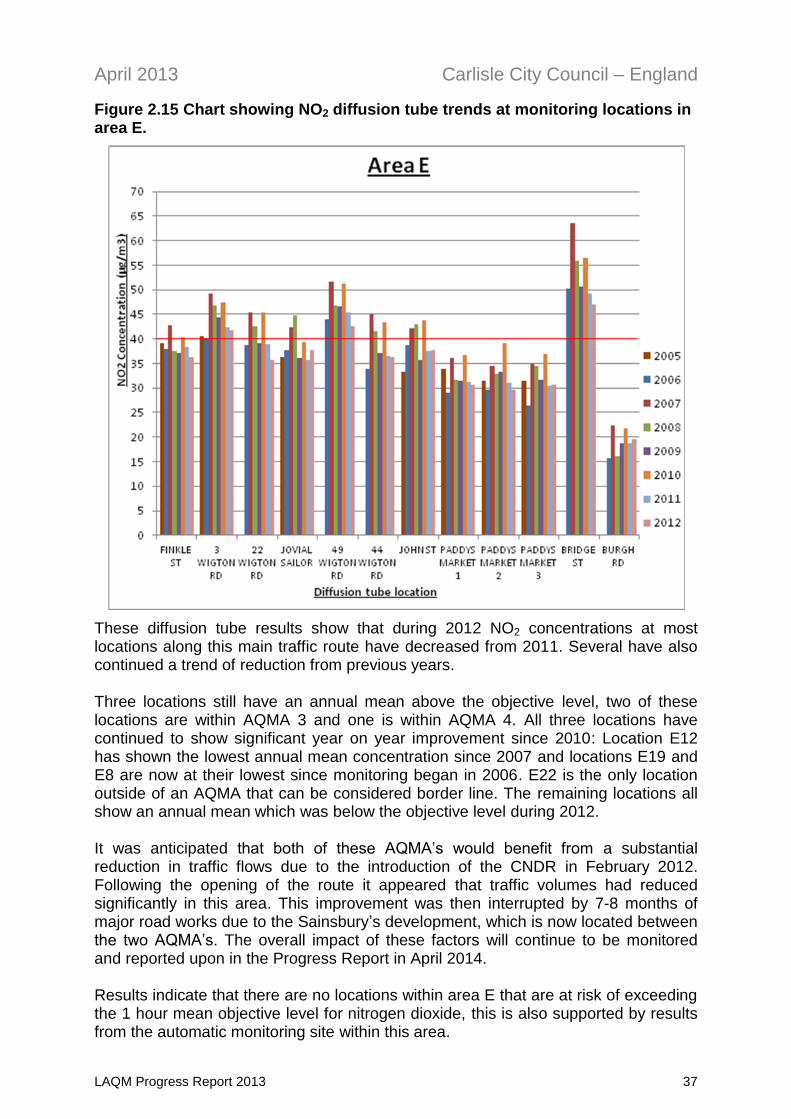
Figure 2.15 Chart showing NO2 diffusion tube trends at monitoring locations in area E.
These diffusion tube results show that during 2012 NO2 concentrations at most locations along this main traffic route have decreased from 2011. Several have also continued a trend of reduction from previous years. Three locations still have an annual mean above the objective level, two of these locations are within AQMA 3 and one is within AQMA 4. All three locations have continued to show significant year on year improvement since 2010: Location E12 has shown the lowest annual mean concentration since 2007 and locations E19 and E8 are now at their lowest since monitoring began in 2006. E22 is the only location outside of an AQMA that can be considered border line. The remaining locations all show an annual mean which was below the objective level during 2012. It was anticipated that both of these AQMA’s would benefit from a substantial reduction in traffic flows due to the introduction of the CNDR in February 2012. Following the opening of the route it appeared that traffic volumes had reduced significantly in this area. This improvement was then interrupted by 7-8 months of major road works due to the Sainsbury’s development, which is now located between the two AQMA’s. The overall impact of these factors will continue to be monitored and reported upon in the Progress Report in April 2014. Results indicate that there are no locations within area E that are at risk of exceeding the 1 hour mean objective level for nitrogen dioxide, this is also supported by results from the automatic monitoring site within this area.
April 2013 Carlisle City Council – England
LAQM Progress Report 2013 38
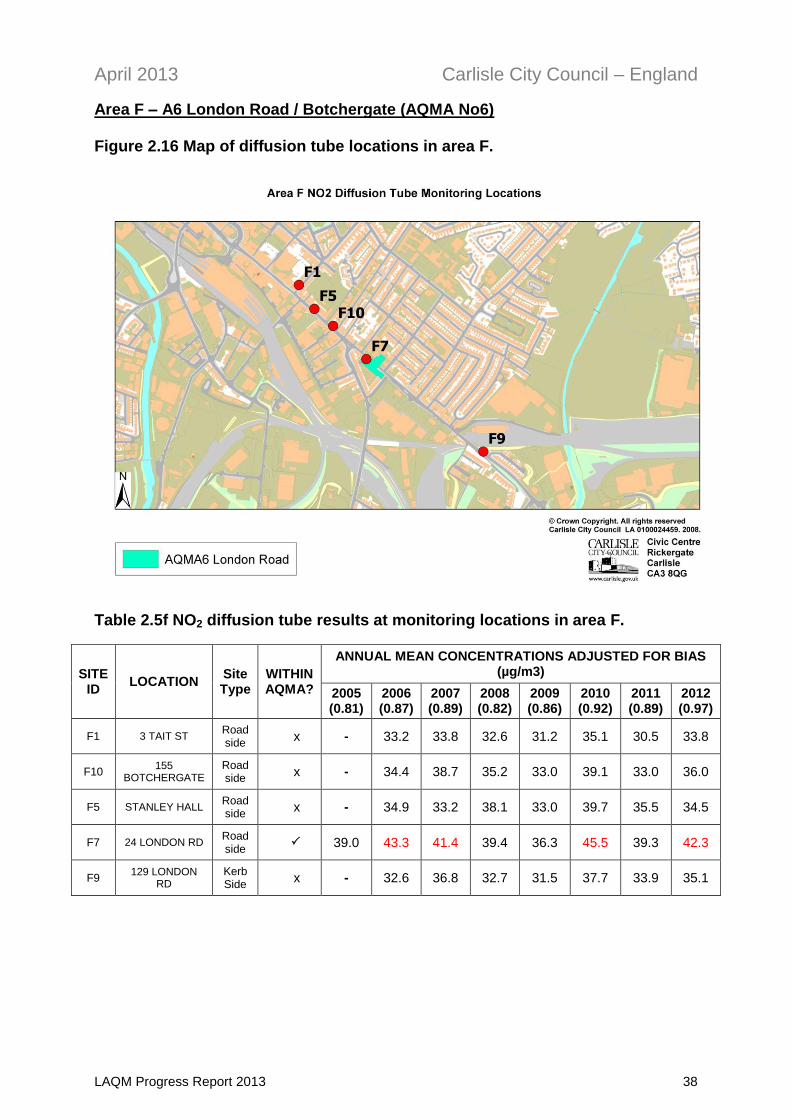
Area F – A6 London Road / Botchergate (AQMA No6) Figure 2.16 Map of diffusion tube locations in area F.
Table 2.5f NO2 diffusion tube results at monitoring locations in area F.
SITE ID
LOCATION Site Type
WITHIN AQMA?
ANNUAL MEAN CONCENTRATIONS ADJUSTED FOR BIAS (µg/m3)
2005 (0.81)
2006 (0.87)
2007 (0.89)
2008 (0.82)
2009 (0.86)
2010 (0.92)
2011 (0.89)
2012 (0.97)
F1 3 TAIT ST Road side
x - 33.2 33.8 32.6 31.2 35.1 30.5 33.8
F10 155
BOTCHERGATE Road side
x - 34.4 38.7 35.2 33.0 39.1 33.0 36.0
F5 STANLEY HALL Road side
x - 34.9 33.2 38.1 33.0 39.7 35.5 34.5
F7 24 LONDON RD Road side
39.0 43.3 41.4 39.4 36.3 45.5 39.3 42.3
F9 129 LONDON
RD Kerb Side
x - 32.6 36.8 32.7 31.5 37.7 33.9 35.1
April 2013 Carlisle City Council – England
LAQM Progress Report 2013 39
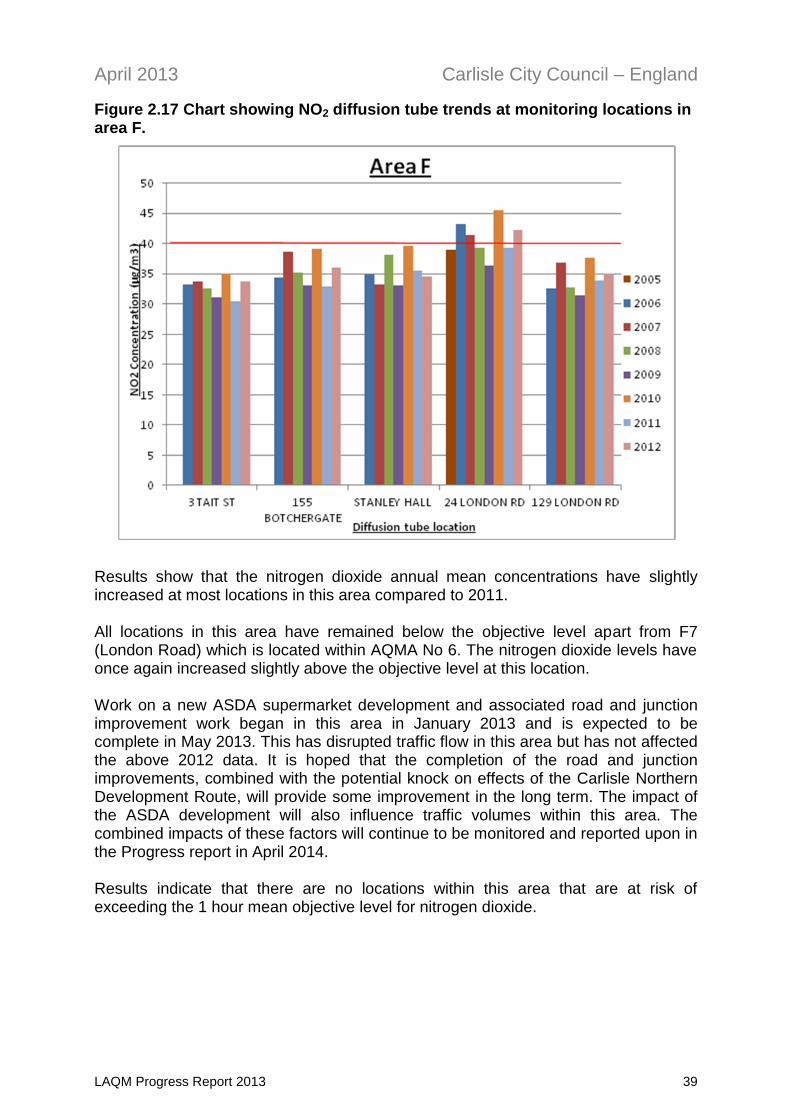
Figure 2.17 Chart showing NO2 diffusion tube trends at monitoring locations in area F.
Results show that the nitrogen dioxide annual mean concentrations have slightly increased at most locations in this area compared to 2011. All locations in this area have remained below the objective level apart from F7 (London Road) which is located within AQMA No 6. The nitrogen dioxide levels have once again increased slightly above the objective level at this location. Work on a new ASDA supermarket development and associated road and junction improvement work began in this area in January 2013 and is expected to be complete in May 2013. This has disrupted traffic flow in this area but has not affected the above 2012 data. It is hoped that the completion of the road and junction improvements, combined with the potential knock on effects of the Carlisle Northern Development Route, will provide some improvement in the long term. The impact of the ASDA development will also influence traffic volumes within this area. The combined impacts of these factors will continue to be monitored and reported upon in the Progress report in April 2014. Results indicate that there are no locations within this area that are at risk of exceeding the 1 hour mean objective level for nitrogen dioxide.
April 2013 Carlisle City Council – England
LAQM Progress Report 2013 40
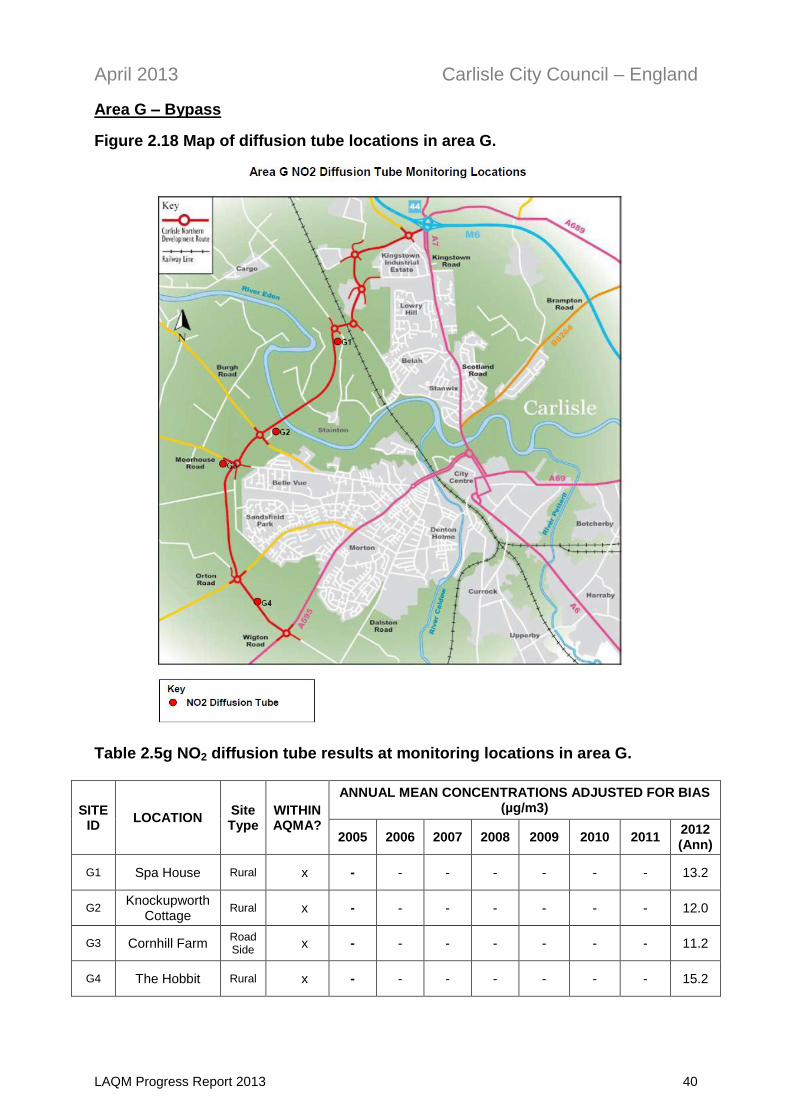
Area G – Bypass
Figure 2.18 Map of diffusion tube locations in area G.
Table 2.5g NO2 diffusion tube results at monitoring locations in area G.
SITE ID
LOCATION Site Type
WITHIN AQMA?
ANNUAL MEAN CONCENTRATIONS ADJUSTED FOR BIAS (µg/m3)
2005 2006 2007 2008 2009 2010 2011 2012 (Ann)
G1 Spa House Rural x - - - - - - - 13.2
G2 Knockupworth
Cottage Rural x - - - - - - - 12.0
G3 Cornhill Farm Road Side
x - - - - - - - 11.2
G4 The Hobbit Rural x - - - - - - - 15.2
April 2013 Carlisle City Council – England
LAQM Progress Report 2013 41
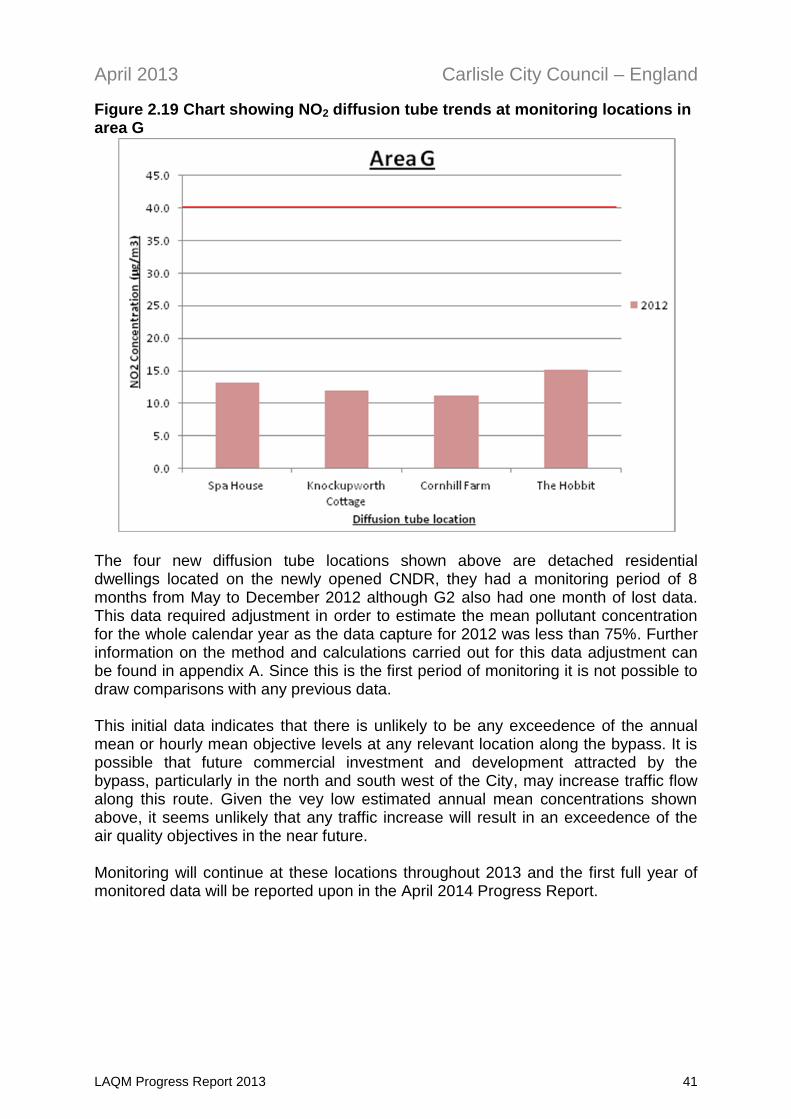
Figure 2.19 Chart showing NO2 diffusion tube trends at monitoring locations in area G
The four new diffusion tube locations shown above are detached residential dwellings located on the newly opened CNDR, they had a monitoring period of 8 months from May to December 2012 although G2 also had one month of lost data. This data required adjustment in order to estimate the mean pollutant concentration for the whole calendar year as the data capture for 2012 was less than 75%. Further information on the method and calculations carried out for this data adjustment can be found in appendix A. Since this is the first period of monitoring it is not possible to draw comparisons with any previous data. This initial data indicates that there is unlikely to be any exceedence of the annual mean or hourly mean objective levels at any relevant location along the bypass. It is possible that future commercial investment and development attracted by the bypass, particularly in the north and south west of the City, may increase traffic flow along this route. Given the vey low estimated annual mean concentrations shown above, it seems unlikely that any traffic increase will result in an exceedence of the air quality objectives in the near future. Monitoring will continue at these locations throughout 2013 and the first full year of monitored data will be reported upon in the April 2014 Progress Report.
April 2013 Carlisle City Council – England
LAQM Progress Report 2013 42
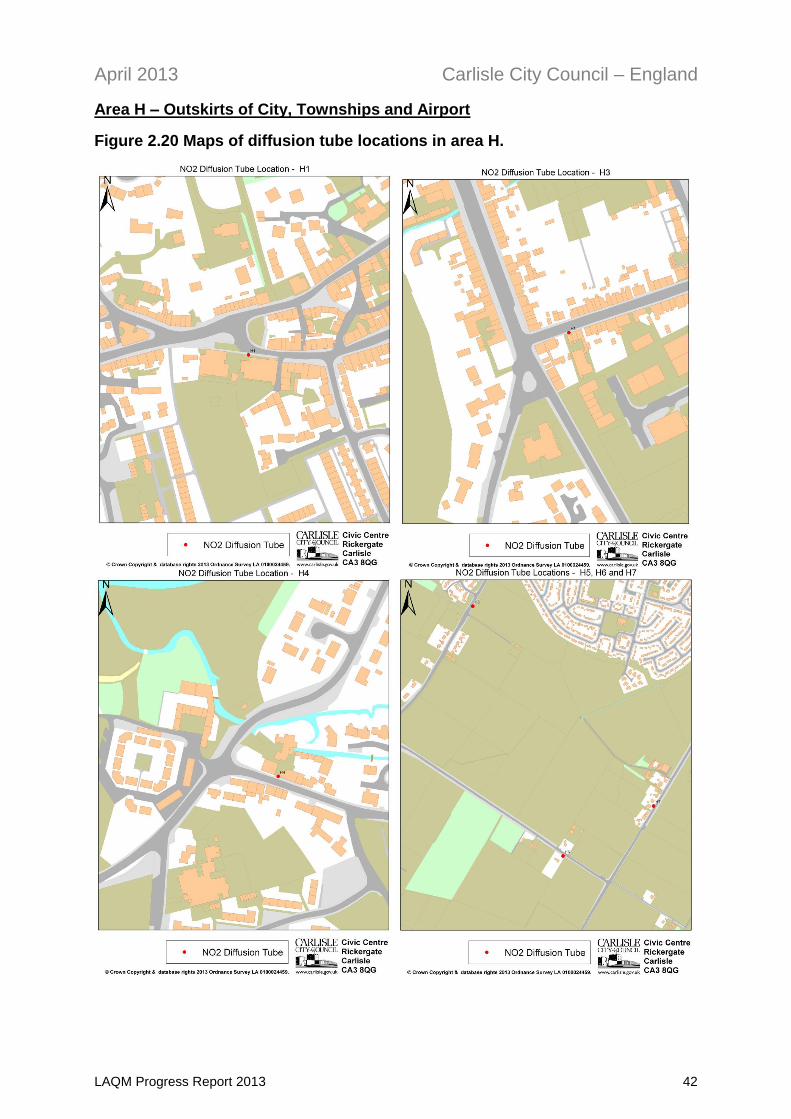
Area H – Outskirts of City, Townships and Airport
Figure 2.20 Maps of diffusion tube locations in area H.
April 2013 Carlisle City Council – England
LAQM Progress Report 2013 43
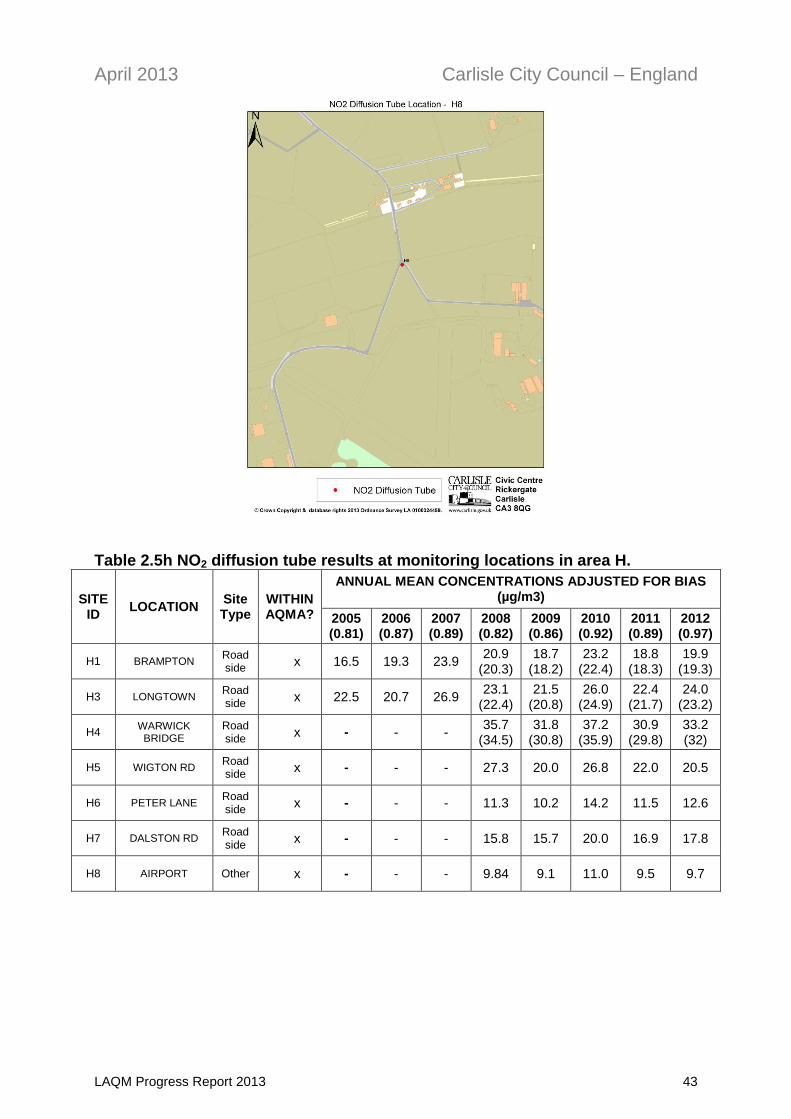
Table 2.5h NO2 diffusion tube results at monitoring locations in area H.
SITE ID
LOCATION Site Type
WITHIN AQMA?
ANNUAL MEAN CONCENTRATIONS ADJUSTED FOR BIAS (µg/m3)
2005 (0.81)
2006 (0.87)
2007 (0.89)
2008 (0.82)
2009 (0.86)
2010 (0.92)
2011 (0.89)
2012 (0.97)
H1 BRAMPTON Road side
x 16.5 19.3 23.9 20.9
(20.3) 18.7
(18.2) 23.2
(22.4) 18.8
(18.3) 19.9
(19.3)
H3 LONGTOWN Road side
x 22.5 20.7 26.9 23.1
(22.4) 21.5
(20.8) 26.0
(24.9) 22.4
(21.7) 24.0
(23.2)
H4 WARWICK BRIDGE
Road side
x - - - 35.7
(34.5) 31.8
(30.8) 37.2
(35.9) 30.9
(29.8) 33.2 (32)
H5 WIGTON RD Road side
x - - - 27.3 20.0 26.8 22.0 20.5
H6 PETER LANE Road side
x - - - 11.3 10.2 14.2 11.5 12.6
H7 DALSTON RD Road side
x - - - 15.8 15.7 20.0 16.9 17.8
H8 AIRPORT Other x - - - 9.84 9.1 11.0 9.5 9.7
April 2013 Carlisle City Council – England
LAQM Progress Report 2013 44
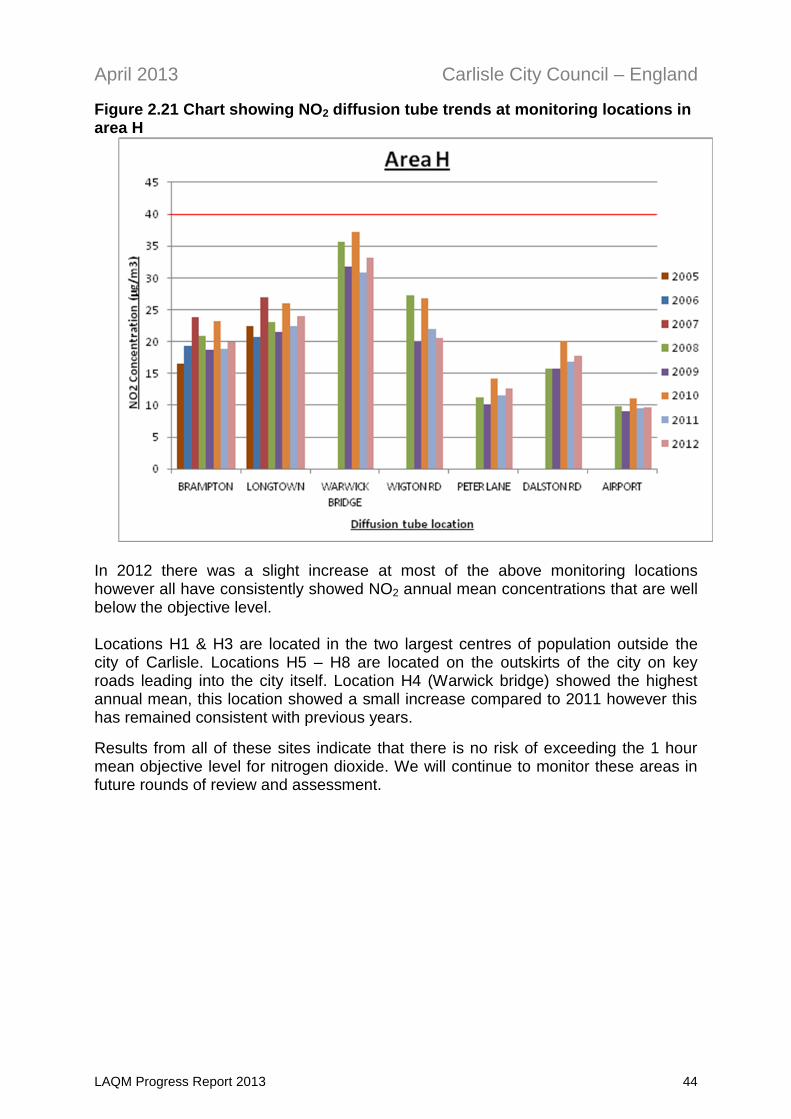
Figure 2.21 Chart showing NO2 diffusion tube trends at monitoring locations in area H
In 2012 there was a slight increase at most of the above monitoring locations however all have consistently showed NO2 annual mean concentrations that are well below the objective level. Locations H1 & H3 are located in the two largest centres of population outside the city of Carlisle. Locations H5 – H8 are located on the outskirts of the city on key roads leading into the city itself. Location H4 (Warwick bridge) showed the highest annual mean, this location showed a small increase compared to 2011 however this has remained consistent with previous years.
Results from all of these sites indicate that there is no risk of exceeding the 1 hour mean objective level for nitrogen dioxide. We will continue to monitor these areas in future rounds of review and assessment.
April 2013 Carlisle City Council – England
LAQM Progress Report 2013 45
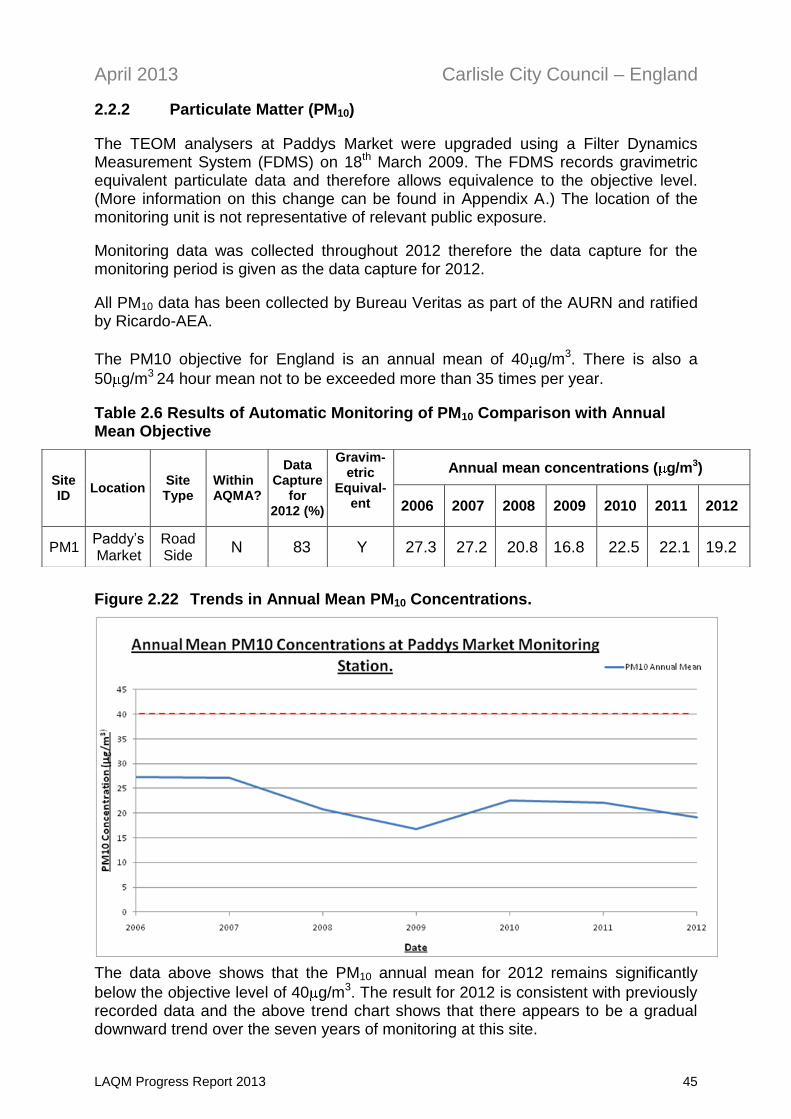
2.2.2 Particulate Matter (PM10)
The TEOM analysers at Paddys Market were upgraded using a Filter Dynamics Measurement System (FDMS) on 18th March 2009. The FDMS records gravimetric equivalent particulate data and therefore allows equivalence to the objective level. (More information on this change can be found in Appendix A.) The location of the monitoring unit is not representative of relevant public exposure.
Monitoring data was collected throughout 2012 therefore the data capture for the monitoring period is given as the data capture for 2012.
All PM10 data has been collected by Bureau Veritas as part of the AURN and ratified by Ricardo-AEA.
The PM10 objective for England is an annual mean of 40 g/m3. There is also a
50 g/m3 24 hour mean not to be exceeded more than 35 times per year.
Table 2.6 Results of Automatic Monitoring of PM10 Comparison with Annual Mean Objective
Figure 2.22 Trends in Annual Mean PM10 Concentrations.
The data above shows that the PM10 annual mean for 2012 remains significantly
below the objective level of 40 g/m3. The result for 2012 is consistent with previously recorded data and the above trend chart shows that there appears to be a gradual downward trend over the seven years of monitoring at this site.
Site ID
Location Site Type
Within AQMA?
Data Capture
for 2012 (%)
Gravim-etric
Equival-ent
Annual mean concentrations ( g/m3)
2006 2007 2008 2009 2010 2011 2012
PM1 Paddy’s Market
Road Side
N 83 Y 27.3 27.2 20.8 16.8 22.5 22.1 19.2
April 2013 Carlisle City Council – England
LAQM Progress Report 2013 46
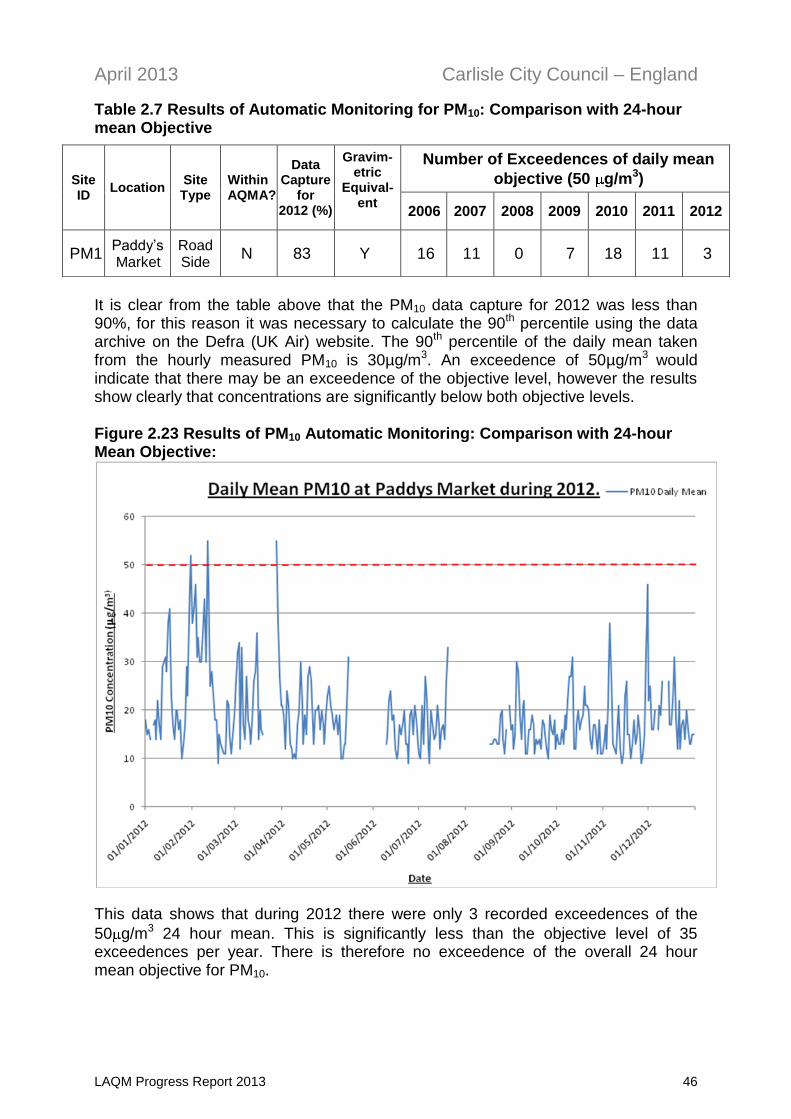
Table 2.7 Results of Automatic Monitoring for PM10: Comparison with 24-hour mean Objective
It is clear from the table above that the PM10 data capture for 2012 was less than 90%, for this reason it was necessary to calculate the 90th percentile using the data archive on the Defra (UK Air) website. The 90th percentile of the daily mean taken from the hourly measured PM10 is 30µg/m3. An exceedence of 50µg/m3 would indicate that there may be an exceedence of the objective level, however the results show clearly that concentrations are significantly below both objective levels. Figure 2.23 Results of PM10 Automatic Monitoring: Comparison with 24-hour Mean Objective:
This data shows that during 2012 there were only 3 recorded exceedences of the
50 g/m3 24 hour mean. This is significantly less than the objective level of 35 exceedences per year. There is therefore no exceedence of the overall 24 hour mean objective for PM10.
Site ID
Location Site Type
Within AQMA?
Data Capture
for 2012 (%)
Gravim-etric
Equival-ent
Number of Exceedences of daily mean
objective (50 g/m3)
2006 2007 2008 2009 2010 2011 2012
PM1 Paddy’s Market
Road Side
N 83 Y 16 11 0 7 18 11 3
April 2013 Carlisle City Council – England
LAQM Progress Report 2013 47
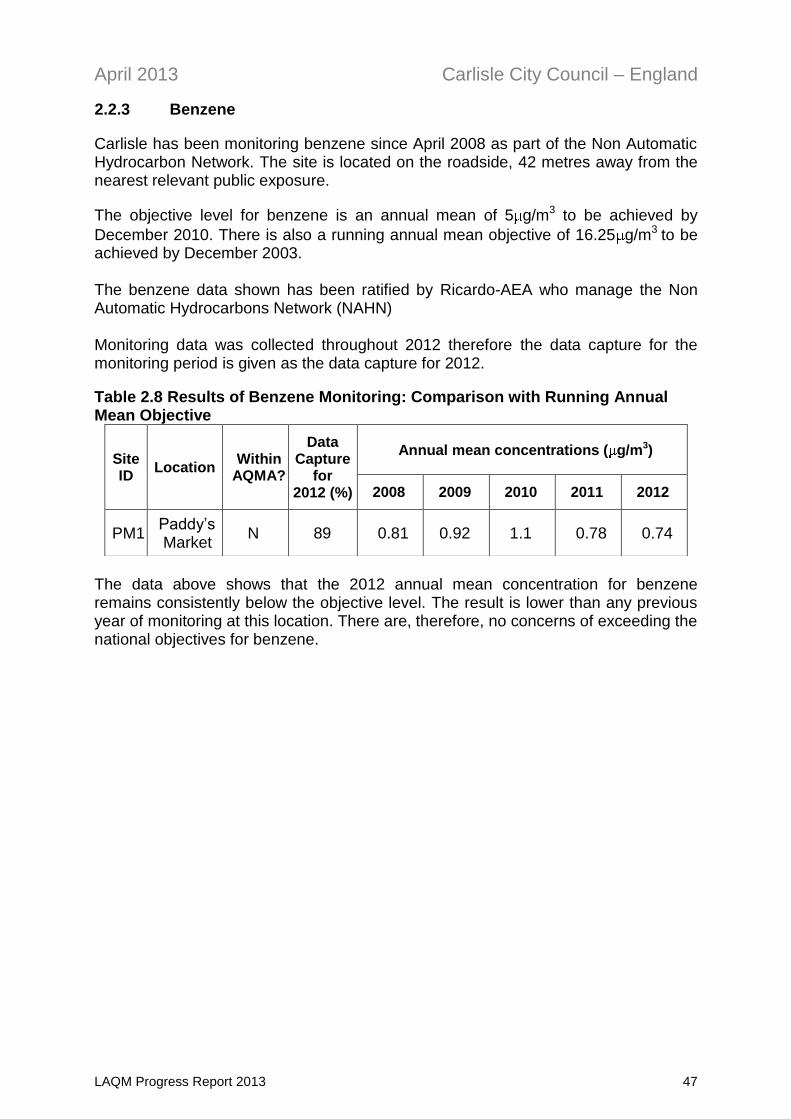
2.2.3 Benzene
Carlisle has been monitoring benzene since April 2008 as part of the Non Automatic Hydrocarbon Network. The site is located on the roadside, 42 metres away from the nearest relevant public exposure.
The objective level for benzene is an annual mean of 5 g/m3 to be achieved by
December 2010. There is also a running annual mean objective of 16.25 g/m3 to be achieved by December 2003. The benzene data shown has been ratified by Ricardo-AEA who manage the Non Automatic Hydrocarbons Network (NAHN) Monitoring data was collected throughout 2012 therefore the data capture for the monitoring period is given as the data capture for 2012.
Table 2.8 Results of Benzene Monitoring: Comparison with Running Annual Mean Objective
The data above shows that the 2012 annual mean concentration for benzene remains consistently below the objective level. The result is lower than any previous year of monitoring at this location. There are, therefore, no concerns of exceeding the national objectives for benzene.
Site ID
Location Within
AQMA?
Data Capture
for 2012 (%)
Annual mean concentrations ( g/m3)
2008 2009 2010 2011 2012
PM1 Paddy’s Market
N 89 0.81 0.92 1.1 0.78 0.74
April 2013 Carlisle City Council – England
LAQM Progress Report 2013 48
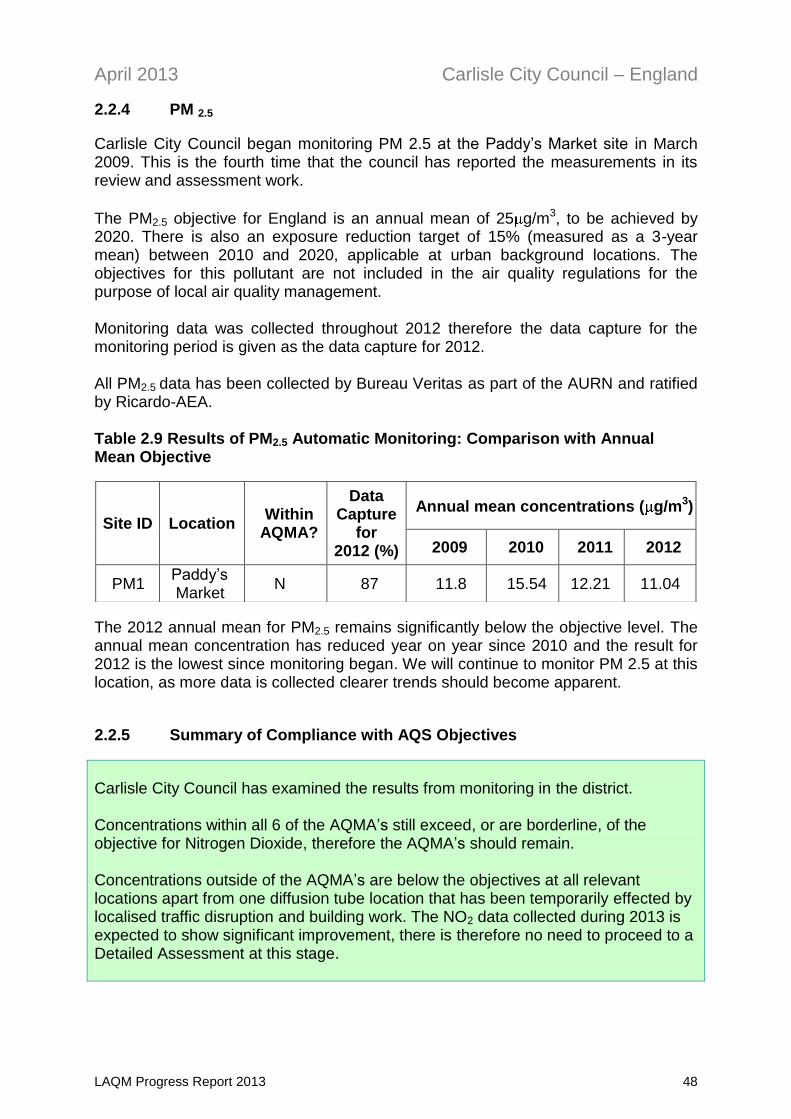
2.2.4 PM 2.5
Carlisle City Council began monitoring PM 2.5 at the Paddy’s Market site in March 2009. This is the fourth time that the council has reported the measurements in its review and assessment work.
The PM2.5 objective for England is an annual mean of 25 g/m3, to be achieved by 2020. There is also an exposure reduction target of 15% (measured as a 3-year mean) between 2010 and 2020, applicable at urban background locations. The objectives for this pollutant are not included in the air quality regulations for the purpose of local air quality management. Monitoring data was collected throughout 2012 therefore the data capture for the monitoring period is given as the data capture for 2012. All PM2.5 data has been collected by Bureau Veritas as part of the AURN and ratified by Ricardo-AEA. Table 2.9 Results of PM2.5 Automatic Monitoring: Comparison with Annual Mean Objective
The 2012 annual mean for PM2.5 remains significantly below the objective level. The annual mean concentration has reduced year on year since 2010 and the result for 2012 is the lowest since monitoring began. We will continue to monitor PM 2.5 at this location, as more data is collected clearer trends should become apparent.
2.2.5 Summary of Compliance with AQS Objectives
Carlisle City Council has examined the results from monitoring in the district. Concentrations within all 6 of the AQMA’s still exceed, or are borderline, of the objective for Nitrogen Dioxide, therefore the AQMA’s should remain. Concentrations outside of the AQMA’s are below the objectives at all relevant locations apart from one diffusion tube location that has been temporarily effected by localised traffic disruption and building work. The NO2 data collected during 2013 is expected to show significant improvement, there is therefore no need to proceed to a Detailed Assessment at this stage.
Site ID Location Within
AQMA?
Data Capture
for 2012 (%)
Annual mean concentrations ( g/m3)
2009 2010 2011 2012
PM1 Paddy’s Market
N 87 11.8 15.54 12.21 11.04
April 2013 Carlisle City Council – England
LAQM Progress Report 2013 49
3 New Local Developments
DEFRA guidance requires that details of new local developments, that might affect local air quality, are included in the Progress Report. New developments which were covered in previous rounds of review and assessment have, in some cases, been included. Any update on progress with these developments is given, where appropriate. These new developments are considered under the following categories:
3.1 Road Traffic Sources
There have been a number of minor changes to roads in the district, in particular changes to junctions to allow increased traffic flows associated with new developments or to reduce the volume of standing traffic. The following summarises the changes since Updating and Screening Assessment 2012.
There are no new narrow congested streets with residential properties close to the kerb.
There are no new busy streets where people may spend one hour or more close to traffic.
There are no new roads with a high flow of buses and/or HGVs.
There are no new bus or coach stations.
There have been two significant new developments to road junctions within the city, these include:
o The junction changes to allow access to the new Sainsbury’s supermarket and petrol filling station on Bridge Street. This development was completed in October 2012 after around 8 months of work. The road is now wider with additional lanes and improved traffic signals. Traffic disruption has now ended and overall congestion in this area appears to have improved. The impact of this change on nearby AQMA’s 3 and 4 will continue to be monitored.
o Works on the new ASDA development and associated junction on London Road will continue throughout May 2013. Works include removal of the existing traffic signals on the junction with Grey Street and the introduction of new signals at the entrance to the retail park. The new signalling system will incorporate a pedestrian crossing and the road layout will provide additional lanes. This change is expected to impact AQMA 6 in that it will potentially increase the number of vehicles using this road but the new layout will hopefully ease congestion. Removal of the old traffic signals adjacent to AQMA 6 should significantly reduce the number of standing vehicles in this location.
There has been one major new road development; the CNDR. This has been the most significant recent change in the road network and it was completed in February 2012. The road development was considered in detail in the Updating and Screening Assessment 2012 and continues to be monitored as part of the diffusion tube network.
April 2013 Carlisle City Council – England
LAQM Progress Report 2013 50
There are no other new roads constructed or proposed since the Updating and Screening Assessment in 2012 other than minor roads associated with new residential developments.
3.2 Other Transport Sources
As well as road vehicles, public exposure to emissions from planes, buses, trains, ships etc must also be considered. The following summarises the changes since the last Updating and Screening Assessment in 2012:
There are no new locations where diesel or steam trains are regularly stationary for periods of 15 minutes or more, with potential for relevant exposure within 15m.
There are no new locations with a large number of movements of diesel locomotives, and potential long-term relevant exposure within 30m.
Carlisle City Council has no ports for shipping.
Carlisle City Council does have an airport in the district. As discussed in previous rounds of review and assessment there have been various applications made to develop the airport and negotiations have been ongoing over recent years. The current plans relate to development of the airport, including the improvement of runways and buildings to include warehousing, hangers and improvements to the passenger terminal. The plans have now been approved by Carlisle City Council and have gone to a judicial review due to opposition from residents of a nearby village. Essentially the airport itself remains unchanged and it still operates as a small runway for light passenger/pleasure aircraft. Any further changes to the airport will be re-examined in the next round of review and assessment.
3.3 Industrial Sources
For the purpose of this section of the report it is necessary to look at new or changed industrial sources of air pollution. The following summarises the changes since the last updating and screening assessment in 2009:
There are no new or proposed installations for which an air quality assessment has been carried out.
There are no existing installations where emissions have increased substantially or new relevant exposure has been introduced.
There are no new or significantly changed installations without a previous air quality assessment.
There are no new major fuel storage depots storing petrol.
There is one new petrol station which opened in the district in October 2012. The petrol station was introduced as part of the new Sainsbury’s development on Bridge Street. This part B permitted process is expected to have an annual throughput of 1000 – 3499m3 of petrol and incorporates both stage 1 and 2 vapour recovery. It is located between AQMA’s 3 and 4 directly opposite the Paddy’s Market automatic analyser on Castle Way.
There are no newly permitted poultry farms since April 2012.
April 2013 Carlisle City Council – England
LAQM Progress Report 2013 51
3.4 Commercial and Domestic Sources
For the purpose of this section of the report it is necessary to look at new or changed commercial & domestic sources of air pollution. The following summarises the changes since the last updating and screening assessment in 2012:
There are no new significant individual biomass combustion plants. Guidance suggests that consideration needs to be given to biomass combustion installations in the range of 50KW-20MW. There are no new installations of this size in the district.
There are no new areas where the combined impact of several biomass combustion sources may be relevant.
There are no new areas where domestic solid fuel burning may be relevant, however the council is in receipt of an increased number of enquiries regarding the installation of wood burning and multi fuel stoves. This also includes the installation of exempt appliances in smoke control areas and the use of exempt smokeless fuel. This is a trend that appears to cover the whole of the city and it is difficult therefore to quantify the combined effects on air quality from such sources.
3.5 New Developments with Fugitive or Uncontrolled Sources
For the purpose of this section of the report it is necessary to look at new developments with uncontrolled or fugitive sources of air pollution. The following summarises the changes since the last updating and screening assessment in 2012:
There are no new landfill sites.
There are no new quarries.
There are no new unmade haulage roads on industrial sites.
There are no new waste transfer stations established in the district.
There are no other new potential sources of fugitive particulate emissions.
Carlisle City Council confirms that there are no new or newly identified local developments which may have an impact on air quality within the Local Authority area. Carlisle City Council confirms that all the following have been considered:
Road traffic sources
Other transport sources
Industrial sources
Commercial and domestic sources
New developments with fugitive or uncontrolled sources.
April 2013 Carlisle City Council – England
LAQM Progress Report 2013 52
4 Planning Applications
Since 1st April 2012 Carlisle City Council has received applications for a whole range of new developments, most of which are small and insignificant in terms of air quality impacts. There are also a number of major new developments that have been granted permission or are currently being considered by the planning department. Some of the developments below were included in previous rounds of review and assessment and in these cases details of any application decisions or amended proposals are given:
Morton Development The original application made in May 2009 was for the proposed development of land for a maximum of 825 residential dwellings, 40000 m2 of floor space used for employment, such as offices and warehousing, as well as public open spaces.
The proposed location is open agricultural land at Morton bounded by Peter Lane, Wigton Road and Dalston Road, the North-Eastern boundary backs onto existing suburban residential properties. It would be located right on the edge of the city, to the West, in an area which is predominantly residential. (See appendix D for map). The outline application has been granted, at committee, subject to legal agreement.
Since the original application subsequent applications have been submitted for adjacent locations in this area of the city:
In October 2010 an application was received for further development, on adjoining land to the North of the original proposal, adjacent to Wigton Road and South of Ellesmere Way. This comprises a retail food store, petrol filling station, crèche, restaurant/cafe and take-away, with associated car parking and landscaping. A decision was made by committee to grant the outline application in 2010. It has now been announced that Tesco will be opening on the site and the final detail of the application or reserved matters are expected to be received by the planning department at the end of May 2013. (See appendix D for map).
A further outline application was received in April 2011 for a residential development consisting of 103 new homes. The proposal is located toward the South East corner of the original development site, on land adjacent to Peter Lane and bounded by Dalston Road, Peter Lane and Newby West. The outline application was granted and a decision is currently being made as to the reserved matters which were received in October 2012. (See appendix D for map).
A final application has been received in November 2010 and relates to the Garden Village area of Morton. The application comprises the erection of 253 dwellings, associated access, parking, engineering works and landscaping. This is located to the West of the original site on the opposite side of Wigton Road. The application was granted and construction work has now started. (See appendix D for map).
An Air Quality Impact Assessment (EIA) has been submitted as part of each of the first two applications detailed above (original 825 residential properties and the Ellesmere Way supermarket project). Consideration was made as to the combined impact of the above proposals as they are all in close proximity to one another,
April 2013 Carlisle City Council – England
LAQM Progress Report 2013 53
together they combine to make the Morton master plan. For this reason the latter two smaller residential proposals were called in by the Secretary of State who determined that neither was sufficient to warrant an EIA as part of the planning process.
Tube H5 was placed on the roadside at the proposed entrance to the original site in 2008 when the application was first rumoured. Since then the annual mean for NO2 at this location has remained significantly below the objective. Other tubes that have been positioned adjacent to the site include H6 and H7 both of which are also consistently well below the objective level.
The air quality impacts of these developments are uncertain. Traffic flow along Wigton Road (AQMA 3) could increase due to the increased density of the population in the area. At the same time the supermarket would have a large catchment in the west and rural areas reducing the need for journeys into the city centre for shopping purposes. The site entrance is planned to be right next to a junction onto the CNDR which is likely to direct much of the traffic flow around the city bypass.
Carlisle Lake District Airport As discussed in previous rounds of review and assessment there have been various applications made to develop the airport and negotiations have been ongoing over recent years. The current plans include the development of a distribution centre inclusive of air freight and road haulage, integrated chillers, workshops, offices, a gatehouse, new access, auxiliary fire station and a raised re-profiled runway. A new expanded Environmental Impact Assessment containing an Air Quality Impact Assessment was submitted as part of the proposal. The plans have now been approved by Carlisle City Council in February 2013 but have now gone to a judicial review due to opposition from residents. (See appendix D for map).
Tube H8 was placed on the roadside near to the existing site entrance in 2008 when it became clear that expansion was a possibility. Since then the annual mean for NO2 at this location has been consistently below the objective and this year showed a 9.7µg/m3 annual mean.
Crindledyke Development This application was submitted in July 2009 for the proposed development of a maximum of 950 residential properties, ancillary local community facilities; including a school, a community building and open public space. The total area of the site is 29.08 hectares. This development is proposed for open land at Crindledyke bounded by the North West mainline, the M6 and Kingmoor industrial estate. It would be located in an area which is semi rural farmland to the North West of the city. (See appendix D for map).
An Air Quality Impact Assessment as been submitted as part of an Environmental Impact assessment. The EIA was considered unsatisfactory as it did not take into consideration the combined impacts of other new local developments. An amended assessment was submitted. The application has now been granted subject to legal agreement and work has started on phase 1 of construction. Hammonds Pond Development This application was submitted in September 2012 for the proposed development of 318 residential properties and associated open space and infrastructure. The development is proposed for land bounded by Hammonds Pond, Oaklands Drive and
April 2013 Carlisle City Council – England
LAQM Progress Report 2013 54
Durdar Road, which is on the southern fringe of the city. The application is in consultation phase and will be discussed in the development control committee meeting in July 2013. (See appendix D for map). Dalston Development This application was submitted in October 2012 for the proposed erection of 125 dwellings, associated open space and infrastructure. The site is located on land between Townhead Road and Station Road in the village of Dalston, 5 miles outside Carlisle. The area currently has no air quality concerns. The application is in consultation phase and will be discussed in the development control committee meeting in June 2013. (See appendix D for map). Smithfield Poultry Breeding Unit This application was submitted in May 2012 for the proposed erection of a 5990m3 poultry breeding unit for egg and hatchling production, with a maximum of 22880 birds. It also includes the siting of an agricultural worker's mobile home, engineering works and landscaping. The development is proposed for land between A6071 and U1084 in the village of Smithfield, 8 miles outside Carlisle. This application has been granted. (See appendix D for map). Biomass Boilers New applications relating to biomass boilers have been received from two rural schools in the last year. Stone Raise Primary School (109KW) has been approved and is expected to be installed during the summer holidays of 2013. Another application from Lanercost Primary School (45KW) has been received, however a decision has not yet been reached. In both cases stack heights have been considered by Environmental Health and discussed with planners at the County Council using Technical Guidance (09) Box 5.8.
April 2013 Carlisle City Council – England
LAQM Progress Report 2013 55
5 Air Quality Planning Policies
Land use planning has a significant role to play in improving and protecting air quality within the city. Planning decisions can have a significant, long term impact on travel behaviour and traffic levels. The City Council through its function as a planning authority, can influence new development to ensure that it is designed and located so as to reduce the need to travel. It may also influence a range of travel options encouraging alternatives to car use in accordance with national policy. The integration of land use, transport and highways is key to the Council facilitating delivery of sustainability. Carlisle’s main planning policies are set out in the adopted Carlisle District Local Plan, 2001 – 2016, (the Local Plan) as discussed in chapter 6.
Development Management Air quality as a material consideration has now been incorporated into the local planning process. As part of the Council’s planning application validation process, developers are required to submit an air quality impact assessment (AQIA), as follows: When is it required? Where the development is proposed inside, or adjacent to, an AQMA; where the development could in itself result in the designation of an AQMA; or where the grant of planning permission would conflict with, or render unworkable, elements of the local authority’s Air Quality Action Plan. What is required? Any report should be detailed enough to enable the planning authority to determine, with a reasonable degree of certainty, the significance of any air quality impacts, and thereby the priority to be given to air quality concerns when deciding an application. The scope of an air quality assessment will depend on the nature of the proposed development and the likely impact. Why is it required? In compliance with Policy CP13 of the adopted Carlisle District Local Plan 2001 – 2016. Specific guidance ‘Air Quality Land Use Planning, has been produced by Environmental Health and is routinely provided to both planners and developers to assist them with this requirement. It indicates the trigger criteria where a development has the potential for significant emissions of pollutants. In these circumstances an AQIA would be expected. The following are three examples of these trigger criteria:
Residential development in excess of 100 units; or
Employment uses in excess of 5,000 m2 gross floor space; or
Any developments that either generates in excess of 100 heavy goods vehicles per day or 100 vehicles movements in any hour. Once submitted, the Environmental Health Department carry out an appraisal of the AQIA, and issue comments or recommendations to planners and developers as required.
April 2013 Carlisle City Council – England
LAQM Progress Report 2013 56
The planning guidance will be revised as necessary to incorporate a checklist of mitigating measures which could be included in Section 106 agreements based on emerging best practice. Examples of actions taken nationally to minimise adverse transport impacts on air quality include the requirements for travel plans and possible developer contributions for public transport infrastructure. PPS23 outlines national policy on planning and pollution control, including the basis for applying a combination of planning conditions and legal obligations to address the environmental impacts of proposed developments. In particular, it notes that ‘Section 106 Agreements can be used to improve air quality, make other environmental improvements […] or offset the subsequent environmental impact of a proposed development.’ It is important to note that the Community Infrastructure Levy (CIL) exists separately from 106 agreements. The CIL is a new charge in which local authorities are empowered, but not required, to charge on most types of new development in their area. CIL charges will be based on simple formulae which relate the size of the charge to the size and character of the development paying it. The proceeds of the levy will be spent on local and sub-regional infrastructure to support the development of the area. As yet Carlisle has not drawn up a CIL. Despite the need to enter into the above legal agreements where appropriate, conditions may also be imposed on any planning consent to achieve the following examples:
Secure the submission of a full emissions inventory;
Secure the submission of a scheme for monitoring air quality in areas affected by the development;
To secure the submission of a Green Travel Plan and Transport Assessment;
Encourage the use of clean fuels, secure bicycle parking and changing facilities;
Promote the use of, and the securing of improvements to public transport, walking and cycling;
Set targets for trips made by public transport;
Encourage the implementation and use of Green Travel Plans, Environmental Management Plans and Air Quality Strategies;
Require industrial processes to monitor and model their emissions;
Require developers to monitor air quality before and after development.
More details of how the planning system has been and can be used to promote and improve air quality can be found in ‘Low Emissions Strategies, using the planning system to reduce transport emissions, Good Practice Guidance’, (DEFRA January 2010).

April 2013 Carlisle City Council – England
LAQM Progress Report 2013 57
6 Local Transport Plans and Strategies
The Local Transport Plan 3 (LTP3) (2011 - 2026) is the statutory planning document that sets out the County Council’s vision, strategy and policies for transport. It also describes the approaches and measures that will be taken to implement these policies in each Cumbrian Authority. The plan provides the framework to co-ordinate the local delivery of integrated transport and seeks improvements to our transport systems. One of the aims of the LTP is a high quality natural and built environment. The current plan LTP(3) identifies that Carlisle suffers from traffic congestion at peak times and air quality problems on roads around the city centre. It goes on to state that: ‘2012 will see the completion of the Carlisle Northern Development Route. This will provide the opportunity to improve air quality as well as improving access to development sites.’ For rural areas of the district the plan sets a priority to: ‘The priority for rural Carlisle is to improve resident’s ability to access jobs, services and healthcare. This will be based around developing demand responsive services and developing opportunities within local communities.’ The LTP(3) states that there will be a further document which, among other things, will address parking issues within the city centre of Carlisle: ‘The Carlisle City Centre Transport Overview and Joint Parking Policy Statement which is being developed between the county and city council and local businesses will help to identify the transport improvements required to support the economic priorities.’ This document is currently in draft form and discussions are ongoing as to how best to move the policy forward. Delays have followed the decision for Carlisle City Council to hand back the highways claimed rights to the County Council. This hand over took place at the end of March 2013. Further decisions on roles and responsibilities and the future of this document are expected in due course. The County Council has also produced the draft LTP(3) Implementation Plan (2012 – 2015). The report has not yet been presented to members and currently remains a draft internal document. This report seeks to inform members on the Carlisle section of the LTP(3) Implementation Plan. The Implementation Plan is a key part of the Cumbria Transport Plan (LTP3), setting out how the priorities of the recently approved LTP(3) Strategy will be delivered. The three year Implementation Plan 2012 -2015, which will be rolled forward and reviewed annually will incorporate a transport statement for Carlisle setting out its key transport priorities and a schedule of proposed transport improvement schemes aimed at helping to deliver them. The outcomes and any major change as a result of these emerging documents will be reported in due course during subsequent rounds of review and assessment.

April 2013 Carlisle City Council – England
LAQM Progress Report 2013 58
7 Climate Change Strategies
The council has in place three key documents relating to climate change these are summarised as follows: In the Nottingham Declaration the council acknowledges the occurrence of
climate change and it outlines the councils commitment from the 15th January 2007 to, amongst other things, achieve a significant reduction of greenhouse gas emissions from our own authority's operations. It identifies key areas where this can be achieved including energy sourcing and use, travel and transport, waste production and disposal and the purchasing of goods and services. The declaration shows commitment to working with central government to contribute, at a local level, to the delivery of the UK Climate Change Programme, the Kyoto Protocol and the target for carbon dioxide reduction. The document is signed by the council’s Chief Executive, Leader of the Council, the Minister of State for Climate Change and the Environment (DEFRA) as well as the Parliamentary Under Secretary of State (DCLG).
As part of Carlisle City Council’s Carbon Management Programme the Carbon
Management Plan (CMP) was introduced in 2008 and is due to be reviewed in 2013. The plan was developed with the Carbon Management Trust in order to meet the following objectives:
Lead by example in reducing carbon emissions in the Carlisle area.
Reduce energy and fuel consumption and expenditure on bills.
Meeting legislative and government requirements through the performance framework.
Embed fuel and energy efficiency into the Council’s corporate culture and working practices.
Allocate roles and responsibilities for reducing carbon emissions
Support our partners – Carlisle Leisure Limited and Community Centres in delivering carbon reductions.
Establish an effective monitoring system of consumption and savings achieved.
Set informed carbon reduction targets to guide progress.
The key messages from the Carbon Management Plan are:
If we do nothing, annual utility and fuel costs to the City Council and our partners are likely to increase from £1,127,000 to £1,748,000 by 2013 and carbon emissions will rise unchecked.
If we apply the carbon management programme, we could reduce the total cumulative cost by £1,344,000 during the same period of 5 years and save 5,580 tonnes of carbon dioxide.
The Climate Change Strategy was developed in 2008 to be reviewed in 2013 the
purpose of this was to draw together these achievements along with aims, objectives and milestones to measure success. These objectives are as follows:
April 2013 Carlisle City Council – England
LAQM Progress Report 2013 59
Ensure that our operations and services address the issue of climate change How we will measure success:
Completion of a climate ‘proofing’ assessment of key Council policies, strategies, action plans and procedures to ensure that they are systematically lowering carbon emissions and ensuring that decisions are resilient to climate change.
A corporate Climate Change group is established to oversee the implementation of the Climate Change Strategy.
Staff and Members are aware of the implications of climate change, how it affects our operations and services and receiving training and support where needed.
Carlisle is achieving targets against our performance indicators on climate change.
The City Council’s partners, businesses and the wider community have developed a Carlisle Climate Change Action Plan
Reduce the City Council’s carbon emissions associated with our operations How we will measure success:
By April 2013 Carlisle City Council will have reduced CO2 emissions from its operations. An aspirational target of 25% on 2007-08 levels will be aimed for.
Procurement decisions take a whole life cycle approach that includes associated carbon emissions.
Ensure that the City Council’s operations and services are adapted to climate change How we will measure success
All directorates have undertaken a climate change impacts assessment of their operations and services
By 2012 Carlisle City Council and our key partners will be implementing an adaptation action plan and monitoring progress.
Establish climate change as a priority issue for the Carlisle Partnership How we will measure success
The target of achieving a 3% reduction per annum on CO2 emissions per capita for Carlisle is being achieved.
Carlisle Partnership members have put in place carbon reduction plans and report their action.
Carlisle Partnership will have undertaken a local climate change impacts profile for Carlisle.
Carlisle Partnership is playing an active role in helping local communities, businesses and partners to work towards a climate proofed Carlisle through the development and delivery of a Carlisle Climate Change Action Plan.
Develop more environmentally friendly transport choices How we will measure success
The City Council and Carlisle Partnership are engaging with local employers on the potential for partnership working through the development of Green Travel Plans.
April 2013 Carlisle City Council – England
LAQM Progress Report 2013 60
Make planning an effective tool in the pursuit of a climate proofed Carlisle How we will measure success
Planning policies include targets and standards for addressing climate change.
Support improvement in the energy efficiency of Carlisle’s housing stock How we will measure success
Targets are being met for the Decent Home standard and fuel poverty indicator.
April 2013 Carlisle City Council – England
LAQM Progress Report 2013 61
8 Implementation of Action Plans
Carlisle City Council’s revised Air Quality Action Plan (AQAP) sets out measures that the Council, along with its partners, intends to take in order to achieve a reduction in nitrogen dioxide (NO2) concentrations in Carlisle. A reduction in NO2 concentrations is required in order to meet the annual average objectives for this pollutant set by the government. Particular attention has been paid to those 6 areas of the city where exceedences of the national objective level have been identified. The Air Quality Action Plan was originally produced in 2007, it was then later revised and updated in 2012 to take into account new AQMA’s and to set out new improved measures. The final version of the plan was approved by Carlisle City Councils Executive Committee in July 2012, it was subsequently submitted to and accepted by DEFRA in September 2012. The Action Plan measures are those which are currently considered to be the most cost effective and appropriate for Carlisle. They focus on local initiatives which are realistic and achievable and are most likely to result in significant improvements. The measures seek to manage and continuously improve air quality at a local level whilst providing the level of access and development needed to maintain a vibrant, attractive and prosperous city. This is the first year that progress with the new revised action plan has been reported upon. Progress with each measure is given under the ‘progress to date’ column in the following table, due to the fact that the Action Plan has been in place for less than 12 months. The progress since the Action plan was produced is limited in that some schemes are still in the early planning and design stages. It is envisaged that Progress Report 2014 will contain greater progress toward larger schemes and infrastructure improvements. The following table contains a summary of any progress that has been made so far in the implementation of all of the revised action plan measures.
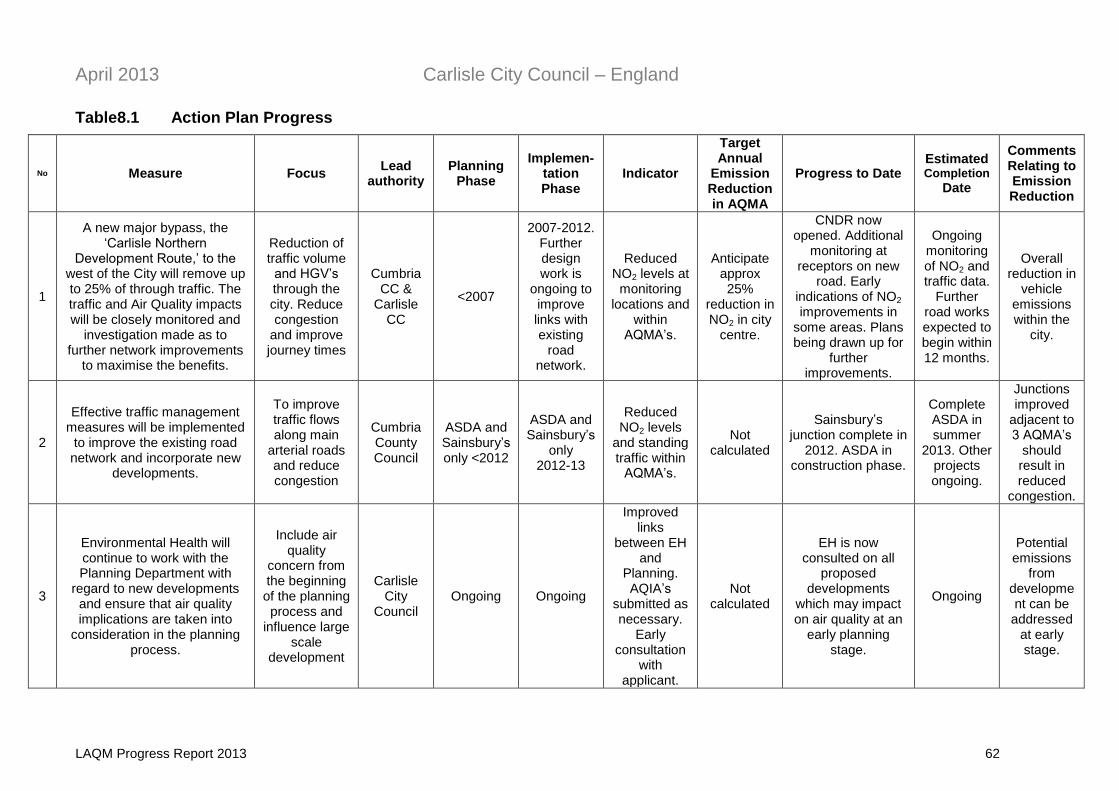
April 2013 Carlisle City Council – England
LAQM Progress Report 2013 62
Table8.1 Action Plan Progress
No Measure Focus Lead
authority Planning
Phase
Implemen-tation Phase
Indicator
Target Annual
Emission Reduction in AQMA
Progress to Date Estimated Completion
Date
Comments Relating to Emission Reduction
1
A new major bypass, the ‘Carlisle Northern
Development Route,’ to the west of the City will remove up to 25% of through traffic. The traffic and Air Quality impacts will be closely monitored and
investigation made as to further network improvements
to maximise the benefits.
Reduction of traffic volume
and HGV’s through the city. Reduce congestion
and improve journey times
Cumbria CC &
Carlisle CC
<2007
2007-2012. Further design work is
ongoing to improve links with existing
road network.
Reduced NO2 levels at
monitoring locations and
within AQMA’s.
Anticipate approx 25%
reduction in NO2 in city
centre.
CNDR now opened. Additional
monitoring at receptors on new
road. Early indications of NO2 improvements in
some areas. Plans being drawn up for
further improvements.
Ongoing monitoring of NO2 and traffic data.
Further road works expected to begin within 12 months.
Overall reduction in
vehicle emissions within the
city.
2
Effective traffic management measures will be implemented
to improve the existing road network and incorporate new
developments.
To improve traffic flows along main
arterial roads and reduce congestion
Cumbria County Council
ASDA and Sainsbury’s only <2012
ASDA and Sainsbury’s
only 2012-13
Reduced NO2 levels
and standing traffic within
AQMA’s.
Not calculated
Sainsbury’s junction complete in
2012. ASDA in construction phase.
Complete ASDA in summer
2013. Other projects ongoing.
Junctions improved
adjacent to 3 AQMA’s
should result in reduced
congestion.
3
Environmental Health will continue to work with the Planning Department with
regard to new developments and ensure that air quality implications are taken into
consideration in the planning process.
Include air quality
concern from the beginning of the planning process and
influence large scale
development
Carlisle City
Council Ongoing Ongoing
Improved links
between EH and
Planning. AQIA’s
submitted as necessary.
Early consultation
with applicant.
Not calculated
EH is now consulted on all
proposed developments
which may impact on air quality at an
early planning stage.
Ongoing
Potential emissions
from development can be addressed
at early stage.

April 2013 Carlisle City Council – England
LAQM Progress Report 2013 63
No Measure Focus Lead
authority Planning
Phase
Implemen-tation Phase
Indicator
Target Annual
Emission Reduction in AQMA
Progress to Date Estimated Completion
Date
Comments Relating to Emission Reduction
4
Work will continue to upgrade the passenger transport
infrastructure to make it more convenient and widely
accessible across the County. Arrangements for sustainable
transport systems will be integrated into major new and
proposed developments
To increase patronage of all passenger
transport systems.
Cumbria County Council
Ongoing Ongoing
Improved bus service. Increased
use of transport provided. Reduced
NO2 along main routes
Not calculated
Improved bus access with new
shelters and raised kerbs. Proposed extension of real
time bus info signs (PIP screens).
Possibility of linking this to a new city
broadband network. Plans for large new
housing estates include public
transport provision.
Ongoing
Reduced emissions from public transport.
Use of technology
to encourage the use of
an improved, modern
fleet.
5
Cycling and walking will be encouraged through reducing the impact of vehicle traffic in key areas of the city. New and improved pedestrian and cycle links including the Caldew and Lowry Hill Cycle ways and the
River Petteril shared cycle/footway will be provided.
To provide opportunity for walking and cycling as a
viable transport
option across the district.
Cumbria County Council
Ongoing Ongoing
Completion of proposed works and ongoing
improvement of the cycle
and pedestrian
route network.
Not calculated
Plans in place to provide underpass
for cycle and pedestrian access under Castle Way. Contribution made
by Sainsbury’s. Funding is available for new Cycle links
to the CNDR including Burgh
Road and Etterby Street. Planned improvement to
pedestrian bridge connecting Currock to Denton Holme
cycle ways.
Expected to complete
all of these detailed
proposals during
2013 -14.
Increased use of
sustainable transport
options with lower
emissions.
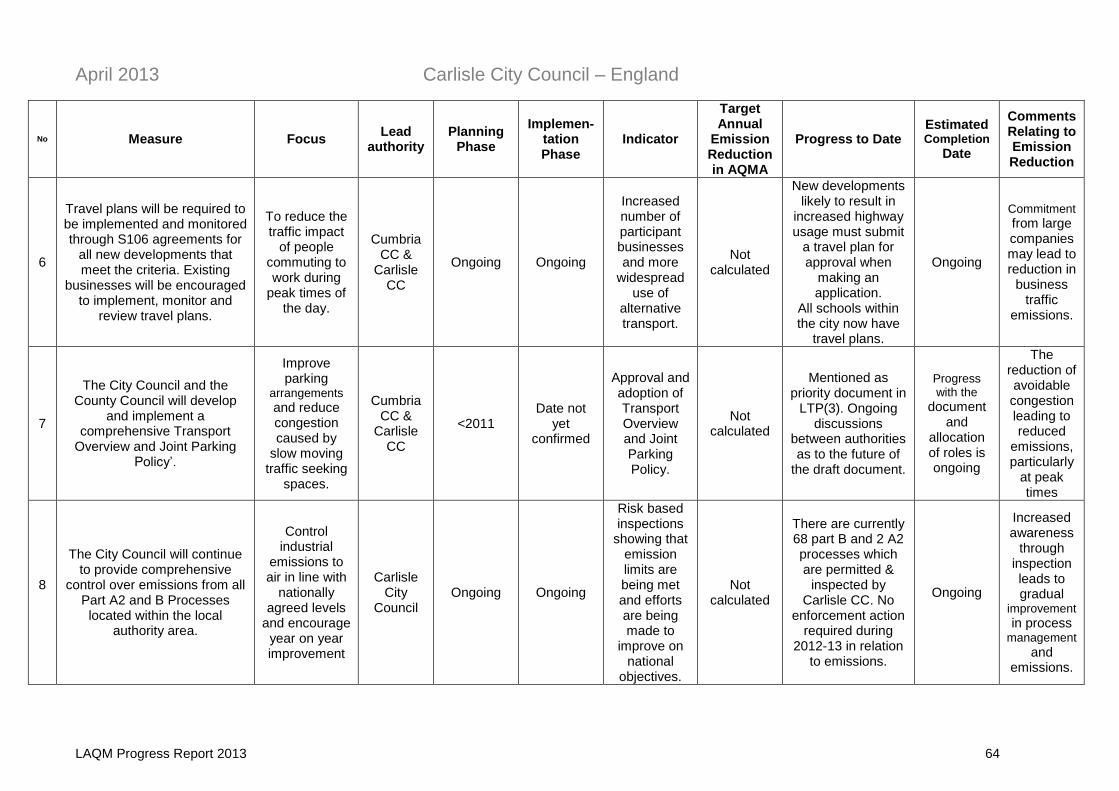
April 2013 Carlisle City Council – England
LAQM Progress Report 2013 64
No Measure Focus Lead
authority Planning
Phase
Implemen-tation Phase
Indicator
Target Annual
Emission Reduction in AQMA
Progress to Date Estimated Completion
Date
Comments Relating to Emission Reduction
6
Travel plans will be required to be implemented and monitored through S106 agreements for
all new developments that meet the criteria. Existing
businesses will be encouraged to implement, monitor and
review travel plans.
To reduce the traffic impact
of people commuting to work during
peak times of the day.
Cumbria CC &
Carlisle CC
Ongoing Ongoing
Increased number of participant businesses and more
widespread use of
alternative transport.
Not calculated
New developments likely to result in
increased highway usage must submit
a travel plan for approval when
making an application.
All schools within the city now have
travel plans.
Ongoing
Commitment from large companies may lead to reduction in
business traffic
emissions.
7
The City Council and the County Council will develop
and implement a comprehensive Transport
Overview and Joint Parking Policy’.
Improve parking
arrangements and reduce congestion caused by
slow moving traffic seeking
spaces.
Cumbria CC &
Carlisle CC
<2011 Date not
yet confirmed
Approval and adoption of Transport Overview and Joint Parking Policy.
Not calculated
Mentioned as priority document in
LTP(3). Ongoing discussions
between authorities as to the future of
the draft document.
Progress with the
document and
allocation of roles is ongoing
The reduction of avoidable congestion leading to reduced
emissions, particularly
at peak times
8
The City Council will continue to provide comprehensive
control over emissions from all Part A2 and B Processes located within the local
authority area.
Control industrial
emissions to air in line with
nationally agreed levels
and encourage year on year improvement
Carlisle City
Council Ongoing Ongoing
Risk based inspections
showing that emission limits are being met and efforts are being made to
improve on national
objectives.
Not calculated
There are currently 68 part B and 2 A2 processes which are permitted &
inspected by Carlisle CC. No
enforcement action required during
2012-13 in relation to emissions.
Ongoing
Increased awareness
through inspection leads to gradual
improvement in process
management and
emissions.

April 2013 Carlisle City Council – England
LAQM Progress Report 2013 65
No Measure Focus Lead
authority Planning
Phase
Implemen-tation Phase
Indicator
Target Annual
Emission Reduction in AQMA
Progress to Date Estimated Completion
Date
Comments Relating to Emission Reduction
9
The City Council will continue to investigate complaints of
black smoke and smoke nuisance as well as managing
smokeless zones. Enforcement action will be
taken as necessary.
To control emissions
from burning of trade and
domestic waste. Prevent
nuisance caused by
smoke.
Carlisle City
Council Ongoing Ongoing
Reduction in the number
of complaints from
members of the public.
Reduction of repeat
offenders.
Not calculated
Info on website advice and
enforcement as required. N
o smoke
complaints responded to: 2007 – 67, 2008 – 48, 2009 – 47, 2010 - 53, 2011 - 52, 2012 – 32.
Ongoing
Reduction of
emissions from
burning trade and domestic waste.
10
Energy savings advice and subsidised home insulation
improvements will continue to be provided to the public. Uptake will be monitored.
Improve energy
efficiency. Reduce
domestic emissions and fuel poverty.
Carlisle City
Council (Host
authority for the
Cumbria Affordable Warmth Project. (CAWP)
Ongoing Ongoing
Improved energy
efficiency of residential properties.
Cumbria Warm Homes Project
(CWHP) delivered a reduction of
317296 lifetime carbon tonnes
CWHP spent £4.9 million on subsidies and grants between
Oct 11 – Mar 13. This included 424 cavity Wall and
1010 loft insulation projects in Carlisle
CWHP ended in March 2013. CAWP
continues to seek
funding as part of
Green Deal for Energy
Reduction of
emissions from
general heating
requirements of domestic properties.
11
Environmental Health will work alongside the Neighbourhoods
and Green Spaces team to investigate and implement the
effective use of trees and green areas to offset traffic
derived emissions in existing AQMA’s and in new development areas.
To investigate ways in which vegetation and trees can be
used to improve air quality and raise public awareness.
Cumbria CC &
Carlisle CC
Ongoing Ongoing
Increase in trees and
vegetation in visible
locations. Increased
public interest.
Not calculated
106 new trees planted in parks
and the cemetery. 62 new trees
planted on the roadsides and city centre since April 2012 by Carlisle
City Council.
Highways claimed
rights given back to
County in March 13. Plans for
tree planting are uncertain.
Use of trees to
reduce air pollution and raise
public awareness.

April 2013 Carlisle City Council – England
LAQM Progress Report 2013 66
No Measure Focus Lead
authority Planning
Phase
Implemen-tation Phase
Indicator
Target Annual
Emission Reduction in AQMA
Progress to Date Estimated Completion
Date
Comments Relating to Emission Reduction
12
Joint working will be extended in order to include air quality improvement in all relevant
City Council and County Council policies and strategies.
To generate more internal interest in air
quality. Increase
profile of local improvement measures.
Cumbria CC &
Carlisle CC
Ongoing Ongoing
Increased awareness of
air quality issues and
consideration given by
more council departments.
Not calculated
Included air quality links within:
Corporate Plan (2010-13)
Local Transport Plan (2011-26)
The Green Infrastructure
Strategy (2011) The Local Plan
(2001-2016)
Ongoing
Policies and
strategies can lead to
future decisions
which favour air
quality objectives.
13
The City Council will undertake regular publicity events and
actively promote air quality and sustainable transport issues.
Up to date air quality information and monitoring data will be provided to the
public.
Increase public
awareness and
participation. Improve
access to information
and monitoring data.
Carlisle City
Council Ongoing Ongoing
Increased public
awareness and
participation in improving air quality.
Not calculated
EH in partnership with other Cumbrian
authorities used adverts on busses
to promote alternative transport.
Investigating ways to extend this
campaign. Air quality info and real time monitoring data is available on
the website.
Ongoing
Public can make
informed choices in order to reduce
emissions.
April 2013 Carlisle City Council – England
LAQM Progress Report 2013 67
9 Conclusions and Proposed Actions
9.1 Conclusions from New Monitoring Data
Nitrogen Dioxide The monitoring undertaken for the purpose of this report has identified a potential exceedence of the nitrogen dioxide annual mean at one relevant location outside our current AQMA’s. The location in question is C1, Lowther St (42.55µg/m3). It seems certain that the recent increase is due to the major road works associated with the nearby Sainsbury’s development on Bridge Street. Road narrowing and restrictions led to a greatly increased volume of traffic being diverted onto Lowther Street from March to October 2012. The development and road improvements are now complete and as a result there has been a noticeable reduction in traffic volume and standing traffic at location C1. For this reason it is not proposed to proceed to a detailed assessment due to the temporary nature of the traffic congestion which is likely to have caused the exceedence.
Two other locations, namely; D7 (36.83µg/m3) and E22 (36.4µg/m3) are borderline of exceeding the annual mean objective for NO2. They are the only other locations that have an annual mean of above 36µg/m3 and are in a relevant location. These locations have both shown a slight decrease when compared to the 2011 monitoring data.
The monitoring data indicates that there are still locations within all 6 of our AQMA’s which remain above, or borderline of, the annual mean objective level, therefore there are no plans to revoke or amend any of them at this present time.
In 2012 the annual mean NO2 concentrations decreased at many of the monitoring locations across the district, compared to 2011. Some locations have also shown a further decrease on previous years particularly in AQMA 1, 3 and 4.
The vast majority of the monitoring network will continue to operate unchanged during 2013. A consistent monitoring programme will allow accurate ‘before and after’ comparisons to be drawn since the opening of the Carlisle Northern Development Route (CNDR) in February 2012. This Action Plan measure is expected to have a dramatic effect on inner city traffic congestion and should have a knock on improvement in NO2 concentrations in key areas.
There are now four diffusion tubes located on residential properties which are adjacent to the CNDR. The initial data based on an 8 month monitoring period indicates that the new road has had a minimal effect on those dwellings which are closest to it. These locations showed estimated annual means which are among the lowest of all of the collected data.
Monitoring from the continuous analyser at Paddys Market showed no exceedence of the 1 hour mean objective, or the annual mean objective, for nitrogen dioxide during
2012. The unit recorded an annual mean of 29.9 g/m3.
Monitoring from the continuous analyser unit at Stanwix Bank showed no exceedence of the nitrogen dioxide 1 hour mean objective. The unit also recorded an
annual mean of 32.2 g/m3. It should be noted that the unit’s location is not representative of public exposure and is within AQMA 1.
April 2013 Carlisle City Council – England
LAQM Progress Report 2013 68
Particulate Matter (PM 10)
Monitoring from our unit at Paddys Market showed 3 exceedences of the 50 g/m3 24 hour mean, this is below the permitted 35 exceedences given in the objective. The
recorded annual mean of 19.2 g/m3 was also significantly below the objective level
of 40 g/m3, during 2012. Particulate Matter (PM 2.5)
Monitoring from our unit at Paddys Market showed no exceedence of the 25 g/m3
annual mean objective, for PM 2.5. The recorded annual mean of 11.04 g/m3 was significantly below the objective level, during 2012. Benzene. Monitoring from our pumped diffusion tubes unit at Paddys Market revealed an
annual mean of 0.74 g/m3 for benzene. The result is slightly lower than any previous
year of monitoring at this location. There was therefore no exceedence of the 5 g/m3
annual mean or the running annual mean objective of 16.25 g/m3
No other pollutants are of concern in the district.
9.2 Conclusions relating to New Local Developments
The new local developments within the district are detailed in sections 3 and 4 of this report, the air quality impacts of these have been assessed as part of the planning process and in some cases under the Environmental Permitting Regulations 2010. There are no new major developments of any particular concern since the last round of review and assessment.
There are some large proposed developments including major residential developments and an application to develop the airport which will be closely monitored. If necessary these will be given more detailed consideration in the Updating and Screening Assessment in 2015.
No new developments currently give rise to the need for a detailed assessment.
9.3 Other Conclusions
There has been some progress with initiatives set out in the Air Quality Action Plan, this is summarised in table 8.1 in section 8 of this report. The Air Quality Action Plan was originally produced in 2007, it was later revised and updated in July 2012 to take into account new AQMA’s and to set out new improved measures. This is the first year that progress with the new revised action plan has been reported upon. The progress made since the Action plan was produced is limited in that some schemes are still in the early planning and design stages. It is envisaged that Progress Report 2014 will contain greater progress toward larger schemes and infrastructure improvements.
The additional monitoring of PM2.5 started in March 2009 and since then the monitoring results have been reported upon. The 2012 results have shown an annual
mean of 11.04 g/m3. This is well below the target objective of 25 g/m3 to be achieved by 2020. All monitoring undertaken to date has shown no risk of any exceedence of this pollutant.
April 2013 Carlisle City Council – England
LAQM Progress Report 2013 69
There are a number of major planning applications which have been summarised in section 4 of this report. The only proposed developments which are likely to have any significant effect on air quality are the combined Morton developments, the Cryndledyke development and the Carlisle Airport distribution centre. In all cases an Air Quality Impact Assessment has been requested and Environmental Health has been working with the planning department and any the consultants concerned as to the scope the assessments and the potential impacts. Any outcomes or changes to these applications will be monitored and documented in Progress Report 2014. The Local Transport Plan 3 (LTP3) (2011 - 2026) is the current statutory planning document that sets out the County Council’s vision, strategy and policies for transport. It also describes the approaches and measures that will be taken to implement these policies in each Cumbrian Authority. The LTP(3) is discussed in section 6 of this report.
9.3.1 Proposed Actions
The new monitoring data for 2012 has not identified the need to proceed to a Detailed Assessment for any pollutant. There are a small number of locations that are outside the existing AQMA’s which are borderline or slightly above the annual mean objective for NO2. As previously discussed there are strong reasons to believe that this increase is due to temporary traffic disruption and it is expected that future levels will stabilise. If these locations continue to show an increase or significantly exceed the objective in future then it will be necessary to carry out a detailed assessment.
The new monitoring data has not identified any need for additional monitoring, or changes to the existing monitoring programme. This will remain largely the same so that comparisons can be drawn since the opening of the CNDR. It is hoped that the bypass will further improve air quality in several AQMA’s and at this point it may be possible that one or more may be revoked.
The current AQMA 3 (Wigton Road) has been successfully extended and the AQMA order came into force on 1st July 2010. Monitoring will continue here in the same way during 2013. The data collected from the AQMA during 2012 is currently borderline or slightly above the NO2 annual mean objective. There is currently no reason to make any further changes to the boundaries of any of the existing AQMA’s.
The next report to be submitted to DEFRA will be Progress Report 2014. This will be submitted in April 2014 and will present all of the monitoring data for 2013 as well as detail any further progress with proposed or existing developments. All of the review and assessment reports will continue to be made available for public access on the City Council web site.
April 2013 Carlisle City Council – England
LAQM Progress Report 2013 70
10 References
Department of the Environment Transport and the Regions. (2000b) Air Quality Strategy for England, Scotland, Wales and Northern Ireland. (Revised 2007) Carlisle City Council, Environmental Health. Air Quality and Land use planning. (2006) DEFRA. Part IV of the Environment Act 1995. Local Air Quality Management Technical Guidance LAQM.TG (09) (Feb 2009) The Air Quality (England) Regulations 2000 (as amended 2002) Cumbria County Council. Local Transport Plan (2011- 2026) NSCA. Development Control: Planning for Air Quality’. (Updated 2006) Carlisle City Council Second Round Review and Assessment Reports: Carlisle City Council. Air Quality Updating & Screening Assessment. (2003) Carlisle City Council. Air Quality Detailed Assessment. (2004) Carlisle City Council Third Round Review and Assessment Reports: Carlisle City Council. Updating and Screening Assessment. 2006 Carlisle City Council. Detailed Assessment Report. (2006) Carlisle City Council. Further Assessment Report. (2007) Carlisle City Council. Detailed Assessment. (2007) Carlisle City Council. Further Assessment Report. (2007) Carlisle City Council. Further Assessment Report. (Issue 2 2009) Carlisle City Council Fourth Round Review and Assessment Reports: Carlisle City Council. Updating and Screening Assessment. (2009) Carlisle City Council. Progress Report. (2010)
Carlisle City Council. Progress Report. (2011)
Carlisle City Council. Updating and Screening Assessment (2012)
Carlisle City Council. Air Quality Action Plan (2012)
April 2013 Carlisle City Council – England
LAQM Progress Report 2013 71
Appendices
Appendix A: Quality Assurance / Quality Control (QA/QC) Data
Appendix B: Monthly NO2 diffusion tube results 2012(Raw Data)
Appendix C: NO2 diffusion tube results 2012 (Calculated Data)
Appendix D: Maps Showing Locations of Potential New Developments.
April 2013 Carlisle City Council – England
LAQM Progress Report 2013 72
Appendix A: Quality Assurance / Quality Control (QA/QC) Data
Diffusion Tube Bias Adjustment Factors Diffusion tube precision can be described as the ability of a measurement to be consistently reproduced, i.e. how similar the results of duplicate or triplicate tubes are to each other. Accuracy represents the ability of the measurement to represent the ‘true’ value, which, in this case, is defined as the result from the automatic analyser. When averaged over a number of sets of results bias can be evident. This represents the overall tendency of the diffusion tubes to depart from the ‘true’ value, i.e. to systematically over or under-read when compared against the reference method. Once identified, bias can be adjusted for in order to improve the accuracy of diffusion tube results. This is done using bias adjustment factors, which have been found to be specific to a laboratory and tube preparation method. As a result of the considerable difference in the performance of tubes prepared by different labs, government guidance recommends that a bias adjustment factor is determined and applied to the data. Technical guidance gives a method for this, which involves the co-location of these tubes with a chemiluminescent NOx analyser. Authorities are asked to report the adjustment factor from their own co-location study, where available. The national bias adjustment factor is then determined by collating and assessing data from NO2
co-location studies across the UK. Full details of both the national and local bias adjustment factors used to adjust data and details of data precision are provided below. Factor from Local Co-location Study Carlisle City Council utilises NO2 diffusion tubes prepared with 20% TEA in water, these are prepared and analysed by Gradko Environmental Ltd. A local bias adjustment factor of 0.95 was derived from the diffusion tubes co-located at the Paddy’s Market monitoring station. This is a roadside location, not representative of public exposure, located close to two air quality management areas. The local bias adjustment factor was calculated using the RICARDO-AEA Spreadsheet for checking the precision and accuracy of triplicate tubes, found on the UK Air Quality Archive website. The following screen print shows the results of the data that was input into the spreadsheet:
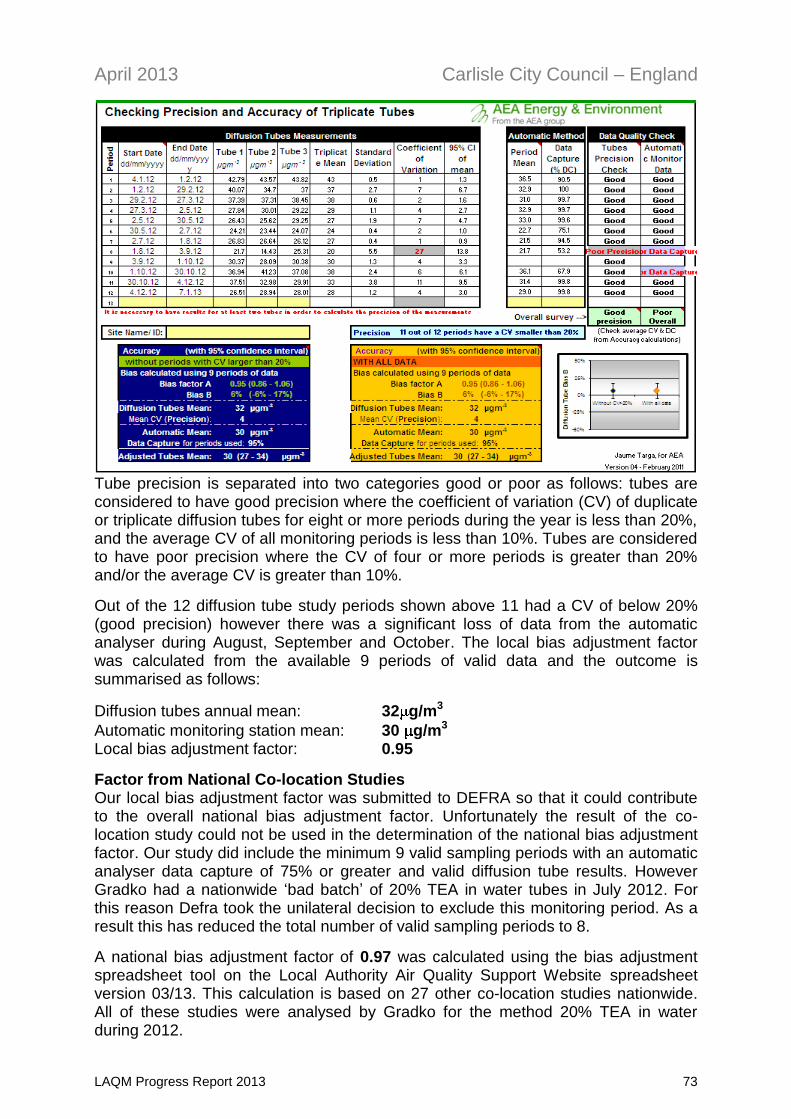
April 2013 Carlisle City Council – England
LAQM Progress Report 2013 73
Tube precision is separated into two categories good or poor as follows: tubes are considered to have good precision where the coefficient of variation (CV) of duplicate or triplicate diffusion tubes for eight or more periods during the year is less than 20%, and the average CV of all monitoring periods is less than 10%. Tubes are considered to have poor precision where the CV of four or more periods is greater than 20% and/or the average CV is greater than 10%.
Out of the 12 diffusion tube study periods shown above 11 had a CV of below 20% (good precision) however there was a significant loss of data from the automatic analyser during August, September and October. The local bias adjustment factor was calculated from the available 9 periods of valid data and the outcome is summarised as follows:
Diffusion tubes annual mean: 32 g/m3
Automatic monitoring station mean: 30 g/m3 Local bias adjustment factor: 0.95
Factor from National Co-location Studies Our local bias adjustment factor was submitted to DEFRA so that it could contribute to the overall national bias adjustment factor. Unfortunately the result of the co-location study could not be used in the determination of the national bias adjustment factor. Our study did include the minimum 9 valid sampling periods with an automatic analyser data capture of 75% or greater and valid diffusion tube results. However Gradko had a nationwide ‘bad batch’ of 20% TEA in water tubes in July 2012. For this reason Defra took the unilateral decision to exclude this monitoring period. As a result this has reduced the total number of valid sampling periods to 8.
A national bias adjustment factor of 0.97 was calculated using the bias adjustment spreadsheet tool on the Local Authority Air Quality Support Website spreadsheet version 03/13. This calculation is based on 27 other co-location studies nationwide. All of these studies were analysed by Gradko for the method 20% TEA in water during 2012.
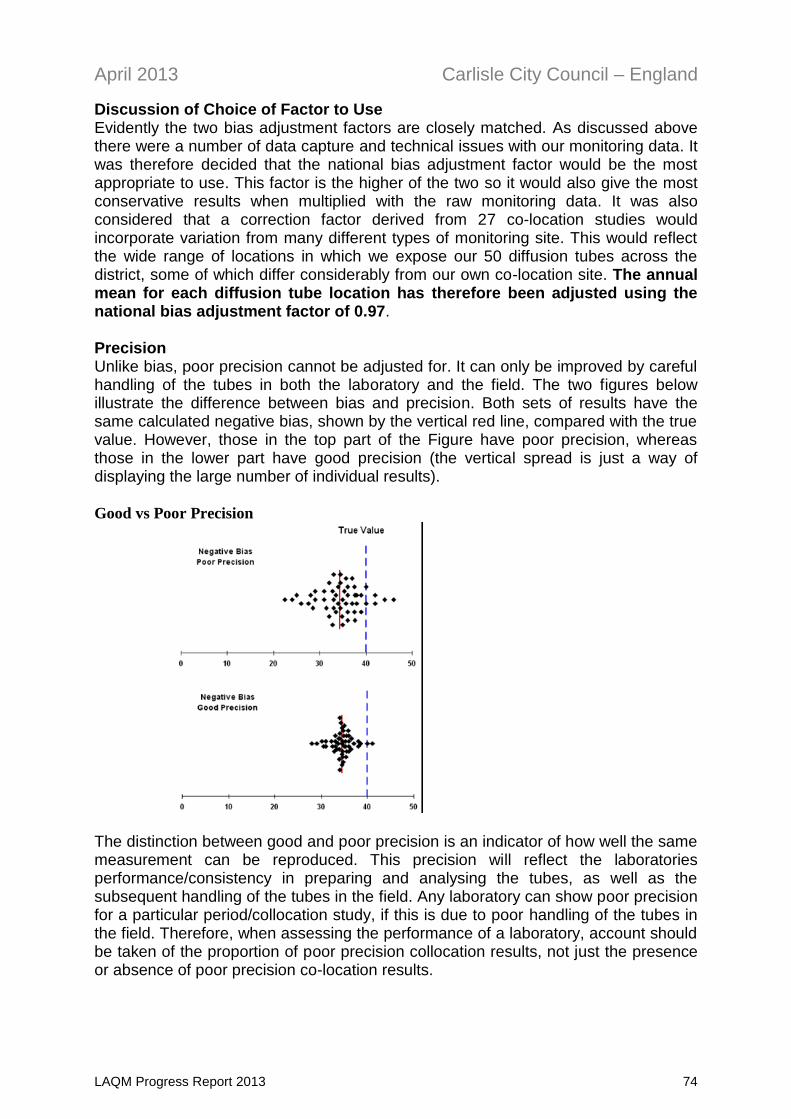
April 2013 Carlisle City Council – England
LAQM Progress Report 2013 74
Discussion of Choice of Factor to Use Evidently the two bias adjustment factors are closely matched. As discussed above there were a number of data capture and technical issues with our monitoring data. It was therefore decided that the national bias adjustment factor would be the most appropriate to use. This factor is the higher of the two so it would also give the most conservative results when multiplied with the raw monitoring data. It was also considered that a correction factor derived from 27 co-location studies would incorporate variation from many different types of monitoring site. This would reflect the wide range of locations in which we expose our 50 diffusion tubes across the district, some of which differ considerably from our own co-location site. The annual mean for each diffusion tube location has therefore been adjusted using the national bias adjustment factor of 0.97. Precision Unlike bias, poor precision cannot be adjusted for. It can only be improved by careful handling of the tubes in both the laboratory and the field. The two figures below illustrate the difference between bias and precision. Both sets of results have the same calculated negative bias, shown by the vertical red line, compared with the true value. However, those in the top part of the Figure have poor precision, whereas those in the lower part have good precision (the vertical spread is just a way of displaying the large number of individual results).
Good vs Poor Precision
The distinction between good and poor precision is an indicator of how well the same measurement can be reproduced. This precision will reflect the laboratories performance/consistency in preparing and analysing the tubes, as well as the subsequent handling of the tubes in the field. Any laboratory can show poor precision for a particular period/collocation study, if this is due to poor handling of the tubes in the field. Therefore, when assessing the performance of a laboratory, account should be taken of the proportion of poor precision collocation results, not just the presence or absence of poor precision co-location results.
April 2013 Carlisle City Council – England
LAQM Progress Report 2013 75
PM Monitoring Adjustment DEFRA published the results of a study investigating the equivalence of various samplers and instruments for measuring PM10 in comparison with the European reference method (a gravimetric technique). The study found that the TEOM did not meet the equivalence criteria of the European reference method within the UK, even with the 1.3 correction factor (as advised in previous guidance). The outcome of the equivalence study means that TEOM analysers cannot strictly be used to measure PM10 concentrations for comparison with the air quality objectives. TEOM’s are however widely used in LAQM work. DEFRA & the Devolved Administrations advice to local authorities using TEOM’s is that it is generally not necessary to replace the instrument immediately, but when the time does come to replace it, the selected sampler should be a reference sampler, or one that meets the equivalence criteria. During some early rounds of review and assessment the data was corrected wherever possible using the King’s College London Volatile Correction Model (VCM) for PM10 (rather than by the application of a 1.3 correction factor). This adjustment is not necessary for the purpose of more recent monitoring because the TEOM was upgraded to FDMS on 18th March 2009. For this reason the PM10 data presented here can be used to compare with the air quality objectives. Short-term to Long-term Data adjustment
In order to estimate the annual mean concentration at locations where diffusion tube monitoring has been undertaken for less than 9 months of the calendar year there is a clearly defined procedure that must be followed in LAQM TG(09) section 3. The intention is to calculate an adjustment factor that can be applied to the data in order to estimate the mean pollutant concentration for the whole calendar year. This procedure applies to the new diffusion tube monitoring locations on the newly opened Carlisle Northern Development Route. Monitoring at these four locations began in May 2012. The adjustment is based on the fact that patterns in pollution concentrations, such as seasonal variation, usually affect a wide region. Thus if a six month period is above average at one location it is also likely to be above average at other locations in the region. The first step was to identify two to four nearby continuous monitoring sites that measure nitrogen dioxide at a background location, are affiliated to the Automatic Urban and Rural Network (AURN) and have a data capture of above 90% for 2012. The locations were selected following advice from the LAQM help desk, they match the above criteria and aim to provide a good geographical spread, however it was only possible to obtain the required data from locations which lie slightly outside of the desired 50 mile radius. Details of the locations are as follows:
- Blackpool Marton Approximately 73 miles south south west of Carlisle - Newcastle Centre Approximately 52 miles directly east of Carlisle - Preston Approximately 79 miles directly south of Carlisle - Peebles Approximately 53 miles directly north of Carlisle
April 2013 Carlisle City Council – England
LAQM Progress Report 2013 76
The monitoring data for these locations was obtained and the annual mean (Am) was calculated for each. In the same way the period means (Pm) were calculated for the period in which our diffusion tube monitoring was undertaken i.e. from May to December 2012. The ratio of the annual mean to the period mean (Am/Pm) was then calculated for each location. An average was then taken of these four ratios to give the final adjustment factor (Ra). Below is a table showing the monitoring data that was collected and a summary of the results of the above calculations.
Table A.1 Short-Term to Long-Term Monitoring Data Adjustment
Background Automatic Monitoring
Site
Annual Mean 2012 (Am)
(µg/m3)
Period Mean May - Dec 2012
(µg/m3) (Pm) Ratio (Am/Pm)
Blackpool Marton 20.21 18.39 1.099
Newcastle Centre 29.46 29.58 0.996
Preston 30.67 28.25 1.086
Peebles 7.98 7.91 1.009
Average Ratio (Ra) 1.047
The adjustment factor calculated above was then applied to the period mean for each of the four new diffusion tube monitoring locations. This was done by multiplying the measured period mean for each of the diffusion tube locations (M) with this adjustment factor. (M x Ra = Predicted Annual Mean) The results of these calculations can be found in appendix B & C and further discussion can be found in section 2 of this report. QA/QC of automatic monitoring Both of our automatic stations are subject to stringent QA/QC procedures. Paddy’s Market, which monitors PM10, NO2 and more recently PM2.5, is part of the AURN and the network quality assurance and control procedures are implemented. To ensure optimum data quality and capture, a three-tier system of calibration and analyser test procedures is employed in the AURN. The major components of this system are briefly described below.
a) Daily automatic IZS checks - these allow instrumental drifts to be examined, and act as a daily check on instrument performance.
b) Fortnightly manual calibrations - these are performed by the local site operators and are used by management unit to scale raw pollution data.
c) 6 – monthly network inter calibrations – These exercises are performed by the QA/Qc Unit every 6 months to ensure that all measurements from all network stations are completely representative and intercomparable. The inter calibrations will also act as an independent audit of the system at the site.
Data ratification is undertaken at 3 monthly intervals. This involves a critical review of all information relating to the data set to verify, amend or reject the data. The ratified data represents the final data set in the review & assessment process.
April 2013 Carlisle City Council – England
LAQM Progress Report 2013 77
The NO2 data collected by the Stanwix Bank monitoring unit was managed by Casella Monitor throughout 2012. Casella Monitor has a defined quality system that forms part of their UKAS accreditation that the laboratory holds. The data management contract was passed to Supporting U in April 2013 and a decision has now been made to maintain this arrangement up to April 2014. Re-scaling of the data relies on the Local Site Operator (Carlisle City Council) providing fortnightly calibration reports as a result of using calibration sources such as gas cylinders and zero air scrubbers. This data is used to calculate the true analyser zero and response factor and is used to scale data for the following two weeks leading up to the next scheduled calibration.
QA/QC of diffusion tube monitoring
Carlisle City Council QA/QC of diffusion tube monitoring Carlisle City Council follows the guidance set out in the ‘Diffusion Tubes for Ambient NO2 Monitoring: Practical Guidance for Laboratories and User’ which includes advice on selection of site, the location of the samplers, instructions for exposure, and co-location with automatic analysers.
Laboratory QA/QC of diffusion tube monitoring Gradko International has a defined quality system which forms part of the UKAS accreditation that the laboratory holds. All accredited methods are fully documented. The analytical laboratory is assessed by UKAS to establish conformance of Laboratory Quality Procedures to the requirements of ISO/IEC 17025 Standard. UKAS assessors visit on an annual basis and review all aspects of the analysis from the sample handling to analysis and reporting. As a condition of the accreditation the laboratory is required to participate in external proficiency schemes. Gradko participates in the Workplace Analysis Scheme for Proficiency (WASP) organised by the Health and Safety Laboratory. This scheme provides a regular assessment of the labs performance in that, every quarter, the laboratory receives four diffusion tubes doped with an amount of nitrite known to HSL, but not the laboratory. At least two of the tubes are usually duplicates, which enables precision, as well as accuracy, to be assessed. Any result from such a scheme that falls outside the relevant limits is immediately investigated and steps taken to rectify the situation. Calibration The instrument is calibrated twice daily, using a series of calibration standards to ensure a satisfactory linear response is obtained. A standard check is analysed after every fifty samples to ensure that the calibration is still valid.
Quality Control A quality control check is run after ten samples and is assessed against warning and action limits defined in the method. Quality control solutions are prepared from standards supplied by a different vendor to that of the calibration standards. Any AQC exceeding the action limit or two consecutive warning limits is internally assessed and is reported to the client as an AQC failure.
Travel Blank The travelling blank is analysed at the same time as the samples, any blank exceeding the currently prescribed maximum is investigated and reported to the client.
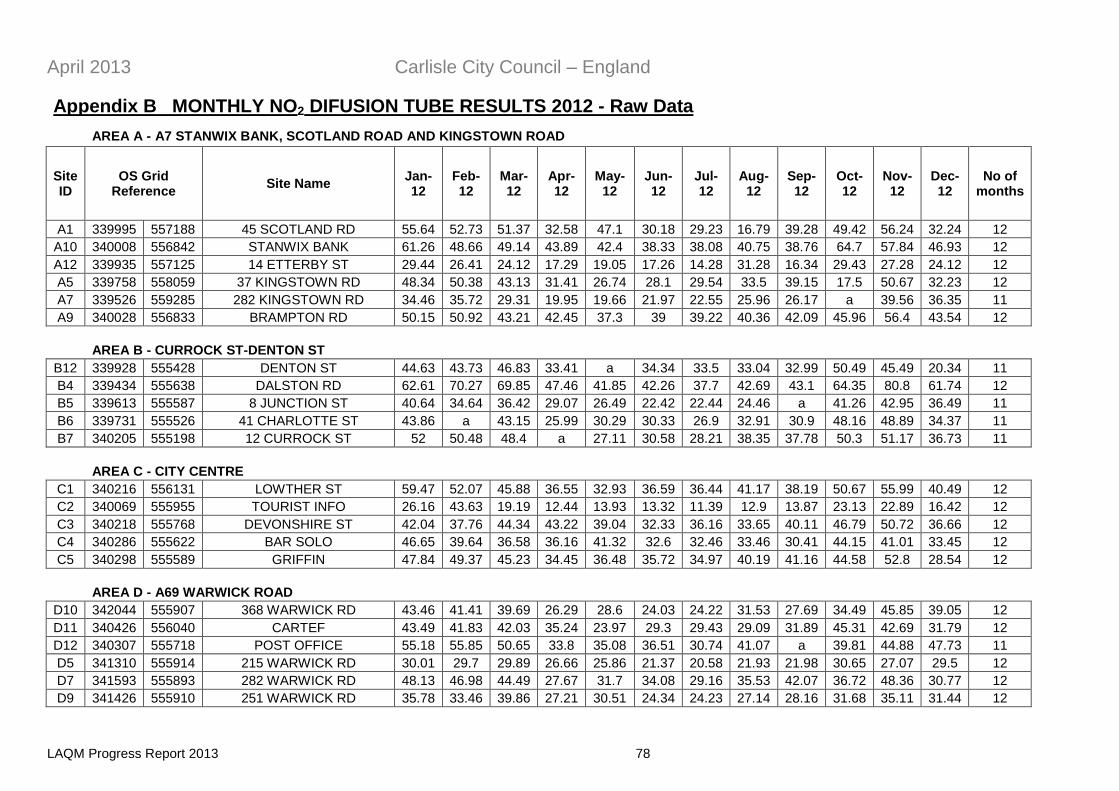
April 2013 Carlisle City Council – England
LAQM Progress Report 2013 78
Appendix B MONTHLY NO2 DIFUSION TUBE RESULTS 2012 - Raw Data
AREA A - A7 STANWIX BANK, SCOTLAND ROAD AND KINGSTOWN ROAD
Site ID
OS Grid Reference
Site Name Jan-12
Feb-12
Mar-12
Apr-12
May-12
Jun-12
Jul-12
Aug-12
Sep-12
Oct-12
Nov-12
Dec-12
No of months
A1 339995 557188 45 SCOTLAND RD 55.64 52.73 51.37 32.58 47.1 30.18 29.23 16.79 39.28 49.42 56.24 32.24 12
A10 340008 556842 STANWIX BANK 61.26 48.66 49.14 43.89 42.4 38.33 38.08 40.75 38.76 64.7 57.84 46.93 12
A12 339935 557125 14 ETTERBY ST 29.44 26.41 24.12 17.29 19.05 17.26 14.28 31.28 16.34 29.43 27.28 24.12 12
A5 339758 558059 37 KINGSTOWN RD 48.34 50.38 43.13 31.41 26.74 28.1 29.54 33.5 39.15 17.5 50.67 32.23 12
A7 339526 559285 282 KINGSTOWN RD 34.46 35.72 29.31 19.95 19.66 21.97 22.55 25.96 26.17 a 39.56 36.35 11
A9 340028 556833 BRAMPTON RD 50.15 50.92 43.21 42.45 37.3 39 39.22 40.36 42.09 45.96 56.4 43.54 12
AREA B - CURROCK ST-DENTON ST
B12 339928 555428 DENTON ST 44.63 43.73 46.83 33.41 a 34.34 33.5 33.04 32.99 50.49 45.49 20.34 11
B4 339434 555638 DALSTON RD 62.61 70.27 69.85 47.46 41.85 42.26 37.7 42.69 43.1 64.35 80.8 61.74 12
B5 339613 555587 8 JUNCTION ST 40.64 34.64 36.42 29.07 26.49 22.42 22.44 24.46 a 41.26 42.95 36.49 11
B6 339731 555526 41 CHARLOTTE ST 43.86 a 43.15 25.99 30.29 30.33 26.9 32.91 30.9 48.16 48.89 34.37 11
B7 340205 555198 12 CURROCK ST 52 50.48 48.4 a 27.11 30.58 28.21 38.35 37.78 50.3 51.17 36.73 11
AREA C - CITY CENTRE
C1 340216 556131 LOWTHER ST 59.47 52.07 45.88 36.55 32.93 36.59 36.44 41.17 38.19 50.67 55.99 40.49 12
C2 340069 555955 TOURIST INFO 26.16 43.63 19.19 12.44 13.93 13.32 11.39 12.9 13.87 23.13 22.89 16.42 12
C3 340218 555768 DEVONSHIRE ST 42.04 37.76 44.34 43.22 39.04 32.33 36.16 33.65 40.11 46.79 50.72 36.66 12
C4 340286 555622 BAR SOLO 46.65 39.64 36.58 36.16 41.32 32.6 32.46 33.46 30.41 44.15 41.01 33.45 12
C5 340298 555589 GRIFFIN 47.84 49.37 45.23 34.45 36.48 35.72 34.97 40.19 41.16 44.58 52.8 28.54 12
AREA D - A69 WARWICK ROAD
D10 342044 555907 368 WARWICK RD 43.46 41.41 39.69 26.29 28.6 24.03 24.22 31.53 27.69 34.49 45.85 39.05 12
D11 340426 556040 CARTEF 43.49 41.83 42.03 35.24 23.97 29.3 29.43 29.09 31.89 45.31 42.69 31.79 12
D12 340307 555718 POST OFFICE 55.18 55.85 50.65 33.8 35.08 36.51 30.74 41.07 a 39.81 44.88 47.73 11
D5 341310 555914 215 WARWICK RD 30.01 29.7 29.89 26.66 25.86 21.37 20.58 21.93 21.98 30.65 27.07 29.5 12
D7 341593 555893 282 WARWICK RD 48.13 46.98 44.49 27.67 31.7 34.08 29.16 35.53 42.07 36.72 48.36 30.77 12
D9 341426 555910 251 WARWICK RD 35.78 33.46 39.86 27.21 30.51 24.34 24.23 27.14 28.16 31.68 35.11 31.44 12
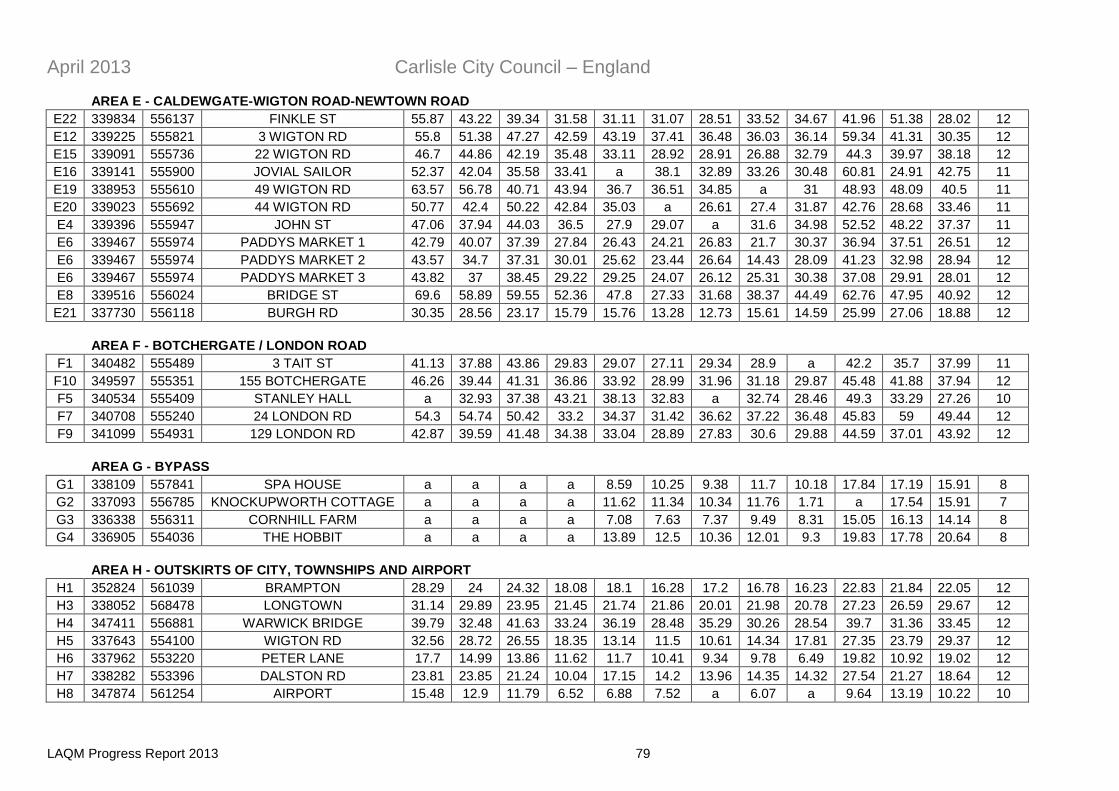
April 2013 Carlisle City Council – England
LAQM Progress Report 2013 79
AREA E - CALDEWGATE-WIGTON ROAD-NEWTOWN ROAD
E22 339834 556137 FINKLE ST 55.87 43.22 39.34 31.58 31.11 31.07 28.51 33.52 34.67 41.96 51.38 28.02 12
E12 339225 555821 3 WIGTON RD 55.8 51.38 47.27 42.59 43.19 37.41 36.48 36.03 36.14 59.34 41.31 30.35 12
E15 339091 555736 22 WIGTON RD 46.7 44.86 42.19 35.48 33.11 28.92 28.91 26.88 32.79 44.3 39.97 38.18 12
E16 339141 555900 JOVIAL SAILOR 52.37 42.04 35.58 33.41 a 38.1 32.89 33.26 30.48 60.81 24.91 42.75 11
E19 338953 555610 49 WIGTON RD 63.57 56.78 40.71 43.94 36.7 36.51 34.85 a 31 48.93 48.09 40.5 11
E20 339023 555692 44 WIGTON RD 50.77 42.4 50.22 42.84 35.03 a 26.61 27.4 31.87 42.76 28.68 33.46 11
E4 339396 555947 JOHN ST 47.06 37.94 44.03 36.5 27.9 29.07 a 31.6 34.98 52.52 48.22 37.37 11
E6 339467 555974 PADDYS MARKET 1 42.79 40.07 37.39 27.84 26.43 24.21 26.83 21.7 30.37 36.94 37.51 26.51 12
E6 339467 555974 PADDYS MARKET 2 43.57 34.7 37.31 30.01 25.62 23.44 26.64 14.43 28.09 41.23 32.98 28.94 12
E6 339467 555974 PADDYS MARKET 3 43.82 37 38.45 29.22 29.25 24.07 26.12 25.31 30.38 37.08 29.91 28.01 12
E8 339516 556024 BRIDGE ST 69.6 58.89 59.55 52.36 47.8 27.33 31.68 38.37 44.49 62.76 47.95 40.92 12
E21 337730 556118 BURGH RD 30.35 28.56 23.17 15.79 15.76 13.28 12.73 15.61 14.59 25.99 27.06 18.88 12
AREA F - BOTCHERGATE / LONDON ROAD
F1 340482 555489 3 TAIT ST 41.13 37.88 43.86 29.83 29.07 27.11 29.34 28.9 a 42.2 35.7 37.99 11
F10 349597 555351 155 BOTCHERGATE 46.26 39.44 41.31 36.86 33.92 28.99 31.96 31.18 29.87 45.48 41.88 37.94 12
F5 340534 555409 STANLEY HALL a 32.93 37.38 43.21 38.13 32.83 a 32.74 28.46 49.3 33.29 27.26 10
F7 340708 555240 24 LONDON RD 54.3 54.74 50.42 33.2 34.37 31.42 36.62 37.22 36.48 45.83 59 49.44 12
F9 341099 554931 129 LONDON RD 42.87 39.59 41.48 34.38 33.04 28.89 27.83 30.6 29.88 44.59 37.01 43.92 12
AREA G - BYPASS
G1 338109 557841 SPA HOUSE a a a a 8.59 10.25 9.38 11.7 10.18 17.84 17.19 15.91 8
G2 337093 556785 KNOCKUPWORTH COTTAGE a a a a 11.62 11.34 10.34 11.76 1.71 a 17.54 15.91 7
G3 336338 556311 CORNHILL FARM a a a a 7.08 7.63 7.37 9.49 8.31 15.05 16.13 14.14 8
G4 336905 554036 THE HOBBIT a a a a 13.89 12.5 10.36 12.01 9.3 19.83 17.78 20.64 8
AREA H - OUTSKIRTS OF CITY, TOWNSHIPS AND AIRPORT
H1 352824 561039 BRAMPTON 28.29 24 24.32 18.08 18.1 16.28 17.2 16.78 16.23 22.83 21.84 22.05 12
H3 338052 568478 LONGTOWN 31.14 29.89 23.95 21.45 21.74 21.86 20.01 21.98 20.78 27.23 26.59 29.67 12
H4 347411 556881 WARWICK BRIDGE 39.79 32.48 41.63 33.24 36.19 28.48 35.29 30.26 28.54 39.7 31.36 33.45 12
H5 337643 554100 WIGTON RD 32.56 28.72 26.55 18.35 13.14 11.5 10.61 14.34 17.81 27.35 23.79 29.37 12
H6 337962 553220 PETER LANE 17.7 14.99 13.86 11.62 11.7 10.41 9.34 9.78 6.49 19.82 10.92 19.02 12
H7 338282 553396 DALSTON RD 23.81 23.85 21.24 10.04 17.15 14.2 13.96 14.35 14.32 27.54 21.27 18.64 12
H8 347874 561254 AIRPORT 15.48 12.9 11.79 6.52 6.88 7.52 a 6.07 a 9.64 13.19 10.22 10
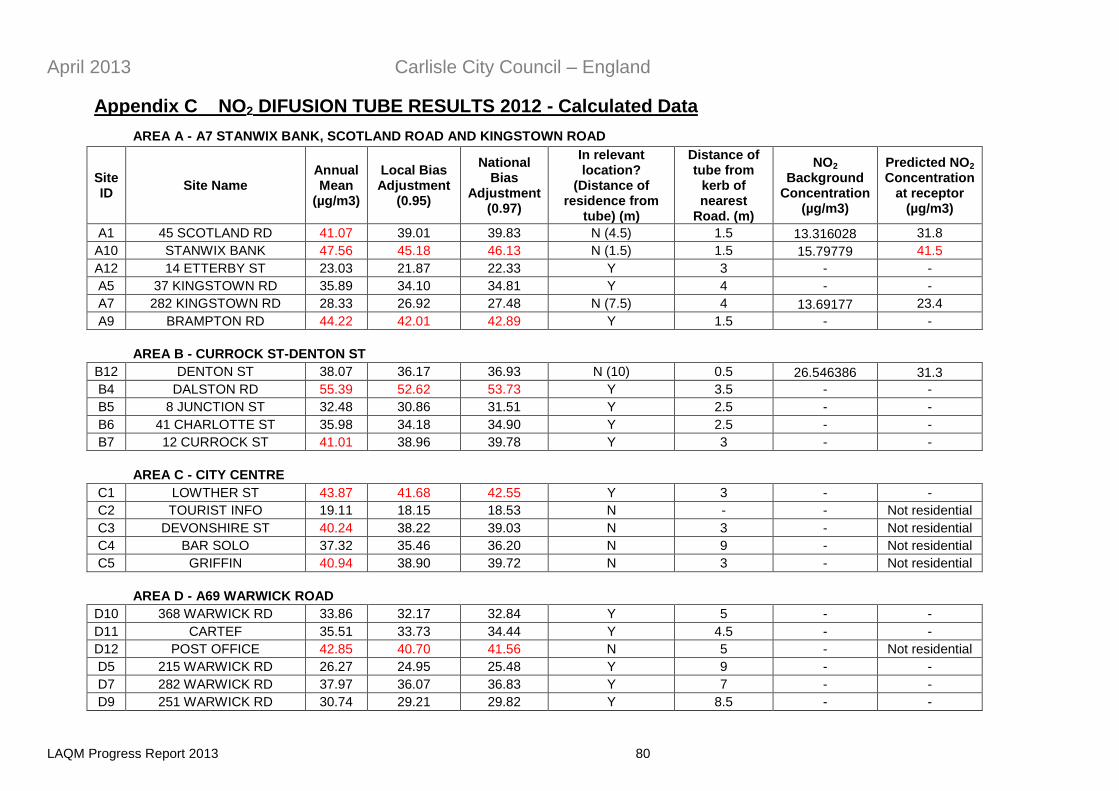
April 2013 Carlisle City Council – England
LAQM Progress Report 2013 80
Appendix C NO2 DIFUSION TUBE RESULTS 2012 - Calculated Data
AREA A - A7 STANWIX BANK, SCOTLAND ROAD AND KINGSTOWN ROAD
Site ID
Site Name Annual Mean
(µg/m3)
Local Bias Adjustment
(0.95)
National Bias
Adjustment (0.97)
In relevant location?
(Distance of residence from
tube) (m)
Distance of tube from
kerb of nearest
Road. (m)
NO2 Background
Concentration (µg/m3)
Predicted NO2 Concentration
at receptor (µg/m3)
A1 45 SCOTLAND RD 41.07 39.01 39.83 N (4.5) 1.5 13.316028 31.8
A10 STANWIX BANK 47.56 45.18 46.13 N (1.5) 1.5 15.79779 41.5
A12 14 ETTERBY ST 23.03 21.87 22.33 Y 3 - -
A5 37 KINGSTOWN RD 35.89 34.10 34.81 Y 4 - -
A7 282 KINGSTOWN RD 28.33 26.92 27.48 N (7.5) 4 13.69177 23.4
A9 BRAMPTON RD 44.22 42.01 42.89 Y 1.5 - -
AREA B - CURROCK ST-DENTON ST
B12 DENTON ST 38.07 36.17 36.93 N (10) 0.5 26.546386 31.3
B4 DALSTON RD 55.39 52.62 53.73 Y 3.5 - -
B5 8 JUNCTION ST 32.48 30.86 31.51 Y 2.5 - -
B6 41 CHARLOTTE ST 35.98 34.18 34.90 Y 2.5 - -
B7 12 CURROCK ST 41.01 38.96 39.78 Y 3 - -
AREA C - CITY CENTRE
C1 LOWTHER ST 43.87 41.68 42.55 Y 3 - -
C2 TOURIST INFO 19.11 18.15 18.53 N - - Not residential
C3 DEVONSHIRE ST 40.24 38.22 39.03 N 3 - Not residential
C4 BAR SOLO 37.32 35.46 36.20 N 9 - Not residential
C5 GRIFFIN 40.94 38.90 39.72 N 3 - Not residential
AREA D - A69 WARWICK ROAD
D10 368 WARWICK RD 33.86 32.17 32.84 Y 5 - -
D11 CARTEF 35.51 33.73 34.44 Y 4.5 - -
D12 POST OFFICE 42.85 40.70 41.56 N 5 - Not residential
D5 215 WARWICK RD 26.27 24.95 25.48 Y 9 - -
D7 282 WARWICK RD 37.97 36.07 36.83 Y 7 - -
D9 251 WARWICK RD 30.74 29.21 29.82 Y 8.5 - -
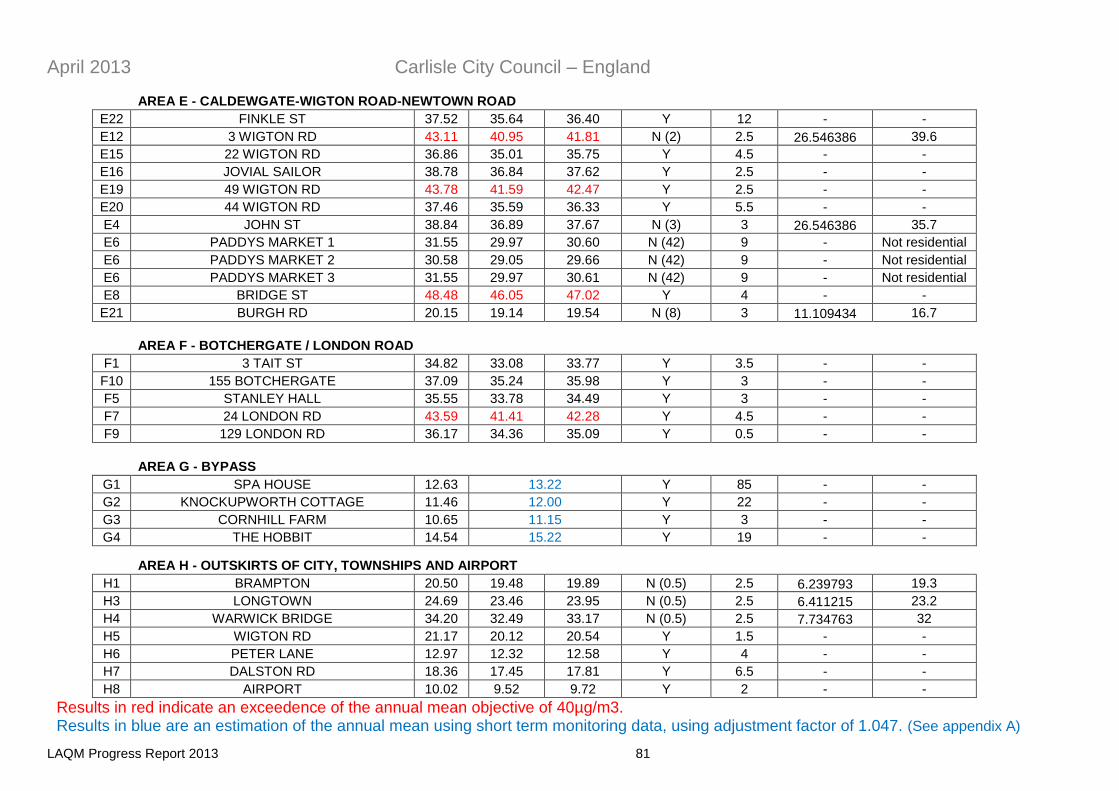
April 2013 Carlisle City Council – England
LAQM Progress Report 2013 81
AREA E - CALDEWGATE-WIGTON ROAD-NEWTOWN ROAD
E22 FINKLE ST 37.52 35.64 36.40 Y 12 - -
E12 3 WIGTON RD 43.11 40.95 41.81 N (2) 2.5 26.546386 39.6
E15 22 WIGTON RD 36.86 35.01 35.75 Y 4.5 - -
E16 JOVIAL SAILOR 38.78 36.84 37.62 Y 2.5 - -
E19 49 WIGTON RD 43.78 41.59 42.47 Y 2.5 - -
E20 44 WIGTON RD 37.46 35.59 36.33 Y 5.5 - -
E4 JOHN ST 38.84 36.89 37.67 N (3) 3 26.546386 35.7
E6 PADDYS MARKET 1 31.55 29.97 30.60 N (42) 9 - Not residential
E6 PADDYS MARKET 2 30.58 29.05 29.66 N (42) 9 - Not residential
E6 PADDYS MARKET 3 31.55 29.97 30.61 N (42) 9 - Not residential
E8 BRIDGE ST 48.48 46.05 47.02 Y 4 - -
E21 BURGH RD 20.15 19.14 19.54 N (8) 3 11.109434 16.7
AREA F - BOTCHERGATE / LONDON ROAD ROAD
F1 3 TAIT ST 34.82 33.08 33.77 Y 3.5 - -
F10 155 BOTCHERGATE 37.09 35.24 35.98 Y 3 - -
F5 STANLEY HALL 35.55 33.78 34.49 Y 3 - -
F7 24 LONDON RD 43.59 41.41 42.28 Y 4.5 - -
F9 129 LONDON RD 36.17 34.36 35.09 Y 0.5 - -
AREA G - BYPASS
G1 SPA HOUSE 12.63 13.22 Y 85 - -
G2 KNOCKUPWORTH COTTAGE 11.46 12.00 Y 22 - -
G3 CORNHILL FARM 10.65 11.15 Y 3 - -
G4 THE HOBBIT 14.54 15.22 Y 19 - -
AREA H - OUTSKIRTS OF CITY, TOWNSHIPS AND AIRPORT
H1 BRAMPTON 20.50 19.48 19.89 N (0.5) 2.5 6.239793 19.3
H3 LONGTOWN 24.69 23.46 23.95 N (0.5) 2.5 6.411215 23.2
H4 WARWICK BRIDGE 34.20 32.49 33.17 N (0.5) 2.5 7.734763 32
H5 WIGTON RD 21.17 20.12 20.54 Y 1.5 - -
H6 PETER LANE 12.97 12.32 12.58 Y 4 - -
H7 DALSTON RD 18.36 17.45 17.81 Y 6.5 - -
H8 AIRPORT 10.02 9.52 9.72 Y 2 - -
Results in red indicate an exceedence of the annual mean objective of 40µg/m3. Results in blue are an estimation of the annual mean using short term monitoring data, using adjustment factor of 1.047. (See appendix A)
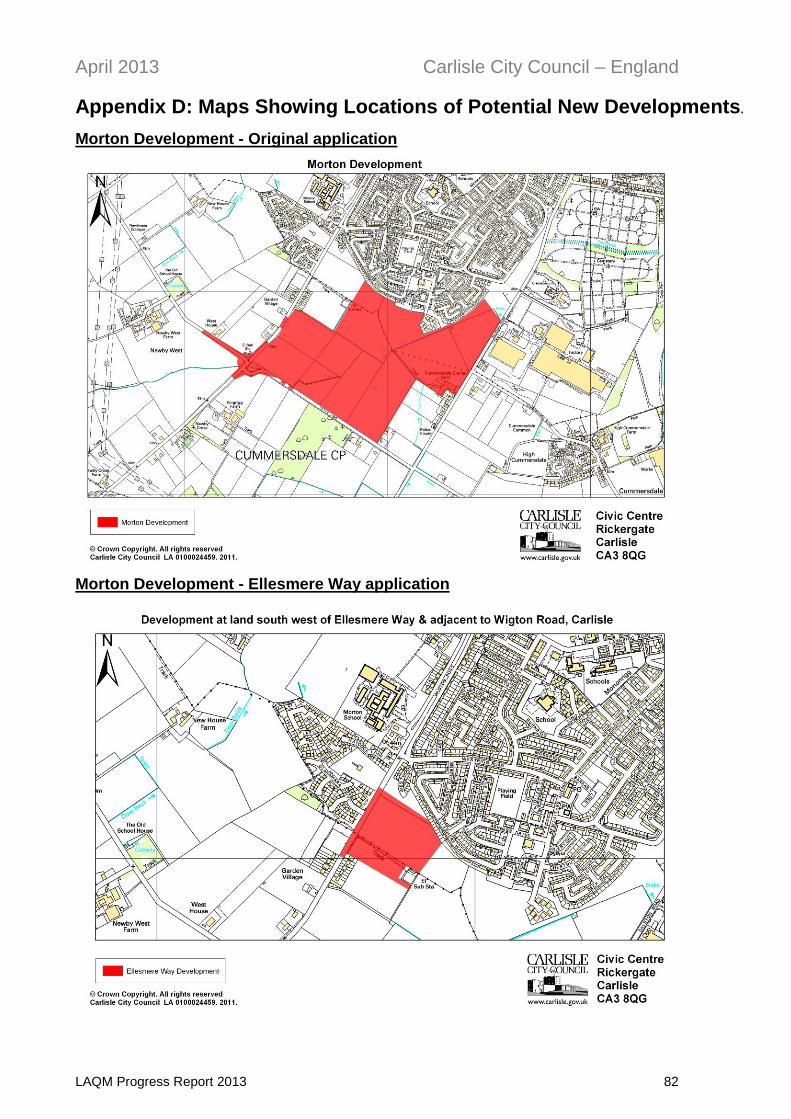
April 2013 Carlisle City Council – England
LAQM Progress Report 2013 82
Appendix D: Maps Showing Locations of Potential New Developments.
Morton Development - Original application
Morton Development - Ellesmere Way application
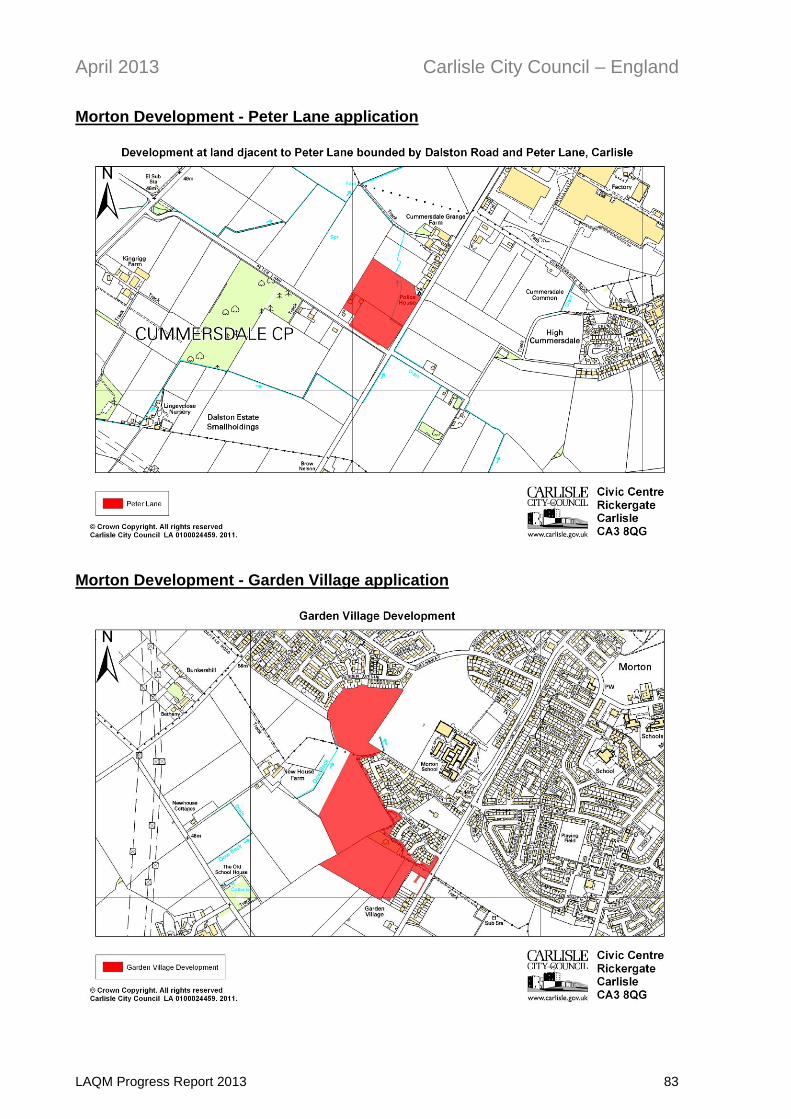
April 2013 Carlisle City Council – England
LAQM Progress Report 2013 83
Morton Development - Peter Lane application
Morton Development - Garden Village application
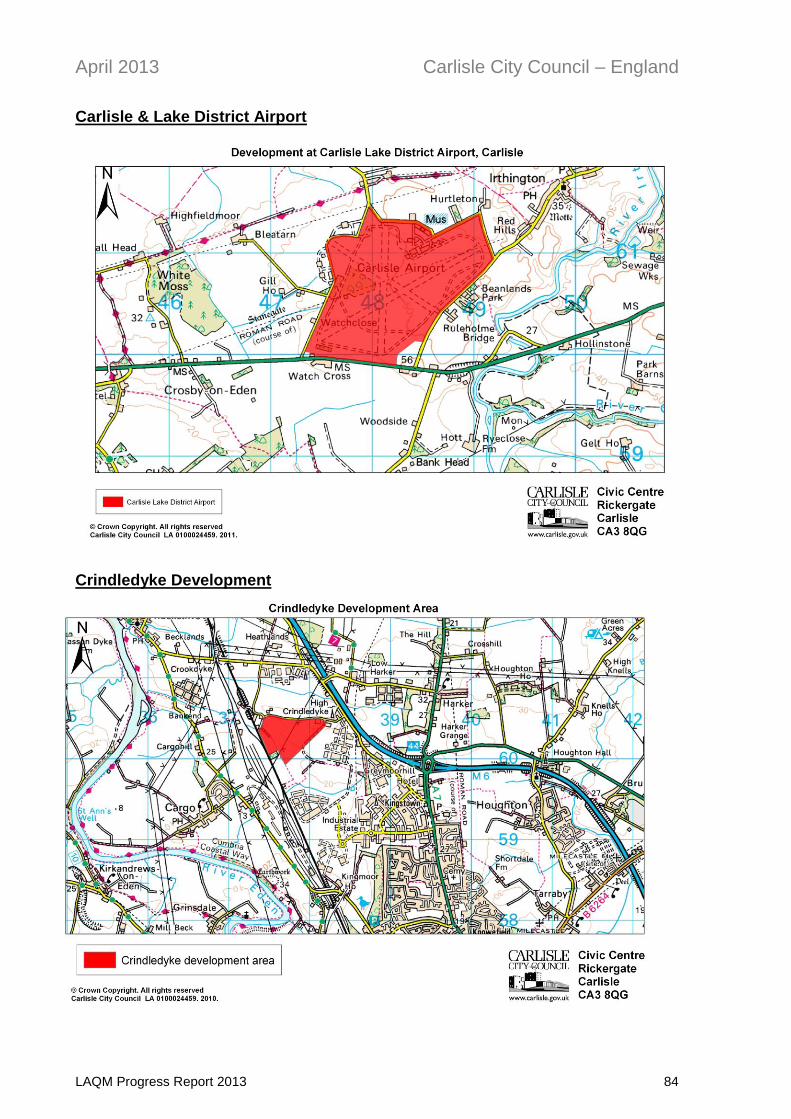
April 2013 Carlisle City Council – England
LAQM Progress Report 2013 84
Carlisle & Lake District Airport
Crindledyke Development
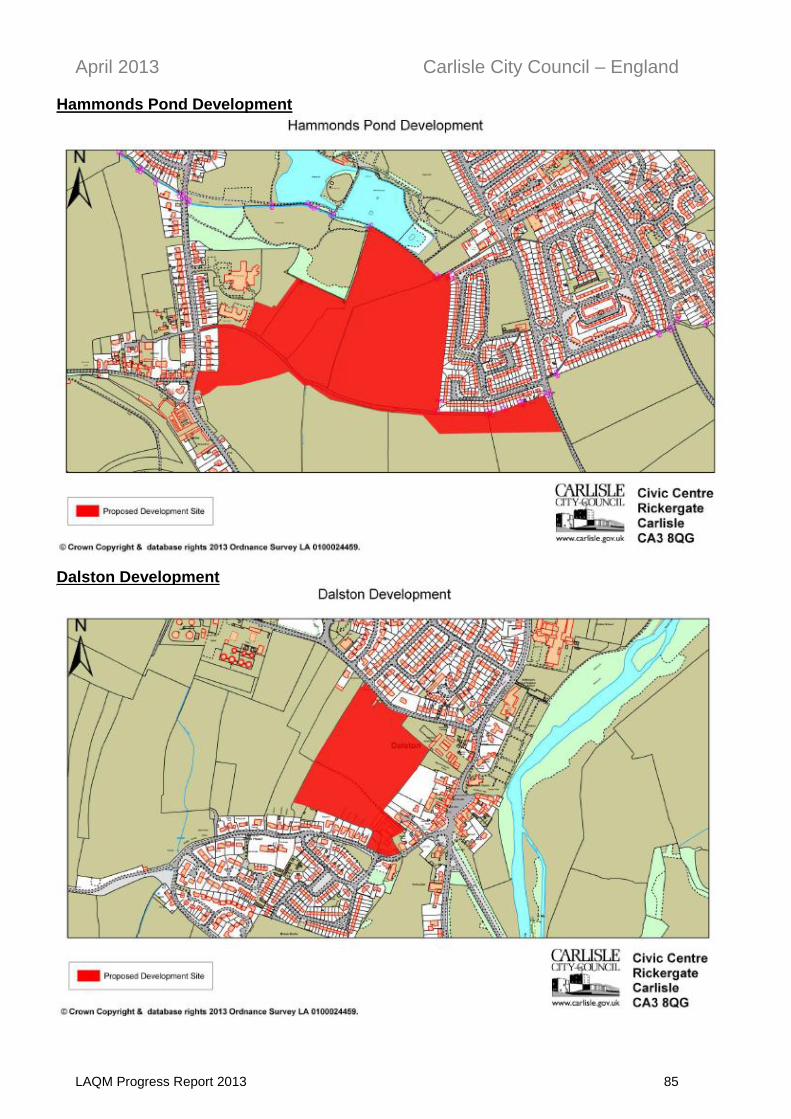
April 2013 Carlisle City Council – England
LAQM Progress Report 2013 85
Hammonds Pond Development
Dalston Development
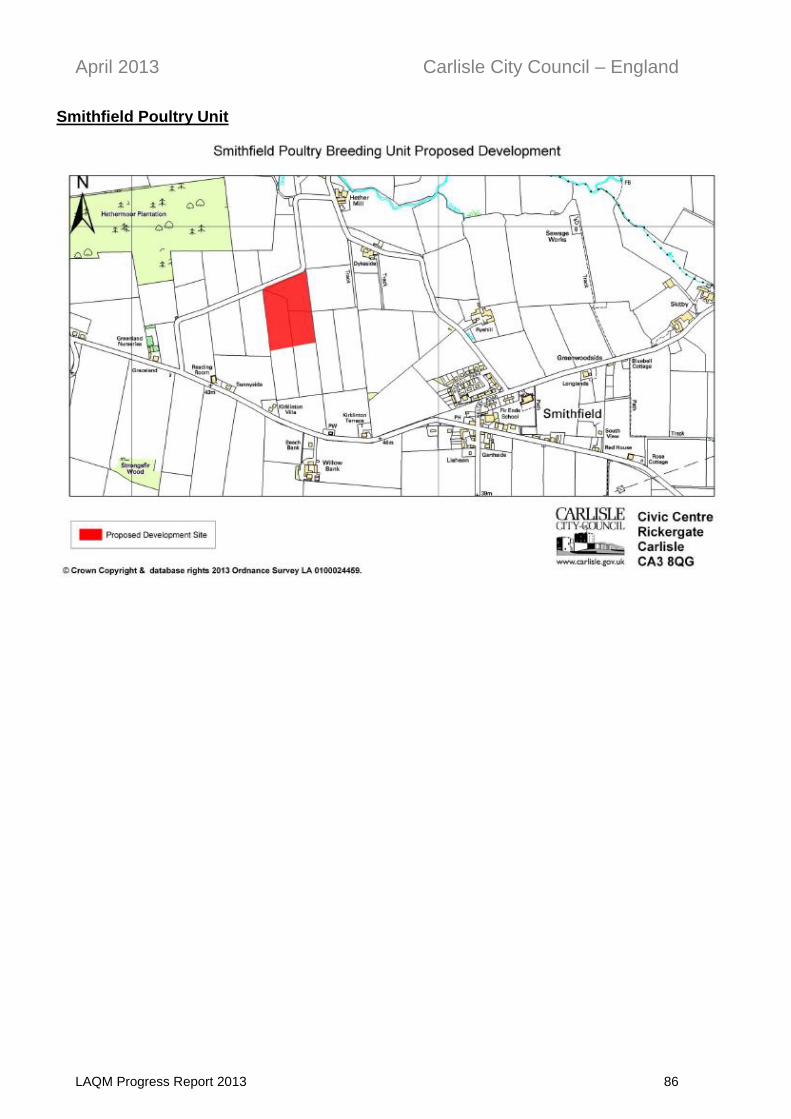
April 2013 Carlisle City Council – England
LAQM Progress Report 2013 86
Smithfield Poultry Unit