age profile, personnel costs and scientific productivity at the university of vienna
TRANSCRIPT
The Mutual Information of University-Industry-Government
Relations: An Indicator of the Triple Helix Dynamics
Loet Leydesdorff
Science & Technology Dynamics, University of Amsterdam
Amsterdam School of Communications Research (ASCoR)
Kloveniersburgwal 48, 1012 CX Amsterdam, The Netherlands
[email protected] ; http://www.leydesdorff.net/
Abstract
University-industry-government relations provide a networked infrastructure for
knowledge-based innovation systems. This infrastructure organizes the dynamic
fluxes locally and the knowledge base remains emergent given these conditions.
Whereas the relations between the institutions can be measured as variables, the
interacting fluxes generate a probabilistic entropy. The mutual information among
the three institutional dimensions provides us with an indicator of this entropy.
When this indicator is negative, self-organization can be expected. The self-
organizing dynamic may temporarily be stabilized in the overlay of communications
among the carrying agencies. The various dynamics of Triple Helix relations at the
global and national levels, in different databases, and in different regions of the
world, are distinguished by applying this indicator to scientometric and webometric
data.

1. Introduction
In 1953, Linus Pauling and Robert B. Corey proposed that DNA was made up of
three chains, twisted around each other in ropelike helices (Pauling & Corey, 1953).
A few months later, James Watson and Francis Crick proposed the double helix,
which was then quickly accepted as the correct structure of DNA (Watson & Crick,
1953). This discovery led to a Nobel Prize (Watson, 1970).
Double helices can under circumstances stabilize in a coevolution, but triple helices
may contain all kinds of chaotic behaviour (Poincaré, 1905). Triple Helix models
continue to be useful in studying transition processes, for example, in
crystallography and molecular biology. More recently, Richard Lewontin (2000)
used the metaphor of a Triple Helix for modeling the relations between genes,
organisms, and environments.
In a different context, Henry Etzkowitz and I introduced a Triple Helix model for
the dynamics of university-industry-government relations (Etzkowitz &
Leydesdorff, 1995). Our argument for using this neo-evolutionary model was that a
knowledge-based regime of innovations can be expected to remain in transition. A
Triple Helix can contain double helices as temporary stabilizations, but a system of
three dynamics is meta-stabilized. Under specific conditions the next-order system
of an overlay of communications can also be globalized and then exhibit self-
organization. Globalization means in this context that the next-order (emerging)
overlay gains priority in determining the dynamics of the underlying ones (on which
2
it rests). Thus, a Triple Helix model may be sufficiently complex to encompass the
different species of observable behaviour in the networks under study.
The advantages of using the Triple Helix model can be specified with reference to
different research traditions. First, one is able to study specific configurations of
university-industry-government relations as instantiations of the Triple Helix
dynamics of a knowledge-based innovation system (Giddens, 1984; Leydesdorff &
Etzkowitz, 1998). In this context of specification, the Triple Helix metaphor
functions as a heuristics. The institutional configurations in knowledge-based
systems can be considered as the outcome of three (functional) subdynamics of
competitive systems: (a) the economic dynamic of wealth generation through
exchange, (b) the knowledge-based dynamic of reconstruction and innovation over
time, and (c) the political and managerial need and urge for normative control at the
interfaces. The carriers of these three functions do no longer have to exhibit a one-
to-one correspondence to industry, university, and government, respectively. The
institutions can be expected to experiment with new formats in their mutual
arrangements (Etzkowitz & Leydesdorff, 1997).
While the heuristic application of the Triple Helix metaphor can be made useful for
the historical specification, the neo-evolutionary model of the two layers of
functions and institutions operating upon each other opens a space of possible
interactions. The evolutionary system has an option to reconstruct itself in the
present with reference to the historical configurations that have occurred. The
functional dimension can be provided with priority if a next-order system (e.g., a
3
relevant selection environment) can be defined. Are the institutional arrangements
still functional?
For example, participants who are entrained in co-evolutions of mutual shaping
between two helices can be expected to ‘lock-in’ (David, 1985; Arthur, 1988). The
internal perspectives of these participant-observers can be distinguished from the
perspective of an external (that is, third) observer. The latter is able to evaluate. The
switch to the external perspective enables the analyst to search for options emerging
from interactions that cannot be perceived from within the co-evolution. The
configuration under study can then be reconstructed on the basis of knowledge.
Thus, a knowledge base for the reconstruction can emerge as different from an
institutional rationale.
The two layers of functions and institutions can also be considered as degrees of
freedom. For example, one can question whether a network at the institutional level
is functionally efficient and whether it provides dynamic scale effects. (The latter
can be considered as emergent synergies.) The functional perspective and the
institutional perspective can be used for the optimization and the reorganization in
different cycles.
4

2. The representation of a Triple Helix dynamics
A Triple Helix configuration can be depicted statically using social network analysis
or in more general terms, as partially overlapping sets (e.g., Venn-diagrams; see also
figure 2 below). While a Triple Helix dynamics can be expected to remain in flux,
the geometrical representation focuses necessarily on one subdynamics or another
by taking a perspective. For example, one can measure instantiations of a Triple
Helix in terms of variables or trajectories along the time axis. An evolutionary
system, however, can go through reconstructions of the complex system in the
present. The system is complex at different levels, since the various subdynamics
can be recombined algorithmically.
How can the values of the variables at each moment in time be related to the
dynamic operation over time? Using a calculus one can study changes in the value
of a variable (x = a) in relation to changes in the variable (dx/dt). Following a
suggestion of Bar-Hillel (1955), Leydesdorff (1995) proposed to use information
calculus for this purpose. In this study, I elaborate this calculus for Triple Helix
dynamics, but let me first explain the concept of the mutual information in three
dimensions using graphical representations.
Already in 1979, Goguen and Varela proposed a representation of a complex and
self-organizing system using a holographic model of three interacting dynamics:
5

Figure 1 A schematic depiction of a complex system by Goguen & Varela (1979) At each step (i-1, i, i+1), the emerging system is composed of interaction effects
among the previous stages of the three participating systems. In addition, however,
to the recursion of the interaction among the helices, a model of university-industry-
government relations should encompass the recursive dynamics within each of the
helices along their respective time axes. The differences in these subdynamics may
break the symmetries suggested by this representation.
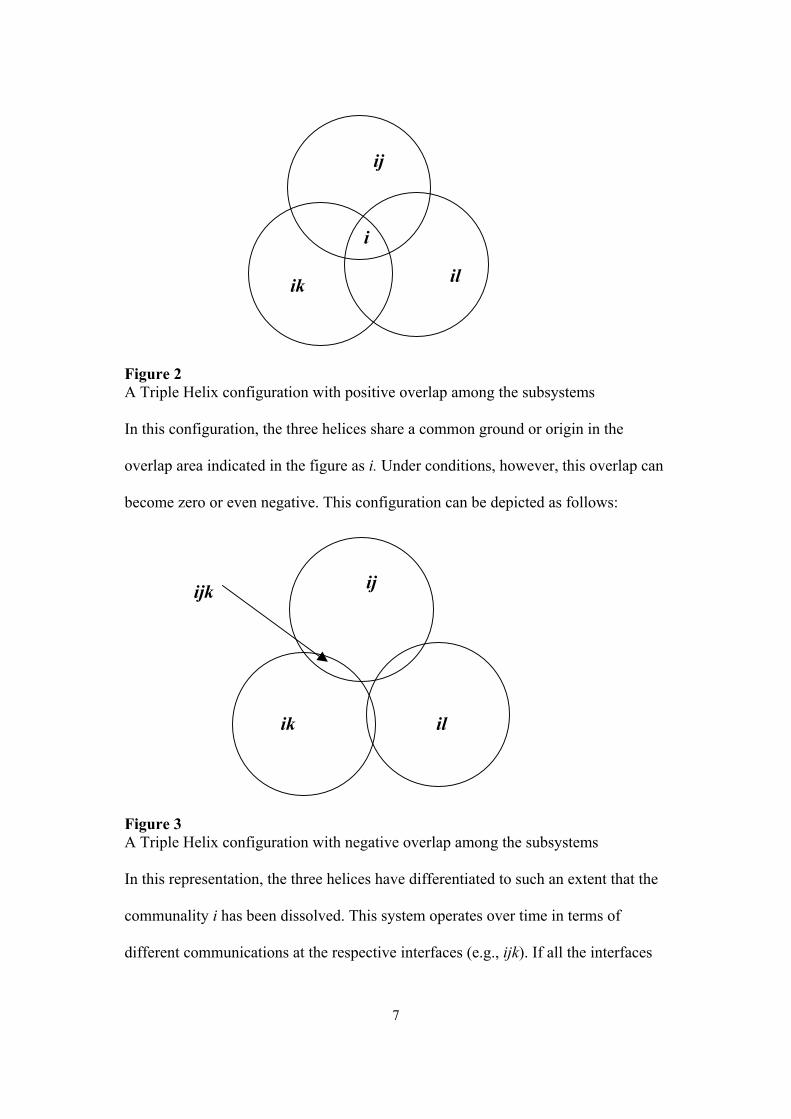
Let us develop a model that is both interactive and recursive step by step. First,
consider three helices as sets that overlap in the intersections, as follows:
6
ij
il
i
ik
Figure 2 A Triple Helix configuration with positive overlap among the subsystems In this configuration, the three helices share a common ground or origin in the
overlap area indicated in the figure as i. Under conditions, however, this overlap can
become zero or even negative. This configuration can be depicted as follows:
ij
ik
ijk
il
Figure 3 A Triple Helix configuration with negative overlap among the subsystems In this representation, the three helices have differentiated to such an extent that the
communality i has been dissolved. This system operates over time in terms of
different communications at the respective interfaces (e.g., ijk). If all the interfaces
7

operate, one can consider the result as the emergence of a ‘hypercycle’ (Figure 4).
The hypercyclic configuration integrates the three systems in a distributed mode. It
fails to integrate completely, or one can also say that the integration remains
subsymbolic.
ik
ijk ijtime
il
Figure 4 Ex post integration in an ‘emerging’ hypercycle by recombining different interactions This configuration can be expected to exhibit ‘self-organizing’ properties because
the various transmissions are no longer integrated at a single place. Since a common
domain of instantaneous integration is lacking, each integration leads at the same
time to a re-differentiation. Integration fails in this configuration at each moment in
time, but it may take place over the time dimension.
It can be shown that under the condition of a lack of overlap among the three sets,
the mutual information in three dimensions is negative (Abramson, 1963). From the
perspective of each binary interface, the third dimension remains then ‘latent’ as a
8

structural given in the background. This third system entertains interfaces with each
of the first two, but not directly (or less so) with their interaction. The structural
function of the third system remains beyond the control of each two relating
systems, but this latent structure in the network reduces the uncertainty that prevails
when the first two systems interact.
In the Triple Helix model of university-industry-government relations the
hypercyclic integration can be identified as an overlay of negotiations and exchange
relations among the institutional carriers of the Triple Helix dynamics. Insofar as the
hypercycle operates it functions as a virtual feedback on the network of relations
among the institutional agents at each moment in time.
4. Methodology
The mutual information in the three dimensions of the Triple Helix enables us to
measure networks at each moment in time in terms of probability distributions and
to evaluate the measurement results in terms of the dynamics. Unlike co-variation,
correlation or co-occurrence measurements, the mutual information is defined in the
case of interactions among three dimensions. However, the mutual information in
three dimensions can no longer be considered as a similarity measure. It informs us
about the size and the sign of the probabilistic entropy generated by the interactions
within the complex system.
9
Conceptually, the generation of a negative entropy corresponds with the idea of
complexity that is contained or ‘self-organized’ in a network of relations that lacks
central coordination. The network system may then be able to propel itself in an
evolutionary mode by alternating and recombining the various subdynamics. The
reduction of the uncertainty is a result of the bi-lateral relations operating upon each
other. The network contains more uncertainty-reducing structure than is visible for
the interacting agents at their respective interfaces. This negative entropy is
generated because the flux is constrained by the existing structure of institutional
relations.
How does this relate to the measurement? Triple Helix relations can be measured in
terms of relevant variables (e.g., budgets, collaborations, citations). From this
perspective, the historical description of a specific configuration can be considered
as measurement with only nominal variables (that is, words used for the
description). In detailed (“thick”) descriptions, one is able to evaluate whether
something was the case or not. However, one can often specify the intensity of the
relationship at a more aggregated level using measurement scales more refined than
the binary one. To which extent was something the case?
For example, when comparing science parks, one may be able to count instances in
which government agencies were involved in these academic-industry relations, and
to which extent. In other cases, one may be able to measure more precisely, for
example, along a scale. The measurement can be based on various measurement
scales, but the networks can always be compared as relative frequency distributions.
10
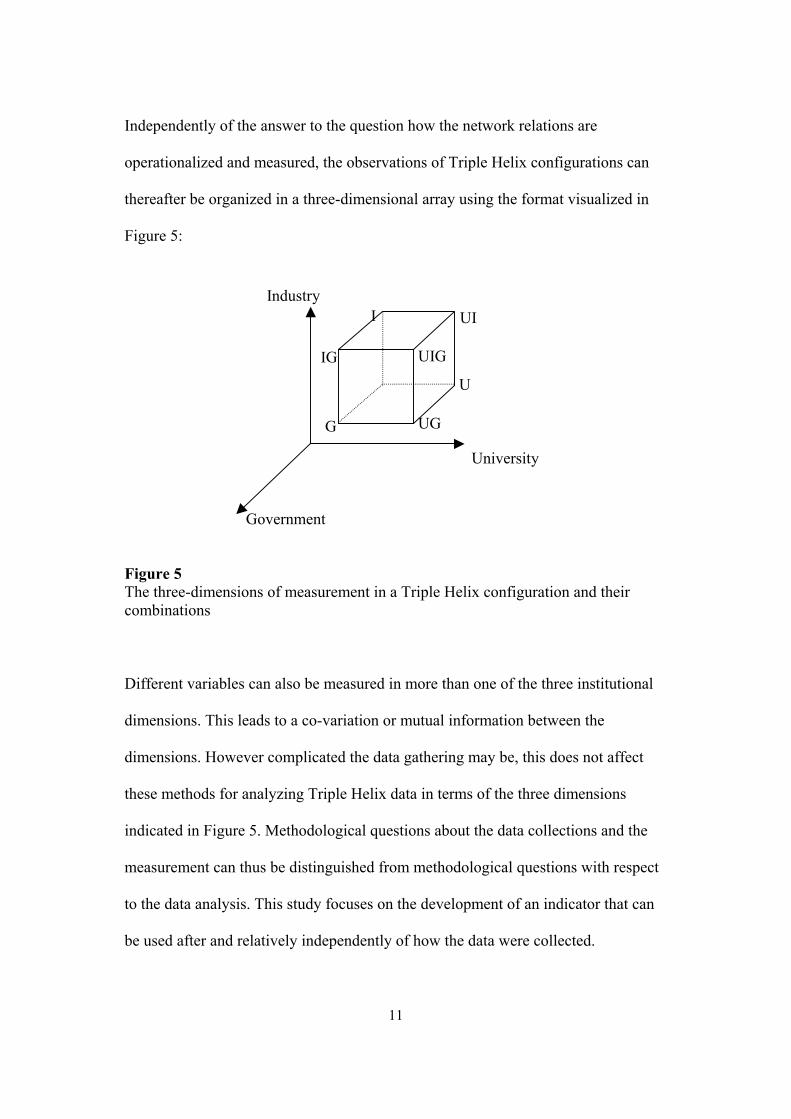
Independently of the answer to the question how the network relations are
operationalized and measured, the observations of Triple Helix configurations can
thereafter be organized in a three-dimensional array using the format visualized in
Figure 5:
IG
U
I UI
University
Government
Industry
UG
UIG
G
Figure 5 The three-dimensions of measurement in a Triple Helix configuration and their combinations
Different variables can also be measured in more than one of the three institutional
dimensions. This leads to a co-variation or mutual information between the
dimensions. However complicated the data gathering may be, this does not affect
these methods for analyzing Triple Helix data in terms of the three dimensions
indicated in Figure 5. Methodological questions about the data collections and the
measurement can thus be distinguished from methodological questions with respect
to the data analysis. This study focuses on the development of an indicator that can
be used after and relatively independently of how the data were collected.
11
In general, network data can be considered as relative frequency distributions. A
relative frequency distribution can be written as a probability distribution. The
description of the network data in terms of probability distributions enables us to use
Shannon’s (1948) mathematical theory of communication. A probability distribution
contains an uncertainty. The expected information content of the message that these
events have happened with this observed frequency distribution, can be expressed in
terms of bits of information using the Shannon-formulas (Abramson, 1963; Theil,
1972; Leydesdorff, 1995).
The mutual information between two dimensions of the probability distribution (for
example, in university-industry (UI) relations) is then equal to the transmission (T)
of the uncertainty (Theil, 1972):
TUI = HU + HI – HUI
The relationship reduces the uncertainty for the two relating systems (with –HUI).
Abramson (1963, at p. 129) showed that the mutual information in three dimensions
can be derived as:
TUIG = HU + HI + HG – HUI – HIG – HUG + HUIG
Note that the uncertainty of the variables measured in each of the interacting
systems (HU, HI, and HG) is reduced at the system’s level by the relations at the
12
interfaces between them, but the three-dimensional uncertainty adds positively to the
uncertainty that prevails. Because of this alteration of the signs, the three-
dimensional transmission can become negative. As noted, this reduction of the
uncertainty by the negative transmission is a result of the network configuration of
bi-lateral relations that develops without central coordination (Figure 4).
5. Results
In order to show the usefulness of this indicator, I will apply it to relatively
straightforward data like search results with the terms ‘university,’ ‘industry,’
‘government,’ and their combinations with Boolean AND operators in various
databases. As noted, the measurement problems in the data collections are
backgrounded in favour of the data analysis. The data collection is based on raw
search strategies that result in approximate figures, but which serve us here mainly
for the illustration of the argument.
The research question behind the searches is whether and the extent to which the
relations among these retrieval terms enable us to reveal a Triple Helix dynamics
operating. At which level can a self-propelling dynamic of network relations be
observed, and to what extent? I first turn to the Internet for retrieving relevant time-
series data and then use also the Science Citation Index to measure these relations at
national and international levels.
13
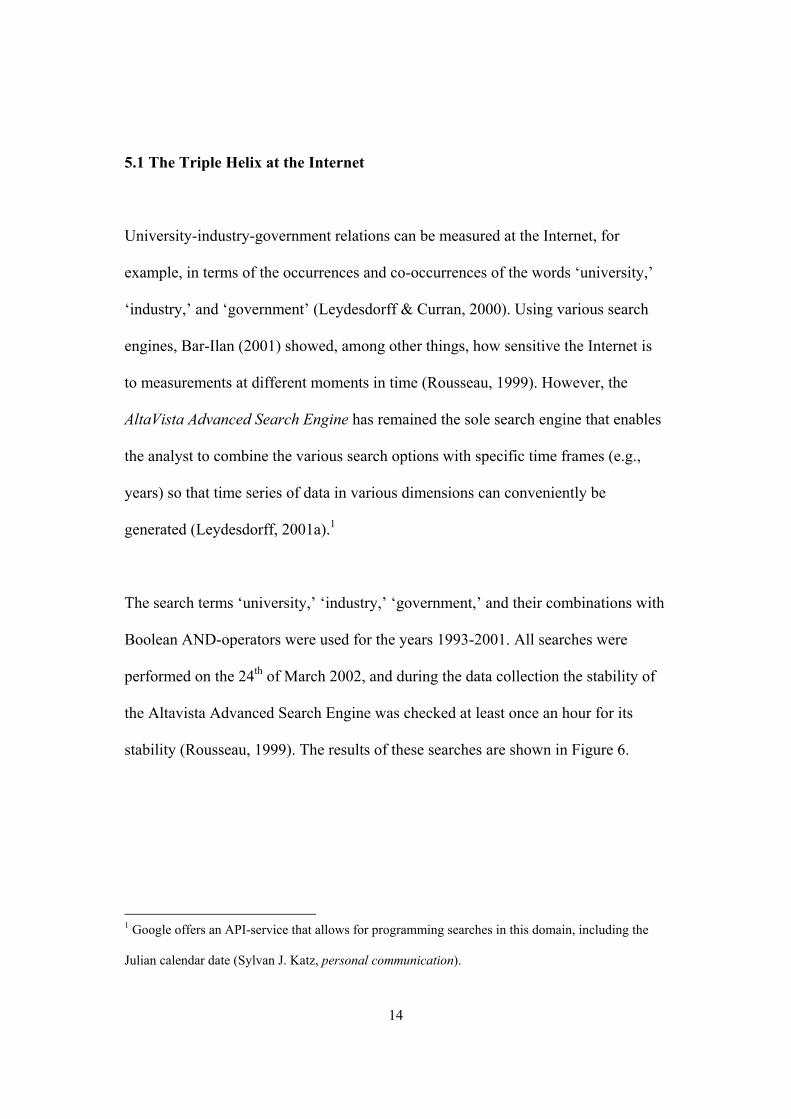
5.1 The Triple Helix at the Internet
University-industry-government relations can be measured at the Internet, for
example, in terms of the occurrences and co-occurrences of the words ‘university,’
‘industry,’ and ‘government’ (Leydesdorff & Curran, 2000). Using various search
engines, Bar-Ilan (2001) showed, among other things, how sensitive the Internet is
to measurements at different moments in time (Rousseau, 1999). However, the
AltaVista Advanced Search Engine has remained the sole search engine that enables
the analyst to combine the various search options with specific time frames (e.g.,
years) so that time series of data in various dimensions can conveniently be
generated (Leydesdorff, 2001a).1
The search terms ‘university,’ ‘industry,’ ‘government,’ and their combinations with
Boolean AND-operators were used for the years 1993-2001. All searches were
performed on the 24th of March 2002, and during the data collection the stability of
the Altavista Advanced Search Engine was checked at least once an hour for its
stability (Rousseau, 1999). The results of these searches are shown in Figure 6.
1 Google offers an API-service that allows for programming searches in this domain, including the
Julian calendar date (Sylvan J. Katz, personal communication).
14
0
5000000
10000000
15000000
20000000
25000000
30000000
1993
1995
1997
1999
2001
University
Industry
Government
UI
UG
IG
UIG
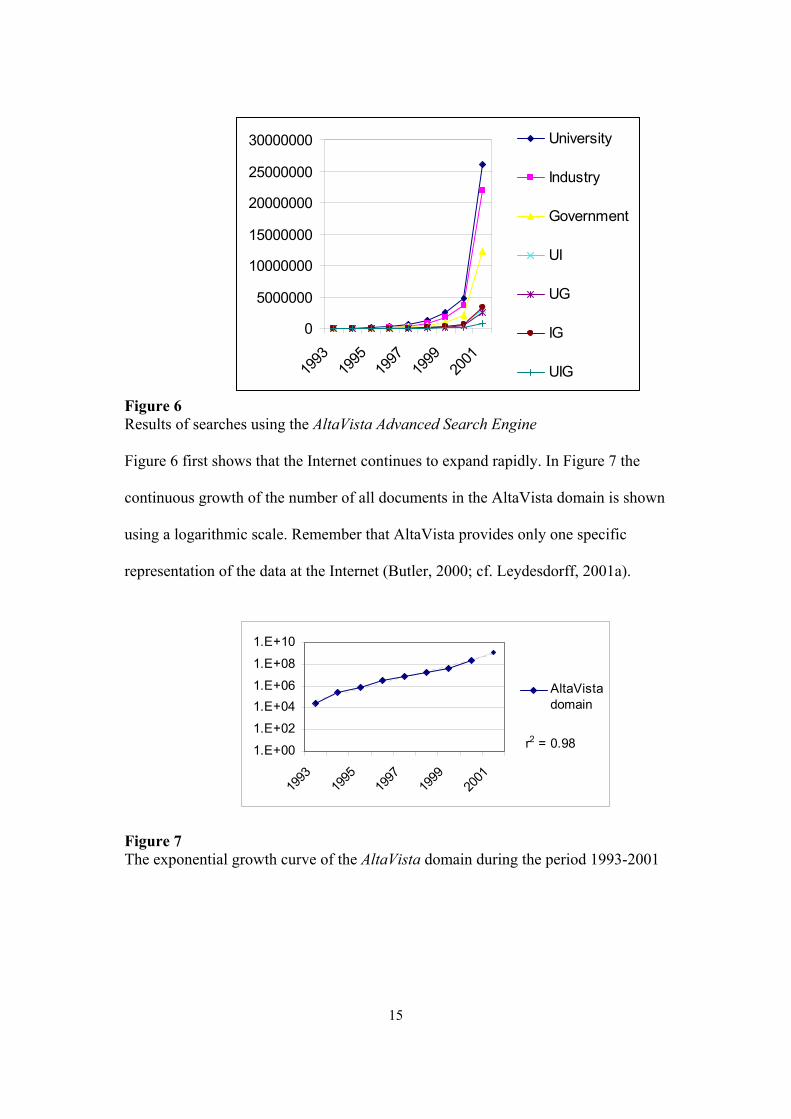
Figure 6 Results of searches using the AltaVista Advanced Search Engine Figure 6 first shows that the Internet continues to expand rapidly. In Figure 7 the
continuous growth of the number of all documents in the AltaVista domain is shown
using a logarithmic scale. Remember that AltaVista provides only one specific
representation of the data at the Internet (Butler, 2000; cf. Leydesdorff, 2001a).
r2 = 0.981.E+00
1.E+02
1.E+041.E+06
1.E+08
1.E+10
1993
1995
1997
1999
2001
AltaVistadomain
Figure 7 The exponential growth curve of the AltaVista domain during the period 1993-2001
15
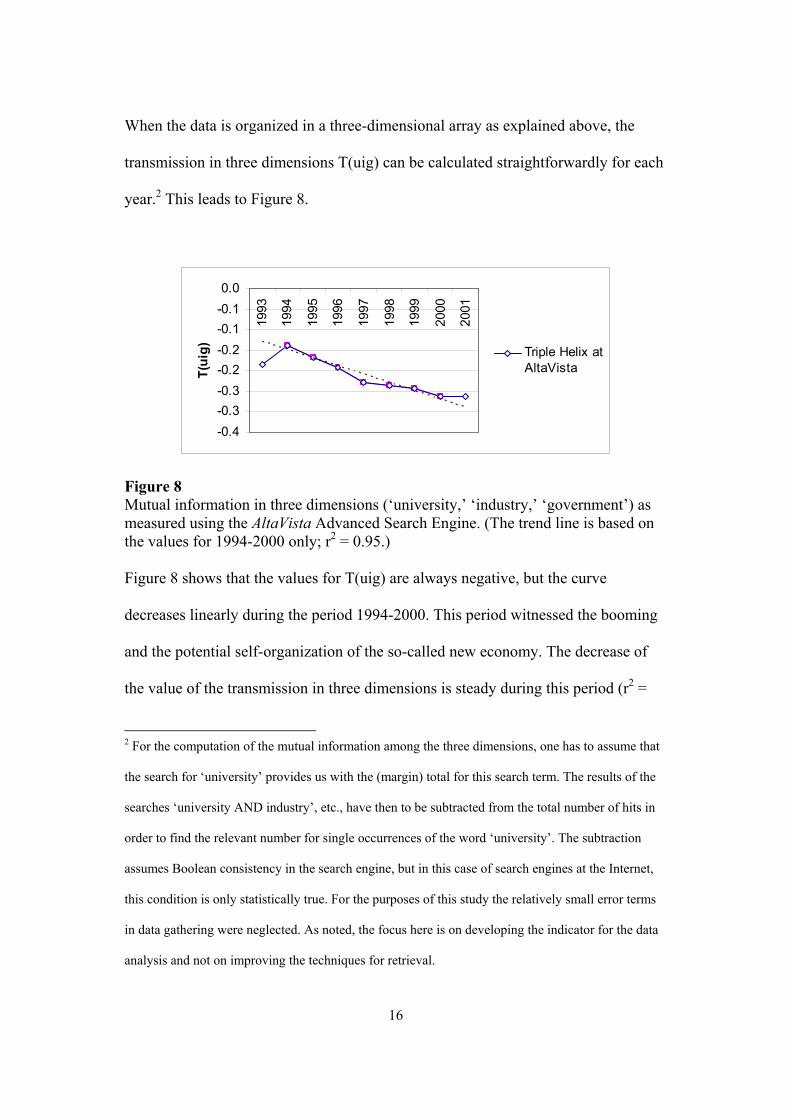
When the data is organized in a three-dimensional array as explained above, the
transmission in three dimensions T(uig) can be calculated straightforwardly for each
year.2 This leads to Figure 8.
-0.4-0.3-0.3-0.2-0.2-0.1-0.10.0
1993
1994
1995
1996
1997
1998
1999
2000
2001
T(ui
g) Triple Helix atAltaVista
Figure 8 Mutual information in three dimensions (‘university,’ ‘industry,’ ‘government’) as measured using the AltaVista Advanced Search Engine. (The trend line is based on the values for 1994-2000 only; r2 = 0.95.) Figure 8 shows that the values for T(uig) are always negative, but the curve
decreases linearly during the period 1994-2000. This period witnessed the booming
and the potential self-organization of the so-called new economy. The decrease of
the value of the transmission in three dimensions is steady during this period (r2 =
2 For the computation of the mutual information among the three dimensions, one has to assume that
the search for ‘university’ provides us with the (margin) total for this search term. The results of the
searches ‘university AND industry’, etc., have then to be subtracted from the total number of hits in
order to find the relevant number for single occurrences of the word ‘university’. The subtraction
assumes Boolean consistency in the search engine, but in this case of search engines at the Internet,
this condition is only statistically true. For the purposes of this study the relatively small error terms
in data gathering were neglected. As noted, the focus here is on developing the indicator for the data
analysis and not on improving the techniques for retrieval.
16

0.95). Perhaps the flattening of the curve in recent years illustrates that the process
of endogenous expansion of the Internet has been interrupted temporarily as the e-
business has gone into a recession. Note that this change in the dynamics is not
noticeable upon visual inspection of the growth data in Figures 6 and 7.
5.2 Testing for Systemness in the Overlay of Triple Helix Relations
What does the effect of increasingly negative values for T(uig) teach us when
compared to the descriptive statistics? Does it indicate the self-organization of a
virtual dimension in the overlay of relations generated by the co-occurrences? Can
this, indeed, be considered as an indication of increasing self-organization of the
system of relations? Are the underlying data in each of the helices also being
reorganized by the emerging system at the overlay level?
Emerging systemness in data sets can be tested against the alternative of historical
development of the elements of the system along the time axis (Leydesdorff, 1995).
While the overlay in the Triple Helix model may exhibit systemness, the carrying
institutions continue to develop historically; but the overlay system would then
provide another selection environment for them at the global level, that is, in a
(historically changing) present. Negative entropy first indicates that the overlay
system provides the carrying systems with information relevant to reduce the
uncertainty in the present. But has this feedback also become stabilized as a
systemic subdynamic?
17
In the case of emerging systemness, one can expect a data set increasingly to contain
the Markov property. The Markov property states that the current state of a system is
the best prediction of its next stage.3 If systemness is not achieved, however, the
normalized sum of the longitudinal predictions for the various elements provides us
with the best prediction for a next state. These two hypotheses (of systemic
development versus independent development of the elements, respectively) can be
tested against each other for predicting next year’s data. When the predicted values
are subsequently observed, the quality of the two predictions can be evaluated (e.g.,
Leydesdorff & Oomes, 1999; Riba-Vilanova & Leydesdorff, 2001).4
This test was applied using the time series data 1993-2000 for the prediction of 2001
data. Comparison with the observed data for 2001 led to the following results:
3 Complex systems can also exhibit non Markovian features, when they have a memory. Such
systems can be modeled as Markov processes with memory (Ebeling et al., 1995).
4 Since the historical prediction is dependent of the year used as the first year for the longitudinal
analysis, the predictions for all possible starting year are routinely calculated and the one prediction is
selected with the best fit so that the possibility of rejection of the hypothesis of systemness in the data
under study is maximized.
18
prediction of the value in 2001
7 categories (U, I, G, UI, UG, IG, UIG)
four categories (UI, UG, IG, UIG)
three categories (UI, UG, IG)
on the basis of the univariate time series (1993-2000)
2.06 5.93 5.06
on the basis of the previous year (2000) (Markov property)
2.83 5.54 4.15
hypothesis of systemness - 0.77
(rejected)
0.39
0.91
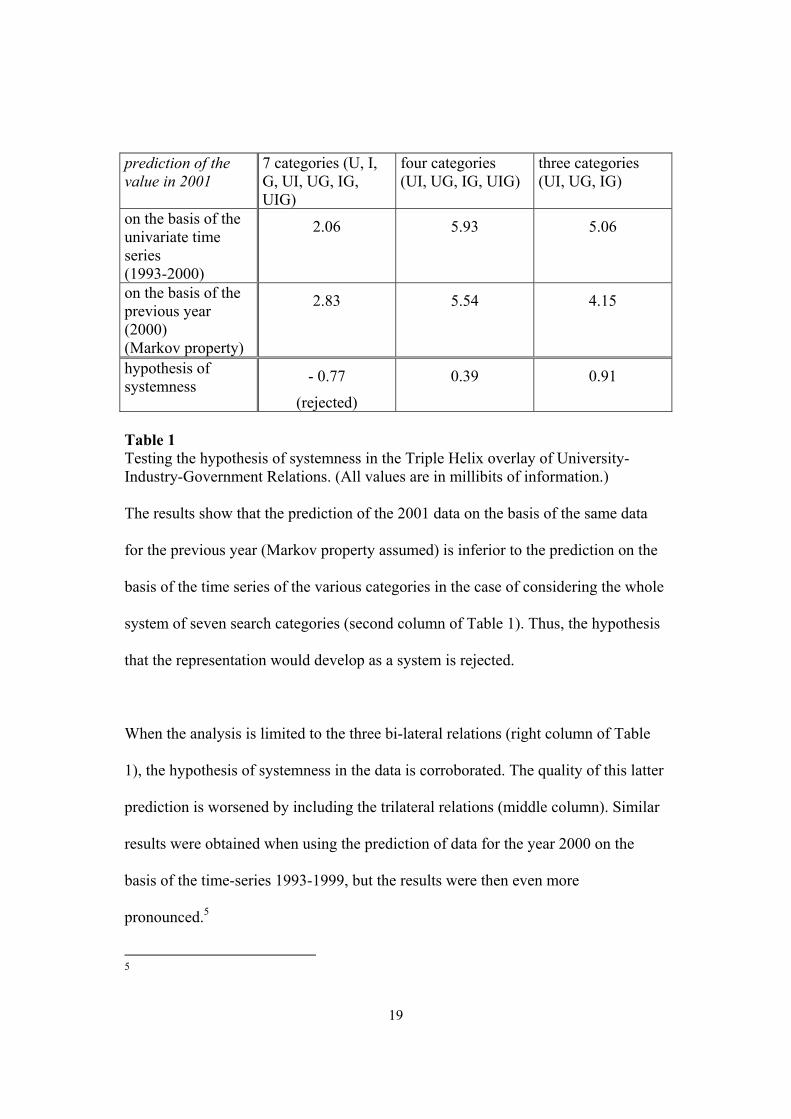
Table 1 Testing the hypothesis of systemness in the Triple Helix overlay of University-Industry-Government Relations. (All values are in millibits of information.) The results show that the prediction of the 2001 data on the basis of the same data
for the previous year (Markov property assumed) is inferior to the prediction on the
basis of the time series of the various categories in the case of considering the whole
system of seven search categories (second column of Table 1). Thus, the hypothesis
that the representation would develop as a system is rejected.
When the analysis is limited to the three bi-lateral relations (right column of Table
1), the hypothesis of systemness in the data is corroborated. The quality of this latter
prediction is worsened by including the trilateral relations (middle column). Similar
results were obtained when using the prediction of data for the year 2000 on the
basis of the time-series 1993-1999, but the results were then even more
pronounced.5
5
19
In summary, these results suggest that the system of representations of university-
industry-government relations at the Internet is developing as a set of bilateral
relations. The bilateral relations generate a negative entropy and in this sense enable
the global system to self-organize the complexity in the data using a virtual overlay
of network relations. This development, however, has slowed down recently.
5.3 The Triple Helix in the Science Citation Index (2000)
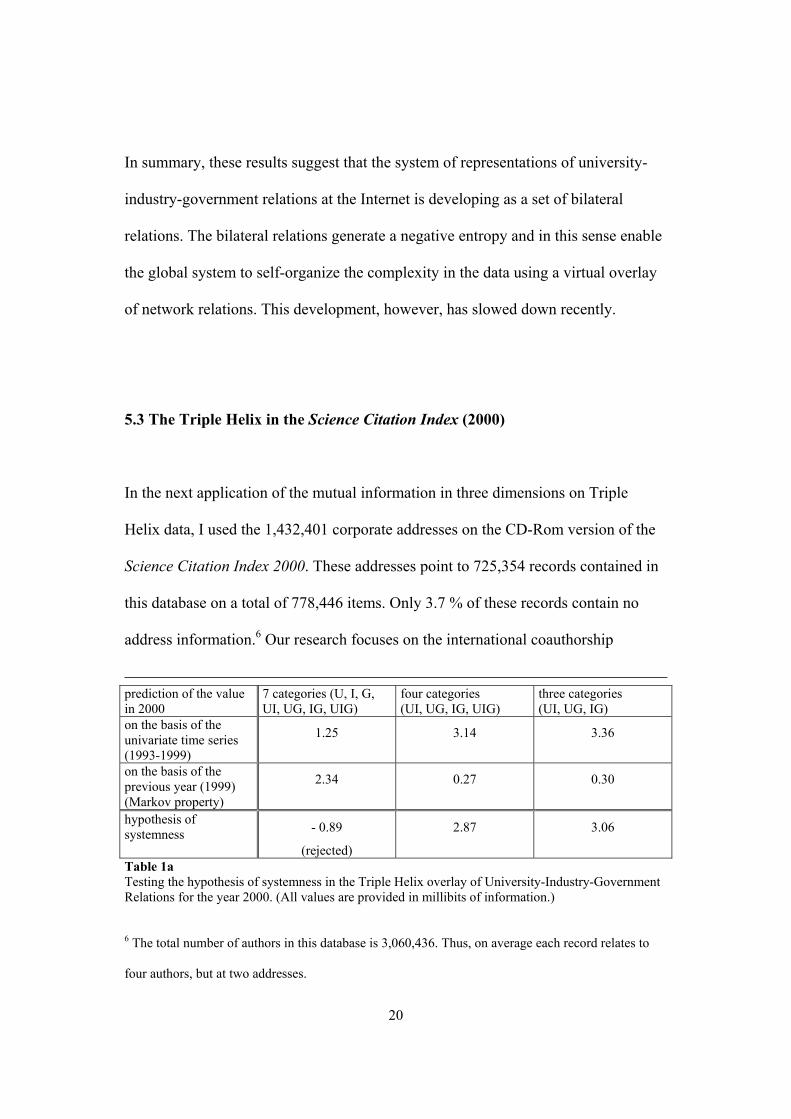
In the next application of the mutual information in three dimensions on Triple
Helix data, I used the 1,432,401 corporate addresses on the CD-Rom version of the
Science Citation Index 2000. These addresses point to 725,354 records contained in
this database on a total of 778,446 items. Only 3.7 % of these records contain no
address information.6 Our research focuses on the international coauthorship
prediction of the value in 2000
7 categories (U, I, G, UI, UG, IG, UIG)
four categories (UI, UG, IG, UIG)
three categories (UI, UG, IG)
on the basis of the univariate time series (1993-1999)
1.25 3.14 3.36
on the basis of the previous year (1999) (Markov property)
2.34 0.27 0.30
hypothesis of systemness - 0.89
(rejected)
2.87
3.06
Table 1a Testing the hypothesis of systemness in the Triple Helix overlay of University-Industry-Government Relations for the year 2000. (All values are provided in millibits of information.)
6 The total number of authors in this database is 3,060,436. Thus, on average each record relates to
four authors, but at two addresses.
20
relations in this data, but we will report on that project elsewhere (Wagner &
Leydesdorff, 2003). Here, I focus on University-Industry-Government relations in
this data set.
An attempt was made to organize all these addresses automatically in terms of their
attribution to university-industry-government relations. The routine first attributed a
university label to addresses that contained the abbreviations ‘UNIV’ or ‘COLL.’
Once an attribution was made, the record was set aside before further attributions
were made. The remaining addresses were subsequently labeled as ‘industrial’ if
they contained one of the following identifiers ‘CORP’, ‘INC’, ‘LTD’, ‘SA’ or
‘AG’. Thereafter, the file was scanned for the identifiers of public research
institutions using ‘NATL’, ‘NACL’, ‘NAZL’, ‘GOVT’, ‘MINIST’, ‘ACAD’,
‘INST’, ‘NIH’, ‘HOSP’, ‘HOP ‘, ‘EUROPEAN’, ‘US’, ‘CNRS’, ‘CERN’, ‘INRA’,
and ‘BUNDES’ as identifiers.
This relatively simple procedure enabled us to identify 1,239,848, that is 86.6% of
the total number of address records, in terms of their origin as ‘university,’
‘industry,’ or ‘government.’ However, these results remain statistically approximate
figures. The distribution is exhibited in Table 2:
21
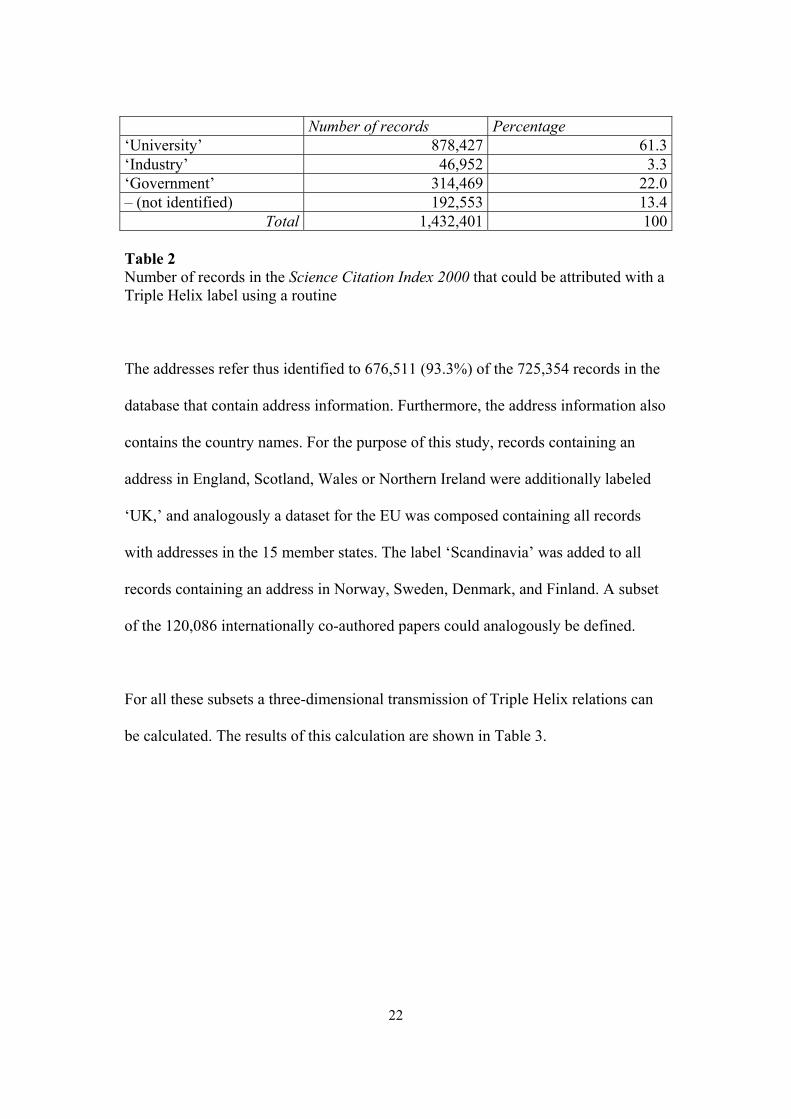
Number of records Percentage ‘University’ 878,427 61.3‘Industry’ 46,952 3.3‘Government’ 314,469 22.0– (not identified) 192,553 13.4
Total 1,432,401 100 Table 2 Number of records in the Science Citation Index 2000 that could be attributed with a Triple Helix label using a routine
The addresses refer thus identified to 676,511 (93.3%) of the 725,354 records in the
database that contain address information. Furthermore, the address information also
contains the country names. For the purpose of this study, records containing an
address in England, Scotland, Wales or Northern Ireland were additionally labeled
‘UK,’ and analogously a dataset for the EU was composed containing all records
with addresses in the 15 member states. The label ‘Scandinavia’ was added to all
records containing an address in Norway, Sweden, Denmark, and Finland. A subset
of the 120,086 internationally co-authored papers could analogously be defined.
For all these subsets a three-dimensional transmission of Triple Helix relations can
be calculated. The results of this calculation are shown in Table 3.
22
number % titles retrieved
T(uig)in mbits
UI UG IG UIG Univers Industry Govern
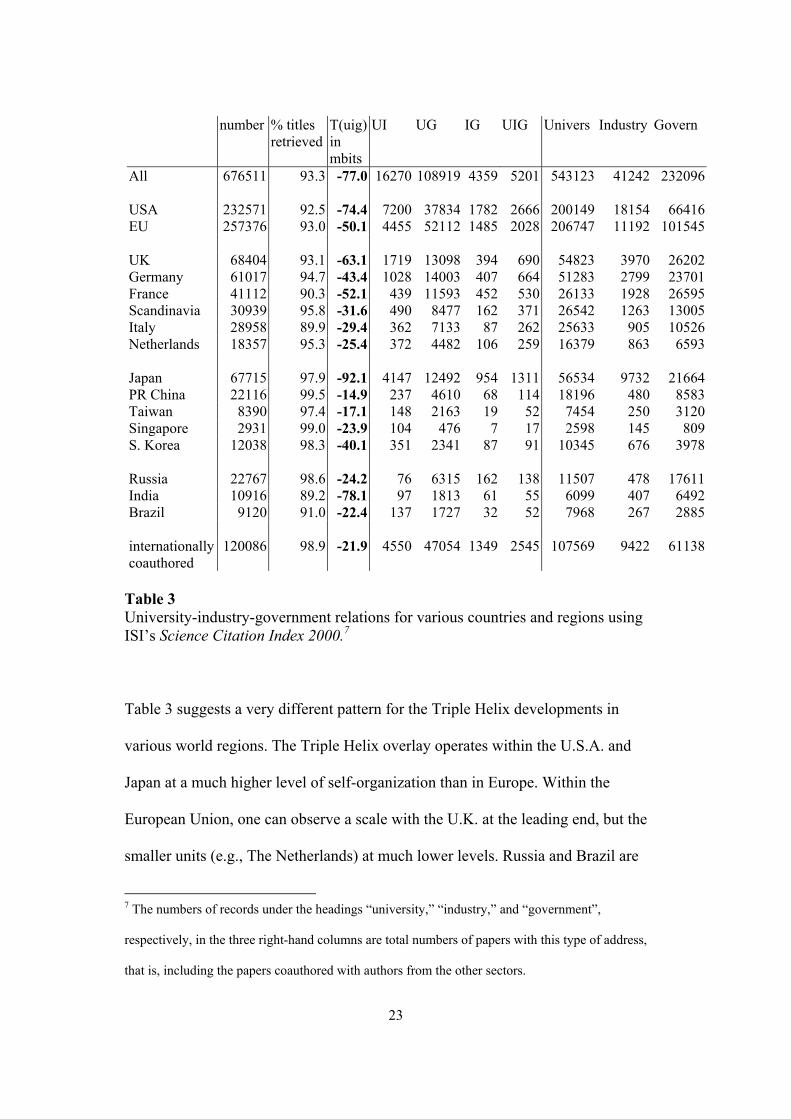
All 676511 93.3 -77.0 16270 108919 4359 5201 543123 41242 232096 USA 232571 92.5 -74.4 7200 37834 1782 2666 200149 18154 66416EU 257376 93.0 -50.1 4455 52112 1485 2028 206747 11192 101545 UK 68404 93.1 -63.1 1719 13098 394 690 54823 3970 26202Germany 61017 94.7 -43.4 1028 14003 407 664 51283 2799 23701France 41112 90.3 -52.1 439 11593 452 530 26133 1928 26595Scandinavia 30939 95.8 -31.6 490 8477 162 371 26542 1263 13005Italy 28958 89.9 -29.4 362 7133 87 262 25633 905 10526Netherlands 18357 95.3 -25.4 372 4482 106 259 16379 863 6593 Japan 67715 97.9 -92.1 4147 12492 954 1311 56534 9732 21664PR China 22116 99.5 -14.9 237 4610 68 114 18196 480 8583Taiwan 8390 97.4 -17.1 148 2163 19 52 7454 250 3120Singapore 2931 99.0 -23.9 104 476 7 17 2598 145 809S. Korea 12038 98.3 -40.1 351 2341 87 91 10345 676 3978 Russia 22767 98.6 -24.2 76 6315 162 138 11507 478 17611India 10916 89.2 -78.1 97 1813 61 55 6099 407 6492Brazil 9120 91.0 -22.4 137 1727 32 52 7968 267 2885 internationally coauthored
120086 98.9 -21.9 4550 47054 1349 2545 107569 9422 61138
Table 3 University-industry-government relations for various countries and regions using ISI’s Science Citation Index 2000.7
Table 3 suggests a very different pattern for the Triple Helix developments in
various world regions. The Triple Helix overlay operates within the U.S.A. and
Japan at a much higher level of self-organization than in Europe. Within the
European Union, one can observe a scale with the U.K. at the leading end, but the
smaller units (e.g., The Netherlands) at much lower levels. Russia and Brazil are
7 The numbers of records under the headings “university,” “industry,” and “government”,
respectively, in the three right-hand columns are total numbers of papers with this type of address,
that is, including the papers coauthored with authors from the other sectors.
23

even less integrated from this perspective, but India exhibits the Asian-Pacific
pattern (T < –0.70).
In terms of the three-dimensional transmission, Japan is by far more networked in a
Triple Helix mode than the other countries included in this analysis. This can
already be seen on visual inspection of the numbers. For example, the number of
papers with both university and industry addresses in Japan is 4147 against 4455 for
the whole EU. This corresponds to 7.3% and 2.2% of all university papers in these
two subsets, respectively.
In France the ratio of university papers coauthored with industry is only 1.7%. In
this case, the relation between industry and government is even stronger than the one
between the university sector and industry. The relations between university
research and public sector research are strong everywhere, but in France, Russia,
and India public sector research is larger than university research in terms of
scientific output. The East-Asian countries demonstrate how the industrial
participation in the network knowledge production system can be the crucial
variable for the self-organization of the Triple Helix dynamics.
Note that more than 39% of the internationally coauthored papers contain an address
of both a university and a government agency. Yet, the relative low numbers of
bilateral coauthorship relations of universities and government agencies with
industrial partners indicates a low level of institutional differentiation in this subset.
Furthermore there seems to be a size effect of the T(uig) indicator among nations,
24
but this correlation is not statistically significant. The main distinction, however, is
visible as a pattern of collaboration that is culturally specific. The academic system
on the continent in Europe seems much more traditional in its patterns of
collaboration than in the U.S.A. and Japan. University-Government relations are
more established in the European nations than University-Industry relations. Russia
and France are the most extreme cases in this respect. The papers based on
international collaborations exhibit the least development in this Triple Helix mode
of relations among all the subsets.
It should be noted that these results refer to representations in the Science Citation
Index, and the above classification into sectors was statistical and therefore
approximate. Industry is weakly represented in this data. Collaborations with
industry may often not lead to this type of scientific publication. The purpose of this
study, however, was to demonstrate the use of three-dimensional transmissions as a
methodology for data analysis. Data collection may require more care. However,
independently of the refinement of the measurement, network data about university-
industry-government relations can usually be written as relative frequency
distributions. The indicators of the three-dimensional transmissions can then be
applied to a comparison of the state of the Triple Helix configurations under study.
25
5.4 Two further tests
The above results suggest that the Triple Helix is operating strongly as an overlay in
the system of global representations, but not similarly at the national level in all the
advanced countries. On the contrary, cultural patterns seem to intervene. Let me
therefore proceed by adding two further types of analysis, notably the representation
of national systems at the level of an international database, and the representation
of an international system at the level of a national database. These two tests enable
me to specify the dynamics of globalization and Triple Helix relations in greater
detail.
5.4.1 National subdomains and languages at the Internet
The Internet can be considered as a global system, but it can be searched specifically
for national domains using the domain name (e.g, ‘.br’ for Brazil) and/or the
national language (Portuguese in this case). In Leydesdorff & Curran (2000) we
explored these various dimensions. In this study, three national domains with their
respective languages will be used: Brazil (.br) with Portuguese, Germany (.de) with
German, and the Netherlands (.nl) with Dutch. Among the many possibilities, Brazil
and the Netherlands were selected for the comparison with our previous analysis.
Germany was added as a third case with a larger economy because Brazil and the
Netherlands also exhibited some similarities in our previous analysis.
26

After consultation with a number of native speakers, the following search terms
were selected:
University Industry GovernmentPortuguese Universidade Indústria Governo German Universit* Industr* Bundes* Dutch Universit* Industr* Overheid
Table 4 Search terms for Triple Helix relations in different national languages The similarity between the English search terms and those in German and Dutch
makes it possible to include the terms more globally, possibly disadvantaging
Portuguese. However, the results exhibited in Figure 9 are very clear and robust: the
global development at the Internet prevailed over national differences as the Internet
developed during the 1990s.
-0.40
-0.30
-0.20
-0.10
0.00
0.10
0.20
1993
1994
1995
1996
1997
1998
1999
2000
2001
AltaVista (Figure 8)GermanyBrazilNetherlands
Figure 9 The three-dimensional transmission between ‘university,’ ‘industry,’ and ‘government’ in various national systems and languages during the period 1993-2001 Although initially (1993-1995) these ‘national’ representations of Triple Helix
configurations were variously integrated and differentiated at the Internet, the global
dynamics harmonized these systems into a similar pattern during the years
27

thereafter. The self-organization of Triple Helix relations at the Internet has
prevailed over national differences in terms of domains and languages.
5.4.2 U.S. Patent data
The database of the U.S. Patent and Trademark Office (USPTO) provides us with a
nationally organized database which can be used as a window on international
developments of patents because it integrates patent applications from around the
world at the level of the American market (Narin & Olivastro, 1988; Granstrand,
1999).
‘University,’ ‘industry,’ and ‘government,’ and their various combinations with
Boolean ‘AND’ operators can also be used as free text search terms in this database
(Black, 2003). As in the case of the Internet, I searched the patent database for the
number of occurrences of these terms in the file on a year-to-year basis.8 For reasons
of comparison with the Internet analysis in sections 5.1. and 5.4.1, the time-series in
Table 5 is shown for the period 1993-2001.
8 The use of the word ‘industry’ in a free-text search means that this word is part of the discourse, but
it does not refer to the ownership or inventor of the patent in question (Debackere et al., 2002).
However, the number of patents assigned to corporations is much higher than indicated by ‘industry’
as a free-text search term.
28
Year University Industry Government UI UG IG UIG Total number of patents
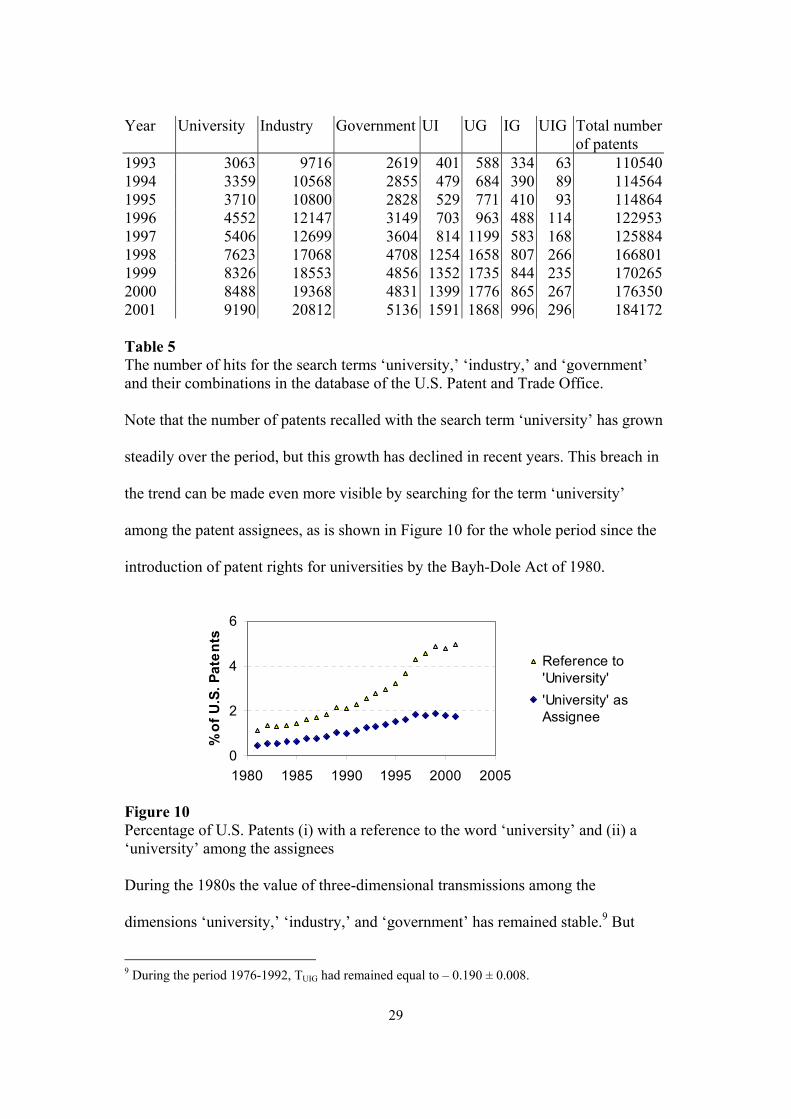
1993 3063 9716 2619 401 588 334 63 1105401994 3359 10568 2855 479 684 390 89 1145641995 3710 10800 2828 529 771 410 93 1148641996 4552 12147 3149 703 963 488 114 1229531997 5406 12699 3604 814 1199 583 168 1258841998 7623 17068 4708 1254 1658 807 266 1668011999 8326 18553 4856 1352 1735 844 235 1702652000 8488 19368 4831 1399 1776 865 267 1763502001 9190 20812 5136 1591 1868 996 296 184172 Table 5 The number of hits for the search terms ‘university,’ ‘industry,’ and ‘government’ and their combinations in the database of the U.S. Patent and Trade Office. Note that the number of patents recalled with the search term ‘university’ has grown
steadily over the period, but this growth has declined in recent years. This breach in
the trend can be made even more visible by searching for the term ‘university’
among the patent assignees, as is shown in Figure 10 for the whole period since the
introduction of patent rights for universities by the Bayh-Dole Act of 1980.
0
2
4
6
1980 1985 1990 1995 2000 2005
% o
f U.S
. Pat
ents
Reference to'University''University' asAssignee
Figure 10 Percentage of U.S. Patents (i) with a reference to the word ‘university’ and (ii) a ‘university’ among the assignees During the 1980s the value of three-dimensional transmissions among the
dimensions ‘university,’ ‘industry,’ and ‘government’ has remained stable.9 But
29
9 During the period 1976-1992, TUIG had remained equal to – 0.190 ± 0.008.

during the 1990s this value began to rise, indicating a tendency towards a more
centrally integrated and systematic word usage (Figure 11).
R2 = 0.87-0.20
-0.15
-0.10
-0.05
0.00
1993
1994
1995
1996
1997
1998
1999
2000
2001
T(ui
g)
Figure 11 The mutual information among ‘university,’ ‘industry,’ and ‘government’ relations in the database of the U.S. Patent and Trade Office With hindsight, the Bayh-Dole Act of 1980 can be considered as having provided
the patent system with one more degree of freedom, that is, by allowing universities
increasingly to become players in this institutional field. (The Bayh-Dole Act
granted universities the right to patent results from federally funded research.) The
patent system, however, has remained a highly institutionalized system of legal
control and therefore under the pressure of integration. New players can be expected
to be enrolled within this system in due time.
30

6. Conclusions
Triple Helix configurations can be measured as network data. The representations
need by no means be restricted—like in this study—to the terms ‘university,’
‘industry,’ and ‘government’ as search terms in a database. However, I have used
the results from these relatively straightforward searches in order to explain how the
algorithmic indicator of mutual information in three dimensions enables us to
distinguish among observable Triple Helix arrangements.
For example, one can measure the discourse in an academic set of papers in terms of
word (co-)occurrences and then compare the results of this analysis with a similar
one for the relevant industry and government sets of papers (Leydesdorff, 2003).
Matrices (or higher-order arrays) of words used in different instances, or other
variables measured in the various contexts, can be compared in terms of their
relative overlap. The ‘mutual information’ in two dimensions can be considered as a
measure of the covariation. On each side, one expects remaining variations, for
example, terms which are used (or have meaning) within industry, but not in
academia.
If the data representation is sufficiently complex, that is, containing these three
institutional dimensions, the representation can be evaluated using the three-
dimensional transmission. In this study, I used scientometric and webometric
representations in order to show how Triple Helix relations work differently at the
national and at the global level. But the algorithm works equally well on sociometric
31
data. The method allows us to investigate to which extent the university-industry-
government networks under study exhibit the knowledge infrastructure of a
knowledge-based dynamics.
The development of the dynamic knowledge base can be studied using the three-
dimensional transmission because entropy can be considered as a measure of the
flux. The three-dimensional transmission is generated as a potentially negative
entropy within the system composed by the interacting subdynamics. Whether the
overlay of the relations has also become systemic and how it then operates, for
example, in terms of bilateral and/or trilateral relations can be analyzed further using
information-theoretical measures (Leydesdorff, 2001b).
At the global level, the system of representations at the Internet has gone through a
rapid phase of expansion and has exhibited a negative transmission in these three
dimensions that is further deepening. The self-organization of the probabilistic
entropy in this representation, however, was based only on the system of bi-lateral
relations. The representations at the national level within this global system followed
the trend and this result confirmed the assumption of a global development.
Using the ISI-database, different patterns of integration became visible in various
cultural regions of the globe. Industry seems far less integrated into the academic
system in Europe than in the U.S.A. and in Asia, in terms of their participation in
academic publications. By using the nationally integrated U.S. patent system, I
could then show that this national system exerts integrative feedback on an
32
otherwise expanding domain. The expansion of the patent system is moderated by
this institutional framework.
Finally, I indicated how the systemness of the overlay can be evaluated in
comparison with the systemness of the representations of the composing units (e.g.,
university, industry, and government). In the case of the Internet, the bi-lateral
relations between the search terms carried the systemness. The self-organization of
the knowledge-based economy can thus be considered as a Triple Helix
development at the global level, while nations differ in terms of how they are able to
participate in these developments. The value of the mutual information in three
dimensions at the national level indicates the extent to which the national system
itself contains a Triple Helix dynamics.
References
Abramson, N. (1963). Information Theory and Coding. New York, etc.: McGraw-
Hill.
Arthur, W. B. (1988). Competing technologies. In G. Dosi, Chris Freeman, Richard
Nelson, Gerald Silverberg, and Luc Soete (Ed.), Technical Change and
Economic Theory (pp. 590-607.). London: Pinter.
Bar-Hillel, Y. (1955). An Examination of Information Theory. Phil. Sci., 22, 86-105.
Bar-Ilan, J. (2001). Data collection methods on the Web for informetric purposes—
A review and analysis. Scientometrics, 50(1), 7-32.
33
Black, G. R. (2003). Keyword Patent Searching Online, at
http://www.keypatent.net/.
Butler, D. (2000). Souped-up search engines,. Nature, Vol. 405, 11 May 2000,
2112-2115.
David, P. A. (1985). Clio and the Economics of QWERTY. American Economic
Review, 75, 332-337.
Debackere, K., A. Verbeek, M. Luwel and E. Zimmermann (2002). Measuring
Progress and Evolution in Science and Technology: Part II: The Multiple
Uses of Technometric Indicators, International Journal of Management
Reviews, 4 (3), 213-231.
Ebeling, W., T. Poeschel, & K.-F. Albrecht. (1995). Entropy, Transinformation and
Word Distribution of Information-Carrying Sequences. Int. J. Bifurcation
and Chaos, 5, 51; at http://arxiv.org/abs/cond-mat/?0204045
Etzkowitz, H., & L. Leydesdorff (1995). The Triple Helix---University-Industry-
Government Relations: A Laboratory for Knowledge Based Economic
Development. EASST Review 14, 14-19.
Etzkowitz, H., & L. Leydesdorff (Eds.). (1997). Universities in the Global
Knowledge Economy: A Triple Helix of University-Industry-Government
Relations. London: Pinter.
Giddens, A. (1984). The Constitution of Society. Cambridge: Polity Press.
Goguen, J. A., & F. J. Varela (1979). Systems and distinctions: duality and
complementarity, International Journal of General Systems 5, 31- 43.
Granstrand, O. (1999). The Economics and Management of Intellectual Property:
Towards Intellectual Capitalism. Cheltenham, UK: Edward Elgar.
34

Lewontin, R. (2000). The Triple Helix: Gene, Organism, and Environment.
Cambridge, MA/London: Harvard University Press.
Leydesdorff, L. (1995). The Challenge of Scientometrics: the development,
measurement, and self-organization of scientific communications. Leiden:
DSWO Press, Leiden University; at
http://www.upublish.com/books/leydesdorff-sci.htm .
Leydesdorff, L. (2001a). Indicators of Innovation in a Knowledge-based Economy.
Cybermetrics, 5 (Issue 1), Paper 2, at
http://www.cindoc.csic.es/cybermetrics/articles/v5i1p2.html.
Leydesdorff, L. (2001b). A Sociological Theory of Communication: The Self-
Organization of the Knowledge-Based Society. Parkland, FL: Universal
Publishers; at <http://www.upublish.com/books/leydesdorff.htm>.
Leydesdorff, L. (2003). Translations at Interfaces in Triple Helix Configurations:
Mapping the Case of ‘Stem Cell’ Research. Paper to be presented at the IX
Conference of the International Society of Scientometrics and Informetrics,
Beijing, August 25-29.
Leydesdorff, L., & M. Curran (2000). Mapping University-Industry-Government
Relations on the Internet: An Exploration of Indicators for a Knowledge-
Based Economy. Cybermetrics 4 Issue 1, Paper 2 at
<http://www.cindoc.csic.es/cybermetrics/articles/v4i1p2.html >.
Leydesdorff, L., & H. Etzkowitz (1998). The Triple Helix as a model for innovation
studies. Science and Public Policy, 25(3), 195-203.
Leydesdorff, L., & N. Oomes (1999). Is the European Monetary System Converging
to Integration? Social Science Information, 38(1), 57-86.
35

36
Narin, F., & D. Olivastro (1988). Technology Indicators Based on Patents and
Patent Citations. In A. F. J. v. Raan (Ed.), Handbook of Quantitative Studies
of Science and Technology. Amsterdam: Elsevier, pp. 465-507.
Pauling, L., & R. B. Corey (1953). A proposed structure for the nucleic acids. Proc.
Natl. Acad. Sci. USA, 89, 84-97.
Poincaré, H. (1905). Leçons de mécanique céleste (Vol. 1905 vol. I, 1907 vol. II part
I, 1909 vol. II part II, 1911 vol. III). Paris: Gauthier-Villars.
Riba-Vilanova, M., & L. Leydesdorff (2001). Why Catalonia cannot be considered
as a Regional Innovation System. Scientometrics, 50(2), 215-240.
Rousseau, R. (1999). Daily time series of common single word searches in AltaVista
and NorthernLight,. Cybermetrics 2/3, Paper 2 at
<http://www.cindoc.csic.es/cybermetrics/articles/v2i1p2.html>.
Shannon, C. E. (1948). A Mathematical Theory of Communication. Bell System
Technical Journal, 27, 379-423 and 623-356.
Theil, H. (1972). Statistical Decomposition Analysis. Amsterdam/ London: North-
Holland.
Wagner, C. S., & L. Leydesdorff. (2003). Mapping Global Science Using
International Co-authorships: A Comparison of 1990 and 2000. Paper to be
presented at the IXth Conference of the International Society of
Scientometrics and Informetrics ISSI, Beijing, August 25-29.
Watson, J. (1970). The Double Helix: A Personal Account of the Discovery of the
Structure of DNA. Harmondsworth: Penguin.
Watson, J., & F. Crick (1953). A structure for Deoxyribose Nucleic Acid. Nature
171 (25 April) 737-738.