adsorption of brilliant green dye from aqueous solution onto red clay
TRANSCRIPT
This article appeared in a journal published by Elsevier. The attachedcopy is furnished to the author for internal non-commercial researchand education use, including for instruction at the authors institution
and sharing with colleagues.
Other uses, including reproduction and distribution, or selling orlicensing copies, or posting to personal, institutional or third party
websites are prohibited.
In most cases authors are permitted to post their version of thearticle (e.g. in Word or Tex form) to their personal website orinstitutional repository. Authors requiring further information
regarding Elsevier’s archiving and manuscript policies areencouraged to visit:
http://www.elsevier.com/authorsrights
Author's personal copy
Adsorption of Brilliant Green dye from aqueous solution onto red clay
Muhammad Saif Ur Rehman b,c,1, Muhammad Munir a,1, Muhammad Ashfaq a,⇑, Naim Rashid c,d,Muhammad Faizan Nazar a, Muhammad Danish a, Jong-In Han c,⇑a Department of Chemistry, University of Gujrat, Jalalpur Jattan Road, Gujrat, Pakistanb Department of Environmental Science, University of Gujrat, Jalalpur Jattan Road, Gujrat, Pakistanc Department of Civil and Environmental Engineering, Korea Advanced Institute of Science and Technology, Daejeon 305-701, Republic of Koread Department of Environmental Sciences, COMSATS Institute of Information Technology, Abbottabad, Pakistan
h i g h l i g h t s
� Brilliant Green (BG) was adsorbed on naturally existing red clay (RC).� RC possessed large surface area 100.3 m2/g and pore volume 0.88 cm3/g.� The maximum monolayer adsorption of BG on RC was found to be 125 mg/g.� BG adsorption on RC was found favorable.
a r t i c l e i n f o
Article history:Received 29 January 2013Received in revised form 22 April 2013Accepted 25 April 2013Available online 7 May 2013
Keywords:Brilliant GreenRed clayAdsorption kineticsIsothermsAdsorption thermodynamics
a b s t r a c t
This study was aimed at the adsorption of Brilliant Green (BG) dye on naturally existing red clay (RC)through batch adsorption experiment. Adsorbent characterization showed Brunauer–Emmett–Teller sur-face area 100.28 m2/g, pore volume 0.88 cm3/g, and pore diameter 148.2 Å. Batch studies were carried outto investigate the effect of experimental factors such as pH (2–10), particle size (58–150 lm), adsorbentdose (0.3-1.5 g/L), contact time (5–1500 min), initial dye concentration (20–100 mg/L), and temperature(25–65 �C) on the adsorption of BG dye. Langmuir (R2 = 0.993), Freundlich (R2 = 0.997), Hansley(R2 = 0.997) and Redlich–Peterson (R2 = 0.999) isotherms were fitted to describe the equilibrium of BGadsorption process. Isothermal models showed that BG adsorption was a favorable process on RC.Adsorption kinetics were well fitted by Pseudo-second order kinetic model (R2 = 0.999). Thermodynamicstudy revealed that BG adsorption on RC was spontaneous, favorable and physiosorptive. The maximumadsorption capacity of RC was found to be 125 mg/g. These results showed that BG dye can be effectivelyremoved from aqueous solution employing RC as a cheap adsorbent.
� 2013 Elsevier B.V. All rights reserved.
1. Introduction
Several industries use dyes to accomplish different kinds ofoperation. The nature and amount of dyes vary from industry toindustry, and from operation to operation. However, textile andleather industries are the biggest consumers of dyes, and hence,the biggest producers of dyeing wastewater in Pakistan [1,2].According to Auta and Hameed [3], approximately 700,000 metrictons of 100,000 commercial dyes are produced globally, and1–1.5% (670,000 metric tons) of these dyes is discharged intowastewater [4]. Dyes are broadly categorized into cationic andanionic dyes, whereas the former is considered more toxic thanthe latter [5]. Thus, dyeing wastewater may damage the ecosystem
of receiving water, and the environment in total, due to the carcin-ogenic, mutagenic, and allergenic characteristics of dyes. The treat-ment of such a toxic wastewater is necessary to avoidenvironmental contamination [6].
Several treatment technologies have been developed to decol-orize dyeing wastewater. These treatment options include biolog-ical [2], physio-chemical [7], membrane filtration [8], ozonation[9] and advanced oxidation [10] and integrated treatment pro-cesses [11]. However, these processes face certain technical andeconomical limitations such as cost and production of sludge[12]. Adsorption process is an innovative and economical alterna-tive due to its performance and ease of operation [13,14]. The tar-get pollutant accumulates at the surface/interface of the adsorbentin aqueous medium. Several process conditions (pH, temperature,ionic strength, adsorbent dose, adsorbate properties) influencethe adsorption process. The basic theory of adsorption can befound in the literature [14–16]. Adsorption process can be appliedfor the removal (�99%) of different types of pollutants such as
1385-8947/$ - see front matter � 2013 Elsevier B.V. All rights reserved.http://dx.doi.org/10.1016/j.cej.2013.04.094
⇑ Corresponding authors. Tel.: +92 (53) 3643112; fax: +92 (53) 3642167 (M.Ashfaq), tel.: +82 42 350 3629; fax: +82 42 350 3610 (J.-I. Han).
E-mail addresses: [email protected] (M. Ashfaq), [email protected] (J.-I. Han).1 These authors contributed equally to this work.
Chemical Engineering Journal 228 (2013) 54–62
Contents lists available at SciVerse ScienceDirect
Chemical Engineering Journal
journal homepage: www.elsevier .com/locate /ce j
Author's personal copy
heavy metals, organic compounds and pathogens [14,17]. Amongorganic pollutants, adsorption has been extensively investigatedto treat dyeing wastewater. However, the performance of adsorp-tion process depends on the properties of adsorbents, such as highadsorption capacity, and surface characteristics [14,15]. Activatedcarbon has been found one of the most prominent adsorbent dueto its high surface area and adsorption capacity [3,15,17]. Besidesits performance, commercial activated carbon is an expensiveadsorbent. Therefore, several researchers are searching for sustain-able adsorbents such as agriculture waste. However, these biosor-bents require chemical and physical modifications to improve theirperformance and adsorption capacity [18,19].
Clay based adsorbents have also emerged as promising adsor-bents for wastewater treatment [20,21]. Clays possess certainproperties which make them an ultimate choice for adsorptionprocess such as low cost, high availability, and environmentallyfriendly material. Resultantly, clays can substitute expensive acti-vated carbon as well as low performing biosorbents [4,5,22]. Theseclays can be used either in their natural form or modified withsome chemical agent, depending on the target pollutants [4]. Paki-stan possesses different types of clays due to its topography. Redclay (RC) is one such material that is abundantly available in someparts of the country. So, RC can also be investigated as an adsorbentlike other clay materials [4,20–22]. The adsorption of BrilliantGreen (BG) dye on different types of clay materials has been exten-sively investigated. BG is used as a model cationic dye for adsorp-tion studies to measure sorption efficiency (S%), and adsorptioncapacity of clay materials [4,5,22]. BG dye posses several healthrisks which include eye burns, skin irritation, coughing and short-ness of breath, nausea, vomiting and diarrhea. It is therefore essen-tial to remove this dye from water [22–24].
This study was aimed at using red clay as an adsorbent to re-move BG dye from aqueous solution. The effect of different adsorp-tion factors such as solution pH, adsorbent dose, particle size,agitation speed, initial dye concentration, contact time and tem-perature, was studied. Kinetic, isothermal and thermodynamicstudies of the adsorption process were carried out to understandthe equilibrium and mechanism of adsorption process.
2. Materials and methods
2.1. Preparation and characterization of adsorbent
Red clay was collected from the surrounding areas of Jhelum,Pakistan. The adsorbent was crushed, and was ground using labscale ball mill. It was sieved to obtain different particles size tostudy the effect of particle size. The adsorbent was then dried at100 �C in oven for 24 h. It was not subjected to any further chem-ical or physical treatment, and it was stored in sealed jars for fur-ther experimentation. The characterization of RC was carried outfollowing the procedures described in literature [25]. The specificsurface area and pore diameter were measured by N2 adsorptionisotherm at 77 K using the surface area and pore size analyzer(Quantachrome Nova 1200e, USA) employing the Brunauer–Em-mett–Teller (BET) method. The Barrett–Joyner–Halenda (BJH)method was used to calculate the pore distribution for RC. TheRC samples were degassed before subjecting to surface analyses.Scanning electron micrographs were recorded by SEM (JSM 5910,JEOL Japan) to obtain visual information about the morphology ofRC samples. Fourier transform infrared (FTIR) spectroscopy wascarried out using FTIR spectrometer (Jasco, USA) to characterizethe type of functional groups present on RC [20]. The point of zerocharge (pHZPC) of the RC was determined using the pH drift methodas reported in the literature [24]. A stepwise addition of 0.1 M HCland/or 0.1 M NaOH solutions were used for pH adjustment.
2.2. Dye solution
Brilliant Green dye (Merck, Germany) was purchased from themarket, and was used in this experiment without any further puri-fication. The stock solution (1000 ppm) of BG dye (C27H34N2O4S,FW: 482.62 and bulk density 500 - 600 kg/m3) was prepared bydissolving accurately weighed quantity of dye in 1 L of double dis-tilled and deionized water. The experimental solutions of desiredconcentration were prepared accordingly by diluting the stocksolution with distilled water. The concentration of BG dye wasmeasured at kmax = 625 nm [22] using UV–Visible spectrophotom-eter (PG instrument T60, UK).
2.3. Adsorption studies
Adsorption studies were carried out in batch mode to investi-gate the effect of experimental factors (pH, adsorbent dose, initialdye conc., contact time and temperature) on the adsorption of BGon RC. The effect of experimental factors such as pH (2–10), adsor-bent particle size (58–150 lm), RC dose (0.3–1.5 g/L), contact time(5–1500 min), BG dye concentration (20–100 mg/L), and tempera-ture (25–65 �C), was investigated employing one factor one timeapproach.
BG experimental solutions (V = 100 mL) were taken in glassflasks (250 mL), and mixed with known amount of RC at prede-fined experimental conditions. The detail of experimental condi-tions has been presented for each experiment in the relevantsections of Result and discussion. A common set of experimentalconditions, adsorbent dose (m) of 0.4 g/L, dye concentration (Co)50 mg/L, contact time (t) 4 h, stirring speed of 100 rpm, pH 7.0and temperature 25 �C, was used for all the experiments exceptwhere stated differently. The solution was then gently agitated inan isothermal shaker to achieve the equilibrium between RC–BGsuspensions. After the experiment, the suspensions were centri-fuged, filtered to remove RC particles, and residual concentrationof BG in the filtrate was determined by spectrophotometer. Sorp-tion efficiency (S%), and adsorption capacity (q) were calculatedas followed:
Sð%Þ ¼ ðCo � CeÞ �100Co
ð1Þ
q ¼ ðCo � CeÞV=W ð2Þ
where Co (mg/L) is the initial concentration of dye, Ce (mg/L) is theconcentration of dye at equilibrium, V (L) is the volume of dye solu-tion, and W (g) is the mass of adsorbent. All the experiments wererun in triplicate, and the results were reported as mean ± SD.Adsorption kinetics were investigated in order to find out rate lim-iting step. This task was carried out by finding rate of BG adsorptionas a function of time. The quantity of the dye adsorbed at time t, qt
(mg/g) was calculated using the following equation:
qt ¼ ðCo � CtÞV=W ð3Þ
where Ct (mg/L) is the concentration of dye at any time t [22].
3. Results and discussion
3.1. RC characterization
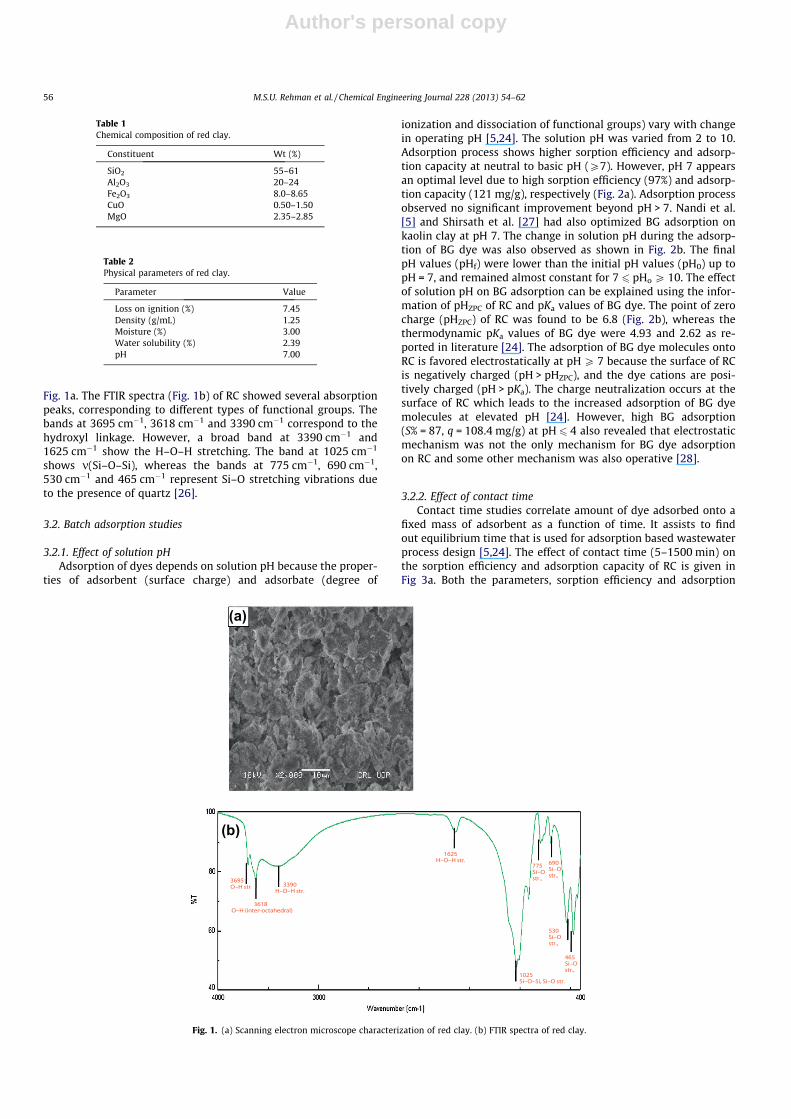
The surface characterization of RC show that its BET surfacearea is measured to be 100.28 m2/g, BJH pore surface area238.5 m2/g, pore volume 0.88 cm3/g, and pore diameter 148.2 Å.Further chemical and physical characteristics of RC are given inTables 1 and 2. SEM micrographs display visual information aboutthe surface morphology of the adsorbent material as shown in
M.S.U. Rehman et al. / Chemical Engineering Journal 228 (2013) 54–62 55
Author's personal copy
Fig. 1a. The FTIR spectra (Fig. 1b) of RC showed several absorptionpeaks, corresponding to different types of functional groups. Thebands at 3695 cm�1, 3618 cm�1 and 3390 cm�1 correspond to thehydroxyl linkage. However, a broad band at 3390 cm�1 and1625 cm�1 show the H–O–H stretching. The band at 1025 cm�1
shows m(Si–O–Si), whereas the bands at 775 cm�1, 690 cm�1,530 cm�1 and 465 cm�1 represent Si–O stretching vibrations dueto the presence of quartz [26].
3.2. Batch adsorption studies
3.2.1. Effect of solution pHAdsorption of dyes depends on solution pH because the proper-
ties of adsorbent (surface charge) and adsorbate (degree of
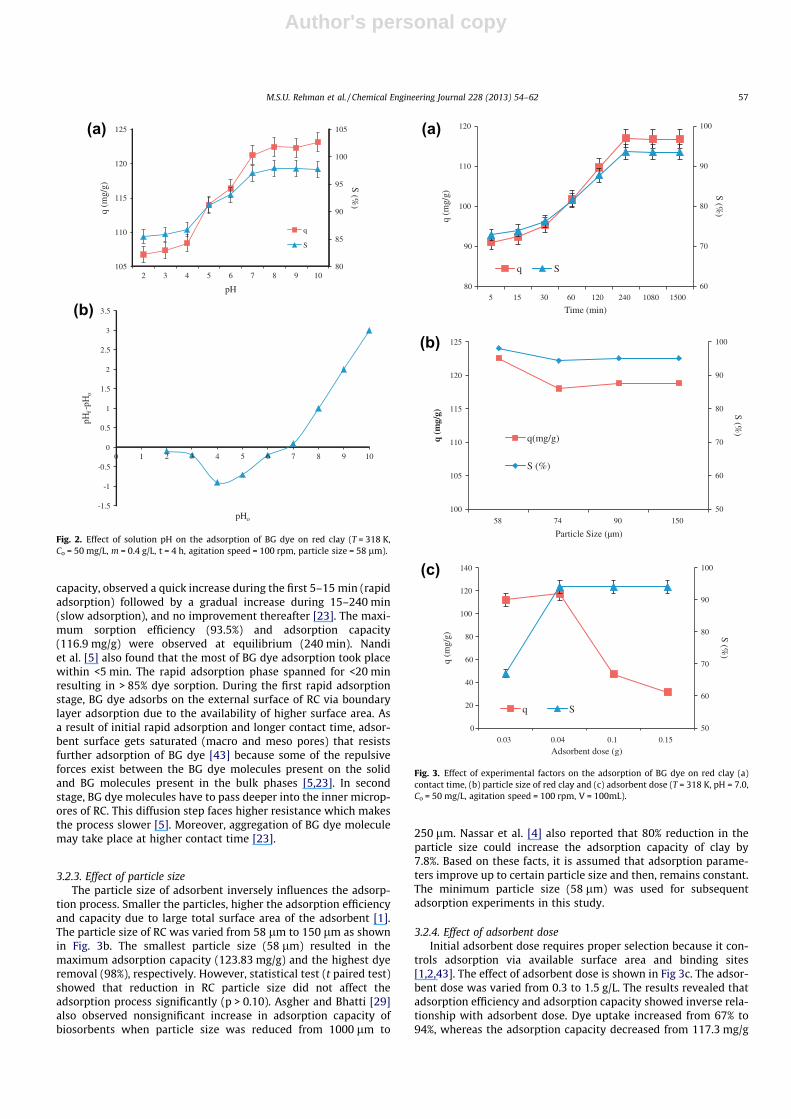
ionization and dissociation of functional groups) vary with changein operating pH [5,24]. The solution pH was varied from 2 to 10.Adsorption process shows higher sorption efficiency and adsorp-tion capacity at neutral to basic pH (P7). However, pH 7 appearsan optimal level due to high sorption efficiency (97%) and adsorp-tion capacity (121 mg/g), respectively (Fig. 2a). Adsorption processobserved no significant improvement beyond pH > 7. Nandi et al.[5] and Shirsath et al. [27] had also optimized BG adsorption onkaolin clay at pH 7. The change in solution pH during the adsorp-tion of BG dye was also observed as shown in Fig. 2b. The finalpH values (pHf) were lower than the initial pH values (pH0) up topH = 7, and remained almost constant for 7 6 pHo P 10. The effectof solution pH on BG adsorption can be explained using the infor-mation of pHZPC of RC and pKa values of BG dye. The point of zerocharge (pHZPC) of RC was found to be 6.8 (Fig. 2b), whereas thethermodynamic pKa values of BG dye were 4.93 and 2.62 as re-ported in literature [24]. The adsorption of BG dye molecules ontoRC is favored electrostatically at pH P 7 because the surface of RCis negatively charged (pH > pHZPC), and the dye cations are posi-tively charged (pH > pKa). The charge neutralization occurs at thesurface of RC which leads to the increased adsorption of BG dyemolecules at elevated pH [24]. However, high BG adsorption(S% = 87, q = 108.4 mg/g) at pH 6 4 also revealed that electrostaticmechanism was not the only mechanism for BG dye adsorptionon RC and some other mechanism was also operative [28].
3.2.2. Effect of contact timeContact time studies correlate amount of dye adsorbed onto a
fixed mass of adsorbent as a function of time. It assists to findout equilibrium time that is used for adsorption based wastewaterprocess design [5,24]. The effect of contact time (5–1500 min) onthe sorption efficiency and adsorption capacity of RC is given inFig 3a. Both the parameters, sorption efficiency and adsorption
Table 1Chemical composition of red clay.
Constituent Wt (%)
SiO2 55–61Al2O3 20–24Fe2O3 8.0–8.65CuO 0.50–1.50MgO 2.35–2.85
Table 2Physical parameters of red clay.
Parameter Value
Loss on ignition (%) 7.45Density (g/mL) 1.25Moisture (%) 3.00Water solubility (%) 2.39pH 7.00
Fig. 1. (a) Scanning electron microscope characterization of red clay. (b) FTIR spectra of red clay.
56 M.S.U. Rehman et al. / Chemical Engineering Journal 228 (2013) 54–62
Author's personal copy
capacity, observed a quick increase during the first 5–15 min (rapidadsorption) followed by a gradual increase during 15–240 min(slow adsorption), and no improvement thereafter [23]. The maxi-mum sorption efficiency (93.5%) and adsorption capacity(116.9 mg/g) were observed at equilibrium (240 min). Nandiet al. [5] also found that the most of BG dye adsorption took placewithin <5 min. The rapid adsorption phase spanned for <20 minresulting in > 85% dye sorption. During the first rapid adsorptionstage, BG dye adsorbs on the external surface of RC via boundarylayer adsorption due to the availability of higher surface area. Asa result of initial rapid adsorption and longer contact time, adsor-bent surface gets saturated (macro and meso pores) that resistsfurther adsorption of BG dye [43] because some of the repulsiveforces exist between the BG dye molecules present on the solidand BG molecules present in the bulk phases [5,23]. In secondstage, BG dye molecules have to pass deeper into the inner microp-ores of RC. This diffusion step faces higher resistance which makesthe process slower [5]. Moreover, aggregation of BG dye moleculemay take place at higher contact time [23].
3.2.3. Effect of particle sizeThe particle size of adsorbent inversely influences the adsorp-
tion process. Smaller the particles, higher the adsorption efficiencyand capacity due to large total surface area of the adsorbent [1].The particle size of RC was varied from 58 lm to 150 lm as shownin Fig. 3b. The smallest particle size (58 lm) resulted in themaximum adsorption capacity (123.83 mg/g) and the highest dyeremoval (98%), respectively. However, statistical test (t paired test)showed that reduction in RC particle size did not affect theadsorption process significantly (p > 0.10). Asgher and Bhatti [29]also observed nonsignificant increase in adsorption capacity ofbiosorbents when particle size was reduced from 1000 lm to
250 lm. Nassar et al. [4] also reported that 80% reduction in theparticle size could increase the adsorption capacity of clay by7.8%. Based on these facts, it is assumed that adsorption parame-ters improve up to certain particle size and then, remains constant.The minimum particle size (58 lm) was used for subsequentadsorption experiments in this study.
3.2.4. Effect of adsorbent doseInitial adsorbent dose requires proper selection because it con-
trols adsorption via available surface area and binding sites[1,2,43]. The effect of adsorbent dose is shown in Fig 3c. The adsor-bent dose was varied from 0.3 to 1.5 g/L. The results revealed thatadsorption efficiency and adsorption capacity showed inverse rela-tionship with adsorbent dose. Dye uptake increased from 67% to94%, whereas the adsorption capacity decreased from 117.3 mg/g
80
85
90
95
100
105
105
110
115
120
125
2 3 4 5 6 7 8 9 10
S (%
)
q (m
g/g)
pH
q
S
-1.5
-1
-0.5
0
0.5
1
1.5
2
2.5
3
3.5
0 1 2 3 4 5 6 7 8 9 10
pHf-
pHo
pHo
(a)
(b)
Fig. 2. Effect of solution pH on the adsorption of BG dye on red clay (T = 318 K,Co = 50 mg/L, m = 0.4 g/L, t = 4 h, agitation speed = 100 rpm, particle size = 58 lm).
50
60
70
80
90
100
0
20
40
60
80
100
120
140
0.03 0.04 0.1 0.15
q (m
g/g)
Adsorbent dose (g)
q S
50
60
70
80
90
100
100
105
110
115
120
125
58 74 90 150
q (m
g/g)
Particle Size (µm)
q(mg/g)
S (%)
60
70
80
90
100
80
90
100
110
120
5 15 30 60 120 240 1080 1500
S (%)
S (%)
S (%)
q (m
g/g)
Time (min)
q S
(a)
(c)
(b)
Fig. 3. Effect of experimental factors on the adsorption of BG dye on red clay (a)contact time, (b) particle size of red clay and (c) adsorbent dose (T = 318 K, pH = 7.0,Co = 50 mg/L, agitation speed = 100 rpm, V = 100mL).
M.S.U. Rehman et al. / Chemical Engineering Journal 228 (2013) 54–62 57
Author's personal copy
to 31.4 mg/g against the adsorbent dose (0.3–1.5 g/L), respectively.The maximum sorption efficiency (94%), and adsorption capacity(117.3 mg/g) was obtained at an optimal RC dose (0.4 g/L). Maneand Babu [23] and Safa and Bahtti [1] had also reported the similarbehavior of adsorption parameters against the adsorbent dose. Anincrease in RC dose increases the available binding sites up to cer-tain level against the fixed number of dye molecules [24]. How-ever, dye uptake remains constant, whereas the adsorptioncapacity decreases at RC dose >0.4 g/L. This behavior can be ex-plained on the basis of Eqs. (1) and (2). The total number of dyemolecules are fixed (Co = 50 mg/L) against an increasing RC dose(0.3–1.5 g/L). Experimental results show that the equilibrium con-centration of dye (Ce) remains constant for high RC dose (P0.4 g/L)implying that a portion of adsorbent surface remains uncovered.Resultantly, dye uptake (S%) does not decrease (Eq. (1)), however,adsorption capacity decreases drastically (Eq. (2)). Subsequentexperiments were carried out using 0.4 g/L of RC.
3.2.5. Effect of initial dye concentrationThe adsorption process is proportional to the initial dye concen-
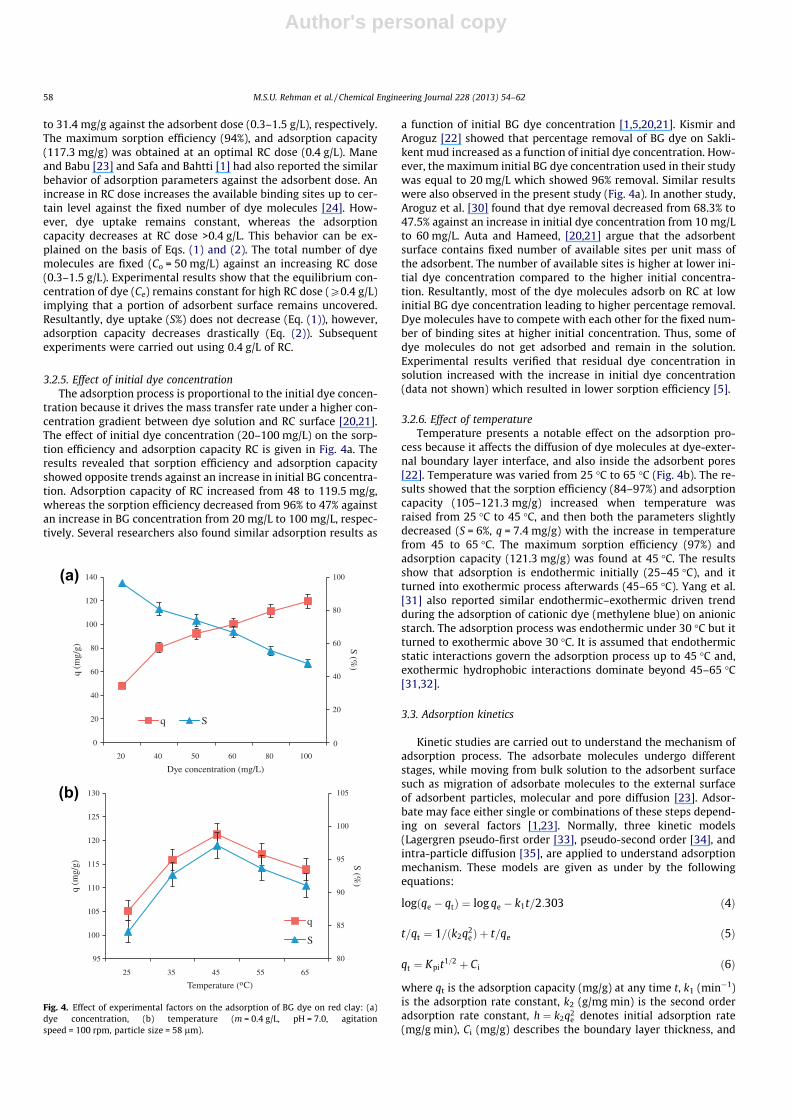
tration because it drives the mass transfer rate under a higher con-centration gradient between dye solution and RC surface [20,21].The effect of initial dye concentration (20–100 mg/L) on the sorp-tion efficiency and adsorption capacity RC is given in Fig. 4a. Theresults revealed that sorption efficiency and adsorption capacityshowed opposite trends against an increase in initial BG concentra-tion. Adsorption capacity of RC increased from 48 to 119.5 mg/g,whereas the sorption efficiency decreased from 96% to 47% againstan increase in BG concentration from 20 mg/L to 100 mg/L, respec-tively. Several researchers also found similar adsorption results as
a function of initial BG dye concentration [1,5,20,21]. Kismir andAroguz [22] showed that percentage removal of BG dye on Sakli-kent mud increased as a function of initial dye concentration. How-ever, the maximum initial BG dye concentration used in their studywas equal to 20 mg/L which showed 96% removal. Similar resultswere also observed in the present study (Fig. 4a). In another study,Aroguz et al. [30] found that dye removal decreased from 68.3% to47.5% against an increase in initial dye concentration from 10 mg/Lto 60 mg/L. Auta and Hameed, [20,21] argue that the adsorbentsurface contains fixed number of available sites per unit mass ofthe adsorbent. The number of available sites is higher at lower ini-tial dye concentration compared to the higher initial concentra-tion. Resultantly, most of the dye molecules adsorb on RC at lowinitial BG dye concentration leading to higher percentage removal.Dye molecules have to compete with each other for the fixed num-ber of binding sites at higher initial concentration. Thus, some ofdye molecules do not get adsorbed and remain in the solution.Experimental results verified that residual dye concentration insolution increased with the increase in initial dye concentration(data not shown) which resulted in lower sorption efficiency [5].
3.2.6. Effect of temperatureTemperature presents a notable effect on the adsorption pro-
cess because it affects the diffusion of dye molecules at dye-exter-nal boundary layer interface, and also inside the adsorbent pores[22]. Temperature was varied from 25 �C to 65 �C (Fig. 4b). The re-sults showed that the sorption efficiency (84–97%) and adsorptioncapacity (105–121.3 mg/g) increased when temperature wasraised from 25 �C to 45 �C, and then both the parameters slightlydecreased (S = 6%, q = 7.4 mg/g) with the increase in temperaturefrom 45 to 65 �C. The maximum sorption efficiency (97%) andadsorption capacity (121.3 mg/g) was found at 45 �C. The resultsshow that adsorption is endothermic initially (25–45 �C), and itturned into exothermic process afterwards (45–65 �C). Yang et al.[31] also reported similar endothermic–exothermic driven trendduring the adsorption of cationic dye (methylene blue) on anionicstarch. The adsorption process was endothermic under 30 �C but itturned to exothermic above 30 �C. It is assumed that endothermicstatic interactions govern the adsorption process up to 45 �C and,exothermic hydrophobic interactions dominate beyond 45–65 �C[31,32].
3.3. Adsorption kinetics
Kinetic studies are carried out to understand the mechanism ofadsorption process. The adsorbate molecules undergo differentstages, while moving from bulk solution to the adsorbent surfacesuch as migration of adsorbate molecules to the external surfaceof adsorbent particles, molecular and pore diffusion [23]. Adsor-bate may face either single or combinations of these steps depend-ing on several factors [1,23]. Normally, three kinetic models(Lagergren pseudo-first order [33], pseudo-second order [34], andintra-particle diffusion [35], are applied to understand adsorptionmechanism. These models are given as under by the followingequations:
logðqe � qtÞ ¼ log qe � k1t=2:303 ð4Þ
t=qt ¼ 1=ðk2q2eÞ þ t=qe ð5Þ
qt ¼ Kpit1=2 þ Ci ð6Þ
where qt is the adsorption capacity (mg/g) at any time t, k1 (min�1)is the adsorption rate constant, k2 (g/mg min) is the second orderadsorption rate constant, h ¼ k2q2
e denotes initial adsorption rate(mg/g min), Ci (mg/g) describes the boundary layer thickness, and
0
20
40
60
80
100
0
20
40
60
80
100
120
140
20 40 50 60 80 100
S (%)
S (%)
q (m
g/g)
Dye concentration (mg/L)
q S
80
85
90
95
100
105
95
100
105
110
115
120
125
130
25 35 45 55 65
q (m
g/g)
q
S
Temperature ( C)ο
(a)
(b)
Fig. 4. Effect of experimental factors on the adsorption of BG dye on red clay: (a)dye concentration, (b) temperature (m = 0.4 g/L, pH = 7.0, agitationspeed = 100 rpm, particle size = 58 lm).
58 M.S.U. Rehman et al. / Chemical Engineering Journal 228 (2013) 54–62
Author's personal copy
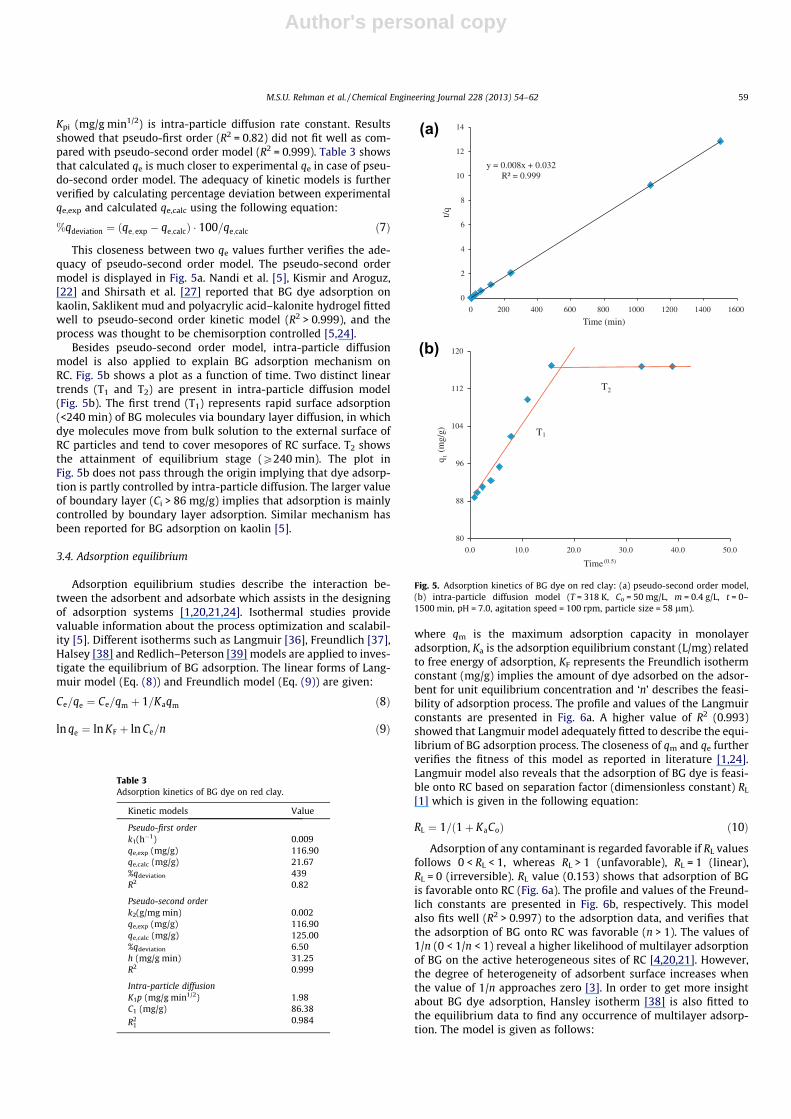
Kpi (mg/g min1/2) is intra-particle diffusion rate constant. Resultsshowed that pseudo-first order (R2 = 0.82) did not fit well as com-pared with pseudo-second order model (R2 = 0.999). Table 3 showsthat calculated qe is much closer to experimental qe in case of pseu-do-second order model. The adequacy of kinetic models is furtherverified by calculating percentage deviation between experimentalqe,exp and calculated qe,calc using the following equation:
%qdeviation ¼ ðqe; exp � qe;calcÞ � 100=qe;calc ð7Þ
This closeness between two qe values further verifies the ade-quacy of pseudo-second order model. The pseudo-second ordermodel is displayed in Fig. 5a. Nandi et al. [5], Kismir and Aroguz,[22] and Shirsath et al. [27] reported that BG dye adsorption onkaolin, Saklikent mud and polyacrylic acid–kalonite hydrogel fittedwell to pseudo-second order kinetic model (R2 > 0.999), and theprocess was thought to be chemisorption controlled [5,24].
Besides pseudo-second order model, intra-particle diffusionmodel is also applied to explain BG adsorption mechanism onRC. Fig. 5b shows a plot as a function of time. Two distinct lineartrends (T1 and T2) are present in intra-particle diffusion model(Fig. 5b). The first trend (T1) represents rapid surface adsorption(<240 min) of BG molecules via boundary layer diffusion, in whichdye molecules move from bulk solution to the external surface ofRC particles and tend to cover mesopores of RC surface. T2 showsthe attainment of equilibrium stage (P240 min). The plot inFig. 5b does not pass through the origin implying that dye adsorp-tion is partly controlled by intra-particle diffusion. The larger valueof boundary layer (Ci > 86 mg/g) implies that adsorption is mainlycontrolled by boundary layer adsorption. Similar mechanism hasbeen reported for BG adsorption on kaolin [5].
3.4. Adsorption equilibrium
Adsorption equilibrium studies describe the interaction be-tween the adsorbent and adsorbate which assists in the designingof adsorption systems [1,20,21,24]. Isothermal studies providevaluable information about the process optimization and scalabil-ity [5]. Different isotherms such as Langmuir [36], Freundlich [37],Halsey [38] and Redlich–Peterson [39] models are applied to inves-tigate the equilibrium of BG adsorption. The linear forms of Lang-muir model (Eq. (8)) and Freundlich model (Eq. (9)) are given:
Ce=qe ¼ Ce=qm þ 1=Kaqm ð8Þ
ln qe ¼ ln KF þ ln Ce=n ð9Þ
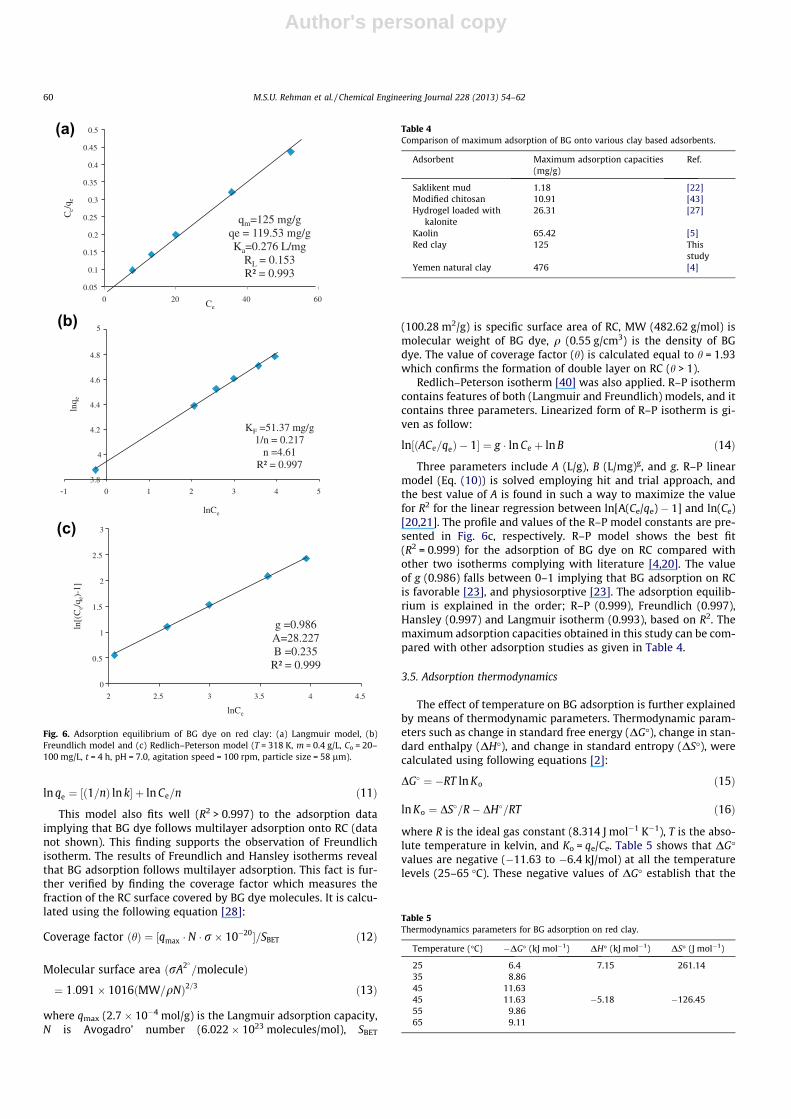
where qm is the maximum adsorption capacity in monolayeradsorption, Ka is the adsorption equilibrium constant (L/mg) relatedto free energy of adsorption, KF represents the Freundlich isothermconstant (mg/g) implies the amount of dye adsorbed on the adsor-bent for unit equilibrium concentration and ‘n’ describes the feasi-bility of adsorption process. The profile and values of the Langmuirconstants are presented in Fig. 6a. A higher value of R2 (0.993)showed that Langmuir model adequately fitted to describe the equi-librium of BG adsorption process. The closeness of qm and qe furtherverifies the fitness of this model as reported in literature [1,24].Langmuir model also reveals that the adsorption of BG dye is feasi-ble onto RC based on separation factor (dimensionless constant) RL
[1] which is given in the following equation:
RL ¼ 1=ð1þ KaCoÞ ð10Þ
Adsorption of any contaminant is regarded favorable if RL valuesfollows 0 < RL < 1, whereas RL > 1 (unfavorable), RL = 1 (linear),RL = 0 (irreversible). RL value (0.153) shows that adsorption of BGis favorable onto RC (Fig. 6a). The profile and values of the Freund-lich constants are presented in Fig. 6b, respectively. This modelalso fits well (R2 > 0.997) to the adsorption data, and verifies thatthe adsorption of BG onto RC was favorable (n > 1). The values of1/n (0 < 1/n < 1) reveal a higher likelihood of multilayer adsorptionof BG on the active heterogeneous sites of RC [4,20,21]. However,the degree of heterogeneity of adsorbent surface increases whenthe value of 1/n approaches zero [3]. In order to get more insightabout BG dye adsorption, Hansley isotherm [38] is also fitted tothe equilibrium data to find any occurrence of multilayer adsorp-tion. The model is given as follows:
Table 3Adsorption kinetics of BG dye on red clay.
Kinetic models Value
Pseudo-first orderk1(h�1) 0.009qe,exp (mg/g) 116.90qe,calc (mg/g) 21.67%qdeviation 439R2 0.82
Pseudo-second orderk2(g/mg min) 0.002qe,exp (mg/g) 116.90qe,calc (mg/g) 125.00%qdeviation 6.50h (mg/g min) 31.25R2 0.999
Intra-particle diffusionK1p (mg/g min1/2) 1.98C1 (mg/g) 86.38
R21
0.984
80
88
96
104
112
120
0.0 10.0 20.0 30.0 40.0 50.0
qt
(mg/
g)
Time(0.5)
T2
y = 0.008x + 0.032R² = 0.999
0
2
4
6
8
10
12
14
0 200 400 600 800 1000 1200 1400 1600
t/q
Time (min)
T1
(a)
(b)
Fig. 5. Adsorption kinetics of BG dye on red clay: (a) pseudo-second order model,(b) intra-particle diffusion model (T = 318 K, Co = 50 mg/L, m = 0.4 g/L, t = 0–1500 min, pH = 7.0, agitation speed = 100 rpm, particle size = 58 lm).
M.S.U. Rehman et al. / Chemical Engineering Journal 228 (2013) 54–62 59
Author's personal copy
ln qe ¼ ½ð1=nÞ ln k� þ ln Ce=n ð11Þ
This model also fits well (R2 > 0.997) to the adsorption dataimplying that BG dye follows multilayer adsorption onto RC (datanot shown). This finding supports the observation of Freundlichisotherm. The results of Freundlich and Hansley isotherms revealthat BG adsorption follows multilayer adsorption. This fact is fur-ther verified by finding the coverage factor which measures thefraction of the RC surface covered by BG dye molecules. It is calcu-lated using the following equation [28]:
Coverage factor ðhÞ ¼ ½qmax � N � r� 10�20�=SBET ð12Þ
Molecular surface area ðrA2�=moleculeÞ
¼ 1:091� 1016ðMW=qNÞ2=3 ð13Þ
where qmax (2.7 � 10�4 mol/g) is the Langmuir adsorption capacity,N is Avogadro’ number (6.022 � 1023 molecules/mol), SBET
(100.28 m2/g) is specific surface area of RC, MW (482.62 g/mol) ismolecular weight of BG dye, q (0.55 g/cm3) is the density of BGdye. The value of coverage factor (h) is calculated equal to h = 1.93which confirms the formation of double layer on RC (h > 1).
Redlich–Peterson isotherm [40] was also applied. R–P isothermcontains features of both (Langmuir and Freundlich) models, and itcontains three parameters. Linearized form of R–P isotherm is gi-ven as follow:
ln½ðACe=qeÞ � 1� ¼ g � ln Ce þ ln B ð14Þ
Three parameters include A (L/g), B (L/mg)g, and g. R–P linearmodel (Eq. (10)) is solved employing hit and trial approach, andthe best value of A is found in such a way to maximize the valuefor R2 for the linear regression between ln[A(Ce/qe) � 1] and ln(Ce)[20,21]. The profile and values of the R–P model constants are pre-sented in Fig. 6c, respectively. R–P model shows the best fit(R2 = 0.999) for the adsorption of BG dye on RC compared withother two isotherms complying with literature [4,20]. The valueof g (0.986) falls between 0–1 implying that BG adsorption on RCis favorable [23], and physiosorptive [23]. The adsorption equilib-rium is explained in the order; R–P (0.999), Freundlich (0.997),Hansley (0.997) and Langmuir isotherm (0.993), based on R2. Themaximum adsorption capacities obtained in this study can be com-pared with other adsorption studies as given in Table 4.
3.5. Adsorption thermodynamics
The effect of temperature on BG adsorption is further explainedby means of thermodynamic parameters. Thermodynamic param-eters such as change in standard free energy (DG�), change in stan-dard enthalpy (DH�), and change in standard entropy (DS�), werecalculated using following equations [2]:
DG� ¼ �RT ln Ko ð15Þ
ln Ko ¼ DS�=R� DH�=RT ð16Þ
where R is the ideal gas constant (8.314 J mol�1 K�1), T is the abso-lute temperature in kelvin, and Ko = qe/Ce. Table 5 shows that DG�values are negative (�11.63 to �6.4 kJ/mol) at all the temperaturelevels (25–65 �C). These negative values of DG� establish that the
g =0.986A=28.227B =0.235
R² = 0.999
0
0.5
1
1.5
2
2.5
3
2 2.5 3 3.5 4 4.5
ln[(
Ce/
q e)-
1]
lnCe
KF =51.37 mg/g1/n = 0.217
n =4.61R² = 0.997
3.8
4
4.2
4.4
4.6
4.8
5
-1 0 1 2 3 4 5
lnq e
lnCe
qm=125 mg/gqe = 119.53 mg/gKa=0.276 L/mg
RL = 0.153R² = 0.993
0.05
0.1
0.15
0.2
0.25
0.3
0.35
0.4
0.45
0.5
0 20 40 60
Ce/
q e
Ce
(a)
(b)
(c)
Fig. 6. Adsorption equilibrium of BG dye on red clay: (a) Langmuir model, (b)Freundlich model and (c) Redlich–Peterson model (T = 318 K, m = 0.4 g/L, Co = 20–100 mg/L, t = 4 h, pH = 7.0, agitation speed = 100 rpm, particle size = 58 lm).
Table 4Comparison of maximum adsorption of BG onto various clay based adsorbents.
Adsorbent Maximum adsorption capacities(mg/g)
Ref.
Saklikent mud 1.18 [22]Modified chitosan 10.91 [43]Hydrogel loaded with
kalonite26.31 [27]
Kaolin 65.42 [5]Red clay 125 This
studyYemen natural clay 476 [4]
Table 5Thermodynamics parameters for BG adsorption on red clay.
Temperature (�C) �DG� (kJ mol�1) DH� (kJ mol�1) DS� (J mol�1)
25 6.4 7.15 261.1435 8.8645 11.6345 11.63 �5.18 �126.4555 9.8665 9.11
60 M.S.U. Rehman et al. / Chemical Engineering Journal 228 (2013) 54–62
Author's personal copy
adsorption of BG onto RC is spontaneous [34] and physiosorptiveprocess because DG� values fall in the range of �20 to 0 kJ/mol[20,21]. The adsorption of BG dye shows successive endothermic–exothermic behavior (Section 3.2.6). Thermodynamic study showsthat the process is endothermic in the range of 25–45 �C(DH� + 7.15 kJ/mol) but it turns into exothermic from 45 to 65 �C(DH� � 5.18 kJ/mol) [21,24]. Moreover, the values of DH� (>�8 kJ/mol) verify that the BG adsorption is a physical process [5]. Rela-tively lower value of DH� (�5.18 kJ/mol) in the range of 45–65 �Cshows a decreased affinity of BG dye with RC. The positive valueof DS� (261 J/mol k) in the range of 25–45 �C indicates that increasein temperature facilitates dye adsorption by displacing water mol-ecules from RC surface [40]. On the other hand, negative value ofentropy in the range of 45–65 �C show ordered adsorption of BGon RC [41]. Based on temperature effect, we assume that endother-mic static interactions govern the adsorption process up to 45 �Cand exothermic hydrophobic interactions dominate beyond 45–65 �C [31,32]. Lindman et al. [42] reported that decrease in the val-ues of DH� and DS� with an increase in temperature show the tem-perature dependence of the hydrophobic effect. Thus, hydrophobicinteractions appear as driving force in the range of 45–65 �C [42].
4. Conclusion
The results showed that naturally existing red clay (RC) pos-sessed sufficient properties to be used as promising adsorbent toremove dyes from aqueous solution. Suitable levels of experimen-tal factors were found using one factor one time approach such assolution pH = 7, RC particle size = 58 lm, contact time = 4 h andadsorbent dose = 0.4 g/L and temperature 25 �C. The equilibriumbetween BG dye in the solution and on the RC surface was achievedin 4 h. Pseudo-second-order model (R2 > 0.999) described the BGadsorption kinetics adequately. Isothermal studies showed thatBG adsorption was favorable on RC and followed multilayeradsorption. Redlich–Peterson (R2 = 0.999) isotherm fitted well toexplained BG adsorption on RC. Negative values of DG� showedthat the adsorption process was spontaneous, favorable and phys-iosorptive. Moreover, adsorption process followed endothermic–exothermic trend with respect to temperature. The maximumadsorption capacity of BG on RC was found to be 125 mg/g. Theseresults showed that BG dye can be effectively removed from aque-ous solution employing RC as a cheap adsorbent.
Acknowledgements
This research was completed under KAIST, South Korea-Univer-sity of Gujrat, Pakistan Collaborative Research Program, and waspartly supported by the Advanced Biomass R&D Center (ABC)(ABC-2012053875) of Korea Grant funded by the Ministry of Edu-cation, Science and Technology and the New & Renewable Energyof the Korea Institute of Energy Technology Evaluation and Plan-ning (KETEP) Grant funded by the Korea government Ministry ofKnowledge Economy (No. 2012T100201665).
References
[1] Y. Safa, H.N. Bhatti, Kinetic and thermodynamic modeling for the removal ofDirect Red-31 and Direct Orange-26 dyes from aqueous solutions by rice husk,Desalination 272 (2011) 313–322.
[2] M. Javaid, A.R. Saleemi, S. Naveed, M. Zafar, N. Ramzan, Anaerobic treatment ofdesizing effluent in a mesophilic anaerobic packed bed reactor, JPIChE. 39(2011) 61–67.
[3] M. Auta, B.H. Hameed, Preparation of waste tea activated carbon usingpotassium acetate as an activating agent for adsorption of Acid Blue 25 dye,Chem. Eng. J. 171 (2011) 502–509.
[4] M.M. Nassar, M.S. El-Geundi, A.A. Al-Wahbi, Equilibrium modeling andthermodynamic parameters for adsorption of cationic dyes onto Yemennatural clay, Desalination Water Treat. 44 (2012) 340–349.
[5] B.K. Nandi, A. Goswami, M.K. Purkait, Adsorption characteristics of brilliantgreen dye on kaolin, J. Hazard. Mater. 161 (2009) 387–395.
[6] M.S.U. Rehman, S. Mehmood, A. Ahmad, A. Saeed, T. Mahmood, Color and CODreduction of biotreated complex wastewater using ozonation process, JPIChE.39 (2011) 83–89.
[7] F. Qian, X. Sun, Y. Liu, Removal characteristics of organics in bio-treated textilewastewater reclamation by a stepwise coagulation and intermediate GAC/O3
oxidation process, Chem. Eng. J. 214 (2013) 112–118.[8] E. Kurt, D.Y. Koseoglu-Imer, N. Dizge, S. Chellam, I. Koyuncu, Pilot-scale
evaluation of nanofiltration and reverse osmosis for process reuse ofsegregated textile dyewash wastewater, Desalination 302 (2012) 24–32.
[9] F. Aziz, M.S.U. Rehman, A. Batool, A. Muhammad, T. Mahmood, Pretreatment ofmunicipal, industrial and composite wastewater by ozonation, Environ.Process. Eng. 1–2 (2012) 1–8.
[10] A. Yasar, S. Khalil, A.B. Tabinda, A. Malik, Comparison of cost and treatmentefficiency of solar assisted advance oxidation processes for textile dye batheffluent, Korean J. Chem. Eng. 30 (2013) 131–138.
[11] A.M. Lotito, U. Fratino, G. Bergna, C.D. Iaconi, Integrated biological and ozonetreatment of printing textile wastewater, Chem. Eng. J. 195–196 (2012) 261–269.
[12] M. Asgher, H.N. Bhatti, Evaluation of thermodynamics and effect of chemicaltreatments on sorption potential of citrus waste biomass for removal ofanionic dyes from aqueous solutions, Ecol. Eng. 38 (2011) 79–85.
[13] I. Ali, V.K. Gupta, Advances in water treatment by adsorption technology,Nature Protocol 1 (2006) 2661–2667.
[14] I. Ali, New generation adsorbents for water treatment, Chem. Rev. 112 (2012)5073–5091.
[15] I. Ali, M. Asim, T.A. Khan, Low cost adsorbents for removal of organic pollutantsfrom wastewater, J. Environ. Manag. 113 (2012) 170–183.
[16] I. Ali, Water treatment by adsorption columns: evaluation at ground level, Sep.Purif. Rev. (2013), http://dx.doi.org/10.1080/15422119.2012.748671.
[17] I. Ali, The quest for active carbon adsorbent substitutes: inexpensiveadsorbents for toxic metal ions removal from wastewater, Sep. Purif. Rev. 39(2010) 95–171.
[18] M.S.U. Rehman, I. Kim, J.-I. Han, Adsorption of methylene blue dye fromaqueous solution by sugar extracted spent rice biomass, Carbohyd. Polym. 90(2012) 1314–1322.
[19] M.S.U. Rehman, I. Kim, J-I. Han, Biosorption of methylene blue from aqueoussolutions by Typha angustata phytomass, Int. J. Environ. Sci. Technol. (2012),http://dx.doi.org/10.1007/s13762-012-0128-5.
[20] M. Auta, B.H. Hameed, Modified mesoporous clay adsorbent for adsorptionisotherm and kinetics of methylene blue, Chem. Eng. J. 198–199 (2012) 219–227.
[21] M. Auta, B.H. Hameed, Acid modified local clay beads as effective low-costadsorbent for dynamic adsorption of methylene blue, J. Ind. Eng. Chem. (2013),http://dx.doi.org/10.1016/j.jiec.2012.12.012.
[22] Y. Kismir, A.Z. Aroguz, Adsorption characteristics of the hazardous dye BrilliantGreen on Saklıkent mud, Chem. Eng. J. 172 (2011) 199–206.
[23] V.S. Mane, P.V.V. Babu, Studies on the adsorption of Brilliant Green dye fromaqueous solution onto low-cost NaOH treated saw dust, Desalination 273(2011) 321–329.
[24] M. Ghaedi, H. Hossainian, M. Montazerozohori, A. Shokrollahi, F. Shojaipour,M. Soylak, M.K. Purkait, A novel acorn based adsorbent for the removal ofbrilliant green, Desalination 281 (2011) 226–233.
[25] M. Waseem, S. Mustafa, A. Naeem, K.H. Shah, I. Shah, Mechanism of Cd (II)sorption on silica synthesized by sol–gel method, Chem. Eng. J. 169 (2011) 78–83.
[26] P.S. Nayak, B.K. Singh, Instrumental characterization of clay by XRF, XRD andFTIR, Bull. Mater. Sci. 30 (2007) 235–238.
[27] S.R. Shirsath, A.P. Patil, R. Patil, J.B. Naik, P.R. Gogate, S.H. Sonawane, Removalof Brilliant Green from wastewater using conventional and ultrasonicallyprepared poly(acrylic acid) hydrogel loaded with kaolin clay A comparativestudy, Ultrason. Sonochem. 20 (2013) 914–923.
[28] Y.S. Al-Degs, M.I. El-Barghouthi, A.H. El-Sheikh, G.M. Walker, Effect of solutionpH, ionic strength, and temperature on adsorption behavior of reactive dyes onactivated carbon, Dyes Pigment 77 (2008) 16–23.
[29] M. Asgher, H.N. Bhatti, Evaluation of thermodynamics and effect of chemicaltreatments on sorption potential of Citrus waste biomass for removal ofanionic dyes from aqueous solutions, Ecol. Eng. 38 (2012) 79–85.
[30] A.Z. Aroguz, J. Gulen, R.H. Evers, Adsorption of methylene blue from aqueoussolution on pyrolyzed petrified sediment, Bioresour. Technol. 99 (2008) 1503–1508.
[31] Y. Yang, X. Wei, P. Sun, J. Wan, Preparation, characterization and adsorptionperformance of a novel anionic starch microsphere, Molecule 15 (2010) 2872–2885.
[32] S. Xu, J. Wang, R. Wu, J. Wang, H. Li, Adsorption behaviors of acid andbasic dyes on crosslinked amphoteric starch, Chem. Eng. J. 117 (2006)161–167.
[33] S. Lagergren, About the theory of so-called adsorption of soluble substances, K.Sven. Vetenskapsakad. Handl. 24 (1898) 1–39.
[34] Y.S. Ho, J.C.Y. Ng, G. Mckay, Kinetics of pollutants sorption by biosorbents:review, Sep. Purif. Method 29 (2000) 189–232.
[35] W.J. Weber Jr., J.C. Morris, Kinetics of adsorption on carbon from solution, J.Sanitary Eng. Div. Am. Soc. Chem. Eng. 89 (1963) 31–59.
[36] I. Langmuir, The adsorption of gases on plane surfaces of glass, mica andplatinum, J. Am. Chem. Soc. 40 (1918) 1361–1403.
M.S.U. Rehman et al. / Chemical Engineering Journal 228 (2013) 54–62 61

Author's personal copy
[37] H.M.F. Freundlich, Over the adsorption in solution, J. Phys. Chem. 57 (1906)385–471.
[38] G. Halsey, Physical adsorption on nonuniform surfaces, J. Chem. Phys. 16(1948) 931–937.
[39] O. Redlich, D.L. Peterson, A useful adsorption isotherm, J. Phys. Chem. 63(1959) 1024.
[40] M.A.M. Khraisheh, Y.S. Al-Degs, S.J. Allen, M.N. Ahmad, Elucidation ofcontrolling steps of reactive dye adsorption on activated carbon, Ind. Eng.Chem. Res. 41 (2002) 1651–1657.
[41] M. Dogan, H. Abak, M. Alkan, Adsorption of methylene blue onto hazelnutshell: kinetics, mechanism and activation parameters, J. Hazard. Matter 164(2009) 172–181.
[42] S. Lindman, I. Lynch, E. Thulin, H. Nilsson, K.A. Dawson, S. Linse, SystematicInvestigation of the thermodynamics of hsa adsorption to N-iso-Propylacrylamide/N-tert-Butylacrylamide copolymer nanoparticles: effects ofparticle size and hydrophobicity, Nano Lett. 7 (2007) 914–920.
[43] H. Karaer, _I. Uzun, Adsorption of basic dyestuffs from aqueous solution bymodified chitosan, Desalination Water Treat. 51 (2013) 2294–2305.
62 M.S.U. Rehman et al. / Chemical Engineering Journal 228 (2013) 54–62