removal of remazol brilliant violet5r dye using periwinkle shells
TRANSCRIPT
This article was downloaded by: [Olugbenga Solomon Bello]On: 17 October 2011, At: 22:58Publisher: Taylor & FrancisInforma Ltd Registered in England and Wales Registered Number: 1072954 Registeredoffice: Mortimer House, 37-41 Mortimer Street, London W1T 3JH, UK
Chemistry and EcologyPublication details, including instructions for authors andsubscription information:http://www.tandfonline.com/loi/gche20
Removal of Remazol Brilliant Violet-5Rdye using periwinkle shellsOlugbenga Solomon Bello a b & Mohd Azmier Ahmad aa School of Chemical Engineering, Universiti Sains Malaysia,Penang, Malaysiab Department of P/A Chemistry, Ladoke Akintola University ofTechnology, Ogbomoso, Nigeria
Available online: 17 Aug 2011
To cite this article: Olugbenga Solomon Bello & Mohd Azmier Ahmad (2011): Removal of RemazolBrilliant Violet-5R dye using periwinkle shells, Chemistry and Ecology, 27:5, 481-492
To link to this article: http://dx.doi.org/10.1080/02757540.2011.600696
PLEASE SCROLL DOWN FOR ARTICLE
Full terms and conditions of use: http://www.tandfonline.com/page/terms-and-conditions
This article may be used for research, teaching, and private study purposes. Anysubstantial or systematic reproduction, redistribution, reselling, loan, sub-licensing,systematic supply, or distribution in any form to anyone is expressly forbidden.
The publisher does not give any warranty express or implied or make any representationthat the contents will be complete or accurate or up to date. The accuracy of anyinstructions, formulae, and drug doses should be independently verified with primarysources. The publisher shall not be liable for any loss, actions, claims, proceedings,demand, or costs or damages whatsoever or howsoever caused arising directly orindirectly in connection with or arising out of the use of this material.
Chemistry and EcologyVol. 27, No. 5, October 2011, 481–492
Removal of Remazol Brilliant Violet-5R dye usingperiwinkle shells
Olugbenga Solomon Belloa,b* and Mohd Azmier Ahmada
aSchool of Chemical Engineering, Universiti Sains Malaysia, Penang, Malaysia; bDepartment of P/AChemistry, Ladoke Akintola University of Technology, Ogbomoso, Nigeria
(Received 14 February 2011; final version received 21 June 2011)
The purpose of this research is to obtain optimal processing conditions for the adsorption of Remazol Bril-liant Violet-5R (RBV-5R) dye onto activated carbon prepared from periwinkle shells (PSAC) by chemicalactivation with KOH using response surface methodology. Central composite design (CCD) was usedto determine the effects of three preparation variables; CO2 activation temperature, CO2 activation timeand KOH:char impregnation ratio (IR) on two responses; percentage RBV-5R dye removal and PSACyield. Based on the CCD, two quadratic models were developed for percentage RBV-5R dye removaland PSAC yield, respectively. The most influential factor on each experimental design response was iden-tified from the analysis of variance (ANOVA). The optimum conditions for the adsorption of RBV-5Rdye onto PSAC were CO2 activation temperature of 811 ◦C, CO2 activation time of 1.70 h and IR of 3.0,resulting in 81.28% RBV-5R dye removal and 28.18% PSAC yield. PSAC prepared under optimum con-ditions was mesoporous with a Brunauer–Emmett–Teller surface area of 1894 m2·g−1, total pore volumeof 1.107 cm3·g−1 and average pore diameter of 2.32 nm. The surface morphology and functional groupsof the activated carbon were respectively determined from the scanning electron microscopy and Fouriertransform infrared analysis.
Keywords: periwinkle shell activated carbon; adsorption; central composite design; dye; responses
1. Introduction
Water pollution is one of the most undesirable environmental problems in the world that requiresurgent solution. Textile industries produce a lot of wastewater, which contains different contam-inants, including acidic or caustic dissolved solids, toxic compounds and different type of dyes.Many of the organic dyes are hazardous and may affect aquatic life causing various diseases anddisorders [1]. Synthetic dyes are used extensively for textile dyeing and other industrial applica-tions. Total world colourant production is estimated to be ∼800,000 ton·year−1. More than 10,000dyes are commercially available and at least 10% of the dyestuff used enters the environment aswastes [2]. These industrial effluents are toxic and are characterised by high chemical oxygendemands (CODs)/biological oxygen demands (BODs), suspended solids and intense colour [3].Furthermore, these coloured molecules are highly conjugated and can be extremely injurious tothe life [4]. Synthetic dyes, classified by their chromophores, have different and stable chemical
*Corresponding author. Email: [email protected]
ISSN 0275-7540 print/ISSN 1029-0370 online© 2011 Taylor & Francishttp://dx.doi.org/10.1080/02757540.2011.600696http://www.tandfonline.com
Dow
nloa
ded
by [
Olu
gben
ga S
olom
on B
ello
] at
22:
58 1
7 O
ctob
er 2
011
482 O. S. Bello and M. A. Ahmad
structures to meet various colouring requirements and they are often difficult to degrade and/orremove using conventional physical and chemical processes [5,6]. Remazol Brilliant Violet Reac-tive (RBV-5R) is one of the most important dyes in the textile industry. It is frequently used asa starting material in the production of polymeric dyes. RBV-5R is an anthracene derivative andrepresents an important class of toxic and recalcitrant organic pollutants.
Marine snails in general are part of the family Gastropoda. They are found in oceans all over theworld. The major species available in the lagoon and mudflats of Nigeria’s Niger Delta, betweenCalabar in the east and Badagry in the west, are Typanostonus spp. and Pachmellania spp. Overthe years, lots of periwinkle shells have accumulated in many parts of the country such as Bori,Western Ijaw, Burutu, Agoro, Ogalaga and Lotugbene, thereby causing a serious environmentalchallenge. In this study, periwinkle (Typanotonus fuscatus), which is abundant in the Niger Deltain Nigeria along the mangrove intertidal wetland within the upper part of Bonny River systemadjoining a densely populated municipal environment, was used for activated carbon preparation.Periwinkles are usually 1.3–2.5 cm in height, and their colouration varies from grey to black.The shell is fairly heavy and solid. To make better use of this abundant waste, it was used in thepreparation of activated carbon. Conversion of periwinkle shell (PS) to activated carbon serves adual purpose. First, unwanted waste is converted to useful, value-added adsorbent and second, theuse of PS as a potential source of adsorbent contributes to solving wastewater treatment problemsin Nigeria. However, there are limited studies reported on the utilisation of PS, especially onconversion of PS into activated carbon. The most important characteristic of activated carbon isits adsorption performance, which is highly influenced by the preparation conditions that affectthe pore development and surface characteristics of the activated carbon produced. Therefore,the challenge in activated carbon production is to produce specific carbons that are suitable forcertain applications.
The experimental design technique is a very useful tool for this purpose because it provides sta-tistical models that help in understanding interactions among parameters that have been optimised[6]. Response surface methodology (RSM) has been found to be a useful tool in studying the inter-actions of two or more variables [7,8]. Optimisation of experimental conditions using RSM hasbeen widely applied in various processes. Some previous studies applying RSM in the preparationof activated carbons used precursors such as biochar [9], olive-waste cakes [10], Luscar char [11]and Turkish lignite [8]. To the best of our knowledge, there has been no study on the preparationof activated carbon from PS by physiochemical activation for adsorption of RBV-5R reactive dyefrom aqueous solutions using the RSM approach. Therefore, the focus of this research was tocarry out a statistical optimisation to determine the optimum preparation conditions for activatedcarbon derived from PS, which gave high activated carbon yield and high RBV-5R reactive dyeremoval from aqueous solutions, because these data are required as the starting point for scaling-up the laboratory results to pilot-plant or full-scale levels [12]. A central composite design (CCD)was selected to simultaneously study the effects of three activated carbon preparation variables(CO2 activation temperature, CO2 activation time and impregnation ratio, IR) on two responses.Empirical models correlating RBV-5R reactive dye removal and the activated carbon yield withthe three variables were then developed. The PS-based activated carbon prepared under optimumconditions was further characterised to determine its physical and chemical characteristics.
2. Material and methods
2.1. Remazol Brilliant Violet 5R dye (RBV-5R)
Remazol Brilliant Violet- 5R reactive dye supplied by Sigma-Aldrich (M) Sdn Bhd, Malaysia wasused as an adsorbate. Deionised water was used to prepare all reagents and solutions.
Dow
nloa
ded
by [
Olu
gben
ga S
olom
on B
ello
] at
22:
58 1
7 O
ctob
er 2
011
Chemistry and Ecology 483
2.2. Preparation of periwinkle shell-based activated carbon (PSAC)
PS was washed with water and subsequently dried at 105 ◦C for 24 h to remove moisture content.The dried PS was ground and sieved to a particle size of 1–2 mm before loading it into a stainlesssteel vertical tubular reactor placed in a tube furnace. A carbonisation step was carried out at400 ◦C for 30 min under nitrogen (99.99%) flow at flow rate of 150 mL·min−1. The char producedwas mixed with KOH pellets at different impregnation ratio (IR), calculated using Equation (1):
Impregnation ratio (I.R) = WKOH
WChar(1)
where WKOH is the dry weight (g) of KOH pellets and WChar is the dry weight (g) of char. Deionisedwater was then added to dissolve all the KOH pellets. The activation step was carried out usinga similar reactor as in carbonisation step. Once the final activation temperature was reached, thegas flow was switched from nitrogen to CO2 at a flow rate of 150 mL·min−1 for 2 h. The activatedproduct was then cooled to room temperature under nitrogen flow. The sample was washed withhydrochloric acid (0.1 M). Thereafter it was washed with hot deionised water until the pH of thewashed solution reached 6.5–7.
2.3. Adsorption studies
For batch adsorption studies, 0.2 g of PSAC were mixed with 100 mL aqueous dye solutionof 100 mg·L−1 initial concentration in 20 sets of 250-mL Erlenmeyer flasks. The mixture wasagitated at 120 rpm at 30 ◦C until equilibrium was reached. The concentration of RBV-5R dyesolution was determined using a UV-visible spectrophotometer (UV-1800 Shimadzu, Japan) ata maximum wavelength of 577 nm. The percentage dye removal at equilibrium was calculatedusing Equation (2):
Removal (%) = (Co − Ce)
C0× 100 (2)
where Co and Ce are the liquid-phase dye concentrations at initial state and at equilibrium(mg·L−1), respectively. The activated carbon yield was calculated using Equation (3):
Yield (%) = Wc
Wo× 100 (3)
where Wc and Wo are the dry weight of final PSAC (g) and the dry weight of precursor (g),respectively.
2.4. Design of experiment using CCD
RSM is a collection of statistical and mathematical techniques that uses quantitative data fromappropriate experiments to determine regression model equations and operating conditions whichare useful for developing, improving and optimising processes [13]. In this work, a standard RSMdesign called CCD was applied to study the variables for preparing PSAC. This method reducesthe number of experimental trials needed to evaluate multiple parameters and their interactions[14,15]. In this study, the preparation variables used were CO2 activation temperature (x1), CO2
activation time (x2) and KOH:char impregnation ratio (IR) (x3). These three variables togetherwith their respective ranges were chosen based on literature and preliminary studies are reportedin Table 1.
Dow
nloa
ded
by [
Olu
gben
ga S
olom
on B
ello
] at
22:
58 1
7 O
ctob
er 2
011
484 O. S. Bello and M. A. Ahmad
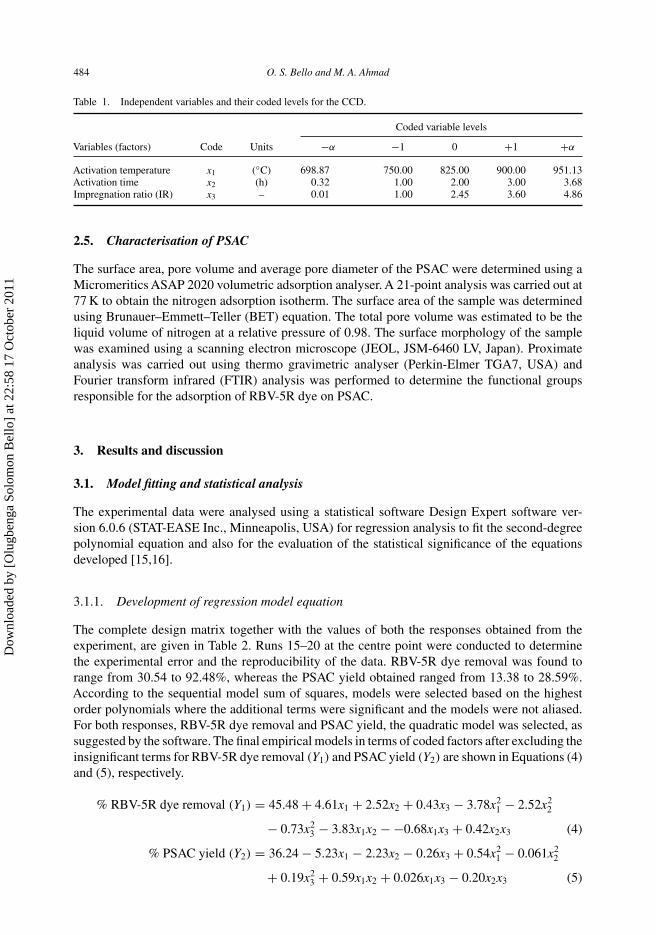
Table 1. Independent variables and their coded levels for the CCD.
Coded variable levels
Variables (factors) Code Units −α −1 0 +1 +α
Activation temperature x1 (◦C) 698.87 750.00 825.00 900.00 951.13Activation time x2 (h) 0.32 1.00 2.00 3.00 3.68Impregnation ratio (IR) x3 – 0.01 1.00 2.45 3.60 4.86
2.5. Characterisation of PSAC
The surface area, pore volume and average pore diameter of the PSAC were determined using aMicromeritics ASAP 2020 volumetric adsorption analyser. A 21-point analysis was carried out at77 K to obtain the nitrogen adsorption isotherm. The surface area of the sample was determinedusing Brunauer–Emmett–Teller (BET) equation. The total pore volume was estimated to be theliquid volume of nitrogen at a relative pressure of 0.98. The surface morphology of the samplewas examined using a scanning electron microscope (JEOL, JSM-6460 LV, Japan). Proximateanalysis was carried out using thermo gravimetric analyser (Perkin-Elmer TGA7, USA) andFourier transform infrared (FTIR) analysis was performed to determine the functional groupsresponsible for the adsorption of RBV-5R dye on PSAC.
3. Results and discussion
3.1. Model fitting and statistical analysis
The experimental data were analysed using a statistical software Design Expert software ver-sion 6.0.6 (STAT-EASE Inc., Minneapolis, USA) for regression analysis to fit the second-degreepolynomial equation and also for the evaluation of the statistical significance of the equationsdeveloped [15,16].
3.1.1. Development of regression model equation
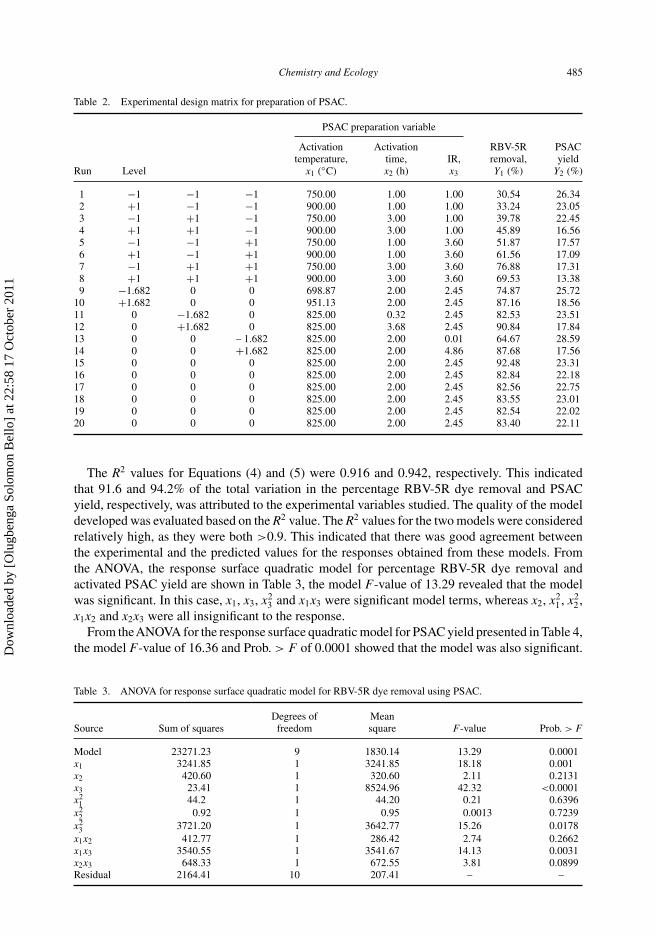
The complete design matrix together with the values of both the responses obtained from theexperiment, are given in Table 2. Runs 15–20 at the centre point were conducted to determinethe experimental error and the reproducibility of the data. RBV-5R dye removal was found torange from 30.54 to 92.48%, whereas the PSAC yield obtained ranged from 13.38 to 28.59%.According to the sequential model sum of squares, models were selected based on the highestorder polynomials where the additional terms were significant and the models were not aliased.For both responses, RBV-5R dye removal and PSAC yield, the quadratic model was selected, assuggested by the software. The final empirical models in terms of coded factors after excluding theinsignificant terms for RBV-5R dye removal (Y1) and PSAC yield (Y2) are shown in Equations (4)and (5), respectively.
% RBV-5R dye removal (Y1) = 45.48 + 4.61x1 + 2.52x2 + 0.43x3 − 3.78x21 − 2.52x2
2
− 0.73x23 − 3.83x1x2 − −0.68x1x3 + 0.42x2x3 (4)
% PSAC yield (Y2) = 36.24 − 5.23x1 − 2.23x2 − 0.26x3 + 0.54x21 − 0.061x2
2
+ 0.19x23 + 0.59x1x2 + 0.026x1x3 − 0.20x2x3 (5)
Dow
nloa
ded
by [
Olu
gben
ga S
olom
on B
ello
] at
22:
58 1
7 O
ctob
er 2
011
Chemistry and Ecology 485
Table 2. Experimental design matrix for preparation of PSAC.
PSAC preparation variable
Activation Activation RBV-5R PSACtemperature, time, IR, removal, yield
Run Level x1 (◦C) x2 (h) x3 Y1 (%) Y2 (%)
1 −1 −1 −1 750.00 1.00 1.00 30.54 26.342 +1 −1 −1 900.00 1.00 1.00 33.24 23.053 −1 +1 −1 750.00 3.00 1.00 39.78 22.454 +1 +1 −1 900.00 3.00 1.00 45.89 16.565 −1 −1 +1 750.00 1.00 3.60 51.87 17.576 +1 −1 +1 900.00 1.00 3.60 61.56 17.097 −1 +1 +1 750.00 3.00 3.60 76.88 17.318 +1 +1 +1 900.00 3.00 3.60 69.53 13.389 −1.682 0 0 698.87 2.00 2.45 74.87 25.72
10 +1.682 0 0 951.13 2.00 2.45 87.16 18.5611 0 −1.682 0 825.00 0.32 2.45 82.53 23.5112 0 +1.682 0 825.00 3.68 2.45 90.84 17.8413 0 0 – 1.682 825.00 2.00 0.01 64.67 28.5914 0 0 +1.682 825.00 2.00 4.86 87.68 17.5615 0 0 0 825.00 2.00 2.45 92.48 23.3116 0 0 0 825.00 2.00 2.45 82.84 22.1817 0 0 0 825.00 2.00 2.45 82.56 22.7518 0 0 0 825.00 2.00 2.45 83.55 23.0119 0 0 0 825.00 2.00 2.45 82.54 22.0220 0 0 0 825.00 2.00 2.45 83.40 22.11
The R2 values for Equations (4) and (5) were 0.916 and 0.942, respectively. This indicatedthat 91.6 and 94.2% of the total variation in the percentage RBV-5R dye removal and PSACyield, respectively, was attributed to the experimental variables studied. The quality of the modeldeveloped was evaluated based on the R2 value. The R2 values for the two models were consideredrelatively high, as they were both >0.9. This indicated that there was good agreement betweenthe experimental and the predicted values for the responses obtained from these models. Fromthe ANOVA, the response surface quadratic model for percentage RBV-5R dye removal andactivated PSAC yield are shown in Table 3, the model F-value of 13.29 revealed that the modelwas significant. In this case, x1, x3, x2
3 and x1x3 were significant model terms, whereas x2, x21, x2
2,x1x2 and x2x3 were all insignificant to the response.
From theANOVA for the response surface quadratic model for PSAC yield presented in Table 4,the model F-value of 16.36 and Prob. > F of 0.0001 showed that the model was also significant.
Table 3. ANOVA for response surface quadratic model for RBV-5R dye removal using PSAC.
Degrees of MeanSource Sum of squares freedom square F-value Prob. > F
Model 23271.23 9 1830.14 13.29 0.0001x1 3241.85 1 3241.85 18.18 0.001x2 420.60 1 320.60 2.11 0.2131x3 23.41 1 8524.96 42.32 <0.0001x2
1 44.2 1 44.20 0.21 0.6396x2
2 0.92 1 0.95 0.0013 0.7239x2
3 3721.20 1 3642.77 15.26 0.0178x1x2 412.77 1 286.42 2.74 0.2662x1x3 3540.55 1 3541.67 14.13 0.0031x2x3 648.33 1 672.55 3.81 0.0899Residual 2164.41 10 207.41 – –
Dow
nloa
ded
by [
Olu
gben
ga S
olom
on B
ello
] at
22:
58 1
7 O
ctob
er 2
011
486 O. S. Bello and M. A. Ahmad
Table 4. ANOVA for response surface quadratic model for PSAC yield.
Sum of Degrees of MeanSource squares freedom square F-value Prob. > F
Model 328.40 9 328.40 16.36 0.0001x1 88.73 1 88.73 32.48 0.0002x2 16.21 1 16.21 5.88 0.0242x3 48.71 1 48.71 17.41 0.0016x2
1 121.23 1 121.23 46.16 <0.0001x2
2 38.43 1 38.43 14.24 0.0029x2
3 10.06 1 10.06 3.21 0.0646x1x2 0.054 1 0.054 0.024 0.07863x1x3 12.18 1 12.18 4.86 0.0531x2x3 12.18 1 12.18 4.86 0.0531Residual 25.16 10 25.26 – –
In this case, x1, x2, x3, x21 and x2
2 were significant model terms whereas x23 and the three interaction
effects of x1x2, x1x3 and x2x3 were negligible to the response.
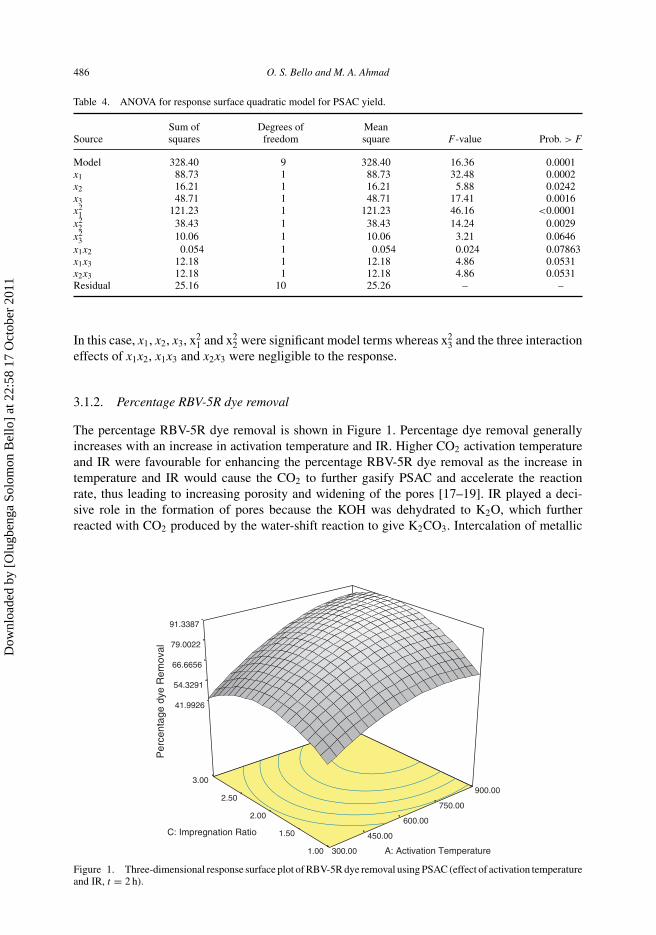
3.1.2. Percentage RBV-5R dye removal
The percentage RBV-5R dye removal is shown in Figure 1. Percentage dye removal generallyincreases with an increase in activation temperature and IR. Higher CO2 activation temperatureand IR were favourable for enhancing the percentage RBV-5R dye removal as the increase intemperature and IR would cause the CO2 to further gasify PSAC and accelerate the reactionrate, thus leading to increasing porosity and widening of the pores [17–19]. IR played a deci-sive role in the formation of pores because the KOH was dehydrated to K2O, which furtherreacted with CO2 produced by the water-shift reaction to give K2CO3. Intercalation of metallic
41.9926
54.3291
66.6656
79.0022
91.3387
Per
cent
age
dye
Rem
oval
300.00
450.00
600.00
750.00
900.00
1.00
1.50
2.00
2.50
3.00
A: Activation Temperature
C: Impregnation Ratio
Figure 1. Three-dimensional response surface plot of RBV-5R dye removal using PSAC (effect of activation temperatureand IR, t = 2 h).
Dow
nloa
ded
by [
Olu
gben
ga S
olom
on B
ello
] at
22:
58 1
7 O
ctob
er 2
011
Chemistry and Ecology 487
potassium, which was formed above 700 ◦C, appeared to be responsible for the drastic expan-sion of the carbon material and the creation of large surface area and high porosity, leading tothe high percentage RBV-5R dye removal [18,19]. The results obtained revealed that activationtime showed an insignificant effect on the percentage RBV-5R dye removal of the PSAC. Thisobservation was in agreement with the study by Sudaryanto et al. [20] who reported that acti-vation time had no significant effect on the pore structure of activated carbon produced fromcassava peel, whereas the pore characteristics changed significantly with the activation temper-ature and also the KOH impregnation ratio. Gratuito et al. [21] stated that the duration of theactivation had a significant effect on the development of the carbon porous networks; never-theless, the activation time should just be enough to eliminate all the moisture and most of thevolatile components in the precursor to cause the pores to develop. Because the end of the volatileevolution marked the formation of the basic pore structure, activation should be limited up tothat point. The three variables studied were found to have synergistic effects on the percent-age RBV-5R dye removal. This was expected as the increase in activation temperature and timewould entail an opening and enlargement of the pores, which enhanced the adsorption of RBV-5Rdye [10,22,23].
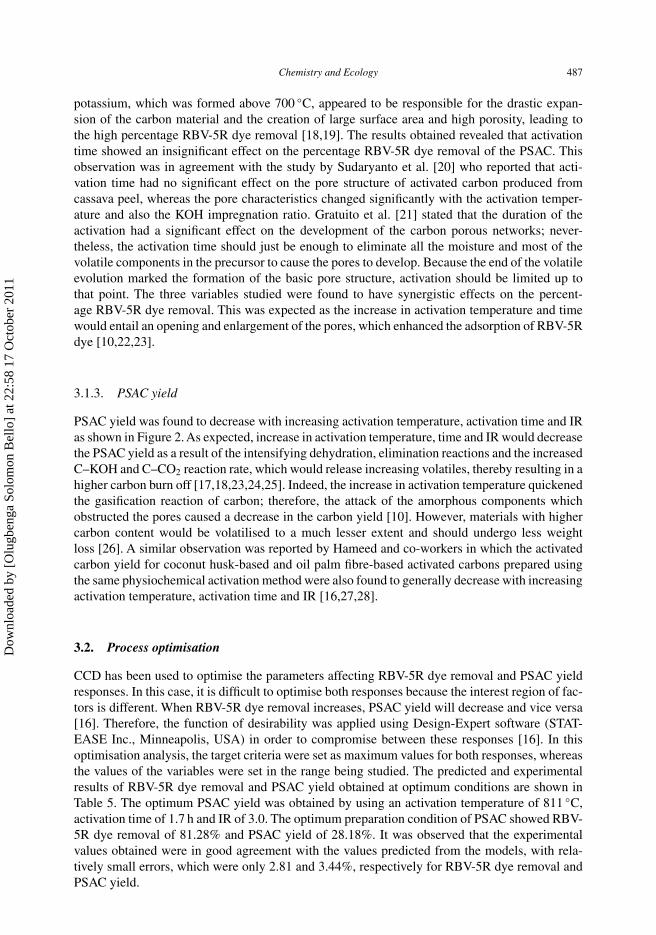
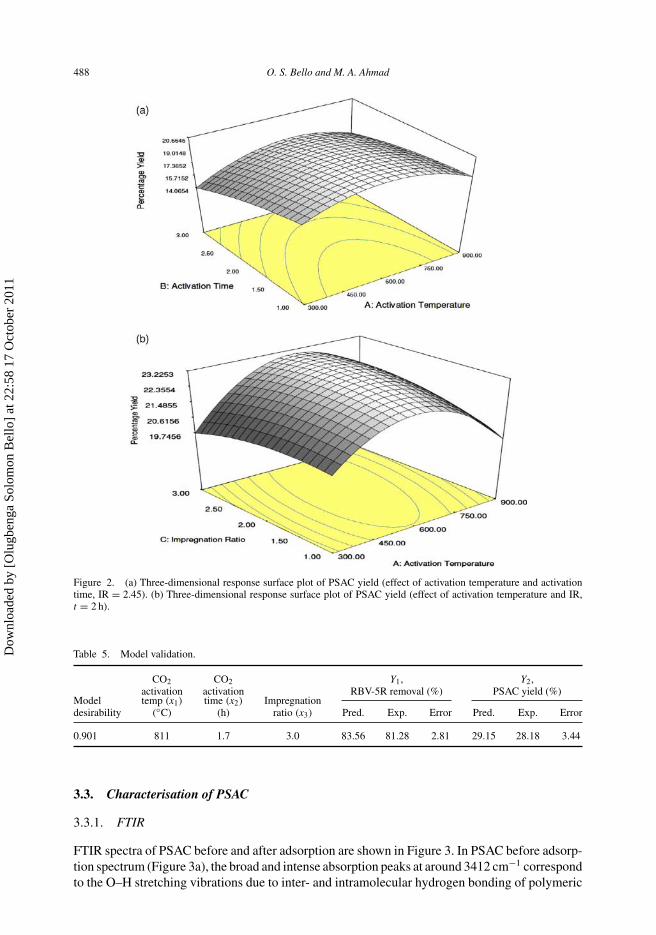
3.1.3. PSAC yield
PSAC yield was found to decrease with increasing activation temperature, activation time and IRas shown in Figure 2. As expected, increase in activation temperature, time and IR would decreasethe PSAC yield as a result of the intensifying dehydration, elimination reactions and the increasedC–KOH and C–CO2 reaction rate, which would release increasing volatiles, thereby resulting in ahigher carbon burn off [17,18,23,24,25]. Indeed, the increase in activation temperature quickenedthe gasification reaction of carbon; therefore, the attack of the amorphous components whichobstructed the pores caused a decrease in the carbon yield [10]. However, materials with highercarbon content would be volatilised to a much lesser extent and should undergo less weightloss [26]. A similar observation was reported by Hameed and co-workers in which the activatedcarbon yield for coconut husk-based and oil palm fibre-based activated carbons prepared usingthe same physiochemical activation method were also found to generally decrease with increasingactivation temperature, activation time and IR [16,27,28].
3.2. Process optimisation
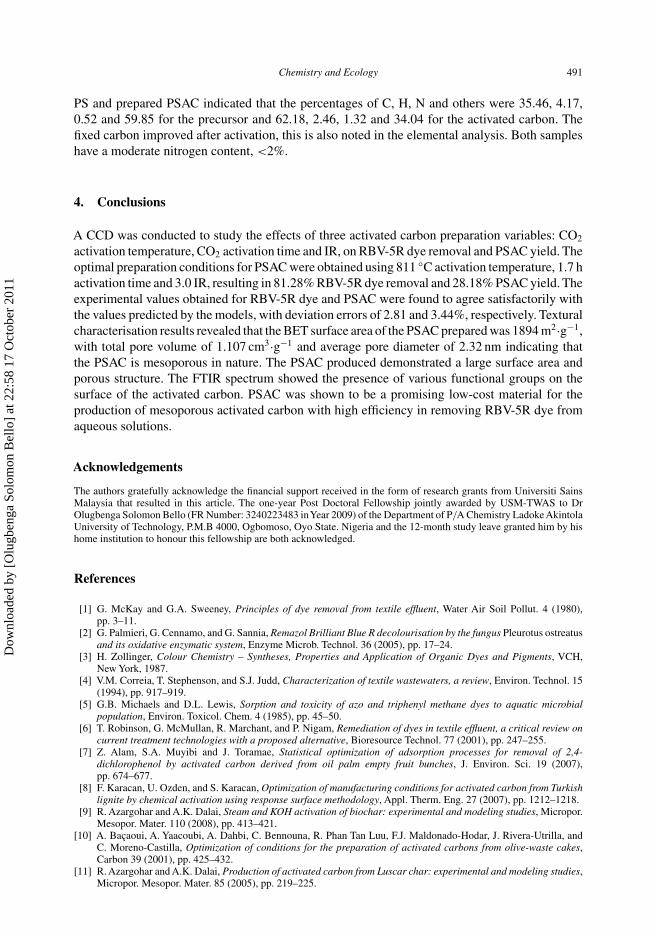
CCD has been used to optimise the parameters affecting RBV-5R dye removal and PSAC yieldresponses. In this case, it is difficult to optimise both responses because the interest region of fac-tors is different. When RBV-5R dye removal increases, PSAC yield will decrease and vice versa[16]. Therefore, the function of desirability was applied using Design-Expert software (STAT-EASE Inc., Minneapolis, USA) in order to compromise between these responses [16]. In thisoptimisation analysis, the target criteria were set as maximum values for both responses, whereasthe values of the variables were set in the range being studied. The predicted and experimentalresults of RBV-5R dye removal and PSAC yield obtained at optimum conditions are shown inTable 5. The optimum PSAC yield was obtained by using an activation temperature of 811 ◦C,activation time of 1.7 h and IR of 3.0. The optimum preparation condition of PSAC showed RBV-5R dye removal of 81.28% and PSAC yield of 28.18%. It was observed that the experimentalvalues obtained were in good agreement with the values predicted from the models, with rela-tively small errors, which were only 2.81 and 3.44%, respectively for RBV-5R dye removal andPSAC yield.
Dow
nloa
ded
by [
Olu
gben
ga S
olom
on B
ello
] at
22:
58 1
7 O
ctob
er 2
011
488 O. S. Bello and M. A. Ahmad
Figure 2. (a) Three-dimensional response surface plot of PSAC yield (effect of activation temperature and activationtime, IR = 2.45). (b) Three-dimensional response surface plot of PSAC yield (effect of activation temperature and IR,t = 2 h).
Table 5. Model validation.
CO2 CO2 Y1, Y2,activation activation RBV-5R removal (%) PSAC yield (%)
Model temp (x1) time (x2) Impregnationdesirability (◦C) (h) ratio (x3) Pred. Exp. Error Pred. Exp. Error
0.901 811 1.7 3.0 83.56 81.28 2.81 29.15 28.18 3.44
3.3. Characterisation of PSAC
3.3.1. FTIR
FTIR spectra of PSAC before and after adsorption are shown in Figure 3. In PSAC before adsorp-tion spectrum (Figure 3a), the broad and intense absorption peaks at around 3412 cm−1 correspondto the O–H stretching vibrations due to inter- and intramolecular hydrogen bonding of polymeric
Dow
nloa
ded
by [
Olu
gben
ga S
olom
on B
ello
] at
22:
58 1
7 O
ctob
er 2
011

Chemistry and Ecology 489
Figure 3. FTIR spectra of PSAC before and after adsorption.
compounds (macromolecular associations), such as alcohols, phenols and carboxylic acids, as inpectin, cellulose and lignin, thus showing the presence of ‘free’ hydroxyl groups on the PSACsurface. The peak at 2919 cm−1 is attributed to the symmetric and asymmetric C–H stretchingvibration of aliphatic acids. The peak at 1634 cm−1 is due to asymmetric stretching vibrationsof C=O and the peak observed at 1509 cm−1 can be assigned to aromatic compound group. Theother prominent peaks are due to NH2, C=O and −C−C− (1427, 1035 and 606 cm−1, respec-tively) groups. After adsorption (Figure 3b), there is remarkable shift in positions of −OH, COand −C−C− group peaks to lower wave numbers indicating that RBV-5R dye binds mostly at−OH and CO groups. The changes in FTIR spectra confirm the complexation of RBV-5R dyewith the functional groups present in PSAC.
3.3.2. BET
It was found that the BET surface area, total pore volume and average pore diameter of PSAC were1894 m2·g−1, 1.107 cm3·g−1 and 2.32 nm respectively. The porosity of PSAC is well developedwith a higher surface area, total pore volume and larger average pore diameter, which are advanta-geous for dye adsorption. The average pore diameter of the PSAC was found to be 2.32 nm. Thisindicated that PSAC was mesoporous, with a relatively large surface area and total pore volumecompared with commercially available activated carbons such as BDH from Merck, F100 andBPL from Calgon Corp. with BET surface areas of 1118, 957 and 972 m2·g−1, as well as totalpore volumes of 0.618, 0.526 and 0.525 cm3·g−1, respectively [22].
3.3.3. SEM
Figure 4 shows the SEM images of (a) the raw PS and (b) the PSAC. Many large pores witha honeycomb shape were found on the surface of the PSAC, compared with the raw PS. Thisshows that the activation process was effective in creating well-developed pores on the surface ofthe precursor, leading to PSAC with large surface area and porous structure [29,30]. These poresallowed a good surface for RBV-5R reactive dye to be trapped and adsorbed [31].
Dow
nloa
ded
by [
Olu
gben
ga S
olom
on B
ello
] at
22:
58 1
7 O
ctob
er 2
011

490 O. S. Bello and M. A. Ahmad
Figure 4. SEM of raw PS and PSAC (magnification 500×).
Table 6. Proximate analysis of PSAC.
Elemental analysis (%) Proximate analysis (%)
Sample C H N (O + S)a Moisture Volatile Fixed carbon Ash
Raw PS 35.46 4.17 0.52 59.85 13.14 52.35 30.26 4.25PSAC 62.18 2.46 1.32 34.04 10.00 20.50 64.90 4.60
Note: aEstimated by difference.
3.3.4. Proximate and elemental analyses
The proximate analyses of PSAC are presented in Table 6. The volatile matter and ash contentsin the PSAC were 20.5 and 4.6% respectively. The fixed carbon content was satisfactory in theprepared activated carbon, having a value of 64.9%, indicating that the precursor was suitable inactivated carbon preparation. For moisture content, it left ∼10%. Elemental analyses of the raw
Dow
nloa
ded
by [
Olu
gben
ga S
olom
on B
ello
] at
22:
58 1
7 O
ctob
er 2
011
Chemistry and Ecology 491
PS and prepared PSAC indicated that the percentages of C, H, N and others were 35.46, 4.17,0.52 and 59.85 for the precursor and 62.18, 2.46, 1.32 and 34.04 for the activated carbon. Thefixed carbon improved after activation, this is also noted in the elemental analysis. Both sampleshave a moderate nitrogen content, <2%.
4. Conclusions
A CCD was conducted to study the effects of three activated carbon preparation variables: CO2
activation temperature, CO2 activation time and IR, on RBV-5R dye removal and PSAC yield. Theoptimal preparation conditions for PSAC were obtained using 811 ◦C activation temperature, 1.7 hactivation time and 3.0 IR, resulting in 81.28% RBV-5R dye removal and 28.18% PSAC yield. Theexperimental values obtained for RBV-5R dye and PSAC were found to agree satisfactorily withthe values predicted by the models, with deviation errors of 2.81 and 3.44%, respectively. Texturalcharacterisation results revealed that the BET surface area of the PSAC prepared was 1894 m2·g−1,with total pore volume of 1.107 cm3·g−1 and average pore diameter of 2.32 nm indicating thatthe PSAC is mesoporous in nature. The PSAC produced demonstrated a large surface area andporous structure. The FTIR spectrum showed the presence of various functional groups on thesurface of the activated carbon. PSAC was shown to be a promising low-cost material for theproduction of mesoporous activated carbon with high efficiency in removing RBV-5R dye fromaqueous solutions.
Acknowledgements
The authors gratefully acknowledge the financial support received in the form of research grants from Universiti SainsMalaysia that resulted in this article. The one-year Post Doctoral Fellowship jointly awarded by USM-TWAS to DrOlugbenga Solomon Bello (FR Number: 3240223483 inYear 2009) of the Department of P/A Chemistry Ladoke AkintolaUniversity of Technology, P.M.B 4000, Ogbomoso, Oyo State. Nigeria and the 12-month study leave granted him by hishome institution to honour this fellowship are both acknowledged.
References
[1] G. McKay and G.A. Sweeney, Principles of dye removal from textile effluent, Water Air Soil Pollut. 4 (1980),pp. 3–11.
[2] G. Palmieri, G. Cennamo, and G. Sannia, Remazol Brilliant Blue R decolourisation by the fungus Pleurotus ostreatusand its oxidative enzymatic system, Enzyme Microb. Technol. 36 (2005), pp. 17–24.
[3] H. Zollinger, Colour Chemistry – Syntheses, Properties and Application of Organic Dyes and Pigments, VCH,New York, 1987.
[4] V.M. Correia, T. Stephenson, and S.J. Judd, Characterization of textile wastewaters, a review, Environ. Technol. 15(1994), pp. 917–919.
[5] G.B. Michaels and D.L. Lewis, Sorption and toxicity of azo and triphenyl methane dyes to aquatic microbialpopulation, Environ. Toxicol. Chem. 4 (1985), pp. 45–50.
[6] T. Robinson, G. McMullan, R. Marchant, and P. Nigam, Remediation of dyes in textile effluent, a critical review oncurrent treatment technologies with a proposed alternative, Bioresource Technol. 77 (2001), pp. 247–255.
[7] Z. Alam, S.A. Muyibi and J. Toramae, Statistical optimization of adsorption processes for removal of 2,4-dichlorophenol by activated carbon derived from oil palm empty fruit bunches, J. Environ. Sci. 19 (2007),pp. 674–677.
[8] F. Karacan, U. Ozden, and S. Karacan, Optimization of manufacturing conditions for activated carbon from Turkishlignite by chemical activation using response surface methodology, Appl. Therm. Eng. 27 (2007), pp. 1212–1218.
[9] R. Azargohar and A.K. Dalai, Steam and KOH activation of biochar: experimental and modeling studies, Micropor.Mesopor. Mater. 110 (2008), pp. 413–421.
[10] A. Baçaoui, A. Yaacoubi, A. Dahbi, C. Bennouna, R. Phan Tan Luu, F.J. Maldonado-Hodar, J. Rivera-Utrilla, andC. Moreno-Castilla, Optimization of conditions for the preparation of activated carbons from olive-waste cakes,Carbon 39 (2001), pp. 425–432.
[11] R. Azargohar and A.K. Dalai, Production of activated carbon from Luscar char: experimental and modeling studies,Micropor. Mesopor. Mater. 85 (2005), pp. 219–225.
Dow
nloa
ded
by [
Olu
gben
ga S
olom
on B
ello
] at
22:
58 1
7 O
ctob
er 2
011
492 O. S. Bello and M. A. Ahmad
[12] Z.R. Lazic, Design of Experiments in Chemical Engineering, 1st ed., Wiley-VCH Verlag, Weinheim, 2004.[13] M.A. Ahmad and R. Alrozi, Optimization of preparation conditions for mangosteen peel-based activated carbons
for the removal of Remazol Brilliant Blue R using response surface methodology, Chem. Eng. J. 165 (2010),pp. 883–890.
[14] D.C. Montgomery, Design and Analysis of Experiments, 7th ed., Wiley, New York, 2009.[15] N.F. Zainudin, K.T. Lee, A.H. Kamaruddin, S. Bhatia, and A.R. Mohamed, Study of adsorbent prepared from oil
palm ash (OPA) for flue gas desulfurization, Sep. Purif. Technol. 45 (2005), pp. 50–60.[16] I.A.W. Tan, A.L. Ahmad, and B.H. Hameed, Optimization of preparation conditions for activated carbons from
coconut husk using response surface methodology, Chem. Eng. J. 137 (2008), pp. 462–470.[17] F.C. Wu and R.L. Tseng, Preparation of highly porous carbon from fir wood by KOH etching and CO2 gasification
for adsorption of dyes and phenols from water, J. Colloid Interface Sci. 294 (2006), pp. 21–30.[18] D. Adinata, W.M.A. Wan Daud, and M.K. Aroua, Preparation and characterization of activated carbon from palm
shell by chemical activation with K2CO3, Bioresource Technol. 98 (2007), pp. 145–149.[19] A. Zabaniotou, G. Stavropoulos, and V. Skoulou, Activated carbon from olive kernels in a two-stage process:
industrial improvement, Bioresource Technol. 99 (2008), pp. 320–326.[20] Y. Sudaryanto, S.B. Hartono, W. Irawaty, H. Hindarso, and S. Ismadji, High surface area activated carbon prepared
from cassava peel by chemical activation, Bioresource Technol. 97 (2006), pp. 734–739.[21] M.K.B. Gratuito, T. Panyathanmaporn, R.A. Chumnanklang, N. Sirinuntawittaya, and A. Dutta, Production of
activated carbon from coconut shell: optimization using response surface methodology, Bioresource Technol. 99(2008), pp. 4887–4895.
[22] G.G. Stavropoulos and A.A. Zabaniotou, Production and characterization of activated carbons from olive-seedwaste residue, Micropor. Mesopor. Mater. 82 (2005), pp. 79–85.
[23] A.C. Lua and T.Yang, Effect of activation temperature on the textural and chemical properties of potassium hydroxideactivated carbon prepared from pistachio nut shell, J. Colloid Interface Sci. 274 (2004), pp. 594–601.
[24] C.Sentorun-Shalaby, M.G. Ucak-Astarlıoglu, L. Artok, and C. Sarıcı, Preparation and characterization of acti-vated carbons by one-step steam pyrolysis/activation from apricot stones, Micropor. Mesopor. Mater. 88 (2006),pp. 126–134.
[25] T.Yang and A.C. Lua, Characteristics of activated carbons prepared from pistachio nut shells by physical activation,J. Colloid Interface Sci. 267 (2003), pp. 408–417.
[26] R.M. Suzuki,A.D.Andrade, J.C. Sousa, and M.C. Rollemberg, Preparation and characterization of activated carbonfrom rice bran, Bioresource Technol. 98 (2007), pp. 1985–1991.
[27] B.H. Hameed, I.A.W. Tan, and A.L. Ahmad, Optimization of basic dye removal by oil palm fibre-based activatedcarbon using response surface methodology, J. Hazard. Mater. 158 (2008), pp. 324–332.
[28] I.A.W. Tan, A.L. Ahmad, and B.H. Hameed, Preparation of activated carbon from coconut husk: optimization studyon removal of 2,4,6-trichlorophenol using response surface methodology, J. Hazard. Mater. 153 (2008), pp. 709–717.
[29] P. Ricou-Hoeffer, I. Lecuyer and P.L. Cloirec, Experimental design methodology applied to adsorption of metallicions onto fly ash, Water Res. 35 (2001), pp. 965–976.
[30] B.H. Hameed and F.B.M. Daud, Adsorption studies of basic dye on activated carbon derived from agriculturalwaste: Hevea brasiliensis seed coat, Chem. Eng. J. 139 (2008), pp. 48–55.
[31] N.K. Amin, Removal of acid blue -106 dye from aqueous solution using new activated carbons developed frompomegranate peel: adsorption equilibrium and kinetics, J. Hazard. Mater. 165 (2008), pp. 52–62.
Dow
nloa
ded
by [
Olu
gben
ga S
olom
on B
ello
] at
22:
58 1
7 O
ctob
er 2
011