action plan for critically polluted areas of agra
TRANSCRIPT
U.P POLLUTION CONTROL BOARD, AGRA
Action Plan For Critically Polluted Areas
of Agra
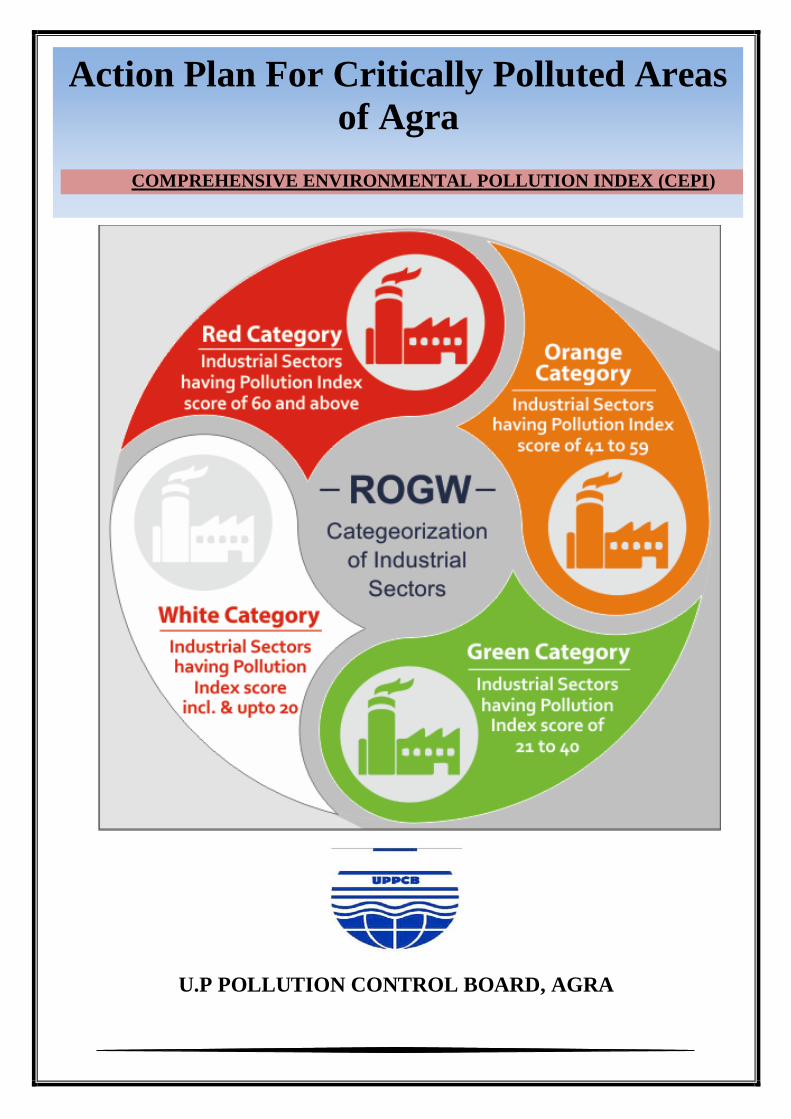
COMPREHENSIVE ENVIRONMENTAL POLLUTION INDEX (CEPI)
1. Background
Central Pollution Control Board (CPCB) in collaboration with Indian Institute of
Technology (IIT), Delhi had carried out comprehensive environmental assessment of 88
prominent industrial clusters during 2009-10 based on Comprehensive Environmental
Pollution Index (CEPI) criteria. CEPI is a rational number between 0 and 100, assigned to a
given location to characterize the environmental quality following the algorithm of source,
pathway and receptor. Out of identified 88 prominent industrial clusters, 43 industrial clusters
in 16 States having CEPI score of 70 and above are identified as Critically Polluted Industrial
Clusters. Further, 32 industrial clusters with CEPI scores between 60 & 70 are categorized as
severely polluted areas.
Subsequently, Ministry of Environment, Forest and Climate Change, GoI had
imposed a temporary moratorium vide O. M. 13.01.2010 on consideration of developmental
projects in critically polluted industrial cluster/areas including the projects in pipeline for
Environmental Clearance. Thereafter, action plans for each of abovementioned critical
clusters was submitted by Uttar Pradesh Pollution Control Board and implemented after
approval of CPCB.
Since 2009-10, CPCB has been doing routine monitoring in industrial clusters
identified under CEPI through third party and releasing amended CEPI scores on basis of
results. Based on these monitoring results, CEPI score of Agra was calculated and details of
same have been tabulated in Table :1
Table :1
S. No. Year CEPI Score
1 2009 76.48
2 2011 88.36
3 2013 68.71
Revised CEPI
With a concept to promote industrial development consistent with the environmental
objectives and understanding the fact that the original concept and calculation of CEPI score
was based on verticals where subjectivity was involved, in order to overcome the
subjectivity, revised concept retaining the factors which can be measured/monitored precisely
was drafted by CPCB in 2015 and finalized in 2016. The revised criteria for CEPI has been
based on following principles:
Revised concept is prepared by eliminating the debatable factors but retaining the factors
which can be measured precisely.
To develop the Comprehensive Environmental Pollution Index (CEPI) retaining the existing
algorithm of Source, Pathway and Receptor.
Develop the Revised CEPI considering the sources of pollution, real time observed
values of the pollutants in the ambient air, surface water and ground water of the
industrial cluster and health related statistics. The concept is based on the selection of
3 criteria pollutants for each of the environment components i.e. air, surface water and
ground water which together indicate the well being of ambient environment.
Assessment of environmental quality of the area based on the concept of SNLF to
which is a surrogate number representing the level of exposure (a function of
percentage sample exceedance and Exceedance factor)
Health related statistics to be based on health data available from major hospitals in
the area.
The scoring format has also been restructured in Revised CEPI, same is detailed in
Table: 2.
Table: 2
Component A Scale of Industrial Activity 20 Marks
Component B Status of ambient environmental
quality (air/surface water/ground
water)
50 Marks
Component C Health related statistics 10 Marks
Component D Compliance status of industries 20 Marks
Based on latest CEPI scores, there are total 13 Polluted industrial Areas (PIAs) in the State of
Uttar Pradesh, out of which 9 are critically polluted Areas (CPAs) namely Mathura, Kanpur,
Moradabad, Varanasi-Mirzapur, Bulandshahar-Khurja, Firozabad, Gajraula area, Agra,
Ghaziabad and 4 are severely Polluted Area viz. Noida, Meerut, Aligarh, Singrauli (UP&
MP). As mentioned above, CEPI score for Agra industrial clusters is 76.22 as per latest score.
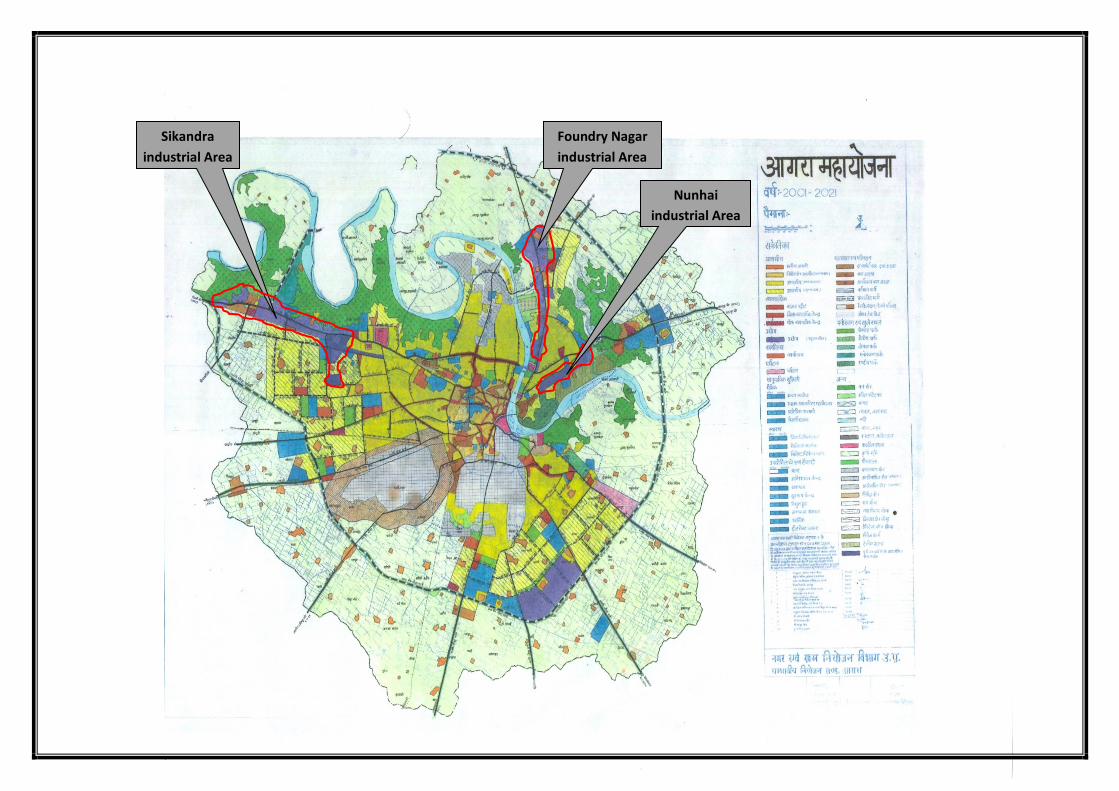
1.1 AREA DETAILS
As per the CEPI assessment, following areas have been identified as critically/ severely
polluted areas:-
(1) Nunhai Industrial Estate
(2) Foundry Nagar Industrial Area
(3) UPSIDC, Sikandra Industrial Area
Sikandra
industrial Area
Foundry Nagar
industrial Area
Nunhai
industrial Area
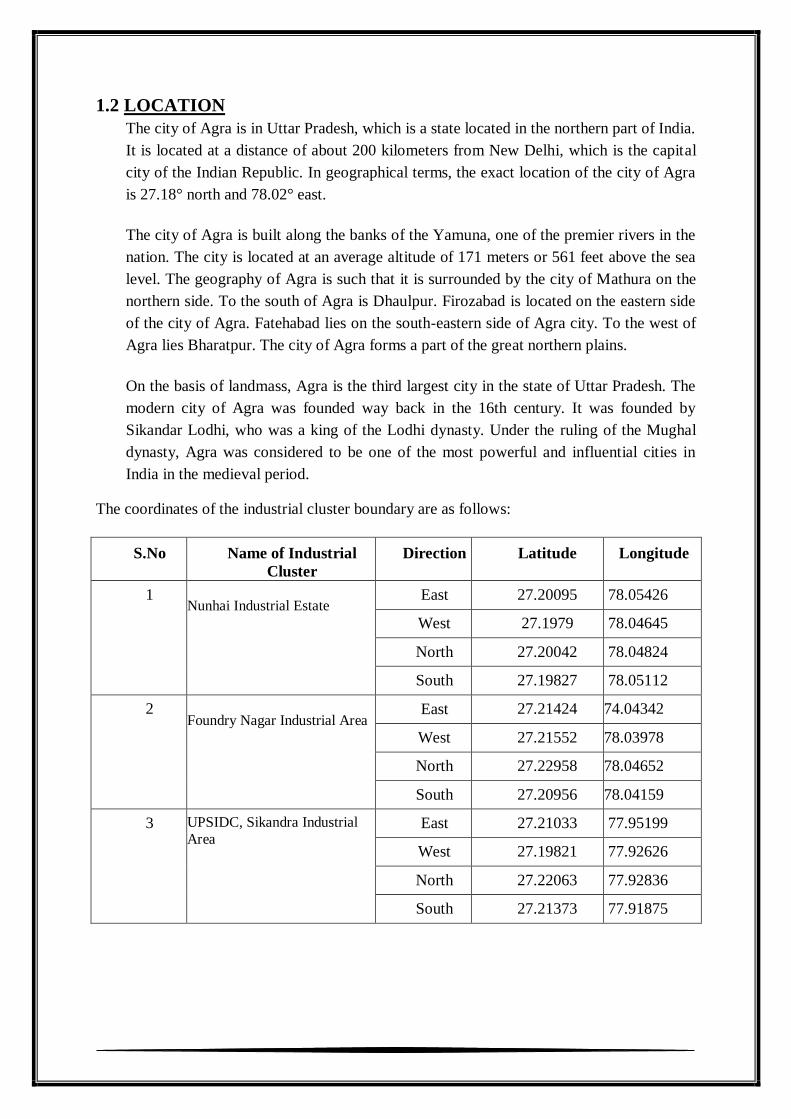
1.2 LOCATION
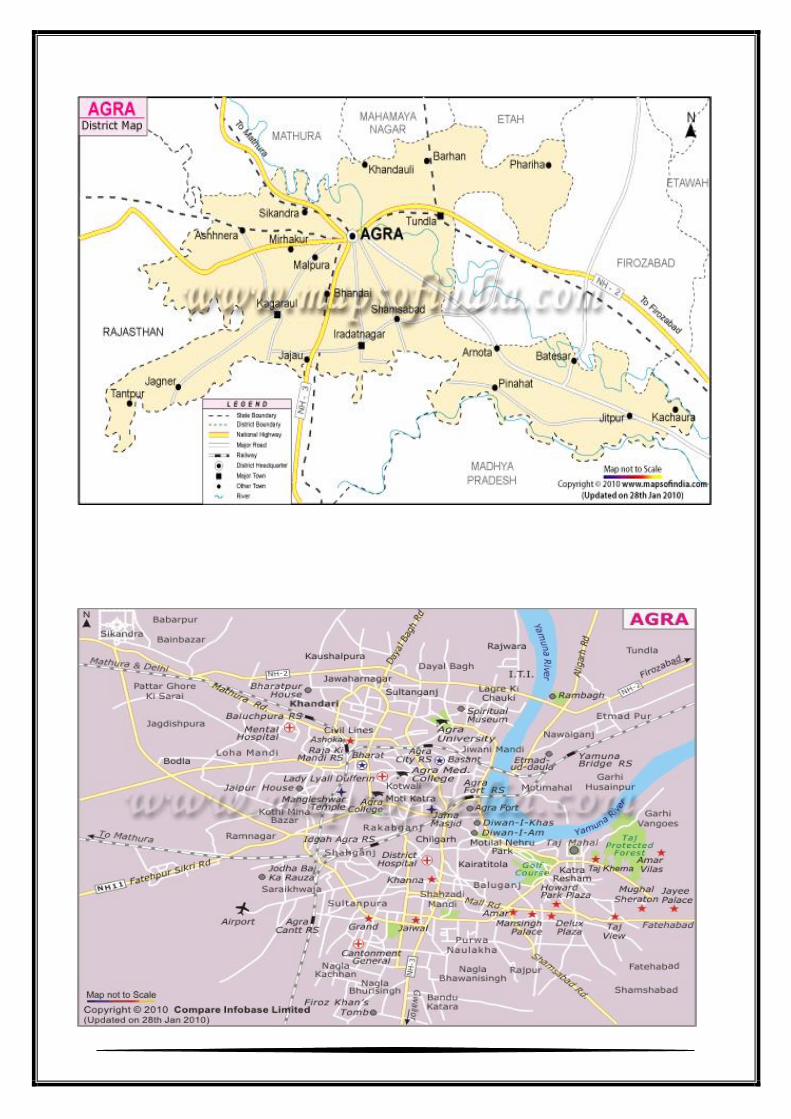
The city of Agra is in Uttar Pradesh, which is a state located in the northern part of India.
It is located at a distance of about 200 kilometers from New Delhi, which is the capital
city of the Indian Republic. In geographical terms, the exact location of the city of Agra
is 27.18° north and 78.02° east.
The city of Agra is built along the banks of the Yamuna, one of the premier rivers in the
nation. The city is located at an average altitude of 171 meters or 561 feet above the sea
level. The geography of Agra is such that it is surrounded by the city of Mathura on the
northern side. To the south of Agra is Dhaulpur. Firozabad is located on the eastern side
of the city of Agra. Fatehabad lies on the south-eastern side of Agra city. To the west of
Agra lies Bharatpur. The city of Agra forms a part of the great northern plains.
On the basis of landmass, Agra is the third largest city in the state of Uttar Pradesh. The
modern city of Agra was founded way back in the 16th century. It was founded by
Sikandar Lodhi, who was a king of the Lodhi dynasty. Under the ruling of the Mughal
dynasty, Agra was considered to be one of the most powerful and influential cities in
India in the medieval period.
The coordinates of the industrial cluster boundary are as follows:
S.No Name of Industrial
Cluster
Direction Latitude Longitude
1 Nunhai Industrial Estate
East 27.20095 78.05426
West 27.1979 78.04645
North 27.20042 78.04824
South 27.19827 78.05112
2 Foundry Nagar Industrial Area
East 27.21424 74.04342
West 27.21552 78.03978
North 27.22958 78.04652
South 27.20956 78.04159
3 UPSIDC, Sikandra Industrial
Area East 27.21033 77.95199
West 27.19821 77.92626
North 27.22063 77.92836
South 27.21373 77.91875
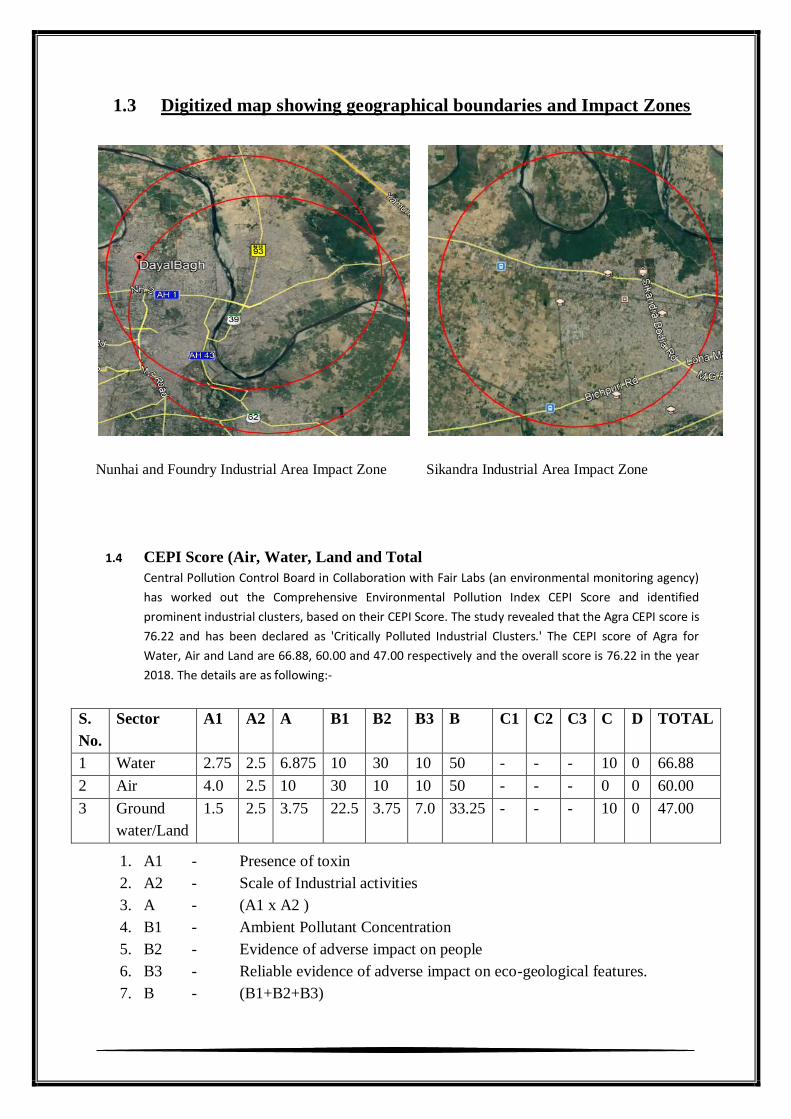
1.3 Digitized map showing geographical boundaries and Impact Zones
Nunhai and Foundry Industrial Area Impact Zone Sikandra Industrial Area Impact Zone
1.4 CEPI Score (Air, Water, Land and Total
Central Pollution Control Board in Collaboration with Fair Labs (an environmental monitoring agency)
has worked out the Comprehensive Environmental Pollution Index CEPI Score and identified
prominent industrial clusters, based on their CEPI Score. The study revealed that the Agra CEPI score is
76.22 and has been declared as 'Critically Polluted Industrial Clusters.' The CEPI score of Agra for
Water, Air and Land are 66.88, 60.00 and 47.00 respectively and the overall score is 76.22 in the year
2018. The details are as following:-
S.
No.
Sector A1 A2 A B1 B2 B3 B C1 C2 C3 C D TOTAL
1 Water 2.75 2.5 6.875 10 30 10 50 - - - 10 0 66.88
2 Air 4.0 2.5 10 30 10 10 50 - - - 0 0 60.00
3 Ground
water/Land
1.5 2.5 3.75 22.5 3.75 7.0 33.25 - - - 10 0 47.00
1. A1 - Presence of toxin
2. A2 - Scale of Industrial activities
3. A - (A1 x A2 )
4. B1 - Ambient Pollutant Concentration
5. B2 - Evidence of adverse impact on people
6. B3 - Reliable evidence of adverse impact on eco-geological features.
7. B - (B1+B2+B3)
8. C1 - Number of people potentially affected within 2 km. radius from the
industrial pollution source.
9. C2 - Level of exposure
10. C3 - Additional risk to sensitive receptors
11. C - (C1 x C2 + C3)
12. D - Additional high-risk element
13. CEPI = (A+B+C+D)
1.5 Baseline Status Of Sensitive Receptors:
Total population and sensitive receptors (hospitals, educational institutions, courts etc)
residing in the area comprising geographical area of the cluster and its impact zone.
S.
No
Population Number of
Hospitals
Number of
Educational
Institutions
Number of
Courts
Other socially
sensitive
features
Within
Cluster
Impact
Zone
Within
Cluster
Impact
Zone
Within
Cluster
Impact
Zone
Within
Cluster
Impact
Zone
Within
Cluster
Impact
Zone
1 - - - 16 - 22 NIL NIL - -
1.6 Eco-Geological Features:
Impact Zones [the area comprising of geographical area of the cluster and its impact zone
(minimum 5 km)
1.6.1 Major water bodies(Rivers, Lakes, Ponds, etc.)
S. No.
Rivers Lakes Ponds
Within
Cluster
Impact
Zone
Within
Cluster
Impact
Zone
Within
Cluster
Impact
Zone
1 - 02 - 01 - 01
Rivers- (1) Yamuna River (2) River Karwan
Lake – Keetham Lake
Ponds- Pond of Taj Forest Block (Taj Nature Walk)
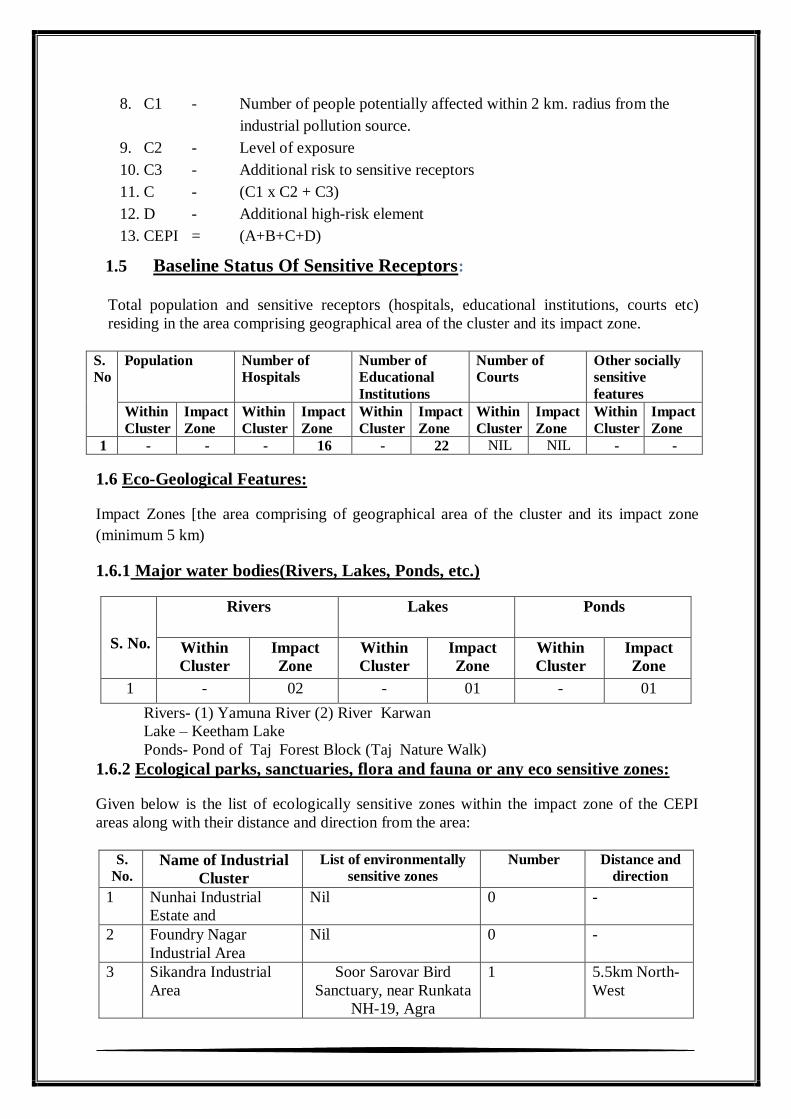
1.6.2 Ecological parks, sanctuaries, flora and fauna or any eco sensitive zones:
Given below is the list of ecologically sensitive zones within the impact zone of the CEPI
areas along with their distance and direction from the area:
S.
No. Name of Industrial
Cluster
List of environmentally
sensitive zones
Number Distance and
direction
1 Nunhai Industrial
Estate and
Nil 0 -
2 Foundry Nagar
Industrial Area
Nil 0 -
3 Sikandra Industrial
Area
Soor Sarovar Bird
Sanctuary, near Runkata
NH-19, Agra
1 5.5km North-
West
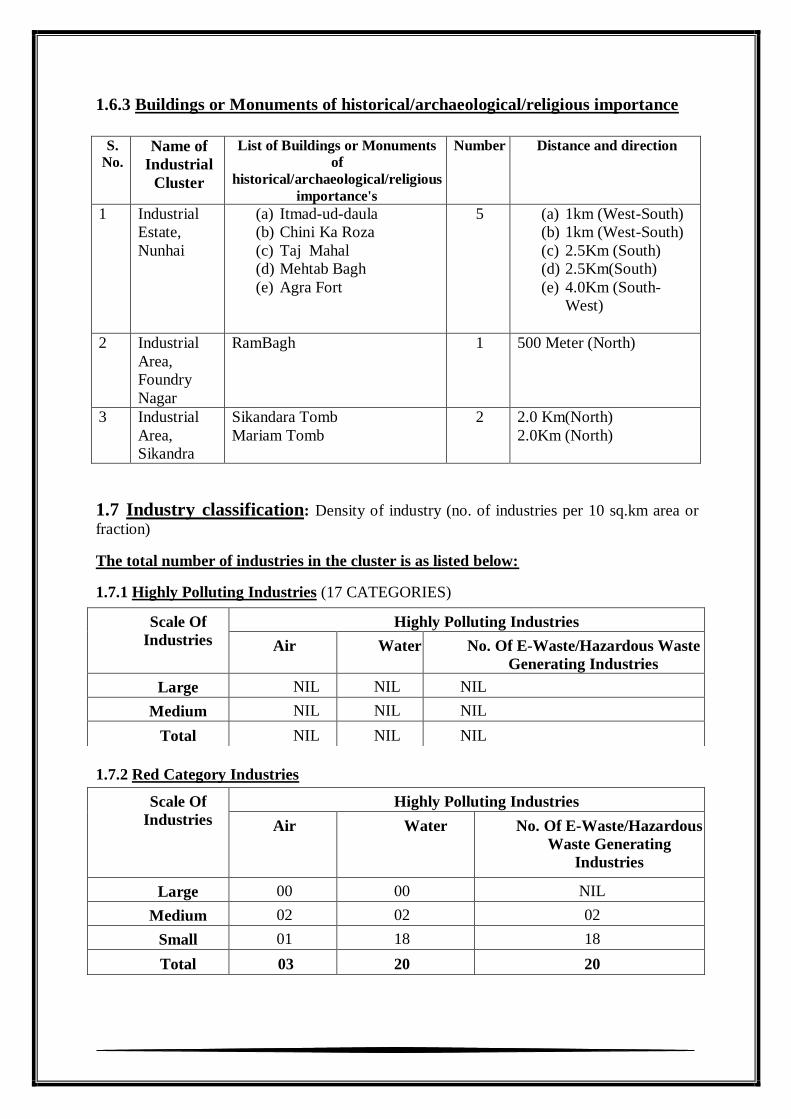
1.6.3 Buildings or Monuments of historical/archaeological/religious importance
S.
No. Name of
Industrial
Cluster
List of Buildings or Monuments
of
historical/archaeological/religious
importance's
Number Distance and direction
1 Industrial
Estate,
Nunhai
(a) Itmad-ud-daula
(b) Chini Ka Roza
(c) Taj Mahal
(d) Mehtab Bagh
(e) Agra Fort
5 (a) 1km (West-South)
(b) 1km (West-South)
(c) 2.5Km (South)
(d) 2.5Km(South)
(e) 4.0Km (South-
West)
2 Industrial
Area,
Foundry
Nagar
RamBagh 1 500 Meter (North)
3 Industrial
Area,
Sikandra
Sikandara Tomb
Mariam Tomb
2 2.0 Km(North)
2.0Km (North)
1.7 Industry classification: Density of industry (no. of industries per 10 sq.km area or
fraction)
The total number of industries in the cluster is as listed below:
1.7.1 Highly Polluting Industries (17 CATEGORIES)
1.7.2 Red Category Industries
Scale Of
Industries
Highly Polluting Industries
Air Water No. Of E-Waste/Hazardous Waste
Generating Industries
Large NIL NIL NIL
Medium NIL NIL NIL
Total NIL NIL NIL
Scale Of
Industries
Highly Polluting Industries
Air Water No. Of E-Waste/Hazardous
Waste Generating
Industries
Large 00 00 NIL
Medium 02 02 02
Small 01 18 18
Total 03 20 20
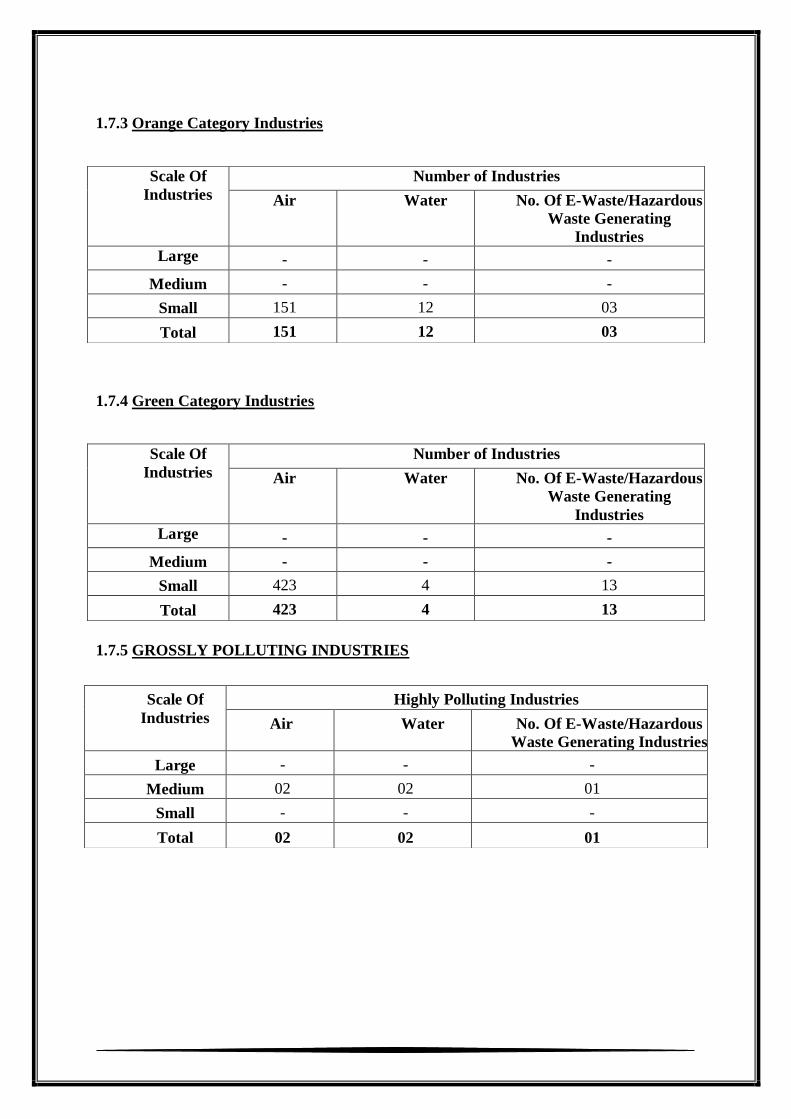
1.7.3 Orange Category Industries
1.7.4 Green Category Industries
1.7.5 GROSSLY POLLUTING INDUSTRIES
Scale Of
Industries
Number of Industries
Air Water No. Of E-Waste/Hazardous
Waste Generating
Industries
Large - - -
Medium - - -
Small 151 12 03
Total 151 12 03
Scale Of
Industries
Number of Industries
Air Water No. Of E-Waste/Hazardous
Waste Generating
Industries
Large - - -
Medium - - -
Small 423 4 13
Total 423 4 13
Scale Of
Industries
Highly Polluting Industries
Air Water No. Of E-Waste/Hazardous
Waste Generating Industries
Large - - -
Medium 02 02 01
Small - - -
Total 02 02 01
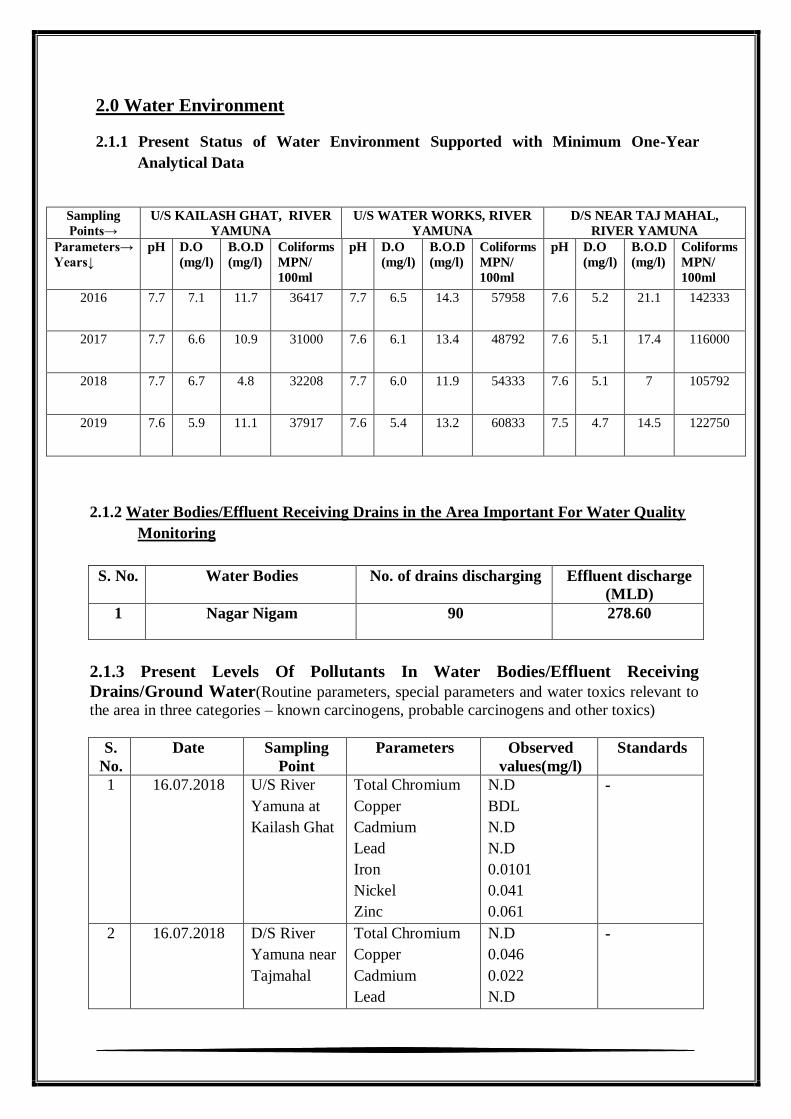
2.0 Water Environment
2.1.1 Present Status of Water Environment Supported with Minimum One-Year
Analytical Data
Sampling
Points→
U/S KAILASH GHAT, RIVER
YAMUNA
U/S WATER WORKS, RIVER
YAMUNA
D/S NEAR TAJ MAHAL,
RIVER YAMUNA
Parameters→
Years↓
pH D.O
(mg/l)
B.O.D
(mg/l)
Coliforms
MPN/
100ml
pH D.O
(mg/l)
B.O.D
(mg/l)
Coliforms
MPN/
100ml
pH D.O
(mg/l)
B.O.D
(mg/l)
Coliforms
MPN/
100ml
2016 7.7 7.1 11.7 36417 7.7 6.5 14.3 57958 7.6 5.2 21.1 142333
2017 7.7 6.6 10.9 31000 7.6 6.1 13.4 48792 7.6 5.1 17.4 116000
2018 7.7 6.7 4.8 32208 7.7 6.0 11.9 54333 7.6 5.1 7 105792
2019 7.6 5.9 11.1 37917 7.6 5.4 13.2 60833 7.5 4.7 14.5 122750
2.1.2 Water Bodies/Effluent Receiving Drains in the Area Important For Water Quality
Monitoring
S. No. Water Bodies No. of drains discharging Effluent discharge
(MLD)
1 Nagar Nigam 90 278.60
2.1.3 Present Levels Of Pollutants In Water Bodies/Effluent Receiving
Drains/Ground Water(Routine parameters, special parameters and water toxics relevant to
the area in three categories – known carcinogens, probable carcinogens and other toxics)
S.
No.
Date Sampling
Point
Parameters Observed
values(mg/l)
Standards
1 16.07.2018 U/S River
Yamuna at
Kailash Ghat
Total Chromium
Copper
Cadmium
Lead
Iron
Nickel
Zinc
N.D
BDL
N.D
N.D
0.0101
0.041
0.061
-
2 16.07.2018 D/S River
Yamuna near
Tajmahal
Total Chromium
Copper
Cadmium
Lead
N.D
0.046
0.022
N.D
-
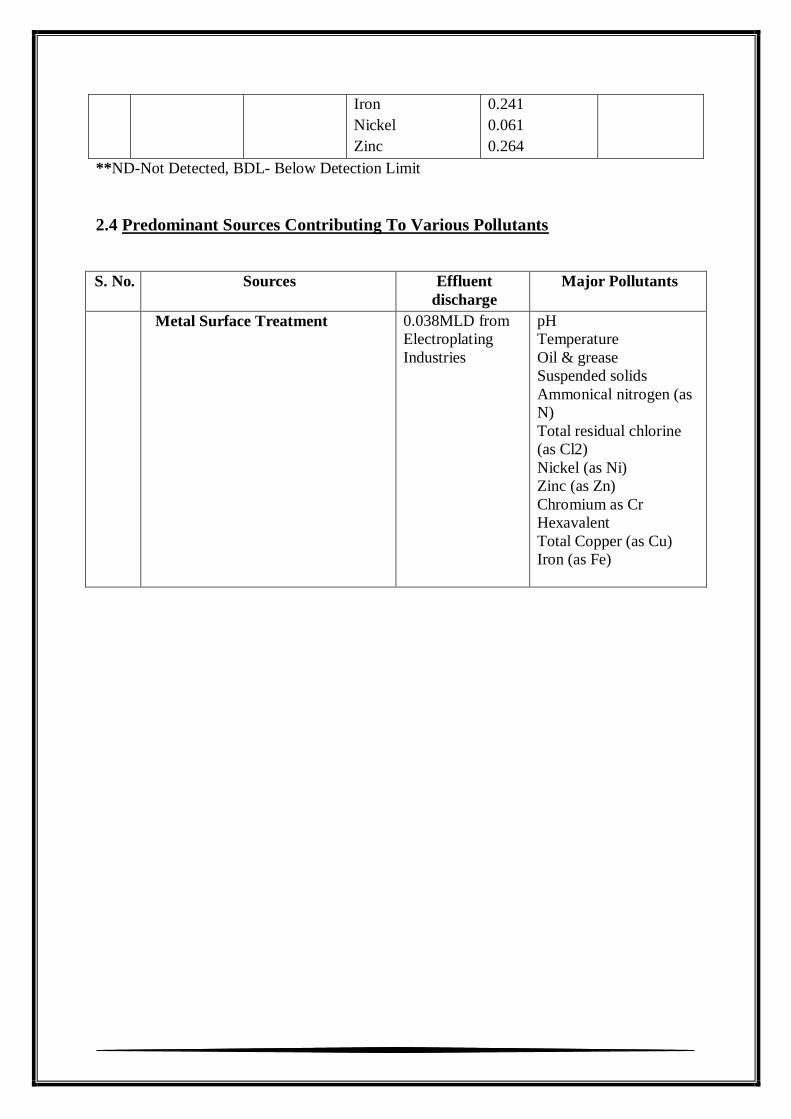
Iron
Nickel
Zinc
0.241
0.061
0.264
**ND-Not Detected, BDL- Below Detection Limit
2.4 Predominant Sources Contributing To Various Pollutants
S. No. Sources Effluent
discharge
Major Pollutants
Metal Surface Treatment
0.038MLD from
Electroplating
Industries
pH
Temperature
Oil & grease
Suspended solids
Ammonical nitrogen (as
N)
Total residual chlorine
(as Cl2)
Nickel (as Ni)
Zinc (as Zn)
Chromium as Cr
Hexavalent
Total Copper (as Cu)
Iron (as Fe)
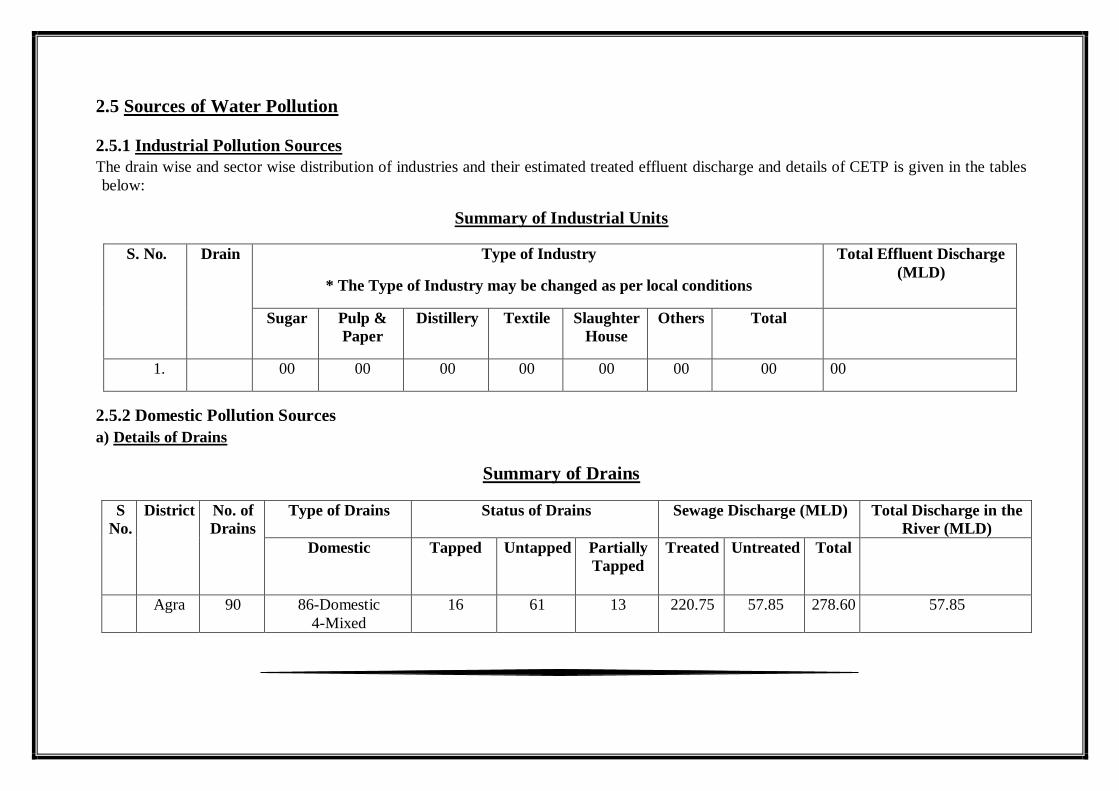
2.5 Sources of Water Pollution
2.5.1 Industrial Pollution Sources
The drain wise and sector wise distribution of industries and their estimated treated effluent discharge and details of CETP is given in the tables
below:
Summary of Industrial Units
S. No. Drain Type of Industry
* The Type of Industry may be changed as per local conditions
Total Effluent Discharge
(MLD)
Sugar Pulp &
Paper
Distillery Textile Slaughter
House
Others Total
1. 00 00 00 00 00 00 00 00
2.5.2 Domestic Pollution Sources
a) Details of Drains
Summary of Drains
S
No.
District No. of
Drains
Type of Drains Status of Drains Sewage Discharge (MLD) Total Discharge in the
River (MLD)
Domestic Tapped Untapped Partially
Tapped
Treated Untreated Total
1. Agra 90 86-Domestic
4-Mixed
16 61 13 220.75 57.85 278.60 57.85
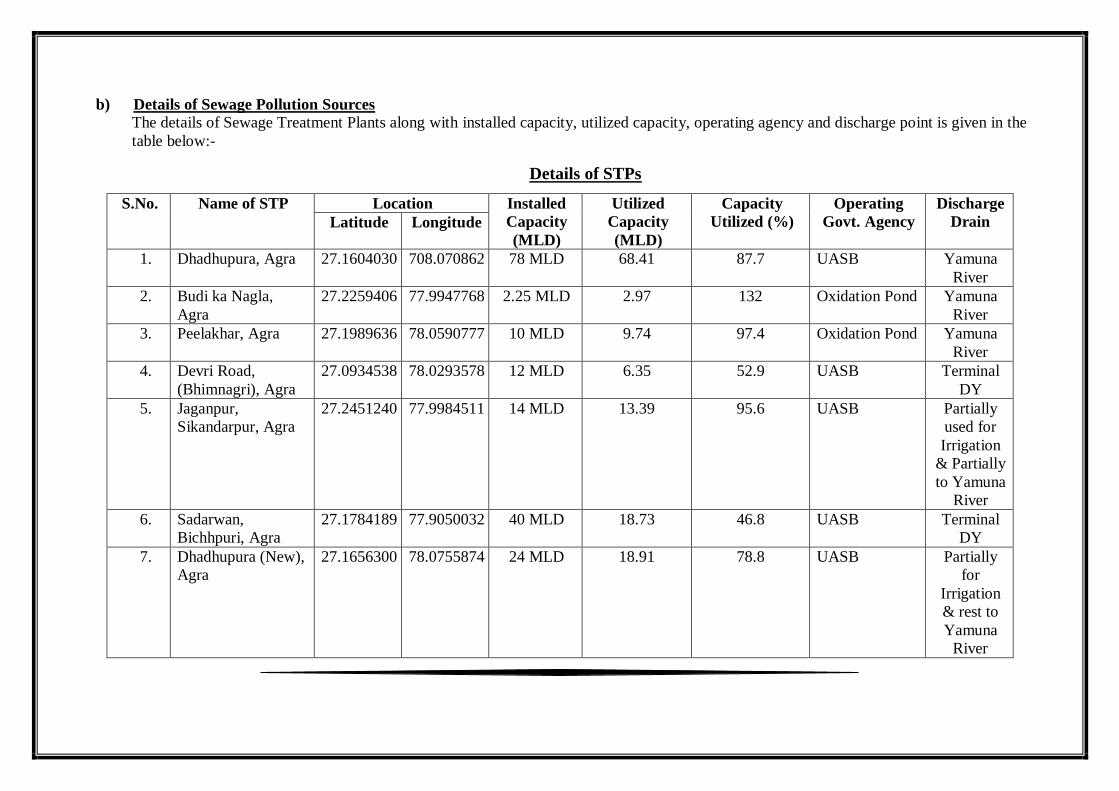
b) Details of Sewage Pollution Sources
The details of Sewage Treatment Plants along with installed capacity, utilized capacity, operating agency and discharge point is given in the
table below:-
Details of STPs
S.No. Name of STP Location Installed
Capacity
(MLD)
Utilized
Capacity
(MLD)
Capacity
Utilized (%)
Operating
Govt. Agency
Discharge
Drain Latitude Longitude
1. Dhadhupura, Agra 27.1604030 708.070862 78 MLD 68.41 87.7 UASB Yamuna
River
2. Budi ka Nagla,
Agra
27.2259406 77.9947768 2.25 MLD 2.97 132 Oxidation Pond Yamuna
River
3. Peelakhar, Agra 27.1989636 78.0590777 10 MLD 9.74 97.4 Oxidation Pond Yamuna
River
4. Devri Road,
(Bhimnagri), Agra
27.0934538 78.0293578 12 MLD 6.35 52.9 UASB Terminal
DY
5. Jaganpur,
Sikandarpur, Agra
27.2451240 77.9984511 14 MLD 13.39 95.6 UASB Partially
used for
Irrigation
& Partially
to Yamuna
River
6. Sadarwan,
Bichhpuri, Agra
27.1784189 77.9050032 40 MLD 18.73 46.8 UASB Terminal
DY
7. Dhadhupura (New),
Agra
27.1656300 78.0755874 24 MLD 18.91 78.8 UASB Partially
for
Irrigation
& rest to
Yamuna
River
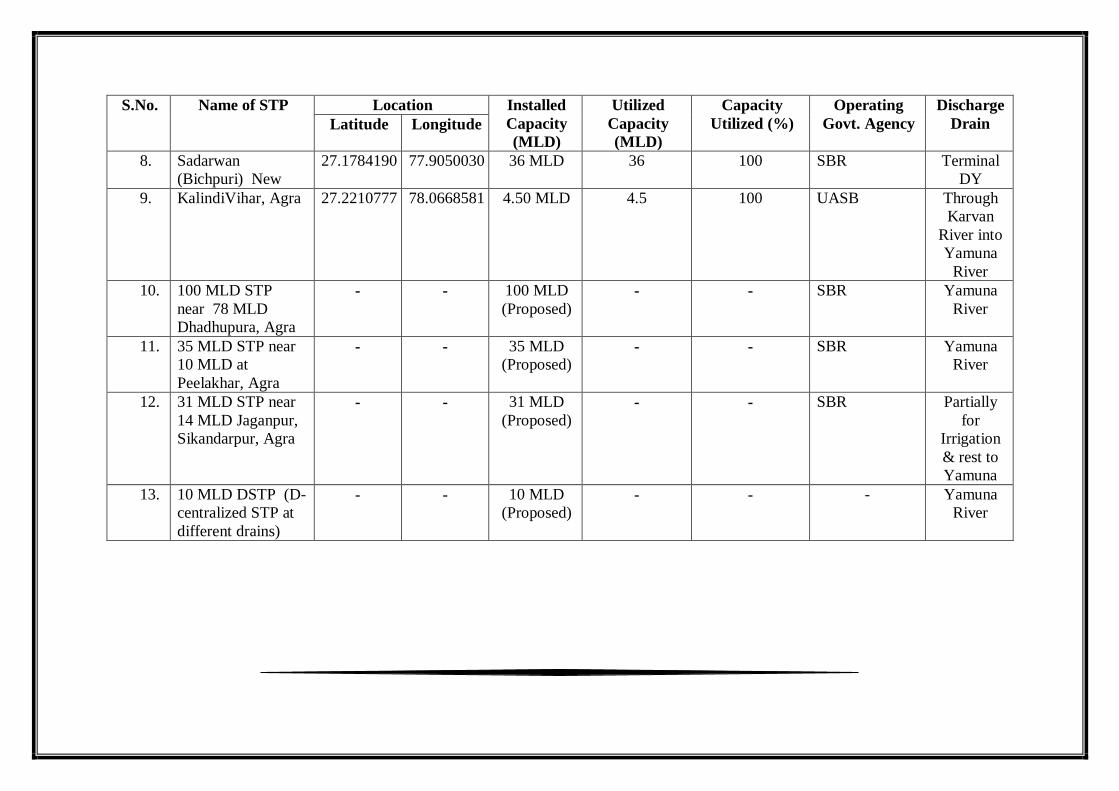
S.No. Name of STP Location Installed
Capacity
(MLD)
Utilized
Capacity
(MLD)
Capacity
Utilized (%)
Operating
Govt. Agency
Discharge
Drain Latitude Longitude
8. Sadarwan
(Bichpuri) New
27.1784190 77.9050030 36 MLD 36 100 SBR Terminal
DY
9. KalindiVihar, Agra 27.2210777 78.0668581 4.50 MLD 4.5 100 UASB Through
Karvan
River into
Yamuna
River
10. 100 MLD STP
near 78 MLD
Dhadhupura, Agra
- - 100 MLD
(Proposed)
- - SBR Yamuna
River
11. 35 MLD STP near
10 MLD at
Peelakhar, Agra
- - 35 MLD
(Proposed) - - SBR Yamuna
River
12. 31 MLD STP near
14 MLD Jaganpur,
Sikandarpur, Agra
- - 31 MLD
(Proposed)
- - SBR Partially
for
Irrigation
& rest to
Yamuna
13. 10 MLD DSTP (D-
centralized STP at
different drains)
- - 10 MLD
(Proposed) - - - Yamuna
River
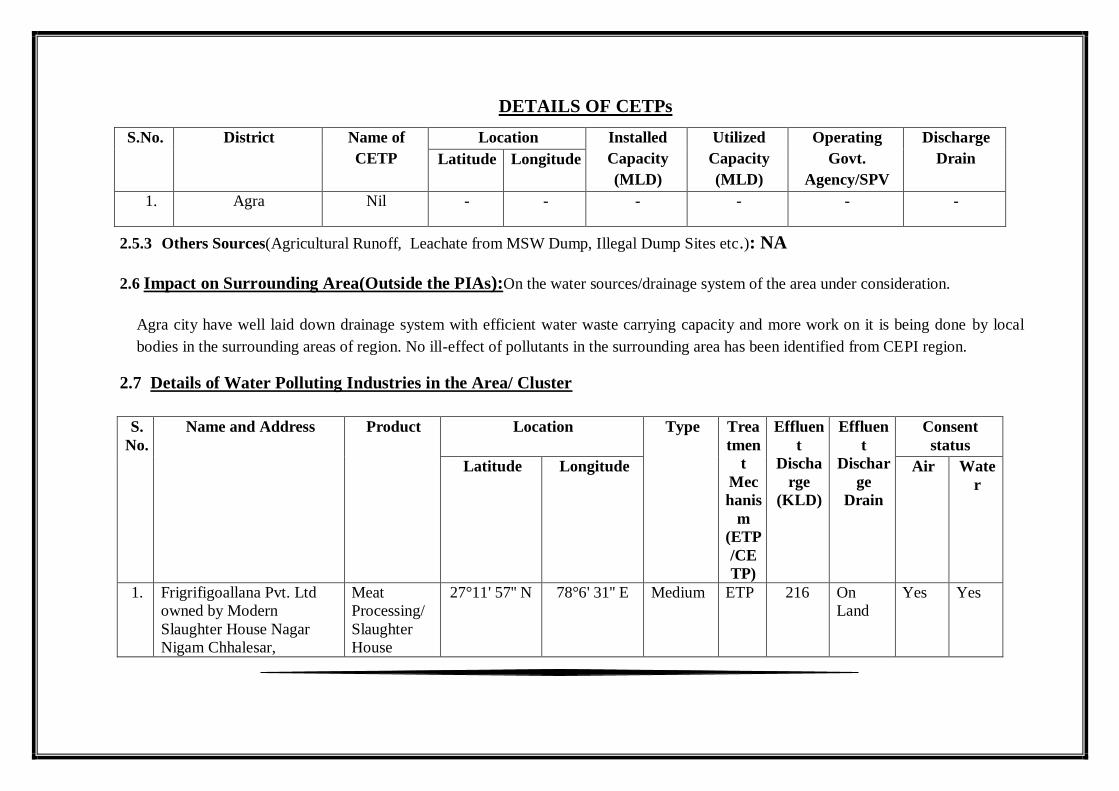
DETAILS OF CETPs
S.No. District Name of
CETP
Location Installed
Capacity
(MLD)
Utilized
Capacity
(MLD)
Operating
Govt.
Agency/SPV
Discharge
Drain Latitude Longitude
1. Agra Nil - - - - - -
2.5.3 Others Sources(Agricultural Runoff, Leachate from MSW Dump, Illegal Dump Sites etc.): NA
2.6 Impact on Surrounding Area(Outside the PIAs):On the water sources/drainage system of the area under consideration.
Agra city have well laid down drainage system with efficient water waste carrying capacity and more work on it is being done by local
bodies in the surrounding areas of region. No ill-effect of pollutants in the surrounding area has been identified from CEPI region.
2.7 Details of Water Polluting Industries in the Area/ Cluster
S.
No.
Name and Address Product Location Type Trea
tmen
t
Mec
hanis
m
(ETP
/CE
TP)
Effluen
t
Discha
rge
(KLD)
Effluen
t
Dischar
ge
Drain
Consent
status
Latitude Longitude Air Wate
r
1. Frigrifigoallana Pvt. Ltd
owned by Modern
Slaughter House Nagar
Nigam Chhalesar,
Meat
Processing/
Slaughter
House
27°11' 57'' N 78°6' 31'' E Medium ETP 216 On
Land
Yes Yes
Kuberpur, Agra
2. HMA Food Exports Pvt.
Ltd. (Slaughter House)
Plot No. 293-295 and 297,
Kuberpur, Etmadpur, Agra
Slaughter
House
27°11' 57'' N 78°6' 31'' E Medium ETP 500 On
Land
Yes Yes
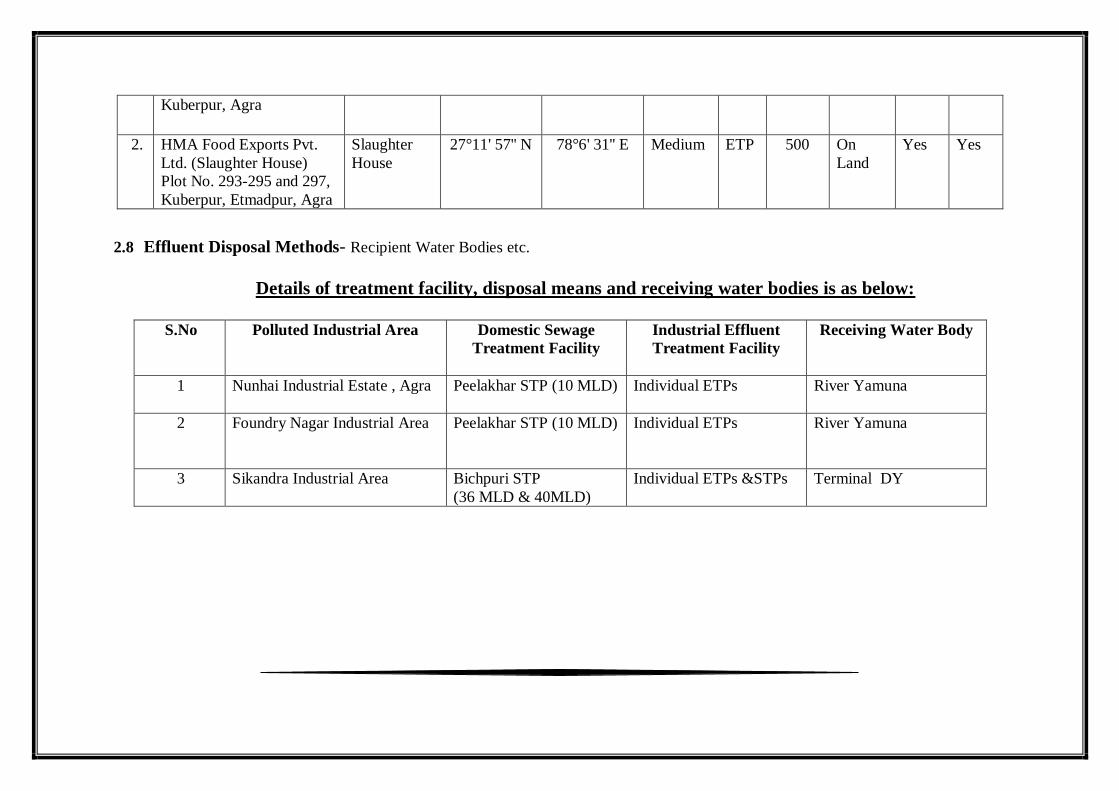
2.8 Effluent Disposal Methods- Recipient Water Bodies etc.
Details of treatment facility, disposal means and receiving water bodies is as below:
S.No Polluted Industrial Area
Domestic Sewage
Treatment Facility
Industrial Effluent
Treatment Facility
Receiving Water Body
1 Nunhai Industrial Estate , Agra Peelakhar STP (10 MLD) Individual ETPs
River Yamuna
2 Foundry Nagar Industrial Area Peelakhar STP (10 MLD) Individual ETPs
River Yamuna
3 Sikandra Industrial Area Bichpuri STP
(36 MLD & 40MLD)
Individual ETPs &STPs
Terminal DY
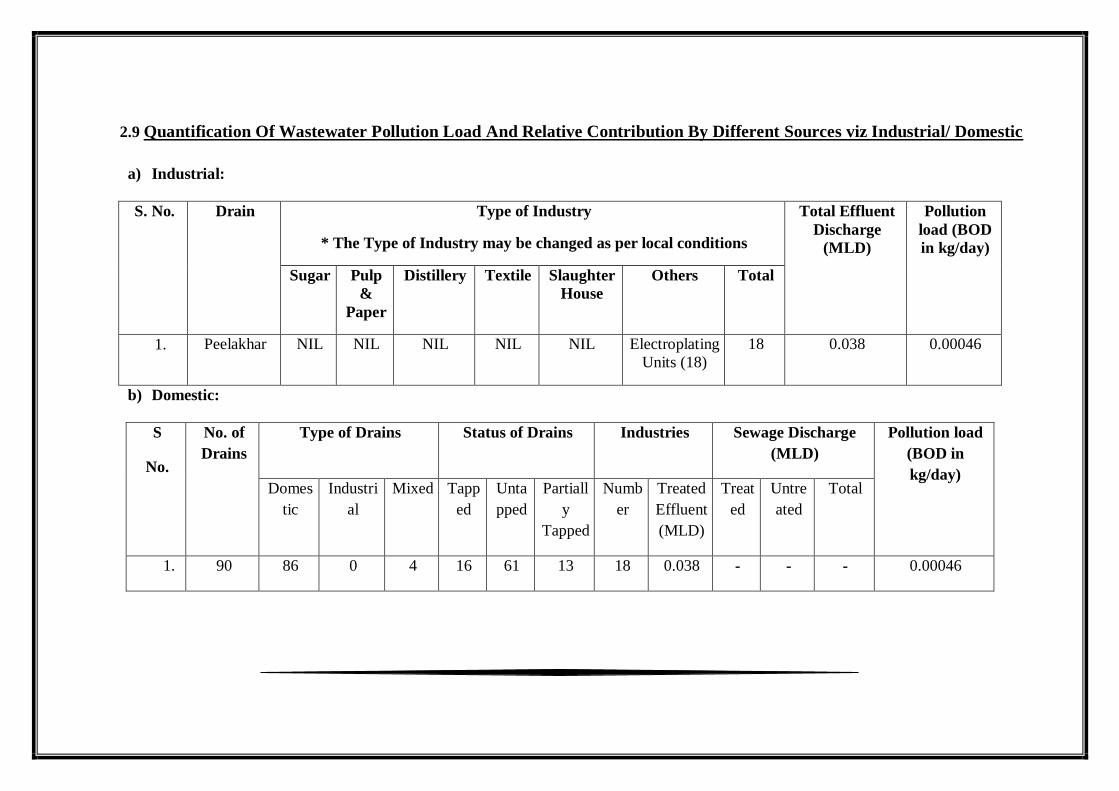
2.9 Quantification Of Wastewater Pollution Load And Relative Contribution By Different Sources viz Industrial/ Domestic
a) Industrial:
S. No. Drain Type of Industry
* The Type of Industry may be changed as per local conditions
Total Effluent
Discharge
(MLD)
Pollution
load (BOD
in kg/day)
Sugar Pulp
&
Paper
Distillery Textile Slaughter
House
Others Total
1. Peelakhar NIL NIL NIL NIL NIL Electroplating
Units (18)
18 0.038 0.00046
b) Domestic:
S
No.
No. of
Drains
Type of Drains Status of Drains Industries Sewage Discharge
(MLD)
Pollution load
(BOD in
kg/day) Domes
tic
Industri
al
Mixed Tapp
ed
Unta
pped
Partiall
y
Tapped
Numb
er
Treated
Effluent
(MLD)
Treat
ed
Untre
ated
Total
1. 90 86 0 4 16 61 13 18 0.038 - - - 0.00046
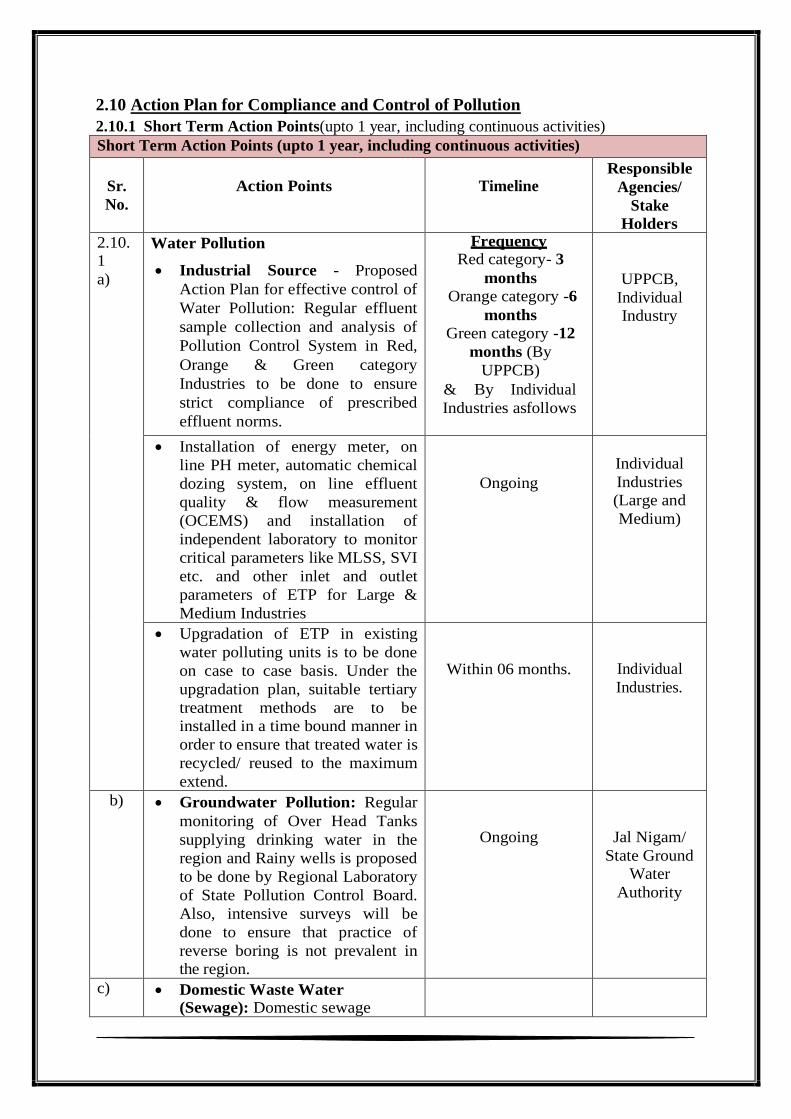
2.10 Action Plan for Compliance and Control of Pollution
2.10.1 Short Term Action Points(upto 1 year, including continuous activities)
Short Term Action Points (upto 1 year, including continuous activities)
Sr.
No.
Action Points
Timeline Responsible
Agencies/
Stake
Holders
2.10.
1
a)
Water Pollution
Industrial Source - Proposed
Action Plan for effective control of
Water Pollution: Regular effluent
sample collection and analysis of
Pollution Control System in Red,
Orange & Green category
Industries to be done to ensure
strict compliance of prescribed
effluent norms.
Frequency
Red category- 3
months
Orange category -6
months
Green category -12
months (By
UPPCB)
& By Individual
Industries asfollows
UPPCB,
Individual
Industry
Installation of energy meter, on
line PH meter, automatic chemical
dozing system, on line effluent
quality & flow measurement
(OCEMS) and installation of
independent laboratory to monitor
critical parameters like MLSS, SVI
etc. and other inlet and outlet
parameters of ETP for Large &
Medium Industries
Ongoing
Individual
Industries
(Large and
Medium)
Upgradation of ETP in existing
water polluting units is to be done
on case to case basis. Under the
upgradation plan, suitable tertiary
treatment methods are to be
installed in a time bound manner in
order to ensure that treated water is
recycled/ reused to the maximum
extend.
Within 06 months.
Individual
Industries.
b) Groundwater Pollution: Regular
monitoring of Over Head Tanks
supplying drinking water in the
region and Rainy wells is proposed
to be done by Regional Laboratory
of State Pollution Control Board.
Also, intensive surveys will be
done to ensure that practice of
reverse boring is not prevalent in
the region.
Ongoing
Jal Nigam/
State Ground
Water
Authority
c) Domestic Waste Water
(Sewage): Domestic sewage
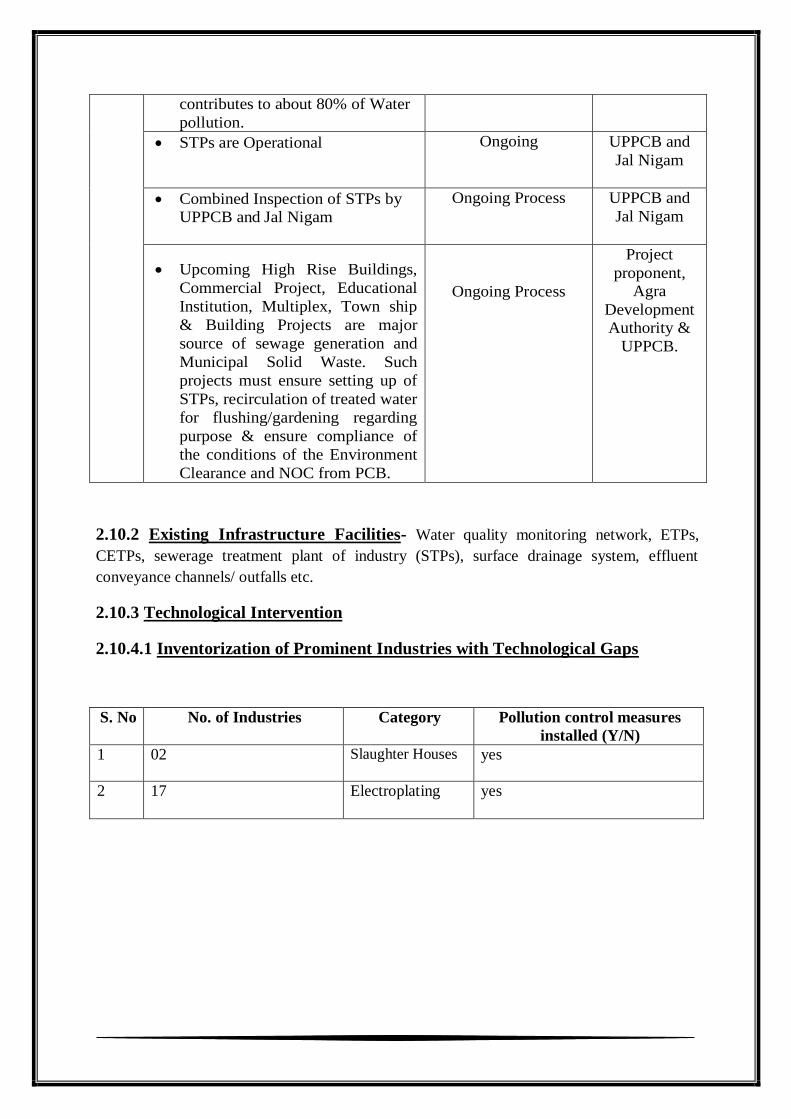
contributes to about 80% of Water
pollution.
STPs are Operational
Ongoing
UPPCB and
Jal Nigam
Combined Inspection of STPs by
UPPCB and Jal Nigam
Ongoing Process
UPPCB and
Jal Nigam
Upcoming High Rise Buildings,
Commercial Project, Educational
Institution, Multiplex, Town ship
& Building Projects are major
source of sewage generation and
Municipal Solid Waste. Such
projects must ensure setting up of
STPs, recirculation of treated water
for flushing/gardening regarding
purpose & ensure compliance of
the conditions of the Environment
Clearance and NOC from PCB.
Ongoing Process
Project
proponent,
Agra
Development
Authority &
UPPCB.
2.10.2 Existing Infrastructure Facilities- Water quality monitoring network, ETPs,
CETPs, sewerage treatment plant of industry (STPs), surface drainage system, effluent
conveyance channels/ outfalls etc.
2.10.3 Technological Intervention
2.10.4.1 Inventorization of Prominent Industries with Technological Gaps
S. No No. of Industries Category Pollution control measures
installed (Y/N)
1 02 Slaughter Houses
yes
2 17 Electroplating
yes
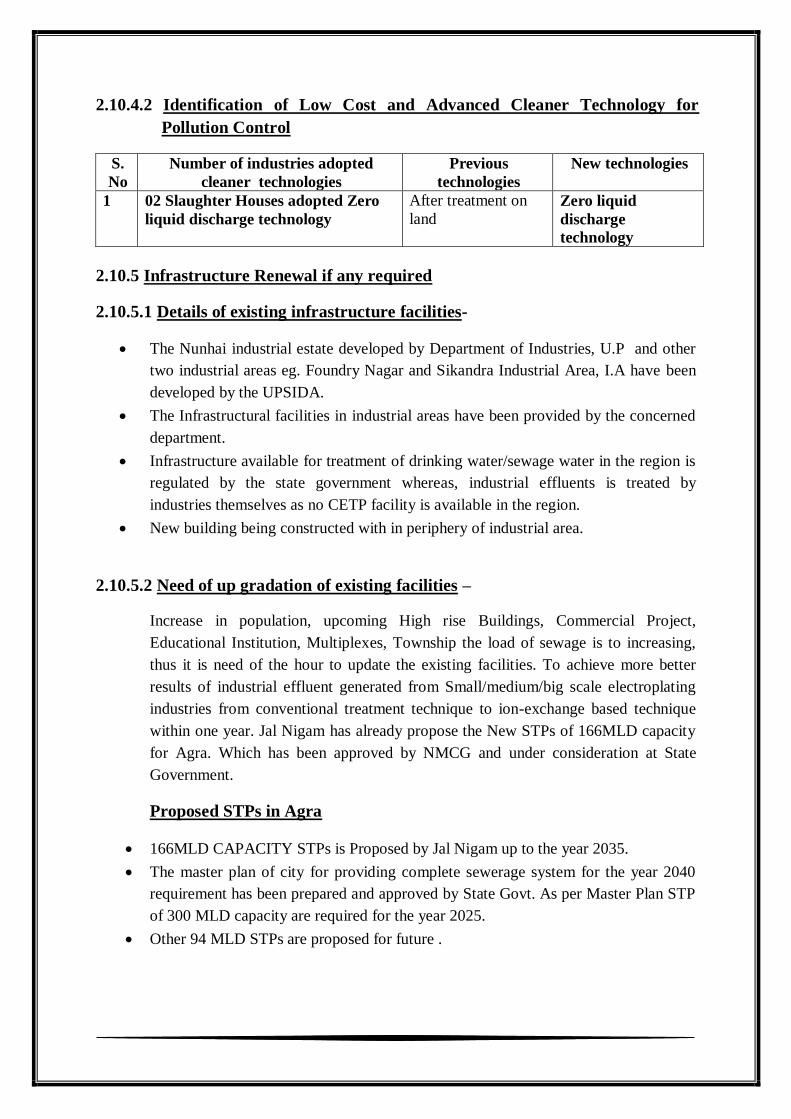
2.10.4.2 Identification of Low Cost and Advanced Cleaner Technology for
Pollution Control
S.
No
Number of industries adopted
cleaner technologies
Previous
technologies
New technologies
1 02 Slaughter Houses adopted Zero
liquid discharge technology
After treatment on
land
Zero liquid
discharge
technology
2.10.5 Infrastructure Renewal if any required
2.10.5.1 Details of existing infrastructure facilities-
The Nunhai industrial estate developed by Department of Industries, U.P and other
two industrial areas eg. Foundry Nagar and Sikandra Industrial Area, I.A have been
developed by the UPSIDA.
The Infrastructural facilities in industrial areas have been provided by the concerned
department.
Infrastructure available for treatment of drinking water/sewage water in the region is
regulated by the state government whereas, industrial effluents is treated by
industries themselves as no CETP facility is available in the region.
New building being constructed with in periphery of industrial area.
2.10.5.2 Need of up gradation of existing facilities –
Increase in population, upcoming High rise Buildings, Commercial Project,
Educational Institution, Multiplexes, Township the load of sewage is to increasing,
thus it is need of the hour to update the existing facilities. To achieve more better
results of industrial effluent generated from Small/medium/big scale electroplating
industries from conventional treatment technique to ion-exchange based technique
within one year. Jal Nigam has already propose the New STPs of 166MLD capacity
for Agra. Which has been approved by NMCG and under consideration at State
Government.
Proposed STPs in Agra
166MLD CAPACITY STPs is Proposed by Jal Nigam up to the year 2035.
The master plan of city for providing complete sewerage system for the year 2040
requirement has been prepared and approved by State Govt. As per Master Plan STP
of 300 MLD capacity are required for the year 2025.
Other 94 MLD STPs are proposed for future .
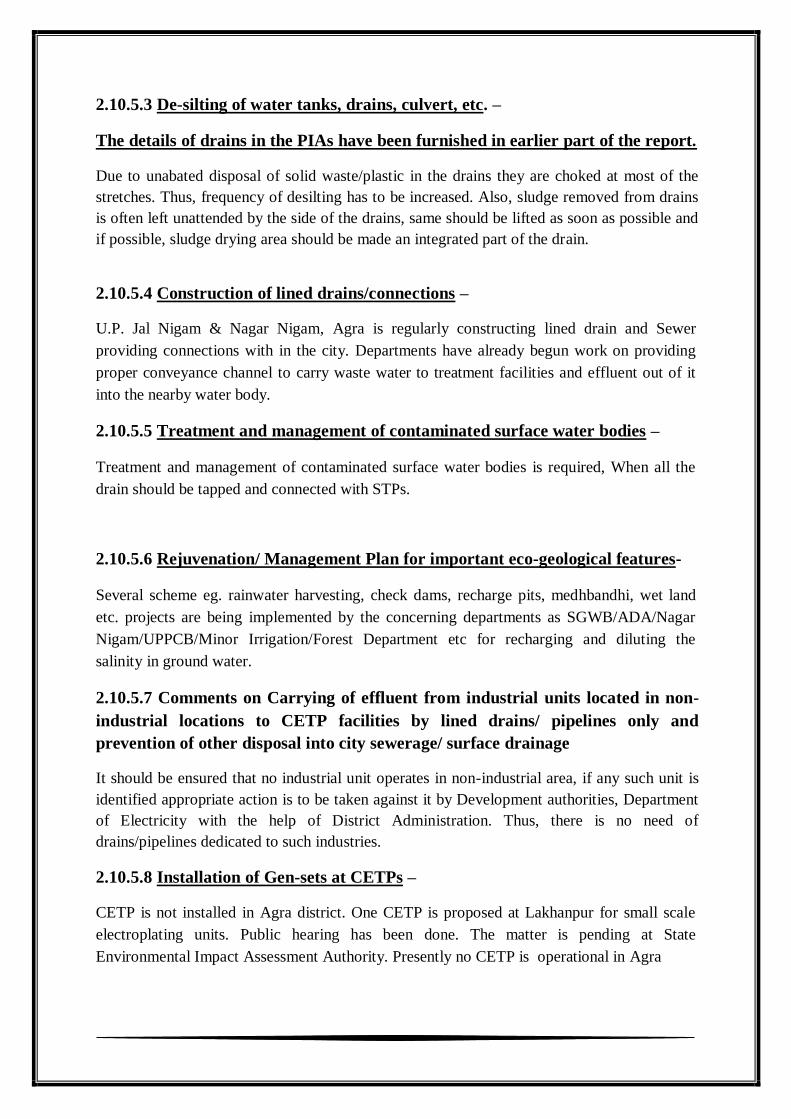
2.10.5.3 De-silting of water tanks, drains, culvert, etc. –
The details of drains in the PIAs have been furnished in earlier part of the report.
Due to unabated disposal of solid waste/plastic in the drains they are choked at most of the
stretches. Thus, frequency of desilting has to be increased. Also, sludge removed from drains
is often left unattended by the side of the drains, same should be lifted as soon as possible and
if possible, sludge drying area should be made an integrated part of the drain.
2.10.5.4 Construction of lined drains/connections –
U.P. Jal Nigam & Nagar Nigam, Agra is regularly constructing lined drain and Sewer
providing connections with in the city. Departments have already begun work on providing
proper conveyance channel to carry waste water to treatment facilities and effluent out of it
into the nearby water body.
2.10.5.5 Treatment and management of contaminated surface water bodies –
Treatment and management of contaminated surface water bodies is required, When all the
drain should be tapped and connected with STPs.
2.10.5.6 Rejuvenation/ Management Plan for important eco-geological features-
Several scheme eg. rainwater harvesting, check dams, recharge pits, medhbandhi, wet land
etc. projects are being implemented by the concerning departments as SGWB/ADA/Nagar
Nigam/UPPCB/Minor Irrigation/Forest Department etc for recharging and diluting the
salinity in ground water.
2.10.5.7 Comments on Carrying of effluent from industrial units located in non-
industrial locations to CETP facilities by lined drains/ pipelines only and
prevention of other disposal into city sewerage/ surface drainage
It should be ensured that no industrial unit operates in non-industrial area, if any such unit is
identified appropriate action is to be taken against it by Development authorities, Department
of Electricity with the help of District Administration. Thus, there is no need of
drains/pipelines dedicated to such industries.
2.10.5.8 Installation of Gen-sets at CETPs –
CETP is not installed in Agra district. One CETP is proposed at Lakhanpur for small scale
electroplating units. Public hearing has been done. The matter is pending at State
Environmental Impact Assessment Authority. Presently no CETP is operational in Agra
2.10.6 Managerial and Financial aspects
2.10.6.1 Cost and time estimates:
The approximate cost to be incurred to improve the existing infrastructure, Drinking water
and sanitation facility, MSW handling/collection infrastructure is to be assessed. Also, it
would be appropriate to engage a third party for complete inventorization of pollution sources
and preparing a Pollutant Transfer Register for each of the identified PIAs. Project for same
shall be prepared and required funding shall be worked out thereafter.
2.10.6.2 Identified private/ public sector potential investors and contribution/
obligation:
Appropriate agencies will be identified after finalization of action plan.
2.10.6.3 Government Budgetary support requirement
Finalized action plan will be submitted to the Government seeking financial support wherever
necessary.
2.10.6.4 Hierarchical and structured managerial system for efficient
implementation:
UPPCB in association with stakeholders at regional level will oversee the implementation of
finalized action plan under the Chairmanship of District Magistrates.
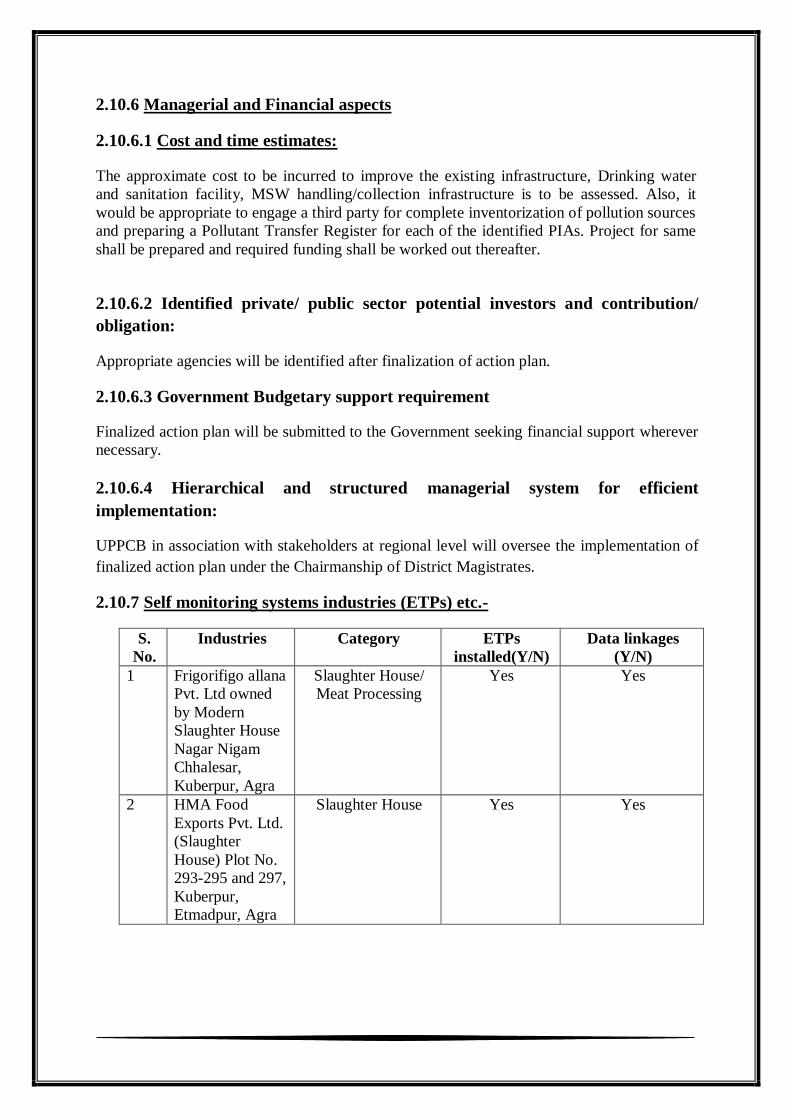
2.10.7 Self monitoring systems industries (ETPs) etc.-
S.
No.
Industries Category ETPs
installed(Y/N)
Data linkages
(Y/N)
1 Frigorifigo allana
Pvt. Ltd owned
by Modern
Slaughter House
Nagar Nigam
Chhalesar,
Kuberpur, Agra
Slaughter House/
Meat Processing
Yes Yes
2 HMA Food
Exports Pvt. Ltd.
(Slaughter
House) Plot No.
293-295 and 297,
Kuberpur,
Etmadpur, Agra
Slaughter House Yes Yes
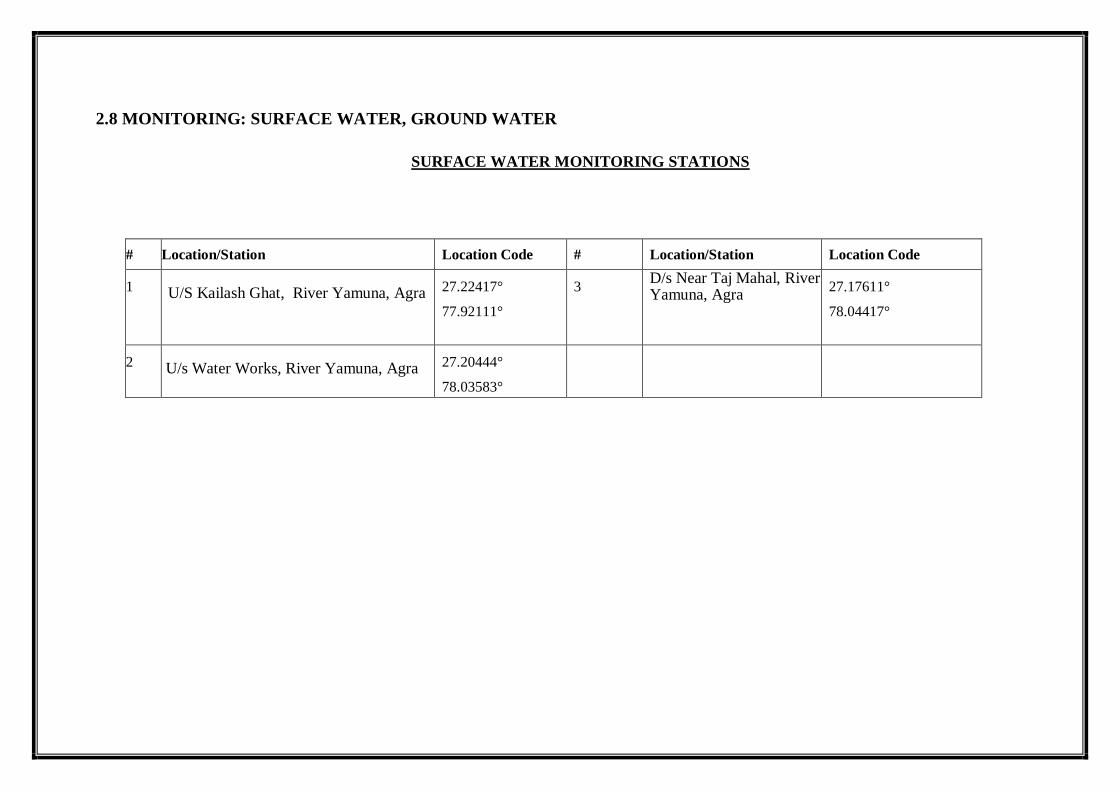
2.8 MONITORING: SURFACE WATER, GROUND WATER
SURFACE WATER MONITORING STATIONS
# Location/Station Location Code # Location/Station Location Code
1 U/S Kailash Ghat, River Yamuna, Agra
27.22417°
77.92111°
3 D/s Near Taj Mahal, River Yamuna, Agra
27.17611°
78.04417°
2 U/s Water Works, River Yamuna, Agra
27.20444°
78.03583°
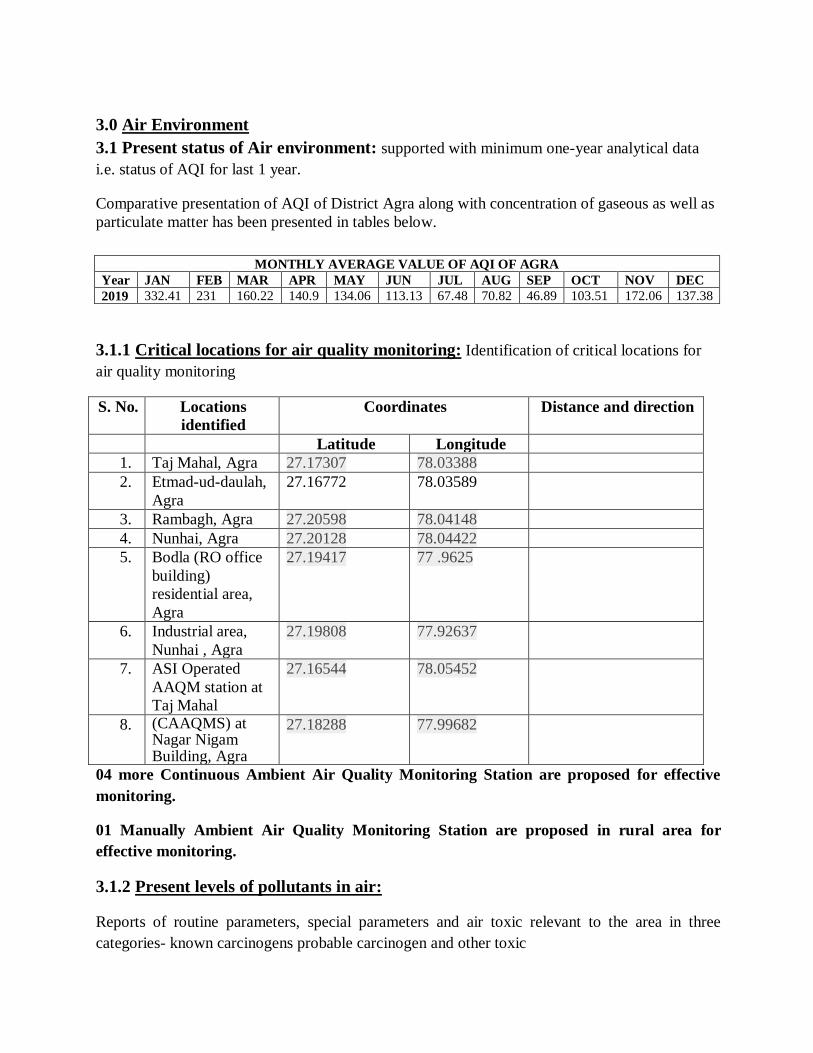
3.0 Air Environment
3.1 Present status of Air environment: supported with minimum one-year analytical data
i.e. status of AQI for last 1 year.
Comparative presentation of AQI of District Agra along with concentration of gaseous as well as
particulate matter has been presented in tables below.
MONTHLY AVERAGE VALUE OF AQI OF AGRA
Year JAN FEB MAR APR MAY JUN JUL AUG SEP OCT NOV DEC
2019 332.41 231 160.22 140.9 134.06 113.13 67.48 70.82 46.89 103.51 172.06 137.38
3.1.1 Critical locations for air quality monitoring: Identification of critical locations for
air quality monitoring
S. No. Locations
identified
Coordinates Distance and direction
Latitude Longitude
1. Taj Mahal, Agra 27.17307 78.03388
2. Etmad-ud-daulah,
Agra
27.16772 78.03589
3. Rambagh, Agra 27.20598 78.04148
4. Nunhai, Agra 27.20128 78.04422
5. Bodla (RO office
building)
residential area,
Agra
27.19417
77 .9625
6. Industrial area,
Nunhai , Agra
27.19808 77.92637
7. ASI Operated
AAQM station at
Taj Mahal
27.16544 78.05452
8. (CAAQMS) at Nagar Nigam Building, Agra
27.18288 77.99682
04 more Continuous Ambient Air Quality Monitoring Station are proposed for effective
monitoring.
01 Manually Ambient Air Quality Monitoring Station are proposed in rural area for
effective monitoring.
3.1.2 Present levels of pollutants in air:
Reports of routine parameters, special parameters and air toxic relevant to the area in three
categories- known carcinogens probable carcinogen and other toxic
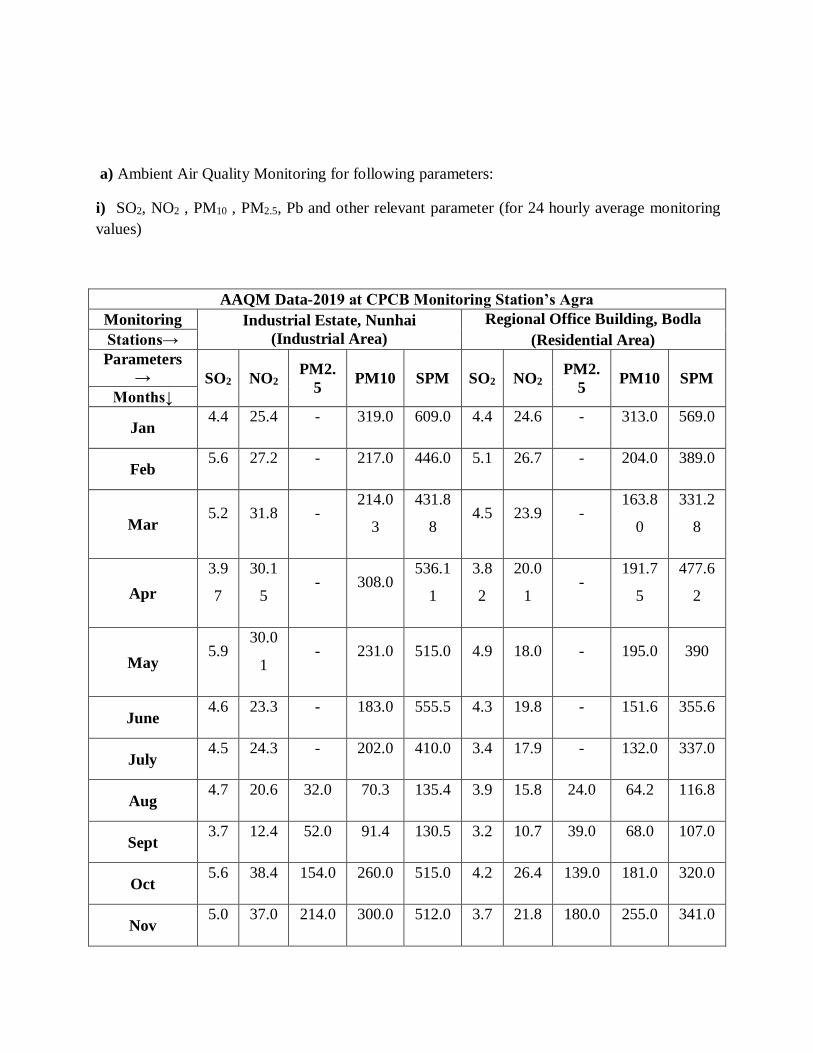
a) Ambient Air Quality Monitoring for following parameters:
i) SO2, NO2 , PM10 , PM2.5, Pb and other relevant parameter (for 24 hourly average monitoring
values)
AAQM Data-2019 at CPCB Monitoring Station’s Agra
Monitoring Industrial Estate, Nunhai
(Industrial Area)
Regional Office Building, Bodla
(Residential Area) Stations→
Parameters
→ SO2 NO2 PM2.
5 PM10 SPM SO2 NO2
PM2.
5 PM10 SPM
Months↓
Jan 4.4 25.4 - 319.0 609.0 4.4 24.6 - 313.0 569.0
Feb 5.6 27.2 - 217.0 446.0 5.1 26.7 - 204.0 389.0
Mar 5.2 31.8 -
214.0
3
431.8
8 4.5 23.9 -
163.8
0
331.2
8
Apr
3.9
7
30.1
5 - 308.0
536.1
1
3.8
2
20.0
1 -
191.7
5
477.6
2
May 5.9
30.0
1 - 231.0 515.0 4.9 18.0 - 195.0 390
June 4.6 23.3 - 183.0 555.5 4.3 19.8 - 151.6 355.6
July 4.5 24.3 - 202.0 410.0 3.4 17.9 - 132.0 337.0
Aug 4.7 20.6 32.0 70.3 135.4 3.9 15.8 24.0 64.2 116.8
Sept 3.7 12.4 52.0 91.4 130.5 3.2 10.7 39.0 68.0 107.0
Oct 5.6 38.4 154.0 260.0 515.0 4.2 26.4 139.0 181.0 320.0
Nov 5.0 37.0 214.0 300.0 512.0 3.7 21.8 180.0 255.0 341.0
Dec 9.1 34.8 226.0 278.0 408.0 5.0 24.8 205.0 236.0 338.0
Annual AVG
5.1
8
27.9
4 56.5
222.8
1
433.6
9
4.2
0
20.8
6 48.91
179.6
1
299.5
5
Note: all above monthly average values are in µg/m3
24hrly Average Standard: SO2: 80µg/m3, NO2: 80µg/m3, PM10: 100µg/m3,PM2.5: 60µg/m3
Annual average Standard: SO2: 20µg/m3, NO2: 30µg/m3, PM10: 60µg/m3, PM2.5: 40µg/m3
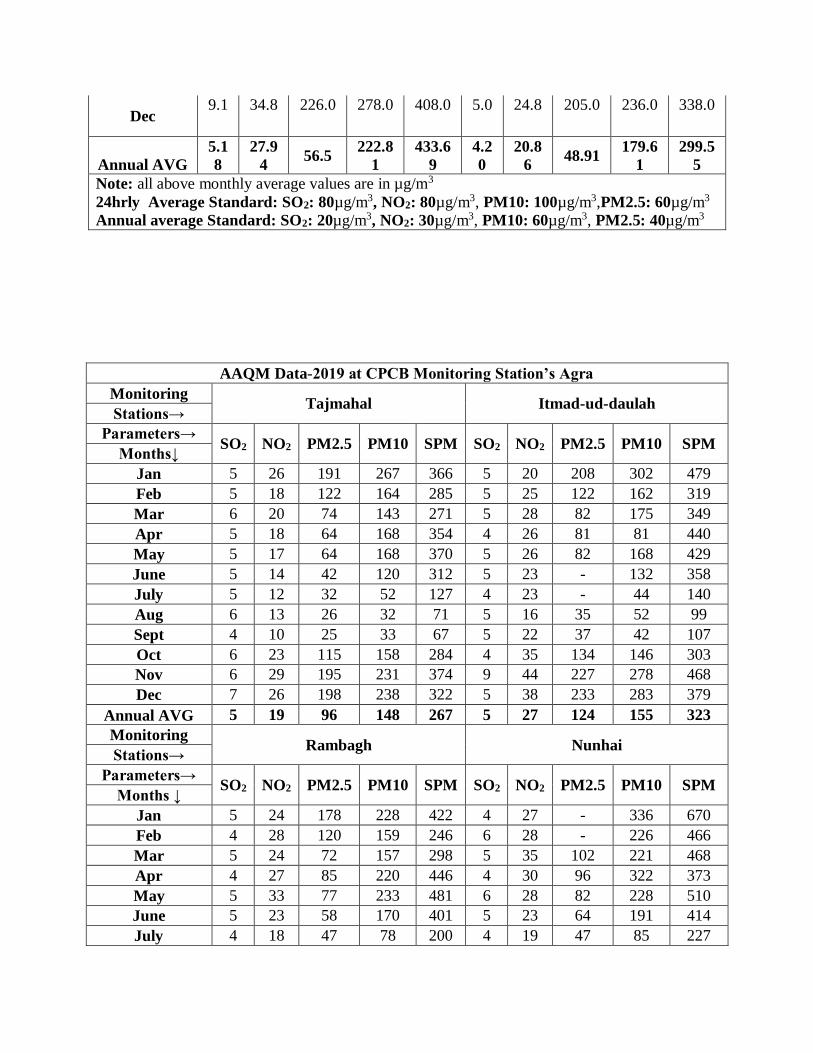
AAQM Data-2019 at CPCB Monitoring Station’s Agra
Monitoring Tajmahal Itmad-ud-daulah
Stations→
Parameters→ SO2 NO2 PM2.5 PM10 SPM SO2 NO2 PM2.5 PM10 SPM
Months↓
Jan 5 26 191 267 366 5 20 208 302 479
Feb 5 18 122 164 285 5 25 122 162 319
Mar 6 20 74 143 271 5 28 82 175 349
Apr 5 18 64 168 354 4 26 81 81 440
May 5 17 64 168 370 5 26 82 168 429
June 5 14 42 120 312 5 23 - 132 358
July 5 12 32 52 127 4 23 - 44 140
Aug 6 13 26 32 71 5 16 35 52 99
Sept 4 10 25 33 67 5 22 37 42 107
Oct 6 23 115 158 284 4 35 134 146 303
Nov 6 29 195 231 374 9 44 227 278 468
Dec 7 26 198 238 322 5 38 233 283 379
Annual AVG 5 19 96 148 267 5 27 124 155 323
Monitoring Rambagh Nunhai
Stations→
Parameters→ SO2 NO2 PM2.5 PM10 SPM SO2 NO2 PM2.5 PM10 SPM
Months ↓
Jan 5 24 178 228 422 4 27 - 336 670
Feb 4 28 120 159 246 6 28 - 226 466
Mar 5 24 72 157 298 5 35 102 221 468
Apr 4 27 85 220 446 4 30 96 322 373
May 5 33 77 233 481 6 28 82 228 510
June 5 23 58 170 401 5 23 64 191 414
July 4 18 47 78 200 4 19 47 85 227
Aug 5 15 30 45 123 5 20 34 53 145
Sept 5 14 35 40 96 4 12 41 44 132
Oct 4 22 97 131 258 6 40 176 264 532
Nov 4 27 - 247 411 5 39 241 284 568
Dec 8 25 216 228 309 9 34 233 298 448
Annual AVG 5 23 92 161 308 5 28 112 213 413
Note: all above monthly average values are in µg/m3
24hrly Average Standard: SO2: 80µg/m3, NO2: 80µg/m3, PM10: 100µg/m3,PM2.5: 60µg/m3
Annual average Standard: SO2: 20µg/m3, NO2: 30µg/m3, PM10: 60µg/m3, PM2.5: 40µg/m3
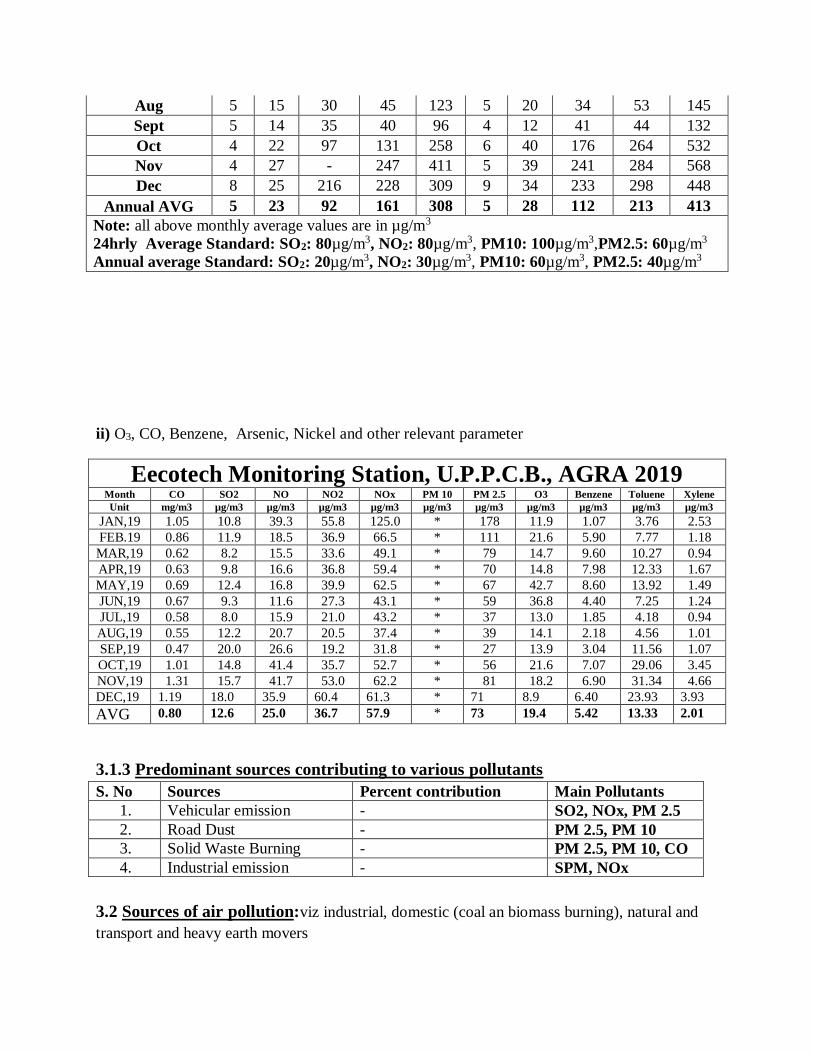
ii) O3, CO, Benzene, Arsenic, Nickel and other relevant parameter
Eecotech Monitoring Station, U.P.P.C.B., AGRA 2019 Month CO SO2 NO NO2 NOx PM 10 PM 2.5 O3 Benzene Toluene Xylene
Unit mg/m3 µg/m3 µg/m3 µg/m3 µg/m3 µg/m3 µg/m3 µg/m3 µg/m3 µg/m3 µg/m3
JAN,19 1.05 10.8 39.3 55.8 125.0 * 178 11.9 1.07 3.76 2.53
FEB.19 0.86 11.9 18.5 36.9 66.5 * 111 21.6 5.90 7.77 1.18
MAR,19 0.62 8.2 15.5 33.6 49.1 * 79 14.7 9.60 10.27 0.94
APR,19 0.63 9.8 16.6 36.8 59.4 * 70 14.8 7.98 12.33 1.67
MAY,19 0.69 12.4 16.8 39.9 62.5 * 67 42.7 8.60 13.92 1.49
JUN,19 0.67 9.3 11.6 27.3 43.1 * 59 36.8 4.40 7.25 1.24
JUL,19 0.58 8.0 15.9 21.0 43.2 * 37 13.0 1.85 4.18 0.94
AUG,19 0.55 12.2 20.7 20.5 37.4 * 39 14.1 2.18 4.56 1.01
SEP,19 0.47 20.0 26.6 19.2 31.8 * 27 13.9 3.04 11.56 1.07
OCT,19 1.01 14.8 41.4 35.7 52.7 * 56 21.6 7.07 29.06 3.45
NOV,19 1.31 15.7 41.7 53.0 62.2 * 81 18.2 6.90 31.34 4.66
DEC,19 1.19 18.0 35.9 60.4 61.3 * 71 8.9 6.40 23.93 3.93
AVG 0.80 12.6 25.0 36.7 57.9 * 73 19.4 5.42 13.33 2.01
3.1.3 Predominant sources contributing to various pollutants
S. No Sources Percent contribution Main Pollutants
1. Vehicular emission - SO2, NOx, PM 2.5
2. Road Dust - PM 2.5, PM 10
3. Solid Waste Burning - PM 2.5, PM 10, CO
4. Industrial emission - SPM, NOx
3.2 Sources of air pollution:viz industrial, domestic (coal an biomass burning), natural and
transport and heavy earth movers
Source apportionment study for Agra with regards to various sources in the region has been
awarded to IIT-Kanpur, which is likely to be completed by October, 2020.
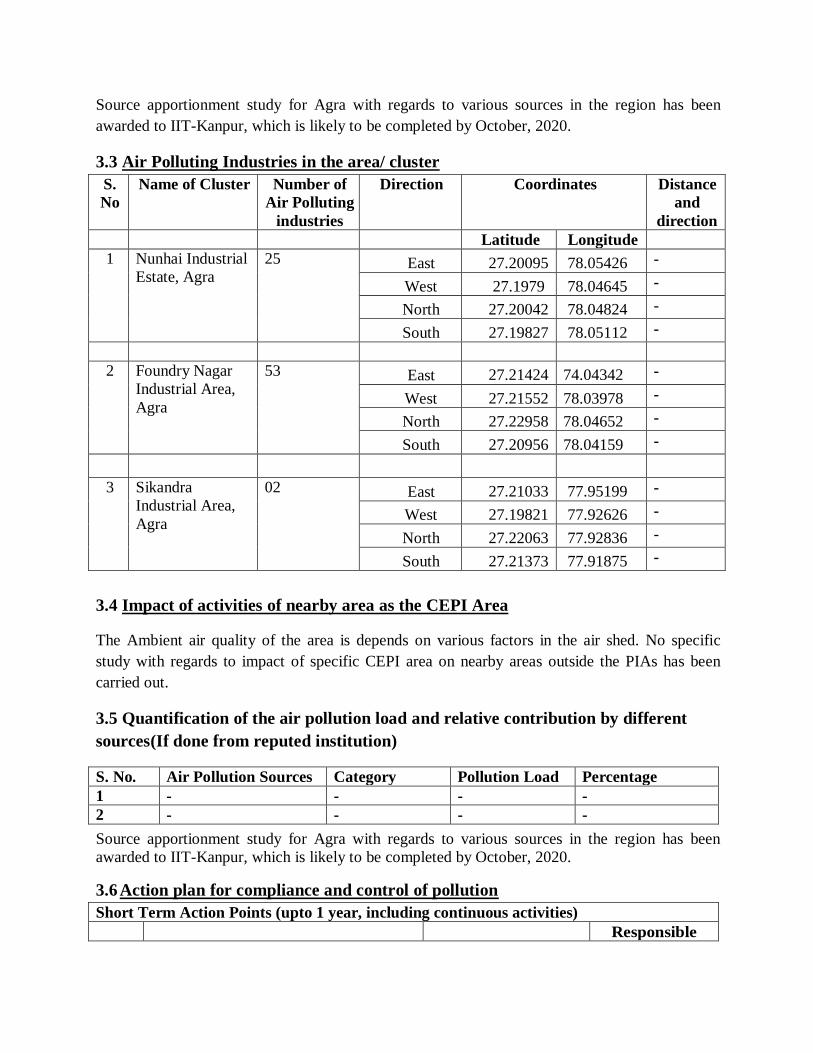
3.3 Air Polluting Industries in the area/ cluster
S.
No
Name of Cluster Number of
Air Polluting
industries
Direction Coordinates Distance
and
direction
Latitude Longitude
1 Nunhai Industrial
Estate, Agra
25 East 27.20095 78.05426 -
West 27.1979 78.04645 -
North 27.20042 78.04824 -
South 27.19827 78.05112 -
2 Foundry Nagar
Industrial Area,
Agra
53 East 27.21424 74.04342 -
West 27.21552 78.03978 -
North 27.22958 78.04652 -
South 27.20956 78.04159 -
3 Sikandra
Industrial Area,
Agra
02 East 27.21033 77.95199 -
West 27.19821 77.92626 -
North 27.22063 77.92836 -
South 27.21373 77.91875 -
3.4 Impact of activities of nearby area as the CEPI Area
The Ambient air quality of the area is depends on various factors in the air shed. No specific
study with regards to impact of specific CEPI area on nearby areas outside the PIAs has been
carried out.
3.5 Quantification of the air pollution load and relative contribution by different
sources(If done from reputed institution)
S. No. Air Pollution Sources Category Pollution Load Percentage
1 - - - -
2 - - - -
Source apportionment study for Agra with regards to various sources in the region has been
awarded to IIT-Kanpur, which is likely to be completed by October, 2020.
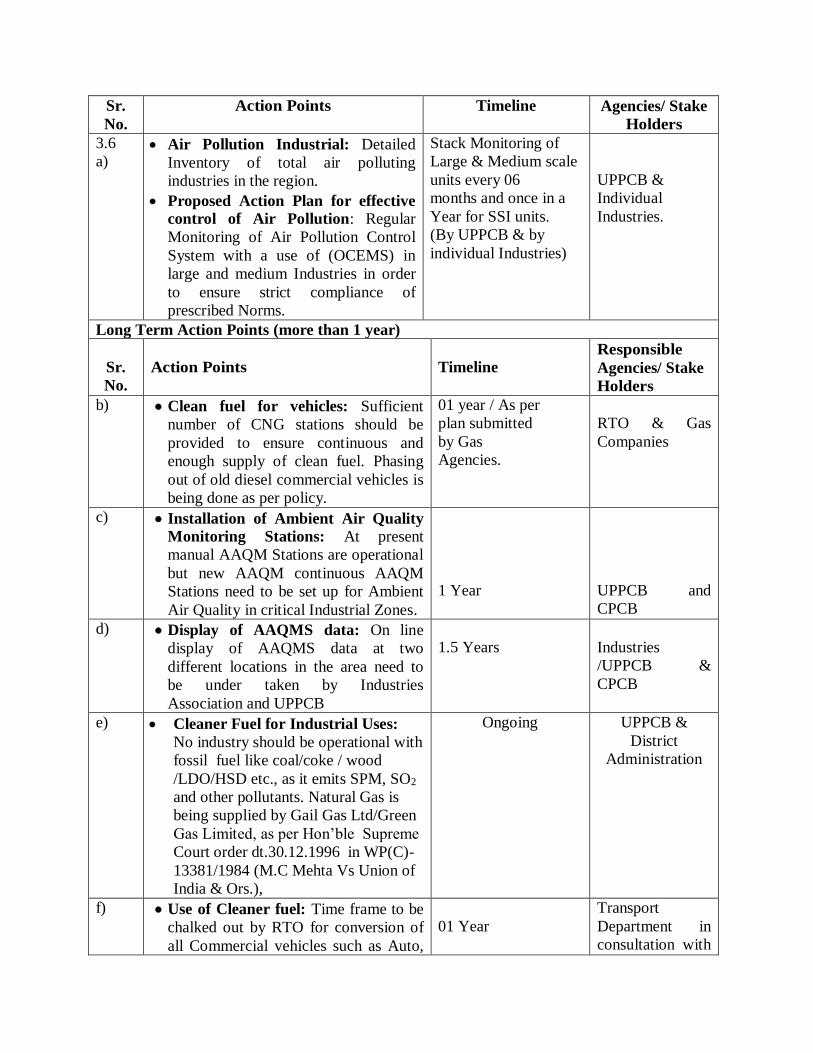
3.6 Action plan for compliance and control of pollution
Short Term Action Points (upto 1 year, including continuous activities)
Responsible
Sr.
No.
Action Points Timeline Agencies/ Stake
Holders
3.6
a) Air Pollution Industrial: Detailed
Inventory of total air polluting
industries in the region.
Proposed Action Plan for effective
control of Air Pollution: Regular
Monitoring of Air Pollution Control
System with a use of (OCEMS) in
large and medium Industries in order
to ensure strict compliance of
prescribed Norms.
Stack Monitoring of
Large & Medium scale
units every 06
months and once in a
Year for SSI units.
(By UPPCB & by
individual Industries)
UPPCB &
Individual
Industries.
Long Term Action Points (more than 1 year)
Sr.
No.
Action Points
Timeline
Responsible
Agencies/ Stake
Holders
b) Clean fuel for vehicles: Sufficient
number of CNG stations should be
provided to ensure continuous and
enough supply of clean fuel. Phasing
out of old diesel commercial vehicles is
being done as per policy.
01 year / As per
plan submitted
by Gas
Agencies.
RTO & Gas
Companies
c) Installation of Ambient Air Quality
Monitoring Stations: At present
manual AAQM Stations are operational
but new AAQM continuous AAQM
Stations need to be set up for Ambient
Air Quality in critical Industrial Zones.
1 Year
UPPCB and
CPCB
d) Display of AAQMS data: On line
display of AAQMS data at two
different locations in the area need to
be under taken by Industries
Association and UPPCB
1.5 Years
Industries
/UPPCB &
CPCB
e) Cleaner Fuel for Industrial Uses:
No industry should be operational with
fossil fuel like coal/coke / wood
/LDO/HSD etc., as it emits SPM, SO2
and other pollutants. Natural Gas is
being supplied by Gail Gas Ltd/Green
Gas Limited, as per Hon’ble Supreme
Court order dt.30.12.1996 in WP(C)-
13381/1984 (M.C Mehta Vs Union of
India & Ors.),
Ongoing UPPCB &
District
Administration
f) Use of Cleaner fuel: Time frame to be
chalked out by RTO for conversion of
all Commercial vehicles such as Auto,
01 Year
Transport
Department in
consultation with
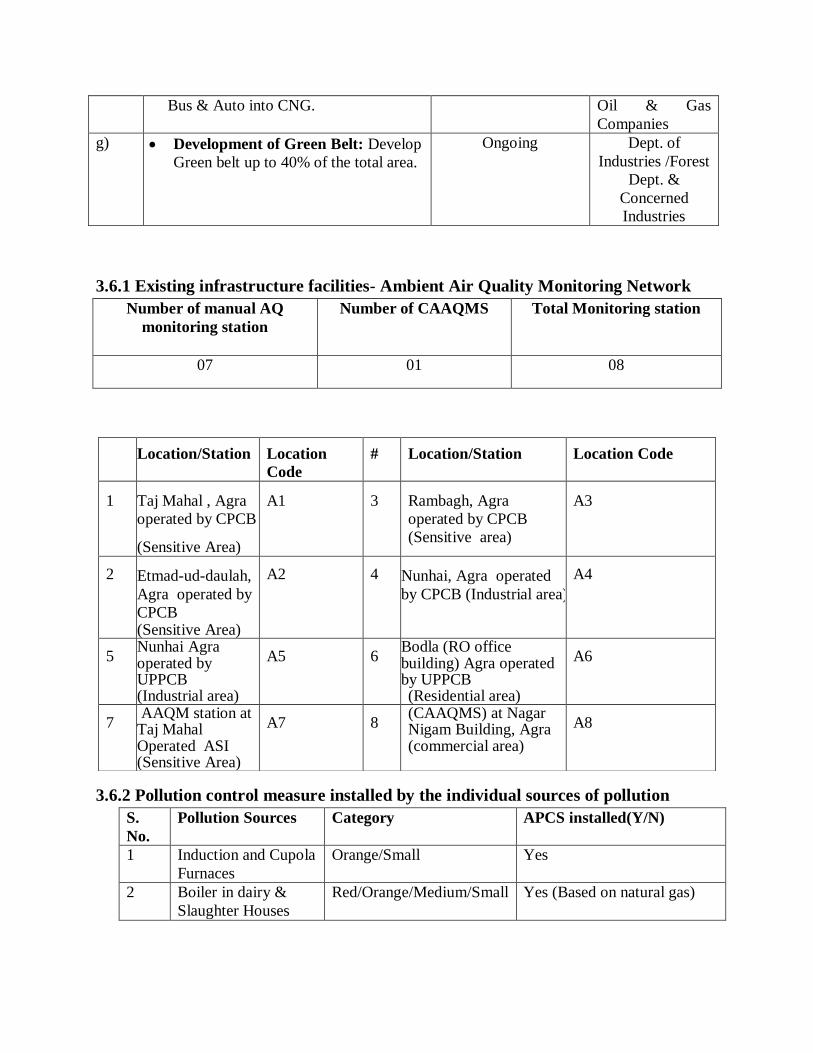
Bus & Auto into CNG. Oil & Gas
Companies
g) Development of Green Belt: Develop
Green belt up to 40% of the total area.
Ongoing Dept. of
Industries /Forest
Dept. &
Concerned
Industries
3.6.1 Existing infrastructure facilities- Ambient Air Quality Monitoring Network
Number of manual AQ
monitoring station
Number of CAAQMS Total Monitoring station
07 01 08
3.6.2 Pollution control measure installed by the individual sources of pollution
S.
No.
Pollution Sources Category APCS installed(Y/N)
1 Induction and Cupola
Furnaces
Orange/Small Yes
2 Boiler in dairy &
Slaughter Houses
Red/Orange/Medium/Small Yes (Based on natural gas)
Location/Station Location
Code
# Location/Station Location Code
1 Taj Mahal , Agra
operated by CPCB
(Sensitive Area)
A1 3 Rambagh, Agra
operated by CPCB
(Sensitive area)
A3
2 Etmad-ud-daulah,
Agra operated by
CPCB (Sensitive Area)
A2 4 Nunhai, Agra operated
by CPCB (Industrial area)
A4
5 Nunhai Agra operated by UPPCB (Industrial area)
A5 6 Bodla (RO office building) Agra operated by UPPCB (Residential area)
A6
7 AAQM station at Taj Mahal Operated ASI (Sensitive Area)
A7 8 (CAAQMS) at Nagar Nigam Building, Agra (commercial area)
A8
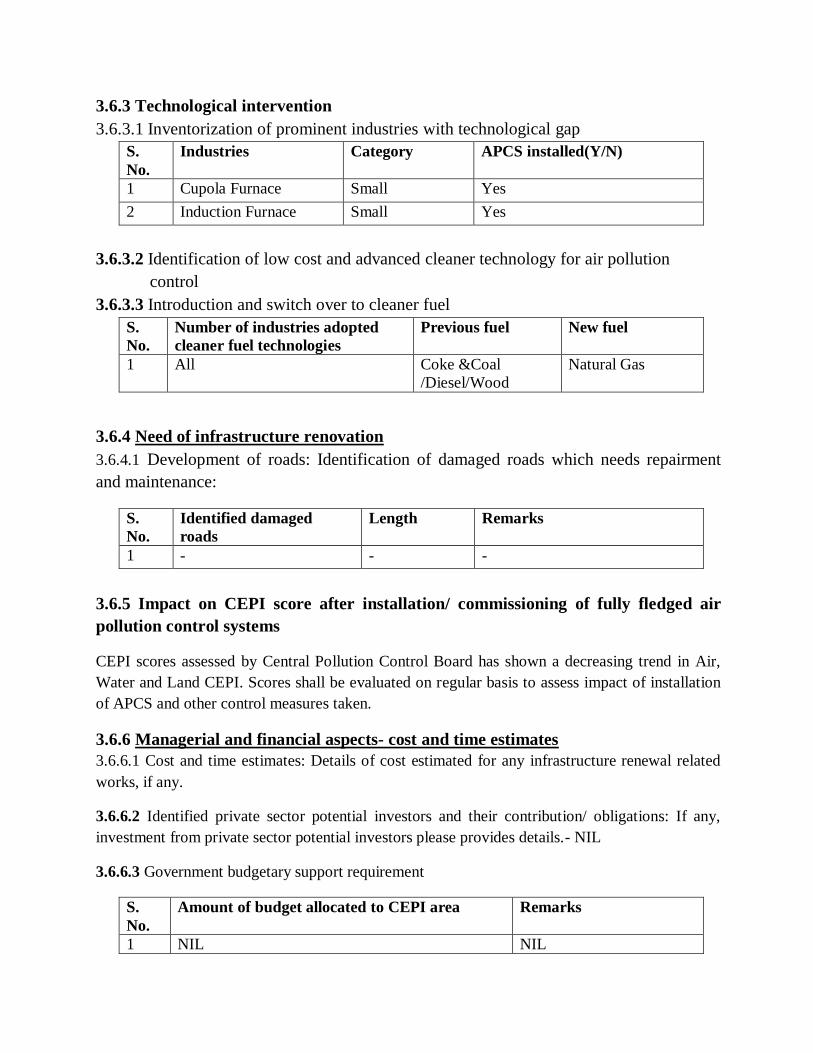
3.6.3 Technological intervention
3.6.3.1 Inventorization of prominent industries with technological gap
S.
No.
Industries Category APCS installed(Y/N)
1 Cupola Furnace Small Yes
2 Induction Furnace Small Yes
3.6.3.2 Identification of low cost and advanced cleaner technology for air pollution
control
3.6.3.3 Introduction and switch over to cleaner fuel S.
No.
Number of industries adopted
cleaner fuel technologies
Previous fuel New fuel
1 All Coke &Coal
/Diesel/Wood
Natural Gas
3.6.4 Need of infrastructure renovation
3.6.4.1 Development of roads: Identification of damaged roads which needs repairment
and maintenance:
S.
No.
Identified damaged
roads
Length Remarks
1 - - -
3.6.5 Impact on CEPI score after installation/ commissioning of fully fledged air
pollution control systems
CEPI scores assessed by Central Pollution Control Board has shown a decreasing trend in Air,
Water and Land CEPI. Scores shall be evaluated on regular basis to assess impact of installation
of APCS and other control measures taken.
3.6.6 Managerial and financial aspects- cost and time estimates
3.6.6.1 Cost and time estimates: Details of cost estimated for any infrastructure renewal related
works, if any.
3.6.6.2 Identified private sector potential investors and their contribution/ obligations: If any,
investment from private sector potential investors please provides details.- NIL
3.6.6.3 Government budgetary support requirement
S.
No.
Amount of budget allocated to CEPI area Remarks
1 NIL NIL
3.6.6.4 Hierarchical and structured managerial system for efficient implementation
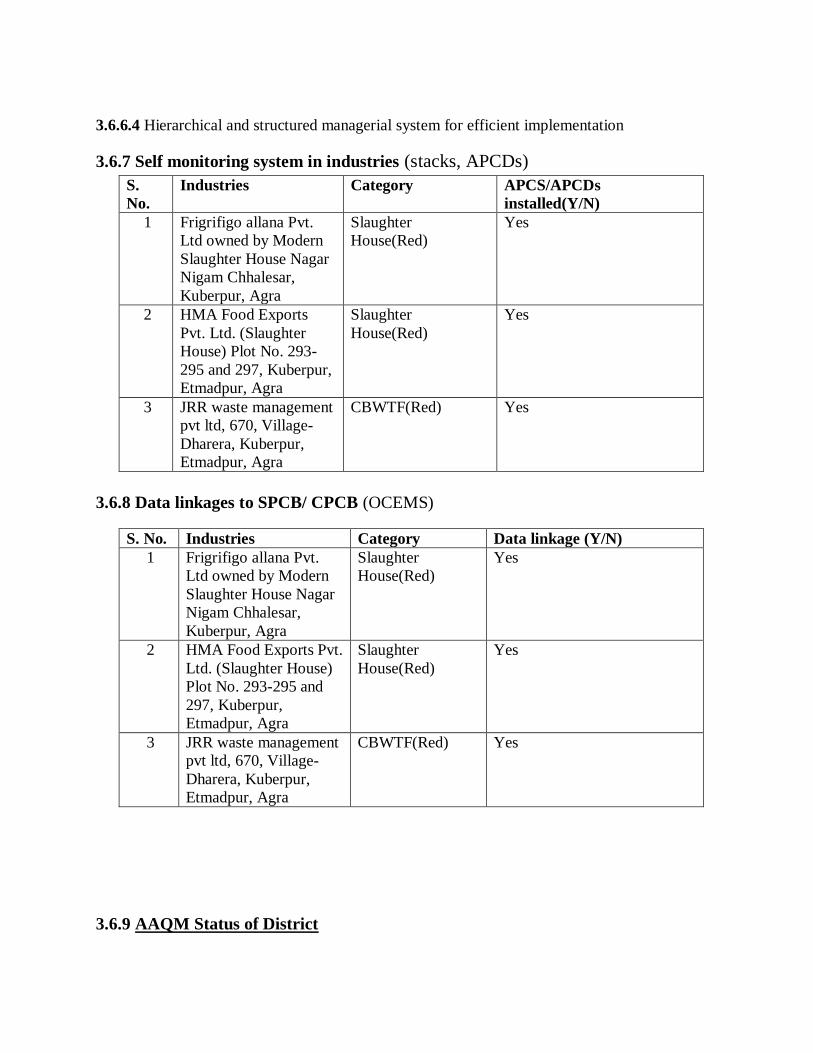
3.6.7 Self monitoring system in industries (stacks, APCDs)
S.
No.
Industries Category APCS/APCDs
installed(Y/N)
1 Frigrifigo allana Pvt.
Ltd owned by Modern
Slaughter House Nagar
Nigam Chhalesar,
Kuberpur, Agra
Slaughter
House(Red)
Yes
2 HMA Food Exports
Pvt. Ltd. (Slaughter
House) Plot No. 293-
295 and 297, Kuberpur,
Etmadpur, Agra
Slaughter
House(Red)
Yes
3 JRR waste management
pvt ltd, 670, Village-
Dharera, Kuberpur,
Etmadpur, Agra
CBWTF(Red) Yes
3.6.8 Data linkages to SPCB/ CPCB (OCEMS)
S. No. Industries Category Data linkage (Y/N)
1 Frigrifigo allana Pvt.
Ltd owned by Modern
Slaughter House Nagar
Nigam Chhalesar,
Kuberpur, Agra
Slaughter
House(Red)
Yes
2 HMA Food Exports Pvt.
Ltd. (Slaughter House)
Plot No. 293-295 and
297, Kuberpur,
Etmadpur, Agra
Slaughter
House(Red)
Yes
3 JRR waste management
pvt ltd, 670, Village-
Dharera, Kuberpur,
Etmadpur, Agra
CBWTF(Red) Yes
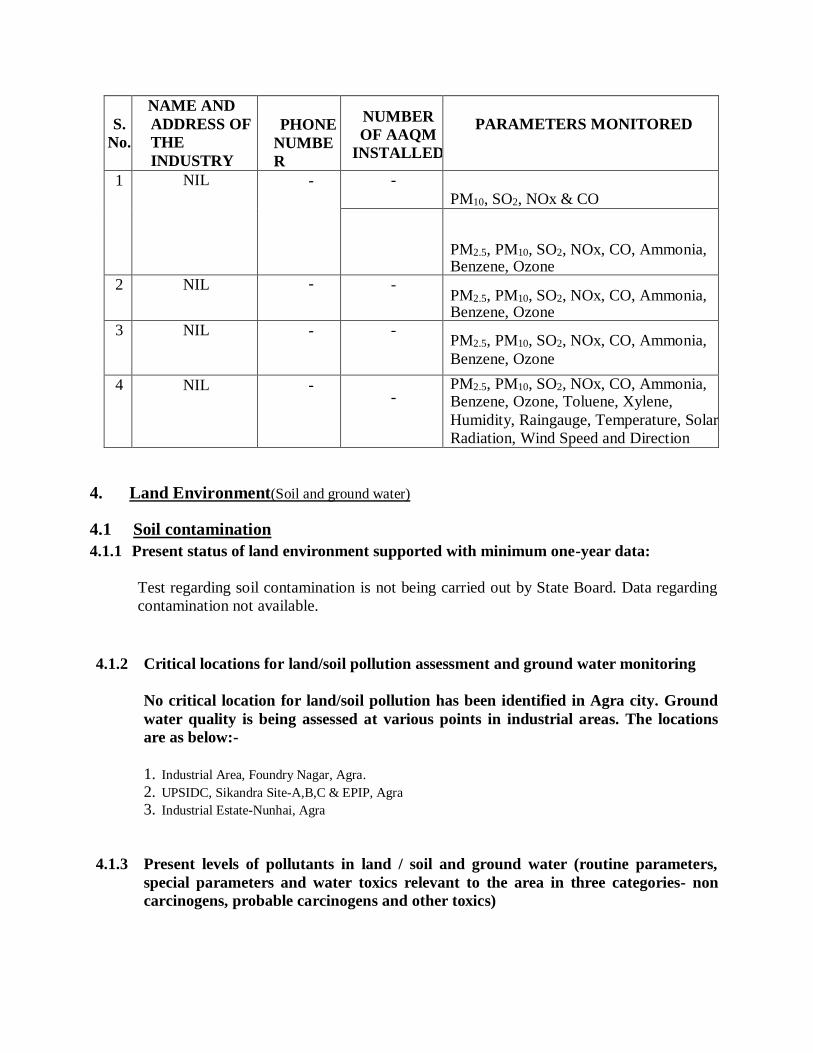
3.6.9 AAQM Status of District
S.
No.
NAME AND
ADDRESS OF
THE
INDUSTRY
PHONE
NUMBE
R
NUMBER
OF AAQM
INSTALLED
PARAMETERS MONITORED
1 NIL - -
PM10, SO2, NOx & CO
PM2.5, PM10, SO2, NOx, CO, Ammonia, Benzene, Ozone
2 NIL - - PM2.5, PM10, SO2, NOx, CO, Ammonia, Benzene, Ozone
3 NIL - - PM2.5, PM10, SO2, NOx, CO, Ammonia,
Benzene, Ozone
4 NIL - -
PM2.5, PM10, SO2, NOx, CO, Ammonia, Benzene, Ozone, Toluene, Xylene,
Humidity, Raingauge, Temperature, Solar
Radiation, Wind Speed and Direction
4. Land Environment(Soil and ground water)
4.1 Soil contamination
4.1.1 Present status of land environment supported with minimum one-year data:
Test regarding soil contamination is not being carried out by State Board. Data regarding
contamination not available.
4.1.2 Critical locations for land/soil pollution assessment and ground water monitoring
No critical location for land/soil pollution has been identified in Agra city. Ground
water quality is being assessed at various points in industrial areas. The locations
are as below:-
1. Industrial Area, Foundry Nagar, Agra.
2. UPSIDC, Sikandra Site-A,B,C & EPIP, Agra 3. Industrial Estate-Nunhai, Agra
4.1.3 Present levels of pollutants in land / soil and ground water (routine parameters,
special parameters and water toxics relevant to the area in three categories- non
carcinogens, probable carcinogens and other toxics)
Test regarding soil contamination is not being carried out by State Board. Data regarding
contamination not available
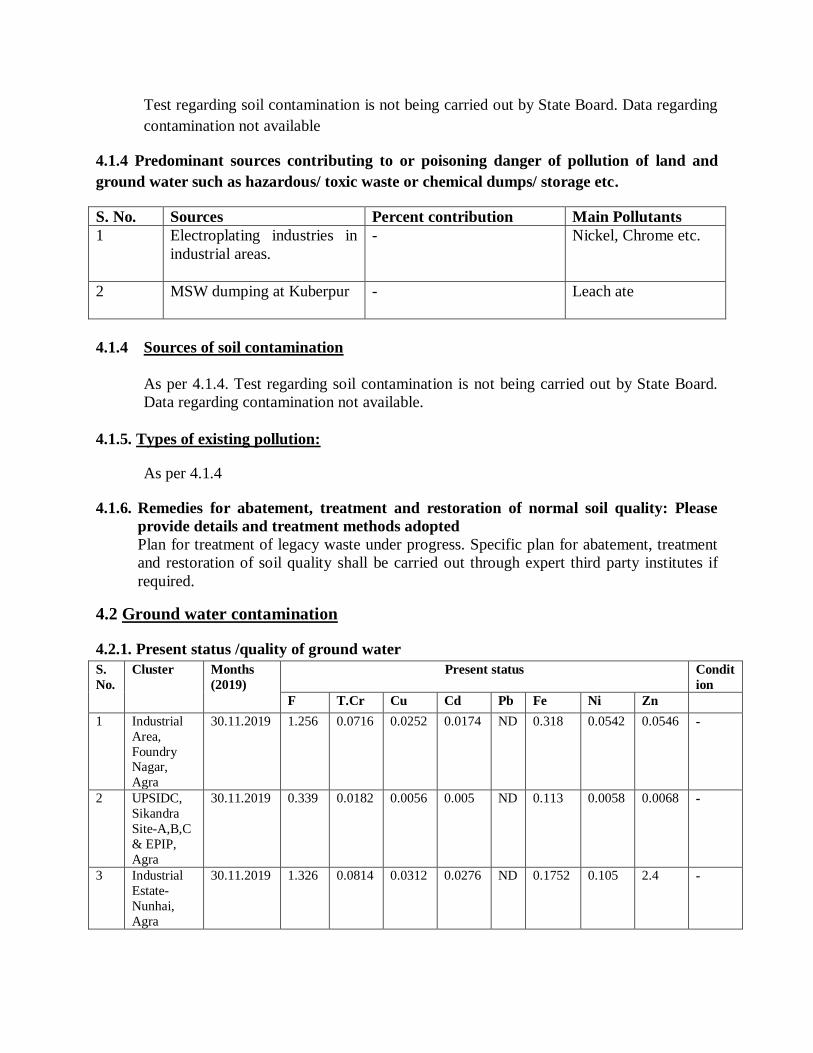
4.1.4 Predominant sources contributing to or poisoning danger of pollution of land and
ground water such as hazardous/ toxic waste or chemical dumps/ storage etc.
S. No. Sources Percent contribution Main Pollutants
1 Electroplating industries in
industrial areas.
- Nickel, Chrome etc.
2 MSW dumping at Kuberpur
- Leach ate
4.1.4 Sources of soil contamination
As per 4.1.4. Test regarding soil contamination is not being carried out by State Board.
Data regarding contamination not available.
4.1.5. Types of existing pollution:
As per 4.1.4
4.1.6. Remedies for abatement, treatment and restoration of normal soil quality: Please
provide details and treatment methods adopted
Plan for treatment of legacy waste under progress. Specific plan for abatement, treatment
and restoration of soil quality shall be carried out through expert third party institutes if
required.
4.2 Ground water contamination
4.2.1. Present status /quality of ground water
S.
No.
Cluster Months
(2019)
Present status Condit
ion
F T.Cr Cu Cd Pb Fe Ni Zn
1 Industrial
Area,
Foundry Nagar,
Agra
30.11.2019 1.256 0.0716 0.0252 0.0174 ND 0.318 0.0542 0.0546 -
2 UPSIDC,
Sikandra
Site-A,B,C
& EPIP,
Agra
30.11.2019 0.339 0.0182 0.0056 0.005 ND 0.113 0.0058 0.0068 -
3 Industrial
Estate-
Nunhai,
Agra
30.11.2019 1.326 0.0814 0.0312 0.0276 ND 0.1752 0.105 2.4 -
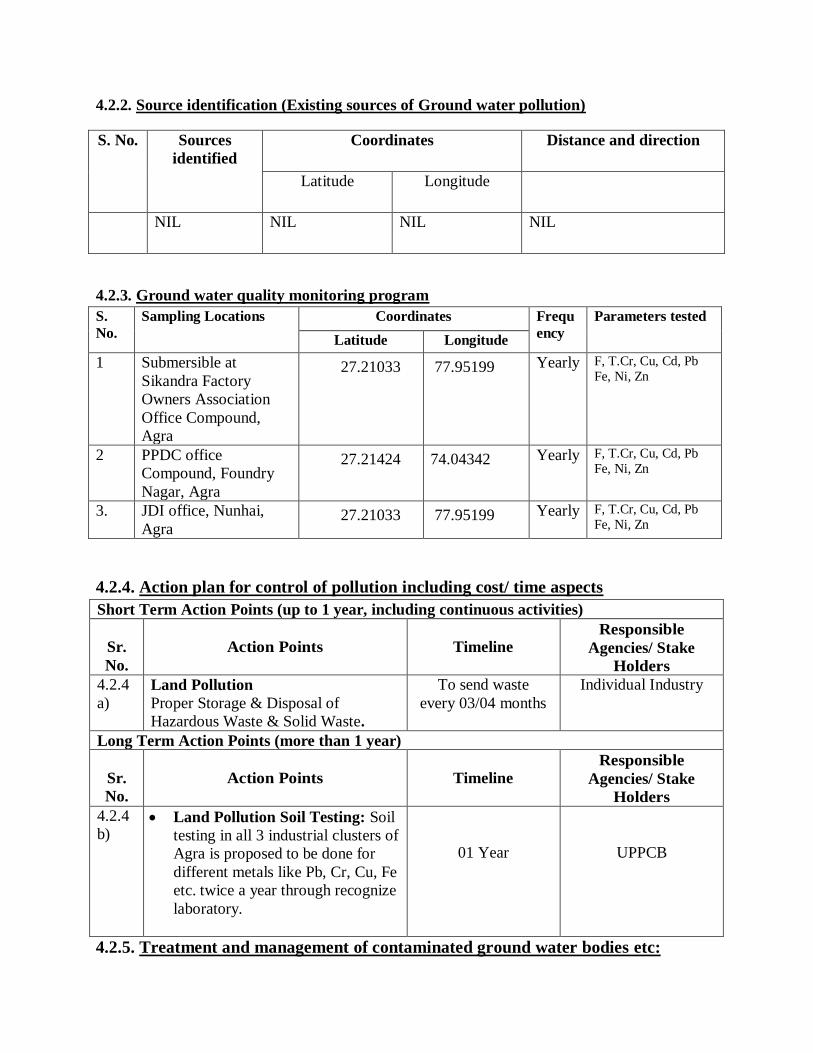
4.2.2. Source identification (Existing sources of Ground water pollution)
S. No. Sources
identified
Coordinates Distance and direction
Latitude Longitude
NIL NIL NIL NIL
4.2.3. Ground water quality monitoring program
S.
No.
Sampling Locations Coordinates Frequ
ency
Parameters tested
Latitude Longitude
1 Submersible at
Sikandra Factory
Owners Association
Office Compound,
Agra
27.21033 77.95199 Yearly F, T.Cr, Cu, Cd, Pb
Fe, Ni, Zn
2 PPDC office
Compound, Foundry
Nagar, Agra
27.21424 74.04342 Yearly F, T.Cr, Cu, Cd, Pb
Fe, Ni, Zn
3. JDI office, Nunhai,
Agra 27.21033 77.95199 Yearly F, T.Cr, Cu, Cd, Pb
Fe, Ni, Zn
4.2.4. Action plan for control of pollution including cost/ time aspects
Short Term Action Points (up to 1 year, including continuous activities)
Sr.
No.
Action Points
Timeline Responsible
Agencies/ Stake
Holders
4.2.4
a)
Land Pollution
Proper Storage & Disposal of
Hazardous Waste & Solid Waste.
To send waste
every 03/04 months
Individual Industry
Long Term Action Points (more than 1 year)
Sr.
No.
Action Points
Timeline
Responsible
Agencies/ Stake
Holders
4.2.4
b) Land Pollution Soil Testing: Soil
testing in all 3 industrial clusters of
Agra is proposed to be done for
different metals like Pb, Cr, Cu, Fe
etc. twice a year through recognize
laboratory.
01 Year
UPPCB
4.2.5. Treatment and management of contaminated ground water bodies etc:
Management of ground water level in the region is achieved by implementing rain water
harvesting in industries in all the clusters. In future, it is also proposed to implement rain
water harvesting in residential areas as well with the help of authorities concerned. This
will help not only in maintaining ground water levels but also reduce the problem faced
due to heavy run off during rains.
4.2.6. Impact on CEPI Score after abatement of pollution:
Proper management of groundwater in the region will help in lowering the overall CEPI
score as it will have positive impact on A1, B2, B3, C1, C2, C3 and D.
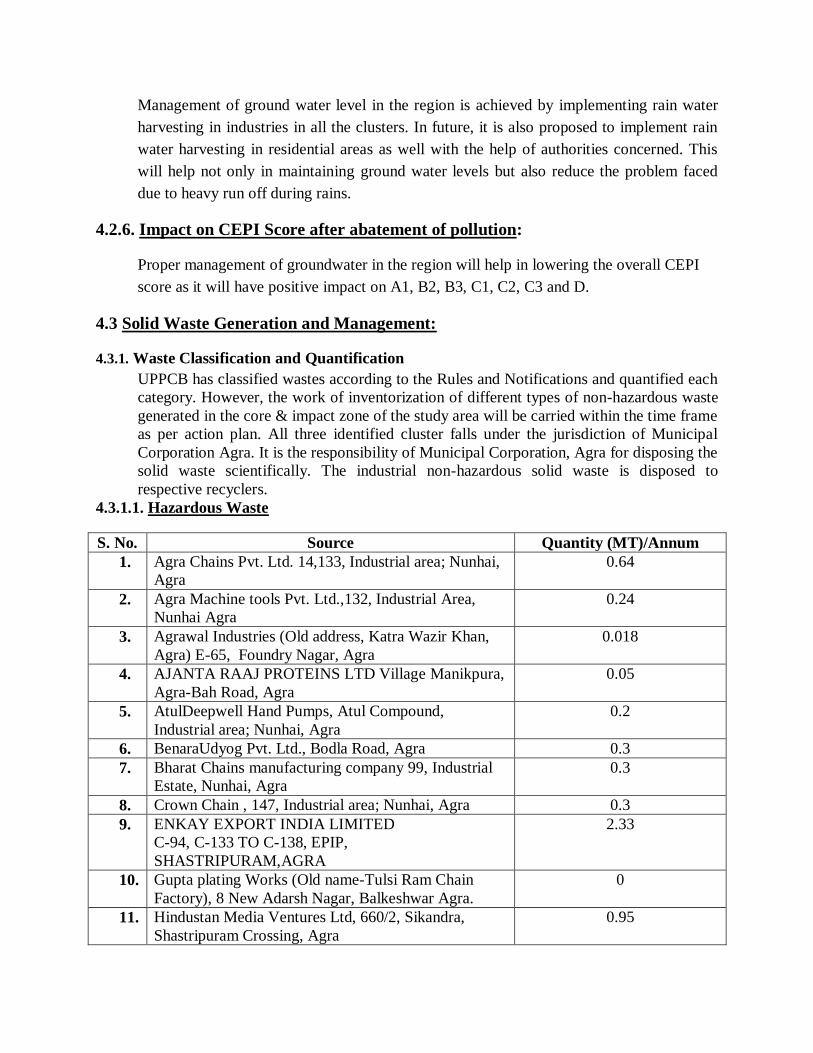
4.3 Solid Waste Generation and Management:
4.3.1. Waste Classification and Quantification
UPPCB has classified wastes according to the Rules and Notifications and quantified each
category. However, the work of inventorization of different types of non-hazardous waste
generated in the core & impact zone of the study area will be carried within the time frame
as per action plan. All three identified cluster falls under the jurisdiction of Municipal
Corporation Agra. It is the responsibility of Municipal Corporation, Agra for disposing the
solid waste scientifically. The industrial non-hazardous solid waste is disposed to
respective recyclers.
4.3.1.1. Hazardous Waste
S. No. Source Quantity (MT)/Annum
1. Agra Chains Pvt. Ltd. 14,133, Industrial area; Nunhai,
Agra
0.64
2. Agra Machine tools Pvt. Ltd.,132, Industrial Area,
Nunhai Agra
0.24
3. Agrawal Industries (Old address, Katra Wazir Khan,
Agra) E-65, Foundry Nagar, Agra
0.018
4. AJANTA RAAJ PROTEINS LTD Village Manikpura,
Agra-Bah Road, Agra
0.05
5. AtulDeepwell Hand Pumps, Atul Compound,
Industrial area; Nunhai, Agra
0.2
6. BenaraUdyog Pvt. Ltd., Bodla Road, Agra 0.3
7. Bharat Chains manufacturing company 99, Industrial
Estate, Nunhai, Agra
0.3
8. Crown Chain , 147, Industrial area; Nunhai, Agra 0.3
9. ENKAY EXPORT INDIA LIMITED
C-94, C-133 TO C-138, EPIP,
SHASTRIPURAM,AGRA
2.33
10. Gupta plating Works (Old name-Tulsi Ram Chain
Factory), 8 New Adarsh Nagar, Balkeshwar Agra.
0
11. Hindustan Media Ventures Ltd, 660/2, Sikandra,
Shastripuram Crossing, Agra
0.95
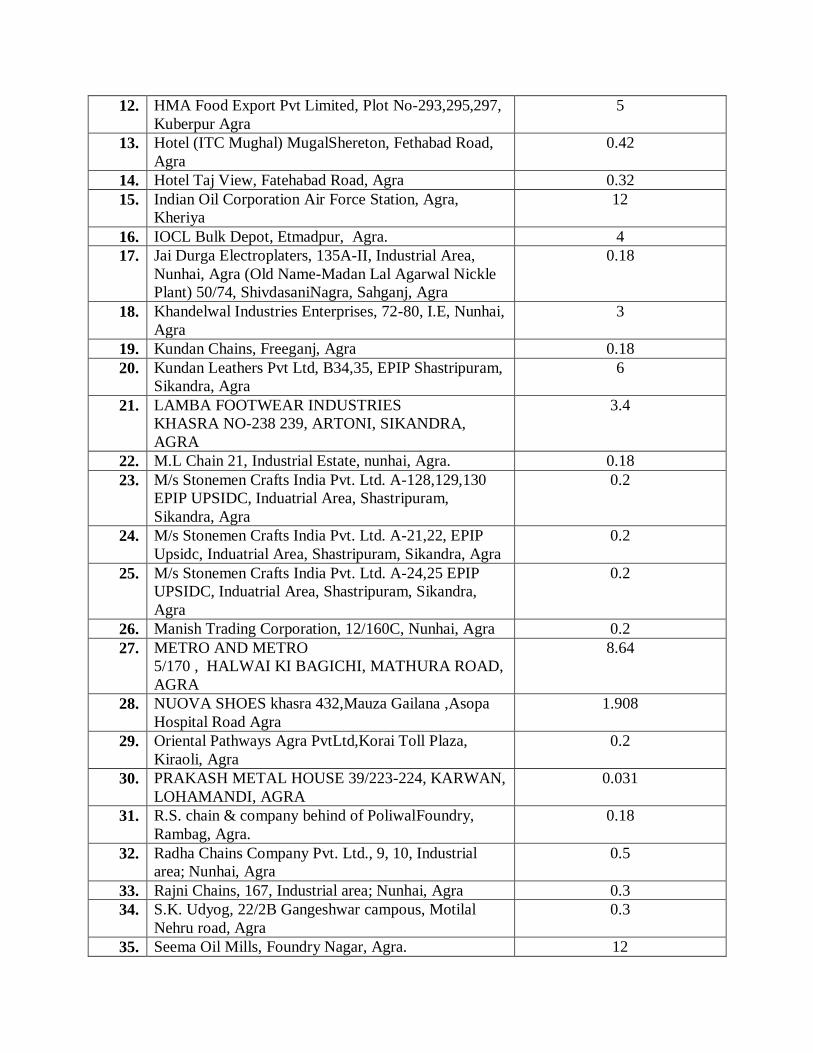
12. HMA Food Export Pvt Limited, Plot No-293,295,297,
Kuberpur Agra
5
13. Hotel (ITC Mughal) MugalShereton, Fethabad Road,
Agra
0.42
14. Hotel Taj View, Fatehabad Road, Agra 0.32
15. Indian Oil Corporation Air Force Station, Agra,
Kheriya
12
16. IOCL Bulk Depot, Etmadpur, Agra. 4
17. Jai Durga Electroplaters, 135A-II, Industrial Area,
Nunhai, Agra (Old Name-Madan Lal Agarwal Nickle
Plant) 50/74, ShivdasaniNagra, Sahganj, Agra
0.18
18. Khandelwal Industries Enterprises, 72-80, I.E, Nunhai,
Agra
3
19. Kundan Chains, Freeganj, Agra 0.18
20. Kundan Leathers Pvt Ltd, B34,35, EPIP Shastripuram,
Sikandra, Agra
6
21. LAMBA FOOTWEAR INDUSTRIES
KHASRA NO-238 239, ARTONI, SIKANDRA,
AGRA
3.4
22. M.L Chain 21, Industrial Estate, nunhai, Agra. 0.18
23. M/s Stonemen Crafts India Pvt. Ltd. A-128,129,130
EPIP UPSIDC, Induatrial Area, Shastripuram,
Sikandra, Agra
0.2
24. M/s Stonemen Crafts India Pvt. Ltd. A-21,22, EPIP
Upsidc, Induatrial Area, Shastripuram, Sikandra, Agra
0.2
25. M/s Stonemen Crafts India Pvt. Ltd. A-24,25 EPIP
UPSIDC, Induatrial Area, Shastripuram, Sikandra,
Agra
0.2
26. Manish Trading Corporation, 12/160C, Nunhai, Agra 0.2
27. METRO AND METRO
5/170 , HALWAI KI BAGICHI, MATHURA ROAD,
AGRA
8.64
28. NUOVA SHOES khasra 432,Mauza Gailana ,Asopa
Hospital Road Agra
1.908
29. Oriental Pathways Agra PvtLtd,Korai Toll Plaza,
Kiraoli, Agra
0.2
30. PRAKASH METAL HOUSE 39/223-224, KARWAN,
LOHAMANDI, AGRA
0.031
31. R.S. chain & company behind of PoliwalFoundry,
Rambag, Agra.
0.18
32. Radha Chains Company Pvt. Ltd., 9, 10, Industrial
area; Nunhai, Agra
0.5
33. Rajni Chains, 167, Industrial area; Nunhai, Agra 0.3
34. S.K. Udyog, 22/2B Gangeshwar campous, Motilal
Nehru road, Agra
0.3
35. Seema Oil Mills, Foundry Nagar, Agra. 12
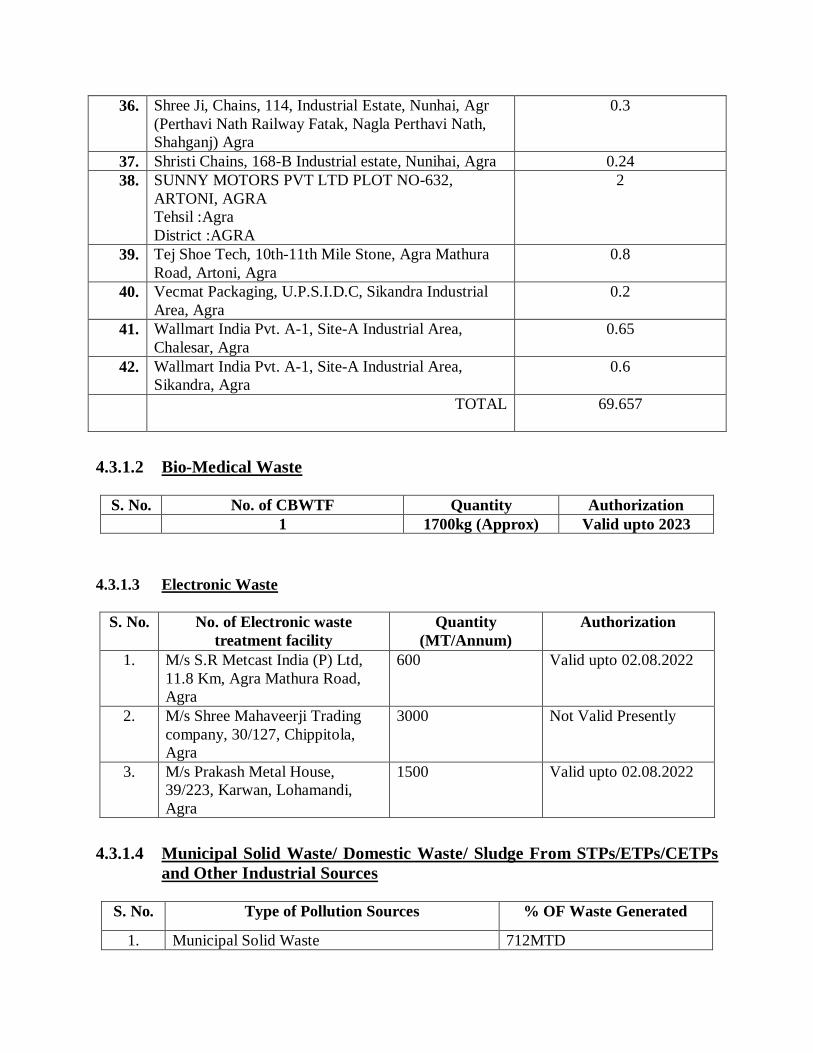
36. Shree Ji, Chains, 114, Industrial Estate, Nunhai, Agr
(Perthavi Nath Railway Fatak, Nagla Perthavi Nath,
Shahganj) Agra
0.3
37. Shristi Chains, 168-B Industrial estate, Nunihai, Agra 0.24
38. SUNNY MOTORS PVT LTD PLOT NO-632,
ARTONI, AGRA
Tehsil :Agra
District :AGRA
2
39. Tej Shoe Tech, 10th-11th Mile Stone, Agra Mathura
Road, Artoni, Agra
0.8
40. Vecmat Packaging, U.P.S.I.D.C, Sikandra Industrial
Area, Agra
0.2
41. Wallmart India Pvt. A-1, Site-A Industrial Area,
Chalesar, Agra
0.65
42. Wallmart India Pvt. A-1, Site-A Industrial Area,
Sikandra, Agra
0.6
TOTAL 69.657
4.3.1.2 Bio-Medical Waste
S. No. No. of CBWTF Quantity Authorization
1 1700kg (Approx) Valid upto 2023
4.3.1.3 Electronic Waste
S. No. No. of Electronic waste
treatment facility
Quantity
(MT/Annum)
Authorization
1. M/s S.R Metcast India (P) Ltd,
11.8 Km, Agra Mathura Road,
Agra
600 Valid upto 02.08.2022
2. M/s Shree Mahaveerji Trading
company, 30/127, Chippitola,
Agra
3000 Not Valid Presently
3. M/s Prakash Metal House,
39/223, Karwan, Lohamandi,
Agra
1500 Valid upto 02.08.2022
4.3.1.4 Municipal Solid Waste/ Domestic Waste/ Sludge From STPs/ETPs/CETPs
and Other Industrial Sources
S. No. Type of Pollution Sources % OF Waste Generated
1. Municipal Solid Waste 712MTD
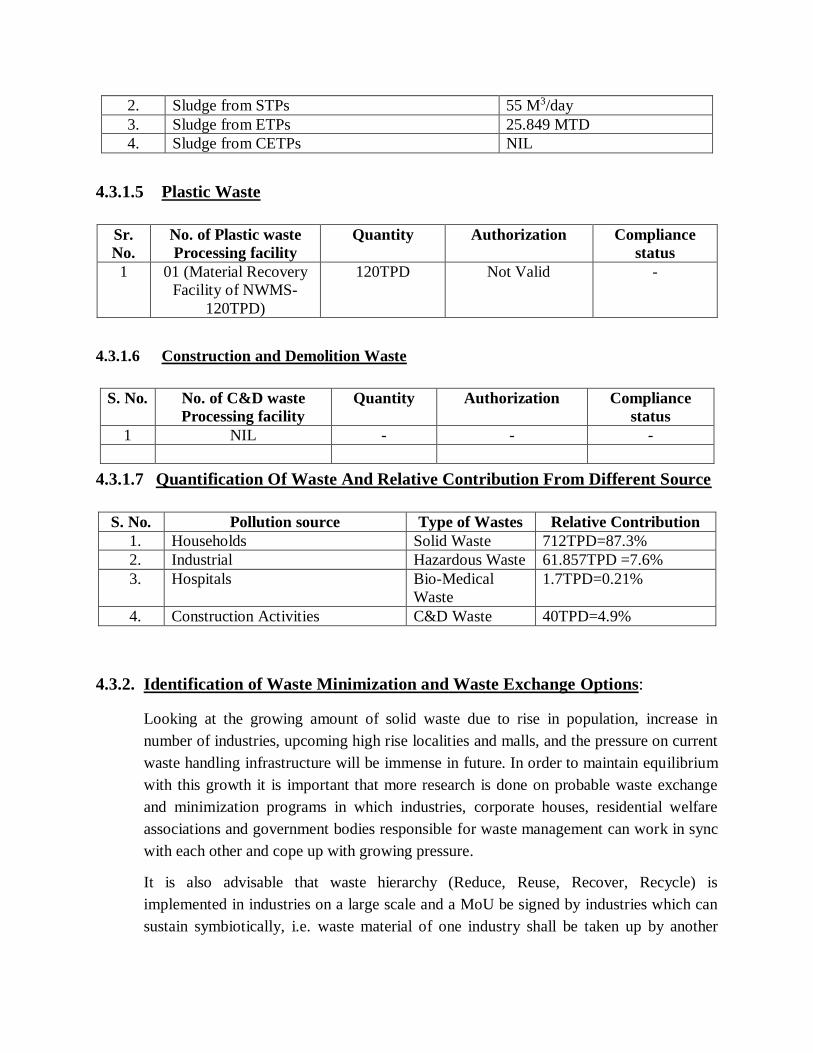
2. Sludge from STPs 55 M3/day
3. Sludge from ETPs 25.849 MTD
4. Sludge from CETPs NIL
4.3.1.5 Plastic Waste
Sr.
No.
No. of Plastic waste
Processing facility
Quantity Authorization Compliance
status
1 01 (Material Recovery
Facility of NWMS-
120TPD)
120TPD Not Valid -
4.3.1.6 Construction and Demolition Waste
S. No. No. of C&D waste
Processing facility
Quantity Authorization Compliance
status
1 NIL - - -
4.3.1.7 Quantification Of Waste And Relative Contribution From Different Source
S. No. Pollution source Type of Wastes Relative Contribution
1. Households Solid Waste 712TPD=87.3%
2. Industrial Hazardous Waste 61.857TPD =7.6%
3. Hospitals Bio-Medical
Waste
1.7TPD=0.21%
4. Construction Activities C&D Waste 40TPD=4.9%
4.3.2. Identification of Waste Minimization and Waste Exchange Options:
Looking at the growing amount of solid waste due to rise in population, increase in
number of industries, upcoming high rise localities and malls, and the pressure on current
waste handling infrastructure will be immense in future. In order to maintain equilibrium
with this growth it is important that more research is done on probable waste exchange
and minimization programs in which industries, corporate houses, residential welfare
associations and government bodies responsible for waste management can work in sync
with each other and cope up with growing pressure.
It is also advisable that waste hierarchy (Reduce, Reuse, Recover, Recycle) is
implemented in industries on a large scale and a MoU be signed by industries which can
sustain symbiotically, i.e. waste material of one industry shall be taken up by another
industry using it as a raw material. This understanding between industries will reduce the
overall waste coming out of industries.
UPPCB has also prepared a “Waste to Wealth” directory having details of all the waste in
Uttar Pradesh which may be used elsewhere.
4.3.3. Reduction/Reuse/ Recovery/ Recycle Options in the Co-Processing of Waste:
As mentioned elsewhere, due to presence of industries of different types, waste
characteristics and processes in same region/area/cluster co-processing of waste is not
viable to industries as they need to manage the waste on their site till transportation.
However, with advent of technology and new waste treatment processes whereby wastes
of different types can be handled simultaneously co-processing option shall be looked
into. For best results it is advisable, that a separate unit be setup in regions where
industries can register themselves for willingly incorporating Reduce, Reuse, Recover,
Recycle in their processes and get their site inspected for the same by experts. Based on
the report the industry should incorporate the necessary infrastructural, operational and
functional changes over a period of time to do co-processing of their own waste in their
process. Once successful this can be implemented between different industries and
clusters in following phases.
4.3.4. Infrastructure Facilities:
4.3.4.1. Existing TSDF/Incineration Facilities Including Capacities
Presently, there is no TSDF facility in the Agra. Industries generating hazardous waste
have been directed to become a member of TSDF facilities at Kanpur Dehat. These are
the only two TSDF facilities in the state as of now and are managed by M/s Ramky
Enviro Engineers group and M/s Bharat Oil and Waste Management Ltd.
One waste recycling unit M/s Seema Oil is operational in Foundry Nagar industrial Area
of Agra.
4.3.4.2. Present Status / Performance and Need up Gradation Of Existing Facilities
Including Enhancement Of Capacities:
Agra Nagar Nigam is managing the regular cleaning of the city area. Landfil Site &
Composting Plant of 750 TPD at Kuberpur, Agra has been established by Agra Nagar
Nigam. But since one year the treatment facility is not operational. Total quantity
collected waste of 770 TPD is disposed by land filling.
1. Treatment And Management Of Contaminated Waste Disposal Sites Etc:
These sites are being and in future will be managed by private players who have expertise
in landfill siting and handling, it is their responsibility to ensure the management of their
site so that there are no issues with wastes dumped on site after the site is exhausted.
However, the site is also monitored by State Pollution Control Board from time to time in
order to ensure that there is no degradation in quality of ground water from leachate from
these sites.
2. Impact On CEPI Score After Proper Management Of Solid Waste:
Apart from proposed landfill sites, authorities have taken an initiative and build different
waste collection centres in various sectors of the region. Waste from nearby localities is
collected and managed in these centres before being sent to the waste dumping site, also
it is proposed that in future projects must ensure setting up of in house MSW disposal
facilities as per MSW Rules & ensure compliance of the conditions of the Environment
Clearance and NOC from UPPCB. In order to curb solid waste pollution in industries
they have to be directed to properly store, handle and dispose hazardous and their MSW
within the campus till it is not sent to TSDF so that it does not create litter in surrounding
areas. Implementation of proposed actions shall result in lowering of CEPI due to
reduction in the values of A1, B1, B2, B3, C1, C2, D due to reduction in air, water and
land pollution issues related with waste storage, handling and disposal.
5. PPP Model
5.1 Identification of project proposals (for both the options i.e technology intervention
and infrastructure renewal) for implementation under the PPP mode under the
Action Plan.
After finalization of action plan private participation will be explored.
6. Other infrastructural Renewal measures:
6.1. Green belts
Large scale plantation drives have been carried out in the State of U.P./Likewise in Agra
37,50,407 saplings were planted in a single day in the year 2020-21. Besides this
plantation by concerned authorities and private players are carried out from time to time.
6.2. Development of Industrial Estate(s)
Presently no new Industrial Estate/Area has been identified by department of industries,
UPSIDA and Agra development Authority in Agra.
6.3. Development/shifting of industries
Many electroplating, Petha and Shoe industries operational in residential areas have
either been shifted to or in process of shifting to industrial areas/conforming zone. The
matter of land identification, allocation and shifting of units is related to Development
Authority. Agra is famous for footwear and Petha industries. Some imitation jewellery is
also being manufactured in the city. Leather footwear and leather products fall under
Green category and finished leather goods, conversion of finished goods without wet
process like leather stitching, upper, shoe laces etc fall under White category of
industries. Most of these units are basically Cottage units. Potential shoe units are already
operational either in industrial areas or in conforming land use.
Agra Petha units operational at different places in Agra are in the process of shifting to a
designated area i.e. Kalindi Vihar, which is being monitored by district administration.
There is an issue of non-availability of soft water, which is under consideration at
concerned department. District Administration is trying for availability of Ganga water
for this area. As soon as it is sorted out, most of the Petha units will shift themselves to
this area. However, the District administration is continuously taking action by carrying
regular drive against the Petha units running with coal as fuel in residential areas. That a
leather park for footwear industries has also been proposed by UPSIDA at Kiraoli, Agra.
7. Specific Schemes:
7.1. GIS-GPS System for pollution sources monitoring
At present there is no such system for pollution sources monitoring. The possibility will
be explored.
7.2. Hydro- geological fracturing for water bodies rejuvenation
Hydro-geological survey by technical agency is recommended to be carried out in all the
industrial area pre monsoon and post monsoon to have a detailed groundwater report and
for identification of point source..
7.3. In-situ remediation of sewage
State has formulated a policy for management of Sewage, Fecal and Septage. Same is
being implemented for ex-situ and in-situ management of domestic waste water.
7.4. Utilization of MSW inert by gas based brick kilns
Presently all the brick kilns are coal based and remotely stationed even scattered also.
Possibility will be explored if feasible.
7.5. Co- processing of wastes in cements industries
No Cement industry is situated in the District.
8. Public awareness and training programs
District Administration, Nagar Nigam and UPPCB are conducting both public awareness
& training programs in the field of environment management for the stakeholders in co-
ordination with industries, NGOs educational Institutes & other Government
departments. Public awareness and training programs are also proposed under. NCAP
program of MoEF & CC through various partners.
9. Overall impact on installation/commissioning of pollution control
equipment/ measures on the CEPI score
Water Pollution Although all the industries in the industrial clusters have installed ETPs for treatment of
industrial effluent, modification and switching on the latest technologies w.r.t Effluent
treatment Plants is recommended to bring down the CEPI scores. Following measures
will reduce the pollution load being added by the discharge of treated effluent into the
drains
Water intensive units should be promoted to reuse the treated water in the process
wherever feasible.
Strict enforcement to close down illegal industries operating in residential areas.
Air Pollution
All medium and small scale air polluting industries have installed OCEMS for monitoring of
emissions from the chimney. Following
All the air polluting industries are based on either electricity or natural gas. No industry is
being permitted on the fossil fuel in the Agra city.
Strict enforcement to close down illegal industries operating in residential areas.
10. Assessment of techno-economic feasibility pollution control system in
clusters of small/medium scale industries Study of techno-economical feasibility of pollution control systems in clusters of small/medium
scale industries has not been carried out. It will be proposed for future.
11. Efforts shall be made to encourage use of Bio-compost and Bio-fertilizers
along with the chemical fertilizers in the state to minimize the unutilized
chemical fertilizers runoff into the natural water resources from agriculture
fields (through Govt. Policy)
To ensure the implementation of above mentioned point is proposed to be implemented through
Agriculture department.
12. Summary of proposed action points
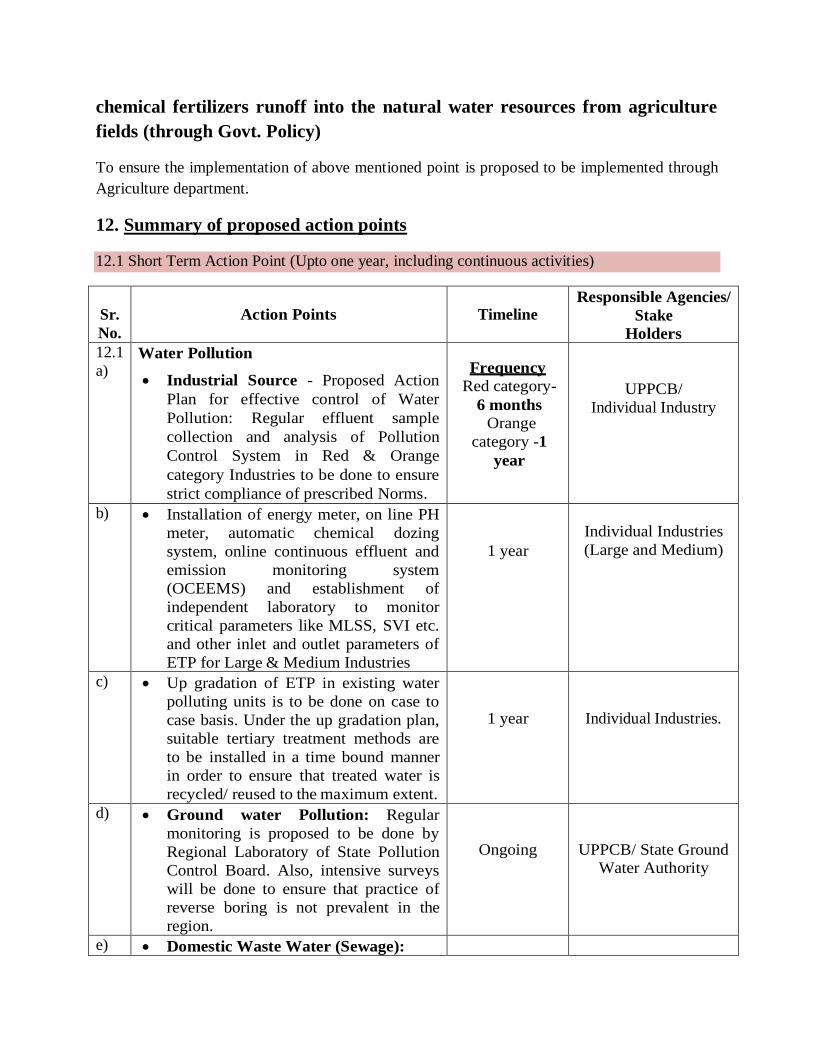
12.1 Short Term Action Point (Upto one year, including continuous activities)
Sr.
No.
Action Points
Timeline Responsible Agencies/
Stake
Holders
12.1
a) Water Pollution
Industrial Source - Proposed Action
Plan for effective control of Water
Pollution: Regular effluent sample
collection and analysis of Pollution
Control System in Red & Orange
category Industries to be done to ensure
strict compliance of prescribed Norms.
Frequency
Red category-
6 months
Orange
category -1
year
UPPCB/
Individual Industry
b) Installation of energy meter, on line PH
meter, automatic chemical dozing
system, online continuous effluent and
emission monitoring system
(OCEEMS) and establishment of
independent laboratory to monitor
critical parameters like MLSS, SVI etc.
and other inlet and outlet parameters of
ETP for Large & Medium Industries
1 year
Individual Industries
(Large and Medium)
c) Up gradation of ETP in existing water
polluting units is to be done on case to
case basis. Under the up gradation plan,
suitable tertiary treatment methods are
to be installed in a time bound manner
in order to ensure that treated water is
recycled/ reused to the maximum extent.
1 year
Individual Industries.
d) Ground water Pollution: Regular
monitoring is proposed to be done by
Regional Laboratory of State Pollution
Control Board. Also, intensive surveys
will be done to ensure that practice of
reverse boring is not prevalent in the
region.
Ongoing
UPPCB/ State Ground
Water Authority
e) Domestic Waste Water (Sewage):
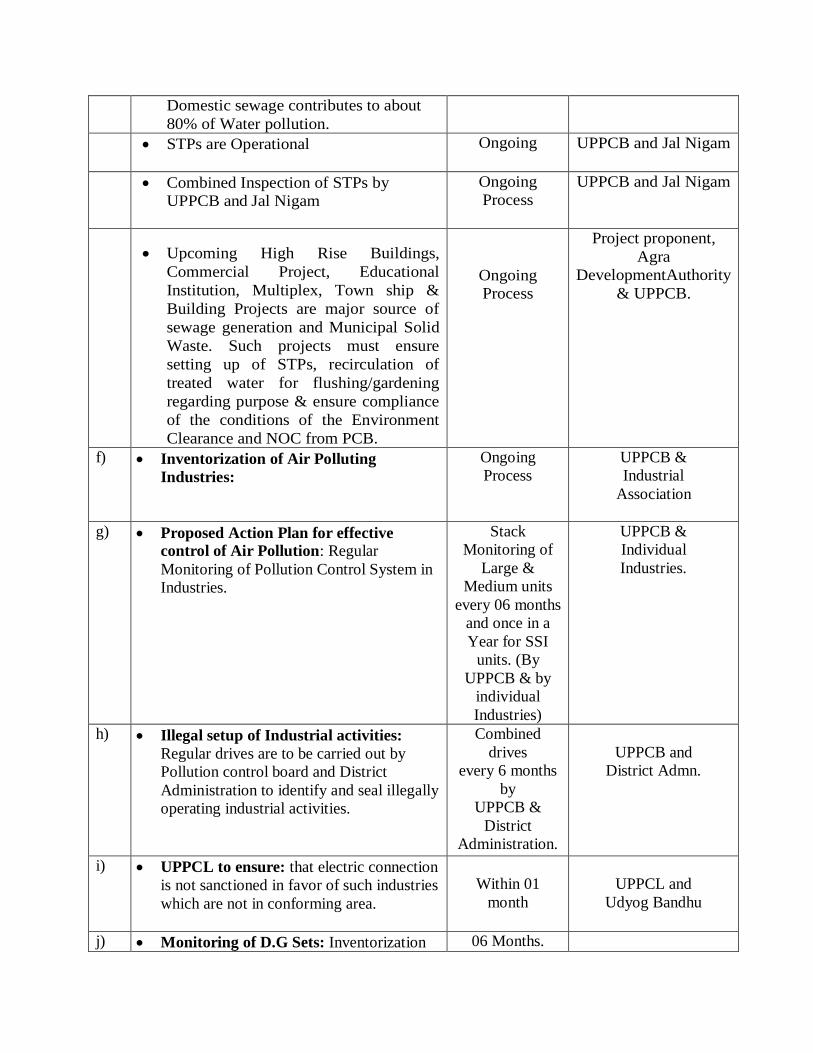
Domestic sewage contributes to about
80% of Water pollution.
STPs are Operational
Ongoing
UPPCB and Jal Nigam
Combined Inspection of STPs by
UPPCB and Jal Nigam
Ongoing
Process
UPPCB and Jal Nigam
Upcoming High Rise Buildings,
Commercial Project, Educational
Institution, Multiplex, Town ship &
Building Projects are major source of
sewage generation and Municipal Solid
Waste. Such projects must ensure
setting up of STPs, recirculation of
treated water for flushing/gardening
regarding purpose & ensure compliance
of the conditions of the Environment
Clearance and NOC from PCB.
Ongoing
Process
Project proponent,
Agra
DevelopmentAuthority
& UPPCB.
f) Inventorization of Air Polluting
Industries:
Ongoing
Process
UPPCB &
Industrial
Association
g) Proposed Action Plan for effective
control of Air Pollution: Regular
Monitoring of Pollution Control System in
Industries.
Stack
Monitoring of
Large &
Medium units
every 06 months
and once in a
Year for SSI
units. (By
UPPCB & by
individual
Industries)
UPPCB &
Individual
Industries.
h) Illegal setup of Industrial activities:
Regular drives are to be carried out by
Pollution control board and District
Administration to identify and seal illegally
operating industrial activities.
Combined
drives
every 6 months
by
UPPCB &
District
Administration.
UPPCB and
District Admn.
i) UPPCL to ensure: that electric connection
is not sanctioned in favor of such industries
which are not in conforming area.
Within 01
month
UPPCL and
Udyog Bandhu
j) Monitoring of D.G Sets: Inventorization 06 Months.
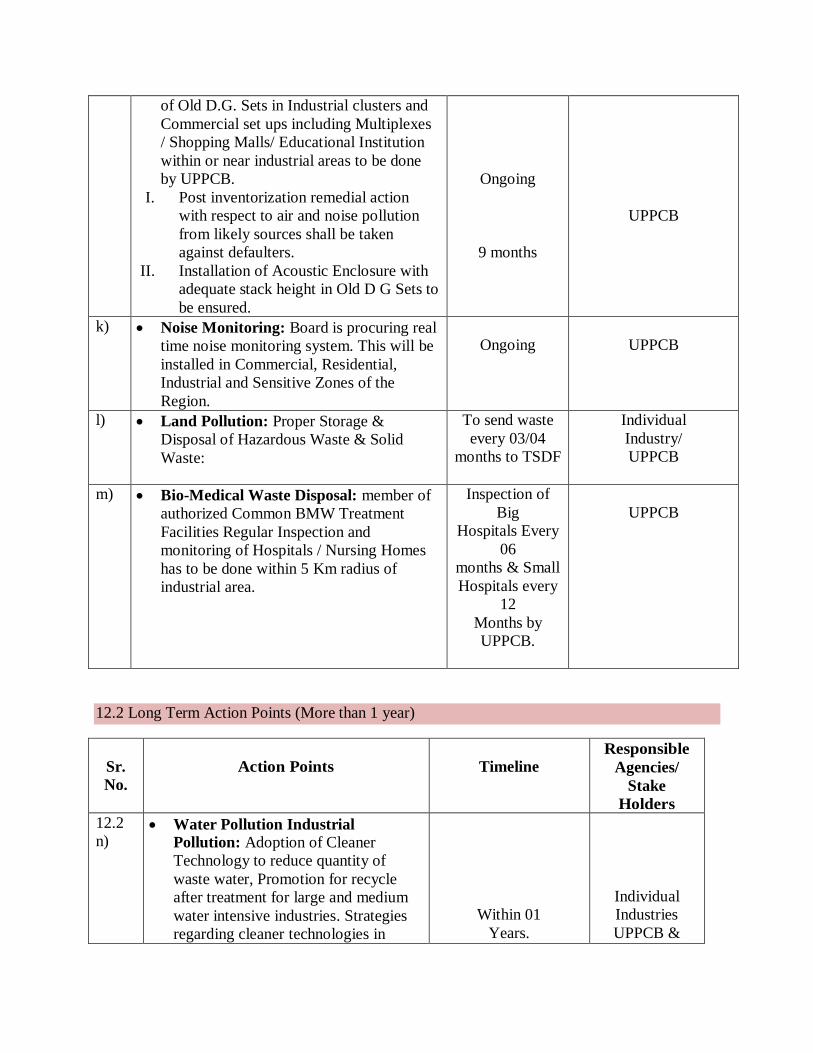
of Old D.G. Sets in Industrial clusters and
Commercial set ups including Multiplexes
/ Shopping Malls/ Educational Institution
within or near industrial areas to be done
by UPPCB.
I. Post inventorization remedial action
with respect to air and noise pollution
from likely sources shall be taken
against defaulters.
II. Installation of Acoustic Enclosure with
adequate stack height in Old D G Sets to
be ensured.
Ongoing
9 months
UPPCB
k) Noise Monitoring: Board is procuring real
time noise monitoring system. This will be
installed in Commercial, Residential,
Industrial and Sensitive Zones of the
Region.
Ongoing
UPPCB
l)
Land Pollution: Proper Storage &
Disposal of Hazardous Waste & Solid
Waste:
To send waste
every 03/04
months to TSDF
Individual
Industry/
UPPCB
m) Bio-Medical Waste Disposal: member of
authorized Common BMW Treatment
Facilities Regular Inspection and
monitoring of Hospitals / Nursing Homes
has to be done within 5 Km radius of
industrial area.
Inspection of
Big
Hospitals Every
06
months & Small
Hospitals every
12
Months by
UPPCB.
UPPCB
12.2 Long Term Action Points (More than 1 year)
Sr.
No.
Action Points
Timeline
Responsible
Agencies/
Stake
Holders
12.2
n) Water Pollution Industrial
Pollution: Adoption of Cleaner
Technology to reduce quantity of
waste water, Promotion for recycle
after treatment for large and medium
water intensive industries. Strategies
regarding cleaner technologies in
Within 01
Years.
Individual
Industries
UPPCB &
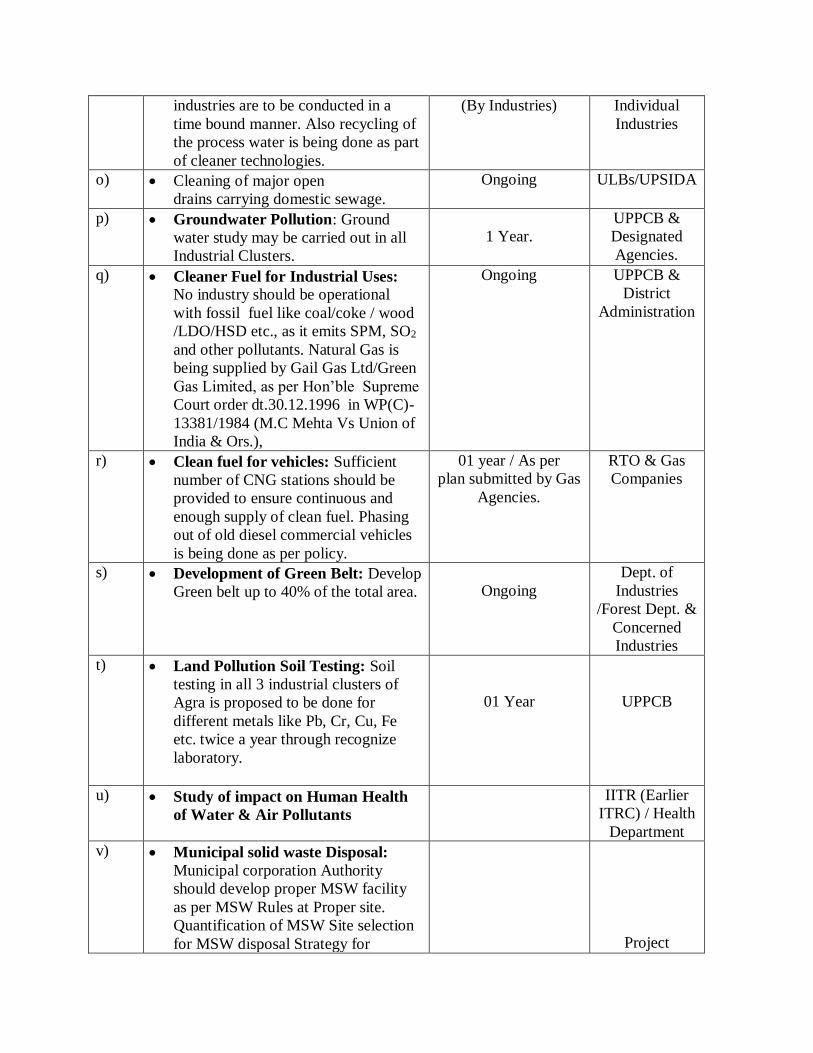
industries are to be conducted in a
time bound manner. Also recycling of
the process water is being done as part
of cleaner technologies.
(By Industries) Individual
Industries
o) Cleaning of major open
drains carrying domestic sewage.
Ongoing ULBs/UPSIDA
p) Groundwater Pollution: Ground
water study may be carried out in all
Industrial Clusters.
1 Year.
UPPCB &
Designated
Agencies.
q) Cleaner Fuel for Industrial Uses:
No industry should be operational
with fossil fuel like coal/coke / wood
/LDO/HSD etc., as it emits SPM, SO2
and other pollutants. Natural Gas is
being supplied by Gail Gas Ltd/Green
Gas Limited, as per Hon’ble Supreme
Court order dt.30.12.1996 in WP(C)-
13381/1984 (M.C Mehta Vs Union of
India & Ors.),
Ongoing UPPCB &
District
Administration
r) Clean fuel for vehicles: Sufficient
number of CNG stations should be
provided to ensure continuous and
enough supply of clean fuel. Phasing
out of old diesel commercial vehicles
is being done as per policy.
01 year / As per
plan submitted by Gas
Agencies.
RTO & Gas
Companies
s) Development of Green Belt: Develop
Green belt up to 40% of the total area.
Ongoing
Dept. of
Industries
/Forest Dept. &
Concerned
Industries
t) Land Pollution Soil Testing: Soil
testing in all 3 industrial clusters of
Agra is proposed to be done for
different metals like Pb, Cr, Cu, Fe
etc. twice a year through recognize
laboratory.
01 Year
UPPCB
u) Study of impact on Human Health
of Water & Air Pollutants
IITR (Earlier
ITRC) / Health
Department
v) Municipal solid waste Disposal:
Municipal corporation Authority
should develop proper MSW facility
as per MSW Rules at Proper site.
Quantification of MSW Site selection
for MSW disposal Strategy for
Project
implementation / setting up of
integrated facility for MSW to be
decided in consultation with local
civic authority and implementation to
be done in time bound manner.
Upcoming High Rise Buildings,
Commercial Project, Educational
Institution, Multiplexes, Town ship &
Building Projects are major source of
Municipal Solid Waste. Such projects
must ensure setting up of in house
MSW disposal facilities like organic
waste convertor as per MSW Rules &
ensure compliance of the conditions of
the Environment Clearance and NOC
from PCB
Every 3 months
proponent to
give
compliance
report to
UPPCB.