a tactile visual library to support user experience storytelling
TRANSCRIPT

NordDesign 2014 August 27 – 29, 2014
Espoo, Finland
A Tactile Visual Library To Support User Experience Storytelling
Makayla Lewis1 & Lizzie Coles-Kemp2
1,2Possible Futures Lab, Information Security Group, Royal Holloway University of London
[email protected] [email protected]
Abstract This paper presents an adult visual narrative stimulus (tactile visual library) that supports the reduction of physical distance between the user-centred design practitioner (maker of the visual narrative artefact) and the user narrative. Two user experience storytelling sessions were conducted involving adult participants, within a community centre in the United Kingdom, who identified themselves as community centre workers or community centre users. A tactile visual library was used to support the production of current experience comic strips, a previously developed instrument that prompts adult visual narrative production. This paper discusses the design philosophy and role of the tactile visual library and presents the method developed to rigorously analyse, verify and display adult user narratives. Keywords: tactile visual library, current experience comic strips, participatory design and actual physical distance. 1 Introduction As humans we are hardwired to listen to and learn from narratives. As a result user-centred design (UCD) practitioners often use narratives in the development of experiences because it offers an alternative means of understanding users and or products under development. In this context, narratives allow for complex ideas to be represented simply and to a variety of people, which results in a greater communication of meaning. Our initial research [1] identified that visual narratives, specifically current experience comic strips (CECS), are a relatable visual form that enables user communities to share and empathize with others [34]. However CECS production follows a traditional UCD process, placing visual artefact production on the side of the UCD practitioner, thus creating actual physical distance between the storyteller and the UCD practitioner. To better support narrative production within a community, CECS production must be placed into the hands of the user (storyteller) thus ensuring that the depicted user and the situation are relatable. To do this, a participatory design approach [2] that considers visual and tactile methods was developed. This approach promotes communication between UCD practitioners and users using visual narrative stimuli (tactile visual library). 2 Background 2.1 Visual thinking Visual thinking (or non-verbal thought) is often described as seeing the world in a series of icons, symbols or pictures, and 60% of humans view the world in this way [3, 9]. Evidence of

visual thinking, in the form of engravings and drawings, was first discovered in 1994 in the Chauvet Cave, where elaborate cave art, created 35,000 years ago, depicted large wild animals [4]. Far from being primitive, the visual narratives were proficiently produced. In the 15th Century, Aztecs created the ‘Stone of the Sun’ where imagery of water and animals refer to the role of the Sun within Aztec belief and religion [5, 6]. Such examples from our past demonstrate that visual thinking is not a new concept but is hardwired into the fabric of being human. More recently (within the last few decades) visual thinking has been looked at within humanities education, specifically childhood expression and learning through the use of sketching and doodling within picture storybooks [6]. This expression allows the user to explore thoughts through abstract representations of beliefs, experiences, ideas and idea structures. For example adult visual thinkers, specifically those in the field of architecture, use sketches to translate ideas from designer to client [7, 37]. Such sketching can also be seen within UCD where practitioners explore system end-users using wireframes and storyboards etc. to express end-users to developers [11]. Thus visual thinking is often viewed as a valuable skill to obtain as it can offer cognitive power, performance and pleasure [7, 8, 9, 10]. 2.1.1 Visual language When faced with something new, humans will often look for something familiar [39]. Though there are instances where familiarity is not possible, we look for inspiration in the world we create [7]. For visual thinkers, such as UCD practitioners, this world contains metaphors (pictures) that are regularly called upon to understand and or express new experiences [7, 10, 11, 12, 14]. A visual language (library) is often developed that allows the visual thinker to visualize anything with minimal practice or experience. This language consists of twelve visual letters that are connected using devices and with practice the visual thinker will take a real-world leap from a limited word-only way of thinking to an all-inclusive visual view of their experiences and ideas, consequently crafting a visual narrative [7, 10, 12]. 2.1.2 Visual narratives Visual narratives offer visual thinkers a way to explore and reflect on their beliefs, experiences, ideas and idea structures [11, 12]. This form of expression is important. Grudin, J., & Pruitt, J. (2002) [12] and Pruitt, J., & Adlin, T. (2010) [13] believe stories are hardwired into all humans i.e. we create, listen to and learn from stories. As with visual thinking our ability to tell and share stories has been momentous. As discussed previously, early cave drawings offer us a glimpse at early visual narratives where humans recorded their experiences for others to see [4]. Similarly, Egyptian pharaohs commissioned expansive hieroglyphs to visually share religious beliefs and historic events with their citizens [15]. More recently the Quaker Tapestry, based on the Bayeux Tapestry [16], depict Quakerism from 17th century to the present day [17]. Such visual narratives offer us a glimpse into past worlds. However, in the last 15 years technology has dramatically altered the way we share our narratives. Narratives have become fragmented across different mass-media multimedia channels and delivered via ever-changing technologies [14]. UCD practitioners aim to bring together these narrative fragments to ensure the UCD goal is maintained whilst defining and understanding the user and or product under development [11, 12, 14]. This allows for articulation and preservation of a user’s view [32]. 2.2 Actual physical distance The role of physical distance within UCD is often discussed geographically e.g. remote user research and evaluation or managing dispersed teams [18]. It rarely considers the ‘actual’ physical distance between a) the user (storyteller) engagement with the approach, and b) the location in which visual narrative artefact is created. These issues can often result in a user
narrative that is driven by the goal of the UCD practitioner and not the user. Traditionally, UCD practitioners use qualitative methods, such as interviews, surveys and focus groups to understand users, returning to the lab to develop visual narrative artefacts (proxies of the real user [32]) such as low-to-medium fidelity sketches, personas, narrative scenarios and, more recently, storyboards and comic strips. Though these visual narrative artefacts are descriptive and widely accepted by the UCD community, their traditional development does not reduce actual physical distance. Specifically Muller (2003) [32 p. 27] puts forward two questions, “How can people speak for themselves if they are not even present? How can designers verify their knowledge of the user if the users are not available to discuss their needs?” Additionally Porter, J. (2010) [19 p. 1] suggests, as “the distance between the maker and user increases, so does the difficulty of designing a great user experience”. Porter, J. (2010) proposes that regular involved interaction between the UCD practitioner and user can reduce actual physical distance but does not offer a support tool. To better support the reduction of actual physical distance, from the perspective of visual narrative production, this work looks towards participatory design. 2.3 Participatory design Within participatory design (PD) the role of the UCD practitioner and the user blur and the user becomes a critical component of the design process. The participant contributes their ideas because they possess grassroots knowledge about specific experiences [2, 20, 21, 22]. In the case of this work we wanted the participants to control their level of engagement and creation of their visual narrative artefact thus reducing actual physical distance. To do this, we believe a cultural probe [21, 22] that supports visual narrative engagement and creation could be the answer. 2.3.1 Cultural probes Cultural probes are extremely popular self-documentary tools within PD [20, 21] as they provoke a highly visual approach, which as previously discussed are an inherent skill evident within humans [20, 21]. Gaver, B. et, al. (1999) [20] used cultural probes to explore adult users’ activities and attitudes concerning their wellbeing. The UCD practitioners interpreted the cultural probes in order to extract observations of specific interest, transforming appearing themes into visual (cartoon-like) narratives that were discussed with users. Though descriptive and participatory, we believe actual physical distance has not been reduced due to the different location in which the visual narrative artefact was created. A subsequent study by Sustar, H. (2013) [24] explored visual narratives where teenage users were asked to visualise, using a short storyboard, a typical situation of their daily life. Participants were provided with information about storyboards and prompted with a range of different contexts they could refer to. The teenage users created highly detailed scenarios that focused on emotion, specifically drawing faces e.g. happy, sad, angry etc. This work placed visual narrative artefact production on the side of the teenage users, reducing actual physical distance, although we question if this form of visual narrative artefact production would be successful with adult users due to their perceived visual illiteracy. 2.4 Visual illiteracy It is evident that adult visual narrative production is often difficult, to those outside the humanities, due to an inherent belief that visual thinking and production is something practiced when young and is hard to achieve because drawing is difficult. Brown, S. (2014) [7 p. 5] recalls, “I’ve seen children of all ages ooze doodles and drawings onto paper as if they were vines growing from their hands. They do this easily without prompting or training; it’s as natural as walking and talking. Then, without warning –and worse, without adults
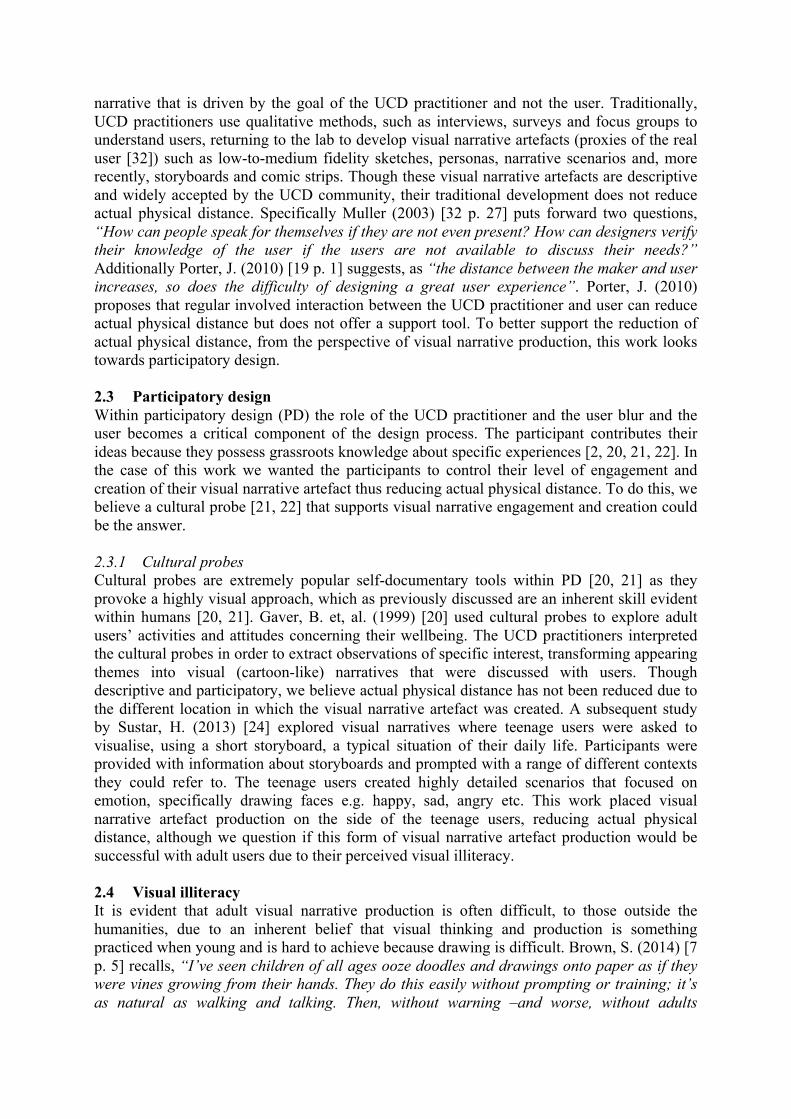
generally noticing or caring –they seem to lose their visual language capacity as they embrace numbers and letters. Out go their loose, easy sketches, and in come the supposedly “real” tools, the power tools of numbers and words that will likely dominate their attention for the rest of their lives.” To better support adult users to freely and confidently express their visual narratives [35], on a similar level as children, teenagers and humanities practitioners we put forward a cultural probe, hands-on adult visual narrative stimulus (tactile visual library). 3 Development 3.1 Setting the scene To develop the tactile visual library, a hands-on visual narrative stimulus that supports adult visual narrative production, a community-based participatory approach was used [32, 33]. The researchers approached a community centre (CC) in the United Kingdom to explore information sharing between people and people and organisations as part of the everyday. The CC provides resources and support for those who are unemployed and looking for employment, and those who need to claim welfare payments through the UK government’s on-line welfare system. A previously developed visual narrative tool, current experience comic strips (CECS) [1], was used to elicit adult CC workers and CC users visual narratives in an everyday information-sharing situation. It is widely believed that CECS can be easy to interpret by the viewer and are also remarkably rich and expressive whilst having a very standardised structure, which makes them a good tool for producing visual narratives and sharing the everyday [1, 25, 26, 27, 28, 34]. Specifically the TVL and CECS were used to explore the requirements for the local delivery of the centralised welfare service. 3.2 Tactile visual library A tactile visual library (TVL) consisting of 46 elements, drawing on the fundamentals of letters and devices [7, 10] and influenced by McCloud, S. (1993) [28] and Roam, D. (2009) [29] due to reader simplicity and recent appeal to UCD practitioners [40], was developed. The purpose of the TVL was to support adult CC workers and CC users to visualise their community centre and information sharing experiences. Therefore, the TVL was designed in a way that the CC workers and CC users could relate to. Specifically, initial on-site exploratory work (observations and focus groups) within the community centre [38] identified common physical objects e.g. computers, communication devices, catering (such as cups of tea and pots of soup), official forms and modes of travel and non-physical objects e.g. email and communication in the form of one-to-one and group discussion. The researchers developed simple, viewer-friendly, colourless line illustrations that conveyed these objects. Additionally blank emotionless faces to convey feelings, empty speech bubbles to allow thought to be expressed and a local map to support modes of travel was also included [Figure 1].
Figure 1 Tactile visual library.
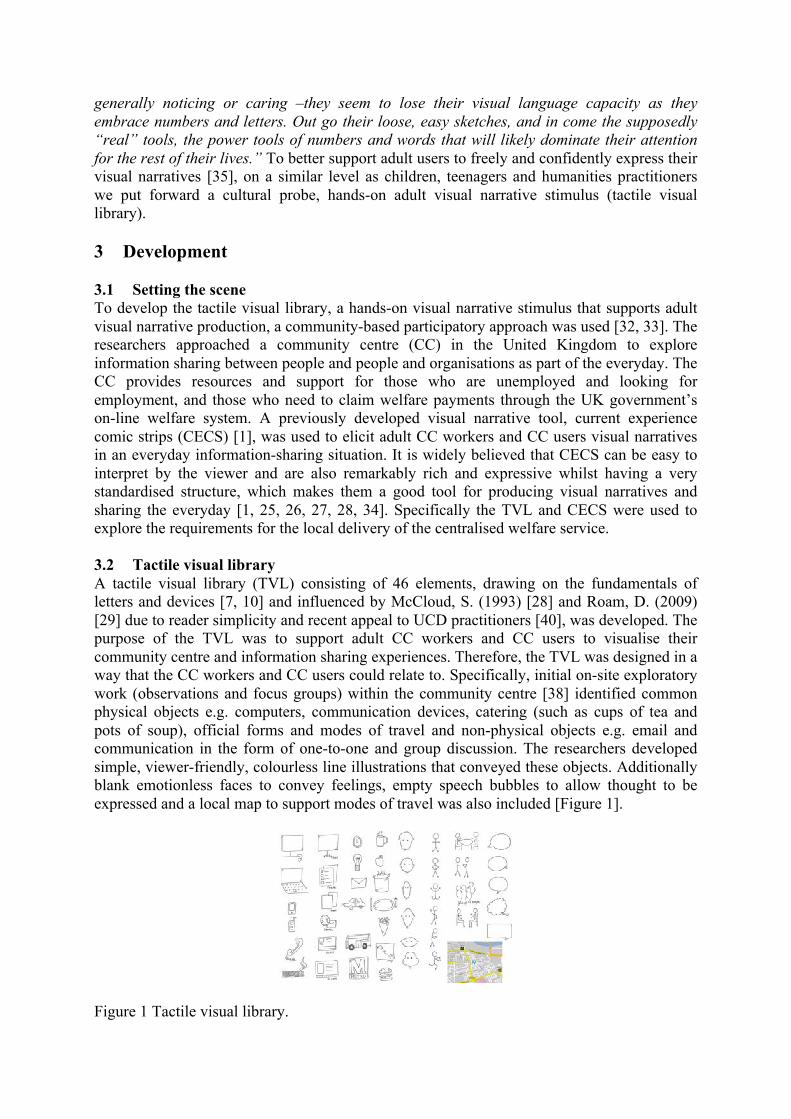
3.3 Participatory sessions Thirteen adult CC users (5 female and 3 male) and CC workers (5 female) took part in a user experience storytelling session. The participants were asked to create a CECS that focused on their identity, community centre experiences i.e. daily activities and interactions, and their attitudes towards information sharing with a view to better understand the design requirements for the local implementations of the on-line welfare system. The participants were provided with a blank CECS [Figure 2] containing a series of prompts in either a request for information ‘Who am I?’ or a question to answer ‘How did you feel when you arrived?’ together with the TVL. Participants were encouraged to refer to (copy) or use (cut out, alter, embellish and stick) the TVL to their blank CECS. Participants could also use coloured pens and markers, post-it notes, scissors and glue.
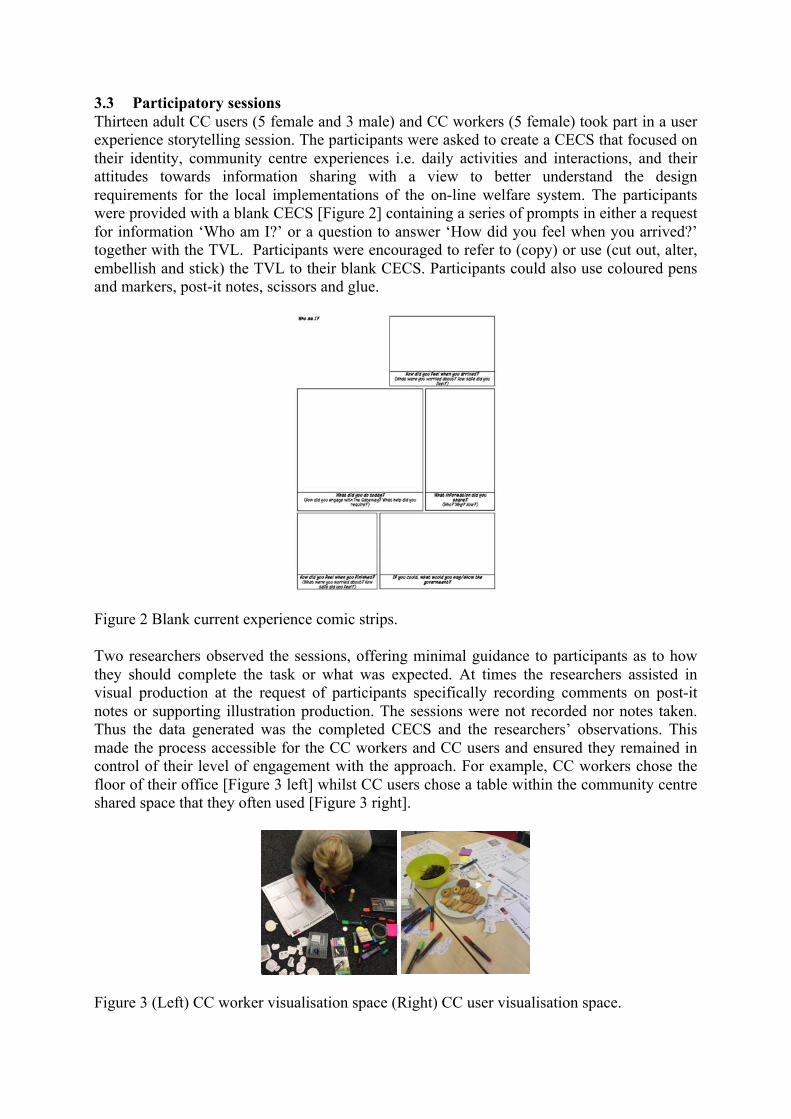
Figure 2 Blank current experience comic strips. Two researchers observed the sessions, offering minimal guidance to participants as to how they should complete the task or what was expected. At times the researchers assisted in visual production at the request of participants specifically recording comments on post-it notes or supporting illustration production. The sessions were not recorded nor notes taken. Thus the data generated was the completed CECS and the researchers’ observations. This made the process accessible for the CC workers and CC users and ensured they remained in control of their level of engagement with the approach. For example, CC workers chose the floor of their office [Figure 3 left] whilst CC users chose a table within the community centre shared space that they often used [Figure 3 right].
Figure 3 (Left) CC worker visualisation space (Right) CC user visualisation space.

The completed CECS were analysed inductively [30, 31]; the analysis was supported by qualitative analysis software [http://www.atlasti.com] where 1039 visual instances were identified and associated with 113 categories. The identified categories underwent a consistency check with an independent coder to determine category reliability. A category model based on the most important categories and visual instances was developed and used to shape the narrative of the findings.
4 Findings 4.1 Icebreaker The CC workers and CC users were initially asked to visualise themselves below the CECS prompt, “Who am I?” The purpose of the prompt was to act as an icebreaker and was used to welcome participants and warm up TVL engagement. The participants chose to visualise their response in differing ways. CC workers interacted with the TVL, specifically cutting out relevant illustrations, colouring them and including plain spotlight typography [Figure 4 left], whilst CC users focused on plain typography using the TVL and or post-it notes to spotlight important personal characteristics and or interests. For example, one CC user used plain typography to list interests, e.g. gardening and Sudoku, but used a TVL element to depict a love of cooking and drew beautifully, in a similar style to the TVL, a love for bird watching [Figure 4 right]. Participants spent upwards of 10 minutes visualising and openly and enthusiastically sharing with the researchers e.g. picking up their CECS and prompting the researcher to admire their work.
Figure 4 (Left) CC worker response to “Who am I?” (Right) CC user response to “Who am I?”
The style and level of TVL used at this early stage influenced the level of engagement throughout the participatory session. Additionally the visual responses to the icebreaker prompt revealed that TVL engagement is influenced by a) fellow participants, the level of TVL engagement was positively influenced if a participant was positioned next to an actively engaged participant, and b) gender, male participants were less likely to use the TVL choosing to use colourful typography due to a perceived belief of visual illiteracy. Furthermore the reduced physical distance between the female participants and the participatory method also influenced the male participants’ visual production.
4.2 Use of the tactile visual library To aid timing of the participatory sessions, some TVL elements were pre-cut from the TVL sheet. Surprisingly, the participants that used the TVL chose to review the pre-cut TVL elements and then cut them out themselves. The participants displayed different patterns of participatory engagement, though the process was designed in such a way that participants could engage in ways that felt most comfortable to them thus provoking greater participatory engagement and reducing actual physical distance. For example, female participants used more TVL elements than the males although there was one female participant who used
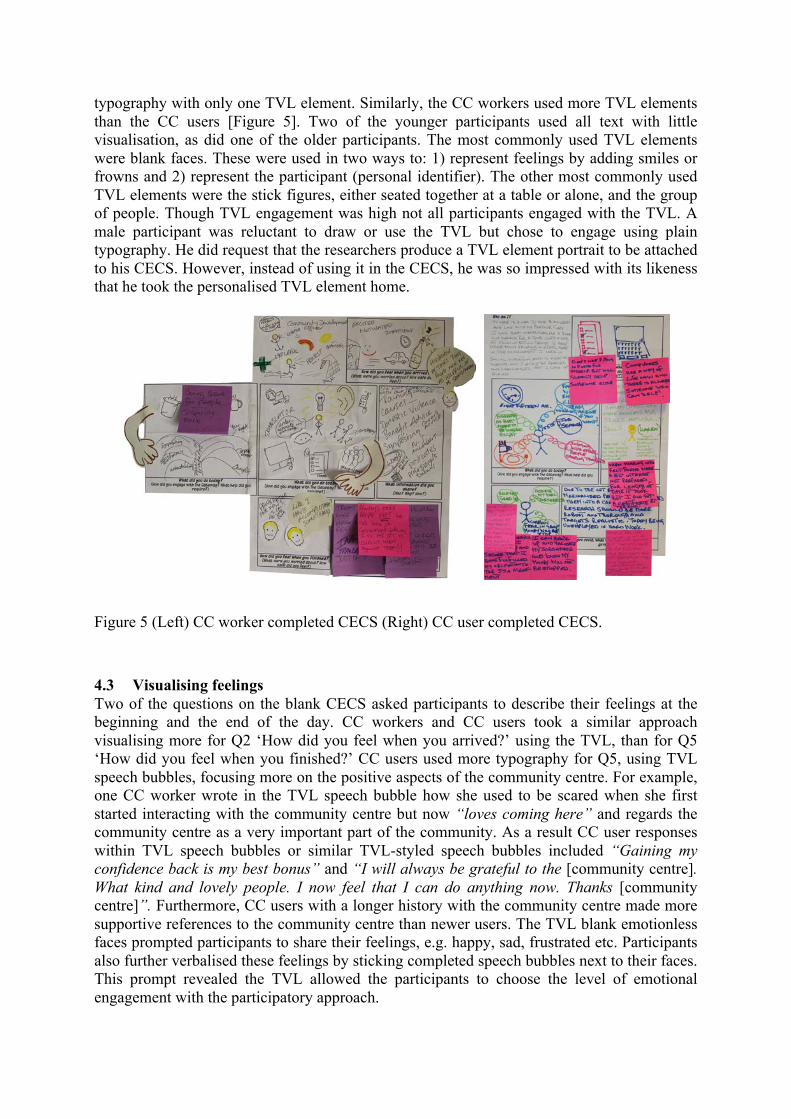
typography with only one TVL element. Similarly, the CC workers used more TVL elements than the CC users [Figure 5]. Two of the younger participants used all text with little visualisation, as did one of the older participants. The most commonly used TVL elements were blank faces. These were used in two ways to: 1) represent feelings by adding smiles or frowns and 2) represent the participant (personal identifier). The other most commonly used TVL elements were the stick figures, either seated together at a table or alone, and the group of people. Though TVL engagement was high not all participants engaged with the TVL. A male participant was reluctant to draw or use the TVL but chose to engage using plain typography. He did request that the researchers produce a TVL element portrait to be attached to his CECS. However, instead of using it in the CECS, he was so impressed with its likeness that he took the personalised TVL element home.
Figure 5 (Left) CC worker completed CECS (Right) CC user completed CECS.
4.3 Visualising feelings Two of the questions on the blank CECS asked participants to describe their feelings at the beginning and the end of the day. CC workers and CC users took a similar approach visualising more for Q2 ‘How did you feel when you arrived?’ using the TVL, than for Q5 ‘How did you feel when you finished?’ CC users used more typography for Q5, using TVL speech bubbles, focusing more on the positive aspects of the community centre. For example, one CC worker wrote in the TVL speech bubble how she used to be scared when she first started interacting with the community centre but now “loves coming here” and regards the community centre as a very important part of the community. As a result CC user responses within TVL speech bubbles or similar TVL-styled speech bubbles included “Gaining my confidence back is my best bonus” and “I will always be grateful to the [community centre]. What kind and lovely people. I now feel that I can do anything now. Thanks [community centre]”. Furthermore, CC users with a longer history with the community centre made more supportive references to the community centre than newer users. The TVL blank emotionless faces prompted participants to share their feelings, e.g. happy, sad, frustrated etc. Participants also further verbalised these feelings by sticking completed speech bubbles next to their faces. This prompt revealed the TVL allowed the participants to choose the level of emotional engagement with the participatory approach.
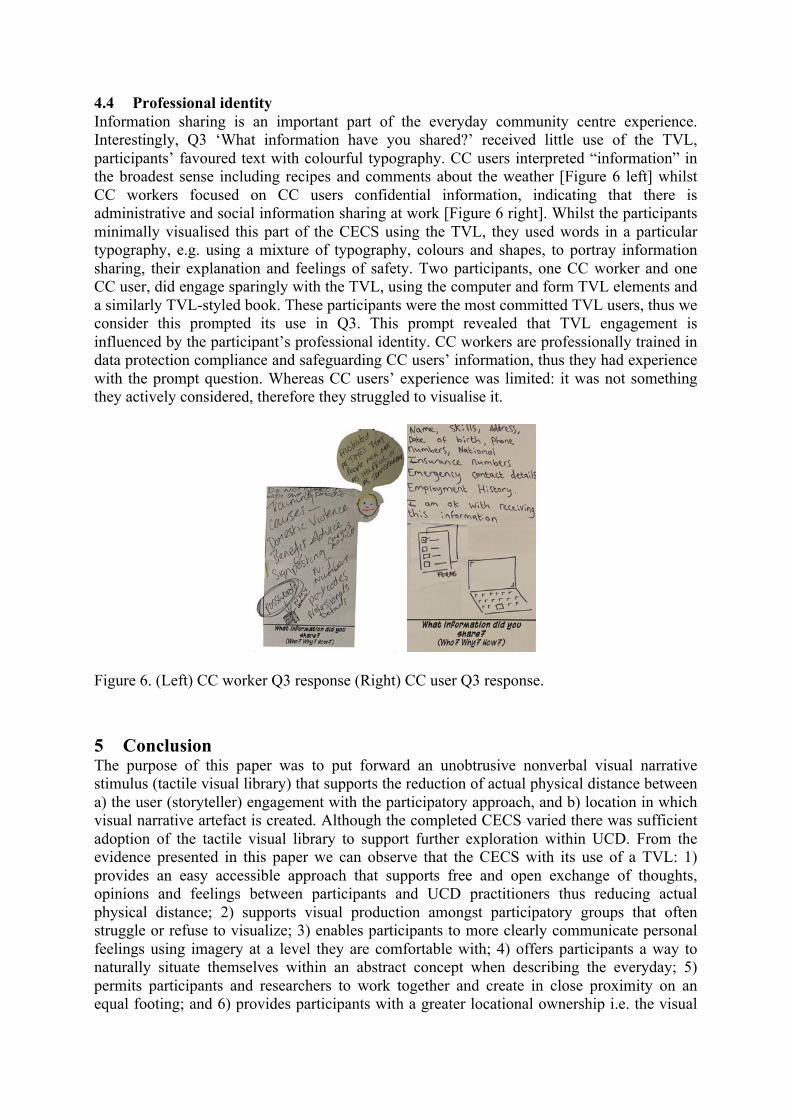
4.4 Professional identity Information sharing is an important part of the everyday community centre experience. Interestingly, Q3 ‘What information have you shared?’ received little use of the TVL, participants’ favoured text with colourful typography. CC users interpreted “information” in the broadest sense including recipes and comments about the weather [Figure 6 left] whilst CC workers focused on CC users confidential information, indicating that there is administrative and social information sharing at work [Figure 6 right]. Whilst the participants minimally visualised this part of the CECS using the TVL, they used words in a particular typography, e.g. using a mixture of typography, colours and shapes, to portray information sharing, their explanation and feelings of safety. Two participants, one CC worker and one CC user, did engage sparingly with the TVL, using the computer and form TVL elements and a similarly TVL-styled book. These participants were the most committed TVL users, thus we consider this prompted its use in Q3. This prompt revealed that TVL engagement is influenced by the participant’s professional identity. CC workers are professionally trained in data protection compliance and safeguarding CC users’ information, thus they had experience with the prompt question. Whereas CC users’ experience was limited: it was not something they actively considered, therefore they struggled to visualise it.
Figure 6. (Left) CC worker Q3 response (Right) CC user Q3 response.
5 Conclusion The purpose of this paper was to put forward an unobtrusive nonverbal visual narrative stimulus (tactile visual library) that supports the reduction of actual physical distance between a) the user (storyteller) engagement with the participatory approach, and b) location in which visual narrative artefact is created. Although the completed CECS varied there was sufficient adoption of the tactile visual library to support further exploration within UCD. From the evidence presented in this paper we can observe that the CECS with its use of a TVL: 1) provides an easy accessible approach that supports free and open exchange of thoughts, opinions and feelings between participants and UCD practitioners thus reducing actual physical distance; 2) supports visual production amongst participatory groups that often struggle or refuse to visualize; 3) enables participants to more clearly communicate personal feelings using imagery at a level they are comfortable with; 4) offers participants a way to naturally situate themselves within an abstract concept when describing the everyday; 5) permits participants and researchers to work together and create in close proximity on an equal footing; and 6) provides participants with a greater locational ownership i.e. the visual

narrative artefact production is initiated by the user (storyteller) ensuring the UCD practitioner’s proxies of the user are more relatable thus reducing actual physical distance. 6 Acknowledgement This work was funded under grant number EP/K006266/1. 7 References [1] Lewis, M. and Coles-Kemp, L. (2014) Who says personas can't dance? The use of
comic strips to design information security personas. In CHI '14 Extended Abstracts on Human Factors in Computing Systems (CHI'14). ACM, New York, (pp. 2485-2490).
[2] Vines, J., Clarke, R., Wright, P., McCarthy, J., & Olivier, P. (2013) configuring participation: on how we involve people in design. In Proceedings of the SIGCHI Conference on Human Factors in Computing Systems (CHI '13). ACM, New York, (pp. 429-438).
[3] Deza and Deza (2009) Encyclopedia of Distances. Springer, New York. [4] Clottes, J. (2002) "Chauvet Cave (ca. 30,000 B.C.)". In Heilbrunn Timeline of Art
History. New York: The Metropolitan Museum of Art, 2000. [Accessed 10 May 2014] http://www.metmuseum.org/toah/hd/chav/hd_chav.htm
[5] American Museum of Natural History (Date Unknown) Aztec’s Stone of the Sun. [Accessed 10 May 2014] http://www.amnh.org/exhibitions/permanent-exhibitions/human-origins-and-cultural-halls/hall-of-mexico-and-central-america/aztec-stone-of-the-sun
[6] Carney, R. N., & Levin, J. R. (2002). Pictorial illustrations still improve students' learning from text. Educational psychology review, 14(1), (pp. 5-26).
[7] Brown, S (2014) The Doodle Revolution: Unlock the Power to Think Differently. Portfolio Penguin
[8] Reilly, J.M., Ring, J., and Duke, L. (2005) Visual thinking strategies: a new role for art in medical education. Fam Med 37.4. (pp. 250-2).
[9] Ware, C. (2005) Visual Queries: The Foundation of Visual Thinking. Knowledge and Information Visualization. Springer-Verlag Berlin Heidelberg. 3426, (pp. 27-35).
[10] Rohde, M. (2012) The Sketchnote Handbook: The Illustrated Guide to Visual Notetaking. Peachpit Press
[11] Buxton, B (2007) Sketching User Experiences: Getting the Design Right and the Right Design. Morgan Kaufmann.
[12] Grudin, J., & Pruitt, J. (2002). Personas, participatory design and product development: An infrastructure for engagement. PDC
[13] Pruitt, J., & Adlin, T. (2010). The persona lifecycle: keeping people in mind throughout product design. Morgan Kaufmann.
[14] Inchauste, F. (2010) Better user experience with storytelling [Accessed 10 May 2014] http://bit.ly/1gwGP7d
[15] Encyclopedia Britannica (Date Unknown) Hieroglyphic writing [Accessed 10 May 2014] http://www.britannica.com/EBchecked/topic/265021/hieroglyphic-writing
[16] Bayeux Tapestry (Date Unknown) Tapestry or embroidery [Accessed 10 May 2014] http://www.tapestry-bayeux.com/
[17] The Quaker Tapestry Kendall Cumbria (Date Unknown) About [Accessed 10 May 2014] http://www.quaker-tapestry.co.uk/
[18] Safai, B (2006) Overcoming Distance in User-Centered Design. Master of Science Thesis, Stockholm.
[19] Porter, J. (2010) The distance between the maker and the user [Accessed 10 May
2014] http://52weeksofux.com/post/800723783/the-distance-between-maker-and-user [20] Gaver, B., Dunne, T., & Pacenti, E. (1999). Design: cultural probes. Interactions, 6(1),
(pp. 21-29). [21] Mattelmäki, T. (2006) Design Probes. The University of Art and Design, Helsinki. [22] Simonsen, J and Robertson, T (2013) Routledge International Handbook of
Participatory Design, Routledge. [23] Mazzone, E., Read, J. C., & Beale, R. (2008) Design with and for disaffected
teenagers. In Proceedings of the 5th Nordic conference on Human-computer interaction: building bridges (pp. 290-297).
[24] Sustar, H. (2013) Using popular culture to enable health service co-design with young people. Crafting the Future, Sweden.
[25] Chute, H. (2008). Comics as literature? Reading graphic narrative. PMLA, 123 (2), (pp. 452-465).
[26] Kindborg, M., & Kollerbaur, A. (1987). Visual Languages and HCI. BCS HCI, (pp. 175-187).
[27] Truong, K, et al. (2006) Storyboarding: an empirical determination of best practices and effective guidelines. Proceedings from Designing Interactive Systems.
[28] McCloud, S. (1993) Understanding comics: the invisible art. Harper Collins. [29] Roam, D. (2009). Unfolding the Napkin: The hands-on method for solving complex
problems with simple pictures. Penguin Books. [30] Thomas, D. R. (2006). A general inductive approach for analysing qualitative
evaluation data. American journal of evaluation, 27(2), (pp. 237-246) [31] Ball, M. S., & Smith, G. W. (1992) Analysing visual data (Vol. 24), Sage. [32] Muller, M. J. (2003) Participatory design: the third space in HCI. Human-computer
interaction: Development process, (pp. 165-185). [33] Shallwani, S., & Mohammed, S. (2007) Community-based participatory research: a
training manual for community-based researchers. Aga Khan University. [34] Lewis. M, Coles-Kemp, L. (2014) Are You Feeling It? The Use Of Comic Strips To
Encourage Empathy in Design. Extended Abstract for Workshop on Enabling Empathy in Health and Care: Design Methods and Challenges at CHI’14 Human Factors in Computing Systems, Toronto, Canada
[35] Bødker, K., Kensing, F., & Simonsen, J. (2004) Participatory IT design: designing for business and workplace realities. MIT press.
[36] Sanders, E. N. (2000) Generative tools for co-designing. In Collaborative design, Springer London, (pp. 3-12).
[37] Hester, R. Democratic Drawing: Techniques for Participatory Design. Reconstructing Communities.
[38] Coles-Kemp, L., Zugenmeier, A., and Lewis, M. (2014) Watching You Watching Me: The Art of Playing the Panopticon. DEF YEARBOOK 2014 Social Networks and Social Machines, Surveillance and Empowerment.
[39] B. Bingham, C., and Kahl, S. (2012) Analogies can help people make sense of technological change and other innovations. Using them effectively relies on recognizing both their benefits and pitfalls. [Accessed 20 July 2014] http://sloanreview.mit.edu/article/how-to-use-analogies-to-introduce-new-ideas/
[40] Cheng, K. (2012) See What I Mean How to Use Comics to Communicate Ideas. Rosenfeld Media.