evaluating the effectiveness of digital storytelling with panoramic images to facilitate experience...
TRANSCRIPT
J. Jacko (Ed.): Human-Computer Interaction, Part III, HCII 2007, LNCS 4552, pp. 981–989, 2007. © Springer-Verlag Berlin Heidelberg 2007
Evaluating the Effectiveness of Digital Storytelling with Panoramic Images to Facilitate Experience Sharing
Zuraidah Sulaiman1, Nor Laila Md Noor2, Narinderjit Singh1, and Suet Peng Yong1
1 Universiti Teknologi PETRONAS, Perak, Malaysia {zuraidahs,narinderjit,yongsuetpeng}@petronas.com.my
2 Universiti Teknologi MARA, Selangor, Malaysia [email protected]
Abstract. Technology advancement has now enabled experience sharing to happen in a digital storytelling environment that is facilitated through different delivery technologies such as panoramic images and virtual reality. However, panoramic images have not being fully explored and formally studied especially to assist experience sharing in digital storytelling setting. This research aims to study the effectiveness of an interactive digital storytelling to facilitate the sharing of experience. The interactive digital storytelling artifact was developed to convey the look and feel of Universiti Teknologi PETRONAS through the panoramic images. The effectiveness of digital storytelling through panoramic images was empirically tested based on the adapted Delone and McLean IS success model. The experiment was conducted on participants who have never visited the university. Six hypotheses were derived and experiment showed that there are correlations between user satisfaction of digital storytelling with panoramic images and user’s individual impact of the application to assist experience sharing among users. Hence, this research concludes a model on the production of an effective digital storytelling with panoramic images for specific experience sharing to bloom among users.
Keyword: Digital storytelling, interactivity, panoramic images, experience sharing, effective system, effectiveness study, human computer interaction.
1 Introduction
In the digital storytelling realm, many types of digital technology and media have long being the enabler for narrative entertainment to reach its audience. Traditional narrative form of storytelling is transformed into a more dynamic and powerful system of communication with sound, music, visuals, interactivity navigation and user-control mechanism [1], [2]. Digital storytelling can act as glue that holds things together when developers are about to offer users with all different kinds of information, media, types of images and ideas [3].
Indicators of effectiveness of a system or application include quality of solution and error rates. In this study, the quality of solution is used as a primary indicator of effectiveness to measure the outcome when users (students) interact with the digital
982 Z. Sulaiman et al.
storytelling with panoramic images application [4]. Our research, UTP-PanoView, is a system with an attempt of sharing information about the Universiti Teknologi PETRONAS using digital storytelling as the medium that utilizes Information Technology in views of multimedia and virtual reality. A systematic measure to study the effectiveness of a digital storytelling must start somewhere and this study aims to fulfill that call.
2 Literature Review
Panoramic (from the Greek pan means all and horama meaning see) are orientation-independent images that contain all the information needed to look around in 360 degrees. A number of these images can be connected or stitched together to form a walkthrough sequence. These orientation-independent images allow a greater degree of freedom in interactive viewing and navigation [5]. Experience refers to the nature of events that has been undergone by someone or something [6]. Humans have countless and unique ways that consist of expressions, behaviors, language and emotions to characterize and convey their moment-to-moment experiences. Hence, experience also is as an act that produces, create, and invent knowledge for effects upon the future. Interactive image sharing application nowadays [7], [8], enable users to feel like they are sharing experiences rather than just looking at pictures or sending and receiving messages with the images. With the availability of mechanisms such as MMS, online albums and moblogs, the experience sharing aspect remains problematic than the capture aspect. More fundamentally, experience sharing is highly relationship-specific.
Several measures have been examined by different prominent literatures to define the effectiveness of Information System applications. The diversity of the various measures from the previous research and empirical study on IS effectiveness was initially a cause for concern that lead DeLone and McLean to synthesize the measures into a unified model [9], [10], [11]. The DeLone and McLean’s (henceforth “D&M”) Model of IS Success has been regarded by many authors as a major contribution [12]. Realizing the fact that this model has been a great influence and inspiration to the succeeding research, D&M Model is adapted to suit digital storytelling application in our research. D&M Model is believed to be significant in evaluating the effectiveness of digital storytelling; which can also be considered as an Information System. The D&M model basically incorporated several of the already accepted and tested dimensions or constructs of IS Success into a single model.
3 Research Methodology
3.1 Research Model and Hypotheses
Although claims on the effectiveness of digital storytelling are often made, the current literature does not reflect work on the evaluation of the effectiveness digital storytelling [13]. In addition to that, there is a lack of formal guidelines or standard model on how to produce an effective digital storytelling for the purpose of
Evaluating the Effectiveness of Digital Storytelling with Panoramic Images 983
facilitating the experience sharing to bloom among users. Our work was driven by the following research questions:
• Do system quality, information quality and interactivity have any significant relationship with user satisfaction of digital storytelling with panoramic images?
• Will user satisfaction of digital storytelling with panoramic images lead to any individual impact to the user?
• Will user satisfaction and individual impact of digital storytelling with panoramic images encourage the sharing of experience to bloom in user?
The hypotheses formulated are as follows:
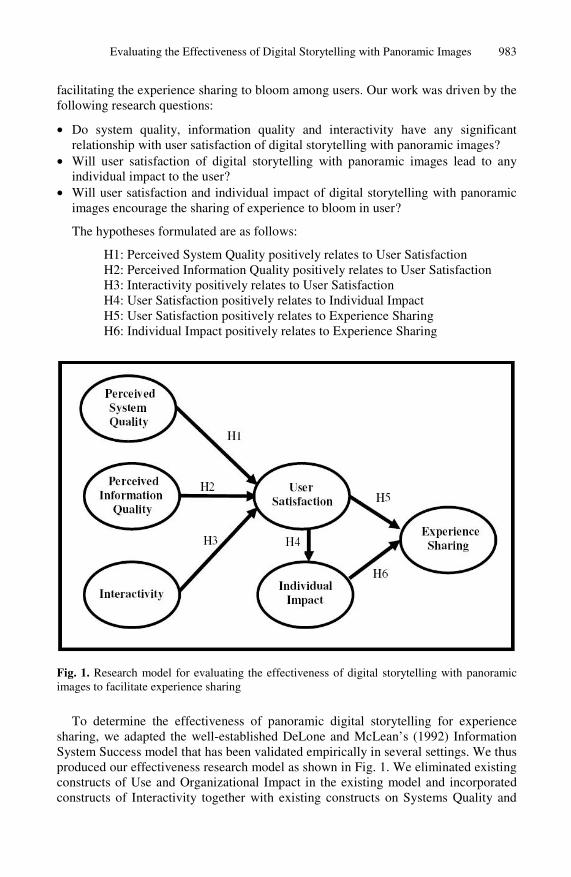
H1: Perceived System Quality positively relates to User Satisfaction H2: Perceived Information Quality positively relates to User Satisfaction H3: Interactivity positively relates to User Satisfaction H4: User Satisfaction positively relates to Individual Impact H5: User Satisfaction positively relates to Experience Sharing H6: Individual Impact positively relates to Experience Sharing
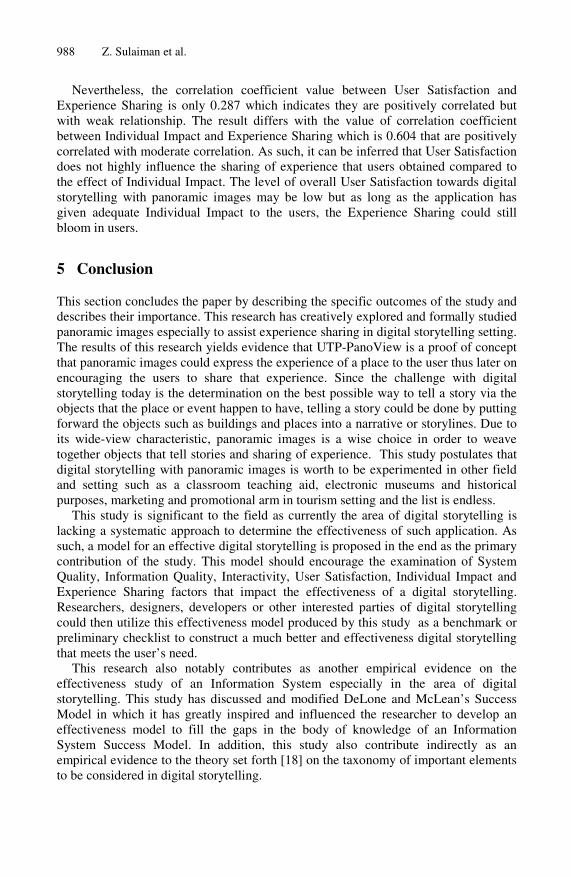
Fig. 1. Research model for evaluating the effectiveness of digital storytelling with panoramic images to facilitate experience sharing
To determine the effectiveness of panoramic digital storytelling for experience sharing, we adapted the well-established DeLone and McLean’s (1992) Information System Success model that has been validated empirically in several settings. We thus produced our effectiveness research model as shown in Fig. 1. We eliminated existing constructs of Use and Organizational Impact in the existing model and incorporated constructs of Interactivity together with existing constructs on Systems Quality and
984 Z. Sulaiman et al.
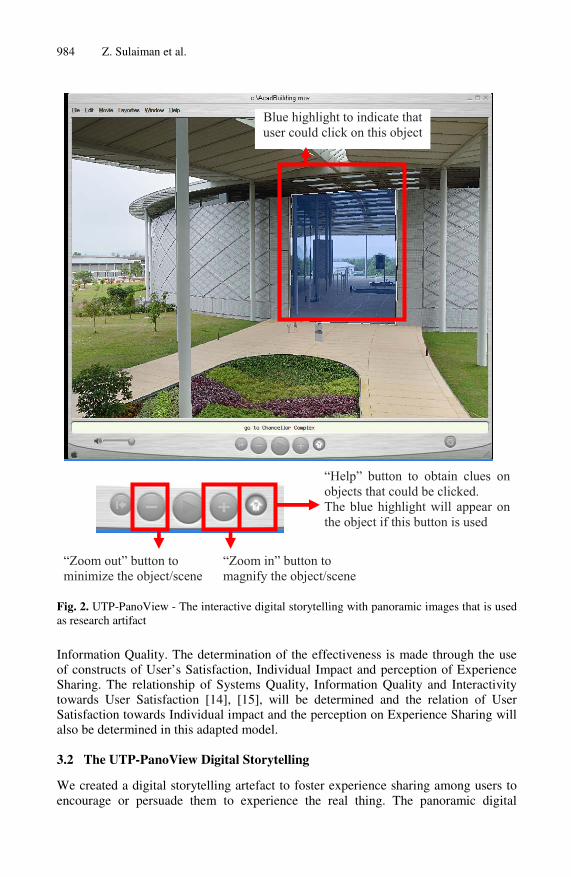
Blue highlight to indicate thatuser could click on this object
“Help” button to obtain clues onobjects that could be clicked.The blue highlight will appear onthe object if this button is used
“Zoom in” button tomagnify the object/scene
“Zoom out” button tominimize the object/scene
Fig. 2. UTP-PanoView - The interactive digital storytelling with panoramic images that is used as research artifact
Information Quality. The determination of the effectiveness is made through the use of constructs of User’s Satisfaction, Individual Impact and perception of Experience Sharing. The relationship of Systems Quality, Information Quality and Interactivity towards User Satisfaction [14], [15], will be determined and the relation of User Satisfaction towards Individual impact and the perception on Experience Sharing will also be determined in this adapted model.
3.2 The UTP-PanoView Digital Storytelling
We created a digital storytelling artefact to foster experience sharing among users to encourage or persuade them to experience the real thing. The panoramic digital
Evaluating the Effectiveness of Digital Storytelling with Panoramic Images 985
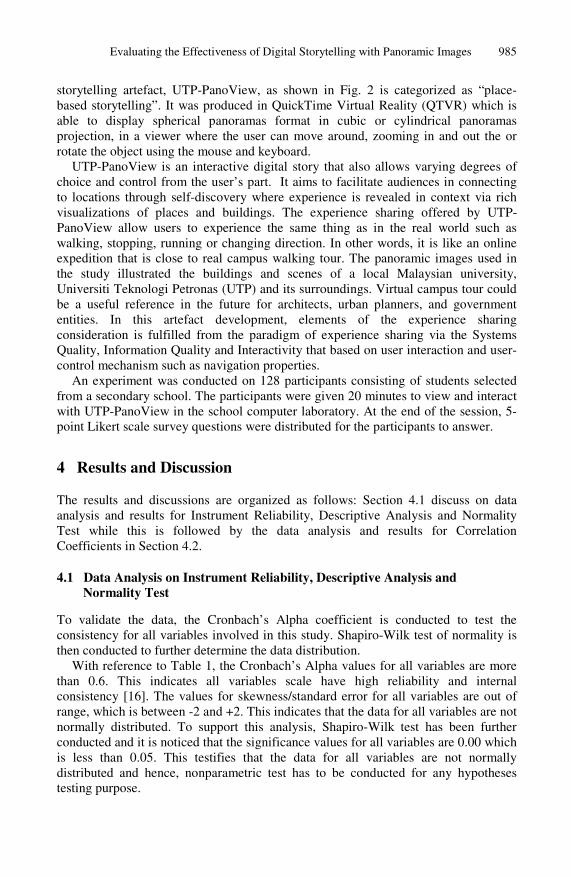
storytelling artefact, UTP-PanoView, as shown in Fig. 2 is categorized as “place-based storytelling”. It was produced in QuickTime Virtual Reality (QTVR) which is able to display spherical panoramas format in cubic or cylindrical panoramas projection, in a viewer where the user can move around, zooming in and out the or rotate the object using the mouse and keyboard.
UTP-PanoView is an interactive digital story that also allows varying degrees of choice and control from the user’s part. It aims to facilitate audiences in connecting to locations through self-discovery where experience is revealed in context via rich visualizations of places and buildings. The experience sharing offered by UTP-PanoView allow users to experience the same thing as in the real world such as walking, stopping, running or changing direction. In other words, it is like an online expedition that is close to real campus walking tour. The panoramic images used in the study illustrated the buildings and scenes of a local Malaysian university, Universiti Teknologi Petronas (UTP) and its surroundings. Virtual campus tour could be a useful reference in the future for architects, urban planners, and government entities. In this artefact development, elements of the experience sharing consideration is fulfilled from the paradigm of experience sharing via the Systems Quality, Information Quality and Interactivity that based on user interaction and user-control mechanism such as navigation properties.
An experiment was conducted on 128 participants consisting of students selected from a secondary school. The participants were given 20 minutes to view and interact with UTP-PanoView in the school computer laboratory. At the end of the session, 5-point Likert scale survey questions were distributed for the participants to answer.
4 Results and Discussion
The results and discussions are organized as follows: Section 4.1 discuss on data analysis and results for Instrument Reliability, Descriptive Analysis and Normality Test while this is followed by the data analysis and results for Correlation Coefficients in Section 4.2.
4.1 Data Analysis on Instrument Reliability, Descriptive Analysis and Normality Test
To validate the data, the Cronbach’s Alpha coefficient is conducted to test the consistency for all variables involved in this study. Shapiro-Wilk test of normality is then conducted to further determine the data distribution.
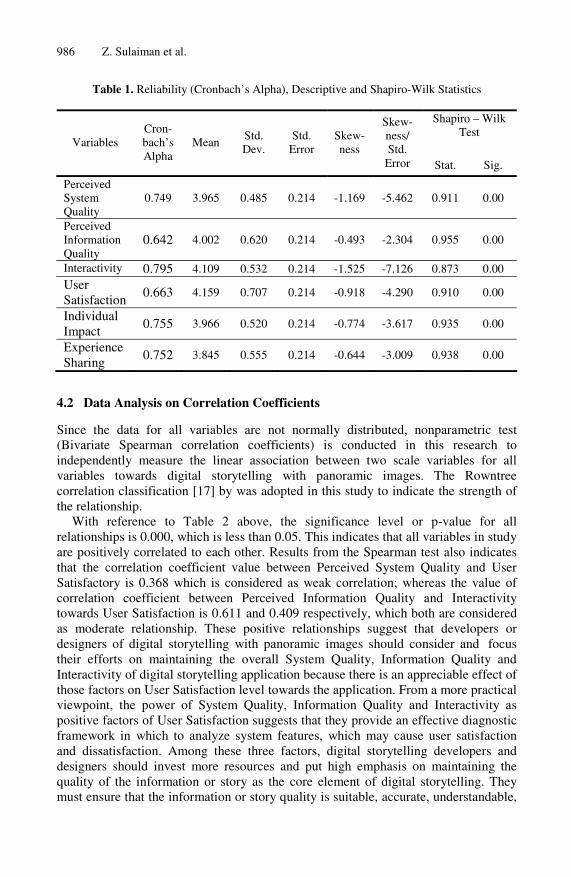
With reference to Table 1, the Cronbach’s Alpha values for all variables are more than 0.6. This indicates all variables scale have high reliability and internal consistency [16]. The values for skewness/standard error for all variables are out of range, which is between -2 and +2. This indicates that the data for all variables are not normally distributed. To support this analysis, Shapiro-Wilk test has been further conducted and it is noticed that the significance values for all variables are 0.00 which is less than 0.05. This testifies that the data for all variables are not normally distributed and hence, nonparametric test has to be conducted for any hypotheses testing purpose.
986 Z. Sulaiman et al.
Table 1. Reliability (Cronbach’s Alpha), Descriptive and Shapiro-Wilk Statistics
Shapiro – Wilk Test
Variables Cron-bach’s Alpha
Mean Std. Dev.
Std. Error
Skew-ness
Skew-ness/ Std.
Error Stat. Sig.
Perceived System Quality
0.749 3.965 0.485 0.214 -1.169 -5.462 0.911 0.00
Perceived Information Quality
0.642 4.002 0.620 0.214 -0.493 -2.304 0.955 0.00
Interactivity 0.795 4.109 0.532 0.214 -1.525 -7.126 0.873 0.00 User Satisfaction
0.663 4.159 0.707 0.214 -0.918 -4.290 0.910 0.00
Individual Impact
0.755 3.966 0.520 0.214 -0.774 -3.617 0.935 0.00
Experience Sharing
0.752 3.845 0.555 0.214 -0.644 -3.009 0.938 0.00
4.2 Data Analysis on Correlation Coefficients
Since the data for all variables are not normally distributed, nonparametric test (Bivariate Spearman correlation coefficients) is conducted in this research to independently measure the linear association between two scale variables for all variables towards digital storytelling with panoramic images. The Rowntree correlation classification [17] by was adopted in this study to indicate the strength of the relationship.
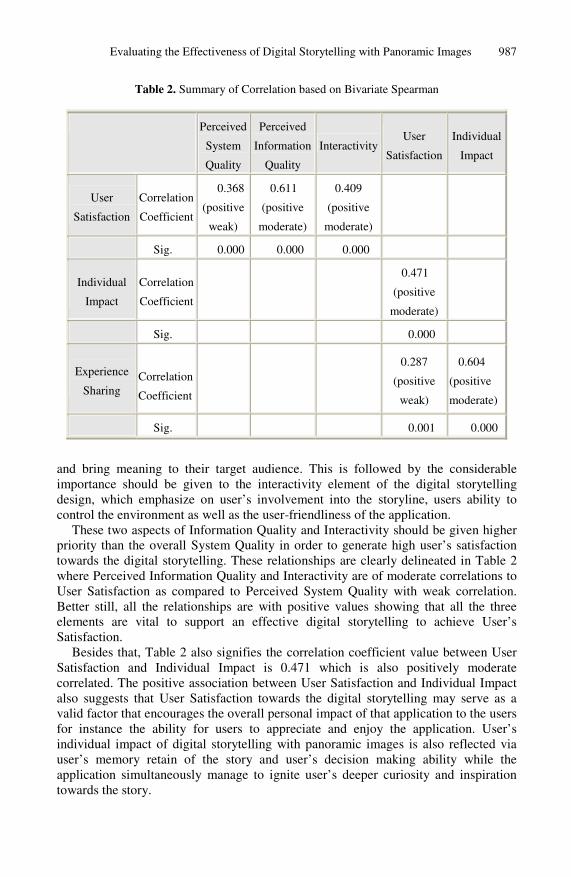
With reference to Table 2 above, the significance level or p-value for all relationships is 0.000, which is less than 0.05. This indicates that all variables in study are positively correlated to each other. Results from the Spearman test also indicates that the correlation coefficient value between Perceived System Quality and User Satisfactory is 0.368 which is considered as weak correlation; whereas the value of correlation coefficient between Perceived Information Quality and Interactivity towards User Satisfaction is 0.611 and 0.409 respectively, which both are considered as moderate relationship. These positive relationships suggest that developers or designers of digital storytelling with panoramic images should consider and focus their efforts on maintaining the overall System Quality, Information Quality and Interactivity of digital storytelling application because there is an appreciable effect of those factors on User Satisfaction level towards the application. From a more practical viewpoint, the power of System Quality, Information Quality and Interactivity as positive factors of User Satisfaction suggests that they provide an effective diagnostic framework in which to analyze system features, which may cause user satisfaction and dissatisfaction. Among these three factors, digital storytelling developers and designers should invest more resources and put high emphasis on maintaining the quality of the information or story as the core element of digital storytelling. They must ensure that the information or story quality is suitable, accurate, understandable,
Evaluating the Effectiveness of Digital Storytelling with Panoramic Images 987
Table 2. Summary of Correlation based on Bivariate Spearman
Perceived
System
Quality
Perceived
Information
Quality
InteractivityUser
Satisfaction
Individual
Impact
User
Satisfaction
Correlation
Coefficient
0.368
(positive
weak)
0.611
(positive
moderate)
0.409
(positive
moderate)
Sig. 0.000 0.000 0.000
Individual
Impact
Correlation
Coefficient
0.471
(positive
moderate)
Sig. 0.000
Experience
Sharing
Correlation
Coefficient
0.287
(positive
weak)
0.604
(positive
moderate)
Sig. 0.001 0.000
and bring meaning to their target audience. This is followed by the considerable importance should be given to the interactivity element of the digital storytelling design, which emphasize on user’s involvement into the storyline, users ability to control the environment as well as the user-friendliness of the application.
These two aspects of Information Quality and Interactivity should be given higher priority than the overall System Quality in order to generate high user’s satisfaction towards the digital storytelling. These relationships are clearly delineated in Table 2 where Perceived Information Quality and Interactivity are of moderate correlations to User Satisfaction as compared to Perceived System Quality with weak correlation. Better still, all the relationships are with positive values showing that all the three elements are vital to support an effective digital storytelling to achieve User’s Satisfaction.
Besides that, Table 2 also signifies the correlation coefficient value between User Satisfaction and Individual Impact is 0.471 which is also positively moderate correlated. The positive association between User Satisfaction and Individual Impact also suggests that User Satisfaction towards the digital storytelling may serve as a valid factor that encourages the overall personal impact of that application to the users for instance the ability for users to appreciate and enjoy the application. User’s individual impact of digital storytelling with panoramic images is also reflected via user’s memory retain of the story and user’s decision making ability while the application simultaneously manage to ignite user’s deeper curiosity and inspiration towards the story.
988 Z. Sulaiman et al.
Nevertheless, the correlation coefficient value between User Satisfaction and Experience Sharing is only 0.287 which indicates they are positively correlated but with weak relationship. The result differs with the value of correlation coefficient between Individual Impact and Experience Sharing which is 0.604 that are positively correlated with moderate correlation. As such, it can be inferred that User Satisfaction does not highly influence the sharing of experience that users obtained compared to the effect of Individual Impact. The level of overall User Satisfaction towards digital storytelling with panoramic images may be low but as long as the application has given adequate Individual Impact to the users, the Experience Sharing could still bloom in users.
5 Conclusion
This section concludes the paper by describing the specific outcomes of the study and describes their importance. This research has creatively explored and formally studied panoramic images especially to assist experience sharing in digital storytelling setting. The results of this research yields evidence that UTP-PanoView is a proof of concept that panoramic images could express the experience of a place to the user thus later on encouraging the users to share that experience. Since the challenge with digital storytelling today is the determination on the best possible way to tell a story via the objects that the place or event happen to have, telling a story could be done by putting forward the objects such as buildings and places into a narrative or storylines. Due to its wide-view characteristic, panoramic images is a wise choice in order to weave together objects that tell stories and sharing of experience. This study postulates that digital storytelling with panoramic images is worth to be experimented in other field and setting such as a classroom teaching aid, electronic museums and historical purposes, marketing and promotional arm in tourism setting and the list is endless.
This study is significant to the field as currently the area of digital storytelling is lacking a systematic approach to determine the effectiveness of such application. As such, a model for an effective digital storytelling is proposed in the end as the primary contribution of the study. This model should encourage the examination of System Quality, Information Quality, Interactivity, User Satisfaction, Individual Impact and Experience Sharing factors that impact the effectiveness of a digital storytelling. Researchers, designers, developers or other interested parties of digital storytelling could then utilize this effectiveness model produced by this study as a benchmark or preliminary checklist to construct a much better and effectiveness digital storytelling that meets the user’s need.
This research also notably contributes as another empirical evidence on the effectiveness study of an Information System especially in the area of digital storytelling. This study has discussed and modified DeLone and McLean’s Success Model in which it has greatly inspired and influenced the researcher to develop an effectiveness model to fill the gaps in the body of knowledge of an Information System Success Model. In addition, this study also contribute indirectly as an empirical evidence to the theory set forth [18] on the taxonomy of important elements to be considered in digital storytelling.
Evaluating the Effectiveness of Digital Storytelling with Panoramic Images 989
References
1. Miller, C.H.: Digital Storytelling: A Creator’s Guide to Interactive Entertainment. Focal Press Elsevier, Burlington, MA (2004)
2. Kannan, S.: Online Documentary. In Interactive Storytelling. In: Paper presented at the Proceedings of Web Designs for Interactive Learning Conference 2005, New York (2005)
3. Johnson, B.: The Second Story in Interactive Storytelling. In: Paper presented at the Proceedings of Web Designs for Interactive Learning Conference 2005, New York (2005)
4. Frokjaer, E., Herzum, M., Hornbaek, K.: Measuring Usability: Are Effectiveness, Efficiency, and Satisfaction Really Correlated? In: Paper presented at the Conference on Human Factors in Computing Systems, Hague, Netherlands (2000)
5. Chen, S.E.: QuickTime VR: An Image-Based Approach to Virtual Environment Navigation. In: Paper presented at the SIGGRAPH 1995, Los Angeles, CA (1995)
6. Neill, J.: What is Experience? (2006) Retrieved July 23, 2006, from http://wilderdom.com/experiential/ExperienceWhatIs.html
7. Aoki, P.M., Szymanski, M.H., Woodruff, A.: Turning From Image Sharing to Experience Sharing. In: Paper presented at the Ubicomp 2005 Workshop on Pervasive Image Capture and Sharing: New Social Practices and Implications for Technology, Tokyo (2005)
8. Balabanovic, M., Chu, L.L., Wolff, G.J.: Storytelling with Digital Photographs. In: Proc. CHI 2000, ACM, pp. 564–571 (2000)
9. DeLone, W.H., McLean, E.R.: Information System Success: The Quest for the Dependent Variable. Information Systems Research 3(1), 60–95 (1992)
10. DeLone, W.H., McLean, E.R.: Information Systems Success Revisited. In: Paper presented at the Proceedings of the 35th Hawaii International Conference on System Sciences (HICSS-35‘02), Hawaii (2002)
11. DeLone, W.H., McLean, E.R.: The DeLone and McLean Model of Information Systems Success: A Ten-Year Update. Journal of Management Information Systems 19(4), 9–30 (2003)
12. Molla, A., Licker, P.S.: E-Commerce Systems Success: An Attempt to Extend and Respecify the Delone and MaClean Model of IS Success. Journal of Electronic Commerce Research 2(4), 131–141 (2001)
13. Davenport, G., Murtaugh, M.: Automatist Storyteller Systems and The Shifting Sands of Story. IBM Systems Journal 36(3), 446–456 (1999)
14. Baroudi, J.J., Olson, M.H., Ives, B.: An Empirical Study of the Impact of User Involvement on System Usage and Information Satisfaction. Communication of the ACM 29(3), 232–238 (1986)
15. Ives, B., Olson, M.H., Baroudi, J.J.: The Measurement of User Information Satisfaction Communications of the ACM, 26(10), 785–793 (1983)
16. Sekaran, U.: Research Methods for Business: A Skill Building Approach, 2nd edn. Wiley, New York (1992)
17. Rowntree, D.: Statistics Without Tears: A Primer for Non-Mathematicians. Charles Scribner’s Sons, New York (1981)
18. Paul, N., Fiebich, C.: The Elements of Digital Storytelling. A project of the University of Minnesota School of Journalism and Mass Communication’s Institute for New Media Studies and New Directions for News (2002) Retrieved April 25, 2006, from http://www.inms.umn.edu/elements/