a study on cash flow analysis of nestle
TRANSCRIPT
PROJECT REPORT
On
A STUDY ON CASH FLOW ANALYSIS OF NESTLE
INDIA LTD.
BY
ABHISHEK S
(1NH19MBA03)
Submitted to
DEPARTMENT OF MANAGEMENT STUDIES
NEW HORIZON COLLEGE OF ENGINEERING,
OUTER RING ROAD, MARATHALLI,
BENGALURU
In partial fulfilment of the requirements for the award of the degree of
MASTER OF BUSINESS ADMINISTRATION
Under the guidance of
MR SANTOSH KUMAR
ASSISTANT PROFESSOR
2019 - 2021
CERTIFICATE
This is to certify that ABHISHEK S bearing USN 1NH19MBA03, is a bonafide
student of Master of Business Administration course of the Institute 2019-21,
autonomous program, affiliated to Visvesvaraya Technological University,
Belgaum. The project report on “A STUDY ON CASH FLOW ANALYSIS OF
NESTLE INDIA LTD.” is prepared by her under the guidance of Prof Santosh
Kumar in partial fulfilment of requirements for the award of the degree of Master
of Business Administration of Visvesvaraya Technological University, Belgaum
Karnataka.
Signature of Internal Guide Signature of HOD Signature of principal
Name of the Examiners with affiliation Signature with date
1. External Examiner
2. Internal Examiner
DECLARATION
I, ABHISHEK S hereby declare that the project report on “A STUDY ON CASH FLOW
ANALYSIS OF NESTLE INDIA LTD.” with reference to “ NESTLE INDIA LTD. ” prepared by
me under the guidance of Prof. SANTOSH KUMAR, faculty of M.B.A Department, New Horizon
College of Engineering.
I also declare that this project report is towards the partial fulfilment of the university
regulations for the award of the degree of Master of Business Administration by Visvesvaraya
Technological University, Belgaum.
I have undergone an industry project for a period of Twelve weeks. I further declare that this
report is based on the original study undertaken by me and has not been submitted for the award
of a degree/diploma from any other University / Institution.
Signature of Student
Place:
Date:

ACKNOWLEDGEMENT
The successful completion of the project would not have been possible without
the guidance and support of many people
I am thankful to my internal guide Prof Santosh Kumar, for his/her constant
support and inspiration throughout the project and invaluable suggestions,
guidance and also for providing valuable information.
Finally, I express my gratitude towards my parents and family for their
continuous support during the study.
ABHISHEK S
1NH19MBA03
5
Date : 15th July 2021
PROJECT WORK CERTIFICATE
This is to inform that Mr. ABHISHEK S bearing USN 1NH19MBA03 has successfully
completed freelance project work under the guidance of Prof. SANTOSH KUMAR
We found his extremely inquisitive and hard working. He has demonstrated active interest
in learning and was also willing to put in his best efforts. His performance on task assigned
was highly appreciated.
His association with me was very fruitful and I wish him best luck for his career ahead.
Sincerely,
(Internal Guide)
6
TABLE OF CONTENTS
SL. NUMBER CONTENTS PAGE NUMBERS
1
Executive summary
07
2
Chapter 1- Theoretical Background of The
Study
8-16
3
Chapter 2- Industry Profile &
Company Profile
17-27
4
Chapter 3- Research Methodology
28-32
5
Chapter 4- Data Analysis and Interpretation
33-72
6
Chapter 5 - Summary of Findings,
Suggestion and Conclusion
73-75
7
Bibliography
76
8
Annexure
7
EXECUTIVE SUMMARY:
Cash flow is the money that comes in and goes out of a company. It is the generation of income and the
payment of expenses. Cash inflows result from either the generation of revenue through the selling of
goods and services, money borrowed, or money earned through investments.
If more cash is coming into the company than leaving the company, you are experiencing positive cash
flow. But if more cash is leaving the company than coming into the company, then you are experiencing
negative cash flow. Keep in mind that just because you are experiencing negative cash flow for the
moment doesn't mean you are going to suffer a loss, because cash flow is dynamic. Cash flow is reported
on the company's cash flow statement, which is also called a statement of cash receipts and disbursements.
Cash flow statement helps to identify the sources from where cash inflows have arisen within a
particular period and also shows the various activities where in the cash was utilized.
Cash flow statement is significant to management for proper cash planning and maintaining a
proper matching between cash inflows and outflows.
Cash flow statement shows efficiency of a firm in generating cash inflows from its regular
operations.
Cash flow statement reports the amount of cash used during the period in various long-term
investing activities, such as purchase of fixed assets.
Nestlé India Limited is the Indian subsidiary of Nestle which is a Swiss multinational company. The
company is headquartered in Gurgaon, Haryana. The company's products
include food, beverages, chocolate, and confectioneries.
The company was incorporated on 28 March 1959 and was promoted by Nestle Alimentana S.A. via a
subsidiary, Nestle Holdings Ltd. As of 2020, the parent company Nestle owns 62.76% of Nestle India. The
company has 9 production facilities in various locations across India.
In the light of all above, I have undertaken a project on “A Study on Cash-flow analysis of NESTLE
INDIA LIMITED”. This is an effort to make an analysis and comparison on food processing sector
companies like nestle, Parle and heritage. I am undertaking a study based on cash flow analysis and ratio
analysis of the company through financial statements of the companies.
8
CHAPTER 1
THEORETICAL BACKGROUND OF THE STUDY
INTRODUCTION
Every big and small firms performs cash transactions. Cash transaction refers to cash inflows and
outflows. Cash inflows and outflows help to review success, failure of a firm and its ability to meet
maturing debts. Such review and evaluation are possible if the statement of cash flow is prepared.
Accounting standard Board (ASB) at international level in 1996 suggested every firm to publish the
statement of cash flow along with the final accounts. Since then the statement of cash flow is getting more
recognition than funds flow statement.
The statement that shows cash inflows and outflows of a firm for a specified period is called the cash flow
statement. Cash flow statement demonstrates where the cash has come during the period and what the firm
has done with the available cash. Therefore, cash flow statement shows a picture of cash movement
occurred in and out from a firm during a year in a summarized form. Cash flow statement gives a picture
of sources and applications of cash of a firm for a year.
DEFINITION:
“Cash Flow is the money that comes in and goes out of a company. It is the generation of income and the
payment of expenses. Cash inflows result from either the generation of revenue through the selling of
goods and services, money borrowed, or money earned through investments.”
If more cash is coming into the company than leaving the company, you are experiencing positive cash
flow. But if more cash is leaving the company than coming into the company, then you are experiencing
negative cash flow. Keep in mind that just because you are experiencing negative cash flow for the
moment doesn't mean you are going to suffer a loss, because cash flow is dynamic. Cash flow is reported
on the company’s cash flow statement, which is also called a statement of cash receipts and disbursements.
The cash flow statement was previously known as the flow of Cash statement. The cash flow statement
reflects a firm's liquidity.
The balance sheet is a snapshot of a firm's financial resources and obligations at a single point in time, and
the income statement summarizes a firm's financial transactions over an interval of time. These two
financial statements reflect the accrual basis accounting used by firms to match revenues with the expenses
associated with generating those revenues. The cash flow statement includes only inflows and outflows of
cash and cash equivalents; it excludes transactions that do not directly affect cash receipts and payments.
These non-cash transactions include depreciation or write-offs on bad debts or credit losses to name a few.
The cash flow statement is a cash basis report on three types of financial activities: operating activities,
investing activities, and financing activities. Non-cash activities are usually reported in footnotes.
9
Important definitions As per Accounting Standard -3 (revised)
‘Cash’ comprises cash in hand and demand deposits with banks.
‘Cash equivalents’ are short term highly liquid investments that are readily convertible into known amount
of cash and which are subject to an insignificant risk of changes in value. Examples of cash equivalents are
a) Treasury Bills
b) Commercial papers
c) Investment funds
d) Free Saving Account.
STRUCTURE OF CASH FLOW STATEMENT: The cash flow statement is distinct from the income
statement and balance sheet because it does not include the amount of future incoming and outgoing cash
that has been recorded on credit. Therefore, cash is not the same as net income which, on the income
statement and balance sheet, includes cash sales and sales made on credit.
Cash flow activities
The cash flow statement is partitioned into three segments, namely:
1. Cash flow resulting from operating activities;
2. Cash flow resulting from investing activities;
3. Cash flow resulting from financing activities.
The money coming into the business is called cash inflow, and money going out from the business is
called cash outflow.
Operating activities
Operating activities include the production, sales and delivery of the company's product as well as
collecting payment from its customers. This could include purchasing raw materials, building inventory,
advertising, and shipping the product.
Under IAS 7, operating cash flows include:
a. Receipts from the sale of goods or services
b. Receipts for the sale of loans, debt or equity instruments in a trading portfolio
c. Interest received on loans
d. Payments to suppliers for goods and services
e. Payments to employees or on behalf of employees
f. Interest payments (alternatively, this can be reported under financing activities in IAS 7)
g. Buying Merchandise
Items which are added back to [or subtracted from, as appropriate] the net income figure (which is found
on the Income Statement) to arrive at cash flows from operations generally include:
Depreciation (loss of tangible asset value over time)
10
Deferred tax
Amortization (loss of intangible asset value over time)
Any gains or losses associated with the sale of a non-current asset, because associated cash flows
do not belong in the operating section (unrealized gains/losses are also added back from the income
statement).
Dividends received
Revenue received from certain investing activities
Investing activities
These are the acquisition and disposal of long term assets such as land, building, plant machinery etc and
other investments not included in cash equivalents. Cash flow from investing activities represents the
extent to which expenditure has been made for resources intended to generate future income and cash
flows.
Examples of investing activities are
Purchase or Sale of an asset (assets can be land, building, equipment, marketable securities, etc.)
Loans made to suppliers or received from customers
Payments related to mergers and acquisition. Financing activities
Financing activities
Include the inflow of cash from investors such as banks and shareholders, as well as the outflow of cash to
shareholders as dividends as the company generates income. Other activities which impact the long-term
liabilities and equity of the company are also listed in the financing activities section of the cash flow
statement.
Under IAS 7,
a) Payments of dividends
b) Payments for repurchase of company shares
c) For non-profit organizations, receipts of donor-restricted cash that is limited to long-term purposes
Items under the financing activities section include:
a. Dividends paid
b. Sale or repurchase of the company's stock
c. Net borrowings
d. Payment of dividend tax
e. Repayment of debt principal, including capital leases.
11
CASH FLOW FROM OPERATING ACTIVITIES
Cash flows from operating activities can be calculated by two methods
a) Direct method b) Indirect method
a) Direct Method
The direct method for creating a cash flow statement reports major classes of gross cash receipts and
payments. Under IAS 7, dividends received may be reported under operating activities or under investing
activities. If taxes paid are directly linked to operating activities, they are reported under operating
activities; if the taxes are directly linked to investing activities or financing activities, they are reported
under investing or financing activities. Generally Accepted Accounting Principles (GAAP) vary from
International Financial Reporting Standards in that under GAAP rules, dividends received from a
company's investing activities is reported as an "operating activity," not an "investing activity.”
b) Indirect Method
The indirect method uses net-income as a starting point, makes adjustments for all transactions for non-
cash items, then adjusts from all cash-based transactions. An increase in an asset account is subtracted
from net income, and an increase in a liability account is added back to net income. This method converts
accrual-basis net income (or loss) into cash flow by using a series of additions and deductions.
1. Decrease in non-cash current assets are added to net income
2. Increase in non-cash current asset are subtracted from net income
3. Increase in current liabilities are added to net income
4. Decrease in current liabilities are subtracted from net income
5. Expenses with no cash outflows are added back to net income (depreciation and/or amortization expense
are the only operating items that have no effect on cash flows in the period)
6. Revenues with no cash inflows are subtracted from net income
7. Non-operating losses are added back to net income
8. Non-operating gains are subtracted from net income.
Rules (financing activities)
Finding the Cash Flows from Financing Activities is much more intuitive and needs little explanation.
Generally, the things to account for are financing activities:
a. Include as outflows, reductions of long term notes payable (as would represent the cash repayment of
debt on the balance sheet)
b. Or as inflows, the issuance of new notes payable
c. Include as outflows, all dividends paid by the entity to outside parties
d. Or as inflows, dividend payments received from outside parties
e. Include as outflows, the purchase of notes stocks or bonds
12
f. Or as inflows, the receipt of payments on such financing vehicles.
In the case of more advanced accounting situations, such as when dealing with subsidiaries, the accountant
must
a. Exclude intra-company dividend payments.
b. Exclude intra-company bond interest.
Main Difference between Direct and Indirect Method of SCF
The main difference between the direct method and the indirect method of presenting the statement of cash
flows (SCF) involves the cash flows from operating activities. (There are no differences in the cash flows
from investing activities and/or the cash flows from financing activities.)
EXAMPLE OF DIRECT METHOD
I. Cash Flow from Operating Activities (Direct Method/ Indirect Method)
II. Cash Flow from Investing Activities
III. Cash Flow from Financing Activities
Classification by activities provides information that allows users to assess the impact of those
activities on the financial position of the enterprise. This information also helps in evaluating the inter -
relationships between these activities.
Cash Flows from Operating Activities
Cash Flows from operating Activities are primarily derived from the Principal Revenue-producing
activities of the enterprise.
There are 2 methods of preparing the Cash Flows from Operating Activities:-
Direct Method
Indirect Method
1. Cash Flow from Operating Activity- Direct Method
Format for Computation of Cash Flows from Operating Activities as per Direct Method
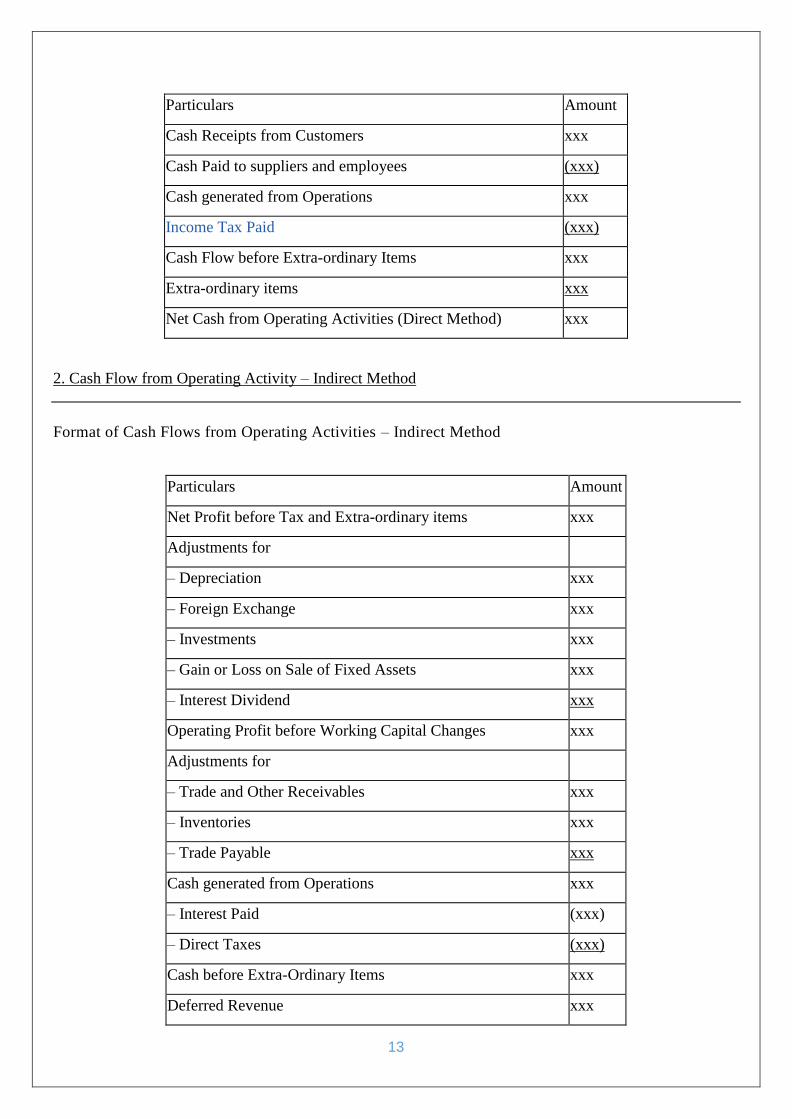
13
Particulars Amount
Cash Receipts from Customers xxx
Cash Paid to suppliers and employees (xxx)
Cash generated from Operations xxx
Income Tax Paid (xxx)
Cash Flow before Extra-ordinary Items xxx
Extra-ordinary items xxx
Net Cash from Operating Activities (Direct Method) xxx
2. Cash Flow from Operating Activity – Indirect Method
Format of Cash Flows from Operating Activities – Indirect Method
Particulars Amount
Net Profit before Tax and Extra-ordinary items xxx
Adjustments for
– Depreciation xxx
– Foreign Exchange xxx
– Investments xxx
– Gain or Loss on Sale of Fixed Assets xxx
– Interest Dividend xxx
Operating Profit before Working Capital Changes xxx
Adjustments for
– Trade and Other Receivables xxx
– Inventories xxx
– Trade Payable xxx
Cash generated from Operations xxx
– Interest Paid (xxx)
– Direct Taxes (xxx)
Cash before Extra-Ordinary Items xxx
Deferred Revenue xxx
14
Net Cash Flow from Operating Activities (Indirect Method) xxx
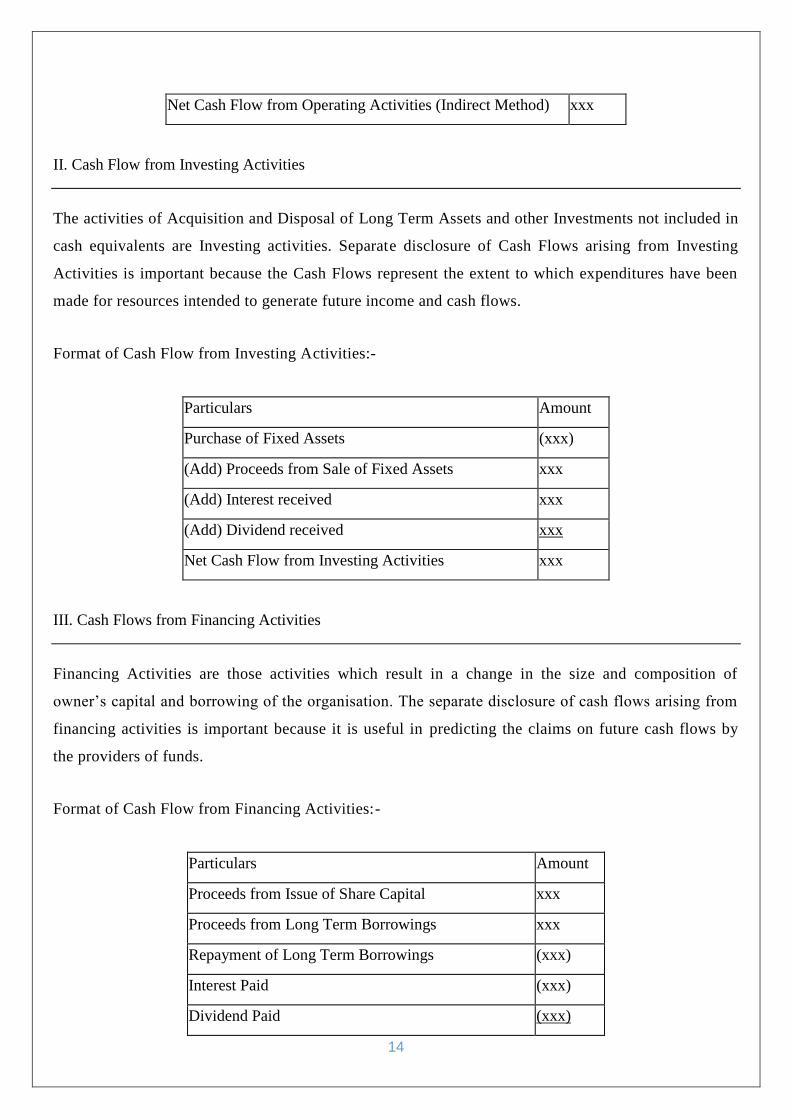
II. Cash Flow from Investing Activities
The activities of Acquisition and Disposal of Long Term Assets and other Investments not included in
cash equivalents are Investing activities. Separate disclosure of Cash Flows arising from Investing
Activities is important because the Cash Flows represent the extent to which expenditures have been
made for resources intended to generate future income and cash flows.
Format of Cash Flow from Investing Activities:-
Particulars Amount
Purchase of Fixed Assets (xxx)
(Add) Proceeds from Sale of Fixed Assets xxx
(Add) Interest received xxx
(Add) Dividend received xxx
Net Cash Flow from Investing Activities xxx
III. Cash Flows from Financing Activities
Financing Activities are those activities which result in a change in the size and composition of
owner’s capital and borrowing of the organisation. The separate disclosure of cash flows arising from
financing activities is important because it is useful in predicting the claims on future cash flows by
the providers of funds.
Format of Cash Flow from Financing Activities:-
Particulars Amount
Proceeds from Issue of Share Capital xxx
Proceeds from Long Term Borrowings xxx
Repayment of Long Term Borrowings (xxx)
Interest Paid (xxx)
Dividend Paid (xxx)
15
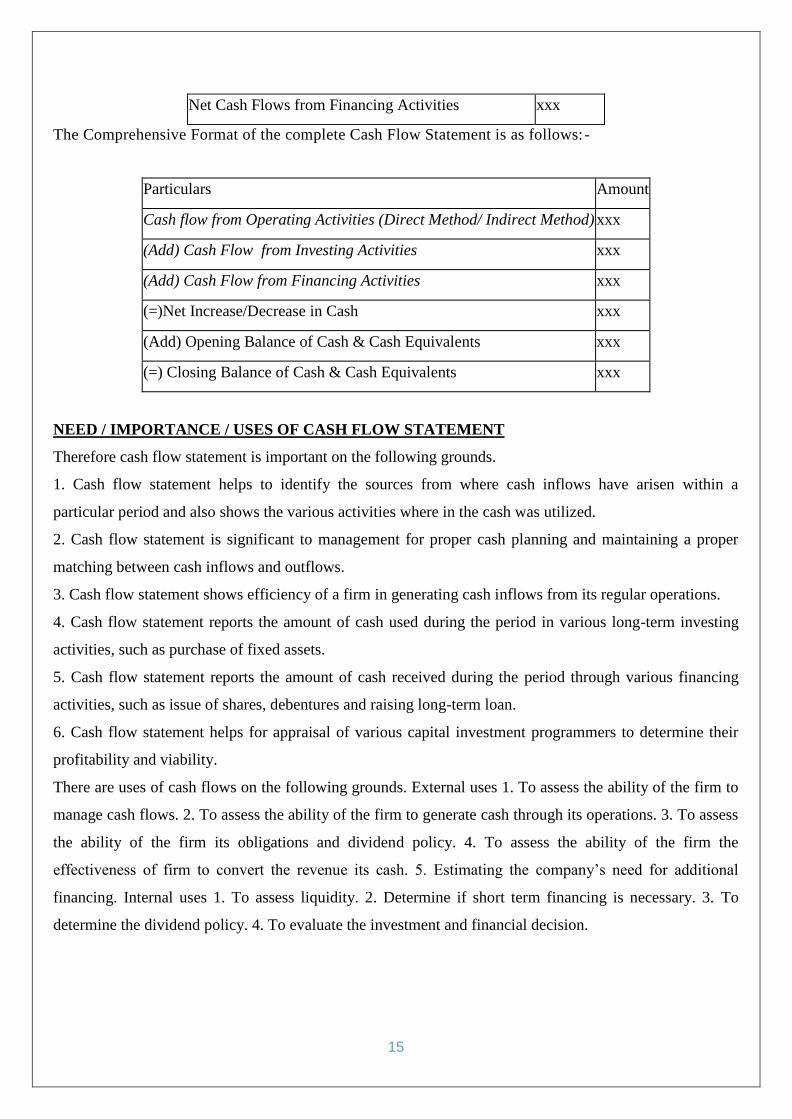
Net Cash Flows from Financing Activities xxx
The Comprehensive Format of the complete Cash Flow Statement is as follows:-
Particulars Amount
Cash flow from Operating Activities (Direct Method/ Indirect Method) xxx
(Add) Cash Flow from Investing Activities xxx
(Add) Cash Flow from Financing Activities xxx
(=)Net Increase/Decrease in Cash xxx
(Add) Opening Balance of Cash & Cash Equivalents xxx
(=) Closing Balance of Cash & Cash Equivalents xxx
NEED / IMPORTANCE / USES OF CASH FLOW STATEMENT
Therefore cash flow statement is important on the following grounds.
1. Cash flow statement helps to identify the sources from where cash inflows have arisen within a
particular period and also shows the various activities where in the cash was utilized.
2. Cash flow statement is significant to management for proper cash planning and maintaining a proper
matching between cash inflows and outflows.
3. Cash flow statement shows efficiency of a firm in generating cash inflows from its regular operations.
4. Cash flow statement reports the amount of cash used during the period in various long-term investing
activities, such as purchase of fixed assets.
5. Cash flow statement reports the amount of cash received during the period through various financing
activities, such as issue of shares, debentures and raising long-term loan.
6. Cash flow statement helps for appraisal of various capital investment programmers to determine their
profitability and viability.
There are uses of cash flows on the following grounds. External uses 1. To assess the ability of the firm to
manage cash flows. 2. To assess the ability of the firm to generate cash through its operations. 3. To assess
the ability of the firm its obligations and dividend policy. 4. To assess the ability of the firm the
effectiveness of firm to convert the revenue its cash. 5. Estimating the company’s need for additional
financing. Internal uses 1. To assess liquidity. 2. Determine if short term financing is necessary. 3. To
determine the dividend policy. 4. To evaluate the investment and financial decision.
16
OBJECTIVES OF CASH FLOW STATEMENT
To find the liquidity position of the Nestle. For the availability cash and utilization of the cash by
the organization.
It will help find to assess the company's ability to generate positive cash flows in the future
To assess its ability to meet its obligations to service loans, pay dividends etc.
To assess the effect on its finances of major transactions in the year.
To study the firms liquidity.
To learn about how company manage its cash & become such well recognized profitable industry
& if there is any problem arise then what steps taken by company.
17
CHAPTER 2
INDUSTRY PROFILE
Food processing sector is indispensable for the overall development of an economy as it provides a vital
linkage and synergy between the agriculture and industry. It helps to diversify and commercialise farming;
enhance income of farmers; create markets for export of agro foods as well as generate greater
employment opportunities. Through the presence of such industries, a wider range of food products could
be sold and distributed to the distant locations.
The term 'food processing' is mainly defined as a process of value addition to the agricultural or
horticultural produce by various methods like grading, sorting and packaging. In other words, it is a
technique of manufacturing and preserving food substances in an effective manner with a view to enhance
their shelf life; improve quality as well as make them functionally more useful. It covers spectrum of
products from sub-sectors comprising agriculture, horticulture, plantation, animal husbandry and fisheries.
Food processing industry is one of the largest industry in India and is ranked 5th in terms of production,
consumption and export. Earlier, food processing was largely confined to the food preservation, packaging
and transportation, which mainly involved salting, curdling, drying, pickling, etc. However, over the years,
with emerging new markets and technologies, the sector has widened its scope. It has started producing
many new items like ready-to-eat food, beverages, processed and frozen fruit and vegetable products,
marine and meat products, etc. It also includes establishment of post-harvest infrastructure for processing
of various food items like cold storage facilities, food parks, packaging centres, value added centres,
irradiation facilities and modernised abattoir.
Major Areas The sector comprises of the following major areas
Fruits & Vegetables Beverages, Juices, Concentrates, Pulps, Slices, Frozen & Dehydrated products,
Wine Potato Wafers/Chips etc.
Fisheries Frozen & Canned products mainly in fresh form
Meat & Poultry Frozen and packed mainly in fresh form, Egg Powder
Milk & Dairy Whole Milk Powder, Skimmed milk powder, Condensed milk, Ice cream, Butter and
Ghee
Grain and Cereals Flour, Bakeries, Biscuits, Starch Glucose, Cornflakes, Malted Foods, Vermicelli,
Pasta Foods, Beer and Malt extracts, Grain based Alcohol.
Consumer Industry Chocolates, Confectionery, Soft/Aerated Beverages/Drinks
Plantation Tea, coffee, cashew, cocoa, coconut etc
18
HISTORY OF FOOD PROCESSING
GLOBAL FOOD PROCESSING INDUSTRY
The Global Processed Food Industry is valued at US $ 3.2 trillion and accounts for over 3/4th of global
food sales. Despite the large size of the industry, only 6% of the processed food is traded the world over as
compared to bulk agricultural commodities where 16% of produce is traded. Growth of the sector has been
the highest in developed economies, especially across Western Europe, North America, Japan and
Australia. USA is the single largest consumer of processed food and accounts for 31% of global sales. The
food processing sector has seen substantial growth in developing economies with increase in GDP, per
capita income and the resultant changes in lifestyle. Organized retailing and availability of better
processing technologies too have contributed to the accelerated growth of the sector.
FOOD PROCESSING INDUSTRY IN INDIA
The Indian food processing industry stands at $135 billion and is estimated to grow with a CAGR of 10
per cent to reach $200 billion by 2015. The food processing industry contributed 7% to India‘s GDP. The
industry employs around 13 million workers directly and about 35 million indirectly.
The industry is segmented into sectors namely, milk and allied products (dairy), meat and poultry, seafood,
bakery and confectionery, fruit and vegetables, grain, pulses and oilseeds (staple) products, alcoholic and
non-alcoholic products (beverages), and packaged foods. The classification is not distinct as many
processed products overlap different segments.
India ranks No. 1 in the world in production of Milk (Fresh, whole, buffalo), Pulses, Ginger, Chick Peas,
Bananas Guavas, Papayas and Mangoes. Further, India ranks No. 2 in the world in production of Rice,
Wheat, Potatoes, Garlic, Cashew Nuts, Groundnuts, Dry Onion, Green Peas, Pumpkins, Gourds, and
cauliflowers. With the huge production base India can easily become the leading food supplier to the world
and at the same time serving its vast growing domestic market with over a billion people.
Key growth drivers of Food Processing Sector in India
Increasing spending on health and nutritional foods.
Increasing number of nuclear families and working women
Changing lifestyle
Functional foods, fresh or processed foods
Organized retail and private label penetration
Changing demographics and rising disposable incomes
Key opportunities in Food Processing Sector
Processable varieties of crop
Contract farming
19
Investments in infrastructure through Public Private partnership (PPP) 17
Mega Food parks
Logistics and cold chain infrastructure
Food safety Management Systems
Machinery and packaging
COMPANY PROFILE
Nestle India Limited is the Indian subsidiary of Nestle which is a Swiss multinational company. The
company is headquartered in Gurgaon, Haryana. The company's products
include food, beverages, chocolate, and confectioneries.
The company was incorporated on 28 March 1959 and was promoted by Nestle Alimentana S.A. via a
subsidiary, Nestle Holdings Ltd. As of 2020, the parent company Nestle owns 62.76% of Nestle India. The
company has 9 production facilities in various locations across India.
Mission Statement
Nestle is...
...the world's leading nutrition, health and Wellness Company. mission of "Good Food, Good Life" is to
provide consumers with the best tasting, most nutritious choices in a wide range of food and beverage
categories and eating occasions, from morning to night.
20
Vision and values
To be a leading, competitive, Nutrition, Health and Wellness Company delivering improved
shareholder value by being a preferred corporate citizen, preferred employer, preferred supplier
selling preferred products.
SWOT ANALYSIS
STRENGTHS
The company enjoy good support of parent company Nestle S.A. which is a nutrition, health and wellness
company headquartered in Vevey, Waadt, Switzerland. The company's product portfolio includes baby
foods, bottled water, cereals, chocolate and confectionery, coffee, culinary products, chilled and frozen
foods, dairy products, drinks, nutritional products, ice-cream, cooking aid products, pet care products,
sports nutrition products, weight management and pharmaceutical products.
The company has strong brands like Nescafe, milkmaid, kit Kat, etc. and the company is known for
product innovation. Under the dynamic leadership of the current Chairman and Managing Director Mr.
Suresh Narayanan Nestlé India is doing extremely well and in fact the company is even open to strategic
acquisition for faster growth. More importantly brand under his stewardship Maggi attained over 60
percent market share and almost reached the pre-crisis level in value sales volume.
Nestle have a century old presence in India when Nestlé Anglo Swiss Condensed Milk Company (Export)
Limited imported and sold the finished products in the Indian market The company has been an associate
in India's growth and has a very unique association of confidence and commitment with the people of
India. The Companies have provided direct and indirect employment to over one million people including
farmers, suppliers of packaging materials and other.
Nestle India, achieved a major landmark in the financial year 2017 as the first listed food company to
cross Rs10,000 crore in sales in India. Also, the good financial performance in first quarter of the current
financial year leads to good show in share prices of Nestlé India in National Stock Exchange and Bombay
Stock Exchange.
WEAKNESSES
Nestle India was caught off the guard as the company was totally ignorant and were ill prepared to
manage the regulator’s call on Maggi ban and more importantly the responses to Maggi ban were very
brief and not adequately culture-sensitive. Heavy dependence on milk products and nutrition, the largest
category that contributes nearly 47.6% to the company's top line is another major weakness of the
21
company.
OPPORTUNITIES
The company have excellent potential for growth in confectionery and beverage segment. The Company
have a global portfolio of about 2,000 brands including bestselling brands like Aero, Cerelac, Chocapic,
Nescafe, Boost, Kit Kat, Crunch, S. Pellegrino, Perrier, Nido, La Laitiere, Carnation, Milo, Nestea,
Nesquik, Dreyer’s, Movenpick and Alpo, Beneful. But in India they are operating with a truncated
portfolio of just 20 brands. So, the company can capitalise on the product and brand strength of the parent
company.
THREATS
The company is facing stiff competition from new entrants like Ferrero India and Patanjali Products.
Raising cost of input is another threat is a common problem faced by most of the companies in Fast
Moving Consumer Goods sector. Maggi ban negative publicity is probably the major threat for the
company and if the issue have not been raised, the company would have reached Rs. 10,000 crore mark a
couple of years ago.
HISTORY
Nestle India is one of the largest players in India's Fast-moving consumer goods segment and has a long
history in the country.
Nestlé India Limited was incorporated at New Delhi on 28 March 1959 and was promoted by Nestle
Alimentana S.A. via a wholly owned subsidiary, Nestle Holdings Ltd., Nassau, Bahama Islands.
The company built their first production facility in 1961 at Mogo, in the Indian state of Punjab.
Nestlé's second plant was set up at Choladi in Tamil Nadu, the plant was built primarily to process the
tea grown in the area.
In 1989, the company established a factory at Nanjangud in Karnataka.
The company entered the confectionery business in 1990 by introducing Nestlé premium chocolate.
In 1991, they started the production of soya based products through a joint venture with the BM
Khaitan group.
In the year 1995 and 1997 Nestlé established two facilities in Goa at Ponda and Bicholim respectively.
In April 2000 they entered the liquid milk and iced tea markets.
2006 marked the year when the company set up its 7th factory at Pantnagar in Uttarakhand.
The company opened another plant in Karnataka in 2011 bringing up its total plants in India to eight.
In October 2020, Nestle India announced investment of Rs. 2,600 crores for a new plant
at Sanand in Gujarat
22
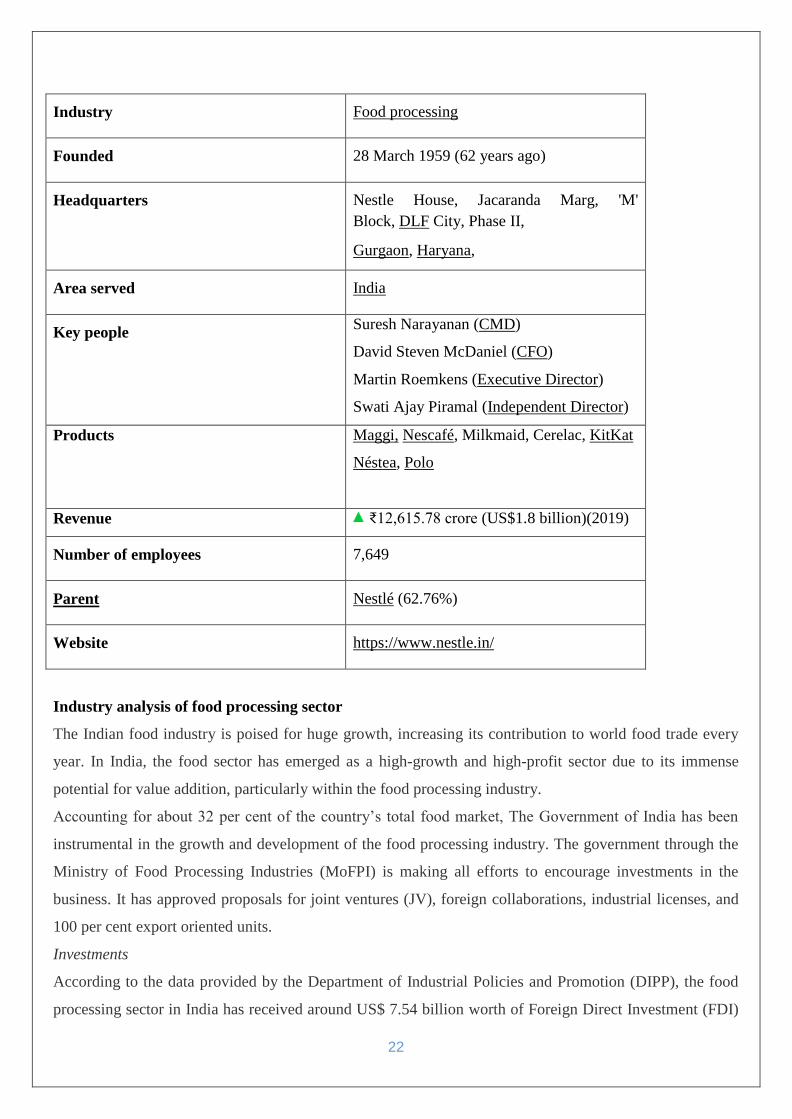
Industry Food processing
Founded 28 March 1959 (62 years ago)
Headquarters Nestle House, Jacaranda Marg, 'M'
Block, DLF City, Phase II,
Gurgaon, Haryana,
Area served India
Key people Suresh Narayanan (CMD)
David Steven McDaniel (CFO)
Martin Roemkens (Executive Director)
Swati Ajay Piramal (Independent Director)
Products Maggi, Nescafé, Milkmaid, Cerelac, KitKat
Néstea, Polo
Revenue ₹12,615.78 crore (US$1.8 billion)(2019)
Number of employees 7,649
Parent Nestlé (62.76%)
Website https://www.nestle.in/
Industry analysis of food processing sector
The Indian food industry is poised for huge growth, increasing its contribution to world food trade every
year. In India, the food sector has emerged as a high-growth and high-profit sector due to its immense
potential for value addition, particularly within the food processing industry.
Accounting for about 32 per cent of the country’s total food market, The Government of India has been
instrumental in the growth and development of the food processing industry. The government through the
Ministry of Food Processing Industries (MoFPI) is making all efforts to encourage investments in the
business. It has approved proposals for joint ventures (JV), foreign collaborations, industrial licenses, and
100 per cent export oriented units.
Investments
According to the data provided by the Department of Industrial Policies and Promotion (DIPP), the food
processing sector in India has received around US$ 7.54 billion worth of Foreign Direct Investment (FDI)
23
during the period April 2000-March 2017. The Confederation of Indian Industry (CII) estimates that the
food processing sectors have the potential to attract as much as US$ 33 billion of investment over the next
10 years and also to generate employment of nine million person-days.
Some of the major investments in this sector in the recent past are:
Global e-commerce giant, Amazon is planning to enter the Indian food retailing sector by investing
US$ 515 million in the next five years, as per Mr Harsimrat Kaur Badal, Minister of Food
Processing Industries, Government of India.
Parle Agro Pvt Ltd is launching Frooti Fizz, a succession of the original Mango Frooti, which will
be retailed across 1.2 million outlets in the country as it targets increasing its annual revenue from
Rs 2800 crore (US$ 0.42 billion) to Rs 5000 crore (US$ 0.75 billion) by 2018.
US-based food company Cargill Inc, aims to double its branded consumer business in India by
2020, by doubling its retail reach to about 800,000 outlets and increase market share to become
national leader in the sunflower oil category which will help the company be among the top three
leading brands in India.
Mad Over Donuts (MoD), outlined plans of expanding its operations in India by opening nine new
MOD stores by March 2017.
Danone SA plans to focus on nutrition business in India, its fastest growing market in South Asia,
by launching 10 new products in 2017, and aiming to double its revenue in India by 2020.
Uber Technologies Inc plans to launch UberEATS, its food delivery service to India, with
investments made across multiple cities and regions.
Government Initiatives
Some of the major initiatives taken by the Government of India to improve the food processing sector in
India are as follows:
The Government of India aims to boost growth in the food processing sector by leveraging reforms
such as 100 per cent Foreign direct investment (FDI) in marketing of food products and various
incentives at central and state government level along with a strong focus on supply chain
infrastructure.
In Union Budget 2017-18, the Government of India has set up a dairy processing infra fund worth
Rs 8,000 crore (US$ 1.2 billion).
The Government of India has relaxed foreign direct investment (FDI) norms for the sector,
allowing up to 100 per cent FDI in food product e-commerce through automatic route.
24
The Food Safety and Standards Authority of India (FSSAI) plans to invest around Rs 482 crore
(US$ 72.3 million) to strengthen the food testing infrastructure in India, by upgrading 59 existing
food testing laboratories and setting up 62 new mobile testing labs across the country.
The Indian Council for Fertilizer and Nutrient Research (ICFNR) will adopt international best
practices for research in fertiliser sector, which will enable farmers to get good quality fertilisers at
affordable rates and thereby achieve food security for the common man.
The Ministry of Food Processing Industries announced a scheme for Human Resource
Development (HRD) in the food processing sector. The HRD scheme is being implemented
through State Governments under the National Mission on Food Processing. The scheme has the
following four components:
o Creation of infrastructure facilities for degree/diploma courses in food processing sector
o Entrepreneurship Development Programme (EDP)
o Food Processing Training Centres (FPTC)
o Training at recognised institutions at State/National level
PARLE
Parle Products Private Limited is an Indian food products company. It owns the
famous biscuit brand Parle-G. In 2019, it had a 7% share of the global biscuit market, growing to 50% by
of 2020. As of 2020, as per Nielsen, it is the largest selling biscuit brand in the world.
HISTORY
Parle Products company was founded in 1929 in British India by the Chauhan family of Vile Parle,
Bombay. Parle began manufacturing biscuits in 1939. In 1947, when India became independent, the
company launched an ad campaign showcasing its Gluco biscuits as an Indian alternative to the British
biscuits.[5] The Parle brand became well known in India following the success of products such as
the Parle-G biscuits and cold beverages like Gold Spot, Thums Up and Frooti.
The original Parle company was split into three separate companies, owned by the different factions of the
original Chauhan family, with a majority of it owned by Parle Agro products:[6]
25
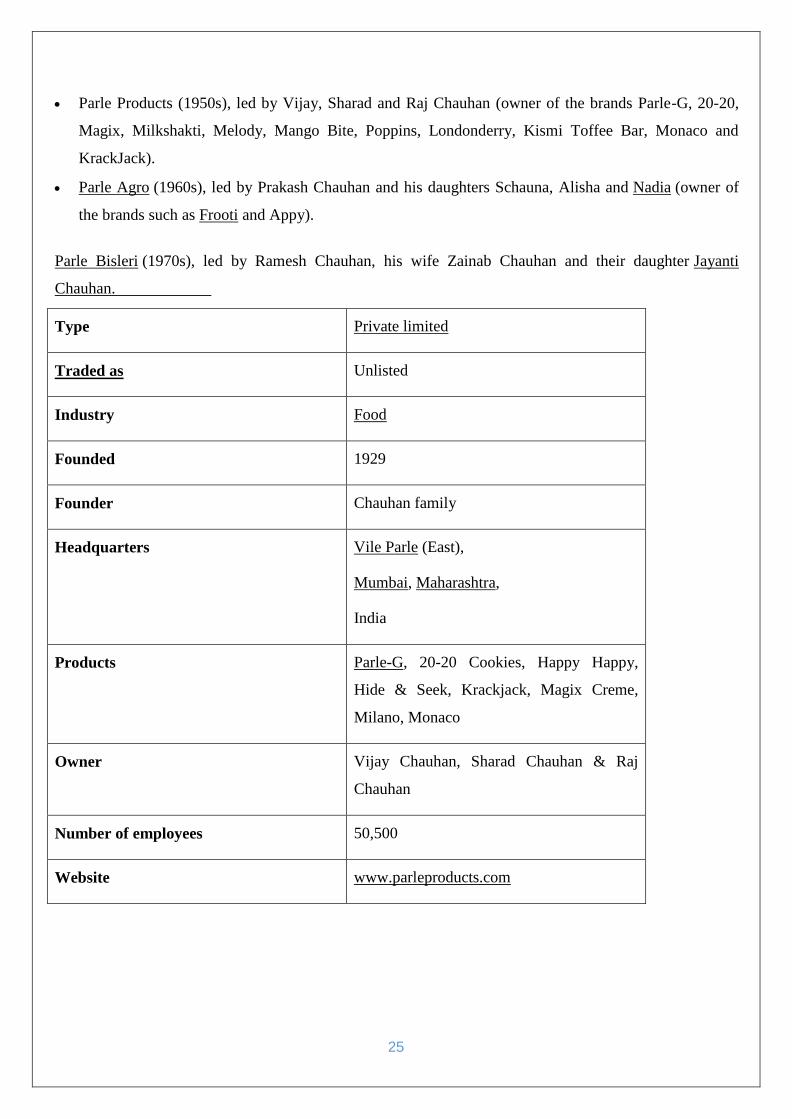
Parle Products (1950s), led by Vijay, Sharad and Raj Chauhan (owner of the brands Parle-G, 20-20,
Magix, Milkshakti, Melody, Mango Bite, Poppins, Londonderry, Kismi Toffee Bar, Monaco and
KrackJack).
Parle Agro (1960s), led by Prakash Chauhan and his daughters Schauna, Alisha and Nadia (owner of
the brands such as Frooti and Appy).
Parle Bisleri (1970s), led by Ramesh Chauhan, his wife Zainab Chauhan and their daughter Jayanti
Chauhan.
Type Private limited
Traded as Unlisted
Industry Food
Founded 1929
Founder Chauhan family
Headquarters Vile Parle (East),
Mumbai, Maharashtra,
India
Products Parle-G, 20-20 Cookies, Happy Happy,
Hide & Seek, Krackjack, Magix Creme,
Milano, Monaco
Owner Vijay Chauhan, Sharad Chauhan & Raj
Chauhan
Number of employees 50,500
Website www.parleproducts.com
26
HERITAGE
Heritage Foods Limited (commonly known as Heritage Foods) is one of the largest private
sector dairy enterprises in Southern India.
HISTORY
The Heritage Group was founded in 1992 by Telugu Desam Party Chief and former Chief Minister of
Andhra Pradesh Shri Nara Chandrababu Naidu, with three-business divisions viz., Dairy, Retail and Agri
under its flagship Company Heritage Foods Limited (HFL), one infrastructure subsidiary - Heritage Infra
Developers Limited and other associate Companies viz., Heritage Finlease Limited, Heritage International
Limited and Heritage Agro Marine Private Limited. The annual turnover has crossed $200 million USD
during FY 2008'09.
Heritage’s milk products have market presence in Telangana, Andhra Pradesh, Karnataka, Kerala, Tamil
Nadu, Maharashtra, Delhi, Rajasthan and Punjab. It has retail stores across Bangalore, Chennai,
Hyderabad and Visakhapatnam. Integrated agri operations are in Chittoor and Medak Districts and these
are backbone to retail operations.
Type Public limited company (BSE)
Industry Dairy and Agribusiness
Founded 1992
Founder Nara Chandrababu Naidu
Headquarters Hyderabad, Telangana, India
Key people Nara Brahmani (Executive Director)
Sambasiva Rao (President)

27
Revenue US$300 million (in 2014 -15)
Owner Nara family
Number of employees 3000+
Website www.heritagefoods.in
28
CHAPTER 3
RESEARCH METHODOLOGY
Literature survey
This chapter looks at the concept of cash flow statement as given by other authors and researchers with
importance to accountability, profit measurement, solvency, ambiguity, and disclosure and their specific
relevance for proper financial management of commercial company .one of the aim and objectives of this
dissertation was to review conceptual though and theoretical framework related to cash flow analysis.
Developing a critical review of cash flow literature and any related issues help the researcher, manager and
any potential reader to better understand the subject and also provide a framework for data analysis.
Governance as stated in the UK charity commission standard for good governance code is “the systems
and processes concerned with ensuring the overall direction, effectiveness, supervision and accountability
of an organization.”
This chapter begins with a clarified concept of cash flow as stated by the Financial Accounting Standard
Board (FASB) and also develop and update and utility of cash flow when managing commercial activities.
How the better knowledge on that topic helps in business decision making nowadays.
Expansion of the reporting standard
The Financial Accounting Standards Board (FASB) introduced Statement of Financial Accounting
Standards No. 95 which is the Statement of Cash Flows in November 1987. The requirement of
FASB 95 regarding a full set of financial statements classified cash flow as the fourth required financial
statement (along with a balance sheet, income statement, and statement of retained earnings). This
statement established standards for cash flow reporting, and dated out the Accounting Principles Board
(APB) Opinion No. 19, Reporting Changes in Financial Position. In March 1971, the APB Opinion No.19
gave chances to enterprises to report cash flow information in a statement of changes in financial position
commonly called a funds statement. During that time, there was no formal or universally accepted
definition to catalogue each statement even though the term “funds” was not sufficiently defined (Alves et
al 2008). Every single industry however had different funds constitution to others since the statement
referred to changes in funds. The term funds referred sometimes to cash for some company meanwhile
some used cash and short term investment and some used quick asset, some used working capital. The
relevance and the valuation of funds statement has been recognized in most company but the lack of
consistency in format and focus from one firm to another was responsible of the main reason that the
FASB obviously took up the matter and with extensive commentary from accountants and any other
interested parties, adopted the standards espoused in FASB 95.it effectively took place in 1988 had not
encouraged use of the world “funds” because it had been stated with so much (Alves et al 2008).
29
A cash flow statement is an important indicator of financial health because it is possible for a company to
show profits while not having enough cash to sustain operations. It is a financial report that shows to the
user the source of a company's cash and how it was spent over a specific period of time. A cash flow
statement counters the ambiguity regarding a company's solvency that various accrual accounting
measures create. It also categorizes the sources and uses of cash to provide the reader with an
understanding of the amount of cash a company generates and uses in its operations, as opposed to the
amount of cash provided by sources outside the company, such as borrowed funds or funds from
stockholders. The cash flow statement also tells the reader how much money was spent for items that do
not appear on the income statement, such as loan repayments, long-term asset purchases, and payment of
cash dividends (Ryan 2007).
Requirements for cash flow statement
Thornton (2008) indicated that FASB 95 requires a statement of cash flows to classify cash receipts and
cash payments in accordance with the prescribe format whether they start from operating activities,
investing activities, or financing activities. The provisions given by FASB are as follows on the
presentation of cash flow statement are:
A. it provides that the cash flows statement should be prepared under either direct or indirect method and
provides examples of how to use each method when preparing statements. b. It also provides that under the
core concept, cash is stated as “cash and cash equivalents”. while cash is the most liquid assets within the
asset portion of a company’s balance sheet including currency and bank deposit, in the other hand cash
equivalents are asset that are ready to be converted into cash such as money market holding, short term
government bond, bills, marketable securities and commercial paper. Other sources of investments such as
stocks, bonds, futures contracts, and so forth are not considered cash.
Cash and profitability concepts
Cash
Cash is one of the most important aspects of running any large or small business. It is one of the single
most important reasons why many businesses fail regardless of how good the business is. The physical
aspect of cash can be any currency, coins on hand, bank balances, negotiable money and so forth.
Managing cash flow therefore is vitally important in the soft running, survival and success of a business
(Atrill P. 2004).
The use of some examples has illustrated how cash flow can make the difference between success and
failure. The meaning of failure in this case is insolvency that is, the company is unable to pay its debts.
The term bankrupt is sometimes used to describe that situation, even though it is only individual who can
be declared bankrupt. But sometimes both terms can be confusing.
30
Significance of cash flow
There is a significant importance of cash flow to a business. Cash flow as defined above is the inflow and
outflow of cash or liquidized finances. The following are some advantages of inward and outward flow of
cash.
a) Income Assurance: The biggest importance of cash flow is that the business organization tends to have
an assured income irrespective of the outside economic condition. Many business corporations have a very
well balanced and uniform inward and outward cash flow.
b) Ensures Timely Payment: The uniform and assured cash flow, in both the directions, ensures two
principal payments, namely, the salaries of employees are paid on time and installments of all loans are
made on time. This safeguards the trust of employees and upholds the credit rating.
c) Return Ratio: The analysis of cash flow ensures that the business is not investing finances in the wrong
avenues, and investments already made are paying off well. This ratio is often termed as return over asset
ratio.
d) Keeps You Out of Debt: The timely cash inflow plays a very instrumental role in keeping you out of
debt, as a timely inflow of cash prevents you from taking small loans.
e) Saves Unnecessary Expenditure: The use of inward and outward cash flow prevents all unnecessary
expenditure such as piled up interest, late payment charges, etc.
f) Timely Investments: As the inflow and outflow of cash is on time, you are left with adequate free and
liquid finances, which you may invest in time bound instruments and securities.
g) Good cash flow practices ensure smooth operation of the company when accrued revenue is still sitting
in accounts receivable. Often an increase in sales does not automatically mean an increase in cash flow at
least not right away. for instance, a company with £3 million annual revenue and 30day gap days between
the day of payment and the day of sales is likely to be more cash rich than the company with£5 million in
sales and a 3 days float. By using cash flow forecasting practices, the company can anticipate when they
are most likely to be cash flush and when they are most likely to be cash-strapped so that they can plan
their capital purchase.
h) Effective cash flow management is vital to every organization; it is an important aspect when planning
business functioning. Earning income is (or should be ) one the main focus of company objectives. It can
be profitable in and of itself. Cash shortages result in increased cost, such as interest charges on loans, late
payment penalties, and loss of vendors discount for paying bill promptly. Cash flow improvements can
eliminate these costs and create the opportunity for more favorable payment terms on some type of
payments. A better understanding of cash flow management can be benefit to many organization with a
comprehensive guide for:
i) Identifying and understanding organization’s cash flow characteristics, strengths and weaknesses
31
j) Improving cash flow through implementing relevant strategies.
k) Improving overall performance by using cash flow.
Limitations of the cash flow statement
Some of the limitations of the cash flow statement are as follows:
As the enterprise shifts from strictly cash basis, enters into credit transactions as well takes into account
prepared and accrued items, the net income no doubt would generally represent an increase in working
capital. Yet equating net income in cash flow for such enterprise would be inaccurate and misleading since
a number of noncash items affects the net income of the firm.
Cash flow is part of working capital. The volume of cost flowing in any part of the system and the speed at
which it flows determines the amount of capital. Tied up sometimes in any segment of the enterprise or
business. At any given time cash flow analysis used in connection with ratio analysis provided a barometer
for measuring the aforesaid change and financing problem of the business much more manageable
There are two methods of preparing cash flow statement:
1) DIRECT METHOD
2) INDIRECT METHOD
Sometimes it can be possible that due to the of wrong method the accurate cash the company cannot make
proper cash planning.
Data of collection
Primary data: not applicable
Secondary data:
Secondary data has been collected from
Websites
journals
Research design & methodology
Research design is blue print of data collection, measurement & analysis of data. It indicate both structure
of problem & plan of investigation used to obtain empirical evidence on those relationship .There are
generally three types of research design which are as follows.
1 Exploratory studies
2. Descriptive studies
3. Causal studies
For the research design I have selected DESCRIPTIVRE STUDIES because as cash flow analysis is topic
in which there must detail description of all transaction are required to study so that we get idea how cash
is collect from various sources & utilized in organization. Further while doing in depth study we get
complete picture of process that follow in organization. Significant of study Aim of work help to reach
32
destination by problems arises in the way work become more efficient if purpose for doing work is clear.
Scope Statement of Cash Flows
1. Consolidated cash flow is a financial statement that presents information about the company's cash
receipts and disbursements during the accounting period.
2. The purpose of cash flow statement is to provide information on sources and uses of cash and cash
equivalents during the period of accounting and cash reconciliation at the beginning of the period with
cash at the end of the period plus the cash equivalent balances.
3. The general form of the cash flow statement shows cash receipts and disbursements are divided into
three categories, namely: cash flow from operating activities, cash flows from investing activities and cash
flows arising from financing activities.
33
CHAPTER 4
DATA ANALYSIS AND INTERPRETATION
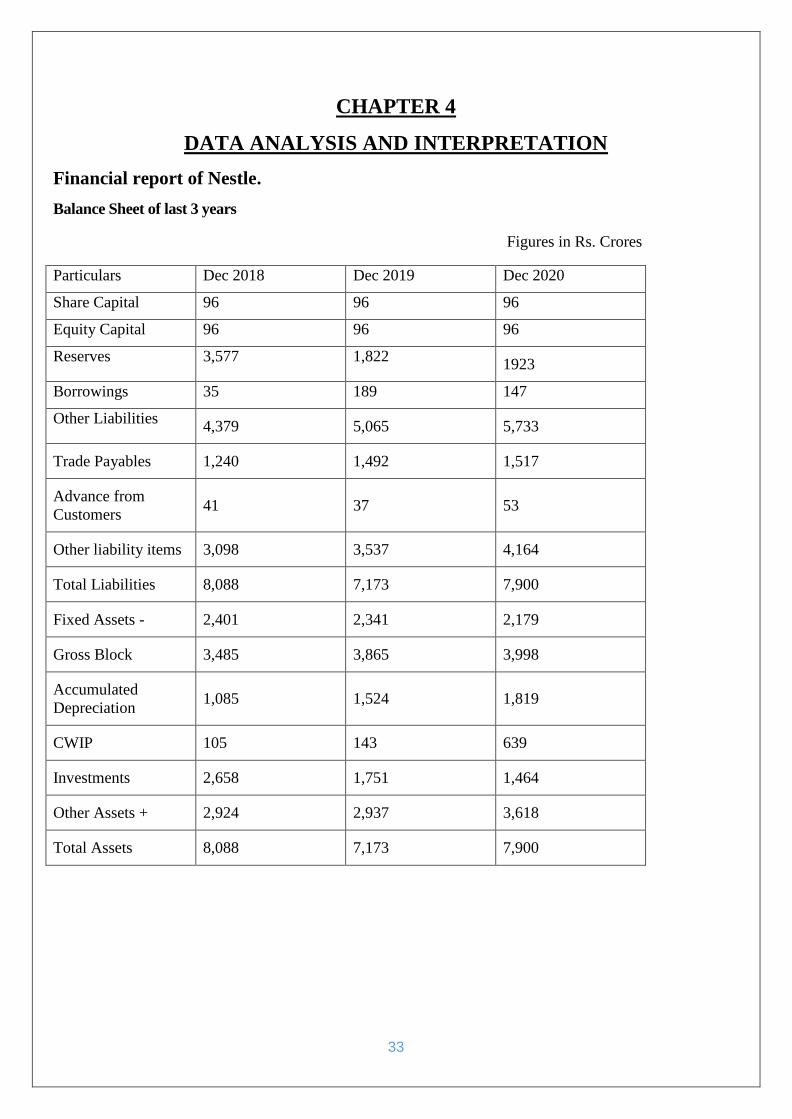
Financial report of Nestle.
Balance Sheet of last 3 years
Figures in Rs. Crores
Particulars Dec 2018 Dec 2019 Dec 2020
Share Capital 96 96 96
Equity Capital 96 96 96
Reserves 3,577 1,822 1923
Borrowings 35 189 147
Other Liabilities 4,379 5,065 5,733
Trade Payables 1,240 1,492 1,517
Advance from
Customers 41 37 53
Other liability items 3,098 3,537 4,164
Total Liabilities 8,088 7,173 7,900
Fixed Assets - 2,401 2,341 2,179
Gross Block 3,485 3,865 3,998
Accumulated
Depreciation 1,085 1,524 1,819
CWIP 105 143 639
Investments 2,658 1,751 1,464
Other Assets + 2,924 2,937 3,618
Total Assets 8,088 7,173 7,900
34
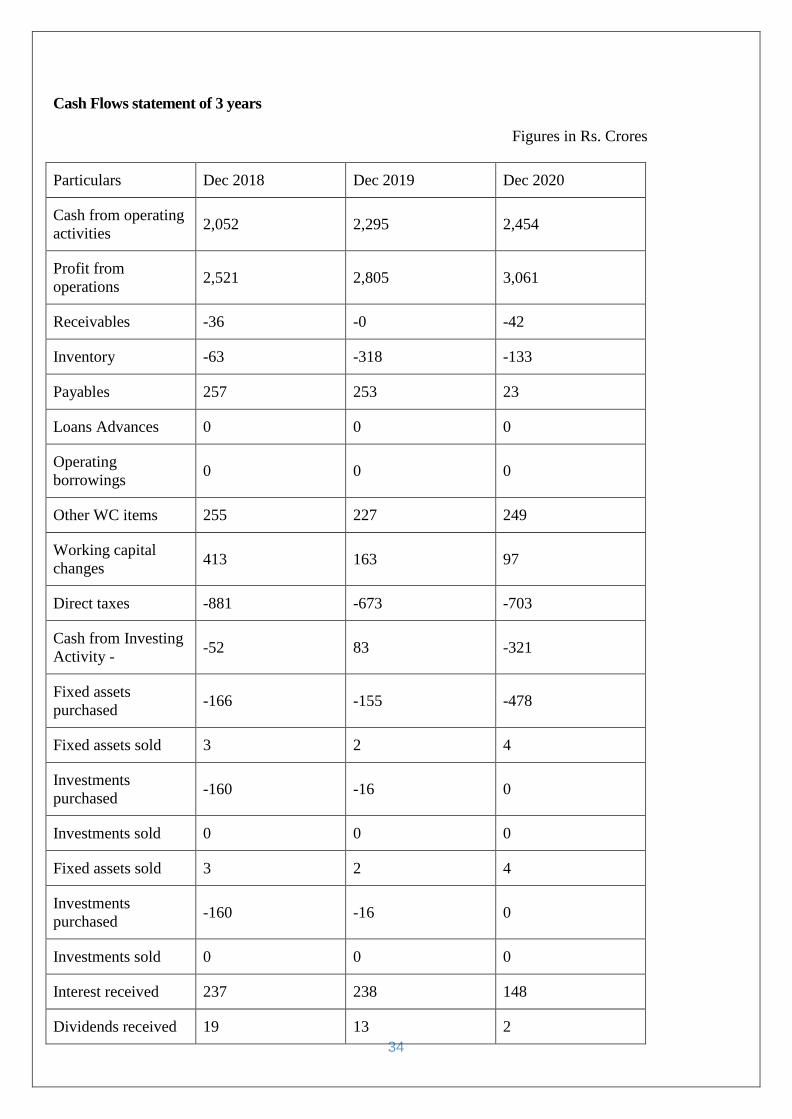
Cash Flows statement of 3 years
Figures in Rs. Crores
Particulars Dec 2018 Dec 2019 Dec 2020
Cash from operating
activities 2,052 2,295 2,454
Profit from
operations 2,521 2,805 3,061
Receivables -36 -0 -42
Inventory -63 -318 -133
Payables 257 253 23
Loans Advances 0 0 0
Operating
borrowings 0 0 0
Other WC items 255 227 249
Working capital
changes 413 163 97
Direct taxes -881 -673 -703
Cash from Investing
Activity - -52 83 -321
Fixed assets
purchased -166 -155 -478
Fixed assets sold 3 2 4
Investments
purchased -160 -16 0
Investments sold 0 0 0
Fixed assets sold 3 2 4
Investments
purchased -160 -16 0
Investments sold 0 0 0
Interest received 237 238 148
Dividends received 19 13 2
35
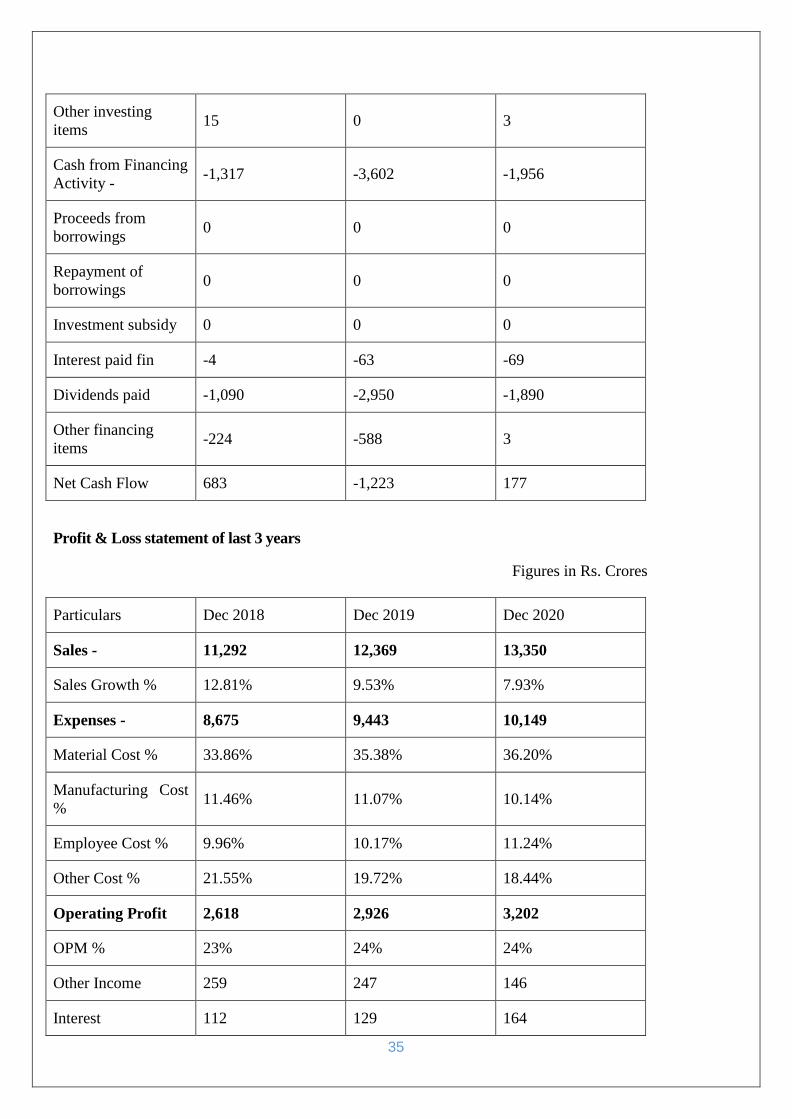
Other investing
items 15 0 3
Cash from Financing
Activity - -1,317 -3,602 -1,956
Proceeds from
borrowings 0 0 0
Repayment of
borrowings 0 0 0
Investment subsidy 0 0 0
Interest paid fin -4 -63 -69
Dividends paid -1,090 -2,950 -1,890
Other financing
items -224 -588 3
Net Cash Flow 683 -1,223 177
Profit & Loss statement of last 3 years
Figures in Rs. Crores
Particulars Dec 2018 Dec 2019 Dec 2020
Sales - 11,292 12,369 13,350
Sales Growth % 12.81% 9.53% 7.93%
Expenses - 8,675 9,443 10,149
Material Cost % 33.86% 35.38% 36.20%
Manufacturing Cost
% 11.46% 11.07% 10.14%
Employee Cost % 9.96% 10.17% 11.24%
Other Cost % 21.55% 19.72% 18.44%
Operating Profit 2,618 2,926 3,202
OPM % 23% 24% 24%
Other Income 259 247 146
Interest 112 129 164
36
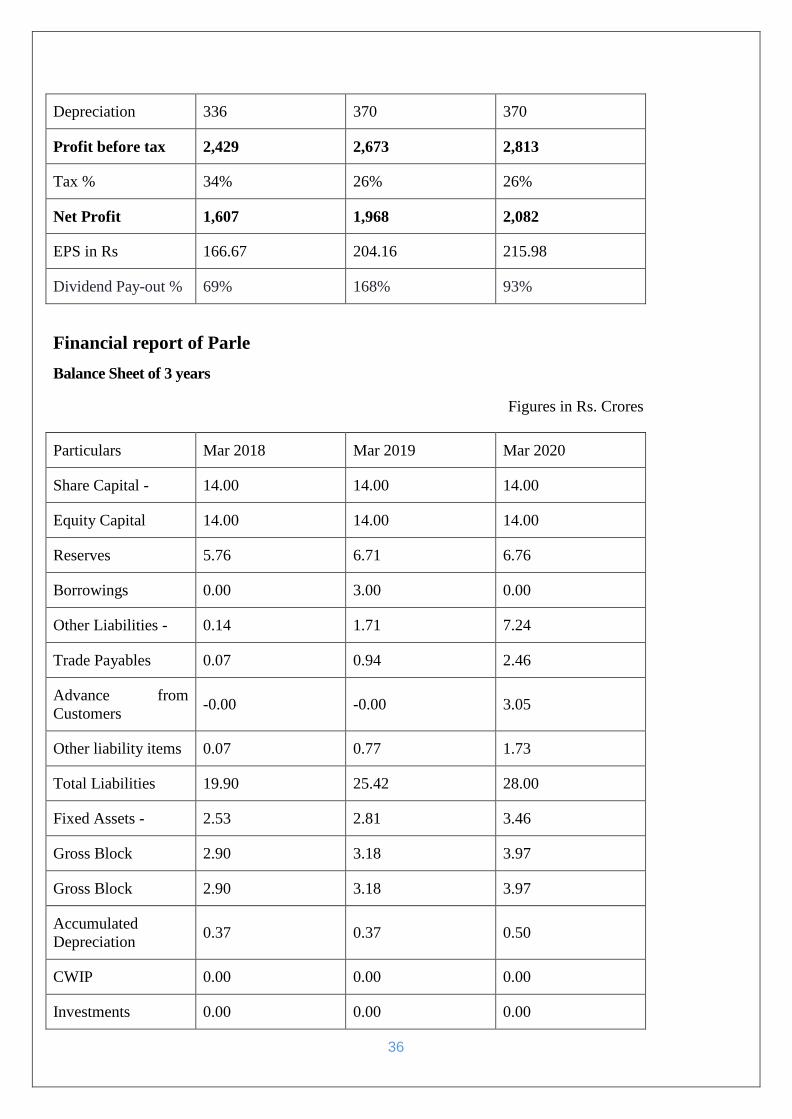
Depreciation 336 370 370
Profit before tax 2,429 2,673 2,813
Tax % 34% 26% 26%
Net Profit 1,607 1,968 2,082
EPS in Rs 166.67 204.16 215.98
Dividend Pay-out % 69% 168% 93%
Financial report of Parle
Balance Sheet of 3 years
Figures in Rs. Crores
Particulars Mar 2018 Mar 2019 Mar 2020
Share Capital - 14.00 14.00 14.00
Equity Capital 14.00 14.00 14.00
Reserves 5.76 6.71 6.76
Borrowings 0.00 3.00 0.00
Other Liabilities - 0.14 1.71 7.24
Trade Payables 0.07 0.94 2.46
Advance from
Customers -0.00 -0.00 3.05
Other liability items 0.07 0.77 1.73
Total Liabilities 19.90 25.42 28.00
Fixed Assets - 2.53 2.81 3.46
Gross Block 2.90 3.18 3.97
Gross Block 2.90 3.18 3.97
Accumulated
Depreciation 0.37 0.37 0.50
CWIP 0.00 0.00 0.00
Investments 0.00 0.00 0.00
37
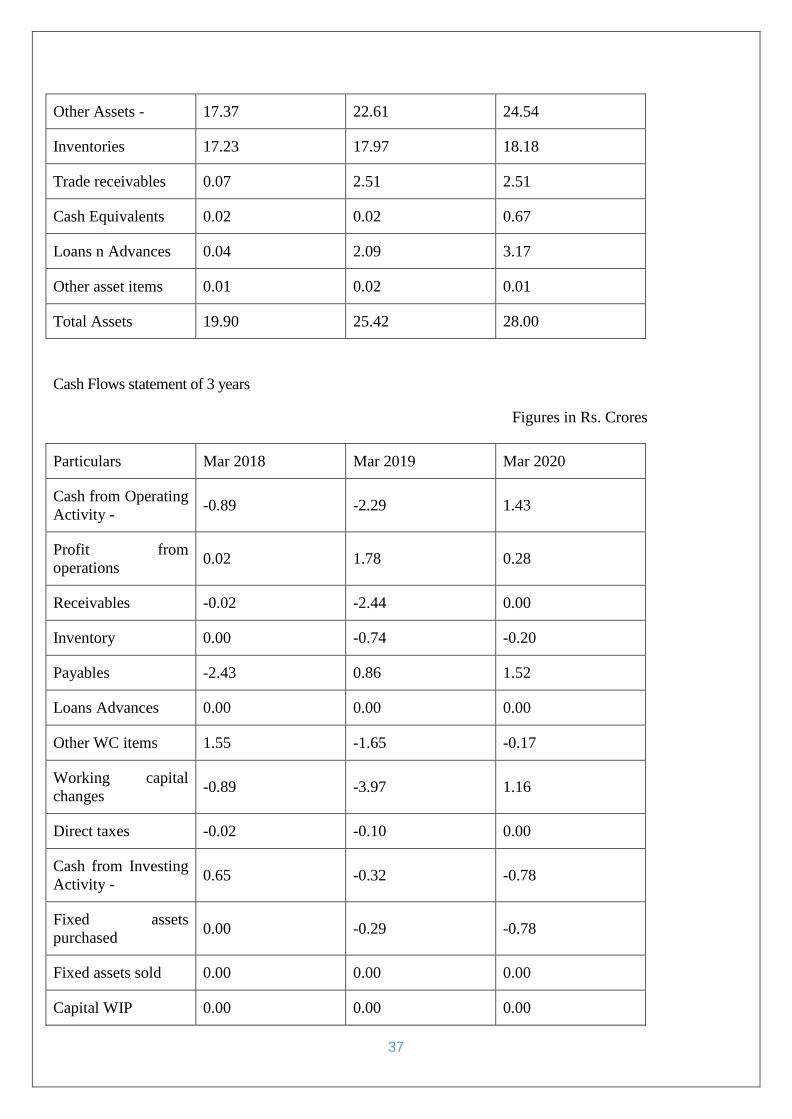
Other Assets - 17.37 22.61 24.54
Inventories 17.23 17.97 18.18
Trade receivables 0.07 2.51 2.51
Cash Equivalents 0.02 0.02 0.67
Loans n Advances 0.04 2.09 3.17
Other asset items 0.01 0.02 0.01
Total Assets 19.90 25.42 28.00
Cash Flows statement of 3 years
Figures in Rs. Crores
Particulars Mar 2018 Mar 2019 Mar 2020
Cash from Operating
Activity - -0.89 -2.29 1.43
Profit from
operations 0.02 1.78 0.28
Receivables -0.02 -2.44 0.00
Inventory 0.00 -0.74 -0.20
Payables -2.43 0.86 1.52
Loans Advances 0.00 0.00 0.00
Other WC items 1.55 -1.65 -0.17
Working capital
changes -0.89 -3.97 1.16
Direct taxes -0.02 -0.10 0.00
Cash from Investing
Activity - 0.65 -0.32 -0.78
Fixed assets
purchased 0.00 -0.29 -0.78
Fixed assets sold 0.00 0.00 0.00
Capital WIP 0.00 0.00 0.00
38
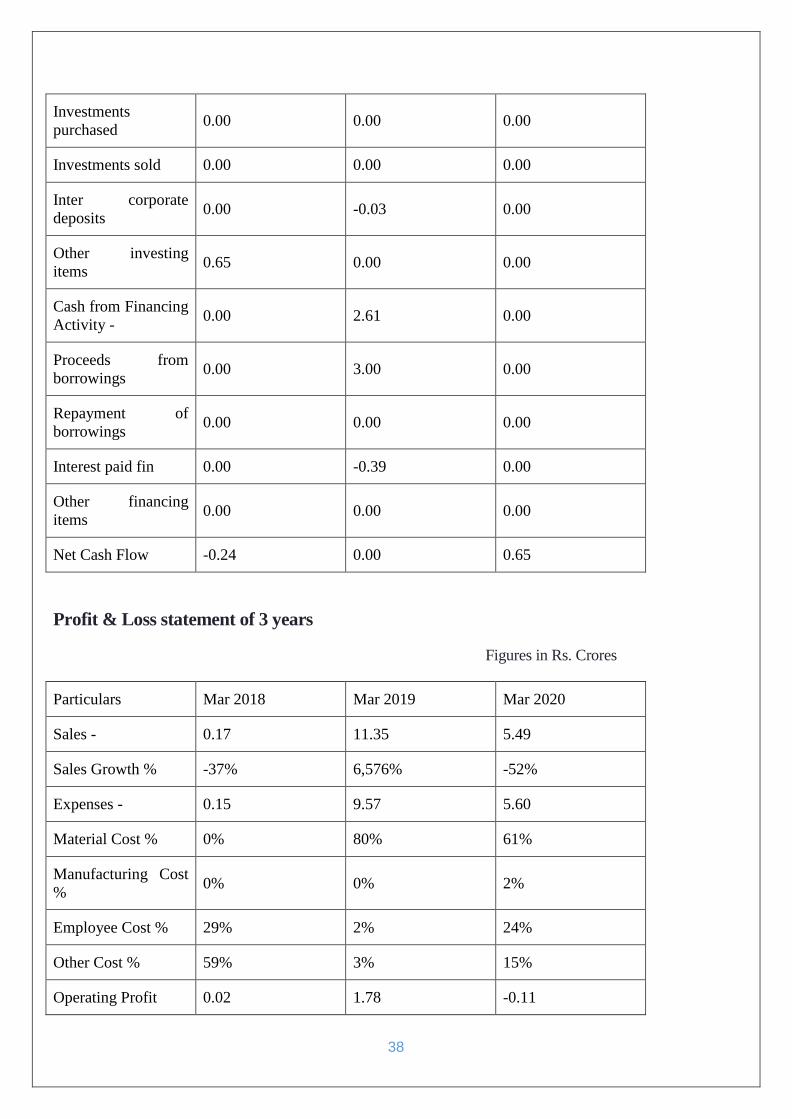
Investments
purchased 0.00 0.00 0.00
Investments sold 0.00 0.00 0.00
Inter corporate
deposits 0.00 -0.03 0.00
Other investing
items 0.65 0.00 0.00
Cash from Financing
Activity - 0.00 2.61 0.00
Proceeds from
borrowings 0.00 3.00 0.00
Repayment of
borrowings 0.00 0.00 0.00
Interest paid fin 0.00 -0.39 0.00
Other financing
items 0.00 0.00 0.00
Net Cash Flow -0.24 0.00 0.65
Profit & Loss statement of 3 years
Figures in Rs. Crores
Particulars Mar 2018 Mar 2019 Mar 2020
Sales - 0.17 11.35 5.49
Sales Growth % -37% 6,576% -52%
Expenses - 0.15 9.57 5.60
Material Cost % 0% 80% 61%
Manufacturing Cost
% 0% 0% 2%
Employee Cost % 29% 2% 24%
Other Cost % 59% 3% 15%
Operating Profit 0.02 1.78 -0.11
39
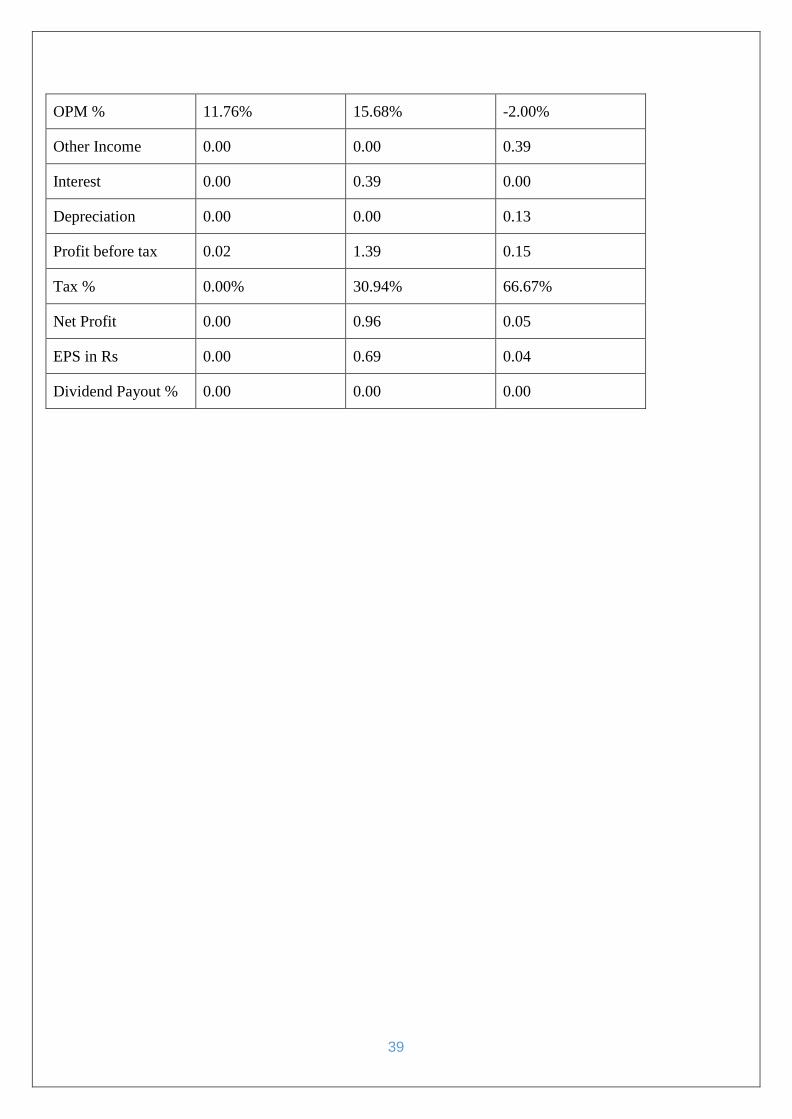
OPM % 11.76% 15.68% -2.00%
Other Income 0.00 0.00 0.39
Interest 0.00 0.39 0.00
Depreciation 0.00 0.00 0.13
Profit before tax 0.02 1.39 0.15
Tax % 0.00% 30.94% 66.67%
Net Profit 0.00 0.96 0.05
EPS in Rs 0.00 0.69 0.04
Dividend Payout % 0.00 0.00 0.00
40
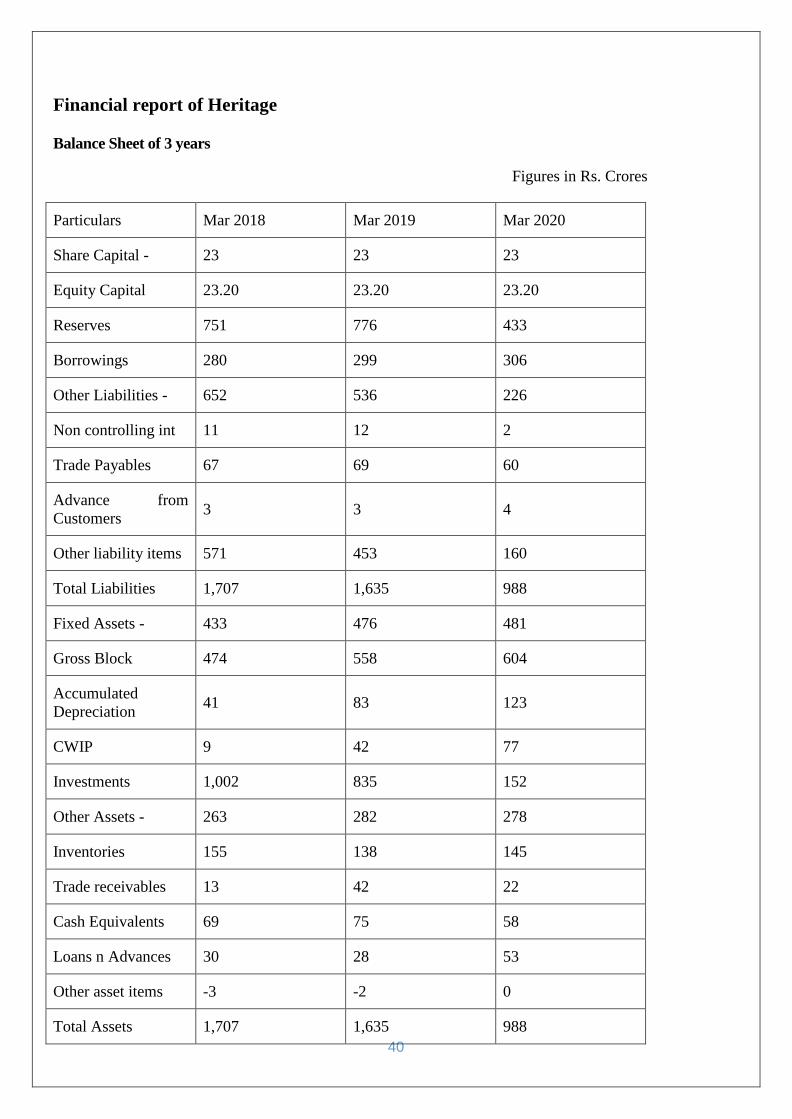
Financial report of Heritage
Balance Sheet of 3 years
Figures in Rs. Crores
Particulars Mar 2018 Mar 2019 Mar 2020
Share Capital - 23 23 23
Equity Capital 23.20 23.20 23.20
Reserves 751 776 433
Borrowings 280 299 306
Other Liabilities - 652 536 226
Non controlling int 11 12 2
Trade Payables 67 69 60
Advance from
Customers 3 3 4
Other liability items 571 453 160
Total Liabilities 1,707 1,635 988
Fixed Assets - 433 476 481
Gross Block 474 558 604
Accumulated
Depreciation 41 83 123
CWIP 9 42 77
Investments 1,002 835 152
Other Assets - 263 282 278
Inventories 155 138 145
Trade receivables 13 42 22
Cash Equivalents 69 75 58
Loans n Advances 30 28 53
Other asset items -3 -2 0
Total Assets 1,707 1,635 988
41
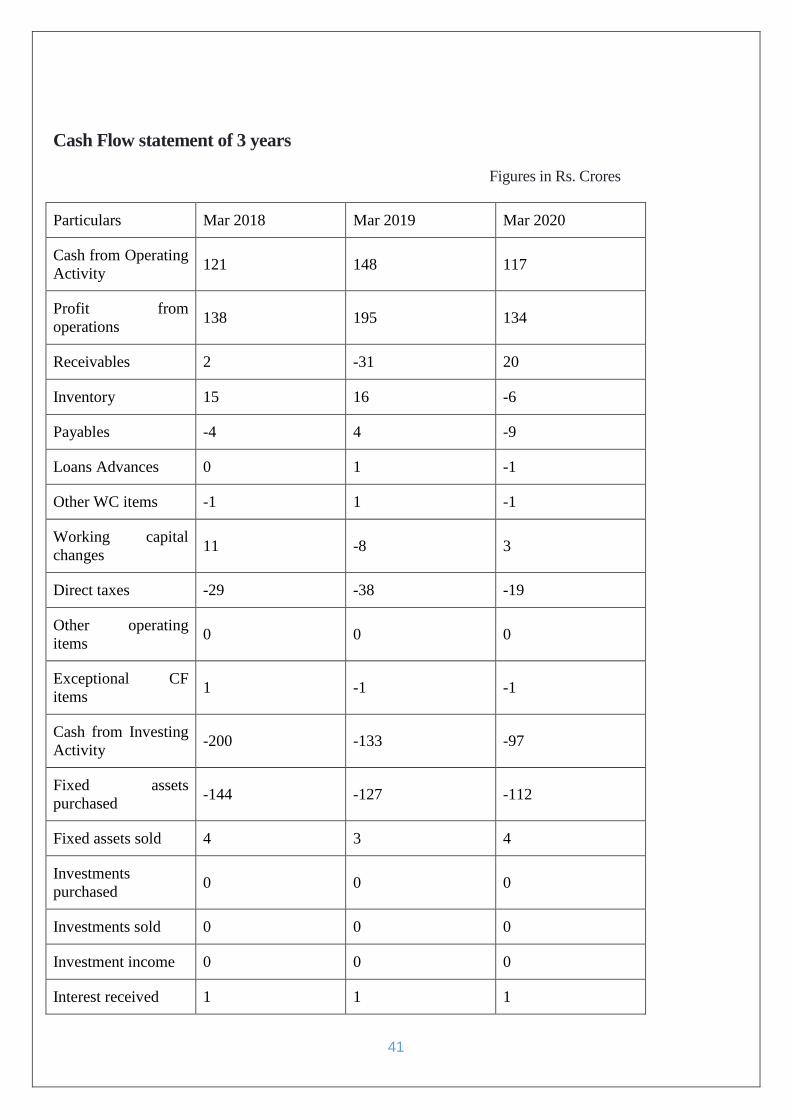
Cash Flow statement of 3 years
Figures in Rs. Crores
Particulars Mar 2018 Mar 2019 Mar 2020
Cash from Operating
Activity 121 148 117
Profit from
operations 138 195 134
Receivables 2 -31 20
Inventory 15 16 -6
Payables -4 4 -9
Loans Advances 0 1 -1
Other WC items -1 1 -1
Working capital
changes 11 -8 3
Direct taxes -29 -38 -19
Other operating
items 0 0 0
Exceptional CF
items 1 -1 -1
Cash from Investing
Activity -200 -133 -97
Fixed assets
purchased -144 -127 -112
Fixed assets sold 4 3 4
Investments
purchased 0 0 0
Investments sold 0 0 0
Investment income 0 0 0
Interest received 1 1 1
42
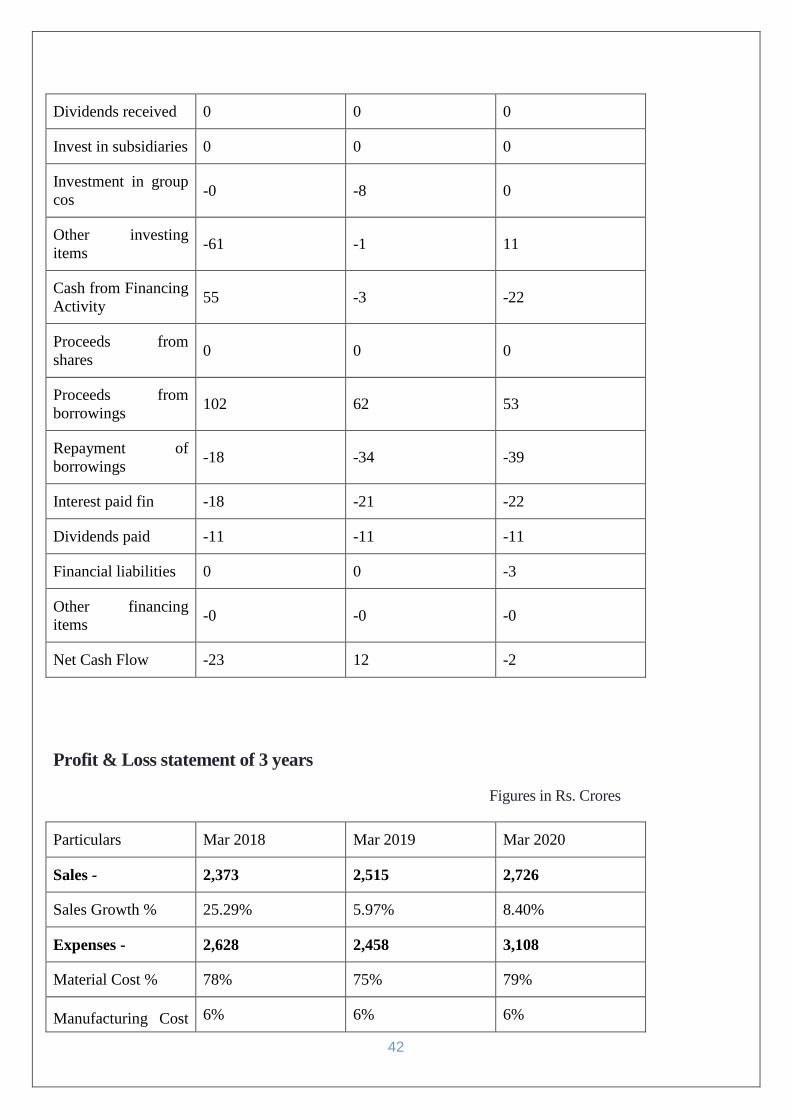
Dividends received 0 0 0
Invest in subsidiaries 0 0 0
Investment in group
cos -0 -8 0
Other investing
items -61 -1 11
Cash from Financing
Activity 55 -3 -22
Proceeds from
shares 0 0 0
Proceeds from
borrowings 102 62 53
Repayment of
borrowings -18 -34 -39
Interest paid fin -18 -21 -22
Dividends paid -11 -11 -11
Financial liabilities 0 0 -3
Other financing
items -0 -0 -0
Net Cash Flow -23 12 -2
Profit & Loss statement of 3 years
Figures in Rs. Crores
Particulars Mar 2018 Mar 2019 Mar 2020
Sales - 2,373 2,515 2,726
Sales Growth % 25.29% 5.97% 8.40%
Expenses - 2,628 2,458 3,108
Material Cost % 78% 75% 79%
Manufacturing Cost 6% 6% 6%
43
%
Employee Cost % 5% 6% 6%
Other Cost % 22% 11% 24%
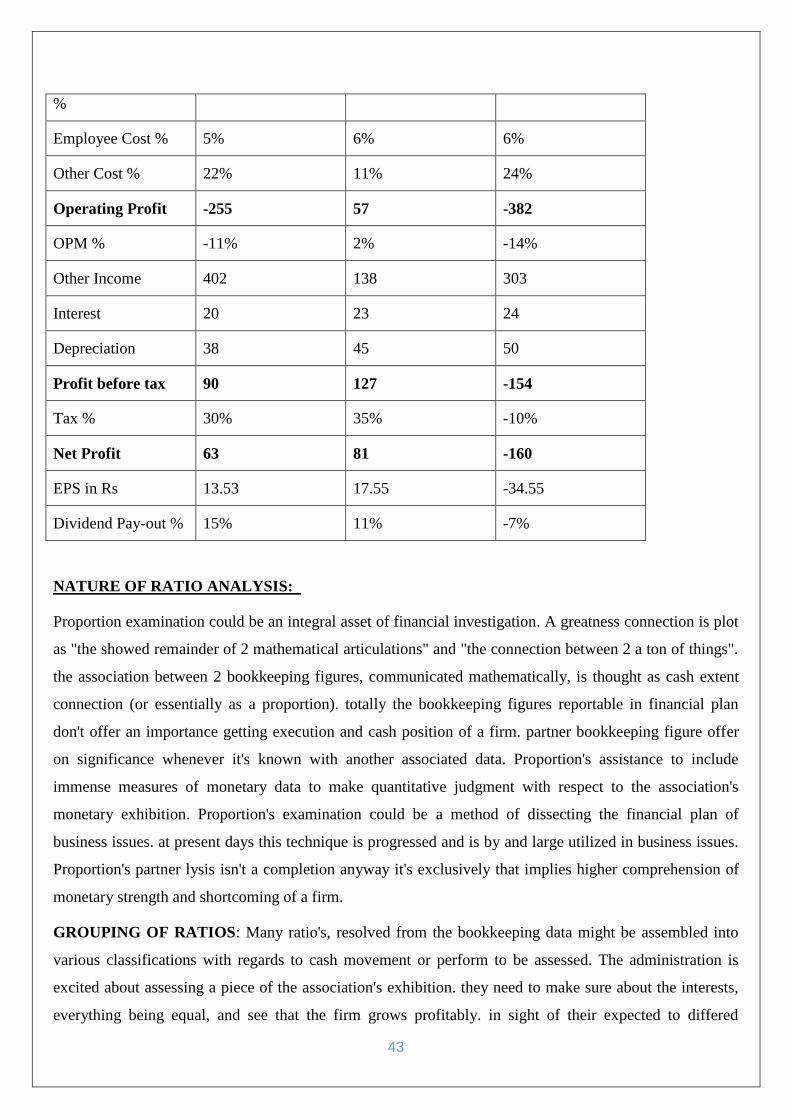
Operating Profit -255 57 -382
OPM % -11% 2% -14%
Other Income 402 138 303
Interest 20 23 24
Depreciation 38 45 50
Profit before tax 90 127 -154
Tax % 30% 35% -10%
Net Profit 63 81 -160
EPS in Rs 13.53 17.55 -34.55
Dividend Pay-out % 15% 11% -7%
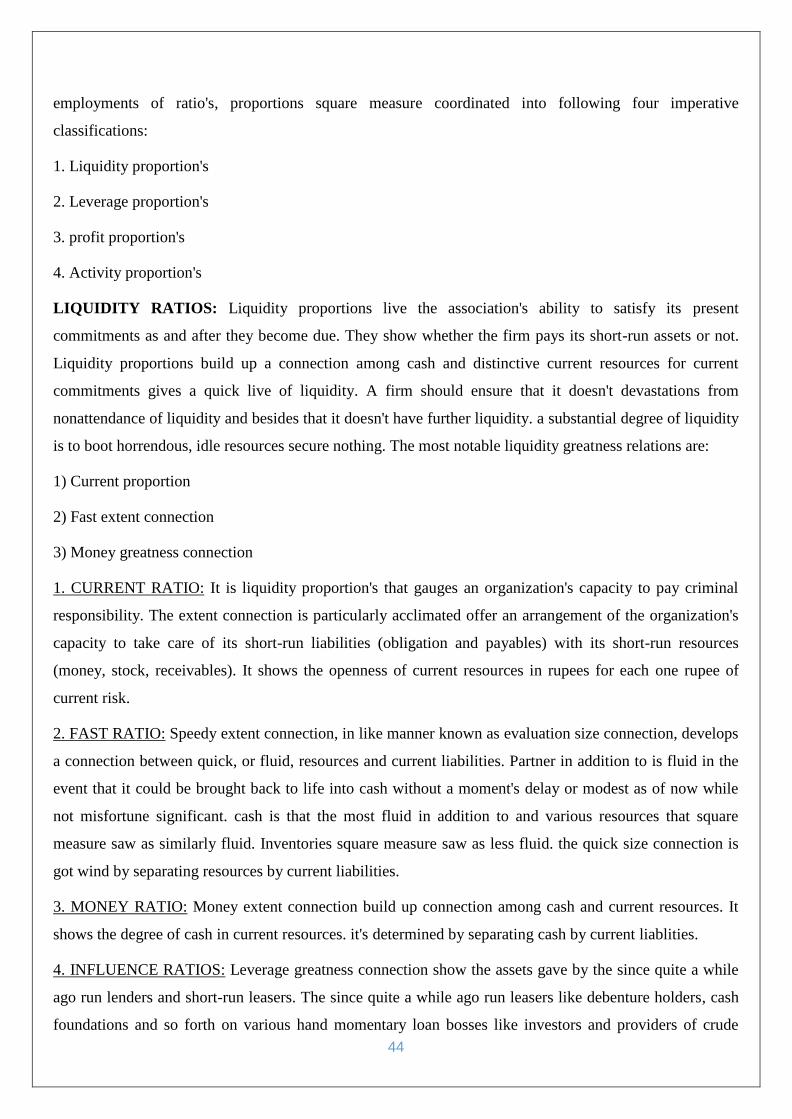
NATURE OF RATIO ANALYSIS:
Proportion examination could be an integral asset of financial investigation. A greatness connection is plot
as "the showed remainder of 2 mathematical articulations" and "the connection between 2 a ton of things".
the association between 2 bookkeeping figures, communicated mathematically, is thought as cash extent
connection (or essentially as a proportion). totally the bookkeeping figures reportable in financial plan
don't offer an importance getting execution and cash position of a firm. partner bookkeeping figure offer
on significance whenever it's known with another associated data. Proportion's assistance to include
immense measures of monetary data to make quantitative judgment with respect to the association's
monetary exhibition. Proportion's examination could be a method of dissecting the financial plan of
business issues. at present days this technique is progressed and is by and large utilized in business issues.
Proportion's partner lysis isn't a completion anyway it's exclusively that implies higher comprehension of
monetary strength and shortcoming of a firm.
GROUPING OF RATIOS: Many ratio's, resolved from the bookkeeping data might be assembled into
various classifications with regards to cash movement or perform to be assessed. The administration is
excited about assessing a piece of the association's exhibition. they need to make sure about the interests,
everything being equal, and see that the firm grows profitably. in sight of their expected to differed
44
employments of ratio's, proportions square measure coordinated into following four imperative
classifications:
1. Liquidity proportion's
2. Leverage proportion's
3. profit proportion's
4. Activity proportion's
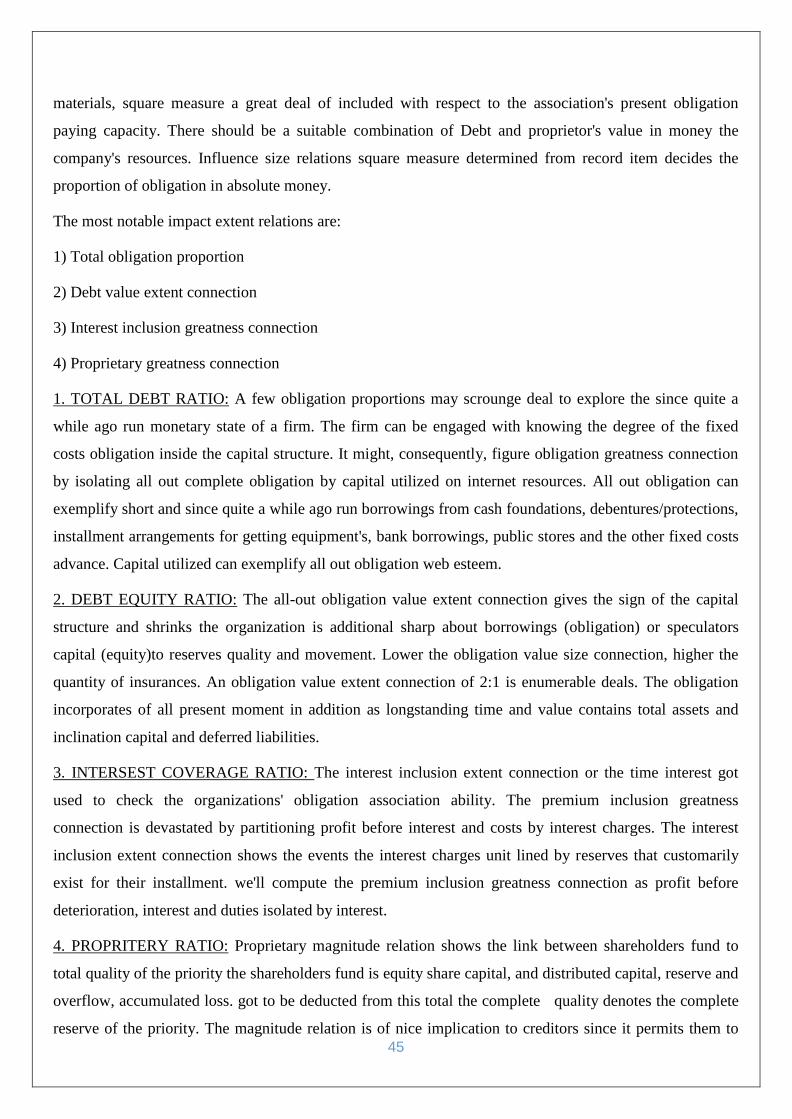
LIQUIDITY RATIOS: Liquidity proportions live the association's ability to satisfy its present
commitments as and after they become due. They show whether the firm pays its short-run assets or not.
Liquidity proportions build up a connection among cash and distinctive current resources for current
commitments gives a quick live of liquidity. A firm should ensure that it doesn't devastations from
nonattendance of liquidity and besides that it doesn't have further liquidity. a substantial degree of liquidity
is to boot horrendous, idle resources secure nothing. The most notable liquidity greatness relations are:
1) Current proportion
2) Fast extent connection
3) Money greatness connection
1. CURRENT RATIO: It is liquidity proportion's that gauges an organization's capacity to pay criminal
responsibility. The extent connection is particularly acclimated offer an arrangement of the organization's
capacity to take care of its short-run liabilities (obligation and payables) with its short-run resources
(money, stock, receivables). It shows the openness of current resources in rupees for each one rupee of
current risk.
2. FAST RATIO: Speedy extent connection, in like manner known as evaluation size connection, develops
a connection between quick, or fluid, resources and current liabilities. Partner in addition to is fluid in the
event that it could be brought back to life into cash without a moment's delay or modest as of now while
not misfortune significant. cash is that the most fluid in addition to and various resources that square
measure saw as similarly fluid. Inventories square measure saw as less fluid. the quick size connection is
got wind by separating resources by current liabilities.
3. MONEY RATIO: Money extent connection build up connection among cash and current resources. It
shows the degree of cash in current resources. it's determined by separating cash by current liablities.
4. INFLUENCE RATIOS: Leverage greatness connection show the assets gave by the since quite a while
ago run lenders and short-run leasers. The since quite a while ago run leasers like debenture holders, cash
foundations and so forth on various hand momentary loan bosses like investors and providers of crude
45
materials, square measure a great deal of included with respect to the association's present obligation
paying capacity. There should be a suitable combination of Debt and proprietor's value in money the
company's resources. Influence size relations square measure determined from record item decides the
proportion of obligation in absolute money.
The most notable impact extent relations are:
1) Total obligation proportion
2) Debt value extent connection
3) Interest inclusion greatness connection
4) Proprietary greatness connection
1. TOTAL DEBT RATIO: A few obligation proportions may scrounge deal to explore the since quite a
while ago run monetary state of a firm. The firm can be engaged with knowing the degree of the fixed
costs obligation inside the capital structure. It might, consequently, figure obligation greatness connection
by isolating all out complete obligation by capital utilized on internet resources. All out obligation can
exemplify short and since quite a while ago run borrowings from cash foundations, debentures/protections,
installment arrangements for getting equipment's, bank borrowings, public stores and the other fixed costs
advance. Capital utilized can exemplify all out obligation web esteem.
2. DEBT EQUITY RATIO: The all-out obligation value extent connection gives the sign of the capital
structure and shrinks the organization is additional sharp about borrowings (obligation) or speculators
capital (equity)to reserves quality and movement. Lower the obligation value size connection, higher the
quantity of insurances. An obligation value extent connection of 2:1 is enumerable deals. The obligation
incorporates of all present moment in addition as longstanding time and value contains total assets and
inclination capital and deferred liabilities.
3. INTERSEST COVERAGE RATIO: The interest inclusion extent connection or the time interest got
used to check the organizations' obligation association ability. The premium inclusion greatness
connection is devastated by partitioning profit before interest and costs by interest charges. The interest
inclusion extent connection shows the events the interest charges unit lined by reserves that customarily
exist for their installment. we'll compute the premium inclusion greatness connection as profit before
deterioration, interest and duties isolated by interest.
4. PROPRITERY RATIO: Proprietary magnitude relation shows the link between shareholders fund to
total quality of the priority the shareholders fund is equity share capital, and distributed capital, reserve and
overflow, accumulated loss. got to be deducted from this total the complete quality denotes the complete
reserve of the priority. The magnitude relation is of nice implication to creditors since it permits them to
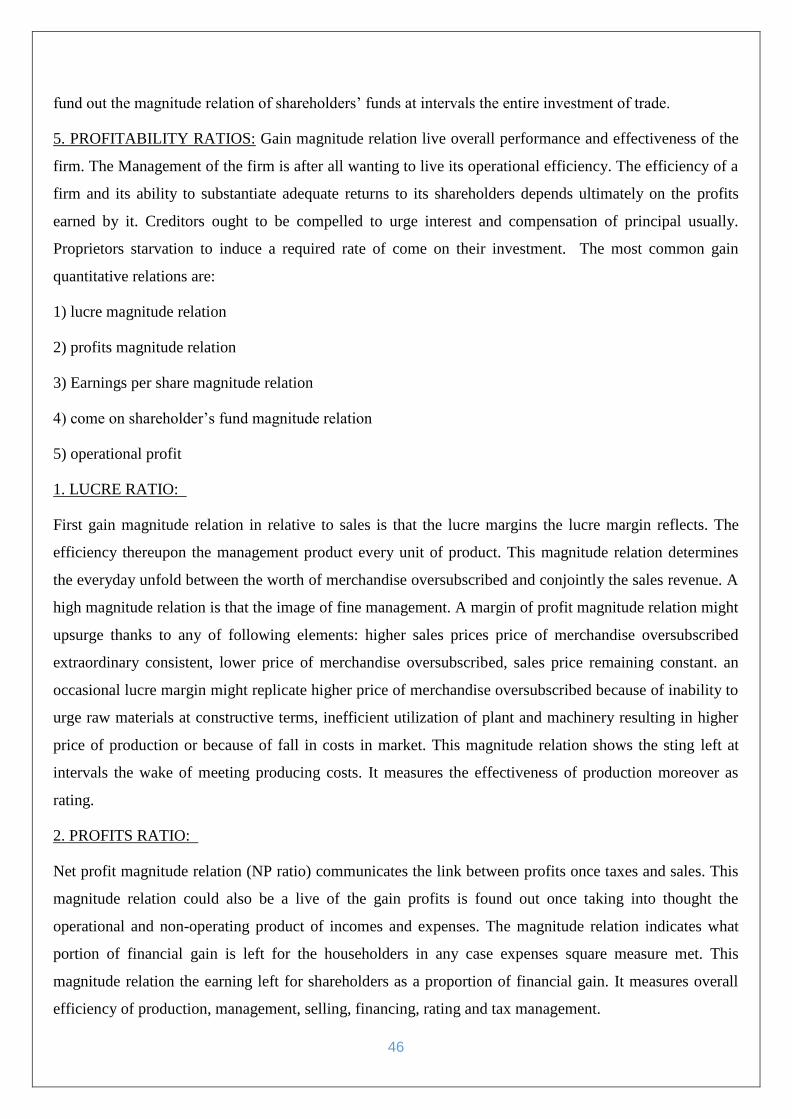
46
fund out the magnitude relation of shareholders’ funds at intervals the entire investment of trade.
5. PROFITABILITY RATIOS: Gain magnitude relation live overall performance and effectiveness of the
firm. The Management of the firm is after all wanting to live its operational efficiency. The efficiency of a
firm and its ability to substantiate adequate returns to its shareholders depends ultimately on the profits
earned by it. Creditors ought to be compelled to urge interest and compensation of principal usually.
Proprietors starvation to induce a required rate of come on their investment. The most common gain
quantitative relations are:
1) lucre magnitude relation
2) profits magnitude relation
3) Earnings per share magnitude relation
4) come on shareholder’s fund magnitude relation
5) operational profit
1. LUCRE RATIO:
First gain magnitude relation in relative to sales is that the lucre margins the lucre margin reflects. The
efficiency thereupon the management product every unit of product. This magnitude relation determines
the everyday unfold between the worth of merchandise oversubscribed and conjointly the sales revenue. A
high magnitude relation is that the image of fine management. A margin of profit magnitude relation might
upsurge thanks to any of following elements: higher sales prices price of merchandise oversubscribed
extraordinary consistent, lower price of merchandise oversubscribed, sales price remaining constant. an
occasional lucre margin might replicate higher price of merchandise oversubscribed because of inability to
urge raw materials at constructive terms, inefficient utilization of plant and machinery resulting in higher
price of production or because of fall in costs in market. This magnitude relation shows the sting left at
intervals the wake of meeting producing costs. It measures the effectiveness of production moreover as
rating.
2. PROFITS RATIO:
Net profit magnitude relation (NP ratio) communicates the link between profits once taxes and sales. This
magnitude relation could also be a live of the gain profits is found out once taking into thought the
operational and non-operating product of incomes and expenses. The magnitude relation indicates what
portion of financial gain is left for the householders in any case expenses square measure met. This
magnitude relation the earning left for shareholders as a proportion of financial gain. It measures overall
efficiency of production, management, selling, financing, rating and tax management.
47
3. OPERATING RATIO:
This magnitude relation communicates the link between operational profit and sales. it's functioned out by
dividing operational profit by financial gain. With the assistance of this magnitude relation, one can opt for
the chief efficiency which may not be reflected at intervals the profits magnitude relation.
4. EARNING PER SHARE:
The company profit per share (EPS) magnitude relation enable uSSs. to measure earnings in connexion
every share on issue. This magnitude relation is importance as a result of as a capitalist space unit your
owner in associate company every share is reflective of this EPS demonstrates what proportion every offer
you own has procured (or) will earn if we've got a bent to square measure relating prospective EPS.
5. COME ON SHAREHOLDERS INVESTMENT RATIO:
Profit for investors' venture greatness connection could likewise be a live of by and large addition of the
exchange and is figured by isolating web acquire once revenue and duty by normal investors' value. it's
generally named as gone ahead all out value (ROTE) size connection and are accessible back on total
assets extent connection. The size connection is frequently communicated in extent.
6. DIVIDEND PAYOUT RATIO: Dividend pay-out magnitude relation discloses what portion of this
earnings the company is paying to its stockholders at intervals the fashion of dividend and what portion the
company is cultivation back at intervals the trade for growth in future. it's computed by dividing the
dividend per share by the earnings per share (EPS) for a selected quantity.
7. ACTIVITY MAGNITUDE RELATION OR TURNOVER RATIO: Movement extent connection are
included anyway quickly the resources of the firm are dealt with these proportions absolute connection
between the level of deals and interest in various resources inventories, resources, mounted resources, and
so on Action proportions are locked in to check the intensity with that the firm oversees and endeavor its
resources. the higher administration of furthermore, and hence the bigger amount of deals. These
proportions are otherwise called flip over proportions because of they show the speed with that resources
are reawakened into deals.
The most common turnover magnitude relations are:
1) Debtors turnover ratio
2) Credit turnover magnitude relation
3) assets turnover magnitude relation
4) Total plus turnover magnitude relation
5) Inventory turnover magnitude relation
48
1. DEBTORS TURNOVER RATIO: The assets turnover magnitude relation, additionally called the
debtor’s turnover magnitude relation, is Associate in Nursing potency magnitude relation that estimates
however expeditiously an organization is utilizing its assets. The assets turnover magnitude relation
measures the number of times over a given amount that an organization collects its average assets.
2. CREDIT TURNOVER RATIO: The indebtedness turnover magnitude relation, otherwise known as the
liability’s turnover or the creditors turnover magnitude relation, may be a liquidity magnitude relation that
measures what number times an organization
Pays its creditors over Associate in Nursing accounting amount. The accounts owed turnover magnitude
relation may be a live of short liquidity, with the next owed turnover magnitude relation being a lot of
favourable.
3. ASSETS TURNOVER RATIO: The assets turnover magnitude relation is additionally brought up as
income to assets. It indicates a company’s effectiveness in utilizing its assets. The assets turnover
magnitude relation is calculated as follows: internet annual sales divided by the common quantity of assets
throughout the same 12-month amount.
4. TOTAL PLUS TURNOVER RATIO: The plus turnover magnitude relation may be a potency
magnitude relation that measures a company's ability to come up with sales from its assets by scrutiny
income with average total assets. At the tip of the day, this magnitude relation shows however
expeditiously an organization will utilize its assets to come up with sales.
5. INVENTORY TURNOVER RATIO: The inventory turnover magnitude relation is Associate in nursing
potency magnitude relation that shows however effectively inventory is managed by scrutiny value of
products sold-out with average inventory for an amount. This measures what number times average
inventory is "turned" or sold-out throughout an amount.
49
DATA ANALYSIS AND INTERPRETATION:
Nestle
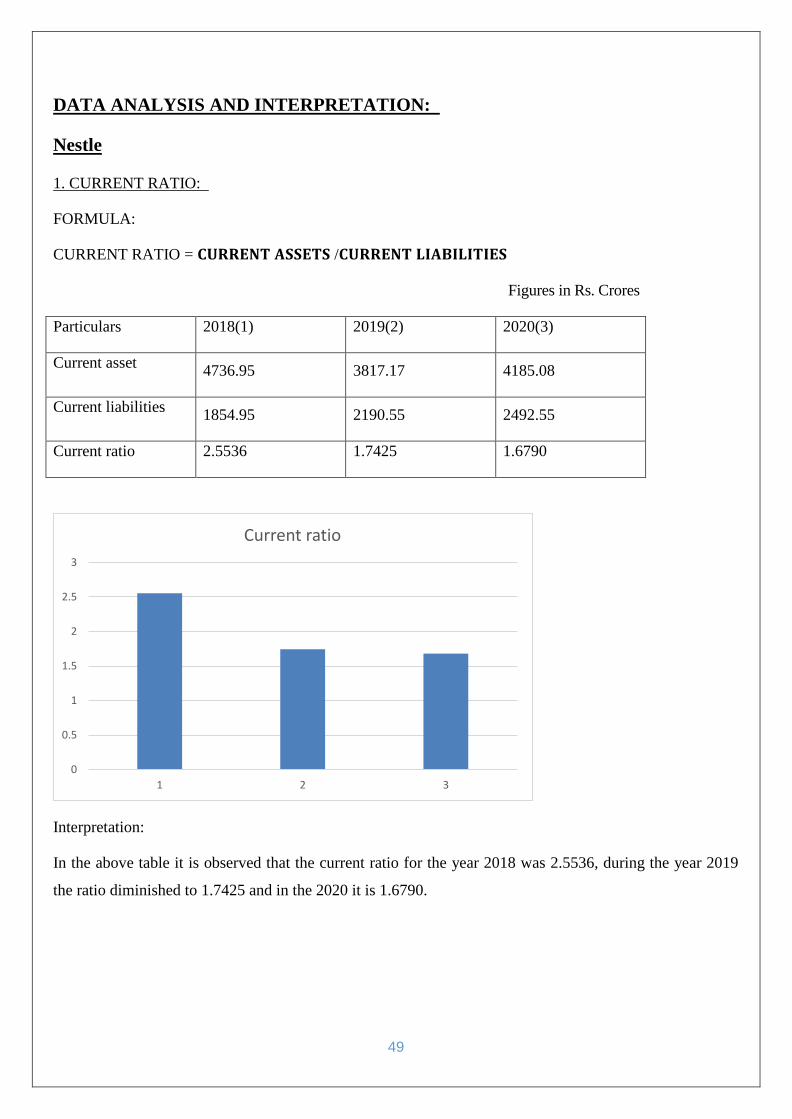
1. CURRENT RATIO:
FORMULA:
CURRENT RATIO = 𝐂𝐔𝐑𝐑𝐄𝐍𝐓 𝐀𝐒𝐒𝐄𝐓𝐒 /𝐂𝐔𝐑𝐑𝐄𝐍𝐓 𝐋𝐈𝐀𝐁𝐈𝐋𝐈𝐓𝐈𝐄𝐒
Figures in Rs. Crores
Particulars 2018(1) 2019(2) 2020(3)
Current asset 4736.95 3817.17 4185.08
Current liabilities 1854.95 2190.55 2492.55
Current ratio 2.5536 1.7425 1.6790
Interpretation:
In the above table it is observed that the current ratio for the year 2018 was 2.5536, during the year 2019
the ratio diminished to 1.7425 and in the 2020 it is 1.6790.
0
0.5
1
1.5
2
2.5
3
1 2 3
Current ratio
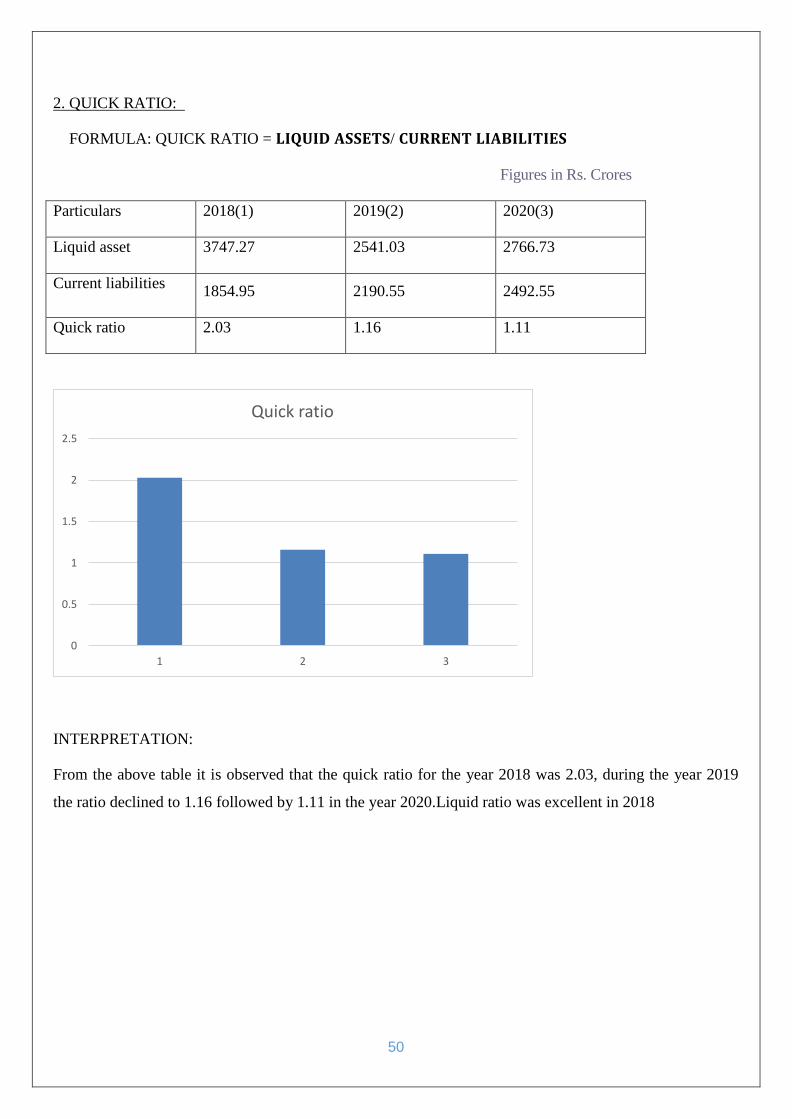
50
2. QUICK RATIO:
FORMULA: QUICK RATIO = 𝐋𝐈𝐐𝐔𝐈𝐃 𝐀𝐒𝐒𝐄𝐓𝐒/ 𝐂𝐔𝐑𝐑𝐄𝐍𝐓 𝐋𝐈𝐀𝐁𝐈𝐋𝐈𝐓𝐈𝐄𝐒
Figures in Rs. Crores
Particulars 2018(1) 2019(2) 2020(3)
Liquid asset 3747.27 2541.03 2766.73
Current liabilities 1854.95 2190.55 2492.55
Quick ratio 2.03 1.16 1.11
INTERPRETATION:
From the above table it is observed that the quick ratio for the year 2018 was 2.03, during the year 2019
the ratio declined to 1.16 followed by 1.11 in the year 2020.Liquid ratio was excellent in 2018
0
0.5
1
1.5
2
2.5
1 2 3
Quick ratio
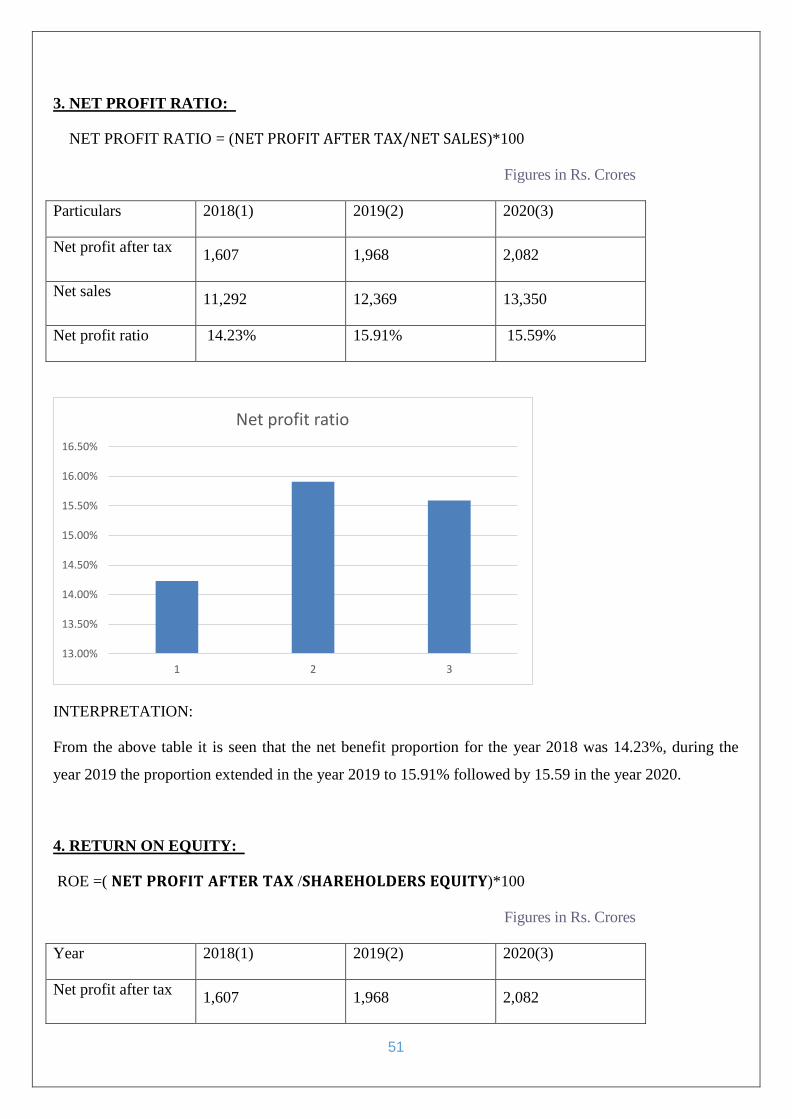
51
3. NET PROFIT RATIO:
NET PROFIT RATIO = (NET PROFIT AFTER TAX/NET SALES)*100
Figures in Rs. Crores
Particulars 2018(1) 2019(2) 2020(3)
Net profit after tax 1,607 1,968 2,082
Net sales 11,292 12,369 13,350
Net profit ratio 14.23% 15.91% 15.59%
INTERPRETATION:
From the above table it is seen that the net benefit proportion for the year 2018 was 14.23%, during the
year 2019 the proportion extended in the year 2019 to 15.91% followed by 15.59 in the year 2020.
4. RETURN ON EQUITY:
ROE =( 𝐍𝐄𝐓 𝐏𝐑𝐎𝐅𝐈𝐓 𝐀𝐅𝐓𝐄𝐑 𝐓𝐀𝐗 /𝐒𝐇𝐀𝐑𝐄𝐇𝐎𝐋𝐃𝐄𝐑𝐒 𝐄𝐐𝐔𝐈𝐓𝐘)*100
Figures in Rs. Crores
Year 2018(1) 2019(2) 2020(3)
Net profit after tax 1,607 1,968 2,082
13.00%
13.50%
14.00%
14.50%
15.00%
15.50%
16.00%
16.50%
1 2 3
Net profit ratio
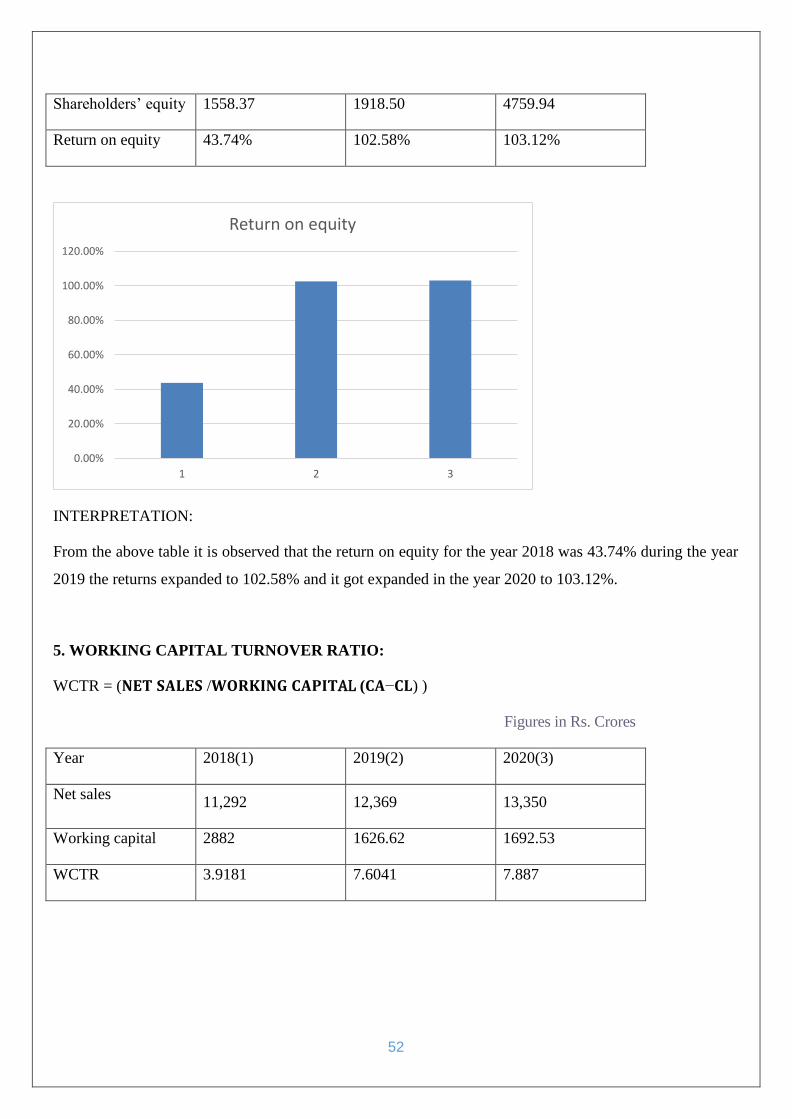
52
Shareholders’ equity 1558.37 1918.50 4759.94
Return on equity 43.74% 102.58% 103.12%
INTERPRETATION:
From the above table it is observed that the return on equity for the year 2018 was 43.74% during the year
2019 the returns expanded to 102.58% and it got expanded in the year 2020 to 103.12%.
5. WORKING CAPITAL TURNOVER RATIO:
WCTR = (𝐍𝐄𝐓 𝐒𝐀𝐋𝐄𝐒 /𝐖𝐎𝐑𝐊𝐈𝐍𝐆 𝐂𝐀𝐏𝐈𝐓AL (𝐂𝐀−𝐂𝐋) )
Figures in Rs. Crores
Year 2018(1) 2019(2) 2020(3)
Net sales 11,292 12,369 13,350
Working capital 2882 1626.62 1692.53
WCTR 3.9181 7.6041 7.887
0.00%
20.00%
40.00%
60.00%
80.00%
100.00%
120.00%
1 2 3
Return on equity
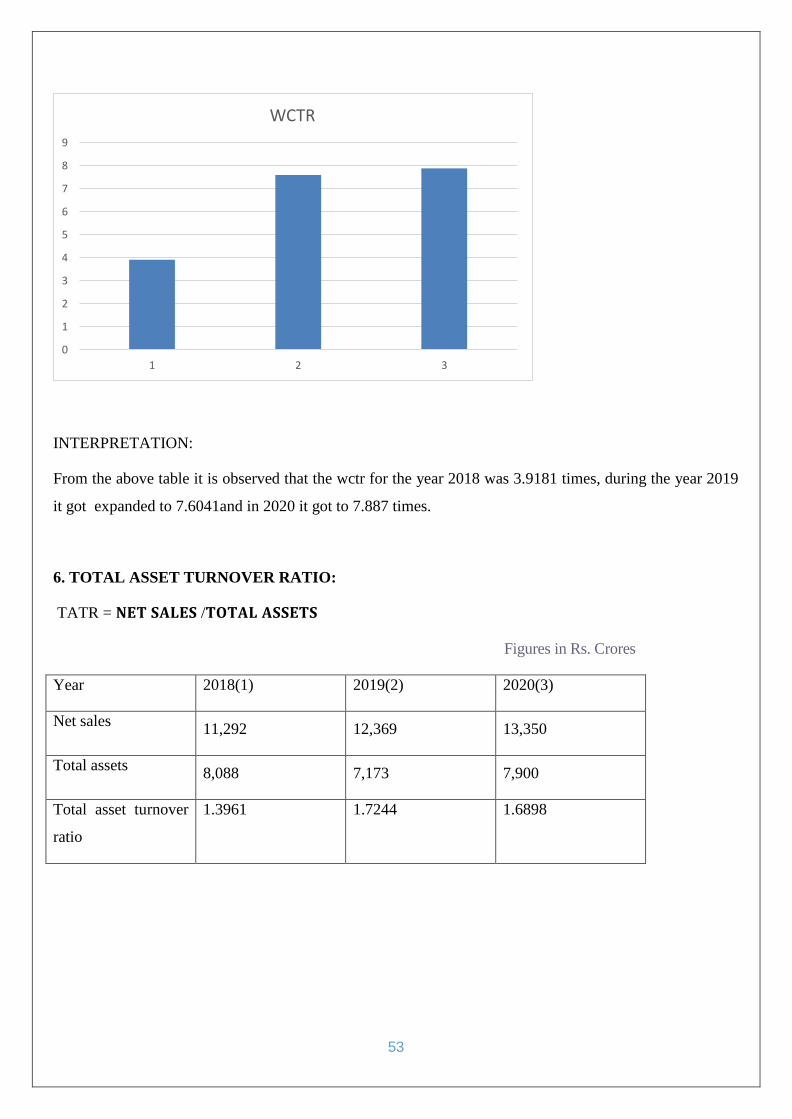
53
INTERPRETATION:
From the above table it is observed that the wctr for the year 2018 was 3.9181 times, during the year 2019
it got expanded to 7.6041and in 2020 it got to 7.887 times.
6. TOTAL ASSET TURNOVER RATIO:
TATR = 𝐍𝐄𝐓 𝐒𝐀𝐋𝐄𝐒 /𝐓𝐎𝐓𝐀𝐋 𝐀𝐒𝐒𝐄𝐓𝐒
Figures in Rs. Crores
Year 2018(1) 2019(2) 2020(3)
Net sales 11,292 12,369 13,350
Total assets 8,088 7,173 7,900
Total asset turnover
ratio
1.3961 1.7244 1.6898
0
1
2
3
4
5
6
7
8
9
1 2 3
WCTR
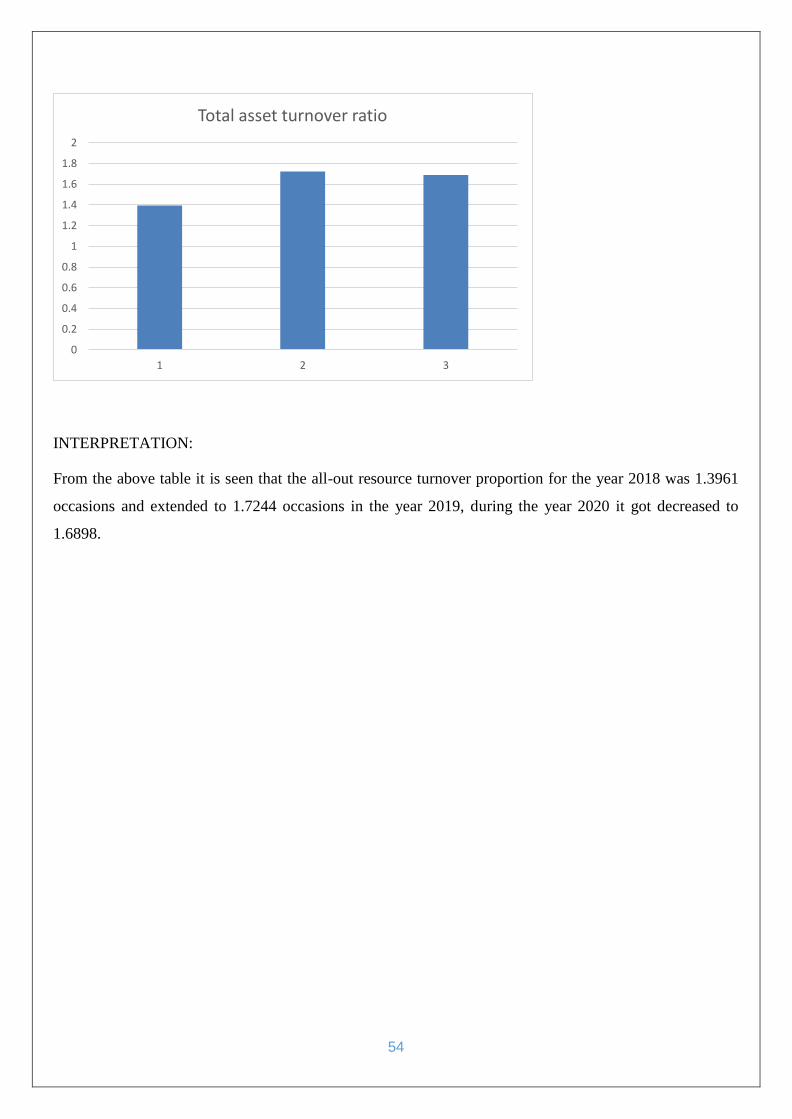
54
INTERPRETATION:
From the above table it is seen that the all-out resource turnover proportion for the year 2018 was 1.3961
occasions and extended to 1.7244 occasions in the year 2019, during the year 2020 it got decreased to
1.6898.
0
0.2
0.4
0.6
0.8
1
1.2
1.4
1.6
1.8
2
1 2 3
Total asset turnover ratio
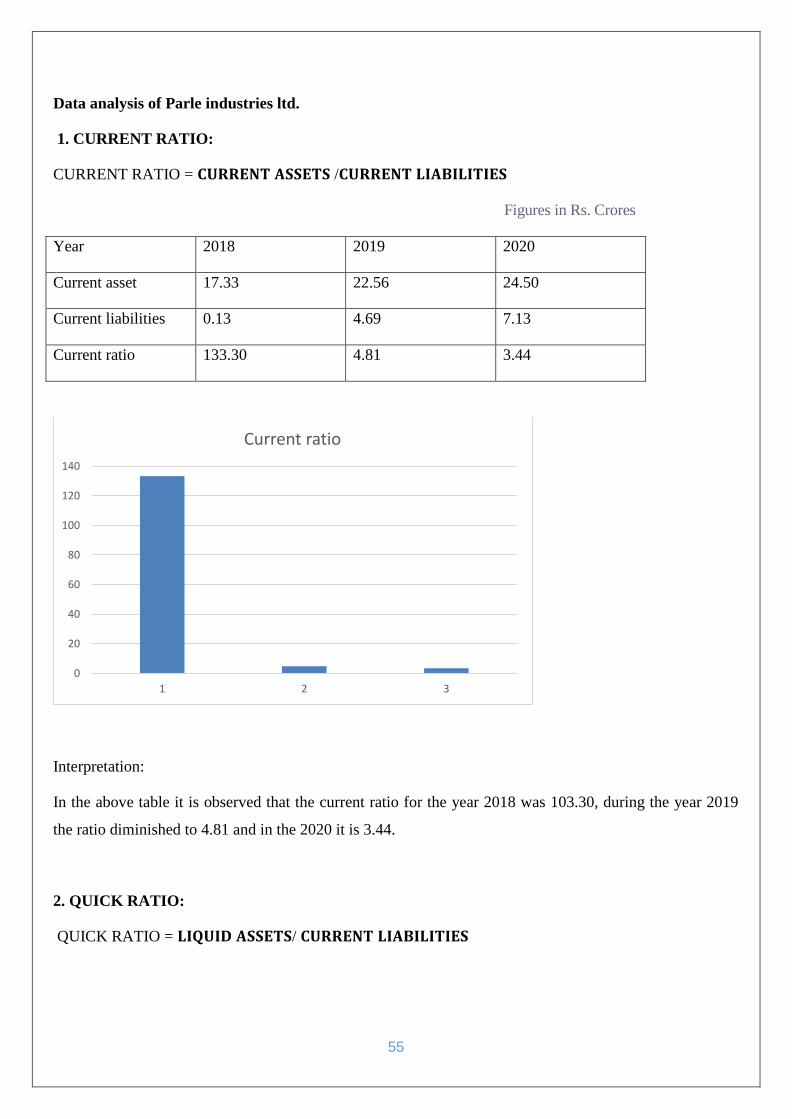
55
Data analysis of Parle industries ltd.
1. CURRENT RATIO:
CURRENT RATIO = 𝐂𝐔𝐑𝐑𝐄𝐍𝐓 𝐀𝐒𝐒𝐄𝐓𝐒 /𝐂𝐔𝐑𝐑𝐄𝐍𝐓 𝐋𝐈𝐀𝐁𝐈𝐋𝐈𝐓𝐈𝐄𝐒
Figures in Rs. Crores
Year 2018 2019 2020
Current asset 17.33 22.56 24.50
Current liabilities 0.13 4.69 7.13
Current ratio 133.30 4.81 3.44
Interpretation:
In the above table it is observed that the current ratio for the year 2018 was 103.30, during the year 2019
the ratio diminished to 4.81 and in the 2020 it is 3.44.
2. QUICK RATIO:
QUICK RATIO = 𝐋𝐈𝐐𝐔𝐈𝐃 𝐀𝐒𝐒𝐄𝐓𝐒/ 𝐂𝐔𝐑𝐑𝐄𝐍𝐓 𝐋𝐈𝐀𝐁𝐈𝐋𝐈𝐓𝐈𝐄𝐒
0
20
40
60
80
100
120
140
1 2 3
Current ratio
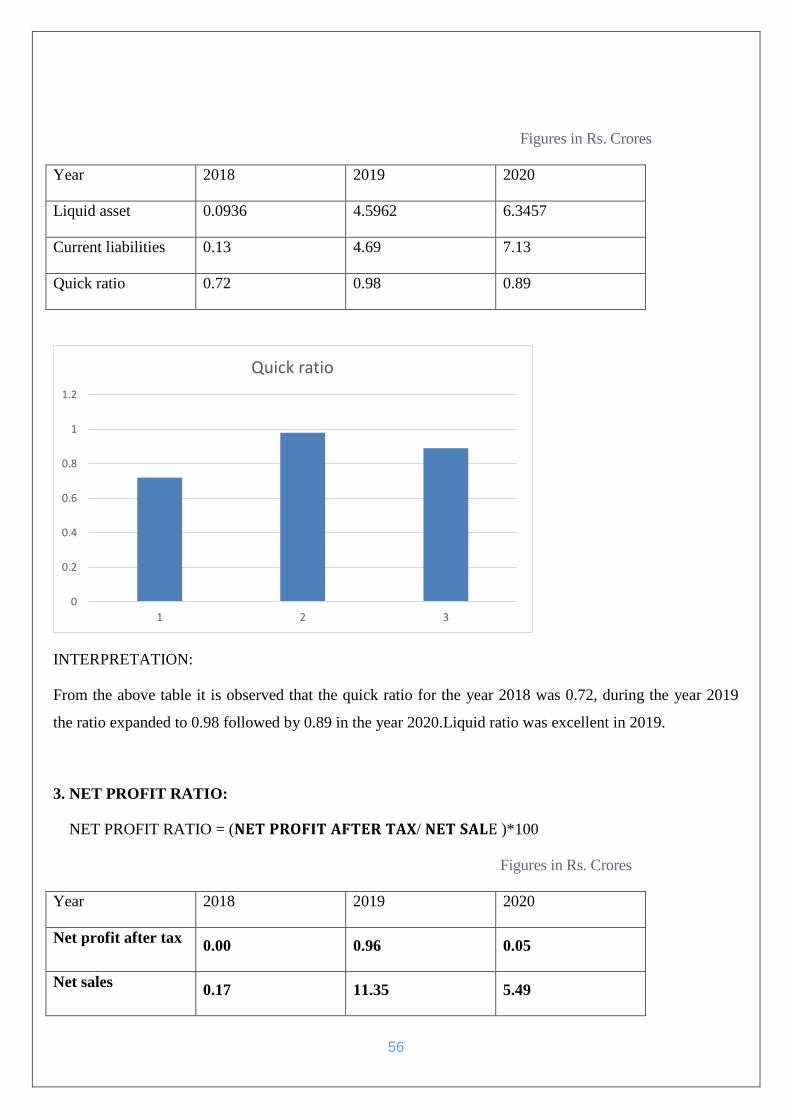
56
Figures in Rs. Crores
Year 2018 2019 2020
Liquid asset 0.0936 4.5962 6.3457
Current liabilities 0.13 4.69 7.13
Quick ratio 0.72 0.98 0.89
INTERPRETATION:
From the above table it is observed that the quick ratio for the year 2018 was 0.72, during the year 2019
the ratio expanded to 0.98 followed by 0.89 in the year 2020.Liquid ratio was excellent in 2019.
3. NET PROFIT RATIO:
NET PROFIT RATIO = (𝐍𝐄𝐓 𝐏𝐑𝐎𝐅𝐈𝐓 𝐀𝐅𝐓𝐄𝐑 𝐓𝐀𝐗/ 𝐍𝐄𝐓 𝐒𝐀𝐋E )*100
Figures in Rs. Crores
Year 2018 2019 2020
Net profit after tax 0.00 0.96 0.05
Net sales 0.17 11.35 5.49
0
0.2
0.4
0.6
0.8
1
1.2
1 2 3
Quick ratio
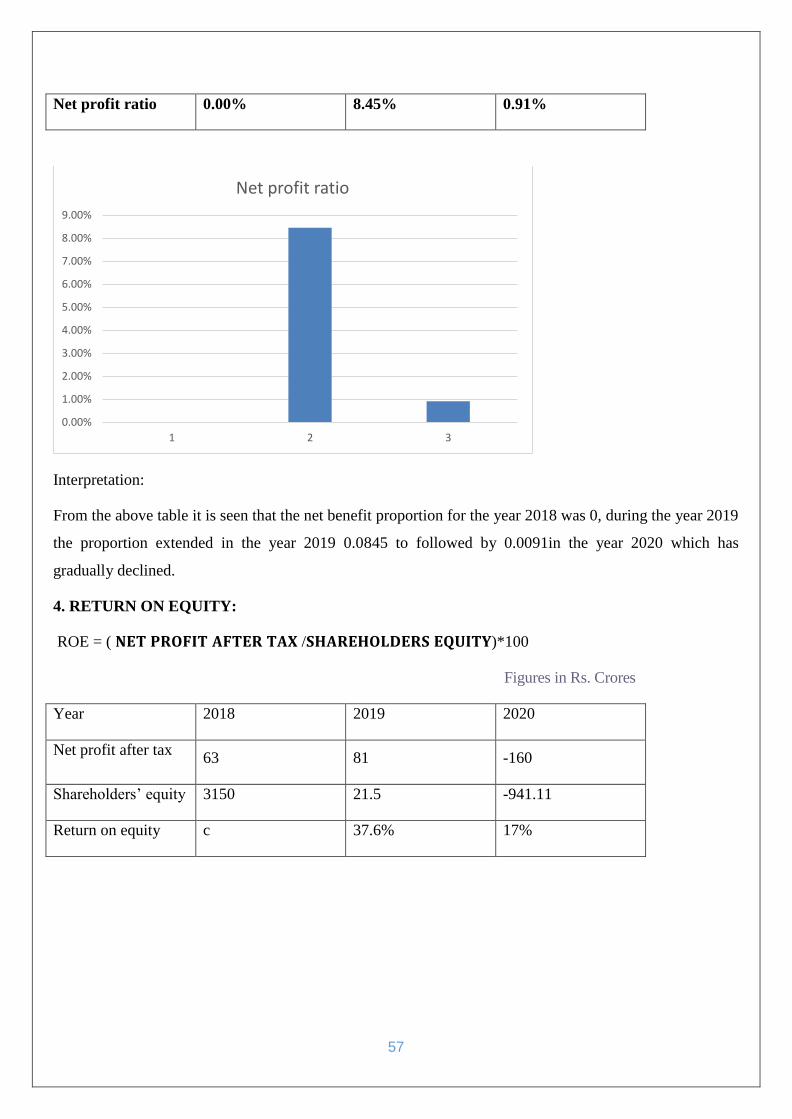
57
Net profit ratio 0.00% 8.45% 0.91%
Interpretation:
From the above table it is seen that the net benefit proportion for the year 2018 was 0, during the year 2019
the proportion extended in the year 2019 0.0845 to followed by 0.0091in the year 2020 which has
gradually declined.
4. RETURN ON EQUITY:
ROE = ( 𝐍𝐄𝐓 𝐏𝐑𝐎𝐅𝐈𝐓 𝐀𝐅𝐓𝐄𝐑 𝐓𝐀𝐗 /𝐒𝐇𝐀𝐑𝐄𝐇𝐎𝐋𝐃𝐄𝐑𝐒 𝐄𝐐𝐔𝐈𝐓𝐘)*100
Figures in Rs. Crores
Year 2018 2019 2020
Net profit after tax 63 81 -160
Shareholders’ equity 3150 21.5 -941.11
Return on equity c 37.6% 17%
0.00%
1.00%
2.00%
3.00%
4.00%
5.00%
6.00%
7.00%
8.00%
9.00%
1 2 3
Net profit ratio

58
INTERPRETATION:
From the above table it is observed that the return on equity for the year 2018 was 0.02 during the year
2019 the returns expanded to 3.76 and it got decreased by in the year 2020 to 0.17%.
5. WORKING CAPITAL TURNOVER RATIO:
WCTR = (𝐍𝐄𝐓 𝐒𝐀𝐋𝐄𝐒 /𝐖𝐎𝐑𝐊𝐈𝐍𝐆 𝐂𝐀𝐏𝐈𝐓AL (𝐂𝐀−𝐂𝐋) )
Figures in Rs. Crores
Year 2018 2019 2020
Net sales 0.17 11.35 5.49
Working capital 17.2 17.87 17.37
Working capital
turnover ratio
0.0098 0.6351 0.3160
0%
5%
10%
15%
20%
25%
30%
35%
40%
1 2 3
Return on equity
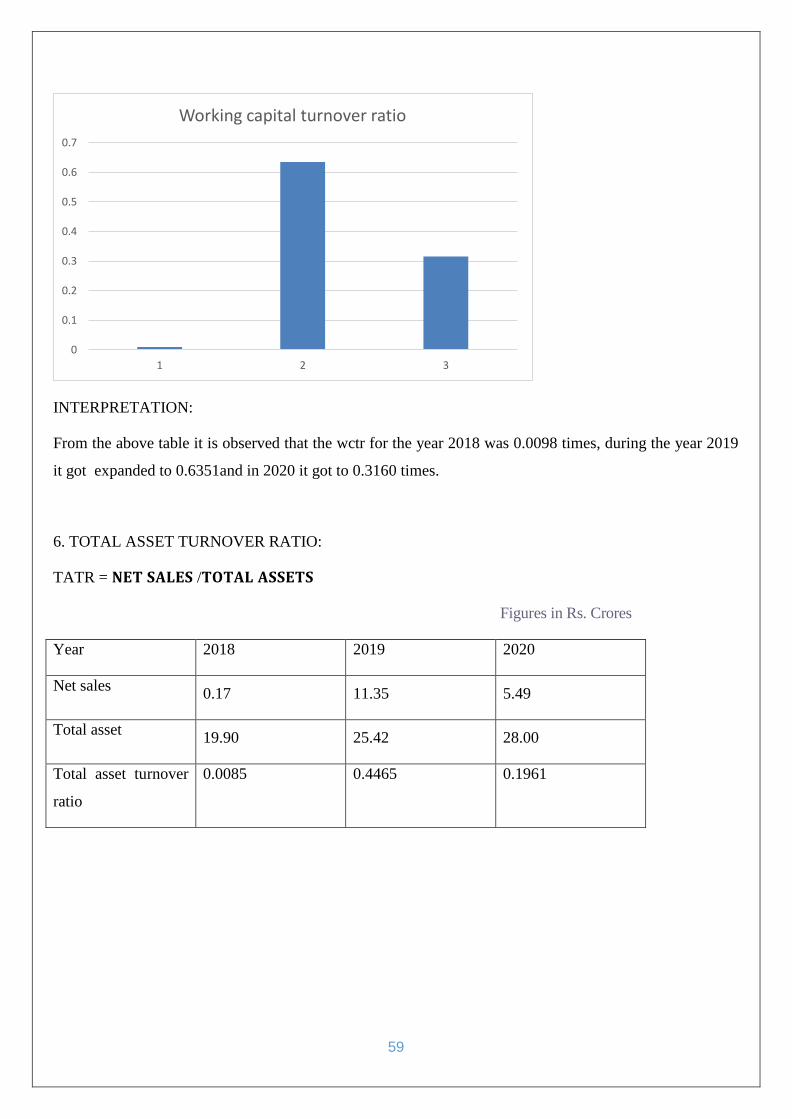
59
INTERPRETATION:
From the above table it is observed that the wctr for the year 2018 was 0.0098 times, during the year 2019
it got expanded to 0.6351and in 2020 it got to 0.3160 times.
6. TOTAL ASSET TURNOVER RATIO:
TATR = 𝐍𝐄𝐓 𝐒𝐀𝐋𝐄𝐒 /𝐓𝐎𝐓𝐀𝐋 𝐀𝐒𝐒𝐄𝐓𝐒
Figures in Rs. Crores
Year 2018 2019 2020
Net sales 0.17 11.35 5.49
Total asset 19.90 25.42 28.00
Total asset turnover
ratio
0.0085 0.4465 0.1961
0
0.1
0.2
0.3
0.4
0.5
0.6
0.7
1 2 3
Working capital turnover ratio
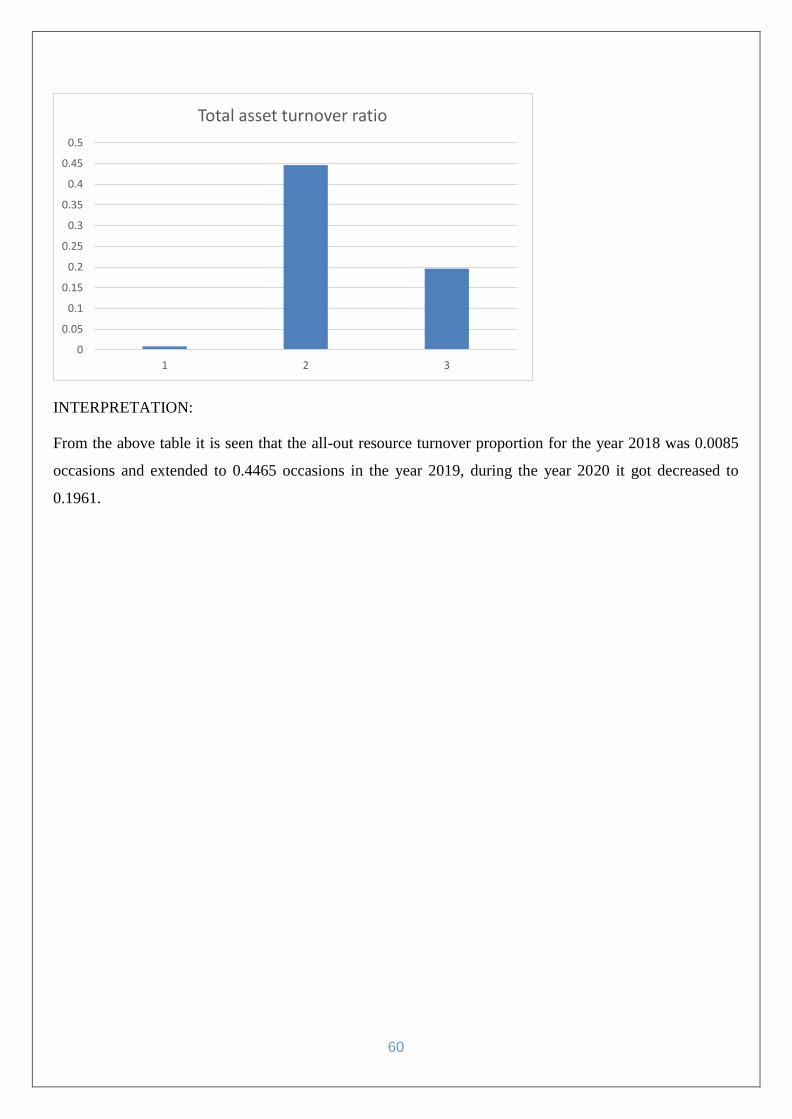
60
INTERPRETATION:
From the above table it is seen that the all-out resource turnover proportion for the year 2018 was 0.0085
occasions and extended to 0.4465 occasions in the year 2019, during the year 2020 it got decreased to
0.1961.
0
0.05
0.1
0.15
0.2
0.25
0.3
0.35
0.4
0.45
0.5
1 2 3
Total asset turnover ratio
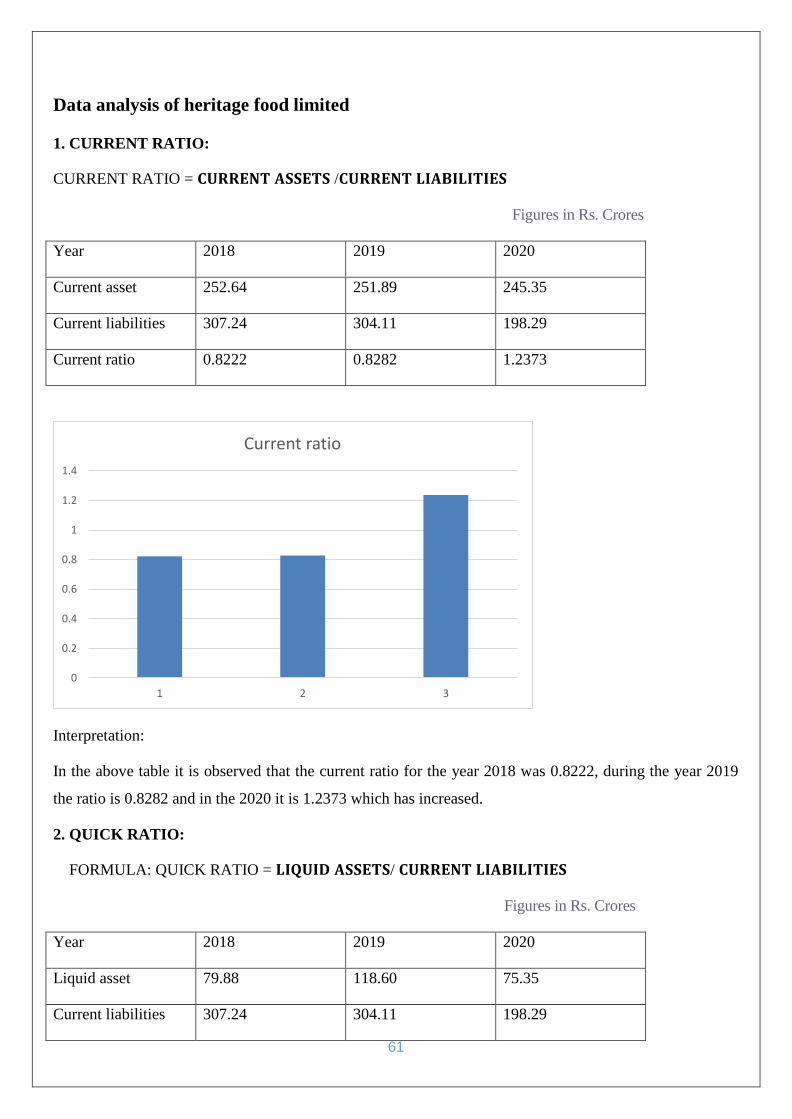
61
Data analysis of heritage food limited
1. CURRENT RATIO:
CURRENT RATIO = 𝐂𝐔𝐑𝐑𝐄𝐍𝐓 𝐀𝐒𝐒𝐄𝐓𝐒 /𝐂𝐔𝐑𝐑𝐄𝐍𝐓 𝐋𝐈𝐀𝐁𝐈𝐋𝐈𝐓𝐈𝐄𝐒
Figures in Rs. Crores
Year 2018 2019 2020
Current asset 252.64 251.89 245.35
Current liabilities 307.24 304.11 198.29
Current ratio 0.8222 0.8282 1.2373
Interpretation:
In the above table it is observed that the current ratio for the year 2018 was 0.8222, during the year 2019
the ratio is 0.8282 and in the 2020 it is 1.2373 which has increased.
2. QUICK RATIO:
FORMULA: QUICK RATIO = 𝐋𝐈𝐐𝐔𝐈𝐃 𝐀𝐒𝐒𝐄𝐓𝐒/ 𝐂𝐔𝐑𝐑𝐄𝐍𝐓 𝐋𝐈𝐀𝐁𝐈𝐋𝐈𝐓𝐈𝐄𝐒
Figures in Rs. Crores
Year 2018 2019 2020
Liquid asset 79.88 118.60 75.35
Current liabilities 307.24 304.11 198.29
0
0.2
0.4
0.6
0.8
1
1.2
1.4
1 2 3
Current ratio
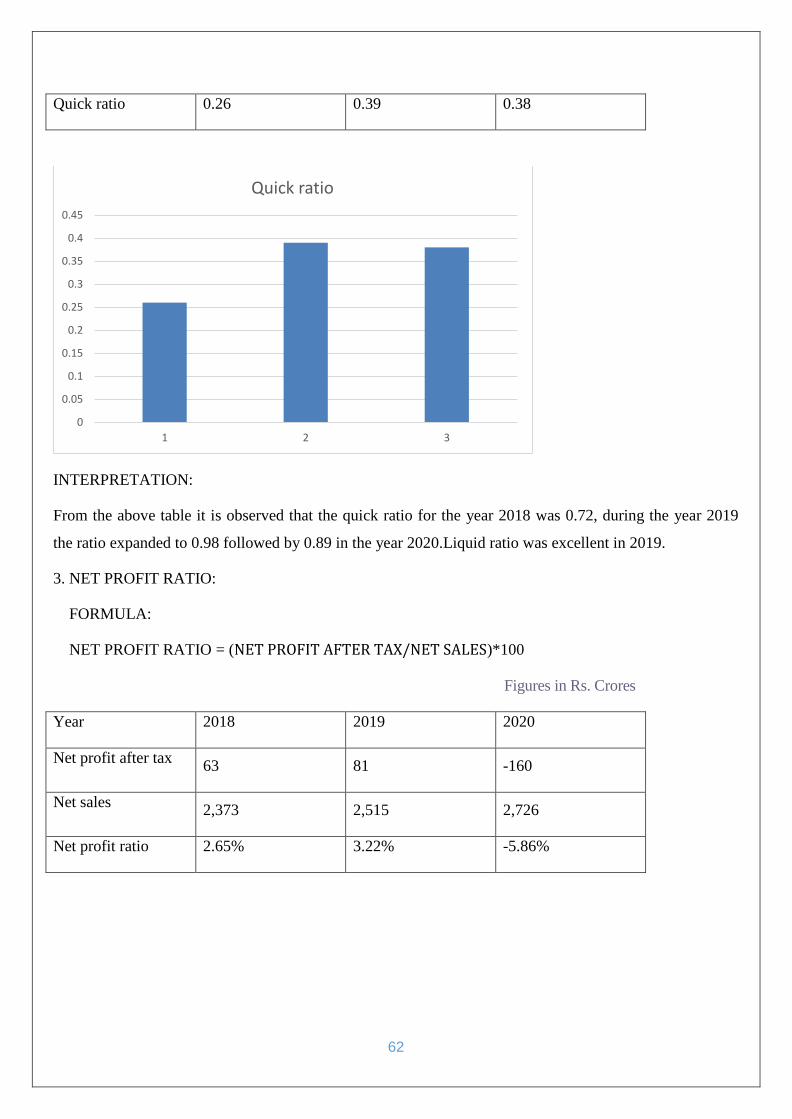
62
Quick ratio 0.26 0.39 0.38
INTERPRETATION:
From the above table it is observed that the quick ratio for the year 2018 was 0.72, during the year 2019
the ratio expanded to 0.98 followed by 0.89 in the year 2020.Liquid ratio was excellent in 2019.
3. NET PROFIT RATIO:
FORMULA:
NET PROFIT RATIO = (NET PROFIT AFTER TAX/NET SALES)*100
Figures in Rs. Crores
Year 2018 2019 2020
Net profit after tax 63 81 -160
Net sales 2,373 2,515 2,726
Net profit ratio 2.65% 3.22% -5.86%
0
0.05
0.1
0.15
0.2
0.25
0.3
0.35
0.4
0.45
1 2 3
Quick ratio
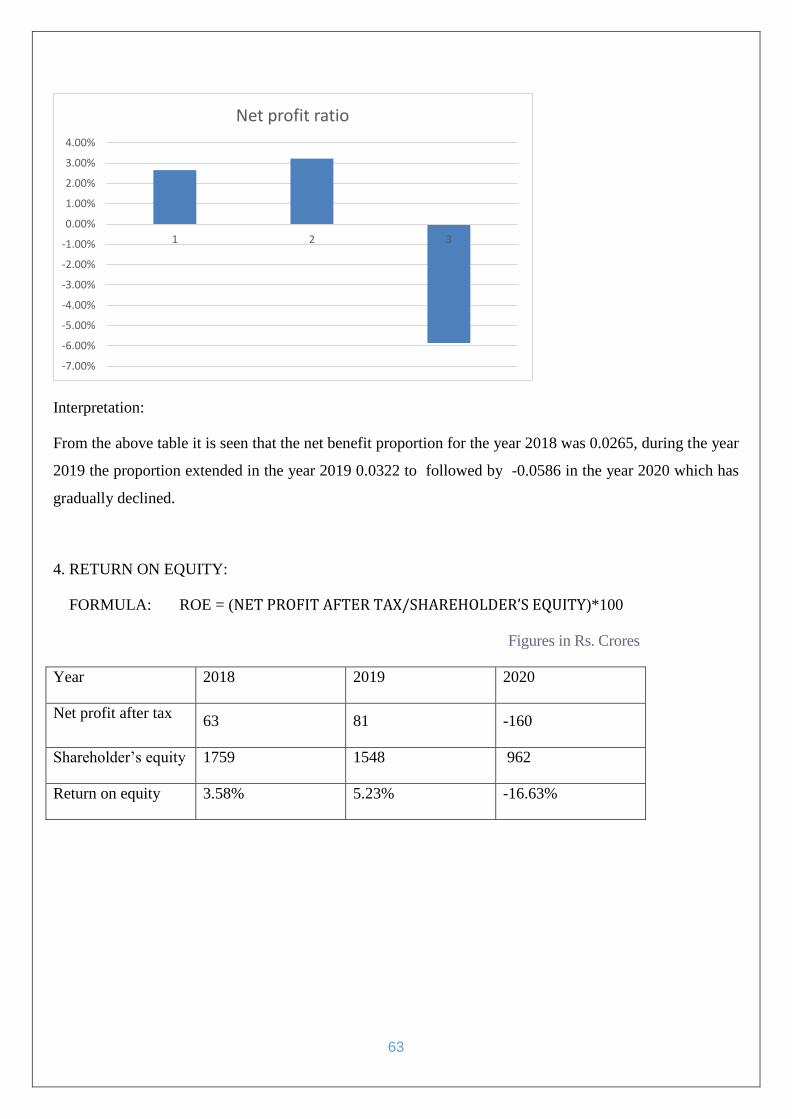
63
Interpretation:
From the above table it is seen that the net benefit proportion for the year 2018 was 0.0265, during the year
2019 the proportion extended in the year 2019 0.0322 to followed by -0.0586 in the year 2020 which has
gradually declined.
4. RETURN ON EQUITY:
FORMULA: ROE = (NET PROFIT AFTER TAX/SHAREHOLDER’S EQUITY)*100
Figures in Rs. Crores
Year 2018 2019 2020
Net profit after tax 63 81 -160
Shareholder’s equity 1759 1548 962
Return on equity 3.58% 5.23% -16.63%
-7.00%
-6.00%
-5.00%
-4.00%
-3.00%
-2.00%
-1.00%
0.00%
1.00%
2.00%
3.00%
4.00%
1 2 3
Net profit ratio
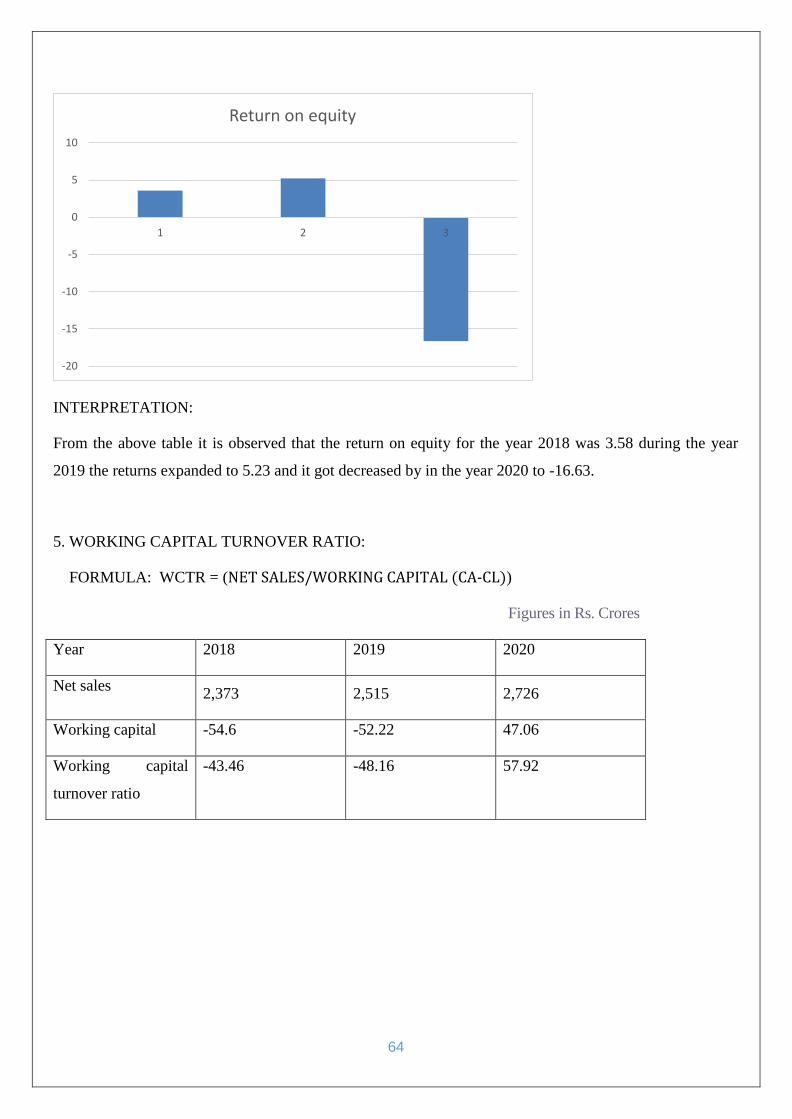
64
INTERPRETATION:
From the above table it is observed that the return on equity for the year 2018 was 3.58 during the year
2019 the returns expanded to 5.23 and it got decreased by in the year 2020 to -16.63.
5. WORKING CAPITAL TURNOVER RATIO:
FORMULA: WCTR = (NET SALES/WORKING CAPITAL (CA-CL))
Figures in Rs. Crores
Year 2018 2019 2020
Net sales 2,373 2,515 2,726
Working capital -54.6 -52.22 47.06
Working capital
turnover ratio
-43.46 -48.16 57.92
-20
-15
-10
-5
0
5
10
1 2 3
Return on equity
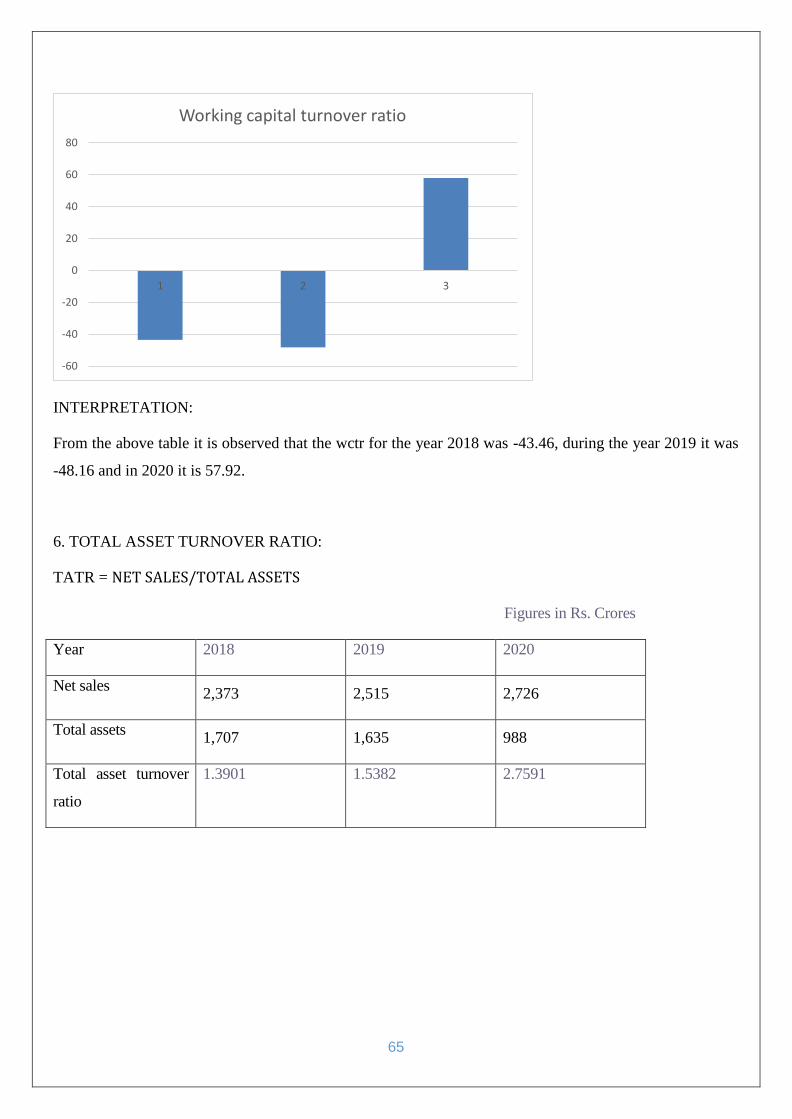
65
INTERPRETATION:
From the above table it is observed that the wctr for the year 2018 was -43.46, during the year 2019 it was
-48.16 and in 2020 it is 57.92.
6. TOTAL ASSET TURNOVER RATIO:
TATR = NET SALES/TOTAL ASSETS
Figures in Rs. Crores
Year 2018 2019 2020
Net sales 2,373 2,515 2,726
Total assets 1,707 1,635 988
Total asset turnover
ratio
1.3901 1.5382 2.7591
-60
-40
-20
0
20
40
60
80
1 2 3
Working capital turnover ratio
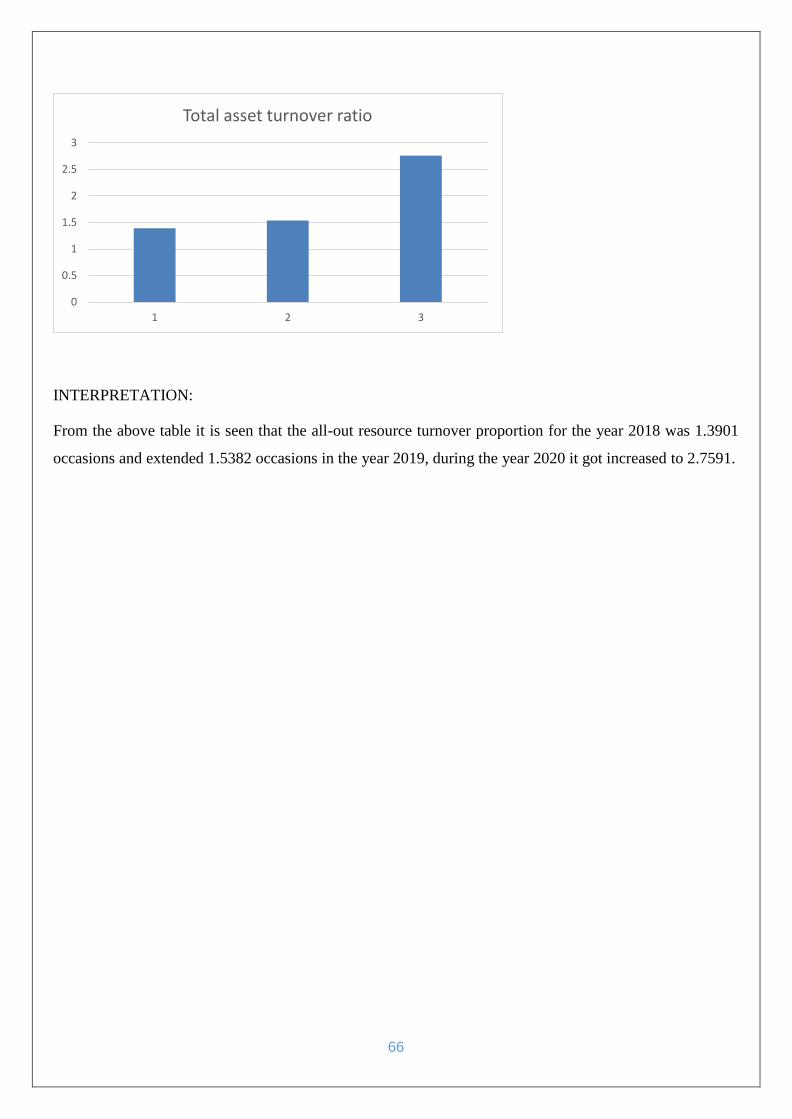
66
INTERPRETATION:
From the above table it is seen that the all-out resource turnover proportion for the year 2018 was 1.3901
occasions and extended 1.5382 occasions in the year 2019, during the year 2020 it got increased to 2.7591.
0
0.5
1
1.5
2
2.5
3
1 2 3
Total asset turnover ratio
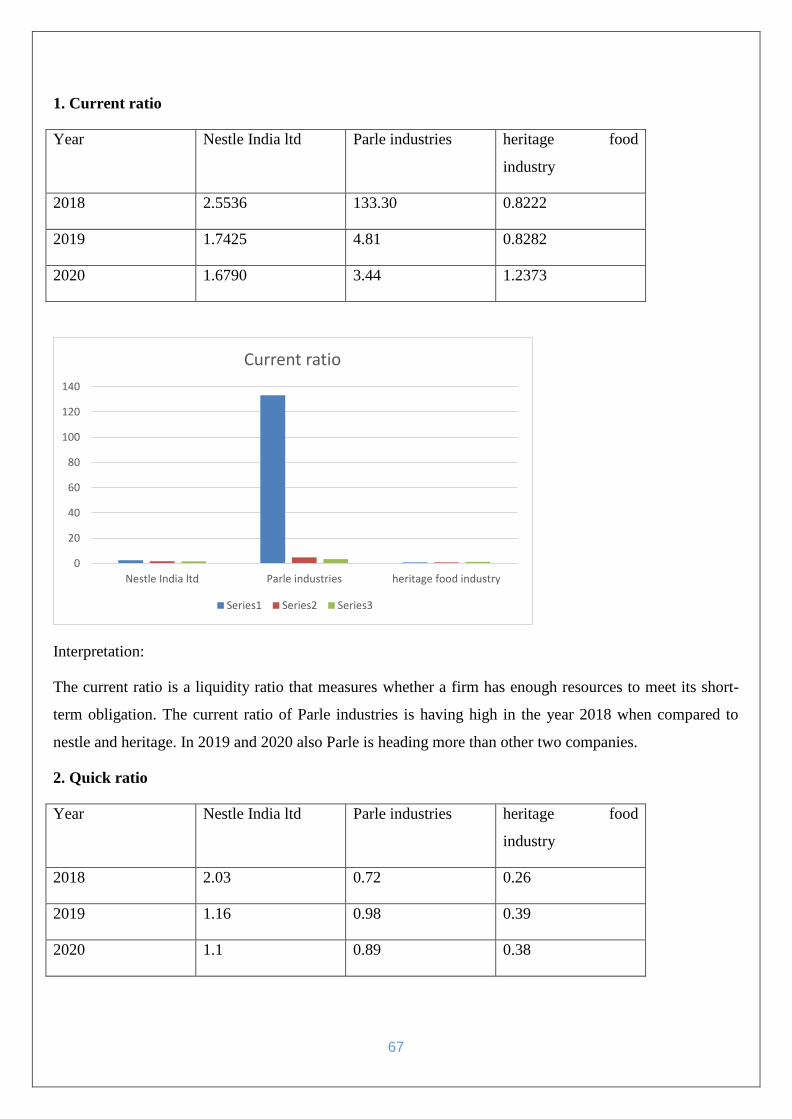
67
1. Current ratio
Year Nestle India ltd Parle industries heritage food
industry
2018 2.5536 133.30 0.8222
2019 1.7425 4.81 0.8282
2020 1.6790 3.44 1.2373
Interpretation:
The current ratio is a liquidity ratio that measures whether a firm has enough resources to meet its short-
term obligation. The current ratio of Parle industries is having high in the year 2018 when compared to
nestle and heritage. In 2019 and 2020 also Parle is heading more than other two companies.
2. Quick ratio
Year Nestle India ltd Parle industries heritage food
industry
2018 2.03 0.72 0.26
2019 1.16 0.98 0.39
2020 1.1 0.89 0.38
0
20
40
60
80
100
120
140
Nestle India ltd Parle industries heritage food industry
Current ratio
Series1 Series2 Series3
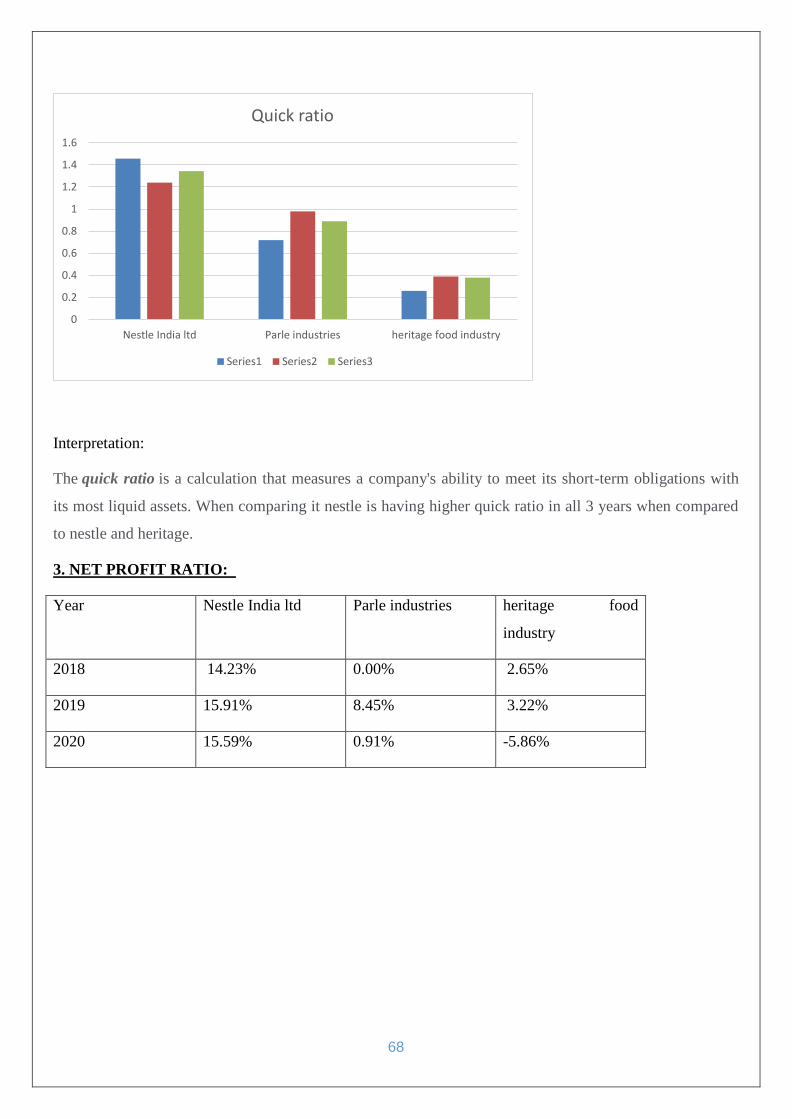
68
Interpretation:
The quick ratio is a calculation that measures a company's ability to meet its short-term obligations with
its most liquid assets. When comparing it nestle is having higher quick ratio in all 3 years when compared
to nestle and heritage.
3. NET PROFIT RATIO:
Year Nestle India ltd Parle industries heritage food
industry
2018 14.23% 0.00% 2.65%
2019 15.91% 8.45% 3.22%
2020 15.59% 0.91% -5.86%
0
0.2
0.4
0.6
0.8
1
1.2
1.4
1.6
Nestle India ltd Parle industries heritage food industry
Quick ratio
Series1 Series2 Series3
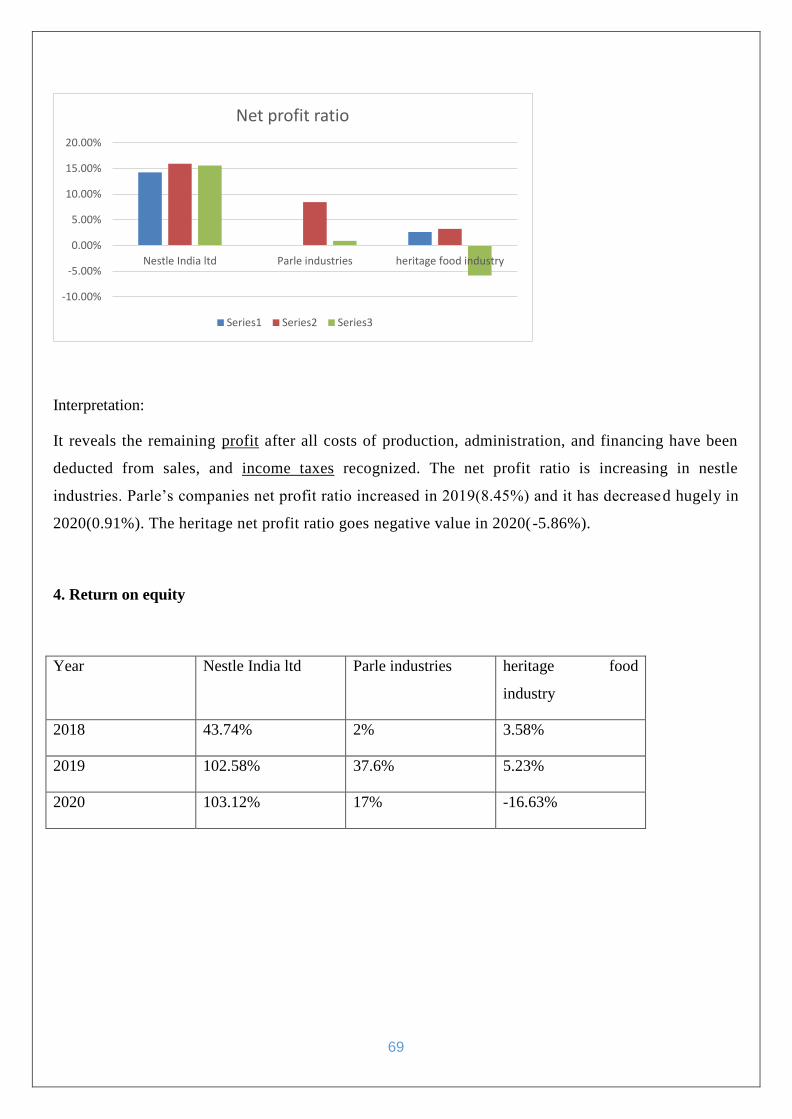
69
Interpretation:
It reveals the remaining profit after all costs of production, administration, and financing have been
deducted from sales, and income taxes recognized. The net profit ratio is increasing in nestle
industries. Parle’s companies net profit ratio increased in 2019(8.45%) and it has decreased hugely in
2020(0.91%). The heritage net profit ratio goes negative value in 2020(-5.86%).
4. Return on equity
Year Nestle India ltd Parle industries heritage food
industry
2018 43.74% 2% 3.58%
2019 102.58% 37.6% 5.23%
2020 103.12% 17% -16.63%
-10.00%
-5.00%
0.00%
5.00%
10.00%
15.00%
20.00%
Nestle India ltd Parle industries heritage food industry
Net profit ratio
Series1 Series2 Series3
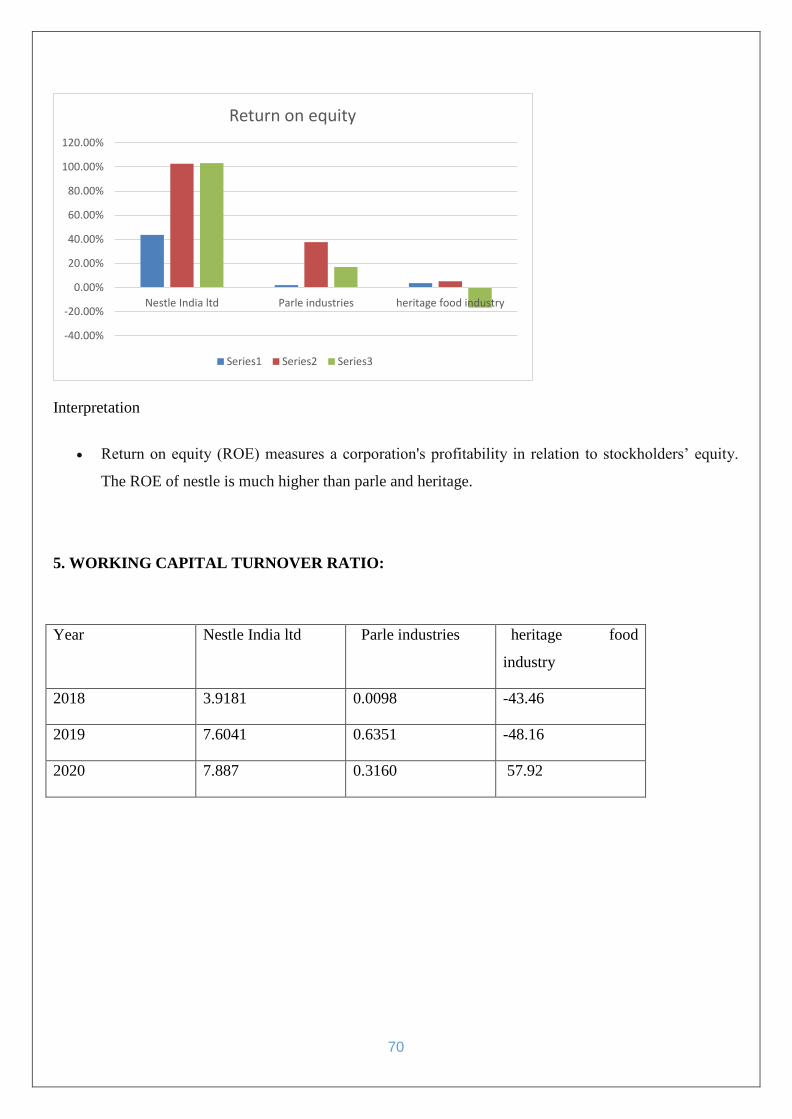
70
Interpretation
Return on equity (ROE) measures a corporation's profitability in relation to stockholders’ equity.
The ROE of nestle is much higher than parle and heritage.
5. WORKING CAPITAL TURNOVER RATIO:
Year Nestle India ltd Parle industries heritage food
industry
2018 3.9181 0.0098 -43.46
2019 7.6041 0.6351 -48.16
2020 7.887 0.3160 57.92
-40.00%
-20.00%
0.00%
20.00%
40.00%
60.00%
80.00%
100.00%
120.00%
Nestle India ltd Parle industries heritage food industry
Return on equity
Series1 Series2 Series3
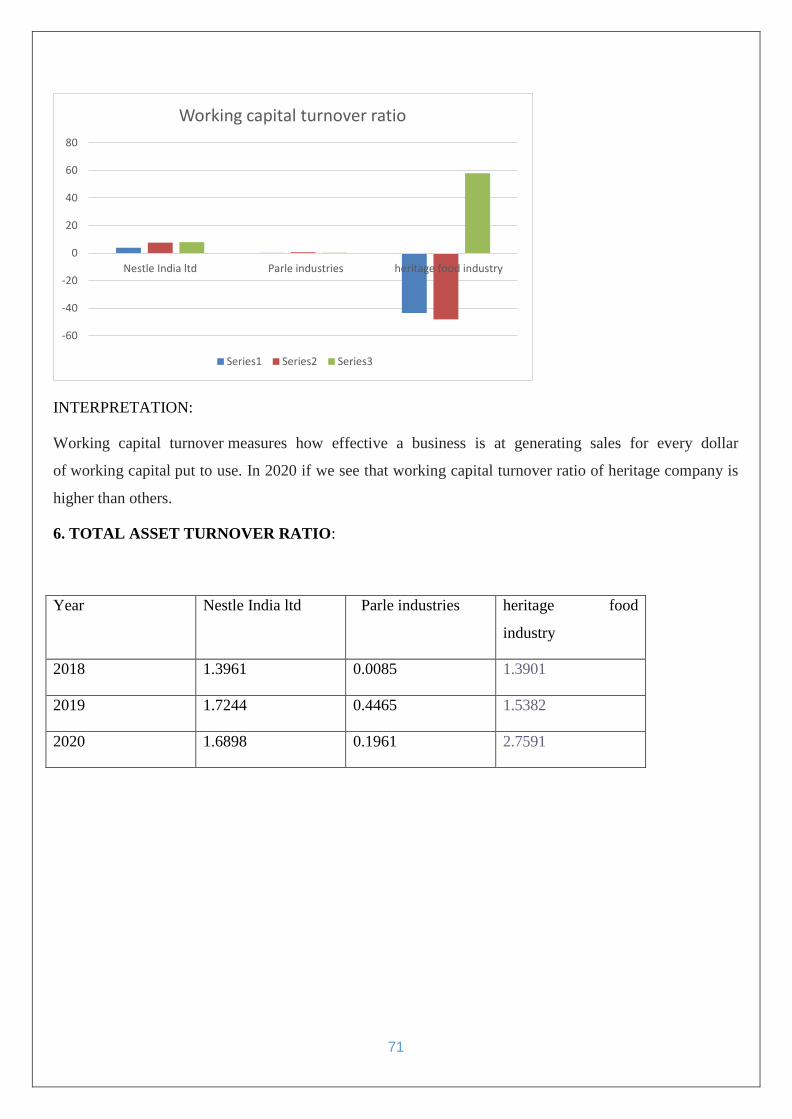
71
INTERPRETATION:
Working capital turnover measures how effective a business is at generating sales for every dollar
of working capital put to use. In 2020 if we see that working capital turnover ratio of heritage company is
higher than others.
6. TOTAL ASSET TURNOVER RATIO:
Year Nestle India ltd Parle industries heritage food
industry
2018 1.3961 0.0085 1.3901
2019 1.7244 0.4465 1.5382
2020 1.6898 0.1961 2.7591
-60
-40
-20
0
20
40
60
80
Nestle India ltd Parle industries heritage food industry
Working capital turnover ratio
Series1 Series2 Series3
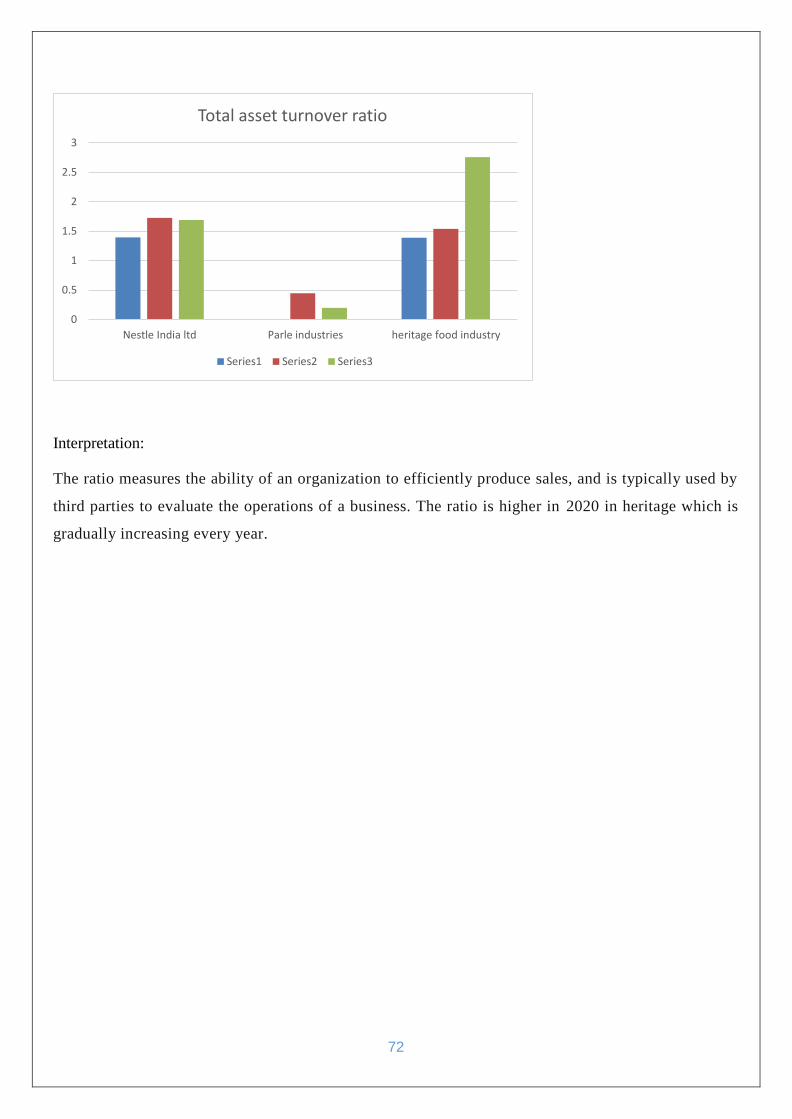
72
Interpretation:
The ratio measures the ability of an organization to efficiently produce sales, and is typically used by
third parties to evaluate the operations of a business. The ratio is higher in 2020 in heritage which is
gradually increasing every year.
0
0.5
1
1.5
2
2.5
3
Nestle India ltd Parle industries heritage food industry
Total asset turnover ratio
Series1 Series2 Series3
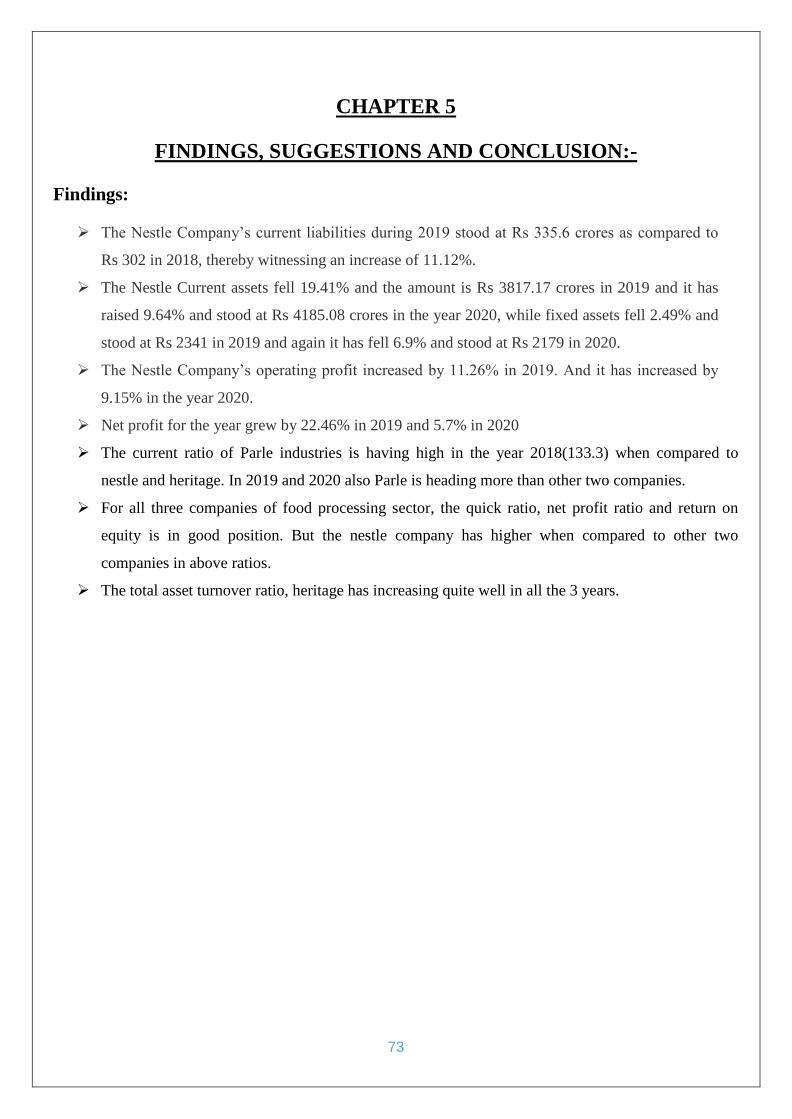
73
CHAPTER 5
FINDINGS, SUGGESTIONS AND CONCLUSION:-
Findings:
The Nestle Company’s current liabilities during 2019 stood at Rs 335.6 crores as compared to
Rs 302 in 2018, thereby witnessing an increase of 11.12%.
The Nestle Current assets fell 19.41% and the amount is Rs 3817.17 crores in 2019 and it has
raised 9.64% and stood at Rs 4185.08 crores in the year 2020, while fixed assets fell 2.49% and
stood at Rs 2341 in 2019 and again it has fell 6.9% and stood at Rs 2179 in 2020.
The Nestle Company’s operating profit increased by 11.26% in 2019. And it has increased by
9.15% in the year 2020.
Net profit for the year grew by 22.46% in 2019 and 5.7% in 2020
The current ratio of Parle industries is having high in the year 2018(133.3) when compared to
nestle and heritage. In 2019 and 2020 also Parle is heading more than other two companies.
For all three companies of food processing sector, the quick ratio, net profit ratio and return on
equity is in good position. But the nestle company has higher when compared to other two
companies in above ratios.
The total asset turnover ratio, heritage has increasing quite well in all the 3 years.
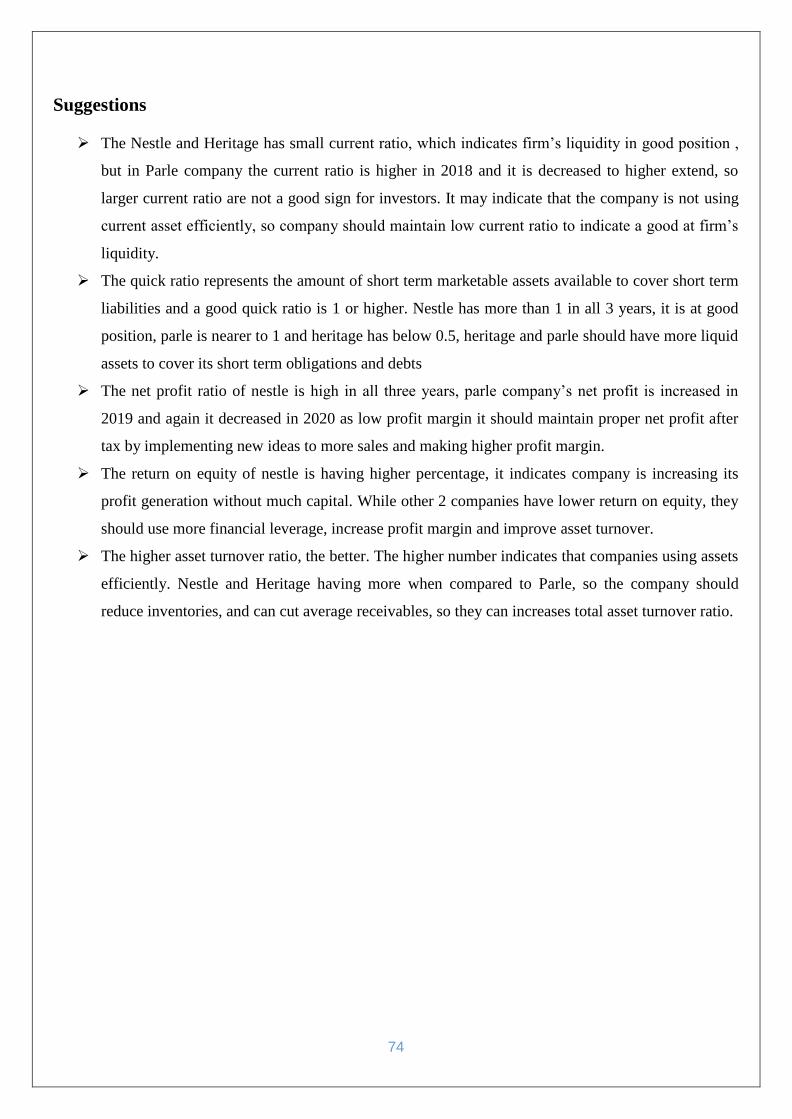
74
Suggestions
The Nestle and Heritage has small current ratio, which indicates firm’s liquidity in good position ,
but in Parle company the current ratio is higher in 2018 and it is decreased to higher extend, so
larger current ratio are not a good sign for investors. It may indicate that the company is not using
current asset efficiently, so company should maintain low current ratio to indicate a good at firm’s
liquidity.
The quick ratio represents the amount of short term marketable assets available to cover short term
liabilities and a good quick ratio is 1 or higher. Nestle has more than 1 in all 3 years, it is at good
position, parle is nearer to 1 and heritage has below 0.5, heritage and parle should have more liquid
assets to cover its short term obligations and debts
The net profit ratio of nestle is high in all three years, parle company’s net profit is increased in
2019 and again it decreased in 2020 as low profit margin it should maintain proper net profit after
tax by implementing new ideas to more sales and making higher profit margin.
The return on equity of nestle is having higher percentage, it indicates company is increasing its
profit generation without much capital. While other 2 companies have lower return on equity, they
should use more financial leverage, increase profit margin and improve asset turnover.
The higher asset turnover ratio, the better. The higher number indicates that companies using assets
efficiently. Nestle and Heritage having more when compared to Parle, so the company should
reduce inventories, and can cut average receivables, so they can increases total asset turnover ratio.
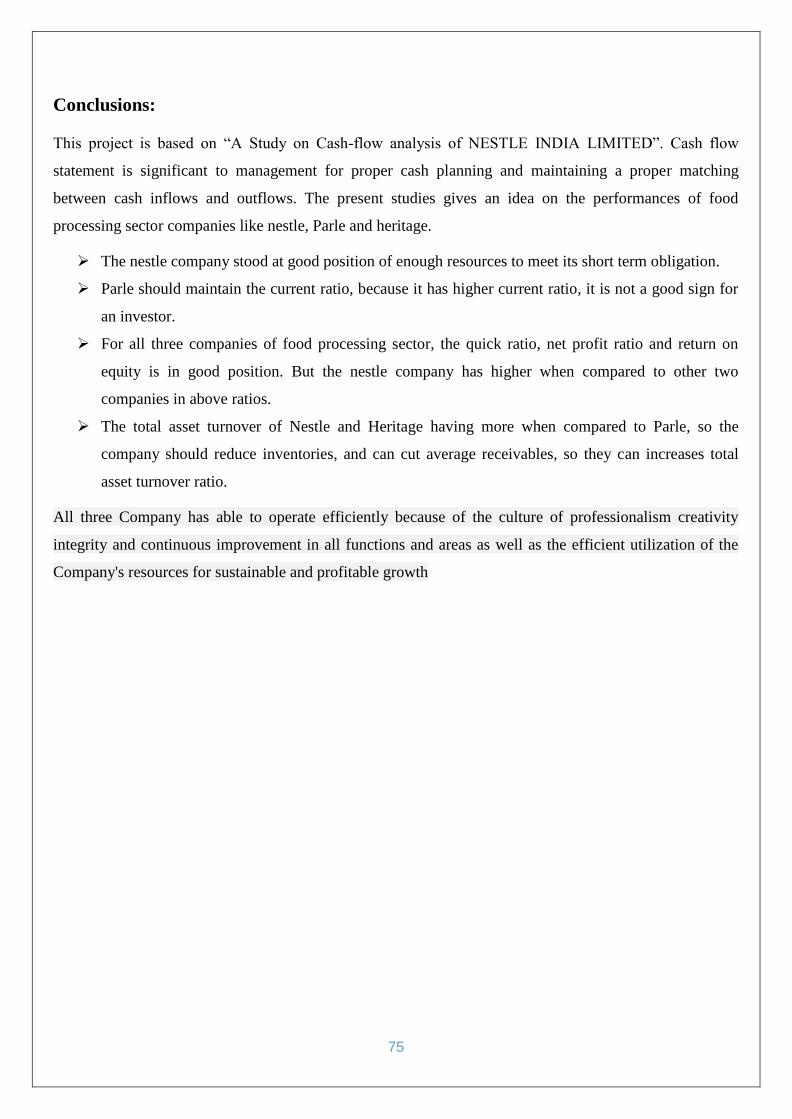
75
Conclusions:
This project is based on “A Study on Cash-flow analysis of NESTLE INDIA LIMITED”. Cash flow
statement is significant to management for proper cash planning and maintaining a proper matching
between cash inflows and outflows. The present studies gives an idea on the performances of food
processing sector companies like nestle, Parle and heritage.
The nestle company stood at good position of enough resources to meet its short term obligation.
Parle should maintain the current ratio, because it has higher current ratio, it is not a good sign for
an investor.
For all three companies of food processing sector, the quick ratio, net profit ratio and return on
equity is in good position. But the nestle company has higher when compared to other two
companies in above ratios.
The total asset turnover of Nestle and Heritage having more when compared to Parle, so the
company should reduce inventories, and can cut average receivables, so they can increases total
asset turnover ratio.
All three Company has able to operate efficiently because of the culture of professionalism creativity
integrity and continuous improvement in all functions and areas as well as the efficient utilization of the
Company's resources for sustainable and profitable growth

76
BIBLOGRAPHY
Websites
www.moneycontrol.com
www.financialexpress.com
www.economictimes.com
www.capitalmarket.com
www.nestle.in
www.parle.in
www.heritage.in
77
78
79