a study of tropospheric no2 variability over pakistan using omi data
TRANSCRIPT
Atmospheric Pollution Research 5 (2014) xx–xx
© Author(s) 2014. This work is distributed under the Creative Commons Attribution 3.0 License.
AAtm spheric PPollution RResearch www.atmospolres.com
A study of tropospheric NO2 variability over Pakistan using OMI data
Zia ul–Haq, Salman Tariq, Muhammad Ali, Khalid Mahmood, Syeda Adila Batool, Asim Daud Rana
Remote Sensing and GIS Group, Department of Space Science, University of the Punjab, New Campus, Lahore 54590, Pakistan
ABSTRACT In this study we present an analysis of spatio–temporal variability of monthly averaged Vertical Tropospheric Columns (VTCs) of NO2 over Pakistan using OMI (ozone monitoring instrument) dataset from December 2004 to November 2008. The results have shown significant spatial and temporal variability of NO2 column values over the study region. Four NO2 hotspots and a high density corridor were identified within the study region. The main sources of NO2 emissions in these areas were also investigated. During the study period, an average value of NO2 was observed to be 1.102±0.081x10
15 molecules/cm
2, with an increasing trend of 3.29% per year. Twin cities of Islamabad/Rawalpindi,
Lahore, Dera Ghazi Khan and Karachi have shown positive trends of 44.10%, 23.48%, 31.40%, and 32.32% per year respectively. Karachi has shown the highest and the lowest mean monthly average values of 11.33x10
15 molecules/cm
2
and 0.98x10¹⁵ molecules/cm
2 respectively. Air mass trajectories for hotspot regions have been used to track possible
long–range transport of NO2.
Keywords: OMI, NO2, Pakistan, trajectory analysis, air pollutants
Corresponding Author:
Zia ul–Haq : +92‐423‐595‐2996 : [email protected]
Article History: Received: 11 November 2013 Revised: 25 May 2014 Accepted: 25 May 2014
doi: 10.5094/APR.2014.080
1. Introduction
Nitrogen dioxide (NO2) is among the highly reactive group of
gasses known as "oxides of nitrogen" or "nitrogen oxides (NOX)" with nitrous acid and nitric acid (U.S. EPA, 1998). Its presence in troposphere adversely impacts human health and visibility, and contributes to the formation of tropospheric ozone (O3), fine particle pollution, summer smog and acid rain. Evidences suggest that exposure of mixtures of NO2 and SO2 to vegetation and plants may alter their growth and reduce their ability to withstand drought and frost stresses and could increase the growth rate of herbivorous insects and fungal pathogens (WHO, 2000; He et al., 2007; Martin et al., 2010; Shon et al., 2011). Tropospheric nitrogen oxides (NOX=NO+NO2) are initially emitted in the form of nitrogen monoxide (NO), which are converted into NO2 by oxidation process. This NO2 is converted back into NO by photolysis process during the day light and photochemical equilibrium is reached (Werner et al., 2013). The main sources of NOX are industrial burning processes, vehicle combustion process, biomass fuel and crop residue burning, soil emissions, and natural lightning (Richter and Burrows, 2002; Cheng et al., 2012). However, there are large uncertainties in source strengths (U.S. EPA, 1998; Werner et al., 2013). Major sink of tropospheric NO2 is its reaction with OH, producing secondary pollutants such as O3, HNO3, methane and aldehydes (Kanaya et al., 2007; U.S. CAR, 2010). The observed variability in tropospheric NO2 columns is mostly linked to climatic conditions, seasonal variations, socio–economy (industries and vehicles) and differences in the fuel use pattern (Colbeck et al., 2010; Saud et al., 2011; Zhou et al., 2012). From environmental perspective, Pakistan is facing severe problems of rapid industri‐alization and motorization, deforestation and energy crises leading
to a strong increase in NO2 emissions putting extra pressure on the local and regional environment. Therefore, a comprehensive spatio–temporal study of tropospheric NO2 over Pakistan is much needed in order to develop the effective strategies to reduce its emissions.
Very few studies of NO2 assessment have been conducted
over Pakistan (e.g., PEPA/JICA, 2006; Colbeck et al., 2010; Zafar et al., 2012; Ahmad and Aziz, 2013; Ashraf et al., 2013; Jahangir et al., 2013; Mahar et al., 2013). All these studies used in situ measurements of very short spatial and temporal windows. To our best knowledge, no study has been conducted yet using satellite remote sensing technique covering the entire Pakistan. Satellite remote sensing (SRS) has emerged as an effective tool for studying ambient trace gases and pollutants in the atmosphere. This technique gives main advantages of repetitive large geographical coverage and uniformity of averaged measurements. It has been well established that NO2 measurements retrieved from satellites are in good agreement with in–situ measurements and bottom–up emission inventories (Boersma et al., 2009; Hayn et al., 2009; Lamsal et al., 2010; Sheel et al., 2010; Kloog et al., 2012; Oluleye and Okogbue, 2013; Prud’homme et al., 2013). The main objective of the present work is to analyze spatial and temporal patterns of tropospheric NO2 column values over Pakistan by employing SRS technique.
2. Data
Ozone monitoring instrument (OMI) on NASA’s Earth orbiting
satellite Aura employs hyperspectral imaging in push–broom mode to measure the backscattered solar radiation in the spectral range
ul-Haq et al. – Atmospheric Pollution Research (APR) x
of 270 nm–500 nm (Levelt et al., 2006a; Levelt et al., 2006b) with a spectral resolution of about 0.5 nm (Zyrichidou et al., 2013). Tropospheric NO2 columns are retrieved by using differential optical absorption spectroscopy (DOAS) analysis in the 405–465 nm spectral range (Eskes and Boersma, 2003; Wallace and Kanaroglou, 2009). Details of data filtering, DOAS analysis and algorithm, and data quality control procedures can be found in NASA’s online user’s manual for OMI products (Giovanni, 2014). The retrieval of NO2 takes into account the clear and 0–30% cloudy conditions in the air mass factor derived for the simulated NO2
profiles (Bucsela et al., 2006). Tropospheric NO2 has an uncertainty of 0.1x10¹⁵ molecules/cm2 and it is underestimated by 15–30% (Celarier et al., 2008). The preliminary validation studies for retrieved tropospheric NO2 columns indicate a good agreement when compared with in–situ NO2 measurements and bottom–up emission inventories. The seasonal variations of NO2 retrieved from OMI agree with the NASA GSFC’s global modeling initiative (GMI) chemical transport model (Duncan et al., 2013). As no measurement campaign for NO2 was conducted in Pakistan during the study period, so we have relied on other similar studies (Hains et al., 2010; Han et al., 2011; Bucsela et al., 2013; Zyrichidou et al., 2013). Since January 24th, 2009 a large row anomaly (row anomaly–3) appeared in OMI radiance data which introduced a decrease and increase in the radiance signal depending on position of satellite in the orbit (Giovanni, 2014). To avoid this anomaly, we restricted our analysis until 2008. In this study, daily averaged product (OMNO2d.003, level–3) of tropospheric NO2 columns gridded at spatial resolution of 0.25°x 0.25° has been used.
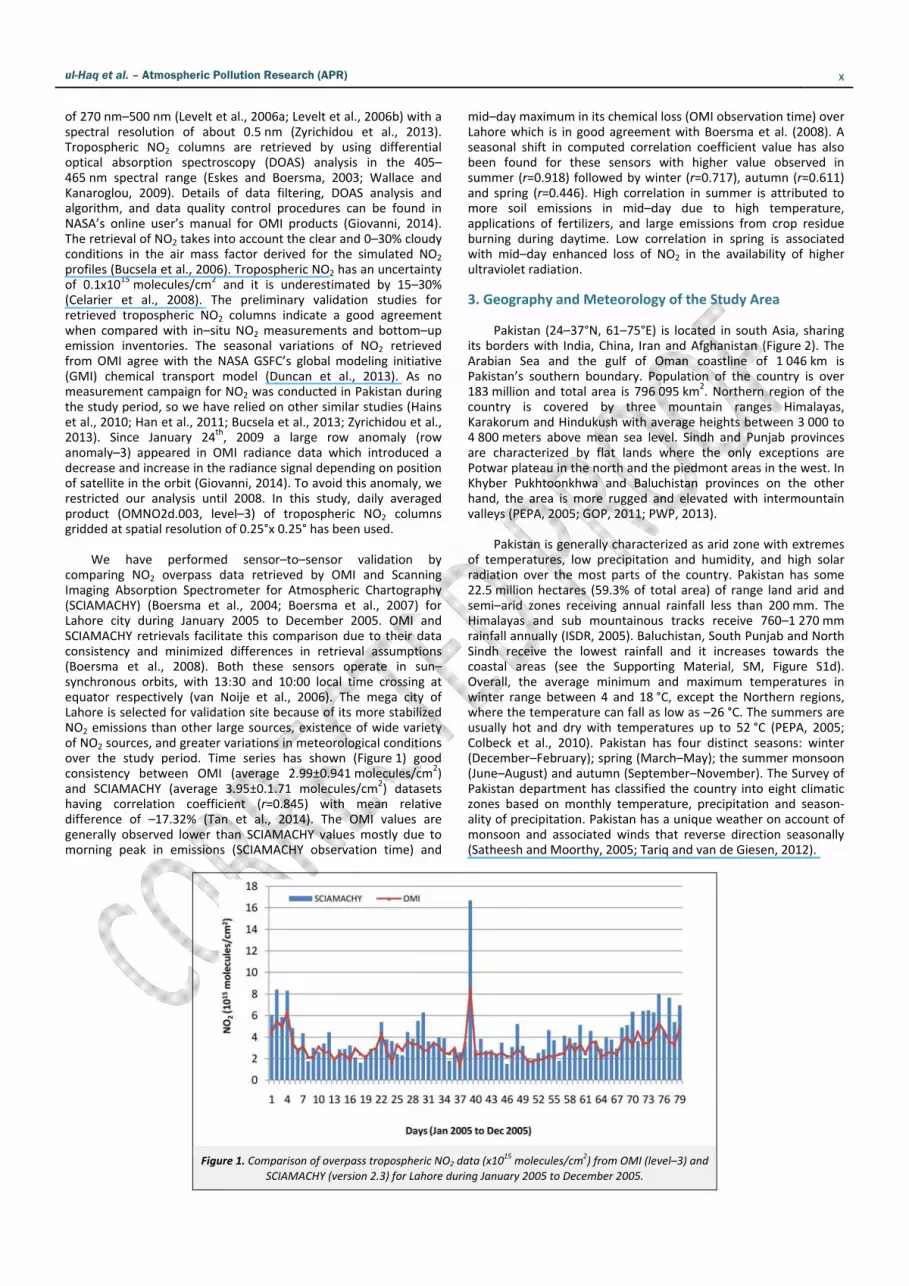
We have performed sensor–to–sensor validation by
comparing NO2 overpass data retrieved by OMI and Scanning Imaging Absorption Spectrometer for Atmospheric Chartography (SCIAMACHY) (Boersma et al., 2004; Boersma et al., 2007) for Lahore city during January 2005 to December 2005. OMI and SCIAMACHY retrievals facilitate this comparison due to their data consistency and minimized differences in retrieval assumptions (Boersma et al., 2008). Both these sensors operate in sun–synchronous orbits, with 13:30 and 10:00 local time crossing at equator respectively (van Noije et al., 2006). The mega city of Lahore is selected for validation site because of its more stabilized NO2 emissions than other large sources, existence of wide variety of NO2 sources, and greater variations in meteorological conditions over the study period. Time series has shown (Figure 1) good consistency between OMI (average 2.99±0.941 molecules/cm2) and SCIAMACHY (average 3.95±0.1.71 molecules/cm2) datasets having correlation coefficient (r=0.845) with mean relative difference of –17.32% (Tan et al., 2014). The OMI values are generally observed lower than SCIAMACHY values mostly due to morning peak in emissions (SCIAMACHY observation time) and
mid–day maximum in its chemical loss (OMI observation time) over Lahore which is in good agreement with Boersma et al. (2008). A seasonal shift in computed correlation coefficient value has also been found for these sensors with higher value observed in summer (r=0.918) followed by winter (r=0.717), autumn (r=0.611) and spring (r=0.446). High correlation in summer is attributed to more soil emissions in mid–day due to high temperature, applications of fertilizers, and large emissions from crop residue burning during daytime. Low correlation in spring is associated with mid–day enhanced loss of NO2 in the availability of higher ultraviolet radiation.
3. Geography and Meteorology of the Study Area
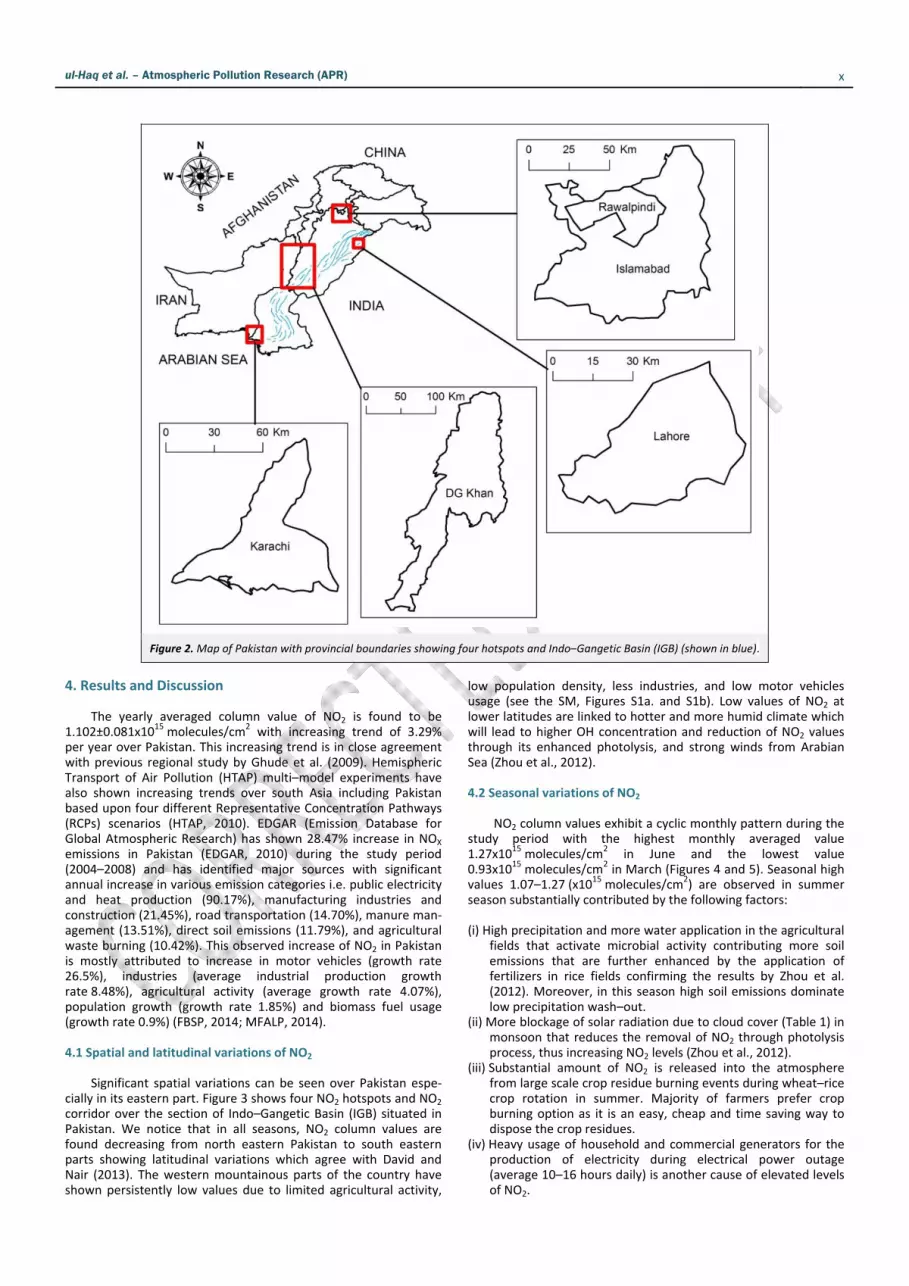
Pakistan (24–37°N, 61–75°E) is located in south Asia, sharing
its borders with India, China, Iran and Afghanistan (Figure 2). The Arabian Sea and the gulf of Oman coastline of 1 046 km is Pakistan’s southern boundary. Population of the country is over 183 million and total area is 796 095 km2. Northern region of the country is covered by three mountain ranges Himalayas, Karakorum and Hindukush with average heights between 3 000 to 4 800 meters above mean sea level. Sindh and Punjab provinces are characterized by flat lands where the only exceptions are Potwar plateau in the north and the piedmont areas in the west. In Khyber Pukhtoonkhwa and Baluchistan provinces on the other hand, the area is more rugged and elevated with intermountain valleys (PEPA, 2005; GOP, 2011; PWP, 2013).
Pakistan is generally characterized as arid zone with extremes
of temperatures, low precipitation and humidity, and high solar radiation over the most parts of the country. Pakistan has some 22.5 million hectares (59.3% of total area) of range land arid and semi–arid zones receiving annual rainfall less than 200 mm. The Himalayas and sub mountainous tracks receive 760–1 270 mm rainfall annually (ISDR, 2005). Baluchistan, South Punjab and North Sindh receive the lowest rainfall and it increases towards the coastal areas (see the Supporting Material, SM, Figure S1d). Overall, the average minimum and maximum temperatures in winter range between 4 and 18 °C, except the Northern regions, where the temperature can fall as low as –26 °C. The summers are usually hot and dry with temperatures up to 52 °C (PEPA, 2005; Colbeck et al., 2010). Pakistan has four distinct seasons: winter (December–February); spring (March–May); the summer monsoon (June–August) and autumn (September–November). The Survey of Pakistan department has classified the country into eight climatic zones based on monthly temperature, precipitation and season‐ality of precipitation. Pakistan has a unique weather on account of monsoon and associated winds that reverse direction seasonally (Satheesh and Moorthy, 2005; Tariq and van de Giesen, 2012).
Figure 1. Comparison of overpass tropospheric NO2 data (x1015 molecules/cm
2) from OMI (level–3) and
SCIAMACHY (version 2.3) for Lahore during January 2005 to December 2005.
ul-Haq et al. – Atmospheric Pollution Research (APR) x
Figure 2. Map of Pakistan with provincial boundaries showing four hotspots and Indo–Gangetic Basin (IGB) (shown in blue).
4. Results and Discussion
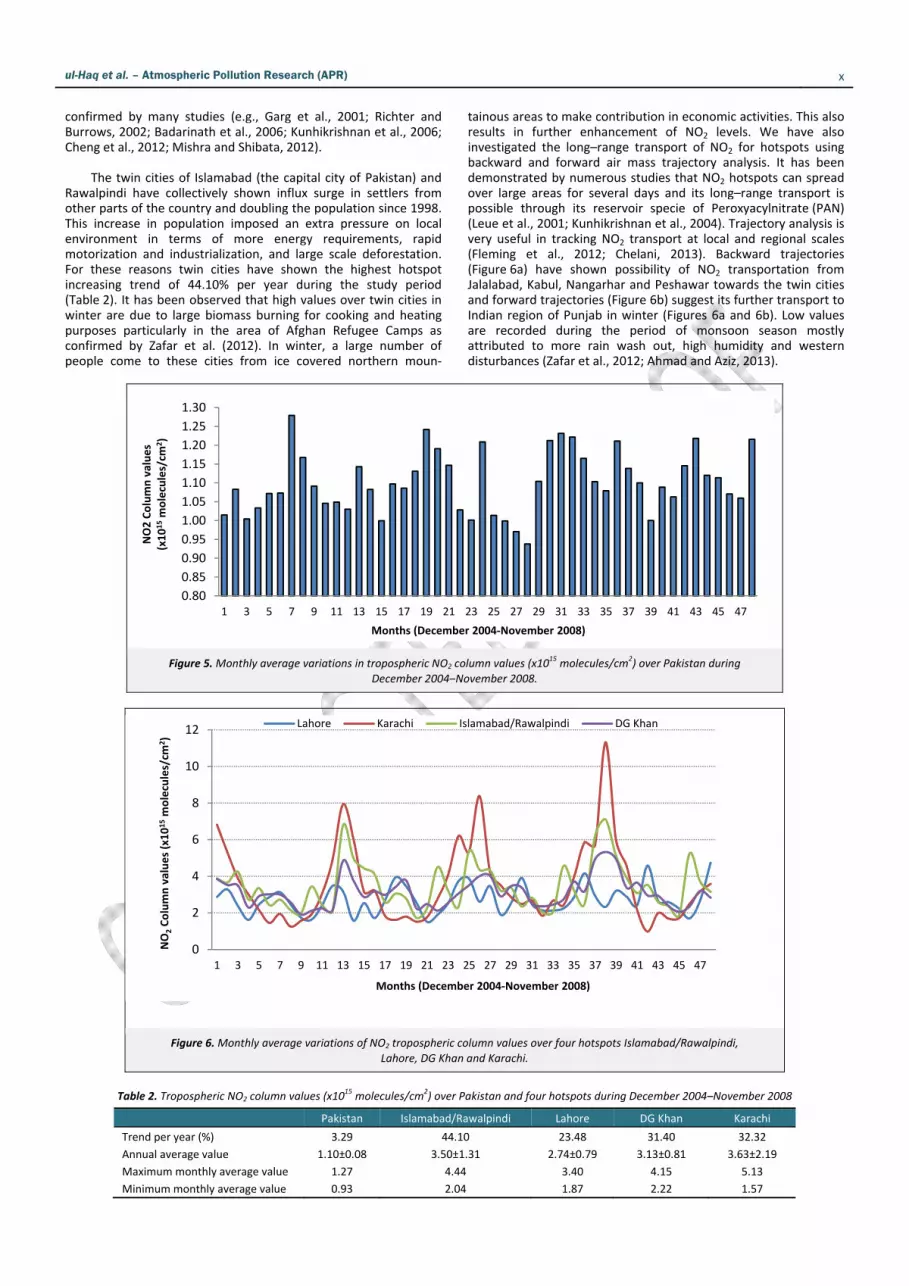
The yearly averaged column value of NO2 is found to be
1.102±0.081x10¹⁵ molecules/cm2 with increasing trend of 3.29% per year over Pakistan. This increasing trend is in close agreement with previous regional study by Ghude et al. (2009). Hemispheric Transport of Air Pollution (HTAP) multi–model experiments have also shown increasing trends over south Asia including Pakistan based upon four different Representative Concentration Pathways (RCPs) scenarios (HTAP, 2010). EDGAR (Emission Database for Global Atmospheric Research) has shown 28.47% increase in NOX emissions in Pakistan (EDGAR, 2010) during the study period (2004–2008) and has identified major sources with significant annual increase in various emission categories i.e. public electricity and heat production (90.17%), manufacturing industries and construction (21.45%), road transportation (14.70%), manure man‐agement (13.51%), direct soil emissions (11.79%), and agricultural waste burning (10.42%). This observed increase of NO2 in Pakistan is mostly attributed to increase in motor vehicles (growth rate 26.5%), industries (average industrial production growth rate 8.48%), agricultural activity (average growth rate 4.07%), population growth (growth rate 1.85%) and biomass fuel usage (growth rate 0.9%) (FBSP, 2014; MFALP, 2014).
4.1 Spatial and latitudinal variations of NO2
Significant spatial variations can be seen over Pakistan espe‐cially in its eastern part. Figure 3 shows four NO2 hotspots and NO2 corridor over the section of Indo–Gangetic Basin (IGB) situated in Pakistan. We notice that in all seasons, NO2 column values are found decreasing from north eastern Pakistan to south eastern parts showing latitudinal variations which agree with David and Nair (2013). The western mountainous parts of the country have shown persistently low values due to limited agricultural activity,
low population density, less industries, and low motor vehicles usage (see the SM, Figures S1a. and S1b). Low values of NO2 at lower latitudes are linked to hotter and more humid climate which will lead to higher OH concentration and reduction of NO2 values through its enhanced photolysis, and strong winds from Arabian Sea (Zhou et al., 2012).
4.2 Seasonal variations of NO2
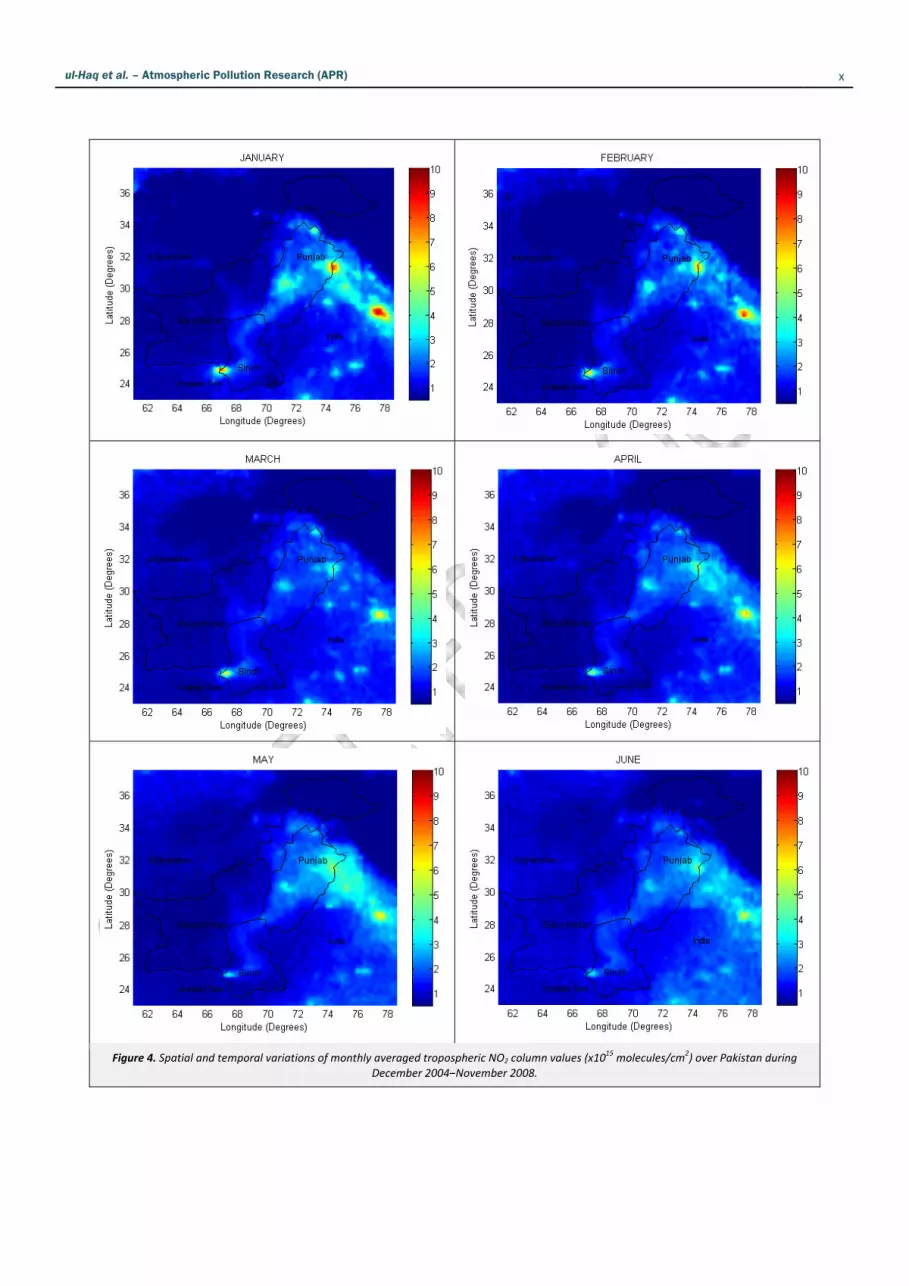
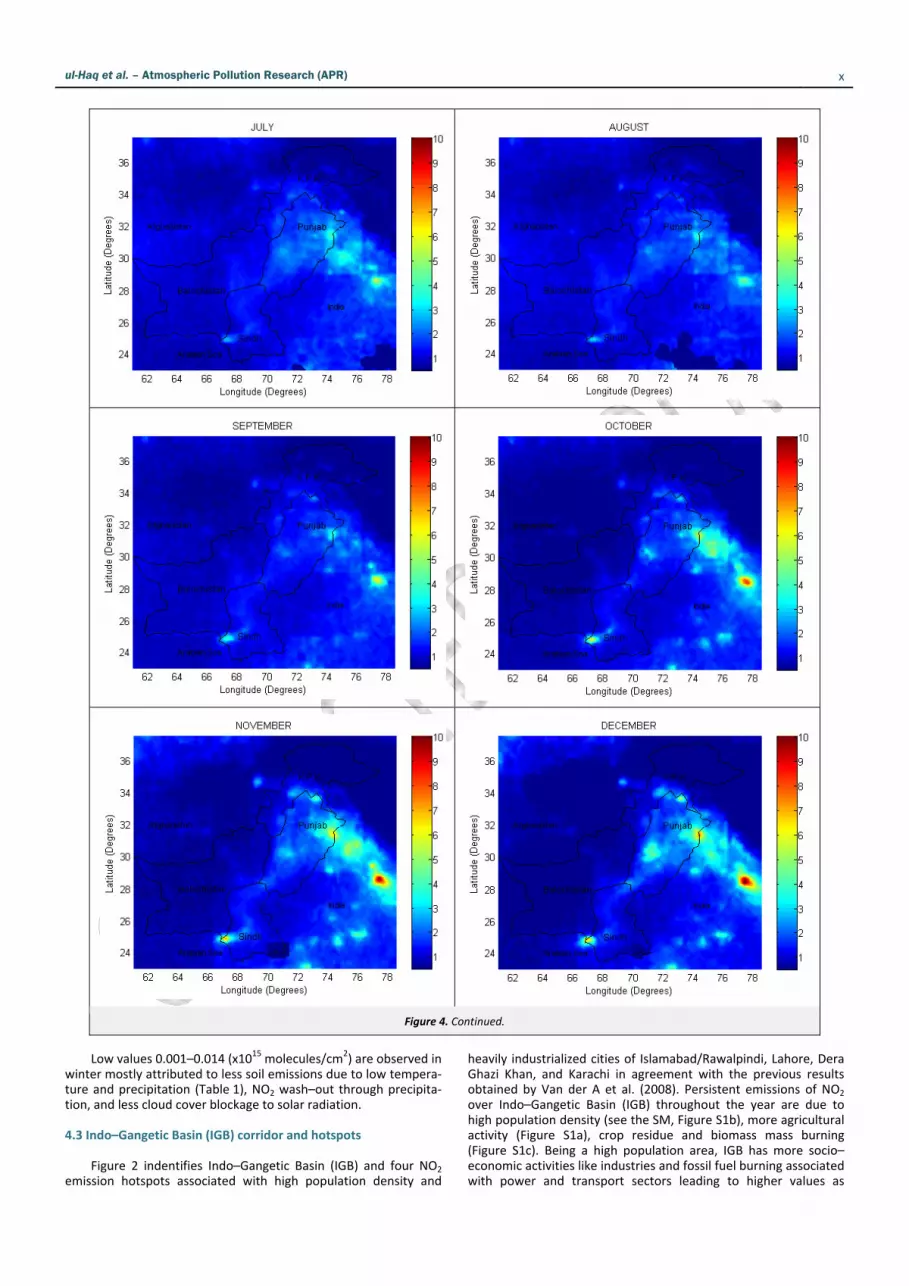
NO2 column values exhibit a cyclic monthly pattern during the
study period with the highest monthly averaged value 1.27x10¹⁵ molecules/cm2 in June and the lowest value 0.93x10¹⁵ molecules/cm2 in March (Figures 4 and 5). Seasonal high values 1.07–1.27 (x10
15 molecules/cm2) are observed in summer season substantially contributed by the following factors:
(i) High precipitation and more water application in the agricultural
fields that activate microbial activity contributing more soil emissions that are further enhanced by the application of fertilizers in rice fields confirming the results by Zhou et al. (2012). Moreover, in this season high soil emissions dominate low precipitation wash–out.
(ii) More blockage of solar radiation due to cloud cover (Table 1) in monsoon that reduces the removal of NO2 through photolysis process, thus increasing NO2 levels (Zhou et al., 2012).
(iii) Substantial amount of NO2 is released into the atmosphere from large scale crop residue burning events during wheat–rice crop rotation in summer. Majority of farmers prefer crop burning option as it is an easy, cheap and time saving way to dispose the crop residues.
(iv) Heavy usage of household and commercial generators for the production of electricity during electrical power outage (average 10–16 hours daily) is another cause of elevated levels of NO2.

ul-Haq et al. – Atmospheric Pollution Research (APR) x
Figure 3. Spatial distribution of averaged tropospheric NO2 column values (x1015 molecules/cm
2) over
Pakistan during December 2004–November 2008.
Table 1. Meteorological conditions over four hotspots during December 2004–November 2008. (Data source: Pakistan Meteorological
Department, www.wunderground.com)
Islamabad/Rawalpindi Lahore DG Khan Karachi
Latitude/Longitude 33.40°N/73.0°E 31.32°N/74.22oE 30.03°N/70.38°E 24.51°N/67.72°E
Population (million) 2.13 10.23 2.12 16.05
Area (km2) 1.060 1.172 11.294 3.527
Temperature
(°C) Winter 11.76 15.19 14.24 20.50
Spring 22.78 27.59 27.97 29.13
Summer 29.30 31.70 34.10 31.05
Fall 22.02 25.75 26.11 28.30
Relative
humidity (%)
Winter 52.16 50.41 45.08 57.24
Spring 37.50 31.50 28.50 43.50
Summer 54.25 55.25 42.50 62.71
Fall 54.83 49.75 41.83 59.20
Cloud
cover (oktas)
Winter 3.60 2.67 2.84 2.10
Spring 3.51 2.05 2.46 1.33
Summer 3.36 3.19 2.70 3.43
Fall 0.89 1.36 1.14 0.89
Precipitation
(mm) Winter 75.70 26.81 28.14 6.72
Spring 59.15 25.06 19.64 10.48
Summer 279.21 138.11 26.14 49.67
Fall 50.26 33.10 5.63 14.43
Mean sea level
pressure (hPa)
Winter 1 016.40 1 014.9 1 015.90 1 015.0
Spring 1 006.40 1 004.4 1 002.20 1 008.0
Summer 997.50 996.1 991.90 999.80
Fall 1 010.0 1 008.0 1 010.0 1 009.29
ul-Haq et al. – Atmospheric Pollution Research (APR) x
Figure 4. Spatial and temporal variations of monthly averaged tropospheric NO2 column values (x1015 molecules/cm
2) over Pakistan during
December 2004–November 2008.
ul-Haq et al. – Atmospheric Pollution Research (APR) x
Figure 4. Continued.
Low values 0.001–0.014 (x1015 molecules/cm2) are observed in
winter mostly attributed to less soil emissions due to low tempera‐ture and precipitation (Table 1), NO2 wash–out through precipita‐tion, and less cloud cover blockage to solar radiation.
4.3 Indo–Gangetic Basin (IGB) corridor and hotspots
Figure 2 indentifies Indo–Gangetic Basin (IGB) and four NO2
emission hotspots associated with high population density and
heavily industrialized cities of Islamabad/Rawalpindi, Lahore, Dera Ghazi Khan, and Karachi in agreement with the previous results obtained by Van der A et al. (2008). Persistent emissions of NO2 over Indo–Gangetic Basin (IGB) throughout the year are due to high population density (see the SM, Figure S1b), more agricultural activity (Figure S1a), crop residue and biomass mass burning (Figure S1c). Being a high population area, IGB has more socio–economic activities like industries and fossil fuel burning associated with power and transport sectors leading to higher values as
ul-Haq et al. – Atmospheric Pollution Research (APR) x
confirmed by many studies (e.g., Garg et al., 2001; Richter and Burrows, 2002; Badarinath et al., 2006; Kunhikrishnan et al., 2006; Cheng et al., 2012; Mishra and Shibata, 2012).
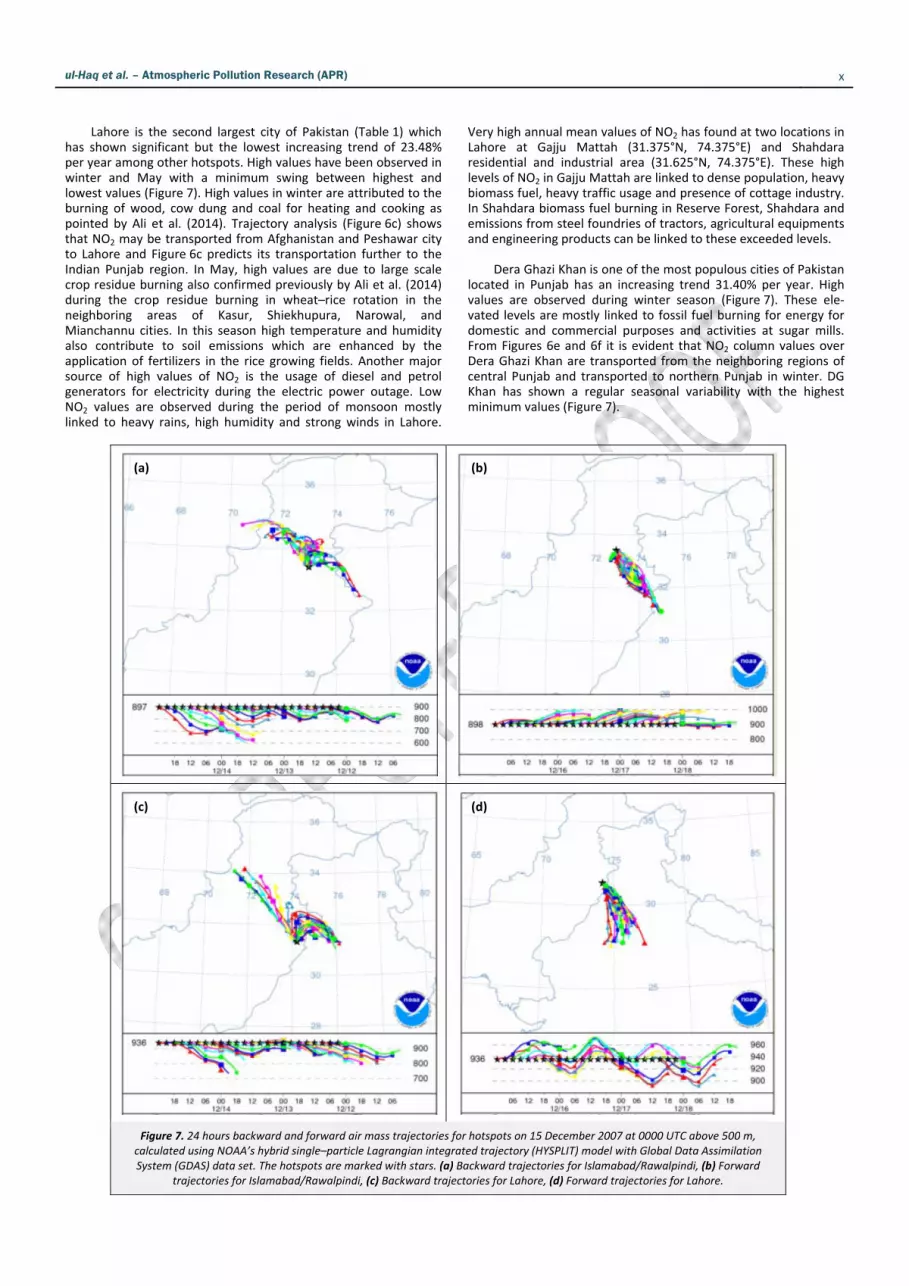
The twin cities of Islamabad (the capital city of Pakistan) and
Rawalpindi have collectively shown influx surge in settlers from other parts of the country and doubling the population since 1998. This increase in population imposed an extra pressure on local environment in terms of more energy requirements, rapid motorization and industrialization, and large scale deforestation. For these reasons twin cities have shown the highest hotspot increasing trend of 44.10% per year during the study period (Table 2). It has been observed that high values over twin cities in winter are due to large biomass burning for cooking and heating purposes particularly in the area of Afghan Refugee Camps as confirmed by Zafar et al. (2012). In winter, a large number of people come to these cities from ice covered northern moun‐
tainous areas to make contribution in economic activities. This also results in further enhancement of NO2 levels. We have also investigated the long–range transport of NO2 for hotspots using backward and forward air mass trajectory analysis. It has been demonstrated by numerous studies that NO2 hotspots can spread over large areas for several days and its long–range transport is possible through its reservoir specie of Peroxyacylnitrate (PAN) (Leue et al., 2001; Kunhikrishnan et al., 2004). Trajectory analysis is very useful in tracking NO2 transport at local and regional scales (Fleming et al., 2012; Chelani, 2013). Backward trajectories (Figure 6a) have shown possibility of NO2 transportation from Jalalabad, Kabul, Nangarhar and Peshawar towards the twin cities and forward trajectories (Figure 6b) suggest its further transport to Indian region of Punjab in winter (Figures 6a and 6b). Low values are recorded during the period of monsoon season mostly attributed to more rain wash out, high humidity and western disturbances (Zafar et al., 2012; Ahmad and Aziz, 2013).
Figure 5. Monthly average variations in tropospheric NO2 column values (x1015 molecules/cm
2) over Pakistan during
December 2004–November 2008.
Figure 6. Monthly average variations of NO2 tropospheric column values over four hotspots Islamabad/Rawalpindi,
Lahore, DG Khan and Karachi.
Table 2. Tropospheric NO2 column values (x10
15 molecules/cm
2) over Pakistan and four hotspots during December 2004–November 2008
Pakistan Islamabad/Rawalpindi Lahore DG Khan Karachi
Trend per year (%) 3.29 44.10 23.48 31.40 32.32
Annual average value 1.10±0.08 3.50±1.31 2.74±0.79 3.13±0.81 3.63±2.19
Maximum monthly average value 1.27 4.44 3.40 4.15 5.13
Minimum monthly average value 0.93 2.04 1.87 2.22 1.57
0.80
0.85
0.90
0.95
1.00
1.05
1.10
1.15
1.20
1.25
1.30
1 3 5 7 9 11 13 15 17 19 21 23 25 27 29 31 33 35 37 39 41 43 45 47
NO2 Column values
(x1015molecules/cm
2)
Months (December 2004‐November 2008)
0
2
4
6
8
10
12
1 3 5 7 9 11 13 15 17 19 21 23 25 27 29 31 33 35 37 39 41 43 45 47
NO2Column values (x1015molecules/cm
2)
Months (December 2004‐November 2008)
Lahore Karachi Islamabad/Rawalpindi DG Khan
ul-Haq et al. – Atmospheric Pollution Research (APR) x
Lahore is the second largest city of Pakistan (Table 1) which
has shown significant but the lowest increasing trend of 23.48% per year among other hotspots. High values have been observed in winter and May with a minimum swing between highest and lowest values (Figure 7). High values in winter are attributed to the burning of wood, cow dung and coal for heating and cooking as pointed by Ali et al. (2014). Trajectory analysis (Figure 6c) shows that NO2 may be transported from Afghanistan and Peshawar city to Lahore and Figure 6c predicts its transportation further to the Indian Punjab region. In May, high values are due to large scale crop residue burning also confirmed previously by Ali et al. (2014) during the crop residue burning in wheat–rice rotation in the neighboring areas of Kasur, Shiekhupura, Narowal, and Mianchannu cities. In this season high temperature and humidity also contribute to soil emissions which are enhanced by the application of fertilizers in the rice growing fields. Another major source of high values of NO2 is the usage of diesel and petrol generators for electricity during the electric power outage. Low NO2 values are observed during the period of monsoon mostly linked to heavy rains, high humidity and strong winds in Lahore.
Very high annual mean values of NO2 has found at two locations in Lahore at Gajju Mattah (31.375°N, 74.375°E) and Shahdara residential and industrial area (31.625°N, 74.375°E). These high levels of NO2 in Gajju Mattah are linked to dense population, heavy biomass fuel, heavy traffic usage and presence of cottage industry. In Shahdara biomass fuel burning in Reserve Forest, Shahdara and emissions from steel foundries of tractors, agricultural equipments and engineering products can be linked to these exceeded levels.
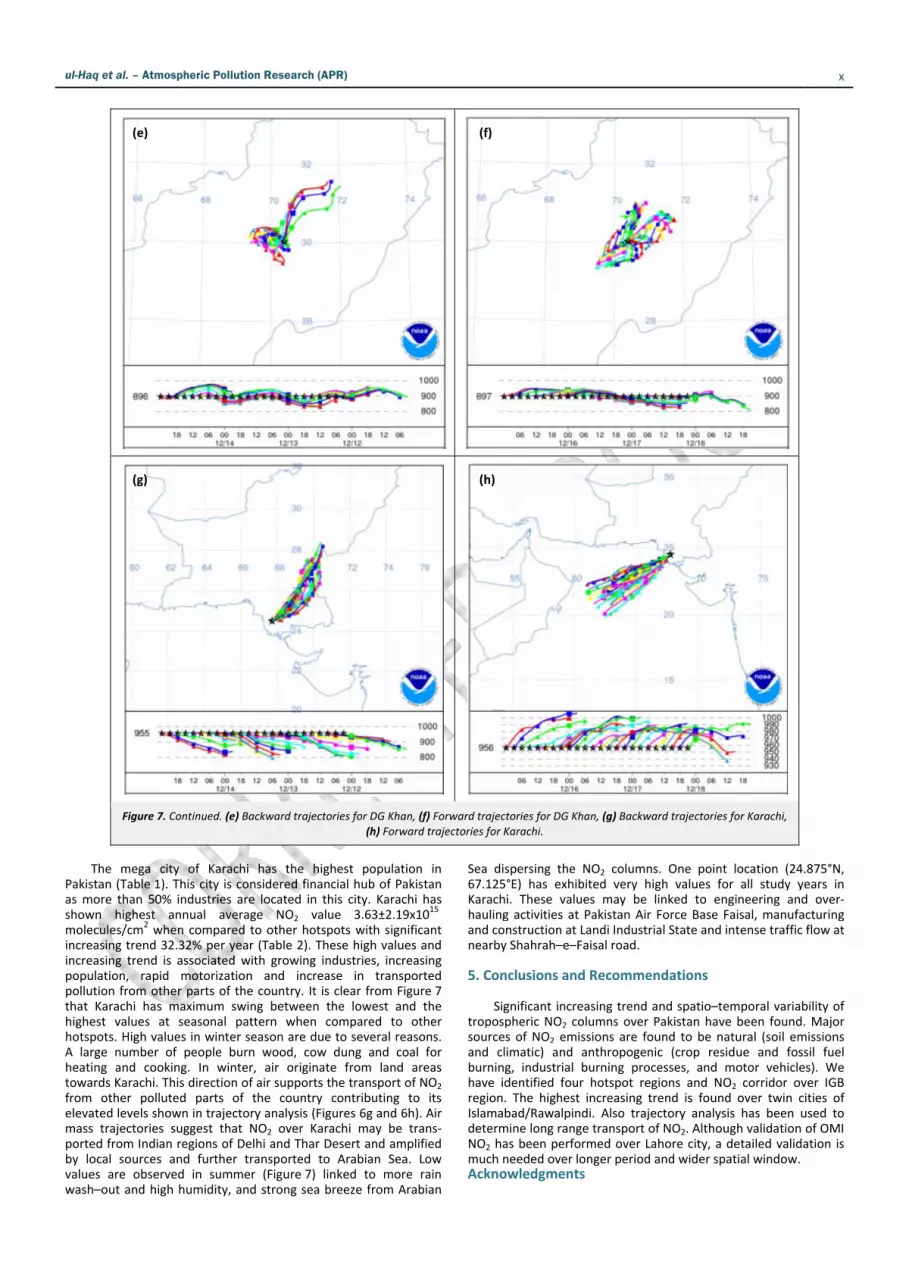
Dera Ghazi Khan is one of the most populous cities of Pakistan
located in Punjab has an increasing trend 31.40% per year. High values are observed during winter season (Figure 7). These ele‐vated levels are mostly linked to fossil fuel burning for energy for domestic and commercial purposes and activities at sugar mills. From Figures 6e and 6f it is evident that NO2 column values over Dera Ghazi Khan are transported from the neighboring regions of central Punjab and transported to northern Punjab in winter. DG Khan has shown a regular seasonal variability with the highest minimum values (Figure 7).
Figure 7. 24 hours backward and forward air mass trajectories for hotspots on 15 December 2007 at 0000 UTC above 500 m, calculated using NOAA’s hybrid single–particle Lagrangian integrated trajectory (HYSPLIT) model with Global Data Assimilation System (GDAS) data set. The hotspots are marked with stars. (a) Backward trajectories for Islamabad/Rawalpindi, (b) Forward
trajectories for Islamabad/Rawalpindi, (c) Backward trajectories for Lahore, (d) Forward trajectories for Lahore.
(a)
(d) (c)
(b)
ul-Haq et al. – Atmospheric Pollution Research (APR) x
Figure 7. Continued. (e) Backward trajectories for DG Khan, (f) Forward trajectories for DG Khan, (g) Backward trajectories for Karachi, (h) Forward trajectories for Karachi.
The mega city of Karachi has the highest population in
Pakistan (Table 1). This city is considered financial hub of Pakistan as more than 50% industries are located in this city. Karachi has shown highest annual average NO2 value 3.63±2.19x10¹⁵ molecules/cm2 when compared to other hotspots with significant increasing trend 32.32% per year (Table 2). These high values and increasing trend is associated with growing industries, increasing population, rapid motorization and increase in transported pollution from other parts of the country. It is clear from Figure 7 that Karachi has maximum swing between the lowest and the highest values at seasonal pattern when compared to other hotspots. High values in winter season are due to several reasons. A large number of people burn wood, cow dung and coal for heating and cooking. In winter, air originate from land areas towards Karachi. This direction of air supports the transport of NO2 from other polluted parts of the country contributing to its elevated levels shown in trajectory analysis (Figures 6g and 6h). Air mass trajectories suggest that NO2 over Karachi may be trans‐ported from Indian regions of Delhi and Thar Desert and amplified by local sources and further transported to Arabian Sea. Low values are observed in summer (Figure 7) linked to more rain wash–out and high humidity, and strong sea breeze from Arabian
Sea dispersing the NO2 columns. One point location (24.875°N, 67.125°E) has exhibited very high values for all study years in Karachi. These values may be linked to engineering and over‐hauling activities at Pakistan Air Force Base Faisal, manufacturing and construction at Landi Industrial State and intense traffic flow at nearby Shahrah–e–Faisal road.
5. Conclusions and Recommendations
Significant increasing trend and spatio–temporal variability of
tropospheric NO2 columns over Pakistan have been found. Major sources of NO2 emissions are found to be natural (soil emissions and climatic) and anthropogenic (crop residue and fossil fuel burning, industrial burning processes, and motor vehicles). We have identified four hotspot regions and NO2 corridor over IGB region. The highest increasing trend is found over twin cities of Islamabad/Rawalpindi. Also trajectory analysis has been used to determine long range transport of NO2. Although validation of OMI NO2 has been performed over Lahore city, a detailed validation is much needed over longer period and wider spatial window. Acknowledgments
(f) (e)
(h) (g)
ul-Haq et al. – Atmospheric Pollution Research (APR) x
We greatly acknowledge NASA for OMI data and NOAA for HYSPLIT model provided at web portals (http://disc.sci.gsfc.nasa. gov/giovanni) and (www.arl.noaa.gov/hysplit.php). We are also thankful to Pakistan Meteorological Department (Karachi center), National Fertilizer Development Centre, Pakistan, Federal Bureau of Statistics, Pakistan and Ministry of Food, Agriculture & Livestock, Pakistan for providing relevant data. We acknowledge the free use of tropospheric NO2 column data from SCIAMACHY sensor from www.temis.nl.
Supporting Material Available
(a) Agricultural land use, (b) population density, (c) averaged
fire pixel count (2004–2008), and (d) annual rainfall in Pakistan (1955–2000) (Figure S1). This information is available free of charge via the Internet at http://www.atmospolres.com.
References
Ahmad, S.S., Aziz, N., 2013. Spatial and temporal analysis of ground level
ozone and nitrogen dioxide concentration across the twin cities of Pakistan. Environmental Monitoring and Assessment 185, 3133–3147.
Ali, M., Salman, T., Khalid, M., Asim, D., Adila, B., Zia, U.H., 2014. A study of
aerosol properties over Lahore (Pakistan) by using AERONET data. Asia‐Pacific Journal of Atmospheric Science 50, 153‐162.
Ashraf, N., Mushtaq, M., Sultana, B., Iqbal, M., Ullah, I., Shahid, S.A., 2013.
Preliminary monitoring of tropospheric air quality of Lahore City in Pakistan. International Journal of Chemical and Biochemical Sciences 3,
19–28.
Badarinath, K.V.S., Chand, T.R.K., Prasad, V.K., 2006. Agriculture crop residue burning in the Indo–Gangetic Plains – a study using IRS–P6
AWIFS satellite data. Current Science 91, 1085–1089.
Boersma, K.F., Jacob, D.J., Trainic, M., Rudich, Y., DeSmedt, I., Dirksen, R., Eskes, H.J., 2009. Validation of urban NO2 concentrations and their
diurnal and seasonal variations observed from the SCIAMACHY and
OMI sensors using in situ surface measurements in Israeli cities. Atmospheric Chemistry and Physics 9, 3867–3879.
Boersma, K.F., Jacob, D.J., Eskes, H.J., Pinder, R.W., Wang, J., van der A, R.J.,
2008. Intercomparison of SCIAMACHY and OMI tropospheric NO2 columns: Observing the diurnal evolution of chemistry and emissions
from space. Journal of Geophysical Research–Atmospheres 113, art. no.
D16S26.
Boersma, K.F., Eskes, H.J., Veefkind, J.P., Brinksma, E.J., van der A, R.J.,
Sneep, M., van den Oord, G.H.J., Levelt, P.F., Stammes, P., Gleason, J.F.,
Bucsela, E.J., 2007. Near–real time retrieval of tropospheric NO2 from OMI. Atmospheric Chemistry and Physics 7, 2103–2118.
Boersma, K.F., Eskes, H.J., Brinksma, E.J., 2004. Error analysis for
tropospheric NO2 retrieval from space. Journal of Geophysical Research – Atmospheres 109, art. no. D04311.
Bucsela, E.J., Krotkov, N.A., Celarier, E.A., Lamsal, L.N., Swartz, W.H.,
Bhartia, P.K., Boersma, K.F., Veefkind, J.P., Gleason, J.F., Pickering, K.E., 2013. A new stratospheric and tropospheric NO2 retrieval algorithm for
nadir–viewing satellite instruments: Applications to OMI. Atmospheric
Measurement Techniques 6, 2607–2626.
Bucsela, E.J., Celarier, E.A., Wenig, M.O., Gleason, J.F., Veefkind, J.P.,
Boersma, K.F., Brinksma, E.J., 2006. Algorithm for NO2 vertical column
retrieval from the Ozone Monitoring Instrument. IEEE Transactions on Geoscience and Remote Sensing 44, 1245–1258.
Celarier, E.A., Brinksma, E.J., Gleason, J.F., Veefkind, J.P., Cede, A., Herman,
J.R., Ionov, D., Goutail, F., Pommereau, J.P., Lambert, J.C., van Roozendael, M., Pinardi, G., Wittrock, F., Schonhardt, A., Richter, A.,
Ibrahim, O.W., Wagner, T., Bojkov, B., Mount, G., Spinei, E., Chen, C.M.,
Pongetti, T.J., Sander, S.P., Bucsela, E.J., Wenig, M.O., Swart, D.P.J., Volten, H., Kroon, M., Levelt, P.F., 2008. Validation of Ozone
Monitoring Instrument nitrogen dioxide columns. Journal of
Geophysical Research–Atmospheres 113, art. no. D15S15.
Chelani, A.B., 2013. Study of extreme CO, NO2 and O3 concentrations at a
traffic site in Delhi: Statistical persistence analysis and source
identification. Aerosol and Air Quality Research 13, 377–384.
Cheng, M.M., Jiang, H., Guo, Z., 2012. Evaluation of long–term tropospheric
NO2 columns and the effect of different ecosystem in Yangtze River
Delta. Procedia Environmental Sciences 13, 1045–1056.
Colbeck, I., Nasir, Z.A., Ali, Z., Ahmad, S., 2010. Nitrogen dioxide and
household fuel use in the Pakistan. Science of the Total Environment
409, 357–363.
David, L.M., Nair, P.R., 2013. Tropospheric column O3 and NO2 over the
Indian region observed by Ozone Monitoring Instrument (OMI):
Seasonal changes and long–term trends. Atmospheric Environment 65, 25–39.
Duncan, B.N., Yoshida, Y., de Foy, B., Lamsal, L.N., Streets, D.G., Lu, Z.F.,
Pickering, K.E., Krotkov, N.A., 2013. The observed response of Ozone Monitoring Instrument (OMI) NO2 columns to NOX emission controls on
power plants in the United States: 2005–2011. Atmospheric
Environment 81, 102–111.
EDGAR (Emission Database for Global Atmospheric Research), 2010.
European Commission, release version 4.1. http://edgar.jrc.ec.europa.
eu, accessed in June 2014.
Eskes, H.J., Boersma, K.F., 2003. Averaging kernels for DOAS total–column
satellite retrievals. Atmospheric Chemistry and Physics 3, 1285–1291.
FBSP (Federal Bureau of Statistics, Pakistan), 2014. http://www.pbs.gov.pk, accessed in June 2014.
Fleming, Z.L., Monks, P.S., Manning, A.J., 2012. Review: Untangling the
influence of air–mass history in interpreting observed atmospheric composition. Atmospheric Research 104, 1–39.
Garg, A., Bhattacharya, S., Shukla, P.R., Dadhwal, V.K., 2001. Regional and
sectoral assessment of greenhouse gas emissions in India. Atmospheric Environment 35, 2679–2695.
Ghude, S.D., Van der A, R.J., Beig, G., Fadnavis, S., Polade, S.D., 2009.
Satellite derived trends in NO2 over the major global hotspot regions during the past decade and their inter–comparison. Environmental
Pollution 157, 1873–1878.
Giovanni (Geospatial Interactive Online Visualization and Analysis Infrastructure), 2014. Giovanni 3 Online Users Manual, http://disc.sci.
gsfc.nasa.gov/giovanni, accessed in June 2014.
GOP (Government of Pakistan), 2011. Economic Survey of Pakistan (2010–2011), Finance Division, Economic, Advisor's Wing, Islamabad, Pakistan.
Hains, J.C., Boersma, K.F., Kroon, M., Dirksen, R.J., Cohen, R.C., Perring,
A.E., Bucsela, E., Volten, H., Swart, D.P.J., Richter, A., Wittrock, F., Schoenhardt, A., Wagner, T., Ibrahim, O.W., van Roozendael, M.,
Pinardi, G., Gleason, J.F., Veefkind, J.P., Levelt, P., 2010. Testing and
improving OMI DOMINO tropospheric NO2 using observations from the DANDELIONS and INTEX–B validation campaigns. Journal of
Geophysical Research–Atmospheres 115, art. no. D05301.
Han, K.M., Lee, C.K., Lee, J., Kim, J., Song, C.H., 2011. A comparison study between model–predicted and OMI–retrieved tropospheric NO2
columns over the Korean peninsula. Atmospheric Environment 45,
2962–2971.
Hayn, M., Beirle, S., Hamprecht, F.A., Platt, U., Menze, B.H., Wagner, T.,
2009. Analysing spatio–temporal patterns of the global NO2–
distribution retrieved from GOME satellite observations using a generalized additive model. Atmospheric Chemistry and Physics 9,
6459–6477.
He, Y., Uno, I., Wang, Z., Ohara, T., Sugirnoto, N., Shimizu, A., Richter, A., Burrows, J.P., 2007. Variations of the increasing trend of tropospheric
NO2 over central east China during the past decade. Atmospheric
Environment 41, 4865–4876.
HTAP (Hemispheric Transport of Air Pollution), 2010. Hemispheric
Transport of Air Pollution 2010, Part A: Ozone and Particulate Matter,
Air Pollution Studies, No. 17, Edited by. Dentener, F., Keating T., Akimoto, H., The Task Force on Hemispheric Transport of Air Pollution
(HTAP) Acting within the Framework of the Convention on Long–Range
Transboundary Air Pollution (LRTAP) of the United Nations Economic

ul-Haq et al. – Atmospheric Pollution Research (APR) x
Commission for Europe (UNECE), United Nations, New York and
Geneva, 86 pages.
ISDR (International Strategy for Disaster Reduction), 2005. A review of disaster management policies and systems in Pakistan. The World
Conference on Disaster Reduction, Kobe, Japan, 44 pages.
Jahangir, S., Ahmad, S.S., Aziz, N., Shah, M.T.A., 2013. Spatial variation of nitrogen dioxide concentration in private and public hospitals of
Rawalpindi and Islamabad, Pakistan. Journal of International
Environmental Application & Science 8, 16–24.
Kanaya, Y., Tanimoto, H., Matsumoto, J., Furutani, H., Hashimoto, S.,
Komazaki, Y., Tanaka, S., Yokouchi, Y., Kato, S., Kajii, Y., Akimoto, H.,
2007. Diurnal variations in H2O2, O3, PAN, HNO3 and aldehyde concentrations and NO/NO2 ratios at Rishiri Island, Japan: Potential
influence from iodine chemistry. Science of the Total Environment 376,
185–197.
Kloog, I., Nordio, F., Coull, B.A., Schwartz, J., 2012. Incorporating local land
use regression and satellite aerosol optical depth in a hybrid model of
spatiotemporal PM2.5 exposures in the Mid–Atlantic states. Environmental Science & Technology 46, 11913–11921.
Kunhikrishnan, T., Lawrence, M.G., von Kuhlmann, R., Wenig, M.O., Asman,
W.A.H., Richter, A., Burrows, J.P., 2006. Regional NOx emission strength for the Indian subcontinent and the impact of emissions from India and
neighboring countries on regional O3 chemistry. Journal of Geophysical
Research–Atmospheres 111, art. no. D15301.
Kunhikrishnan, T., Lawrence, M.G., von Kuhlmann, R., Richter, A.,
Ladstatter–Weissenmayer, A., Burrows, J.P., 2004. Analysis of
tropospheric NOx over Asia using the model of atmospheric transport and chemistry (MATCH–MPIC) and GOME–satellite observations.
Atmospheric Environment 38, 581–596.
Lamsal, L.N., Martin, R.V., van Donkelaar, A., Celarier, E.A., Bucsela, E.J., Boersma, K.F., Dirksen, R., Luo, C., Wang, Y., 2010. Indirect validation of
tropospheric nitrogen dioxide retrieved from the OMI satellite
instrument: Insight into the seasonal variation of nitrogen oxides at northern midlatitudes. Journal of Geophysical Research–Atmospheres
115, art. no. D05302.
Leue, C., Wenig, M., Wagner, T., Klimm, O., Platt, U., Jahne, B., 2001. Quantitative analysis of NOX emissions from Global Ozone Monitoring
Experiment satellite image sequences. Journal of Geophysical
Research–Atmospheres 106, 5493–5505.
Levelt, P.F., Van den Oord, G.H.J., Dobber, M.R., Malkki, A., Visser, H., de
Vries, J., Stammes, P., Lundell, J.O.V., Saari, H., 2006a. The Ozone
Monitoring Instrument. IEEE Transactions on Geoscience and Remote Sensing 44, 1093–1101.
Levelt, P.F., Hilsenrath, E., Leppelmeier, G.W., van den Oord, G.H.J., Bhartia,
P.K., Tamminen, J., de Haan, J.F., Veefkind, J.P., 2006b. Science objectives of the Ozone Monitoring Instrument. IEEE Transactions on
Geoscience and Remote Sensing 44, 1199–1208.
Mahar, A., Ahmad, I., Wasila, H., Siyal, A.N., Abro, S.A., Malik, R.N., Gabol, A., Channa, S.A., Noor, S., Shah, M., Khan, M.A., 2013. Concentrations
of road transport–related air pollutants and it's health implications of
Hyderabad City, Pakistan. Global Journal of Biodiversity Science and Management 3, 269–275.
Martin, P., Cabanas, B., Villanueva, F., Gallego, M.P., Colmenar, I., Salgado,
S., 2010. Ozone and nitrogen dioxide levels monitored in an urban area (Ciudad Real) in central–southern Spain. Water Air and Soil Pollution
208, 305–316.
MFALP (Ministry of Food, Agriculture & Livestock, Pakistan), 2014. http://faorap–apcas.org/pakistan/Agriculture%20Statistics%20of%
20Pakistan%202004–05, accessed in 2014.
Mishra, A.K., Shibata, T., 2012. Climatological aspects of seasonal variation of aerosol vertical distribution over central Indo–Gangetic belt (IGB)
inferred by the space–borne lidar CALIOP. Atmospheric Environment
46, 365–375.
Oluleye, A., Okogbue, E.C., 2013. Analysis of temporal and spatial variability
of total column ozone over West Africa using daily TOMS
measurements. Atmospheric Pollution Research 4, 387–397.
PEPA (Pakistan Environmental Protection Agency), 2005. Pakistan State of
the Environment (SoE) Report.
PEPA/JICA (Pakistan Environmental Protection Agency/ Japan International Cooperation Agency), 2006. Measurement of NO2 Concentration in
Different Cities of Pakistan Using Diffusion Samplers (Karachi,
Islamabad, Peshawar, Lahore and Quetta).
Prud'homme, G., Dobbin, N.A., Sun, L., Burnett, R.T., Martin, R.V., Davidson,
A., Cakmak, S., Villeneuve, P.J., Lamsal, L.N., van Donkelaar, A., Peters,
P.A., Johnson, M., 2013. Comparison of remote sensing and fixed–site monitoring approaches for examining air pollution and health in a
national study population. Atmospheric Environment 80, 161–171.
PWP (Pakistan Web Portal), 2013. http://www.pakistan.gov.pk, accessed in 2013.
Richter, A., Burrows, J.P., 2002. Tropospheric NO2 from GOME
measurements. Advances in Space Research 29, 1673–1683.
Satheesh, S.K., Moorthy, K.K., 2005. Radiative effects of natural aerosols: A
review. Atmospheric Environment 39, 2089–2110.
Saud, T., Mandal, T.K., Gadi, R., Singh, D.P., Sharma, S.K., Saxena, M., Mukherjee, A., 2011. Emission estimates of particulate matter (PM)
and trace gases (SO2, NO and NO2) from biomass fuels used in rural
sector of Indo–Gangetic Plain, India. Atmospheric Environment 45, 5913–5923.
Sheel, V., Lal, S., Richter, A., Burrows, J.P., 2010. Comparison of satellite
observed tropospheric NO2 over India with model simulations. Atmospheric Environment 44, 3314–3321.
Shon, Z.H., Kim, K.H., Song, S.K., 2011. Long–term trend in NO2 and NOx
levels and their emission ratio in relation to road traffic activities in East Asia. Atmospheric Environment 45, 3120–3131.
Tan, K.C., Hwee, S.L., Jafri, M.Z.M., 2014. Analysis of total column ozone in
Peninsular Malaysia retrieved from SCIAMACHY. Atmospheric Pollution Research 5, 42‐51.
Tariq, M.A.U.R., van de Giesen, N., 2012. Floods and flood management in
Pakistan. Physics and Chemistry of the Earth 47–48, 11–20.
U.S. CAR (U.S. Climate Action Report), 2010. U.S. Department of State,
Washington: Global Publishing Services.
U.S. EPA (U.S. Environmental Protection Agency), 1998. National Air Quality and Emissions Trends Report 1997, Report 454/R–98–016,
http://www.epa.gov/, accessed in 2013.
Van der A, R.J., Eskes, H.J., Boersma, K.F., van Noije, T.P.C., Van Roozendael, M., De Smedt, I., Peters, D.H.M.U., Kuenen, J.J.P., Meijer, E.W., 2008.
Identification of NO2 sources and their trends from space using
seasonal variability analyses. Journal of Geophysical Research 113, art. no. D04302.
van Noije, T.P.C., Eskes, H.J., Dentener, F.J., Stevenson, D.S., Ellingsen, K.,
Schultz, M.G., Wild, O., Amann, M., Atherton, C.S., Bergmann, D.J., Bey, I., Boersma, K.F., Butler, T., Cofala, J., Drevet, J., Fiore, A.M., Gauss, M.,
Hauglustaine, D.A., Horowitz, L.W., Isaksen, I.S.A., Krol, M.C.,
Lamarque, J.F., Lawrence, M.G., Martin, R.V., Montanaro, V., Muller, J.F., Pitari, G., Prather, M.J., Pyle, J.A., Richter, A., Rodriguez, J.M.,
Savage, N.H., Strahan, S.E., Sudo, K., Szopa, S., van Roozendael, M.,
2006. Multi–model ensemble simulations of tropospheric NO2 compared with GOME retrievals for the year 2000. Atmospheric
Chemistry and Physics 6, 2943–2979.
Wallace, J., Kanaroglou, P., 2009. The sensitivity of OMI–derived nitrogen dioxide to boundary layer temperature inversions. Atmospheric
Environment 43, 3596–3604.
Werner, R., Valev, D., Atanassov, A., Guineva, V., Kirillov, A., 2013. Analysis of variations and trends of the NO2 slant column abundance obtained
by DOAS measurements at Stara Zagora and at NDACC European mid–
latitude stations in comparison with subtropical stations. Journal of Atmospheric and Solar–Terrestrial Physics 99, 134–142.
WHO (World Health Organization), 2000. Air Quality Guidelines for Europe,
Second Edition, WHO Regional Publications, European Series, No. 91.
Zafar, L., Ahmad, S.S., Syed, W.A.A, Ali, S.S., 2012. Temporal variations in
nitrogen dioxide concentration due to vehicular emissions in Islamabad

ul-Haq et al. – Atmospheric Pollution Research (APR) x
capital territory (ICT) & Rawalpindi. Science International (Lahore) 24,
265–268.
Zhou, Y.P., Brunner, D., Hueglin, C., Henne, S., Staehelin, J., 2012. Changes in OMI tropospheric NO2 columns over Europe from 2004 to 2009 and
the influence of meteorological variability. Atmospheric Environment
46, 482–495.
Zyrichidou, I., Koukouli, M.E., Balis, D.S., Kioutsioukis, I., Poupkou, A.,
Katragkou, E., Melas, D., Boersma, K.F., van Roozendael, M., 2013.
Evaluation of high resolution simulated and OMI retrieved tropospheric NO2 column densities over Southeastern Europe.
Atmospheric Research 122, 55–66.