nanostructured sno2 thin films for no2 gas sensing applications
TRANSCRIPT

CERAMICSINTERNATIONAL
Available online at www.sciencedirect.com
0272-8842/$ - sehttp://dx.doi.org/
nCorrespondinE-mail addre
Ceramics International 39 (2013) 8673–8679www.elsevier.com/locate/ceramint
Nanostructured SnO2 thin films for NO2 gas sensing applications
G.D. Khuspea, R.D. Sakharea, S.T. Navalea, M.A. Chougulea, Y.D. Kolekarb, R.N. Mulika,R.C. Pawarc, C.S. Leec, V.B. Patila,n
aFunctional Materials Research Laboratory, School of Physical Sciences, Solapur University, Solapur 413255, Maharashtra, IndiabDepartment of Physics, Pune University, Pune 411007, Maharashtra, India
cDepartment of Materials Engineering, Hanyang University, Ansan 426-791, South Korea
Received 2 March 2013; received in revised form 12 April 2013; accepted 12 April 2013Available online 22 April 2013
Abstract
We report the synthesis of nanostructured SnO2 by a simple inexpensive sol–gel spin coating method using m-cresol as a solvent. This methodfacilitates rapid synthesis at comparatively lower temperature enabling formation of nanostructures suitable for gas-sensing applications. Variousphysicochemical techniques have been used for the characterization of SnO2 thin films. X-ray diffraction analysis confirmed the single-phaseformation of tetragonal SnO2 having crystallite size 5–10 nm. SnO2 showed highest response (19%) with 77.90% stability toward 100 ppmnitrogen dioxide (NO2) at 200 1C. The response time of 7 s and recovery time of 20 min were also observed with the same operating parameters.The probable mechanism is proposed to explain the selective response toward nitrogen dioxide. Impedance spectroscopy studies showed that theresponse to nitrogen dioxide is mainly contributed by grain boundaries. The reproducibility and stability study of SnO2 sensor confirmed itscandidature for detection of NO2 gas at low concentration (10–100 ppm) and lower operating temperature.& 2013 Elsevier Ltd and Techna Group S.r.l. All rights reserved.
Keywords: Sol–gel synthesis; SnO2 thin films; Crystal structure; NO2 sensor; Stability
1. Introduction
An environment friendly n-type semiconductor, SnO2, hasbeen proved to be an excellent gas sensitive material for detectionof toxic, combustible, explosive and harmful gases in both thedomestic and industrial applications. In the past decade, extensiveresearch has revealed that the solid-state gas sensors play a crucialrole in monitoring the environmental and chemical process,occupational health, safety and medical devices [1]. In compar-ison with the other solid-state sensors, semiconductor metal oxidebased sensors have been widely investigated owing to their smalldimensions, low cost, fast response and good recovery speed, andhigh compatibility with Si-based microelectronics [2,3]. Semi-conducting metal oxides, such as ZnO, TiO2, Fe2O3 and NiOhave been studied widely and are reported to be sensitive towardcertain gas species [4–7].
As far as the gas sensor performance is concerned, the gassensitivity, selectivity and durability are the most important
e front matter & 2013 Elsevier Ltd and Techna Group S.r.l. All ri10.1016/j.ceramint.2013.04.047
g author. Tel.: +91 2172744771x202; fax: +91 2172744770.ss: [email protected] (V.B. Patil).
properties. High gas sensitivity is the key factor in detectinggases at very low concentration as recognized by internationalstandards [8]. The efficiency of semiconductor gas sensor isstrongly influenced by nature of surface sites, the electrondonor/acceptor properties of gas, the adsorption, the surfacereaction and subsequent desorption of the gas species [9–11].Extensive studies have been reported to improve the gassensing performances of SnO2 based sensor, such as addingpromoters, doping additives, decreasing grain size, controllingpore and surface defects, etc. [11–13]. It is well-known that theshape and size of SnO2 have a significant influence on its gassensing properties. Nanosized particles have high surface tovolume ratio and hence are ideal as potential gas-sensingmaterials.It is known that high temperature is required to form the
SnO2 single phase with tetragonal structure. However, byemploying the sol–gel method, it can be synthesized at relativelylower temperature and short time. The phase formation at lowertemperature restricts the crystal growth, favors its application ingas sensing. To the best of our knowledge, the nanostructuredSnO2 prepared by a sol–gel spin coating method using m-cresol
ghts reserved.
20 30 40 50 60 70
(301
)(1
12)
(310
)
(002
)(220
)
(200
)
(211
)
(101
)
(110
)
Inte
nsity
(arb
.uni
t)
2θ (degree)
SnO2
Fig. 1. XRD pattern of SnO2 calcinated at 700 1C.
G.D. Khuspe et al. / Ceramics International 39 (2013) 8673–86798674
as a solvent have not been reported so far in gas sensorapplications. It is well known that the gas sensing properties ofoxide materials are strongly influenced by the surface morphol-ogy and grain size. Therefore, one can improve the sensitivityby controlling the grain size and surface morphology. Thepresent study deals with the simple and cost effective synthesisof SnO2 nanoparticles using sol–gel spin coating method withm-cresol as a solvent. The effect of operating temperature, gasconcentration and surface morphology on the NO2 gas sensingproperties of nanostructured SnO2 were studied. The SnO2
sensor exhibit highest sensitivity toward NO2 at lower concen-tration (10–100 ppm) and lower operating temperature(o300 1C). Other gases such as NH3, C2H5OH, CH3OH,H2S, and Cl2 show low response, indicating high selectivitytoward NO2.
2. Experimental details
A sol–gel synthesis method was used for preparation ofSnO2 wherein the AR grade SnCl4 � 5H2O and CH3OH weremixed and the reaction mixture was stirred vigorously at 60 1Cfor 1 h, leading to the formation of gel. This gel was furtherheated for 10 min to obtain faint yellow color powder. Theobtained powder was then placed in an alumina boat andannealed at 700 1C for 1 h, subsequently cooled to roomtemperature. Samples were collected, washed several timeswith distilled water to remove the salt and dried in air at100 1C for 1 h. For thin film formation, SnO2 powder wasdissolved in m-cresol and solution was continuously stirred for11 h at room temperature and filtered. The filtered homoge-neous solution of SnO2 was deposited on to a glass substrateby a single wafer spin coating unit. The above films werecharacterized by various techniques. The structural and particlesize determination was carried out by a Philips PW-3710 X-raydiffractometer using CuKα line with an accelerating voltage of40 kV. The Field emission scanning electron microscopy(FESEM) images were scanned using MIRA3 TESCAN,USA while Transmission electron microscopy (TEM) wasperformed using Philips-800 TEM. The thickness of the filmwas measured by using AMBIOS XP-1 surface profiler with1 A1 vertical resolution. The detailed gas-sensing characteriza-tion was carried out at different operating temperatures and fordifferent gases to explore the applications for these films.Impedance measurements were carried out in the frequencyrange 20–10 MHz using Wayne Kerr make (model 6500-B)precision impedance analyzer. The measurements were carriedout at 200 1C temperature.
3. Gas sensing characteristics
To study the gas-sensing characteristics of SnO2, sampleswere made in the thin film form with thickness 0.92 mm [14].The gas response was measured after providing the ohmiccontacts using silver paste. Films were subjected for studyingsensitivity and selectivity toward the known amount of varioustest gases using the custom fabricated dynamic setup [15,16].The sensor film was kept in the insulated steel chamber.
The known amount of test gas was introduced in the gas-mixing chamber so that the required ppm level was attained.The gas-sensing characteristics with reference to time, atdifferent operating temperatures and concentrations wererecorded using a programmable 6514 Keithley Electrometer.The gas response (S) for a given test gas is calculated asfollows:
S ¼ Ra=Rg ð1Þwhere Ra and Rg are the electrical resistances of the sensor inair and in test gas, respectively.
4. Results and discussion
Sol–gel spin coating thin film deposition technique offers animportant advantages over other techniques due to excellentcompositional control, high homogeneity at the molecularlevel, lower crystallization temperature, large surface areaand feasibility of producing thin films on complex shapes. Amajor advantage of sol–gel processes over other methods is theability to control the microstructure of deposited film, i.e. thepore size, pore volume [17].It is well known that the gas response is a surface
phenomena wherein, various oxygen species viz., O−, O2−
and O2− available on the surface of metal oxide play asignificant role in the detection of gases. More precisely,depending upon the temperature, oxygen is ionosorbed on thesurface primarily as O2− ions below 147 1C or as O− ionsbetween 147 1C and 397 1C. Above 397 1C, the formation ofO2− also occurs, which then directly gets incorporated into thelattice above 597 1C [18].
4.1. Structural characterization
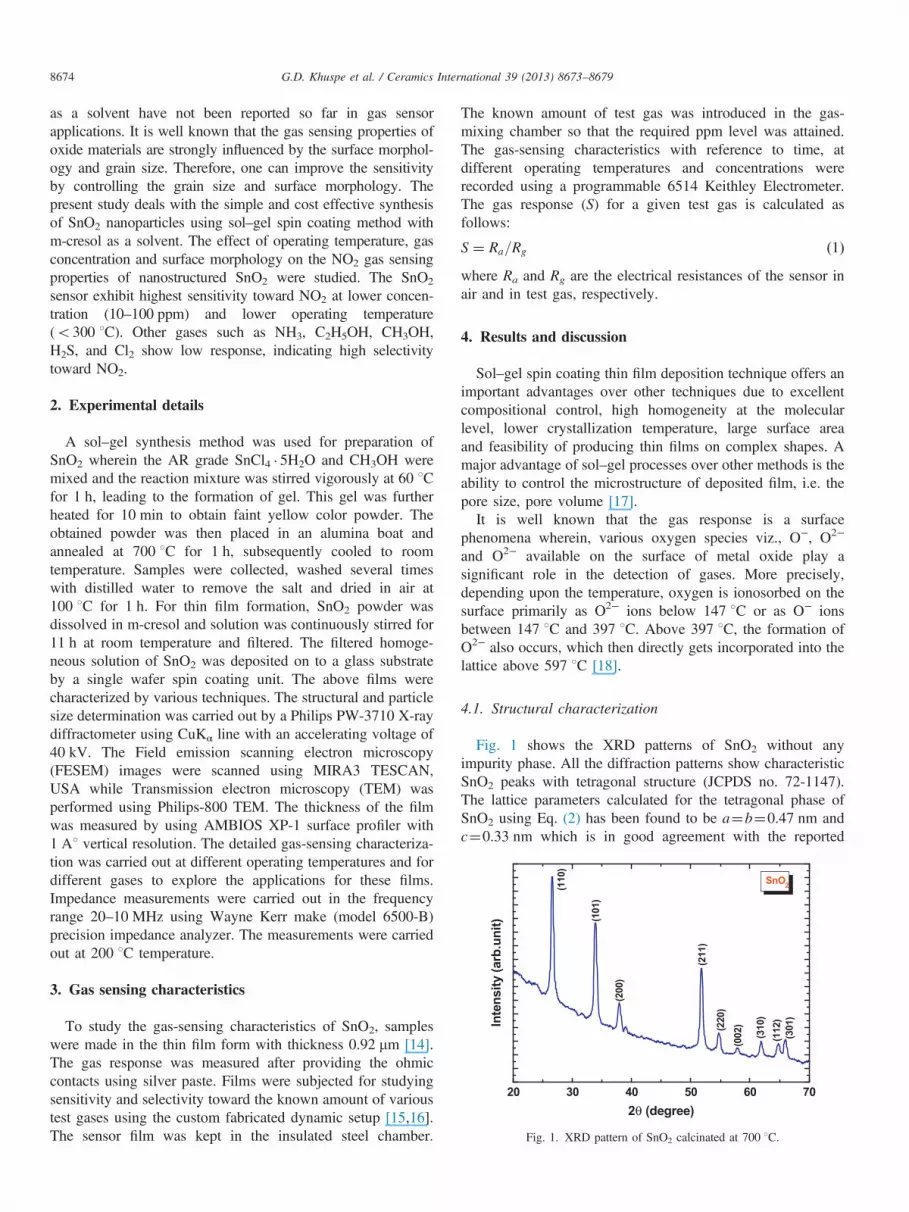
Fig. 1 shows the XRD patterns of SnO2 without anyimpurity phase. All the diffraction patterns show characteristicSnO2 peaks with tetragonal structure (JCPDS no. 72-1147).The lattice parameters calculated for the tetragonal phase ofSnO2 using Eq. (2) has been found to be a¼b¼0.47 nm andc¼0.33 nm which is in good agreement with the reported

G.D. Khuspe et al. / Ceramics International 39 (2013) 8673–8679 8675
JCPDS no. 72-1147.
1=d2 ¼ h2 þ k2=a2 þ l2=c2 ð2ÞThe average crystallite size (D) calculated from Scherer's
formula, Eq. (3) is in the range of 10–15 nm.
D¼ 0:94λ=β cos θ ð3Þwhere ‘D’ is the average crystallite size, assuming particles tobe spherical K¼0.94, ‘λ’ is the wavelength of X-ray radiation,‘β’ is the full width at half maximum of the diffracted peakmeasured in radians and θ is the angle of diffraction.
4.2. FESEM analysis
The two-dimensional high magnification surface morphol-ogy of SnO2 thin films processed at 700 1C was carried outusing FESEM image (Fig. 2). From the FESEM image, it isseen that the film consists of nanocrystalline grains withuniform coverage of the substrate surface with randomlyoriented morphology. It is well known that the sensingmechanism is surface controlled process in which grain size,
Fig. 2. FESEM of SnO2 thin films.
002220211200101
110
Fig. 3. (a) TEM image of SnO2
surface states, porosity and oxygen adsorption plays afundamental role.
4.3. TEM analysis
The shape and size of the nanostructures are determined byTEM. The TEM images of the SnO2 show formation of nearlynanospherical particles (Fig. 3). It is interesting to find suchnanospherical particles remaining distinctly separated evenafter heating at a high temperature (700 1C). The diameter ofparticles (Fig. 3(a)) varies from 5 to 10 nm with majority ofparticles having less than 10 nm size. The selected areaelectron diffraction (SAED) pattern (Fig. 3 (b)) of an isolatedparticle shows bright spots corresponding to the (110), (101),(200), (211), (220), (002) lattice planes of a tetragonalstructure of SnO2. These lattice planes match well with theplanes observed in the XRD pattern.Structural studies reveal the formation of large amount of
uniformly distributed distinct nanoparticles of SnO2. Suchmorphology is preferred for gas sensing, as it promotesadsorption of gas molecules through the film surface.
4.4. Gas-sensing characterization
Gas sensitivity is greatly influenced by the operatingtemperature. Wide band gap oxides like SnO2, TiO2 andZnO mostly sense gases at higher operating temperatures.The gas response of the samples was tested for the differentgases. Prior to gas-sensing characterization, the samples weretreated in air at 100 1C for 1 h. This thermal treatment createsoxygen species in the form of O−, O2− and O2− on the oxidesurface which play an important role in the gas-sensingphenomena.
4.4.1. Stabilization of sensor resistanceStabilization of metal oxide film resistance in ambient air
prior to exposure of gas is very important, because it ensuresstable zero level for gas sensing application [4,5]. Because ofthat before exposing gas to SnO2 films, the electrical resistance
and (b) SAED pattern.

G.D. Khuspe et al. / Ceramics International 39 (2013) 8673–86798676
was allowed to be stable for 30 min and the behavior ofresistance was observed. Fig. 4 shows the initial stabilizationcurve of the SnO2 film at 200 1C. The decrease in resistanceobserved at the beginning of stabilization period can beattributed to the generation of electrons due to thermalexcitation [4,5]. The resistance of the film decreases graduallyfrom 1.60� 109 Ω to 3.44� 108 Ω at 200 1C in the first 3 minand for next 6.5 min, the resistance decreases slowly then itremains constant. After 30 min, the SnO2 thin film attains astable constant resistance of 4.95� 108 Ω at 200 1C.
4.4.2. Effect of operating temperature and NO2 concentrationBefore exposing to NO2 gas, the SnO2 film was allowed to
be stable for electrical resistance for 30 min and the stabilizedresistance was taken as Ra. Initially, the gas response to100 ppm of SnO2 was measured as a function of operatingtemperature for SnO2 film and is shown in Fig. 5. The sensorresponse reached maximum at 200 1C (gas response¼19%)and then decreased. It is well known that at lower temperature,
0 500 1000 1500 2000
2.0x10⁸
4.0x10⁸
6.0x10⁸
8.0x10⁸
1.0x10⁹
1.2x10⁹
1.4x10⁹
1.6x10⁹
1.8x10⁹
Res
ista
nce
(Ω)
Time (second)
Stabilization-SnO2
Fig. 4. Resistance stabilization curve with time for SnO2 film at 200 1C.
50 100 150 200 250 3002
4
6
8
10
12
14
16
18
20
Res
pons
e, S
(%)
Temperature (°C)
100 ppm NO2
Fig. 5. Response toward NO2 for SnO2 at the different operating temperatures.
the response is restricted by the speed of chemical reaction,and at high temperature, by the speed of diffusion of gasmolecules. At some intermediate temperature, the speeds oftwo processes become equal, and at that temperature, thesensor response reaches to its maximum [7,8].
4.4.3. Selectivity of SnO2 sensorThe ability of a gas sensor to response to a certain gas in the
presence of other gases is known as selectivity. The selectivity ofa sensor in relation to a definite gas is closely associated with itsoperating temperature. Fig. 6 shows the bar diagram of gasresponse of different gases at a fixed concentration of 100 ppm.From the bar diagram, it is revealed that the SnO2 sensor offeredmaximum response to NH3 (4%), H2S (9%), and NO2 (19%) at200 1C. The SnO2 film showed more selectivity for NO2 overH2S compared to NH3 (SNO2/SH2S¼2.12, and SNO2/SNH3¼4.17)at an operating temperature 200 1C. It is revealed that NO2 ismore selective against NH3 and poor selective against H2S.Different gases have different energies to react with surface ofsensor material. The rate of reaction of NO2 molecules withsurface of SnO2 could be greater. Therefore SnO2 showsmaximum gas response to NO2 than other gases. Therefore,further dependence of NO2 response on NO2 concentration ofSnO2 film was studied.Once the operating temperature is fixed, the sensor response is
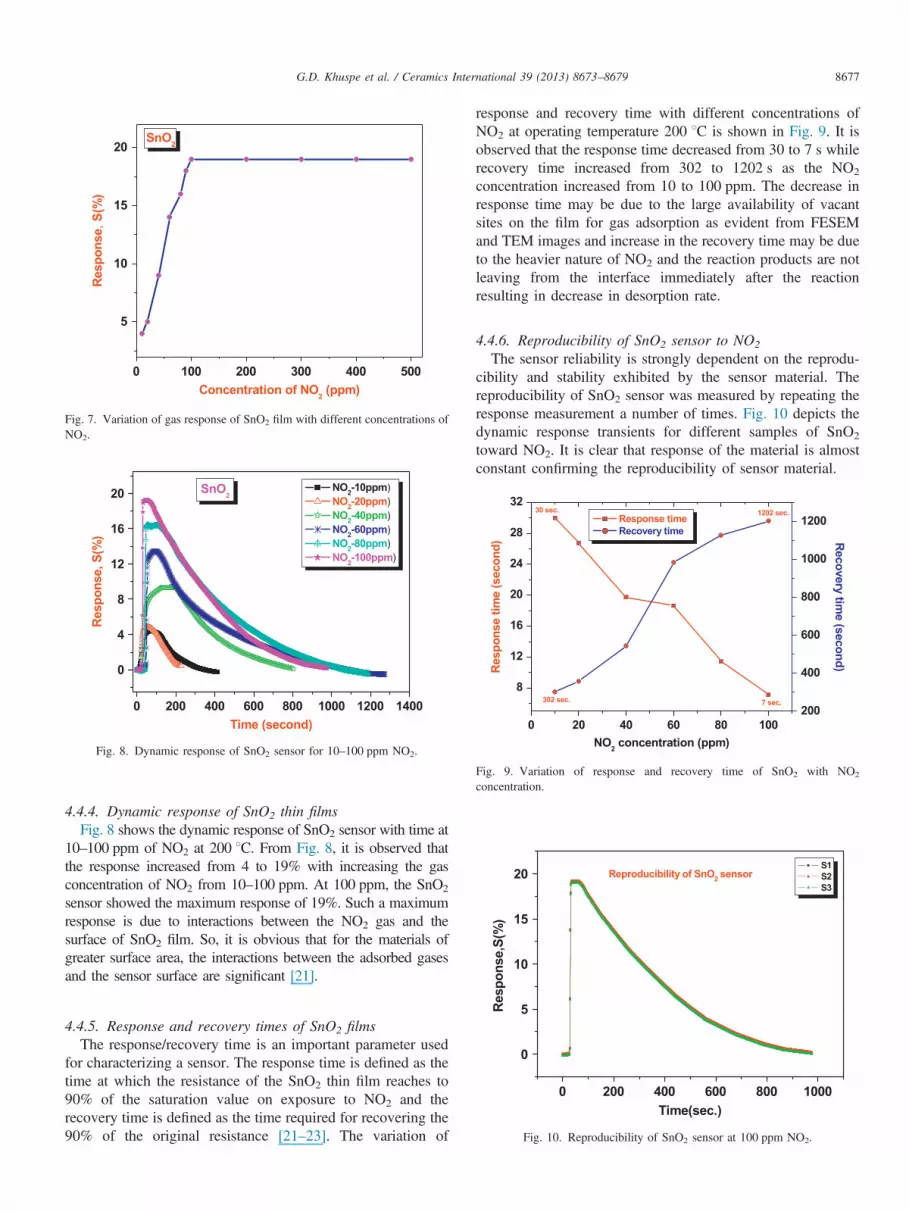
studied at different NO2 concentrations. Fig. 7 shows the responseof SnO2 film as a function of NO2 concentration. The responseincreased from 4 to 19%, as the NO2 concentration increasedfrom 10 to 100 ppm. The gas response showed saturation at NO2
concentration more than 100 ppm due to increased surfacereaction [18,19]. The response of a sensor depends on removalof adsorbed oxygen molecules by reaction with a target gas andgeneration of electrons. For a small concentration of gas, exposedto a fixed surface area of a sample, there is lower coverage of gasmolecules on the surface and hence lower surface reactionoccurred. An increase in gas concentration increases the surfacereaction due to larger surface coverage [20].
NO2 H2S NH30
2
4
6
8
10
12
14
16
18
20
4%
9%
19%
100ppm
100ppm
100ppm
Res
pons
e, S
(%)
Gas
SnO2 sensor
Fig. 6. Gas response of SnO2 sensor to 100 ppm of NO2, H2S and NH3.
0 200 400 600 800 1000 1200 1400
0
4
8
12
16
20 SnO2
Res
pons
e, S
(%)
Time (second)
NO2-10ppm) NO2-20ppm) NO2-40ppm) NO2-60ppm) NO2-80ppm) NO2-100ppm)
Fig. 8. Dynamic response of SnO2 sensor for 10–100 ppm NO2.
0 20 40 60 80 100
8
12
16
20
24
28
32
7 sec.
1202 sec.
302 sec.
30 sec. Response time Recovery time
NO2 concentration (ppm)
Res
pons
e tim
e (s
econ
d)
200
400
600
800
1000
1200
Recovery time (second)
Fig. 9. Variation of response and recovery time of SnO2 with NO2
concentration.
0 100 200 300 400 500
5
10
15
20
Concentration of NO2 (ppm)
Res
pons
e, S
(%)
SnO2
Fig. 7. Variation of gas response of SnO2 film with different concentrations ofNO2.
10
15
20 Reproducibility of SnO2 sensor
onse
,S(%
)
S1 S2 S3
G.D. Khuspe et al. / Ceramics International 39 (2013) 8673–8679 8677
4.4.4. Dynamic response of SnO2 thin filmsFig. 8 shows the dynamic response of SnO2 sensor with time at
10–100 ppm of NO2 at 200 1C. From Fig. 8, it is observed thatthe response increased from 4 to 19% with increasing the gasconcentration of NO2 from 10–100 ppm. At 100 ppm, the SnO2
sensor showed the maximum response of 19%. Such a maximumresponse is due to interactions between the NO2 gas and thesurface of SnO2 film. So, it is obvious that for the materials ofgreater surface area, the interactions between the adsorbed gasesand the sensor surface are significant [21].
0 200 400 600 800 1000
0
5Res
p
Time(sec.)
Fig. 10. Reproducibility of SnO2 sensor at 100 ppm NO2.
4.4.5. Response and recovery times of SnO2 filmsThe response/recovery time is an important parameter used
for characterizing a sensor. The response time is defined as thetime at which the resistance of the SnO2 thin film reaches to90% of the saturation value on exposure to NO2 and therecovery time is defined as the time required for recovering the90% of the original resistance [21–23]. The variation of
response and recovery time with different concentrations ofNO2 at operating temperature 200 1C is shown in Fig. 9. It isobserved that the response time decreased from 30 to 7 s whilerecovery time increased from 302 to 1202 s as the NO2
concentration increased from 10 to 100 ppm. The decrease inresponse time may be due to the large availability of vacantsites on the film for gas adsorption as evident from FESEMand TEM images and increase in the recovery time may be dueto the heavier nature of NO2 and the reaction products are notleaving from the interface immediately after the reactionresulting in decrease in desorption rate.
4.4.6. Reproducibility of SnO2 sensor to NO2
The sensor reliability is strongly dependent on the reprodu-cibility and stability exhibited by the sensor material. Thereproducibility of SnO2 sensor was measured by repeating theresponse measurement a number of times. Fig. 10 depicts thedynamic response transients for different samples of SnO2
toward NO2. It is clear that response of the material is almostconstant confirming the reproducibility of sensor material.
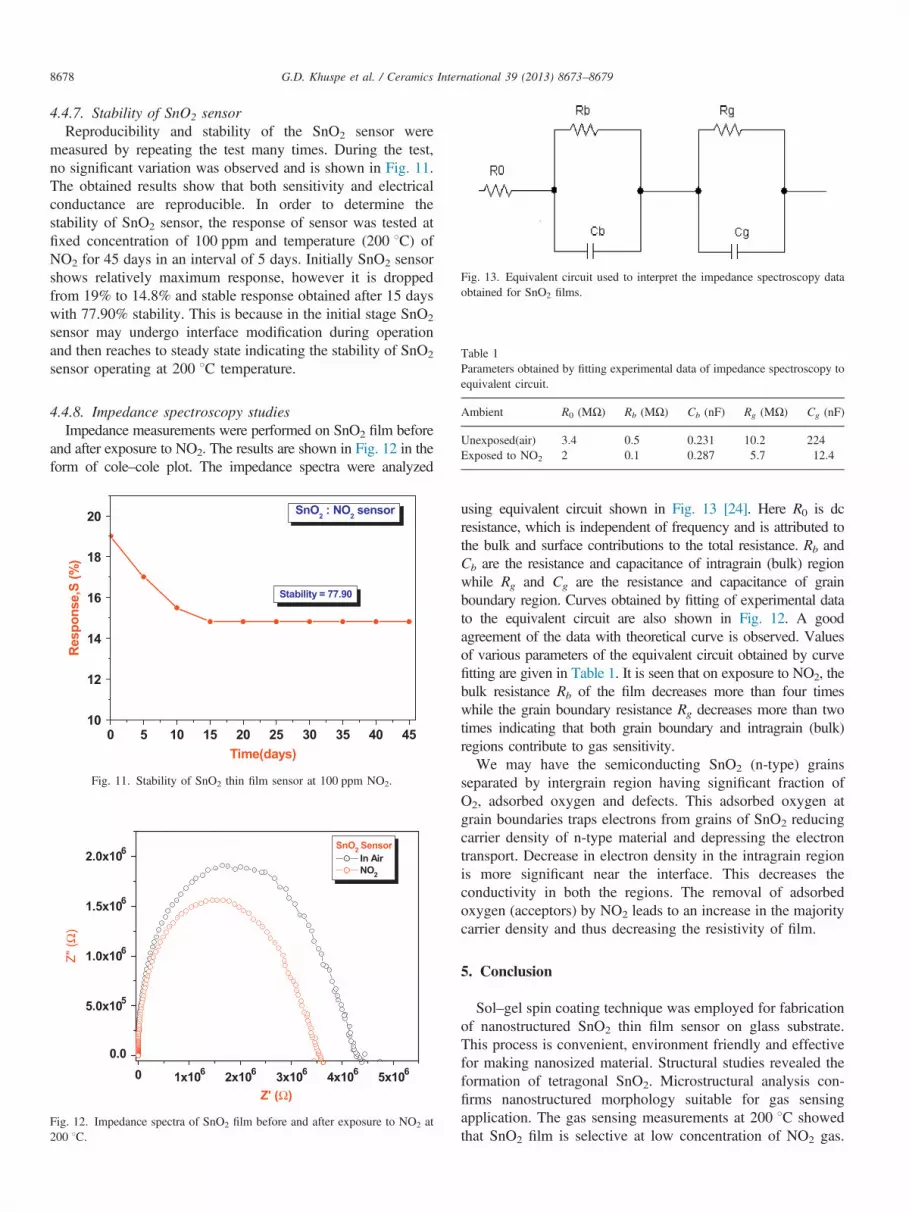
Fig. 13. Equivalent circuit used to interpret the impedance spectroscopy dataobtained for SnO2 films.
Table 1Parameters obtained by fitting experimental data of impedance spectroscopy toequivalent circuit.
Ambient R0 (MΩ) Rb (MΩ) Cb (nF) Rg (MΩ) Cg (nF)
Unexposed(air) 3.4 0.5 0.231 10.2 224Exposed to NO2 2 0.1 0.287 5.7 12.4
G.D. Khuspe et al. / Ceramics International 39 (2013) 8673–86798678
4.4.7. Stability of SnO2 sensorReproducibility and stability of the SnO2 sensor were
measured by repeating the test many times. During the test,no significant variation was observed and is shown in Fig. 11.The obtained results show that both sensitivity and electricalconductance are reproducible. In order to determine thestability of SnO2 sensor, the response of sensor was tested atfixed concentration of 100 ppm and temperature (200 1C) ofNO2 for 45 days in an interval of 5 days. Initially SnO2 sensorshows relatively maximum response, however it is droppedfrom 19% to 14.8% and stable response obtained after 15 dayswith 77.90% stability. This is because in the initial stage SnO2
sensor may undergo interface modification during operationand then reaches to steady state indicating the stability of SnO2
sensor operating at 200 1C temperature.
4.4.8. Impedance spectroscopy studiesImpedance measurements were performed on SnO2 film before
and after exposure to NO2. The results are shown in Fig. 12 in theform of cole–cole plot. The impedance spectra were analyzed
0 5 10 15 20 25 30 35 40 4510
12
14
16
18
20
Stability = 77.90
Res
pons
e,S
(%)
Time(days)
SnO2 : NO2 sensor
Fig. 11. Stability of SnO2 thin film sensor at 100 ppm NO2.
0 1x10⁶ 2x10⁶ 3x10⁶ 4x10⁶ 5x10⁶
0.0
5.0x10⁵
1.0x10⁶
1.5x10⁶
2.0x10⁶
Z" (Ω
)
Z' (Ω)
SnO2 Sensor In Air NO2
Fig. 12. Impedance spectra of SnO2 film before and after exposure to NO2 at200 1C.
using equivalent circuit shown in Fig. 13 [24]. Here R0 is dcresistance, which is independent of frequency and is attributed tothe bulk and surface contributions to the total resistance. Rb andCb are the resistance and capacitance of intragrain (bulk) regionwhile Rg and Cg are the resistance and capacitance of grainboundary region. Curves obtained by fitting of experimental datato the equivalent circuit are also shown in Fig. 12. A goodagreement of the data with theoretical curve is observed. Valuesof various parameters of the equivalent circuit obtained by curvefitting are given in Table 1. It is seen that on exposure to NO2, thebulk resistance Rb of the film decreases more than four timeswhile the grain boundary resistance Rg decreases more than twotimes indicating that both grain boundary and intragrain (bulk)regions contribute to gas sensitivity.We may have the semiconducting SnO2 (n-type) grains
separated by intergrain region having significant fraction ofO2, adsorbed oxygen and defects. This adsorbed oxygen atgrain boundaries traps electrons from grains of SnO2 reducingcarrier density of n-type material and depressing the electrontransport. Decrease in electron density in the intragrain regionis more significant near the interface. This decreases theconductivity in both the regions. The removal of adsorbedoxygen (acceptors) by NO2 leads to an increase in the majoritycarrier density and thus decreasing the resistivity of film.
5. Conclusion
Sol–gel spin coating technique was employed for fabricationof nanostructured SnO2 thin film sensor on glass substrate.This process is convenient, environment friendly and effectivefor making nanosized material. Structural studies revealed theformation of tetragonal SnO2. Microstructural analysis con-firms nanostructured morphology suitable for gas sensingapplication. The gas sensing measurements at 200 1C showedthat SnO2 film is selective at low concentration of NO2 gas.

G.D. Khuspe et al. / Ceramics International 39 (2013) 8673–8679 8679
SnO2 thin film sensor exhibits maximum response of 19% with77.90% stability toward NO2 gas. Impedance spectroscopystudies revealed that the change in resistance of the SnO2 filmafter exposure to NO2 is mainly contributed by intragrainregion. The gas sensing characteristics viz, selectivity,response reproducibility and stability showed that SnO2 wouldbe a prospective candidate for the detection of NO2 gas atlow concentration (10–100 ppm) and at lower operatingtemperature.
Acknowledgments
Authors are grateful to the Department of Atomic Energy-Board of Research in Nuclear Science, Govt. of India, NewDelhi for Financial support through the scheme no. 2010/37P/45/BRNS/1442.
References
[1] N. Barsan, D. Koziej, U. Weimar, Metal oxide-based gas sensor research:how to?, Sensors and Actuators B: Chemical 121 (2007) 18–35
[2] T.J. Hsueh, C.L. Hsu, S.J. Chang, I.C. Chen, Laterally grown ZnOnanowire ethanol gas sensors, Sensors and Actuators B: Chemical 126(2007) 473–477.
[3] T.J. Hsueh, S.J. Chang, C.L. Hsu, Y.R. Lin, I.C. Chen, Highly sensitiveZnO nanowire ethanol sensor with Pd adsorption, Applied Physics Letters91 (2007) 053111–053113.
[4] M.A. Chougule, S.L. Patil, S.G. Pawar, B.T. Raut, P.R. Godse,Shashwati Sen, V.B. Patil, Fabrication of nanostructured ZnO thin filmsensor for NO2 monitoring, Ceramics International 28 (2012) 2685–2692.
[5] S.G. Pawar, M.A. Chougule, B.T. Raut, P.R. Godse, S.A. Pawar,Shashwati Sen, V.B. Patil, Nanocrystalline TiO2 thin films: NH3
monitoring and physical characterization, Journal of Materials ScienceMaterials in Electronics 23 (2012) 273–279.
[6] S.T. Navale, S.R. Nalage, M.A. Chougule , S.A. Pawar, V.B. Patil, Novelprocess for synthesis of α-Fe2O3: microstructural and optoelectronicinvestigations, Journal of Materials Science Materials in Electronics, 24(2013) 1422–1430.
[7] S.R. Nalage, M.A. Chougule, Shashwati Sen, V.B. Patil, Fabrication andcharacterization of nickel oxide NO2 sensor, Journal of Materials ScienceMaterials in Electronics 24 (2013) 368–375.
[8] S.T. Navale, D.K. Bandgar, S.R. Nalage, G.D. Khuspe, M.A. Chougule,Y.D. Kolekar, Shashwati Sen, V.B. Patil, Synthesis of Fe2O3 nanopar-ticles, for nitrogen dioxide gas sensing applications, Ceramics Interna-tional (2013)http://dx.doi.org/10.1016/j.ceramint.2013.01.074.
[9] J. Xu, Q. Pan, Y. Shun, Z. Tian, Grain size control and gas sensingproperties of ZnO gas sensor, Sensors and Actuators B 66 (2000)277–279.
[10] C. Bose, P. Thangadurai, S. Ramasamy, Grain size dependent electricalstudies on nanocrystalline SnO2, Materials Chemistry and Physics 95(2006) 72–78.
[11] S. Gupta, R.K. Roy, M. PalChowdhury, A.K. Pal, Synthesis of SnO2/Pdcomposite films by PVD route for a liquid petroleum gas sensor, Vacuum75 (2004) 111–119.
[12] Y. Liu, E. Koep, M.L. Liu, A highly sensitive and fast-responding SnO2
sensor fabricated by combustion chemical vapor deposition, Chemistry ofMaterials 17 (2005) 3997–4000.
[13] D.L. Chen, L. Gao, Novel synthesis of well-dispersed crystalline SnO2
nanoparticles by water-in-oil microemulsion-assisted hydrothermal pro-cess, Journal of Colloid and Interface Science 279 (2004) 137–142.
[14] R.D. Sakhare, G.D. Khuspe, S.T. Navale, R.N. Mulik, R.C. Pawar,C.S. Lee, M.A. Chougule, V.B. Patil, Nanocrystalline SnO2 thin films:structural, morphological, electrical transport and optical studies, Journalof Alloys and Compounds 563 (2013) 300–306.
[15] M.A. Chougule, S.G. Pawar, S.L. Patil, B.T. Raut, V.B. Patil, Polypyrrolethin films: room temperature ammonia sensor, IEEE Sensors Journal 11(9) (2011) 2137–2141.
[16] G.D. Khuspe, D.K. Bandgar, V.B. Patil, Fussy nanofibrous network ofpolyaniline (PANi) for NH3 detection, Synthetic Metals 162 (2012)1822–1827.
[17] S.L. Patil, S.G. Pawar, A.T. Mane, M.A. Chougule, V.B. Patil, Nano-crystalline ZnO thin films: optoelectronic and gas sensing properties,Journal of Materials Science Materials in Electronics 21 (2010)1332–1336.
[18] M.S. Tong, G.R. Dai, D.S. Gao, Surface modification of oxide thin filmand its gas-sensing properties, Applied Surface Science 171 (2001)226–230.
[19] S. Saito, M. Miyayama, K. Kaumoto, H. Yanagida, Gas sensing character-istics of porous ZnO and Pt/ZnO ceramics, Journal of the American CeramicSociety 68 (1985) 40–43.
[20] E. Traversa, New ceramic materials for chemical sensors, Journal ofIntelligent Materials Systems and Structures 6 (1995) 860–869.
[21] M.A. Chougule, S.G. Pawar, P.R. Godse, R.D. Sakhare, Shashwati Sen,V.B. Patil, Sol–gel derived Co3O4 Thin films: effect of annealing onstructural, morphological and optoelectronic properties, Journal ofMaterials Science Materials in Electronics 23 (2012) 772–778.
[22] G. Korotcenkov, V. Brinzari, J. Schwank, M. DiBattista, A. Vasiliev,Peculiarities of SnO2 thin film deposition by spray pyrolysis for gassensor application, Sensors and Actuators B 77 (2001) 244–252.
[23] B.T. Raut, P.R. Godse, S.G. Pawar, M.A. Chougule, V.B. Patil, Devel-opment of nanostructured CdS sensor for H2S recognition: structural andphysical characterization, Journal of Materials Science Materials inElectronics 23 (2012) 956–963.
[24] J.R. Macdonald, Impedance Spectroscopy, Wiley, New York, 1987.