a statistical model for developing body size charts for garments
TRANSCRIPT
COMMUNICATIONS
A statistical model for developingbody size charts for garments
D Gupta and BR GangadharDepartment of Textile Technology Indian Institute of Technology Delhi
New Delhi India
Keywords Clothing Human anatomy Statistical analysis Charts
Abstract A simple easy to follow statistical approach has been proposed for developing body sizecharts from anthropometric data It has been possible to cover 95 percent of the population using11 size charts Multivariate analysis was carried out to detect relationships between variablesPrincipal component analysis was carried out to identify the key body measurements which canform the basis for classifying the population Bust for the upper body and hip for the lower bodywere identified as the critical dimensions affecting garment fit Body shapes and their distributionwithin the population have been identified Validation of size charts was done by calculating theaggregate loss of fit
IntroductionThe process of developing body size charts involves taking anthropometric bodymeasurements of the target population and its division into homogeneous groups forthe purpose of garment manufacture Indian men and women have always worntraditional Indian dresses which are mostly draped such as the dhoti sariangavastram dupatta or lungi These garments are not stitched hence there was notany need for sizes The few structured garments (such as salwar-kameez) which haveevolved and are being sold as RTW are based on the concept of ldquoOne size fits allrdquoNo attempt has been made to measure up the population at the national level and so tilldate no body size charts are available for the Indian population
Currently India is poised on the brink of a major retail revolution The youngergeneration is fast changing its dressing habits and western clothes are becoming moreand more popular in the cities as well as suburbs It is at this stage that an acute need isfelt for an efficient garment sizing system RTW for men is based mostly on the sizesprevalent in the international market As the fit is less critical in that category themarket could exist and mature without any size charts But as the women adopt formalwestern wear and demand more fashionable and better fit ndash the survival of themanufacturer or retailer will depend on the ldquogoodness of fitrdquo provided by his garments
A detail review was undertaken to study the various sizing systems reported inliterature It was found that statistical methods ranging from simple percentiles tocomplex combinations of multivariate and regression analyses have been employed fordistribution of population into subgroups More recently it has been possible to
The Emerald Research Register for this journal is available at The current issue and full text archive of this journal is available at
wwwemeraldinsightcomresearchregister wwwemeraldinsightcom0955-6222htm
The authors are extremely thankful to ITC Limited Lifestyle Retailing Business Division Indiafor allowing the use of the anthropometric data set for this study Help provided by Dr LipikaDey Assistant Professor Department of Mathematics at IIT Delhi with the mathematicalanalysis is gratefully acknowledged
IJCST165
458
Received October 2003Revised June 2004Accepted June 2004
International Journal of ClothingScience and TechnologyVol 16 No 5 2004pp 458-469q Emerald Group Publishing Limited0955-6222DOI 10110809556220410555641
employ powerful mathematical techniques with much better results Some of theimportant approaches listed in the literature are briefly discussed below
In a study by Salusso (1982) the principal component sizing system (PCSS) has beenused for classifying adult female body form with respect to the US Standard forapparel sizing This approach is useful in identifying the critical body or the fitaffecting dimensions which can form the basis of size chart development Researchersfound that 15 principal components can be used to summarize trends in body formvariation Principal components 1 and 2 ie laterality (fullness) and linearity (length)respectively were selected to describe body size and type
In another study Tryfos (1986) suggested an integer programming approach tooptimize the number of sizes so as to maximize expected sales or minimize an index ofaggregate discomfort He divides the space of body dimensions artificially into a set ofdiscrete possible sizes The problem is formulated as a ldquop medianrdquo or ldquoFacility Locationproblemrdquo Another novel approach for the construction of apparel sizing systems hasbeen proposed by McCulloch et al (1998) based on the goodness of fit that an individualexperiences when wearing a garment of a particular size Using this measure known asaggregate loss various existing US sizing systems were compared (Ashdown 1998)Non-linear optimization techniques were used to derive a set of possible sizing systemsfrom anthropometric data Results showed that size assignment as well as the ability toidentify non-accommodated individuals results in substantial improvements in fit overexisting sizing systems
Most techniques used so far are rather complicated and based on complexmathematical calculations The current study was undertaken with the aim ofdeveloping an easy to follow statistical model for developing body size charts forgarment manufacture The model has been demonstrated using a recentanthropometric data set available for young Indian females
Material and methodsAnthropometric data for 2095 Indian women from six metro cities in India were usedA total of 21 measurements were recorded for each subject These included 9 linear and12 girth measurements as shown below
Linear measurements
(1) height
(2) waist length from center front
(3) cervical to natural waist
(4) cervical back to natural waist
(5) cervical height
(6) outside leg length
(7) inside leg length
(8) arm length and
(9) shoulder width
Girth measurements
(1) neck girth at midway level
(2) neck girth at neck base
A statisticalmodel
459
(3) round bust
(4) natural waist
(5) intendedartificial waist
(6) hip 4 (hip measured at 4 inch below the natural waist)
(7) hip 6 (hip measured at 6 inch below the natural waist)
(8) thigh
(9) ankle
(10) knee
(11) upper arm and
(12) wrist
MethodologyStatistical analysis of anthropometric dataAll analyses were conducted using statistica Ver 60 and Microsoftw Excel 2000 Meanmedian range skew and SD for the important measurements were calculatedMultivariate analysis of the dataset were carried out with a view to reduce the numberof variables (which would form key dimensions) and to detect structure in therelationships between variables
Principal component analysis (StatSoft Inc 2002)The aim of principal component analysis is the construction of a set of variables ldquoXirdquosethi frac14 1 2 kTHORN of a new set of variables (Pi) called principal components which arelinear combinations of the ldquoXrdquos These combinations are chosen so that the principalcomponents satisfy two conditions
(1) the principal components are orthogonal to each other and
(2) the first principal component accounts for the highest proportion of totalvariation in the set of all ldquoXrdquos the second principal component accounts for thesecond highest proportion and so on
Figure 1 shows a two dimensional data set (plotted in the X1-X2 plane) which is dividedinto two clusters The variations of the data along the axes are also shown In thecurrent problem this technique needs to be applied to a 20 one dimensional data setThis technique was used to identify the key dimensions which can form the basis ofa sizing system for garments
Results and discussionUnivariate analysisAt the outset the range mean and median for all the body dimensions were calculatedResults for three measurements are reported in Table I As expected data for allmeasurements showed a near normal distribution Care was taken to identifythe outliers under each parameter so that they could be eliminated during the finalanalysis This would help to improve the accuracy of the size charts
IJCST165
460
Height as a critical dimension The first classification of population data was carriedout on the basis of height of subjects The population was divided into three heightcategories namely
(1) Shortfrac14Mean 2 SD
(2) Medium frac14 Mean ^ SD and
(3) Tall frac14 Mean+SD
Results are reported in Table IIThe height distribution for Indian women was compared with some data available
for western women (Cooklin 1999) (Table III) An overwhelming percentage of women(73 percent) in the Indian data set is concentrated in the medium height categoryIndian women are found to be shorter in all categories Women in the US are the tallestfollowed by the European women
Analysis of girth parameters Population data for bust and waist were also analyzedResults are compiled in Table I Majority of the population has a bust measurementbetween 31 and 33 inch This is a very narrow range of bust distribution for such
Figure 1Principal components
Category Height (inch) Count (percent) Max Min Avg
Short 59 352 (1055) 5898 5315 5764Medium 59-64 1522 (7265) 6398 5906 6145Tall 64 352 (1680) 7874 6402 6546
Table IIHeight categories and
their distribution in thesample data
Dimension Maximum Minimum Range SD Skew Mean Median
Height 7874 5315 2559 246 0308 6172 6161Bust 535 2075 3275 318 031 3237 3237Waist 4531 1869 2662 329 083 2701 2657
Table IUnivariate analysis of the
height bust and waistdimensions (in inches)
A statisticalmodel
461
a large data set It indicates that there is possibly a bias in the data toward theyounger women
The frequency distribution for the waist shows a concentration around waist of25-27 inch and few data entries in the range of 15-20 inch and 40-45 inch These latterentries may constitute the outliers which a conventional sizing system cannot cater toSpecial size categories would have to be developed to cater these outliers
Multiple correlation analysisMultiple coefficient analysis was carried out to determine the interrelationshipsbetween the various body parameters BS 7231 (BSI 1990) standard was taken as aguideline for identifying the key parameters from the correlation matrix shown inTable IV According to this standard
Country Short Medium Tall
USA 155 (46) 165 (45) 175 (9)England 150 (24) 160 (55) 170 (19)West Germany 156 (31) 164 (47) 172 (22)France 152 (28) 160 (51) 168 (16)India 146 (10) 156 (73) 166 (17)
Notes Values in parentheses indicate the percent of total population in each group
Table IIIThe height (in cm)distribution ofpopulations of majornations
Dimension Height Nat waist Hip 6 Bust
Height 1 0104 0204 0132Cervical height 0866 0139 0224 0159Natural waist 0104 1 0752 0781Waist length_center front 0172 0224 0138 0242Cervical _natural waist 0246 033 0277 039Center back_natural waist 0235 0124 0091 0167Artificial waist 0139 0801 074 0716Outer leg 0713 008 0185 011Inner leg 052 0101 0173 007Hip 4 0185 078 0919 074Hip 6 0204 0752 1 0714Thigh 0127 0541 0611 0562Knee 0205 0478 055 0507Ankle 0179 0201 0243 0218Bust 0132 0781 0714 1Upper arm girth 0073 049 0472 0467Wrist 0146 0279 0275 0252Neck_mid 018 0638 0581 062Neck_neck 0138 0484 0435 0488Arm length 048 0109 0136 0125Shoulder_shoulder 0275 0348 0326 0347Outer leg-inner leg 0116 20035 20013 0031
Table IVCorrelation co-efficientsof key dimensions
IJCST165
462
if correlation co-efficient is 05 then no relationship
if correlation co-efficient is between 05 and 075 then there is a mild relationshipand
if correlation co-efficient is 076 it indicates a strong relationship
All length measurements appear to have good correlation among themselves and allgirth measurements have good correlation with each other However there is poorcorrelation among the length and girth parameters This is a significant finding asmost empirical size charts are based on a linear increment across all measurement in allsizes In other words it is assumed that as the body grows in girth it also growscorrespondingly in length or height It is because of this assumption that the existingsizing systems yield a good fit for only 20 percent of the population they are intendedfor Four body dimensions having good correlation with maximum of other dimensionswere identified as key dimensions (Table IV) They are as follows
(1) Bust has mild to strong correlation with seven other body dimensions
(2) Hip has mild to strong correlation with seven other body dimensions
(3) Natural waist has mild to strong correlation with six other body dimensions and
(4) Height has mild to strong correlation with three major linear body dimensions
From these findings it may be concluded that bust measurement for the upper bodyand hip measurement for the lower body garments are the most critical measurementsWaist is common to both top and lower body garments but may not be so critical as itis adjustable in most garments In general it can be inferred that these four dimensionsare the important landmarks on the body and hence should be related closely to thegarment measurements
Principal component analysisIn the next step prinicipal component analysis was carried out in order to reduce thenumber of variables and to detect the structure in the relationships between variablesThe first five principal components (factors) accounting for 6697 percent of the totalvariability in the data set were identified (StatSoft Inc 2002) Results are reported inTable V They further endorse the results obtained from the multiple correlationanalysis Based on the interrelationships existing in the data set the bodymeasurements have been classified as follows
(1) Principal component 1 has high loadings (large co-efficients) on all girth relateddimensions ie natural waist artificial waist hip 4 hip 6 and bust
(2) Principal component 2 has high loadings on all height related dimensionsie height cervical height outer leg and inner leg
(3) Principal component 3 has high loadings on upper body dimensions ie waistlength from center front cervical to natural waist and cervical back to naturalwaist
(4) Principal component 4 has high loadings on lower body dimensions ie innerleg length and crotch length
(5) Principal component 5 has high loadings on girth related dimensions of neckarm and leg
A statisticalmodel
463
These findings provide the framework for size chart development in this study Based onthese results the first classification of population was done on the basis of height (Principalcomponent 2) This represents all height related parameters The height categories weresubdivided on the basis of ratio of critical girth measurements namely bust and hip(Principal component 2) to arrive at the body shapes Results are discussed below
Classification of population into body typesClassification on the basis of heightThe population was divided into three height categories as indicated earlier They aretall $64 inch short 59 inch and medium 59-64 inch
Drop valueWithin the height categories the population was further categorised on the basis of keygirth dimensions Bust for the upper body and hip 6 for the lower body were identifiedas the most critical dimensions as they show mild to good correlation with maximumnumber of body dimensions For identifying the overall body shape a derivedparameter drop value was used which is the difference between the hip and bustmeasure (hip 6-bust) Drop values help to identify distinct relationships between keydimensions that determine body shape
Based on drop values the population under each height group was classified intosix categories as shown in Table VI (Cooklin 1999) Each category corresponds to oneof the generally perceived body shapes namely
triangle or pear shaped (bust much smaller than hip) as in category 1
inverted triangle (bust much bigger than the hip) as in category 6
Dimension Factor 1 Factor 2 Factor 3 Factor 4 Factor 5
Height 002 020 001 001 0Cervical height 003 019 001 0008 000Natural waist 009 003 000 7 pound 1026 0018Waist length_center front 002 001 029 001 001Cervical _natural waist 003 001 026 000 002Center back_natural waist 001 002 023 002 003Artificial waist 009 002 000 000 003Outer leg 002 019 003 005 000Inner leg 001 012 005 023 001Hip 4 010 002 001 000 005Hip 6 010 001 002 000 004Thigh 006 001 001 000 001Knee 006 000 001 000 000Ankle 002 000 000 001 014Bust 009 002 000 000 001Upper arm girth 005 001 000 001 004Wrist 002 1 pound 1025 9 pound 1025 002 031Neck_mid 008 001 001 0 006Neck_neck 005 001 001 5 pound 1025 018Arm length 001 010 001 000 001Shoulder_shoulder 003 0005 00443 00062 002Outer leg ndashinner leg 4 pound 1025 000 001 061 001
Table VPrincipal componentanalysis (revised)
IJCST165
464
rectangle (bust is equal to hip) as in category 4 and
the other categories lie in between these
Within each bust category identified on the basis of drop value hip 6 and bust have alinear relationship This means that either one of these can be used as the basis forgeneration of body measurement tables or more suitably bust measurement can beused as the basis of classification for the upper body garments and hip 6 can be usedfor classifying the lower body garments
A closer look at the various body dimensions after classification of each individualcase revealed the outliers having improbable drop values in the range of 8-27 inchA general size chart cannot cater to these extremes thus a total of 32 individuals(153 percent of the sample data) with improbable measurements were eliminatedThey mostly belonged to the category of very small bust or extralarge bust
Results obtained for Indian women in various categories are compared in Table VIIwith figures reported for western women (Cooklin 1999) It is observed that for the
S no Category Hip 6-bust (inch) Short Medium Tall Total(percent)
1 Very small bust 6 21 (1) 274 (1308) 87 (415) 18232 Small bust 4-5 77 (368) 522 (2492) 133 (635) 34953 Medium bust 2-3 86 (411) 508 (2425) 95 (453) 32894 Full bust 0 to 21 26 (124) 179 (854) 32 (153) 11315 Large bust 21 to 24 9 (043) 31 (148) 5 (024) 2156 Extra large bust 24 2 (009) 8 (038) ndash 047
Total 221 (105) 1522 (726) 352 (168) 100
Notes Values in parentheses indicate the percent of total population
Table VIBody types obtained on
the basis of drop 2 value(hip 6-bust)
Bust type Height group USA England West Germany France India
V small Short ndash 1 ndash ndash 1Medium ndash 3 ndash ndash ndashTall ndash 2 ndash ndash 4
Small Short 10 5 11 11 4Medium 10 12 16 19 25Tall 1 5 7 6 6
Medium Short 21 9 15 12 4Medium 21 20 23 23 24Tall 5 7 10 7 5
Full Short 14 7 5 5 1Medium 15 14 8 9 8Tall 3 4 5 3 2
Large Short ndash 2 ndash ndash 04Medium ndash 5 ndash ndash 2Tall ndash 1 ndash ndash 02
Extra large Short ndash ndash ndash 01Medium ndash 1 ndash ndash 04Tall ndash ndash ndash ndash
Table VIIDistribution of bust types
among population ofmajor nations
A statisticalmodel
465
Indian sample the data are skewed toward the small and medium bust categories withthe least number of subjects in the large bust category
Development of size chartsHaving classified the population into three height categories and six body shapes sizecharts for each category were developed adopting the empirical approach The rangefor each body dimension under each category was identified In order to cater allindividuals the range was spread with constant gradient over the populationA gradient of 2 inch between two consecutive sizes for key dimensions namely bustwaist and hip was maintained The bust girth size interval of each size chart is used asthe basis for all comparative calculations For other dimensions suitable grades wereempirically determined and spread over the sizes Some body dimensions like cervicalheight center back to natural waist center front to natural waist etc do not changemuch from one size to another This can be attributed to the fact that the sizes are beingdeveloped from pre classified dimensions In all 11 size charts have been proposedcovering 9638 percent of population The population covered by each category is givenin parentheses
Short height ndash small bust (368 percent) medium bust (411 percent) and full bust(124 percent)
Medium height ndash very small bust (1308 percent) small bust (2492 percent)medium bust (2425 percent) and full bust (854 percent)
Tall height ndash very small bust (415 percent) small bust (635 percent) mediumbust (453 percent) and full bust (153 percent)
A representative chart for the short height-small bust category is given in Table VIII
Bust 26 28 30 32 34 36 38 40 Grade
Hip 6 30 32 34 36 38 40 42 44 2Natural waist 22 24 26 28 30 32 34 36 2Waist length-Center front 9 95 10 105 105 105 105 105 05Cervical-waist 11 12 13 135 135 135 135 135 ndashCenter back-waist 11 115 12 125 13 13 13 13 ndashThigh 14 1625 185 2075 23 2525 275 297 225Knee 11 125 14 155 17 185 20 215 15Ankle 8 95 11 125 14 155 17 185 15Upper arm 8 9 10 11 12 13 14 15 1Wrist 5 525 55 575 6 625 65 675 025Neck mid 11 115 12 125 13 135 14 14 05Neck-neck 115 12 125 13 135 14 145 145 05Shoulder 13 14 15 155 16 1625 165 165 ndashHeight 53 54 55 56 57 58 59 60 10Outer leg length 36 365 37 375 38 385 39 395 05Inside leg length 26 265 27 275 28 285 29 295 05Agg loss 184 119 189 232 157 123 379 202
Notes All measurements are in inches
Table VIIISize chart for the shortheight small bustcategory
IJCST165
466
Validation of the proposed size chartsHaving proposed the size charts the final step lies in validating the same For thispurpose a measure known as the aggregate loss of fit (McCulloch et al 1998) wasemployed An optimal sizing system with a given number of sizes would have thelowest value of aggregate loss where the average distance of individuals from their sizeis as low as possible It was calculated as the average of the Euclidean distance in threedimensional space of the individuals from their allocated size using the followingformula
Aggregate loss frac14
Xpethassigned bust2 actual bustTHORN2 thornethassigned hip2 actual hipTHORN2
thornethassigned waist2 actual waistTHORN2
ethNumber of individuals
in the categoryTHORN
Validation of the proposed size charts was done based on different criteria becausedifferent set of body measurements are relevant while buying different garmentsFor example bust may determine the size for an upper body garment such as a shirtwhile this measurement is not needed while buying a skirt or a pair of trousersHence for each body dimension various values for the aggregate loss were calculatedas follows
(1) Bust natural waist and hip with bust as the key dimension
(2) Bust natural waist and hip with natural waist as the key dimension
(3) Bust cervical to natural waist center back to natural waist center front tonatural waist shoulder width neck girth at midway and neck girth at neck baseto validate for the upper body dimensions needed for a shirt
(4) Natural waist hip outer and inner leg seam dimensions needed for lower bodymeasurements such as those required for trousers and skirt
Selection of the body dimensions used for validation was based on the principalcomponents obtained earlier Body dimensions such as arm length arm scye wristthigh knee angle were not considered during the calculation of the aggregate loss asthey are not key areas for fit However optimization of these dimensions will beintegral to a good size chart
The ideal value for aggregate loss of fit will be a number given by the square root ofthe number of body dimensions considered ndash allowing for ^1 inch deviation of thebody dimension from the assigned size Thus for the calculation of the aggregate lossconsidering three body dimensions the allowable aggregate loss of the goodness of fitwould be
p3 ie 173 inch Based on this understanding multiple analyses were carried
out using 3 4 5 and 7 measurements Two analyses were carried out using three body dimensions each One for the top
body using cervical to natural waist center back to natural waist center front tonatural waist and the second for the lower body using waist outer and inner legThe ideal value for aggregate loss of goodness of fit in each case would be 173
Considering four body dimensions namely bust cervical to natural waist centerback to natural waist and center front to natural waist The ideal value foraggregate loss of goodness of fit would be 200
A statisticalmodel
467
Considering five body dimensions required for a dress ndash namely bust shoulderwidth cervical to natural waist center back to natural waist and center front tonatural waist The ideal value for aggregate loss of goodness of fit would be 223
Considering seven body dimensions required for a formal shirt namely bustshoulder width mid neck girth base neck girth cervical to natural waist centerback to natural waist and center front to natural waist The ideal value foraggregate loss of goodness of fit would be 265
The summary of aggregate loss of goodness of fit obtained for short height-small bustcategory is given in Table IX The total aggregate loss for this category is 184 inchagainst the benchmark value of 173 Results for medium and tall height categoriesusing different sets of measurements are reported in Tables X and XI The valuesobtained for proposed tables are quite close to the ideal value for aggregate loss of fit
Thus it is obvious that the proposed size charts are quite accurate Since the datahas been sorted on the basis of drop value the contribution of bust and hipmeasurements to aggregate loss can be expected to be minimum The difference ofactual size of waist from that of assigned sizes will be more Thus aggregate loss canbe taken as a measure to assess the conformance of the actual waist measurementsobserved in the population to that of the assigned sizes with respect to bust and hip
Body type Upper bodyBusttype
Basedon bust
Basedon waist
Threedimensionsa
Fourdimensionsb
Fivedimensionsc
Sevendimensionsd Lower body
Very small ndash ndash ndash ndash ndash ndash ndashSmall 184 447 183 194 225 249 23Medium 169 218 201 212 242 269 286Full 239 326 205 216 241 271 308
Notes aCervical to natural waist center back to natural waist center front to natural waist bbustcervical to natural waist center back to natural waist and center front to natural waist cbust shoulderwidth cervical to natural waist center back to natural waist and center front to natural waist anddbust shoulder width mid neck girth base neck girth cervical to natural waist center back to naturalwaist and center front to natural waist
Table IXAggregate loss fordifferent dimensions inshort height category
Body type Upper bodyBusttype
Basedon bust
Basedon waist
Threedimensionsa
Fourdimensionsb
Fivedimensionsc
Sevendimensionsd Lower body
Very small 654 929 22 231 27 301 303Small 205 412 272 28 312 335 267Medium 363 293 267 274 298 323 298Full 193 232 254 277 305 336 259
Notes aCervical to natural waist center back to natural waist center front to natural waist bbustcervical to natural waist center back to natural waist and center front to natural waist cbust shoulderwidth cervical to natural waist center back to natural waist and center front to natural waist anddbust shoulder width mid neck girth base neck girth cervical to natural waist center back to naturalwaist and center front to natural waist
Table XAggregate loss fordifferent dimensions inmedium height category
IJCST165
468
ConclusionsA simple statistical approach has been proposed for developing body size charts forwomen Using a linear grading technique 11 size charts for Indian women have beendeveloped It could be shown experimentally that bust girth rather than waist girthshould be the basis for apparel sizing as this gives lower aggregate losses in mostcategories For the lower body hip girth was identified as the most critical dimensionThe sizing system has been optimized with respect to three key dimensionssimultaneously so as to obtain a minimum aggregate loss value The proposed sizecharts indicate only body measurements The actual garment measurements can bederived by incorporating the ease and design allowances
References
Ashdown SP (1998) ldquoAn investigation of the structure of sizing systemsrdquo International Journalof Clothing Science and Technology Vol 10 No 5 pp 324-41
BSI (1990) BS 7231 Part 1 Body Measurements of Boys and Girls from Birth to 169 YearsBritish Standards Institution London
Cooklin G (1999) Pattern Grading for Womenrsquos Clothes ndash the Technology of Sizing BlackwellScience Ltd Oxford UK pp 3-18
McCulloch CE Paal B and Ashdown SP (1998) ldquoAn optimization approach to apparelsizingrdquo Journal of the Operational Research Society Vol 49 No 5 pp 492-9
Salusso CJ (1982) ldquoA method for classifying adult female body form variation in relation to theUS Standard for apparel sizingrdquo Doctoral Dissertation University of Minnesota availableat wwwwsuedu8080~salussoBODYshtml
StatSoft Inc (2002) Electronic Statistics Textbook Tulsa OK available at wwwstatsoftcomtextbookstathomehtml
Tryfos P (1986) ldquoAn integer programming approach to the apparel sizing problemrdquo Journal ofthe Operational Research Society Vol 37 No 10 pp 1001-6
Further reading
Ashdown SP and Delong M (1995) ldquoPerception testing of apparel ease variationrdquo AppliedErgonomics Vol 26 No 1 pp 47-54
Body type Upper bodyBusttype
Basedon bust
Basedon waist
Threedimensionsa
Fourdimensionsb
Fivedimensionsc
Sevendimensionsd Lower body
Very small 491 677 257 264 288 336 305Small 224 295 226 234 271 308 235Medium 199 245 204 215 247 284 176Full 358 487 272 299 323 361 264
Notes aCervical to natural waist center back to natural waist center front to natural waist bbustcervical to natural waist center back to natural waist and center front to natural waist cbust shoulderwidth cervical to natural waist center back to natural waist and center front to natural waist anddbust shoulder width mid neck girth base neck girth cervical to natural waist center back to naturalwaist and center front to natural waist
Table XIAggregate loss for
different dimensions intall height category
A statisticalmodel
469
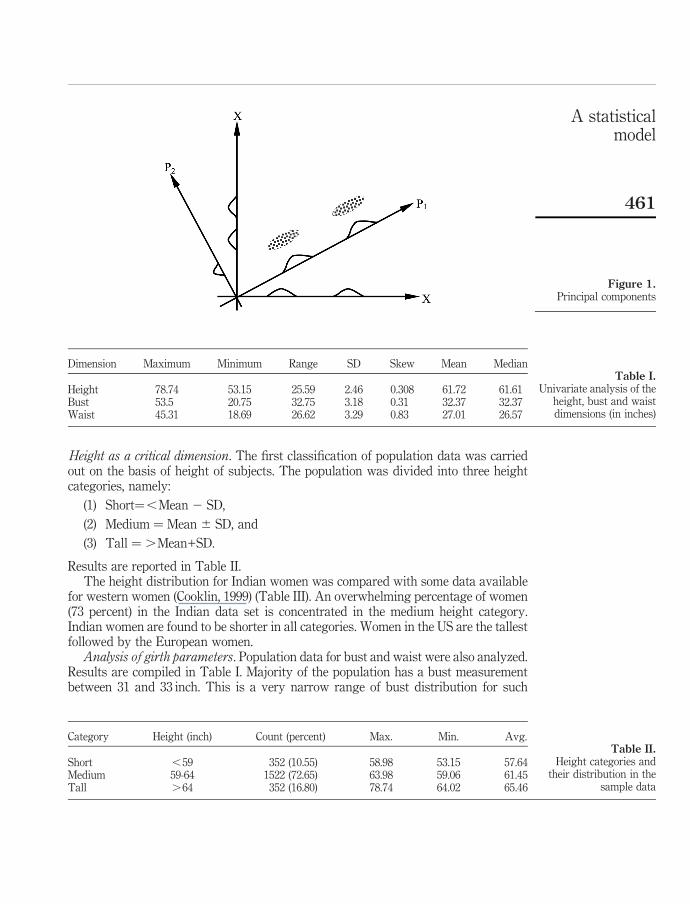
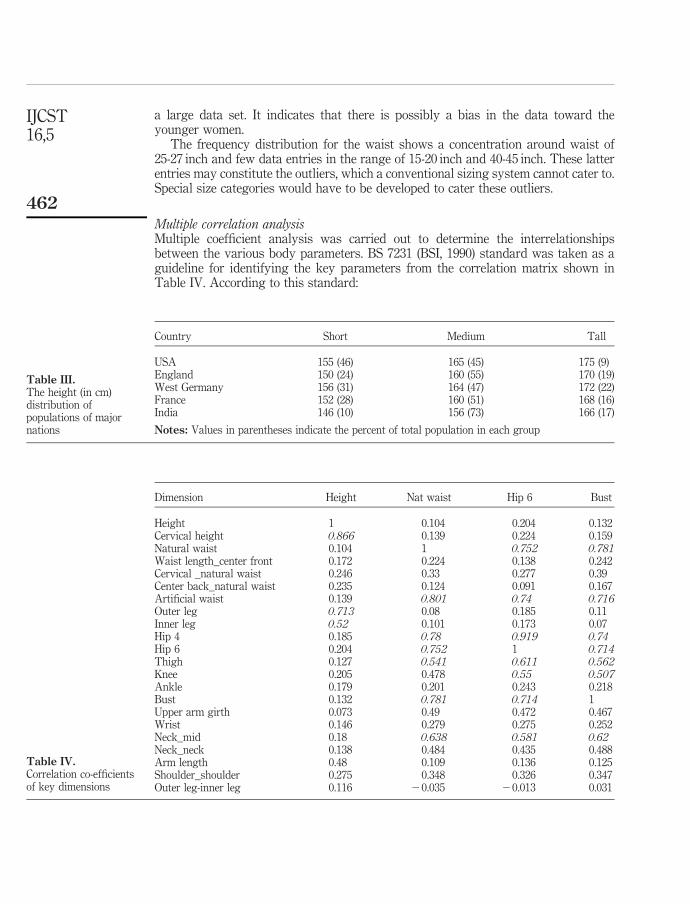
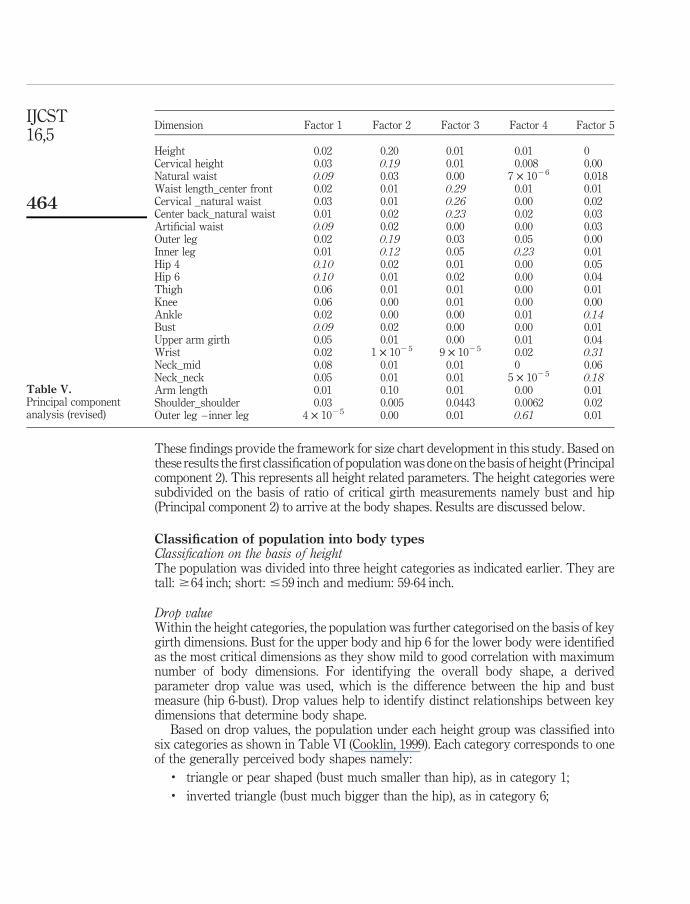
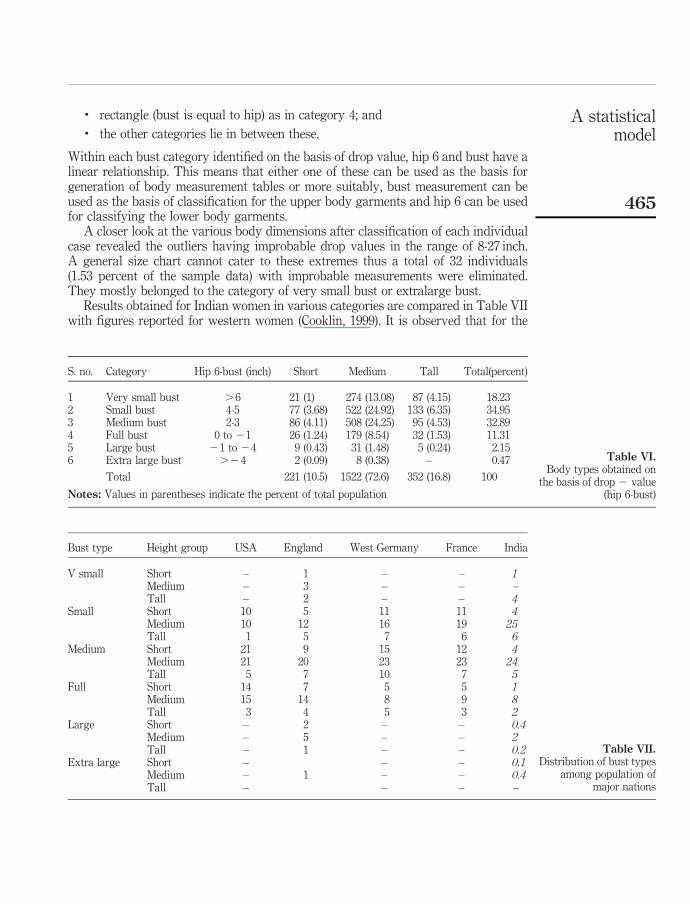
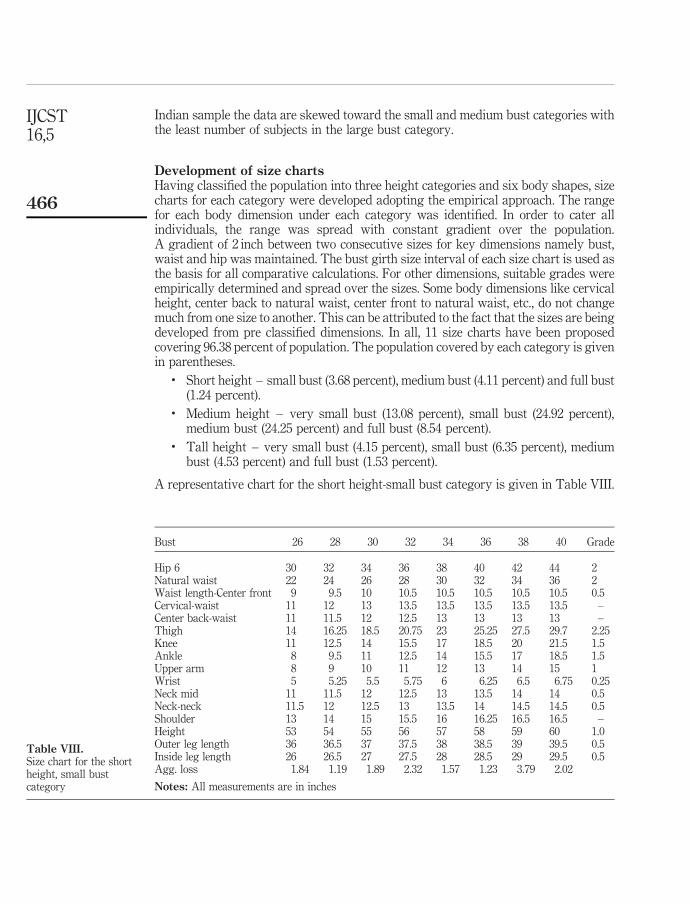
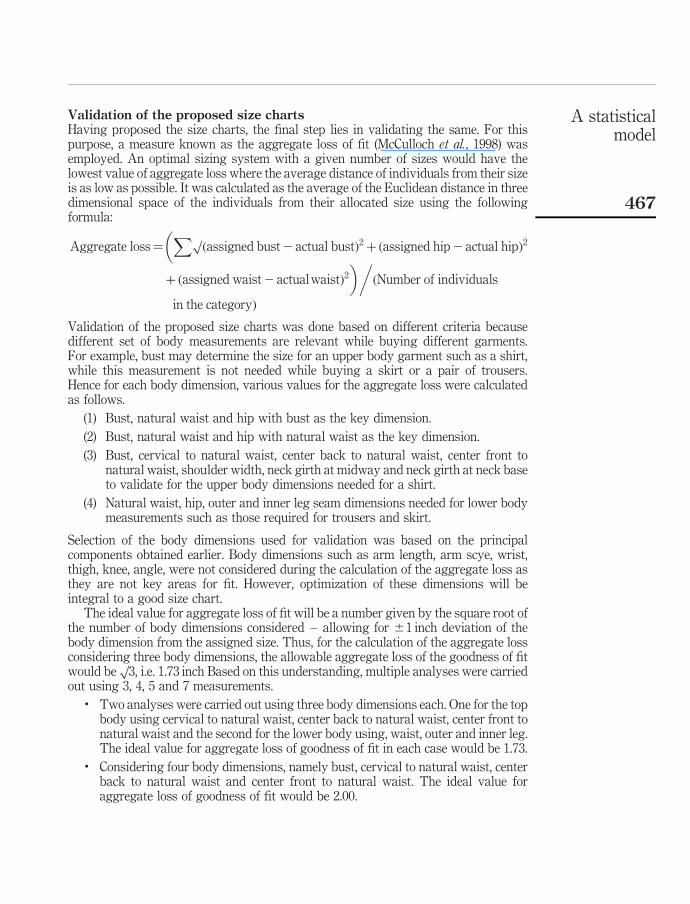
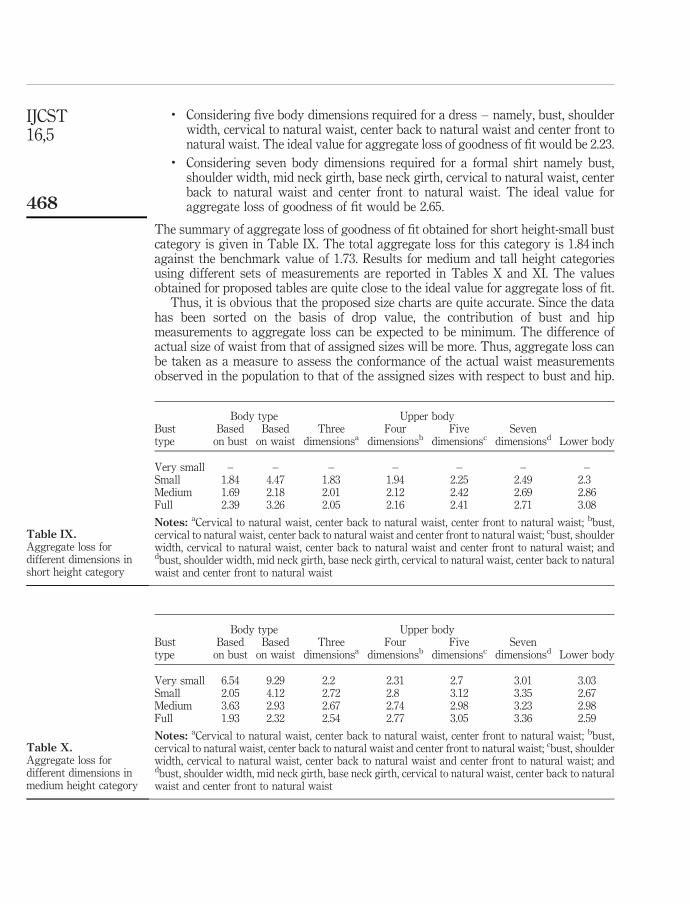
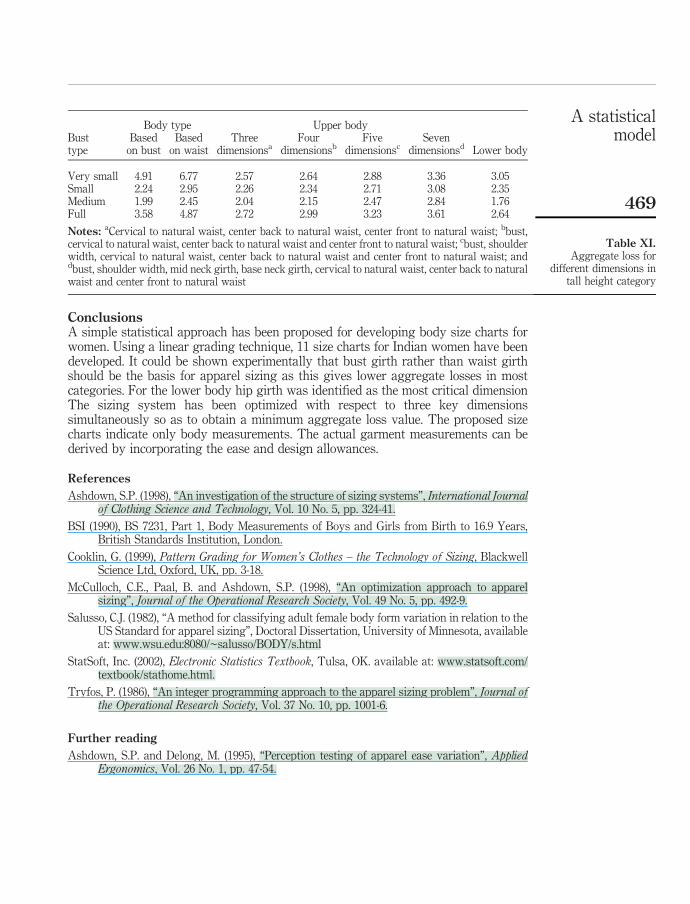