a soa statistical engine for biomedical data
TRANSCRIPT
c o m p u t e r m e t h o d s a n d p r o g r a m s i n b i o m e d i c i n e 9 2 ( 2 0 0 8 ) 144–153
journa l homepage: www. int l .e lsev ierhea l th .com/ journa ls /cmpb
A SOA statistical engine for biomedical data�
Pierpaolo Vittorini ∗, Monica Michetti, Ferdinando di OrioDepartment of Internal Medicine and Public Health, University of L’Aquila, Via S. Salvatore 1,67010 L’Aquila, Italy
a r t i c l e i n f o
Article history:
Received 24 October 2007
Received in revised form 7 June 2008
Accepted 8 June 2008
a b s t r a c t
Currently, large efforts are spent to develop standards and architectures useful to achieve
more effective interoperability among medical information systems. Despite such efforts,
there are no researches produced so far to directly analyse, with statistical methods, biomed-
ical data represented as eXtensible Markup Language (XML) documents. Thus, the paper
proposes an architecture which offers a twofold approach to the statistical analysis of XML
data, i.e. via a web service and by extending the query languages used in XML databases. To
Keywords:XML
SOA
Statistical analysis
Web services
show how the architecture can be used, a sample system is also reported. Finally, the paper
ends by reporting the advantages and drawbacks of the proposed approach in comparison
with classic statistical packages.
© 2008 Elsevier Ireland Ltd. All rights reserved.
Network, PHIN) whose aim is to automatically exchange XML
XML databases
1. Introduction
Practitioners operating in the health sector use informa-tion technology for manifold aims. For instance, to supporttheir strategies and decisions [1,2], but also for faster datacollections and for restraining the reception of unclear ornotoriously wrong data (e.g. for bioterrorism detection or epi-demiological surveillance [3]).
In the recent past, web-based information systems (WISs)were widely adopted, since a WIS supports the creation, inte-gration, analysis, and distribution of information, particularlyfor management processes, entirely through the web [4,5].However, the use of WISs led to the development of infor-mation systems “tailored” to the specificities of a given study(e.g. [6–9]), i.e. with their own user interfaces and propri-etary data models usually stored into relational databases
[10].In such a fragmented scenario, the need for interoperabil-ity became a crucial issue [11]. Thus, the eXtensible Markup
� This work is based on an earlier work: “Towards a SOA Infrastructureon CyberInfrastructure: Information Management in eScience” (CIKM’2
∗ Corresponding author. Tel.: +39 0862 434650.E-mail address: [email protected] (P. Vittorini).
0169-2607/$ – see front matter © 2008 Elsevier Ireland Ltd. All rights resdoi:10.1016/j.cmpb.2008.06.006
Language (XML) [12] was commonly addressed as the possiblesolution to “[. . .] integrate biomedical information and developsemantic interoperability among the numerous and heteroge-neous systems currently in use [. . .]” [13]. Therefore, severalproposals based on XML-related technologies are currentlybecoming available: e.g. in [14] the authors presents a set ofhealth records templates as basis for building an interopera-ble information infrastructure for data exchange, in [15] theauthors discuss on how to integrate different genomic datasources, in [16] a common set of well-defined data formatsare discussed, in [17] the Health Level 7 organisation pro-poses an architecture (Clinical Document Architecture, CDA)useful to represent and manage clinical documents, and in[18] the US Centers for Disease Control and Prevention (CDC)present a network infrastructure (Public Health Information
for Statistically Analysing Public Health Data”, in “First Workshop007), ACM, 2007.
data between public health partners.Despite these efforts, to be best of our knowledge, no
researches have been produced so far regarding how to effec-
erved.
i n b
tXea[rtccddnwi
icsriapta
stFttemaisSsae
dart
c o m p u t e r m e t h o d s a n d p r o g r a m s
ively and directly analyse biomedical data represented asML documents with statistical methods. This fact is peculiar,specially if we consider that high-level statistical analysesre a central topic in connection with biomedical informatics19]. The reasons are essentially twofold. XML data are onlyecently becoming largely available as a result of data integra-ion and interchange [13]. Furthermore, XML data are usuallyonverted into a tabular format and then analysed throughommon statistical packages (e.g. [20,21]). Thus, the paperescribes a statistical engine which takes into account bothescriptive and inferential analyses, can manage numerical,ominal, and ordinal variables, and is implemented both as aeb service and as an extension of the query languages used
n XML databases.The rationale behind the twofold implementation follows.The web service implementation offers the possibility to
nclude statistical analyses into workflows, usually used tooordinate the automated execution of complex computerystems managing biomedical data (e.g. [22]). For instance, aesearcher which aims at demonstrating the difference exist-ng between two therapies in a multicentric study, can createworkflow which automatically collects XML data entered byhysicians, e.g. through the PHIN [18], and at the end invokeshe proper statistical test (available in the service) to produceweb-based report.
The database implementation instead focuses on providingtatistical analysis of data stored into XML databases, ratherhan on data produced during the execution of workflows.or instance, health departments could set up a reposi-ory of their clinical documents, stored accordingly withhe CDA proposal [17], and launch queries to investigate,.g. into the effectiveness of their interventions. Further-ore, the possibility to invoke queries on numerical, nominal
nd ordinal variables contrasts with traditional analysesmplemented into databases, that regard only numeric mea-ures of usually business data through aggregation functions.ince XML can specify also non-numeric data (e.g. ATCGtrings representing amino acid sequences into nominal vari-bles), our proposal can process such kind of data withase.
Whether more statistical functions should be added to
atabase systems or left to the capabilities of external pack-ges is a long and still open debate (e.g. [23]), whose compellingeason was agreed to be efficiency. Therefore, the paper inves-igates into three possible database implementations, andFig. 1 – Overall a
i o m e d i c i n e 9 2 ( 2 0 0 8 ) 144–153 145
concludes with a proposal which couples performances anddistribution.
2. Background
Since its origination as a language for electronic publishing,the eXtensible Markup Language [12] has emerged as the lin-gua franca for representing and exchanging data betweenheterogeneous systems. XML is more precisely a meta lan-guage. Developers can freely create their own XML documents,which must obey to both syntactic and semantic rules. Thesyntactic rules define if a document is well-formed or not (e.g.a start-tag must be closed by a corresponding end-tag), whilethe semantic rules are expressed through XML schemas [24].Such semantic rules include the vocabulary (i.e. element andattribute names), the content model (i.e. relationships andstructure) and the data types, useful in the development ofXML document processing software.
Usually, XML data are processed via the XPath/XQuery[25,26] languages (e.g. through XML databases) and ad hocsoftware components (e.g. implemented as web services orlocal applications). Briefly, XPath is an expression languagethat processes XML documents, while XQuery is a W3C Can-didate Recommendation which is currently emerging as thestandard language for querying XML data. XQuery is an exten-sion of XPath, and provides constructs for expressing a largeclass of queries. Web services are instead software compo-nents, which run into application servers, execute operationsinvoked by remote consumers, can use XPath/XQuery, andcan be easily discovered and “assembled” into larger services[27]. All data processed by a service, the operation request,and the results, are all described through XML. The protocolsused for exchanging XML-based messages are usually SOAP[28] or XML-RPC [29], while the location of the service and itsoperations are described through the web services descriptionlanguage (WSDL) [30].
Finally, an application built by combining web servicesis known as a SOA system [31]. This “composition” can beaccomplished, e.g. through orchestration, which specificallyprovides a method of coordinating the exchange of informa-
tion within loosely coupled and interoperable web services,which results in coarse-grained services, that can be incorpo-rated into workflows and business processes implemented incomposite applications or web portals [32].rchitecture.

146 c o m p u t e r m e t h o d s a n d p r o g r a m s i n
XML schema, called XDTFNSE (Data Types for XFNSE). Suchdocuments contains either a dataset, or a returntag, whichrespectively contains the input data or the results of theanalysis. A dataset is made up of an unbounded sequence
Table 1 – List of the available XFNSE operations
Function Scope
postDataset (dataset) Obtains a ticket for the givendataset
validTicket (ticket) Checks if the ticket is valid
ancova (ticket) Executes the analysis ofcovariance
anova (ticket) Executes the analysis ofvariance
anovaRepeated (ticket) Executes the analysis ofvariance for repeated measures
binomial (ticket) Executes the binomial testchiSquare (ticket) Executes the �2testcochran (ticket) Executes the Cochran’s Q-testcoxRegression (ticket) Executes the Cox regressionfisher (ticket) Executes the Fisher exact testfriedman (ticket) Executes the Friedman testkaplanMeier (ticket) Executes the Kaplan–Meier
survival analysiskruskalWallis (ticket) Executes the Kruskal–Wallis
testlogisticRegression (ticket) Executes the logistic regressionlogLinear (ticket) Executes the log linear
regressionmantelHaenszel (ticket) Executes the Mantel–Haenszel
testmcNemar (ticket) Executes the McNemar testmean (ticket) Computes the meanmedian (ticket) Computes the medianmode (ticket) Computes the modenormalityTest (ticket) Executes the normality testoneWayAnova (ticket) Executes the one-way analysis
of variancepearson (ticket) Executes the Pearson testrange (ticket) Computes the rangecategories (ticket) Count the number of categoriesrankSum (ticket) Executes the rank-sum testregression (ticket) Executes the linear regressionrelativeRisk (ticket) Computes the relative riskrho (ticket) Computes the �
signedRank (ticket) Executes the signed-ranks testsignTest (ticket) Executes the sign testtTestOneSample (ticket) Executes the one-sample t-testtTestPaired (ticket) Executes the paired t-testtTestTwoSample (ticket) Executes the two-sample t-test
Fig. 2 – The core of the statistical processing architecture.
3. System description
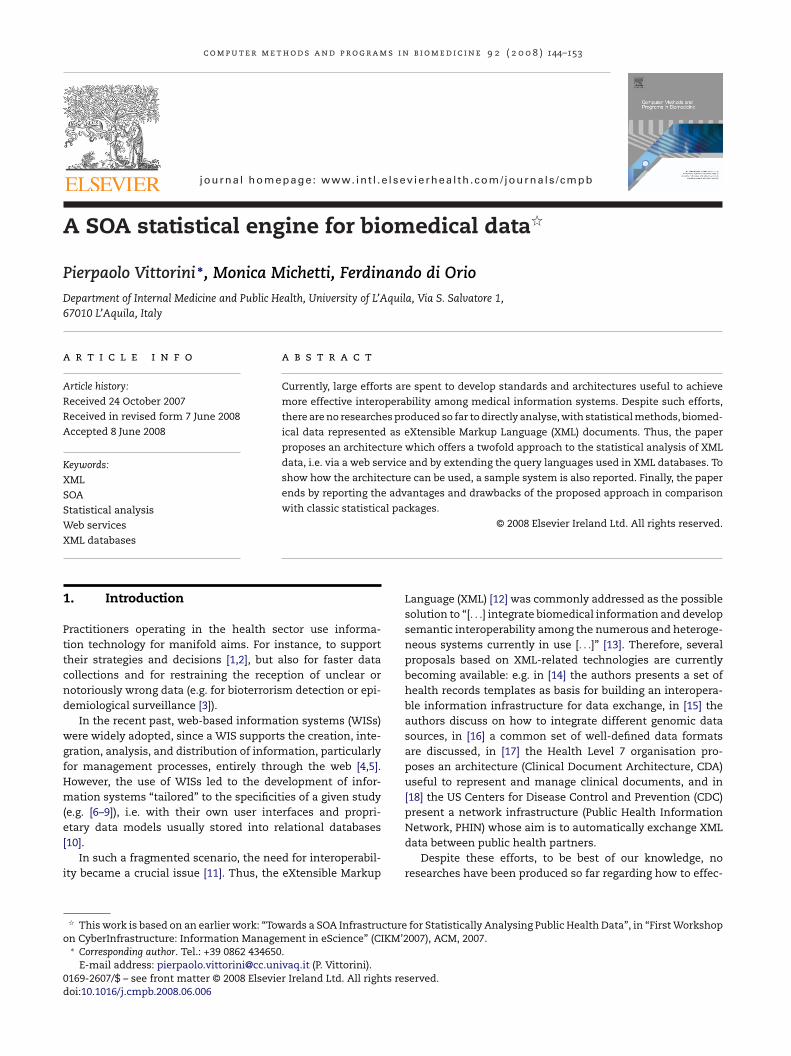
Throughout the paper, the acronym XFNSE (XML FuNctionsand Statistical Engine) will be used to identify all high-levelcomponents of the architecture. The reason behind the use ofsuch an acronym is to clearly identify the contributions actu-ally developed by the authors, from the software componentsreused in our architecture. Fig. 1 shows that the system ismade up of three high-level components, namely: the XFNSEservice (Section 3.1), the XFNSE consumer (Section 3.2), andthe XFNSE module (Section 3.3).
3.1. XFNSE service
The core of the proposed architecture is made up of the XFNSEservice and of the interface to Stata (Fig. 2).
The XFNSE service executes statistical analyses overdatasets sent by consumers through the network. Since thesame dataset is usually analysed repeatedly with different sta-tistical functions, in order to minimise the network traffic, theXFNSE service uses a simple caching mechanism whose func-tioning follows. When the consumer needs to perform severalanalyses, it has to initially communicate the dataset to the ser-vice. In response, it obtains a “ticket” (i.e. a string). Then, theconsumer invokes the analyses over the dataset by only refer-ring to the released ticket. Since the cache is finite in size, aticket can expire if new datasets have to be processed. In sucha case, a fault response is sent back to the consumer, whichmust require a new ticket by sending again the whole dataset.
The implemented analyses are both descriptive and infer-ential. As known, descriptive statistics are used to describethe basic features of the data in a study, while with inferen-tial statistics, researchers try to reach conclusions that extendbeyond the immediate data alone, i.e. to make inferencesfrom the data to more general conditions. More precisely, theproposed software is able to responds to questions regard-ing differences among observations, association betweenvariables, central tendency and dispersion, in terms of thestatistical functionalities reported in [33]. Furthermore, theimplemented analyses can be applied on numerical, ordinalor nominal variables. We recall that a numerical variable isa variable which contains measures (e.g. weight), a nominalvariable is one that has two or more categories, but without
any intrinsic ordering to the categories (e.g. gender), and anordinal variable is similar to a nominal variable, although ithas a clear ordering of the values (e.g. economic status, withthree categories: low, medium, and high). The complete listb i o m e d i c i n e 9 2 ( 2 0 0 8 ) 144–153
of operations exposed by the XFNSE service is contained inTable 1. The first two functions are used to post the datasetto the service and to verify if the ticket is valid. The otherfunctionalities are instead the actual statistical functions,whose scope is briefly summarised in the table. For more infor-mation about each function, the reader may refer to the bookby Dawson-Saunders and Trapp [34].
The datasets received and the results returned by theXFNSE service are XML documents validated over a proper
tTestTwoSampleCorrected(ticket)
Executes the correctedtwo-sample t-test
variance (ticket) Computes the variancevarianceRatioTest (ticket) Executes the variance ratio test

c o m p u t e r m e t h o d s a n d p r o g r a m s i n b i o m e d i c i n e 9 2 ( 2 0 0 8 ) 144–153 147
(b) pObsType, and (c) valueObsType.
ocfuWrtp“iwpctafasd
F
Fig. 3 – A sample (a) dataset,
f variables, each containing a name, a type (either numeri-al, ordinal, or nominal), an optional modifier (either response,actor, repeated, dependent, independent, confounding, fail-re, time, group, case, and control), and the actual data.hile the type clearly specifies which kind of data is rep-
esented by the variable, a modifier specifies the “role” ofhe variable in a statistical analysis. For instance, a multi-le regression aims to discover how a dependent variable isinfluenced” by several independent variables: thus the mod-fiers explain which variable is the dependent variable, and
hich are instead the independent ones. Fig. 3 shows a sam-le dataset made up of one numerical variable named “x”,ontaining four observations, namely: 1, 3, 4 and 2. A returnag contains different information depending on the invokednalysis. A brief description of the most important data types
ollows. A pObsType is defined in XDTFNSE to represent a prob-bility (e.g. the result of a rank-sum test) and its correspondingtatistics (e.g. t, z, F, �2), while a valueObsType is the datatypeefined in XDTFNSE to represent a generic return value (e.g.ig. 4 – The interface to Stata, with CSV, DO, and LOG files, referr
Fig. 5 – Connection between the XFNSE consumer and theXFNSE service.
mean), together with other additional information (e.g. the
confidence interval). XML documents in Fig. 3 and c brieflyshow the use of the pObsType and valueObsType data types, inthe example used to return the result of a rank-sum test andof a mean, respectively.ing to the XML documents contained in Fig. 3 (a) and (c).

148 c o m p u t e r m e t h o d s a n d p r o g r a m s i n b i o m e d i c i n e 9 2 ( 2 0 0 8 ) 144–153
Fig. 6 – The statistical processing architecture via the eXist XML-database.
ad,
Fig. 7 – XQuery used to compare, for each leTo actually execute a statistical function, the XFNSE ser-vice reuses the well-known Stata statistical package [35]. Thissolution is motivated by the following consideration. Stata isa powerful statistical engine which can be executed in batchmode. Therefore, it can be reused like a software componentinto a larger project, thus dramatically reducing the develop-ment efforts [36]. Thus the interface to Stata component worksas follows:
1. By given an operation invoked over a dataset:• a CSV (comma separated values) file is created from the
provided dataset. Eventually, any data contained intonominal variables is encoded into numbers, since non-numeric data cannot be directly processed by Stata.
• A DO file, i.e. a set of Stata commands which implementthe requested operation, is created.
2. Both files are passed to Stata.3. The Stata’s output, located in a LOG file, is parsed to return
back the result, eventually decoding any numeric data intothe code of the corresponding nominal variable.
Fig. 4 depicts the main components of the interface, andprovides a sample run. In the figure, the input dataset is theXML document of Fig. 3, the operation is a “mean”, the blockscontains the CSV, DO, and LOG files which are created dur-ing the execution, and the resulting XML document is that ofFig. 3. More details on a similar interface, but also valid for thisarchitecture, can be found in [37].
3.2. XFNSE consumer
The XFNSE consumer is a graphical application whose aim is
to provide an easy-to-use interface, helpful to interact with theXFNSE service (Fig. 5). Currently, it is only usable to test the ser-vice and to launch statistical analyses from existing datasets,and not for production. It is written in Java, and allows users tothe QRS duration among the two methods.
load databases from CSV documents, to define the respectivevariables’ types and modifiers, to connect to the XFNSE ser-vice, to invoke the desired analysis, and to display the resultsin XML format.
3.3. XFNSE module
The statistical analyses offered by the service can be alsoaccessed via the eXist database [38], which is an “[. . .] OpenSource native XML database featuring efficient, index-basedXQuery processing, automatic indexing, extensions for full-text search, XUpdate support, XQuery update extensions[. . .]”.
To this aim, the authors extended the set of XPath/XQueryfunctions by developing an eXist module [39], called XFNSEmodule. Such a module is implemented as a consumer of theXFNSE service: when a statistical function belonging to thexfnsenamespace is invoked in a XPath/XQuery statement, themodule is activated, a proxy to the service is created, and thecorresponding operation is called via SOAP. We remark thatthe proxy is created the first time the eXist module is acti-vated, thus this high time-consuming task is performed once,at the first function call. Furthermore, the eXist client, i.e. agraphical application not directly developed by the authors,but included in the eXist distribution, can be used to querythe eXist database (Fig. 6).
The extensions closely match the operations available inthe XFNSE service, as a set of aggregation functions.1
Since all statistical analyses return more information thatthe single aggregate value, other supporting functions – whichreturn such complementary information – are introduced. Forinstance, by referring to the mean, the supporting functions
return the lower and upper bound of the confidence inter-vals.1 To list all the available functions, the following XQuery can be
c o m p u t e r m e t h o d s a n d p r o g r a m s i n b i o m e d i c i n e 9 2 ( 2 0 0 8 ) 144–153 149
ludin
4
TsbstadmtEw
l
.
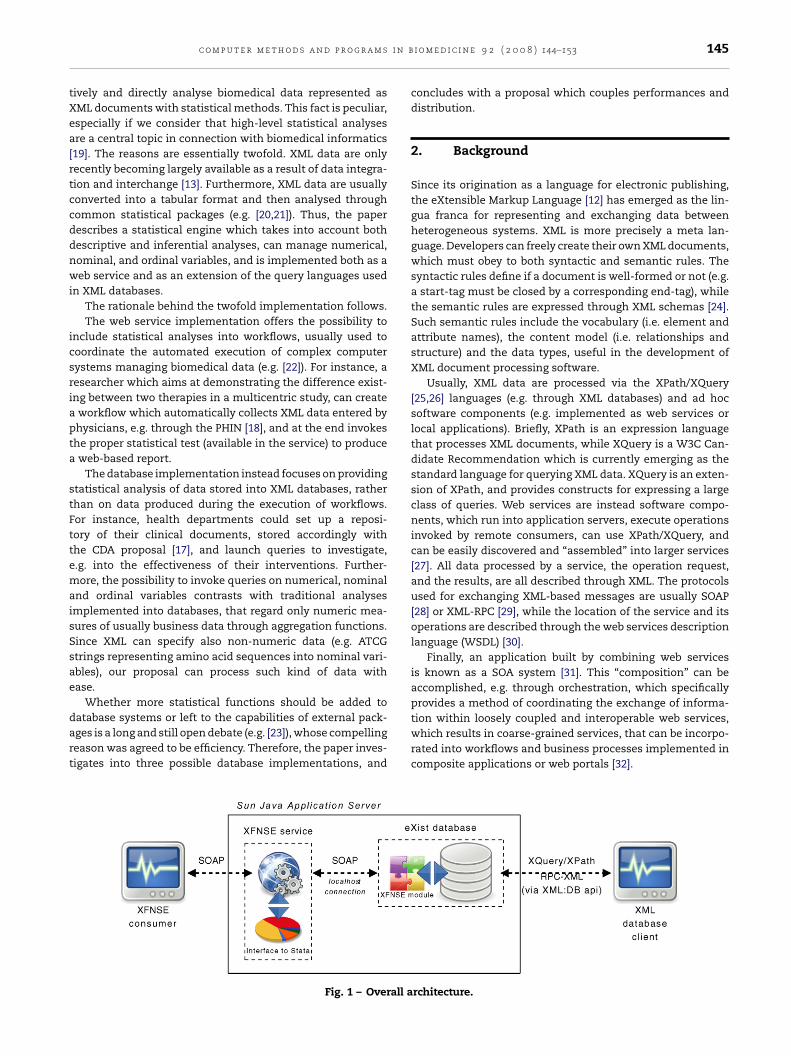
Fig. 8 – The eXist client while executing an XQuery inc
. Sample system run
he proposed architecture was used to perform the analy-es contained in a recent paper concerning the comparisonetween the EASI system 12-lead ecocardiograms (ECGs) andtandard 12-lead ECGs [40]. We remark that the EASI sys-em is a simplified ECG system, which uses five electrodesnd an advanced algorithm to derive continuous 12-lead ECGata. Briefly, the analysed dataset contained the results ofore than 2000 ECGs (in terms of QT dispersion, QRS dura-
ion, and J point, i.e. three standard measurements used inCGs) performed on different patients. The aim of the paperas to point out whether a difference exists or not between
aunched within eXist:
declare namespace util=” http://exist-db.org/xquery/util”;
let $mod:=” http://www.med.univaq.it/hixwg/xfnse”
for $f in util:registered-functions($mod)
return util:describe-function($f)
g a two-sample t-test and a Wilcoxon rank-sum test.
the two methods (for each lead). The analysis that had tobe performed for each lead is a two-sample t-test, in caseof a normal distribution, or a Wilcoxon rank-sum test, oth-erwise.
4.1. Database
To perform the analysis, the extended version of the eXistdatabase was used. The data were provided in a tabular for-mat, converted into three XML documents (qt.xmlfor the QTdispersions, qrs.xml for the QRS durations, and j.xml for the Jpoints), and stored in an ad hoc collection, called ecg. Then,the XQuery listed in Fig. 7 was launched.
The XQuery initially declares the xfnse namespace (line 1).Thus, for each lead contained in the qrs.xml document, storedin the database in the ecg collection (line 4), the query extractsthe actual observations (line 6) and computes a normality test
on them (line 7). Finally, if the distribution is normal (line9), the query returns the result of the two-sample t-test (line10), otherwise the result of the Wilcoxon rank-sum test (line11).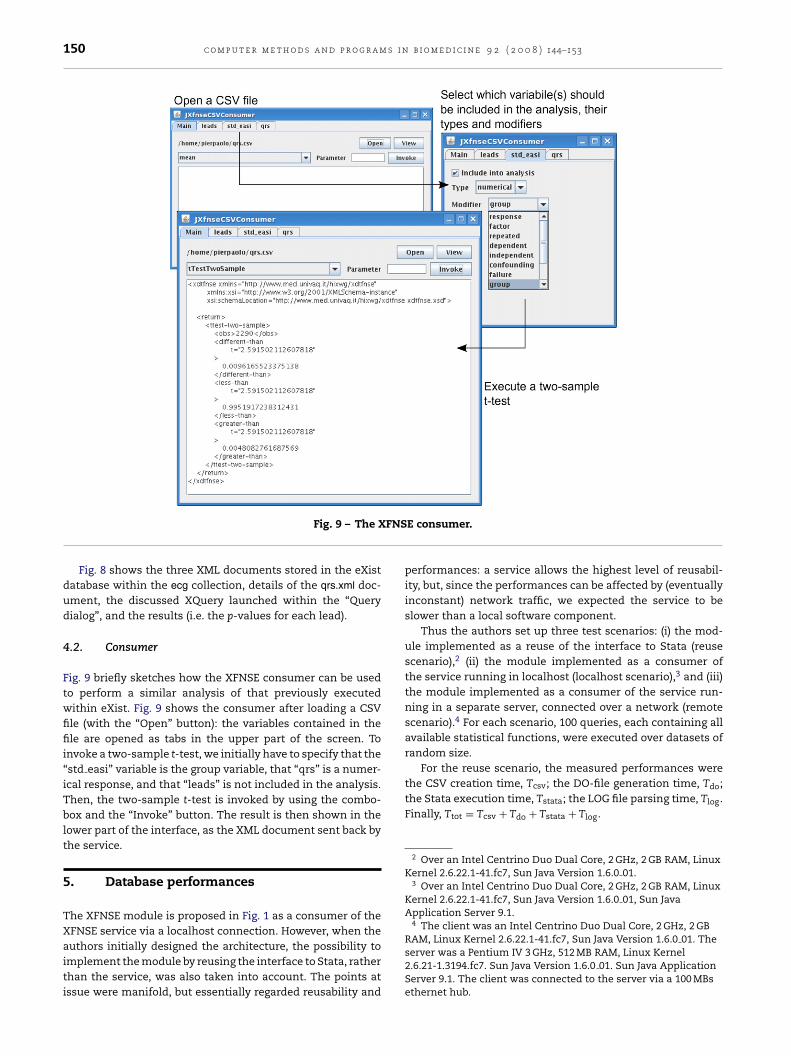
150 c o m p u t e r m e t h o d s a n d p r o g r a m s i n b i o m e d i c i n e 9 2 ( 2 0 0 8 ) 144–153
FNS
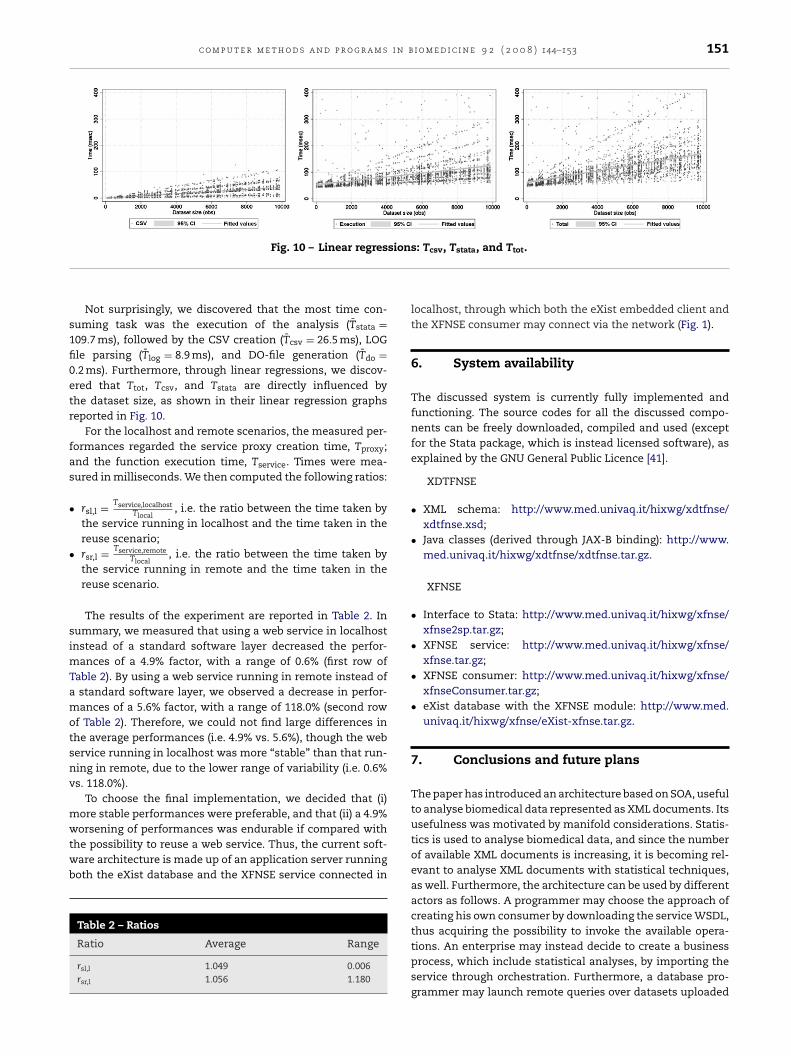
the CSV creation time, Tcsv; the DO-file generation time, Tdo;the Stata execution time, Tstata; the LOG file parsing time, Tlog.Finally, Ttot = Tcsv + Tdo + Tstata + Tlog.
2 Over an Intel Centrino Duo Dual Core, 2 GHz, 2 GB RAM, LinuxKernel 2.6.22.1-41.fc7, Sun Java Version 1.6.0 01.
3 Over an Intel Centrino Duo Dual Core, 2 GHz, 2 GB RAM, LinuxKernel 2.6.22.1-41.fc7, Sun Java Version 1.6.0 01, Sun JavaApplication Server 9.1.
4 The client was an Intel Centrino Duo Dual Core, 2 GHz, 2 GB
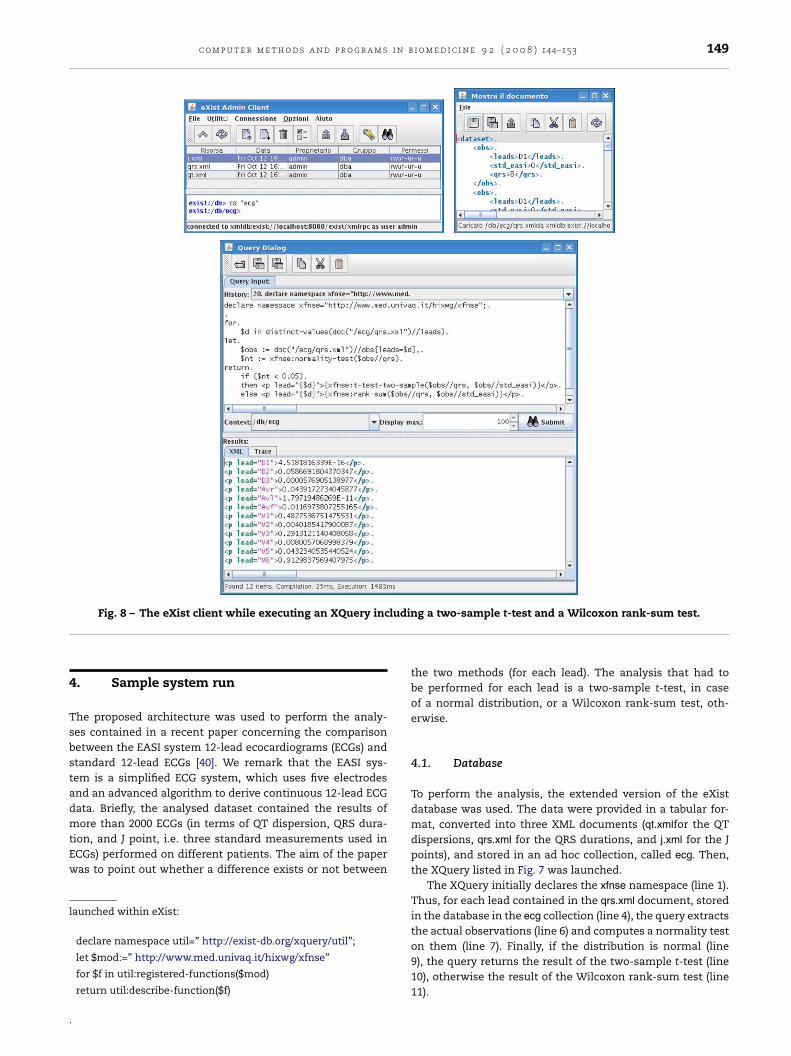
Fig. 9 – The X
Fig. 8 shows the three XML documents stored in the eXistdatabase within the ecg collection, details of the qrs.xml doc-ument, the discussed XQuery launched within the “Querydialog”, and the results (i.e. the p-values for each lead).
4.2. Consumer
Fig. 9 briefly sketches how the XFNSE consumer can be usedto perform a similar analysis of that previously executedwithin eXist. Fig. 9 shows the consumer after loading a CSVfile (with the “Open” button): the variables contained in thefile are opened as tabs in the upper part of the screen. Toinvoke a two-sample t-test, we initially have to specify that the“std easi” variable is the group variable, that “qrs” is a numer-ical response, and that “leads” is not included in the analysis.Then, the two-sample t-test is invoked by using the combo-box and the “Invoke” button. The result is then shown in thelower part of the interface, as the XML document sent back bythe service.
5. Database performances
The XFNSE module is proposed in Fig. 1 as a consumer of theXFNSE service via a localhost connection. However, when the
authors initially designed the architecture, the possibility toimplement the module by reusing the interface to Stata, ratherthan the service, was also taken into account. The points atissue were manifold, but essentially regarded reusability andE consumer.
performances: a service allows the highest level of reusabil-ity, but, since the performances can be affected by (eventuallyinconstant) network traffic, we expected the service to beslower than a local software component.
Thus the authors set up three test scenarios: (i) the mod-ule implemented as a reuse of the interface to Stata (reusescenario),2 (ii) the module implemented as a consumer ofthe service running in localhost (localhost scenario),3 and (iii)the module implemented as a consumer of the service run-ning in a separate server, connected over a network (remotescenario).4 For each scenario, 100 queries, each containing allavailable statistical functions, were executed over datasets ofrandom size.
For the reuse scenario, the measured performances were
RAM, Linux Kernel 2.6.22.1-41.fc7, Sun Java Version 1.6.0 01. Theserver was a Pentium IV 3 GHz, 512 MB RAM, Linux Kernel2.6.21-1.3194.fc7. Sun Java Version 1.6.0 01. Sun Java ApplicationServer 9.1. The client was connected to the server via a 100 MBsethernet hub.
c o m p u t e r m e t h o d s a n d p r o g r a m s i n b i o m e d i c i n e 9 2 ( 2 0 0 8 ) 144–153 151
sions
s1fi0etr
fas
•
•
simTamotsnv
mwtwb
Fig. 10 – Linear regres
Not surprisingly, we discovered that the most time con-uming task was the execution of the analysis (Tstata =09.7 ms), followed by the CSV creation (Tcsv = 26.5 ms), LOGle parsing (Tlog = 8.9 ms), and DO-file generation (Tdo =.2 ms). Furthermore, through linear regressions, we discov-red that Ttot, Tcsv, and Tstata are directly influenced byhe dataset size, as shown in their linear regression graphseported in Fig. 10.
For the localhost and remote scenarios, the measured per-ormances regarded the service proxy creation time, Tproxy;nd the function execution time, Tservice. Times were mea-ured in milliseconds. We then computed the following ratios:
rsl,l = Tservice,localhostTlocal
, i.e. the ratio between the time taken bythe service running in localhost and the time taken in thereuse scenario;rsr,l = Tservice,remote
Tlocal, i.e. the ratio between the time taken by
the service running in remote and the time taken in thereuse scenario.
The results of the experiment are reported in Table 2. Inummary, we measured that using a web service in localhostnstead of a standard software layer decreased the perfor-
ances of a 4.9% factor, with a range of 0.6% (first row ofable 2). By using a web service running in remote instead ofstandard software layer, we observed a decrease in perfor-ances of a 5.6% factor, with a range of 118.0% (second row
f Table 2). Therefore, we could not find large differences inhe average performances (i.e. 4.9% vs. 5.6%), though the webervice running in localhost was more “stable” than that run-ing in remote, due to the lower range of variability (i.e. 0.6%s. 118.0%).
To choose the final implementation, we decided that (i)ore stable performances were preferable, and that (ii) a 4.9%
orsening of performances was endurable if compared withhe possibility to reuse a web service. Thus, the current soft-are architecture is made up of an application server runningoth the eXist database and the XFNSE service connected in
Table 2 – Ratios
Ratio Average Range
rsl,l 1.049 0.006rsr,l 1.056 1.180
: Tcsv, Tstata, and Ttot.
localhost, through which both the eXist embedded client andthe XFNSE consumer may connect via the network (Fig. 1).
6. System availability
The discussed system is currently fully implemented andfunctioning. The source codes for all the discussed compo-nents can be freely downloaded, compiled and used (exceptfor the Stata package, which is instead licensed software), asexplained by the GNU General Public Licence [41].
XDTFNSE
• XML schema: http://www.med.univaq.it/hixwg/xdtfnse/xdtfnse.xsd;
• Java classes (derived through JAX-B binding): http://www.med.univaq.it/hixwg/xdtfnse/xdtfnse.tar.gz.
XFNSE
• Interface to Stata: http://www.med.univaq.it/hixwg/xfnse/xfnse2sp.tar.gz;
• XFNSE service: http://www.med.univaq.it/hixwg/xfnse/xfnse.tar.gz;
• XFNSE consumer: http://www.med.univaq.it/hixwg/xfnse/xfnseConsumer.tar.gz;
• eXist database with the XFNSE module: http://www.med.univaq.it/hixwg/xfnse/eXist-xfnse.tar.gz.
7. Conclusions and future plans
The paper has introduced an architecture based on SOA, usefulto analyse biomedical data represented as XML documents. Itsusefulness was motivated by manifold considerations. Statis-tics is used to analyse biomedical data, and since the numberof available XML documents is increasing, it is becoming rel-evant to analyse XML documents with statistical techniques,as well. Furthermore, the architecture can be used by differentactors as follows. A programmer may choose the approach ofcreating his own consumer by downloading the service WSDL,thus acquiring the possibility to invoke the available opera-
tions. An enterprise may instead decide to create a businessprocess, which include statistical analyses, by importing theservice through orchestration. Furthermore, a database pro-grammer may launch remote queries over datasets uploaded
s i n
r
152 c o m p u t e r m e t h o d s a n d p r o g r a m
in the database, while an end-user may run the consumer touse a simplified graphical interface.
Compared to relational databases or flat files storinghealth data, XML documents offers several advantagesconnected with the possibility to integrate biomedicalinformation among heterogeneous sources, and (hopefully)provide semantic interoperability among them [13]. Never-theless, their storage into XML databases have at least oneserious drawback. XML databases are slower than relationaldatabases, essentially due to their infancy (in terms of boththeoretical background and available query optimisations).Approaches aiming at mapping XML data to relational (andviceversa) are usually adopted [42], but problems still existconcerning: (i) the translation of XPath/XQuery into SQL oversuch architectures, (ii) the costs connected with the develop-ment of classes to get data in/out of a relational database, and(iii) the difficulties in converting tabular data to/from XML [43].Due to such concerns, however, it is not unjustified to presup-pose that in a near future XML native databases will substituterelational ones, similarly to what happened in the 80’ withnetwork and hierarchical systems.
Compared with classic statistical packages, the proposedarchitecture offers several advantages and some drawbacks.
In connection with the XFNSE service, it can be reusedby any software, written in every programming language,thus guaranteeing high interoperability. Furthermore, it canbe easily included into the automated execution of com-plex computer systems needing statistical analyses. Moreover,every software update and/or bug correction is applied onlyin the service, without affecting the database component.Finally, the authors point out that the software architecturealso allows the usage of different packages as statistical back-ends (e.g. R [44]). The major drawback is that the operationsare limited to those listed in [33]. Although such operationssuffice to respond to central tendency, dispersion, differenceamong observations, and association between variables, theservice cannot compete with many statistical packages thatimplement programming languages specifically written forstatistical analysis. Furthermore, the XFNSE service processesonly XML documents validated over the XDTFNSE schema.Thus, to analyse user-defined XML documents (e.g. CDA docu-ments), a preliminary transformation must be performed, e.g.via an ad hoc written software, or transformation languages[45], or the orchestration “assign” operator [32].
By referring to the XPath/XQuery extensions, provided bythe XFNSE module, this solution represents the first attemptto implement statistical analyses into XML native databases(like the functions available into relational databases with sta-tistical extensions [46,47]). This solution allows researchersto directly analyse, e.g. CDA documents stored into XMLdatabases, or collections of user-defined XML documents,thus with a more flexible behaviour than that of the XFNSEservice. However, it is worth remarking that other types ofstatistical analyses should not be implemented neither as aservice nor in a module, but must be directly implementedinto the database engine. Sampling is a clear example [48]: it
is extremely unsatisfactory to extract large collections of datafrom a database, only to sample the collection through a sta-tistical function. Further investigations, concerning both theidentification of all such functions and their efficient imple-b i o m e d i c i n e 9 2 ( 2 0 0 8 ) 144–153
mentation into XML-native databases, have to be carried outand represent a further research direction.
e f e r e n c e s
[1] W. Raghupathi, J. Tan, Strategic IT applications in healthcare, Communications of the ACM 45 (2002) 56–61.
[2] K. Hauck, P.C. Smith, M. Goddard, The Economics of PrioritySetting for Health Care—A Literature Review, The WorldBank, 2003.
[3] D.M. Bravata, K.M. McDonald, W.M. Smith, C. Rydzak, H.Szeto, D.L. Buckeridge, C. Haberland, D.K. Owens, Systematicreview: surveillance systems for early detection ofbioterrorism-related diseases, Annals of Internal Medicine140 (2004) 910–922.
[4] Y. Deshpande, S. Hansen, Web engineering: creating adiscipline among disciplines, IEEE Multimedia 8 (2001) 82–87.
[5] A. Armoni (Ed.), Effective Healthcare Information Systems,IRM Press, 2002.
[6] R.L. Sanson, R.S. Morris, M.W. Stern, EpiMAN-FMD: adecision support system for managing epidemics ofvesicular disease, Revue Scientifique et Technique(International Office of Epizootics) 18 (1999) 593–605.
[7] S. Silva, R. Gouveia-Oliveira, A. Maretzek, J. Carrico, T.Gudnason, K.G. Kristinsson, K. Ekdahl, A. Brito-Avo, A.Tomasz, I.S. Sanches, H. de Lencastre, J. Almeida,EURISWEB—web-based epidemiological surveillance ofantibiotic-resistant pneumococci in day care centers, BMCMedical Informatics and Decision Making 3 (2003).
[8] E. Marcos, C.J. Acuna, B. Vela, J.M. Cavero, J.A. Hernández, Adatabase for medical image management, ComputerMethods and Programs in Biomedicine 86 (2007) 255–269.
[9] P. Thriskos, E. Zintzaras, A. Germenis, Dhlas: a web-basedinformation system for statistical genetic analysis of HLApopulation data, Computer Methods and Programs inBiomedicine 85 (2007) 267–272.
[10] W. Sujansky, Heterogeneous database integration inbiomedicine, Journal of Biomedical Informatics 34 (2001)285–298.
[11] P.A. Covitz, To infinity, and beyond: uniting the galaxy ofbiological data, OMICS: A Journal of Integrative Biology 7(2003) 21–22.
[12] T. Bray, J. Paoli, C.M. Sperberg-McQueen, E. Maler, F. Yergeau,Extensible Markup Language (XML) 1.0, fourth edition,http://www.w3.org/TR/REC-xml/(accessed May 29, 2008).
[13] A. Shabo, S. Rabinovici-Cohen, P. Vortman, Revolutionaryimpact of XML on biomedical information interoperability,IBM Systems Journal 45 (2006) 361–372.
[14] W.S. Jian, C.Y. Hsu, T.H. Hao, H.C. Wen, M.H. Hsu, Y.L. Lee,Y.C. Li, P. Chang, Building a portable data and informationinteroperability infrastructure-framework for a standardTaiwan electronic medical record template, ComputerMethods and Programs in Biomedicine 88 (2007) 102–111.
[15] R. de Knikker, Y. Guo, J.L. Li, A.K. Kwan, K.Y. Yip, D.W.Cheung, K.-H. Cheung, A web service choreography scenariofor interoperating bioinformatics applications, BMCBioinformatics 5 (2004).
[16] P.N. Seibel, J. Krüger, S. Hartmeier, K. Schwarzer, K.Löwenthal, H. Mersch, T. Dandekar, R. Giegerich, XMLschemas for common bioinformatic data types and theirapplication in workflow systems, BMC Bioinformatics 7
(2006).[17] R.H. Dolin, L. Alschuler, S. Boyer, C. Beebe, F.M. Behlen, P.V.Biron, A. Shabo, HL7 clinical document architecture, release2, Journal of The American Medical Informatics Association13 (2006) 30–39.
i n b
c o m p u t e r m e t h o d s a n d p r o g r a m s[18] J.W. Loonsk, S.R. McGarvey, L.A. Conn, J. Johnson, The PublicHealth Information Network (PHIN) preparedness initiative,Journal of the American Medical Informatics Association 13(2006) 1–4.
[19] E.H. Shortliffe, J.J. Cimino (Eds.), Biomedical Informatics:Computer Applications in Health Care and Biomedicine,Health Informatics, Springer-Verlag New York Inc., 2006.
[20] M. Dugas, E. Hoffmann, S. Janko, S. Hahnewald, T. Matis, J.Miller, Ch. von Bary, A. Farnbacher, V. Vogler, K. Überla,Complexity of biomedical data models in cardiology: theintranet-based af registry, Computer Methods and Programsin Biomedicine 68 (2002) 49–61.
[21] F. Pratter, XML for SAS programmers, in: SAS Global ForumConference, 2008.
[22] G. Gonzalez, J. Balasooriya, Web service orchestration forbioinformatics systems: challenges and current workflowdefinition approaches, in: IEEE International Conference onWeb Services (ICWS), 2007, pp. 1226–1227.
[23] J.P. Dittrich, D. Kossmann, A. Kreutz, Bridging the gapbetween OLAP and SQL, in: 31st International Conference onVery Large Data Bases (VLDB), 2005.
[24] D.C. Fallside, P. Walmsley, XML Schema Part 0: Primer,second edition, http://www.w3.org/TR/xmlschema-0/(accessed May 29, 2008).
[25] A. Berglund, S. Boag, D. Chamberlin, M.F. Fernández, M. Kay,J. Robie, J. Siméon, XML Path Language (XPath) 2.0.http://www.w3.org/TR/xpath20/ (accessed May 29, 2008).
[26] S. Boag, D. Chamberlin, M.F. Fernández, D. Florescu, J. Robie,J. Siméon, XQuery 1.0: An XML Query Language,http://www.w3.org/TR/xquery/ (accessed May 29, 2008).
[27] C. Ferris, J. Farrell, What are web services? Communicationsof the ACM 46 (6) (2003) 31.
[28] N. Mitra, Y. Lafon, SOAP Version 1.2 Part 0: Primer, secondedition, http://www.w3.org/TR/soap12-part0/ (accessed May29, 2008).
[29] D. Winer, XML-RPC Specification, http://www.xmlrpc.com/spec (accessed May 29, 2008).
[30] E. Christensen, F. Curbera, G. Meredith, S. Weerawarana,Web Services Description Language (WSDL) 1.1,http://www.w3.org/TR/wsdl (accessed May 29, 2008).
[31] T. Erl, Service-Oriented Architecture (SOA): Concepts,Technology, and Design, Prentice Hall PTR, 2005.
[32] S. Weerawarana, F. Curbera, F. Leymann, T. Storey, D.F.
Ferguson, Web Services Platform Architecture: SOAP, WSDL,WS-Policy, WS-Addressing, WS-BPEL, WS-ReliableMessaging, and More, Prentice Hall PTR, 2005.[33] B. Dawson-Saunders, R.G. Trapp, Basic & ClinicalBiostatistics, Chapter Appendix C: Flowcharts for Relating
i o m e d i c i n e 9 2 ( 2 0 0 8 ) 144–153 153
Research Questions to Statistical Methods, Appleton &Lange, 1994, pp. 329–333.
[34] B. Dawson-Saunders, R.G. Trapp, Basic & ClinicalBiostatistics, Appleton & Lange, 1994.
[35] A.C. Acock, A Gentle Introduction to Stata, Stata Press, 2006.[36] H. Mili, A. Mili, S. Yacoub, E. Addy, Reuse Based Software
Engineering: Techniques, Organizations, and Measurement,Wiley, 2002.
[37] P. Vittorini, S. Necozione, F. di Orio, Stata and the WeeWinformation system, The Stata Journal 7 (2007) 84–97.
[38] W. Meier, eXist: An Open Source Native XML Database,Volume 2593 of Lecture Notes in Computer Science, SpringerBerlin, Heidelberg, 2003, pp. 169–183.
[39] A. Retter, P. Brihaye, XQuery Extension ModulesDocumentation, http://www.exist-db.org/extensions.html(accessed May 29, 2008).
[40] L. Lancia, M.P. Cerone, P. Vittorini, S. Romano, M. Penco, Acomparison between EASI system 12-lead ECGs andstandard 12-lead ECGs for improved clinical nursingpractice, Journal of Clinical Nursing 12 (2008)370–377.
[41] Free Software Foundation, GNU General Public License,http://www.gnu.org/licenses/gpl.html (accessed May 29,2008).
[42] D. Florescu, D. Kossmann, Storing and querying XML datausing an RDBMs, IEEE Data Engineering Bulletin 22 (1999)27–34.
[43] T. Grust, S. Sakr, J. Teubner, Xquery on sql hosts, in:Proceedings of the 30th International Conference on VeryLarge Data Bases (VLDB), 2004.
[44] R Development Core Team, R: A Language and Environmentfor Statistical Computing, R Foundation for StatisticalComputing, Vienna, Austria, 2006, ISBN 3-900051-07-0.
[45] J. Clark, XSL Transformations (XSLT),http://www.w3.org/TR/xslt (accessed May 29, 2008).
[46] A. Shoshani, OLAP and statistical databases: similarities anddifferences, in: PODS’97: Proceedings of the Sixteenth ACMSIGACT-SIGMOD-SIGART Symposium on Principles ofDatabase Systems, ACM Press, New York, NY, USA, 1997, pp.185–196.
[47] ORACLE, Oracle Statistical Functions, http://www.oracle.com/technology/products/bi/stats fns/index.html (accessedMay 29, 2008).
[48] F. Olken, D. Rotem, Random sampling from databases—asurvey, in: SSDBM V: Proceedings of the Fifth InternationalConference on Statistical and Scientific DatabaseManagement, Springer-Verlag New York Inc., New York, NY,USA, 1990, pp. 92–111.