spring 2020 cfe fd model solutions - soa
TRANSCRIPT
CFE FD Spring 2020 Solutions Page 1
CFE FD Model Solutions Spring 2020
1. Learning Objectives:
1. The candidate will understand how a company optimizes its corporate finance decisions based on its business objectives.
Learning Outcomes: (1b) Compare and contrast methods to determine the value of a business or project,
including the impact on capital budgeting and allocation decisions. (1c) Evaluate the impact of non-financial factors on capital structure or capital
budgeting decisions. (1d) Assess the impact of business strategies such as acquisitions, divestitures, and/or
restructurings. Sources: Corporate Finance, Fourth Edition, Ch 22: Real Options Corporate Finance, Fourth Edition, Ch 25: Leasing Corporate Finance, Fourth Edition, Ch 27: Short Term Financing Case Study Commentary on Question: Overall, students did fair on this question. This was a long question to start the exam, which drew from a number of sources and the case study. The most successful answers were those which drew from the context of the case study and provided answers that were most applicable to Blue Jay Tires’ specific situation. Solution: (a)
(i) Describe two provisions of a lease agreement that create a non-tax lease.
(ii) Describe the tax consequences to each of the lessor and lessee of a true tax lease and a non-tax lease.
CFE FD Spring 2020 Solutions Page 2
1. Continued
Commentary on Question: The most successful answers to this part focused on provisions that would be beneficial to BJT (the lessee) as opposed to a potential lessor, given that the entire question is about BJT deciding how to obtain this equipment. There were many acceptable answers here, but given that the question asked for two provisions, only the first two responses provided by the student were considered. (i) BJT could structure the lease contract so that they are obligated to take
ownership of the machines at the end of the lease. BJT could also try to add an option to the contract that allows them to purchase the machines at a significant discount to the fair market price during the lease.
(ii) Under a True Tax lease:
a. Lessor receives depreciation tax deduction and lease payments are treated as revenue
b. Lessee can deduct lease payment as an operating expense Under a Non-Tax lease: c. Lessor treats interest portion of lease payment as income d. Lessee receives depreciation tax deduction and treats interest portion
of lease payment as a deductible operating expense. (b) Determine whether BJT should accept lease proposal A or lease proposal B based
on expected cost. Show your work.
Commentary on Question: Successful answers to this question set up the cash flows appropriately, including the timing of benefits and noting that the salvage value is not relevant from BJT’s perspective. Successful answers also appropriately applied the tax shield and used the appropriate tax-adjusted discount rate. Post-Tax cost of debt = 8% * (1 – 0.2) = 6.4% Lease Proposal A: Annual cost is $1,750,000 for the first 5 years (beginning of year cash flow) Annual cost is $2,000,000 for years 6-10 (beginning of year cash flow) Maintenance savings is $120,000 per year at the end of years 1-10 For the purposes of setting up the NPV, we have four distinct cash flow legs: Post-Tax Cost at Time 0 = $1,750,000 * (1 – 0.2) = $1,400,000 Post-Tax Cost at Time 1-4 = (($1,750,000 - $120,000) * (1 – 0.2)) = $1,304,000 Post-Tax Cost at Time 5-9 = (($2,000,000 - $120,000) * (1 – 0.2)) = $1,504,000 Post-Tax Cost at Time 10 = -$120,000 * (1 – 0.2) = -$96,000 NPV at Post-Tax Cost of Debt = -$10,715,652
CFE FD Spring 2020 Solutions Page 3
1. Continued Lease Proposal B: Annual cost is $1,800,000 for the first 10 years (beginning of year cash flows) Maintenance savings is $100,000 per years at the end of years 1-10 For the purposes of setting up the NPV, we have three distinct cash flow legs: Post-Tax Cost at Time 0 = $1,800,000 * (1 – 0.2) = $1,440,000 Post-Tax Cost at Time 1-9 = (($1,800,000 - $100,000) * (1 – 0.2)) = $1,360,000 Post-Tax Cost at Time 10 = -$100,000 * (1 – 0.2) = -$80,000 NPV at Post-Tax Cost of Debt = -$10,488,360 The expected cost of lease proposal B is lower that lease proposal A, so BJT should accept proposal B.
(c) Explain two reasons why BJT might choose to lease rather than buy the machine.
Commentary on Question: The most successful answers for part c) focused on why BJT would choose to lease, as opposed to why a generic company would choose to lease.
Risk of Selling Machines - BJT may not want to be stuck with the risk of selling the machines after their useful life and failing to recover their expected salvage value. These are specialized machines that likely have a very limited resale market. There is also sizable uncertainty over the value of used assets ten years into the future. In addition, BJT has not owned these machines in the past and may be unfamiliar with the selling process. Efficiency / Ancillary Improvements from Leasing - BJT may see efficiency improvements from leasing, as they will receive annual maintenance service from the lessor. BJT is unfamiliar with these specialized machines and may benefit from this service. While the expected monetary savings is incorporated in the cost analysis, there may be ancillary benefits for BJT that are not easily quantified. For example, the lessor may be able to detect early warning signs that require further maintenance before BJT could. This may reduce BJT's product liability risk. Similarly, the lessor may recommend testing, routine maintenance, and other checking BJT can perform on a regular basis to ensure the machine is functioning properly. In addition, BJT is assured of a service provider if they have significant problems with their machines.
(d) Calculate the value of BJT’s option to defer the production level decision. Show
your work.
CFE FD Spring 2020 Solutions Page 4
1. Continued
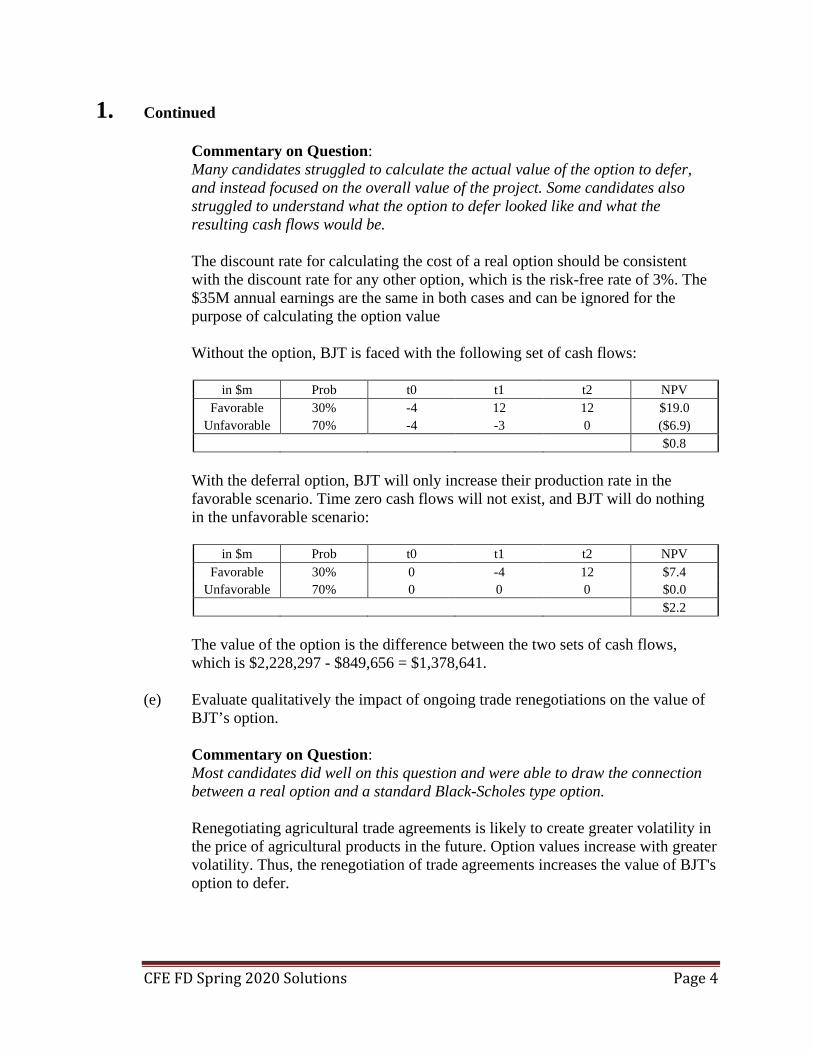
Commentary on Question: Many candidates struggled to calculate the actual value of the option to defer, and instead focused on the overall value of the project. Some candidates also struggled to understand what the option to defer looked like and what the resulting cash flows would be.
The discount rate for calculating the cost of a real option should be consistent with the discount rate for any other option, which is the risk-free rate of 3%. The $35M annual earnings are the same in both cases and can be ignored for the purpose of calculating the option value Without the option, BJT is faced with the following set of cash flows:
in $m Prob t0 t1 t2 NPV Favorable 30% -4 12 12 $19.0
Unfavorable 70% -4 -3 0 ($6.9) $0.8
With the deferral option, BJT will only increase their production rate in the
favorable scenario. Time zero cash flows will not exist, and BJT will do nothing in the unfavorable scenario:
in $m Prob t0 t1 t2 NPV
Favorable 30% 0 -4 12 $7.4 Unfavorable 70% 0 0 0 $0.0
$2.2 The value of the option is the difference between the two sets of cash flows,
which is $2,228,297 - $849,656 = $1,378,641. (e) Evaluate qualitatively the impact of ongoing trade renegotiations on the value of
BJT’s option.
Commentary on Question: Most candidates did well on this question and were able to draw the connection between a real option and a standard Black-Scholes type option.
Renegotiating agricultural trade agreements is likely to create greater volatility in the price of agricultural products in the future. Option values increase with greater volatility. Thus, the renegotiation of trade agreements increases the value of BJT's option to defer.

CFE FD Spring 2020 Solutions Page 5
1. Continued
(f) (i) Calculate the effective annual rate (EAR) of the proposed bank loan.
Show your work.
(ii) Recommend an alternative short-term financing method for BJT.
Commentary on Question: Candidates struggled across the board with this question. The key to this question was understanding that if BJT is going to incur $7M of one-time costs, BJT doesn’t need a $7M loan. BJT needs a loan that gives them enough usable proceeds, such that after the compensation balance is removed and $40,000 of fees are paid, there is $7M left over. For part ii, candidates generally provided suitable financing alternatives, but not all answers tied back into why this would be possible or preferable for BJT. There were a number of alternative answers here that could receive full credit.
(i) Total loan amount needed: (7,000,000 + 40,000) / 0.95 = $7,410,526
The origination fee will be paid immediately, and the compensating balance is not available to BJT for covering acquisition expenses. Thus, BJT needs a loan of $7,410,526. Interest on the loan will be $7,410,526 * (0.15/4) = $277,895 To calculate the quarterly cost of the loan, BJT has $7,040,000 of usable proceeds, while the rest is a maintenance balance. BJT’s quarterly cost as a percentage of the usable proceeds is $277,895 / $7,040,000 = 3.95%. The EAR is then (1.0395^4 – 1) = 16.75%.
(ii) BJT should finance the acquisition costs using commercial paper with
Blue Jay Air (or RPPC) performing the offering. Commercial paper is generally cheaper than a bank loan. Blue Jay Air has an investment grade credit rating and may be large enough to issue commercial paper on favorable terms. In addition, Blue Jay Air (or RPPC) is likely better known to investors than BJT, which has only recently begun growing beyond their niche markets.
CFE FD Spring 2020 Solutions Page 6
1. Continued (g) Recommend whether BJT should acquire TNT or develop its own capabilities to
expand into the construction equipment and agricultural tires market. Justify your recommendation.
Commentary on Question: Candidates generally did not provide enough support for this answer in the justification section. As a two-point question at the end of a long case study question, candidates were expected to provide a detailed, fully reasoned recommendation that used both financial and non-financial support from prior sections of the question. Answers were accepted to both acquire and not acquire TNT, as long as sufficient support was provided.
BJT must weigh several factors when deciding whether to acquire TNT or develop their own capabilities. - BJT will earn an additional $1M per year ($36M - $35M) if they acquire TNT. - BJT will retain the option that is already worth more than the annual income differential to expand if they develop their own capabilities and that option may increase in value given the ongoing trade negotiations. This may make developing their own capabilities more attractive from a financial perspective over time. - Changes to NAFTA may make transactions with TNT, a US based company, more costly in the future. - Acquiring TNT gives BJT an established presence in a new market where BJT may have limited knowledge. For example, BJT may need to develop a new distribution network in a crowded market. -BJT has a grass roots competency in quality management, which helps keep manufacturing risk low. TNT manufacturing occurs in Eastern Asia, which will make oversight difficult for BJT. In addition, BJT does not want to interfere with TNT's operations. Thus, BJT's manufacturing risk and product liability risk would likely increase if they acquired TNT. - Acquiring TNT may also increase BJT's reputation risk due to the likely increase in product liability risk. BJT's reputation and brand name are primary strengths and a key factor in BJT's recent growth. While $1M in additional expected annual earnings is material given BJT earned $45M in 2018, it is recommended that BJT develop their own capabilities to expand into the construction equipment and agricultural tires industry. Increases in BJT's manufacturing and reputational risk from acquiring a company that primarily uses low cost labor in Asia with little oversight from BJT could harm earnings from BJT's existing operations. In addition, changes in NAFTA may benefit BJT if they develop their own capabilities given BJT's option to expand and their reduced reliance on a US company. Notable increases in their risk profile outweigh the potential for additional expected earnings.
CFE FD Spring 2020 Solutions Page 7
2. Learning Objectives: 5. The candidate will understand advanced techniques to evaluate and manage non-
hedgeable risks in financial and non-financial organizations. Learning Outcomes: (5a) Apply frameworks or methods to evaluate non-hedgeable risks for both financial
and non-financial organizations. (5c) Evaluate the efficacy of different approaches to managing non-hedgeable risks,
including risk capital positions, operational risk management practices, risk mitigation and transfer strategies.
Sources: CRO Forum, Market Cost of Capital Approach to Market Value Margins Case Study Commentary on Question: Commentary listed underneath question component. Solution: (a) Assess the likely impact to a market value margin (MVM) calculation for each of
I-IV. Commentary on Question: Most candidates correctly identified the directional impact to the MVM under each scenario. Full credit was given when those impacts were supported by recognizing hedgeable vs. non-hedgable risk and/or specifics from the case study. I. No impact. The liabilities on the balance sheet are set on a pre-tax basis
and hence the MVM should be pre-tax as well. The tax rate is irrelevant. II. Increase. Operational risk is non-hedgable. The expected and worst-case
liability is likely to increase and as a result increase the MVM. III. No or little impact. Investment risk is typically hedgeable. In fact,
Darwin already uses derivatives and credit default swaps (CDS) to manage the interest and credit risk in the GA.
IV. Increase, at least initially. Operational risk is likely to increase during and
after the acquisition. The MVM may ultimately decrease over the medium to long-term if synergies from combining life insurance operations are realized.
CFE FD Spring 2020 Solutions Page 8
2. Continued (b) A member of the Board of Directors comments, “MVM’s ‘one-year shock’
method is not appropriate for setting margins for longer duration businesses such as life insurance.”
Critique the Board member’s comment.
Commentary on Question: In many cases candidates did not articulate how the one-year shock method may be perfectly appropriate for setting margins on life insurance. The Board member is wrong, or just confused. The idea that the MVM only takes account of one-year worth of risk and everything after the first year is ignored is incorrect. The change in liability value is between expected future liability cash flows and a tail scenario. The tail scenario cash flows reflect not what we can observe in any one year but rather how far off we can be in estimating our expected liability cash flows over their entire life.
(c) Calculate the cost of capital charge implied in Darwin’s MVM assumption. Show
your work. Commentary on Question: Most candidates were able to accurately complete a substantial potion of the calculation. In some cases, candidates interpreted the wording such that (additional) discounting was not applied to claims and surrenders, which was reasonable, and thus they were not materially penalized.
Projected UL first year premium (000s) - case study, page 78 50% of that is ULSG premium (given) 10% of that is PV claims and surrenders (given)
PV of future claims and surrenders for business issued in year (t)
2018 = (58,780) * (50%) * (10%) = 2,939 2019 = (72,420) * (50%) * (10%) = 3,621 2020 = (89,480) * (50%) * (10%) = 4,474
Mid-year discounting of cashflows at 3%; multiply by 8% for SCR 2020 = 4,474 / (1.03).5 = 4,408 SCR = 4,408 * 8% = 353 2019 = 3,621 / (1.03).5 + 4,408 / (1.03) = 7,848 SCR = 7,848 * 8% = 628 2018 = 2,939 / (1.03).5 + 7,848 / (1.03) = 10,515 SCR = 10,515 * 8 % = 841
CFE FD Spring 2020 Solutions Page 9
2. Continued Mid-year discounting of SCR at 3% 2020 = 353 / (1.03).5 = 347 2019 = 628 / (1.03).5 + 347 / (1.03) = 956 2018 = 841 / (1.03).5 + 956 / (1.03) = 1,757 Total over three years = 1,757 MVM (in 000s) = 200 Implied Cost of Capital = 200 / 1,757 = 11.4%
(d) Recommend three changes to Darwin’s MVM estimation approach. Justify your
recommendation.
Commentary on Question: Candidates did okay on this question. In some cases, responses focused entirely on the reliability of the cashflow assumptions from part c) above and received partial credit. Even with perfect cashflow assumptions there are significant methodology concerns worth noting. Candidates needed to recognize that in order to receive full credit.
Consider aggregation in some form
• Since MVM is typically calculated for each line of business where the products have similar risk profiles, calculate MVM for the entire UL block or across all Darwin life insurance business (UL + Trad Life + Term).
Extend the time horizon
• The projected SCR should be from time-zero to runoff. A three-year time horizon is not particularly meaningful for long-tailed business such as life insurance, so it should be extended.
Refine or sensitivity test basic assumptions
• The simplistic ULSG cashflow estimates are likely inappropriate. Fundamentally, a better proxy measure for non-hedgable mortality risk may be NAR. Also, consider alternative discount rate(s) and their impact.

CFE FD Spring 2020 Solutions Page 10
3. Learning Objectives: 1. The candidate will understand how a company optimizes its corporate finance
decisions based on its business objectives. 2. The candidate will understand how to gauge a company’s performance through an
evaluation of its financial reports. 3. The candidate will understand how to apply and recommend appropriate ERM
framework, principles and strategies to manage, evaluate, analyze and mitigate risk exposures faced by an entity and to ensure operational excellence in any industry.
4. The candidate will understand the application of quantitative methods with a risk
management focus to business problems. Learning Outcomes: (1d) Assess the impact of business strategies such as acquisitions, divestitures, and/or
restructurings. (2b) Identify and analyze the impact of unusual accounting practices on the quality of
earnings and assets of a corporation, including analyzing the signs of questionable accounting.
(3a) Assess the potential impact of risks faced by an entity in any industry. (3d) Recommend best practices to achieve operational excellence. (4c) Evaluate the impact of risk mitigation methods including risk hedging and
insurance. Sources: F-142-19 Manuela, Rhoades, and Curtis, An Analysis of Delta Air Lines' Oil Refinery Acquisition F-134-19 Aswath Damodaran, Damodaran on Valuation, Ch 15: The Value of Synergy F-138-19 Caldwell, A Framework for Board Oversight of Enterprise Risk, CPA Canada Robinson et al., International Financial Statement Analysis, Ch. 17 Evaluating Quality of Financial Reports F-145-19 Romanosky et al., Content Analysis of Cyber Insurance Policies: How Do Carriers Write Policies and Price Cyber Risk? Case Study
CFE FD Spring 2020 Solutions Page 11
3. Continued Commentary on Question: Candidates scored reasonably well in parts that were direct recollections from study material. However, candidates who did not justify answers fully did not receive full credit. Sections that tested the candidates’ ability to apply concepts covered in the study material to practical situations showed a clear demarcation between candidates who scored well overall and those who did not. These sections required candidates to substantiate their responses with clear references to the case study and identify distinct issues or reasons in order to receive full credit. Solution: (a) Determine which organizational theory each executive’s statement
(I-IV) represents. Justify your answer. Commentary on Question: Most candidates scored reasonably well on this part. The candidates had to justify the organizational theory applicable by linking the statement given in the question to what the theory describes for full credit. Clark: Resource-Based View (RBV) According to RBV, internal resources and capabilities are the source of sustained competitive advantage and should drive the decision-making on what form the organizational structure should take. Smith: Resource Dependence Theory (RDT) RDT emphasizes the concept of power and autonomy in the discussion of organizational structure. Marino: Transaction Cost Economics (TCE) TCE stresses the role of transaction costs in the shaping the structure. Brandon Kaladin (CEO): Resource Dependence Theory (RDT) RDT provides responses to reduce dependence and uncertainty with organizational growth.
(b) Evaluate which alternative each executive (I-IV) would pursue based on their
statements above. Justify your answer. Commentary on Question: Alternate answers with proper justification were given due credit. Some candidates argued that the CFO would prefer to outsource, given the cost savings. If these answers did not recognize the long-term benefits of ownership and vertical integration it received only partial credit.
CFE FD Spring 2020 Solutions Page 12
3. Continued Clark: outsource underwriting operations Clark's statement expresses the RBV, which argues for focusing on what you do best and outsourcing the rest. Smith: purchase Snappy Smith's statement expresses the RDT, which suggests managing resource dependency by incorporating resources within the organization through mergers and acquisitions. Marino: purchase Snappy Marino's statement aligns with TCE, which argues for the benefits of a vertically integrated firm. Outsourcing may impose costs on the firm that could be alleviated through ownership. Kaladin: purchase Snappy Kaladin's statement aligns with RDT, which suggests managing resource dependency by incorporating resources within the organization through mergers and acquisitions.
(c)
(i) Describe three risks associated with Snappy Life that may influence the decision to purchase.
(ii) Recommend actions to address the risks identified in (i).
Commentary on Question: Possible risks other than the three mentioned below such as volatility of Snappy’s cash flows and the short planning horizon received appropriate credit. In order to receive full credit, candidates had to identify three distinct risks and appropriate mitigation measures.
Risk: Snappy's aggressive competitive actions. Snappy's aggressive strategy with bias toward accepting most risks is inconsistent with Darwin's strategic move toward a more disciplined operational focus in underwriting. Mitigation: Darwin should fully integrate Snappy into the Darwin risk management framework. No sale should be approved unless it is within Darwin's risk appetite, and all processes should be subject to risk monitoring.
CFE FD Spring 2020 Solutions Page 13
3. Continued Risk: Snappy doesn't have an economic capital model or analysis. Life Ins Co has long term liabilities and should understand evolution of capital needs Mitigation: Darwin should include Snappy's current business in its economic capital model to estimate the increased capital requirement due to the purchase of Snappy. Risk: Snappy's internet sales business is subject to cyber-risk Mitigation: Darwin should have Snappy's cyber-risk exposure evaluated by an independent expert to estimate potential liability and cost of remediating
(d) Darwin has performed a valuation of Snappy Life and calculates the purchase price as the present value of future earnings. Critique the valuation approach. Commentary on Question: Very few candidates received full credit for this part of the question. Answers varied widely, but some lacked proper justification and the reasons identified were not distinct.
Value of combined firm is often greater than the sum of the individual firms' value Basing the acquisition price on PV of Snappy's future earnings ignores the value of control and synergies. If cash flows of Darwin and Snappy are less than perfectly correlated, the combined CFs will be less variable than the CFs of the individual firms. This decreased variability can result in an increase in debt capacity and in the value of the combined firm. Success of vertical integration strategy is uncertain. Purchasing Snappy may not bring intended added value
(e) Describe two issues in Snappy’s financials to support Darwin’s concern.
Commentary on Question: Very few candidates received full credit for this part of the question. The question explicitly asks for issues that can be seen in Snappy’s financials. Descriptions of M-scores and mentioning that the M-score is low did not receive credit as it does not provide reasonings for why the financials look suspicious.

CFE FD Spring 2020 Solutions Page 14
3. Continued
Premiums seem manipulated in the past to get specific outcomes. Premiums in 2017 is significantly less than in 2016. However, sales expenses expense do not appear consistent with this pattern. Premium growth is not consistent with decreasing cash position and the reserves.

CFE FD Spring 2020 Solutions Page 15
4. Learning Objectives: 5. The candidate will understand advanced techniques to evaluate and manage non-
hedgeable risks in financial and non-financial organizations. Learning Outcomes: (5c) Evaluate the efficacy of different approaches to managing non-hedgeable risks,
including risk capital positions, operational risk management practices, risk mitigation and transfer strategies.
(5d) Assess drawbacks and other costs to risk transfer solutions versus other internal
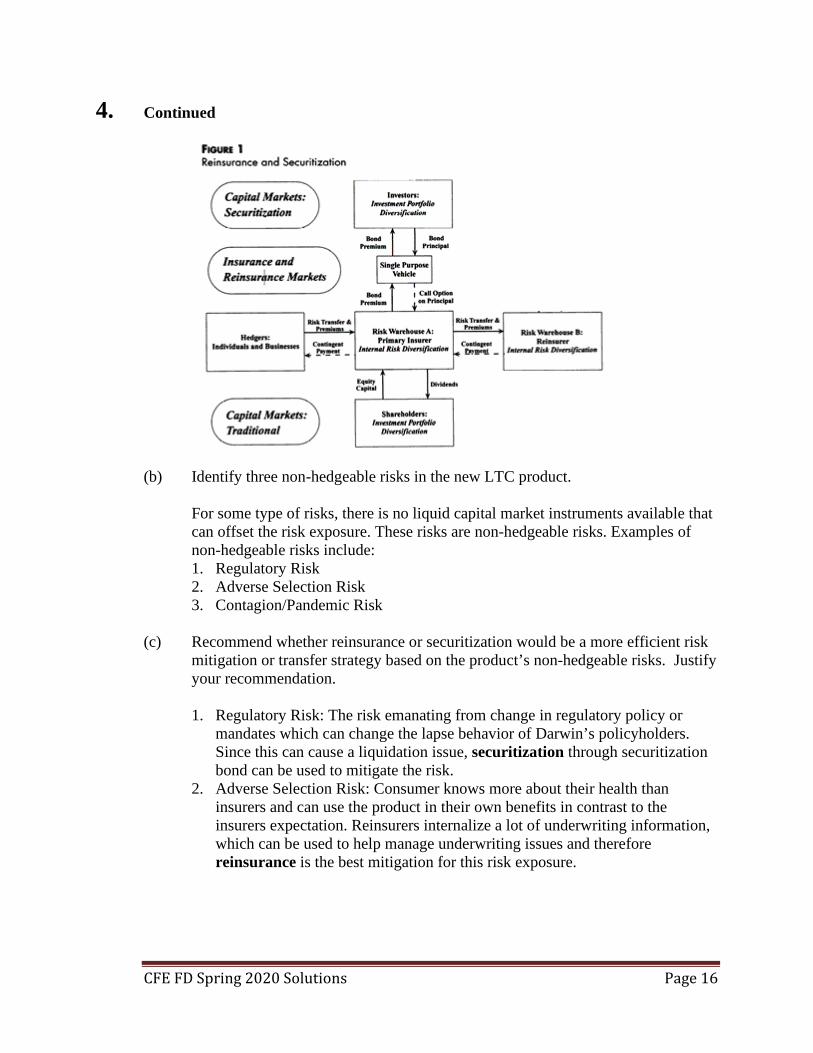
risk management approaches for non-hedgeable risks. Sources: F-113-14 Trainer & Cummins, Securitization, Insurance, and Reinsurance F-145-19 Romanosky et al., Content Analysis of Cyber Insurance Policies: How Do Carriers Write Policies and Price Cyber Risk? Case Study Commentary on Question: Candidates performed satisfactorily on this question. For part (a), candidates didn’t get the necessary details to get full credit. Some candidates split the flow chart into several components and received full credit. Solution: (a) Sketch a risk transfer and diversification flow-chart of the insurance, reinsurance,
and securitization markets from Darwin’s perspective.
CFE FD Spring 2020 Solutions Page 16
4. Continued
(b) Identify three non-hedgeable risks in the new LTC product.
For some type of risks, there is no liquid capital market instruments available that can offset the risk exposure. These risks are non-hedgeable risks. Examples of non-hedgeable risks include: 1. Regulatory Risk 2. Adverse Selection Risk 3. Contagion/Pandemic Risk
(c) Recommend whether reinsurance or securitization would be a more efficient risk
mitigation or transfer strategy based on the product’s non-hedgeable risks. Justify your recommendation. 1. Regulatory Risk: The risk emanating from change in regulatory policy or
mandates which can change the lapse behavior of Darwin’s policyholders. Since this can cause a liquidation issue, securitization through securitization bond can be used to mitigate the risk.
2. Adverse Selection Risk: Consumer knows more about their health than insurers and can use the product in their own benefits in contrast to the insurers expectation. Reinsurers internalize a lot of underwriting information, which can be used to help manage underwriting issues and therefore reinsurance is the best mitigation for this risk exposure.
CFE FD Spring 2020 Solutions Page 17
4. Continued
3. Contagion/Pandemic Risk: Large scale pandemic drives huge change in consumption of benefits. These are tail type events and difficult to price in the product and still be competitive. Large scale event likely to consume all capital in both insurance and reinsurance market. Securities market which is mostly uncorrelated with pandemic exposures can be a better option. Hence securitization should be used to mitigate this risk.
(d) Compare and contrast reducing data breach exposure through strengthening
Darwin’s IT security or purchasing a cyber insurance policy.
Cyber Insurance can mitigate financial exposures due to data breach incidents. However Cyber Insurance usually has many exclusions such as criminal, fraudulent/dishonest acts, errors or omissions, and intentional violation of laws. Moreover, the reputational risk due to data breach incidents are not mitigated by adding cyber insurance. Darwin has entered in the LTC market through acquisition of Cyber LTC and they do not have lot of experience in dealing with privacy laws. Their first step of action should be strengthening their IT systems, build a policy around data security and develop the IT security process as one of their core strengths. As they get more experience, they might consider cyber insurance for certain exposures (if justified by cost-benefit analysis).
CFE FD Spring 2020 Solutions Page 18
5. Learning Objectives: 1. The candidate will understand how a company optimizes its corporate finance
decisions based on its business objectives. 5. The candidate will understand advanced techniques to evaluate and manage non-
hedgeable risks in financial and non-financial organizations. Learning Outcomes: (1d) Assess the impact of business strategies such as acquisitions, divestitures, and/or
restructurings. (5a) Apply frameworks or methods to evaluate non-hedgeable risks for both financial
and non-financial organizations. (5b) Assess strengths and biases of techniques to measure risks given limited
information for a range of business situations. (5c) Evaluate the efficacy of different approaches to managing non-hedgeable risks,
including risk capital positions, operational risk management practices, risk mitigation and transfer strategies.
(5d) Assess drawbacks and other costs to risk transfer solutions versus other internal
risk management approaches for non-hedgeable risks. Sources: Jonathan Berk and Peter Demarzo, Corporate Finance, Fourth Edition, Ch 28: M&A (pages 962-978) F-144-19 Harvard Kennedy School of Government, Walmart's Response to Hurricane Katrina: Striving for a Public-Private Partnership Hubbard, How to Measure Anything, Ch 9 Hubbard, How to Measure Anything, Ch 14 Commentary on Question: Commentary listed underneath question component. Solution: (a) The mayor of Moose Hoof issues the following statement:
“Relief efforts are underway, but we have no idea how much the relief will cost. There’s no way to even estimate that.”
Critique the mayor’s statement.
CFE FD Spring 2020 Solutions Page 19
5. Continued Commentary on Question: Most candidates were able to state that the mayor’s statement is wrong. However, candidates struggled to present and explain steps needed to reduce uncertainty. The mayor’s statement is incorrect. Once initial research is done and the problem is defined, estimates can be calibrated using confidence intervals and probability distributions. Anything can be measured. You can then calculate if more information and/or further calibration is needed until you get comfortable enough with the estimate.
(b) Describe the steps to estimate the cost of the recovery effort from SEA’s
perspective.
Commentary on Question: Successful candidates were able to identify the steps from Applied Information Economics that were relevant to SEA and Moose Hoof disaster. 1. Conduct initial research and identify experts
• CEO of SEA, • Pilots, • Mechanics, • Weather experts, etc.
2. There probably isn’t enough time for calibration workshops. 3. Define the problem: how much is it going to cost to help? 4. Break down the problem into multiple parts:
• How many flights do we need daily? • How much will that cost in fuel and employee hours? 5. Calibrate the estimates
6. Perform VIA analysis to determine uncertainty in our estimates. 7. Run Monte Carlo simulations on the estimates to develop a total estimate for
the cost of assisting 8. Use the results in an updated decision model for a final estimate of the range
of cost. (c) Determine whether SEA would assist given the data above and Otterwein’s
budget. Justify your response. Commentary on Question: Candidates did well and could answer either using the mathless approach or t-statistic method to receive credit.
CFE FD Spring 2020 Solutions Page 20
5. Continued
According to the Mathless method, for 8 observations, the bounds for a 90% CI of the median are the 2nd smallest and 2nd largest. Since the CEO is asking for 95% confidence, this is equivalent to the upper bound of the 90% CI 90% CI upper bound = $900K, which is lower than CEO’s $1.0m budget. Thus, SEA can assist.
(d) Describe three reasons why SEA would consider assisting at a higher amount than
its original budget. Commentary on Question: Most candidates received partial credits for general justification such reputation benefits and goodwill. To receive full credit, candidates explained how these reasons are relevant to SEA’s operations and in the environment it operates.
1. Reputation benefit to gain clients in a highly competitive industry 2. Gain of goodwill from government so they are less likely to impose
restrictions 3. Additional training for pilots in SEA’s pilot school, so they can graduate
sooner once reaching a certain number of hours (e) Gilroy Clyde, RPPC’s CEO, would like RPPC’s subsidiaries to assist SEA’s
Moose Hoof recovery. In a memo to the Board of Directors explaining his desire to get involved in the recovery effort, Clyde states: “Involvement with SEA will provide valuable insight into the company’s operations for potential acquisition purposes.” Evaluate Clyde’s statement. Commentary on Question: Most candidates failed to give concrete examples of potential synergies between SEA and RPPC.
Clyde is correct. This creates a good opportunity to identify synergies between SEA and current RPPC businesses. RPPC can evaluate if there are economies of scale with BJA or diversification benefits through new routes and a different customer base.
CFE FD Spring 2020 Solutions Page 21
5. Continued (f)
(i) Identify three functions of RPPC companies that could be useful in reducing the risk of failure of the recovery effort.
(ii) Describe how each function in (i) could improve the likelihood of success of the recovery effort.
Commentary on Question: Candidates did poorly and fail to provide specific tasks that can help in the recovery effort. Generic responses such as “Frenz can provide coffee for calories” received no credit.
1. Big Ben can provide small business loans, which can get necessary companies
up and running 2. Blue Jay Air can assist in flight logistics, so SEA can focus solely on flying. 3. Frenz can offer its global supply chain network to bring needed materials
quickly
CFE FD Spring 2020 Solutions Page 22
6. Learning Objectives: 1. The candidate will understand how a company optimizes its corporate finance
decisions based on its business objectives. Learning Outcomes: (1a) Recommend an optimal capital structure for given business objectives and the
competitive environment. (1b) Compare and contrast methods to determine the value of a business or project,
including the impact on capital budgeting and allocation decisions. (1d) Assess the impact of business strategies such as acquisitions, divestitures, and/or
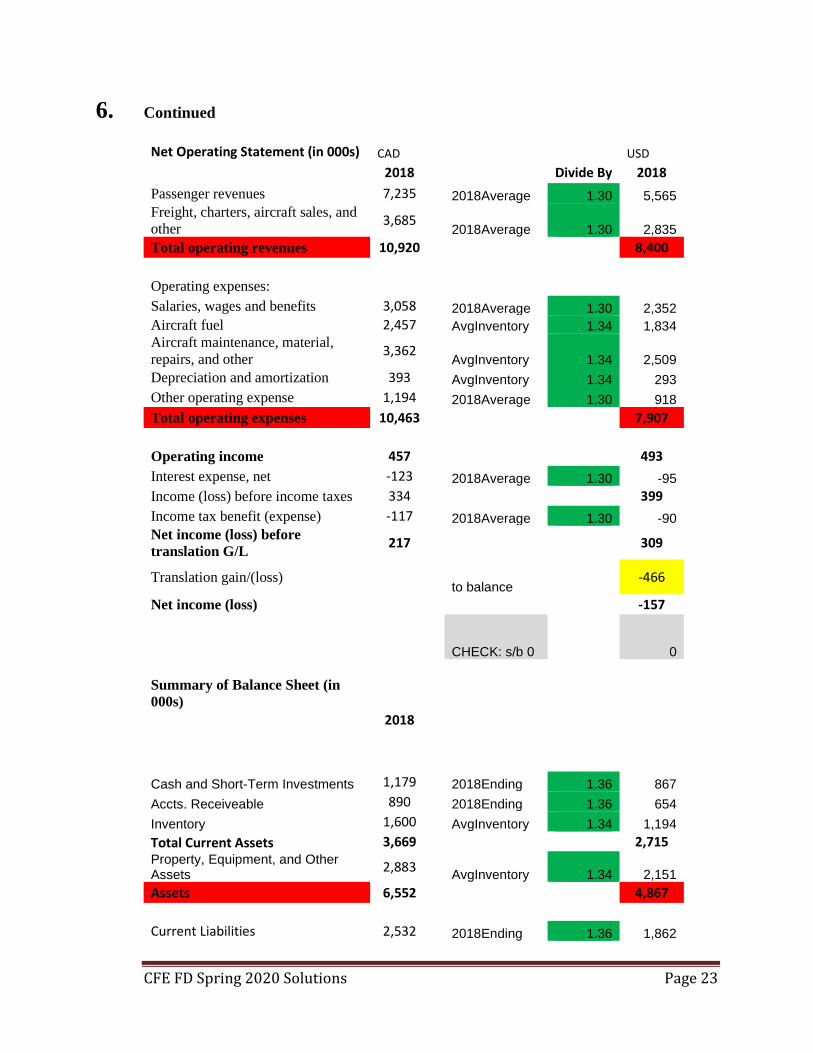
restructurings. Sources: Robinson et al., International Financial Statement Analysis, Ch. 16 Multinational Operations Robinson et al., International Financial Statement Analysis, Ch. 16 Multinational Operations Commentary on Question: Overall, candidates may have found the first part of this question to be lengthy as they made several mistakes. Very few candidates seemed to fully master this material. Solution: (a) Calculate items (A)-(AE) in the following 2018 Net Operating Statement and
Summary of Balance Sheet for SEA if SEA is acquired by BJA with USD as SEA’s functional currency. Show your work.
Commentary on Question: Most candidates made the same mistake by multiplying by the exchange rate instead of dividing. Most candidates were not able to calculate the translated post-acquisition equity, the translation adjustment, or the retained earnings and equity
CFE FD Spring 2020 Solutions Page 23
6. Continued
Net Operating Statement (in 000s) CAD USD 2018
Divide By 2018 Passenger revenues 7,235 2018Average 1.30 5,565 Freight, charters, aircraft sales, and other 3,685
2018Average 1.30 2,835 Total operating revenues 10,920
8,400
Operating expenses:
Salaries, wages and benefits 3,058 2018Average 1.30 2,352 Aircraft fuel 2,457 AvgInventory 1.34 1,834 Aircraft maintenance, material, repairs, and other 3,362
AvgInventory 1.34 2,509 Depreciation and amortization 393 AvgInventory 1.34 293 Other operating expense 1,194 2018Average 1.30 918 Total operating expenses 10,463
7,907
Operating income 457
493 Interest expense, net -123 2018Average 1.30 -95 Income (loss) before income taxes 334
399
Income tax benefit (expense) -117 2018Average 1.30 -90 Net income (loss) before translation G/L 217
309
Translation gain/(loss) to balance
-466
Net income (loss) -157
CHECK: s/b 0 0
Summary of Balance Sheet (in 000s)
2018
Cash and Short-Term Investments 1,179 2018Ending 1.36 867 Accts. Receiveable 890 2018Ending 1.36 654 Inventory 1,600 AvgInventory 1.34 1,194 Total Current Assets 3,669
2,715 Property, Equipment, and Other Assets 2,883
AvgInventory 1.34 2,151 Assets 6,552
4,867
Current Liabilities 2,532 2018Ending 1.36 1,862
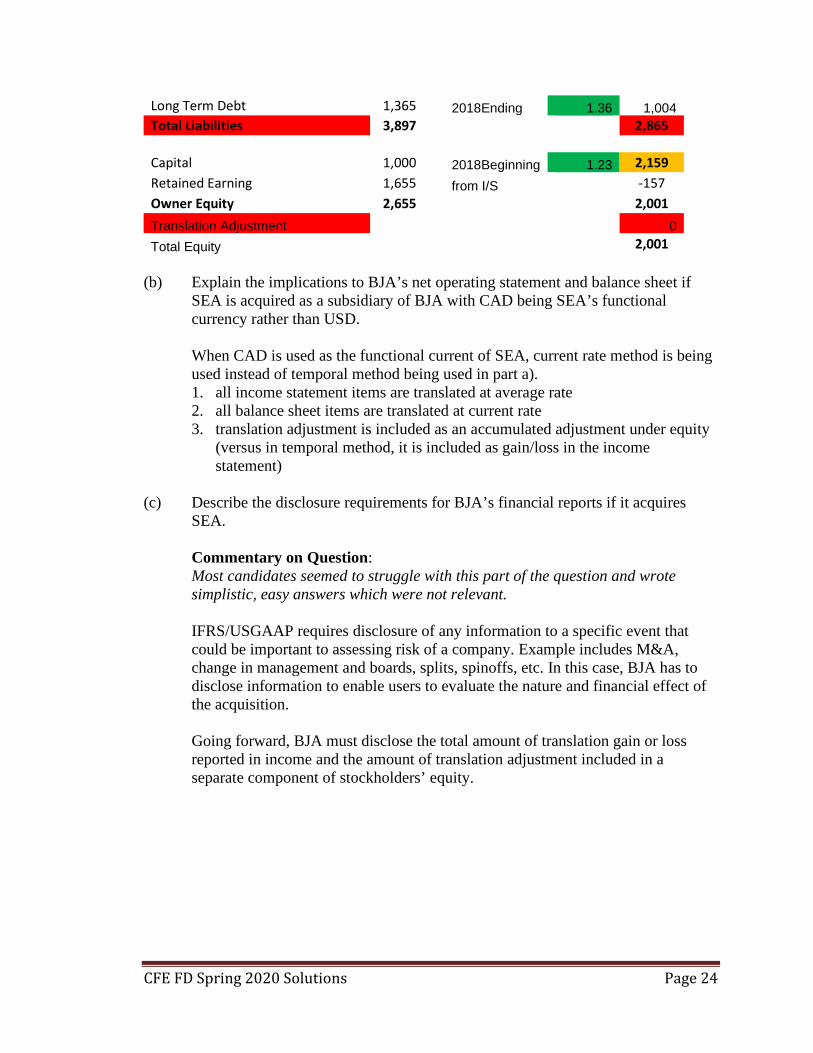
CFE FD Spring 2020 Solutions Page 24
Long Term Debt 1,365 2018Ending 1.36 1,004 Total Liabilities 3,897
2,865
Capital 1,000 2018Beginning 1.23 2,159 Retained Earning 1,655 from I/S -157 Owner Equity 2,655
2,001 Translation Adjustment 0 Total Equity 2,001
(b) Explain the implications to BJA’s net operating statement and balance sheet if
SEA is acquired as a subsidiary of BJA with CAD being SEA’s functional currency rather than USD.
When CAD is used as the functional current of SEA, current rate method is being used instead of temporal method being used in part a). 1. all income statement items are translated at average rate 2. all balance sheet items are translated at current rate 3. translation adjustment is included as an accumulated adjustment under equity
(versus in temporal method, it is included as gain/loss in the income statement)
(c) Describe the disclosure requirements for BJA’s financial reports if it acquires
SEA.
Commentary on Question: Most candidates seemed to struggle with this part of the question and wrote simplistic, easy answers which were not relevant.
IFRS/USGAAP requires disclosure of any information to a specific event that could be important to assessing risk of a company. Example includes M&A, change in management and boards, splits, spinoffs, etc. In this case, BJA has to disclose information to enable users to evaluate the nature and financial effect of the acquisition. Going forward, BJA must disclose the total amount of translation gain or loss reported in income and the amount of translation adjustment included in a separate component of stockholders’ equity.
CFE FD Spring 2020 Solutions Page 25
7. Learning Objectives: 4. The candidate will understand the application of quantitative methods with a risk
management focus to business problems. Learning Outcomes: (4a) Assess methods and processes for quantifying and managing risk within any
business enterprise. (i) Evaluate method and model tradeoffs between usefulness, resource
constraints, timeliness, fidelity, and accuracy (ii) Evaluate processes for vetting models
(4c) Evaluate the impact of risk mitigation methods including risk hedging and
insurance. Sources: Dowd Chapter 15 – Backtesting Market Risk Models F-141-19 Empirical Evaluation of Selected Hedging Strategies for Cattle Feeders Commentary on Question: This question was trying to test candidate’s ability to interpret backtesting results and to implement the appropriate test method. Candidates were also expected to explain potential issues from empirical evaluation of a hedge program. Solution: (a) Evaluate the backtesting results of each of the two hedge approaches
independently and in comparison to each other. Commentary on Question: Most candidates were able to explain the differences in the number of exceedance and volatility between the 2 approaches and conclude that the selective approach is more effective. Daily Rebalancing: • VaR should be symmetric, but the number of negative exceptions is more than
the positive in the current model indicating that the risk measures might be biased.
• Exceptions tend to cluster in the second third of time. • The large number of extreme observations indicating the risk measures are
probably too low for the current model. Selective Rebalancing: • Exceptions continue to cluster in the second third of time. • Both upper and lower bounds exhibits flatness and smoothness implying the
risk measure might not be updated sufficiently quickly.
CFE FD Spring 2020 Solutions Page 26
7. Continued Comparison: • Selective approach shows less volatility, indicating that it is a more effective
hedging program. • The range of higher and lower risk bound is narrower for selective approach. • The magnitude of large losses lying below the lower risk bound is reduced for
the selective approach. (b)
(i) Recommend one of the above test methods (A-C) to perform using the information above. Justify your recommendation.
(ii) Determine if the model is accepted or rejected at the 1% level for each hedge approach (I-II) based on your recommended test method in (i). Justify your response.
Commentary on Question: (i) Majority of the candidates were able to recommend binomial test with
appropriate justification. The best candidates were able to describe the other two tests.
(ii) Almost all candidates were able to set up the hypothesis testing paradigm, but not every candidate reached the correct conclusion.
(i) Binomial approach is recommended, as frequency is the major concern
and information provided can only justify using binomial. Rosenblatt approach focuses on the side of the exceedances and require assumptions about the P/L distribution such as mean and variance. Berkowitz approach convers a uniform series into a standard normal series, which enables us to test model adequacy through test of standard normality.
(ii) Daily rebalancing: H0: P = 0.01 H1: P > 0.01 Pr (x>17) = 1- 96.3% = 3.7% H0 is accepted
CFE FD Spring 2020 Solutions Page 27
7. Continued Selective rebalancing: H0: P = 0.01 H1: P < 0.01 Pr (x<=7) = 0.85% H0 is rejected
(c) Explain two issues with the hedge approaches that may not be apparent from the backtesting results.
Commentary on Question: Only a few candidates were able to identify issues such as basis risk, policyholder behavior risk and length of the economic horizon covered.
The backtest period does not cover different economic conditions. Hedge program results may not cover the full economic cycle with more extreme events which may impact the results. There exists basis risk since the number of future contract price is generally rounded to the nearest contract unit. Other transaction cost such as bid/ask spread, trading volume, brokerage fees, market depth will also affect the actual profit and losses.
CFE FD Spring 2020 Solutions Page 28
8. Learning Objectives: 2. The candidate will understand how to gauge a company’s performance through an
evaluation of its financial reports. Learning Outcomes: (2a) Analyze the interrelationships between the income statement, cash flow
statement, and balance sheet, in order to measure a corporation’s financial performance.
(2b) Identify and analyze the impact of unusual accounting practices on the quality of
earnings and assets of a corporation, including analyzing the signs of questionable accounting.
Sources: Robinson et al., International Financial Statement Analysis, Ch. 17 Evaluating Quality of Financial Reports Robinson et al., International Financial Statement Analysis, Ch. 7 Financial Analysis Techniques Commentary on Question: Overall candidates answered part (a) reasonably better than rest of the questions. Part (b) response needed full explanation for each sign to earn full score while many simple listed the answers or were not clear or mixed up. Part (c) was poorly responded as many couldn’t simply produce the full formula for Altman Z score or its components. Candidates were expected to apply this formula and analyze. Solution: (a) Outline the general steps to evaluate the quality of financial statements.
The general steps to evaluate the quality of financial statements include the following, however other reasonable answers were accepted. • Develop an understanding of the company and its industry • Consider management • Identify significant accounting areas, management judgements, unusual
accounting rules • Make comparison
o current vs prior, o accounting policies with closest competitors, o perform ratio analysis
• Check for warning signs • Suspect shifting issues/policies for multi-segment/geographic operations • Use of appropriate quantitative tools such as Beneish Model, Altman Z score
CFE FD Spring 2020 Solutions Page 29
8. Continued (b) Identify two warning signs for each of I-III that may indicate if there are
significant concerns.
I. Overstatement of cash flow from operation II. Overstatement of operating income III. Mis-statement of balance sheet items
Commentary on Question: The list below is not exhaustive. Other valid responses were accepted when supported with reasonable justifications. Analysts would apply general steps described in part (a) to obtain a high-level understanding of the company and its industry and management's attitude and company's practice towards financial statement and earning quality. Then, analyst would compare company's financial statements, disclosures, accounting policies vertically (among companies within the industry) and horizontally (across reporting periods) to identify any anomalies in the target's financial statement. Any trends, positive and negative, should be investigated and appropriate reason should be given. The following warning signs would indicate further review of financials, though at times these can happen based on company's business situation. As a financial analyst you would pay attention to these signs carefully: Overstatement of CF from operation can be observed from the following: 1. Increased by deferring payments on payables in accounts payable 2. Accelerating payments from customers 3. Deferring purchases of inventory 4. Deferring other expenditures related to operations, such as maintenance and
research 5. Showing Sales of certain items and leaseback them to inflate the CF 6. Management may be motivated to classify activities as operating activities to
overstate company's ability to generate cash form it's operation. Management may capitalize rather than expense operating expenditures to classify it as investing activity.
1-4 attempts to manage company's activity to affect cashflow from operations. 5-6 attempts to misclassify cash flows to positively affect cash flow from operations
CFE FD Spring 2020 Solutions Page 30
8. Continued Overstatement of operating income can be observed from the following: • Growth in Revenue higher than industry/peers - This would seem unusual
unless the company has niche and unique business situation • Higher growth rate in receivables than revenue as receivable should contribute
to revenue • Large proportion of revenue in final quarter of year - This usually happens
where target sales and performance of directors linked revenue growth or stock price. Unusual year-end revenue growth is a warning sign to watch for.
• Cashflow from operations is much lower than operating income which indicates the company overstates income with less operating activities
• Inconsistency of operating income over different time period warns you to review company's financials and operating activities
• Increase in operating margin without appropriate business growth
The following shows high risk of mis-statement of balance sheet items (either overstatement or understatement): • Biased fair value measures for the model/inconsistent model that misstates
income • Current assets (receivable and inventory) included in non-current assets to
inflate asset value and understate liabilities to show profit in current time period
• Assigning high goodwill value compared to assets would overstate asset and equity
• Use of Special purpose vehicle: Which can overshadow operating activities and trick accounting rules to massage balance sheet item
• significant off-balance sheet liabilities (c)
(i) Explain the significance of each component in the Altman’s Z-score formula.
(ii) Interpret the financial health of Tuque based on its Altman’s Z-score. (iii) Hypothesize two reasons for the difference in Tuque’s Altman’s Z-score
and that of the banking industry. (iv) Propose how to validate your hypotheses from (iii).
Commentary on Question: Full formula or each component (with/without scalar co-efficient) of the formula was expected in part (i).
CFE FD Spring 2020 Solutions Page 31
8. Continued
(i) Formula for Altman’s Z score = 2*(Net working capital/Total assets) + 1.4*(Retained earnings/Total assets) +3.3*(EBIT/Total assets) +0.6*(Market value of equity/Book value of liabilities) + 1.0*(Sales/Total Assets) The ratios in the model reflects: • Liquidity = Net working capital/Total assets. Measures liquid assets in
relation to the size of the company. • Accumulated Profitability and relative age = Retained earnings/Total assets.
Measures profitability that reflects the company's age and earning power. • Profitability = EBIT/Total assets. Measures operating efficiency and
recognizes operating earnings for long-term viability of the company. • Leverage or Solvency indicator = Market value of equity/Book value of
liabilities. Measures market dimension that can show up security price fluctuation as a possible red flag
• Activity or ability to generate sales = Sales/Total Assets. Standard measure for total asset turnover (varies greatly from industry to industry).
(ii) Altman’s Z - Score less than 1.81 indicates high probability of bankruptcy. The industry has experienced decreasing score while the company's score is increasing over time. It may indicate weakening financial strength of the industry (declining industry) while the company is performing better. (iii) Commentary on Question: Valid response included but not limited to: company has gain competitive advantages through operational efficiencies, monopoly within region / country; successfully break through a market or invent new product that produce high margin; divest unprofitable business; government support; or simply Altman Z-score fails in this particular case. The following describes several possible answers: • Company is investing in higher margin business with little competition or
moving away the traditional industry business (example Apple Inc. from laptop to iPod or iPhone)
• Company has developed certain competitive advantages against their competitors
• Company has successfully divested the unprofitable business (a large component of the Altman Z-score is “Total Asset”)
• Altman Z score may not cover certain area of the company’s financial strength
CFE FD Spring 2020 Solutions Page 32
8. Continued
(iv) Commentary on Question Response should be intuitive and supported by reasonable justifications. Sample responses are provided below for reasons provided in (iii) above. • The company's profit margin should increase due to improved margins. In
company's MD&A should also have descriptions on what has happened to company's profile over the last few years.
• The company's profit margin should increase due to improved margins. In company's MD&A should also have descriptions on what has happened to company's profile over the last few years. This could either be improved revenue, decreased expense, etc. and the story should tie to the financial statement.
• Investigate company's total asset versus its profitability and liability over time. You should able to see those numbers going opposite directions. This does not necessarily mean, however, an improved company's prospect.
• Use other quantitative methods to confirm your observation is consistent with your thought. Altman Z-score ultimately is a model to test solvency of a company and hence, may not cover every aspect of a company
(d)
(i) Explain two drawbacks of the Altman’s Z-Score.
(ii) Describe two alternative credit ratios to supplement the Altman’s Z-score for credit analysis.
Commentary on Question: Following are some of the drawbacks. Other valid reasons were accepted.
(i)
• It uses only one set of financial measures • Taken at one point in time • Measures past performance • Incorporate going-concern assumption • Doesn’t detect one that might be failing • Doesn’t work for new/start-ups as earnings too low initially • Doesn’t consider cashflow situation
CFE FD Spring 2020 Solutions Page 33
8. Continued (ii) Following are few examples of alternative credit ratios
• EBIT Interest Coverage: EBIT over Gross Interest (prior to deductions for capitalized interest or interest income): It is used to determine how easily a company can pay their interest expenses on outstanding debt.
• EBITDA Interest Coverage: EBITDA (earnings before interest, tax, depreciation, and amortization) over Gross Interest (prior to deductions for capitalized interest or interest income): Similar to above
• FFO Interest Coverage: [Funds from operation (FFO) plus interest paid less operating lease adjustments] over Gross Interest (prior to deductions for capitalized interest or interest income): Similar to above
• Return on Capital: EBIT over average capital (where capital = equity plus non-current deferred taxes plus debt): How well a company is using its money to generate returns
• FFO to Debt: FFO to Total Debt: The ability of a company to pay off its debt using net operating income alone
• Free operating cashflow to Debt: Cashflow from operation less capital expenditure over Total Debt: It is used to determine how long it would take a company to repay its debt if it devoted all its cash flow to debt repayment
• Discretionary cashflow to Debt: Cashflow from operation less capital expenditure less dividends paid over Total Debt: Similar to above
• Net cashflow to Capital Expenditure: FFO less dividend over capital expenditure: indicates if a company has sufficient capital to fund operations
• Debt to EBIDTA: Determine a company's ability to pay its debt
CFE FD Spring 2020 Solutions Page 34
9. Learning Objectives: 3. The candidate will understand how to apply and recommend appropriate ERM
framework, principles and strategies to manage, evaluate, analyze and mitigate risk exposures faced by an entity and to ensure operational excellence in any industry.
Learning Outcomes: (3b) Recommend best practices in risk measurement, modeling, and management of
various financial and non-financial risks. (3d) Recommend best practices to achieve operational excellence. Sources: Managing Business Process Flows, Ch. 1 Managing Business Process Flows, Ch. 2 Olsen and Wu, Enterprise Risk Management Models, Ch. 8 pages 105-116 Commentary on Question: Successful candidates were able to explain the rationale of choosing a particular formula and show their work that lead to the ultimate solutions. Solution: (a) Recommend the best location for the coffee shop based on your MER analysis.
Show your work.
Commentary on Question: Candidates may notice that solving for X could yield two different answers. Because of this, graders took different calculations into account. One of the solutions is provided below. Candidates could use different values for X to justify their recommendations. Candidates making a recommendation without showing their work did not receive full credit. Efficiency ratio is to measure the output/input given the constraints. Input for C = 8x2 + 16x + 2.4 -4x2 – 9x + 1.6 = 4(x+1)2
Output for C = x + 8x + 4 + 1 – 4x = 5(x+1) Output / Input = 5/4 * 1/(x+1) From 3 – 8x = 0.4, x = .325 which leads to MER C = .94 From 6x – 1 = .8, x = .3 which leads to MER C = 0.96 Location C has the highest MER so choose location C.
CFE FD Spring 2020 Solutions Page 35
9. Continued
(b) (i) Critique each of the two process architectures described in I-II.
(ii) Recommend which process architecture is better for the coffee shop.
Justify your recommendation.
(i) I is more like a flow shop model which provides consistent quality at low cost, but with limited variety of products
II is more like job shop where the customer enjoys higher variety of options for higher prices. This is higher cost due to requirements of experienced staff. (ii) Architecture II is recommended since the store is targeting high-end
customers. They are more likely to pay more in exchange for higher quality and more varieties.
(c) Explain an advantage and a disadvantage for each of the two performance
measures.
Customer satisfaction directly reflects value to the customer, but is hard to transform to internal process/actions Acid volatility is easy to measure and gives hard numbers to access quality control, but that may not matter to the customer
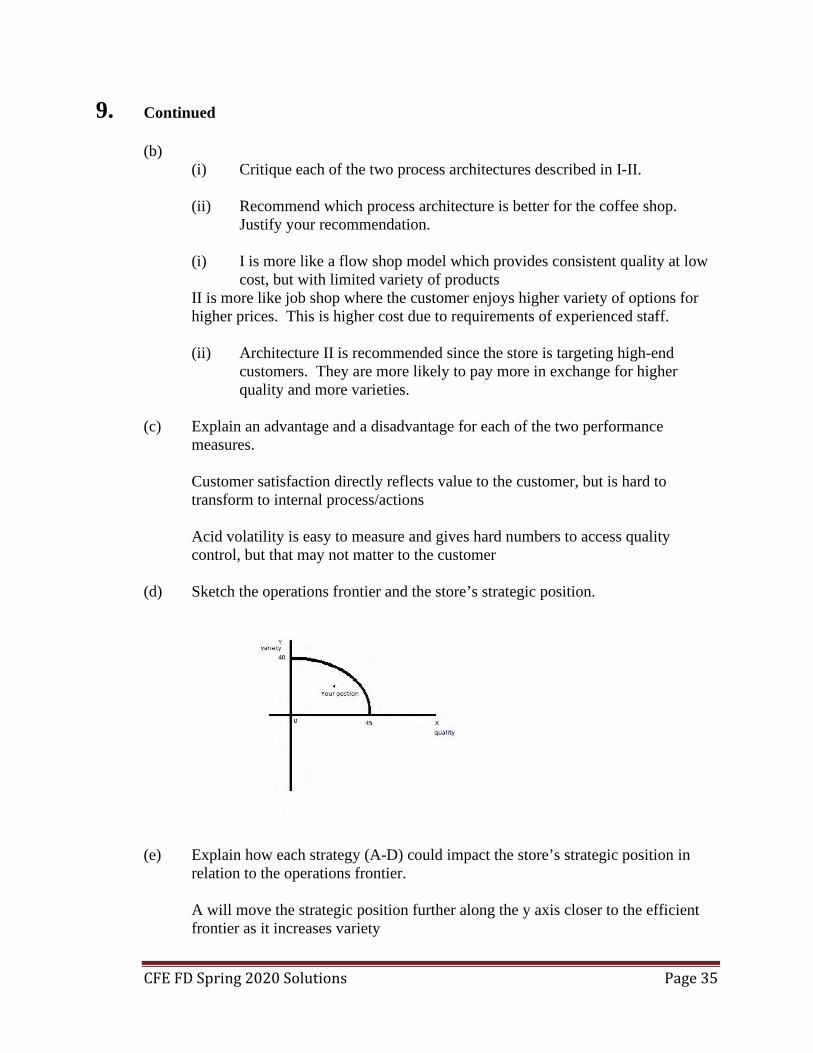
(d) Sketch the operations frontier and the store’s strategic position.
(e) Explain how each strategy (A-D) could impact the store’s strategic position in
relation to the operations frontier.
A will move the strategic position further along the y axis closer to the efficient frontier as it increases variety

CFE FD Spring 2020 Solutions Page 36
9. Continued B may improve quality if it makes the coffee more consistent which would move the point closer to the efficient frontier C may improve quality and variety so it would move the point closer to the efficient frontier D would probably reduce quality, but may increase variety. It would probably move the point away from the efficient frontier, but if the variety increased enough, it could move it towards the efficient frontier.
CFE FD Spring 2020 Solutions Page 37
10. Learning Objectives: 4. The candidate will understand the application of quantitative methods with a risk
management focus to business problems. Learning Outcomes: (4a) Assess methods and processes for quantifying and managing risk within any
business enterprise. (i) Evaluate method and model tradeoffs between usefulness, resource
constraints, timeliness, fidelity, and accuracy (ii) Evaluate processes for vetting models
(4b) Evaluate results of deterministic, stress-testing, stochastic and simulation methods and models.
Sources: Fundamentals of Machine Learning for Predictive Data Analytics, Kelleher, J., 2015, Massachusetts Institute of Technology, Chapter 8: Evaluation Commentary on Question: Commentary listed underneath question component. Solution: (a) Describe the appropriateness of the team’s approach for each of the following
machine learning processes: (i) Hold-out testing
(ii) Profit and loss impact
Commentary on Question: Candidates were expected to comment on the shortfall of the hold-out testing and the resulting impact to the P&L (i) Hold-out Testing cannot be performed because the team trained the
algorithm with the full dataset. For a hold-out test, we take one sample from the overall dataset to train the model and another separate sample to test the model. It would also have been acceptable if candidates answer says to use 3 separate sets: training set / testing set / validation set. The key point is that the data used to evaluate a model should not be the same as the data used to train the model.
CFE FD Spring 2020 Solutions Page 38
10. Continued
(ii) Profit & Loss Impact cannot be estimated because the approach does not take into account the costs of different outcomes. The machine learning approach treats all data points equally (correctly classifying a bond as likely to default is worth the same as correctly classifying a bond as not likely to default), but P/L impact of each outcome varies.
(b) Define the following three performance measures:
(i) Misclassification rate
(ii) True positive rate
(iii) True negative rate
Commentary on Question: Candidates were expected to know:
• True Positive (TP): the number of instances in a test set that have a positive target feature value that were also predicted to have a positive target feature value by the model;
• True Negative (TN): the number of instances in a test set that have a negative target feature value that were also predicted to have a negative target feature value by the model;
• False Negative (FN): the number of instances that have a positive target feature value that were predicted to have a negative target feature value by the model; and
• False Positive (FP): the number of instances that have a negative target feature value that were predicted to have a positive target feature value by the mode.
(i) Misclassification Rate (MR): the number of incorrect predictions made by
the model divided by the total number of predictions made (or MR = (FP +FN)/(TP + TN + FN + FP).
(ii) True Positive Rate (TPR): the number of true positive cases divided by
the sum of true positive case and false negative cases (or TPR = TP/(TP + FN)).
(iii) True Negative Rate (TNR): the number of true negative cases divided by the sum of true negative case and false positive cases (or TNR = TN/(TN + FP)).
CFE FD Spring 2020 Solutions Page 39
10. Continued (c) For each bond portfolio:
(i) Calculate each of the performance measures from (b). Show your work.
(ii) Evaluate the quality of the predictive analytics models based on the
performance measures calculated in (i).
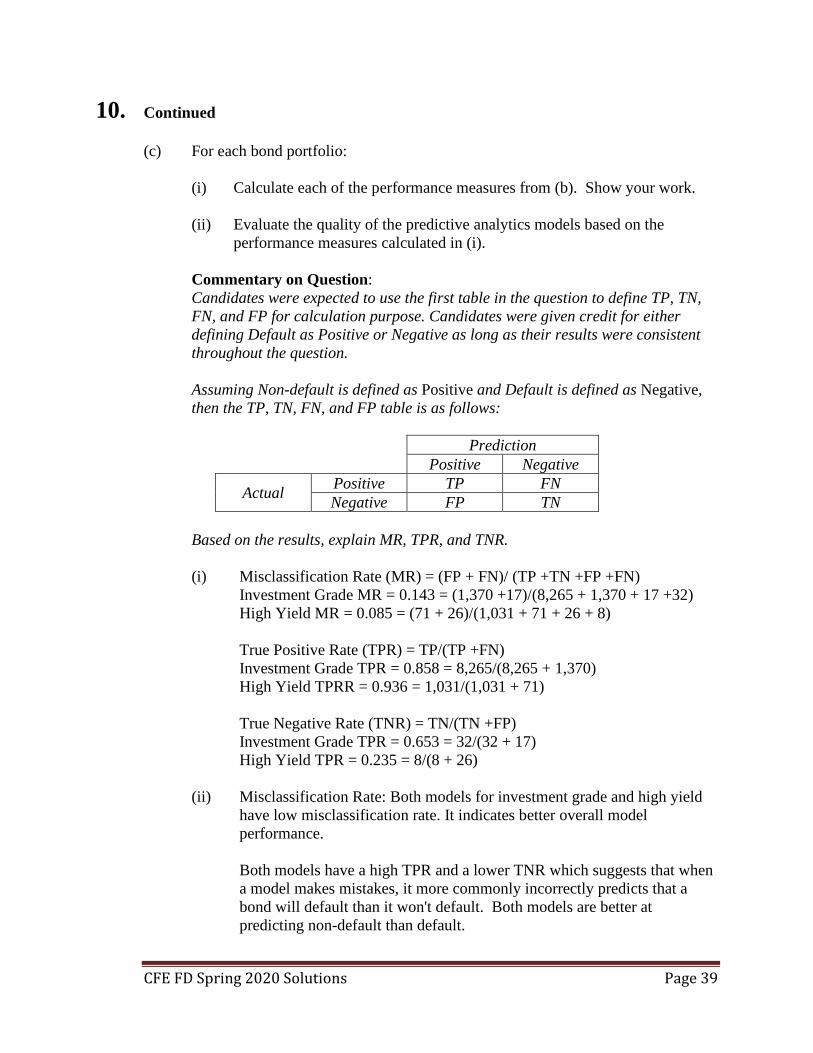
Commentary on Question: Candidates were expected to use the first table in the question to define TP, TN, FN, and FP for calculation purpose. Candidates were given credit for either defining Default as Positive or Negative as long as their results were consistent throughout the question. Assuming Non-default is defined as Positive and Default is defined as Negative, then the TP, TN, FN, and FP table is as follows:
Prediction Positive Negative
Actual Positive TP FN Negative FP TN
Based on the results, explain MR, TPR, and TNR.
(i) Misclassification Rate (MR) = (FP + FN)/ (TP +TN +FP +FN)
Investment Grade MR = 0.143 = (1,370 +17)/(8,265 + 1,370 + 17 +32) High Yield MR = 0.085 = (71 + 26)/(1,031 + 71 + 26 + 8) True Positive Rate (TPR) = TP/(TP +FN) Investment Grade TPR = 0.858 = 8,265/(8,265 + 1,370) High Yield TPRR = 0.936 = 1,031/(1,031 + 71) True Negative Rate (TNR) = TN/(TN +FP) Investment Grade TPR = 0.653 = 32/(32 + 17) High Yield TPR = 0.235 = 8/(8 + 26)
(ii) Misclassification Rate: Both models for investment grade and high yield
have low misclassification rate. It indicates better overall model performance. Both models have a high TPR and a lower TNR which suggests that when a model makes mistakes, it more commonly incorrectly predicts that a bond will default than it won't default. Both models are better at predicting non-default than default.
CFE FD Spring 2020 Solutions Page 40
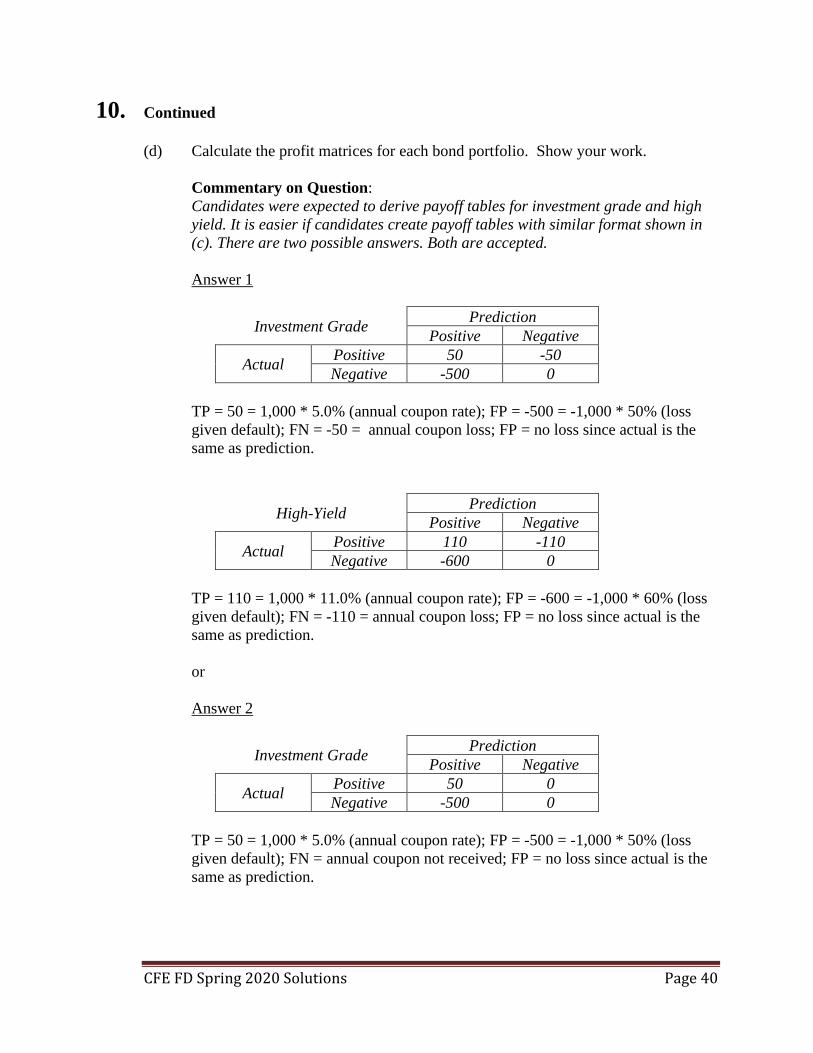
10. Continued (d) Calculate the profit matrices for each bond portfolio. Show your work.
Commentary on Question: Candidates were expected to derive payoff tables for investment grade and high yield. It is easier if candidates create payoff tables with similar format shown in (c). There are two possible answers. Both are accepted.
Answer 1
Investment Grade Prediction Positive Negative
Actual Positive 50 -50 Negative -500 0
TP = 50 = 1,000 * 5.0% (annual coupon rate); FP = -500 = -1,000 * 50% (loss given default); FN = -50 = annual coupon loss; FP = no loss since actual is the same as prediction.
High-Yield Prediction Positive Negative
Actual Positive 110 -110 Negative -600 0
TP = 110 = 1,000 * 11.0% (annual coupon rate); FP = -600 = -1,000 * 60% (loss given default); FN = -110 = annual coupon loss; FP = no loss since actual is the same as prediction. or
Answer 2
Investment Grade Prediction Positive Negative
Actual Positive 50 0 Negative -500 0
TP = 50 = 1,000 * 5.0% (annual coupon rate); FP = -500 = -1,000 * 50% (loss given default); FN = annual coupon not received; FP = no loss since actual is the same as prediction.
CFE FD Spring 2020 Solutions Page 41
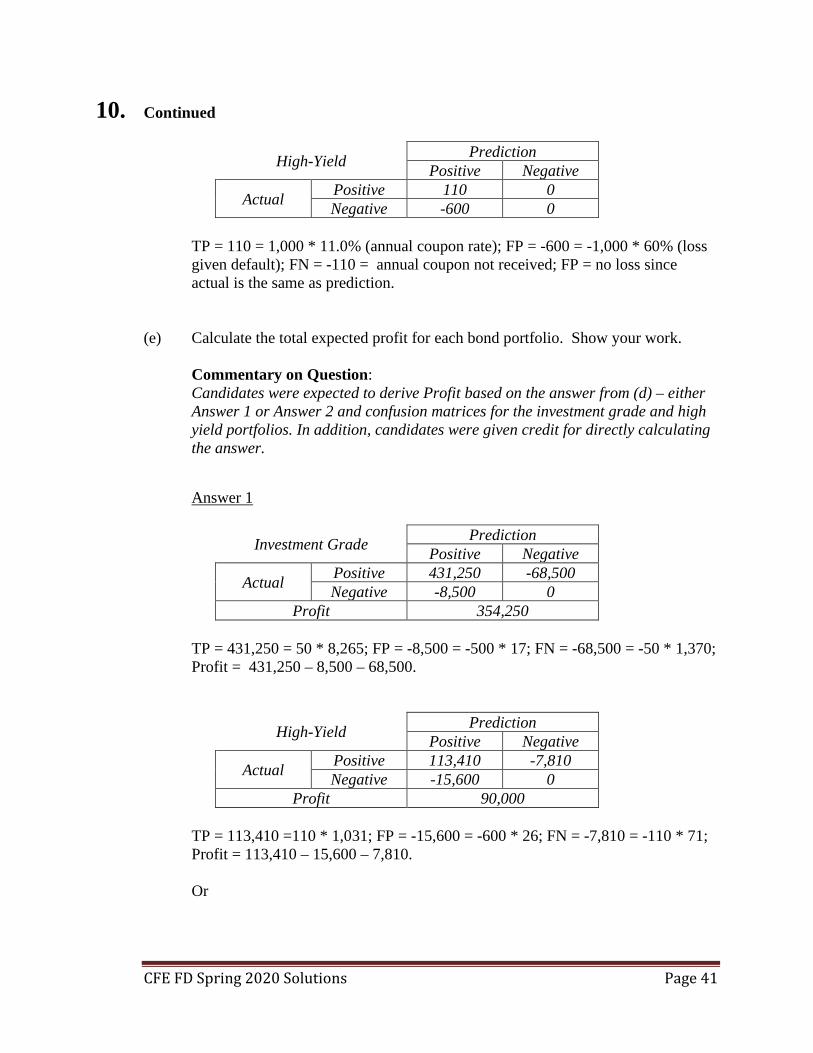
10. Continued
High-Yield Prediction Positive Negative
Actual Positive 110 0 Negative -600 0
TP = 110 = 1,000 * 11.0% (annual coupon rate); FP = -600 = -1,000 * 60% (loss given default); FN = -110 = annual coupon not received; FP = no loss since actual is the same as prediction.
(e) Calculate the total expected profit for each bond portfolio. Show your work.
Commentary on Question: Candidates were expected to derive Profit based on the answer from (d) – either Answer 1 or Answer 2 and confusion matrices for the investment grade and high yield portfolios. In addition, candidates were given credit for directly calculating the answer.
Answer 1
Investment Grade Prediction Positive Negative
Actual Positive 431,250 -68,500 Negative -8,500 0
Profit 354,250 TP = 431,250 = 50 * 8,265; FP = -8,500 = -500 * 17; FN = -68,500 = -50 * 1,370; Profit = 431,250 – 8,500 – 68,500.
High-Yield Prediction Positive Negative
Actual Positive 113,410 -7,810 Negative -15,600 0
Profit 90,000 TP = 113,410 =110 * 1,031; FP = -15,600 = -600 * 26; FN = -7,810 = -110 * 71; Profit = 113,410 – 15,600 – 7,810. Or
CFE FD Spring 2020 Solutions Page 42
10. Continued
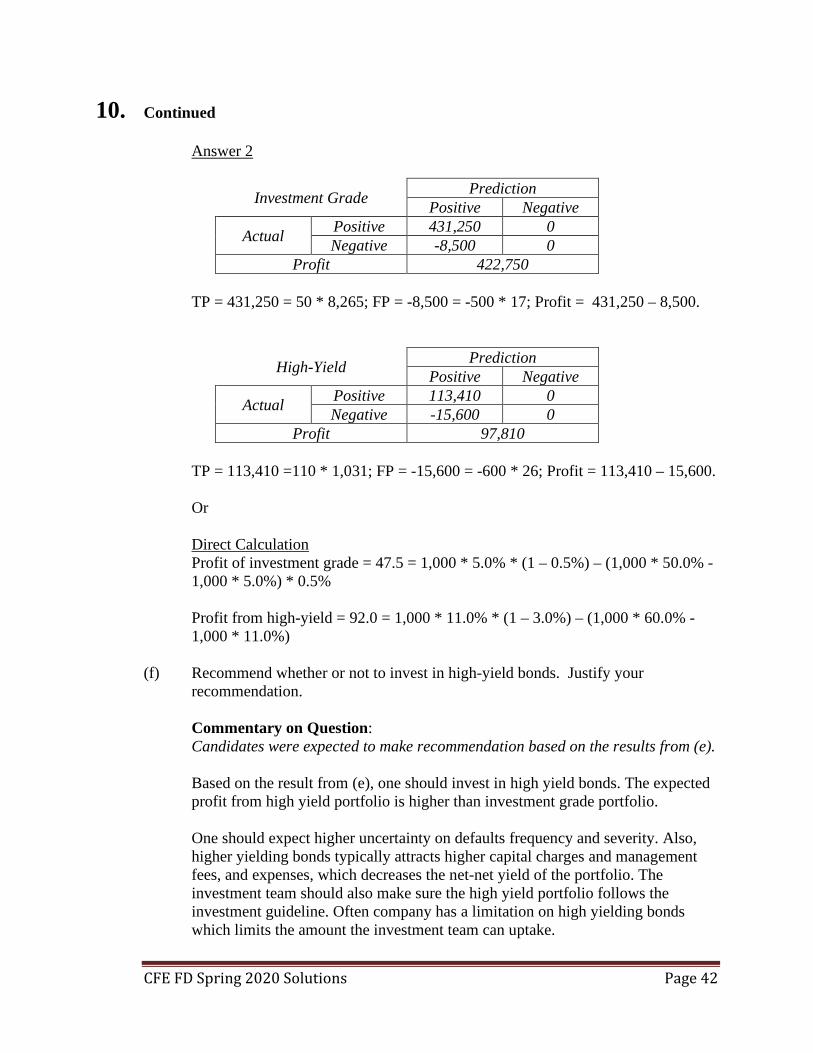
Answer 2
Investment Grade Prediction Positive Negative
Actual Positive 431,250 0 Negative -8,500 0
Profit 422,750 TP = 431,250 = 50 * 8,265; FP = -8,500 = -500 * 17; Profit = 431,250 – 8,500.
High-Yield Prediction Positive Negative
Actual Positive 113,410 0 Negative -15,600 0
Profit 97,810 TP = 113,410 =110 * 1,031; FP = -15,600 = -600 * 26; Profit = 113,410 – 15,600. Or Direct Calculation Profit of investment grade = 47.5 = 1,000 * 5.0% * (1 – 0.5%) – (1,000 * 50.0% - 1,000 * 5.0%) * 0.5% Profit from high-yield = 92.0 = 1,000 * 11.0% * (1 – 3.0%) – (1,000 * 60.0% - 1,000 * 11.0%)
(f) Recommend whether or not to invest in high-yield bonds. Justify your
recommendation.
Commentary on Question: Candidates were expected to make recommendation based on the results from (e).
Based on the result from (e), one should invest in high yield bonds. The expected profit from high yield portfolio is higher than investment grade portfolio. One should expect higher uncertainty on defaults frequency and severity. Also, higher yielding bonds typically attracts higher capital charges and management fees, and expenses, which decreases the net-net yield of the portfolio. The investment team should also make sure the high yield portfolio follows the investment guideline. Often company has a limitation on high yielding bonds which limits the amount the investment team can uptake.
CFE FD Spring 2020 Solutions Page 43
11. Learning Objectives: 4. The candidate will understand how to identify and recommend appropriate model
risk assessment and vetting techniques for risk management models. Learning Outcomes: (4b) Design and evaluate stress-testing and back-testing processes. (4c) Interpret stress-testing and back-testing results. Sources: Olsen and Wu, Enterprise Risk Management Models, Ch. 5 pages 55-73 Olsen and Wu, Enterprise Risk Management Models, Ch. 6 pages 75-86 Olsen and Wu, Enterprise Risk Management Models, Ch. 7 pages 89-103 Commentary on Question: Commentary listed underneath question component. Solution: (a) Compare to the client’s current component vendor, using the simulation results,
recommend an alternative vendor for the Canadian client and support your selection. .
Commentary on Question: This is an open-end question. Credit was given on each of the cost, probability of failure, and probability of being low cost alternative comparison. Then credits were given for a reasonable selection. Candidates generally did very well on this part; and the graders considered various solutions not mentioned below to receive either full or partial credit. China A in this case has the lowest estimated average price, but has a wide expected distribution, maybe driven by exchange rate fluctuation. It also has much higher probability of failure in product compliance than the current vendor; however, it's the lowest price vendor for nearly half of the time. If the cost of failure is reasonable, and XYZ's concern about switching to a new vendor is very cost-driven, China A is a good alternative vendor to consider. A vs current - lower cost but higher failure rate B vs current - lower cost but higher failure rate C vs current - higher potential costs but lower failure rate
CFE FD Spring 2020 Solutions Page 44
11. Continued (b) Evaluate VaR as a risk measure for the CEO’s concerns
Commentary on Question: Candidates were able to explain the shortcomings with VaR measurement; and still quite a few candidates were not able to provide alternatives, like CVaR measurement. This is a very typical method to use in risk measures; and the graders were surprised to see the low mark on this part. VaR is a point estimate. It is only as valid as the assumptions made, which include the distributions used in the model and the parameter estimates. It violates the additive rule as it only considers the extreme percentile of a gain/loss distribution without considering the magnitude of the loss. This makes VaR not a as good candidate for XYZ's situation. Conditional Value-at-risk is a better risk measure in this situation, which represents a weighted average between the value at risk and losses exceeding the value at risk.
(c) Recommend which vendor XYZ should select based on this new information. Justify your recommendation.
Commentary on Question: This is an open ended but must justify and take into account components that can look at such as VaRs, costs, probability of loss, etc. Most candidates were able to score well on this part; and only a handle of candidates didn’t look at the VaR, costs, and probability of loss all together. The candidates that only looked at the cost were not given full credit for the justification. The choice depends on the constraints and objectives of BC. If BC wants to decrease the cost from vendor, it should choose between A, B, and current. Then the particular choice would depend on BC's constraint, for instance, could BC afford to have higher failure rate or have vigorous process to monitor any supply chain break down or back up if failure occurs. If BC wants to increase the quality of the component, it should choose between vendor C or current. Similarly, the particular choice would be constrained by whether BC could afford the higher price. Another consideration includes cost variation (distribution of component cost) and loss given failure. Similar logic applies. It really depends on how BC consider important.
(d) Explain how you would use linear programming to recommend which vendor to select given all of the information and the CFO’s preferences.
CFE FD Spring 2020 Solutions Page 45
11. Continued
Commentary on Question: This part tested candidates’ understanding of the linear programming. The candidates were expected to describe the programming and apply the methodology in CFO’s request. Many candidates didn’t grasp the concept of linear programming and instead referred only to VaR and CVaR. Now that CFO provided a preference, using the logic from part c, one could survey and provide a rating for each category. For instance, CFO is least concerned with average cost; the rating for average cost would be lowest among all other measures. After decision factors are determined and rated, A score will be given on each decision factor to each vendor. The weighted average between the decision factors and the scores would be calculated to derive a score for each vendor.
(e) 1) Expected cost 2) Volatility
3) chance constrain model
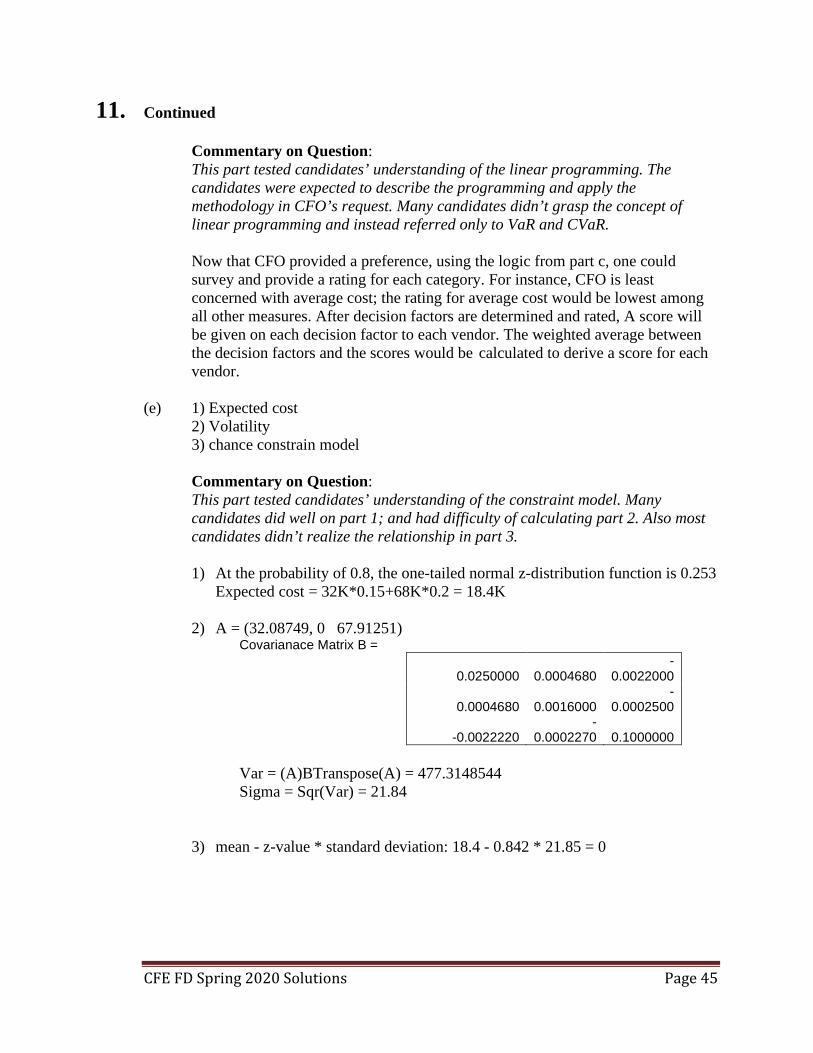
Commentary on Question: This part tested candidates’ understanding of the constraint model. Many candidates did well on part 1; and had difficulty of calculating part 2. Also most candidates didn’t realize the relationship in part 3. 1) At the probability of 0.8, the one-tailed normal z-distribution function is 0.253
Expected cost = 32K*0.15+68K*0.2 = 18.4K 2) A = (32.08749, 0 67.91251)
Covarianace Matrix B =
0.0250000 0.0004680 -
0.0022000
0.0004680 0.0016000 -
0.0002500
-0.0022220 -
0.0002270 0.1000000 Var = (A)BTranspose(A) = 477.3148544 Sigma = Sqr(Var) = 21.84
3) mean - z-value * standard deviation: 18.4 - 0.842 * 21.85 = 0

CFE FD Spring 2020 Solutions Page 46
11. Continued (f) Describe the changes to the following if the new objective is to minimize the
volatility:
(i) InNeed’s vendor budget allocation (ii) Expected profit margin (iii) Volatility of profit margin Commentary on Question: This is to test candidates’ understanding on risk mitigations. Majority of the candidates did well; and a few were either missing one or two of the targets (budget, profit and volatility); or totally missed the whole question. If objective is to minimize volatility, there will be more allocation to Asset B since Asset B has the lowest volatility. There may be allocation to Asset A or C (answer is 58% allocation to Asset B and 41% to Asset C but candidate would not be able to compute the answer because they are not given a computer). Expected profit will decrease because there will be allocation to Asset B, which is a lower return asset. Volatility will decrease because this is our objective.