a-ren at a glance
TRANSCRIPT
R e p o r t a n d A c c o u n t s f o r t h e R E N G r o u p 2 0 0 9
REN - Redes Energéticas Nacionais, SGPS, S.A.
Year 2009
Report and Accounts 2009
Contents | 3
REN at a glance 4
Management report 24
Business activity in 2009 26
Regulation 62
Economic and financial analysis 70
Environment, society and governance (ESG) 80
Human resources 88
Technical infrastructure 94
Outlook for 2010 100
Final remarks 102
Proposal for appropriation of profits 104
Accounts 106
Financial statements 108
Audit reports and statements 204
Extract from minutes of the general meeting of shareholders 216
Energy legislation published in 2009 218
Glossary 222
Contents
REN at a glance
Report and Accounts 2009
REN at a glance | 5
Contents Profile 6
Mission statement, vision and values 7
Strategy 8
Shareholder structure 9
Chairperson’s statement 10
Main indicators 12
Company structure 18
Governing bodies 19
Executive committee - Departmental breakdown 22
6 | REN at a glance
Report and Accounts 2009
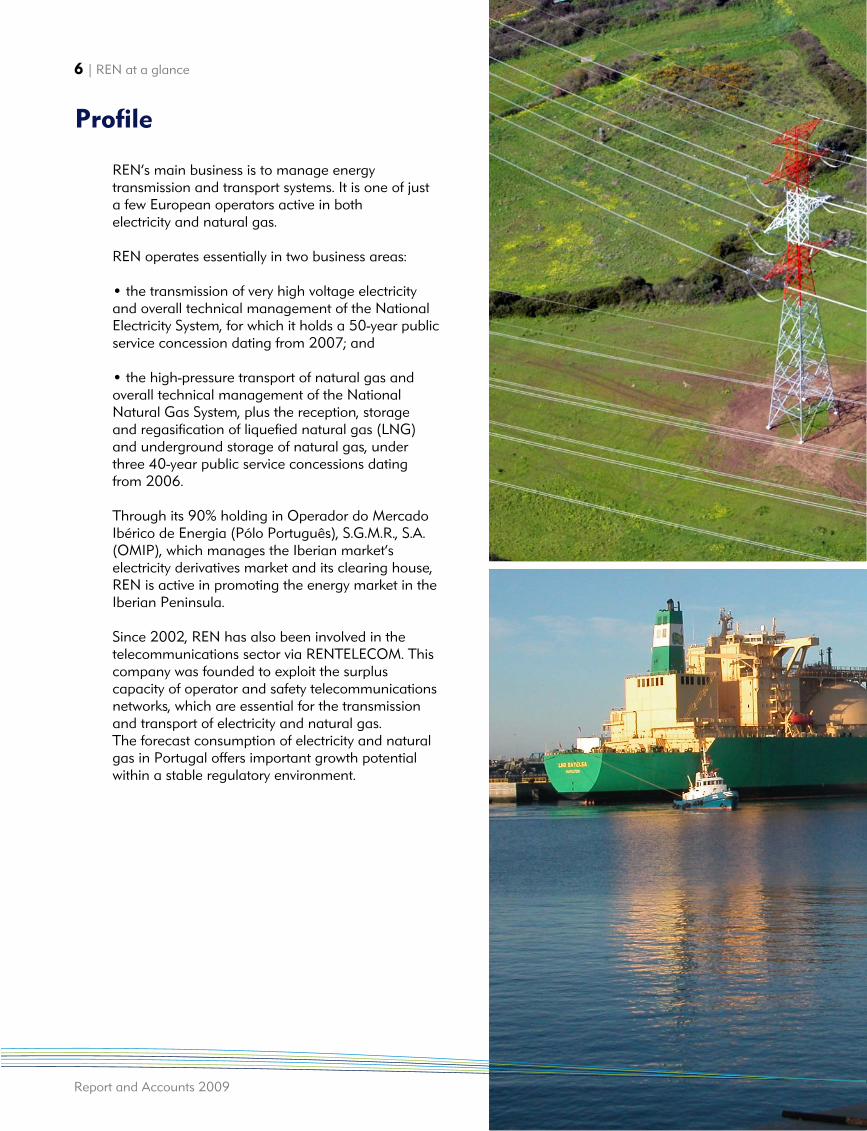
REN’s main business is to manage energytransmission and transport systems. It is one of just a few European operators active in both electricity and natural gas.
REN operates essentially in two business areas:
• the transmission of very high voltage electricityand overall technical management of the NationalElectricity System, for which it holds a 50-year publicservice concession dating from 2007; and
• the high-pressure transport of natural gas andoverall technical management of the NationalNatural Gas System, plus the reception, storage and regasification of liquefied natural gas (LNG)and underground storage of natural gas, underthree 40-year public service concessions dating from 2006.
Through its 90% holding in Operador do MercadoIbérico de Energia (Pólo Português), S.G.M.R., S.A.(OMIP), which manages the Iberian market’selectricity derivatives market and its clearing house,REN is active in promoting the energy market in theIberian Peninsula.
Since 2002, REN has also been involved in thetelecommunications sector via RENTELECOM. Thiscompany was founded to exploit the surpluscapacity of operator and safety telecommunicationsnetworks, which are essential for the transmissionand transport of electricity and natural gas.The forecast consumption of electricity and naturalgas in Portugal offers important growth potentialwithin a stable regulatory environment.
Profile
REN at a glance | 7
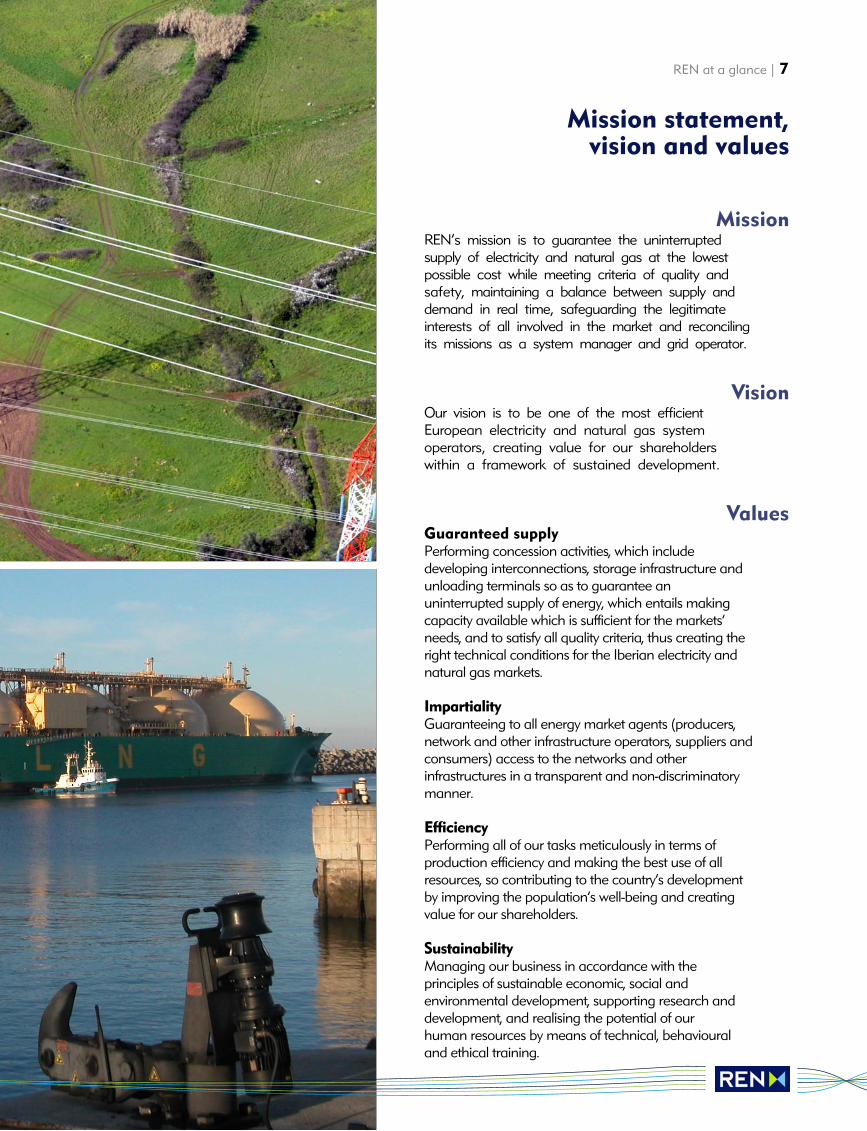
REN’s mission is to guarantee the uninterruptedsupply of electricity and natural gas at the lowestpossible cost while meeting criteria of quality andsafety, maintaining a balance between supply anddemand in real time, safeguarding the legitimateinterests of all involved in the market and reconcilingits missions as a system manager and grid operator.
Our vision is to be one of the most efficientEuropean electricity and natural gas systemoperators, creating value for our shareholderswithin a framework of sustained development.
Guaranteed supplyPerforming concession activities, which includedeveloping interconnections, storage infrastructure andunloading terminals so as to guarantee anuninterrupted supply of energy, which entails makingcapacity available which is sufficient for the markets’needs, and to satisfy all quality criteria, thus creating theright technical conditions for the Iberian electricity andnatural gas markets.
ImpartialityGuaranteeing to all energy market agents (producers,network and other infrastructure operators, suppliers andconsumers) access to the networks and otherinfrastructures in a transparent and non-discriminatorymanner.
EfficiencyPerforming all of our tasks meticulously in terms ofproduction efficiency and making the best use of allresources, so contributing to the country’s developmentby improving the population’s well-being and creatingvalue for our shareholders.
SustainabilityManaging our business in accordance with theprinciples of sustainable economic, social andenvironmental development, supporting research anddevelopment, and realising the potential of our human resources by means of technical, behaviouraland ethical training.
Mission
Vision
Values
Mission statement, vision and values

To fulfil our mission of being one of Europe’s most efficient energy-transport networks, in accordance with our values, REN has drawn up the following strategy:
• to encourage environmental sustainability andresearch and development, taking initiatives that willminimize the impact of our business on theenvironment and which keep us at the technologicalforefront of network management;
• to focus on the main regulated activities inPortugal, developing electricity grids and natural gasnetworks, and preparing them for long-term needs,as well as making the best of our technical know-how;
• to create an integrated energy infrastructure,being a leader in the integration of transmission,transport, storage and management of the electricitygrid and natural gas network infrastructures;
• to improve operating performance and servicequality, with the accent on cost efficiency andimproved network and system safety and reliability;
• to follow an efficient equity policy, optimising ourequity structure and maintaining a solid creditrating; and
• to maximise shareholder earnings, by creatingvalue and maintaining a competitive level ofdividend pay-out.
8 | REN at a glance
Report and Accounts 2009
Strategy
REN at a glance | 9
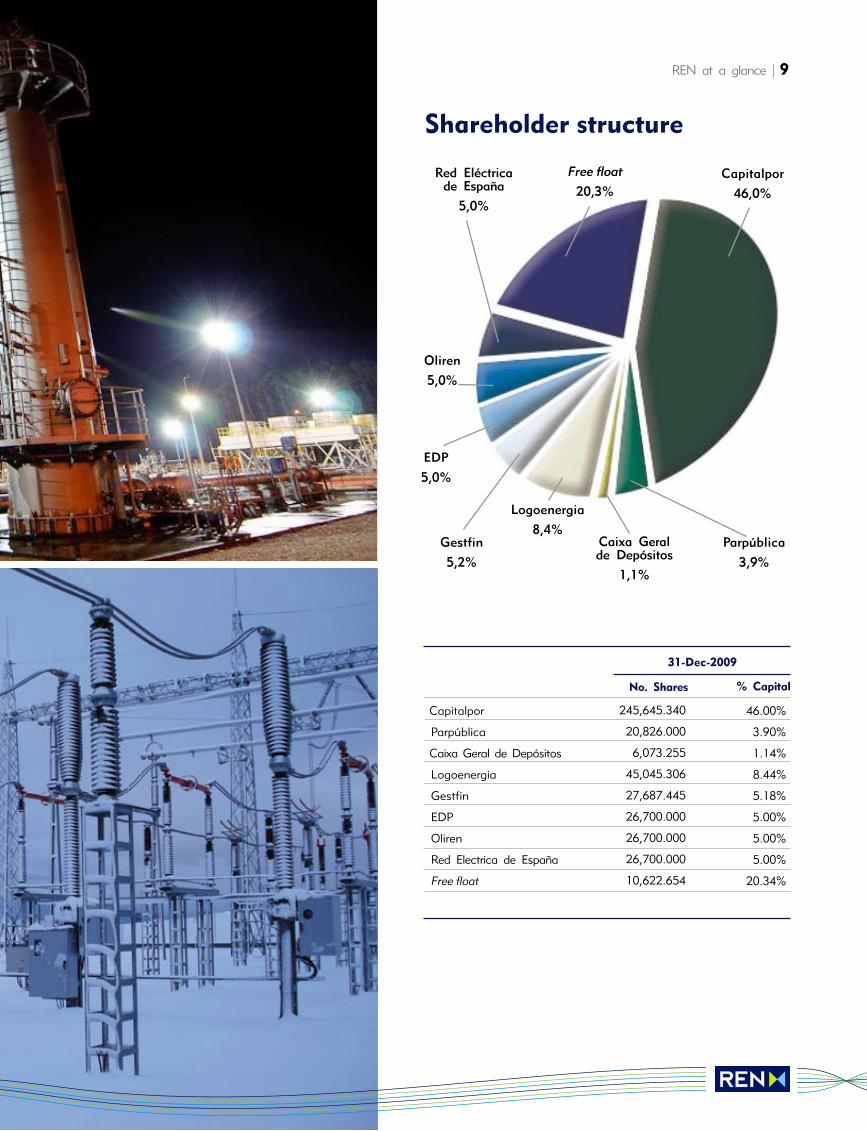
Shareholder structure
Capitalpor46,0%
Parpública3,9%
Free float
20,3%Red Eléctricade España
5,0%
EDP5,0%
Oliren5,0%
Gestfin5,2%
Caixa Geralde Depósitos
1,1%
Logoenergia8,4%
Capitalpor
Parpública
Caixa Geral de Depósitos
Logoenergia
Gestfin
EDP
Oliren
Red Electrica de España
Free float
245,645.340
20,826.000
6,073.255
45,045.306
27,687.445
26,700.000
26,700.000
26,700.000
10,622.654
46.00%
3.90%
1.14%
8.44%
5.18%
5.00%
5.00%
5.00%
20.34%
% CapitalNo. Shares
31-Dec-2009
10 | REN at a glance
Report and Accounts 2009
Portugal has experienced a veritable revolution inthe energy sector in recent years. This upheaval hastaken a number of forms: the separation of theinfrastructures owned by the companies responsiblefor generating or supplying energy, the progressiveprivatisation of the main energy companies, greatercompetition in the electricity and natural gassectors, enhanced by the growing integration of thetwo Iberian markets, and finally Portugal’s leadinginternational position in renewable energies.
This revolution is having a profound impact onREN’s activity. As the company that owns andoperates the electricity transmission and natural gastransport, storage and regasification infrastructures,
it is up to REN to create the right conditions forinterconnecting new electricity generating stationsto the grid and ensure a permanent balancebetween supply and demand and a high degree ofsecurity of supply, even in adverse meteorologicalconditions.
The new profile of electricity generation, in whichrenewable sources represent a growing weight, hasbeen posing new challenges in grid planning andoperation. In very simple terms, the transmissiongrid needs to be more resilient and more“intelligent” to cope with variations in rain and windconditions. This is why a substantial part of REN’sinvestments in electricity have gone towardsdensifying the grid and increasing the amount ofsoftware incorporated in its infrastructure.
On the other hand, the increasingly renewableprofile of our electricity generation facilities means
growing importance for natural gas in the mix offossil fuel sources. Indeed, combined-cycle naturalgas power stations represent the best thermoelectricgeneration technology for offsetting variations inwind power in the event of hydroelectric generationnot being sufficient to do so, which is the case in dryyears. The more important role being played bycombined cycles requires appropriate facilities forreceiving, storing and transporting natural gas, i.e.assets to be built and/or operated by REN.
It was in this scenario that 2009 witnessed thelargest investment in REN’s history and, at the sametime, the best overall quality of service indicator,measured by equivalent interruption time. Thewhole Group made a remarkable effort to meet thechallenges of the national energy strategy and inparticular the incorporation into the grid of anincreasing amount of wind power.
The start-up of new facilities is the main barometerof the company’s growth. And 2009 beat all recordsin this field too, by bringing into operation ?310million in new electricity assets and ?74 million innew natural gas assets.
We completed the construction of around 430 kmof electricity lines and four new substations andswitching stations. These new infrastructures boastcutting-edge technology, such as the acousticinsulation used at some facilities, software fortelecommunications and protection command andcontrol and the installation of around 11 km ofunderground cables to reduce environmentalimpacts in urban and semi-urban areas.
Where natural gas was concerned, we finishedbuilding 19 km of pipelines, established aconnection with the Lares combined-cycle powerstation (Figueira da Foz) and started up the thirdunderground storage cavern at Carriço (Pombal),which increased maximum underground naturalgas storage capacity by 62%. I would like tohighlight the fact that, after almost 10 years,investment in natural gas infrastructures in Portugalis once again substantial, involving the constructionof high pressure pipelines and new storagecapability and the start of work on doubling thecapacity of the Sines LNG terminal.
All these investments are part of the business planannounced in April, on REN’s first Investor’s Day. It’san ambitious plan that shows a group experiencingsustainable growth, concentrating on its corebusiness and focusing fully on the construction and
The whole Group made aremarkable effort to meet thechallenges of the national energystrategy and in particular theincorporation into the grid of anincreasing amount of wind power.
Chairperson’s statement
REN at a glance | 11
operation of safe, efficient energy infrastructures.When all is said and done, REN’s success is thesuccess of all energy consumers in that it means adiversified, secure energy supply and an increasinglyfluid, integrated market for the benefit of end users,i.e. businesses and households.
Another priority of REN’s management team hasbeen increasing efficiency in its operating activities.With this in mind, we drafted in-house plans aimedspecifically at reducing operating costs and unitinvestment costs. Take the Sinergias project, whichis designed to rationalise the Group’s back-officeactivities, and the plan to optimise procurement andgrid operation activities.
The restructuring of our Group’s debt continued in2009, with new issues on the euro market – publicand by private placement – and a new contract withthe EIB. As a result, the average maturity of REN’sdebt is now around five years, as opposed to twobefore the restructuring. In addition, the averagecost of the debt has gone down to about 3.86%.
In short, the next few years are full of challenges interms of energy infrastructures. Security of supply isat the top of the European agenda. Companies’ability to compete depends on open, competitive,interconnected markets. Environmental concernsdemand the reconfiguration of all electricitygeneration facilities in order to make use ofrenewable resources. As a grid and system operator,REN must remain at the centre of thistransformation in the energy scenario.
REN today is a group with an extremely attractiveoutlook for investors. It combines a low risk profile,sustained growth prospects of around 10% a yearand a highly attractive dividend yield.
I would like to thank our shareholders for their trustand the support they have given to our mainstrategic options, thereby allowing us the necessarystability and growth conditions.
A word of acknowledgement goes to the supervisorybodies for their diligence and support in initiatives toimprove REN’s performance at all levels.
Lastly, the REN team is the Group’s main resource,and its enthusiasm, professionalism and expertiseguarantee to all stakeholders that the company willbe up to meeting the huge challenges ahead.
Rui CartaxoChairpersonREN - Redes Energéticas Nacionais
12 | REN at a glance
Report and Accounts 2009
Main indicators
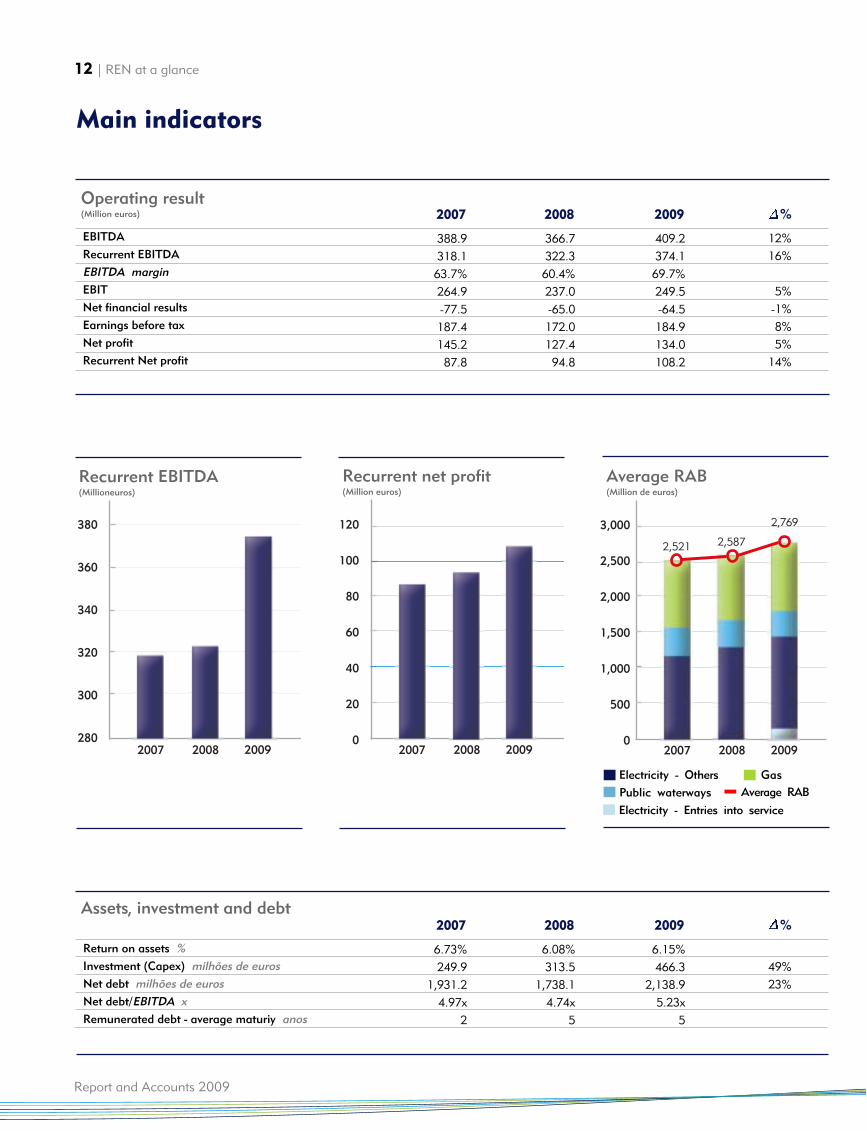
EBITDARecurrent EBITDAEBITDA marginEBITNet financial resultsEarnings before taxNet profitRecurrent Net profit
388.9318.163.7%264.9-77.5187.4145.287.8
Operating result(Million euros) 2007
12%16%
5%-1%8%5%
14%
%
409.2374.169.7%249.5-64.5184.9134.0108.2
2009
366.7322.360.4%237.0-65.0172.0127.494.8
2008
Return on assets %Investment (Capex) milhões de eurosNet debt milhões de eurosNet debt/EBITDA xRemunerated debt - average maturiy anos
6.73%249.9
1,931.24.97x
2
Assets, investment and debt2007
49%23%
%
6.15%466.3
2,138.95.23x
5
2009
6.08%313.5
1,738.14.74x
5
2008
2007
380
360
340
320
300
2802008 2009 2007
3,000
2,500
2,000
1,500
1,000
500
02008 2009
2,521
2,769
2,587
2007
120
100
80
60
40
20
02008 2009
Recurrent EBITDA (Millioneuros)
Recurrent net profit(Million euros)
Average RAB(Million de euros)
Electricity - OthersPublic waterways Average RAB
Gas
Electricity - Entries into service
REN at a glance | 13
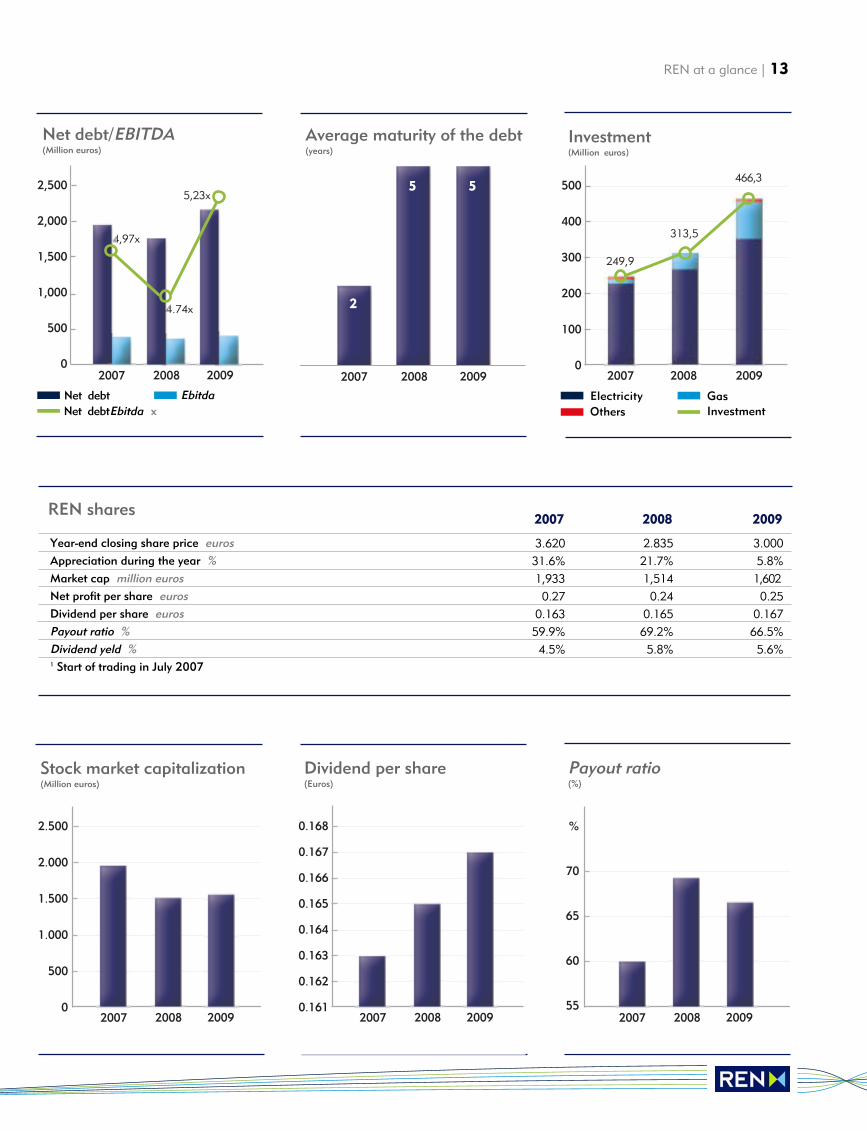
Year-end closing share price eurosAppreciation during the year %Market cap million eurosNet profit per share eurosDividend per share eurosPayout ratio %Dividend yeld %1 Start of trading in July 2007
3.62031.6%1,9330.27
0.16359.9%4.5%
REN shares2007
3.0005.8%1,6020.25
0.16766.5%5.6%
2009
2.83521.7%1,5140.24
0.16569.2%5.8%
2008
2007
2.500
2.000
1.500
1.000
500
02008 2009 2007
%
70
65
60
552008 20092007
0.168
0.167
0.166
0.165
0.164
0.163
0.162
0.1612008 2009
Stock market capitalization(Million euros)
Dividend per share(Euros)
Payout ratio(%)
2007
2,500
2,000
1,500
1,000
500
02008 2009
4,97x
4.74x
5,23x
2007
500
400
300
200
100
02008 2009
249,9
466,3
313,5
2007 2008 2009
2
5 5
Net debt/EBITDA(Million euros)
Average maturity of the debt(years)
Investment(Million euros)
Net debtNet debtEbitda x
Ebitda ElectricityOthers Investment
Gas
14 | REN at a glance
Report and Accounts 2009
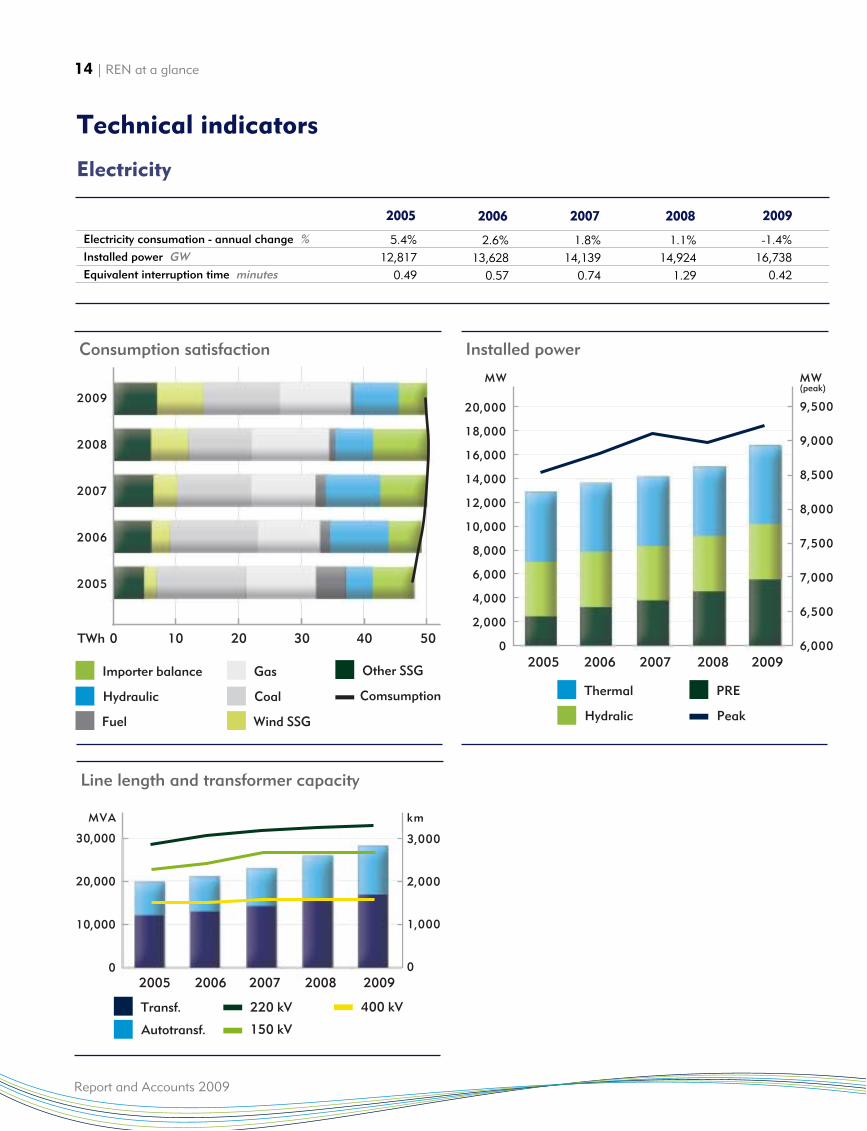
Technical indicators
Electricity consumation - annual change %Installed power GWEquivalent interruption time minutes
2.6%13,628
0.57
2006
5.4%12,817
0.49
2005
-1.4%16,738
0.42
2009
1.1%14,924
1.29
2008
1.8%14,139
0.74
2007
Comsumption
Other SSG
Hydraulic
Fuel
Importer balance
2009
2008
2007
2006
2005
0 10 20 30 40 50TWh
Coal
Wind SSG
Gas
Consumption satisfaction
Hydralic Peak
PREThermal
20,000
18,000
16,000
14,000
12,000
10,000
8,000
6,000
4,000
2,000
02005 2006 2007 2008 2009
9,500
9,000
8,500
8,000
7,500
7,000
6,500
6,000
MW MW(peak)
Installed power
30,000
20,000
10,000
02005 2006 2007 2008 2009
3,000
2,000
1,000
0
MVA km
Autotransf.
220 kV
150 kV
Transf. 400 kV
Line length and transformer capacity
Electricity
REN at a relance | 15
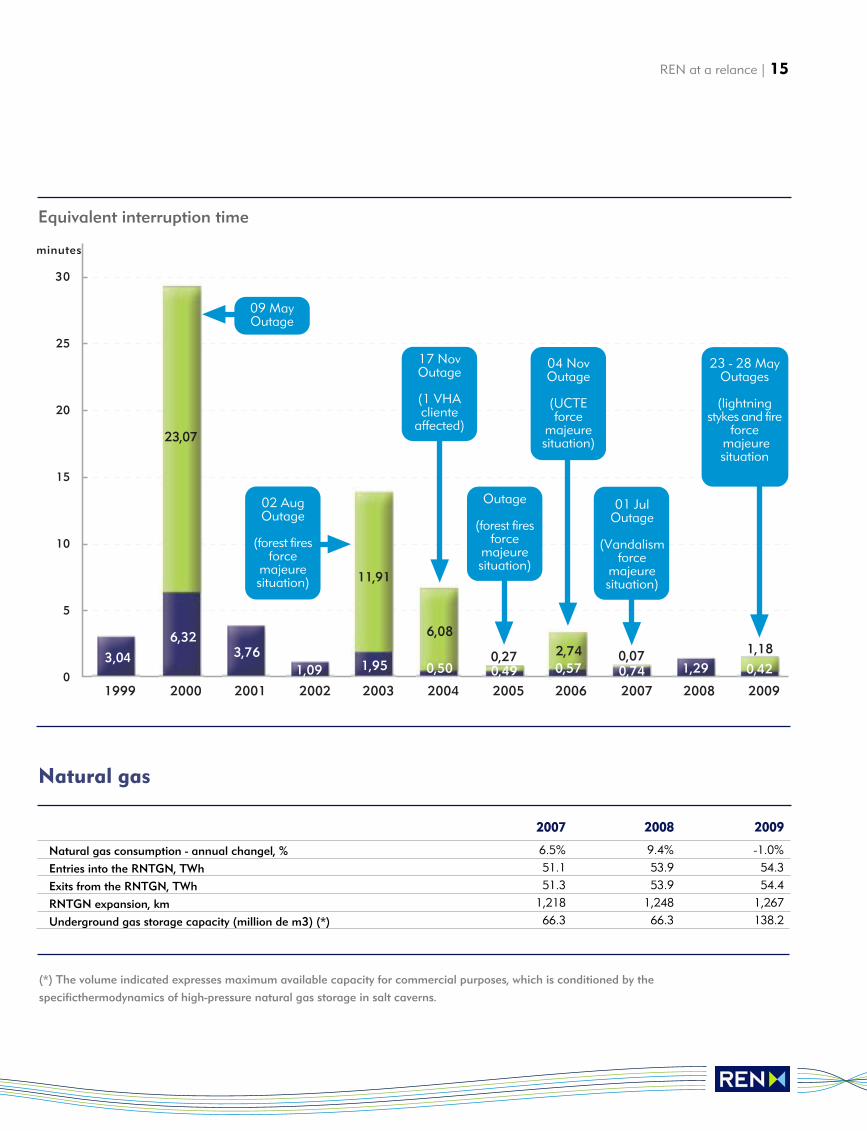
Equivalent interruption time
30
25
20
15
10
5
02000 2001 2002 2003 2004
minutes
2005 2006 2007 2008 20091999
3,04
6,323,76
1,09 1,95 0,50 0,49 0,57 0,74 1,29 0,42
23,07
11,91
6,08
0,27 2,74 0,07 1,18
09 MayOutage
02 AugOutage
(forest firesforce
majeuresituation)
17 NovOutage
(1 VHAcliente
affected)
Outage
(forest firesforce
majeuresituation)
04 NovOutage
(UCTEforce
majeuresituation)
01 JulOutage
(Vandalismforce
majeuresituation)
23 - 28 MayOutages
(lightningstykes and fire
force majeuresituation
Natural gas consumption - annual changel, %Entries into the RNTGN, TWhExits from the RNTGN, TWhRNTGN expansion, kmUnderground gas storage capacity (million de m3) (*)
(*) The volume indicated expresses maximum available capacity for commercial purposes, which is conditioned by thespecificthermodynamics of high-pressure natural gas storage in salt caverns.
6.5%51.151.3
1,21866.3
2007
-1.0%54.354.4
1,267138.2
2009
9.4%53.953.9
1,24866.3
2008
Natural gas
16 | REN at a glance
Report and Accounts 2009
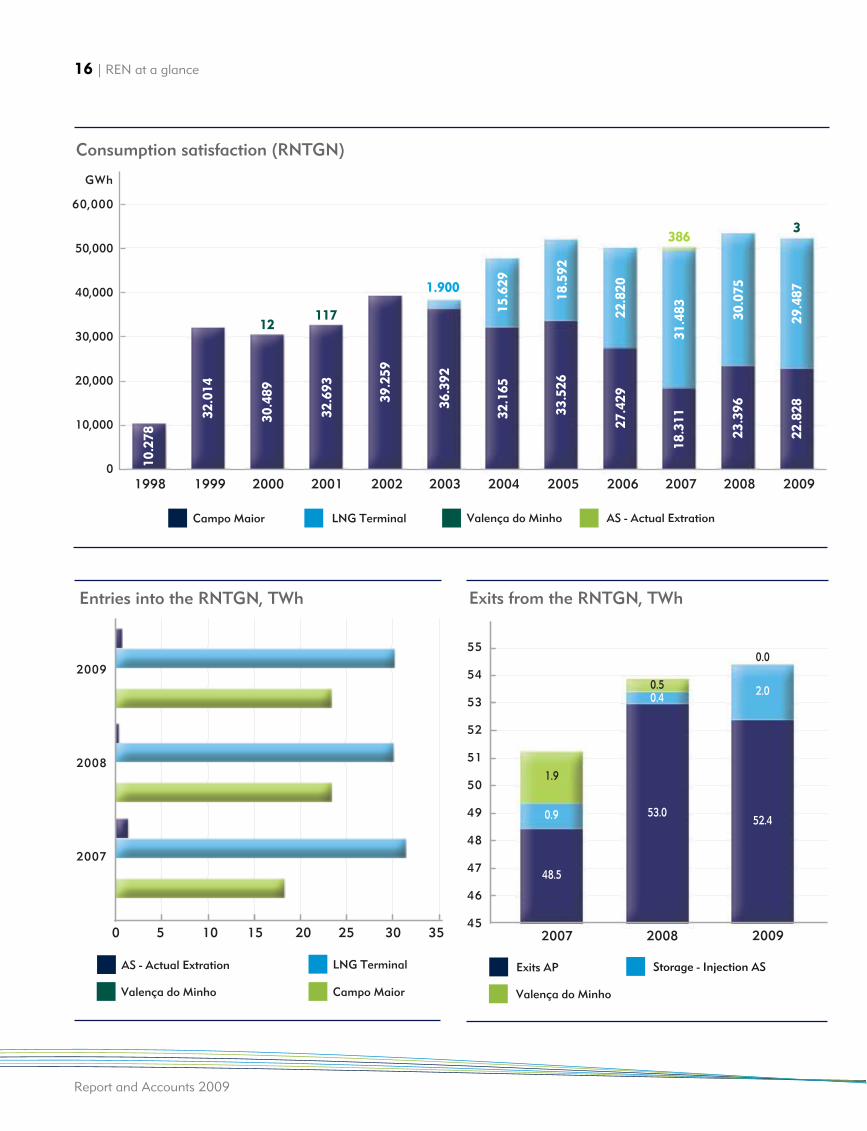
Consumption satisfaction (RNTGN)
60,000
50,000
40,000
30,000
20,000
10,000
02000 2001 2002 2003 2004
GWh
2005 2006 2007 2008 200919991998
Campo Maior LNG Terminal Valença do Minho AS - Actual Extration
2009
2008
2007
0 5 10 15 20 25 30 35
Valença do Minho
AS - Actual Extration LNG Terminal
Campo Maior
Entries into the RNTGN, TWh
48.5
53.052.40.9
0.4 2.0
0.0
1.9
0.5
55
54
53
52
51
50
49
48
47
46
452007
Valença do Minho
Exits AP Storage - Injection AS
2008 2009
Exits from the RNTGN, TWh
10.278
32.014
30.489
386
1.900
32.693
39.259
36.392
32.165
15.629
18.592
22.820
31.483 30.075
29.487
33.526
27.429
18.311
23.396
22.828
11712
3
0,0 0,00,0
2.0
1.5
1.0
0.5
0.02005 2006 2007 2008 2009
0,2 0,3
minutes
TIE Average 2005-2009
REN at a relance | 17
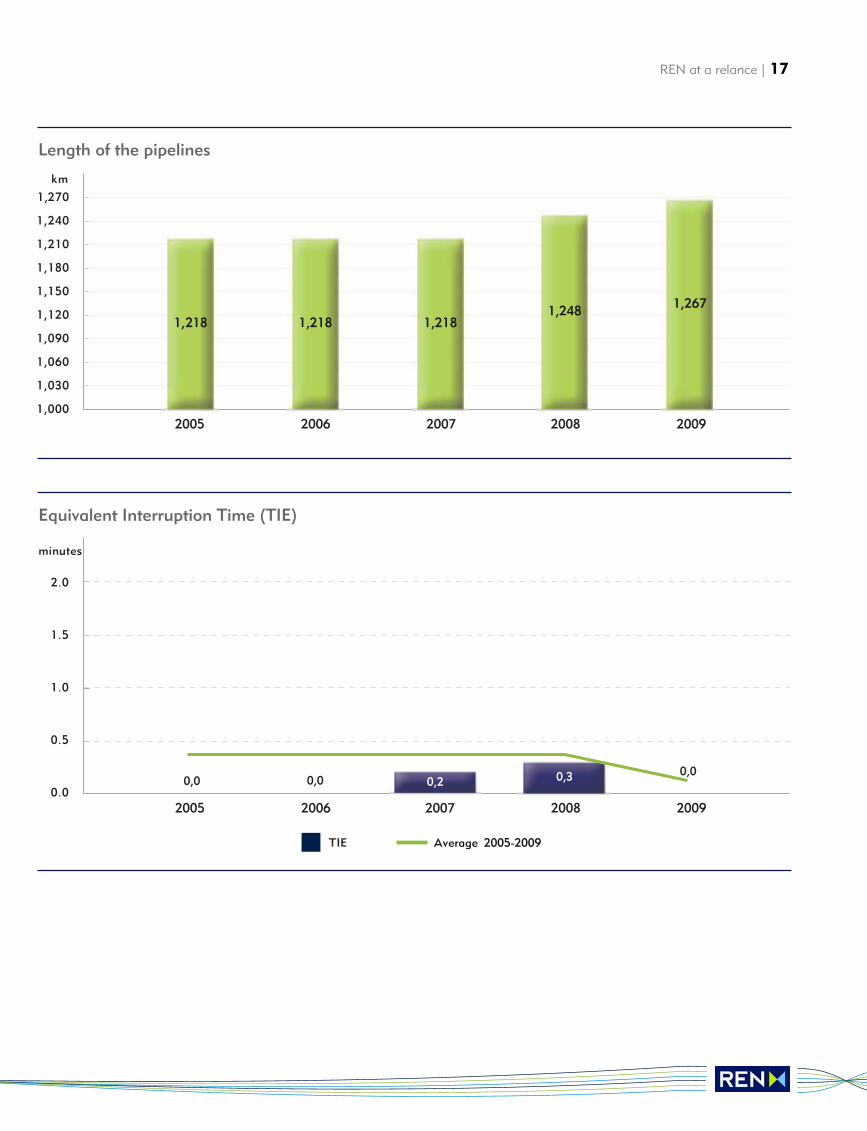
Length of the pipelines
1,270
1,240
1,210
1,180
1,150
1,120
1,090
1,060
1,030
1,000
km
2005 2006 2007 2008 2009
1,218 1,2181,248 1,267
1,218
Equivalent Interruption Time (TIE)
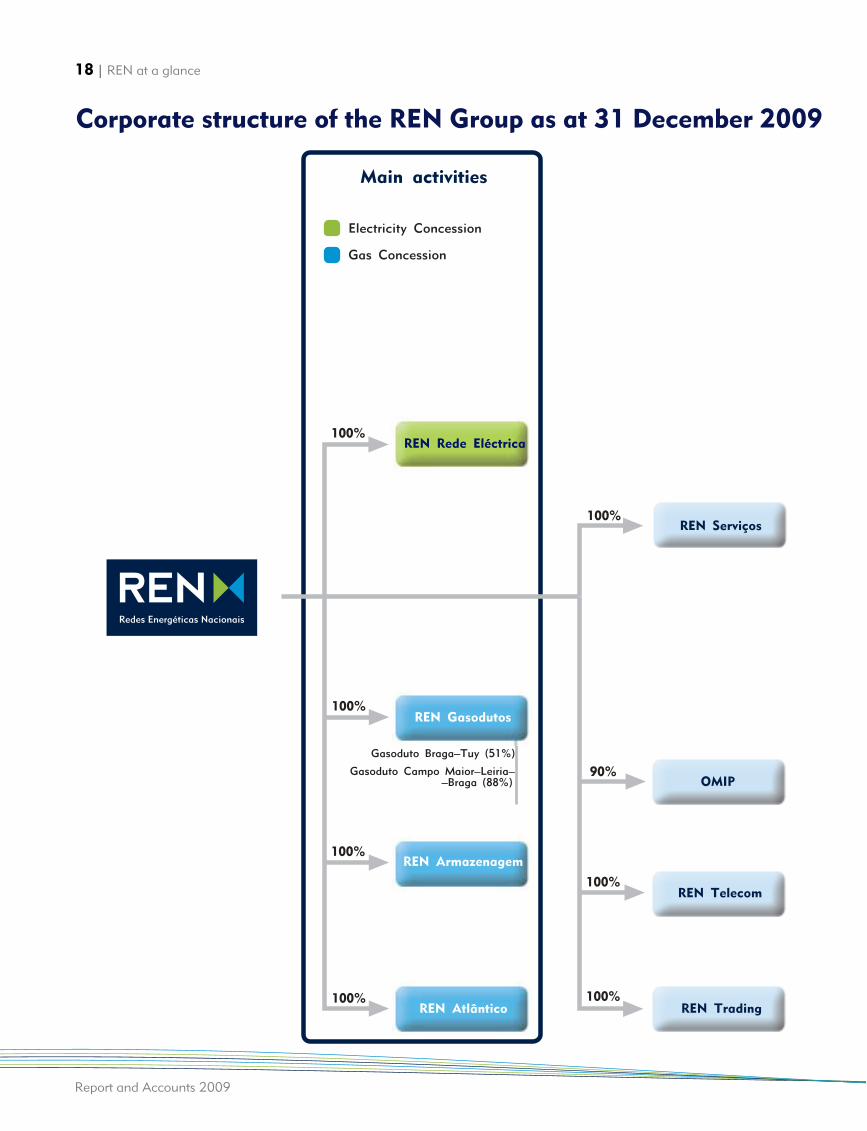
18 | REN at a glance
90%
100%
100%
REN Telecom
OMIP
REN Trading
100%REN Serviços
100%
100%
100%
100%
REN Rede Eléctrica
REN Gasodutos
REN Armazenagem
REN Atlântico
Gasoduto Braga–Tuy (51%)
Gasoduto Campo Maior–Leiria––Braga (88%)
Main activities
Electricity Concession
Gas Concession
Corporate structure of the REN Group as at 31 December 2009
Report and Accounts 2009
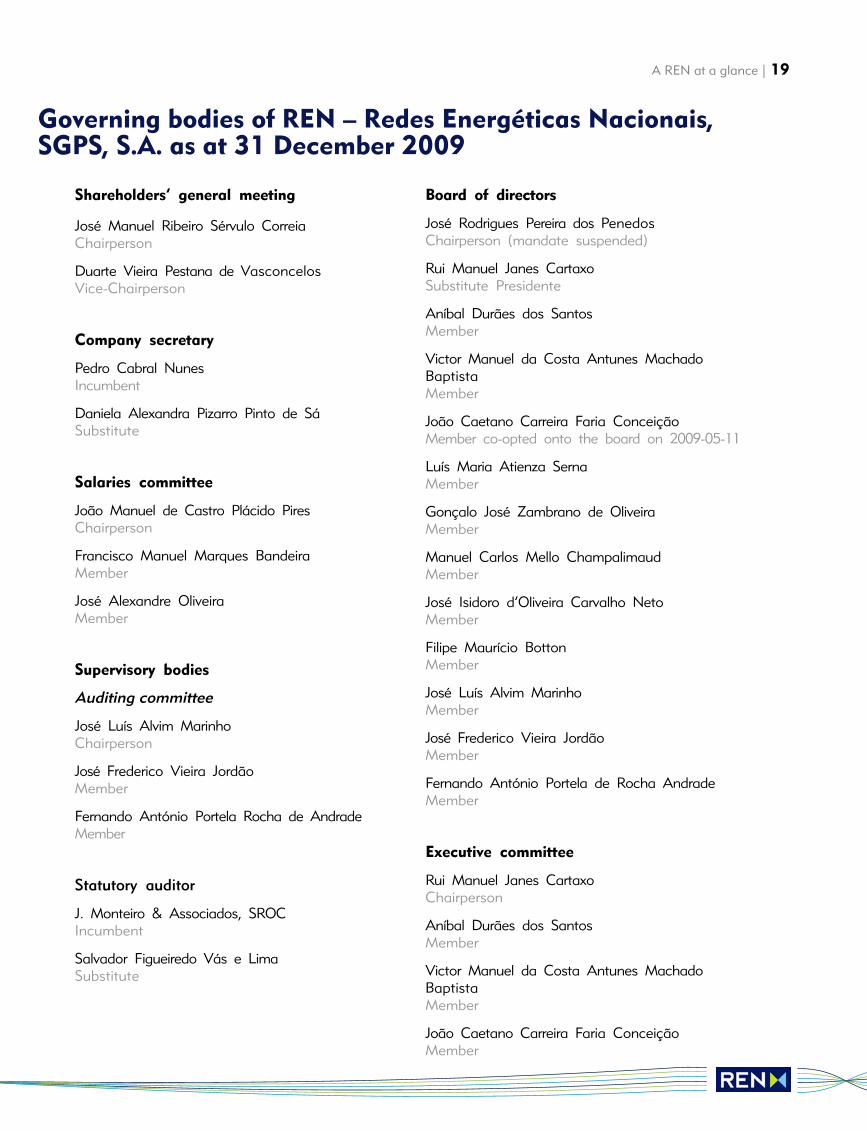
A REN at a glance | 19
Shareholders’ general meeting
José Manuel Ribeiro Sérvulo CorreiaChairperson
Duarte Vieira Pestana de VasconcelosVice-Chairperson
Company secretary
Pedro Cabral NunesIncumbent
Daniela Alexandra Pizarro Pinto de SáSubstitute
Salaries committee
João Manuel de Castro Plácido PiresChairperson
Francisco Manuel Marques BandeiraMember
José Alexandre OliveiraMember
Supervisory bodies
Auditing committee
José Luís Alvim MarinhoChairperson
José Frederico Vieira JordãoMember
Fernando António Portela Rocha de AndradeMember
Statutory auditor
J. Monteiro & Associados, SROCIncumbent
Salvador Figueiredo Vás e LimaSubstitute
Board of directors
José Rodrigues Pereira dos PenedosChairperson (mandate suspended)
Rui Manuel Janes CartaxoSubstitute Presidente
Aníbal Durães dos SantosMember
Victor Manuel da Costa Antunes MachadoBaptistaMember
João Caetano Carreira Faria ConceiçãoMember co-opted onto the board on 2009-05-11
Luís Maria Atienza SernaMember
Gonçalo José Zambrano de OliveiraMember
Manuel Carlos Mello ChampalimaudMember
José Isidoro d’Oliveira Carvalho NetoMember
Filipe Maurício BottonMember
José Luís Alvim MarinhoMember
José Frederico Vieira JordãoMember
Fernando António Portela de Rocha AndradeMember
Executive committee
Rui Manuel Janes CartaxoChairperson
Aníbal Durães dos SantosMember
Victor Manuel da Costa Antunes MachadoBaptistaMember
João Caetano Carreira Faria ConceiçãoMember
Governing bodies of REN – Redes Energéticas Nacionais,SGPS, S.A. as at 31 December 2009
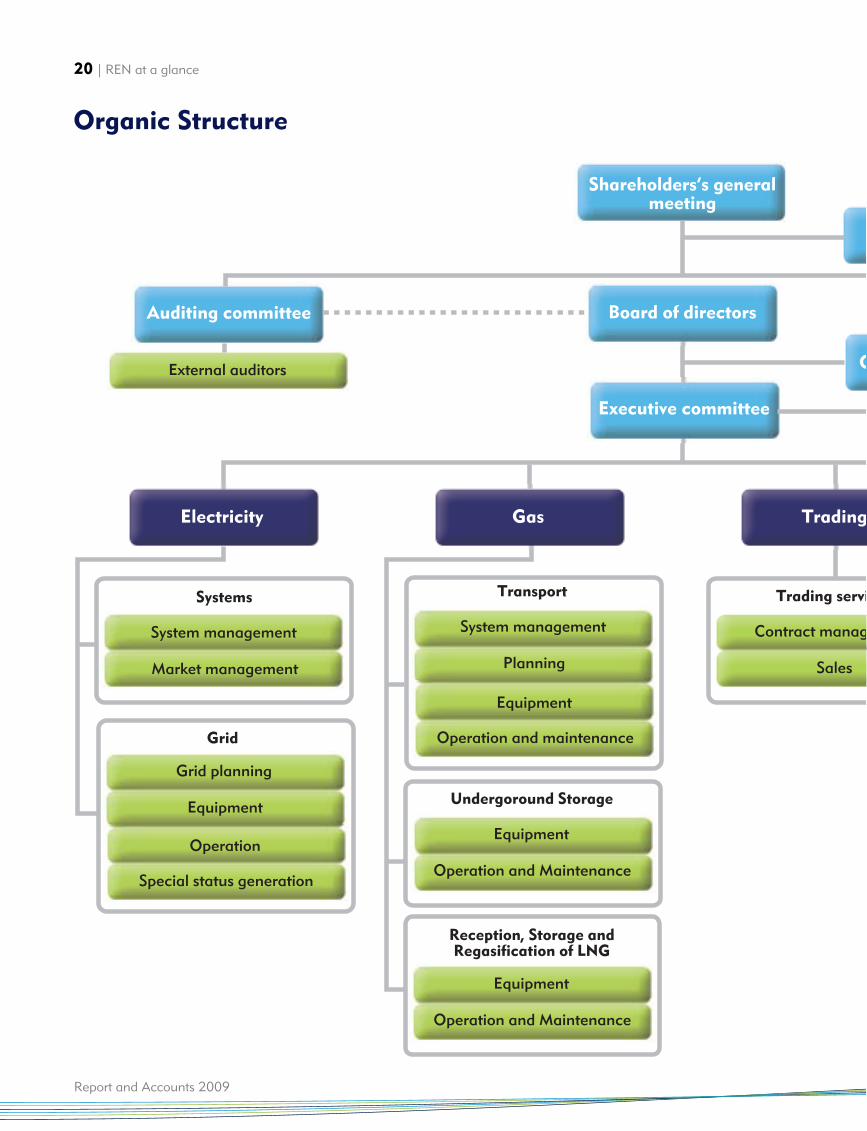
S
Shareholders’s generalmeeting
Auditing committee Board of directors
Electricity
Executive committee
Gas
C
Trading
Sales
Contract manag
Trading servi
Planning
System management
Transport
Operation and Maintenance
Equipment
Undergoround Storage
Operation and Maintenance
Equipment
Reception, Storage andRegasification of LNG
Operation and maintenance
Equipment
Market management
System management
Systems
Equipment
Grid planning
Special status generation
Operation
External auditors
Grid
20 | REN at a glance
Report and Accounts 2009
Organic Structure
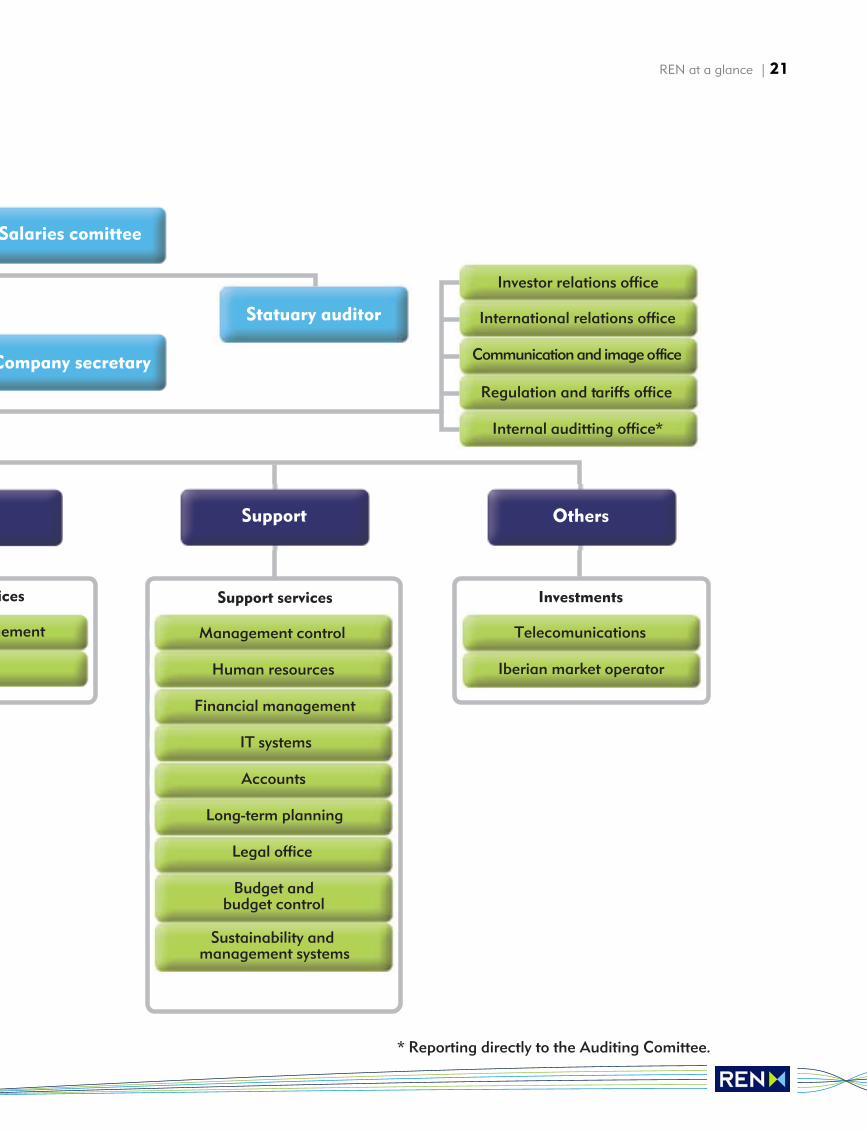
Statuary auditor
Salaries comittee
Company secretary
Support Others
Investor relations office
Internal auditting office*
International relations office
Communication and image office
Regulation and tariffs office
Iberian market operator
Telecomunications
Investments
Human resources
Management control
Support services
IT systems
Financial management
Long-term planning
Accounts
Budget andbudget control
Legal office
Sustainability and management systems
gement
ices
* Reporting directly to the Auditing Comittee.
REN at a glance | 21
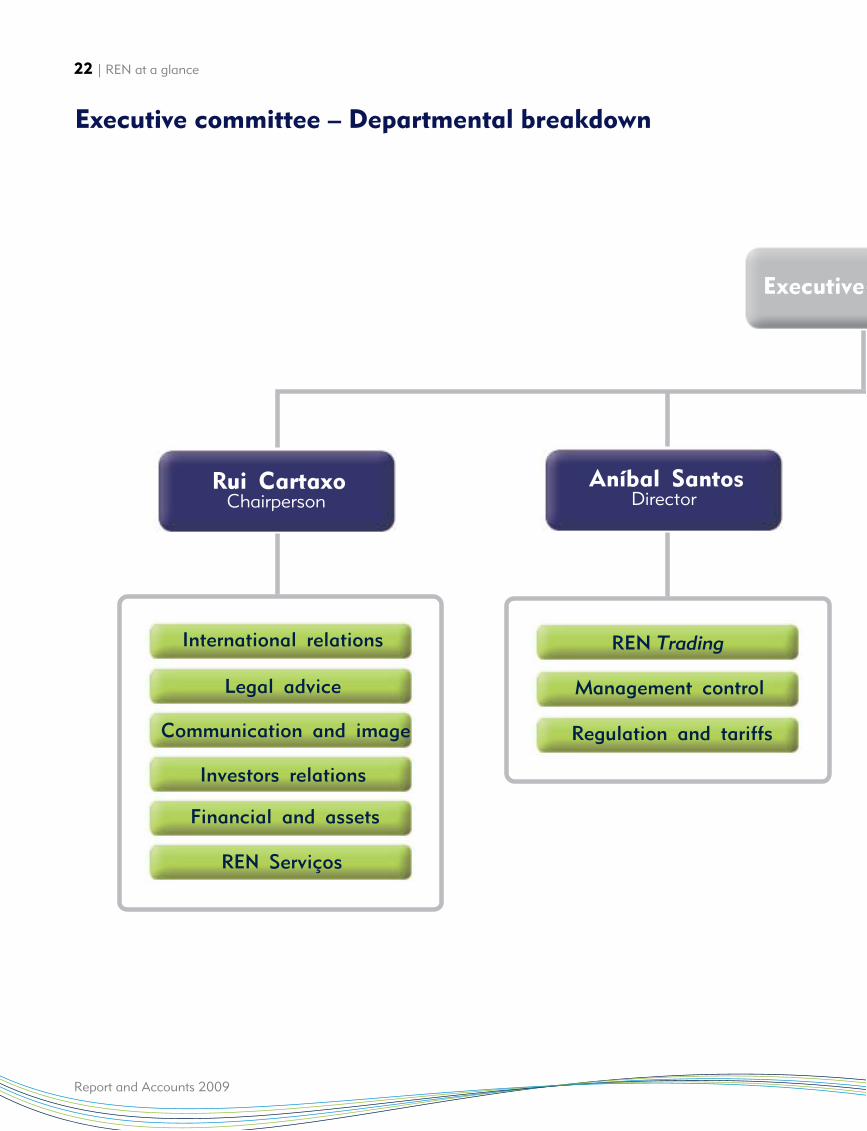
Rui CartaxoChairperson
Aníbal SantosDirector
REN Trading
Management control
Regulation and tariffs
Financial and assets
REN Serviços
Investors relations
International relations
Legal advice
Communication and image
Executive
22 | REN at a glance
Report and Accounts 2009
Executive committee – Departmental breakdown
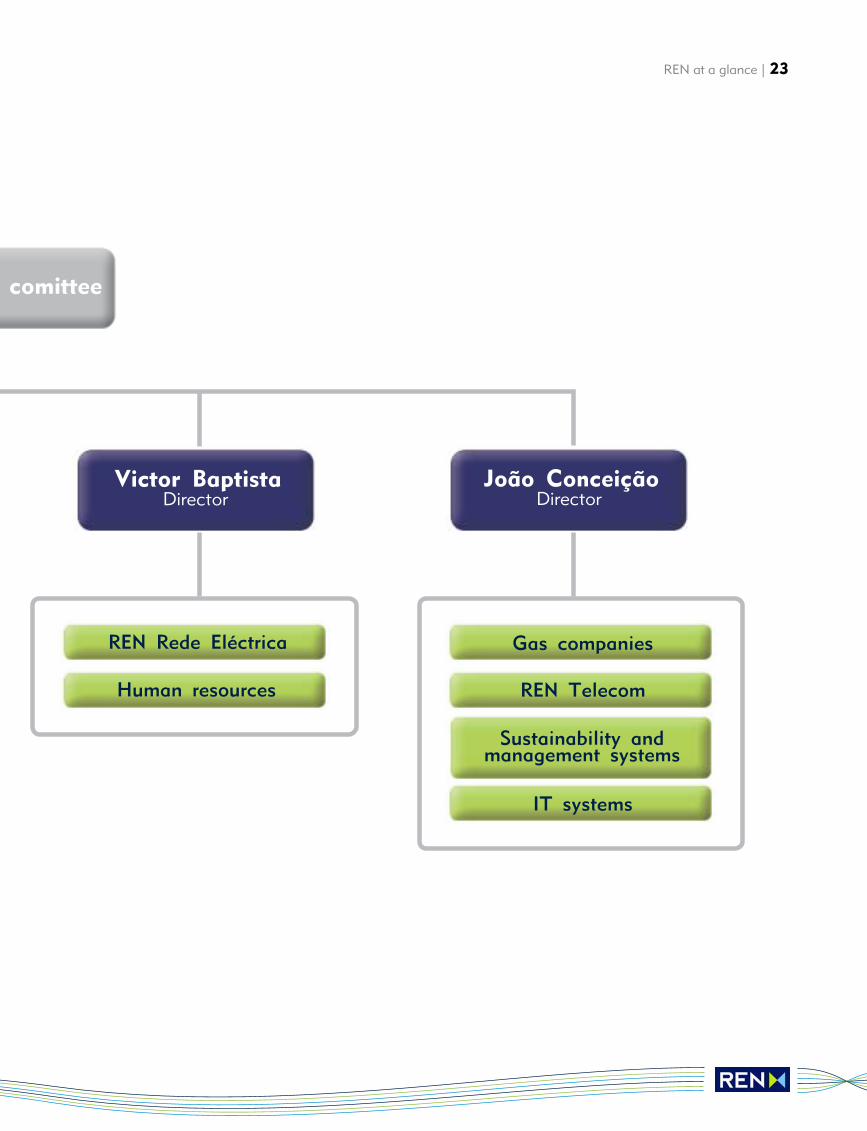
Victor BaptistaDirector
João ConceiçãoDirector
Gas companies
REN Telecom
Sustainability andmanagement systems
IT systems
REN Rede Eléctrica
Human resources
comittee
REN at a glance | 23
Management report
Report and Accounts 2009
Management report | 25
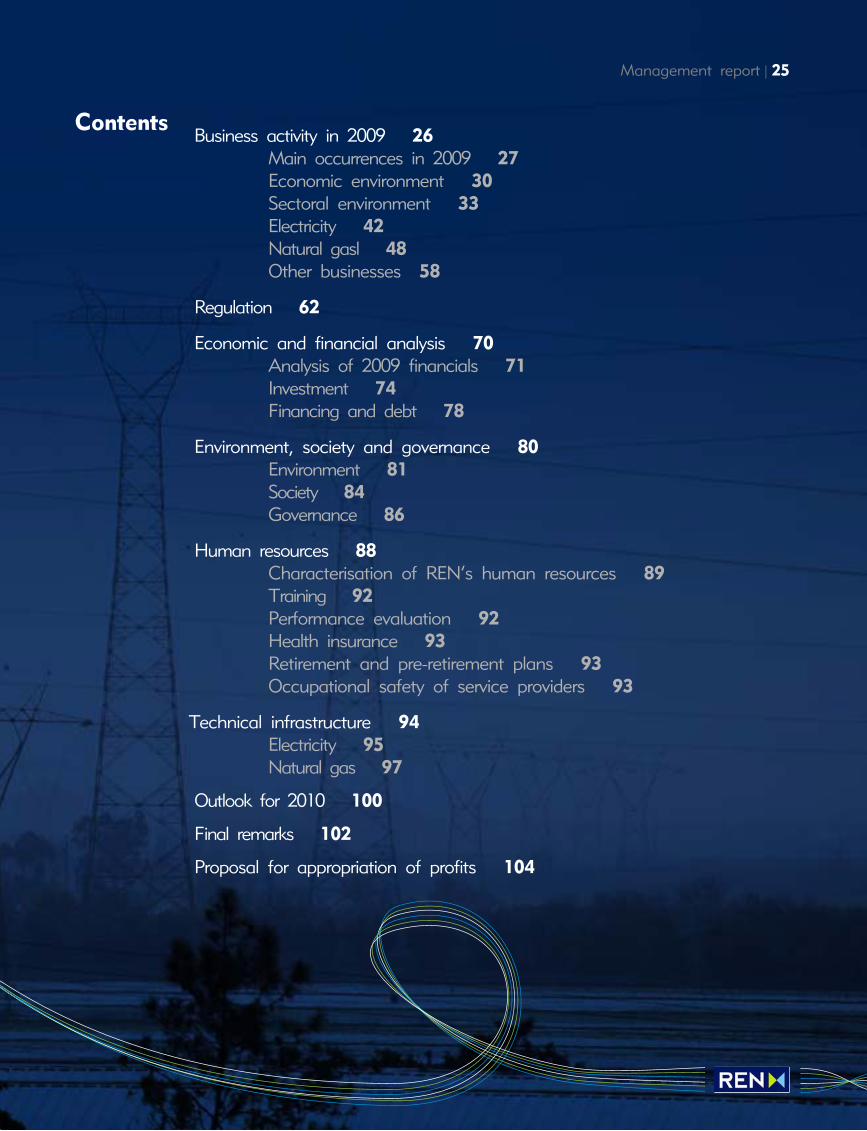
ContentsBusiness activity in 2009 26
Main occurrences in 2009 27Economic environment 30Sectoral environment 33Electricity 42Natural gasl 48Other businesses 58
Regulation 62
Economic and financial analysis 70Analysis of 2009 financials 71Investment 74Financing and debt 78
Environment, society and governance 80Environment 81Society 84Governance 86
Human resources 88Characterisation of REN’s human resources 89Training 92Performance evaluation 92Health insurance 93Retirement and pre-retirement plans 93Occupational safety of service providers 93
Technical infrastructure 94Electricity 95Natural gas 97
Outlook for 2010 100
Final remarks 102
Proposal for appropriation of profits 104
Business activity in 2009
Report and Accounts 2009
Business activity in 2009 | 27
Start of the new electricity regulatory period (Jan 2009-Dec 2011), with several changes to theregulations: a remuneration premium for the newinvestment programme was introduced, standardcosts were applied to new investments, and recognised maximum costs were applied as part of operating overheads; incentives were introducedfor the use of assets at the end of their useful life, and an incentive was introduced for making networkinfrastructure available.Amendment of the Santiago de Compostela agreement on the Iberian Market Operator (OMI)was approved by the Portuguese Parliament.As from 1 January the opening up of the Portuguesenatural gas market included customers whose annual consumption exceeds 10,000 m 3.
The 2009-2014 Transport Network andTransmission Grid Development and Investment Plan was made available for public debate.REN announced the augmentation of its 2009investment plan.REN issued €300M of bonds under its Euro Medium-Term Notes (EMTN) plan.
ERSE elected to place REN Gasodutos in charge of changes to natural gas suppliers, during whichabout 320 changes of supplier were made.
REN organised its first Investor Day at its Bucelaspremises, involving investors and financial analysts,during which the new 2009-14 Business Plan waspresented, involving €2.5B of investment and a commitment to the sustained growth of dividend pay-outs.The United Nations Global Compact graded REN's2007 sustainability report as “notable”.A contract was signed for expansion of the SinesLiquefied Natural Gas Terminal, which will double its capacity.
As part of the process of improving in-house controls,an Internal Auditing Office was established, reportingdirectly to the Auditing Committee.A gas pipeline was completed, connecting EDP'sLares combined cycle power station (800 MW), and natural gas supplies began.
REN issued 10 billion yens (about €75M) of 15-yearbonds as private placements under its EMTN plan.REN Armazenagem's third cavity entered into operation. This increased underground natural gasstorage capacity by 55 million m3.The contract was awarded to install 26 power transformers (€61M), and Falagueira's second autotransformer (€10M) entered into operation.
Main occurrences in 2009
January March
February
May
June
April
REN won the award for the “Company with the beststock-market performance in 2008”, awarded byDeloitte, Semanário Económico and Diário Económico.A long-term financing agreement worth €150M wasentered into with the European Investment Bank (EIB)to fund investment in the Portuguese natural gas system.Contracts were entered into for eight gas-insulatedsubstations and six underground power lines(€146M).Certification renewal took place for the Quality,Environmental and Safety-Management Systems ofREN Gasodutos, REN Atlântico and the LNG terminal.
Work began on expanding the Sines terminal, expectedto last until 2012 and costing €180M.A joint decision was announced with Enagás, ourSpanish counterpart, on the new Mangualde-Zamorainterconnection (stretching 205 km and with an esti-mated cost of €294M on the Portuguese side).REN Atlântico completed the expansion of its berth,which has increased its ship unloading capacity by 30%.
A series of proposals was submitted to ERSE for thenew natural gas regulatory period (from July 2010 to June 2013).REN was awarded the CEEP/CSR Corporate SocialResponsibility Label, as one of the top four of approximately 100 competing European companies.
28 | Management report
July
October
September
Report and Accounts 2009
Business activity in 2009 | 29
December
November
Installation and final testing of one of the 200 kVunderground circuits was completed, at an overallcost of €43.5M. The circuit connects the Alto de MiraSubstation in the borough of Amadora with theZambujal Substation in the borough of Lisbon.
The Court of Arbitration rejected the 45.3 million eurocase brought before it by Galp Energia to contest thechange in the purchase price of natural gas related regulated assets.On 31 December, the highest percentage of energygeneration from renewable resources was achieved, at 88%. In December, wind power accounted for 25% of consumption. The December figure for all consumption from renewable resources was 57%.The European Network of Transmission SystemOperators for Gas (ENTSOG) was formed, with REN as one of its co-founders.The first natural gas storage capacity auction was held.
30 | Management report
Economic environment1
Report and Accounts 2009
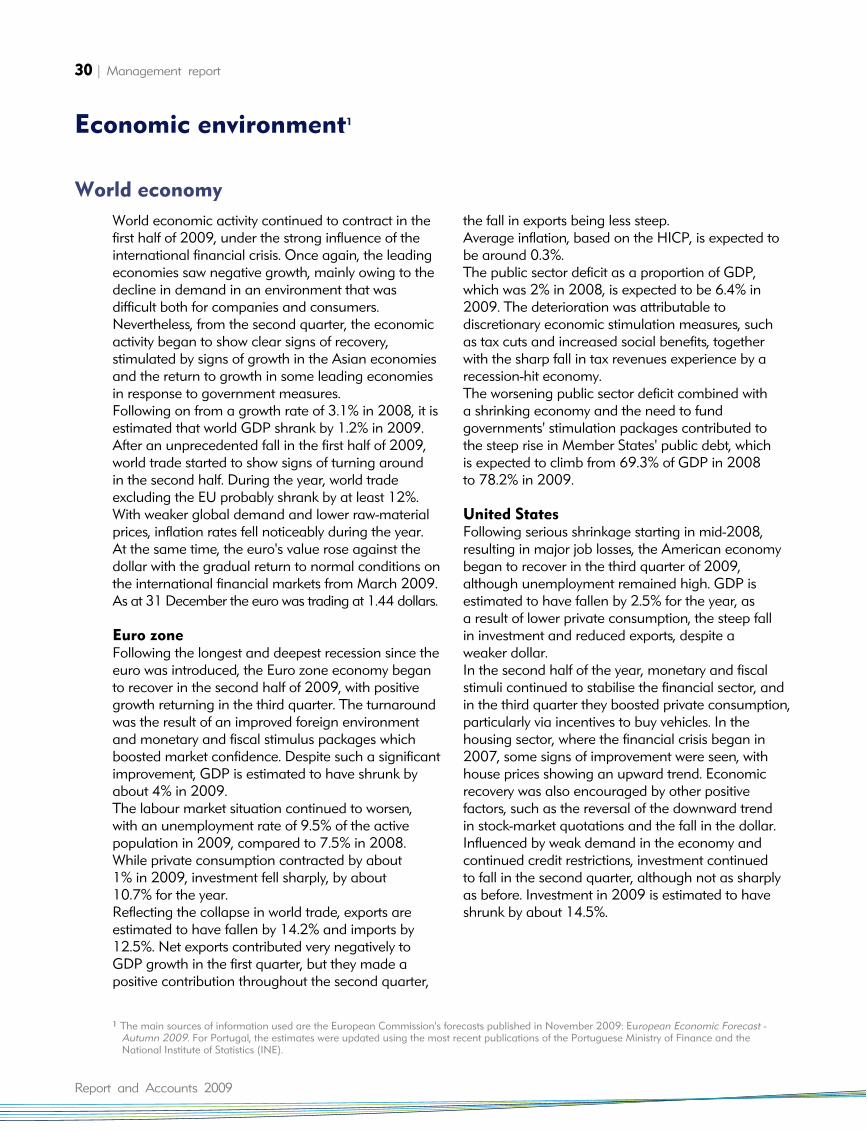
World economic activity continued to contract in thefirst half of 2009, under the strong influence of theinternational financial crisis. Once again, the leadingeconomies saw negative growth, mainly owing to thedecline in demand in an environment that wasdifficult both for companies and consumers.Nevertheless, from the second quarter, the economicactivity began to show clear signs of recovery,stimulated by signs of growth in the Asian economiesand the return to growth in some leading economiesin response to government measures. Following on from a growth rate of 3.1% in 2008, it isestimated that world GDP shrank by 1.2% in 2009.After an unprecedented fall in the first half of 2009,world trade started to show signs of turning aroundin the second half. During the year, world tradeexcluding the EU probably shrank by at least 12%.With weaker global demand and lower raw-materialprices, inflation rates fell noticeably during the year.At the same time, the euro's value rose against thedollar with the gradual return to normal conditions onthe international financial markets from March 2009.As at 31 December the euro was trading at 1.44 dollars.
Euro zoneFollowing the longest and deepest recession since theeuro was introduced, the Euro zone economy beganto recover in the second half of 2009, with positivegrowth returning in the third quarter. The turnaroundwas the result of an improved foreign environmentand monetary and fiscal stimulus packages whichboosted market confidence. Despite such a significantimprovement, GDP is estimated to have shrunk byabout 4% in 2009.The labour market situation continued to worsen,with an unemployment rate of 9.5% of the activepopulation in 2009, compared to 7.5% in 2008.While private consumption contracted by about 1% in 2009, investment fell sharply, by about 10.7% for the year.Reflecting the collapse in world trade, exports areestimated to have fallen by 14.2% and imports by12.5%. Net exports contributed very negatively toGDP growth in the first quarter, but they made apositive contribution throughout the second quarter,
the fall in exports being less steep.Average inflation, based on the HICP, is expected tobe around 0.3%. The public sector deficit as a proportion of GDP,which was 2% in 2008, is expected to be 6.4% in2009. The deterioration was attributable todiscretionary economic stimulation measures, such as tax cuts and increased social benefits, togetherwith the sharp fall in tax revenues experience by arecession-hit economy.The worsening public sector deficit combined with a shrinking economy and the need to fundgovernments' stimulation packages contributed tothe steep rise in Member States' public debt, which is expected to climb from 69.3% of GDP in 2008 to 78.2% in 2009.
United StatesFollowing serious shrinkage starting in mid-2008,resulting in major job losses, the American economybegan to recover in the third quarter of 2009,although unemployment remained high. GDP isestimated to have fallen by 2.5% for the year, as a result of lower private consumption, the steep fall in investment and reduced exports, despite a weaker dollar.In the second half of the year, monetary and fiscalstimuli continued to stabilise the financial sector, andin the third quarter they boosted private consumption,particularly via incentives to buy vehicles. In thehousing sector, where the financial crisis began in2007, some signs of improvement were seen, withhouse prices showing an upward trend. Economicrecovery was also encouraged by other positivefactors, such as the reversal of the downward trendin stock-market quotations and the fall in the dollar.Influenced by weak demand in the economy andcontinued credit restrictions, investment continued to fall in the second quarter, although not as sharplyas before. Investment in 2009 is estimated to haveshrunk by about 14.5%.
World economy
1 The main sources of information used are the European Commission's forecasts published in November 2009: European Economic Forecast - Autumn 2009. For Portugal, the estimates were updated using the most recent publications of the Portuguese Ministry of Finance and the National Institute of Statistics (INE).
Business activity in 2009 | 31
Interest ratesMeasures by central banks to combat the financialcrisis led to a fast and sharp reduction in interestrates. In May, the Central European Bank reduced its reference interest rate to a historic low of 1% - a150-base-point reduction since the end of December2008. For its part, the United States Federal Reservedecided to keep its Fed Funds Target Rate between0% and 0.25%, which has been the case sinceDecember 2008.Consequently, on the euro exchange market Euriborrates continued their downward trend, to reachhistoric lows. As at 31 December 2009, Euriborthree-, six- and twelve-month rates were 0.700%,0.994% and 1.248% respectively, about 200 basepoints down on the end of 2008.
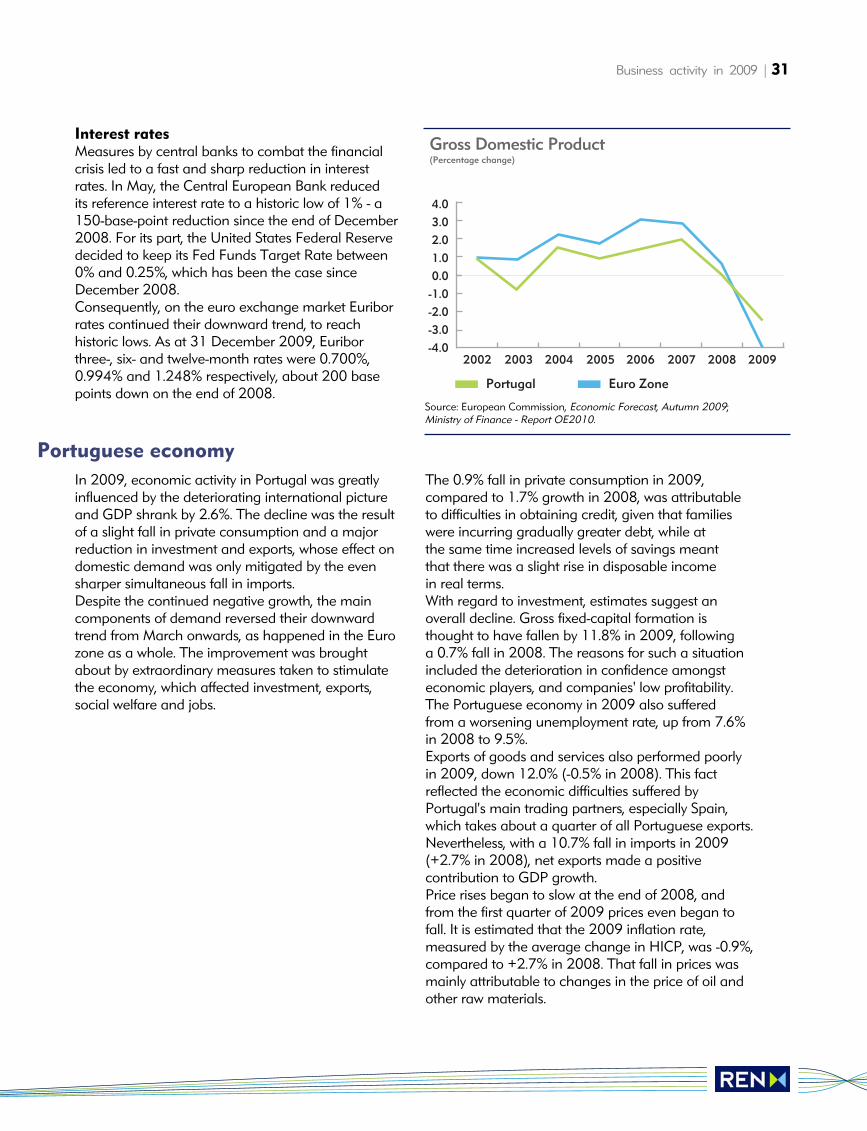
In 2009, economic activity in Portugal was greatlyinfluenced by the deteriorating international pictureand GDP shrank by 2.6%. The decline was the resultof a slight fall in private consumption and a majorreduction in investment and exports, whose effect ondomestic demand was only mitigated by the evensharper simultaneous fall in imports.Despite the continued negative growth, the maincomponents of demand reversed their downwardtrend from March onwards, as happened in the Eurozone as a whole. The improvement was broughtabout by extraordinary measures taken to stimulatethe economy, which affected investment, exports,social welfare and jobs.
The 0.9% fall in private consumption in 2009,compared to 1.7% growth in 2008, was attributableto difficulties in obtaining credit, given that familieswere incurring gradually greater debt, while at the same time increased levels of savings meant that there was a slight rise in disposable income in real terms. With regard to investment, estimates suggest anoverall decline. Gross fixed-capital formation isthought to have fallen by 11.8% in 2009, following a 0.7% fall in 2008. The reasons for such a situationincluded the deterioration in confidence amongsteconomic players, and companies' low profitability.The Portuguese economy in 2009 also suffered from a worsening unemployment rate, up from 7.6%in 2008 to 9.5%.Exports of goods and services also performed poorlyin 2009, down 12.0% (-0.5% in 2008). This factreflected the economic difficulties suffered byPortugal's main trading partners, especially Spain,which takes about a quarter of all Portuguese exports.Nevertheless, with a 10.7% fall in imports in 2009(+2.7% in 2008), net exports made a positivecontribution to GDP growth. Price rises began to slow at the end of 2008, andfrom the first quarter of 2009 prices even began tofall. It is estimated that the 2009 inflation rate,measured by the average change in HICP, was -0.9%,compared to +2.7% in 2008. That fall in prices wasmainly attributable to changes in the price of oil andother raw materials.
Portuguese economy
4.03.02.01.00.0
-1.0-2.0-3.0-4.0
2002 2003 2004 2005 2006 2007 2008 2009
Portugal Euro Zone
Gross Domestic Product(Percentage change)
Source: European Commission, Economic Forecast, Autumn 2009; Ministry of Finance - Report OE2010.
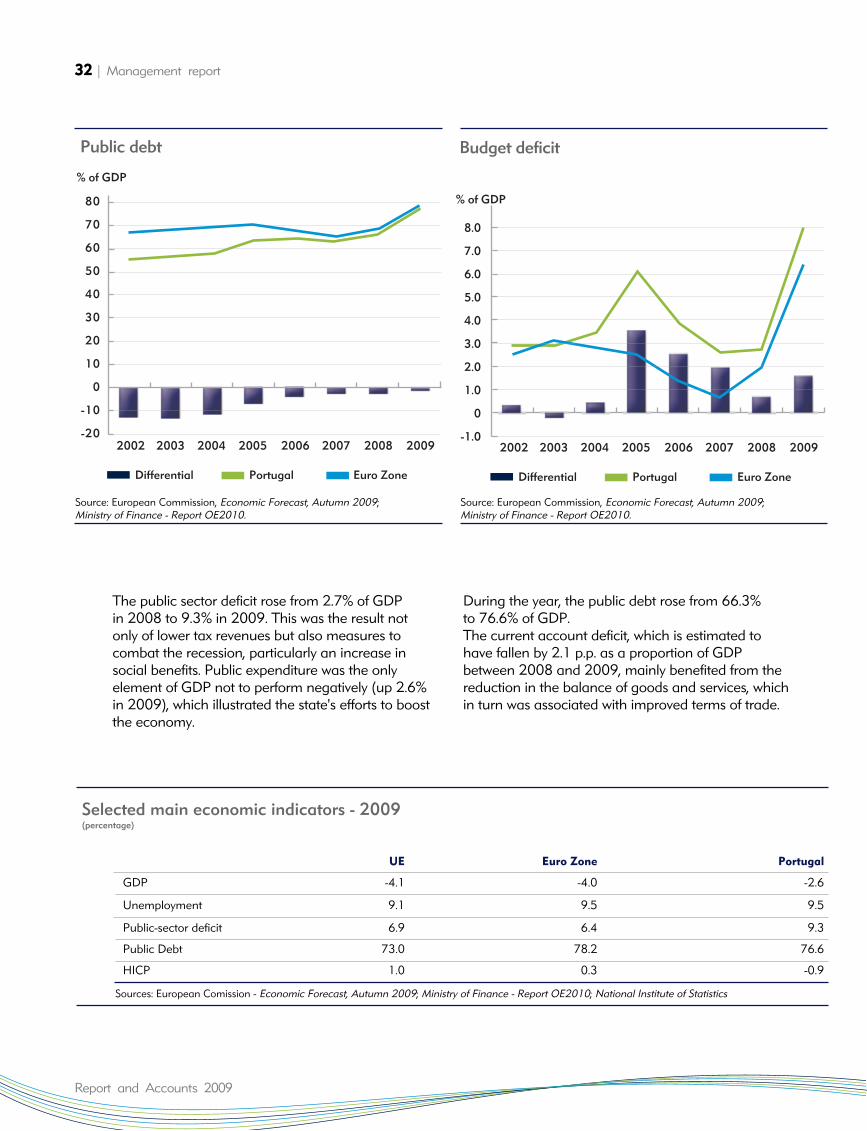
The public sector deficit rose from 2.7% of GDP in 2008 to 9.3% in 2009. This was the result not only of lower tax revenues but also measures tocombat the recession, particularly an increase insocial benefits. Public expenditure was the onlyelement of GDP not to perform negatively (up 2.6%in 2009), which illustrated the state's efforts to boostthe economy.
During the year, the public debt rose from 66.3%to 76.6% of GDP.The current account deficit, which is estimated tohave fallen by 2.1 p.p. as a proportion of GDPbetween 2008 and 2009, mainly benefited from thereduction in the balance of goods and services, whichin turn was associated with improved terms of trade.
32 | Management report
Report and Accounts 2009
UE Euro Zone Portugal
GDP -4.1 -4.0 -2.6
Unemployment 9.1 9.5 9.5
Public-sector deficit 6.9 6.4 9.3
Public Debt 73.0 78.2 76.6
HICP 1.0 0.3 -0.9
Sources: European Comission - Economic Forecast, Autumn 2009; Ministry of Finance - Report OE2010; National Institute of Statistics
Selected main economic indicators - 2009(percentage)
2002
Differential Portugal
80
70
60
50
40
30
20
10
0
-10
-20
Euro Zone
2003 2004 2005 2006 2007 2008 2009
% of GDP
Public debt
2002
Differential Portugal
8.0
7.0
6.0
5.0
4.0
3.0
2.0
1.0
0
-1.0
Euro Zone
2003 2004 2005 2006 2007 2008 2009
% of GDP
Budget deficit
Source: European Commission, Economic Forecast, Autumn 2009; Ministry of Finance - Report OE2010.
Source: European Commission, Economic Forecast, Autumn 2009; Ministry of Finance - Report OE2010.
Business activity in 2009 | 33
Sectoral environment
Electricity and natural gas in a global context
Access to electricity
In 2009, for the first time since 1981, world energydemand fell, by about 2%, as a consequence of theglobal economic crisis. However, despite that fallresulting from the overall situation, it is estimated thatworld energy consumption will quickly return to growth.The two main energy challenges that we had to faceduring the year were guaranteeing a reliable, economically accessible energy supply and rapid convergence to an efficient, sustainable, low-carbonenergy system.According to the International Energy Agency(IEA)'s Reference Scenario, world primary energy consumption could rise by about 40% between 2007and 2030, led by emerging Asian countries and followed by Middle-Eastern countries. Fossil fuels will continue to be the predominant source of primaryenergy (75%), with demand for coal rising more than that of any other fossil fuel, in absolute terms. Also according to the IEA, global electricity demand is expected to grow around 2.5% by 2030 and about80% of this growth will occur in non-OECD countries.The primary energy mix for electricity generation willcontinue to change considerably. Renewable energies and rapid technological development willplay an increasingly important role in electricity generation (from 18.5% in 2007 to 22.6% in 2030).
Currently, over one fifth of the world's population hasno access to electricity. With suitable economic andenergy policies, universal access to electricity could beachieved via additional annual investment of about35 billion dollars between now and 2030, at 2008prices. That figure represents just 6% of the worldinvestment in the electricity sector forecast in the IEA's Reference Scenario.For natural gas, preliminary data for 2009 indicatethat there was an approximately 3% fall in consumption, as a result of the shrinking economy. In its Reference Scenario, the IEA forecasts that worldnatural gas consumption will grow by about 1.5% per annum up to 2030, with India and China havingthe highest growth rates. The electricity sector will continue to be the engine behind natural gas demandin all regions.
The funding difficulties caused by the recent crisishave resulted in the cancellation or postponement of several investment projects in the energy sector.Over the medium-term this could limit the capacityexpansion needed to provide for increased demand,which may have a serious effect on security of supplyand the sustainability of economic recovery.
The European Union's basic objective continues tobe sustainable development. In this context, I wouldlike to highlight EU policies aimed at an economywith low carbon emissions. At the same time, we are aiming at more efficient use of resources. We plan to achieve this goal by employing efficienttechnologies, sustainable means of transport andsustainable development of consumer behaviour.Europe aims to become the world leader in renew-able energies and low-carbon technologies. With aview to achieving that aim, in December 2008 theEuropean Union passed its climate and energypackage. This is the most ambitious reform ever of Europe's energy policy, and it contains measuresto combat climate change and ensure a secure and adequate energy supply.In 2009 a series of documents was published - thethird energy-sector package - intended to establishthe conditions for strengthening the internal energy(electricity and natural gas) market. To support investment in the energy sector, inMarch the European Economic Recovery Plan was launched, which included about €4B for energy-related projects, and in December fundingwas approved for offshore wind-energy projects,projects involving new technologies for carbon capture and sequestration, and electricity-transmissionand natural gas transport infrastructure projects.
European energy policy
34 | Management report
Report and Accounts 2009
In Portugal, the government's energy policy indicatesthat there will be continued investment in the use ofrenewable energies, especially wind and hydroelectricenergy, but also photovoltaic and wave energy, theaim being to achieve and surpass the Community target set for Portugal. The government's policy isalso to continue to encourage the introduction ofelectric vehicles onto the Portuguese market from arange of producers, at competitive prices, with abroad range of electricity supply points to ensure thatthe system is fully functional and to provide for users'convenience. At the same time, particular attentionwill continue to be paid to energy efficiency, via the implementation of plans to reduce energy consumption in public buildings and to encourageless energy-costly behaviour and choices.
In 2009, the International Energy Agency publisheda report entitled Energy Policies of IEA Countries -PORTUGAL 2009 Review. The report noted Portugal'sefforts since 2004 to consolidate its energy policy andhighlighted its significant progress in the following fields:
• liberalisation of the electricity and natural gas markets;• improved security of supply; and• a regulatory framework centred on energy
efficiency, especially with regard to buildings and in the industry and transport sectors.
Portugal is one of the IEA's leading countries as regards the penetration of hydroelectric and wind-generated power, and is also at the forefrontwith respect to its development of wave energy. The report also mentions some challenges that are still facing Portugal when it comes to achieving a more sustainable energy future, such as the need to be more competitive in the energy markets and step up coordination of energy R&D efforts.
ElectricityIn 2009, we continued to develop the grid infrastructures: environmental protection, promotionof competition and improved security of supply: to protect the environment, encourage competitionand improve security of supply. There has been majorinvestment in transport and transmission grids and inthe management and planning of systems which arebeing established throughout Europe, and in REN'scase in Portugal. These are aimed at ensuring thatthe conditions exist to absorb the increase in electricity generation capacity derived from renewable sources, which is necessary if the EU'senergy-policy objectives are to be met. Anotherimportant issue is the provision of more interconnections, as one element in the creation of the European internal market. The development of that market is based on a strategy of regional markets as an intermediate stage, to be followed by their integration into a single EU market.Turning now to the MIBEL, in 2009 REN continuedto work closely with its Spanish opposite its counterpart REE. Since 2002, that partnership has become closer as a result of activities carried out by joint working groups. New interconnectionsthat have been agreed between the two Iberian systems will increase the capacity available for trading from the current 1,500 MW to over 3,000MW from 2014. Situations in which the markets wereseparate, with different prices in each of the twocountries, were reduced during 2009, falling from37% of the time in January to about 12% inDecember. For the year as a whole, the markets wereseparate 20% of the time, compared to 62% in 2008.
Natural gasThe natural gas supply surplus increased in 2009with the economic crisis. In the European Union,demand for natural gas in 2009 fell by between 8% and 9% compared to 2008, and was particularlynotable in the industrial sector.The impact of the crisis on the development of newinfrastructure and the exploitation of new deposits is still difficult to assess. A clear illustration of that factcomes from Russia, where Gazprom announced thatthe Shtokman project, also involving Total (France)and StatoilHydro (Norway) might only be launchedafter 2013, depending on how the market develops.The Shtokman natural gas deposits in the BarentsSea have sufficient reserves to satisfy entire worlddemand for over a year.
Portuguese energy policy
Portuguese energy policyin perspective
Network infrastructure
Business activity in 2009 | 35
However, Gazprom, which currently supplies about25% of all natural gas consumed in the EU, hasdelayed development of the deposits in the Arctic'sYamal Peninsula because of the roughly 36% drop in natural gas sales to Europe compared to 2008,resulting from the economic crisis. Owing to the ongoing pricing dispute between Russiaand Ukraine, 2009 saw the largest ever natural gassecurity-of-supply crisis. Countries that have no storage capacity, principallythose in Eastern Europe, suffered major interruptionsin natural gas supply, illustrating once again that natural gas does not flow freely across borders. This was because there is no physical interconnectioncapacity that can reverse the flow of natural gas in a west-east direction, or in some cases the lack of sufficiently rapid market mechanisms to deal with situations of this kind. Following that crisis, new steps were taken to increasethe flexibility and transparency of the European natural gas market. However, more investment will be required in diversifying sources and increasing the interconnection capacity between states, togetherwith a major commitment to develop undergroundstorage capacity.
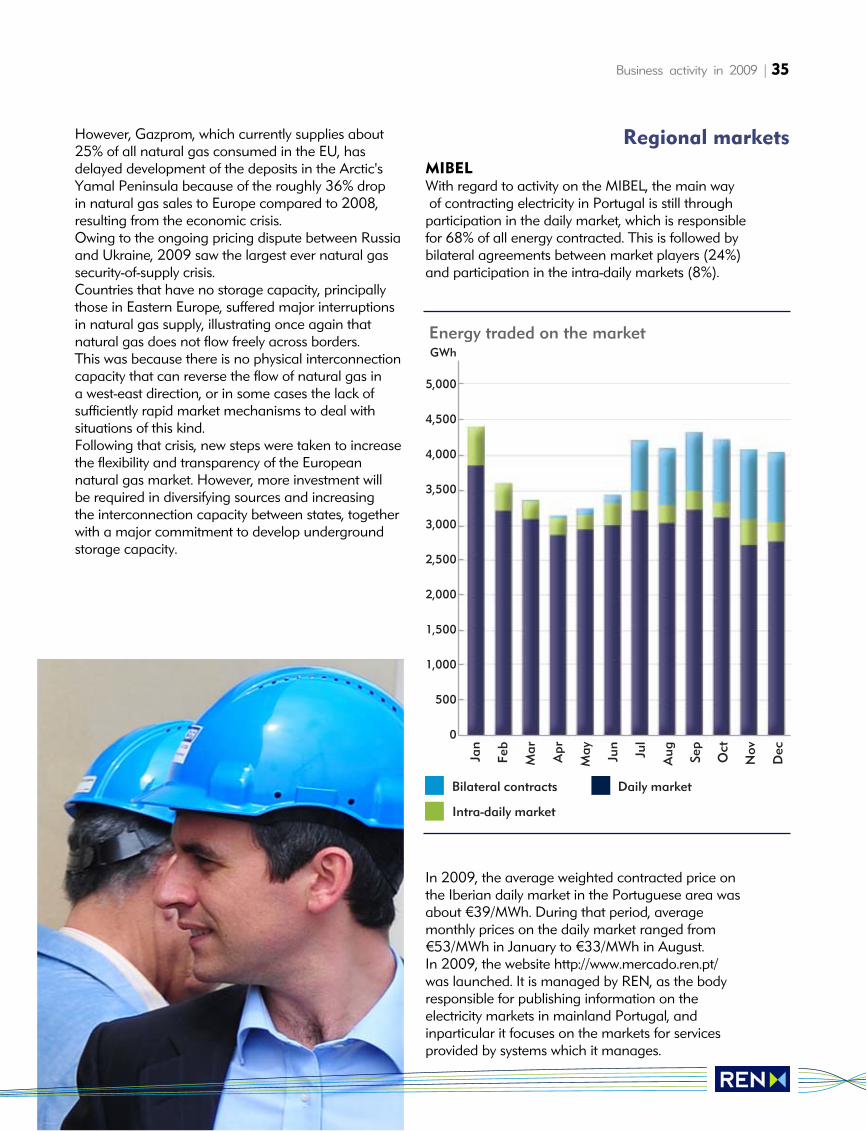
MIBELWith regard to activity on the MIBEL, the main wayof contracting electricity in Portugal is still through
participation in the daily market, which is responsiblefor 68% of all energy contracted. This is followed bybilateral agreements between market players (24%)and participation in the intra-daily markets (8%).
In 2009, the average weighted contracted price onthe Iberian daily market in the Portuguese area wasabout €39/MWh. During that period, average monthly prices on the daily market ranged from€53/MWh in January to €33/MWh in August.In 2009, the website http://www.mercado.ren.pt/was launched. It is managed by REN, as the bodyresponsible for publishing information on the electricity markets in mainland Portugal, and inparticular it focuses on the markets for services provided by systems which it manages.
Regional markets
Intra-daily market
GWh
5,000
4,500
4,000
3,500
3,000
2,500
2,000
1,500
1,000
500
0
Bilateral contracts
Jan
Feb
Mar
Apr
May Jun
Jul
Aug Se
p
Oct
Nov
Dec
Daily market
Energy traded on the market
MIBGÁSThe development of MIBGÁS is one of the prioritiesof the Gas Regional Initiative - South (GRI-S), whichencompasses France, Spain and Portugal. In 2009,its main concern was REN and Enagás's ongoing feasibility study of a third interconnection between the Portuguese and Spanish gas systems. The newpipeline would have a reversible capacity, and it isincluded in the European Economic Recovery Plan.The main advantages of that interconnection wouldbe greater security of supply for both countries, and a joint improvement in their sources of supply, via the establishment of a connecting axis between twomajor underground storage facilities: Yela in Spain,which is under construction, and Carriço in Portugal,which is already being operated and developed. Itprovides immediate advantages for the liquidity of thenatural gas market and because it provides flexibilityfor market players. The new interconnection will alsobe a development factor, by enabling natural gas tobe supplied to inland north-east Portugal.
ElectricityIn 2009, the tendency of the highest-voltage customers to leave the liberalised market went intoreverse. As a result, there was a very significant rise in consumption supplied by the liberalised market,which at the end of 2009 accounted for about 30%of consumption within the national electricity system,as opposed to less than 2% at the end of 2008.Following the Competition Authority's decision of 27 June 2008 to require energy management for the Aguieira and Raiva hydroelectric facilities to betransferred for a period of five years, in exchange for EDP starting to operate the Alqueva hydroelectricplant, Iberdrola Generación began to manage energyat the aforesaid facilities on 1 April 2009.Currently there are 15 active market players, five ofwhich are Portuguese, three of them being generators.
Natural gasOn 1 January 2009, the process of opening up the Portuguese market began to include customerswhose annual consumption is over 10,000 m3 (n), or 120 MWh. In February 2009, in accordance with the TradeRelations Regulation, Galp Gás Natural, S.A., as theauthorised distributor for the National Natural GasSystem (SNGN), auctioned 300 million m 3 (n) viaOMIP for delivery during the 2009-2010 gas year.In June 2009, ERSE, the Energy Services RegulatoryAuthority, changed the Tariff Regulation so as to create a more flexible tariff structure for the useof infrastructure by short-term users, whose consumption is concentrated in time. The changerelated to access to the natural gas transport networkand the LNG terminal at Sines. In the latter case, italso announced the creation from the start of 2010of a mechanism to encourage LNG trading via takeor pay agreements between the incumbent supplierand new low-volume suppliers who wish to use the Sines LNG terminal for deliveries to customers.Also in 2009, ERSE released for public consultation a proposal to amend the regulation of the naturalgas sector, which should take effect in the forthcoming gas year (2010-2011).In July 2009, the Directorate-General of Energy andGeology (DGEG) granted the Turbogás/Tapada doOuteiro and EDP/Lares power stations an exemptionfrom constituting security reserves, owing to the factthat they can both be supplied by an alternative fuel.Given the context, and with the entry into service ofthe REN-C4 cavern at the Carriço underground natural gas storage facility, ERSE, in consultation
36 | Management report
Report and Accounts 2009
Liberalised market in Portugal
Business activity in 2009 | 37
with the SNGN's Overall Technical Manager, decidedto release underground storage capacity for commercialuse. The amount released is equivalent to thereserves released thanks to the aforesaid exemptionduring the 2009-2010 gas year, totalling 573 GWh,and will last for six months starting on 1 January 2010.The extraordinary process undertaken for the sale of that capacity involved advertising, planning andawarding capacity under the specific rules publishedon the ERSE and REN websites.In the first quarter of 2009, in accordance with theCommercial Relations Regulation, ERSE temporarilyawarded management of the process of changingthe authorised distributor to the transport networkoperator, granting that body responsibilities for managing and monitoring the changes. 317 customers had turned to the liberalised marketby the end of 2009, compared to just five customerswho left that market. At the end of 2009 there were 19 market playersoperating on the Portuguese natural gas market.
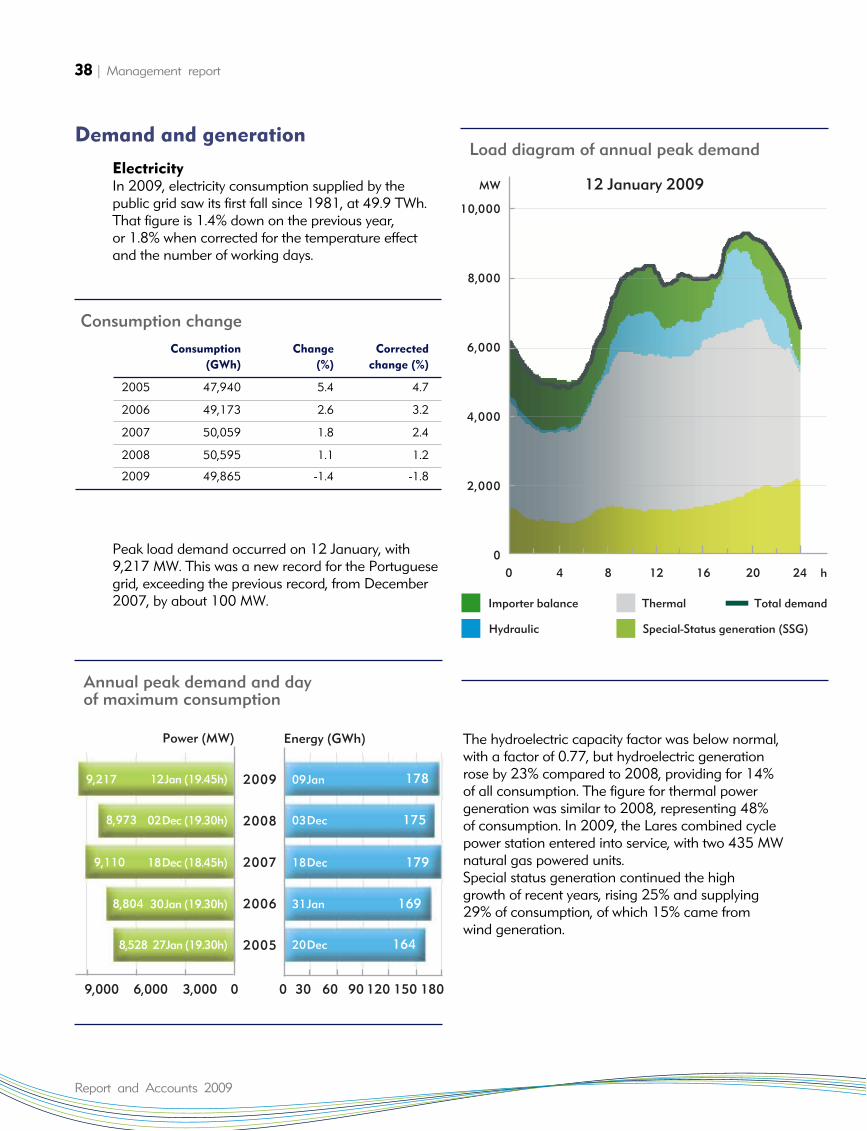
ElectricityIn 2009, electricity consumption supplied by the public grid saw its first fall since 1981, at 49.9 TWh.That figure is 1.4% down on the previous year, or 1.8% when corrected for the temperature effectand the number of working days.
Peak load demand occurred on 12 January, with9,217 MW. This was a new record for the Portuguesegrid, exceeding the previous record, from December2007, by about 100 MW.
The hydroelectric capacity factor was below normal,with a factor of 0.77, but hydroelectric generationrose by 23% compared to 2008, providing for 14% of all consumption. The figure for thermal power generation was similar to 2008, representing 48% of consumption. In 2009, the Lares combined cyclepower station entered into service, with two 435 MWnatural gas powered units.Special status generation continued the high growth of recent years, rising 25% and supplying29% of consumption, of which 15% came from wind generation.
38 | Management report
Report and Accounts 2009
2009
2008
2007
2006
2005
Energy (GWh)
9,000
09Jan
6,000 3,000 0 0 30 60 90 120 150 180
03Dec
18Dec
31Jan
20Dec
Power (MW)
178
175
179
169
164
8,973
9,110
8,528
12Jan (19.45h)
02Dec (19.30h)
18Dec (18.45h)
30Jan (19.30h)
27Jan (19.30h)
9,217
8,804
Annual peak demand and day of maximum consumption
MW
10,000
8,000
6,000
4,000
2,000
0
12 January 2009
0 4 8 12 16 20 24 h
Total demandThermal
Special-Status generation (SSG)Hydraulic
Importer balance
Load diagram of annual peak demand
Consumption Change Corrected
(GWh) (%) change (%)
2005 47,940 5.4 4.7
2006 49,173 2.6 3.2
2007 50,059 1.8 2.4
2008 50,595 1.1 1.2
2009 49,865 -1.4 -1.8
Consumption change
Demand and generation
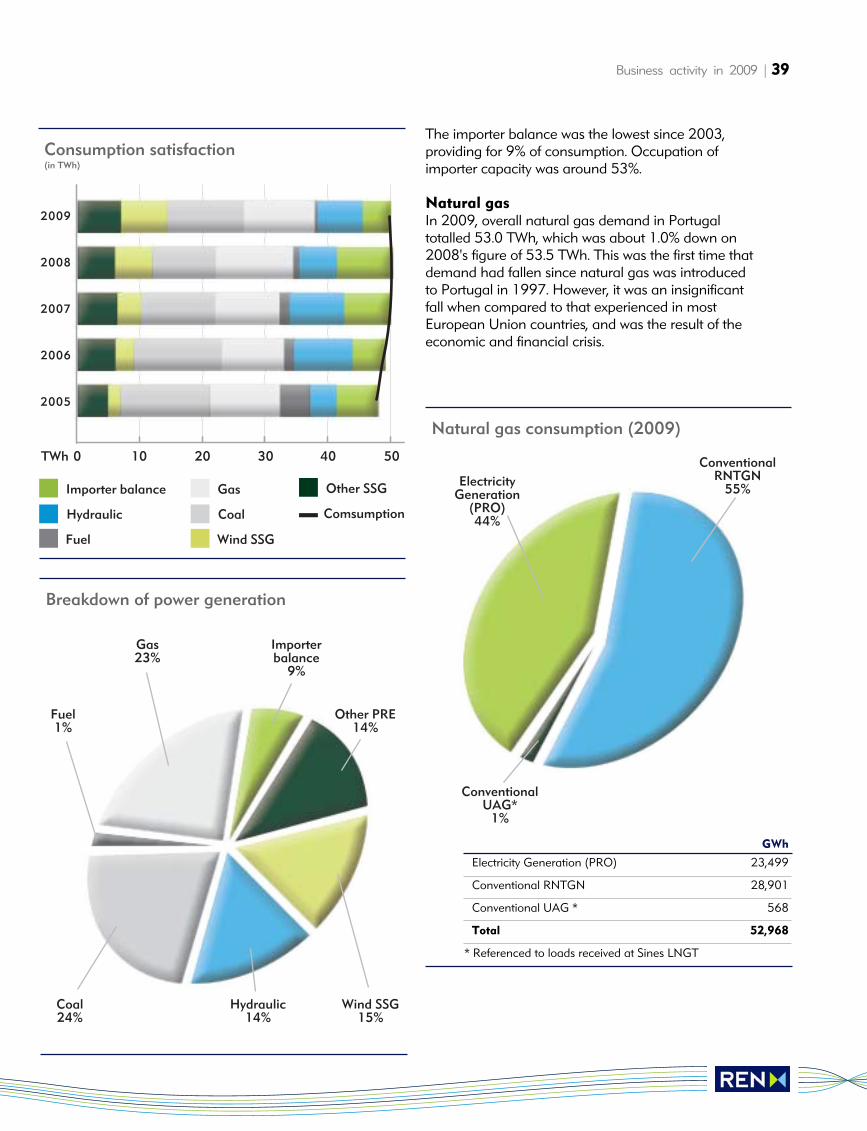
The importer balance was the lowest since 2003, providing for 9% of consumption. Occupation ofimporter capacity was around 53%.
Natural gasIn 2009, overall natural gas demand in Portugaltotalled 53.0 TWh, which was about 1.0% down on2008's figure of 53.5 TWh. This was the first time thatdemand had fallen since natural gas was introducedto Portugal in 1997. However, it was an insignificantfall when compared to that experienced in mostEuropean Union countries, and was the result of theeconomic and financial crisis.
Business activity in 2009 | 39
Hydraulic14%
Fuel1%
Other PRE14%
Importerbalance
9%
Coal24%
Wind SSG15%
Gas23%
Breakdown of power generation
Comsumption
Other SSG
Hydraulic
Fuel
Importer balance
2009
2008
2007
2006
2005
0 10 20 30 40 50TWh
Coal
Wind SSG
Gas
Consumption satisfaction(in TWh)
ElectricityGeneration
(PRO)44%
ConventionalRNTGN
55%
ConventionalUAG*
1%
Natural gas consumption (2009)
GWh
Electricity Generation (PRO) 23,499
Conventional RNTGN 28,901
Conventional UAG * 568
Total 52,968
* Referenced to loads received at Sines LNGT
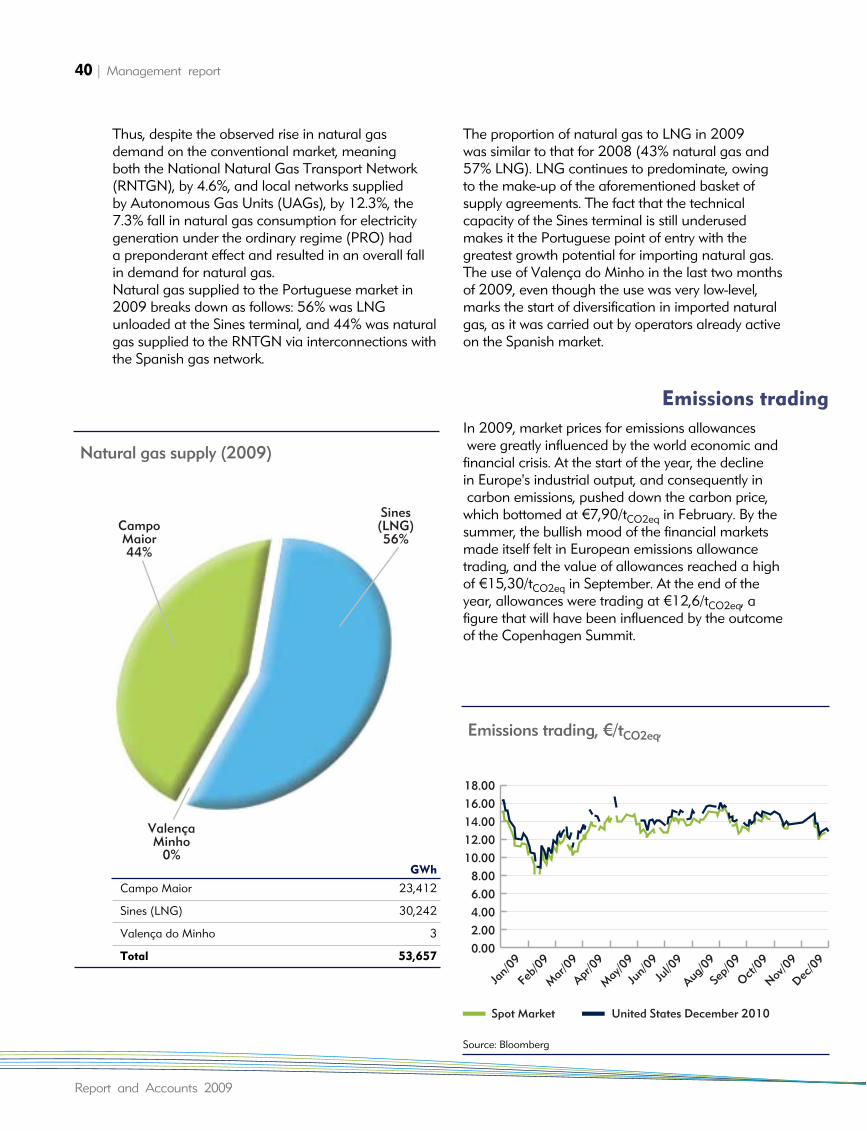
Thus, despite the observed rise in natural gasdemand on the conventional market, meaning both the National Natural Gas Transport Network(RNTGN), by 4.6%, and local networks supplied by Autonomous Gas Units (UAGs), by 12.3%, the7.3% fall in natural gas consumption for electricitygeneration under the ordinary regime (PRO) had a preponderant effect and resulted in an overall fall in demand for natural gas.Natural gas supplied to the Portuguese market in2009 breaks down as follows: 56% was LNGunloaded at the Sines terminal, and 44% was naturalgas supplied to the RNTGN via interconnections withthe Spanish gas network.
The proportion of natural gas to LNG in 2009 was similar to that for 2008 (43% natural gas and57% LNG). LNG continues to predominate, owing to the make-up of the aforementioned basket of supply agreements. The fact that the technical capacity of the Sines terminal is still underused makes it the Portuguese point of entry with the greatest growth potential for importing natural gas.The use of Valença do Minho in the last two monthsof 2009, even though the use was very low-level,marks the start of diversification in imported naturalgas, as it was carried out by operators already activeon the Spanish market.
In 2009, market prices for emissions allowanceswere greatly influenced by the world economic and
financial crisis. At the start of the year, the declinein Europe's industrial output, and consequently incarbon emissions, pushed down the carbon price,
which bottomed at €7,90/tCO2eq in February. By thesummer, the bullish mood of the financial marketsmade itself felt in European emissions allowancetrading, and the value of allowances reached a highof €15,30/tCO2eq in September. At the end of theyear, allowances were trading at €12,6/tCO2eq, a figure that will have been influenced by the outcomeof the Copenhagen Summit.
40 | Management report
Report and Accounts 2009
CampoMaior44%
Sines(LNG)56%
ValençaMinho
0%
Natural gas supply (2009)
GWh
Campo Maior 23,412
Sines (LNG) 30,242
Valença do Minho 3
Total 53,657
Emissions trading
Spot Market United States December 2010
Jan/0
9
Feb/0
9
Dec/0
9
Mar/0
9
Apr/09
May/0
9
Jun/0
9Ju
l/09
Aug/09
Sep/0
9
Oct/09
Nov/09
18.00
16.00
14.00
12.00
10.00
8.00
6.00
4.00
2.00
0.00
Emissions trading, €/tCO2eq,
Source: Bloomberg
Business activity in 2009 | 41
Decree-Law 319/2009 was published on 3 November 2009. It transposes Directive2006/32/EC, on efficient end energy use and onenergy services, into Portuguese law. The Directivesets a general indicative energy saving target of atleast 9% by 2016, to be achieved via energy servicesand other means of improving energy efficiency. As a result of the measures set forth in the NationalPlan of Action for Energy Efficiency (PNAEE) (2008-2015), also known as Portugal Efficiency2015, end energy consumption could be reduced by 10% by 2015, offsetting the 1% per annum rise in Portugal's energy bill between now and that date For electricity, that target means achieving a 7% reduction in consumption by 2015.Under the Plan for the Efficient Use of Electricity(PPEC) 2009-2010, fifty measures have beenapproved which could potentially save about 3,000 GWh - the equivalent of reducing CO2emissions by about one million tonnes. As for electricity generation, with the entry on streamof new combined-cycle natural gas power stationsand the decommissioning of fuel-oil power stations,average thermoelectric energy conversion efficiency is expected to exceed 50% by 2020.
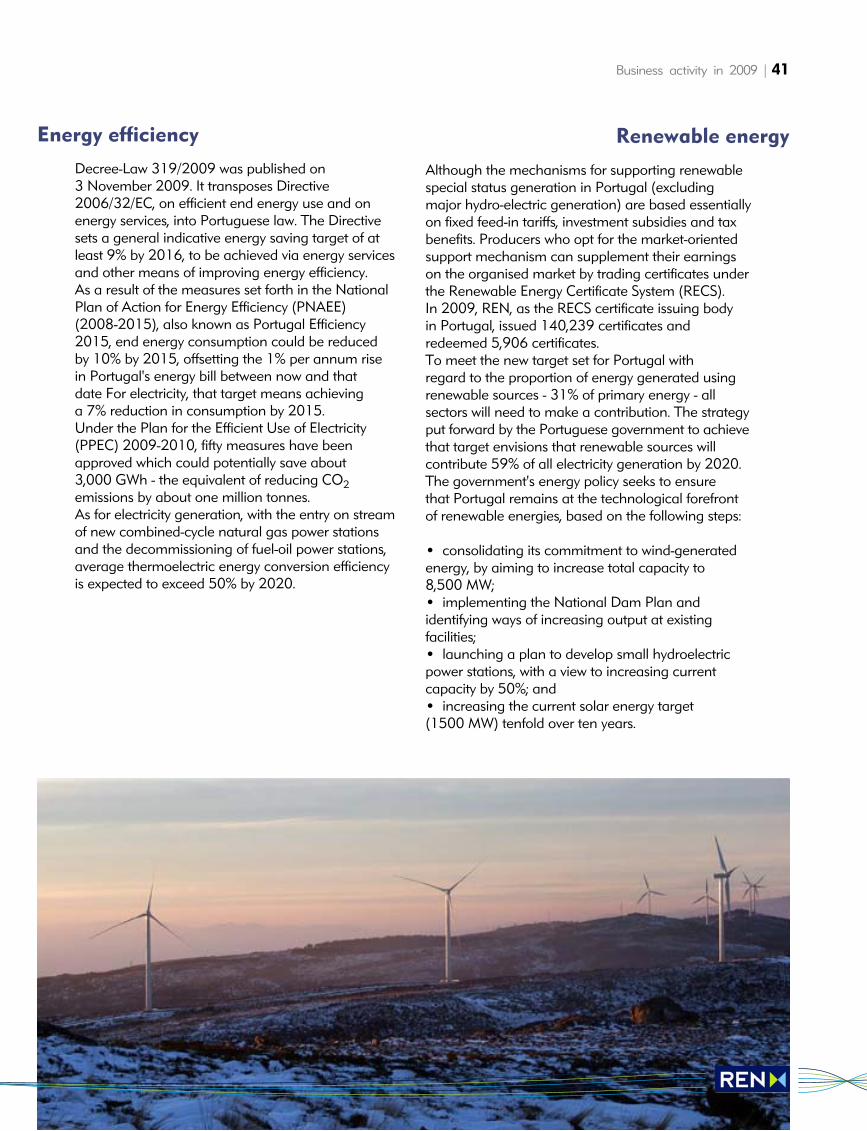
Although the mechanisms for supporting renewablespecial status generation in Portugal (excludingmajor hydro-electric generation) are based essentiallyon fixed feed-in tariffs, investment subsidies and taxbenefits. Producers who opt for the market-orientedsupport mechanism can supplement their earningson the organised market by trading certificates underthe Renewable Energy Certificate System (RECS). In 2009, REN, as the RECS certificate issuing body in Portugal, issued 140,239 certificates andredeemed 5,906 certificates.To meet the new target set for Portugal with regard to the proportion of energy generated usingrenewable sources - 31% of primary energy - all sectors will need to make a contribution. The strategyput forward by the Portuguese government to achievethat target envisions that renewable sources will contribute 59% of all electricity generation by 2020.The government's energy policy seeks to ensure that Portugal remains at the technological forefrontof renewable energies, based on the following steps:
• consolidating its commitment to wind-generatedenergy, by aiming to increase total capacity to 8,500 MW;• implementing the National Dam Plan and identifying ways of increasing output at existing facilities;• launching a plan to develop small hydroelectricpower stations, with a view to increasing currentcapacity by 50%; and• increasing the current solar energy target (1500 MW) tenfold over ten years.
Energy efficiency Renewable energy
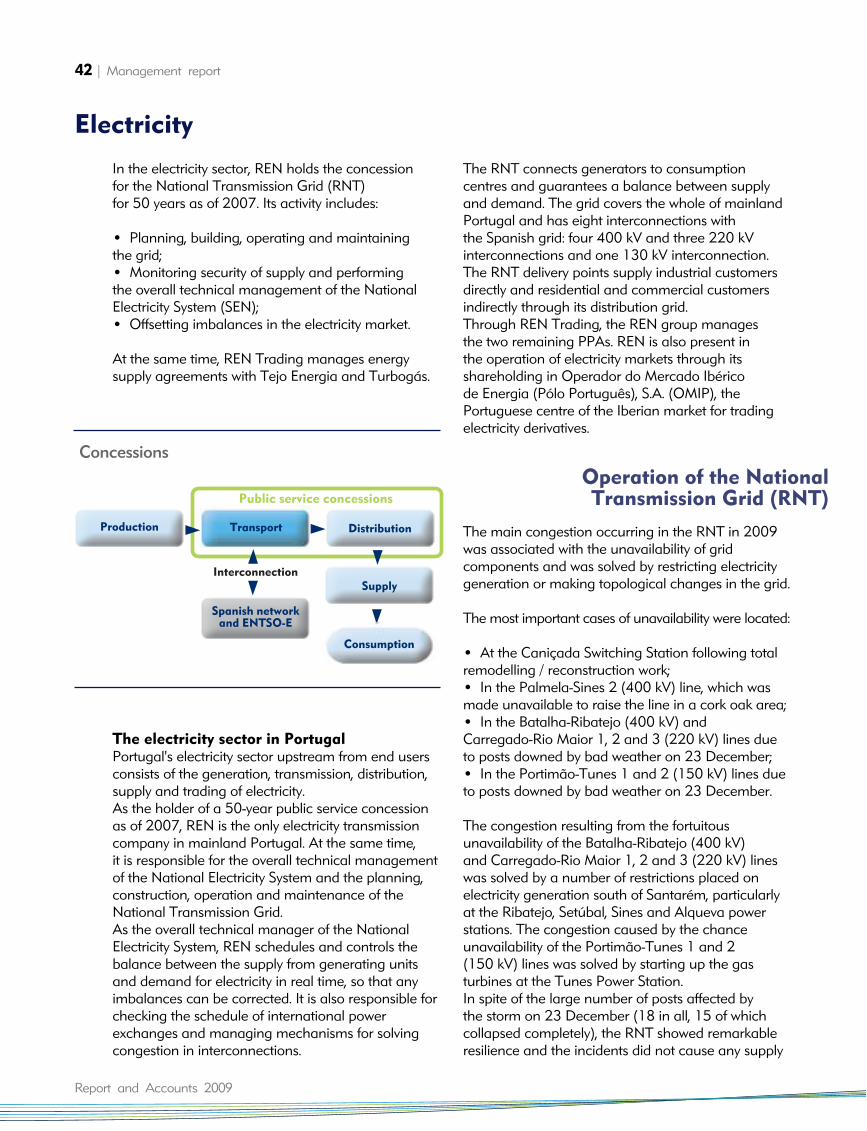
In the electricity sector, REN holds the concession for the National Transmission Grid (RNT) for 50 years as of 2007. Its activity includes:
• Planning, building, operating and maintainingthe grid;• Monitoring security of supply and performingthe overall technical management of the NationalElectricity System (SEN);• Offsetting imbalances in the electricity market.
At the same time, REN Trading manages energy supply agreements with Tejo Energia and Turbogás.
The electricity sector in Portugal Portugal's electricity sector upstream from end usersconsists of the generation, transmission, distribution,supply and trading of electricity. As the holder of a 50-year public service concessionas of 2007, REN is the only electricity transmissioncompany in mainland Portugal. At the same time, it is responsible for the overall technical managementof the National Electricity System and the planning,construction, operation and maintenance of theNational Transmission Grid.As the overall technical manager of the NationalElectricity System, REN schedules and controls thebalance between the supply from generating unitsand demand for electricity in real time, so that anyimbalances can be corrected. It is also responsible forchecking the schedule of international powerexchanges and managing mechanisms for solvingcongestion in interconnections.
The RNT connects generators to consumption centres and guarantees a balance between supplyand demand. The grid covers the whole of mainlandPortugal and has eight interconnections with the Spanish grid: four 400 kV and three 220 kV interconnections and one 130 kV interconnection.The RNT delivery points supply industrial customersdirectly and residential and commercial customersindirectly through its distribution grid.Through REN Trading, the REN group manages the two remaining PPAs. REN is also present in the operation of electricity markets through its shareholding in Operador do Mercado Ibérico de Energia (Pólo Português), S.A. (OMIP), thePortuguese centre of the Iberian market for tradingelectricity derivatives.
The main congestion occurring in the RNT in 2009was associated with the unavailability of grid components and was solved by restricting electricitygeneration or making topological changes in the grid.
The most important cases of unavailability were located:
• At the Caniçada Switching Station following totalremodelling / reconstruction work;• In the Palmela-Sines 2 (400 kV) line, which wasmade unavailable to raise the line in a cork oak area;• In the Batalha-Ribatejo (400 kV) and Carregado-Rio Maior 1, 2 and 3 (220 kV) lines dueto posts downed by bad weather on 23 December;• In the Portimão-Tunes 1 and 2 (150 kV) lines dueto posts downed by bad weather on 23 December.
The congestion resulting from the fortuitous unavailability of the Batalha-Ribatejo (400 kV) and Carregado-Rio Maior 1, 2 and 3 (220 kV) lineswas solved by a number of restrictions placed onelectricity generation south of Santarém, particularlyat the Ribatejo, Setúbal, Sines and Alqueva powerstations. The congestion caused by the chanceunavailability of the Portimão-Tunes 1 and 2 (150 kV) lines was solved by starting up the gas turbines at the Tunes Power Station.In spite of the large number of posts affected by the storm on 23 December (18 in all, 15 of whichcollapsed completely), the RNT showed remarkableresilience and the incidents did not cause any supply
42 | Management report
Electricity
Report and Accounts 2009
Public service concessions
Interconnection
Production
Spanish networkand ENTSO-E
Transport Distribution
Supply
Consumption
Concessions
Operation of the NationalTransmission Grid (RNT)
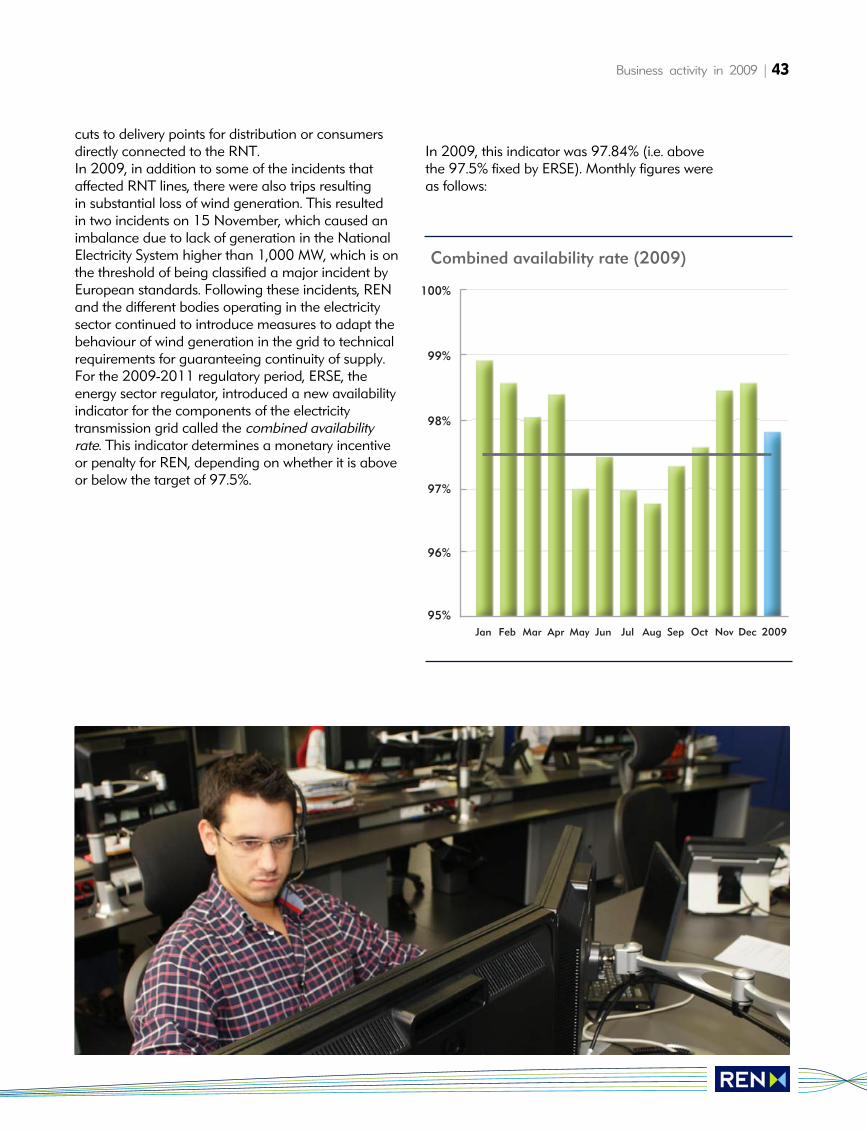
cuts to delivery points for distribution or consumersdirectly connected to the RNT.In 2009, in addition to some of the incidents thataffected RNT lines, there were also trips resulting in substantial loss of wind generation. This resulted in two incidents on 15 November, which caused animbalance due to lack of generation in the NationalElectricity System higher than 1,000 MW, which is onthe threshold of being classified a major incident byEuropean standards. Following these incidents, RENand the different bodies operating in the electricitysector continued to introduce measures to adapt thebehaviour of wind generation in the grid to technicalrequirements for guaranteeing continuity of supply.For the 2009-2011 regulatory period, ERSE, the energy sector regulator, introduced a new availabilityindicator for the components of the electricity transmission grid called the combined availabilityrate. This indicator determines a monetary incentiveor penalty for REN, depending on whether it is aboveor below the target of 97.5%.
In 2009, this indicator was 97.84% (i.e. abovethe 97.5% fixed by ERSE). Monthly figures were as follows:
Business activity in 2009 | 43
Jan Feb Mar Apr May Jun Jul Aug Sep Oct Nov Dec 2009
100%
99%
98%
97%
96%
95%
Combined availability rate (2009)
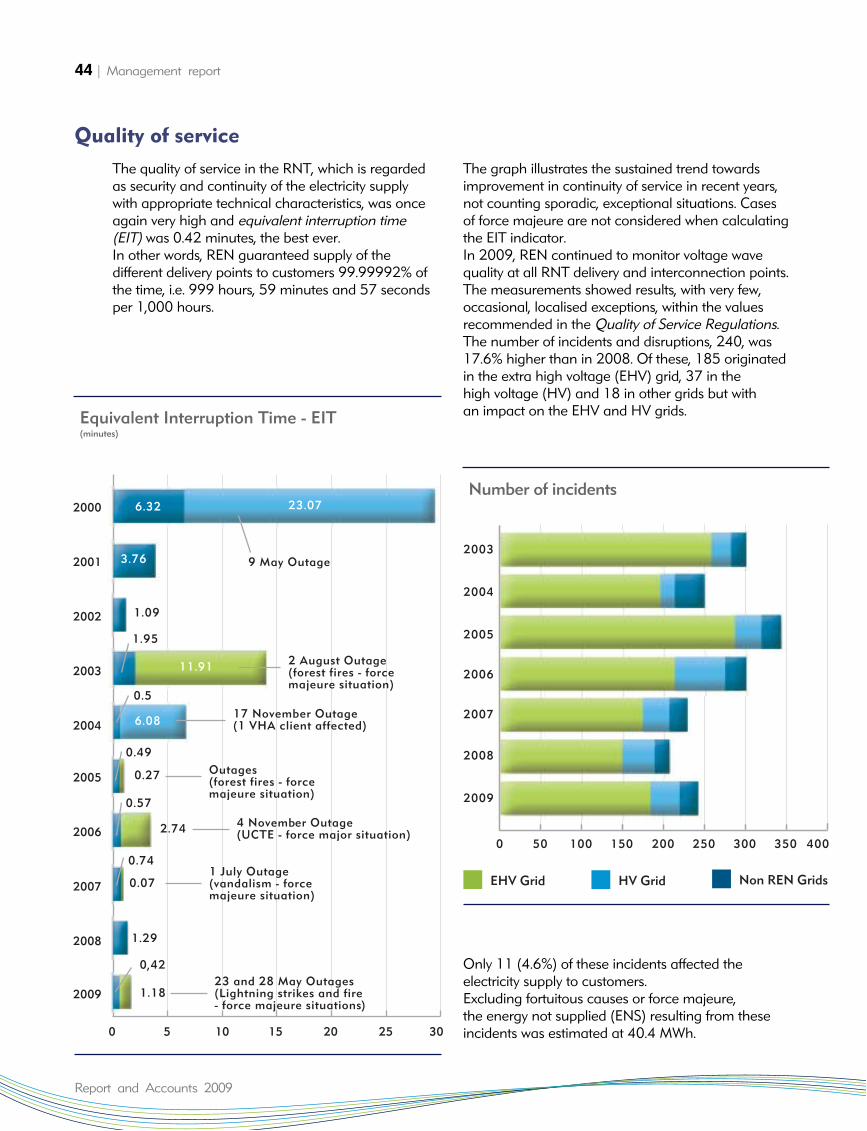
The quality of service in the RNT, which is regardedas security and continuity of the electricity supply with appropriate technical characteristics, was onceagain very high and equivalent interruption time (EIT) was 0.42 minutes, the best ever. In other words, REN guaranteed supply of the different delivery points to customers 99.99992% ofthe time, i.e. 999 hours, 59 minutes and 57 secondsper 1,000 hours.
The graph illustrates the sustained trend towardsimprovement in continuity of service in recent years,not counting sporadic, exceptional situations. Casesof force majeure are not considered when calculatingthe EIT indicator. In 2009, REN continued to monitor voltage wavequality at all RNT delivery and interconnection points.The measurements showed results, with very few,occasional, localised exceptions, within the values recommended in the Quality of Service Regulations.The number of incidents and disruptions, 240, was17.6% higher than in 2008. Of these, 185 originatedin the extra high voltage (EHV) grid, 37 in the high voltage (HV) and 18 in other grids but with an impact on the EHV and HV grids.
Only 11 (4.6%) of these incidents affected the electricity supply to customers. Excluding fortuitous causes or force majeure, the energy not supplied (ENS) resulting from theseincidents was estimated at 40.4 MWh.
44 | Management report
Quality of service
Report and Accounts 2009
0 5 10 15 20 25 30
2000
2001
2002
2003
2004
2005
2006
2007
2008
2009
6.32 23.07
3.76
1.09
1.95
11.91
6.08
0.5
0.49
0.27
0.57
2.74
0.74
0.07
1.29
0,42
1.1823 and 28 May Outages(Lightning strikes and fire- force majeure situations)
1 July Outage(vandalism - forcemajeure situation)
4 November Outage(UCTE - force major situation)
Outages(forest fires - forcemajeure situation)
17 November Outage(1 VHA client affected)
2 August Outage(forest fires - forcemajeure situation)
9 May Outage
Equivalent Interruption Time - EIT(minutes)
Number of incidents
0 50 100 150 200 250 300 350 400
2003
2004
2005
2006
2007
2008
2009
Non REN GridsEHV Grid HV Grid
Business activity in 2009 | 45
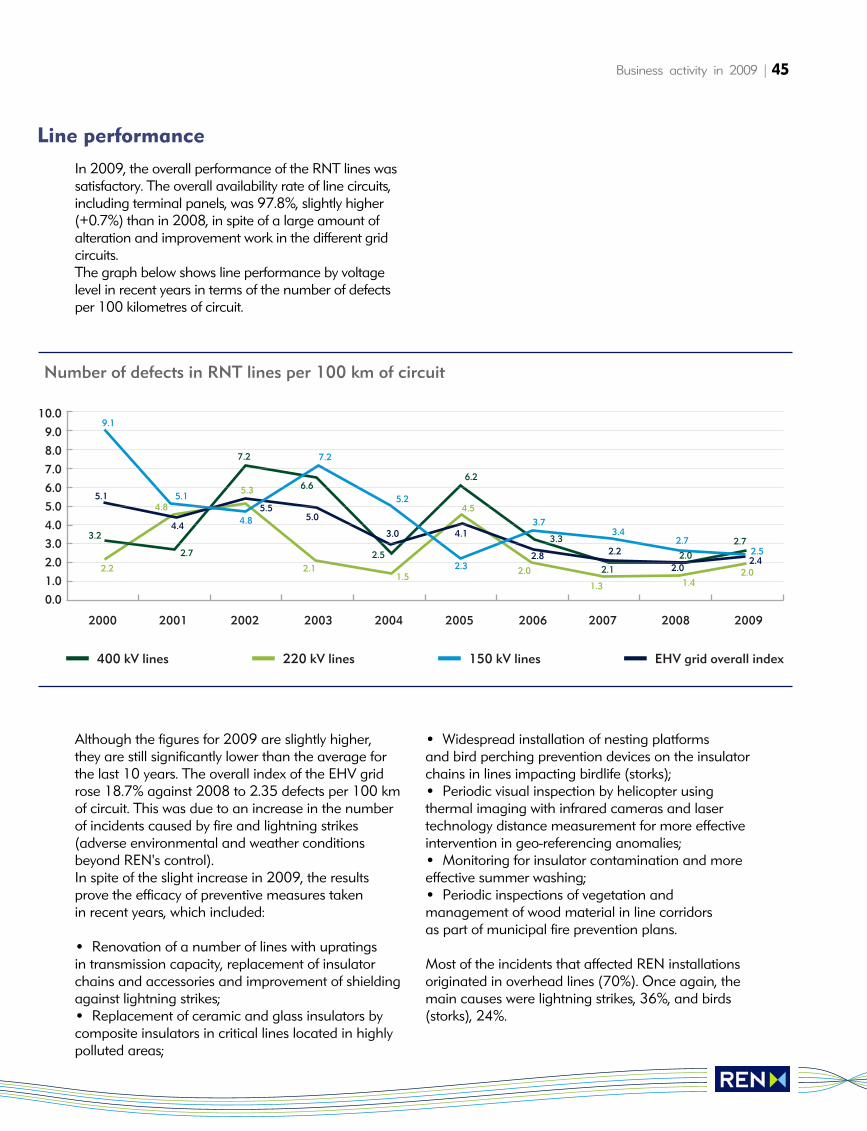
Line performance
In 2009, the overall performance of the RNT lines wassatisfactory. The overall availability rate of line circuits,including terminal panels, was 97.8%, slightly higher(+0.7%) than in 2008, in spite of a large amount ofalteration and improvement work in the different gridcircuits.The graph below shows line performance by voltagelevel in recent years in terms of the number of defectsper 100 kilometres of circuit.
Although the figures for 2009 are slightly higher,they are still significantly lower than the average forthe last 10 years. The overall index of the EHV gridrose 18.7% against 2008 to 2.35 defects per 100 kmof circuit. This was due to an increase in the numberof incidents caused by fire and lightning strikes(adverse environmental and weather conditionsbeyond REN's control).In spite of the slight increase in 2009, the resultsprove the efficacy of preventive measures takenin recent years, which included:
• Renovation of a number of lines with upratingsin transmission capacity, replacement of insulatorchains and accessories and improvement of shieldingagainst lightning strikes;• Replacement of ceramic and glass insulators bycomposite insulators in critical lines located in highlypolluted areas;
• Widespread installation of nesting platforms and bird perching prevention devices on the insulatorchains in lines impacting birdlife (storks);• Periodic visual inspection by helicopter usingthermal imaging with infrared cameras and lasertechnology distance measurement for more effectiveintervention in geo-referencing anomalies;• Monitoring for insulator contamination and moreeffective summer washing;• Periodic inspections of vegetation and management of wood material in line corridors as part of municipal fire prevention plans.
Most of the incidents that affected REN installationsoriginated in overhead lines (70%). Once again, themain causes were lightning strikes, 36%, and birds(storks), 24%.
10.0
9.0
8.0
7.0
6.0
5.0
4.0
3.0
2.0
1.0
0.0
2000 2001 2002 2003 2004 2005 2006 2007 2008 2009
400 kV lines 220 kV lines 150 kV lines EHV grid overall index
3.2
2.7
7.2
6.6
2.5
6.2
3.3
2.1
2.7
2.02.2
4.8
5.3
2.11.5
4.5
2.0
1.3 1.42.0
9.1
5.1
4.8
7.2
5.2
2.3
3.73.4
2.72.5
5.1
4.4
5.55.0
3.0 4.1
2.8 2.2
2.02.4
Number of defects in RNT lines per 100 km of circuit

In general, our substations performed well and thenumber of faults in transformers was substantiallylower than in 2008. The number of faults in circuitbreakers was also down in 2009. Overall availability of transformers and autotransformers (including their panels) was 98%, a very similar figure to 2008 (+0.1%), mainly thanksto remodelling and replacement of HV equipmentand power transformers in 2009.
A number of important efforts were completed in theRNT in 2009, with a view to increasing capacity forrenewable energy reception, power exchanges withthe Spanish grid and supply to distribution grids.
Main investments completed in 2009In 2009, the new Lagoaça substation was opened inthe municipality of Freixo de Espada à Cinta, which is still operating only as a 220 kV switching station in this phase. Some 220 kV lines located in this areaof Douro Internacional were diverted to the new facility, including the two interconnection lines withthe Spanish Aldeadávila substation.The Caniçada 150 kV switching station, which now belongs to REN, S.A., underwent major remodelling to remedy the advanced obsolescence of its equipment.In the Centro area, REN opened the new Tábua220/60 kV substation and diverted the 220 kV Vila Chã - Pereiros 1 and 2 lines to it, the branch of the latter to the Pampilhosa da Serra wind farmand completed the construction of the 220 kVPenela - Tábua line.In inland Alto Alentejo, the Falagueira -Estremoz line went into service, insulated for 400 kV buttemporarily operating at 150 kV, which supplies thenew Estremoz 150/60 kV substation.In Lisbon, two 220 kV underground lines were set upbetween the Alto de Mira substation and Zambujal,where REN is going to build a new substation. Untilthe Zambujal 220/60 kV substation is opened, thesetwo connections will operate at 60 kV and supply theexisting EDP Distribuição substation.Two 400 kV connections were also put into operationbetween the Lavos substation and the new Lares thermoelectric power station for connection to the grid.We also put into service a 150/130 kV, 140 MVAtransformer at the Pedralva substation, the second
400/150 kV, 450 MVA lag autotransformer at theFalagueira substation, the second 400/150 kV, 250 MVA autotransformer at the Ferreira do Alentejosubstation, which came from Falagueira, and the first 400/150 kV, 450 MVA autotransformer at thePortimão substation.Where the total number of new units was concerned,eight transformers (total power of 1,198 MVA) andtwo autotransformers (900 MVA) were put into service. REN also reinforced the transmission capacityof some lines in the Lisbon area and installed 50 Mvar in new condenser batteries.Several 60 kV panels were built in RNT substationsalready on line to make it possible to perform andconnect new special status generation, especiallywind farms (in Frades, Vila Pouca de Aguiar andCarrapatelo).
Main investments in progressTo step up interconnection capacities betweenPortugal and Spain:
• In Douro Internacional, the 400 kV voltage level is being introduced at the Lagoaça substation and a400 kV interconnection is being established betweenLagoaça and the Spanish Aldeadávila substation. At the same time, another 400 kV circuit will also beset up to connect Lagoaça to the future Armamarsubstation;• In the Algarve, a new 400 kV interconnection isbeing closed to link the future Tavira substation withthe current Spanish Guillena facility.
To connect new special status generators to the RNT:
• The 220 kV grid in Trás-os-Montes, from Lagoaçain Douro Internacional to Valdigem, is being closedand will pass through the existing substations atMacedo de Cavaleiros and Vila Pouca de Aguiar and the future one in Valpaços;• A 220 kV connection is being established between the Vila Pouca de Aguiar and Carrapatelosubstations, going round Serra do Alvão to the north.Most of its route will be built as double 400+220 kV,thereby preparing for future inclusion in the PNBEPHgrid located in the Alto Tâmega area;• The Armamar substation will be opened and the operating voltage of the Armamar - Bodiosa -Paraimo axis will be changed to 400 kV;• A new double 400+150 kV line is being builtbetween Castelo Branco and Falagueira, though it will initially only operate at 150 kV.
46 | Management report
Performance of substations
Report and Accounts 2009
Investments in the NationalTransmission Grid (RNT)
Business activity in 2009 | 47
To connect new major ordinary status power stationsto the RNT:
• We are reinforcing the 220 kV axis going from thePicote switching station, which will be totally rebuilt, to the Lagoaça substation in order to distribute generation from new generation groups associatedwith increases in power at the Picote and Bempostapower stations. This reinforcement of the grid will beachieved with a new line, the first section of which willhave only 220 kV and the second will be double, within 400 kV and another 220 kV circuit;• The new 400 kV connections are being completedbetween Batalha - Lavos and Lavos - Paraimo, in central Portugal, and the Marateca area - Fanhões,in the Lisbon/Setúbal area and the Lavos and Sinessubstations and the Pego switching station are beingremodelled or enlarged for inclusion in the RNT ofthe new combined cycle natural gas power stations(Figueira da Foz, Pego and Sines) for which theDGEG has fixed a capacity reserve.
To supply consumption points and support distribution grids:
• In Minho, a new 150/60 kV substation is being set up in Vizela/Felgueiras;• In Trás-os-Montes, the Valpaços 220/60 kVsubstation is being opened;• In Porto, REN is creating a 220/60 kV injector at Prelada, a substation to which a 220 kV underground circuit will be built from Vermoim andremodelling to 220/60 kV the existing Ermesinde150/60 kV substation with a level of 220 kV supplied by two new partially overhead and partiallyunderground circuits;• We are building the new Feira 400/60 kV substation in southern Douro Litoral;• The Carregado - Rio Maior 1 connection is beingconverted to double 400+220 kV in the northernLisbon area;• In the Lisbon region, 220/60 kV substations arebeing opened at Zambujal and Alto de S. João, bothsupplied by two underground cables, the former fromAlto de Mira (already built and in operation at 60 kV)and the second from Sacavém,• In the Setúbal Peninsula, the second 150 kVFernão Ferro -Trafaria line is being completed and400 kV voltage is being introduced into the presentFernão Ferro substation, which will be completelyremodelled;• In the Algarve, a new 150 kV line is being set up between the Portimão and Tunes substations and a 400 kV line between the Portimão and Tavira
substations and the Tavira substation will be openedat 400, 150 and 60 kV;• The transmission capacity of some existing RNTlines is being increased.
To supply large high-voltage customers - planned:
• In order to supply the high-speed railway line inthe Portuguese section of the Lisbon - Madrid line,the plan is to change the operating voltage of theFalagueira - Estremoz line and Estremoz substation to400 kV and close the 400 kV grid between Estremozand Palmela by building the Estremoz - Divor (Évora)- Pegões - Palmela axis;• We will establish supply connections to rail tractionsubstations starting at the present RNT substation in Estremoz and in the future Divor and Pegõessubstations, all at 400 kV.
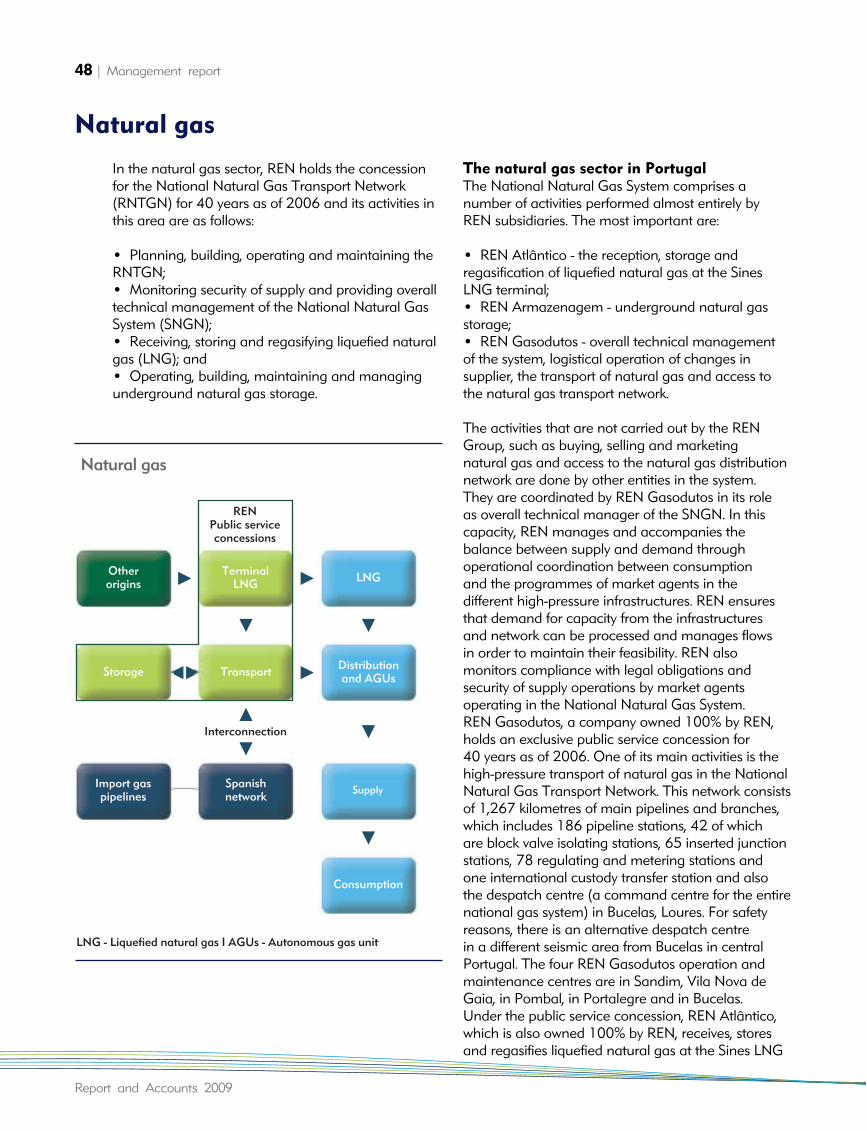
In the natural gas sector, REN holds the concessionfor the National Natural Gas Transport Network(RNTGN) for 40 years as of 2006 and its activities inthis area are as follows:
• Planning, building, operating and maintaining theRNTGN;• Monitoring security of supply and providing overalltechnical management of the National Natural GasSystem (SNGN);• Receiving, storing and regasifying liquefied naturalgas (LNG); and• Operating, building, maintaining and managingunderground natural gas storage.
The natural gas sector in PortugalThe National Natural Gas System comprises a number of activities performed almost entirely byREN subsidiaries. The most important are:
• REN Atlântico - the reception, storage andregasification of liquefied natural gas at the SinesLNG terminal;• REN Armazenagem - underground natural gasstorage;• REN Gasodutos - overall technical managementof the system, logistical operation of changes insupplier, the transport of natural gas and access tothe natural gas transport network.
The activities that are not carried out by the RENGroup, such as buying, selling and marketingnatural gas and access to the natural gas distributionnetwork are done by other entities in the system.They are coordinated by REN Gasodutos in its role as overall technical manager of the SNGN. In thiscapacity, REN manages and accompanies the balance between supply and demand through operational coordination between consumption and the programmes of market agents in the different high-pressure infrastructures. REN ensuresthat demand for capacity from the infrastructures and network can be processed and manages flows in order to maintain their feasibility. REN also monitors compliance with legal obligations and security of supply operations by market agents operating in the National Natural Gas System.REN Gasodutos, a company owned 100% by REN,holds an exclusive public service concession for 40 years as of 2006. One of its main activities is thehigh-pressure transport of natural gas in the NationalNatural Gas Transport Network. This network consistsof 1,267 kilometres of main pipelines and branches,which includes 186 pipeline stations, 42 of whichare block valve isolating stations, 65 inserted junctionstations, 78 regulating and metering stations andone international custody transfer station and alsothe despatch centre (a command centre for the entirenational gas system) in Bucelas, Loures. For safetyreasons, there is an alternative despatch centre in a different seismic area from Bucelas in centralPortugal. The four REN Gasodutos operation andmaintenance centres are in Sandim, Vila Nova deGaia, in Pombal, in Portalegre and in Bucelas.Under the public service concession, REN Atlântico,which is also owned 100% by REN, receives, storesand regasifies liquefied natural gas at the Sines LNG
48 | Management report
Natural gas
Report and Accounts 2009
Storage Transport Distributionand AGUs
Import gaspipelines
Spanishnetwork Supply
Consumption
Otherorigins
TerminalLNG LNG
Interconnection
RENPublic serviceconcessions
LNG - Liquefied natural gas I AGUs - Autonomous gas unit
Natural gas
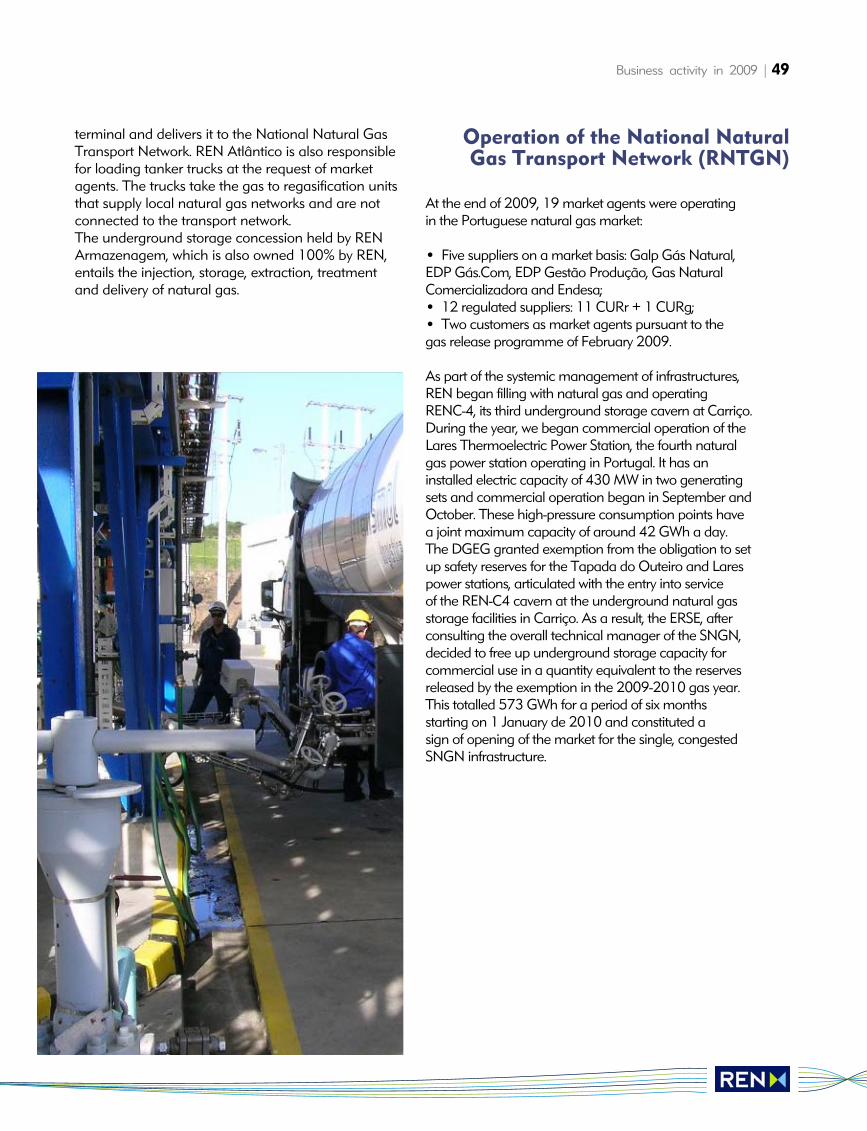
Business activity in 2009 | 49
terminal and delivers it to the National Natural GasTransport Network. REN Atlântico is also responsiblefor loading tanker trucks at the request of marketagents. The trucks take the gas to regasification unitsthat supply local natural gas networks and are notconnected to the transport network.The underground storage concession held by RENArmazenagem, which is also owned 100% by REN,entails the injection, storage, extraction, treatmentand delivery of natural gas.
At the end of 2009, 19 market agents were operating in the Portuguese natural gas market:
• Five suppliers on a market basis: Galp Gás Natural,EDP Gás.Com, EDP Gestão Produção, Gas NaturalComercializadora and Endesa;• 12 regulated suppliers: 11 CURr + 1 CURg;• Two customers as market agents pursuant to the gas release programme of February 2009.
As part of the systemic management of infrastructures,REN began filling with natural gas and operating RENC-4, its third underground storage cavern at Carriço.During the year, we began commercial operation of theLares Thermoelectric Power Station, the fourth naturalgas power station operating in Portugal. It has aninstalled electric capacity of 430 MW in two generatingsets and commercial operation began in September andOctober. These high-pressure consumption points havea joint maximum capacity of around 42 GWh a day.The DGEG granted exemption from the obligation to setup safety reserves for the Tapada do Outeiro and Larespower stations, articulated with the entry into service of the REN-C4 cavern at the underground natural gasstorage facilities in Carriço. As a result, the ERSE, afterconsulting the overall technical manager of the SNGN,decided to free up underground storage capacity forcommercial use in a quantity equivalent to the reservesreleased by the exemption in the 2009-2010 gas year.This totalled 573 GWh for a period of six months starting on 1 January de 2010 and constituted a sign of opening of the market for the single, congestedSNGN infrastructure.
Operation of the National NaturalGas Transport Network (RNTGN)
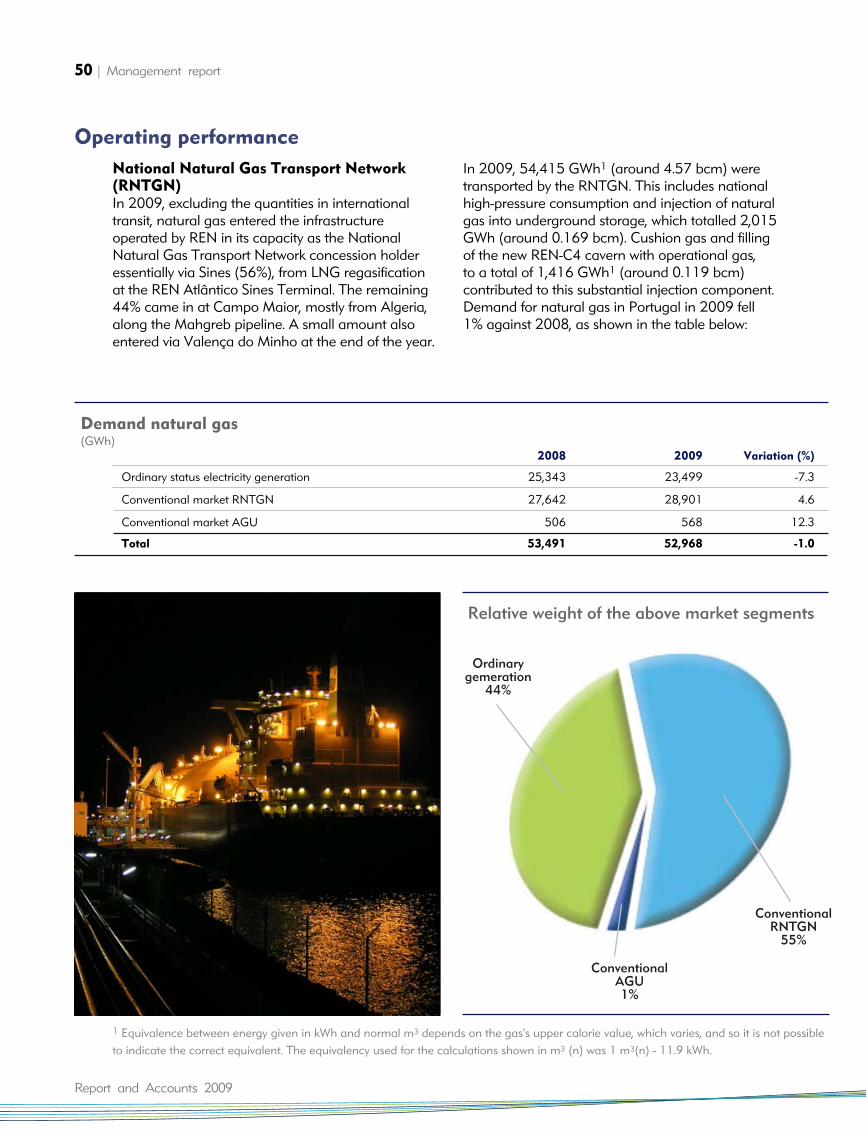
National Natural Gas Transport Network(RNTGN)In 2009, excluding the quantities in internationaltransit, natural gas entered the infrastructure operated by REN in its capacity as the NationalNatural Gas Transport Network concession holderessentially via Sines (56%), from LNG regasificationat the REN Atlântico Sines Terminal. The remaining44% came in at Campo Maior, mostly from Algeria,along the Mahgreb pipeline. A small amount alsoentered via Valença do Minho at the end of the year.
In 2009, 54,415 GWh1 (around 4.57 bcm) weretransported by the RNTGN. This includes nationalhigh-pressure consumption and injection of naturalgas into underground storage, which totalled 2,015GWh (around 0.169 bcm). Cushion gas and filling of the new REN-C4 cavern with operational gas, to a total of 1,416 GWh1 (around 0.119 bcm) contributed to this substantial injection component.Demand for natural gas in Portugal in 2009 fell 1% against 2008, as shown in the table below:
50 | Management report
Operating performance
Report and Accounts 2009
2008 2009 Variation (%)
Ordinary status electricity generation 25,343 23,499 -7.3
Conventional market RNTGN 27,642 28,901 4.6
Conventional market AGU 506 568 12.3
Total 53,491 52,968 -1.0
Demand natural gas(GWh)
1 Equivalence between energy given in kWh and normal m3 depends on the gas's upper calorie value, which varies, and so it is not possibleto indicate the correct equivalent. The equivalency used for the calculations shown in m3 (n) was 1 m3(n) - 11.9 kWh.
ConventionalAGU1%
ConventionalRNTGN
55%
Ordinarygemeration
44%
Relative weight of the above market segments
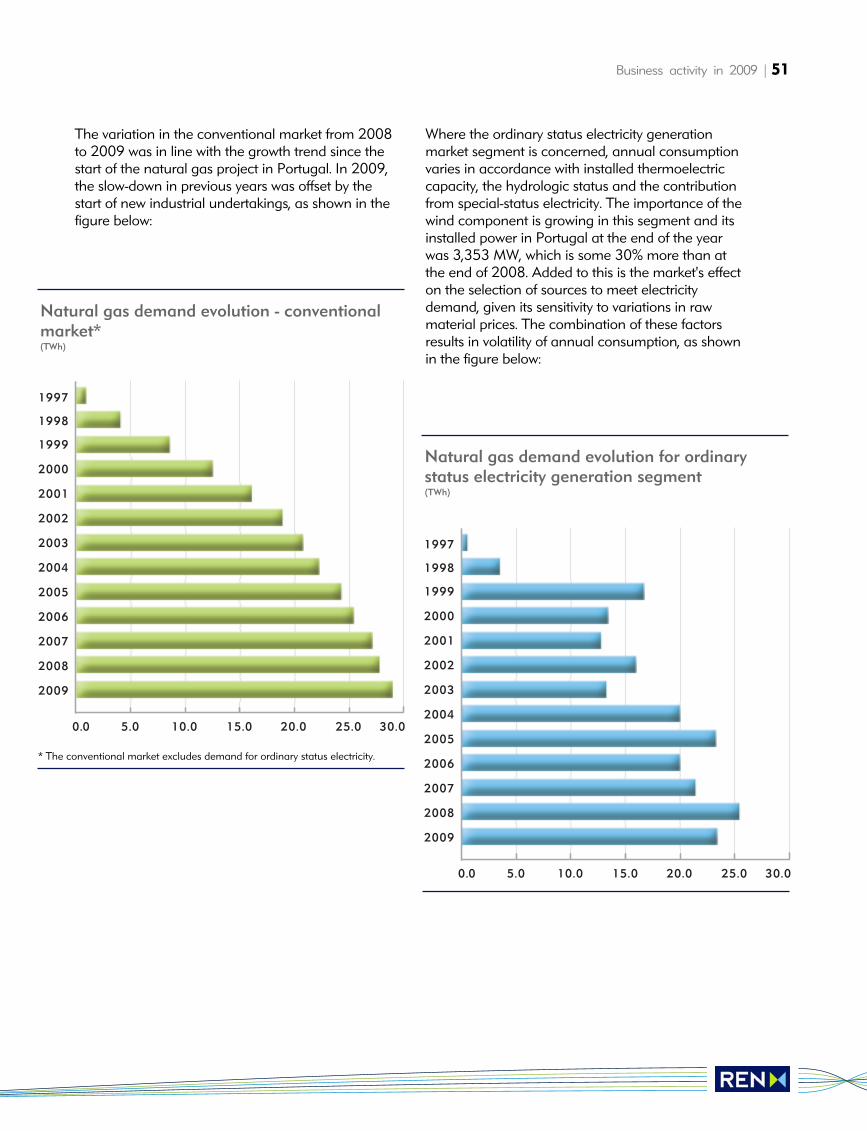
Business activity in 2009 | 51
The variation in the conventional market from 2008to 2009 was in line with the growth trend since thestart of the natural gas project in Portugal. In 2009,the slow-down in previous years was offset by thestart of new industrial undertakings, as shown in thefigure below:
Where the ordinary status electricity generation market segment is concerned, annual consumptionvaries in accordance with installed thermoelectriccapacity, the hydrologic status and the contributionfrom special-status electricity. The importance of thewind component is growing in this segment and itsinstalled power in Portugal at the end of the yearwas 3,353 MW, which is some 30% more than atthe end of 2008. Added to this is the market's effecton the selection of sources to meet electricitydemand, given its sensitivity to variations in rawmaterial prices. The combination of these factorsresults in volatility of annual consumption, as shownin the figure below:
0.0 5.0 10.0 15.0 20.0 25.0 30.0
1997
1998
1999
2000
2001
2002
2003
2004
2005
2006
2007
2008
2009
Natural gas demand evolution - conventionalmarket*(TWh)
* The conventional market excludes demand for ordinary status electricity.
0.0 5.0 10.0 15.0 20.0 25.0 30.0
1997
1998
1999
2000
2001
2002
2003
2004
2005
2006
2007
2008
2009
Natural gas demand evolution for ordinary status electricity generation segment(TWh)
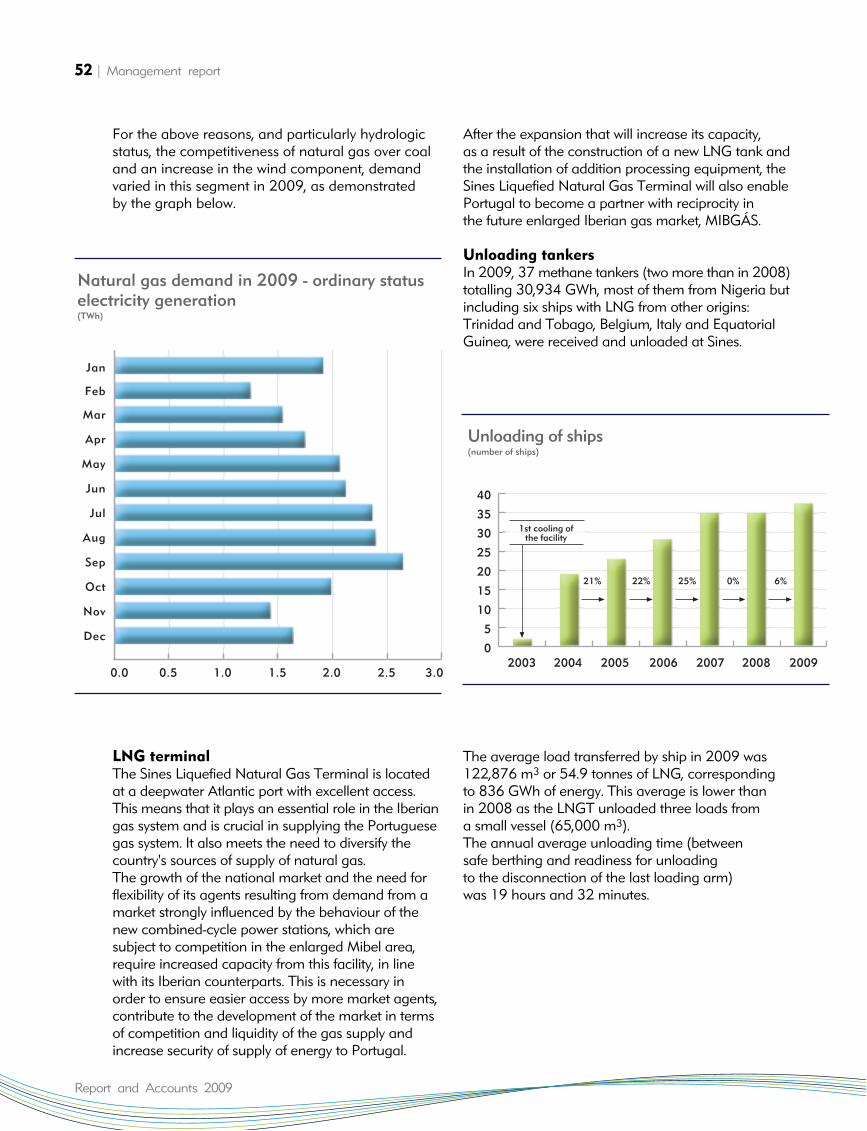
For the above reasons, and particularly hydrologicstatus, the competitiveness of natural gas over coaland an increase in the wind component, demandvaried in this segment in 2009, as demonstratedby the graph below.
LNG terminalThe Sines Liquefied Natural Gas Terminal is locatedat a deepwater Atlantic port with excellent access.This means that it plays an essential role in the Iberiangas system and is crucial in supplying the Portuguesegas system. It also meets the need to diversify thecountry's sources of supply of natural gas. The growth of the national market and the need forflexibility of its agents resulting from demand from amarket strongly influenced by the behaviour of thenew combined-cycle power stations, which are subject to competition in the enlarged Mibel area,require increased capacity from this facility, in linewith its Iberian counterparts. This is necessary inorder to ensure easier access by more market agents,contribute to the development of the market in termsof competition and liquidity of the gas supply andincrease security of supply of energy to Portugal.
After the expansion that will increase its capacity,as a result of the construction of a new LNG tank andthe installation of addition processing equipment, theSines Liquefied Natural Gas Terminal will also enablePortugal to become a partner with reciprocity inthe future enlarged Iberian gas market, MIBGÁS.
Unloading tankersIn 2009, 37 methane tankers (two more than in 2008)totalling 30,934 GWh, most of them from Nigeria butincluding six ships with LNG from other origins:Trinidad and Tobago, Belgium, Italy and EquatorialGuinea, were received and unloaded at Sines.
The average load transferred by ship in 2009 was122,876 m3 or 54.9 tonnes of LNG, correspondingto 836 GWh of energy. This average is lower thanin 2008 as the LNGT unloaded three loads from a small vessel (65,000 m3).The annual average unloading time (betweensafe berthing and readiness for unloading to the disconnection of the last loading arm)was 19 hours and 32 minutes.
52 | Management report
Report and Accounts 2009
0.0 0.5 1.0 1.5 2.0 2.5 3.0
Jan
Feb
Mar
Apr
May
Jun
Jul
Aug
Sep
Oct
Nov
Dec
Natural gas demand in 2009 - ordinary statuselectricity generation(TWh)
40
35
30
25
20
15
10
5
02003 2004 2005 2006 2007 2008 2009
21% 22% 25% 0% 6%
1st cooling ofthe facility
Unloading of ships(number of ships)
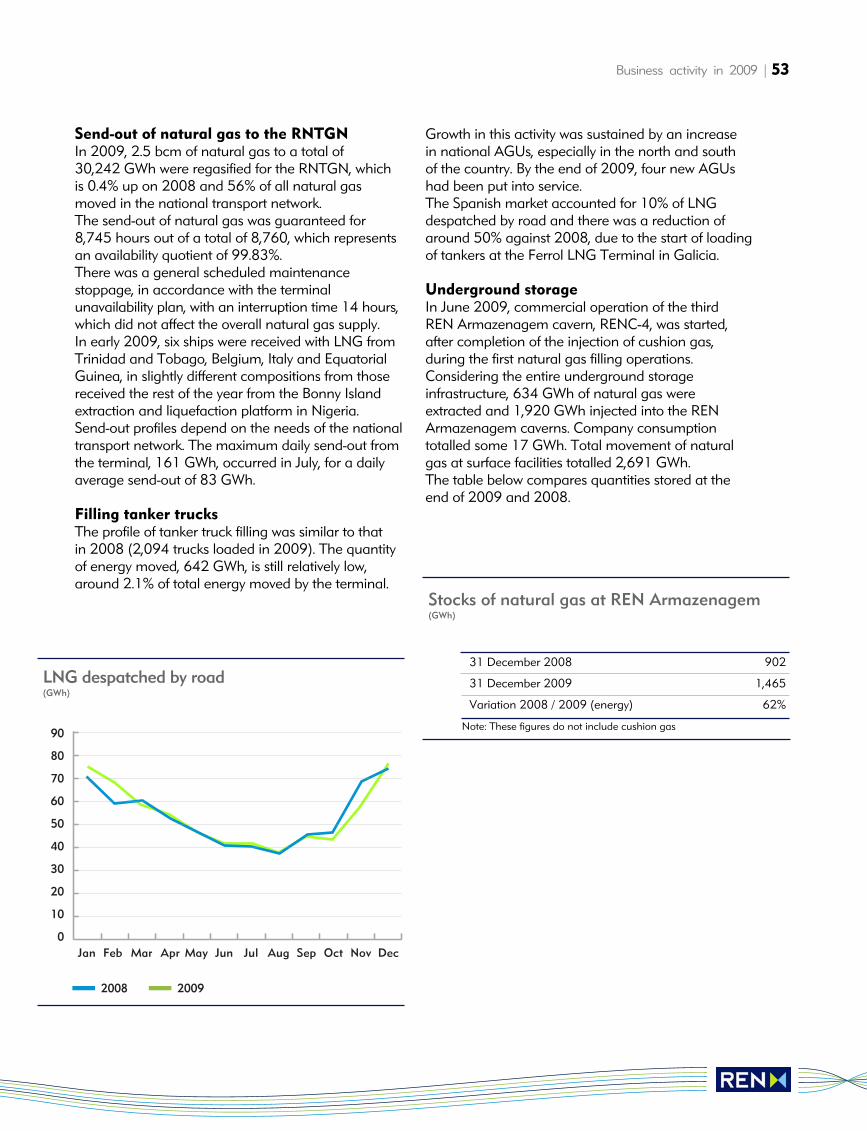
Business activity in 2009 | 53
31 December 2008 902
31 December 2009 1,465
Variation 2008 / 2009 (energy) 62%
Note: These figures do not include cushion gas
Stocks of natural gas at REN Armazenagem(GWh)
Send-out of natural gas to the RNTGNIn 2009, 2.5 bcm of natural gas to a total of 30,242 GWh were regasified for the RNTGN, whichis 0.4% up on 2008 and 56% of all natural gasmoved in the national transport network. The send-out of natural gas was guaranteed for8,745 hours out of a total of 8,760, which representsan availability quotient of 99.83%. There was a general scheduled maintenance stoppage, in accordance with the terminal unavailability plan, with an interruption time 14 hours,which did not affect the overall natural gas supply.In early 2009, six ships were received with LNG fromTrinidad and Tobago, Belgium, Italy and EquatorialGuinea, in slightly different compositions from thosereceived the rest of the year from the Bonny Islandextraction and liquefaction platform in Nigeria. Send-out profiles depend on the needs of the nationaltransport network. The maximum daily send-out fromthe terminal, 161 GWh, occurred in July, for a dailyaverage send-out of 83 GWh.
Filling tanker trucksThe profile of tanker truck filling was similar to thatin 2008 (2,094 trucks loaded in 2009). The quantityof energy moved, 642 GWh, is still relatively low,around 2.1% of total energy moved by the terminal.
Growth in this activity was sustained by an increasein national AGUs, especially in the north and southof the country. By the end of 2009, four new AGUshad been put into service.The Spanish market accounted for 10% of LNGdespatched by road and there was a reduction ofaround 50% against 2008, due to the start of loadingof tankers at the Ferrol LNG Terminal in Galicia.
Underground storageIn June 2009, commercial operation of the third REN Armazenagem cavern, RENC-4, was started,after completion of the injection of cushion gas,during the first natural gas filling operations.Considering the entire underground storage infrastructure, 634 GWh of natural gas wereextracted and 1,920 GWh injected into the RENArmazenagem caverns. Company consumptiontotalled some 17 GWh. Total movement of naturalgas at surface facilities totalled 2,691 GWh. The table below compares quantities stored at theend of 2009 and 2008.
2008 2009
Jan Feb Mar Apr May Jun Jul Aug Sep Oct Nov Dec
90
80
70
60
50
40
30
20
10
0
LNG despatched by road(GWh)
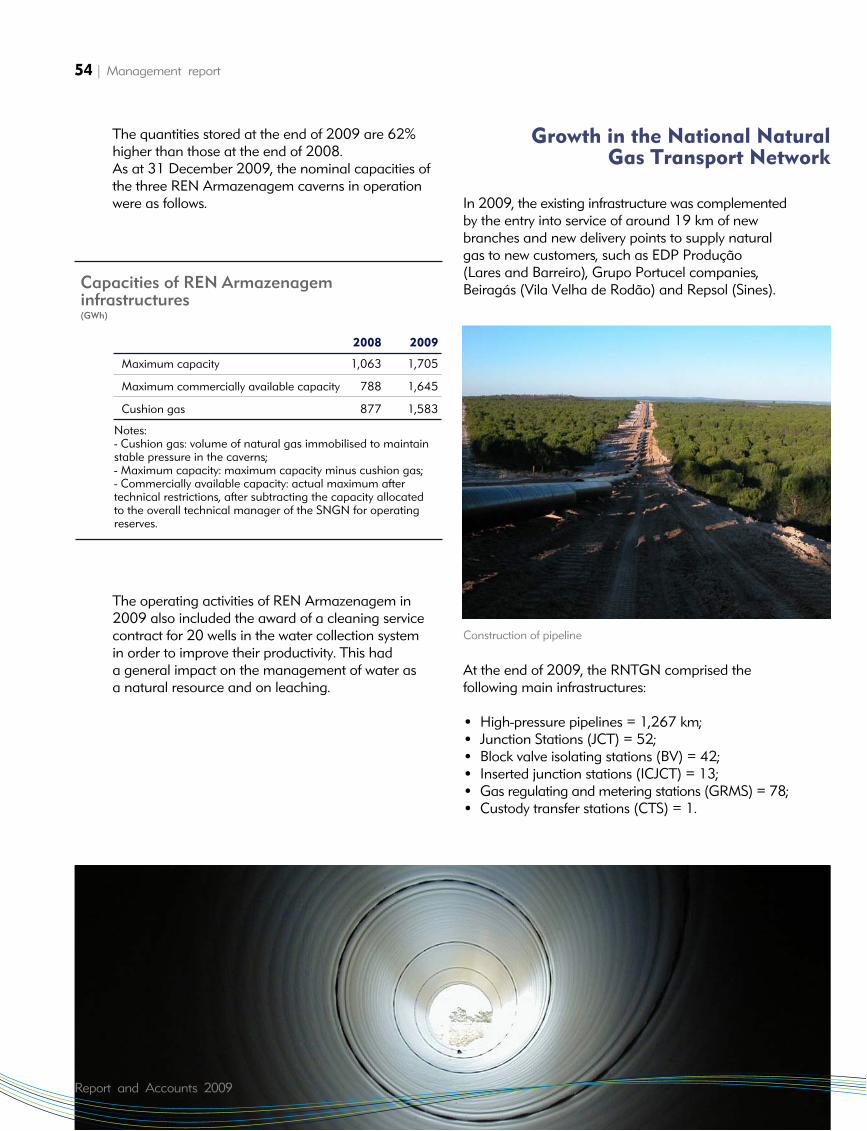
The quantities stored at the end of 2009 are 62%higher than those at the end of 2008. As at 31 December 2009, the nominal capacities ofthe three REN Armazenagem caverns in operationwere as follows.
The operating activities of REN Armazenagem in2009 also included the award of a cleaning servicecontract for 20 wells in the water collection system in order to improve their productivity. This had a general impact on the management of water as a natural resource and on leaching.
In 2009, the existing infrastructure was complementedby the entry into service of around 19 km of newbranches and new delivery points to supply naturalgas to new customers, such as EDP Produção (Lares and Barreiro), Grupo Portucel companies,Beiragás (Vila Velha de Rodão) and Repsol (Sines).
At the end of 2009, the RNTGN comprised the following main infrastructures:
• High-pressure pipelines = 1,267 km;• Junction Stations (JCT) = 52;• Block valve isolating stations (BV) = 42;• Inserted junction stations (ICJCT) = 13;• Gas regulating and metering stations (GRMS) = 78;• Custody transfer stations (CTS) = 1.
54 | Management report
Report and Accounts 2009
2008 2009
Maximum capacity 1,063 1,705
Maximum commercially available capacity 788 1,645
Cushion gas 877 1,583
Notes:- Cushion gas: volume of natural gas immobilised to maintainstable pressure in the caverns;- Maximum capacity: maximum capacity minus cushion gas;- Commercially available capacity: actual maximum aftertechnical restrictions, after subtracting the capacity allocatedto the overall technical manager of the SNGN for operatingreserves.
Capacities of REN Armazenagem infrastructures(GWh)
Growth in the National NaturalGas Transport Network
Construction of pipeline
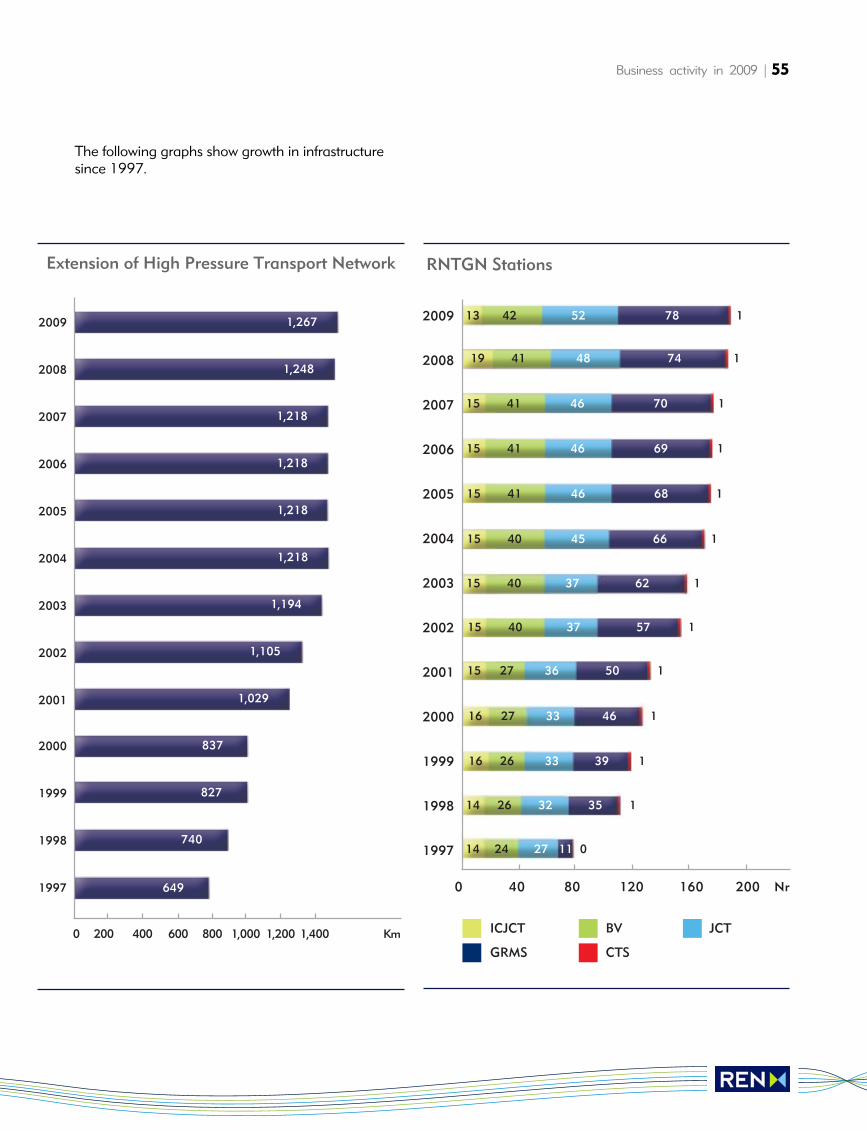
The following graphs show growth in infrastructuresince 1997.
Business activity in 2009 | 55
2009
2008
2007
2006
2005
2004
2003
2002
2001
2000
1999
1998
1997
0 40 80 120 160 200 Nr
13 42 52 78 1
19 41 48 74 1
15 41 46 70 1
15 41 46 69 1
15 41 46 68 1
15 40 45 66 1
15 40 37 62 1
15 40 37 57 1
15 27 36 50 1
16 27 33 46 1
16 26 33 39 1
14 26 32 35 1
14 24 27 11 0
ICJCT
GRMS CTS
BV JCT
RNTGN Stations
0 200 400 600 800 1,000 1,200 1,400 Km
1,267
1,248
1,218
1,218
1,218
1,218
1,194
1,105
1,029
837
827
740
649
2009
2008
2007
2006
2005
2004
2003
2002
2001
2000
1999
1998
1997
Extension of High Pressure Transport Network
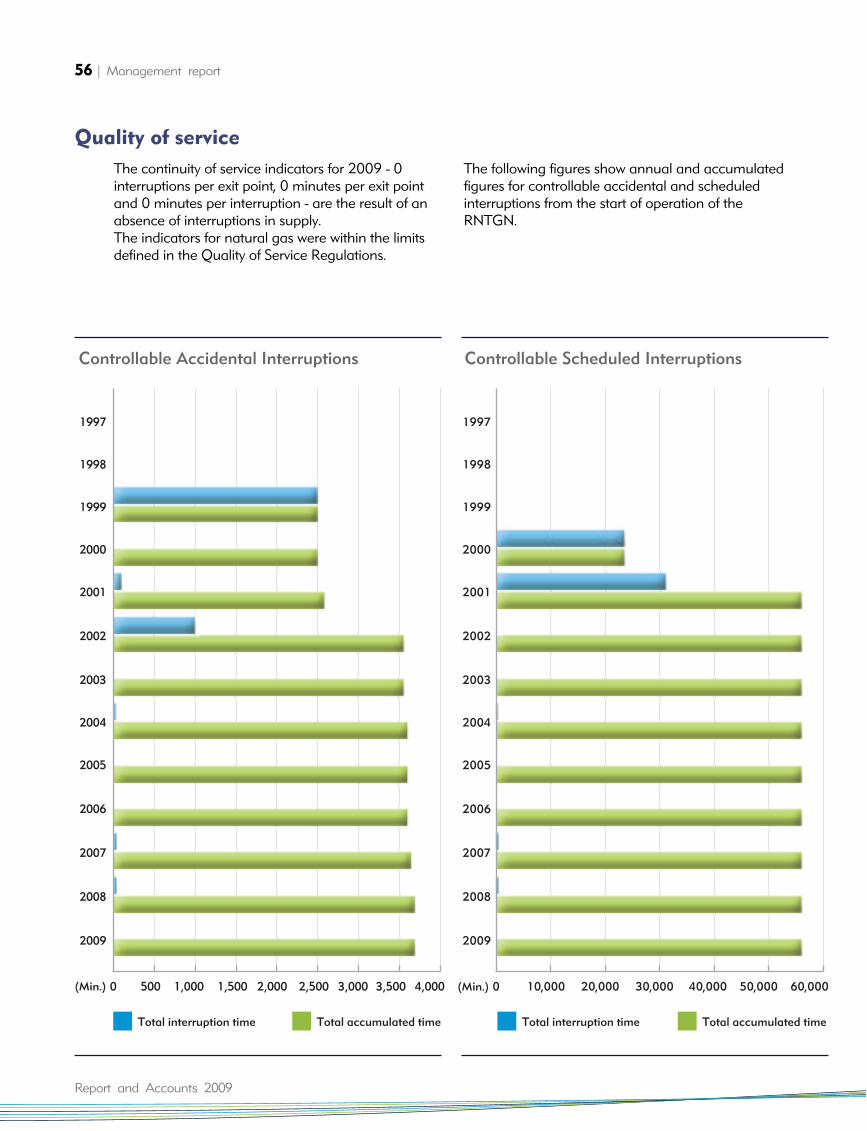
56 | Management report
Report and Accounts 2009
1997
1998
1999
2000
2001
2002
2003
2004
2005
2006
2007
2008
2009
0 500 1,000 1,500 2,000 2,500 3,000 3,500 4,000
Total interruption time Total accumulated time
(Min.)
Controllable Accidental Interruptions
1997
1998
1999
2000
2001
2002
2003
2004
2005
2006
2007
2008
2009
0 10,000 20,000 30,000 40,000 50,000 60,000
Total interruption time Total accumulated time
(Min.)
Controllable Scheduled Interruptions
Quality of service
The continuity of service indicators for 2009 - 0interruptions per exit point, 0 minutes per exit pointand 0 minutes per interruption - are the result of anabsence of interruptions in supply.The indicators for natural gas were within the limitsdefined in the Quality of Service Regulations.
The following figures show annual and accumulatedfigures for controllable accidental and scheduledinterruptions from the start of operation of theRNTGN.
Business activity in 2009 | 57
There were no incidents in the high-pressuretransport infrastructure and the accumulatedindicator of incidents of unintentional gas leaks published by the European Gas Pipeline IncidentData Group, to which REN Gasodutos belongs, was zero incidents per 1,000 km of exposed infrastructure per year.Finally, with a view to ongoing improvement of relations with its stakeholders, in the first quarter of 2009 REN conducted an assessment of naturalgas customers' perceived quality and satisfaction.This was the first natural gas customer satisfactionstudy conducted in the new business model, after the separation of the transport business and its transfer to REN. The results showed that average overall satisfactionwas positive (7.1 out of 10) and that distributors were the segment most satisfied with REN's performance (7.9).
In 2009, REN continued its cooperation with Enagás,the company that manages high-pressure naturalgas transport in Spain, in order to coordinate the contribution of the two technical system managersto the construction of MIBGÁS. The plan for mutualoperational assistance between them, which hadbeen drawn up in 2007 and revised in 2008, wasupdated with regard to available transport capacitiesat international interconnection points.As part of this collaboration between REN andEnagás for the construction of MIBGÁS, studiesto assess the interest and feasibility of a newinterconnection between the Portuguese and Spanishgas systems continued, taking into account anincrease in security of supply and better functioningof the Iberian market. Also as part of operational relations with Enagás andin order to comply with the guidelines drawn up bythe European Regulators' Group for Electricity andGas (ERGEG), as part of the initiatives for the southern European area (SGRI), REN Gasodutos alsoentered into a joint management agreement with itsSpanish counterpart for the Badajoz/Campo Maior(IP39) and Tuy/Valença do Minho internationalinterconnections. At European level, a set of laws making up the thirdpackage for the European Union energy sector werepublished in July 2009, aimed at creating the rightconditions for overcoming the remaining obstaclesto the creation of a single European energy market.
In particular, Regulation 715/2009 set up theEuropean Network of Transmission System Operatorsfor Gas (ENTSOG) and defined its role in the preparation of network codes for the European gasmarket and the drafting and publication, every twoyears, of a non-binding ten-year EU-wide networkdevelopment plan. It also established the resourcesfor intensive cooperation with market agents andrelevant government bodies.ENTSOG was founded on 1 December 2009 and isbased in Brussels. REN Gasodutos, in representationof Portugal, is one of the 31 founding members, 21 of which are members of EU-27.
International cooperation
58 | Management report
Other businesses
Report and Accounts 2009
Power purchase agreements (PPAs) not subject toearly termination pursuant to Decree-Law 172/2006of 23 August are now managed until their expiryby REN Trading, a company owned 100% by REN - Redes Energéticas Nacionais.REN Trading therefore manages the PPA with TejoEnergia for the Pego thermoelectric power station(600 MW) and the PPA with Turbogás, for theTapada do Outeiro thermoelectric power station(990 MW). The company's goal is to maximise earnings from the sale of energy and market systemservices and minimise the costs of PPAs, pursuantto ERSE Order 11210/2008.In terms of organisation, REN Trading has three operating departments: Management, Supply andDevelopment.As part of its PPA management, REN Trading sells all energy and system services for the Pego andTurbogás power stations. Daily control of all the relevant information for the formation of expensesand validation of billing involved is the responsibilityof Contract Management. It also monitors the marketfor CO2 emissions allowances and manages thepower stations' allocations and obligations in thisarea. This activity also entails monitoring the fuelmarkets (coal and natural gas) and their indexers,together with the natural gas consumption management agreement (AGC) with Galp Gás Natural.The negotiations, which began in 2008, on the revision of the AGC with Galp Gás Natural continuedin 2009. Their aim is to adapt the contract to the newlegal framework of the natural gas sector and obtainbetter conditions for the purchase of natural gas forthe Turbogás power station. In view of the complexityof the negotiations, it was not possible to completethem in 2009 and we hope to bring them to a closein early 2010.In the area of contract management, REN's activity in the ETS - Emissions Trading Scheme grew considerably in terms of volumes traded. It also participated more in the Bluenext and Nord Poolexchanges and joined the largest forward market, the ECX (European Climate Exchange). REN Tradingmanages CO2 emission allowances and establishesa carbon management strategy for the two powerstations. It therefore entered into new contracts with entities involved in the CO2 allowance market
in order to buy and sell allowances and perform EUA (European Unit Allowances) swaps for CERs(Certified Emission Reductions).In 2009, a new contract management activity began:hedging of coal purchases for the Pego power station. ISDA agreements were signed with somefinancial bodies and REN began hedging positionsfor the last quarter of 2009 and for 2010.The sale of electricity by the Supply Department takes place mainly on the Iberian electricity market,through daily offers for sale on the OMEL.REN Trading participated in the CESUR auctionsheld in 2009 in order to improve results and diversifythe risk. It sold base load and peak period energy inthe first, third and fourth quarter at highly favourableprices compared to the spot market therefore showing highly positive final results. It also took sellingpositions in financial contracts, which also benefitedthe final profit on sales.The system services market grew in Portugal in 2009.The market's system manager contracts secondaryregulation (teleregulation) and/or tertiary regulation(variation of load in real time), both essential servicesfor the correct technical operation of the electricitysystem.As a regulated company, the Ordinance11210/2008 of 8 April of the Energy ServiceRegulator (ERSE) set out incentives defining ways forthe company to share the benefits of regulatedactivities with electricity consumers. Annex II tothis ordinance sets out the annual parameters for calculating incentives. REN proposed that some of these parameters shouldbe updated. As no timely reply was received fromERSE for the calculation of this year's incentives, thesame parameters were used for 2009 as for 2008.The final amount of the incentive is the result of thedifferent facets of the company's activity, aimed atoptimising the power stations' energy sales and minimising costs of purchasing natural gas of CO2emissions allowances.The company's operating profits therefore correspondto the amount calculated for the incentives defined by ERSE, as follows.
Management of power purchaseagreements (PPAs) by REN Trading
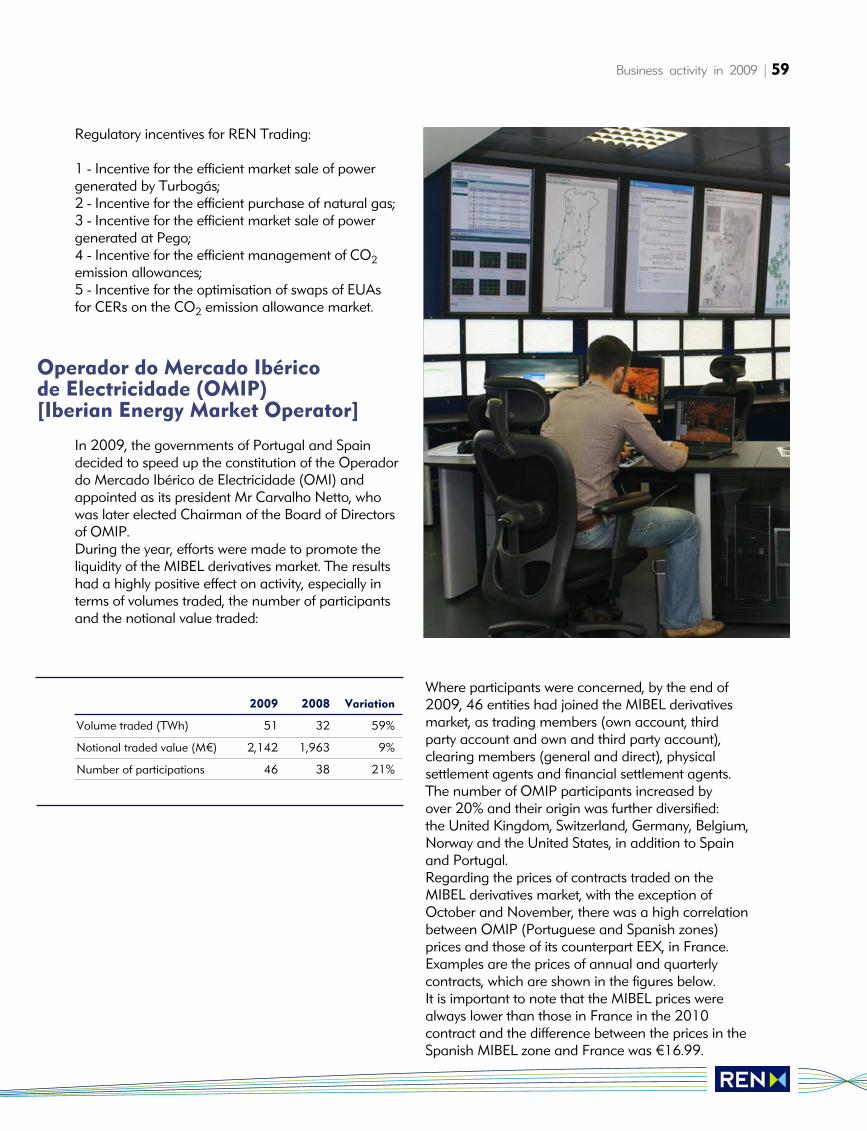
Business activity in 2009 | 59
Regulatory incentives for REN Trading:
1 - Incentive for the efficient market sale of powergenerated by Turbogás;2 - Incentive for the efficient purchase of natural gas;3 - Incentive for the efficient market sale of powergenerated at Pego;4 - Incentive for the efficient management of CO2emission allowances;5 - Incentive for the optimisation of swaps of EUAs for CERs on the CO2 emission allowance market.
In 2009, the governments of Portugal and Spaindecided to speed up the constitution of the Operadordo Mercado Ibérico de Electricidade (OMI) andappointed as its president Mr Carvalho Netto, whowas later elected Chairman of the Board of Directorsof OMIP.During the year, efforts were made to promote theliquidity of the MIBEL derivatives market. The resultshad a highly positive effect on activity, especially interms of volumes traded, the number of participantsand the notional value traded:
Where participants were concerned, by the end of2009, 46 entities had joined the MIBEL derivativesmarket, as trading members (own account, thirdparty account and own and third party account),clearing members (general and direct), physical settlement agents and financial settlement agents.The number of OMIP participants increased by over 20% and their origin was further diversified: the United Kingdom, Switzerland, Germany, Belgium,Norway and the United States, in addition to Spainand Portugal.Regarding the prices of contracts traded on theMIBEL derivatives market, with the exception ofOctober and November, there was a high correlationbetween OMIP (Portuguese and Spanish zones)prices and those of its counterpart EEX, in France.Examples are the prices of annual and quarterly contracts, which are shown in the figures below. It is important to note that the MIBEL prices werealways lower than those in France in the 2010 contract and the difference between the prices in theSpanish MIBEL zone and France was €16.99.
Operador do Mercado Ibérico de Electricidade (OMIP) [Iberian Energy Market Operator]
2009 2008 Variation
Volume traded (TWh) 51 32 59%
Notional traded value (M€) 2,142 1,963 9%
Number of participations 46 38 21%
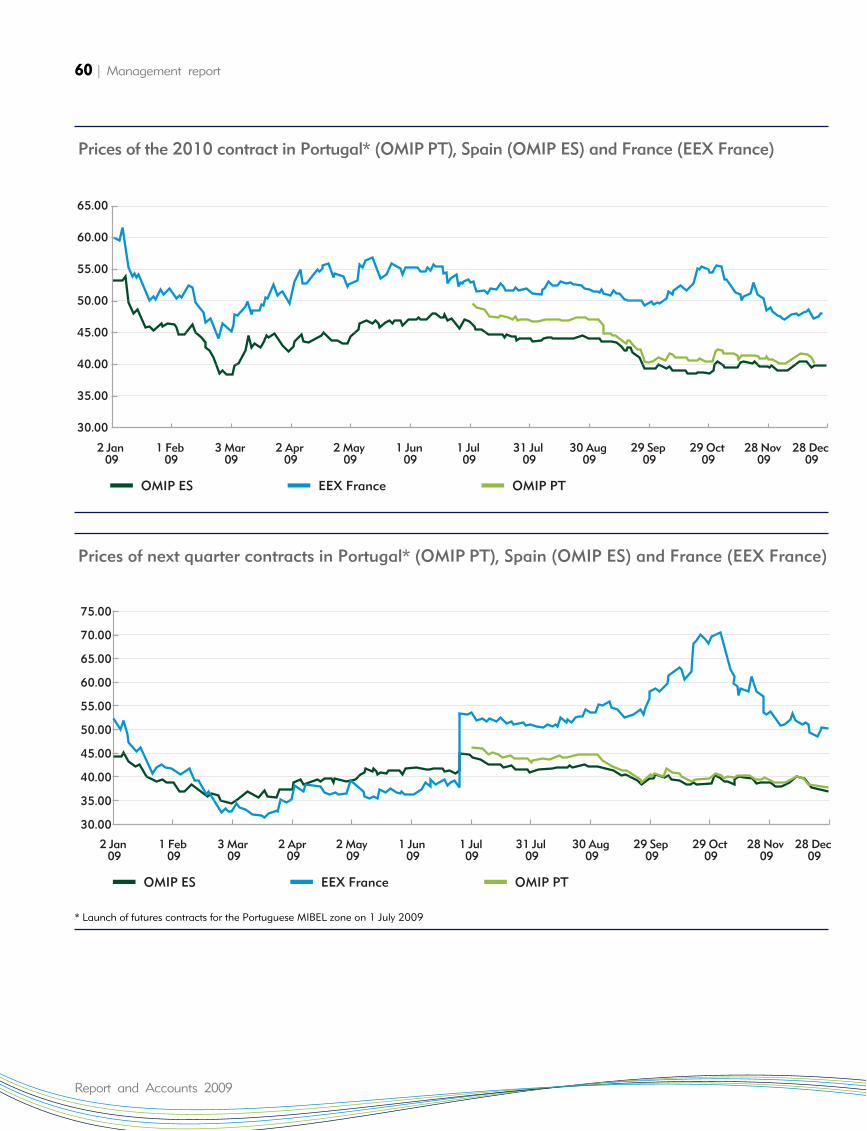
60 | Management report
Report and Accounts 2009
65.00
60.00
55.00
50.00
45.00
40.00
35.00
30.00
2 Jan 1 Feb 3 Mar 2 Apr 2 May 1 Jun 1 Jul 31 Jul 30 Aug 29 Sep 29 Oct 28 Nov 28 Dec09 09 09 09 09 09 09 09 09 09 09 09 09
OMIP ES EEX France OMIP PT
Prices of the 2010 contract in Portugal* (OMIP PT), Spain (OMIP ES) and France (EEX France)
75.00
70.00
65.00
60.00
55.00
50.00
45.00
40.00
35.00
30.00
2 Jan 1 Feb 3 Mar 2 Apr 2 May 1 Jun 1 Jul 31 Jul 30 Aug 29 Sep 29 Oct 28 Nov 28 Dec09 09 09 09 09 09 09 09 09 09 09 09 09
OMIP ES EEX France OMIP PT
Prices of next quarter contracts in Portugal* (OMIP PT), Spain (OMIP ES) and France (EEX France)
* Launch of futures contracts for the Portuguese MIBEL zone on 1 July 2009
Business activity in 2009 | 61
These results were largely due to the strategy of reinforcing the MIBEL derivatives market and thediversification of products and services. The followingwere the most important projects and initiatives:
• Marketing campaigns to promote OMIP andOMIClear as operators of reference for MIBELforward products;• Launch of futures contracts for the PortugueseMIBEL zone and swaps and forwards for the SpanishMIBEL zone;• Promotion of OMIP market makers, which resultedin Deutsche Bank and Citigroup joining, together withEGL España;• Creation of competitive commissions on trading,clearing and registration of bilateral operations;• Migration of the OMIClear settlement system toTarget 2, which fortified the clearing house's paymentsystem;• Auctions for the purchase of natural gas by RENArmazenagem for cushion gas in a cavern at Carriçoand sale of natural gas (gas release) by Galp GásNatural under the liberalisation of the market inPortugal;• Specification and development of a computer system to support the change of supplier in the naturalgas sector, under a contract with REN Gasodutos;• Specification and development of a platform for “English and Dutch” auctions, which was used to sell natural gas from Galp Gás Natural;• Start of the replacement of trading and clearingplatforms with contracts ending in June 2010.
A number of important initiatives are planned for 2010.
After the recent publication in Spain of the amendments to the international agreement that setup the MIBEL, Operador do Mercado Ibérico (OMI) is expected to become a reality. The integration of thetwo Iberian operators may take place in 2010, whichwill have a positive influence on the development ofthe electricity market in the Iberian Peninsula.The OMIP and OMIClear business plan for 2010provides for initiatives to promote greater liquidity inthe futures market, marketing campaigns to attractnew participants, especially new market makers, andthe introduction of new products. At the same time,we hope that the start-up of the new technologicaltrading and clearing platforms will help achieve the two companies' growth goals by meeting their members' expectations.Finally, OMIP and OMIClear will be pursuing theirstrategy of diversifying their portfolios of products and services in the energy sectors.
The REN Group is represented in thetelecommunications business by REN Telecom. This company, which was originally set up to make useof the surplus capacity of the safety telecommunicationsnetwork of REN - Rede Eléctrica Nacional, thenextended its activity to the Group's other companies,particularly REN Gasodutos.REN Telecom focuses its business activity on the sale,management and maintenance of telecommunicationsnetworks and systems and on voice and data services,lease of transmission circuits, lease of spaces, housingand offer of use of dark fibre for telecommunicationsand information systems.In 2009 its commercial activity involved additionalefforts in services to the energy and information systems sectors, which are its favoured markets. This focus helped increase sales in 2009 and therewas particular growth in private voice network, data and telecommunications system services andmaintenance services for promoters and wind farms.The 277% growth in sales was thanks to turnkey contracts in private voice network services.Billing in the lease of circuits rose 22% against 2008,in line with the growth that began in 2007. It rose12% on 2008 in the lease of dark fibre.There was a slight fall against 2008 in income fromthe leasing of space, consisting of housing, towersand antennas and areas and container, as there wasan influx of extraordinary earnings in 2008 resultingfrom pending regularisations from previous years. We estimate that orders for housing services receivedin late 2009 will reverse this trend and we expectaround 500% growth in this segment in 2010.In spite of the difficulties experienced in the sector, we expect sustainable growth in the activity of RENTelecom in 2010, in line with recent years. REN Telecom was audited by APCER in December2009 with a view to NP EN ISO 9001, NP EN ISO14001 and OHSAS 18001 certification of its integrated management, quality, environment andsafety system, thereby contributing to high degrees of quality in its portfolio of services.REN Telecom has resources that are essential to thedevelopment of telecommunications - infrastructures,transmission capacity, high availability and geographicalcoverage. Therefore, in 2010 it will continue to focusprudently on the most demanding business sectors,such as energy, telecommunications operators and ITservice providers and provide services associated withthe surplus capacity of its safety telecommunicationsnetwork and other value-added telecommunicationsservices.
REN Telecom

Report and Accounts 2009
Regulation
Regulation | 63
The REN Group performs three regulated activities inthe electricity sector:
• Overall management of the system;• Electricity transmission;• Purchase and sale of electricity from thecommercial agent, which consists of trading in theMIBEL of generation from the remaining powerpurchase agreements through REN Trading.
These two activities are remunerated by regulatedtariffs, one for general use of the system (GUS) andthe other for use of the transmission grid (UTG). Theearnings from the third activity come essentially fromsale on the market of electricity generation from theremaining PPAs. The GUS tariff reflects the positive ornegative difference between earnings from thesesales and the cost of the PPAs. These two tariffs arefixed annually by Entidade Reguladora dos ServiçosEnergéticos (ERSE) on the basis of economic andenergy forecasts of demand, costs, earnings andinvestments, for example, and derive from aneconomic regulation model based on acceptedcosts and a remuneration rate for fixed assets inoperation in each activity, net of subsidies. Someincentive mechanisms were included in this modelin early 2009.In December 2008, ERSE published new tariffregulations that introduced to the electricitytransmission activity incentives for investment,reduction in operating and maintenance costs, gridavailability and continued use of assets at the end oftheir useful lives, effective as of January 2009. The incentive to investment consists of theintroduction of reference costs for evaluating newinvestments. These investments are remunerated atreference costs based on a remuneration rate higherthan the rate applied to other assets.Although some costs still receive pass-throughtreatment, such as environmental costs and othersresulting from amendments to legislation, mostoperating and maintenance costs (OPEX) are subjectto a revenue cap approach. These costs will grow in upcoming years on the basisof variations in the gross domestic product priceindex, minus an efficiency target set by ERSE, which is0.5% for the current three-year regulatory period, plusthe increase in OPEX resulting from annual growth in
the transmission grid (in kilometres of lines andnumber of substation panels), calculated with thecorresponding incremental costs also fixed by ERSE.The incentive to maintain equipment at the end of itsuseful life is intended to encourage continued use ofassets that are still in technical operating conditionbut are at the end of their working life. The amount ofthis incentive in 2009 was €1.96M. However, byERSE decision, the amount for 2009 will only beincluded in 2010 tariff earnings.The aim of the incentive to increase availability ofthe National Electricity Transmission Grid, whichwas also introduced in 2009, is to promote efficientoperation and maintenance of the gridinfrastructure. However, it is deferred for two years,which means that the incentive for 2009 will only bereflected in the results for 2011. The tariffs fixed by ERSE also reflect tariff deviationsthat, two years later, reconcile forecast and actualcosts and earnings (insofar as they are justifiable andaccepted by ERSE).The below figure shows the components of permittedearnings from electricity transmission.
Electricity
Regulated electricity assets
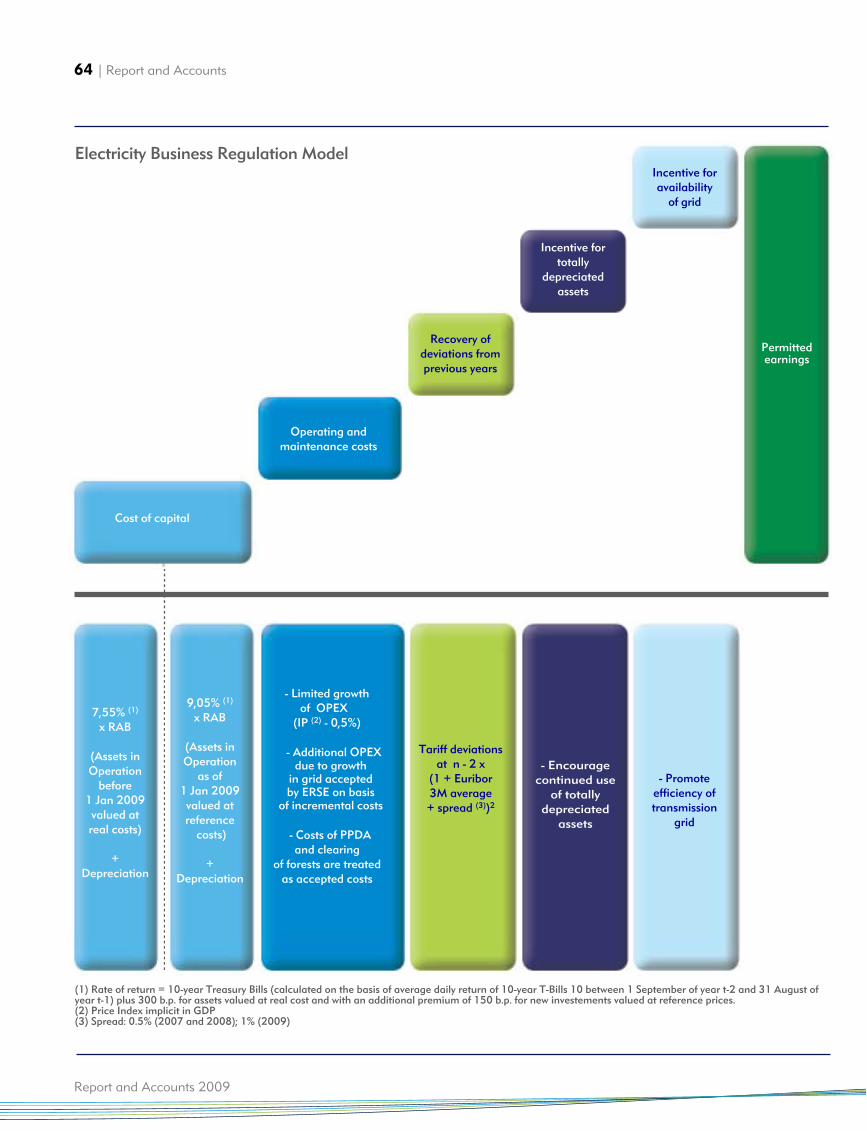
64 | Report and Accounts
Report and Accounts 2009
Electricity Business Regulation Model
(1) Rate of return = 10-year Treasury Bills (calculated on the basis of average daily return of 10-year T-Bills 10 between 1 September of year t-2 and 31 August ofyear t-1) plus 300 b.p. for assets valued at real cost and with an additional premium of 150 b.p. for new investements valued at reference prices.(2) Price Index implicit in GDP(3) Spread: 0.5% (2007 and 2008); 1% (2009)
Cost of capital
7,55% (1)
x RAB
(Assets inOperation
before1 Jan 2009valued atreal costs)
+Depreciation
9,05% (1)
x RAB
(Assets inOperation
as of1 Jan 2009valued atreference
costs)
+Depreciation
Permittedearnings
Incentive foravailability
of grid
- Promoteefficiency oftransmission
grid
Incentive fortotally
depreciatedassets
- Encouragecontinued use
of totallydepreciated
assets
Recovery ofdeviations fromprevious years
Tariff deviationsat n - 2 x
(1 + Euribor3M average+ spread (3))2
Operating andmaintenance costs
- Costs of PPDAand clearing
of forests are treatedas accepted costs
- Additional OPEXdue to growth
in grid acceptedby ERSE on basis
of incremental costs
- Limited growthof OPEX
(IP (2) - 0,5%)
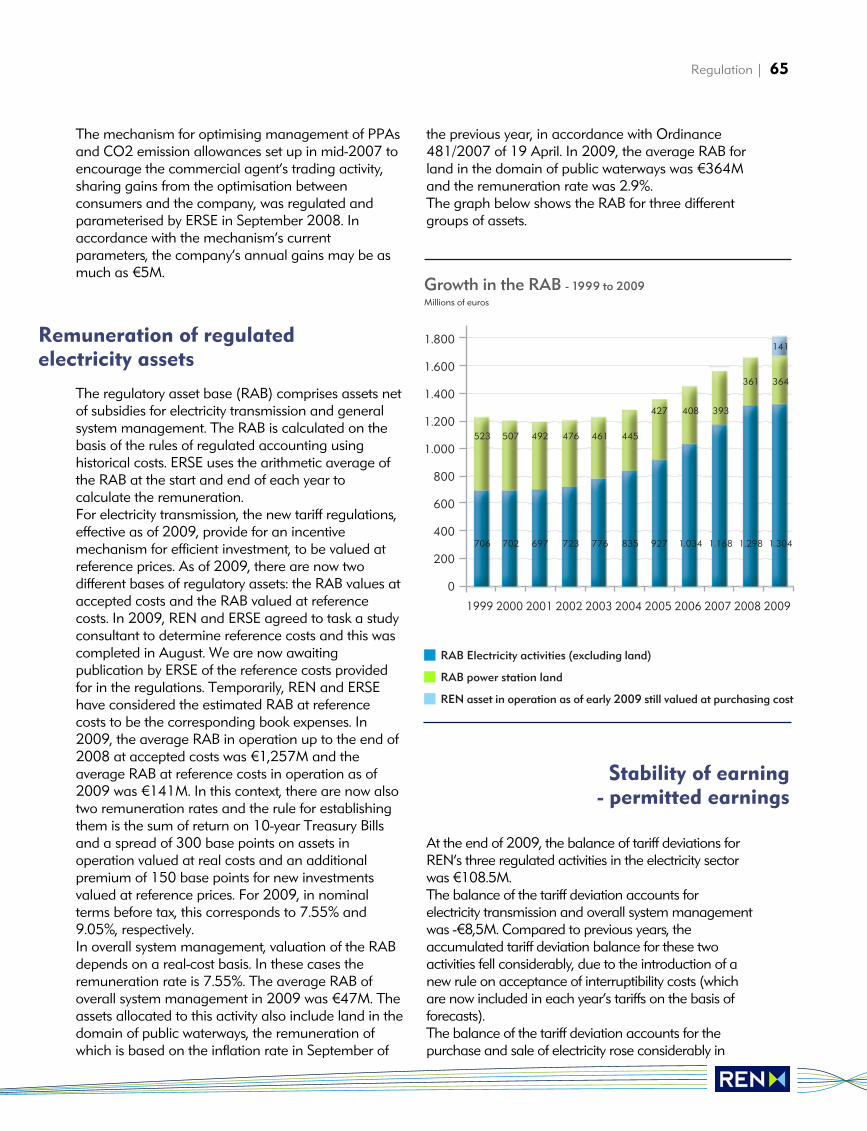
Regulation | 65
The mechanism for optimising management of PPAsand CO2 emission allowances set up in mid-2007 toencourage the commercial agent’s trading activity,sharing gains from the optimisation betweenconsumers and the company, was regulated andparameterised by ERSE in September 2008. Inaccordance with the mechanism’s currentparameters, the company’s annual gains may be asmuch as €5M.
The regulatory asset base (RAB) comprises assets netof subsidies for electricity transmission and generalsystem management. The RAB is calculated on thebasis of the rules of regulated accounting usinghistorical costs. ERSE uses the arithmetic average ofthe RAB at the start and end of each year tocalculate the remuneration.For electricity transmission, the new tariff regulations,effective as of 2009, provide for an incentivemechanism for efficient investment, to be valued atreference prices. As of 2009, there are now twodifferent bases of regulatory assets: the RAB values ataccepted costs and the RAB valued at referencecosts. In 2009, REN and ERSE agreed to task a studyconsultant to determine reference costs and this wascompleted in August. We are now awaitingpublication by ERSE of the reference costs providedfor in the regulations. Temporarily, REN and ERSEhave considered the estimated RAB at referencecosts to be the corresponding book expenses. In2009, the average RAB in operation up to the end of2008 at accepted costs was €1,257M and theaverage RAB at reference costs in operation as of2009 was €141M. In this context, there are now alsotwo remuneration rates and the rule for establishingthem is the sum of return on 10-year Treasury Billsand a spread of 300 base points on assets inoperation valued at real costs and an additionalpremium of 150 base points for new investmentsvalued at reference prices. For 2009, in nominalterms before tax, this corresponds to 7.55% and9.05%, respectively.In overall system management, valuation of the RABdepends on a real-cost basis. In these cases theremuneration rate is 7.55%. The average RAB ofoverall system management in 2009 was €47M. Theassets allocated to this activity also include land in thedomain of public waterways, the remuneration ofwhich is based on the inflation rate in September of
the previous year, in accordance with Ordinance481/2007 of 19 April. In 2009, the average RAB forland in the domain of public waterways was €364Mand the remuneration rate was 2.9%.The graph below shows the RAB for three differentgroups of assets.
-At the end of 2009, the balance of tariff deviations forREN’s three regulated activities in the electricity sectorwas €108.5M. The balance of the tariff deviation accounts forelectricity transmission and overall system managementwas -€8,5M. Compared to previous years, theaccumulated tariff deviation balance for these twoactivities fell considerably, due to the introduction of anew rule on acceptance of interruptibility costs (whichare now included in each year’s tariffs on the basis offorecasts).The balance of the tariff deviation accounts for thepurchase and sale of electricity rose considerably in
Growth in the RAB - 1999 to 2009
1.800
1.600
1.400
1.200
1.000
800
600
400
200
0
1999 2000 2001 2002 2003 2004 2005 2006 2007 2008 2009
RAB Electricity activities (excluding land)
RAB power station land
REN asset in operation as of early 2009 still valued at purchasing cost
706 702 697 723 776 835 927 1.034 1.168 1.298 1.304
523 507 492 476 461 445
427 408 393
361 364
141
Millions of euros
Remuneration of regulatedelectricity assets
Stability of earning- permitted earnings
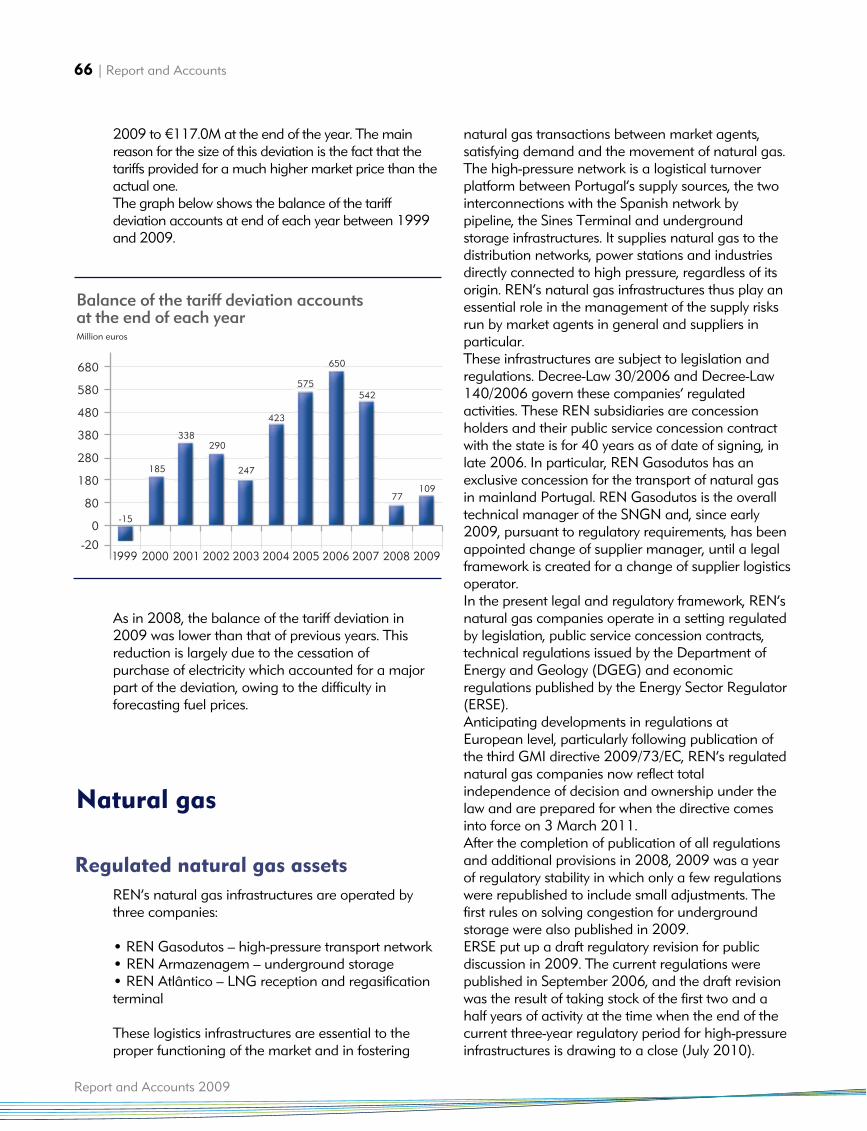
66 | Report and Accounts
Report and Accounts 2009
2009 to €117.0M at the end of the year. The mainreason for the size of this deviation is the fact that thetariffs provided for a much higher market price than theactual one.The graph below shows the balance of the tariffdeviation accounts at end of each year between 1999and 2009.
As in 2008, the balance of the tariff deviation in2009 was lower than that of previous years. Thisreduction is largely due to the cessation of purchase of electricity which accounted for a majorpart of the deviation, owing to the difficulty inforecasting fuel prices.
REN’s natural gas infrastructures are operated bythree companies:
• REN Gasodutos – high-pressure transport network• REN Armazenagem – underground storage• REN Atlântico – LNG reception and regasificationterminal
These logistics infrastructures are essential to theproper functioning of the market and in fostering
natural gas transactions between market agents,satisfying demand and the movement of natural gas. The high-pressure network is a logistical turnoverplatform between Portugal’s supply sources, the twointerconnections with the Spanish network bypipeline, the Sines Terminal and undergroundstorage infrastructures. It supplies natural gas to thedistribution networks, power stations and industriesdirectly connected to high pressure, regardless of itsorigin. REN’s natural gas infrastructures thus play anessential role in the management of the supply risksrun by market agents in general and suppliers inparticular.These infrastructures are subject to legislation andregulations. Decree-Law 30/2006 and Decree-Law140/2006 govern these companies’ regulatedactivities. These REN subsidiaries are concessionholders and their public service concession contractwith the state is for 40 years as of date of signing, inlate 2006. In particular, REN Gasodutos has anexclusive concession for the transport of natural gasin mainland Portugal. REN Gasodutos is the overalltechnical manager of the SNGN and, since early2009, pursuant to regulatory requirements, has beenappointed change of supplier manager, until a legalframework is created for a change of supplier logisticsoperator.In the present legal and regulatory framework, REN’snatural gas companies operate in a setting regulatedby legislation, public service concession contracts,technical regulations issued by the Department ofEnergy and Geology (DGEG) and economicregulations published by the Energy Sector Regulator(ERSE).Anticipating developments in regulations atEuropean level, particularly following publication ofthe third GMI directive 2009/73/EC, REN’s regulatednatural gas companies now reflect totalindependence of decision and ownership under thelaw and are prepared for when the directive comesinto force on 3 March 2011.After the completion of publication of all regulationsand additional provisions in 2008, 2009 was a yearof regulatory stability in which only a few regulationswere republished to include small adjustments. Thefirst rules on solving congestion for undergroundstorage were also published in 2009.ERSE put up a draft regulatory revision for publicdiscussion in 2009. The current regulations werepublished in September 2006, and the draft revisionwas the result of taking stock of the first two and ahalf years of activity at the time when the end of thecurrent three-year regulatory period for high-pressureinfrastructures is drawing to a close (July 2010).
Regulated natural gas assets
Natural gas
Balance of the tariff deviation accountsat the end of each year
680
580
480
380
280
180
80
0
-201999 2000 2001 2002 2003 2004 2005 2006 2007 2008 2009
Million euros
185
338290
247
423
575
650
542
77109
-15
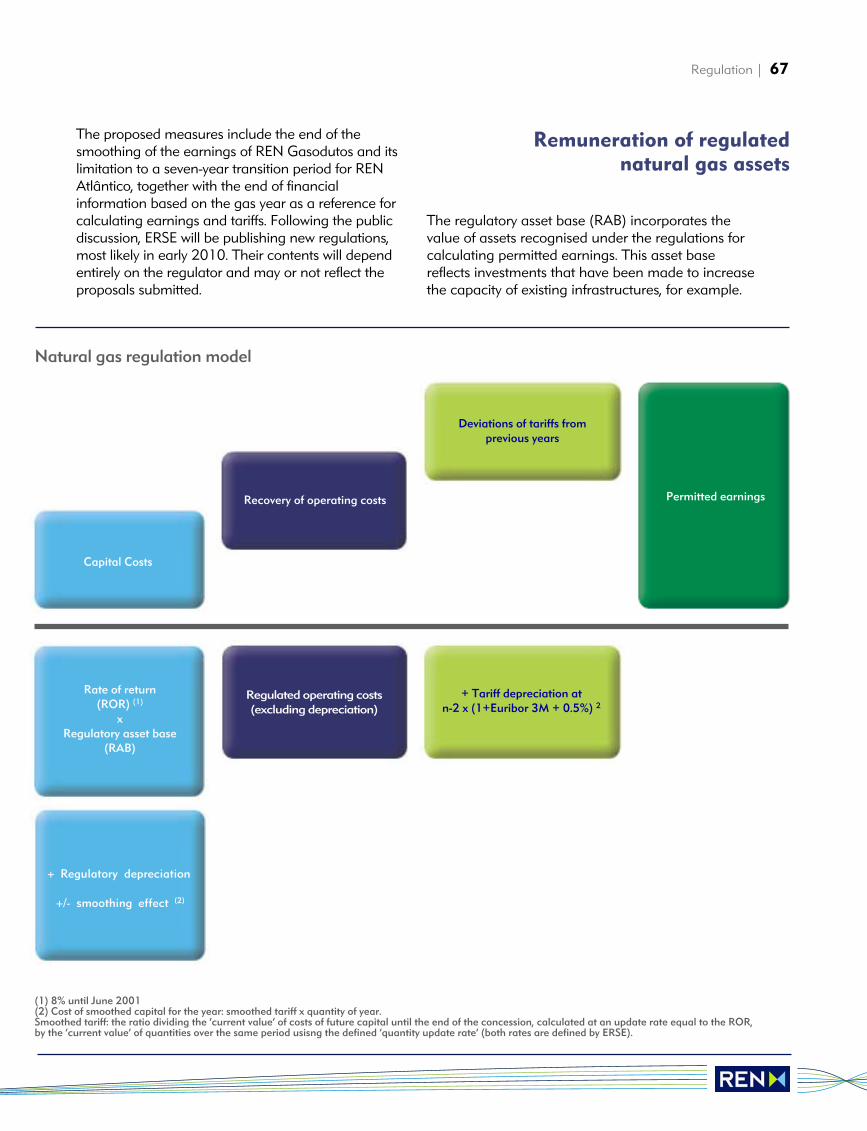
Natural gas regulation model
(1) 8% until June 2001(2) Cost of smoothed capital for the year: smoothed tariff x quantity of year.Smoothed tariff: the ratio dividing the ‘current value’ of costs of future capital until the end of the concession, calculated at an update rate equal to the ROR,by the ‘current value’ of quantities over the same period usisng the defined ‘quantity update rate’ (both rates are defined by ERSE).
Permitted earnings
Deviations of tariffs fromprevious years
Recovery of operating costs
Capital Costs
+ Regulatory depreciation
+/- smoothing effect (2)
Rate of return(ROR) (1)
xRegulatory asset base
(RAB)
+ Tariff depreciation atn-2 x (1+Euribor 3M + 0.5%) 2
Regulated operating costs(excluding depreciation)
Regulation | 67
The proposed measures include the end of thesmoothing of the earnings of REN Gasodutos and itslimitation to a seven-year transition period for RENAtlântico, together with the end of financialinformation based on the gas year as a reference forcalculating earnings and tariffs. Following the publicdiscussion, ERSE will be publishing new regulations,most likely in early 2010. Their contents will dependentirely on the regulator and may or not reflect theproposals submitted.
The regulatory asset base (RAB) incorporates thevalue of assets recognised under the regulations forcalculating permitted earnings. This asset basereflects investments that have been made to increasethe capacity of existing infrastructures, for example.
Remuneration of regulatednatural gas assets
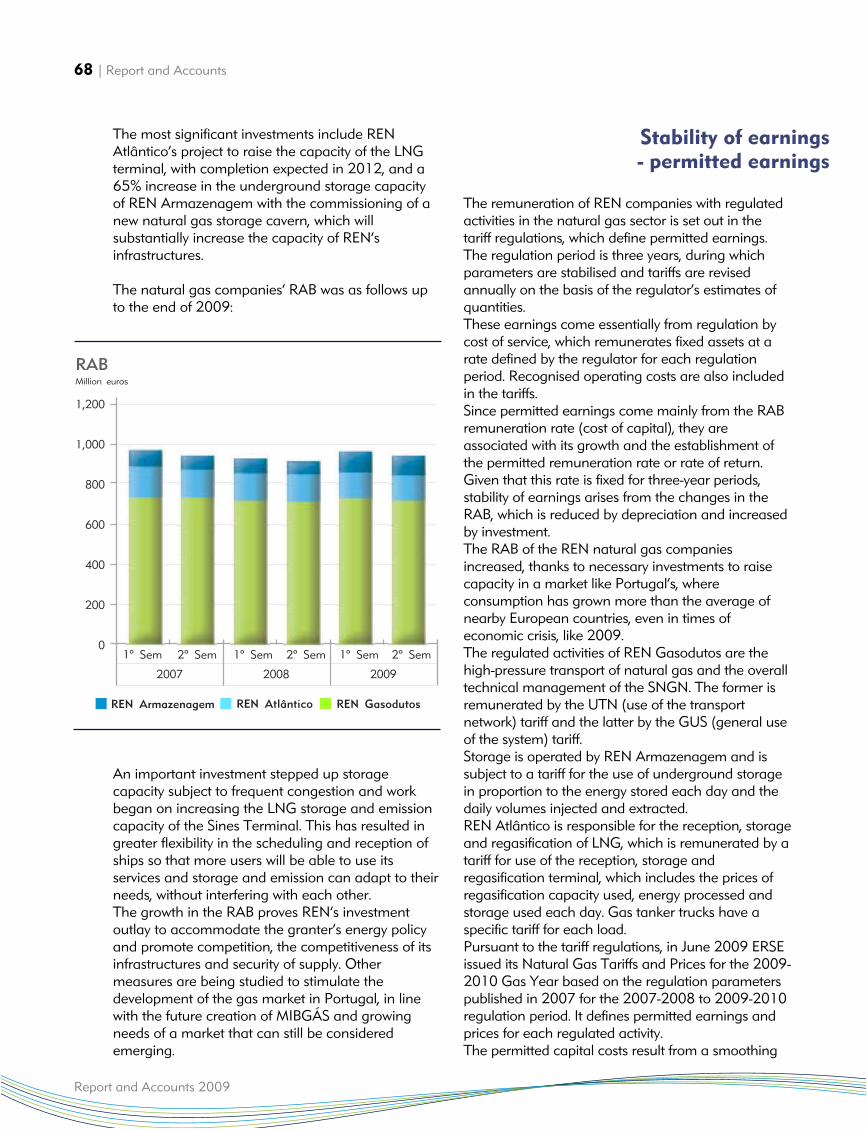
68 | Report and Accounts
Report and Accounts 2009
The most significant investments include RENAtlântico’s project to raise the capacity of the LNGterminal, with completion expected in 2012, and a65% increase in the underground storage capacityof REN Armazenagem with the commissioning of anew natural gas storage cavern, which willsubstantially increase the capacity of REN’sinfrastructures.
The natural gas companies’ RAB was as follows upto the end of 2009:
An important investment stepped up storagecapacity subject to frequent congestion and workbegan on increasing the LNG storage and emissioncapacity of the Sines Terminal. This has resulted ingreater flexibility in the scheduling and reception ofships so that more users will be able to use itsservices and storage and emission can adapt to theirneeds, without interfering with each other.The growth in the RAB proves REN’s investmentoutlay to accommodate the granter’s energy policyand promote competition, the competitiveness of itsinfrastructures and security of supply. Othermeasures are being studied to stimulate thedevelopment of the gas market in Portugal, in linewith the future creation of MIBGÁS and growingneeds of a market that can still be consideredemerging.
The remuneration of REN companies with regulatedactivities in the natural gas sector is set out in thetariff regulations, which define permitted earnings.The regulation period is three years, during whichparameters are stabilised and tariffs are revisedannually on the basis of the regulator’s estimates ofquantities.These earnings come essentially from regulation bycost of service, which remunerates fixed assets at arate defined by the regulator for each regulationperiod. Recognised operating costs are also includedin the tariffs.Since permitted earnings come mainly from the RABremuneration rate (cost of capital), they areassociated with its growth and the establishment ofthe permitted remuneration rate or rate of return.Given that this rate is fixed for three-year periods,stability of earnings arises from the changes in theRAB, which is reduced by depreciation and increasedby investment.The RAB of the REN natural gas companiesincreased, thanks to necessary investments to raisecapacity in a market like Portugal’s, whereconsumption has grown more than the average ofnearby European countries, even in times ofeconomic crisis, like 2009.The regulated activities of REN Gasodutos are thehigh-pressure transport of natural gas and the overalltechnical management of the SNGN. The former isremunerated by the UTN (use of the transportnetwork) tariff and the latter by the GUS (general useof the system) tariff. Storage is operated by REN Armazenagem and issubject to a tariff for the use of underground storagein proportion to the energy stored each day and thedaily volumes injected and extracted. REN Atlântico is responsible for the reception, storageand regasification of LNG, which is remunerated by atariff for use of the reception, storage andregasification terminal, which includes the prices ofregasification capacity used, energy processed andstorage used each day. Gas tanker trucks have aspecific tariff for each load.Pursuant to the tariff regulations, in June 2009 ERSEissued its Natural Gas Tariffs and Prices for the 2009-2010 Gas Year based on the regulation parameterspublished in 2007 for the 2007-2008 to 2009-2010regulation period. It defines permitted earnings andprices for each regulated activity.The permitted capital costs result from a smoothing
RAB
1,200
1,000
800
600
400
200
01º Sem 2º Sem 1º Sem 2º Sem 1º Sem 2º Sem
2007 2008 2009
REN GasodutosREN AtlânticoREN Armazenagem
Million euros
Stability of earnings- permitted earnings
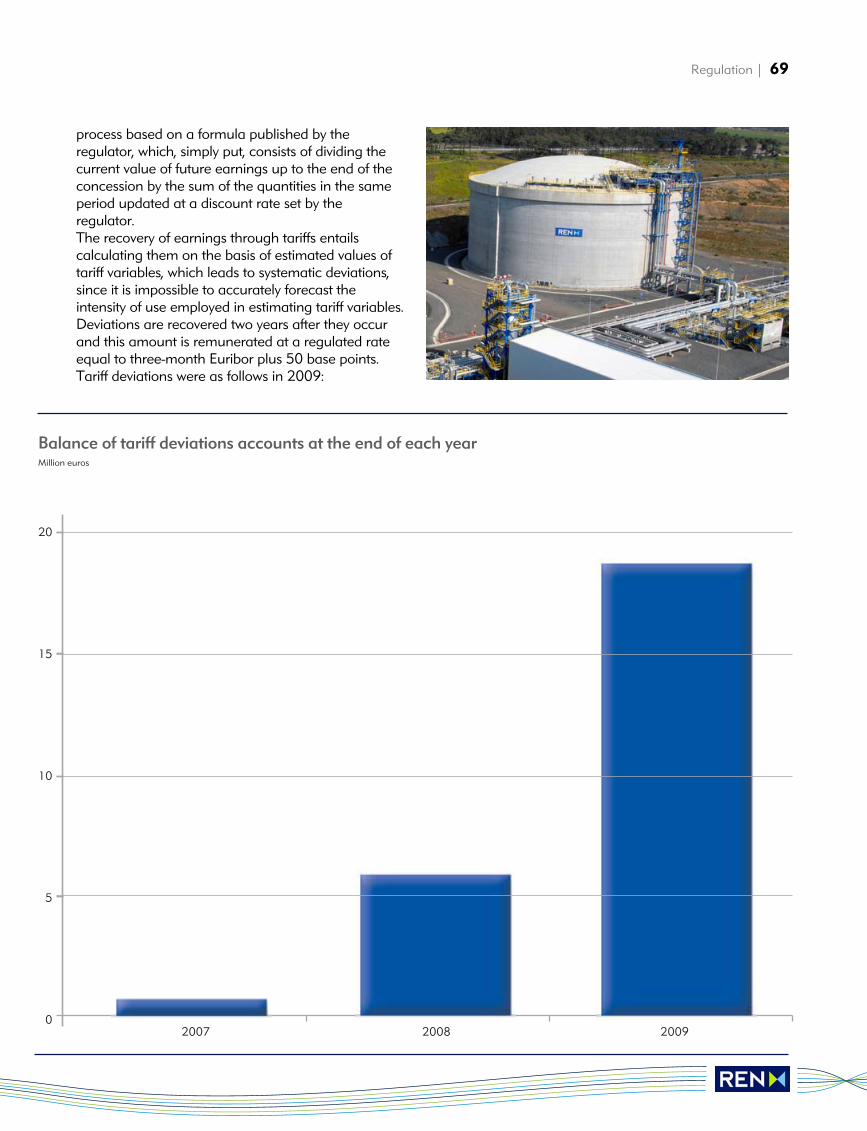
Regulation | 69
process based on a formula published by theregulator, which, simply put, consists of dividing thecurrent value of future earnings up to the end of theconcession by the sum of the quantities in the sameperiod updated at a discount rate set by theregulator.The recovery of earnings through tariffs entailscalculating them on the basis of estimated values oftariff variables, which leads to systematic deviations,since it is impossible to accurately forecast theintensity of use employed in estimating tariff variables.Deviations are recovered two years after they occurand this amount is remunerated at a regulated rateequal to three-month Euribor plus 50 base points.Tariff deviations were as follows in 2009:
Balance of tariff deviations accounts at the end of each year
20
15
10
5
02007 2008 2009
Million euros
Report and Accounts 2009
Economic and financial analysis
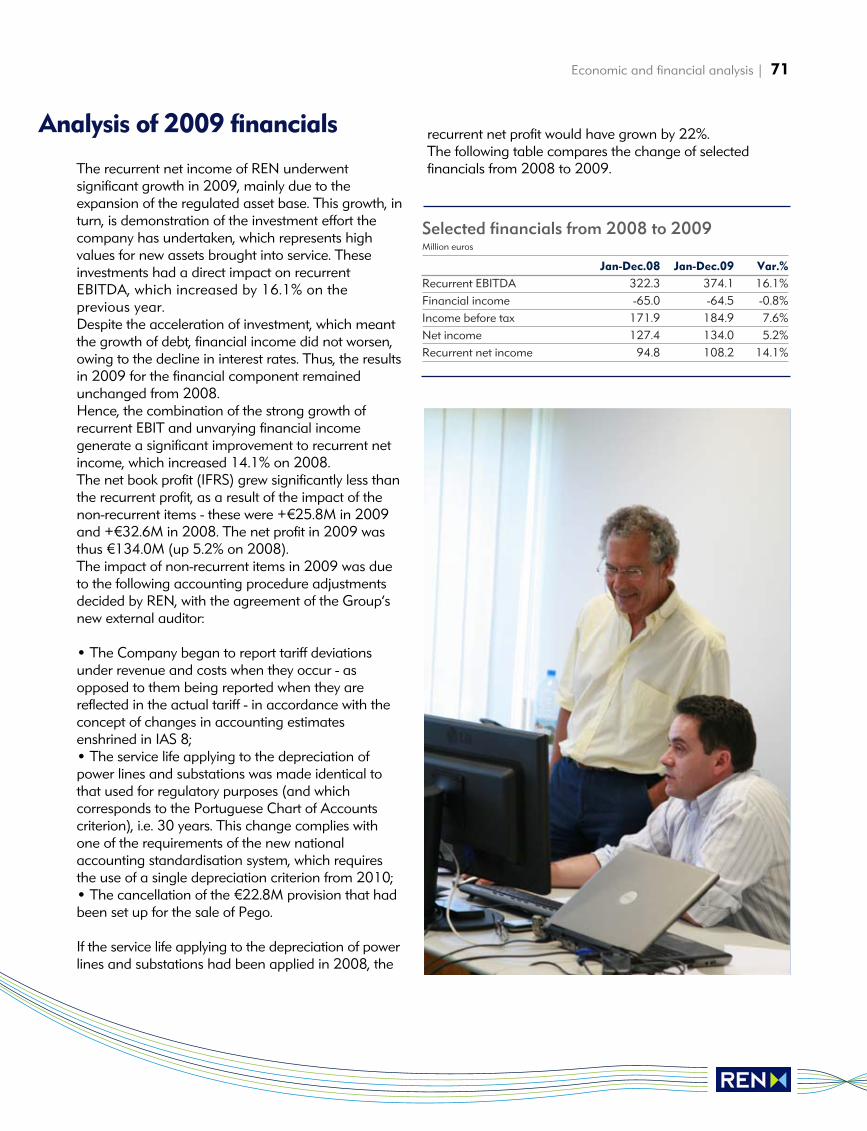
Economic and financial analysis | 71
The recurrent net income of REN underwentsignificant growth in 2009, mainly due to theexpansion of the regulated asset base. This growth, inturn, is demonstration of the investment effort thecompany has undertaken, which represents highvalues for new assets brought into service. Theseinvestments had a direct impact on recurrentEBITDA, which increased by 16.1% on theprevious year.Despite the acceleration of investment, which meantthe growth of debt, financial income did not worsen,owing to the decline in interest rates. Thus, the resultsin 2009 for the financial component remainedunchanged from 2008.Hence, the combination of the strong growth ofrecurrent EBIT and unvarying financial incomegenerate a significant improvement to recurrent netincome, which increased 14.1% on 2008.The net book profit (IFRS) grew significantly less thanthe recurrent profit, as a result of the impact of thenon-recurrent items - these were +€25.8M in 2009and +€32.6M in 2008. The net profit in 2009 wasthus €134.0M (up 5.2% on 2008).The impact of non-recurrent items in 2009 was dueto the following accounting procedure adjustmentsdecided by REN, with the agreement of the Group’snew external auditor:
• The Company began to report tariff deviationsunder revenue and costs when they occur - asopposed to them being reported when they arereflected in the actual tariff - in accordance with theconcept of changes in accounting estimatesenshrined in IAS 8;• The service life applying to the depreciation ofpower lines and substations was made identical tothat used for regulatory purposes (and whichcorresponds to the Portuguese Chart of Accountscriterion), i.e. 30 years. This change complies withone of the requirements of the new nationalaccounting standardisation system, which requiresthe use of a single depreciation criterion from 2010;• The cancellation of the €22.8M provision that hadbeen set up for the sale of Pego.
If the service life applying to the depreciation of powerlines and substations had been applied in 2008, the
recurrent net profit would have grown by 22%.The following table compares the change of selectedfinancials from 2008 to 2009.
Analysis of 2009 financials
Jan-Dec.08 Jan-Dec.09 Var.%
Recurrent EBITDA 322.3 374.1 16.1%Financial income -65.0 -64.5 -0.8%Income before tax 171.9 184.9 7.6%Net income 127.4 134.0 5.2%Recurrent net income 94.8 108.2 14.1%C T t l 313 5 466 3 48 8%
Selected financials from 2008 to 2009Million euros
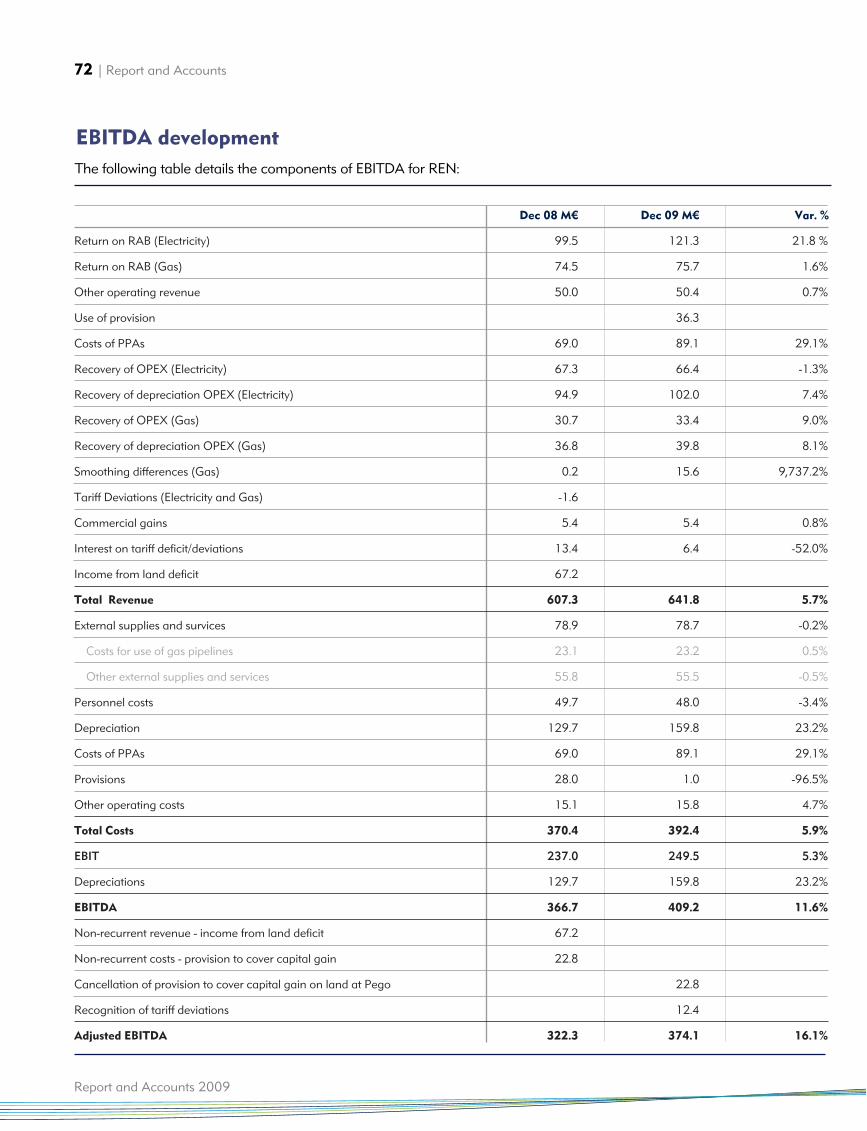
72 | Report and Accounts
Report and Accounts 2009
Dec 08 M€ Dec 09 M€ Var. %
Return on RAB (Electricity) 99.5 121.3 21.8 %
Return on RAB (Gas) 74.5 75.7 1.6%
Other operating revenue 50.0 50.4 0.7%
Use of provision 36.3
Costs of PPAs 69.0 89.1 29.1%
Recovery of OPEX (Electricity) 67.3 66.4 -1.3%
Recovery of depreciation OPEX (Electricity) 94.9 102.0 7.4%
Recovery of OPEX (Gas) 30.7 33.4 9.0%
Recovery of depreciation OPEX (Gas) 36.8 39.8 8.1%
Smoothing differences (Gas) 0.2 15.6 9,737.2%
Tariff Deviations (Electricity and Gas) -1.6
Commercial gains 5.4 5.4 0.8%
Interest on tariff deficit/deviations 13.4 6.4 -52.0%
Income from land deficit 67.2
Total Revenue 607.3 641.8 5.7%
External supplies and survices 78.9 78.7 -0.2%
Costs for use of gas pipelines 23.1 23.2 0.5%
Other external supplies and services 55.8 55.5 -0.5%
Personnel costs 49.7 48.0 -3.4%
Depreciation 129.7 159.8 23.2%
Costs of PPAs 69.0 89.1 29.1%
Provisions 28.0 1.0 -96.5%
Other operating costs 15.1 15.8 4.7%
Total Costs 370.4 392.4 5.9%
EBIT 237.0 249.5 5.3%
Depreciations 129.7 159.8 23.2%
EBITDA 366.7 409.2 11.6%
Non-recurrent revenue - income from land deficit 67.2
Non-recurrent costs - provision to cover capital gain 22.8
Cancellation of provision to cover capital gain on land at Pego 22.8
Recognition of tariff deviations 12.4
Adjusted EBITDA 322.3 374.1 16.1%
EBITDA development
The following table details the components of EBITDA for REN:
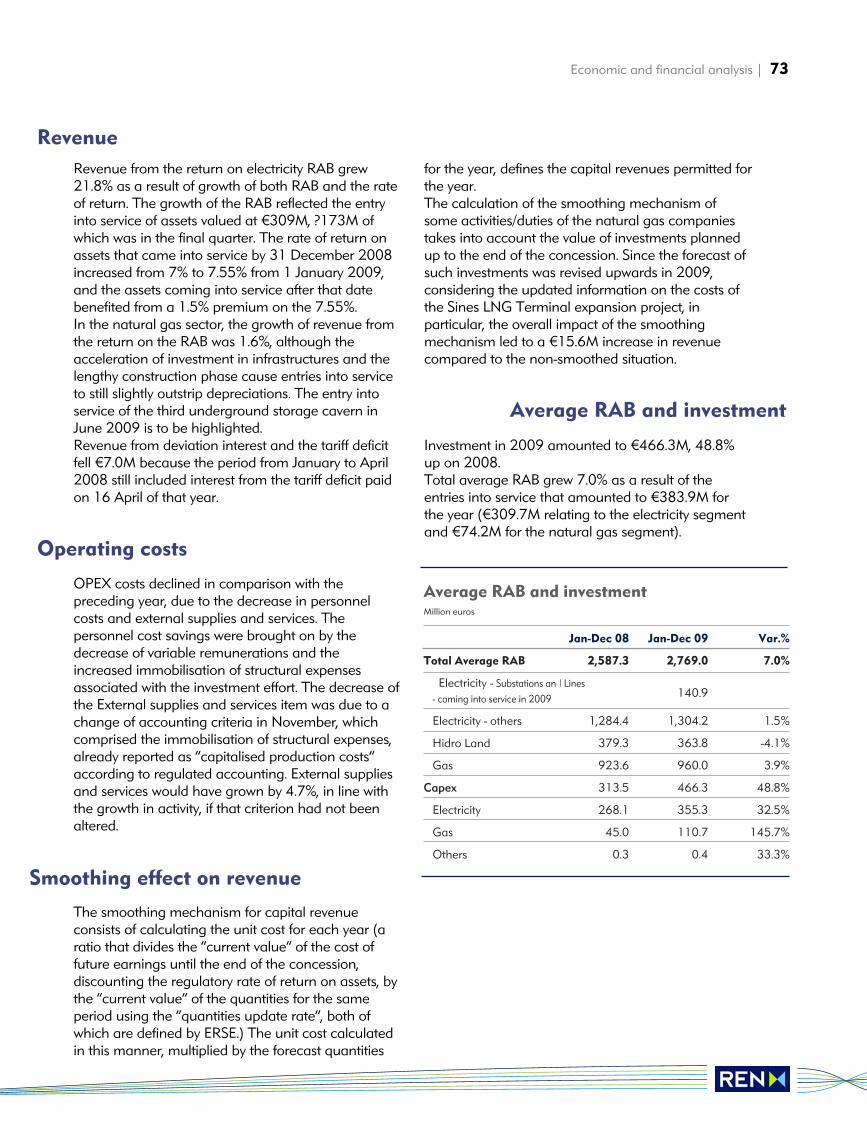
Economic and financial analysis | 73
Revenue from the return on electricity RAB grew21.8% as a result of growth of both RAB and the rateof return. The growth of the RAB reflected the entryinto service of assets valued at €309M, ?173M ofwhich was in the final quarter. The rate of return onassets that came into service by 31 December 2008increased from 7% to 7.55% from 1 January 2009,and the assets coming into service after that datebenefited from a 1.5% premium on the 7.55%.In the natural gas sector, the growth of revenue fromthe return on the RAB was 1.6%, although theacceleration of investment in infrastructures and thelengthy construction phase cause entries into serviceto still slightly outstrip depreciations. The entry intoservice of the third underground storage cavern inJune 2009 is to be highlighted. Revenue from deviation interest and the tariff deficitfell €7.0M because the period from January to April2008 still included interest from the tariff deficit paidon 16 April of that year.
OPEX costs declined in comparison with thepreceding year, due to the decrease in personnelcosts and external supplies and services. Thepersonnel cost savings were brought on by thedecrease of variable remunerations and theincreased immobilisation of structural expensesassociated with the investment effort. The decrease ofthe External supplies and services item was due to achange of accounting criteria in November, whichcomprised the immobilisation of structural expenses,already reported as “capitalised production costs”according to regulated accounting. External suppliesand services would have grown by 4.7%, in line withthe growth in activity, if that criterion had not beenaltered.
The smoothing mechanism for capital revenueconsists of calculating the unit cost for each year (aratio that divides the “current value” of the cost offuture earnings until the end of the concession,discounting the regulatory rate of return on assets, bythe “current value” of the quantities for the sameperiod using the “quantities update rate”, both ofwhich are defined by ERSE.) The unit cost calculatedin this manner, multiplied by the forecast quantities
for the year, defines the capital revenues permitted forthe year.The calculation of the smoothing mechanism ofsome activities/duties of the natural gas companiestakes into account the value of investments plannedup to the end of the concession. Since the forecast ofsuch investments was revised upwards in 2009,considering the updated information on the costs ofthe Sines LNG Terminal expansion project, inparticular, the overall impact of the smoothingmechanism led to a €15.6M increase in revenuecompared to the non-smoothed situation.
Investment in 2009 amounted to €466.3M, 48.8%up on 2008.Total average RAB grew 7.0% as a result of theentries into service that amounted to €383.9M forthe year (€309.7M relating to the electricity segmentand €74.2M for the natural gas segment).
Average RAB and investment
Smoothing effect on revenue
Operating costs
Jan-Dec 08 Jan-Dec 09 Var.%
Total Average RAB 2,587.3 2,769.0 7.0%
Electricity - Substations and Lines - coming into service in 2009 140.9
Electricity - others 1,284.4 1,304.2 1.5%
Hidro Land 379.3 363.8 -4.1%
Gas 923.6 960.0 3.9%
Capex 313.5 466.3 48.8%
Electricity 268.1 355.3 32.5%
Gas 45.0 110.7 145.7%
Others 0.3 0.4 33.3%
Average RAB and investmentMillion euros
Revenue
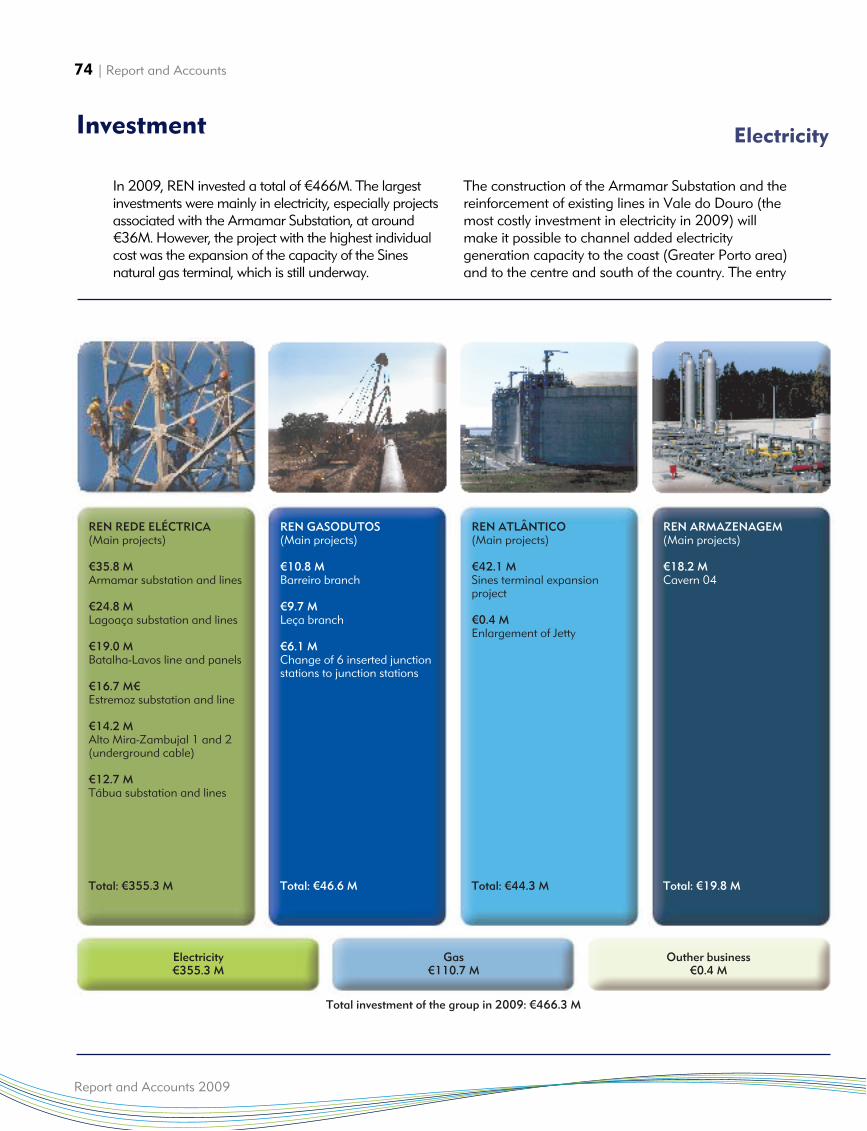
74 | Report and Accounts
Report and Accounts 2009
In 2009, REN invested a total of €466M. The largestinvestments were mainly in electricity, especially projectsassociated with the Armamar Substation, at around€36M. However, the project with the highest individualcost was the expansion of the capacity of the Sinesnatural gas terminal, which is still underway.
The construction of the Armamar Substation and thereinforcement of existing lines in Vale do Douro (themost costly investment in electricity in 2009) willmake it possible to channel added electricitygeneration capacity to the coast (Greater Porto area)and to the centre and south of the country. The entry
Investment Electricity
REN REDE ELÉCTRICA(Main projects)
€35.8 MArmamar substation and lines
€24.8 MLagoaça substation and lines
€19.0 MBatalha-Lavos line and panels
€16.7 M€Estremoz substation and line
€14.2 MAlto Mira-Zambujal 1 and 2(underground cable)
€12.7 MTábua substation and lines
Total: €355.3 M
REN GASODUTOS(Main projects)
€10.8 MBarreiro branch
€9.7 MLeça branch
€6.1 MChange of 6 inserted junctionstations to junction stations
Total: €46.6 M
REN ATLÂNTICO(Main projects)
€42.1 MSines terminal expansionproject
€0.4 MEnlargement of Jetty
Total: €44.3 M
REN ARMAZENAGEM(Main projects)
€18.2 MCavern 04
Total: €19.8 M
Electricity€355.3 M
Gas€110.7 M
Outher business€0.4 M
Total investment of the group in 2009: €466.3 M
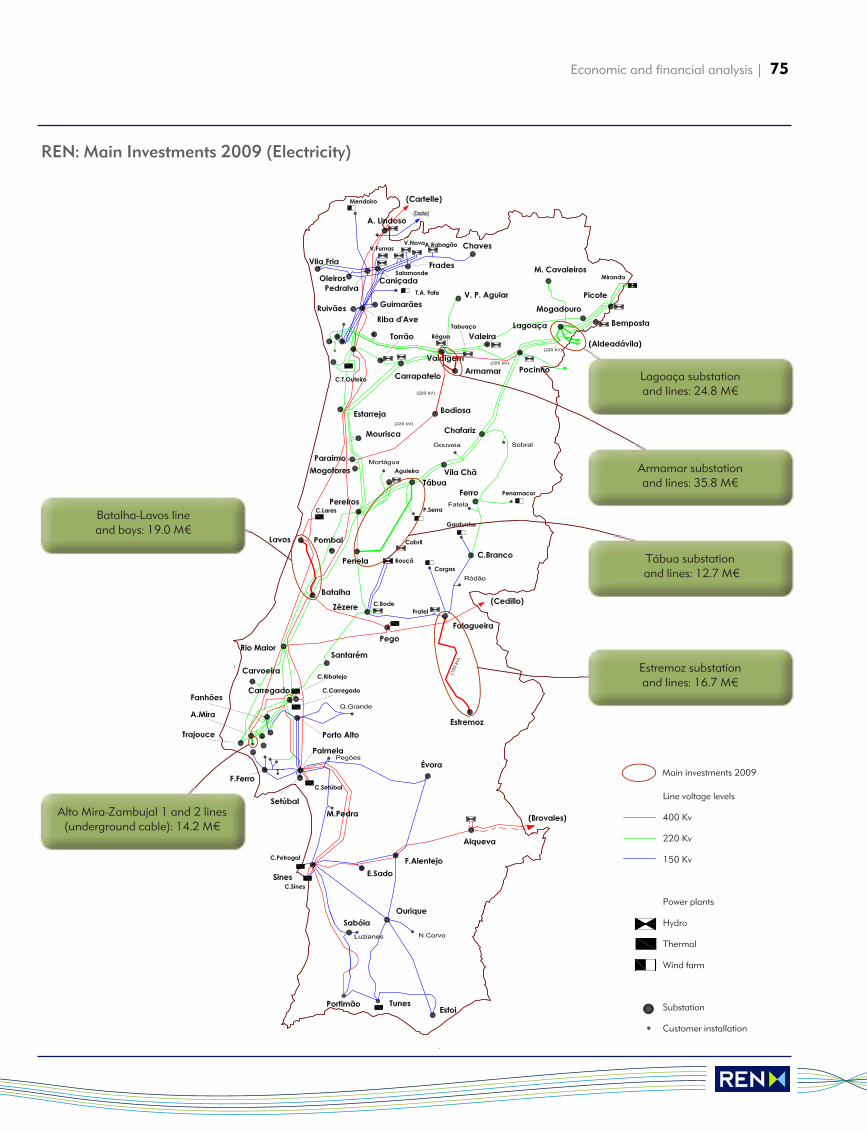
Economic and financial analysis | 75
REN: Main Investments 2009 (Electricity)
Line voltage levels
400 Kv
220 Kv
150 Kv
Power plants
Hydro
Thermal
Wind farm
Substation
Customer installation
Alto Mira-Zambujal 1 and 2 lines(underground cable): 14.2 M€
Armamar substationand lines: 35.8 M€
Tábua substation and lines: 12.7 M€
Estremoz substationand lines: 16.7 M€
Lagoaça substationand lines: 24.8 M€
Batalha-Lavos lineand bays: 19.0 M€
Main investments 2009
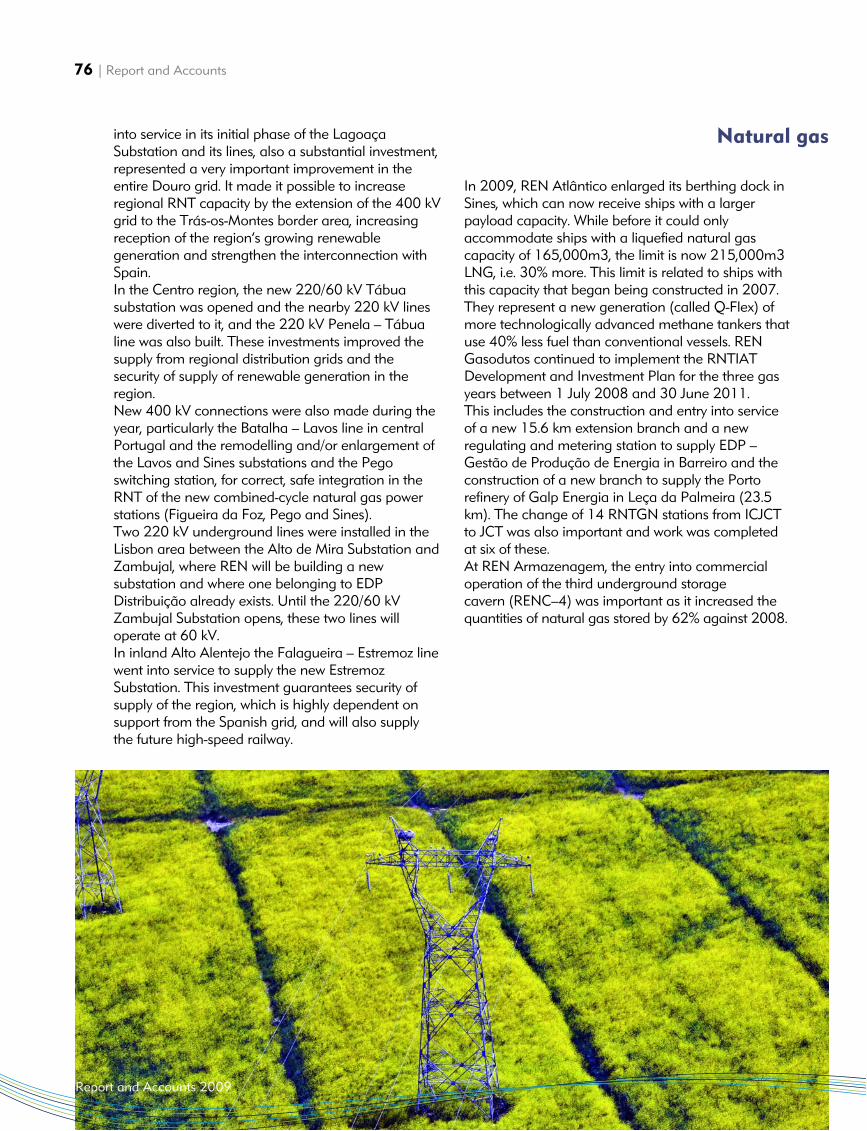
76 | Report and Accounts
Report and Accounts 2009
Natural gasinto service in its initial phase of the LagoaçaSubstation and its lines, also a substantial investment,represented a very important improvement in theentire Douro grid. It made it possible to increaseregional RNT capacity by the extension of the 400 kVgrid to the Trás-os-Montes border area, increasingreception of the region’s growing renewablegeneration and strengthen the interconnection withSpain.In the Centro region, the new 220/60 kV Tábuasubstation was opened and the nearby 220 kV lineswere diverted to it, and the 220 kV Penela – Tábualine was also built. These investments improved thesupply from regional distribution grids and thesecurity of supply of renewable generation in theregion.New 400 kV connections were also made during theyear, particularly the Batalha – Lavos line in centralPortugal and the remodelling and/or enlargement ofthe Lavos and Sines substations and the Pegoswitching station, for correct, safe integration in theRNT of the new combined-cycle natural gas powerstations (Figueira da Foz, Pego and Sines).Two 220 kV underground lines were installed in theLisbon area between the Alto de Mira Substation andZambujal, where REN will be building a newsubstation and where one belonging to EDPDistribuição already exists. Until the 220/60 kVZambujal Substation opens, these two lines willoperate at 60 kV.In inland Alto Alentejo the Falagueira – Estremoz linewent into service to supply the new EstremozSubstation. This investment guarantees security ofsupply of the region, which is highly dependent onsupport from the Spanish grid, and will also supplythe future high-speed railway.
In 2009, REN Atlântico enlarged its berthing dock inSines, which can now receive ships with a largerpayload capacity. While before it could onlyaccommodate ships with a liquefied natural gascapacity of 165,000m3, the limit is now 215,000m3LNG, i.e. 30% more. This limit is related to ships withthis capacity that began being constructed in 2007.They represent a new generation (called Q-Flex) ofmore technologically advanced methane tankers thatuse 40% less fuel than conventional vessels. RENGasodutos continued to implement the RNTIATDevelopment and Investment Plan for the three gasyears between 1 July 2008 and 30 June 2011. This includes the construction and entry into serviceof a new 15.6 km extension branch and a newregulating and metering station to supply EDP –Gestão de Produção de Energia in Barreiro and theconstruction of a new branch to supply the Portorefinery of Galp Energia in Leça da Palmeira (23.5km). The change of 14 RNTGN stations from ICJCTto JCT was also important and work was completedat six of these.At REN Armazenagem, the entry into commercialoperation of the third underground storage cavern (RENC–4) was important as it increased thequantities of natural gas stored by 62% against 2008.
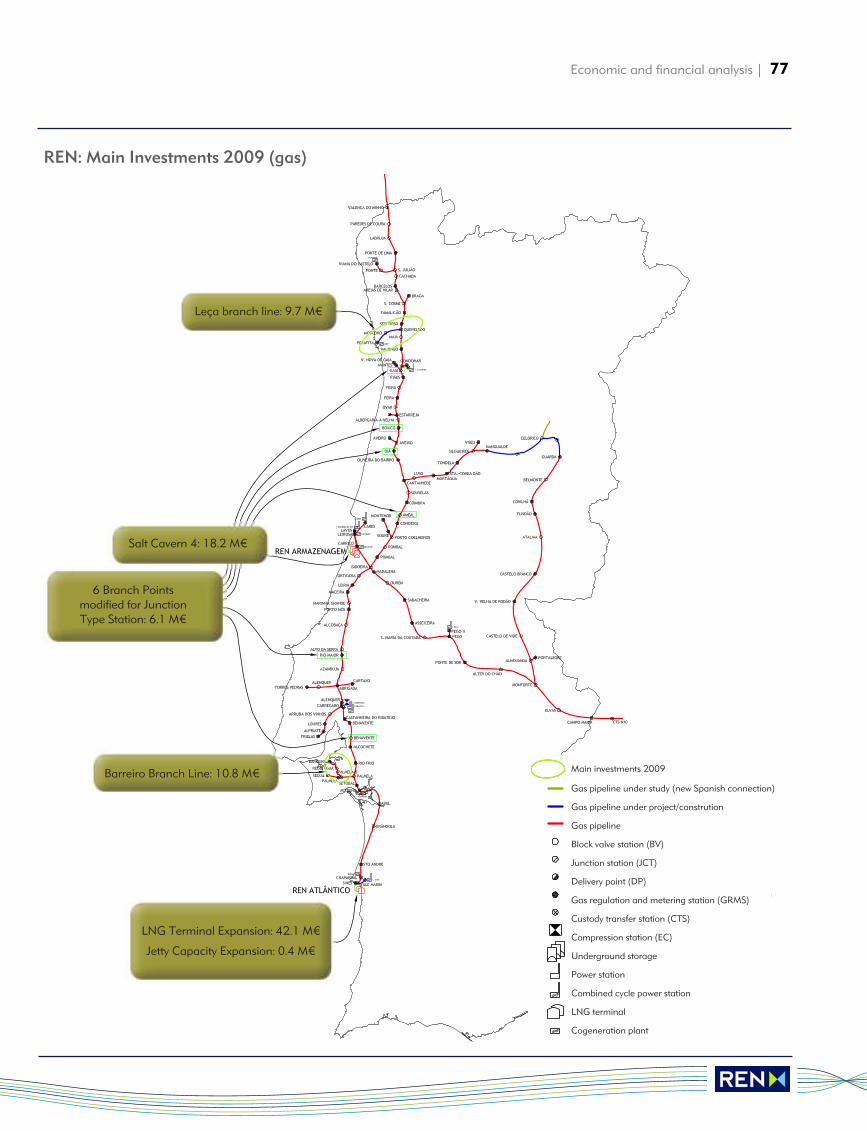
Economic and financial analysis | 77
REN: Main Investments 2009 (gas)
Leça branch line: 9.7 M€
Barreiro Branch Line: 10.8 M€Gas pipeline under study (new Spanish connection)
Gas pipeline under project/constrution
Gas pipeline
Block valve station (BV)
Junction station (JCT)
Delivery point (DP)
Gas regulation and metering station (GRMS)
Custody transfer station (CTS)
Compression station (EC)
Underground storage
Power station
Combined cycle power station
LNG terminal
Cogeneration plant
LNG Terminal Expansion: 42.1 M€
Jetty Capacity Expansion: 0.4 M€
Salt Cavern 4: 18.2 M€
6 Branch Pointsmodified for JunctionType Station: 6.1 M€
Main investments 2009
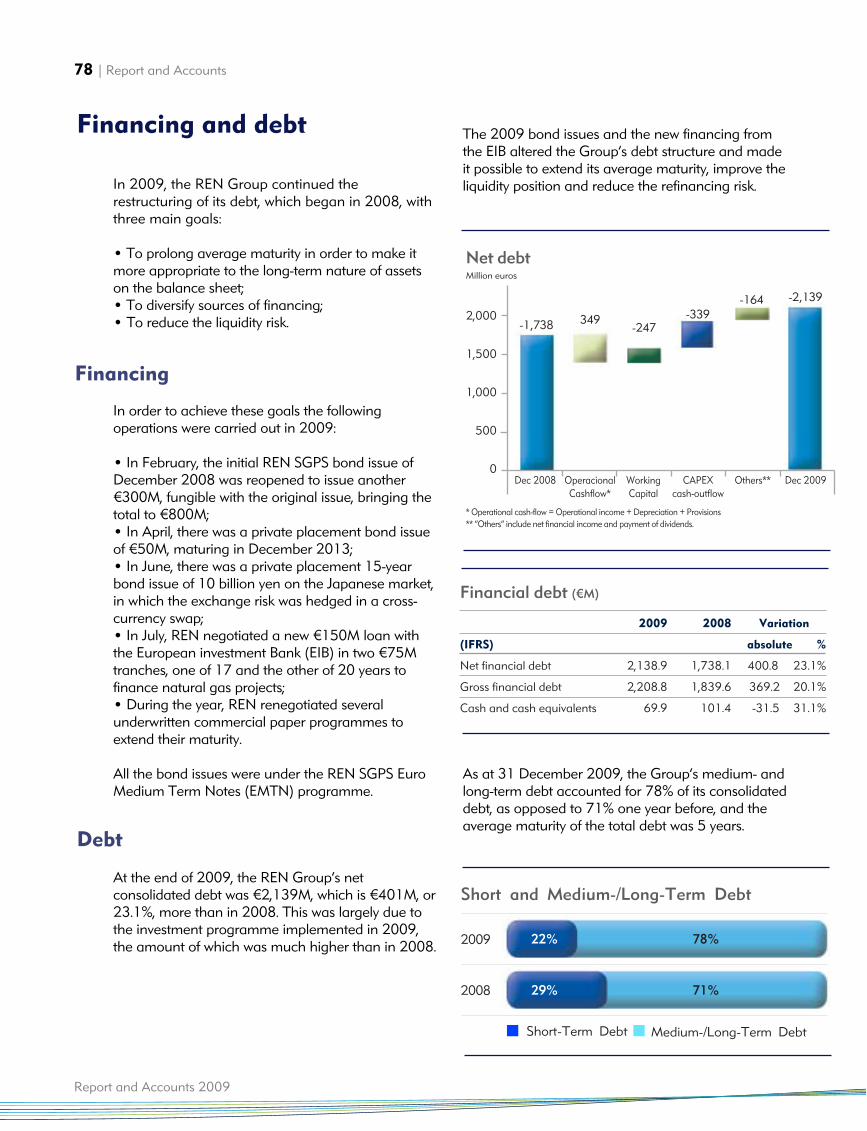
78 | Report and Accounts
In 2009, the REN Group continued therestructuring of its debt, which began in 2008, withthree main goals:
• To prolong average maturity in order to make itmore appropriate to the long-term nature of assetson the balance sheet;• To diversify sources of financing;• To reduce the liquidity risk.
In order to achieve these goals the followingoperations were carried out in 2009:
• In February, the initial REN SGPS bond issue ofDecember 2008 was reopened to issue another€300M, fungible with the original issue, bringing thetotal to €800M;• In April, there was a private placement bond issueof €50M, maturing in December 2013;• In June, there was a private placement 15-yearbond issue of 10 billion yen on the Japanese market,in which the exchange risk was hedged in a cross-currency swap;• In July, REN negotiated a new €150M loan withthe European investment Bank (EIB) in two €75Mtranches, one of 17 and the other of 20 years tofinance natural gas projects;• During the year, REN renegotiated severalunderwritten commercial paper programmes toextend their maturity.
All the bond issues were under the REN SGPS EuroMedium Term Notes (EMTN) programme.
At the end of 2009, the REN Group’s netconsolidated debt was €2,139M, which is €401M, or23.1%, more than in 2008. This was largely due tothe investment programme implemented in 2009,the amount of which was much higher than in 2008.
The 2009 bond issues and the new financing fromthe EIB altered the Group’s debt structure and madeit possible to extend its average maturity, improve theliquidity position and reduce the refinancing risk.
As at 31 December 2009, the Group’s medium- andlong-term debt accounted for 78% of its consolidateddebt, as opposed to 71% one year before, and theaverage maturity of the total debt was 5 years.
Financing and debt
Debt
Financing
2009 2008 Variation
(IFRS) absolute %
Net financial debt 2,138.9 1,738.1 400.8 23.1%
Gross financial debt 2,208.8 1,839.6 369.2 20.1%
Cash and cash equivalents 69.9 101.4 -31.5 31.1%
Financial debt (€M)
Short and Medium-/Long-Term Debt
2009
2008
Short-Term Debt Medium-/Long-Term Debt
22% 78%
29% 71%
Report and Accounts 2009
Net debt
2,000
1,500
1,000
500
0Dec 2008 Operacional Working CAPEX Others** Dec 2009
Cashflow* Capital cash-outflow
Million euros
* Operational cash-flow = Operational income + Depreciation + Provisions** “Others” include net financial income and payment of dividends.
-1,738 349-247
-339-164 -2,139
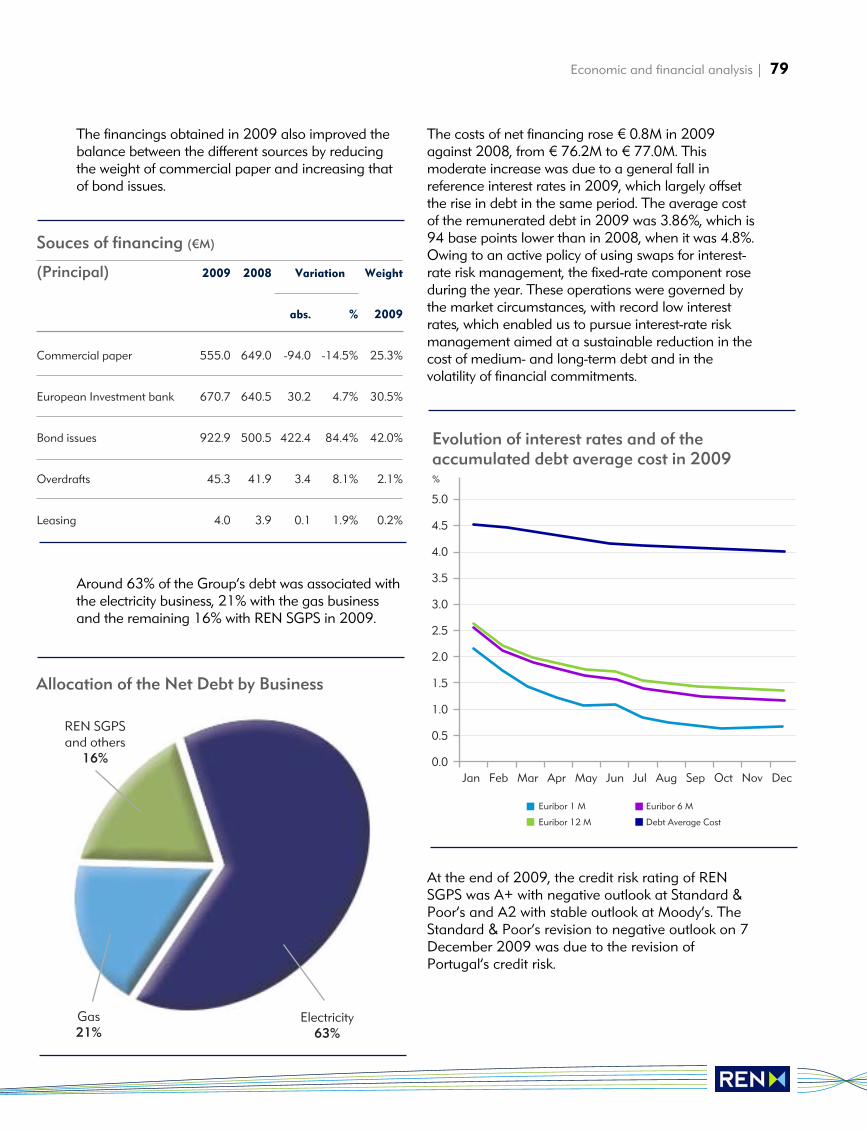
Economic and financial analysis | 79
The financings obtained in 2009 also improved thebalance between the different sources by reducingthe weight of commercial paper and increasing thatof bond issues.
Around 63% of the Group’s debt was associated withthe electricity business, 21% with the gas businessand the remaining 16% with REN SGPS in 2009.
The costs of net financing rose € 0.8M in 2009against 2008, from € 76.2M to € 77.0M. Thismoderate increase was due to a general fall inreference interest rates in 2009, which largely offsetthe rise in debt in the same period. The average costof the remunerated debt in 2009 was 3.86%, which is94 base points lower than in 2008, when it was 4.8%.Owing to an active policy of using swaps for interest-rate risk management, the fixed-rate component roseduring the year. These operations were governed bythe market circumstances, with record low interestrates, which enabled us to pursue interest-rate riskmanagement aimed at a sustainable reduction in thecost of medium- and long-term debt and in thevolatility of financial commitments.
At the end of 2009, the credit risk rating of RENSGPS was A+ with negative outlook at Standard &Poor’s and A2 with stable outlook at Moody’s. TheStandard & Poor’s revision to negative outlook on 7December 2009 was due to the revision ofPortugal’s credit risk.
2009 2008 Variation Weight
abs. % 2009
Commercial paper 555.0 649.0 -94.0 -14.5% 25.3%
European Investment bank 670.7 640.5 30.2 4.7% 30.5%
Bond issues 922.9 500.5 422.4 84.4% 42.0%
Overdrafts 45.3 41.9 3.4 8.1% 2.1%
Leasing 4.0 3.9 0.1 1.9% 0.2%
Souces of financing (€M)
(Principal)
Allocation of the Net Debt by Business
REN SGPSand others
16%
Electricity63%
Gas21%
Evolution of interest rates and of theaccumulated debt average cost in 2009
5.0
4.5
4.0
3.5
3.0
2.5
2.0
1.5
1.0
0.5
0.0Jan Feb Mar Apr May Jun Jul Aug Sep Oct Nov Dec
%
Euribor 1 M Euribor 6 M
Euribor 12 M Debt Average Cost
Report and Accounts 2009
Environment, society and governance (ASG)
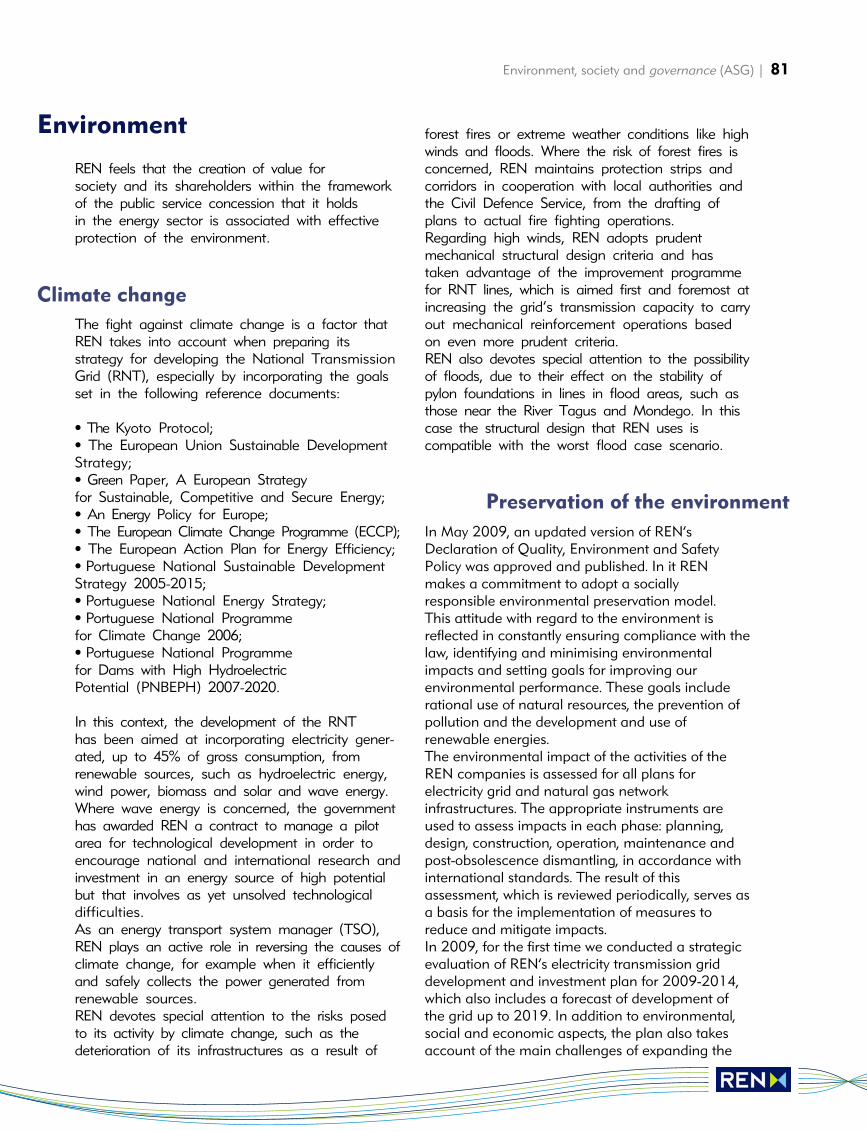
Environment, society and governance (ASG) | 81
REN feels that the creation of value forsociety and its shareholders within the frameworkof the public service concession that it holdsin the energy sector is associated with effectiveprotection of the environment.
The fight against climate change is a factor thatREN takes into account when preparing itsstrategy for developing the National TransmissionGrid (RNT), especially by incorporating the goalsset in the following reference documents:
• The Kyoto Protocol;• The European Union Sustainable DevelopmentStrategy;• Green Paper, A European Strategyfor Sustainable, Competitive and Secure Energy;• An Energy Policy for Europe;• The European Climate Change Programme (ECCP);• The European Action Plan for Energy Efficiency;• Portuguese National Sustainable DevelopmentStrategy 2005-2015;• Portuguese National Energy Strategy;• Portuguese National Programmefor Climate Change 2006;• Portuguese National Programmefor Dams with High HydroelectricPotential (PNBEPH) 2007-2020.
In this context, the development of the RNThas been aimed at incorporating electricity gener-ated, up to 45% of gross consumption, fromrenewable sources, such as hydroelectric energy,wind power, biomass and solar and wave energy.Where wave energy is concerned, the governmenthas awarded REN a contract to manage a pilotarea for technological development in order toencourage national and international research andinvestment in an energy source of high potentialbut that involves as yet unsolved technologicaldifficulties.As an energy transport system manager (TSO),REN plays an active role in reversing the causes ofclimate change, for example when it efficientlyand safely collects the power generated fromrenewable sources.REN devotes special attention to the risks posedto its activity by climate change, such as thedeterioration of its infrastructures as a result of
forest fires or extreme weather conditions like highwinds and floods. Where the risk of forest fires isconcerned, REN maintains protection strips andcorridors in cooperation with local authorities andthe Civil Defence Service, from the drafting ofplans to actual fire fighting operations.Regarding high winds, REN adopts prudentmechanical structural design criteria and hastaken advantage of the improvement programmefor RNT lines, which is aimed first and foremost atincreasing the grid’s transmission capacity to carryout mechanical reinforcement operations basedon even more prudent criteria.REN also devotes special attention to the possibilityof floods, due to their effect on the stability ofpylon foundations in lines in flood areas, such asthose near the River Tagus and Mondego. In thiscase the structural design that REN uses iscompatible with the worst flood case scenario.
In May 2009, an updated version of REN’sDeclaration of Quality, Environment and SafetyPolicy was approved and published. In it RENmakes a commitment to adopt a socially responsible environmental preservation model.This attitude with regard to the environment isreflected in constantly ensuring compliance with thelaw, identifying and minimising environmentalimpacts and setting goals for improving our environmental performance. These goals includerational use of natural resources, the prevention ofpollution and the development and use of renewable energies.The environmental impact of the activities of theREN companies is assessed for all plans for electricity grid and natural gas network infrastructures. The appropriate instruments areused to assess impacts in each phase: planning,design, construction, operation, maintenance andpost-obsolescence dismantling, in accordance withinternational standards. The result of this assessment, which is reviewed periodically, serves asa basis for the implementation of measures toreduce and mitigate impacts.In 2009, for the first time we conducted a strategicevaluation of REN’s electricity transmission griddevelopment and investment plan for 2009-2014,which also includes a forecast of development ofthe grid up to 2019. In addition to environmental,social and economic aspects, the plan also takesaccount of the main challenges of expanding the
Environment
Climate change
Preservation of the environment
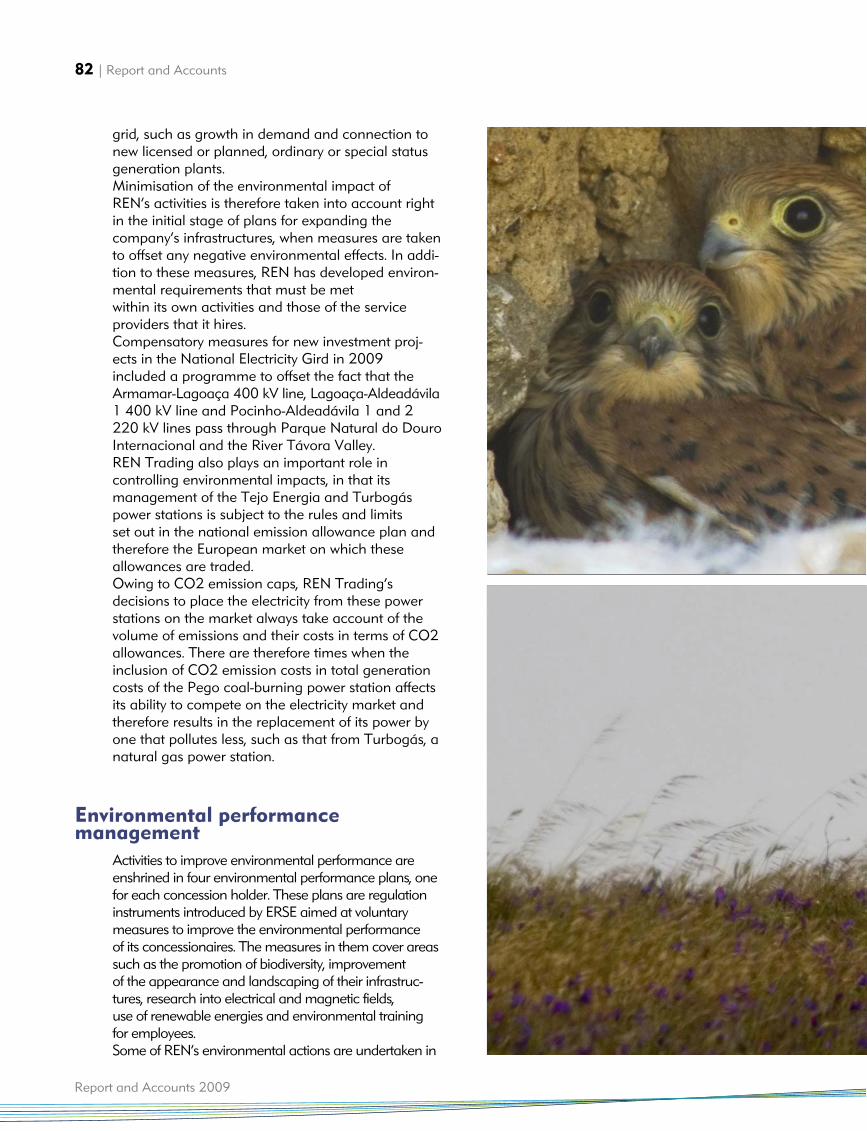
grid, such as growth in demand and connection tonew licensed or planned, ordinary or special statusgeneration plants. Minimisation of the environmental impact of REN’s activities is therefore taken into account rightin the initial stage of plans for expanding the company’s infrastructures, when measures are takento offset any negative environmental effects. In addi-tion to these measures, REN has developed environ-mental requirements that must be met within its own activities and those of the serviceproviders that it hires.Compensatory measures for new investment proj-ects in the National Electricity Gird in 2009 included a programme to offset the fact that theArmamar-Lagoaça 400 kV line, Lagoaça-Aldeadávila1 400 kV line and Pocinho-Aldeadávila 1 and 2220 kV lines pass through Parque Natural do DouroInternacional and the River Távora Valley. REN Trading also plays an important role in controlling environmental impacts, in that its management of the Tejo Energia and Turbogáspower stations is subject to the rules and limits set out in the national emission allowance plan andtherefore the European market on which theseallowances are traded.Owing to CO2 emission caps, REN Trading’s decisions to place the electricity from these powerstations on the market always take account of thevolume of emissions and their costs in terms of CO2allowances. There are therefore times when theinclusion of CO2 emission costs in total generationcosts of the Pego coal-burning power station affectsits ability to compete on the electricity market andtherefore results in the replacement of its power byone that pollutes less, such as that from Turbogás, anatural gas power station.
Activities to improve environmental performance areenshrined in four environmental performance plans, onefor each concession holder. These plans are regulationinstruments introduced by ERSE aimed at voluntarymeasures to improve the environmental performance of its concessionaires. The measures in them cover areassuch as the promotion of biodiversity, improvement of the appearance and landscaping of their infrastruc-tures, research into electrical and magnetic fields, use of renewable energies and environmental trainingfor employees.Some of REN’s environmental actions are undertaken in
82 | Report and Accounts
Report and Accounts 2009
Environmental performance management
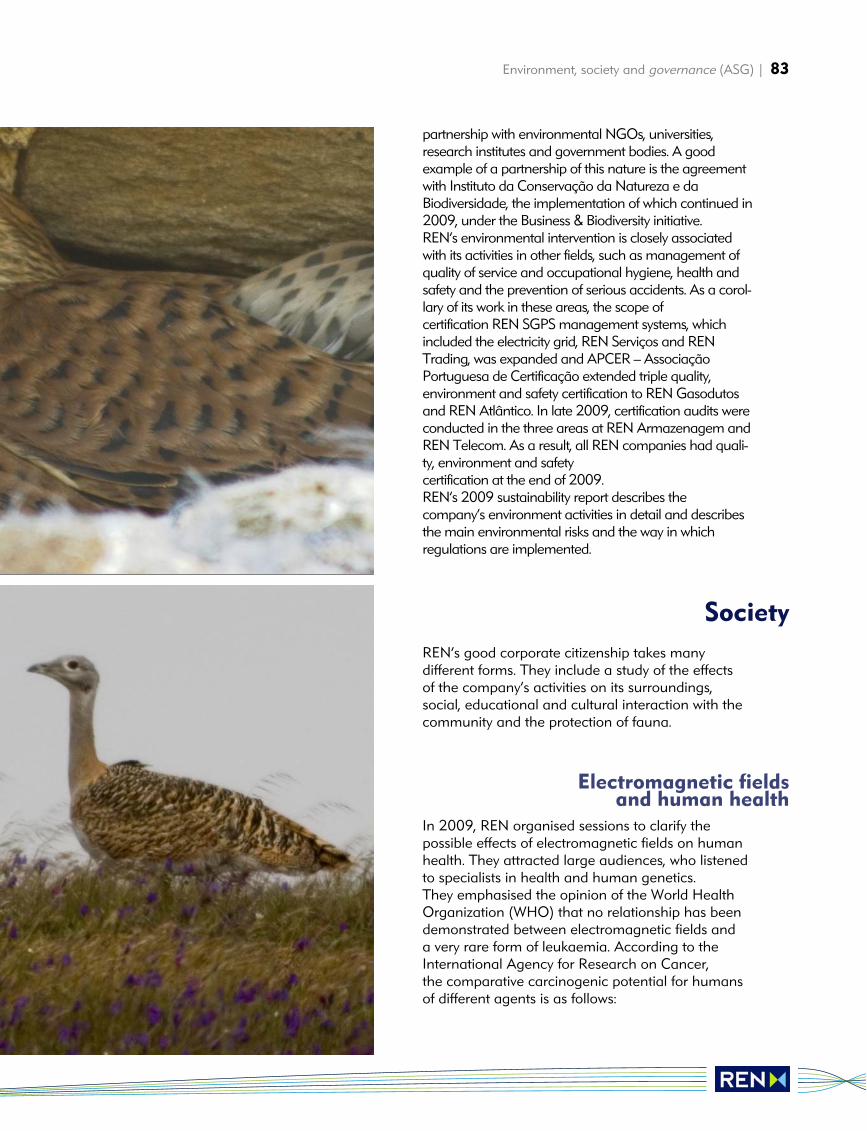
Environment, society and governance (ASG) | 83
Electromagnetic fields and human health
Society
partnership with environmental NGOs, universities,research institutes and government bodies. A goodexample of a partnership of this nature is the agreementwith Instituto da Conservação da Natureza e daBiodiversidade, the implementation of which continued in2009, under the Business & Biodiversity initiative. REN’s environmental intervention is closely associatedwith its activities in other fields, such as management ofquality of service and occupational hygiene, health andsafety and the prevention of serious accidents. As a corol-lary of its work in these areas, the scope of certification REN SGPS management systems, whichincluded the electricity grid, REN Serviços and RENTrading, was expanded and APCER – AssociaçãoPortuguesa de Certificação extended triple quality, environment and safety certification to REN Gasodutosand REN Atlântico. In late 2009, certification audits wereconducted in the three areas at REN Armazenagem andREN Telecom. As a result, all REN companies had quali-ty, environment and safety certification at the end of 2009.REN’s 2009 sustainability report describes the company’s environment activities in detail and describesthe main environmental risks and the way in which regulations are implemented.
REN’s good corporate citizenship takes many different forms. They include a study of the effects of the company’s activities on its surroundings,social, educational and cultural interaction with thecommunity and the protection of fauna.
In 2009, REN organised sessions to clarify the possible effects of electromagnetic fields on humanhealth. They attracted large audiences, who listenedto specialists in health and human genetics. They emphasised the opinion of the World HealthOrganization (WHO) that no relationship has beendemonstrated between electromagnetic fields and a very rare form of leukaemia. According to theInternational Agency for Research on Cancer, the comparative carcinogenic potential for humansof different agents is as follows:
84 | Report and Accounts
Report and Accounts 2009
Nonetheless, in spite of this scientific finding, REN promotes strict compliance with internationalstandards on exposure limits for its workers and the general public. In this context, REN has adoptedthe WHO recommendation that national authoritiesestablish a protection programme that includesmeasuring electromagnetic fields so that precautions can be taken. REN also feels thatresearch programmes should be organised toreduce the uncertainty of the scientific evidence.REN therefore supported the MEDEA project set upby Sociedade Portuguesa de Física (SPF) to encourage students at schools to measure andunderstand the electromagnetic fields around them.All the participating schools were given electric andmagnetic field meters and the students were askedto submit a report on the results of their measure-ments. The students were challenged with present-ing a project using their measurements. A panel ofjudges appointed by the SPF chose the winners.Also in this area, a television series entitled O Condoninho da Renata was designed to awakenyoung people’s interest in energy efficiency and the company’s activities, including the issue ofelectromagnetic fields.
Associated with this series is 24-hour real-timeobservation of a stork’s nest on a REN pylon.Increasing use of the internet raised the awarenessof a large number of people to the way in which thisbird can live in harmony with the company’s infrastructures.
PPaarrttiicciippaattiioonn iinn sscciieennttiiffiicc pprroojjeeccttss REN participates in a number of R&D projects indifferent areas. The most important projects startedin 2009 were as follows:
PPEEGGAASSEEOne of the aims of this four-year project is to definethe information requirements for integrated monitoring of the security of the European electricitytransmission grid. The project covers the high andextra-high voltage transmission grids in Europe andit is being implemented by a consortium of 20 participants, including electricity system operators,specialised companies and recognised researchcentres working on the analysis of energy systemsand applied mathematics.
MMEERRGGEE -- MMoobbiillee EEnneerrggyy RReessoouurrcceess iinn GGrriiddss ooff EElleeccttrriicciittyyHeaded by INESC Porto, the aim of the MERGEproject, which has a budget of €.5M, is to preparethe European electricity system for the mass use of electric cars, as a result of the need to reducepollutant gas emissions and the future oil shortage.The project consists of finding ways of minimisingthe need to reinforce electricity grid and generationinfrastructures in order to avoid excessive costs,which would have to be borne by electric vehicleusers. It is intended to help build an intelligent system that will adapt electric vehicle batterycharges to the availability of the resources of electricity grid infrastructure, taking account of the characteristics of the European electricity systems. MERGE involves 16 companies and institutions, including REN.
SSppoonnssoorrsshhiipp ooff ccuullttuurraall aaccttiivviittiieessREN has a policy of assisting cultural activities. In recent years, it has sponsored hundreds of cultural initiatives, including cinema, photography,documentaries, animation, theatre and music. The most important were Dias da Música at CCB,the purchase of unpublished Fernando Pessoa correspondence and the digitisation and restoration
Effect Agent
Human carcinogens Asbestos
Alcoholic beverages
Benzene
Mustard gas
Radon
Solar radiation
Tobacco
X-rays and gamma rays
Probably Creosote
carcinogenic Diesel exhaust fumes
to humans Formaldehyde
PCBs
Possibly Caffe
carcinogenic Very low frequency
to humans magnetic fields
Petrol exhaust fumes
Fiberglass
Styrene
Electromagnetic fields and human health
Interaction with the community
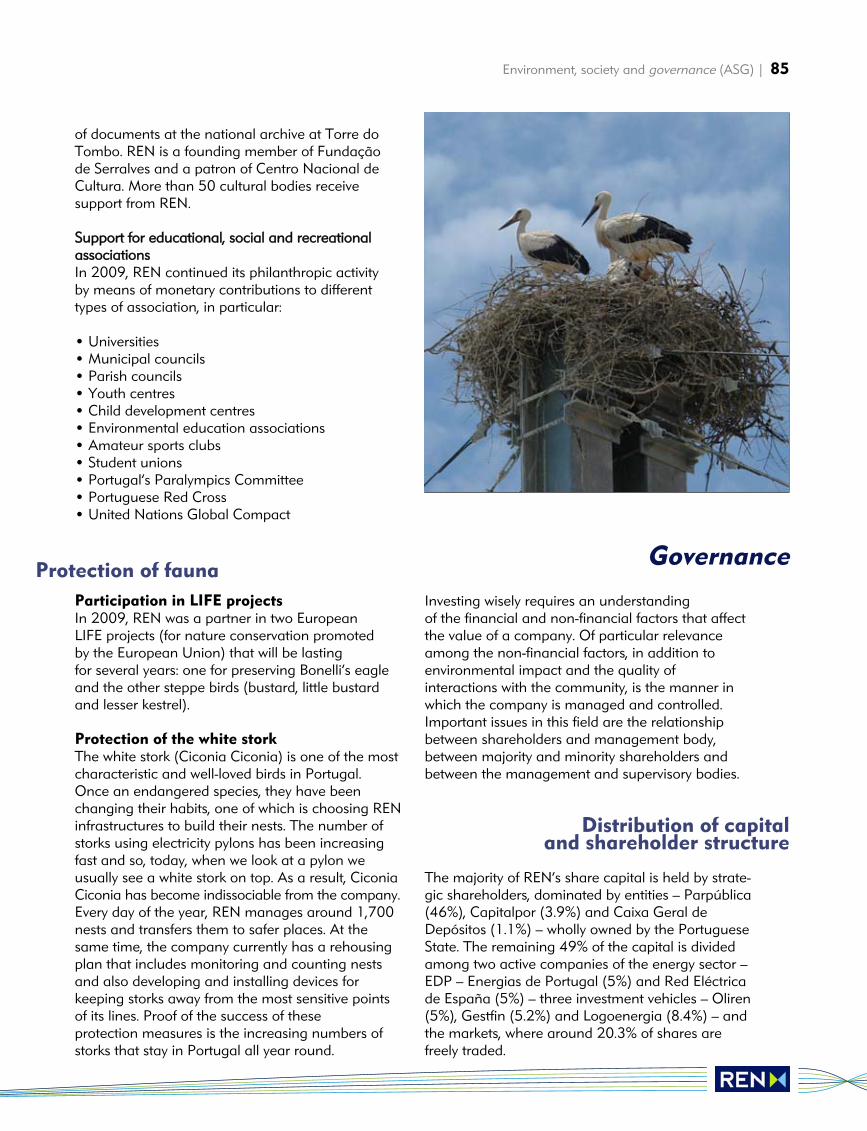
Environment, society and governance (ASG) | 85
of documents at the national archive at Torre doTombo. REN is a founding member of Fundação de Serralves and a patron of Centro Nacional deCultura. More than 50 cultural bodies receive support from REN.
SSuuppppoorrtt ffoorr eedduuccaattiioonnaall,, ssoocciiaall aanndd rreeccrreeaattiioonnaallaassssoocciiaattiioonnssIn 2009, REN continued its philanthropic activity by means of monetary contributions to differenttypes of association, in particular:
• Universities• Municipal councils• Parish councils• Youth centres• Child development centres• Environmental education associations• Amateur sports clubs• Student unions• Portugal’s Paralympics Committee• Portuguese Red Cross• United Nations Global Compact
Participation in LIFE projectsIn 2009, REN was a partner in two European LIFE projects (for nature conservation promoted by the European Union) that will be lasting for several years: one for preserving Bonelli’s eagleand the other steppe birds (bustard, little bustardand lesser kestrel).
Protection of the white storkThe white stork (Ciconia Ciconia) is one of the mostcharacteristic and well-loved birds in Portugal. Once an endangered species, they have beenchanging their habits, one of which is choosing REN infrastructures to build their nests. The number ofstorks using electricity pylons has been increasingfast and so, today, when we look at a pylon we usually see a white stork on top. As a result, CiconiaCiconia has become indissociable from the company.Every day of the year, REN manages around 1,700nests and transfers them to safer places. At thesame time, the company currently has a rehousingplan that includes monitoring and counting nestsand also developing and installing devices for keeping storks away from the most sensitive pointsof its lines. Proof of the success of these protection measures is the increasing numbers ofstorks that stay in Portugal all year round.
Investing wisely requires an understanding of the financial and non-financial factors that affectthe value of a company. Of particular relevanceamong the non-financial factors, in addition to environmental impact and the quality of interactions with the community, is the manner inwhich the company is managed and controlled.Important issues in this field are the relationshipbetween shareholders and management body,between majority and minority shareholders andbetween the management and supervisory bodies.
The majority of REN’s share capital is held by strate-gic shareholders, dominated by entities – Parpública(46%), Capitalpor (3.9%) and Caixa Geral deDepósitos (1.1%) – wholly owned by the PortugueseState. The remaining 49% of the capital is dividedamong two active companies of the energy sector –EDP – Energias de Portugal (5%) and Red Eléctricade España (5%) – three investment vehicles – Oliren(5%), Gestfin (5.2%) and Logoenergia (8.4%) – andthe markets, where around 20.3% of shares arefreely traded.
Protection of fauna
Distribution of capital and shareholder structure
Governance
86 | Report and Accounts
Report and Accounts 2009
49% of the capital of REN is composed of class Ashares, which give the right to information, to vote in general meetings, to challenge the resolutions of the governing bodies and to be paid dividends.These shares can be freely traded although they are subject to the statutory protection schemeas regards not exercising the right to vote, which applies to the acquisition of shares exceeding the legal limits - 5% and 10%, as established in Decrees-Law 29/2006 and 30/2006of 15 February.The remaining 51% of the share capital consists of class B shares, not yet privatised, which enshrinenot only the rights inherent in ownership of class Ashares but are also not governed by the above-mentioned protection scheme.The company is not aware of any impediment,besides the referred to legal restrictions, to the free trading of shares, including shareholder agreements relative to the assignment of eithersecurities or voting rights.Each share of REN corresponds to one vote, irrespective of class.
REN’s governance model aims to be transparentand effective, by separating the powers of the boardof directors - which is responsible for drawing upcompany strategy and monitoring its implementa-tion - from the executive committee, delegated bythe board of directors with operational duties.The audit committee is responsible for supervisingthe activity of both bodies, while a statutory auditoris in charge of examining the financial statements.
The general meeting of REN, which is composed ofall its shareholders, is the company’s highest body. It is responsible, among other duties, for appointingthe board of directors, the audit committee, the statutory auditor and the salaries committee.
The board of directors of REN was composed of twelve directors in office at the end of 2009 - fourexecutive directors and eight non-executive
directors. Three of the non-executive directorsformed the audit committee.The board of directors is responsible for, among its many duties, defining the company's strategyand its organisational structure, as well as approv-ing high-value investments and monitoring their implementation.The resolutions of the board of directors are generally approved by a majority of votes of thedirectors, cast in person or by representation. In 2009, the non-executive directors played a substantial role in the formulation of business strategy and they were actively involved in its implementation. They also closely followed the activities of the executive directors, promoting, inparticular, the strengthening of the internal controlsystems and of the management of various types ofrisk. In this context, an Audit Office was established.This is an internal body, with the objective of implementing the Group’s transparency policy.The board of directors met 12 times during theyear.
The current executive committee is composed of fourdirectors, appointed by the board of directors by resolution of 27 November 2009.The executive committee is responsible for the day-to-day management of REN in accordance withthe strategy defined by the board of directors. The executive committee’s duties are detailed in thereport on corporate governance and include the management of the group of companies that makeup REN, the allocation of resources, fostering synergies and monitoring the implementation of thepolicies that are defined for the different areas.The powers delegated in the executive committee bythe board of directors require that this body meets regularly and diligently. In line with these guidelines,the executive committee met 49 times in 2009.The work of the board of directors and also the executive committee complies with the rules thathave been created to formalise the functioning ofthese two governing bodies.
Supervisory functions are performed by an audit committee and statutory auditor.The audit committee is composed of three members,appointed by the general meeting.The audit committee is responsible for overseeing the
Governance model
General meeting
Board of directors
Executive committee
Audit committee and statutory auditor
Share classes
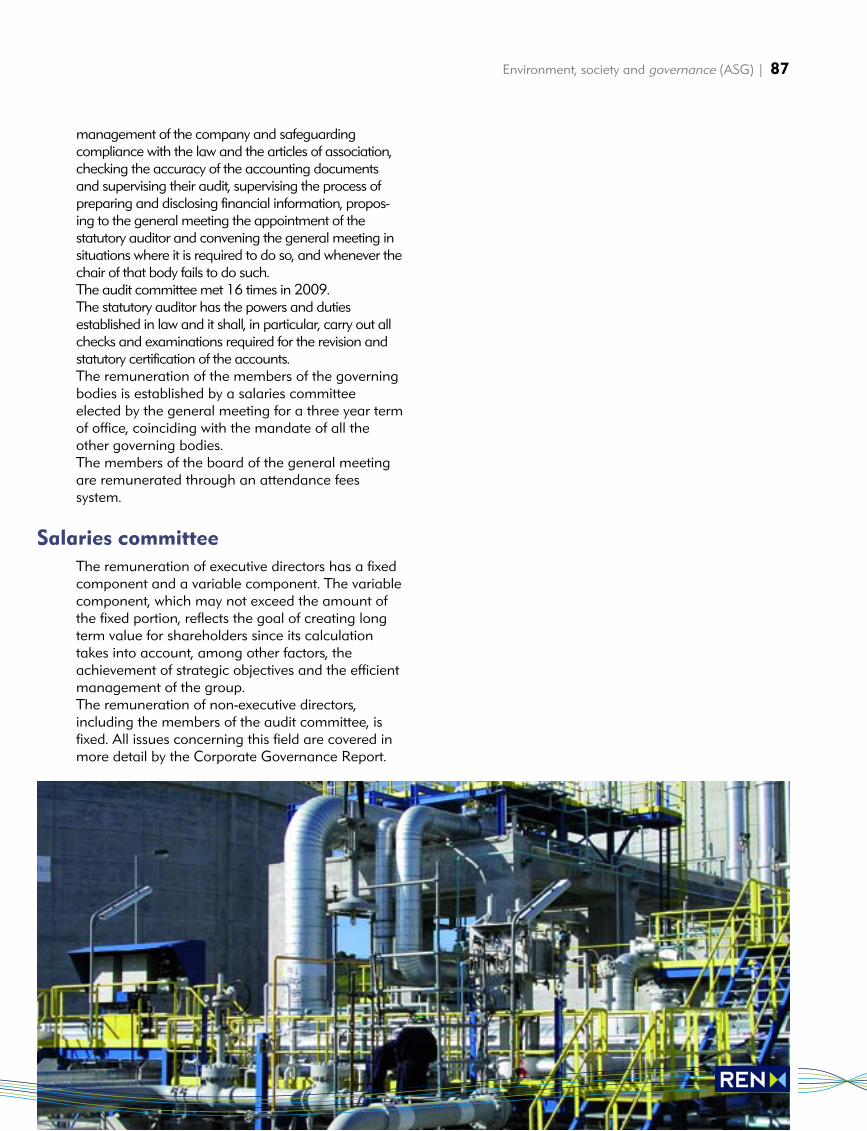
management of the company and safeguarding compliance with the law and the articles of association,checking the accuracy of the accounting documentsand supervising their audit, supervising the process ofpreparing and disclosing financial information, propos-ing to the general meeting the appointment of the statutory auditor and convening the general meeting insituations where it is required to do so, and whenever thechair of that body fails to do such. The audit committee met 16 times in 2009.The statutory auditor has the powers and duties established in law and it shall, in particular, carry out allchecks and examinations required for the revision andstatutory certification of the accounts.The remuneration of the members of the governingbodies is established by a salaries committee elected by the general meeting for a three year termof office, coinciding with the mandate of all theother governing bodies.The members of the board of the general meetingare remunerated through an attendance fees system.
The remuneration of executive directors has a fixedcomponent and a variable component. The variablecomponent, which may not exceed the amount ofthe fixed portion, reflects the goal of creating longterm value for shareholders since its calculationtakes into account, among other factors, theachievement of strategic objectives and the efficientmanagement of the group.The remuneration of non-executive directors, including the members of the audit committee, isfixed. All issues concerning this field are covered inmore detail by the Corporate Governance Report.
Environment, society and governance (ASG) | 87
Salaries committee

Report and Accounts 2009
Human resources
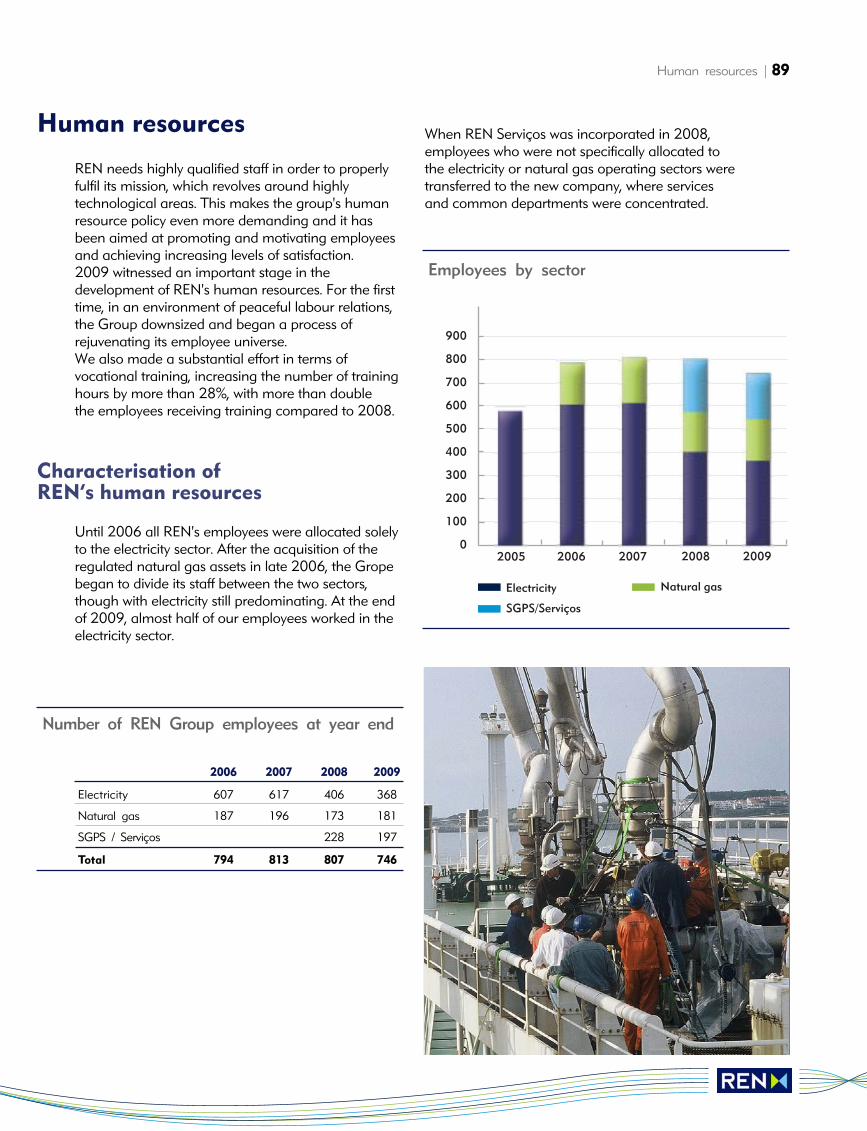
Human resources | 89
REN needs highly qualified staff in order to properlyfulfil its mission, which revolves around highlytechnological areas. This makes the group's humanresource policy even more demanding and it hasbeen aimed at promoting and motivating employeesand achieving increasing levels of satisfaction.2009 witnessed an important stage in the development of REN's human resources. For the firsttime, in an environment of peaceful labour relations,the Group downsized and began a process of rejuvenating its employee universe.We also made a substantial effort in terms of vocational training, increasing the number of traininghours by more than 28%, with more than double the employees receiving training compared to 2008.
Until 2006 all REN's employees were allocated solelyto the electricity sector. After the acquisition of theregulated natural gas assets in late 2006, the Gropebegan to divide its staff between the two sectors,though with electricity still predominating. At the endof 2009, almost half of our employees worked in theelectricity sector.
When REN Serviços was incorporated in 2008,employees who were not specifically allocated to the electricity or natural gas operating sectors weretransferred to the new company, where services and common departments were concentrated.
Human resources
Characterisation of REN’s human resources
2006 2007 2008 2009
Electricity 607 617 406 368
Natural gas 187 196 173 181
SGPS / Serviços 228 197
Total 794 813 807 746
Number of REN Group employees at year end
2005
Electricity Natural gas
900
800
700
600
500
400
300
200
100
02006 2007 2008 2009
SGPS/Serviços
Employees by sector
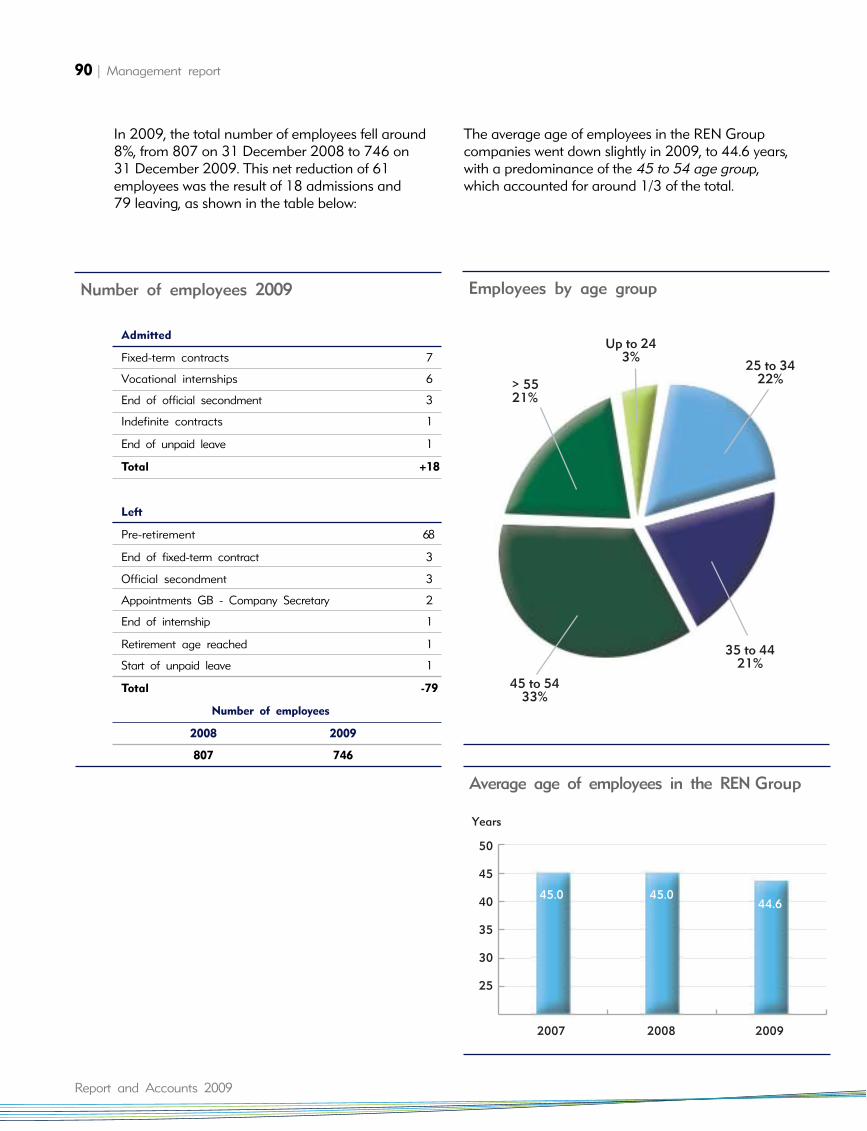
90 | Management report
Report and Accounts 2009
Admitted
Fixed-term contracts 7
Vocational internships 6
End of official secondment 3
Indefinite contracts 1
End of unpaid leave 1
Total +18
Left
Pre-retirement 68
End of fixed-term contract 3
Official secondment 3
Appointments GB - Company Secretary 2
End of internship 1
Retirement age reached 1
Start of unpaid leave 1
Total -79
Number of employees
2008 2009
807 746
Number of employees 2009
In 2009, the total number of employees fell around8%, from 807 on 31 December 2008 to 746 on31 December 2009. This net reduction of 61employees was the result of 18 admissions and79 leaving, as shown in the table below:
The average age of employees in the REN Groupcompanies went down slightly in 2009, to 44.6 years,with a predominance of the 45 to 54 age group,which accounted for around 1/3 of the total.
> 5521%
25 to 3422%
45 to 5433%
Up to 243%
35 to 4421%
Employees by age group
Years
50
45
40
35
30
25
2007 2008 2009
44.645.0 45.0
Average age of employees in the REN Group
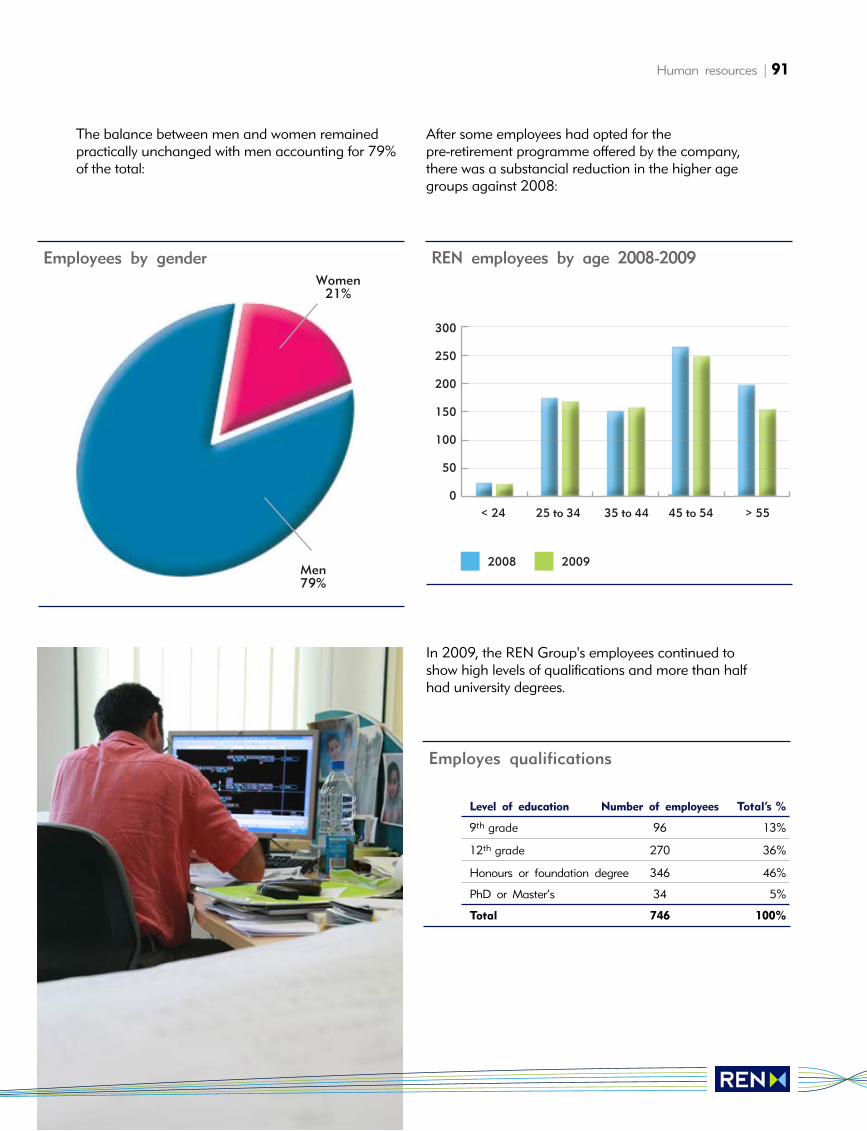
Human resources | 91
Level of education Number of employees Total’s %
9th grade 96 13%
12th grade 270 36%
Honours or foundation degree 346 46%
PhD or Master’s 34 5%
Total 746 100%
Employes qualifications
The balance between men and women remainedpractically unchanged with men accounting for 79%of the total:
After some employees had opted for the pre-retirement programme offered by the company,there was a substancial reduction in the higher agegroups against 2008:
In 2009, the REN Group's employees continued toshow high levels of qualifications and more than halfhad university degrees.
Women21%
Men79%
Employees by gender
300
250
200
150
100
50
0< 24 25 to 34 35 to 44 45 to 54 > 55
2008 2009
REN employees by age 2008-2009
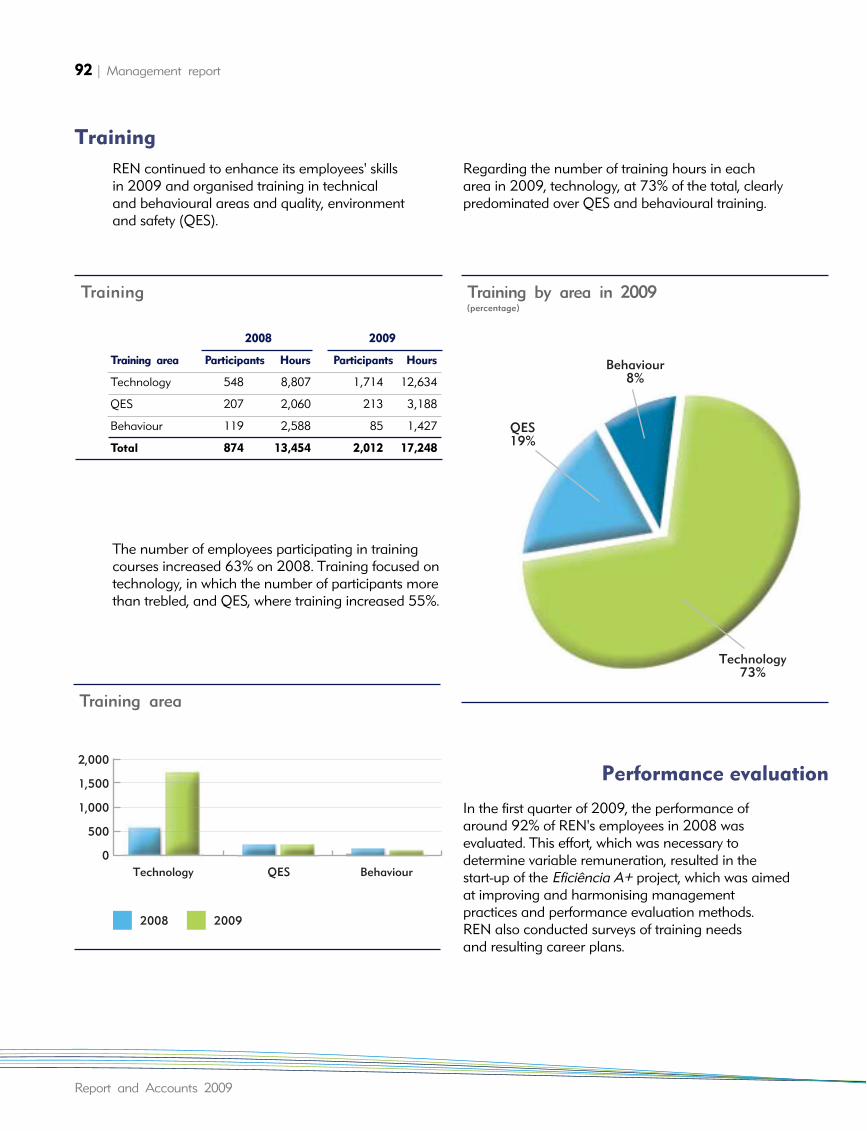
92 | Management report
Report and Accounts 2009
REN continued to enhance its employees' skillsin 2009 and organised training in technical and behavioural areas and quality, environment and safety (QES).
The number of employees participating in trainingcourses increased 63% on 2008. Training focused ontechnology, in which the number of participants morethan trebled, and QES, where training increased 55%.
Regarding the number of training hours in each area in 2009, technology, at 73% of the total, clearlypredominated over QES and behavioural training.
In the first quarter of 2009, the performance ofaround 92% of REN's employees in 2008 wasevaluated. This effort, which was necessary to determine variable remuneration, resulted in the start-up of the Eficiência A+ project, which was aimedat improving and harmonising management practices and performance evaluation methods. REN also conducted surveys of training needs and resulting career plans.
Training
2008 2009
Training area Participants Hours Participants Hours
Technology 548 8,807 1,714 12,634
QES 207 2,060 213 3,188
Behaviour 119 2,588 85 1,427
Total 874 13,454 2,012 17,248
Training
Technology QES Behaviour
2,000
1,500
1,000
500
0
2008 2009
Training area
QES19%
Behaviour8%
Technology73%
Training by area in 2009(percentage)
Performance evaluation
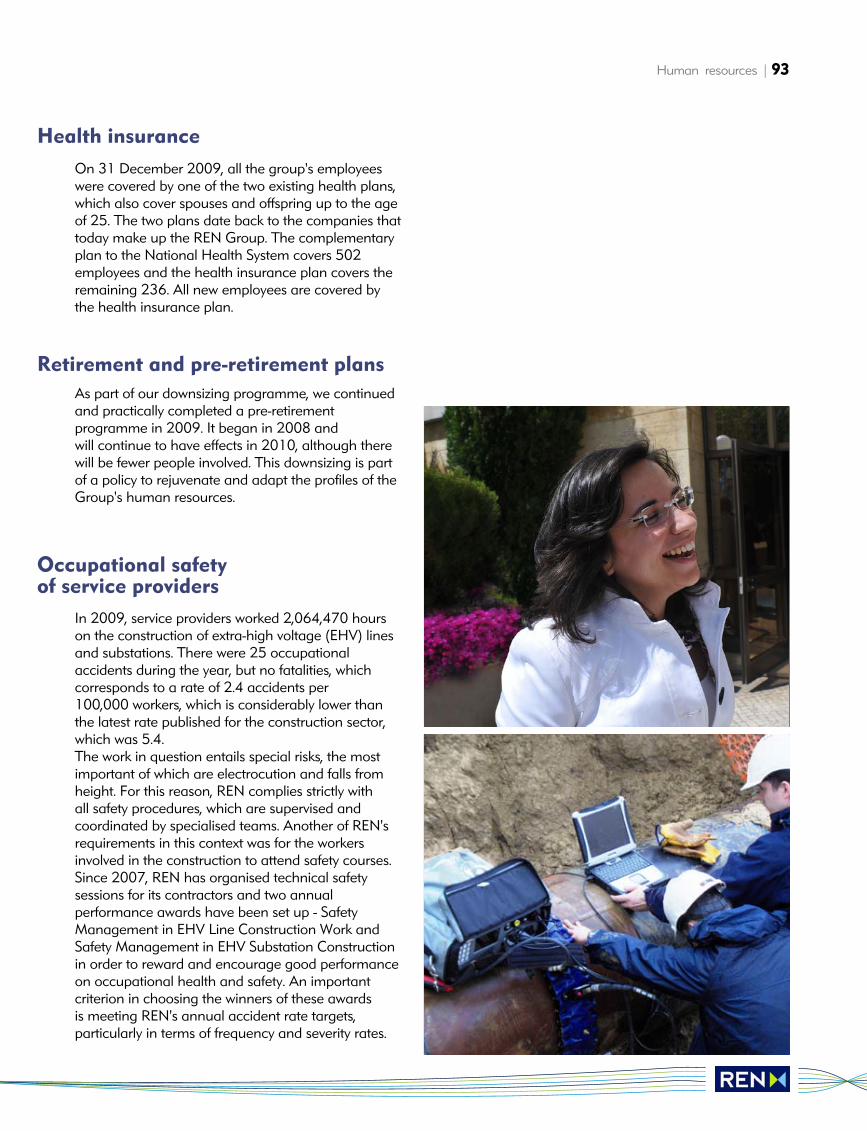
Human resources | 93
On 31 December 2009, all the group's employeeswere covered by one of the two existing health plans,which also cover spouses and offspring up to the ageof 25. The two plans date back to the companies thattoday make up the REN Group. The complementaryplan to the National Health System covers 502employees and the health insurance plan covers theremaining 236. All new employees are covered bythe health insurance plan.
As part of our downsizing programme, we continuedand practically completed a pre-retirement programme in 2009. It began in 2008 and will continue to have effects in 2010, although there will be fewer people involved. This downsizing is partof a policy to rejuvenate and adapt the profiles of theGroup's human resources.
In 2009, service providers worked 2,064,470 hourson the construction of extra-high voltage (EHV) linesand substations. There were 25 occupational accidents during the year, but no fatalities, whichcorresponds to a rate of 2.4 accidents per100,000 workers, which is considerably lower thanthe latest rate published for the construction sector,which was 5.4.The work in question entails special risks, the mostimportant of which are electrocution and falls fromheight. For this reason, REN complies strictly with all safety procedures, which are supervised andcoordinated by specialised teams. Another of REN'srequirements in this context was for the workersinvolved in the construction to attend safety courses. Since 2007, REN has organised technical safetysessions for its contractors and two annual performance awards have been set up - SafetyManagement in EHV Line Construction Work andSafety Management in EHV Substation Constructionin order to reward and encourage good performanceon occupational health and safety. An important criterion in choosing the winners of these awards is meeting REN's annual accident rate targets, particularly in terms of frequency and severity rates.
Health insurance
Retirement and pre-retirement plans
Occupational safety of service providers
Report and Accounts 2009
Technical infrastructure
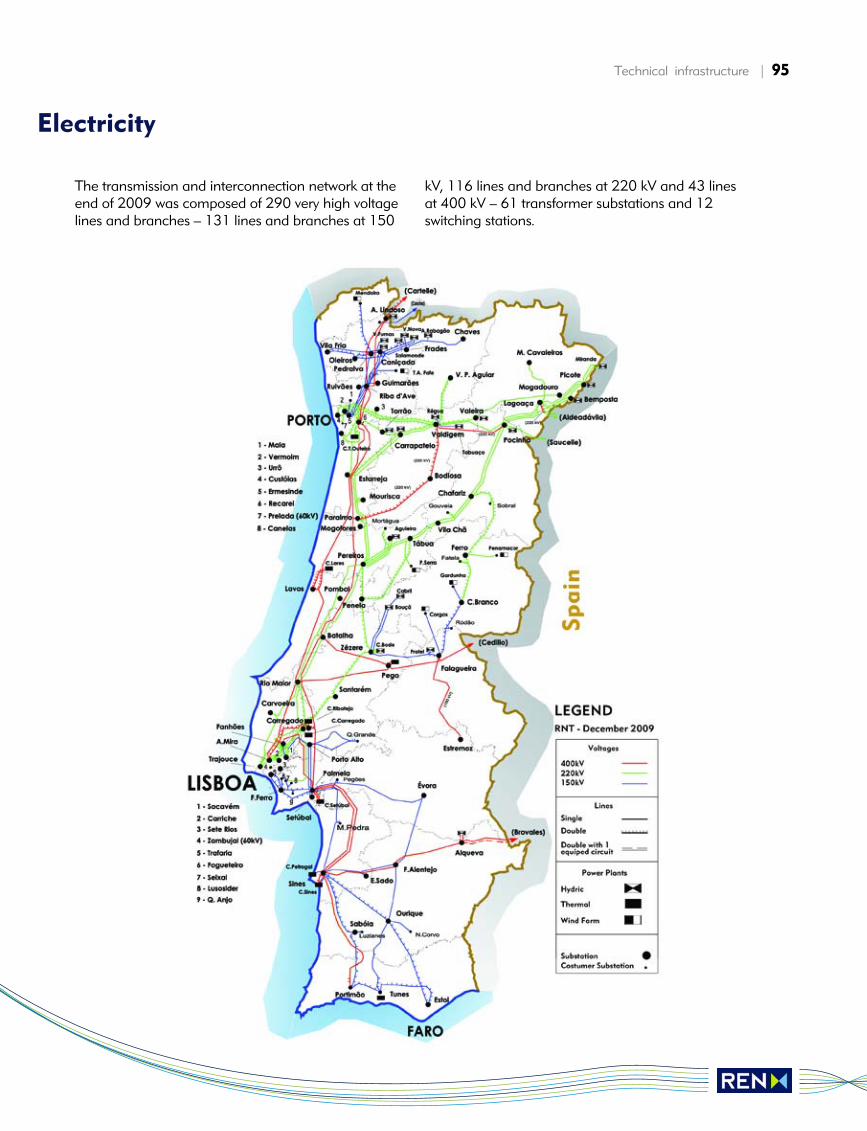
Technical infrastructure | 95
The transmission and interconnection network at theend of 2009 was composed of 290 very high voltagelines and branches – 131 lines and branches at 150
kV, 116 lines and branches at 220 kV and 43 linesat 400 kV – 61 transformer substations and 12switching stations.
Electricity
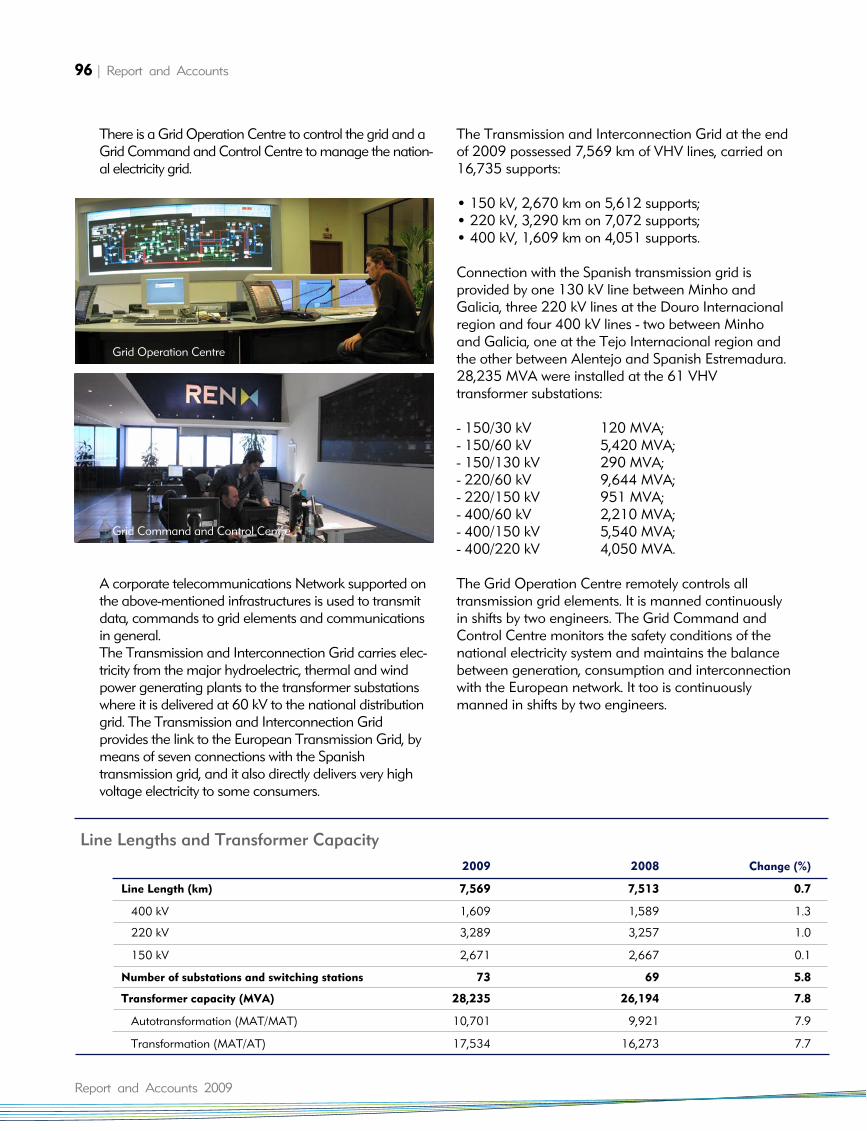
96 | Report and Accounts
Report and Accounts 2009
There is a Grid Operation Centre to control the grid and aGrid Command and Control Centre to manage the nation-al electricity grid.
A corporate telecommunications Network supported onthe above-mentioned infrastructures is used to transmitdata, commands to grid elements and communicationsin general.The Transmission and Interconnection Grid carries elec-tricity from the major hydroelectric, thermal and windpower generating plants to the transformer substationswhere it is delivered at 60 kV to the national distributiongrid. The Transmission and Interconnection Grid provides the link to the European Transmission Grid, bymeans of seven connections with the Spanish transmission grid, and it also directly delivers very highvoltage electricity to some consumers.
The Transmission and Interconnection Grid at the endof 2009 possessed 7,569 km of VHV lines, carried on16,735 supports:
• 150 kV, 2,670 km on 5,612 supports;• 220 kV, 3,290 km on 7,072 supports;• 400 kV, 1,609 km on 4,051 supports.
Connection with the Spanish transmission grid is provided by one 130 kV line between Minho andGalicia, three 220 kV lines at the Douro Internacionalregion and four 400 kV lines - two between Minhoand Galicia, one at the Tejo Internacional region andthe other between Alentejo and Spanish Estremadura.28,235 MVA were installed at the 61 VHV transformer substations:
- 150/30 kV 120 MVA;- 150/60 kV 5,420 MVA;- 150/130 kV 290 MVA;- 220/60 kV 9,644 MVA;- 220/150 kV 951 MVA;- 400/60 kV 2,210 MVA;- 400/150 kV 5,540 MVA;- 400/220 kV 4,050 MVA.
The Grid Operation Centre remotely controls all transmission grid elements. It is manned continuouslyin shifts by two engineers. The Grid Command andControl Centre monitors the safety conditions of thenational electricity system and maintains the balancebetween generation, consumption and interconnectionwith the European network. It too is continuouslymanned in shifts by two engineers.
Grid Operation Centre
Grid Command and Control Centre
2009 2008 Change (%)
Line Length (km) 7,569 7,513 0.7
400 kV 1,609 1,589 1.3
220 kV 3,289 3,257 1.0
150 kV 2,671 2,667 0.1
Number of substations and switching stations 73 69 5.8
Transformer capacity (MVA) 28,235 26,194 7.8
Autotransformation (MAT/MAT) 10,701 9,921 7.9
Transformation (MAT/AT) 17,534 16,273 7.7
Line Lengths and Transformer Capacity
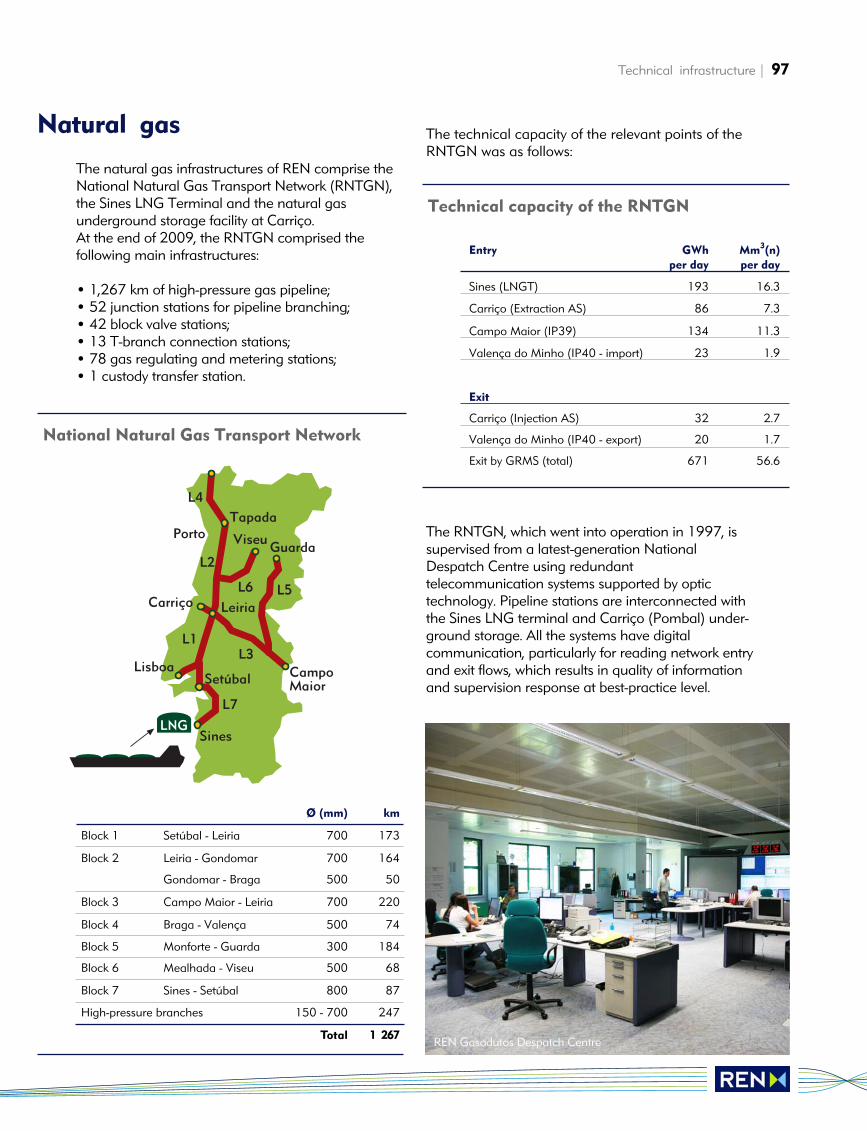
Technical infrastructure | 97
The natural gas infrastructures of REN comprise theNational Natural Gas Transport Network (RNTGN),the Sines LNG Terminal and the natural gas underground storage facility at Carriço.At the end of 2009, the RNTGN comprised the following main infrastructures:
• 1,267 km of high-pressure gas pipeline; • 52 junction stations for pipeline branching;• 42 block valve stations;• 13 T-branch connection stations;• 78 gas regulating and metering stations;• 1 custody transfer station.
The technical capacity of the relevant points of theRNTGN was as follows:
The RNTGN, which went into operation in 1997, issupervised from a latest-generation NationalDespatch Centre using redundant telecommunication systems supported by optic technology. Pipeline stations are interconnected withthe Sines LNG terminal and Carriço (Pombal) under-ground storage. All the systems have digital communication, particularly for reading network entryand exit flows, which results in quality of informationand supervision response at best-practice level.
Natural gas
Ø (mm) km
Block 1 Setúbal - Leiria 700 173
Block 2 Leiria - Gondomar 700 164
Gondomar - Braga 500 50
Block 3 Campo Maior - Leiria 700 220
Block 4 Braga - Valença 500 74
Block 5 Monforte - Guarda 300 184
Block 6 Mealhada - Viseu 500 68
Block 7 Sines - Setúbal 800 87
High-pressure branches 150 - 700 247
Total 1 267
National Natural Gas Transport Network
Sines
SetúbalLisboa
Carriço Leiria
CampoMaior
GuardaViseuPortoTapada
L7
L1
L2
L6 L5
L4
L3
LNG
Entry GWh Mm3(n)
per day per day
Sines (LNGT) 193 16.3
Carriço (Extraction AS) 86 7.3
Campo Maior (IP39) 134 11.3
Valença do Minho (IP40 - import) 23 1.9
Exit
Carriço (Injection AS) 32 2.7
Valença do Minho (IP40 - export) 20 1.7
Exit by GRMS (total) 671 56.6
Technical capacity of the RNTGN
REN Gasodutos Despatch Centre
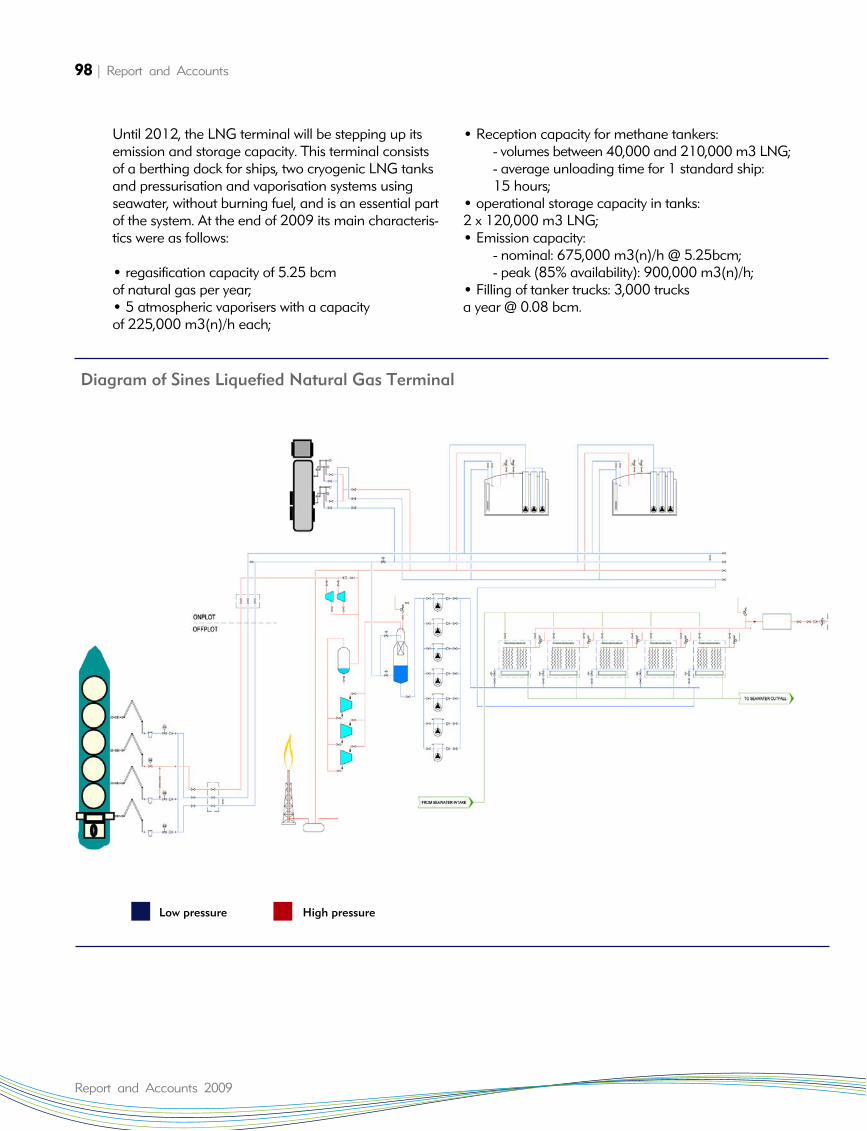
98 | Report and Accounts
Report and Accounts 2009
Until 2012, the LNG terminal will be stepping up itsemission and storage capacity. This terminal consistsof a berthing dock for ships, two cryogenic LNG tanksand pressurisation and vaporisation systems usingseawater, without burning fuel, and is an essential partof the system. At the end of 2009 its main characteris-tics were as follows:
• regasification capacity of 5.25 bcm of natural gas per year;• 5 atmospheric vaporisers with a capacity of 225,000 m3(n)/h each;
• Reception capacity for methane tankers:- volumes between 40,000 and 210,000 m3 LNG;- average unloading time for 1 standard ship: 15 hours;
• operational storage capacity in tanks: 2 x 120,000 m3 LNG;• Emission capacity:
- nominal: 675,000 m3(n)/h @ 5.25bcm;- peak (85% availability): 900,000 m3(n)/h;
• Filling of tanker trucks: 3,000 trucks a year @ 0.08 bcm.
Diagram of Sines Liquefied Natural Gas Terminal
Low pressure High pressure
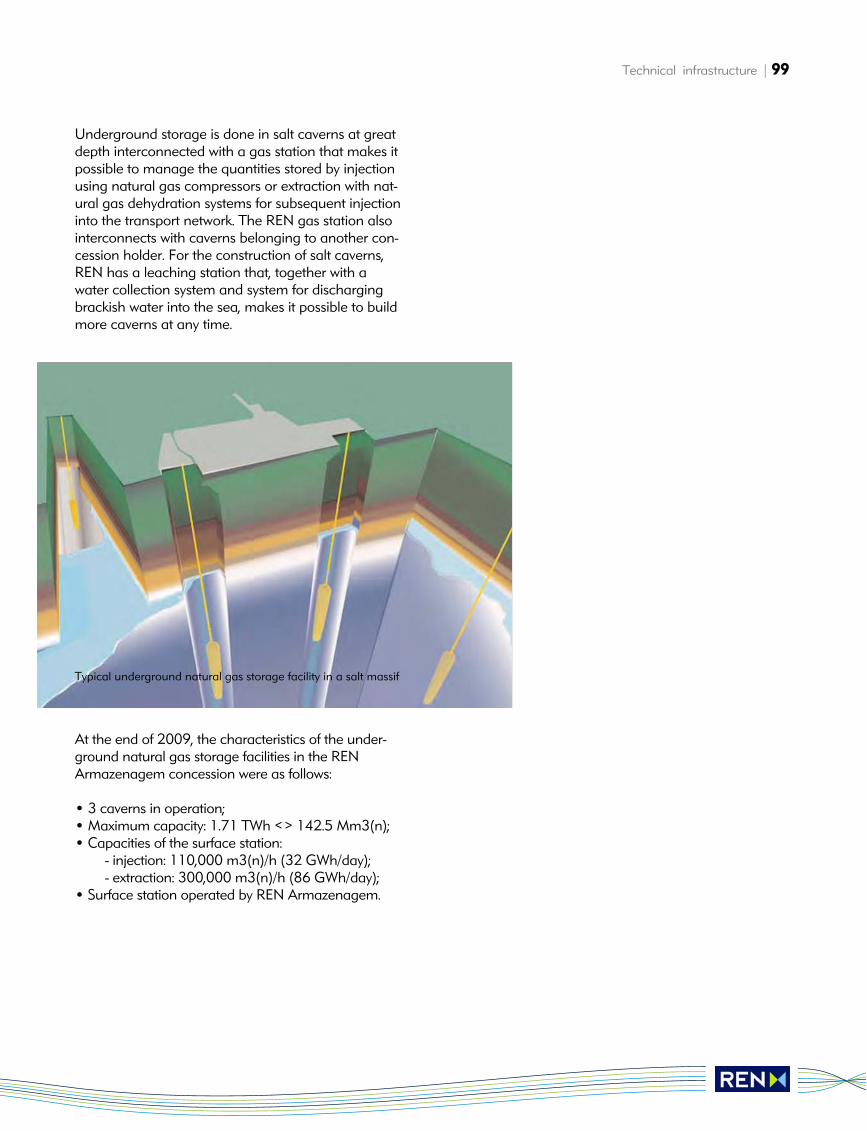
Technical infrastructure | 99
Underground storage is done in salt caverns at greatdepth interconnected with a gas station that makes itpossible to manage the quantities stored by injectionusing natural gas compressors or extraction with nat-ural gas dehydration systems for subsequent injectioninto the transport network. The REN gas station alsointerconnects with caverns belonging to another con-cession holder. For the construction of salt caverns,REN has a leaching station that, together with awater collection system and system for dischargingbrackish water into the sea, makes it possible to buildmore caverns at any time.
At the end of 2009, the characteristics of the under-ground natural gas storage facilities in the RENArmazenagem concession were as follows:
• 3 caverns in operation;• Maximum capacity: 1.71 TWh <> 142.5 Mm3(n);• Capacities of the surface station:
- injection: 110,000 m3(n)/h (32 GWh/day);- extraction: 300,000 m3(n)/h (86 GWh/day);
• Surface station operated by REN Armazenagem.
Typical underground natural gas storage facility in a salt massif
Report and Accounts 2009
Outlook for 2010
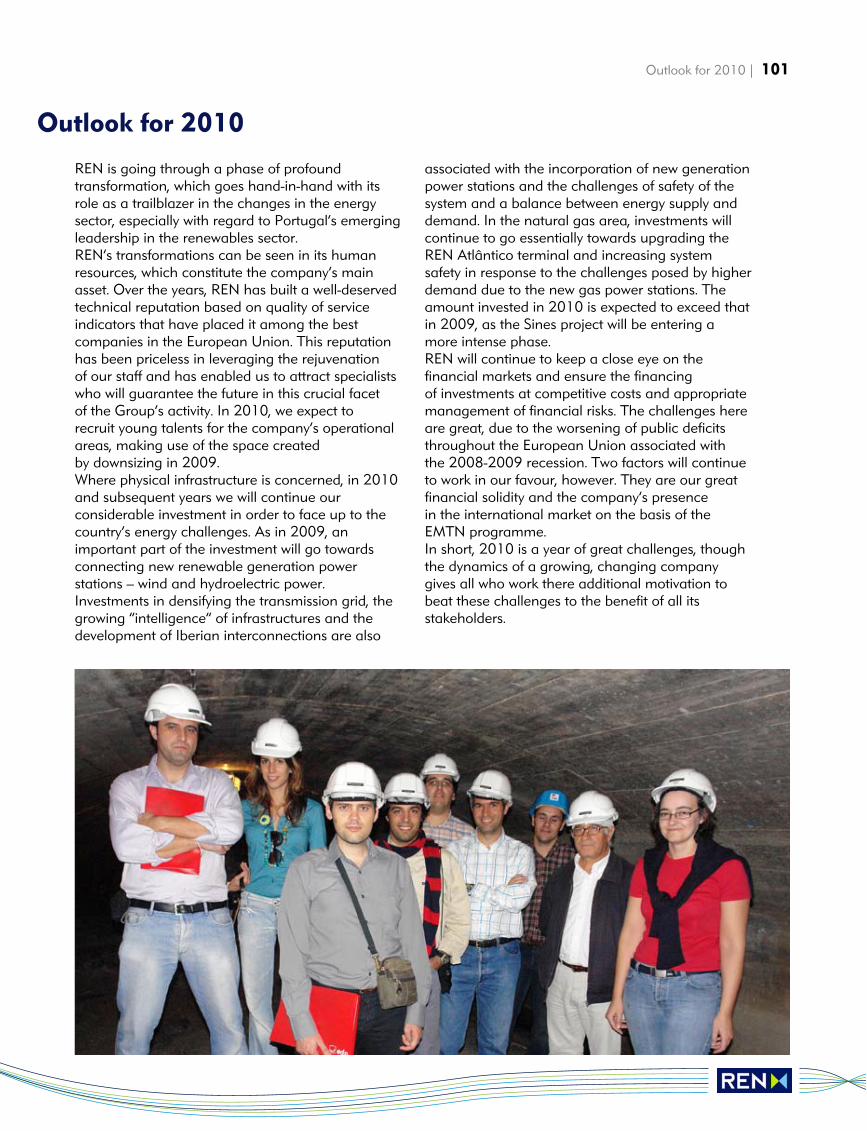
Outlook for 2010 | 101
REN is going through a phase of profound transformation, which goes hand-in-hand with itsrole as a trailblazer in the changes in the energysector, especially with regard to Portugal’s emergingleadership in the renewables sector.REN’s transformations can be seen in its humanresources, which constitute the company’s mainasset. Over the years, REN has built a well-deservedtechnical reputation based on quality of service indicators that have placed it among the best companies in the European Union. This reputationhas been priceless in leveraging the rejuvenation of our staff and has enabled us to attract specialistswho will guarantee the future in this crucial facet of the Group’s activity. In 2010, we expect to recruit young talents for the company’s operational areas, making use of the space created by downsizing in 2009.Where physical infrastructure is concerned, in 2010and subsequent years we will continue our considerable investment in order to face up to thecountry’s energy challenges. As in 2009, an important part of the investment will go towardsconnecting new renewable generation power stations – wind and hydroelectric power.Investments in densifying the transmission grid, thegrowing “intelligence” of infrastructures and thedevelopment of Iberian interconnections are also
associated with the incorporation of new generationpower stations and the challenges of safety of thesystem and a balance between energy supply anddemand. In the natural gas area, investments willcontinue to go essentially towards upgrading theREN Atlântico terminal and increasing systemsafety in response to the challenges posed by higherdemand due to the new gas power stations. Theamount invested in 2010 is expected to exceed thatin 2009, as the Sines project will be entering a more intense phase.REN will continue to keep a close eye on thefinancial markets and ensure the financing of investments at competitive costs and appropriatemanagement of financial risks. The challenges hereare great, due to the worsening of public deficitsthroughout the European Union associated with the 2008-2009 recession. Two factors will continueto work in our favour, however. They are our greatfinancial solidity and the company’s presence in the international market on the basis of theEMTN programme.In short, 2010 is a year of great challenges, thoughthe dynamics of a growing, changing companygives all who work there additional motivation tobeat these challenges to the benefit of all itsstakeholders.
Outlook for 2010
Report and Acconts 2009
Final remarks
Final Remarks | 103
The Board of Directors would like to acknowledgeall those who, in 2009, gave their support to thefulfilment of the Company’s goals:
• To the Company’s employees, for their dedication,commitment and high degree of professionalism inthe performance of their duties, in harmony with thegoals set;• To the shareholders, for the support andconfidence demonstrated at different times in theCompany’s life; • To the Audit Committee, the Statutory Auditorand the External Auditor for the essential servicesthey provided.
Lisbon, 26 February 2010
The Board of Directors
Rui Manuel Janes Cartaxo
Aníbal Durães dos Santos
Victor Manuel da Costa Antunes Machado Baptista
João Caetano Carreira Faria Conceição
Luís Maria Atienza Serna
Gonçalo José Zambrano de Oliveira
Manuel Carlos Mello Champalimaud
José Isidoro d’Oliveira Carvalho Neto
Filipe Maurício Botton
José Luís Alvim Marinho
José Frederico Vieira Jordão
Fernando António Portela de Rocha Andrade
Final remarks
Report and Accounts 2009
Proposal for appropriation of profits
Proposal for appropriation of profits | 105
The consolidated net income of REN SGPS for the2009 financial year was €134,046,810.44 (onehundred and thirty-four million forty-six thousandeight hundred and ten euros and forty-four cents). The Board of Directors, considering the informationreported herein, and pursuant to article 28 ofthe Articles of Association of REN SGPS, S.A. andarticles 31 to 33 and 66(5) of the PortugueseCompanies Code, proposes that the net income forthe 2009 financial year of €144,493,679.21(one hundred and forty-four million four hundredand ninety-three thousand six hundred and seventy-nine euros and twenty-one cents), be appropriated as follows:
• To the legal reserve - €7,224,683.96(seven million two hundred and twenty-four thousand six hundred and eighty-three euros and ninety-six cents);
• To dividends - €89,178,000 (eighty-nine millionone hundred and seventy-eight thousand euros),corresponding to the sharing out of 66.527% of the consolidated income of REN SGPS, S.A. in 2009, which totalled €134,046,810.44 (one hundred and thirty-four million forty-six thousand eight hundred and ten eurosand forty-four cents), and is equivalent to a grossdividend per share of €0.167;
• To free reserves the sum of €48,090,995.25(forty-eight million ninety thousand nine hundredand ninety-five euros and twenty-five cents).
Proposal for appropriationof profits
Accounts
Report and Accounts 2009
Contents Consolidated financial statements 108
Separate financial statements 172
Audit reports and statements 204
Extract from minutes of the General Meeting of Shareholders 216
Accounts | 107
Report and Accounts 2009
Consolidated financial statements
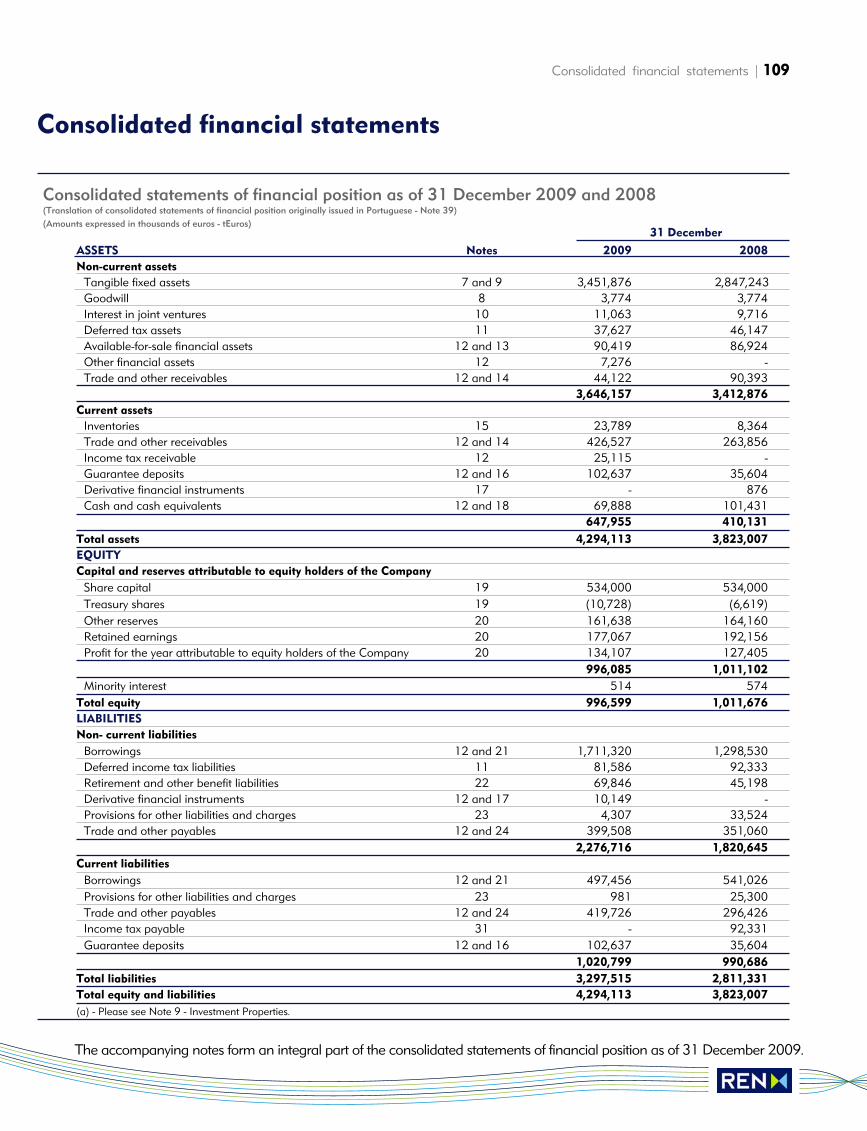
Consolidated financial statements | 109
31 December
ASSETS Notes 2009 2008
Non-current assets
Tangible fixed assets 7 and 9 3,451,876 2,847,243 (a)Goodwill 8 3,774 3,774Interest in joint ventures 10 11,063 9,716Deferred tax assets 11 37,627 46,147Available-for-sale financial assets 12 and 13 90,419 86,924Other financial assets 12 7,276 -Trade and other receivables 12 and 14 44,122 90,393
3,646,157 3,412,876
Current assets
Inventories 15 23,789 8,364Trade and other receivables 12 and 14 426,527 263,856Income tax receivable 12 25,115 -Guarantee deposits 12 and 16 102,637 35,604Derivative financial instruments 17 - 876Cash and cash equivalents 12 and 18 69,888 101,431
647,955 410,131
Total assets 4,294,113 3,823,007
EQUITY
Capital and reserves attributable to equity holders of the Company
Share capital 19 534,000 534,000Treasury shares 19 (10,728) (6,619)Other reserves 20 161,638 164,160Retained earnings 20 177,067 192,156Profit for the year attributable to equity holders of the Company 20 134,107 127,405
996,085 1,011,102
Minority interest 514 574Total equity 996,599 1,011,676
LIABILITIES
Non- current liabilities
Borrowings 12 and 21 1,711,320 1,298,530Deferred income tax liabilities 11 81,586 92,333Retirement and other benefit liabilities 22 69,846 45,198Derivative financial instruments 12 and 17 10,149 -Provisions for other liabilities and charges 23 4,307 33,524Trade and other payables 12 and 24 399,508 351,060
2,276,716 1,820,645
Current liabilities
Borrowings 12 and 21 497,456 541,026Provisions for other liabilities and charges 23 981 25,300Trade and other payables 12 and 24 419,726 296,426Income tax payable 31 - 92,331Guarantee deposits 12 and 16 102,637 35,604
1,020,799 990,686
Total liabilities 3,297,515 2,811,331
Total equity and liabilities 4,294,113 3,823,007
(a) - Please see Note 9 - Investment Properties.
Consolidated financial statements
Consolidated statements of financial position as of 31 December 2009 and 2008 (Translation of consolidated statements of financial position originally issued in Portuguese - Note 39)(Amounts expressed in thousands of euros - tEuros)
The accompanying notes form an integral part of the consolidated statements of financial position as of 31 December 2009.
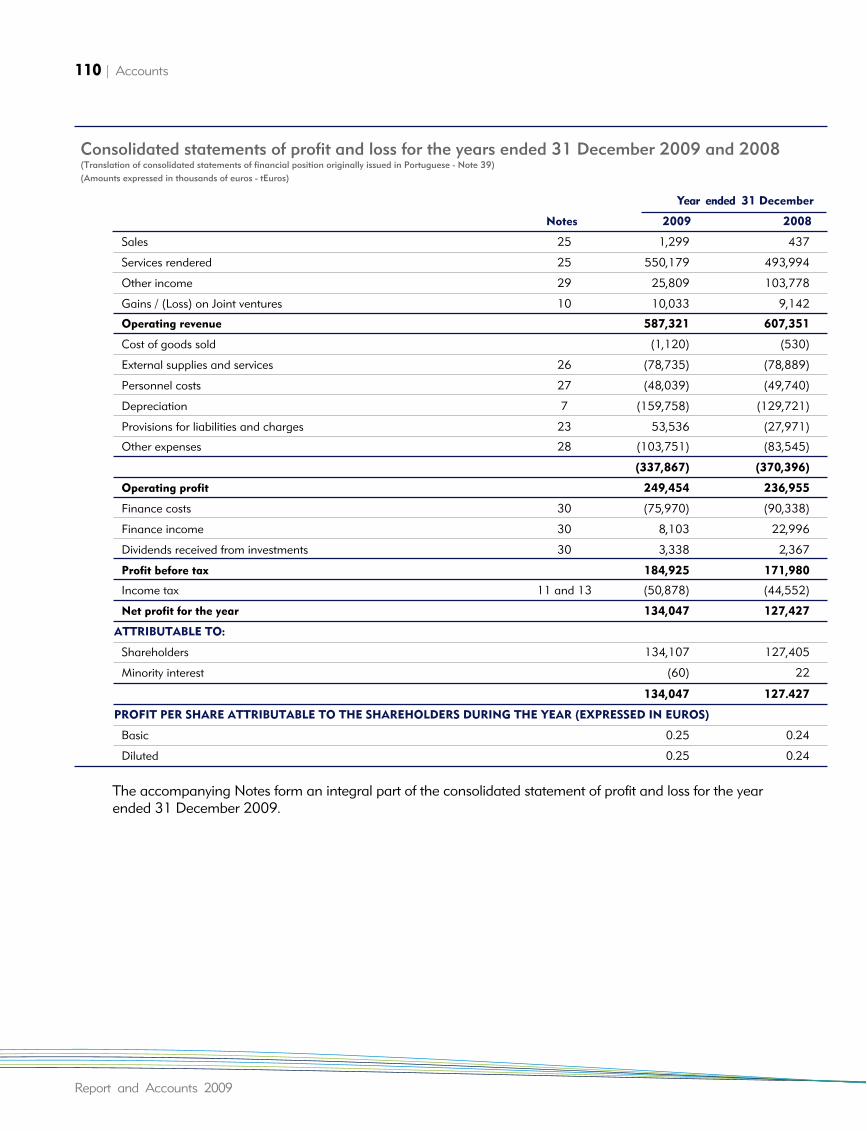
110 | Accounts
Report and Accounts 2009
Year ended 31 December
Notes 2009 2008
Sales 25 1,299 437
Services rendered 25 550,179 493,994
Other income 29 25,809 103,778
Gains / (Loss) on Joint ventures 10 10,033 9,142
Operating revenue 587,321 607,351
Cost of goods sold (1,120) (530)
External supplies and services 26 (78,735) (78,889)
Personnel costs 27 (48,039) (49,740)
Depreciation 7 (159,758) (129,721)
Provisions for liabilities and charges 23 53,536 (27,971)
Other expenses 28 (103,751) (83,545)
(337,867) (370,396)
Operating profit 249,454 236,955
Finance costs 30 (75,970) (90,338)
Finance income 30 8,103 22,996
Dividends received from investments 30 3,338 2,367
Profit before tax 184,925 171,980
Income tax 11 and 13 (50,878) (44,552)
Net profit for the year 134,047 127,427
ATTRIBUTABLE TO:
Shareholders 134,107 127,405
Minority interest (60) 22
134,047 127.427
PROFIT PER SHARE ATTRIBUTABLE TO THE SHAREHOLDERS DURING THE YEAR (EXPRESSED IN EUROS)
Basic 0.25 0.24
Diluted 0.25 0.24
Consolidated statements of profit and loss for the years ended 31 December 2009 and 2008 (Translation of consolidated statements of financial position originally issued in Portuguese - Note 39)(Amounts expressed in thousands of euros - tEuros)
The accompanying Notes form an integral part of the consolidated statement of profit and loss for the yearended 31 December 2009.
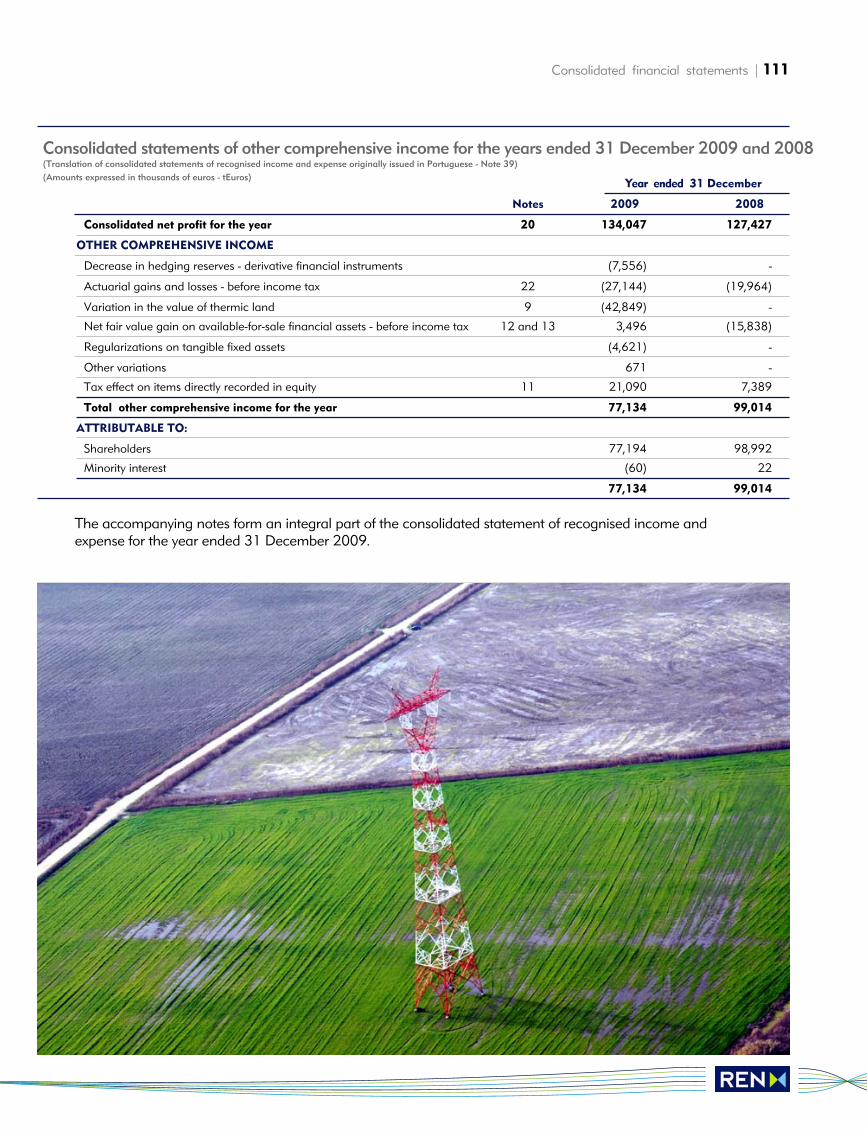
Consolidated financial statements | 111
Year ended 31 December
Notes 2009 2008
Consolidated net profit for the year 20 134,047 127,427
OTHER COMPREHENSIVE INCOME
Decrease in hedging reserves - derivative financial instruments (7,556) -
Actuarial gains and losses - before income tax 22 (27,144) (19,964)
Variation in the value of thermic land 9 (42,849) -
Net fair value gain on available-for-sale financial assets - before income tax 12 and 13 3,496 (15,838)
Regularizations on tangible fixed assets (4,621) -
Other variations 671 -
Tax effect on items directly recorded in equity 11 21,090 7,389
Total other comprehensive income for the year 77,134 99,014
ATTRIBUTABLE TO:
Shareholders 77,194 98,992
Minority interest (60) 22
77,134 99,014
Consolidated statements of other comprehensive income for the years ended 31 December 2009 and 2008(Translation of consolidated statements of recognised income and expense originally issued in Portuguese - Note 39)(Amounts expressed in thousands of euros - tEuros)
The accompanying notes form an integral part of the consolidated statement of recognised income andexpense for the year ended 31 December 2009.
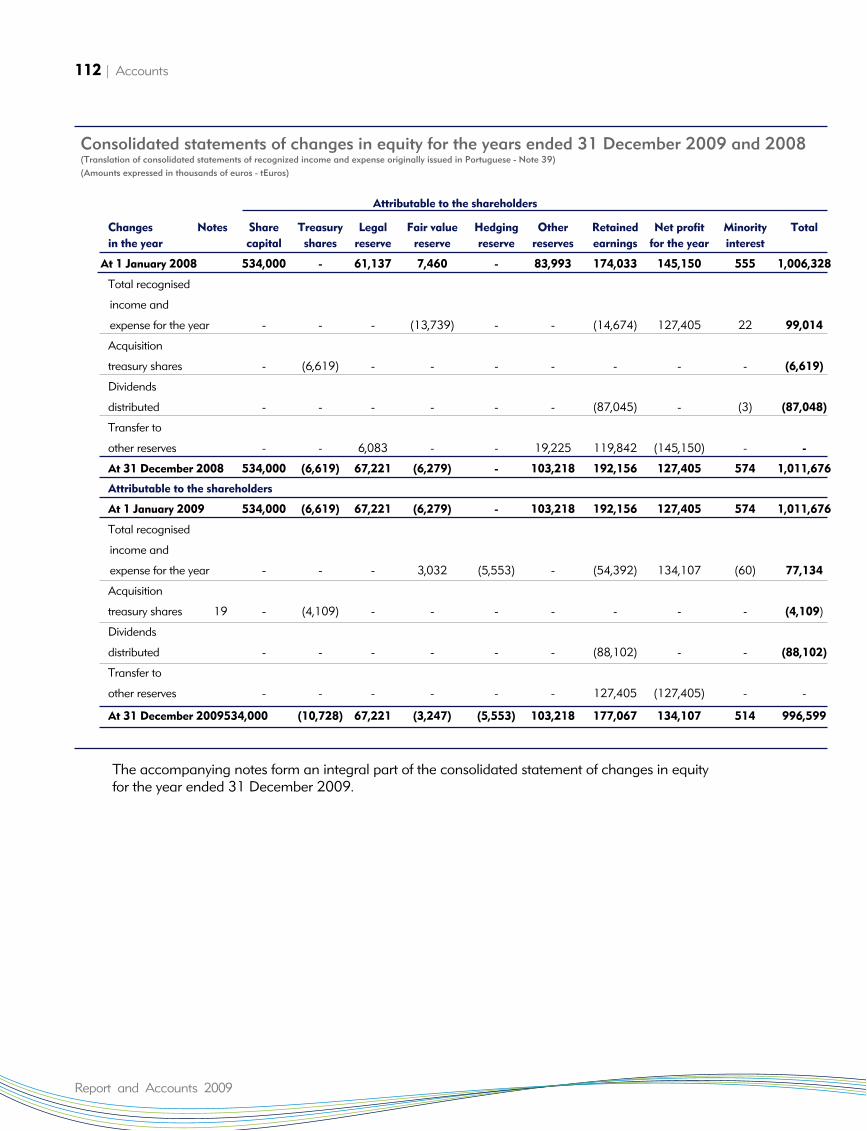
112 | Accounts
Report and Accounts 2009
Attributable to the shareholders
Changes Notes Share Treasury Legal Fair value Hedging Other Retained Net profit Minority Total
in the year capital shares reserve reserve reserve reserves earnings for the year interest
At 1 January 2008 534,000 - 61,137 7,460 - 83,993 174,033 145,150 555 1,006,328
Total recognised
income and
expense for the year - - - (13,739) - - (14,674) 127,405 22 99,014
Acquisition
treasury shares - (6,619) - - - - - - - (6,619)
Dividends
distributed - - - - - - (87,045) - (3) (87,048)
Transfer to
other reserves - - 6,083 - - 19,225 119,842 (145,150) - -
At 31 December 2008 534,000 (6,619) 67,221 (6,279) - 103,218 192,156 127,405 574 1,011,676
Attributable to the shareholders
At 1 January 2009 534,000 (6,619) 67,221 (6,279) - 103,218 192,156 127,405 574 1,011,676
Total recognised
income and
expense for the year - - - 3,032 (5,553) - (54,392) 134,107 (60) 77,134
Acquisition
treasury shares 19 - (4,109) - - - - - - - (4,109)
Dividends
distributed - - - - - - (88,102) - - (88,102)
Transfer to
other reserves - - - - - - 127,405 (127,405) - -
At 31 December 2009534,000 (10,728) 67,221 (3,247) (5,553) 103,218 177,067 134,107 514 996,599
Consolidated statements of changes in equity for the years ended 31 December 2009 and 2008 (Translation of consolidated statements of recognized income and expense originally issued in Portuguese - Note 39)(Amounts expressed in thousands of euros - tEuros)
The accompanying notes form an integral part of the consolidated statement of changes in equityfor the year ended 31 December 2009.
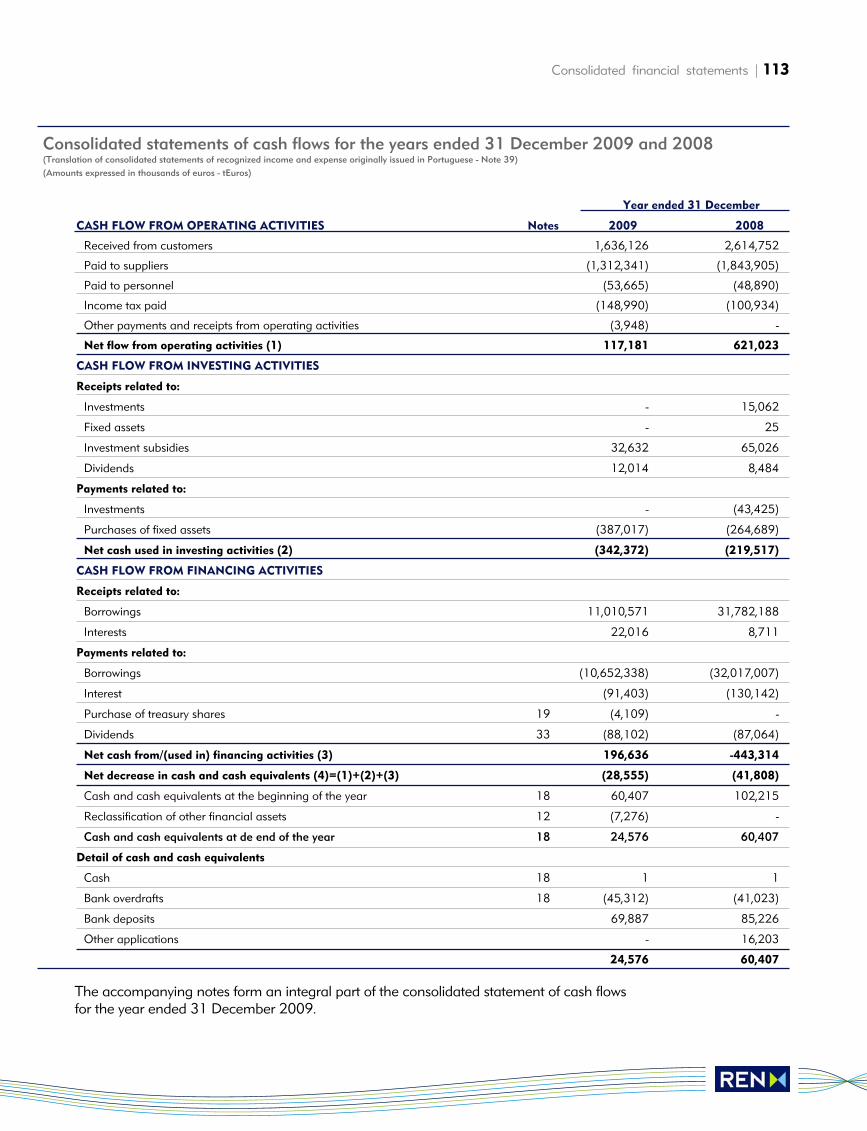
Consolidated financial statements | 113
Year ended 31 December
CASH FLOW FROM OPERATING ACTIVITIES Notes 2009 2008
Received from customers 1,636,126 2,614,752
Paid to suppliers (1,312,341) (1,843,905)
Paid to personnel (53,665) (48,890)
Income tax paid (148,990) (100,934)
Other payments and receipts from operating activities (3,948) -
Net flow from operating activities (1) 117,181 621,023
CASH FLOW FROM INVESTING ACTIVITIES
Receipts related to:
Investments - 15,062
Fixed assets - 25
Investment subsidies 32,632 65,026
Dividends 12,014 8,484
Payments related to:
Investments - (43,425)
Purchases of fixed assets (387,017) (264,689)
Net cash used in investing activities (2) (342,372) (219,517)
CASH FLOW FROM FINANCING ACTIVITIES
Receipts related to:
Borrowings 11,010,571 31,782,188
Interests 22,016 8,711
Payments related to:
Borrowings (10,652,338) (32,017,007)
Interest (91,403) (130,142)
Purchase of treasury shares 19 (4,109) -
Dividends 33 (88,102) (87,064)
Net cash from/(used in) financing activities (3) 196,636 -443,314
Net decrease in cash and cash equivalents (4)=(1)+(2)+(3) (28,555) (41,808)
Cash and cash equivalents at the beginning of the year 18 60,407 102,215
Reclassification of other financial assets 12 (7,276) -
Cash and cash equivalents at de end of the year 18 24,576 60,407
Detail of cash and cash equivalents
Cash 18 1 1
Bank overdrafts 18 (45,312) (41,023)
Bank deposits 69,887 85,226
Other applications - 16,203
24,576 60,407
Consolidated statements of cash flows for the years ended 31 December 2009 and 2008 (Translation of consolidated statements of recognized income and expense originally issued in Portuguese - Note 39)(Amounts expressed in thousands of euros - tEuros)
The accompanying notes form an integral part of the consolidated statement of cash flows for the year ended 31 December 2009.
114 | Accounts
Report and Accounts 2009
Notes to the consolidated financial statementsas of 31 December 2009
REN - Redes Energéticas Nacionais, SGPS, S.A.(referred to in this document as “REN” or “theCompany” together with its subsidiaries, referred to as “the Group” or “the REN Group”), with head officein Avenida Estados Unidos da América, 55 - Lisbon,was formed from the spin-off of the EDP Group, inaccordance with Decree-Laws 7/91 of 8 January and 131/94 of 19 May, approved by theShareholders' General Meeting on 18 August 1994,with the objective of ensuring the overall managementof the Public Electric Supply system (PES).Up to 26 September 2006 the REN Group's operations were concentrated on the electricity business through REN - Rede Eléctrica Nacional, SA. On 26 September 2006, as a result of theunbundling transaction of the natural gas business,the Group underwent a significant change with thepurchase of assets and financial participations relating to the transport, storage and re-gasification of natural gas activities, comprising a new business.In the beginning of 2007 the Company was transformed into a holding company and, after transfer of the electricity business to a new companyformed on 26 September 2006, named REN - Serviçosde Rede, S.A., changed its name to REN - RedeEléctrica Nacional, S.A..The Group presently has two main business areas,Electricity and Gas, and two secondary businesses, inthe areas of Telecommunications and Managementof the Electricity Derivatives Market.
The electricity business includes the following companies:
a) REN - Rede Eléctrica Nacional, S.A., founded on 26 September 2006, the activities of which are carried out under a concession contract for a periodof 50 years as from 2007 and establishes the overallmanagement of the Public Electricity Supply System(PES);b) REN Trading, S.A., founded on 13 June 2007, the main function of which is the management ofelectricity purchase contracts (EPC) from Turbogás,S.A. and Tejo Energia, S.A., which did not terminateon 30 June 2007, date of the entry into force of thenew CMEC contracts. The operations of this companyinclude the trading of electricity produced and of the installed production capacity, with domestic andinternational distributors.
The gas business covers the following companies:
a) REN Gasodutos, S.A.This company was founded on 26 September 2006,the capital of which was paid up through integrationof the gas transport infrastructures (network; connections; compression); b) REN Armazenagem, S.A.This company was founded on 26 September 2006,the capital of which was paid up through integrationof the gas underground storage assets; c) REN Atlântico, Terminal de GNL, S.A. This company was acquired under the acquisition ofthe gas business, previously called “SGNL - SociedadePortuguesa de Gás Natural Liquefeito”. The operationsof this company consist of the supply, reception, storage and re-gasification of natural liquefied gasthrough the GNL maritime terminal, being responsiblefor the construction, utilisation and maintenance ofthe necessary infrastructures.
The operations of these companies are carried outunder three concession contracts granted separatelyfor periods of 40 years as from 2006. In addition REN Gasodutos, S.A. has participations intwo companies founded under joint venture with theSpanish gas transporter, Enagás, to which RENGasodutos ceded the transport rights to specific gaspipelines (Braga-Tuy and Campo Maior - Leiria - Braga).The telecommunications business is managed byRENTELECOM Comunicações, S.A., the operations of which consist of the establishment, managementand utilisation of telecommunications systems andinfrastructures, supplying communications servicesand benefitting from the excess capacity of the fibreoptics belonging to the REN Group.Management of the Electricity Derivatives Market is carried out by OMIP - Operador do MercadoIbérico de Energia (Pólo Português), S.A.. This entitywas founded to organise the Portuguese division ofMIBEL, providing management of MIBEL's DerivativesMarket together with OMIclear (Clearing Agent forthe energy market), a company founded and fullyowned by OMIP, the role of which is to be the clearing agent and central counterparty for operations realized in the term market. OMIP startedoperating on 3 July 2006.REN Serviços, S.A. started operating in January 2008,its operations consisting of the rendering of any
1. General information
Consolidated financial statements | 115
general administrative, financial, regulating, personnelmanagement, salary processing, management andmaintenance of the non-fixed assets and fixed assets,negotiation and supply of consumables or servicesand in general any other services of that type, usuallyknown as back-office services, being remunerated forthese, both for related group companies and anythird parties.
Approval of the consolidated financial state-ments These consolidated financial statements wereapproved by the Board of Directors in a meeting held on 26 February 2010. The Board of Directorsbelieves that the financial statements fairly reflectREN's Group operations, as well as its financial position and financial performance and its cash flows.
2.1 Electricity concession contract The concession for the use of National TransportNetwork (“NTN”) was awarded to REN, SA in accordance with Decree-Law 182/95 of 27 July1995 (art. 64) with a view to the management of the Public Electric Supply system (PES), utilizationof NTN as well as the development of the necessaryinfrastructures. The objective of this concession contract consists of the following activities:
(i) Purchase and sale of Electricity In this area REN, SA operated until 30 June 2007 as anagent between electricity producers and distributors. Theelectricity was acquired based on purchase and sale con-tracts entered into with producers and sold in accordancewith tariffs defined by the regulator, ERSE (EntidadeReguladora de Serviços Energéticos). REN was agent in the sale of available production excess-es. REN had the right to retain 50% of the commercialprofit obtained from these services.As from 1 July 2007, upon termination of the majority ofacquisition contracts (EAC), REN manages two remain-ing EAC's not terminated, with Tejo Energia andTurbogás, through REN Trading, placing the energy ofthese producers in the market. The tangible assets allocated to this activity are remuner-ated in the same way as the electricity transport assets.
(ii) Transmission of Electricity This is REN's main activity, the object being the transmission of electricity through the NationalTransmission Network to distributors in HT (high tension), to consumers connected to the NationalTransmission Network and VHT (very high tension)networks to which REN is connected. This activity also includes the planning and development of theNational Transmission Network, the construction of new infrastructures and the operation and maintenance of the National Transmission Network.The model concession contract ensures contractualequilibrium through the recovery of depreciation and remuneration of the investment made in the concession's assets and recovery of the eligible operating costs.
(iii) Overall Management of the System The objective of this activity is the overall manage-ment of the electricity system, REN being responsiblefor the technical management through coordination,at the points connected to the National TransmissionSystem, the transit of electric energy of the productioninstallations, the distribution networks, in MT and HT,and of the consumers connected to the NationalTransmission Network, through dispatch orders. The overall management of the system has alsoensured contractual equilibrium through the recoveryof depreciation of the concession's assets and remuneration of the investments made.Remuneration is calculated based on the average net amount of the assets allocated to the activity.REN can carry out other activities directly, or throughsubsidiary companies, when authorized by theGovernment, if this is in the best interests of the concession or its clients. This is the case of OMIP,which manages the Electricity Derivatives Marketthrough MIBEL and its subsidiary OMIclear, that functions as a clearing house. The concession was granted for a period of 50 yearsas from 15 January 2007. The assets considered as concession assets are those acquired by REN fromRNT, which include:
• the lines, substations, sectioning points and relatedinstallations;• the installations related to the central dispatch and overall management of SEP, including all the equipment essential for its functioning; and • the telecommunication, telemetry and telecommand installations relating to the transmission and coordination of the electricityproducer system.
2. Information on the concessioncontracts awarded to REN
116 | Accounts
Report and Accounts 2009
In addition, the following are also considered as concession assets:
• the real estate belonging to REN on which theassets referred to above are installed, as well as therelated rights of way; • the locations for the installation of the electricityproducers, the ownership of which belongs to REN; • other moveable or fixed assets necessary for theoperation of the activities under concession; and• the legal relationships directly related to the concession, such as labour, works, location, therendering of services, the reception and delivery of electric energy, as well as the rights to use waterresources and transport through networks locatedoutside the concession area.
REN must, during the concession period, maintainthe assets and related means in good functioningorder, maintenance and security, carrying out all therepairs, renewals and adaptations necessary to maintainthe assets in the required technical conditions. REN is the owner and has title to the concession'sassets up to its termination. The assets can only beused for the purposes of the concession. On the datethe concession terminates, the assets related to itrevert to the State in accordance with the terms of thecontract, which include the receipt of an indemnitycorresponding to the net book value of the assetsallocated to the concession. The concession can be terminated by agreementbetween the parties, by rescission, by redemption andby expiry of the term. Termination of the concessioninvolves transmission to the State of the assets relatedto the concession. The concession contract can be rescinded by theconceding entity if any of the following situations with a significant impact on the operations of theconcession occurs: distancing from the principles of the concession; opposition to supervision and disobedience of the decisions of the conceding entity;refusal to carry out the repairs and maintenance ofthe concession's assets, as well as their development;application of higher tariffs than those defined by theregulator; and the unauthorized transmission or sub-concession of the transmission concession. The conceding entity can cancel the concessionwhenever motives of public interest justify this, 15years having elapsed since the date of the beginningof its term. By cancelling the concession, the concessionaire has the right to an indemnity in accordance with the book value of the assets as of thedate they revert as well as to possible loss of profits.
If, upon termination of the concession, it is notrenewed or the new form or entity responsible for the concession has not been decided, this concessioncontract can be extended for the maximum period of one year, as a leasing, rendering of services or anyother legal form of contract.
2.2 Transport of Gas and OverallManagement of the SystemThe concession to use the National Natural Gas Transmission Network was awarded to REN - Gasodutos, S.A. under Decree-Law 140/2006of 26 July 2006, with the objective of managing theNational Natural Gas System (Sistema Nacional deGás Natural - SNGN), operation of the high pressuregas transport network and development of the necessary infrastructures, under the rendering of public service regime.The concession contract covers the following activities:
(i) Transport of Gas This one of REN - Gasodutos, S.A.'s activities, and hasthe objective of ensuring the transport of gas throughthe infrastructures that make up the high pressurenational network, as well as distribution to SNGNor industrial consumers connected directly to theNational Natural Gas Transport Network. This activityincludes not only the reception and distribution of gasthrough the high pressure transport network, but alsooperation and maintenance of all the infrastructuresand connections belonging to the National NaturalGas Transport Network.The model of the concession contract ensures contractual equilibrium through recovery of the eligible operating costs and remuneration of theassets, which includes: recovery of depreciation of the assets; and remuneration at an interest ratefixed by the regulator (ERSE), calculated as a proportion between the current accumulated value of the units transported and the total estimated units to be transported through the infrastructure,during the concession period.
Consolidated financial statements | 117
(ii) Overall Management of the Gas System The objective of this activity is to manage the NationalGas Supply System (Sistema Nacional deAbastecimento de Gás - SNGN) through coordinationof the national and international connections to theNational Natural Gas Transport Network, planning and preparation of the expansion necessary of the high pressure gas transport network, and control of the natural gas safety reserves. This concession was granted for a period of 40 years asfrom the date of signature of the contract. The assetsconsidered as concession assets are those acquired by REN from Transgás and include:
• the high pressure gas pipelines used to transport gas,and related pipes and antennae; • the infrastructures related to the compression, transport and gas pressure reduction for delivery to medium pressure gas pipelines; • equipment related to the overall technical management of the National Gas Supply System; and • telecommunications, telemetry and remote controlinfrastructures used to manage the reception, transportand delivery networks, including the gas metres placedin the installations of users.
In addition, the concession assets also include:
• the real estate owned by REN Gasodutos, S.A., onwhich the above mentioned equipment is installed, aswell as the related rights of way; • other assets necessary for carrying out the activitiesof the concession; • any intellectual or industrial rights owned by RENGasodutos, S.A.; and• all the legal relationships related to the concession,such as labour contracts, subcontracts, leasing andexternal services.
REN Gasodutos, S.A. must, during the period of theconcession, maintain the assets and related means in good functioning order, maintenance and security,carrying out all the repairs, renewals and adaptationsnecessary to maintain the assets in the required technical conditions. REN Gasodutos, S.A. is the owner and has title to the concession's assets. The assets can only be used for the purposes of the concession. On the date the concession terminates, the assets related to it revertto the State in accordance with the terms of the contract, which include the receipt of an indemnitycorresponding to the net book value of the assetsallocated to the concession.The concession can be terminated by agreement
between the parties, by rescission, by redemption and by expiry of the term. Termination of the concession involves transmission to the State of the assets related to the concession.The concession contract can be rescinded by theconceding entity if any of the following situations with a significant impact on the operations of theconcession occurs: imminent failure or interruption of the activity; deficiencies in the maintenance andrepair of the infrastructures that compromise thequality of the services.The conceding entity can cancel the concessionwhenever motives of public interest justify this, 15 years having elapsed since the date of the beginning of its term. By cancelling the concession,the concessionaire has the right to an indemnity inaccordance with the book value of the assets as ofthe date they revert as well as to possible loss of profits.If, upon termination of the concession, it is notrenewed or the new form or entity responsible for the concession has not been decided, this concessioncontract can be extended for the maximum period of one year, as a leasing, rendering of services or anyother legal form of contract.
2.3 Reception Storage and Regasificationof Liquid Natural Gas (LNG)The concession of the operations of the of the LNGterminal was awarded to REN Atlântico, S.A. underDecree-Law 140/2006 of 26 July 2006, to carry outthe following activities under the rendering of publicservices regime:
a) Reception, storage, treatment and regasification of liquid natural gas unloaded from methane tankersin the Port of Sines; b) the injection of high pressure natural gas in theNational Natural Gas Transport Network (RedeNacional de Transporte de Gás Natural - RNTGN) or its dispatch by specialised trucks; andc) The construction, utilisation, maintenance and expansion of the LNG Terminal infrastructures(buildings, tanks, gas pipelines, etc.).
The model of the concession contract ensurescontractual equilibrium through recovery of the eligible operating costs and remuneration of theassets, which includes: recovery of depreciation of the assets; and remuneration at an interest ratefixed by the regulator (ERSE), calculated as a proportion between the current accumulated value of the units unloaded and regassified, and the totalestimated units to be regasified through the infrastructure, during the concession period.
118 | Accounts
Report and Accounts 2009
This concession was granted for a period of 40 years as from the date of signature of the contract. The assets considered as concession assetsare those acquired by the REN Group from Transgásand include:
• the LNG terminal and related infrastructuresinstalled in the Port of Sines;• the infrastructures related to liquefied natural gas reception, storage, treatment and regasification,including all the equipment necessary to control, regulate and measure all the infrastructures and LNGterminal operations; • the infrastructures used to inject of natural gas into the National Natural Gas Transport Network or the loading and dispatch of LNG through trucks or methane tankers; and• the infrastructures related to telecommunications,telemetry and remote control, used to manage all the infrastructures and the LNG terminal.
In addition, the following are also considered as concession assets:
• the real estate owned by REN Atlântico, SA, wherethe above mentioned equipment is installed as wellas the related right of way;• other assets necessary for the operations of theconcession;• any intellectual or industrial rights owned by RENAtlântico, SA; and• all the legal relationships established during theconcession, such as: labour contracts, subcontracts,leasing and external services.
REN Atlântico, SA must, during the concession period, maintain the assets in good operating condition, maintenance and security, carrying out the necessary repairs, renewals and adaptations necessary keep the assets in the required technicalconditions.REN - Atlântico, S.A. is the owner of and has theassets of the concession. These assets may only be used for the purposes of the concession. At the concession termination date the concession assetsrevert to the State in accordance with the contract,which provides for an indemnity to be paid corresponding to the net book value of the concession assets.The concession can be cancelled by agreementbetween the parties, through rescission, redemptionor maturity. Cancellation of the concession results intransmission of all the concession assets to the State. The Concession contract can be rescinded by the
conceding entity when any one of following eventsoccurs, with a significant impact on the operations of the concession: imminent failure or interruption of the concession operations; deficiencies in the management of the concession's operations; or deficiencies in the maintenance and repair of theinfrastructure that compromises the quality of the service.The conceding entity can redeem the concession,whenever the public interest justifies this, but onlyafter a 15 year period has elapsed as from the dateof the beginning of the concession. By cancelling theconcession, the operator has the right to an indemnityin accordance with the book value of the assets as ofthe date they revert, as well as to possible loss of profits.If, upon termination of the concession, it is notrenewed or the new form or entity responsible for the concession has not been decided, this concessioncontract can be extended for the maximum period of one year, with a leasing, rendering of services or any other legal form of contract.
2.4 Natural gas underground storageConcession for the operation of underground storagewas awarded to REN - Armazenagem, S.A. underDecree-law 140/06 of 26 July of 2006, to carry outthe following activities, under a rendering of publicservice regime:
a) reception, injection, underground storage, extraction, treatment and delivery of natural gas, soas to create or maintain a natural gas security reserveor for delivery to the National Natural Gas TransportNetwork; and b) construction, utilisation, maintenance and expansion of the underground storage chambers.
The model of the concession contract ensures contractual equilibrium through recovery of depreciation of the assets of the concession andremuneration of the investments made in theconcession of the assets and recovery of the operatingcosts relating to the operations of the concession.This concession was granted for a period of 40 yearsas from the date of signature of the contract. The assets considered as concession assets are those acquired by the REN Group from Transgásand include:
• the underground natural gas chambers acquiredor constructed during the period of the concessioncontract;• the infrastructures used for gas injection, extraction, compression, drying, and pressure reduction used for distribution to the National
Consolidated financial statements | 119
Natural Gas Transport Network, including the equipment necessary to control, regulate andmeasure the remaining infrastructures;• infrastructures and equipment for leaching operations; and• the infrastructures necessary for telecommunications,telemetry and remote control, used to manage all theinfrastructures and underground chambers.
In addition, the following are also considered as concession assets:
• the property owned by REN - Armazenagem, SA,in which the above mentioned equipment is installedas well as the related rights of way;• other assets necessary for the operations of theconcession activities;• construction rights or increase in the undergroundchambers;• the cushion gas relating to each chamber;• any intellectual or industrial rights owned by REN Armazenagem, SA; and • all the legal relationships established during theconcession, such as: labour contracts, subcontracts,leasing and external services.
REN Armazenagem, SA must, during the concessionperiod, maintain the assets in good operating condition, maintenance and security, carrying out the necessary repairs, renewals and adaptationsnecessary keep the assets in the required technicalconditions.REN - Armazenagem, S.A. is the owner of and has the assets of the concession. These assets mayonly be used for the purposes of the concession.At the concession termination date the concession
assets revert to the State in accordance with the contract, which provides for an indemnity to bepaid corresponding to the net book value of the concession assets.The concession can be cancelled by agreementbetween the parties, through rescission, redemptionor maturity. Cancellation of the concession results intransmission of all the concession assets to the State.The Concession contract can be rescinded by theconceding entity when any one of following eventsoccurs, with a significant impact on the operationsof the concession: imminent failure or interruption of the concession operations; deficiencies in the management of the concession's operations; or deficiencies in the maintenance and repair of theinfrastructure that compromises the quality of the service.The conceding entity can redeem the concession,whenever the public interest justifies this, but only
after at least 15 year period has elapsed as from thedate of the beginning of the concession. By cancellingthe concession, the operator has the right to anindemnity in accordance with the book value of theassets as of the date they revert, as well as to possibleloss of profits.If, upon termination of the concession, it is notrenewed or the new form or entity responsible for the concession has not been decided, this concessioncontract can be extended for the maximum period ofone year, with a leasing, rendering of services or anyother legal form of contract.
The main accounting policies used in preparing the consolidated financial statements are describedbelow. The policies have been applied consistently in the years presented.
3.1 Basis of preparationThe consolidated financial statements were preparedon a going concern basis, at historical cost, except for the derivative financial instruments andavailable-for-sale financial assets, which are recordedat fair value, as from the books and accountingrecords of the companies included in the consolidation,maintained in accordance with generally acceptedaccounting principles in Portugal, adjusted in the consolidation process so that the consolidated financial statements conform to InternationalFinancial Reporting Standards as endorsed by the European Union, in force for the years starting on 1 January 2009. It is understood that InternationalFinancial Reporting Standards (IFRS), issued by theInternational Accounting Standards Board (“IASB”),International Accounting Standards (IAS), issued bythe International Accounting Standards Committee(“IASC”) and respective SIC and IFRIC interpretations,issued by the International Financial ReportingInterpretation Committee (“IFRIC”) and StandardInterpretation Committee (“SIC”), that have beenendorsed by the European Union are considered as being part of these standards. The standards andinterpretations are hereinafter referred generically to as IFRS. The preparation of financial statements in conformitywith IFRS requires the use of certain critical accountingestimates, assumptions and judgements in theprocess of adopting REN's accounting policies, witha significant impact on the carrying amounts ofassets, liabilities as well as the expenses and incomefor the reporting period.
3. Main accounting policies
120 | Accounts
Report and Accounts 2009
Although the estimates are based in the best experience of the Board of Directors and their bestexpectations in relation to current and future eventsand actions, the current and future results may differfrom the estimates. The areas involving a higherdegree of judgement or complexity, or areas inwhich the assumptions and estimates are significantto the consolidated financial statements are disclosedin Note 5. The financial statements are presented in thousandsof euros - tEuros.
Adoption of new standards, interpretations, amendments and revisions a) The following standards, interpretations, amendmentsand revisions endorsed by the European Union, withmandatory application for financial years beginningon or after 1 January 2009, were adopted for the first time in the year ended 31 December 2009:
• IAS 1 (revised), 'Presentation of financial state-ments'. The 2007 revision of IAS 1 introducedchanges in terminology, including new names forcaptions in financial statements, as well as changes inthe form and content of the statements. REN presentsall the changes to equity resulting from transactionswith the shareholders in the consolidated statementof changes in equity. All the changes in equity resulting from transactions with non-shareholderentities are presented in two separate statements (a consolidated statement of profit and loss and aconsolidated statement of other comprehensive income).• IFRS 8, 'Operating segments'. Adoption of thisstandard did not have a significant impact on theREN Group's segment reporting. • IAS 23, 'Borrowing costs' (revised). This revisionintroduced the requirement to capitalise costs of borrowing relating to assets that qualify, the option to record them in the statement of profit and loss forthe period in which they are incurred therefore beingeliminated. Adoption of this standard did not havea significant impact on the REN Group's consolidatedfinancial statements as it had already adopted this standard.• IFRS 2, 'Share based payments' (amended).Consists of the clarification of the definition of vestingconditions, introduction of the concept of non-vestingconditions and clarification of the treatment of cancellations. Adoption of this change did nothave any impact on the REN Group's consolidatedfinancial statements. • IAS 32 / IAS 1 (amended), 'Financial instruments':presentation (amended). These amendments changedthe criteria for classifying a financial instrument
between an equity instrument and a liability instrument,enabling some financial instruments that can berepurchased to be classified as equity instruments.Consequently the amendment to IAS 1 - 'Presentationof financial statements'. This change did not have any impact on the REN Group's consolidatedfinancial statements.• IFRS 1 / IAS 27 (amended), 'First time adoptionof IFRS' (amendments). These amendments covermeasurement of the cost of investments in sub-sidiaries, jointly controlled entities and associations in the initial adoption of IFRS and the recognition ofdividends from subsidiaries in consolidated financialstatements. This change did not have any impact onthe REN Group's consolidated financial statements.• IFRIC 13, 'Client fidelity programs'. This interpretationstates that bonuses granted to clients as part of a sales transaction are recorded as a separate component of the transaction. This interpretation didnot have any impact on the REN Group's consolidatedfinancial statements.• IAS 39 'Reclassification of financial assets'(amendments). These amendments permit, in certain limited conditions, the reclassification of non derivative financial instruments from the fairvalue through profit and loss and available for salecategories to other categories. • IAS 39' Eligible hedged items (amendements).This deals with clarifications relating to the followinghedge accounting matters: (i) identification of inflation as a hedged risk and (ii) hedging with options. • IFRS 7 'Disclosures regarding measurement at fairvalue and liquidity risk' (amendments). These amendments to IFRS 7 increase the disclosuresrequired regarding the fair value of financial instruments and liquidity risk.
Improvements to international financial reportingstandards - 2007. This process involved the revisionof 32 accounting standards.
Consolidated financial statements | 121
Up to the date of approval of these financial statements the following standards, interpretations,amendments and revisions, with mandatory applica-tion in future financial years have been endorsed bythe European Union:
• IFRS 3 (revised), 'Concentration of activities' IAS 27 (2008 revision) ' Consolidated and separate financial statements' This revision is of mandatory application in yearsstarting on or after 1 July 2009 and introduces somechanges in terms of the recording of concentrationsof business activities, namely: (a) measurement ofinterests without control (previously referred to asminority interests); (b) the recognition and subse-quent measurement of contingent payments; (c) thetreatment of direct costs relating to the concentration;and (d) the recording of transactions relating to thepurchase of interests in entities already controlledand sales of interests without that resulting in loss ofcontrol. This revision will have an impact on futureconcentrations of activities to be made by REN.The revision to IAS 27 has not yet been endorsed bythe European Union. After revision, the standardcomes to require that transactions with “interests not controlled” are recorded in equity when there is nochange in control over the entity. When there is achange in control over the entity, any remaining interest in the entity is re-measured at fair value by corresponding entry to profit and loss for the year.This revision will have an impact on futureconcentrations of activities to be made by REN.• IFRIC 12, 'Concession services' (to be applied in the years starting on or after 1 July 2010). IFRIC12 establishes how operators of concession servicesmust apply the IFRS in recording investment obligations assumed and rights obtained resultingfrom signature of the concession contracts. This interpretation applies to the REN Group's operations,and the estimated impact of its adoption on the RENGroup's consolidated financial statements is stillunder study at this time.• IFRIC 16, 'Hedging of investments in foreignoperations' (to be applied in the years starting on or after 1 July 2009). This interpretation providesguidelines on hedge accounting for net investmentsin foreign operations. This interpretation has noimpact on the REN Group's consolidated financialstatements.• IFRIC 9 and IAS 39 (amended/revised), 'Revaluationof embedded derivatives'. This amendment clarifies in which circumstances subsequent reappraisal of theobligation to separate an embedded derivative ispermitted. This amendment will be applied by the
REN Group in the year it becomes effective.• IFRIC 15, 'Real estate construction contracts' (tobe applied in the years starting on or after 1 January2010). This interpretation covers the way to assess if an agreement to construct a property is within thescope of IAS 11 - 'Construction contracts' or IAS 18 -''Income and how the income should be recognised'.This interpretation has not yet been adopted by theEuropean Union. This interpretation will not impactthe Group's consolidated financial statements.• IFRIC 17, 'Distributions in kind to the shareholders'(to be applied in the years starting on or after 1 July2009). This interpretation provides guidelines on thecorrect recording of assets other than cash distributedto shareholders as dividends. This interpretation hasnot yet been endorsed by the European Union. Thisinterpretation will be applied by the REN Group in theyear it becomes effective.• IFRIC 18, 'Transfers of assets by clients' (to beapplied in the years starting on or after 1 July 2009).This interpretation provides guidelines with respect tothe recording by operators of tangible fixed assets “ofclients”. This interpretation is significant for the utilitiessector as it establishes the accounting treatment tobe given to agreements in which the entity renderingthe service receives from the client an asset that willbe used in connecting the client or other clients to theservice network or that enables the client to accessthe service network. This interpretation will be appliedby the REN Group in the year it becomes effective.
These standards although endorsed by the EuropeanUnion, have not been adopted by the Group in theyear ended 31 December 2009 as their adoption isnot yet mandatory. Their adoption is not expected tohave a significant impact on the financial statements. Draft standards under discussion, issued by the IASB,but not yet approved:
• Rate Regulated Activities - “ Exposure Draft”(ED/2009/8) - In July 2009 the IASB issued an exposure draft relating to “ Rate Regulated Activities”,its main principles being:
i) Recognition in the financial statements of an entity,of regulated assets and liabilities where the regulatorallows an entity to recover costs previously incurredor where the regulator requires return of theamounts previously received and allows the entity toobtain specific remuneration in its regulated activitiesby adjustment to the prices charged to its clients; ii) Measurement of regulated assets and liabilities at the present value of expected cash flows to berecovered or returned, respectively, as a result of the
122 | Accounts
Report and Accounts 2009
regulation, not only on their initial recognition butalso at the end of the period of the financial report; iii) Inclusion of disclosures that identify and explainthe amounts of regulated assets and liabilities recognized in the financial statements so as to ensurethat the users of the financial statements have anunderstanding of the nature and financial effect of itsregulated activities.
The Group is analysing and accompanying thediscussion calendar and conclusion of this ExposureDraft, which is of significant importance to the RENGroup in its operations.
3.2 Service Concessions The Group has four concessions for the operationand development of the NTN, and the overall management of the national electricity system as wellas operation and development of the NationalNatural Gas Transmission Network, the natural lique-fied gas terminal, the natural gas underground storage and the overall management of the naturalgas system. The assets acquired/constructed by RENunder these concession contracts, referred to asconcession assets, comprise mainly property, plantand equipment assets.In accordance with IFRIC 12, a service concessionagreement, typically involves a private sector entity(the operator) that constructs the infrastructure usedto provide the public service or develops it (for example, by increasing its capacity) and operates andmaintains that infrastructure for a specified period of time. The operator is paid for its services over theperiod of the arrangement. The arrangement is governed by a contract that sets out performancestandards, mechanisms for adjusting prices, andarrangements for resolving disputes. A common feature of these contracts is the publicservice nature of the obligation undertaken by theoperator. Public policy requires that the services related to the infrastructure must be provided to thepublic, irrespective of the identity of the party thatoperates the services. The concession contract obliges the operator to provide the services to the public on behalf of the public sector entity. Other common features of the contracts are:
a) the party that awards grants the concession (theconceding entity) is a public sector entity, including agovernmental body, or a private sector entity to whichthe responsibility for the service has been assigned.
b) the operator is responsible for at least themanagement of the infrastructure and relatedservices and does not merely act as an agent onbehalf of the conceding entity.c) the contract sets the initial prices to be levied bythe operator and regulates price revisions over theperiod of the concession contract.d) the operator is obliged to hand over the infrastructureto the conceding entity in a specified condition at theend of the period of the contract, for a residual value,irrespective of which party financed its construction.
Except for the situations of “build-own-operate”, when applying IFRIC 12 the operator should generally not recognise the infrastructure used to provide the conceded services as its property, plantand equipment. Rather, the operator should recordthe rights it receives in exchange for constructingthe infrastructure using:
i) the financial asset model - if the conceding entityhas the responsibility for paying the operator for theconcession services; orii) the intangible asset model - if users have the responsibility for paying the operator for the conceded services.
At this stage the REN Group is analysing the impact of applying IFRIC 12. This interpretation is of mandatory application in the years beginning on or after 1 January 2010, having been endorsedby the European Union on 25 March 2009.
3.3 Consolidation principlesThe consolidation methods used by the Group are as follows:
a) Participations in subsidiariesSubsidiaries are all entities (including special purposeentities) over which REN has the power to govern thefinancial and operating policies generally associatedwith direct or indirect control of more than one half of the voting rights. The existence and effect of potential voting rights that are currently exercisable or convertible are considered when assessing whetherthe Group controls another entity. Subsidiaries arefully consolidated from the date on which control istransferred to the Group. They are deconsolidatedfrom the date that control ceases. Subsidiaries areincluded in the accompanying financial statements in accordance with the full consolidation method. The entities that qualify as subsidiaries are listed inNote 36.
Consolidated financial statements | 123
b) GoodwillDifferences between the cost of acquisition of investments in subsidiaries, jointly controlled companies and associated companies and the fairvalue of the identifiable assets and liabilities of thesecompanies as of the date of the acquisition or duringa period of 12 months after that date, if positive, are recorded as goodwill (in the case of recognisinggoodwill in subsidiary companies or in jointly controlled companies). Goodwill generated on acquisitions after 1 January2004 (date of transition to IFRS) is not amortised, but is subject to impairment tests at least annually to verify the existence of losses. Impairment losses are recorded immediately in the statement of financial position as a deduction from the value of theasset by corresponding entry to the statement of profit and loss, not being reversed subsequently. If the initial recording of a concentration of businessactivities can be determined only provisionally at the end of the period in which the concentrationoccurs because the fair value to be attributed to theidentifiable assets, liabilities and contingent liabilitiesacquired or cost of the acquisition can only bedetermined on a provisional basis, the Group recordsthe concentration using the provisional amounts. The provisional amounts are adjusted when the fairvalue of the assets and liabilities is determined objectively, to occur within a period of twelve monthsafter the date of acquisition. Goodwill or any othergain recognized will be adjusted as from the date ofacquisition by an equal adjustment to the fair valueas of the date of acquisition of the identifiable assets,liabilities and contingent liabilities to be recognized oradjusted and the comparative information presentedfor periods prior to conclusion of the initial recordingof the concentration is presented as if the initialrecording had been concluded as of the date of theacquisition. This includes any depreciation, amortizationor any other additional profit and loss effect recognizedas a result of concluding the initial recognition. Inter-company transactions, balances and unrealisedgains on transactions between group companies are eliminated. Unrealised losses are also eliminatedbut considered an impairment indicator of the assettransferred.REN applies a policy of treating transactions withminority interests as transactions with parties externalto the Group. Losses attributable to minority interestwhich exceed its participation in the subsidiary are fully recognised by REN, except when minorityinterests have contractually assumed additionalresponsibilities over the subsidiary.
The accounting policies of subsidiaries are changedwhenever necessary, so as to ensure that accountingpolicies are applied consistently for all the Groupcompanies.Investments in subsidiaries are always consolidated.
c) Joint venturesThe Group's interests in jointly controlled entities arerecorded in accordance with the equity method ofaccounting. The Group's share of joint venture profitsor losses is recognised in the statement of profit andloss as an operating result and its share of anychanges in reserves is recognised in reserves.Unrealised gains or transactions between the Groupand its joint ventures are eliminated to the extent ofthe Group's interest in the joint venture. The accounting policies of joint ventures are changedwhenever necessary to ensure consistency with thepolicies adopted by the Group.The presentation of joint ventures is determinedbased on shareholders' agreements that regulatejoint control.
3.4 Segment reporting A business segment is a group of assets andoperations engaged in providing products or servicesthat are subject to risks and benefits that are differentfrom those of other business segments. A geographicalsegment is engaged in providing products or services,within a particular economic environment that aresubject to risks and returns that are different fromthose of segments operating in other economic environments.The REN Group only discloses segment informationby business segment, since the Group operates onlyin Portugal. The transactions of the group companyOMIclear, although referring essentially to the sale offuture contracts within MIBEL, are not material for thepresentation of geographical segment information.REN identified the Executive Committee as the entityresponsible for making operating decisions.The Executive Committee reviews the informationprepared internally so as to assess the Group'sperformance and the allocation of resources.Determination of the segments was made basedon the information analysed by the ExecutiveCommittee, which resulted in two new segmentsin relation to those previously reported. The REN Group is organised in two main businesssegments: Electricity and Gas and two secondarysegments: telecommunications and managementof the electricity derivatives market. The Electricitysegment includes the transmission of very high
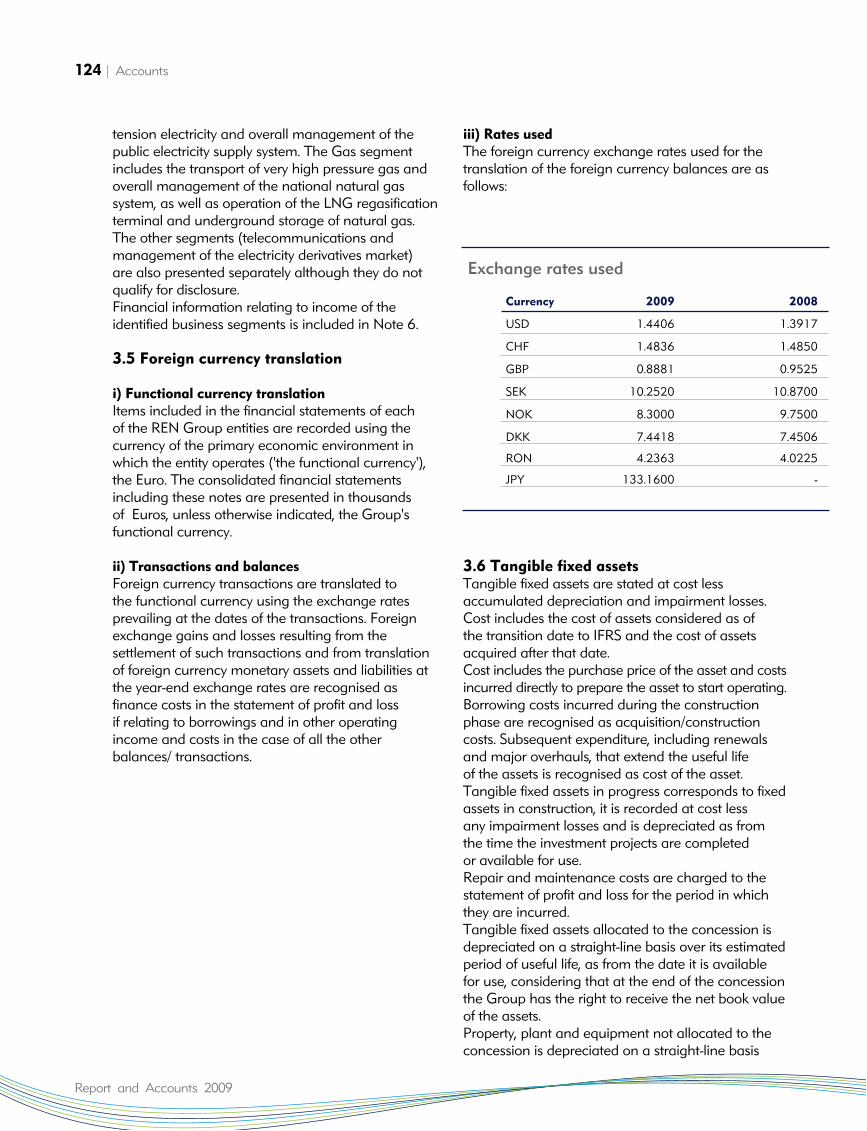
124 | Accounts
Report and Accounts 2009
tension electricity and overall management of thepublic electricity supply system. The Gas segmentincludes the transport of very high pressure gas andoverall management of the national natural gassystem, as well as operation of the LNG regasificationterminal and underground storage of natural gas. The other segments (telecommunications andmanagement of the electricity derivatives market) are also presented separately although they do notqualify for disclosure. Financial information relating to income of theidentified business segments is included in Note 6.
3.5 Foreign currency translation
i) Functional currency translation Items included in the financial statements of eachof the REN Group entities are recorded using thecurrency of the primary economic environment inwhich the entity operates ('the functional currency'),the Euro. The consolidated financial statementsincluding these notes are presented in thousandsof Euros, unless otherwise indicated, the Group'sfunctional currency.
ii) Transactions and balances Foreign currency transactions are translated to the functional currency using the exchange rates prevailing at the dates of the transactions. Foreignexchange gains and losses resulting from thesettlement of such transactions and from translationof foreign currency monetary assets and liabilities atthe year-end exchange rates are recognised asfinance costs in the statement of profit and lossif relating to borrowings and in other operatingincome and costs in the case of all the otherbalances/ transactions.
iii) Rates usedThe foreign currency exchange rates used for thetranslation of the foreign currency balances are asfollows:
3.6 Tangible fixed assetsTangible fixed assets are stated at cost less accumulated depreciation and impairment losses.Cost includes the cost of assets considered as ofthe transition date to IFRS and the cost of assetsacquired after that date.Cost includes the purchase price of the asset and costsincurred directly to prepare the asset to start operating.Borrowing costs incurred during the constructionphase are recognised as acquisition/constructioncosts. Subsequent expenditure, including renewalsand major overhauls, that extend the useful lifeof the assets is recognised as cost of the asset.Tangible fixed assets in progress corresponds to fixedassets in construction, it is recorded at cost lessany impairment losses and is depreciated as fromthe time the investment projects are completed or available for use. Repair and maintenance costs are charged to thestatement of profit and loss for the period in whichthey are incurred.Tangible fixed assets allocated to the concession isdepreciated on a straight-line basis over its estimatedperiod of useful life, as from the date it is availablefor use, considering that at the end of the concessionthe Group has the right to receive the net book valueof the assets. Property, plant and equipment not allocated to theconcession is depreciated on a straight-line basis
Currency 2009 2008
USD 1.4406 1.3917
CHF 1.4836 1.4850
GBP 0.8881 0.9525
SEK 10.2520 10.8700
NOK 8.3000 9.7500
DKK 7.4418 7.4506
RON 4.2363 4.0225
JPY 133.1600 -
Exchange rates used
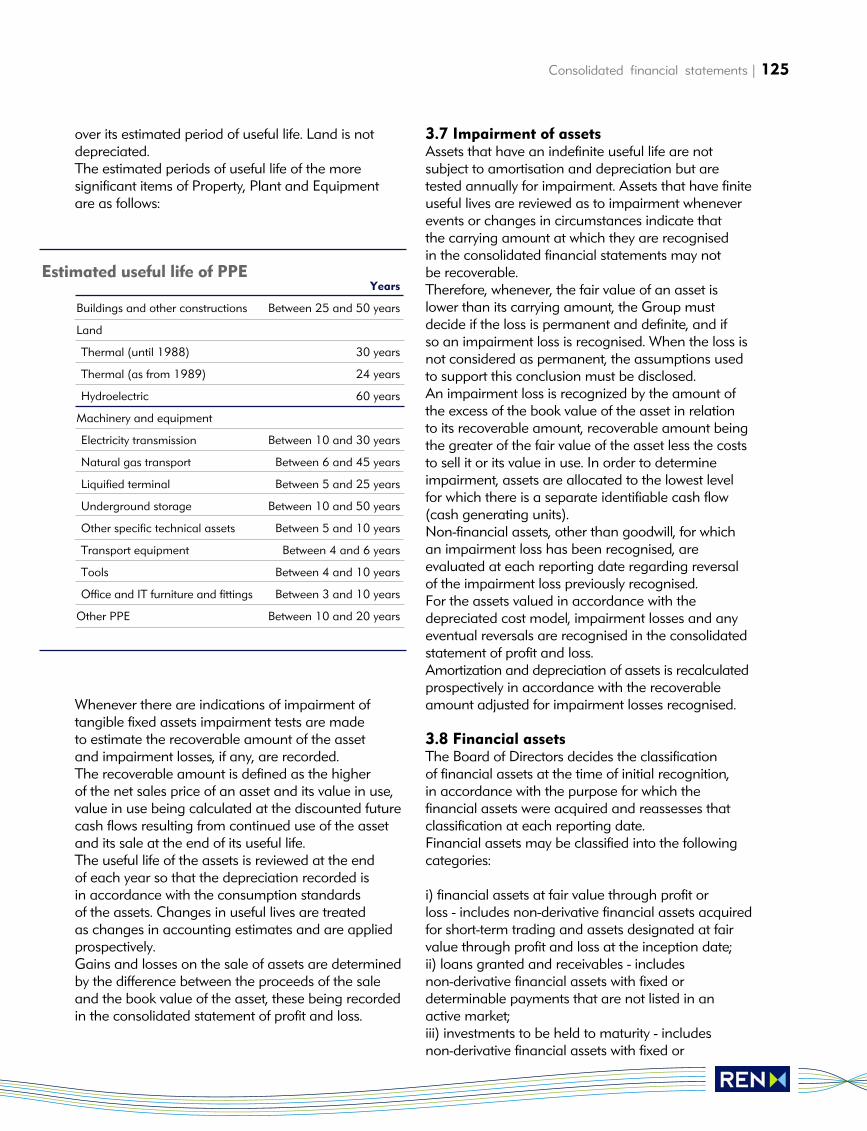
Consolidated financial statements | 125
over its estimated period of useful life. Land is notdepreciated.The estimated periods of useful life of the more significant items of Property, Plant and Equipmentare as follows:
Whenever there are indications of impairment of tangible fixed assets impairment tests are madeto estimate the recoverable amount of the asset and impairment losses, if any, are recorded. The recoverable amount is defined as the higher of the net sales price of an asset and its value in use,value in use being calculated at the discounted futurecash flows resulting from continued use of the assetand its sale at the end of its useful life.The useful life of the assets is reviewed at the end of each year so that the depreciation recorded is in accordance with the consumption standards of the assets. Changes in useful lives are treated as changes in accounting estimates and are appliedprospectively.Gains and losses on the sale of assets are determinedby the difference between the proceeds of the saleand the book value of the asset, these being recordedin the consolidated statement of profit and loss.
3.7 Impairment of assetsAssets that have an indefinite useful life are notsubject to amortisation and depreciation but aretested annually for impairment. Assets that have finiteuseful lives are reviewed as to impairment wheneverevents or changes in circumstances indicate thatthe carrying amount at which they are recognised in the consolidated financial statements may notbe recoverable.Therefore, whenever, the fair value of an asset islower than its carrying amount, the Group mustdecide if the loss is permanent and definite, and ifso an impairment loss is recognised. When the loss isnot considered as permanent, the assumptions usedto support this conclusion must be disclosed.An impairment loss is recognized by the amount ofthe excess of the book value of the asset in relationto its recoverable amount, recoverable amount beingthe greater of the fair value of the asset less the coststo sell it or its value in use. In order to determineimpairment, assets are allocated to the lowest levelfor which there is a separate identifiable cash flow(cash generating units). Non-financial assets, other than goodwill, for whichan impairment loss has been recognised, are evaluated at each reporting date regarding reversalof the impairment loss previously recognised.For the assets valued in accordance with the depreciated cost model, impairment losses and anyeventual reversals are recognised in the consolidatedstatement of profit and loss. Amortization and depreciation of assets is recalculatedprospectively in accordance with the recoverableamount adjusted for impairment losses recognised.
3.8 Financial assets The Board of Directors decides the classificationof financial assets at the time of initial recognition,in accordance with the purpose for which the financial assets were acquired and reassesses thatclassification at each reporting date.Financial assets may be classified into the followingcategories:
i) financial assets at fair value through profit or loss - includes non-derivative financial assets acquiredfor short-term trading and assets designated at fairvalue through profit and loss at the inception date;ii) loans granted and receivables - includes non-derivative financial assets with fixed ordeterminable payments that are not listed in anactive market;iii) investments to be held to maturity - includesnon-derivative financial assets with fixed or
Years
Buildings and other constructions Between 25 and 50 years
Land
Thermal (until 1988) 30 years
Thermal (as from 1989) 24 years
Hydroelectric 60 years
Machinery and equipment
Electricity transmission Between 10 and 30 years
Natural gas transport Between 6 and 45 years
Liquified terminal Between 5 and 25 years
Underground storage Between 10 and 50 years
Other specific technical assets Between 5 and 10 years
Transport equipment Between 4 and 6 years
Tools Between 4 and 10 years
Office and IT furniture and fittings Between 3 and 10 years
Other PPE Between 10 and 20 years
Estimated useful life of PPE
126 | Accounts
Report and Accounts 2009
determinable payments and fixed maturities, that theentity intends and has the capacity to hold until thematurity date; andiv) available-for-sale financial assets - includes non-derivative financial assets designated as available-for-sale at inception date or other financialassets not classified in any of the other financial asset categories. Available-for-sale financial assets are recognised as non-current assets unlessmanagement intends to sell them within 12 monthsof the balance sheet date.
Purchases and sales of investments in financial assets are recognised on the transaction date - thedate on which REN commits itself to purchase orsell the asset.Financial assets at fair value through profit and lossare initially recognised at fair value and transactioncosts are expensed in the consolidated statement ofprofit and loss. Such assets are subsequently adjustedto fair value, gains and losses arising from changes infair value being recognised in the statement of profitand loss caption net financial costs for the period inwhich they arise, which also includes interest incomeand dividends received.Available-for-sale financial assets are initially recognised at fair value including transaction costs. In subsequent periods these assets are adjusted tofair value, the changes in fair value being recognisedin a fair value reserve within Equity. Dividends andinterest income from available-for-sale financialassets are recognised in the statement of profit andloss caption financial income for the period in whichthe right to receive them is established.The fair value of listed investments is based on current market prices (“bid”). If the market for a financial asset is not active, REN establishes fair value by using valuation techniques. These includethe use of recent transactions, provided that they areat market prices, reference to other instruments thatare substantially the same and discounted cashflow analysis when information is available, makingmaximum use of market inputs and relying as little as possible on entity-specific inputs.Loans and receivables are classified as “Trade andother receivables” in the balance sheet (Note 3.11),and are carried at amortised cost using the effectiveinterest rate method, less any provision for impairment.A provision for impairment of trade receivables isestablished when there is objective evidence that theGroup will not be able to collect all amounts due inaccordance with the original terms of the transactionsthat gave rise to the receivables.
At each balance sheet reporting date REN assesseswhether there is objective evidence that its financialassets are impaired. In the case of equity instrumentsclassified as available-for-sale, a significant orprolonged decline in the fair value of the equityinstrument below its cost is considered an indicatorthat it is impaired. If there is evidence of loss in valueof available-for-sale financial assets, the accumulatedloss - determined as the difference between acquisitioncost and current fair value, less any impairment losson that financial asset previously recognised in thestatement of profit or loss - is removed from equityand recognised in the consolidated statementof profit and loss. Impairment losses on equity instruments, recognised in the statement of profit and loss, are not reversible through the consolidatedstatement of profit and loss.Financial assets are derecognised when the rights to receive cash flows from the investments expire or are transferred, as well as all risks and rewards of ownership.
3.9 Derivative financial instrumentsDerivative financial instruments are initiallyrecorded at fair value at the transaction date, beingsubsequently recorded at fair value. The method ofrecognising fair value gains or losses depends onthe designation made of the derivative financialinstruments. If they are designated as derivative financial instruments for trading, gains or lossesresulting from fair value changes are recognized in the statement of profit and loss caption “Financeincome” or “Finance costs”. If they are designatedas hedging derivative financial instruments, gains orlosses resulting from fair value changes depends onthe nature of the hedged item, which can be a fairvalue hedge or a cash flow hedge.In an operation to hedge fair value of an asset orliability (“fair value hedge”), the carrying amount of the respective asset or liability, measured inaccordance with the defined accounting policy, isadjusted to reflect the fair value change attributed to the hedged risk. Variations in the fair value ofhedging derivatives are recognized in the statementof profit and loss together with variations in the fairvalue of the hedged assets and liabilities attributed to the hedged risk.In an operation to hedge exposure to variations in future cash flows of high probability (“cash-flowhedge”), the effective part of fair value changesin the hedging derivative is recognized in reserves,being transferred to the statement of profit and loss in the periods the fair value changes of the hedgeditem affects profit and loss. The ineffective part of the
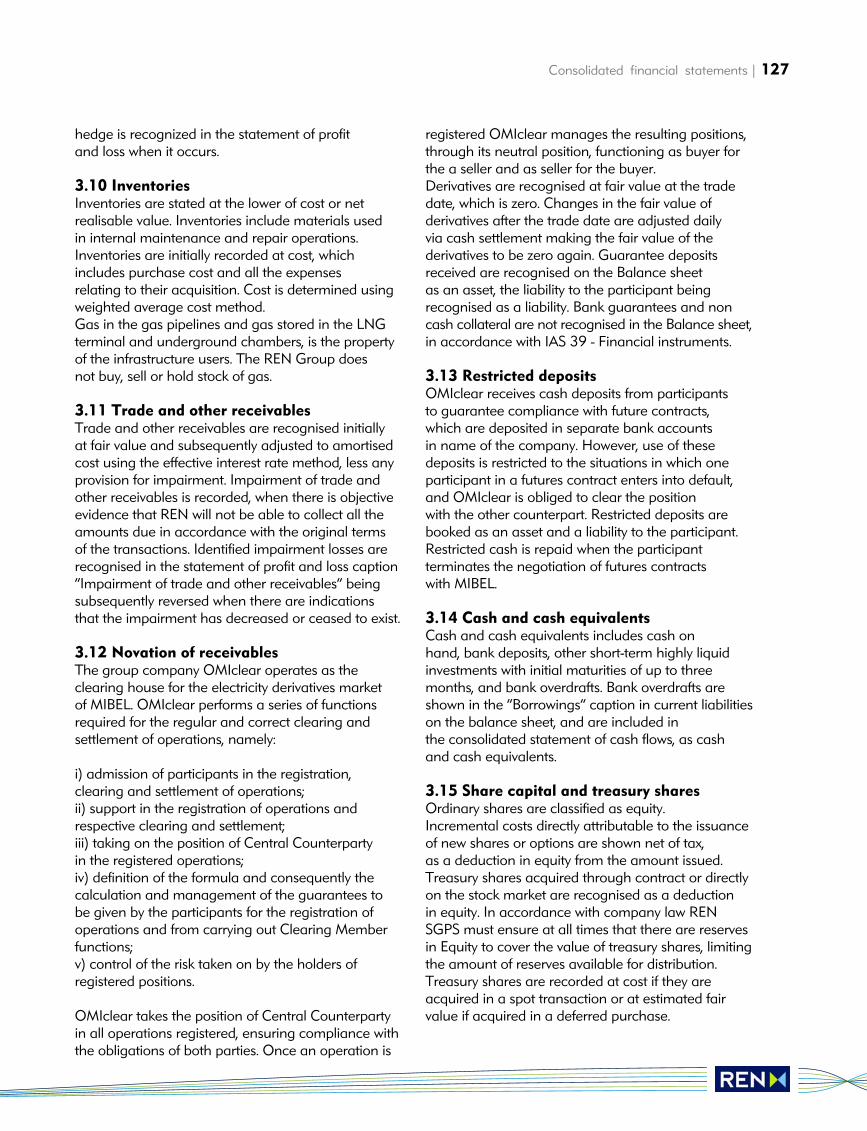
Consolidated financial statements | 127
hedge is recognized in the statement of profit and loss when it occurs.
3.10 InventoriesInventories are stated at the lower of cost or netrealisable value. Inventories include materials used in internal maintenance and repair operations.Inventories are initially recorded at cost, whichincludes purchase cost and all the expenses relating to their acquisition. Cost is determined usingweighted average cost method.Gas in the gas pipelines and gas stored in the LNGterminal and underground chambers, is the propertyof the infrastructure users. The REN Group doesnot buy, sell or hold stock of gas.
3.11 Trade and other receivablesTrade and other receivables are recognised initially at fair value and subsequently adjusted to amortisedcost using the effective interest rate method, less anyprovision for impairment. Impairment of trade andother receivables is recorded, when there is objectiveevidence that REN will not be able to collect all theamounts due in accordance with the original termsof the transactions. Identified impairment losses arerecognised in the statement of profit and loss caption“Impairment of trade and other receivables” beingsubsequently reversed when there are indications that the impairment has decreased or ceased to exist.
3.12 Novation of receivablesThe group company OMIclear operates as the clearing house for the electricity derivatives marketof MIBEL. OMIclear performs a series of functionsrequired for the regular and correct clearing andsettlement of operations, namely:
i) admission of participants in the registration, clearing and settlement of operations;ii) support in the registration of operations andrespective clearing and settlement;iii) taking on the position of Central Counterpartyin the registered operations;iv) definition of the formula and consequently thecalculation and management of the guarantees tobe given by the participants for the registration ofoperations and from carrying out Clearing Memberfunctions;v) control of the risk taken on by the holders of registered positions.
OMIclear takes the position of Central Counterpartyin all operations registered, ensuring compliance withthe obligations of both parties. Once an operation is
registered OMIclear manages the resulting positions,through its neutral position, functioning as buyer forthe a seller and as seller for the buyer.Derivatives are recognised at fair value at the tradedate, which is zero. Changes in the fair value of derivatives after the trade date are adjusted dailyvia cash settlement making the fair value of thederivatives to be zero again. Guarantee depositsreceived are recognised on the Balance sheetas an asset, the liability to the participant being recognised as a liability. Bank guarantees and noncash collateral are not recognised in the Balance sheet,in accordance with IAS 39 - Financial instruments.
3.13 Restricted depositsOMIclear receives cash deposits from participantsto guarantee compliance with future contracts, which are deposited in separate bank accounts in name of the company. However, use of thesedeposits is restricted to the situations in which oneparticipant in a futures contract enters into default,and OMIclear is obliged to clear the position with the other counterpart. Restricted deposits arebooked as an asset and a liability to the participant.Restricted cash is repaid when the participant terminates the negotiation of futures contracts with MIBEL.
3.14 Cash and cash equivalentsCash and cash equivalents includes cash onhand, bank deposits, other short-term highly liquidinvestments with initial maturities of up to threemonths, and bank overdrafts. Bank overdrafts areshown in the “Borrowings” caption in current liabilitieson the balance sheet, and are included in the consolidated statement of cash flows, as cash and cash equivalents.
3.15 Share capital and treasury sharesOrdinary shares are classified as equity.Incremental costs directly attributable to the issuanceof new shares or options are shown net of tax,as a deduction in equity from the amount issued.Treasury shares acquired through contract or directlyon the stock market are recognised as a deduction in equity. In accordance with company law RENSGPS must ensure at all times that there are reservesin Equity to cover the value of treasury shares, limitingthe amount of reserves available for distribution.Treasury shares are recorded at cost if they areacquired in a spot transaction or at estimated fairvalue if acquired in a deferred purchase.
128 | Accounts
Report and Accounts 2009
3.16 Financial liabilitiesIAS 39 establishes the classification of financialliabilities in two categories:
i) financial liabilities at fair value through profit and loss;ii) other financial liabilities
Other financial liabilities include “Borrowings” (Note 3.17) and “Trade and other payables”. Tradeand other payables are initially recognised at fair value and subsequently adjusted to amortised cost,using the effective interest rate method.Financial liabilities are derecognised when the relatedobligations are settled, cancelled or expire.
3.17 BorrowingsBorrowings are initially recognised at fair value,net of transaction costs incurred. Borrowings are subsequently measured at amortised cost, thedifference between the nominal value and the initialfair value being recognised in the consolidated statement of profit and loss over the term of the borrowings, using the effective interest method.Borrowings are classified as current liabilities unless RENhas an unconditional right to defer the settlement of the liability for at least 12 months after the balancesheet date, in which case they are classified as non-current liabilities.
3.18 Income taxIncome tax expense includes current income tax and deferred income tax. Income tax is recognised in the statement of profit and loss, except when related to items recognised directly in equity. Theamount of income tax payable is determined basedon the net profit before tax, adjusted in accordancewith tax legislation.Deferred tax is recognised using the liability methodbased on the balance sheet considering thetemporary differences between the tax base of assetsand liabilities and their amounts in the consolidatedfinancial statements.Deferred income tax is calculated using tax rates inforce or substantially enacted at the balance sheetdate and are expected to apply when the relateddeferred tax asset is realised or the deferred tax liability is settled.
Deferred tax assets are recognised to the extent that it is probable that future taxable profit will beavailable against which the temporary differencescan be used. Deferred tax liabilities are provided foron every temporary tax difference, except those relating to:
i) the initial recognition of goodwill; orii) the initial recognition of assets or liabilities in transactions that do not result from a businesscombination and at the time of the transaction affect neither accounting profit nor taxable profit.
However, taxable temporary differences relating toinvestments in subsidiaries should not be recognisedto the extent that: i) the parent company is able to control the timing ofthe reversal of the temporary difference; andii) it is probable that the temporary difference will notrevert in the near future.
3.19 Employee benefitsREN grants supplementary retirement and survivorpensions (hereinafter referred to as pension plan), provides its retirees and pensioners with a medicalassistance plan and grants other benefits such aslong service bonuses, retirement bonus and deathsubsidy.
i) REN - Rede Eléctrica Nacional, S.A. pension planThe supplementary retirement and survivor pensionsgranted to employees consist of a defined benefitsplan, with an autonomous fund established, to whichall the liabilities are transferred and contributions aremade to cover the liabilities which fall due in eachperiod. The liability for payment of the pensions is estimatedannually by independent actuaries using theprojected unit credit method. The present value ofthe liability for the defined benefit is determined bydiscounting payments of future benefits using theinterest rate for highly rated bonds in the same currency in which the benefits are paid and with similar maturities to those of the liability assumed. The liability for retirement benefits recognised onthe balance sheet corresponds to the present value of the liability for the benefits as of the balance sheetdate less the fair value of the assets of the plan,together with adjustments for past service costs. Actuarial gains and losses determined in a yearand for each benefit plan granted, resulting fromadjustments to actuarial assumptions, experienceadjustments or in the benefits scheme are recordeddirectly in equity.
Consolidated financial statements | 129
ii) REN - Rede Eléctrica Nacional, S.A. medicalassistance plan and other benefits The liabilities assumed relating to healthcare are not funded, being covered by a specific provision.Measurement and recognition of the liability forhealthcare are the same as those for retirement supplements referred to above, except as regardsassets of the plan. REN recognises all the actuarial gains and losses on all the plans directly in equity.
iii) Life assurance contracts The gas segment companies provide their employeeswith life assurance benefits. The costs are recognizedduring the period in which they serve. This liability iscovered by a specific provision.
3.20 ProvisionsProvisions are recognised when REN has:
i) a present legal or constructive obligation as a result of past events; ii) it is more likely than not that an outflow ofresources will be required to settle the obligation; andiii) the amount can be reliably estimated. When oneof these criteria is not fulfilled or the existence of theliability is dependent upon a future event, REN SGPSdiscloses it as a contingent liability, except if the outflow of resources to settle it is considered to be remote.
Provisions are measured at the present value of theestimated expenditure required to settle the liabilityusing a pre-tax rate that reflects the market assessment of the discount period and the risk of theprovision.
3.21 State subsidies and others These refer to subsidies received for investment intangible fixed assets and are recognised as deferredincome in the caption “Trade and other payables”. Subsidies received from the Portuguese State andthe European Union are recognised at their fair value when there is reasonable certainty that the subsidy will be received. Operating assets delivered to REN by new producersconnected to the National Transmission Network or others are also recorded as subsidies received. Subsidies are subsequently credited to the consolidatedstatement of profit and loss on a systematic basis inaccordance with depreciation of the related assets. Operating subsidies are recognised in the consolidatedstatement of profit and loss in the period in which therelated costs are incurred.
3.22 Income and expensesIncome and costs are recognised in the period towhich they relate, independently of the date theyare received or paid, in accordance with the accrualbasis of accounting. Differences between theamounts received and paid and the related incomeand costs are recognised as assets or liabilities, if theyqualify for this.
Tariff deviations In regulated activities the regulator establishes thecriteria for allocating income and costs to futureyears, through adjustment of the tariff applicable to future years. Up to 2008 tariff deviations were recorded as incomeand costs for the years in which they were incorporatedin the tariff by the Regulator. A re-analysis of the degree of precision of theestimates made internally regarding tariff deviationswithin the regulated framework in force, whichshowed the reliability of the amounts estimated,as well as the virtually certain probability of the realization of these assets and settlement of theseliabilities resulted that in 2009 that the Group startedrecognizing asset and liability tariff deviations in theyear in which they are generated, treating this matteras a change in estimates in accordance with IAS 8.
3.23 Revenue
Electicity segmentRevenue recognition for concession activities is determined based on the information of the electricitytransmitted to distributors and the implicit servicesprovided, considering the tariffs defined annually by the regulator, for transmission and overallmanagement of the electricity system.As regards the intermediation activity relating to the sale and purchase of electricity (agent role), REN recognises as revenue, the remunerationobtained over the net book value of the assets allocated to this activity.As regards the “Commercial Agent” activity, carriedout by the group company REN Trading which isresponsible for the management of the electricity produced under the two PPA's (power purchaseagreements) that have not been terminated (TejoEnergia and Turbogás), this is remunerated throughan incentive mechanism.To stimulate the “Commercial Agent” activity, in thebeginning of 2008 ERSE established a mechanism tooptimise the management of the PPA's, a mechanismto optimise the management of CO2 emissionlicences, as well as the parameters to be in place
130 | Accounts
Report and Accounts 2009
in calculating the incentives established. The revenueobtained from application of these mechanisms, is amajor part of the results obtained by the “CommercialAgent” activity.The revenue obtained from these activities is regulatedby ERSE, the Portuguese electricity regulator.In accordance with regulatory terms the tariffs to be charged to final clients (home consumers, industryand others), are determined annually by each component of the system, such as: generation, transmission and distribution. REN, SA's revenuerelates mainly to electricity transmission and overallmanagement of the electricity system.The tariff for electricity transmission is to recover:
i) depreciation of the concession assets classified aselectricity transmission equipment;ii) a return on the average net book value of theassets relating to this activity, in accordance with therates determined annually by the regulator; andiii) operating costs (relating to the activity, payroll and others), less the revenue obtained from electricitytransmission charged to third parties.
The tariff for overall management of the system is to recover:
i) depreciation of the concession assets relating to overall management of the system;ii) depreciation of the concession assets relating to the generating station sites;iii) a return on the average net book value of the generating station sites (land);iv) a return on the average net book value of theassets relating to this activity, in accordance with the rates determined annually by the regulator;v) operating costs (relating to the activity, payroll and others);vi) operating costs of the regulator.
Gas segmentRevenue from the gas concession operations is determined based on:
i) information relating to the gas units unloaded andregasificated of units in the LNG terminal,ii) the gas units injected, stored and extracted in theunderground chambers; and iii) the capacity used and gas units transmittedthrough the high pressure transmission network.
The revenue is calculated in accordance with the tariffs determined by the regulator as from 1 of July2007. Up to 30 June 2007, revenue was recognised
in accordance with the transition agreements signedwith Transgás the main user of the gas capacityof the gas assets owned by the REN Group.
Telecommunications segmentRevenue from the telecommunications segmentresults from services rendered by the group companyRentelecom, through the rent of fibre optics, benefitingfrom of the excess capacity of the telecommunicationsequipment installed. In this area services relating to management of private voice networks are alsorendered. Revenue is recognised in the period theservices are rendered, based on the percentage of the stage of completion of each specific transaction,valued considering the actual services already rendered and the total services to be rendered.
Revenue from management of the Derivatives Market Management of the electricity derivatives market,under MIBEL results in the payment of a commissionfee for each operation negotiated. Revenue fromthese transactions is received at the time of payment.
3.24 Leasing The lease of property, plant and equipment, in which REN has substantially all the risks and rewardsincidental to ownership of an asset, is classified as afinance lease. Agreements which an analysis of oneor more matters of the contract point a finance leaseare also classified as finance leases. All other leasesare classified as operating leases.Finance lease contracts are initially recognised atthe lower of the fair value of the leased assets or thepresent value of the minimum lease payments, eachdetermined at the inception date. The lease liability is recognised net of interest costs in the captionBorrowings. Interest costs included in the lease payments and depreciation of the leased assets arerecognised in the consolidated statement of profitand loss in the period they refer to.The property, plant and equipment acquired throughfinance leases is depreciated at the shorter of the estimated useful life of the asset and the lease term,when the Group does not have a purchase option at the end of the contract, or at its estimated usefullife when the Group has the intention of acquiring the asset at the end of the contract.In operating lease contracts, the lease payments due are recognised as expenses in the consolidatedstatement of profit and loss, on a straight-line basisover the lease term.
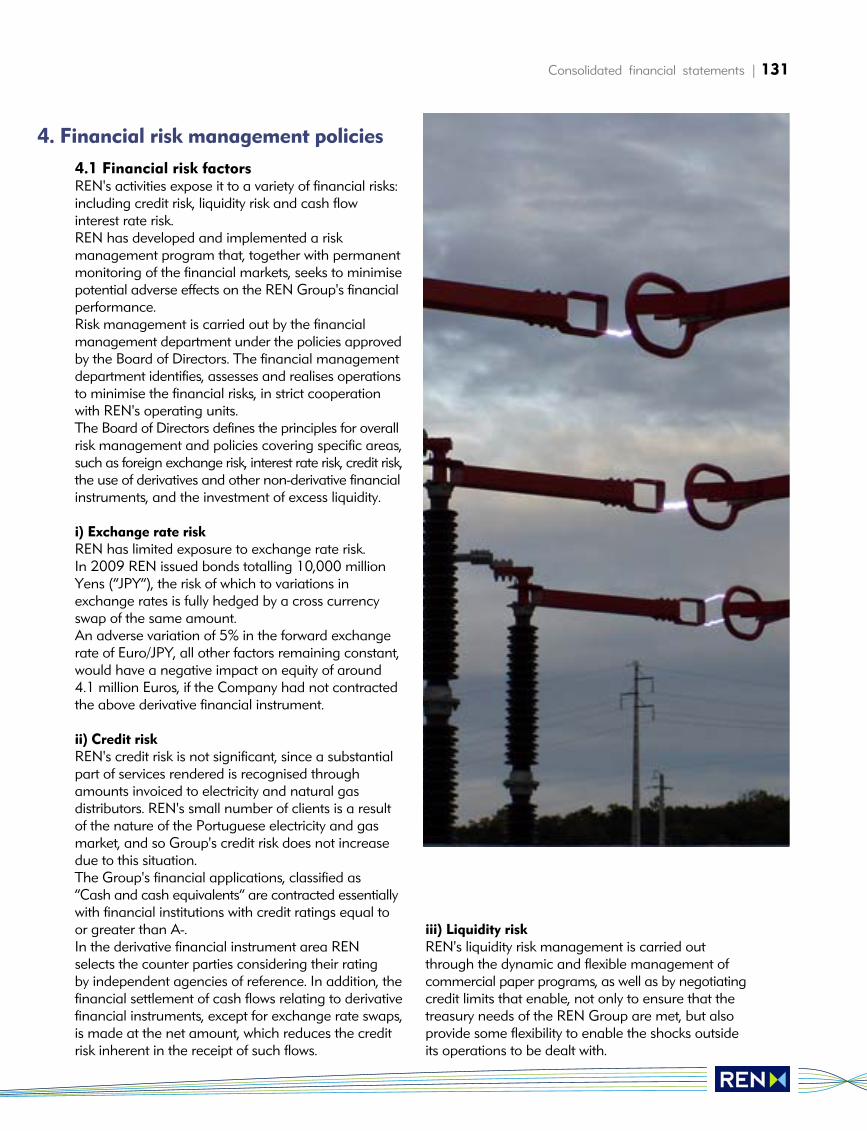
Consolidated financial statements | 131
4.1 Financial risk factorsREN's activities expose it to a variety of financial risks:including credit risk, liquidity risk and cash flowinterest rate risk.REN has developed and implemented a risk management program that, together with permanentmonitoring of the financial markets, seeks to minimisepotential adverse effects on the REN Group's financialperformance.Risk management is carried out by the financial management department under the policies approvedby the Board of Directors. The financial managementdepartment identifies, assesses and realises operationsto minimise the financial risks, in strict cooperationwith REN's operating units. The Board of Directors defines the principles for overallrisk management and policies covering specific areas,such as foreign exchange risk, interest rate risk, credit risk,the use of derivatives and other non-derivative financialinstruments, and the investment of excess liquidity.
i) Exchange rate riskREN has limited exposure to exchange rate risk. In 2009 REN issued bonds totalling 10,000 millionYens (“JPY”), the risk of which to variations inexchange rates is fully hedged by a cross currencyswap of the same amount. An adverse variation of 5% in the forward exchangerate of Euro/JPY, all other factors remaining constant,would have a negative impact on equity of around4.1 million Euros, if the Company had not contractedthe above derivative financial instrument.
ii) Credit riskREN's credit risk is not significant, since a substantialpart of services rendered is recognised throughamounts invoiced to electricity and natural gas distributors. REN's small number of clients is a resultof the nature of the Portuguese electricity and gasmarket, and so Group's credit risk does not increasedue to this situation. The Group's financial applications, classified as “Cash and cash equivalents” are contracted essentiallywith financial institutions with credit ratings equal toor greater than A-.In the derivative financial instrument area RENselects the counter parties considering their rating by independent agencies of reference. In addition, thefinancial settlement of cash flows relating to derivativefinancial instruments, except for exchange rate swaps,is made at the net amount, which reduces the creditrisk inherent in the receipt of such flows.
iii) Liquidity risk REN's liquidity risk management is carried outthrough the dynamic and flexible management ofcommercial paper programs, as well as by negotiatingcredit limits that enable, not only to ensure that thetreasury needs of the REN Group are met, but alsoprovide some flexibility to enable the shocks outsideits operations to be dealt with.
4. Financial risk management policies
132 | Accounts
Report and Accounts 2009
31 December 2009
Less than 1 year From 1 to 5 years More than 5 years Total
Cross Currency Interest Rate Swap
Outflows 4,157 16,709 102,336 123,202
Inflows 2,035 8,152 94,415 104,602
Gross-settled derivative financial instruments ( in thousands of euros - tEuros)
31 December 2008
2008 Less than 1 year From 1 to 5 years More than 5 years Total
Borrowings
Finance leases 1,223 2,563 0 3,786
Bank loans 68,203 252,811 525,692 846,706
Commercial paper 454,502 200,000 0 654,502
Bonds 31,875 627,500 0 659,375
Bank overdrafts 41,643 - - 41,643
597,446 1,082,874 525,692 2,206,012
Derivative financial instruments 1,571 -368 - 1,203
Trade and other payables 271,139 - - -
2009
Borrowings
Finance leases 1,475 2,621 0 4,096
Bank loans 57,431 276,130 492,832 826,393
Commercial paper 405,392 157,753 0 563,145
Bonds 56,489 1,023,892 112,529 1,192,910
Bank overdrafts 45,312 - - 45,312
566,099 1,460,396 605,361 2,631,856
Derivative financial instruments 5,494 7,474 - 12,968
Trade and other payables 402,474 - - -
The following table shows REN's financial liabilitiesby contracted residual maturity intervals andincludes derivative financial instruments for which the related flows are made at the net amount. Theamounts presented in the table refer to contractualnon-discounted cash-flows:
The following table shows the derivative financialinstruments, financial settlement of which is made atgross amounts (Not applicable to 2008): are as follows:
( in thousands of euros - tEuros)
Consolidated financial statements | 133
iv) Interest rate risk The risk relating to interest rate fluctuation has twomajor impacts on REN's financial statements: remuneration of the company's assets, in accordancewith the the tariff regulations; and interest on the borrowings. Since a significant part of the REN Group's assetshave a guaranteed return through the tariffs, definition of which depends in part on the marketrates of interest, its operating cash flows are significantly affected by changes in the market rates of interest. Increases in the market rates of interest generate substantial increases in cash flowsand vice-versa.REN is exposed to interest rate risk, mainly due to borrowings. Borrowings at variable interest ratesexpose REN to cash flow risk, whenever interest rateschange. Borrowings at fixed interest rates exposeREN to fair value risk, whenever interest rates change.The REN Group analyses its exposure to interest raterisk on a dynamic basis. In 2009 REN contracted4 interest rate swaps to hedge the risk of fluctuationof variable interest rates. A sensitivity analysis was made based on the RENGroup's total debt less applications in funds and cash and cash equivalents as of 31 December 2009and 2008, with the following assumptions:
• Changes in market interest rates affecting interestincome and costs of variable financial instruments; • Changes in market interest rates affecting onlyresults or equity in relation to fixed interest rate financialinstruments if they are recognised at fair value;• Changes in market interest rates affecting the fairvalue of derivative financial instruments and otherfinancial assets and liabilities; • Changes in the fair value of derivative financialinstruments and other assets and liabilities areestimated discounting current net amounts of futurecash flows, using market rates at the end of the year.
Using these assumptions a 0.25% increase in marketinterest rates for all the currencies in which the Grouphas borrowings or derivative financial instrumentsat 31 December 2009 would result in a decrease of profit before tax of around 1.2 million Euros(8.2 million Euros in 2008) and an increase in equityof around 4.2 million Euros (not applicable to 2008).
v) Price risk REN's exposure to price risk results essentially fromits investment in REE and Enagás. A negative variation of 10% in the price of shares of REEand Enagás at 31 December 2009 would havea negative impact on equity of 8.9 million Euros(8.6 million Euros in 2008).
vi) Regulated activity risk Gains recognised by REN in each period result directly from the assumptions considered by the regulator, ERSE, in defining the regulated tariffs for the electricity and gas sectors.
vii) Clearing houseOMIclear being the entity responsible for managingthe Clearing Platform of the Iberian derivatives markets, it assumes the role of the central counterpartyon derivatives negotiated (mainly futures contracts),becoming the buyer in relation to a seller positionand seller in relation to a buyer.OMIclear virtually eliminates or reduces a series of risks, specifically:
i) Credit - of one of the parties not honouring its contractual commitments in relation to the other;ii) Financial Settlement - centrally ensuring the debitsand credits of the operation multilaterally;iii) Operational - maintaining market control and supervision of the market's procedures andmechanisms;iv) Systemic - taking into account the introductionmultilateral netting.
4.2 Capital risk managementThe REN Group's objective relating to the managementof capital, which is a broader concept than the capitaldisclosed on the face of balance sheet, is to maintainan optimal capital structure, through rational useof debt and maintenance of a solid credit rating to enable the cost of capital to be reduced.The contracting of debt is analysed periodically considering the following aspects:
i) the needs of CAPEX in regulated assets;ii) the remuneration rate of regulated assets asdetermined in the tariff regulations in force; and iii) the dividend policy in place.
REN also monitors its total capital based on thegearing ratio, which is calculated as net debt divided bytotal capital. Net debt is calculated as total borrowings(including current and non-current borrowings less cash and cash equivalents as presented in the
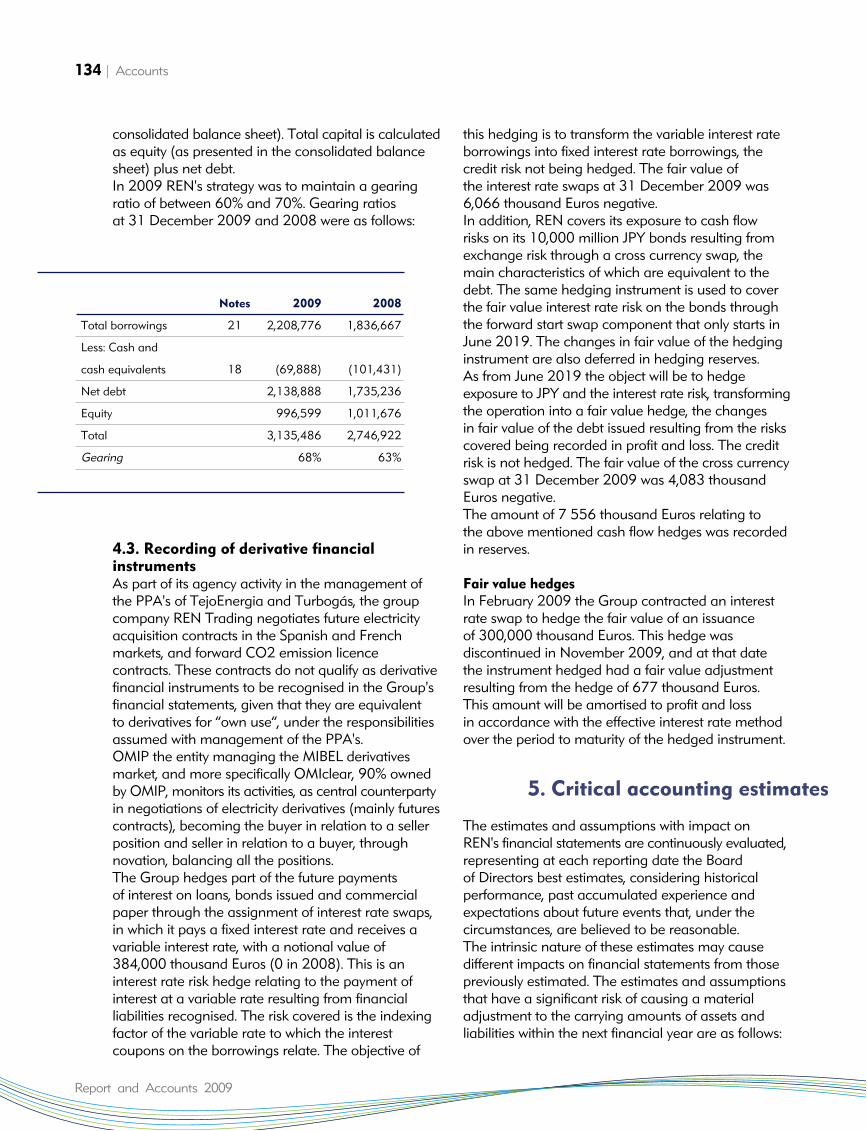
consolidated balance sheet). Total capital is calculatedas equity (as presented in the consolidated balancesheet) plus net debt.In 2009 REN's strategy was to maintain a gearingratio of between 60% and 70%. Gearing ratios at 31 December 2009 and 2008 were as follows:
4.3. Recording of derivative financial instruments As part of its agency activity in the management ofthe PPA's of TejoEnergia and Turbogás, the groupcompany REN Trading negotiates future electricityacquisition contracts in the Spanish and French markets, and forward CO2 emission licence contracts. These contracts do not qualify as derivativefinancial instruments to be recognised in the Group'sfinancial statements, given that they are equivalent to derivatives for “own use”, under the responsibilitiesassumed with management of the PPA's.OMIP the entity managing the MIBEL derivativesmarket, and more specifically OMIclear, 90% ownedby OMIP, monitors its activities, as central counterpartyin negotiations of electricity derivatives (mainly futurescontracts), becoming the buyer in relation to a sellerposition and seller in relation to a buyer, throughnovation, balancing all the positions.The Group hedges part of the future payments of interest on loans, bonds issued and commercialpaper through the assignment of interest rate swaps,in which it pays a fixed interest rate and receives avariable interest rate, with a notional value of384,000 thousand Euros (0 in 2008). This is an interest rate risk hedge relating to the payment ofinterest at a variable rate resulting from financial liabilities recognised. The risk covered is the indexingfactor of the variable rate to which the interestcoupons on the borrowings relate. The objective of
this hedging is to transform the variable interest rateborrowings into fixed interest rate borrowings, thecredit risk not being hedged. The fair value of the interest rate swaps at 31 December 2009 was6,066 thousand Euros negative.In addition, REN covers its exposure to cash flow risks on its 10,000 million JPY bonds resulting fromexchange risk through a cross currency swap, themain characteristics of which are equivalent to thedebt. The same hedging instrument is used to coverthe fair value interest rate risk on the bonds throughthe forward start swap component that only starts inJune 2019. The changes in fair value of the hedginginstrument are also deferred in hedging reserves. As from June 2019 the object will be to hedge exposure to JPY and the interest rate risk, transformingthe operation into a fair value hedge, the changes in fair value of the debt issued resulting from the riskscovered being recorded in profit and loss. The creditrisk is not hedged. The fair value of the cross currencyswap at 31 December 2009 was 4,083 thousandEuros negative.The amount of 7 556 thousand Euros relating to the above mentioned cash flow hedges was recordedin reserves.
Fair value hedges In February 2009 the Group contracted an interestrate swap to hedge the fair value of an issuance of 300,000 thousand Euros. This hedge was discontinued in November 2009, and at that datethe instrument hedged had a fair value adjustmentresulting from the hedge of 677 thousand Euros. This amount will be amortised to profit and lossin accordance with the effective interest rate methodover the period to maturity of the hedged instrument.
The estimates and assumptions with impact on REN's financial statements are continuously evaluated,representing at each reporting date the Boardof Directors best estimates, considering historical performance, past accumulated experience andexpectations about future events that, under the circumstances, are believed to be reasonable.The intrinsic nature of these estimates may cause different impacts on financial statements from thosepreviously estimated. The estimates and assumptionsthat have a significant risk of causing a materialadjustment to the carrying amounts of assets andliabilities within the next financial year are as follows:
134 | Accounts
Report and Accounts 2009
Notes 2009 2008
Total borrowings 21 2,208,776 1,836,667
Less: Cash and
cash equivalents 18 (69,888) (101,431)
Net debt 2,138,888 1,735,236
Equity 996,599 1,011,676
Total 3,135,486 2,746,922
Gearing 68% 63%
5. Critical accounting estimates
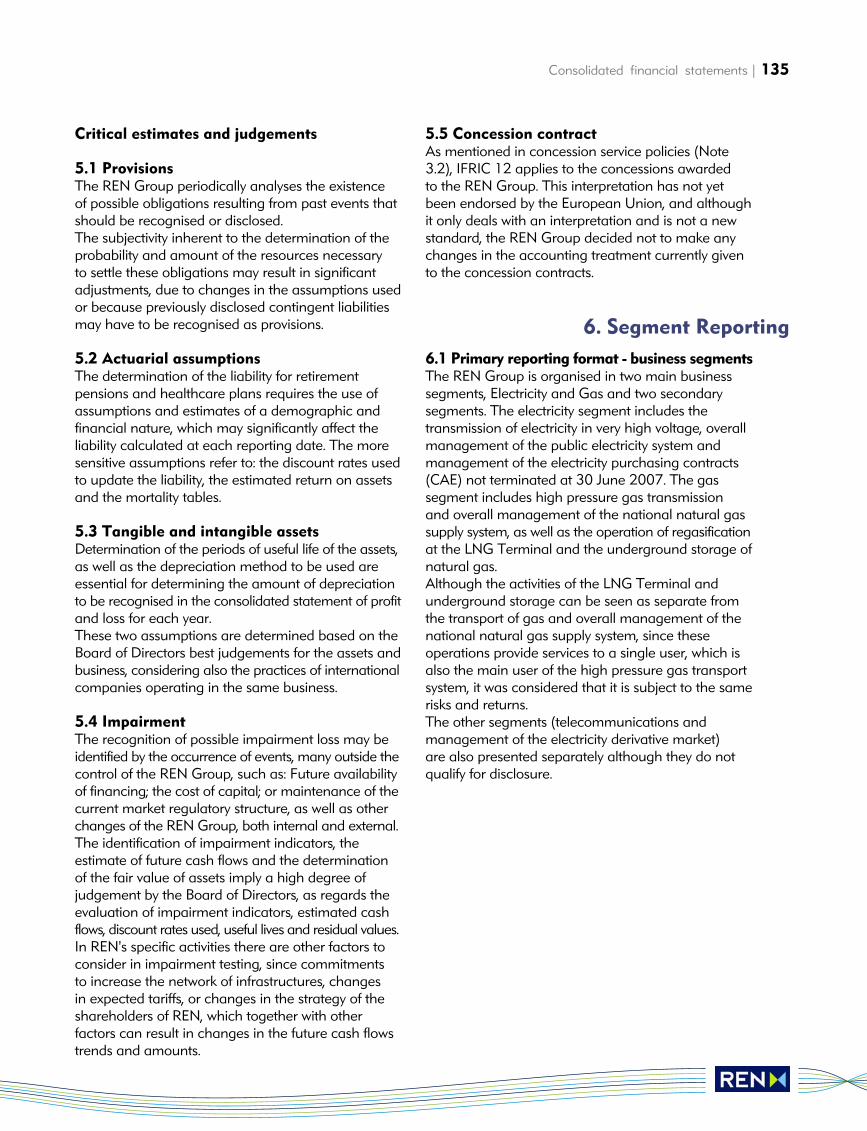
Consolidated financial statements | 135
Critical estimates and judgements
5.1 ProvisionsThe REN Group periodically analyses the existenceof possible obligations resulting from past events thatshould be recognised or disclosed.The subjectivity inherent to the determination of theprobability and amount of the resources necessaryto settle these obligations may result in significantadjustments, due to changes in the assumptions usedor because previously disclosed contingent liabilitiesmay have to be recognised as provisions.
5.2 Actuarial assumptionsThe determination of the liability for retirement pensions and healthcare plans requires the use ofassumptions and estimates of a demographic andfinancial nature, which may significantly affect the liability calculated at each reporting date. The moresensitive assumptions refer to: the discount rates usedto update the liability, the estimated return on assetsand the mortality tables.
5.3 Tangible and intangible assets Determination of the periods of useful life of the assets,as well as the depreciation method to be used areessential for determining the amount of depreciationto be recognised in the consolidated statement of profitand loss for each year.These two assumptions are determined based on theBoard of Directors best judgements for the assets andbusiness, considering also the practices of internationalcompanies operating in the same business.
5.4 ImpairmentThe recognition of possible impairment loss may beidentified by the occurrence of events, many outside thecontrol of the REN Group, such as: Future availabilityof financing; the cost of capital; or maintenance of thecurrent market regulatory structure, as well as otherchanges of the REN Group, both internal and external.The identification of impairment indicators, theestimate of future cash flows and the determinationof the fair value of assets imply a high degree ofjudgement by the Board of Directors, as regards theevaluation of impairment indicators, estimated cashflows, discount rates used, useful lives and residual values.In REN's specific activities there are other factors toconsider in impairment testing, since commitmentsto increase the network of infrastructures, changesin expected tariffs, or changes in the strategy of theshareholders of REN, which together with otherfactors can result in changes in the future cash flowstrends and amounts.
5.5 Concession contract As mentioned in concession service policies (Note3.2), IFRIC 12 applies to the concessions awarded to the REN Group. This interpretation has not yetbeen endorsed by the European Union, and althoughit only deals with an interpretation and is not a newstandard, the REN Group decided not to make anychanges in the accounting treatment currently givento the concession contracts.
6.1 Primary reporting format - business segments The REN Group is organised in two main businesssegments, Electricity and Gas and two secondary segments. The electricity segment includes thetransmission of electricity in very high voltage, overallmanagement of the public electricity system andmanagement of the electricity purchasing contracts(CAE) not terminated at 30 June 2007. The gassegment includes high pressure gas transmission and overall management of the national natural gassupply system, as well as the operation of regasificationat the LNG Terminal and the underground storage ofnatural gas.Although the activities of the LNG Terminal andunderground storage can be seen as separate fromthe transport of gas and overall management of thenational natural gas supply system, since these operations provide services to a single user, which isalso the main user of the high pressure gas transportsystem, it was considered that it is subject to the samerisks and returns.The other segments (telecommunications and management of the electricity derivative market) are also presented separately although they do notqualify for disclosure.
6. Segment Reporting
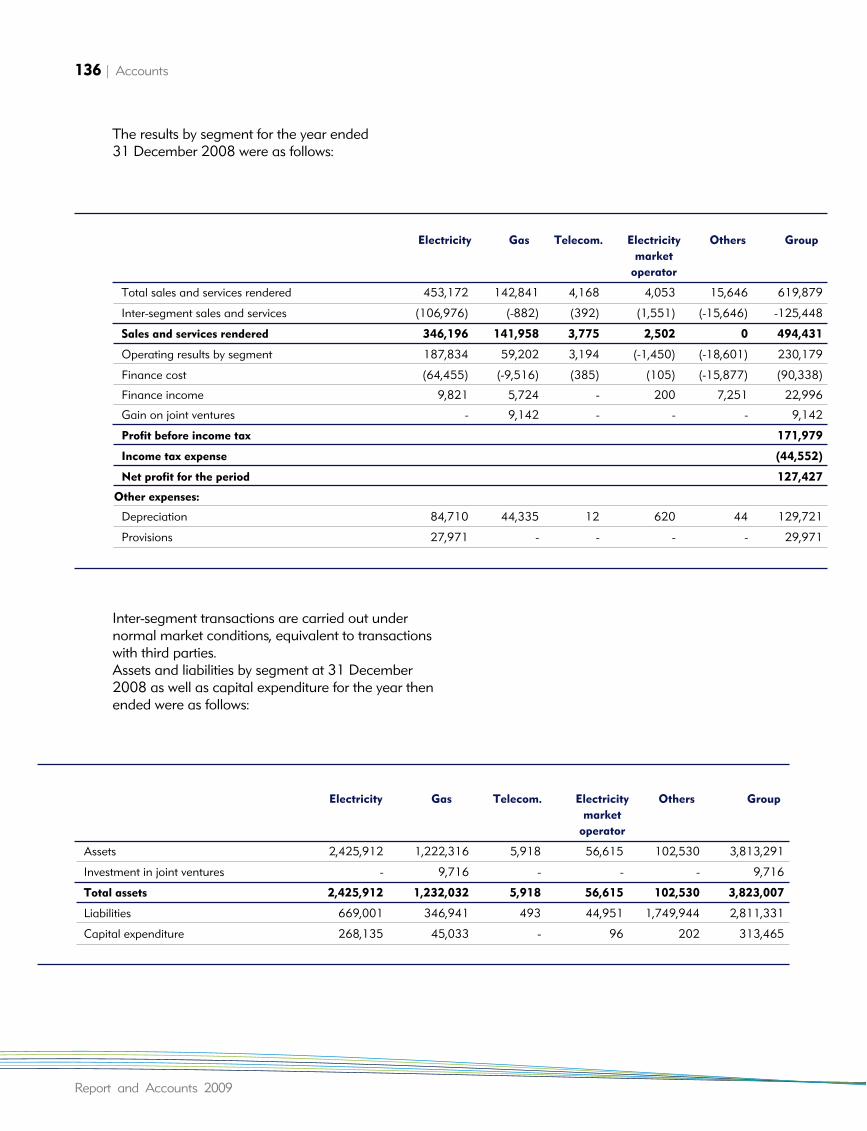
136 | Accounts
Report and Accounts 2009
The results by segment for the year ended31 December 2008 were as follows:
Inter-segment transactions are carried out under normal market conditions, equivalent to transactionswith third parties.Assets and liabilities by segment at 31 December2008 as well as capital expenditure for the year thenended were as follows:
Electricity Gas Telecom. Electricity Others Group
market
operator
Total sales and services rendered 453,172 142,841 4,168 4,053 15,646 619,879
Inter-segment sales and services (106,976) (-882) (392) (1,551) (-15,646) -125,448
Sales and services rendered 346,196 141,958 3,775 2,502 0 494,431
Operating results by segment 187,834 59,202 3,194 (-1,450) (-18,601) 230,179
Finance cost (64,455) (-9,516) (385) (105) (-15,877) (90,338)
Finance income 9,821 5,724 - 200 7,251 22,996
Gain on joint ventures - 9,142 - - - 9,142
Profit before income tax 171,979
Income tax expense (44,552)
Net profit for the period 127,427
Other expenses:
Depreciation 84,710 44,335 12 620 44 129,721
Provisions 27,971 - - - - 29,971
Electricity Gas Telecom. Electricity Others Group
market
operator
Assets 2,425,912 1,222,316 5,918 56,615 102,530 3,813,291
Investment in joint ventures - 9,716 - - - 9,716
Total assets 2,425,912 1,232,032 5,918 56,615 102,530 3,823,007
Liabilities 669,001 346,941 493 44,951 1,749,944 2,811,331
Capital expenditure 268,135 45,033 - 96 202 313,465
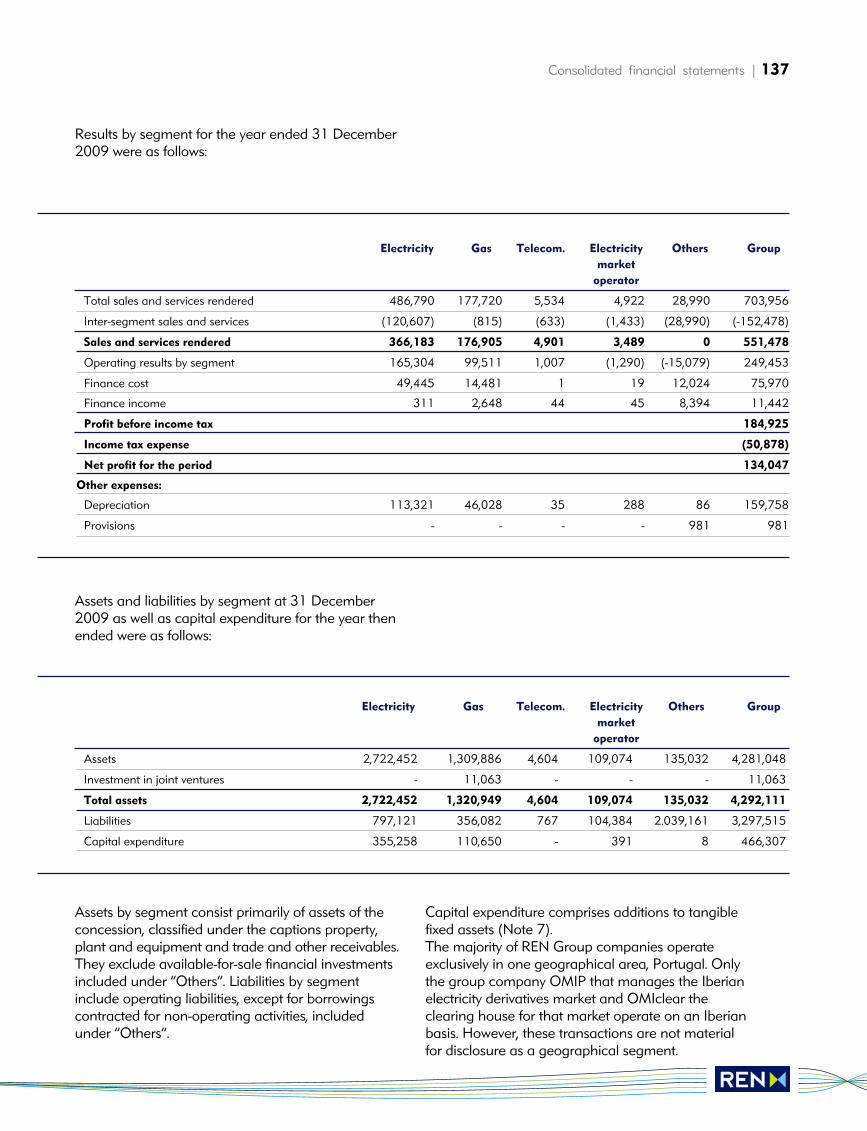
Consolidated financial statements | 137
Results by segment for the year ended 31 December2009 were as follows:
Assets and liabilities by segment at 31 December2009 as well as capital expenditure for the year thenended were as follows:
Assets by segment consist primarily of assets of theconcession, classified under the captions property,plant and equipment and trade and other receivables.They exclude available-for-sale financial investmentsincluded under “Others”. Liabilities by segment include operating liabilities, except for borrowingscontracted for non-operating activities, includedunder “Others”.
Capital expenditure comprises additions to tangiblefixed assets (Note 7).The majority of REN Group companies operateexclusively in one geographical area, Portugal. Onlythe group company OMIP that manages the Iberianelectricity derivatives market and OMIclear the clearing house for that market operate on an Iberianbasis. However, these transactions are not materialfor disclosure as a geographical segment.
Electricity Gas Telecom. Electricity Others Group
market
operator
Assets 2,722,452 1,309,886 4,604 109,074 135,032 4,281,048
Investment in joint ventures - 11,063 - - - 11,063
Total assets 2,722,452 1,320,949 4,604 109,074 135,032 4,292,111
Liabilities 797,121 356,082 767 104,384 2.039,161 3,297,515
Capital expenditure 355,258 110,650 - 391 8 466,307
Electricity Gas Telecom. Electricity Others Group
market
operator
Total sales and services rendered 486,790 177,720 5,534 4,922 28,990 703,956
Inter-segment sales and services (120,607) (815) (633) (1,433) (28,990) (-152,478)
Sales and services rendered 366,183 176,905 4,901 3,489 0 551,478
Operating results by segment 165,304 99,511 1,007 (1,290) (-15,079) 249,453
Finance cost 49,445 14,481 1 19 12,024 75,970
Finance income 311 2,648 44 45 8,394 11,442
Profit before income tax 184,925
Income tax expense (50,878)
Net profit for the period 134,047
Other expenses:
Depreciation 113,321 46,028 35 288 86 159,758
Provisions - - - - 981 981
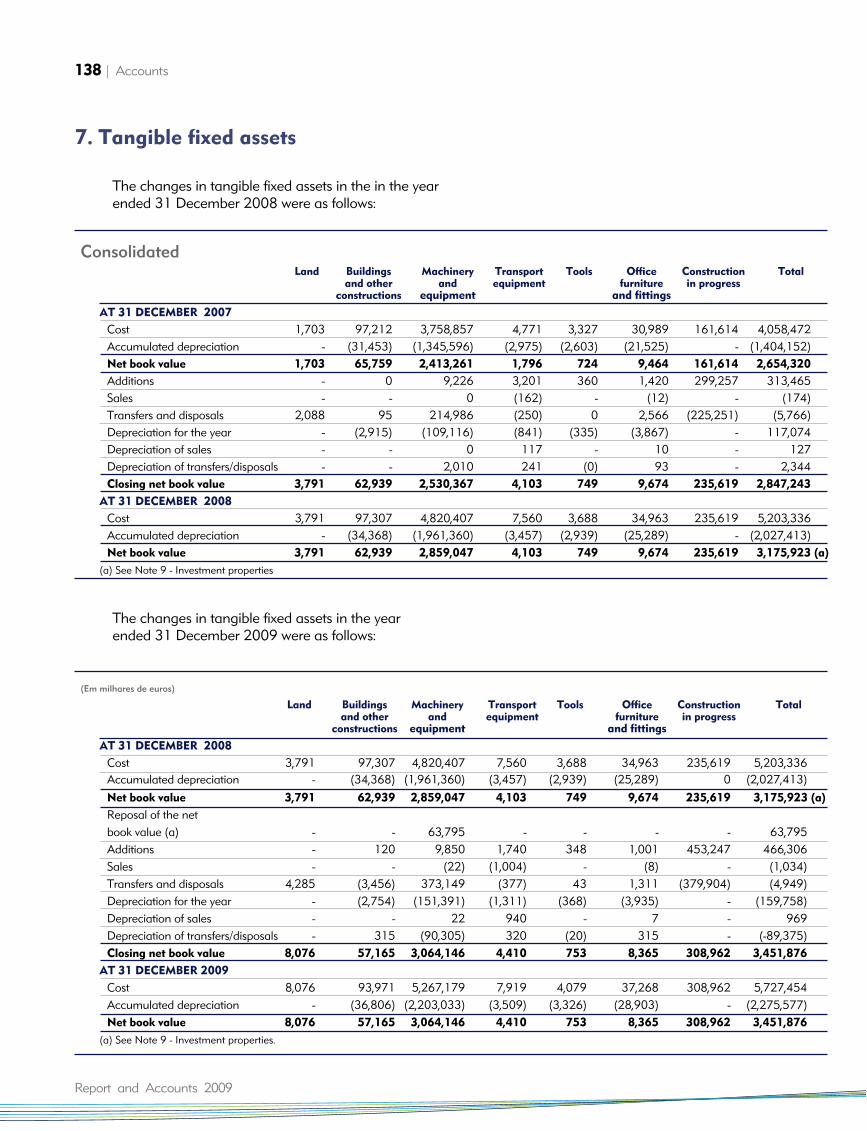
138 | Accounts
Report and Accounts 2009
The changes in tangible fixed assets in the in the yearended 31 December 2008 were as follows:
The changes in tangible fixed assets in the yearended 31 December 2009 were as follows:
7. Tangible fixed assets
Land Buildings Machinery Transport Tools Office Construction Totaland other and equipment furniture in progress
constructions equipment and fittings
AT 31 DECEMBER 2007
Cost 1,703 97,212 3,758,857 4,771 3,327 30,989 161,614 4,058,472Accumulated depreciation - (31,453) (1,345,596) (2,975) (2,603) (21,525) - (1,404,152)Net book value 1,703 65,759 2,413,261 1,796 724 9,464 161,614 2,654,320
Additions - 0 9,226 3,201 360 1,420 299,257 313,465Sales - - 0 (162) - (12) - (174)Transfers and disposals 2,088 95 214,986 (250) 0 2,566 (225,251) (5,766)Depreciation for the year - (2,915) (109,116) (841) (335) (3,867) - 117,074Depreciation of sales - - 0 117 - 10 - 127Depreciation of transfers/disposals - - 2,010 241 (0) 93 - 2,344Closing net book value 3,791 62,939 2,530,367 4,103 749 9,674 235,619 2,847,243
AT 31 DECEMBER 2008
Cost 3,791 97,307 4,820,407 7,560 3,688 34,963 235,619 5,203,336Accumulated depreciation - (34,368) (1,961,360) (3,457) (2,939) (25,289) - (2,027,413)Net book value 3,791 62,939 2,859,047 4,103 749 9,674 235,619 3,175,923 (a)
(a) See Note 9 - Investment properties
Consolidated
Land Buildings Machinery Transport Tools Office Construction Totaland other and equipment furniture in progress
constructions equipment and fittings
AT 31 DECEMBER 2008
Cost 3,791 97,307 4,820,407 7,560 3,688 34,963 235,619 5,203,336Accumulated depreciation - (34,368) (1,961,360) (3,457) (2,939) (25,289) 0 (2,027,413)
Net book value 3,791 62,939 2,859,047 4,103 749 9,674 235,619 3,175,923 (a)
Reposal of the net book value (a) - - 63,795 - - - - 63,795Additions - 120 9,850 1,740 348 1,001 453,247 466,306Sales - - (22) (1,004) - (8) - (1,034)Transfers and disposals 4,285 (3,456) 373,149 (377) 43 1,311 (379,904) (4,949)Depreciation for the year - (2,754) (151,391) (1,311) (368) (3,935) - (159,758)Depreciation of sales - - 22 940 - 7 - 969Depreciation of transfers/disposals - 315 (90,305) 320 (20) 315 - (-89,375)Closing net book value 8,076 57,165 3,064,146 4,410 753 8,365 308,962 3,451,876
AT 31 DECEMBER 2009
Cost 8,076 93,971 5,267,179 7,919 4,079 37,268 308,962 5,727,454Accumulated depreciation - (36,806) (2,203,033) (3,509) (3,326) (28,903) - (2,275,577)Net book value 8,076 57,165 3,064,146 4,410 753 8,365 308,962 3,451,876
(a) See Note 9 - Investment properties.
(Em milhares de euros)
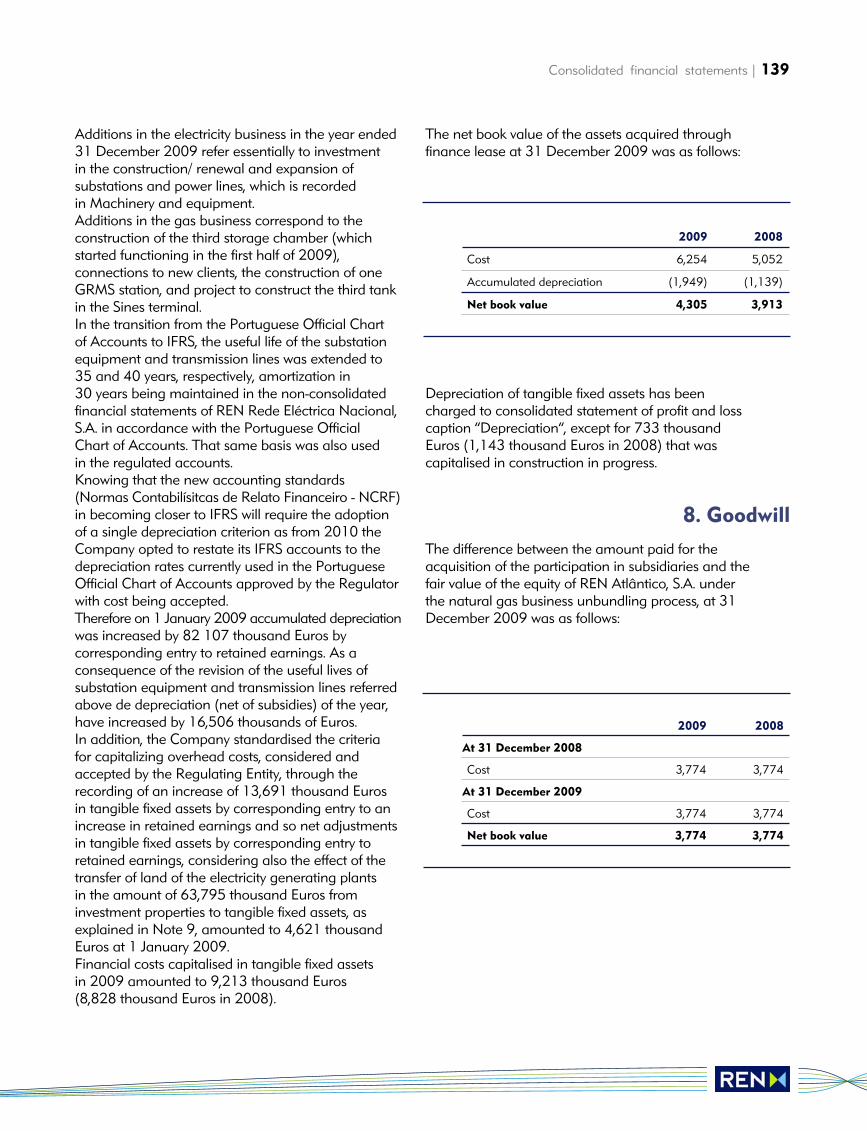
Consolidated financial statements | 139
Additions in the electricity business in the year ended31 December 2009 refer essentially to investmentin the construction/ renewal and expansion of substations and power lines, which is recorded in Machinery and equipment.Additions in the gas business correspond to the construction of the third storage chamber (whichstarted functioning in the first half of 2009), connections to new clients, the construction of oneGRMS station, and project to construct the third tankin the Sines terminal.In the transition from the Portuguese Official Chart of Accounts to IFRS, the useful life of the substationequipment and transmission lines was extended to35 and 40 years, respectively, amortization in 30 years being maintained in the non-consolidatedfinancial statements of REN Rede Eléctrica Nacional,S.A. in accordance with the Portuguese OfficialChart of Accounts. That same basis was also used in the regulated accounts. Knowing that the new accounting standards(Normas Contabilísitcas de Relato Financeiro - NCRF)in becoming closer to IFRS will require the adoptionof a single depreciation criterion as from 2010 theCompany opted to restate its IFRS accounts to thedepreciation rates currently used in the PortugueseOfficial Chart of Accounts approved by the Regulatorwith cost being accepted. Therefore on 1 January 2009 accumulated depreciationwas increased by 82 107 thousand Euros bycorresponding entry to retained earnings. As a consequence of the revision of the useful lives of substation equipment and transmission lines referredabove de depreciation (net of subsidies) of the year,have increased by 16,506 thousands of Euros.In addition, the Company standardised the criteria for capitalizing overhead costs, considered andaccepted by the Regulating Entity, through therecording of an increase of 13,691 thousand Euros in tangible fixed assets by corresponding entry to anincrease in retained earnings and so net adjustmentsin tangible fixed assets by corresponding entry toretained earnings, considering also the effect of thetransfer of land of the electricity generating plants in the amount of 63,795 thousand Euros from investment properties to tangible fixed assets, asexplained in Note 9, amounted to 4,621 thousandEuros at 1 January 2009.Financial costs capitalised in tangible fixed assets in 2009 amounted to 9,213 thousand Euros (8,828 thousand Euros in 2008).
The net book value of the assets acquired throughfinance lease at 31 December 2009 was as follows:
Depreciation of tangible fixed assets has beencharged to consolidated statement of profit and losscaption “Depreciation”, except for 733 thousandEuros (1,143 thousand Euros in 2008) that wascapitalised in construction in progress.
The difference between the amount paid for theacquisition of the participation in subsidiaries and thefair value of the equity of REN Atlântico, S.A. underthe natural gas business unbundling process, at 31December 2009 was as follows:
2009 2008
Cost 6,254 5,052
Accumulated depreciation (1,949) (1,139)
Net book value 4,305 3,913
2009 2008
At 31 December 2008
Cost 3,774 3,774
At 31 December 2009
Cost 3,774 3,774
Net book value 3,774 3,774
8. Goodwill
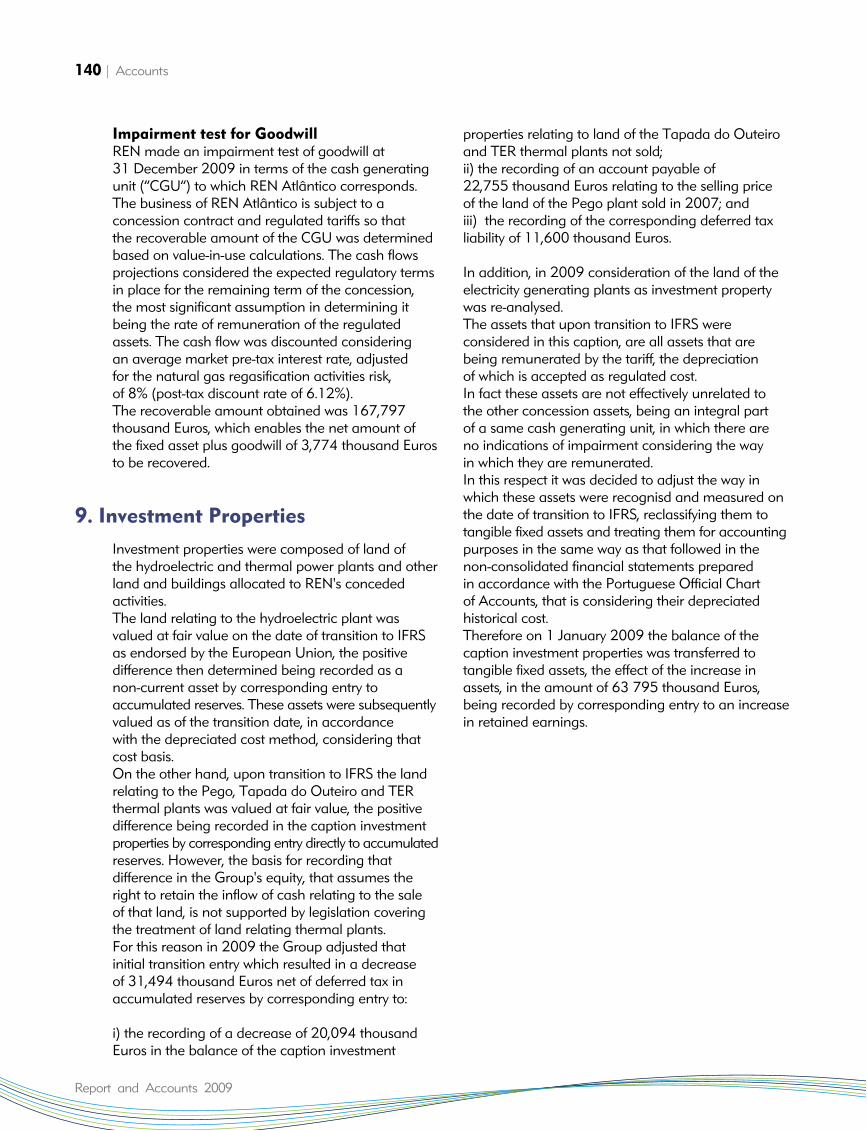
Impairment test for Goodwill REN made an impairment test of goodwill at 31 December 2009 in terms of the cash generatingunit (“CGU”) to which REN Atlântico corresponds.The business of REN Atlântico is subject to a concession contract and regulated tariffs so that the recoverable amount of the CGU was determinedbased on value-in-use calculations. The cash flowsprojections considered the expected regulatory termsin place for the remaining term of the concession, the most significant assumption in determining itbeing the rate of remuneration of the regulatedassets. The cash flow was discounted considering an average market pre-tax interest rate, adjusted for the natural gas regasification activities risk, of 8% (post-tax discount rate of 6.12%). The recoverable amount obtained was 167,797thousand Euros, which enables the net amount of the fixed asset plus goodwill of 3,774 thousand Eurosto be recovered.
Investment properties were composed of land of the hydroelectric and thermal power plants and otherland and buildings allocated to REN's concededactivities. The land relating to the hydroelectric plant was valued at fair value on the date of transition to IFRSas endorsed by the European Union, the positive difference then determined being recorded as a non-current asset by corresponding entry to accumulated reserves. These assets were subsequentlyvalued as of the transition date, in accordance with the depreciated cost method, considering thatcost basis. On the other hand, upon transition to IFRS the landrelating to the Pego, Tapada do Outeiro and TERthermal plants was valued at fair value, the positivedifference being recorded in the caption investmentproperties by corresponding entry directly to accumulatedreserves. However, the basis for recording that difference in the Group's equity, that assumes theright to retain the inflow of cash relating to the sale of that land, is not supported by legislation coveringthe treatment of land relating thermal plants. For this reason in 2009 the Group adjusted that initial transition entry which resulted in a decrease of 31,494 thousand Euros net of deferred tax inaccumulated reserves by corresponding entry to:
i) the recording of a decrease of 20,094 thousandEuros in the balance of the caption investment
properties relating to land of the Tapada do Outeiroand TER thermal plants not sold; ii) the recording of an account payable of 22,755 thousand Euros relating to the selling price of the land of the Pego plant sold in 2007; andiii) the recording of the corresponding deferred taxliability of 11,600 thousand Euros.
In addition, in 2009 consideration of the land of theelectricity generating plants as investment propertywas re-analysed.The assets that upon transition to IFRS wereconsidered in this caption, are all assets that arebeing remunerated by the tariff, the depreciation of which is accepted as regulated cost.In fact these assets are not effectively unrelated to the other concession assets, being an integral part of a same cash generating unit, in which there are no indications of impairment considering the way in which they are remunerated.In this respect it was decided to adjust the way inwhich these assets were recognisd and measured onthe date of transition to IFRS, reclassifying them totangible fixed assets and treating them for accountingpurposes in the same way as that followed in thenon-consolidated financial statements preparedin accordance with the Portuguese Official Chart of Accounts, that is considering their depreciated historical cost.Therefore on 1 January 2009 the balance of the caption investment properties was transferred to tangible fixed assets, the effect of the increase inassets, in the amount of 63 795 thousand Euros,being recorded by corresponding entry to an increasein retained earnings.
140 | Accounts
Report and Accounts 2009
9. Investment Properties
Consolidated financial statements | 141
The changes in “Investment Properties” as of 31December 2009 and 2008 were made up as follows:
As explained in Note 1, with the acquisition of thenatural gas transport business, the REN Groupacquired two joint ventures with Enagás, the entityresponsible for natural gas transport in Spain.The joint ventures were founded to jointly managesome sections of REN Gasodutos, SA's gas pipelines,with the allocation of a part of the transport capacityto each of the partners, so as ensure its maximumutilisation. The profitability of these companies isensured by the two partners (REN and Enagás),through fixing of the annual price payable for eachunit of natural gas transported.The changes in the caption Interests in Joint Venturesin the years ended 31 December 2009 and 2008were as follows:
2009 2008
At 31 December 2008
Cost 420,120 505,248
Acumulated depreciation (91,440) (77,650)
Net book value (a) 328,680 427,598
Depreciation - (13,790)
Disposal - (85,128)
Transfer to tangible
fixed assets (328,680) -
(328,680) (98,918)
At 31 December 2009
Cost - 420,120
Acumulated depreciation - (91,440)
Net book value (a) - 328,680
(a) This amount was transfered to tangible fixed assets as of January 2009
10. Interests in joint ventures
2009 2008
1 January 2009 9,716 9,025
Gains 10,033 9,142
Dividends received (8,686) (8,451)
31 December 2009 11,063 9,716
142 | Accounts
Report and Accounts 2009
The assets and liabilities as of 31 December 2009,and revenue and costs generated since acquisition,as recognised in the non-consolidated accountsof the joint venture companies, are as follows:
The interest in the joint ventures was acquired underthe natural gas unbundling business, being part ofthe assets transferred to the group company RENGasodutos. At the date of acquisition, the fair value of the interest in these joint ventures corresponds to the pre-acquisition dividends (profit generated upto September 2006) receivable from the companies.The remaining amount of equity in the entities wasconsidered as nil, due to the fact that all the gainsgenerated by the entities after the coming into force of the tariff regulations will revert to the tariffs. The dividends received in 2009 refer to RENGasodutos's share of the profits generated by the companies in 2008, available for distribution.
The amounts of deferred tax assets and liabilitiesrecognised in the consolidated financial position as of 31 December 2009 are stated by their gross value.The effect of the changes in the deferred tax captionsin 2009 and 2008 was as follows:
2009 2008
Braga-Tuy Campo Maior-Leiria-Braga Braga-Tuy Campo Maior-Leiria-Braga
gas pipeline gas pipeline gas pipeline gas pipeline
Assets
Non current 13,695 70,148 14,420 73,873
Current 5,598 14,244 4,370 8,367
19,293 84,392 18,790 82,240
Liabilities
Non current 5,847 19,234 7,622 25,076
Current 6,333 24,075 4,283 17,481
12,180 43,309 11,905 42,557
Equity 7,113 41,083 6,885 39,683
7,113 41,083 6,885 39,683
Operations during the year
Revenue 3,767 27,710 3,828 24,960
Costs (2,430) (14,084) (2,660) (15,248)
Net profit 1,337 10,626 1,168 9,712
Direct % participation 51% 88% 51% 88%
682 9,351 595 8,546
2009 2008
Equity
Deferred income tax 21,090 7,389
Statement of profit and loss 21,090 7,389
Deferred income tax (18,863) 105,354
Current income tax (32,016) (149,906)
Total (Note 31) (50,878) (44,552)
11. Deferred tax assets and liabilities
Consolidated financial statements | 143
The changes in the deferred tax asset and liabilitycaptions in 2009 and 2008 were as follows:
2009 2008
Impact on the statement of profit and loss
Deferred income tax assets (6,782) 20,481
Deferred income tax liabilities (12,081) 84,873
(18,863) 105,354
Impact on equity
Deferred income tax assets (1,738) 6,250
Deferred income tax liabilities 22,828 1,139
21,090 7,389
Net impact of deferred income tax 2,227 112,744
Impact of the changes on deferred tax
Provisions Tax Pensions Investment Available- Tariff Others Total
losses properties -for-sale deviations
assets
At 1 January 2008 8,176 - 7,424 - - - 3,816 19,416
Increase/decrease through equity - - 5,290 - 960 - - 6,250
Reversal through profit and loss (23) - (737) - - - (111) (872)
Increase through profit and loss 7,436 23 - 11,580 - - 2,314 21,353
Changes in the year 7,413 23 4,553 11,580 960 - 2,203 26,731
At 31 December 2008 15,588 23 11,977 11,580 960 - 6,019 46,147
At 1 January 2009 15,588 23 11,977 11,580 960 - 6,019 46,147
Increase/decrease through equity - - 7.193 (5.551) (464) - (2,916) (1,738)
Reversal through profit and loss (14,185) - 540 - - - (1,011) (14,656)
Increase through profit and loss - 1,028 (1,201) (6,029) - 14,243 (167) 7,874
Changes in the year (14,185) 1,028 6,532 (11,580) (464) 14,243 (4,094) (8,520)
At 31 December 2009 1,402 1,051 18,509 (0) 496 14,243 1,925 37,627
Deferred tax assets - Changes in the years ended 31 December 2008 and 31 December 2009
144 | Accounts
Report and Accounts 2009
The tax revaluations result from updating the value ofassets in accordance with the Portuguese OfficialChart of Accounts based on legislation which defines
currency devaluation coefficients. The impact ondeferred income tax reflects the non tax deductibilityof 40% of the revaluation.
As agent Transmission Tariff Investments Revaluations Available- Others Total
equipment deviations properties -for-sale
assets
At 1 January 2008 109,647 18,369 - 10,691 38,451 1,139 48 178,345
Increase/decrease through equity - - - - - (1,139) - (1,139)
Increase through statement - 4,697 - - - - 232 4.929
of profit and loss
Decrease through statements (76,660) - - (10,691) (2,403) - (48) (89,802)
of profit and loss
Changes in the year (76,660) 4,697 - (10,691) (2,403) (1,139) 184 (86,012)
At 31 December 2008 32,987 23,066 - - 36,048 - 232 92,333
At 1 January 2009 32,987 23,066 - - 36,048 - 232 92,333
Increase/decrease through equity - (23,066) - - - - 238 (22,828)
Increase through statements - - 47,973 - - - - 47,973
of profit and loss
Decrease through statement (32,987) - - - (2,435) - (470) (35,892)
of profit and loss
Changes in the year (32,987) (23,066) 47,973 - (2,435) - (232) (10,747)
At 31 December 2009 0 - 47,973 - 33,613 - - 81,586
Deferred tax liabilities - Changes in the years ended 31 December 2008 and 31 December 2009
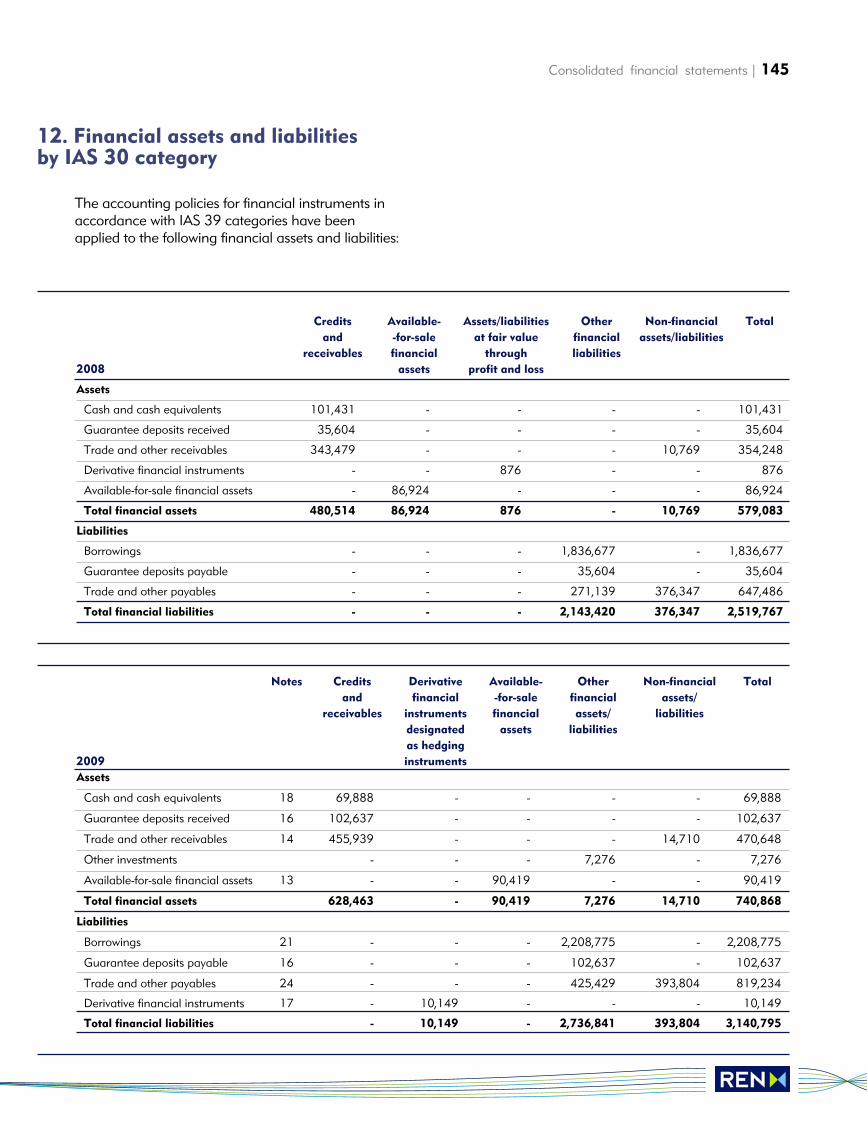
Consolidated financial statements | 145
The accounting policies for financial instruments inaccordance with IAS 39 categories have beenapplied to the following financial assets and liabilities:
12. Financial assets and liabilities by IAS 30 category
Credits Available- Assets/liabilities Other Non-financial Total
and -for-sale at fair value financial assets/liabilities
receivables financial through liabilities
2008 assets profit and loss
Assets
Cash and cash equivalents 101,431 - - - - 101,431
Guarantee deposits received 35,604 - - - - 35,604
Trade and other receivables 343,479 - - - 10,769 354,248
Derivative financial instruments - - 876 - - 876
Available-for-sale financial assets - 86,924 - - - 86,924
Total financial assets 480,514 86,924 876 - 10,769 579,083
Liabilities
Borrowings - - - 1,836,677 - 1,836,677
Guarantee deposits payable - - - 35,604 - 35,604
Trade and other payables - - - 271,139 376,347 647,486
Total financial liabilities - - - 2,143,420 376,347 2,519,767
Notes Credits Derivative Available- Other Non-financial Total
and financial -for-sale financial assets/
receivables instruments financial assets/ liabilities
designated assets liabilities
as hedging
2009 instruments
Assets
Cash and cash equivalents 18 69,888 - - - - 69,888
Guarantee deposits received 16 102,637 - - - - 102,637
Trade and other receivables 14 455,939 - - - 14,710 470,648
Other investments - - - 7,276 - 7,276
Available-for-sale financial assets 13 - - 90,419 - - 90,419
Total financial assets 628,463 - 90,419 7,276 14,710 740,868
Liabilities
Borrowings 21 - - - 2,208,775 - 2,208,775
Guarantee deposits payable 16 - - - 102,637 - 102,637
Trade and other payables 24 - - - 425,429 393,804 819,234
Derivative financial instruments 17 - 10,149 - - - 10,149
Total financial liabilities - 10,149 - 2,736,841 393,804 3,140,795
146 | Accounts
Report and Accounts 2009
In 2009 the Company reclassified the amount of 7,276 thousand Euros to the caption “Other investments”. This amount corresponds to theCompany's investment in the closed fund “LusoCarbon Fund”, with a maturity of 10 years.
Estimated fair value - assets measured at fair valueThe following table presents the Group's assets andliabilities measured at fair value at 31 December2009 in accordance with the following levels of fairvalue seniority in accordance with IFRS 7:
• Level 1: the fair value of financial instruments isbased on net liquid market prices as of the date ofthe balance sheet;
• Level 2: the fair value of financial instruments is not based on liquid market prices but rather on valuation models. The main inputs of the modelsused are taken from the market; and • Level 3: the fair value of financial instruments is not based on liquid market prices, but rather on valuation models, for which the main inputs arenot taken from the market.
Description Level 1 Level 2 Level 3 Total
Assets
Available-for-sale financial assets Shares 90,419 - - 90,419
Liabilities
Financial liabilities at fair Hedging
value recognised in reserves derivatives - (10,149) - (10,149)
Consolidated financial statements | 147
Quality of financial assetsThe credit quality of the financial assets that have not yet matured or are impaired can be valued by reference to external credit ratings or historicalinformation about the entities to which they refer:
Trade and other receivables refer mainly to regulatedelectricity and gas services rendered. The main transactions are carried out with authorised distributorsin each of the businesses, such as EDP, GALP andsome European distributors. In the area of overdue or impaired credits:
i) Trade and other receivable include an amount of 823 thousand Euros which have been adjusted for impairment, for which there is pending litigationprocess;ii) There are some fairly old credits relating to transactions with group companies, EDP for whichthe credit risk is considered as nil.
2009 2008
Trade and other receivables
AA- 85,382 124,478
A+ - -
A - -
A- - 52,963
Others without ratings 385,266 165,210
Total trade and other receivables 470,648 342,651
Cash and cash equivalents
AAA 1,940 -
AA 3,008 39
AA- 10 2,850
A+ 452 6
A 64,434 98,535
Without ratings 44
Total bank deposits 69,888 101,430
148 | Accounts
Report and Accounts 2009
The assets recognised in this caption at 31December 2009 correspond to equity instrumentsheld in strategic market entities in the Spanish elec-tricity market, as follows:
The changes in this caption in 2009 and 2008 are as follows:
As OMEL is not a listed company and there havebeen no recent market transactions with its shares,REN decided to maintain the financial asset at cost,as it has not been possible to determine its fair value.Red Eléctrica de España (“REE”) is the Spanish entityresponsible for managing the electricity network inSpain. REN, SGPS acquired a 1% participation in REE as part of an agreement between thePortuguese and Spanish Governments. REE is listedin Euronext - Spain and the financial asset wasrecorded on the balance sheet at the market price on31 December 2009, which resulted in the recognitionof a fair value gain of 3,818 thousand Euros.
ENAGÁS is the entity responsible for the transportand management of the natural gas system in Spain.REN, SGPS acquired a 1% participation in Enagás as part of a strategic partnership agreement, theasset having been recorded at the market priceat 31 December of 2009, which resulted in therecognition of a fair value loss of 322 thousand Euros.
13. Available for sale Financial assets
% owned Owner 2009 2008
OMEL - Operador del Mercado Ibérico de Energia (Polo Espanhol) 10.00% OMIP 1,033 1,033
Red Electrica de España, S.A. 1.00% REN, SGPS 52,551 48,733
ENAGAS 1.00% REN, SGPS 36,835 37,157
Total 90,419 86,924
OMEL REE ENAGAS Total
At 31 December 2007 1,033 58,534 - 59,568
Acquisitions - - 43,195 43,195
Fair value adjustment - (9,801) (6,038) (15,839)
At 31 December 2008 1,033 48,733 37,157 86,924
Fair value adjustment - 3,818 (322) 3,496
At 31 December 2009 1,033 52,551 36,835 90,419
Consolidated financial statements | 149
The adjustments to fair value of available-for-salefinancial assets are recognised in the equity caption“Fair value reserve” (Note 20):
In the year ended 31 December 2009 REE andEnagás distributed dividends of 1,732 and 1,554thousand Euros, respectively. These amounts wererecognized in the statement of profit and loss caption“Finance income”.
Trade and other receivables at 31 December 2009are made up as follows:
(i) The most significant amount in trade receivables isthe receivable from EDP - Distribuição de Energia, SAin the amount of 65,495 thousand Euros (52,963thousand Euros in 2008).(ii) The Agency balance refers to amounts receivableresulting from the REN's Group's intermediationactivity in the acquisition and sale of electricity. The variation in 2009 results from the transfer of thebalance to the caption “Tariff deviations”.(iii) The loans to joint ventures, refers to loans toSociedade Gasoduto Campo-Maior-Leiria-Bragaacquired in the unbundling transactions. The loanbears interest at the higher of the average cost of thedebts of REN Gasodutos' and Enagás.
There are no differences between the book value andfair value of trade and other receivables in the periodspresented. The non-current balances bear interest atmarket rates.As a result of the Group having adopted the policy of recognising tariff deviations on assets and liabilitiesin 2009 when they occur, at 31 December 2009 theGroup presented the amount of 181,031 thousandEuros in the caption “Trade and other receivables”and an account payable of 53,747 thousand Eurosin the caption “Trade and other payables” relating totariff deviations receivable to be delivered to the tariff,determined in the electricity and natural gas segments.
This change results from re-analysis of the degree ofprecision of the estimates made internally regardingtariff deviations, under the regulatory framework currentlyin force, which showed the reliability of the amountsestimated, as well as the virtual certain probability of the realization of these assets and settlement of the liabilities, and so this matter was considered as a change in estimates under IAS 8 (Note 3.20).
Fair value
adjustment
Gross fair value adjustment 3,496
Deferred income tax (Note 11) (464)
Net fair value adjustment in equity 3,032
2009 2008
Current Non current Total Current Non current Total
Trade and other receivables (i) 236,893 4,083 240,976 185,668 155 185,823
Impairment of trade receivables (823) - (823) (828) - (828)
Trade receivables net 236,070 4,083 240,153 184,840 155 184,995
Agent balance - - - 56,359 68,119 124,478
Tariff deviations (ii) 157,958 23,073 181,031 - - -
Loans to “joint ventures” (iii) 16,966 16,966 33,932 11,059 22,119 33,178
State and other public entities 15,533 - 15,533 11,597 - 11,597
Trade and other receivables 426,527 44,122 470,649 263,856 90,393 354,248
Trade and other receivables
14. Trade and other receivables
Inventories at 31 December 2009 and 2008 are made up as follows:
The increase in inventories in 2009 compared to2008, refers essentially to the acquisition of materialto be used in REN Gasodutos' projects in 2010.
Guarantee deposits refer to deposits given by the participants in the electricity derivatives market, operated by the group company OMIclear. Theseassets are considered as restricted cash as explainedin Note 3.13.The amounts recognized in the statement of financialposition as of 31 December 2009 and 2008 are asfollows:
At 31 December 2009 and 2008 the REN Group hadthe following derivative financial instruments contracted:
150 | Accounts
Report and Accounts 2009
15. Inventories
16. Guarantee deposits
17. Derivative financial instruments
2009 2008
Goods 226 260
Miscellaneous materials 23,563 8,104
Inventories 23,789 8,364
2009 2008
Cash deposits of participants 102,637 35,604
Amounts owed to participants (102,637) (35,604)
2009 2008
Assets Liabilities Assets Liabilities
Interest rate swaps - non-current - 10,149 - -
Interest rate swaps - current - - 876 -
- 10,149 876 -
Consolidated financial statements | 151
The amount recognised in interest rate swaps refersto 4 interest rate swap contracts, contracted by RENSGPS with the objective of reducing the risk to whichits bonds are exposed.The features of the swaps contracted at 31December 2009 are as follows:
Fair value of Carbon licences (CO2)REN has CO2 licence forward contracts negotiatedfor its own use, with the physical delivery in December2010, 2011 and 2012. Their fair value was revised at
31 December 2009 by application of the quotationsas of those dates known at 31 December 2009,it having been determined that the liability is not significant.
Reference value Payment periods Receipt/payment Maturity date Fair value
at 31 Dec 2009
200,000 mEuro Interest counting periods: REN receives Euribor April 2011payable: 26 June and December 1M and pays 1,681%
- interest settled half yearly:16 of each month
- interest settled annually
(3,927)
10,000,000,000 JPY Interest counting periods: REN receives 2,71% June 202472,899 mEuros payable: 16 de Abril and pays 5,64% /annual)
- interest settled monthly; up to June 2019 andreceivable: 26 June and December Euribor 6M + 190 b.p.
- interest settled half yearly from that date to maturity
(4,083)
50,000 mEuro Interest counting period: REN receives Euribor May 2012payable: 5 February, May, 3M and pays 2,1925%
August and November- interest settled quarterly;
receivable: 5 February, May,August, November and December
- interest settled quarterly
(576)
134,000 mEuro Interest payment periods: REN receives Euribor June 2012payable: 15 March, June, 3M and pays 2,275%September e December
- interest settled quarterlyreceivable: 15 March, June,September and December- interest settled quarterly
(1,563)
Total (10.149)
152 | Accounts
Report and Accounts 2009
The caption cash and cash equivalents at 31December 2009 and 2008 is made as follows:
The effective interest rates on short term bankdeposits are indicated in Note 21. The amounts considered as cash and cash equivalents in the consolidated statement of cashflows for the years ended 31 December 2009 and2008 are made up as follows:
REN's subscribed and paid up share capital at 31 December 2009 is made up of 534,000,000 sharesof 1 euro each.Share capital at 31 December 2009 is made up asfollows:
In 2009 REN acquired 1,382,672 treasury sharescorresponding to 0.2589% of its capital.At 31 December 2009 REN SGPS had the followingtreasury shares:
18. Cash and cash equivalents 19. Share capital
2009 2008
Cash 1 1
Bank deposits 69,887 101,430
69,888 101,431
2009 2008
Cash 1 1
Bank overdrafts (45,312) (41,023)
Bank deposits 69,887 101,429
Cash and cash equivalents 24,576 60,407
Number of shares Share capital
534,000,000 534,000
Capital 534,000,000 534,000
Number Share Amountof shares Capital
Treasury shares 3,881,374 0.7268% (10,728)
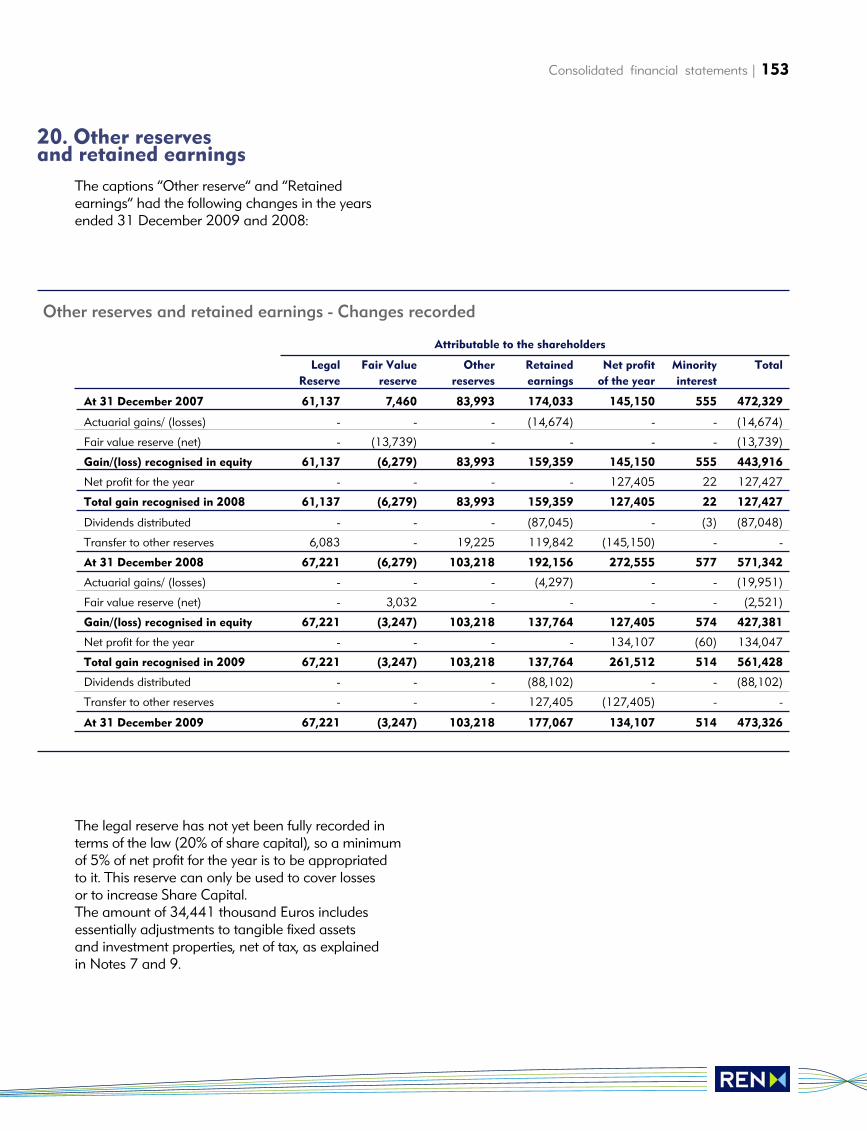
Consolidated financial statements | 153
The captions “Other reserve” and “Retained earnings” had the following changes in the yearsended 31 December 2009 and 2008:
The legal reserve has not yet been fully recorded interms of the law (20% of share capital), so a minimumof 5% of net profit for the year is to be appropriatedto it. This reserve can only be used to cover losses or to increase Share Capital. The amount of 34,441 thousand Euros includesessentially adjustments to tangible fixed assets and investment properties, net of tax, as explained in Notes 7 and 9.
20. Other reserves and retained earnings
Attributable to the shareholders
Legal Fair Value Other Retained Net profit Minority Total
Reserve reserve reserves earnings of the year interest
At 31 December 2007 61,137 7,460 83,993 174,033 145,150 555 472,329
Actuarial gains/ (losses) - - - (14,674) - - (14,674)
Fair value reserve (net) - (13,739) - - - - (13,739)
Gain/(loss) recognised in equity 61,137 (6,279) 83,993 159,359 145,150 555 443,916
Net profit for the year - - - - 127,405 22 127,427
Total gain recognised in 2008 61,137 (6,279) 83,993 159,359 127,405 22 127,427
Dividends distributed - - - (87,045) - (3) (87,048)
Transfer to other reserves 6,083 - 19,225 119,842 (145,150) - -
At 31 December 2008 67,221 (6,279) 103,218 192,156 272,555 577 571,342
Actuarial gains/ (losses) - - - (4,297) - - (19,951)
Fair value reserve (net) - 3,032 - - - - (2,521)
Gain/(loss) recognised in equity 67,221 (3,247) 103,218 137,764 127,405 574 427,381
Net profit for the year - - - - 134,107 (60) 134,047
Total gain recognised in 2009 67,221 (3,247) 103,218 137,764 261,512 514 561,428
Dividends distributed - - - (88,102) - - (88,102)
Transfer to other reserves - - - 127,405 (127,405) - -
At 31 December 2009 67,221 (3,247) 103,218 177,067 134,107 514 473,326
Other reserves and retained earnings - Changes recorded
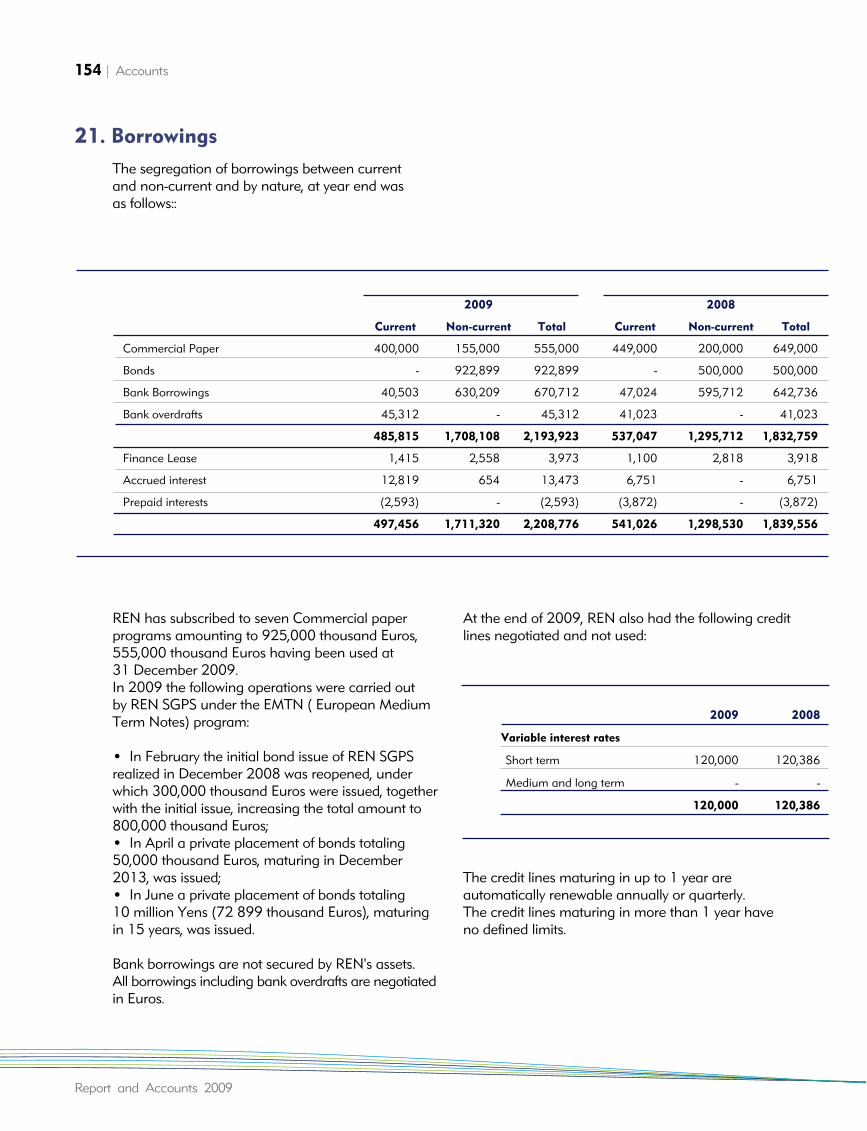
154 | Accounts
Report and Accounts 2009
The segregation of borrowings between current and non-current and by nature, at year end wasas follows::
REN has subscribed to seven Commercial paper programs amounting to 925,000 thousand Euros, 555,000 thousand Euros having been used at31 December 2009.In 2009 the following operations were carried out by REN SGPS under the EMTN ( European MediumTerm Notes) program:
• In February the initial bond issue of REN SGPSrealized in December 2008 was reopened, underwhich 300,000 thousand Euros were issued, togetherwith the initial issue, increasing the total amount to800,000 thousand Euros; • In April a private placement of bonds totaling50,000 thousand Euros, maturing in December2013, was issued;• In June a private placement of bonds totaling 10 million Yens (72 899 thousand Euros), maturingin 15 years, was issued.
Bank borrowings are not secured by REN's assets. All borrowings including bank overdrafts are negotiatedin Euros.
At the end of 2009, REN also had the following creditlines negotiated and not used:
The credit lines maturing in up to 1 year areautomatically renewable annually or quarterly. The credit lines maturing in more than 1 year haveno defined limits.
21. Borrowings
2009 2008
Current Non-current Total Current Non-current Total
Commercial Paper 400,000 155,000 555,000 449,000 200,000 649,000
Bonds - 922,899 922,899 - 500,000 500,000
Bank Borrowings 40,503 630,209 670,712 47,024 595,712 642,736
Bank overdrafts 45,312 - 45,312 41,023 - 41,023
485,815 1,708,108 2,193,923 537,047 1,295,712 1,832,759
Finance Lease 1,415 2,558 3,973 1,100 2,818 3,918
Accrued interest 12,819 654 13,473 6,751 - 6,751
Prepaid interests (2,593) - (2,593) (3,872) - (3,872)
497,456 1,711,320 2,208,776 541,026 1,298,530 1,839,556
2009 2008
Variable interest rates
Short term 120,000 120,386
Medium and long term - -
120,000 120,386
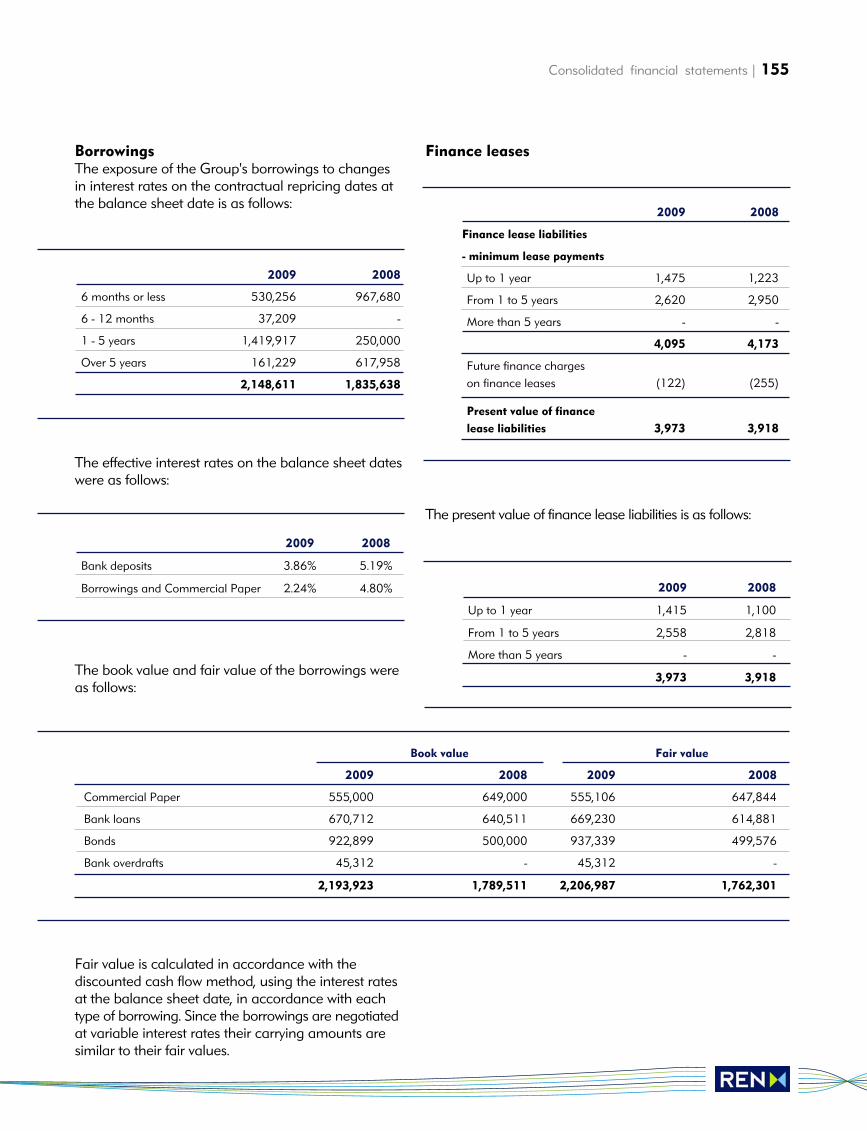
Consolidated financial statements | 155
BorrowingsThe exposure of the Group's borrowings to changesin interest rates on the contractual repricing dates atthe balance sheet date is as follows:
The effective interest rates on the balance sheet dateswere as follows:
The book value and fair value of the borrowings wereas follows:
Fair value is calculated in accordance with the discounted cash flow method, using the interest ratesat the balance sheet date, in accordance with eachtype of borrowing. Since the borrowings are negotiatedat variable interest rates their carrying amounts aresimilar to their fair values.
Finance leases
The present value of finance lease liabilities is as follows:
2009 2008
6 months or less 530,256 967,680
6 - 12 months 37,209 -
1 - 5 years 1,419,917 250,000
Over 5 years 161,229 617,958
2,148,611 1,835,638
2009 2008
Bank deposits 3.86% 5.19%
Borrowings and Commercial Paper 2.24% 4.80%
Book value Fair value
2009 2008 2009 2008
Commercial Paper 555,000 649,000 555,106 647,844
Bank loans 670,712 640,511 669,230 614,881
Bonds 922,899 500,000 937,339 499,576
Bank overdrafts 45,312 - 45,312 -
2,193,923 1,789,511 2,206,987 1,762,301
2009 2008
Finance lease liabilities
- minimum lease payments
Up to 1 year 1,475 1,223
From 1 to 5 years 2,620 2,950
More than 5 years - -
4,095 4,173
Future finance chargeson finance leases (122) (255)
Present value of finance
lease liabilities 3,973 3,918
2009 2008
Up to 1 year 1,415 1,100
From 1 to 5 years 2,558 2,818
More than 5 years - -
3,973 3,918
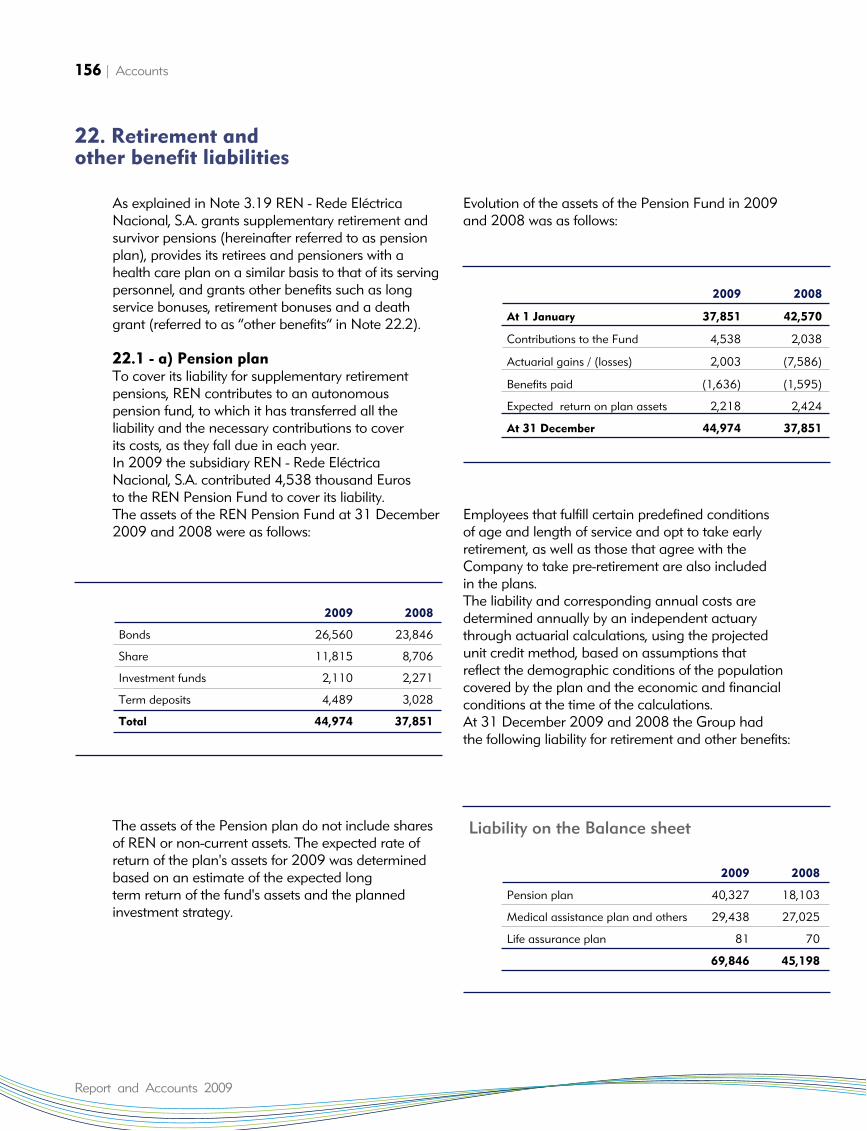
156 | Accounts
Report and Accounts 2009
As explained in Note 3.19 REN - Rede EléctricaNacional, S.A. grants supplementary retirement andsurvivor pensions (hereinafter referred to as pensionplan), provides its retirees and pensioners with ahealth care plan on a similar basis to that of its servingpersonnel, and grants other benefits such as longservice bonuses, retirement bonuses and a deathgrant (referred to as “other benefits” in Note 22.2).
22.1 - a) Pension plan To cover its liability for supplementary retirement pensions, REN contributes to an autonomous pension fund, to which it has transferred all the liability and the necessary contributions to cover its costs, as they fall due in each year.In 2009 the subsidiary REN - Rede EléctricaNacional, S.A. contributed 4,538 thousand Euros to the REN Pension Fund to cover its liability.The assets of the REN Pension Fund at 31 December2009 and 2008 were as follows:
The assets of the Pension plan do not include sharesof REN or non-current assets. The expected rate ofreturn of the plan's assets for 2009 was determinedbased on an estimate of the expected longterm return of the fund's assets and the planned investment strategy.
Evolution of the assets of the Pension Fund in 2009and 2008 was as follows:
Employees that fulfill certain predefined conditionsof age and length of service and opt to take earlyretirement, as well as those that agree with theCompany to take pre-retirement are also included in the plans.The liability and corresponding annual costs aredetermined annually by an independent actuarythrough actuarial calculations, using the projectedunit credit method, based on assumptions that reflect the demographic conditions of the population covered by the plan and the economic and financialconditions at the time of the calculations.At 31 December 2009 and 2008 the Group had the following liability for retirement and other benefits:
22. Retirement and other benefit liabilities
2009 2008
Bonds 26,560 23,846
Share 11,815 8,706
Investment funds 2,110 2,271
Term deposits 4,489 3,028
Total 44,974 37,851
2009 2008
At 1 January 37,851 42,570
Contributions to the Fund 4,538 2,038
Actuarial gains / (losses) 2,003 (7,586)
Benefits paid (1,636) (1,595)
Expected return on plan assets 2,218 2,424
At 31 December 44,974 37,851
2009 2008
Pension plan 40,327 18,103
Medical assistance plan and others 29,438 27,025
Life assurance plan 81 70
69,846 45,198
Liability on the Balance sheet
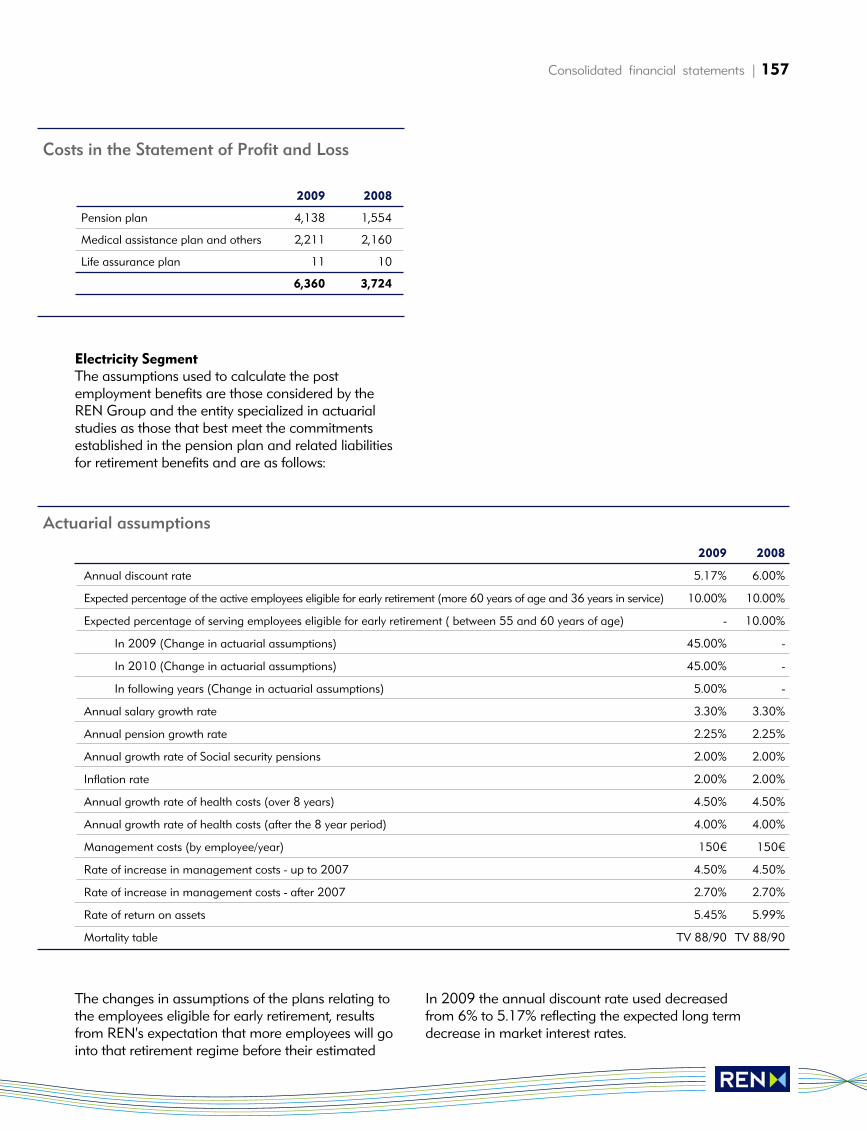
Consolidated financial statements | 157
Electricity Segment The assumptions used to calculate the post employment benefits are those considered by theREN Group and the entity specialized in actuarialstudies as those that best meet the commitmentsestablished in the pension plan and related liabilitiesfor retirement benefits and are as follows:
The changes in assumptions of the plans relating tothe employees eligible for early retirement, resultsfrom REN's expectation that more employees will gointo that retirement regime before their estimated
In 2009 the annual discount rate used decreasedfrom 6% to 5.17% reflecting the expected long termdecrease in market interest rates.
2009 2008
Pension plan 4,138 1,554
Medical assistance plan and others 2,211 2,160
Life assurance plan 11 10
6,360 3,724
Costs in the Statement of Profit and Loss
2009 2008
Annual discount rate 5.17% 6.00%
Expected percentage of the active employees eligible for early retirement (more 60 years of age and 36 years in service) 10.00% 10.00%
Expected percentage of serving employees eligible for early retirement ( between 55 and 60 years of age) - 10.00%
In 2009 (Change in actuarial assumptions) 45.00% -
In 2010 (Change in actuarial assumptions) 45.00% -
In following years (Change in actuarial assumptions) 5.00% -
Annual salary growth rate 3.30% 3.30%
Annual pension growth rate 2.25% 2.25%
Annual growth rate of Social security pensions 2.00% 2.00%
Inflation rate 2.00% 2.00%
Annual growth rate of health costs (over 8 years) 4.50% 4.50%
Annual growth rate of health costs (after the 8 year period) 4.00% 4.00%
Management costs (by employee/year) 150€ 150€
Rate of increase in management costs - up to 2007 4.50% 4.50%
Rate of increase in management costs - after 2007 2.70% 2.70%
Rate of return on assets 5.45% 5.99%
Mortality table TV 88/90 TV 88/90
Actuarial assumptions
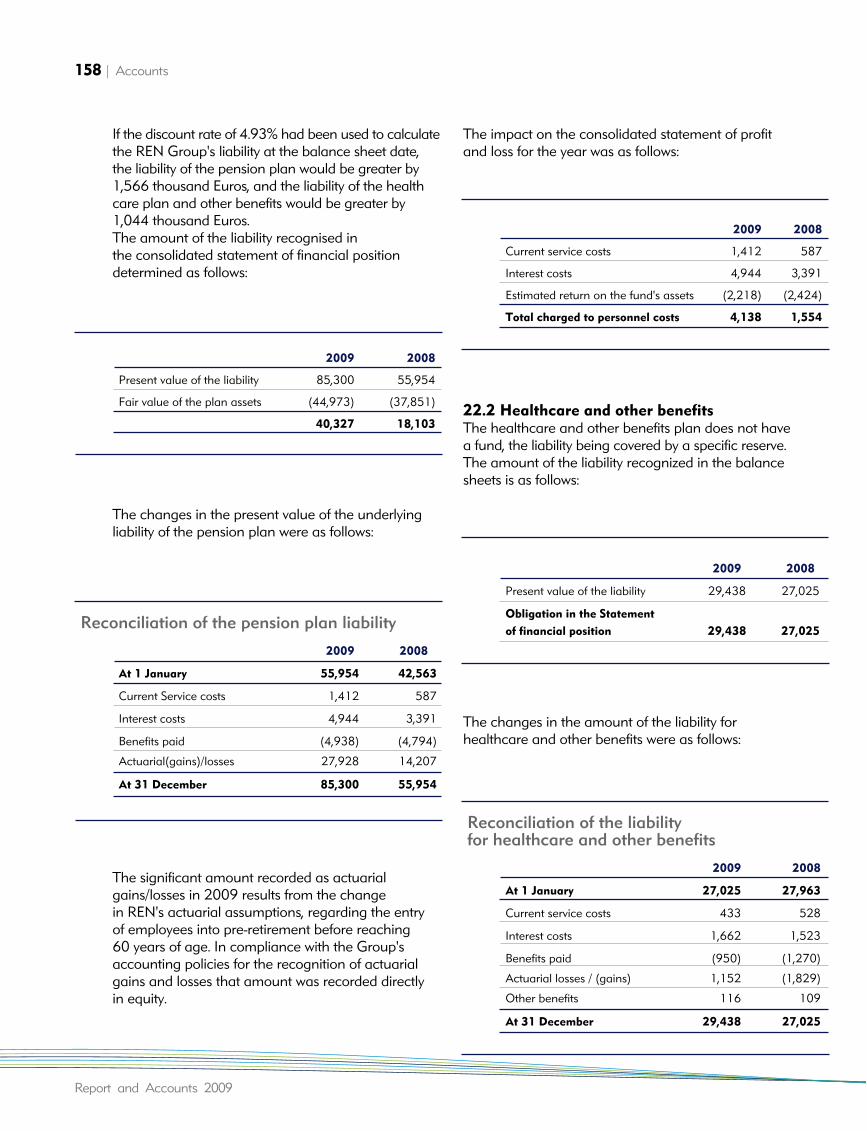
158 | Accounts
Report and Accounts 2009
If the discount rate of 4.93% had been used to calculatethe REN Group's liability at the balance sheet date,the liability of the pension plan would be greater by1,566 thousand Euros, and the liability of the healthcare plan and other benefits would be greater by1,044 thousand Euros. The amount of the liability recognised in the consolidated statement of financial position determined as follows:
The changes in the present value of the underlyingliability of the pension plan were as follows:
The significant amount recorded as actuarialgains/losses in 2009 results from the change in REN's actuarial assumptions, regarding the entry of employees into pre-retirement before reaching 60 years of age. In compliance with the Group'saccounting policies for the recognition of actuarialgains and losses that amount was recorded directly in equity.
The impact on the consolidated statement of profitand loss for the year was as follows:
22.2 Healthcare and other benefits The healthcare and other benefits plan does not havea fund, the liability being covered by a specific reserve.The amount of the liability recognized in the balancesheets is as follows:
The changes in the amount of the liability for healthcare and other benefits were as follows:
2009 2008
Present value of the liability 85,300 55,954
Fair value of the plan assets (44,973) (37,851)
40,327 18,103
2009 2008
At 1 January 55,954 42,563
Current Service costs 1,412 587
Interest costs 4,944 3,391
Benefits paid (4,938) (4,794)
Actuarial(gains)/losses 27,928 14,207
At 31 December 85,300 55,954
Reconciliation of the pension plan liability
2009 2008
Current service costs 1,412 587
Interest costs 4,944 3,391
Estimated return on the fund's assets (2,218) (2,424)
Total charged to personnel costs 4,138 1,554
2009 2008
Present value of the liability 29,438 27,025
Obligation in the Statement
of financial position 29,438 27,025
2009 2008
At 1 January 27,025 27,963
Current service costs 433 528
Interest costs 1,662 1,523
Benefits paid (950) (1,270)
Actuarial losses / (gains) 1,152 (1,829)
Other benefits 116 109
At 31 December 29,438 27,025
Reconciliation of the liability for healthcare and other benefits
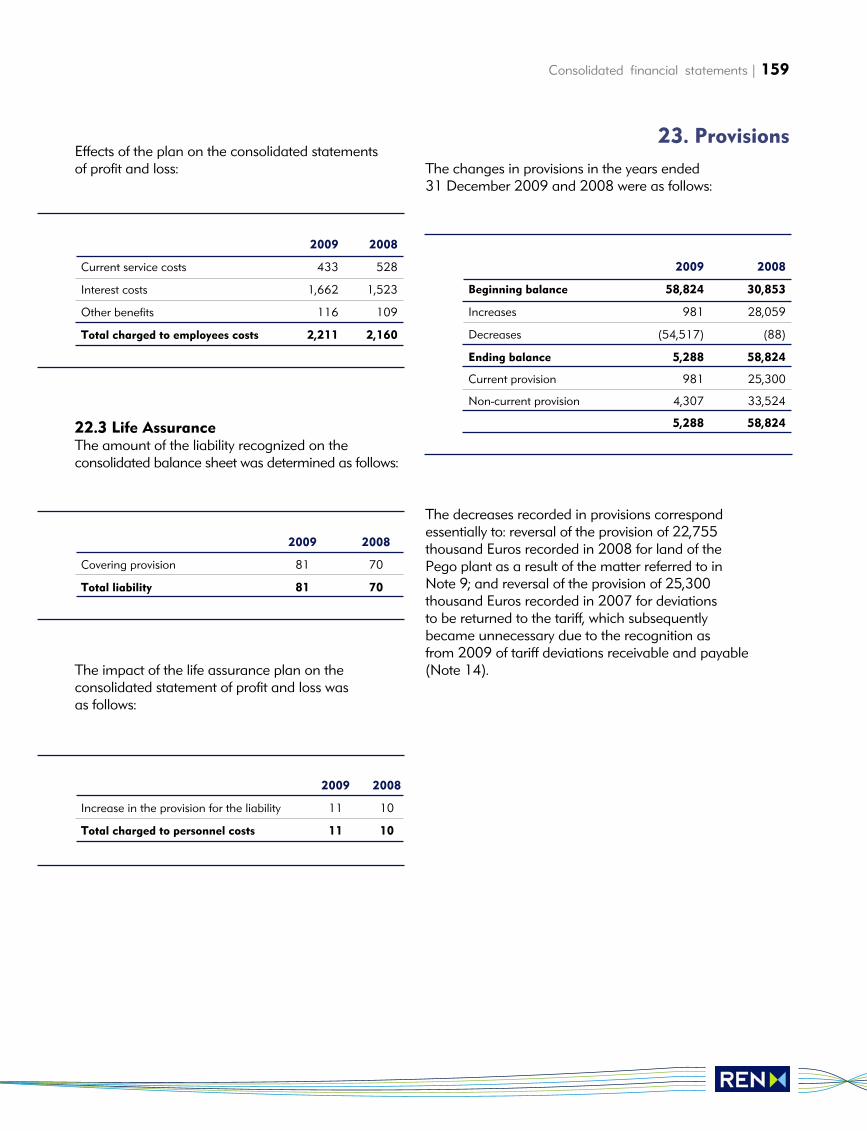
Consolidated financial statements | 159
Effects of the plan on the consolidated statementsof profit and loss:
22.3 Life AssuranceThe amount of the liability recognized on the consolidated balance sheet was determined as follows:
The impact of the life assurance plan on the consolidated statement of profit and loss was as follows:
The changes in provisions in the years ended31 December 2009 and 2008 were as follows:
The decreases recorded in provisions correspondessentially to: reversal of the provision of 22,755thousand Euros recorded in 2008 for land of thePego plant as a result of the matter referred to inNote 9; and reversal of the provision of 25,300thousand Euros recorded in 2007 for deviations to be returned to the tariff, which subsequentlybecame unnecessary due to the recognition as from 2009 of tariff deviations receivable and payable(Note 14).
2009 2008
Current service costs 433 528
Interest costs 1,662 1,523
Other benefits 116 109
Total charged to employees costs 2,211 2,160
2009 2008
Covering provision 81 70
Total liability 81 70
2009 2008
Increase in the provision for the liability 11 10
Total charged to personnel costs 11 10
2009 2008
Beginning balance 58,824 30,853
Increases 981 28,059
Decreases (54,517) (88)
Ending balance 5,288 58,824
Current provision 981 25,300
Non-current provision 4,307 33,524
5,288 58,824
23. Provisions
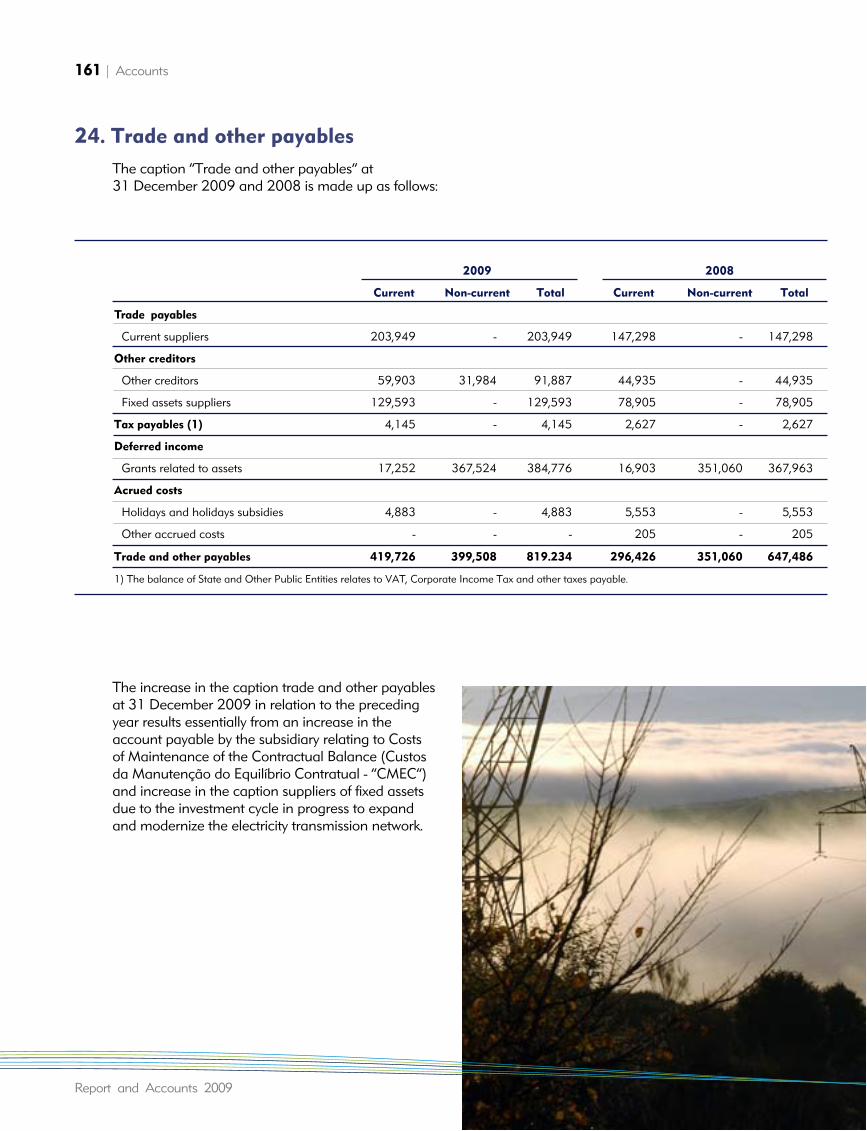
161 | Accounts
Report and Accounts 2009
The caption “Trade and other payables” at 31 December 2009 and 2008 is made up as follows:
The increase in the caption trade and other payablesat 31 December 2009 in relation to the precedingyear results essentially from an increase in theaccount payable by the subsidiary relating to Costs of Maintenance of the Contractual Balance (Custosda Manutenção do Equilíbrio Contratual - “CMEC”)and increase in the caption suppliers of fixed assetsdue to the investment cycle in progress to expandand modernize the electricity transmission network.
24. Trade and other payables
2009 2008
Current Non-current Total Current Non-current Total
Trade payables
Current suppliers 203,949 - 203,949 147,298 - 147,298
Other creditors
Other creditors 59,903 31,984 91,887 44,935 - 44,935
Fixed assets suppliers 129,593 - 129,593 78,905 - 78,905
Tax payables (1) 4,145 - 4,145 2,627 - 2,627
Deferred income
Grants related to assets 17,252 367,524 384,776 16,903 351,060 367,963
Acrued costs
Holidays and holidays subsidies 4,883 - 4,883 5,553 - 5,553
Other accrued costs - - - 205 - 205
Trade and other payables 419,726 399,508 819.234 296,426 351,060 647,486
1) The balance of State and Other Public Entities relates to VAT, Corporate Income Tax and other taxes payable.
Consolidated Financial Statements | 161
Sales and services rendered recognized in theconsolidated statement of profit and loss is made up as follows:
External supplies and services are made up as follows:
25. Sales and services rendered 26. External supplies and services
2009 2008
Sale of goods
Domestic market 1,298 437
1,298 437
Services rendered
Electricity transmission and
overall systems management 362,438 339,981
Natural gas transmission 122,702 100,159
Regasification 38,610 33,763
Underground gas storage 15,428 7,883
Telecommunications network 3,768 3,492
Trading 3,097 5,409
Electricity services 1,479 181
Others 2,658 3,126
550,179 493,994
Total sale of goods and
services rendered 551,478 494,431
2009 2008
Subcontracts and transport of gas 23,239 23,122
Maintenance costs 22,059 17,097
Fees relating to external entities ii) 14,264 16,095
Cross border interconnection costs 5,894 6,293
Electric energy costs 4,203 4,070
Insurance costs 2,817 2,940
Reserve capacity costs i) 1,529 1,502
Publicity and promotional expenses 1,470 1,428
Other (less than 1,000 thousand Euros) 3,261 6,342
External supplies and servicess 78,735 78,889
i)Excess capacity costs correspond to costs incurred by REN relating to production available required from producers, tomaintain the system operational at all times. These costs arerecorded in the overall management of the system activities inaccordance with the regulatory model currently in force.ii) The fees paid to external entities refer to specialized work andfees paid by REN for contracted services and specialized studies.
162 | Accounts
Report and Accounts 2009
Employee compensation and benefits expense in theyears ended 31 December 2009 and 2008 were asfollows:
The average number of employees in the Group in2009 was 798 (817 in 2008).
Other operating expenses are made up as follows:
27. Personnel costs 28. Other operating expenses
2009 2008
Remuneration
Board of directors 4,193 4,394
Personnel 22,492 25,208
26,686 29,602
Social charges
Post-employment and other
benefits cost 6,360 3,724
Performance bonuses 4,004 3,815
Charges on remunerations 7,453 7,314
Social support costs 2,218 2,130
Other 1,318 3,155
Sub-total 21,353 20,138
Personnel costs 48,038 49,740
2009 2008
Excess CAE costs not terminated ii) (89,096) (69,004)
ERSE operating costs i) (9,723) (9,463)
Donations (1,722) (1,007)
Taxes (744) (1,224)
Market operations costs
OMIP/Omiclear (884) (285)
Dismantling of power lines (229) (1,008)
Sales of tangibles (134) (28)
Loss on inventories (46) (64)
Others (1,174) (1,463)
(103,751) (83,545)
i) The caption ERSE operating costs correspond to amounts debited by ERSE, to be recovered through electricity and gastariffs.ii) The Overall Management of the System tariff includes, in the revenue of REN Rede Eléctrica Nacional, S.A., the excesscosts of the CAE not terminated, that is, the tariff covers the difference which REN Trading determines between the fixedand variable costs incurred with the two CAE's and the amountof the sale of electricity placed on the market. The amountincluded “Other operating expenses” refers to costs incurred by REN Trading relating to the CAE's still in force withTurbogás and Tejo Energia.
Consolidated Financial Statements | 163
Other operating expenses are made up as follows:
Finance costs and income (including dividendsreceived) are made up as follows:
Income tax calculated at the normal rate and impact recognized in the caption income tax in the statement of profit and loss are as follows:
The tax rate used to value the tax differences at 31 December 2009 is 26.5% (in 2008: 26.5%).
2009 2008
Amortisation of investment subsidies 17,252 14,658
Interconnection income - coverage of costs i) 5,458 8,324
Supplementary income 867 952
Rent from investment properties ii) - 9,450
Receipt of land deficits 99-2003 iii) - 67,152
Others 2,232 3,242
25,809 103,778
i)The amount recognized as “interconnection income” results from the decision taken by ERSE, to allocate part of the rent received to cover the cost of cross border connections incurred in the year, recognized in “External supplies and services”.ii) Income from buildings and land classified as investment properties as well as the lease of some equipment. In 2009, considering the reclassification made of assets included in this caption, being treated the same way as the other concession assets, the income determined is included in the caption “Sales and services rendered”. iii) The receipt of the tariff deficit in April 2008, gave rise to income of 67 152 thousand Euros resulting from the difference between the amount of the write-off of due to realization of the land (85 128 thousand Euros) and the amount of the deficit received (152 ,279 thousand Euros).
29. Other operating income
30. Finance costs and income 31. Income tax
2009 2008
Interest expense
Borrowings 75,970 90,338
75,970 90,338
Finance costs
Interest income 2,308 22,120
Liquidation of swaps 5,795 876
Dividends received
from investments 3,338 2,367
Finance income 11,441 25,363
2009 2008
Current income tax 32,016 149,906
Deferred income tax 18,863 (105,354)
Income tax (Note 11) 50,878 44,552
164 | Accounts
Report and Accounts 2009
The reconciliation between the nominal tax rateand the effective tax rate is as follows:
The tax rate used to determine the amount of tax onthe consolidated financial statements was as follows:
Earnings per share for the years ended 31 December2009 and 2008 were calculated as follows:
Dividends paid in 2009 and 2008 amounted to88,102 thousand Euros (0.165 Euros per share) and 87,064 thousand Euros (0.163 Euros per share),respectively.
The commitments assumed relating to investmentscontracted and not yet realized by the REN Group at 31 December 2009 and 2008 were as follows:
There are commitments relating to rights of way in the gas and electricity segments, that have not yet been quantified, the cost of which will be allocatedexclusively to investments in progress.
2009 2008
Consolidated profit before
income tax 184,925 171,980
Tax rate 26.5% 26.5%
49,005 45,575
Non deductible costs 6,018 808
Non taxable income (3,357) (3,171)
Loss generated on deferred tax (1,251) 1,317
Effect of correcting deferred tax - (460)
Autonomous taxation 464 483
Income tax 50,878 44,552
Current income tax 32,016 149,906
Deferred income tax 18,863 (105,354)
Income tax 50,878 44,552
Effective tax rate 27.5% 25.9%
2009 2008
Income tax rate 25.00% 25.00%
Municipal surcharge 1.50% 1.50%
26.50% 26.50%
32. Earnings per share
2009 2008
Consolidated net profit used to calculate earnings per share (1) 134,047 127,427
Number of ordinary shares outstanding during the period (Note 20) (2) 534,000,000 534,000,000
Effect of treasury shares 3,166,532 477,322
(3) 530,833,468 533,522,678
Basic earnings per shared (euro per share) (1) / (3) 0.25 0.24
33. Dividends per share
34. Commitments
2009 2008
Power lines 122,015 27,992
Substations 185,186 159,022
Gas pipelines 6,658 -
Sines Terminal 133,704 -
Underground gas storage 741 -
448,304 187,014
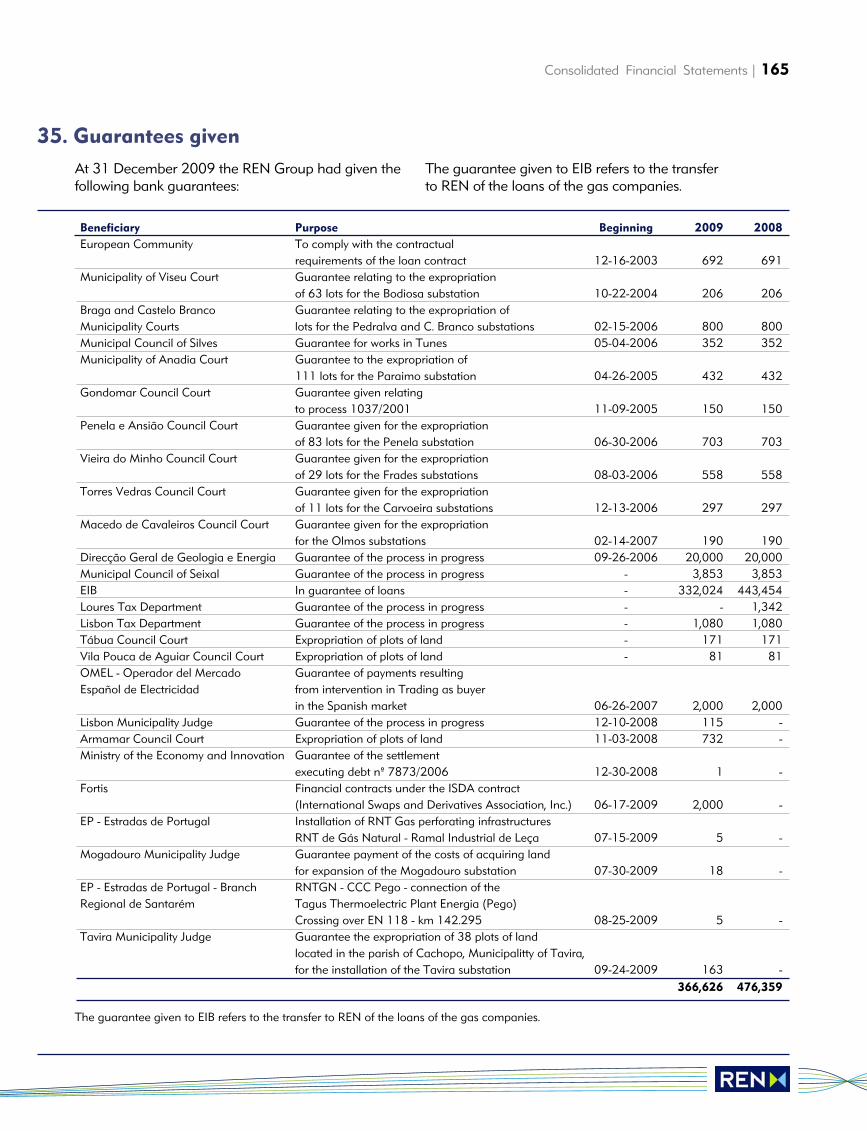
Consolidated Financial Statements | 165
At 31 December 2009 the REN Group had given thefollowing bank guarantees:
The guarantee given to EIB refers to the transfer to REN of the loans of the gas companies.
35. Guarantees given
Beneficiary Purpose Beginning 2009 2008
European Community To comply with the contractual requirements of the loan contract 12-16-2003 692 691
Municipality of Viseu Court Guarantee relating to the expropriationof 63 lots for the Bodiosa substation 10-22-2004 206 206
Braga and Castelo Branco Guarantee relating to the expropriation ofMunicipality Courts lots for the Pedralva and C. Branco substations 02-15-2006 800 800Municipal Council of Silves Guarantee for works in Tunes 05-04-2006 352 352Municipality of Anadia Court Guarantee to the expropriation of
111 lots for the Paraimo substation 04-26-2005 432 432Gondomar Council Court Guarantee given relating
to process 1037/2001 11-09-2005 150 150Penela e Ansião Council Court Guarantee given for the expropriation
of 83 lots for the Penela substation 06-30-2006 703 703Vieira do Minho Council Court Guarantee given for the expropriation
of 29 lots for the Frades substations 08-03-2006 558 558Torres Vedras Council Court Guarantee given for the expropriation
of 11 lots for the Carvoeira substations 12-13-2006 297 297Macedo de Cavaleiros Council Court Guarantee given for the expropriation
for the Olmos substations 02-14-2007 190 190Direcção Geral de Geologia e Energia Guarantee of the process in progress 09-26-2006 20,000 20,000Municipal Council of Seixal Guarantee of the process in progress - 3,853 3,853EIB In guarantee of loans - 332,024 443,454Loures Tax Department Guarantee of the process in progress - - 1,342Lisbon Tax Department Guarantee of the process in progress - 1,080 1,080Tábua Council Court Expropriation of plots of land - 171 171Vila Pouca de Aguiar Council Court Expropriation of plots of land - 81 81OMEL - Operador del Mercado Guarantee of payments resulting Español de Electricidad from intervention in Trading as buyer
in the Spanish market 06-26-2007 2,000 2,000Lisbon Municipality Judge Guarantee of the process in progress 12-10-2008 115 -Armamar Council Court Expropriation of plots of land 11-03-2008 732 -Ministry of the Economy and Innovation Guarantee of the settlement
executing debt nº 7873/2006 12-30-2008 1 -Fortis Financial contracts under the ISDA contract
(International Swaps and Derivatives Association, Inc.) 06-17-2009 2,000 -EP - Estradas de Portugal Installation of RNT Gas perforating infrastructures
RNT de Gás Natural - Ramal Industrial de Leça 07-15-2009 5 -Mogadouro Municipality Judge Guarantee payment of the costs of acquiring land
for expansion of the Mogadouro substation 07-30-2009 18 -EP - Estradas de Portugal - Branch RNTGN - CCC Pego - connection of the Regional de Santarém Tagus Thermoelectric Plant Energia (Pego)
Crossing over EN 118 - km 142.295 08-25-2009 5 -Tavira Municipality Judge Guarantee the expropriation of 38 plots of land
located in the parish of Cachopo, Municipalitty of Tavira,for the installation of the Tavira substation 09-24-2009 163 -
366,626 476,359
The guarantee given to EIB refers to the transfer to REN of the loans of the gas companies.
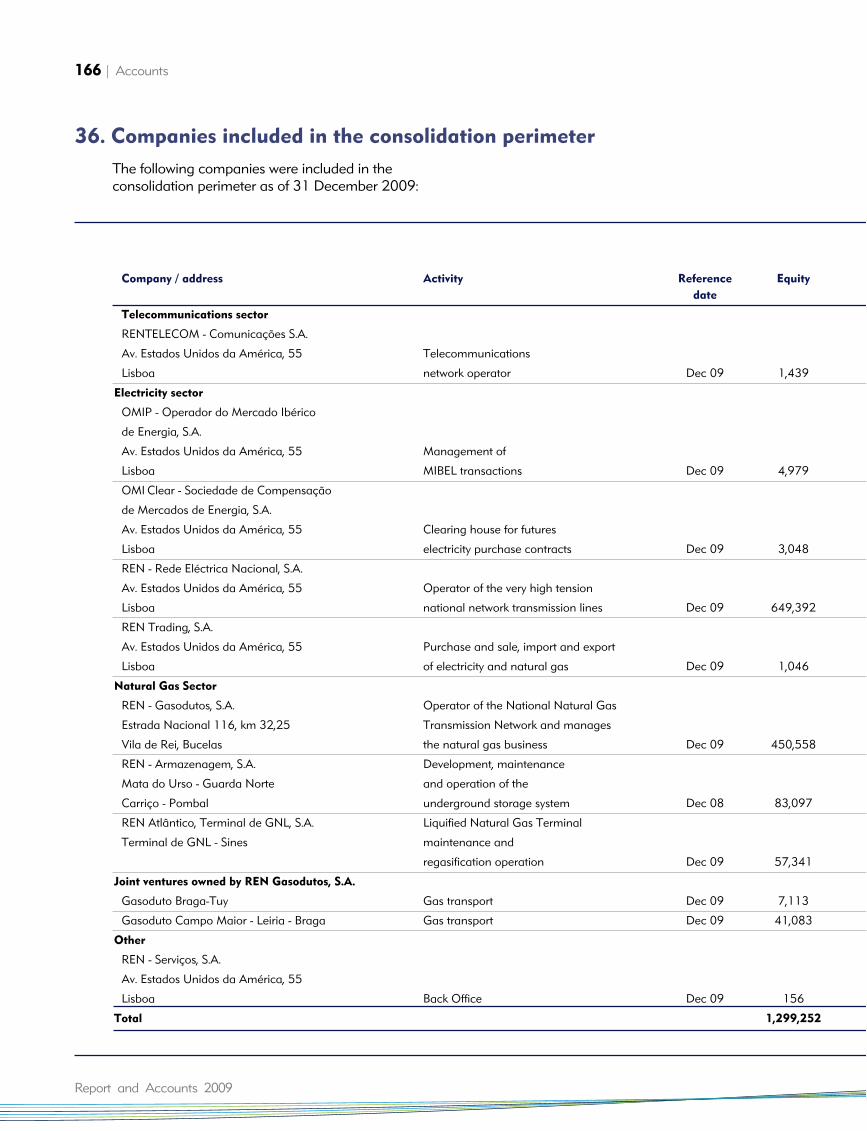
166 | Accounts
Report and Accounts 2009
The following companies were included in theconsolidation perimeter as of 31 December 2009:
36. Companies included in the consolidation perimeter
Company / address Activity Reference Equity
date
Telecommunications sector
RENTELECOM - Comunicações S.A.
Av. Estados Unidos da América, 55 Telecommunications
Lisboa network operator Dec 09 1,439
Electricity sector
OMIP - Operador do Mercado Ibérico
de Energia, S.A.
Av. Estados Unidos da América, 55 Management of
Lisboa MIBEL transactions Dec 09 4,979
OMI Clear - Sociedade de Compensação
de Mercados de Energia, S.A.
Av. Estados Unidos da América, 55 Clearing house for futures
Lisboa electricity purchase contracts Dec 09 3,048
REN - Rede Eléctrica Nacional, S.A.
Av. Estados Unidos da América, 55 Operator of the very high tension
Lisboa national network transmission lines Dec 09 649,392
REN Trading, S.A.
Av. Estados Unidos da América, 55 Purchase and sale, import and export
Lisboa of electricity and natural gas Dec 09 1,046
Natural Gas Sector
REN - Gasodutos, S.A. Operator of the National Natural Gas
Estrada Nacional 116, km 32,25 Transmission Network and manages
Vila de Rei, Bucelas the natural gas business Dec 09 450,558
REN - Armazenagem, S.A. Development, maintenance
Mata do Urso - Guarda Norte and operation of the
Carriço - Pombal underground storage system Dec 08 83,097
REN Atlântico, Terminal de GNL, S.A. Liquified Natural Gas Terminal
Terminal de GNL - Sines maintenance and
regasification operation Dec 09 57,341
Joint ventures owned by REN Gasodutos, S.A.
Gasoduto Braga-Tuy Gas transport Dec 09 7,113
Gasoduto Campo Maior - Leiria - Braga Gas transport Dec 09 41,083
Other
REN - Serviços, S.A.
Av. Estados Unidos da América, 55
Lisboa Back Office Dec 09 156
Total 1,299,252
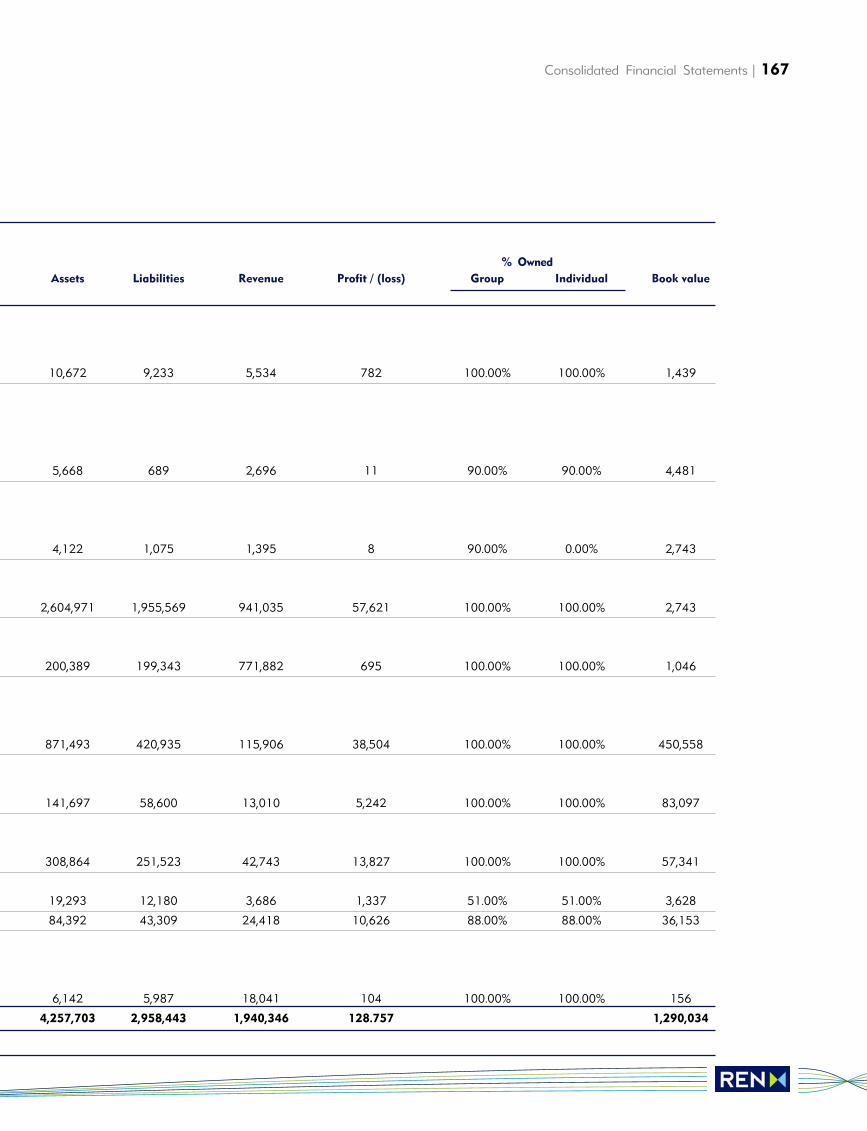
Consolidated Financial Statements | 167
% OwnedAssets Liabilities Revenue Profit / (loss) Group Individual Book value
10,672 9,233 5,534 782 100.00% 100.00% 1,439
5,668 689 2,696 11 90.00% 90.00% 4,481
4,122 1,075 1,395 8 90.00% 0.00% 2,743
2,604,971 1,955,569 941,035 57,621 100.00% 100.00% 2,743
200,389 199,343 771,882 695 100.00% 100.00% 1,046
871,493 420,935 115,906 38,504 100.00% 100.00% 450,558
141,697 58,600 13,010 5,242 100.00% 100.00% 83,097
308,864 251,523 42,743 13,827 100.00% 100.00% 57,341
19,293 12,180 3,686 1,337 51.00% 51.00% 3,628
84,392 43,309 24,418 10,626 88.00% 88.00% 36,153
6,142 5,987 18,041 104 100.00% 100.00% 156
4,257,703 2,958,443 1,940,346 128.757 1,290,034
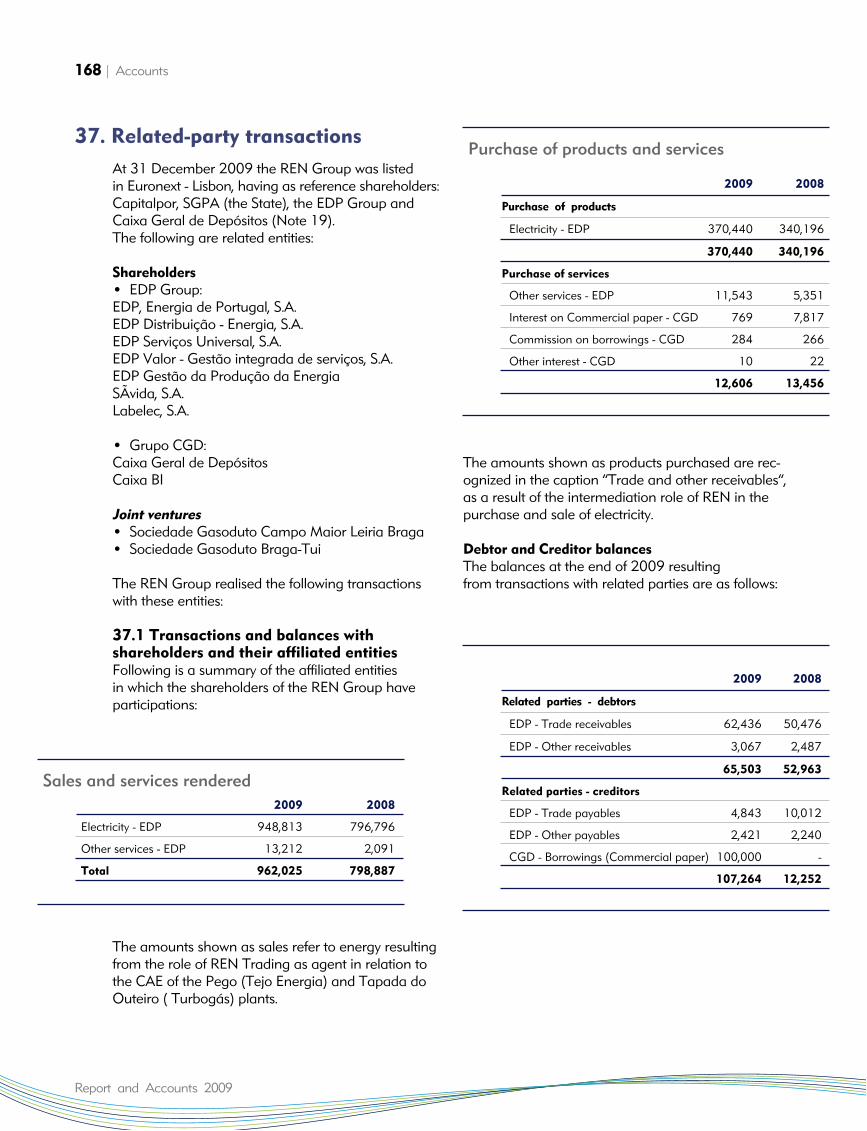
168 | Accounts
Report and Accounts 2009
At 31 December 2009 the REN Group was listedin Euronext - Lisbon, having as reference shareholders:Capitalpor, SGPA (the State), the EDP Group andCaixa Geral de Depósitos (Note 19).The following are related entities:
Shareholders• EDP Group:EDP, Energia de Portugal, S.A.EDP Distribuição - Energia, S.A.EDP Serviços Universal, S.A.EDP Valor - Gestão integrada de serviços, S.A. EDP Gestão da Produção da EnergiaSÃvida, S.A.Labelec, S.A.
• Grupo CGD:Caixa Geral de DepósitosCaixa BI
Joint ventures• Sociedade Gasoduto Campo Maior Leiria Braga• Sociedade Gasoduto Braga-Tui
The REN Group realised the following transactionswith these entities:
37.1 Transactions and balances with shareholders and their affiliated entitiesFollowing is a summary of the affiliated entitiesin which the shareholders of the REN Group haveparticipations:
The amounts shown as sales refer to energy resultingfrom the role of REN Trading as agent in relation tothe CAE of the Pego (Tejo Energia) and Tapada doOuteiro ( Turbogás) plants.
The amounts shown as products purchased are rec-ognized in the caption “Trade and other receivables”,as a result of the intermediation role of REN in thepurchase and sale of electricity.
Debtor and Creditor balances The balances at the end of 2009 resulting from transactions with related parties are as follows:
37. Related-party transactions
2009 2008
Electricity - EDP 948,813 796,796
Other services - EDP 13,212 2,091
Total 962,025 798,887
Sales and services rendered
2009 2008
Purchase of products
Electricity - EDP 370,440 340,196
370,440 340,196
Purchase of services
Other services - EDP 11,543 5,351
Interest on Commercial paper - CGD 769 7,817
Commission on borrowings - CGD 284 266
Other interest - CGD 10 22
12,606 13,456
Purchase of products and services
2009 2008
Related parties - debtors
EDP - Trade receivables 62,436 50,476
EDP - Other receivables 3,067 2,487
65,503 52,963
Related parties - creditors
EDP - Trade payables 4,843 10,012
EDP - Other payables 2,421 2,240
CGD - Borrowings (Commercial paper) 100,000 -
107,264 12,252
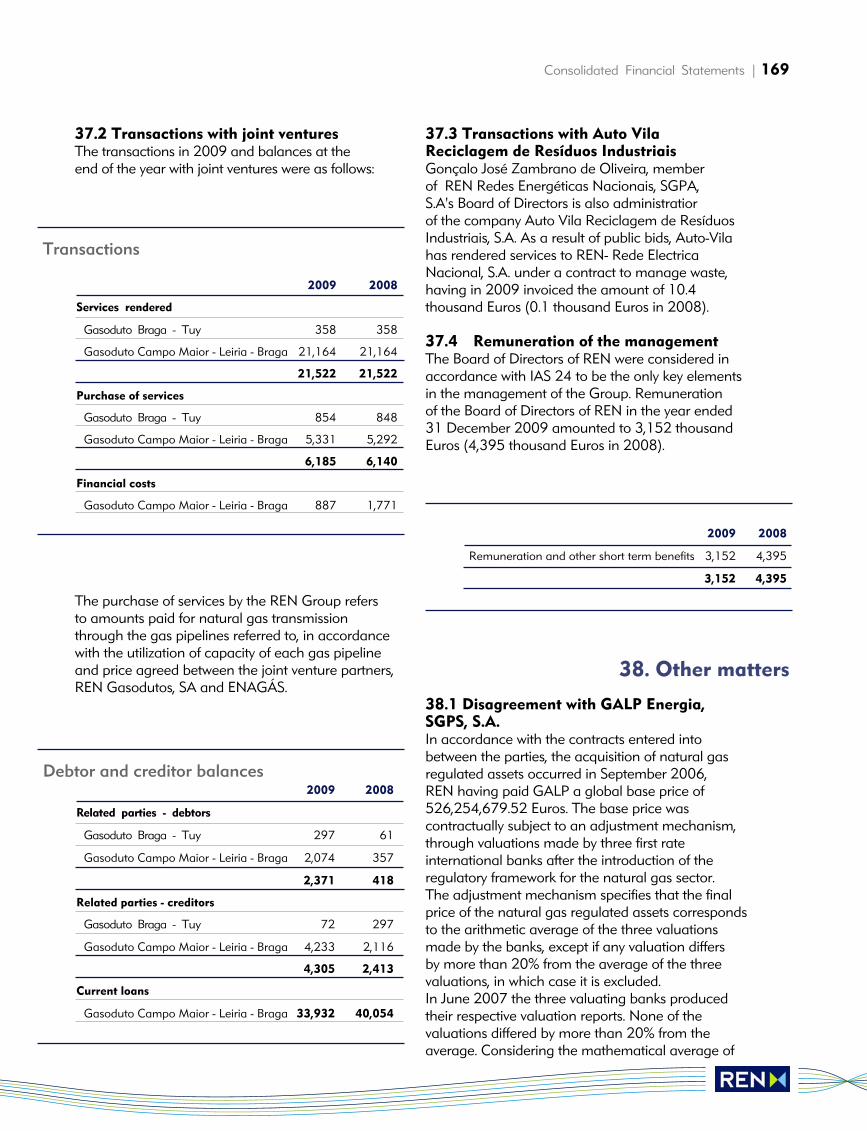
Consolidated Financial Statements | 169
37.2 Transactions with joint venturesThe transactions in 2009 and balances at theend of the year with joint ventures were as follows:
The purchase of services by the REN Group refersto amounts paid for natural gas transmissionthrough the gas pipelines referred to, in accordancewith the utilization of capacity of each gas pipelineand price agreed between the joint venture partners,REN Gasodutos, SA and ENAGÁS.
37.3 Transactions with Auto Vila Reciclagem de Resíduos IndustriaisGonçalo José Zambrano de Oliveira, memberof REN Redes Energéticas Nacionais, SGPA, S.A's Board of Directors is also administratior of the company Auto Vila Reciclagem de ResíduosIndustriais, S.A. As a result of public bids, Auto-Vilahas rendered services to REN- Rede ElectricaNacional, S.A. under a contract to manage waste,having in 2009 invoiced the amount of 10.4thousand Euros (0.1 thousand Euros in 2008).
37.4 Remuneration of the management The Board of Directors of REN were considered inaccordance with IAS 24 to be the only key elementsin the management of the Group. Remunerationof the Board of Directors of REN in the year ended31 December 2009 amounted to 3,152 thousandEuros (4,395 thousand Euros in 2008).
38.1 Disagreement with GALP Energia, SGPS, S.A.In accordance with the contracts entered intobetween the parties, the acquisition of natural gasregulated assets occurred in September 2006, REN having paid GALP a global base price of526,254,679.52 Euros. The base price wascontractually subject to an adjustment mechanism,through valuations made by three first rateinternational banks after the introduction of theregulatory framework for the natural gas sector.The adjustment mechanism specifies that the finalprice of the natural gas regulated assets correspondsto the arithmetic average of the three valuationsmade by the banks, except if any valuation differsby more than 20% from the average of the threevaluations, in which case it is excluded.In June 2007 the three valuating banks producedtheir respective valuation reports. None of thevaluations differed by more than 20% from theaverage. Considering the mathematical average of
2009 2008
Services rendered
Gasoduto Braga - Tuy 358 358
Gasoduto Campo Maior - Leiria - Braga 21,164 21,164
21,522 21,522
Purchase of services
Gasoduto Braga - Tuy 854 848
Gasoduto Campo Maior - Leiria - Braga 5,331 5,292
6,185 6,140
Financial costs
Gasoduto Campo Maior - Leiria - Braga 887 1,771
Transactions
2009 2008
Related parties - debtors
Gasoduto Braga - Tuy 297 61
Gasoduto Campo Maior - Leiria - Braga 2,074 357
2,371 418
Related parties - creditors
Gasoduto Braga - Tuy 72 297
Gasoduto Campo Maior - Leiria - Braga 4,233 2,116
4,305 2,413
Current loans
Gasoduto Campo Maior - Leiria - Braga 33,932 40,054
Debtor and creditor balances
2009 2008
Remuneration and other short term benefits 3,152 4,395
3,152 4,395
38. Other matters
170 | Accounts
Report and Accounts 2009
the three valuations the amount that was paid byREN and the financial charges agreed contractually,the adjustment of the price for the purchase and saleof the regulated assets was fixed at 24,026,484.87Euros, which amount REN paid to GALP in thebeginning of July 2007.Through a letter dated 9 June 2008, in accordancewith the terms of the contracts entered into betweenthe parties, REN was notified of GALP's intention toassign to an arbitration court the settlement of theirdispute regarding the amount of the price adjustmentpaid for the natural gas regulated assets resulting fromthe valuations made by the three financial institutions.In the meantime the arbitration court was establishedand, on 20 November 2008 GALP presented its initialpetition. In summary, GALP alleges that the valuationmade by one of the banks is not in compliance withthe criteria established in the contracts, and that itshould be excluded for purposes of determining theprice adjustment for the acquisition and sale of theregulated assets. GALP also alleges that the valuationsmade by the other two banks contain technical errorsthat should be corrected by the Arbitration court.GALP requested that REN be required to pay40,697,947.78 Euros plus accrued interest amountingto 4,033,552.00 Euros as well as interest up to thedate of payment in full. In addition, GALP requestedthat REN be required to pay 26,864,500.00 Eurosplus accrued interest of 2,662,526.00 Euros as wellas interest up to the date of payment in full.Furthermore GALP requested that REN be requiredto pay 12,232,708.00 Euros plus accrued interest of1,212,377.00 Euros as well as interest up to the dateof payment in full.In January 2009 REN presented its disagreement.In summary, REN states that, in the legal andcontractual terms applicable to this case, the valuationsmade by the banks cannot be investigated in theterms requested by GALP, considering that noneof the valuations differed more than 20% from theaverage of the three valuations. REN also statesthat the valuations contested by GALP comply withall the criteria established contractually, there beingno grounds to exclude any of the valuations.On 18 January 2009 REN was notified by theArbitration Court that judged the case brought by Galp - Gás Natural, S.A., GDP - Gás de Portugal,SGPS, SA and Galp Energia SGPS SA SociedadeAberta (jointly referred to as “GALP”) totally withoutmerit, absolving REN of all the requests made by Galp.
38.2 Disagreement Amorim Energia B.V.On 19 December 2007 REN was notified of the presentation to the International Chamber ofCommerce, of an arbitration request by AmorimEnergia BV against REN, under which REN isaccused of violating emerging obligations or relatedto the “Shareholders Agreement relating to GALPENERGIA, SGPS, S.A.” entered into on 29 December2005 between REN, AMORIM and ENI PORTUGALINVESTMENT, S.p.A.. The arbitration location is Paris,France.In summary, Amorim Energia B.V. alleges that theunlawful acts supposedly performed by REN causeddamage to the amount of dividends distributed byGALP with respect to the 2005 profits and receivedby REN in July 2006 as a shareholder of GALP(Euros 40,669,798 -“Dividends”). In addition, AmorimEnergia BV requires an indemnity of the sameamount received by REN as the result of a mechanism to permanently update the ShareholdersAgreement, consistent with the application of theEuribor 3 month interest rate to the price to be paidby Amorim Energia BV for its participation in GALP(Euros 20,644,972.00). Amorim Energia BV alsodemands that REN be required to pay interest forlate payment at the applicable legal rate as from thepresentation of the arbitration petition up to the dateof payment in full of the amounts claimed or anadjustment for inflation as from 12 September 2006up to the date of full payment of the amounts claimed.However, it is necessary to emphasize that in 2006REN and Amorim Energia BV maintained adifference regarding who had the right to receive dividends under the Shareholders' Agreement. On 15June 2005, an Arbitration Court set out especially byagreement between the parties issued a judgementpronouncing the action brought by Amorim EnergiaBV to be totally without merit and recognizing REN'sright to maintain the dividends of 40,669,797.82received from GALP. The arbitration judgement isfinal and became “res judicata”.REN contested the jurisdiction of an Arbitration Court functioning under the CCI to assess any of theclaims made by Amorim Energia BV, also claiminginadmissibility of the claims made by Amorim EnergiaBV, due to renouncement/violation of the arbitrationaward made in Lisbon on 15 June 2007 as “res judicata” and in any case if the Court decides tojudge the merit of the Arbitration Petition, sustainedits total inadmissibility as it was unfounded.The Arbitration Court has already been constitutedand on 3 June 2008 the Terms of Reference were signed by the members of the Court and representatives of the parties. After presentation of
Consolidated Financial Statements | 171
the parties the hearings were carried out in the beginning of February 2009. The Arbitration Courtwill issue its judgment on the admissibility of theclaims made by Amorim Energia. Should it decide tohave jurisdiction, the Arbitration Court will pronounceitself on the claims. Notification of the ArbitrationAgreement is awaited.REN believes that the arbitration process in progressdoes not determine the existence of a present obligationas (at least) it is more probable that it does not implythe recognition or recording of any liability for RENin relation to Amorim Energia BV relating to therequests made than the reverse situation (that of thetotal or partial validity of the arbitration process).
These consolidated financial statements are atranslation of financial statements originally issued in Portuguese in accordance with InternationalFinancial Reporting Standards as endorsed by theEuropean Union at 1 January 2009. In the event of discrepancies, the Portuguese language versionprevails.
Statement set forth in Article 245(1), sub-paragraph c) of the Portuguese Securities CodePursuant to Article 245(1), paragraph c), of thePortuguese Securities Code, each member of REN - Redes Energéticas Nacionais, SGPS, S.A.'sBoard of Directors, identified below by their names,subscribed the following declaration1:"I hereby declare, in accordance with Article 245(1),sub-paragraph c), of the Portuguese Securities Codethat, to the extent of my knowledge, acting in thecapacity and scope of duties to which I have beenassigned and based upon the information madeavailable within the Board of Directors and/or theExecutive Committee, as applicable, the condensedfinancial statements have been drawn up in accordance with the applicable accounting standards, provide a true and fair view of the assetsand liabilities, financial position and results of REN - Redes Energéticas Nacionais, SGPS, S.A. and the companies included within its scope of consolidation, and that the management report related to the 2009 financial year faithfully reflectsthe major events that have occurred in such periodand the impact in the respective financial statements,also being provided therein a description of the principal risks and uncertainties for the followingfinancial year."Rui Manuel Janes Cartaxo (Chairman of the Boardof Directors in replacement)
Aníbal Durães dos Santos (Executive Director)Victor Manuel da Costa Antunes Machado Baptista(Executive Director)João Caetano Carreira Faria Conceição (ExecutiveDirector)Luís Maria Atienza Serna (Director)Gonçalo José Zambrano de Oliveira (Director)Manuel Carlos Mello Champalimaud (Director)José Isidoro d'Oliveira Carvalho Netto (Director)Filipe Maurício de Botton (Director)José Luís Alvim Marinho (Chairman of the AuditCommittee)José Frederico Vieira Jordão (Member of the AuditCommittee)Fernando António Portela Rocha de Andrade(Member of the Audit Committee)
Lisbon, 26 February 2010
39. Explanation added for translation
The Accountant The Executive Committee
Nº 30 375 Rui Manuel Janes Cartaxo - President
Maria Teresa Martins Aníbal Durães dos Santos
Victor Manuel da Costa Antunes
Machado Baptista
João Caetano Carreira Faria
Conceição
1 The originals of these individual statements are available at the Company's registered office.
Report and Accounts 2009
Separate financial statements
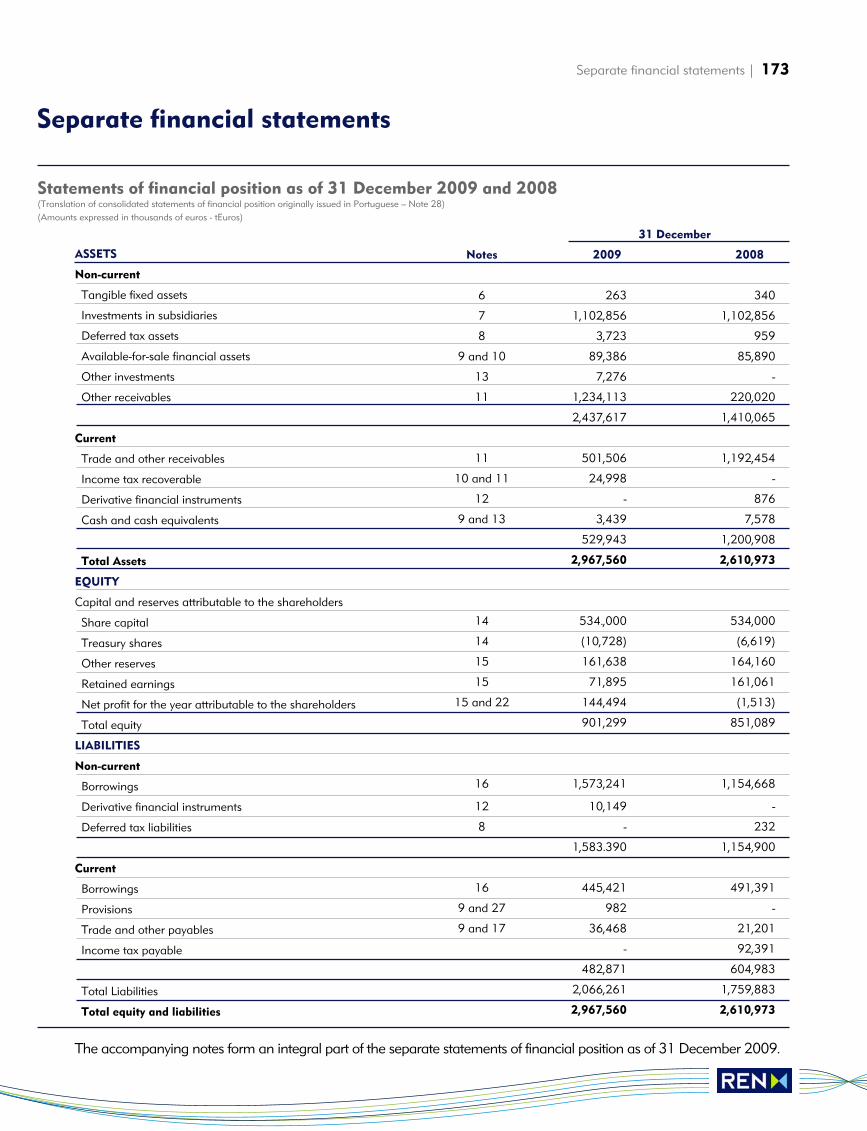
31 December
ASSETS Notes 2009 2008
Não corrente
Activos fixos tangíveis 6 263 340
Investimentos financeiros em subsidiárias 7 1,102,856 1,102,856
Activos por impostos diferidos 8 3,723 959
Activos financeiros disponíveis para venda 9 and 10 89,386 85,890
Outros investimentos financeiros 13 7,276 -
Outras contas a receber 11 1,234,113 220,020
2,437,617 1,410,065
Corrente
Clientes e outras contas a receber 11 501,506 1,192,454
Imposto sobre o rendimento a receber 10 and 11 24,998 -
Instrumentos financeiros derivados 12 - 876
Caixa e equivalentes de caixa 9 and 13 3,439 7,578
529,943 1,200,908
Total do activo 2,967,560 2,610,973
EQUITY
Capital e reservas atribuíveis aos detentores de capital
Capital social 14 534.,000 534,000
Acções próprias 14 (10,728) (6,619)
Outras reservas 15 161,638 164,160
Resultados acumulados 15 71,895 161,061
Resultado do exercício atribuível a detentores de capital 15 and 22 144,494 (1,513)
Total capital próprio 901,299 851,089
LIABILITIES
Não corrente
Empréstimos 16 1,573,241 1,154,668
Intrumentos financeiros derivados 12 10,149 -
Passivos por impostos diferidos 8 - 232
1,583.390 1,154,900
Corrente
Empréstimos 16 445,421 491,391
Provisões 9 and 27 982 -
Fornecedores e outras contas a pagar 9 and 17 36,468 21,201
Imposto sobre o rendimento a pagar - 92,391
482,871 604,983
Total passivo 2,066,261 1,759,883
Total do capital próprio e passivo 2,967,560 2,610,973
ASSETS
Non-current
Tangible fixed assets
Investments in subsidiaries
Deferred tax assets
Available-for-sale financial assets
Other investments
Other receivables
Current
Trade and other receivables
Income tax recoverable
Derivative financial instruments
Cash and cash equivalents
Total Assets
EQUITY
Capital and reserves attributable to the shareholders
Share capital
Treasury shares
Other reserves
Retained earnings
Net profit for the year attributable to the shareholders
Total equity
LIABILITIES
Non-current
Borrowings
Derivative financial instruments
Deferred tax liabilities
Current
Borrowings
Provisions
Trade and other payables
Income tax payable
Total Liabilities
Total equity and liabilities
Separate financial statements | 173
Separate financial statements
Statements of financial position as of 31 December 2009 and 2008(Translation of consolidated statements of financial position originally issued in Portuguese – Note 28)(Amounts expressed in thousands of euros - tEuros)
The accompanying notes form an integral part of the separate statements of financial position as of 31 December 2009.
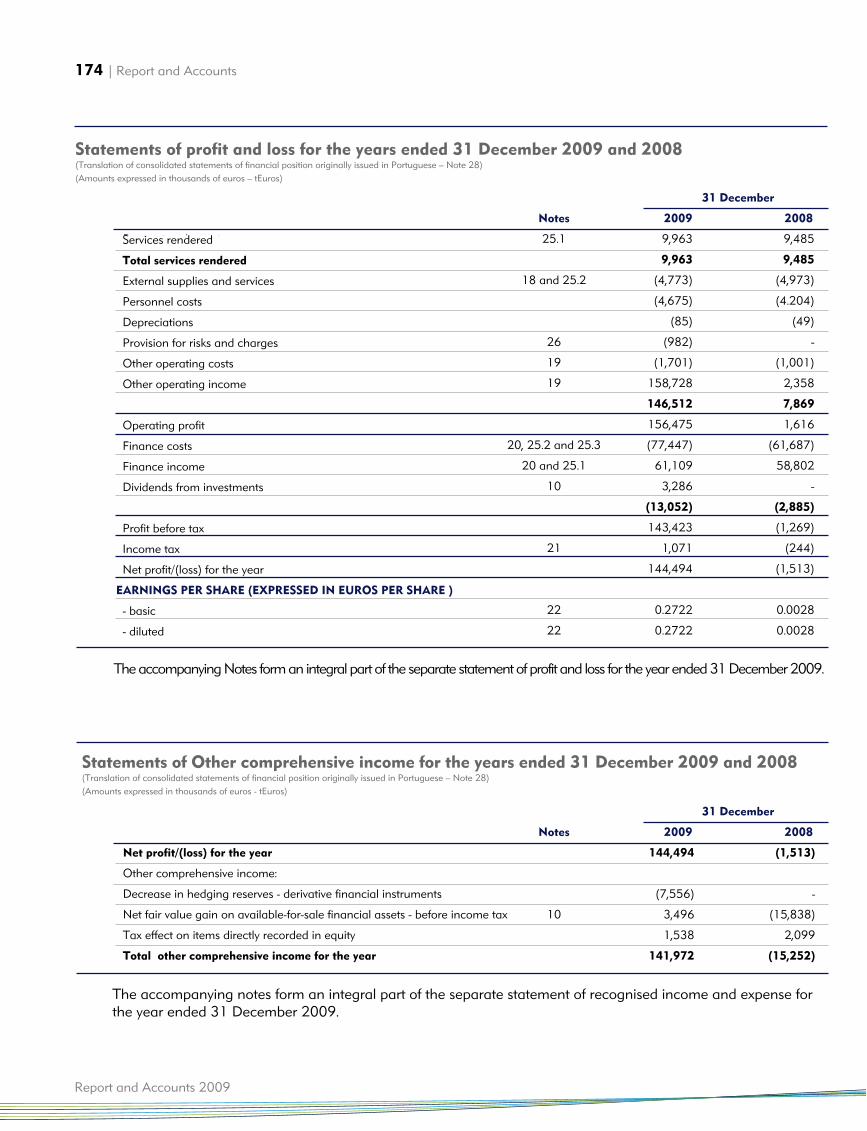
31 December
Notes 2009 2008
Prestações de serviços 25.1 9,963 9,485
Total das prestações de serviços 9,963 9,485
Fornecimentos e serviços externos 18 and 25.2 (4,773) (4,973)
Gastos com pessoal (4,675) (4.204)
Depreciações de exercício (85) (49)
Provisões para riscos e encargos 26 (982) -
Outros custos operacionais 19 (1,701) (1,001)
Outros proveitos operacionais 19 158,728 2,358
Total dos custos 146,512 7,869
Resultado operacional 156,475 1,616
Custos de financiamento 20, 25.2 and 25.3 (77,447) (61,687)
Proveitos financeiros 20 and 25.1 61,109 58,802
Dividendos de empresas participadas 10 3,286 -
(13,052) (2,885)
Resultados consolidados antes de impostos 143,423 (1,269)
Impostos sobre o rendimento 21 1,071 (244)
Resultado líquido do exercício 144,494 (1,513)
EARNINGS PER SHARE (EXPRESSED IN EUROS PER SHARE )
Básico 22 0.2722 0.0028
Diluído 22 0.2722 0.0028
Services rendered
Total services rendered
External supplies and services
Personnel costs
Depreciations
Provision for risks and charges
Other operating costs
Other operating income
Operating profit
Finance costs
Finance income
Dividends from investments
Profit before tax
Income tax
Net profit/(loss) for the year
EARNINGS PER SHARE (EXPRESSED IN EUROS PER SHARE )
- basic
- diluted
174 | Report and Accounts
Report and Accounts 2009
Statements of profit and loss for the years ended 31 December 2009 and 2008(Translation of consolidated statements of financial position originally issued in Portuguese – Note 28)(Amounts expressed in thousands of euros – tEuros)
The accompanying Notes form an integral part of the separate statement of profit and loss for the year ended 31 December 2009.
31 December
Notes 2009 2008
Net profit/(loss) for the year 144,494 (1,513)
Other comprehensive income:
Decrease in hedging reserves - derivative financial instruments (7,556) -
Net fair value gain on available-for-sale financial assets - before income tax 10 3,496 (15,838)
Tax effect on items directly recorded in equity 1,538 2,099
Total other comprehensive income for the year 141,972 (15,252)
Statements of Other comprehensive income for the years ended 31 December 2009 and 2008(Translation of consolidated statements of financial position originally issued in Portuguese – Note 28)(Amounts expressed in thousands of euros - tEuros)
The accompanying notes form an integral part of the separate statement of recognised income and expense forthe year ended 31 December 2009.
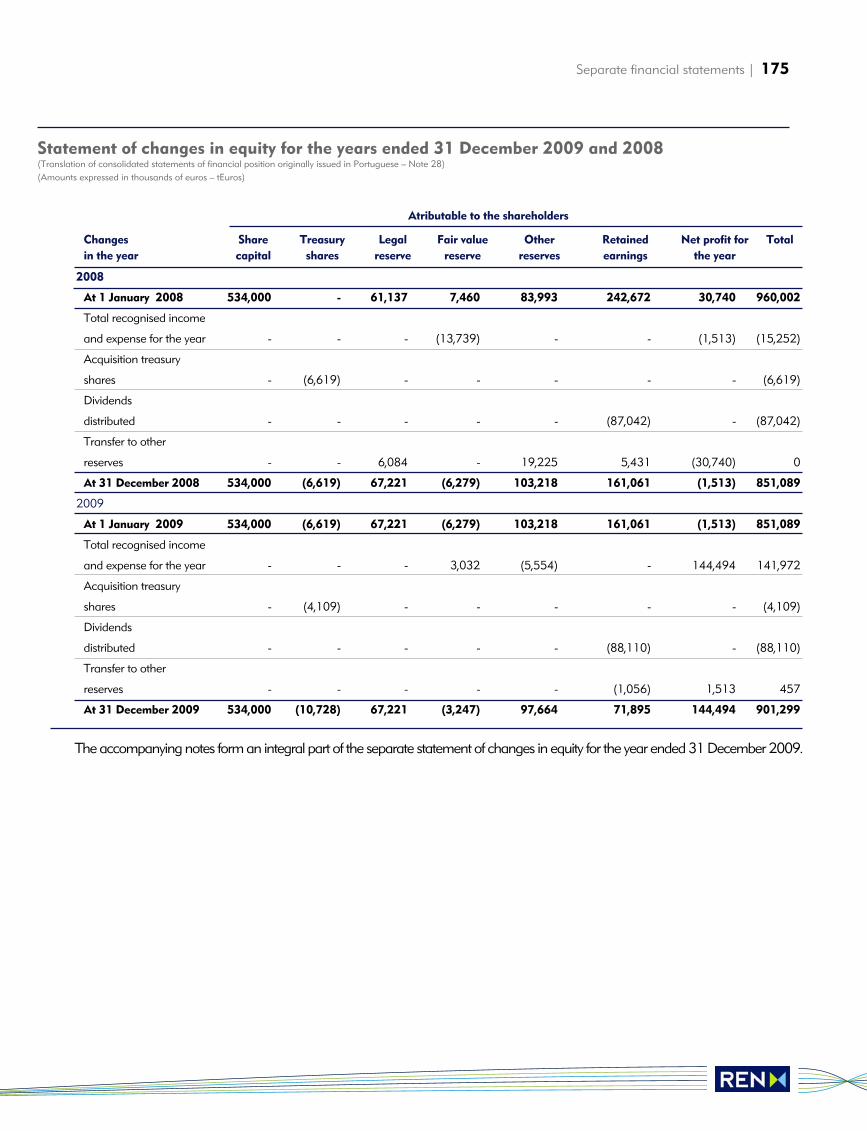
Separate financial statements | 175
Atributable to the shareholders
Changes Share Treasury Legal Fair value Other Retained Net profit for Total
in the year capital shares reserve reserve reserves earnings the year
2008
At 1 January 2008 534,000 - 61,137 7,460 83,993 242,672 30,740 960,002
Total recognised income
and expense for the year - - - (13,739) - - (1,513) (15,252)
Acquisition treasury
shares - (6,619) - - - - - (6,619)
Dividends
distributed - - - - - (87,042) - (87,042)
Transfer to other
reserves - - 6,084 - 19,225 5,431 (30,740) 0
At 31 December 2008 534,000 (6,619) 67,221 (6,279) 103,218 161,061 (1,513) 851,089
2009
At 1 January 2009 534,000 (6,619) 67,221 (6,279) 103,218 161,061 (1,513) 851,089
Total recognised income
and expense for the year - - - 3,032 (5,554) - 144,494 141,972
Acquisition treasury
shares - (4,109) - - - - - (4,109)
Dividends
distributed - - - - - (88,110) - (88,110)
Transfer to other
reserves - - - - - (1,056) 1,513 457
At 31 December 2009 534,000 (10,728) 67,221 (3,247) 97,664 71,895 144,494 901,299
Statement of changes in equity for the years ended 31 December 2009 and 2008(Translation of consolidated statements of financial position originally issued in Portuguese – Note 28)(Amounts expressed in thousands of euros – tEuros)
The accompanying notes form an integral part of the separate statement of changes in equity for the year ended 31 December 2009.
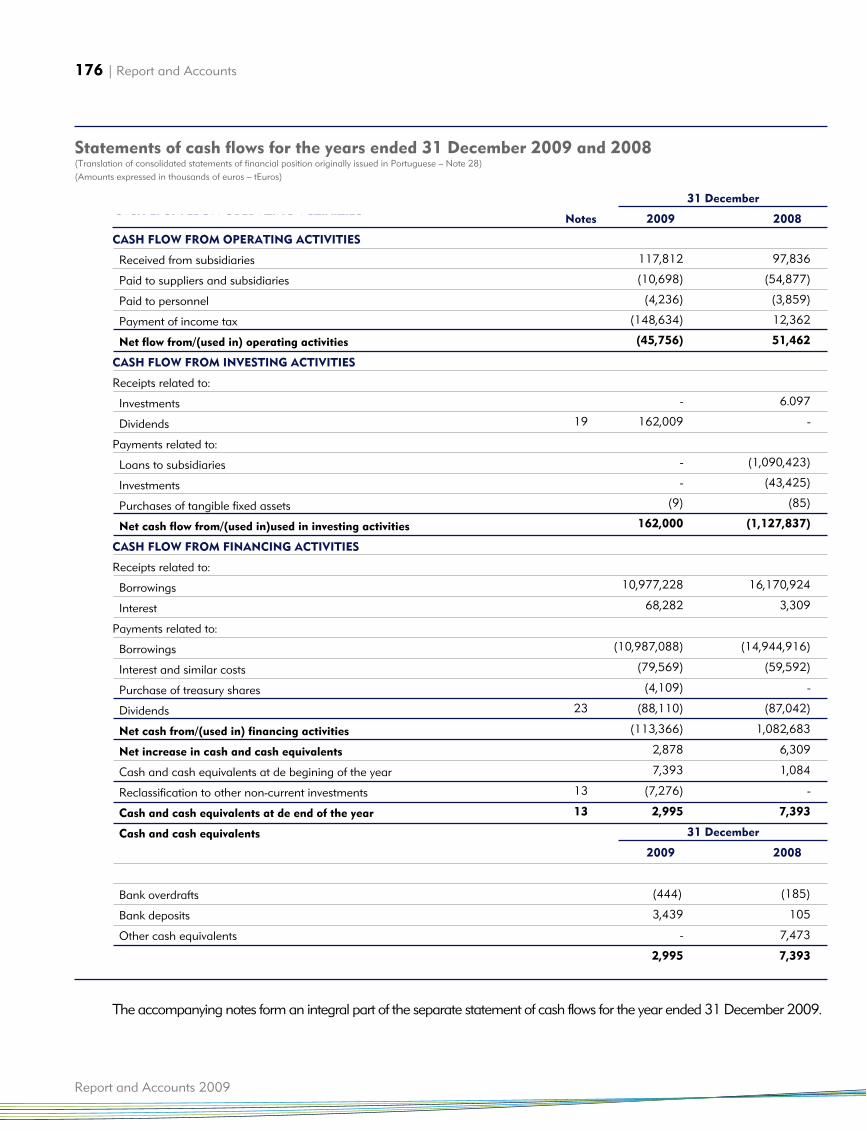
31 December
CASH FLOW FROM OPERATING ACTIVITIES Notes 2009 2008
Recebimentos de subsidiárias 117,812 97,836
Pagamentos a fornecedores e subsidiárias (10,698) (54,877)
Pagamentos ao pessoal (4,236) (3,859)
Pagamento do imposto sobre o rendimento (148,634) 12,362
Fluxos de caixa líquidos das actividades operacionais (45,756) 51,462
CASH FLOW FROM INVESTING ACTIVITIES
Recebimentos provenientes de:
Investimentos financeiros - 6.097
Dividendos 19 162,009 -
Pagamentos respeitantes a:
Empréstimos a filiais - (1,090,423)
Investimentos financeiros - (43,425)
Activos fixos tangíveis (9) (85)
Fluxos de caixa líquidos das actividades de investimento 162,000 (1,127,837)
CASH FLOW FROM FINANCING ACTIVITIES
Recebimentos provenientes de:
Empréstimos obtidos 10,977,228 16,170,924
Juros 68,282 3,309
Pagamentos respeitantes a:
Empréstimos obtidos (10,987,088) (14,944,916)
Juros e custos similares (79,569) (59,592)
Aquisição acções próprias (4,109) -
Dividendos 23 (88,110) (87,042)
Fluxos de caixa líquidos das actividades de financiamento (113,366) 1,082,683
Aumento líquido (diminuição) do caixa e aquivalentes de caixa 2,878 6,309
Caixa e equivalentes de caixa no início do período 7,393 1,084
Reclassificação para outros investimentos financeiros não correntes 13 (7,276) -
Caixa e equivalentes de caixa no final do período 13 2,995 7,393
Detalhe de caixa e equivalen 31 December
CASH FLOW FROM OPERATING ACTIVITIES 2009 2008
Descobertos bancários (444) (185)
Depósitos bancários 3,439 105
Outras aplicações de tesouraria - 7,473
2,995 7,393
CASH FLOW FROM OPERATING ACTIVITIES
Received from subsidiaries
Paid to suppliers and subsidiaries
Paid to personnel
Payment of income tax
Net flow from/(used in) operating activities
CASH FLOW FROM INVESTING ACTIVITIES
Receipts related to:
Investments
Dividends
Payments related to:
Loans to subsidiaries
Investments
Purchases of tangible fixed assets
Net cash flow from/(used in)used in investing activities
CASH FLOW FROM FINANCING ACTIVITIES
Receipts related to:
Borrowings
Interest
Payments related to:
Borrowings
Interest and similar costs
Purchase of treasury shares
Dividends
Net cash from/(used in) financing activities
Net increase in cash and cash equivalents
Cash and cash equivalents at de begining of the year
Reclassification to other non-current investments
Cash and cash equivalents at de end of the year
Cash and cash equivalents
Bank overdrafts
Bank deposits
Other cash equivalents
176 | Report and Accounts
Report and Accounts 2009
Statements of cash flows for the years ended 31 December 2009 and 2008(Translation of consolidated statements of financial position originally issued in Portuguese – Note 28)(Amounts expressed in thousands of euros – tEuros)
The accompanying notes form an integral part of the separate statement of cash flows for the year ended 31 December 2009.
Separate financial statements | 177
REN – Redes Energéticas Nacionais, SGPS, S.A.(hereinafter referred to as “REN SGPS” or “theCompany”), with head office in Avenida EstadosUnidos da América, 55 – Lisbon, resulted from thetransformation on 5 January 2007 of REN – RedeEléctrica Nacional, S.A. into an investment holdingcompany.At the same time a spin-off was made of theelectricity business from REN – Rede EléctricaNacional, S.A. to the group company REN – Serviçosde Rede, S.A., the name of which was subsequentlychanged to REN – Rede Eléctrica Nacional, S.A.. REN – Redes Energéticas Nacionais, SGPS, S.A. is theparent company of the REN Group, which isorganized into two main segments Electricity andGas, and two secondary businesses, in the areas ofTelecommunications and Management of theElectricity Derivatives Market.
Electricity business
A REN – Rede Eléctrica Nacional, S.A. was foundedby public deed on 26 September 2006, a capitalincrease having been made on 5 January 2007 bytransfer of the assets and liabilities relating to theconcession to operate the National Very HighTension Electricity Transmission Network.The purpose of this company is the transmission ofelectricity and overall technical management theNational Electrical System, considering the securityand continuous supply of electricity throughout thecontinent and manage and operate the NationalTransmission of Electricity Network, which includesthe transmission of electricity, planning, construction,maintenance and operation of the infrastructuresnecessary for that in accordance with the law and thepublic service concession contract of which it is theholder. The Company’s capital is 586,759 thousand Euros,represented by 586,758,984 shares of one euroeach. At 31 December 2009 the capital was fullyowned by REN – Redes Energéticas Nacionais, SGPS, S.A..A REN Trading, S.A. was founded on 13 June 2007. The main function of the company is to manage theelectricity purchase contracts (Contratos de aquisiçãode energia - “CAE”) of Turbogás, S.A. and Tejo
Energia, S.A., that were did not terminated on 30June 2007, date of the entry into force of the newCMEC contracts (Custos de manutenção e equilíbrioContratual - “CMEC”). The operations of thiscompany include the trading of electricity producedand of the installed production capacity, withdomestic and international distributors.The company’s capital totals 50 thousand Euros,represented by 50,000 shares of one euro each. At31 December 2009 the capital was fully owned byREN – Redes Energéticas Nacionais, SGPS, S.A..
Gas business
A REN Gasodutos, S.A. was founded by public deedon 26 September 2006 in compliance with adecision of the Government, under Resolution of theCouncil of Ministers 85/2006 published in theJournal of the Republic nº 125, B series of 30 June.The company’s purpose is to transport high pressurenatural gas and the overall technical management ofthe National Natural Gas System, considering thesecurity and continuity of the supply of natural gasthroughout the continent.This company is responsible for operating theNational Natural Gas Transport Network, coveringthe transport of natural gas, planning, construction,maintenance and operation of the necessaryinfrastructures and installations for this in accordancewith the law and the public service concessioncontract of which it is the holder, as well as any otherrelated activities.REN – Gasodutos, S.A.’s capital totals 404,931thousand Euros, represented by 404,931,169 sharesof one euro each. At 31 December 2009 the capitalwas fully owned by REN – Redes EnergéticasNacionais, SGPS, S.A.. REN Gasodutos, S.A. has a participation in two jointventures with the Spanish gas transport companyEnagás, S.A., to which REN Gasodutos transferred thetransport rights over specific gas pipelines (Braga-Tuyand Campo Maior - Leiria - Braga). REN Armazenagem, S.A. was founded by publicdeed on 26 September 2006 in compliance with adecision of the Government, under Resolution of theCouncil of Ministers 85/2006 published in theJournal of the Republic nº 125, B series of 30 June.The purpose of this company is the undergroundstorage of natural gas and the construction,
Notes to the separate financial statements
1. General information
(Translation of consolidated statements of recognized income and expense originally issued in Portuguese – Note 28)(Amounts expressed in thousands of euros – tEuros)
178 | Report and Accounts
Report and Accounts 2009
operation and maintenance of the necessaryinfrastructures and installations for this in accordancewith the law and the public service concessioncontract of which it is the holder, as well as any otherrelated activities.REN – Armazenagem, S.A.’s capital totals 76,386thousand Euros, represented by 76,385,561 sharesof one euro each. At 31 December 2009 the capitalwas fully owned by REN – Redes EnergéticasNacionais, SGPS, S.A..REN Atlântico, Terminal de GNL, S.A. was foundedon 14 April 1999. Its name was changed by publicdeed on 26 September 2006 to REN – Atlântico,Terminal de GNL, S.A. Its purpose is the reception,storage and regasification of liquid natural gas (LNG)in LNG ocean terminal and the construction,operation and maintenance of the necessaryinfrastructures and installations for this in accordancewith the law and the public service concessioncontract of which it is the holder, as well as any otherrelated activities.The company’s capital totals 13,000 thousand Euros,represented by 13,000,000 shares of one euro each.At 31 December 2009 the capital was fully owned byREN – Redes Energéticas Nacionais, SGPS, S.A..
Telecommunications business
RENTELECOM – Comunicações, S.A. was foundedunder Order 128/2001 of 22 October of the Ministerof the Economy and public deed drawn up on 7December 2001. The company started operating on1 January 2002, having as its object theestablishment, management and operation oftelecommunications infrastructures and systems, therendering of telecommunications services, as well asthe realization of any complementary, subsidiary oraccessory activities, directly or through participationsin other companies. The company’s capital totals 100 thousand Euros,represented by 20,000 shares of five euros each. At31 December 2009 the capital was fully owned byREN – Redes Energéticas Nacionais, SGPS, S.A..
Management of the Electricity DerivativesMarket
A OMIP – Operador do Mercado Ibérico de Energia,S.A. was founded under Order 360/ME/2003 of 6June of the Minister of the Economy and by deeddrawn up on 16 June 2003. The company startedoperating on 10 December 2003, having as its objectthe organization and management of a supportingsystem for the realization of transactions and
liquidations in the Iberian Energy Market, beingresponsible for:
a) management of organized energy termcontracting market;b) intermediary of the agents for purposes ofcommercial relationships in the Iberian ElectricityMarket;c) management of other markets of electricity basedproducts;d) rendering of liquidation services in the organizedelectricity markets;e) Rendering of liquidation services for standardtransactions in non-organized energy markets;f) rendering of services relating to the organization ofmarkets in the area of the operation of the electricitysystem.
As a result of delays in the start up of the IberianElectricity Market (MIBEL – Mercado Ibérico deElectricidade), OMIP only started operating on 3 July2006. OMIP’s capital totals 2,500 thousand Euros,represented by 250,000 shares of ten eurosNacionais, SGPS, S.A. and 10% by OMEL –Compañia Operadora del Mercado Español deElectricidad, S.A..OMIP is the sole shareholder of OMIClear -Sociedade de Compensação de Mercados deEnergia, S.A., which has the corporate objective ofclearing futures and options operations.
Other businesses
REN SGPS also has a participation in REN – Serviços,S.A., which has the objective of rendering services inthe areas of administration, finance, regulations,personnel management, salary processing,management and maintenance of moveable andimmovable assets, negotiation and supply ofconsumables and services of the same type, usuallyreferred to as back office services, for relatedcompanies and third parties, receiving remunerationfor this.
1.1 Approval of the separate financialstatements These separate financial statements were approvedby the Board of Directors in a meeting held on 26February 2010. In the opinion of the Board ofDirectors these financial statements reflect fairly theoperations of REN SGPS, S.A., as well as its financialposition, financial performance and cash flows.
Separate financial statements | 179
The main accounting policies used in preparing thefinancial statements are described below. The policieshave been applied consistently in the separatefinancial statements the years presented.The separate financial statements were prepared ona going concern basis, at historical cost, except forthe derivative financial instruments and available-for-sale financial assets, which are recorded at fair value,as from the Company’s books and accountingrecords, maintained in accordance with generallyaccepted accounting principles in Portugal, adjustedin the consolidation process so that the consolidatedfinancial statements conform to InternationalFinancial Reporting Standards as endorsed by theEuropean Union, in force for the years starting on 1January 2009. It is understood that InternationalFinancial reporting Standards (“IFRS”), issued by theInternational Accounting Standards Board (“IASB”),International Accounting Standards (IAS), issued bythe International Accounting Standards Committee(“IASC”) and respective SIC and IFRIC interpretations,issued by the International Financial ReportingInterpretation Committee (“IFRIC”) and StandardInterpretation Committee (“SIC”), that have beenendorsed by the European Union are considered asbeing part of these standards. The standards andinterpretations are hereinafter referred generically toas IFRS.The preparation of financial statements in conformitywith IFRS requires the use of certain criticalaccounting estimates, assumptions and judgementsin the process of adopting REN’s accounting policies,with a significant impact on the carrying amounts ofassets, liabilities as well as the income and expensesfor the reporting period. Although the estimates are based in the bestexperience of the Board of Directors and their bestexpectations in relation to current and future eventsand actions, the current and future results may differfrom the estimates. The areas involving a higherdegree of judgement or complexity, or areas in whichthe assumptions and estimates are significant to theconsolidated financial statements are disclosed inNotes 4 and 5.The financial statements are presented in thousandsof Euros - tEuros.
Adoption of new standards, interpretations,amendments and revisions
a) The following standards and interpretations are ofmandatory application for financial years beginning
on or after 1 January 2009: • IAS 1 (revised), ‘Presentation of financialstatements’. REN SGPS presents all the changes toequity resulting from transactions with theshareholders in the statement of changes in equity.All the changes in equity resulting from transactionswith non-shareholder entities are presented in twoseparate statements (a statement of profit and lossand a statement of other comprehensive income).• IAS 23, ‘Borrowing costs’ (revised). This revisionintroduced the requirement to capitalise costs ofborrowing relating to assets that qualify, the option torecord them in the statement of profit and loss for theperiod in which they are incurred therefore beingeliminated. Adoption of this standard did not have asignificant impact on REN SGPS’s financialstatements as it had already adopted this standard.• IFRS 2, ‘Share based payments’ (amended).Consists of clarification of the definition of vestingconditions, introduction of the concept of non-vestingconditions and clarification of the treatment ofcancellations. Adoption of this change did not haveany impact on REN SGPS’s separate financialstatements.• IAS 32 / IAS 1 (amendment), ‘Financialinstruments’: presentation (amended). Theseamendments changed the criteria for classifying afinancial instrument between an equity instrumentand a liability instrument, enabling some financialinstruments that can be repurchased to be classifiedas equity instruments. Consequently the amendmentto IAS 1 - ‘Presentation of financial statements’. Thischange did not have any impact on REN SGPS’sseparate financial statements.• IFRS 1 / IAS 27 (amended), ‘First time adoption ofIFRS’ (amendments). These amendments covermeasurement of the cost of investments insubsidiaries, jointly controlled entities andassociations in the initial adoption of IFRS and therecognition of dividends from subsidiaries in separatefinancial statements of the parent company. Thischange did not have any impact on REN SGPS’sseparate financial statements.• IFRIC 13, ‘Client fidelity programs’. Thisinterpretation states that bonuses granted to clientsas part of a sales transaction are recorded as aseparate component of the transaction. Thisinterpretation did not have any impact on RENSGPS’s separate financial statements.• IAS 39 ‘Reclassification of financial assets’(amendments). These amendments permit, in certainlimited conditions, the reclassification of nonderivative financial instruments from the fair valuethrough profit and loss and available for sale
2. Accounting policies
180 | Report and Accounts
Report and Accounts 2009
categories to other categories.• IAS 39’ Eligible hedged items (amendments). Thisdeals with clarifications relating to the followinghedge accounting matters: (i) identification ofinflation as a hedged risk and (ii) hedging withoptions.• IFRS 7 ‘Disclosures regarding measurement at fairvalue and liquidity risk’ (amendments). Theseamendments to IFRS 7 increase the disclosuresrequired regarding the fair value of financialinstruments and liquidity risk.
Improvements to international financial reportingstandards – 2007. This process involved the revisionof 32 accounting standards.Up to the date of approval of these financialstatements the following standards, interpretations,amendments and revisions, with mandatoryapplication in future financial years have beenendorsed by the European Union:
• IFRS 3 (revised), ‘Concentration of activities’ IAS 27(2008 revision) ‘ Consolidated and separate financialstatements’. This revision is of mandatory applicationin years starting on or after 1 July 2009 andintroduces some changes in terms of the recording ofconcentrations of business activities, namely: (a)measurement of interests without control (previouslyreferred to as minority interests); (b) the recognitionand subsequent measurement of contingentpayments; (c) the treatment of direct costs relating tothe concentration; and (d) the recording oftransactions relating to the purchase of interests inentities already controlled and sales of interestswithout that resulting in loss of control. This revisionwill have an impact on future concentrations ofactivities to be made by REN.• IAS 27 (revised 2008), ‘Separate financialstatements’ (applicable to years starting on or after 1July 2009). The revision to this standard has not yetbeen endorsed by the European Union. After revision,the standard comes to require that transactions with‘interests not controlled’ be recorded in equity whenthere is no change in control over the entity. Whenthere are changes in control over the entity, anyremaining interest in the entity is restated to fair valueby corresponding entry to profit and loss for the year.This revision will have an impact on futureconcentrations of activities to be made by REN SGPS.• IFRIC 16, ‘Hedging of investments in foreignoperations’ (to be applied in the years starting on orafter 1 July 2009). This interpretation providesguidelines on hedge accounting for net investmentsin foreign operations. This interpretation has no
impact on REN SGPS’s separate financial statements.• IFRIC 9 and IAS 39 (amendments/revised),‘Revaluation of embedded derivatives’. Thisamendment clarifies in which circumstancessubsequent reappraisal of the obligation to separatean embedded derivative is permitted. Thisamendment will be applied by REN SGPS in the yearit becomes effective.• IFRIC 15, ‘Real estate construction contracts‘ (to beapplied in the years starting on or after 1 January2010). This interpretation covers the way to assess ifan agreement to construct a property is within thescope of IAS 11 – ‘Construction contracts’ or IAS 18 –‘’Income and how the income should be recognized’.This interpretation has not yet been adopted by theEuropean Union. This interpretation will not impactREN SGPS’s separate financial statements.• IFRIC 17, ‘Distributions in kind to the shareholders’(to be applied in the years starting on or after 1 July2009). This interpretation provides guidelines on thecorrect recording of assets other than cash distributedto shareholders as dividends. This interpretation hasnot yet been endorsed by the European Union. Thisinterpretation will be applied by REN SGPS in theyear it becomes effective.• IFRIC 18, ‘Transfers of assets by clients’ (to beapplied in the years starting on or after 1 July 2009).This interpretation provides guidelines with respect tothe recording by operators of tangible fixed assets “ofclients”. This interpretation is significant for the utilitiessector as it establishes the accounting treatment tobe given to agreements in which the entity renderingthe service receives from the client an asset that willbe used in connecting the client or other clients to theservice network or that enables the client to accessthe service network. This interpretation will be appliedby REN SGPS in the year it becomes effective.
These standards although endorsed by the EuropeanUnion, have not been adopted by the Company inthe year ended 31 December 2009 as their adoptionis not yet mandatory. Their adoption is not expectedto have a significant impact on the financialstatements.Draft standards under discussion, issued by the IASB,but not yet approved: Rate Regulated Activities – “ Exposure Draft”(ED/2009/8) – In July 2009 the IASB issued anexposure draft relating to “ Rate Regulated Activities”,its main principles being:
i) Recognition in the financial statements of an entity,of regulated assets and liabilities where the regulatorallows an entity to recover costs previously incurred or
Separate financial statements | 181
where the regulator requires return of the amountspreviously received and allows the entity to obtainspecific remuneration in its regulated activities byadjustment to the prices charged to its clients;ii) Measurement of regulated assets and liabilities atthe present value of expected cash flows to berecovered or returned, respectively, as a result of theregulation, not only on their initial recognition butalso at the end of the period of the financial report;iii) Inclusion of disclosures that identify and explainthe amounts of regulated assets and liabilitiesrecognized in the financial statements so as to ensurethat the users of the financial statements have anunderstanding of the nature and financial effect of itsregulated activities.The Company is analysing and accompanying thediscussion calendar and conclusion of this ExposureDraft, which is of significant importance to the RENGroup in its operations.
Resumo das principais políticas contabilísticas
The main accounting policies used to prepare thesefinancial statements are explained below. Thesepolicies were applied consistently to all the yearspresented, unless otherwise indicated.
3.1 SubsidiariesSubsidiaries are all entities (including special purposeentities) over which REN SGPS has the power todecide the financial and operating policies, generallyassociated with direct or indirect control of more thanone half of the voting rights. The existence and effectof potential voting rights that are currently exercisableor convertible are considered when assessing whetherREN SGPS controls another entity. Entities thatqualify as subsidiaries are listed in Note 8.Participations in subsidiaries are recorded at cost lesspre-acquisition dividends and possible impairmentlosses. Dividends received from subsidiaries arerecorded as income for the year, when the right of theshareholder is established, which occurs by decisionof the Shareholders’ General Meeting. These financial statements refer to the Company innon-consolidated terms, the investments insubsidiaries being recorded at cost. The Company willpresent separate consolidated financial statementswhich will include the financial statements of thecompanies in which it has a majority participation ormanagement control. Therefore these financialstatements do not consider the effect of a fullconsolidation of assets, liabilities, income and costs.
3.2 Foreign currency translation(i) Functional currencyItems included in the financial statements of each ofthe REN SGPS are recorded using the currency of theprimary economic environment in which the entityoperates (‘the functional currency’), the Euro. Theseparate financial statements of REN SGPS andrelated notes are presented in thousands of Euros,unless otherwise indicated.(ii) Foreign currency balances and transactionsForeign currency transactions are translated to thefunctional currency using the exchange ratesprevailing at the dates of the transactions. Exchangegains and losses resulting from the settlement of suchtransactions and from translation of foreign currencymonetary assets and liabilities at the year-endexchange rates are recognised as finance costs in thestatement of profit and loss if relating to borrowingsand in other operating income and costs in the caseof all the other balances/ transactions.
3.3 Tangible fixed assetsTangible fixed assets are stated at cost lessaccumulated depreciation and impairment losses. Cost includes the purchase price of the asset, costsdirectly attributable to their acquisition and costsincurred to prepare the assets to start operating. Current repair and maintenance costs are charged tothe statement of profit and loss for the period inwhich they are incurred.Tangible fixed assets is depreciated on a straight-linebasis over its estimated period of useful life, as fromthe date it is ready for use.The estimated useful life of tangible fixed assets is asfollows:
The useful life of the assets is reviewed at the end ofeach year so that the depreciation recorded is inaccordance with the consumption standards of theassets. Changes in useful lives are treated as changesin accounting estimates and are appliedprospectively.Gains and losses on the sale of assets are determinedby the difference between the proceeds of the saleand the book value of the asset, these being recordedin the statement of profit and loss.
3. Summary of main accounting policies
Years
Transport equipment from 4 to 6
Administrative equipment from 3 to 10
Estimated useful life of tangible fixed assets
182 | Report and Accounts
Report and Accounts 2009
3.4 Financial assetsThe Board of Directors decides the classification offinancial assets at the time of initial recognition, inaccordance with the purpose for which the financialassets were acquired and reassesses thatclassification at each reporting date.Financial assets may be classified into the followingcategories:
vii) financial assets at fair value through profit or loss– includes non-derivative financial assets acquired forshort-term trading and assets designated at fair valuethrough profit and loss at the inception date;viii) loans granted and receivables – includes non-derivative financial assets with fixed or determinablepayments that are not listed in an active market;ix) investments to be held to maturity – includes non-derivative financial assets with fixed or determinablepayments and fixed maturities, that the entity intendsand has the capacity to hold until the maturity date;andx) Available-for-sale financial assets – includes non-derivative financial assets designated asavailable-for-sale at inception date or other financialassets not classified in any of the other financial assetcategories. Available-for-sale financial assets arerecognized as non-current assets unlessmanagement intends to sell them within 12 monthsof the balance sheet date.
Purchases and sales of investments in financial assetsare recognized on the transaction date – the date onwhich REN SGPS commits itself to purchase or sellthe asset.Financial assets at fair value through profit and lossare initially recognised at fair value and transactioncosts are expensed in the consolidated statement ofprofit and loss. Such assets are subsequently adjustedto fair value, gains and losses arising from changes infair value being recognised in the statement of profitand loss caption net financial costs for the period inwhich they arise, which also includes interest incomeand dividends received.Available-for-sale financial assets are initiallyrecognised at fair value including transaction costs. Insubsequent periods these assets are adjusted to fairvalue, the changes in fair value being recognised in afair value reserve within Equity. Dividends and interestincome from available-for-sale financial assets arerecognised in the statement of profit and loss captionother financial income for the period in which theright to receive them is established.The fair value of listed investments is based oncurrent market prices (“bid”). If the market for a
financial asset is not active, REN SGPS establishes fairvalue by using valuation techniques. These includethe use of recent transactions, provided that they areat market prices, reference to other instruments thatare substantially the same and discounted cash flowanalysis when information is available, makingmaximum use of market inputs and relying as little aspossible on entity-specific inputs.Loans granted and receivables are classified as“Trade and other receivables” in the balance sheet,and are carried at amortised cost using the effectiveinterest rate method, less any impairment loss.Impairment loss of trade receivables is establishedwhen there is objective evidence that the Group willnot be able to collect all amounts due in accordancewith the original terms of the transactions that gaverise to the receivables.At each balance sheet reporting date REN SGPSassesses whether there is objective evidence that itsfinancial assets are impaired. In the case of equityinstruments classified as available-for-sale, asignificant or prolonged decline in the fair value ofthe equity instrument below its cost is considered asan indicator that it is impaired. If there is evidence ofloss in value of available-for-sale financial assets, theaccumulated loss – determined as the differencebetween cost and current fair value, less anyimpairment loss on that financial asset previouslyrecognised in the statement of profit or loss – isremoved from equity and recognised in theconsolidated statement of profit and loss. Impairmentlosses on equity instruments, recognised in thestatement of profit and loss, are not reversiblethrough the consolidated statement of profit and loss.Financial assets are derecognised when the rights toreceive cash flows from the investments expire or aretransferred, as well as all the risks and rewards ofownership.
3.5 Cash and cash equivalentsCash and cash equivalents includes cash on hand,bank deposits, other short-term highly liquidinvestments with initial maturities of up to threemonths, and bank overdrafts. Bank overdrafts areshown in the “Borrowings” caption in current liabilitieson the balance sheet, and are included in thestatement of cash flows, as cash and cashequivalents.
3.6 Share capitalOrdinary shares are classified as equity. Incrementalcosts directly attributable to the issuance of newshares or options are shown net of tax, as adeduction in equity from the amount issued.
Separate financial statements | 183
Treasury shares acquired through contract or directlyon the stock market are recognised as a deduction inequity. In accordance with company law REN SGPSmust ensure at all times that there are reserves inEquity to cover the value of treasury shares, limitingthe amount of reserves available for distribution.Treasury shares are recorded at cost if they areacquired in a spot transaction or at estimated fairvalue if acquired in a deferred purchase.
3.7 Financial liabilitiesIAS 39 establishes the classification of financialliabilities in two categories:
i) financial liabilities at fair value through profit andloss;ii) Other financial liabilities
Other financial liabilities include “Borrowings” (Note3.8) and “Trade and other payables”. Trade andother payables are initially recognised at fair valueand subsequently adjusted to amortised cost, usingthe effective interest rate method.
3.8 BorrowingsBorrowings are initially recognised at fair value, net oftransaction costs incurred. Borrowings aresubsequently measured at amortised cost thedifference between the nominal value and the initialfair value being recognised in the statement of profitand loss over the term of the borrowings, using theeffective interest method.Borrowings are classified as current liabilities unlessREN SGPS has an unconditional right to defersettlement of the liability for at least 12 months afterthe balance sheet date, in which case they areclassified as non-current liabilities.
3.9 Derivative financial statementsDerivative financial instruments are initially recordedat fair value at the transaction date, beingsubsequently valued at fair value. The method ofrecognizing fair value gains or losses depends on thedesignation made of the derivative financialinstruments. If they are designated as derivativefinancial instruments for trading, gains or lossesresulting from fair value changes are recognized inthe statement of profit and loss caption “Financeincome” or “Finance costs”. If they are designated ashedging derivative financial instruments, gains orlosses resulting from fair value changes depends onthe nature of the hedged item, which can be a fairvalue hedge or a cash flow hedge.In an operation to hedge fair value of an asset or
liability (“fair value hedge”), the carrying amount ofthe respective asset or liability, measured inaccordance with the defined accounting policy, isadjusted to reflect the fair value change attributed tothe hedged risk. Variations in the fair value ofhedging derivatives are recognized in the statementof profit and loss together with variations in the fairvalue of the hedged assets and liabilities attributed tothe hedged risk.In an operation to hedge exposure to variations infuture cash flows of high probability (“cash-flowhedge”), the effective part of fair value changes in thehedging derivative is recognized in reserves, beingtransferred to the statement of profit and loss in theperiods the fair value changes of the hedged itemaffects profit and loss. The ineffective part of thehedge is recognized in the statement of profit andloss when it occurs.
3.10 Income taxIncome tax expense includes current income tax anddeferred income tax. Income tax is recognised in thestatement of profit and loss, except when related toitems recognised directly in equity. The amount ofincome tax payable is determined based on net profitbefore tax, adjusted in accordance with taxlegislation.Deferred tax is recognised using the liability methodbased on the balance sheet considering thetemporary differences between the tax base of assetsand liabilities and their amounts in the separatefinancial statements.Deferred income taxes is calculated using tax rates inforce or substantially enacted at the balance sheetdate and are expected to apply when the relateddeferred tax asset is realised or the deferred taxliability is settled.Deferred tax assets are recognised to the extent thatit is probable that future taxable profit will beavailable against which the temporary differencescan be used. Deferred tax liabilities are provided foron every temporary tax difference, except thoserelating to: i) the initial recognition of goodwill; or ii)the initial recognition of assets or liabilities intransactions that do not result from a businesscombination and at the time of the transaction affectneither accounting profit nor taxable profit. However,temporary taxable differences relating to investmentsin subsidiaries should not be recognised to the extentthat: i) the parent company is able to control thetiming of the reversal of the temporary difference; andii) it is probable that the temporary difference will notrevert in the near future.The Company is covered in terms of Corporate
184 | Report and Accounts
Report and Accounts 2009
Income Tax by the special regime for the taxation ofgroups of companies. Consequently, the changesrecorded by subsidiaries relating to estimated incometax, withholdings made by third parties and paymentson account are recorded in REN - Redes EnergéticasNacionais, SGPS, S.A.’s balance sheet in the caption“Income tax payable/receivable” by correspondingentry to “Other accounts receivable/payable”.
3.11 ProvisionsProvisions are recognised when REN SGPS has: i) apresent legal or constructive obligation as a result ofpast events; ii) it is more likely than not that anoutflow of resources will be required to settle theobligation; and iii) the amount can be reliablyestimated. When one of these criteria is not fulfilled orthe existence of the liability is dependent upon afuture event, REN SGPS discloses it as a contingentliability, except if the outflow of resources to settle it isconsidered to be remote.Provisions are measured at the present value of theestimated expenditure required to settle the liabilityusing a pre-tax rate that reflects the marketassessment of the discount period and the risk of theprovision (Note 25).
3.12 LeasingThe tangible fixed assets, in which REN hassubstantially all the risks and rewards incidental toownership of an asset, is classified as a finance lease.Agreements which an analysis of one or morematters of the contract point a finance lease are alsoclassified as finance leases. All other leases areclassified as operating leases.Finance lease contracts are initially recognised at thelower of the fair value of the leased assets or thepresent value of the minimum lease payments, eachdetermined at the inception date. The lease liability isrecognised net of interest costs in the captionBorrowings. Interest costs included in the leasepayments and depreciation of the leased assets arerecognised in the consolidated statement of profitand loss in the period they refer to.The tangible fixed assets acquired through financeleases is depreciated at the shorter of the estimateduseful life of the asset and the lease term, when theGroup does not have a purchase option at the end ofthe contract, or at its estimated useful life when theGroup has the intention of acquiring the asset at theend of the contract. In operating lease contracts, the lease payments dueare recognised as expenses in the statement of profitand loss, on a straight-line basis over the lease term.
3.13 Income and accruals basisIncome includes the fair value of the servicesrendered, net of tax and discounts, received orreceivable.Services rendered are recognized in the period towhich they relate in accordance with the accrualsbasis. The amounts recognized as services renderedrefer to amounts charged to subsidiaries on accountof management costs.Income relating to dividends from subsidiaries isrecognized when the right to receive them isattributed to the shareholders.Interest income is recognized on an accruals basis,considering the amount of the liability and theeffective interest rate over the period and to maturity. Income and costs are recorded in the period to whichthey relate, independently of when they are receivedor paid, in accordance with the accruals basis.Differences between the amounts received and paidand the corresponding income and costs arerecorded in accruals and deferrals in the captions“Receivables” and “Payables”. .
3.14 Distribution of dividendsThe distribution of dividends to shareholders isrecognized as a liability in the Company’s financialstatements in the period the dividends are approvedby the shareholders up to the time of their payment.
3.15 Contingent assets and liabilitiesContingent liabilities in which the possibility of theoutflow of funds affecting future financial benefits isonly possible, are not recognized in the separatefinancial statements, but are disclosed in notes, unlessthe possibility of the outflow of funds affecting futurebenefits is remote, in which case they are notdisclosed. Contingent assets are not recognised in the separatefinancial statements, but disclosed in the notes whena future financial benefit is probable.
3.16 Subsequent eventsEvents that occur after the balance sheet date thatprovide additional information on conditions thatexisted at the balance sheet date are reflected in theseparate financial statements. Events that occur afterthe balance sheet date that provide additionalinformation on conditions that existed after thebalance sheet date, if material, are disclosed in thenotes to the separate financial statements.
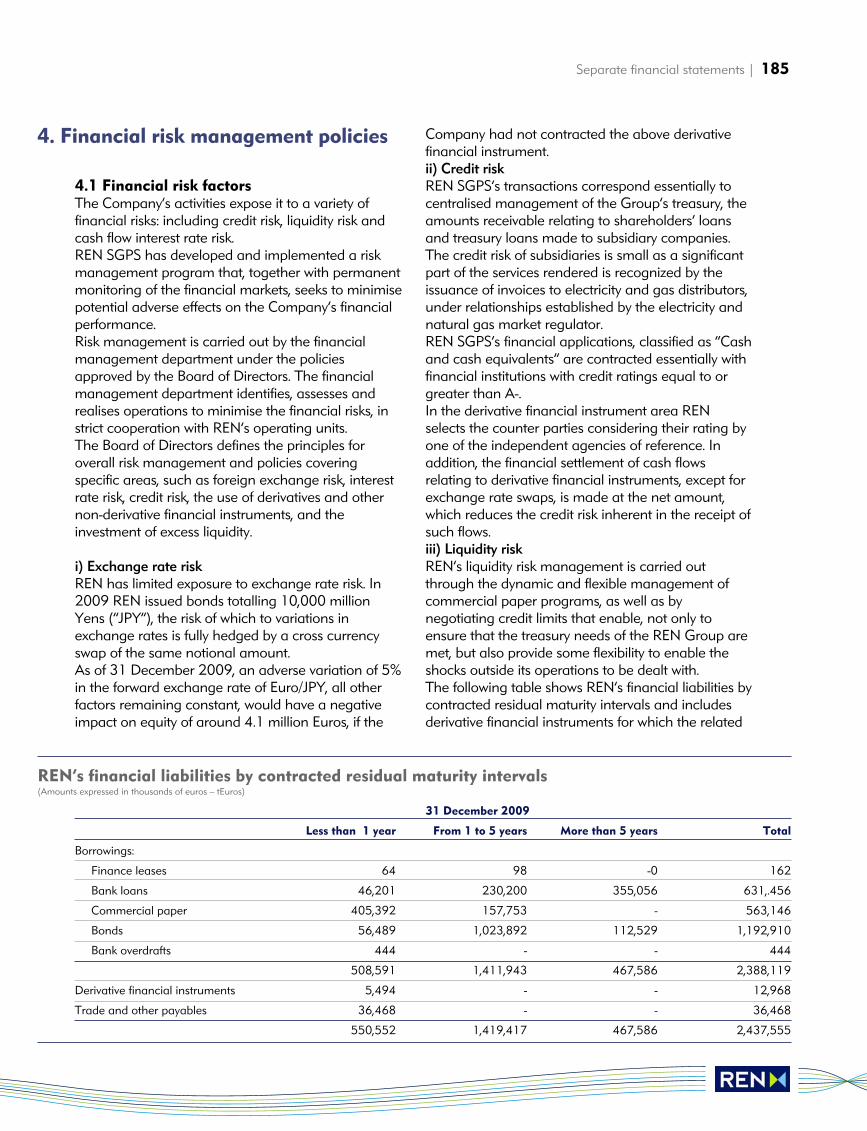
Separate financial statements | 185
4.1 Financial risk factorsThe Company’s activities expose it to a variety offinancial risks: including credit risk, liquidity risk andcash flow interest rate risk.REN SGPS has developed and implemented a riskmanagement program that, together with permanentmonitoring of the financial markets, seeks to minimisepotential adverse effects on the Company’s financialperformance.Risk management is carried out by the financialmanagement department under the policiesapproved by the Board of Directors. The financialmanagement department identifies, assesses andrealises operations to minimise the financial risks, instrict cooperation with REN’s operating units. The Board of Directors defines the principles foroverall risk management and policies coveringspecific areas, such as foreign exchange risk, interestrate risk, credit risk, the use of derivatives and othernon-derivative financial instruments, and theinvestment of excess liquidity.
i) Exchange rate risk REN has limited exposure to exchange rate risk. In2009 REN issued bonds totalling 10,000 millionYens (“JPY”), the risk of which to variations inexchange rates is fully hedged by a cross currencyswap of the same notional amount.As of 31 December 2009, an adverse variation of 5%in the forward exchange rate of Euro/JPY, all otherfactors remaining constant, would have a negativeimpact on equity of around 4.1 million Euros, if the
Company had not contracted the above derivativefinancial instrument.ii) Credit riskREN SGPS’s transactions correspond essentially tocentralised management of the Group’s treasury, theamounts receivable relating to shareholders’ loansand treasury loans made to subsidiary companies. The credit risk of subsidiaries is small as a significantpart of the services rendered is recognized by theissuance of invoices to electricity and gas distributors,under relationships established by the electricity andnatural gas market regulator. REN SGPS’s financial applications, classified as “Cashand cash equivalents” are contracted essentially withfinancial institutions with credit ratings equal to orgreater than A-.In the derivative financial instrument area RENselects the counter parties considering their rating byone of the independent agencies of reference. Inaddition, the financial settlement of cash flowsrelating to derivative financial instruments, except forexchange rate swaps, is made at the net amount,which reduces the credit risk inherent in the receipt ofsuch flows.iii) Liquidity risk REN’s liquidity risk management is carried outthrough the dynamic and flexible management ofcommercial paper programs, as well as bynegotiating credit limits that enable, not only toensure that the treasury needs of the REN Group aremet, but also provide some flexibility to enable theshocks outside its operations to be dealt with.The following table shows REN’s financial liabilities bycontracted residual maturity intervals and includesderivative financial instruments for which the related
4. Financial risk management policies
31 December 2009
Less than 1 year From 1 to 5 years More than 5 years Total
Borrowings:
Finance leases 64 98 -0 162
Bank loans 46,201 230,200 355,056 631,.456
Commercial paper 405,392 157,753 - 563,146
Bonds 56,489 1,023,892 112,529 1,192,910
Bank overdrafts 444 - - 444
508,591 1,411,943 467,586 2,388,119
Derivative financial instruments 5,494 - - 12,968
Trade and other payables 36,468 - - 36,468
550,552 1,419,417 467,586 2,437,555
REN’s financial liabilities by contracted residual maturity intervals(Amounts expressed in thousands of euros – tEuros)
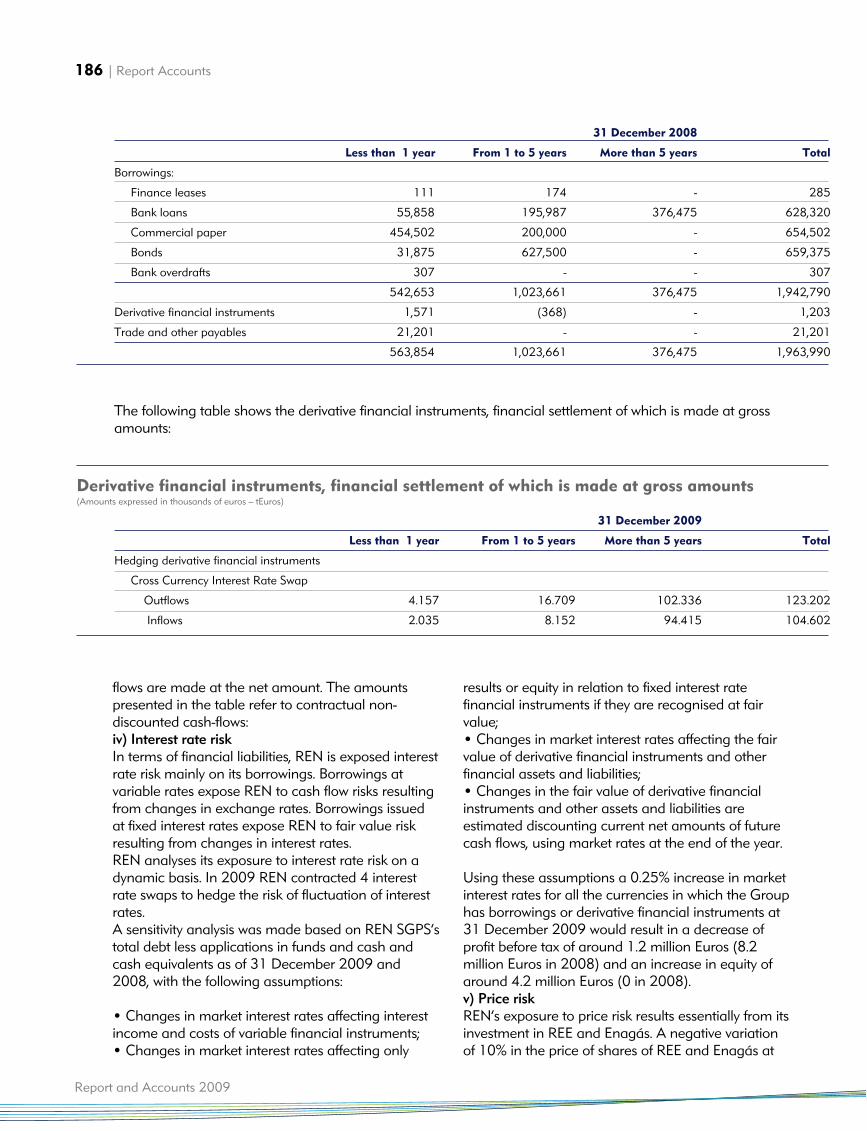
186 | Report Accounts
Report and Accounts 2009
flows are made at the net amount. The amountspresented in the table refer to contractual non-discounted cash-flows:iv) Interest rate riskIn terms of financial liabilities, REN is exposed interestrate risk mainly on its borrowings. Borrowings atvariable rates expose REN to cash flow risks resultingfrom changes in exchange rates. Borrowings issuedat fixed interest rates expose REN to fair value riskresulting from changes in interest rates. REN analyses its exposure to interest rate risk on adynamic basis. In 2009 REN contracted 4 interestrate swaps to hedge the risk of fluctuation of interestrates.A sensitivity analysis was made based on REN SGPS’stotal debt less applications in funds and cash andcash equivalents as of 31 December 2009 and2008, with the following assumptions:
• Changes in market interest rates affecting interestincome and costs of variable financial instruments; • Changes in market interest rates affecting only
results or equity in relation to fixed interest ratefinancial instruments if they are recognised at fairvalue; • Changes in market interest rates affecting the fairvalue of derivative financial instruments and otherfinancial assets and liabilities; • Changes in the fair value of derivative financialinstruments and other assets and liabilities areestimated discounting current net amounts of futurecash flows, using market rates at the end of the year.
Using these assumptions a 0.25% increase in marketinterest rates for all the currencies in which the Grouphas borrowings or derivative financial instruments at31 December 2009 would result in a decrease ofprofit before tax of around 1.2 million Euros (8.2million Euros in 2008) and an increase in equity ofaround 4.2 million Euros (0 in 2008).v) Price risk REN’s exposure to price risk results essentially from itsinvestment in REE and Enagás. A negative variationof 10% in the price of shares of REE and Enagás at
31 December 2008
Less than 1 year From 1 to 5 years More than 5 years Total
Borrowings:
Finance leases 111 174 - 285
Bank loans 55,858 195,987 376,475 628,320
Commercial paper 454,502 200,000 - 654,502
Bonds 31,875 627,500 - 659,375
Bank overdrafts 307 - - 307
542,653 1,023,661 376,475 1,942,790
Derivative financial instruments 1,571 (368) - 1,203
Trade and other payables 21,201 - - 21,201
563,854 1,023,661 376,475 1,963,990
31 December 2009
Less than 1 year From 1 to 5 years More than 5 years Total
Hedging derivative financial instruments
Cross Currency Interest Rate Swap
Outflows 4.157 16.709 102.336 123.202
Inflows 2.035 8.152 94.415 104.602
Derivative financial instruments, financial settlement of which is made at gross amounts(Amounts expressed in thousands of euros – tEuros)
The following table shows the derivative financial instruments, financial settlement of which is made at grossamounts:
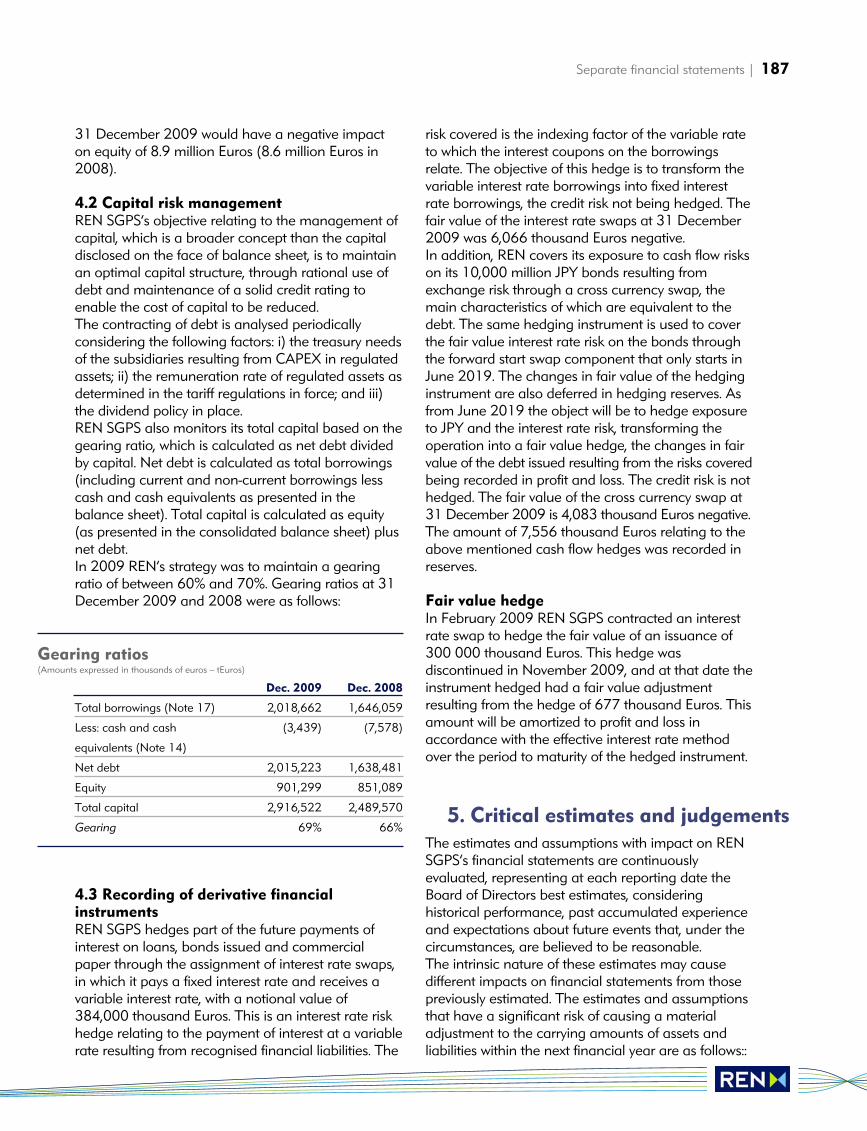
Separate financial statements | 187
31 December 2009 would have a negative impacton equity of 8.9 million Euros (8.6 million Euros in2008).
4.2 Capital risk managementREN SGPS’s objective relating to the management ofcapital, which is a broader concept than the capitaldisclosed on the face of balance sheet, is to maintainan optimal capital structure, through rational use ofdebt and maintenance of a solid credit rating toenable the cost of capital to be reduced.The contracting of debt is analysed periodicallyconsidering the following factors: i) the treasury needsof the subsidiaries resulting from CAPEX in regulatedassets; ii) the remuneration rate of regulated assets asdetermined in the tariff regulations in force; and iii)the dividend policy in place.REN SGPS also monitors its total capital based on thegearing ratio, which is calculated as net debt dividedby capital. Net debt is calculated as total borrowings(including current and non-current borrowings lesscash and cash equivalents as presented in thebalance sheet). Total capital is calculated as equity(as presented in the consolidated balance sheet) plusnet debt.In 2009 REN’s strategy was to maintain a gearingratio of between 60% and 70%. Gearing ratios at 31December 2009 and 2008 were as follows:
quadro pag 2354.3 Recording of derivative financialinstrumentsREN SGPS hedges part of the future payments ofinterest on loans, bonds issued and commercialpaper through the assignment of interest rate swaps,in which it pays a fixed interest rate and receives avariable interest rate, with a notional value of384,000 thousand Euros. This is an interest rate riskhedge relating to the payment of interest at a variablerate resulting from recognised financial liabilities. The
risk covered is the indexing factor of the variable rateto which the interest coupons on the borrowingsrelate. The objective of this hedge is to transform thevariable interest rate borrowings into fixed interestrate borrowings, the credit risk not being hedged. Thefair value of the interest rate swaps at 31 December2009 was 6,066 thousand Euros negative.In addition, REN covers its exposure to cash flow riskson its 10,000 million JPY bonds resulting fromexchange risk through a cross currency swap, themain characteristics of which are equivalent to thedebt. The same hedging instrument is used to coverthe fair value interest rate risk on the bonds throughthe forward start swap component that only starts inJune 2019. The changes in fair value of the hedginginstrument are also deferred in hedging reserves. Asfrom June 2019 the object will be to hedge exposureto JPY and the interest rate risk, transforming theoperation into a fair value hedge, the changes in fairvalue of the debt issued resulting from the risks coveredbeing recorded in profit and loss. The credit risk is nothedged. The fair value of the cross currency swap at31 December 2009 is 4,083 thousand Euros negative. The amount of 7,556 thousand Euros relating to theabove mentioned cash flow hedges was recorded inreserves.
Fair value hedge In February 2009 REN SGPS contracted an interestrate swap to hedge the fair value of an issuance of300 000 thousand Euros. This hedge wasdiscontinued in November 2009, and at that date theinstrument hedged had a fair value adjustmentresulting from the hedge of 677 thousand Euros. Thisamount will be amortized to profit and loss inaccordance with the effective interest rate methodover the period to maturity of the hedged instrument.Prin
cipais estimativas e julgamentos The estimates and assumptions with impact on RENSGPS’s financial statements are continuouslyevaluated, representing at each reporting date theBoard of Directors best estimates, consideringhistorical performance, past accumulated experienceand expectations about future events that, under thecircumstances, are believed to be reasonable.The intrinsic nature of these estimates may causedifferent impacts on financial statements from thosepreviously estimated. The estimates and assumptionsthat have a significant risk of causing a materialadjustment to the carrying amounts of assets andliabilities within the next financial year are as follows::
Dec. 2009 Dec. 2008
Total borrowings (Note 17) 2,018,662 1,646,059
Less: cash and cash (3,439) (7,578)
equivalents (Note 14)
Net debt 2,015,223 1,638,481
Equity 901,299 851,089
Total capital 2,916,522 2,489,570
Gearing 69% 66%
Gearing ratios(Amounts expressed in thousands of euros – tEuros)
5. Critical estimates and judgements
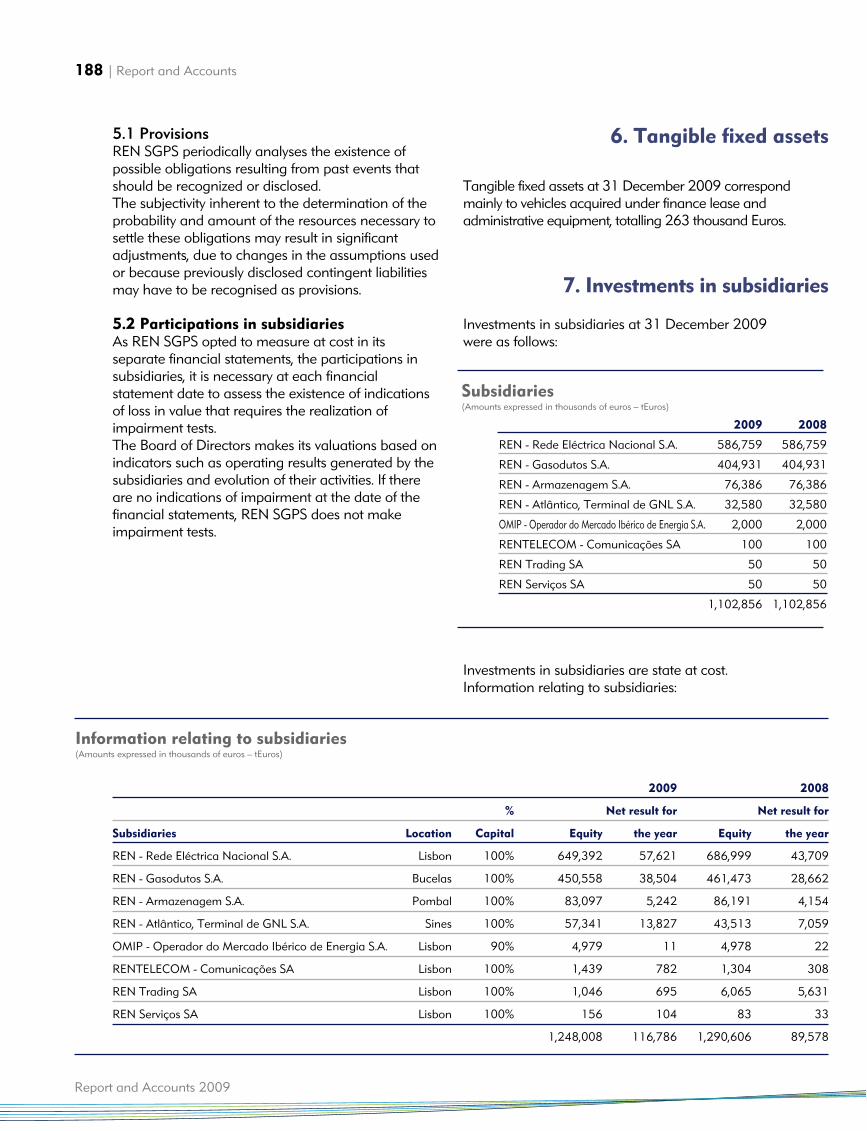
188 | Report and Accounts
Report and Accounts 2009
5.1 ProvisionsREN SGPS periodically analyses the existence ofpossible obligations resulting from past events thatshould be recognized or disclosed. The subjectivity inherent to the determination of theprobability and amount of the resources necessary tosettle these obligations may result in significantadjustments, due to changes in the assumptions usedor because previously disclosed contingent liabilitiesmay have to be recognised as provisions.
5.2 Participations in subsidiaries As REN SGPS opted to measure at cost in itsseparate financial statements, the participations insubsidiaries, it is necessary at each financialstatement date to assess the existence of indicationsof loss in value that requires the realization ofimpairment tests. The Board of Directors makes its valuations based onindicators such as operating results generated by thesubsidiaries and evolution of their activities. If thereare no indications of impairment at the date of thefinancial statements, REN SGPS does not makeimpairment tests.
Activos fixos tangíveisTangible fixed assets at 31 December 2009 correspondmainly to vehicles acquired under finance lease andadministrative equipment, totalling 263 thousand Euros.Participações e
m empresas subsidiárias
Investments in subsidiaries at 31 December 2009were as follows:
Investments in subsidiaries are state at cost. Information relating to subsidiaries:
6. Tangible fixed assets
7. Investments in subsidiaries
2009 2008
REN - Rede Eléctrica Nacional S.A. 586,759 586,759
REN - Gasodutos S.A. 404,931 404,931
REN - Armazenagem S.A. 76,386 76,386
REN - Atlântico, Terminal de GNL S.A. 32,580 32,580
OMIP - Operador do Mercado Ibérico de Energia S.A. 2,000 2,000
RENTELECOM - Comunicações SA 100 100
REN Trading SA 50 50
REN Serviços SA 50 50
1,102,856 1,102,856
Subsidiaries(Amounts expressed in thousands of euros – tEuros)
2009 2008
% Net result for Net result for
Subsidiaries Location Capital Equity the year Equity the year
REN - Rede Eléctrica Nacional S.A. Lisbon 100% 649,392 57,621 686,999 43,709
REN - Gasodutos S.A. Bucelas 100% 450,558 38,504 461,473 28,662
REN - Armazenagem S.A. Pombal 100% 83,097 5,242 86,191 4,154
REN - Atlântico, Terminal de GNL S.A. Sines 100% 57,341 13,827 43,513 7,059
OMIP - Operador do Mercado Ibérico de Energia S.A. Lisbon 90% 4,979 11 4,978 22
RENTELECOM - Comunicações SA Lisbon 100% 1,439 782 1,304 308
REN Trading SA Lisbon 100% 1,046 695 6,065 5,631
REN Serviços SA Lisbon 100% 156 104 83 33
1,248,008 116,786 1,290,606 89,578
Information relating to subsidiaries(Amounts expressed in thousands of euros – tEuros)
Separate financial statements | 189
quadro2 pag 237
Impostos diferidos Deferred tax recognized in the financial statements isas follows:quadro3 pag 237
The changes in deferred tax assets and liabilitieswere as follows:quadro1 pag 238
The changes in deferred tax were as follows: quadro2 pag 238Activos e passivos financeiros por categoria
8. Deferred tax
2009 2008
Deferred tax assets 1,225 -
Deferred tax liabilities 232 (232)
1,457 (232)
1,540 2,099
Deferred tax assets 1,540 2,099
Net impact of deferred tax 2,996 1,866
Deferred tax recognized(Amounts expressed in thousands of euros – tEuros)
Deferred tax(Amounts expressed in thousands of euros – tEuros)
Deferred Deferred Total
tax tax
assets liabilities
At 1 January 2008 - (1,139) (1,139)
Increase/decrease
through equity 959 1,139 2,099
Increase through profit and loss - (232) (232)
Changes in the period 959 907 1,866
At 31 December 2008 959 (232) 727
At 1 January 2009 959 (232) 727
Increase/decrease
through equity 1,540 - 1,540
Increase through profit and loss 1,224 - 1,224
Reversal through profit and loss - 232 232
Changes in the period 2,764 232 2,996
At 31 December 2009 3,723 (0) 3,723
Deferred tax assets and liabilities(Amounts expressed in thousands of euros – tEuros)
2009 2008
Liabilities
Derivative financial instruments (232) 232
Available-for-sale assets - (1,139)
Assets
Available-for-sale assets (463) 959
Tax losses carried forward 1,051 -
Derivative financial instruments 2,176 -
Changes in the year 2,996 727
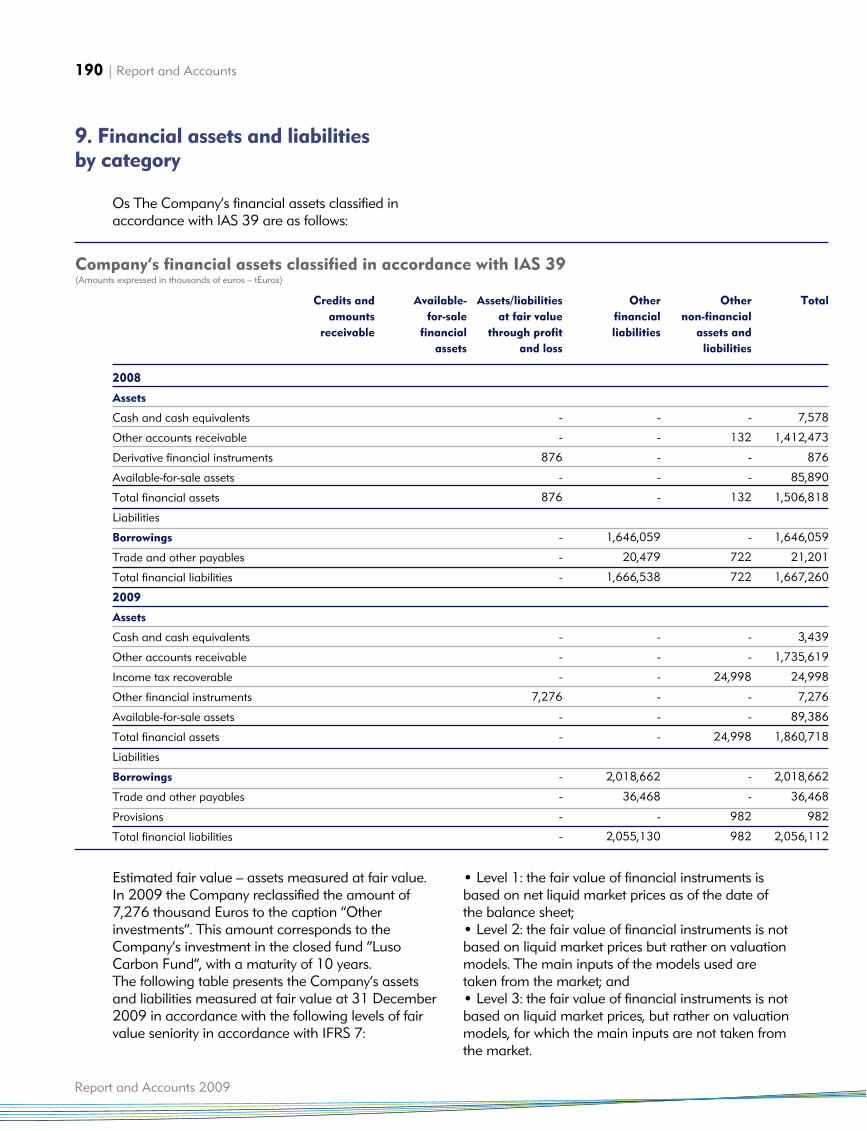
• Level 1: the fair value of financial instruments isbased on net liquid market prices as of the date ofthe balance sheet;• Level 2: the fair value of financial instruments is notbased on liquid market prices but rather on valuationmodels. The main inputs of the models used aretaken from the market; and• Level 3: the fair value of financial instruments is notbased on liquid market prices, but rather on valuationmodels, for which the main inputs are not taken fromthe market.
Os The Company’s financial assets classified inaccordance with IAS 39 are as follows:
Estimated fair value – assets measured at fair value. In 2009 the Company reclassified the amount of7,276 thousand Euros to the caption “Otherinvestments”. This amount corresponds to theCompany’s investment in the closed fund “LusoCarbon Fund”, with a maturity of 10 years.The following table presents the Company’s assetsand liabilities measured at fair value at 31 December2009 in accordance with the following levels of fairvalue seniority in accordance with IFRS 7:
Créditos Activos Activos/passivos Outros Outros Total
e valores financeiros ao justo valor passivos activos/
a receber disponiveis por via financeiros passivos não
para venda resultados financeiros
2008
Activos
Caixa e equivalentes de caixa 7,578 - - - - 7,578
Outras contas a receber 1,412,342 - - - 132 1,412,473
Instrumento financeiros derivados - - 876 - - 876
Activos disponiveis para venda - 85,890 - - - 85,890
Total activos financeiros 1,419,920 85,890 876 - 132 1,506,818
Passivos
Empréstimos obtidos - - - 1,646,059 - 1,646,059
Fornecedores e contas a pagar - - - 20,479 722 21,201
Total passivos financeiros - - - 1,666,538 722 1,667,260
2009
Activos
Caixa e equivalentes de caixa 3,439 - - - - 3,439
Outras contas a receber 1,735,619 - - - - 1,735,619
Imposto sobre o rendimento a receber - - - - 24,998 24,998
Outros instrumentos financeiros - - 7,276 - - 7,276
Activos disponiveis para venda - 89,386 - - - 89,386
Total activos financeiros 1,739,058 89,386 - - 24,998 1,860,718
Passivos
Empréstimos obtidos - - - 2,018,662 - 2,018,662
Fornecedores e contas a pagar - - - 36,468 - 36,468
Provisões - - - - 982 982
Total passivos financeiros - - - 2,055,130 982 2,056,112
2008
Assets
Cash and cash equivalents
Other accounts receivable
Derivative financial instruments
Available-for-sale assets
Total financial assets
Liabilities
Borrowings
Trade and other payables
Total financial liabilities
2009
Assets
Cash and cash equivalents
Other accounts receivable
Income tax recoverable
Other financial instruments
Available-for-sale assets
Total financial assets
Liabilities
Borrowings
Trade and other payables
Provisions
Total financial liabilities
190 | Report and Accounts
Report and Accounts 2009
Credits and Available- Assets/liabilities Other Other Total
amounts for-sale at fair value financial non-financial
receivable financial through profit liabilities assets and
assets and loss liabilities
Company’s financial assets classified in accordance with IAS 39(Amounts expressed in thousands of euros – tEuros)
9. Financial assets and liabilities by category
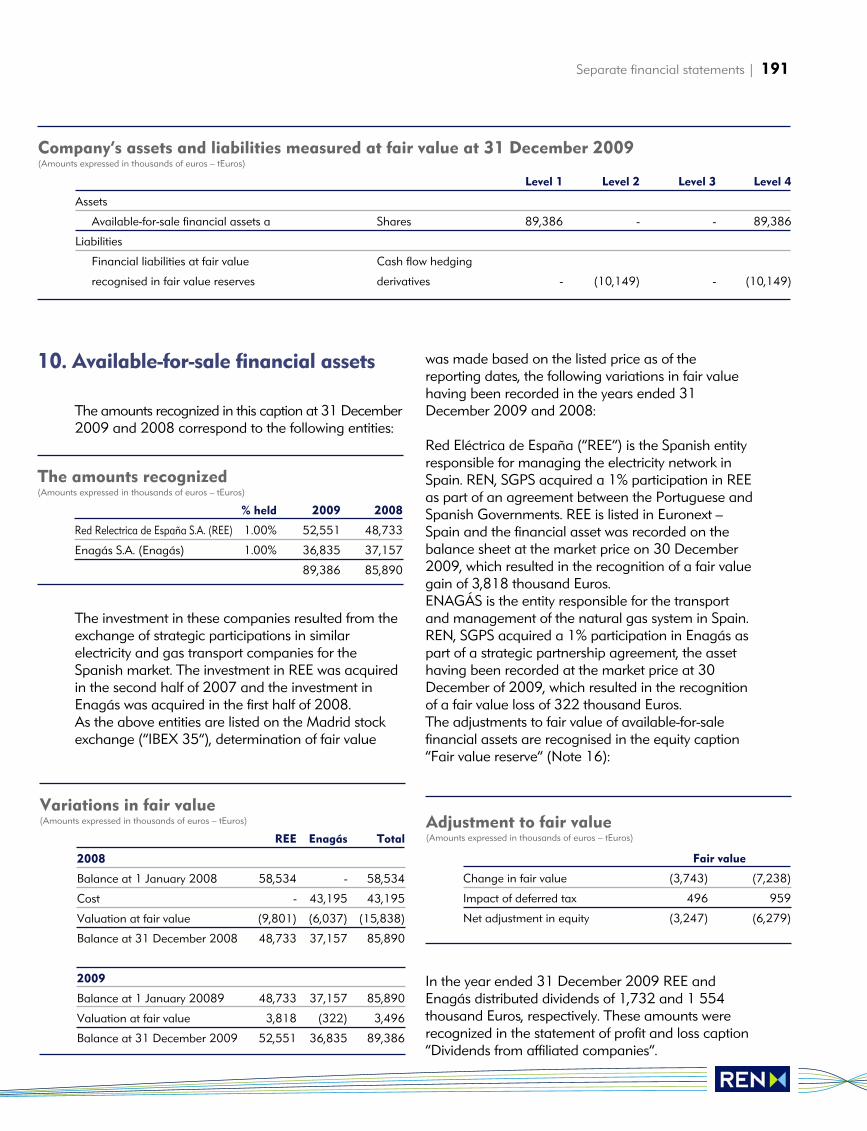
quadro2 pag 239
The amounts recognized in this caption at 31 December2009 and 2008 correspond to the following entities:quadro1 pag 240
The investment in these companies resulted from theexchange of strategic participations in similarelectricity and gas transport companies for theSpanish market. The investment in REE was acquiredin the second half of 2007 and the investment inEnagás was acquired in the first half of 2008. As the above entities are listed on the Madrid stockexchange (“IBEX 35”), determination of fair value
was made based on the listed price as of thereporting dates, the following variations in fair valuehaving been recorded in the years ended 31December 2009 and 2008:
Red Eléctrica de España (“REE”) is the Spanish entityresponsible for managing the electricity network inSpain. REN, SGPS acquired a 1% participation in REEas part of an agreement between the Portuguese andSpanish Governments. REE is listed in Euronext –Spain and the financial asset was recorded on thebalance sheet at the market price on 30 December2009, which resulted in the recognition of a fair valuegain of 3,818 thousand Euros.ENAGÁS is the entity responsible for the transportand management of the natural gas system in Spain.REN, SGPS acquired a 1% participation in Enagás aspart of a strategic partnership agreement, the assethaving been recorded at the market price at 30December of 2009, which resulted in the recognitionof a fair value loss of 322 thousand Euros.The adjustments to fair value of available-for-salefinancial assets are recognised in the equity caption“Fair value reserve” (Note 16):quadro3 pag 240
In the year ended 31 December 2009 REE andEnagás distributed dividends of 1,732 and 1 554thousand Euros, respectively. These amounts wererecognized in the statement of profit and loss caption“Dividends from affiliated companies”.
Separate financial statements | 191
Level 1 Level 2 Level 3 Level 4
Assets
Available-for-sale financial assets a Shares 89,386 - - 89,386
Liabilities
Financial liabilities at fair value Cash flow hedging
recognised in fair value reserves derivatives - (10,149) - (10,149)
Company’s assets and liabilities measured at fair value at 31 December 2009(Amounts expressed in thousands of euros – tEuros)
10. Available-for-sale financial assets
% held 2009 2008
Red Relectrica de España S.A. (REE) 1.00% 52,551 48,733
Enagás S.A. (Enagás) 1.00% 36,835 37,157
89,386 85,890
The amounts recognized(Amounts expressed in thousands of euros – tEuros)
REE Enagás Total
2008
Balance at 1 January 2008 58,534 - 58,534
Cost - 43,195 43,195
Valuation at fair value (9,801) (6,037) (15,838)
Balance at 31 December 2008 48,733 37,157 85,890
2009
Balance at 1 January 20089 48,733 37,157 85,890
Valuation at fair value 3,818 (322) 3,496
Balance at 31 December 2009 52,551 36,835 89,386
Variations in fair value(Amounts expressed in thousands of euros – tEuros)
Fair value
Change in fair value (3,743) (7,238)
Impact of deferred tax 496 959
Net adjustment in equity (3,247) (6,279)
Adjustment to fair value(Amounts expressed in thousands of euros – tEuros)
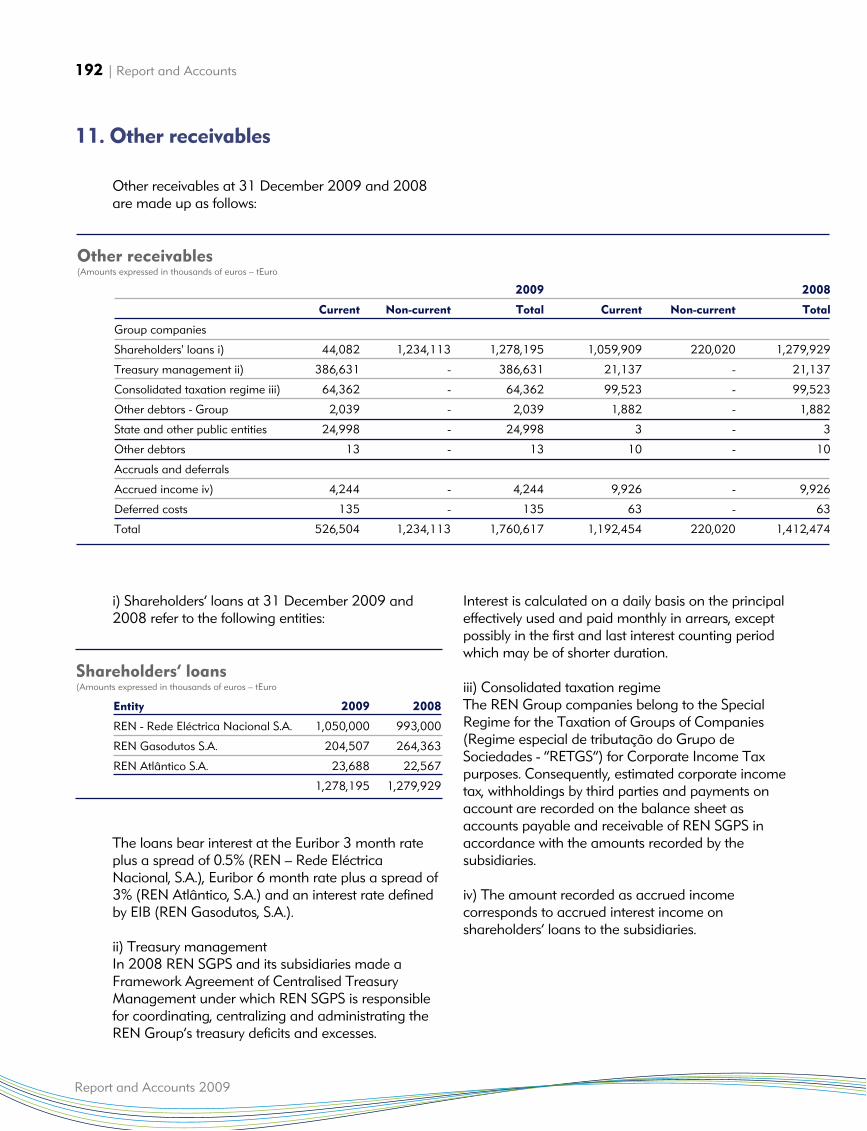
Other receivables at 31 December 2009 and 2008are made up as follows:
i) Shareholders’ loans at 31 December 2009 and2008 refer to the following entities:quadro2 pag 241
The loans bear interest at the Euribor 3 month rateplus a spread of 0.5% (REN – Rede EléctricaNacional, S.A.), Euribor 6 month rate plus a spread of3% (REN Atlântico, S.A.) and an interest rate definedby EIB (REN Gasodutos, S.A.).
ii) Treasury management In 2008 REN SGPS and its subsidiaries made aFramework Agreement of Centralised TreasuryManagement under which REN SGPS is responsiblefor coordinating, centralizing and administrating theREN Group’s treasury deficits and excesses.
Interest is calculated on a daily basis on the principaleffectively used and paid monthly in arrears, exceptpossibly in the first and last interest counting periodwhich may be of shorter duration.
iii) Consolidated taxation regime The REN Group companies belong to the SpecialRegime for the Taxation of Groups of Companies(Regime especial de tributação do Grupo deSociedades - “RETGS”) for Corporate Income Taxpurposes. Consequently, estimated corporate incometax, withholdings by third parties and payments onaccount are recorded on the balance sheet asaccounts payable and receivable of REN SGPS inaccordance with the amounts recorded by thesubsidiaries.
iv) The amount recorded as accrued incomecorresponds to accrued interest income onshareholders’ loans to the subsidiaries.
Instrumentos financeiros derivados
192 | Report and Accounts
Report and Accounts 2009
Entity 2009 2008
REN - Rede Eléctrica Nacional S.A. 1,050,000 993,000
REN Gasodutos S.A. 204,507 264,363
REN Atlântico S.A. 23,688 22,567
1,278,195 1,279,929
Shareholders’ loans(Amounts expressed in thousands of euros – tEuro
2009 2008
Current Non-current Total Current Non-current Total
Group companies
Shareholders' loans i) 44,082 1,234,113 1,278,195 1,059,909 220,020 1,279,929
Treasury management ii) 386,631 - 386,631 21,137 - 21,137
Consolidated taxation regime iii) 64,362 - 64,362 99,523 - 99,523
Other debtors - Group 2,039 - 2,039 1,882 - 1,882
State and other public entities 24,998 - 24,998 3 - 3
Other debtors 13 - 13 10 - 10
Accruals and deferrals
Accrued income iv) 4,244 - 4,244 9,926 - 9,926
Deferred costs 135 - 135 63 - 63
Total 526,504 1,234,113 1,760,617 1,192,454 220,020 1,412,474
Other receivables(Amounts expressed in thousands of euros – tEuro
11. Other receivables
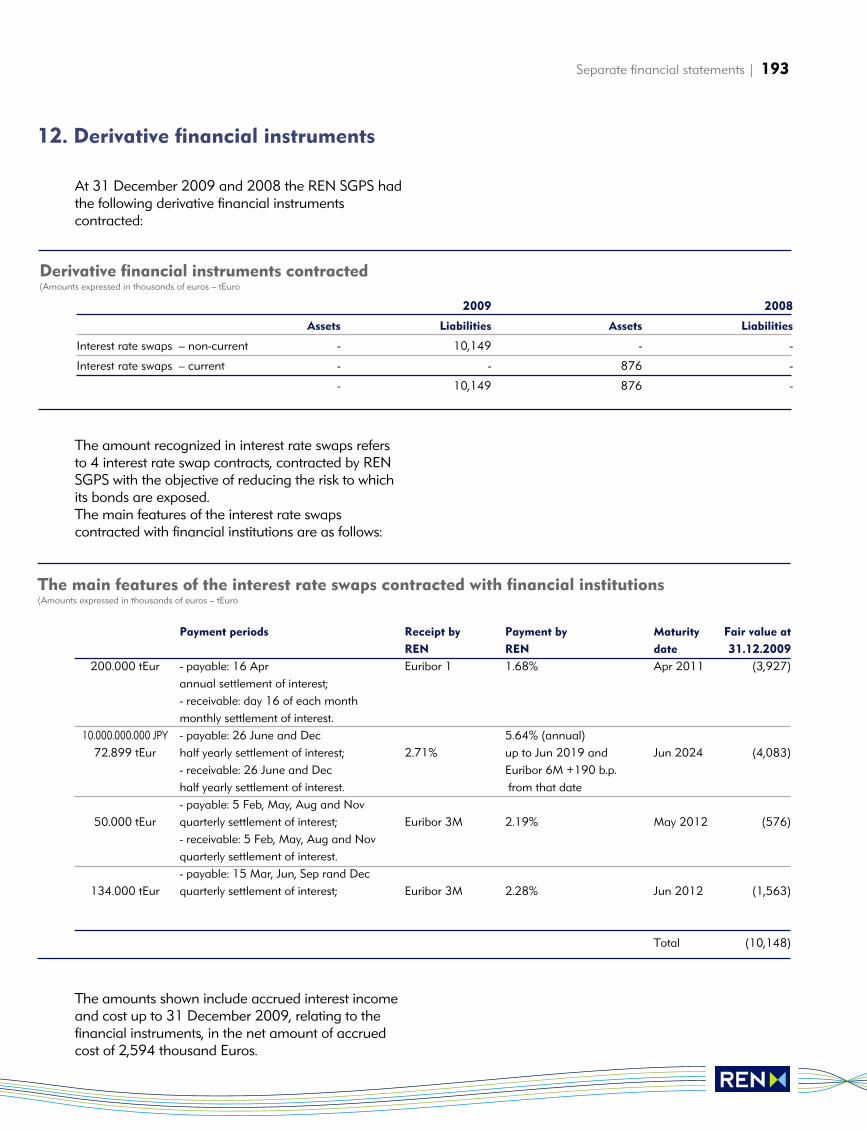
At 31 December 2009 and 2008 the REN SGPS hadthe following derivative financial instrumentscontracted:
The amount recognized in interest rate swaps refersto 4 interest rate swap contracts, contracted by RENSGPS with the objective of reducing the risk to whichits bonds are exposed.The main features of the interest rate swapscontracted with financial institutions are as follows:quadro2 p 242
The amounts shown include accrued interest incomeand cost up to 31 December 2009, relating to thefinancial instruments, in the net amount of accruedcost of 2,594 thousand Euros.
Separate financial statements | 193
12. Derivative financial instruments
2009 2008
Assets Liabilities Assets Liabilities
Interest rate swaps – non-current - 10,149 - -
Interest rate swaps – current - - 876 -
- 10,149 876 -
Derivative financial instruments contracted(Amounts expressed in thousands of euros – tEuro
Payment periods Receipt by Payment by Maturity Fair value at
REN REN date 31.12.2009
200.000 tEur - payable: 16 Apr Euribor 1 1.68% Apr 2011 (3,927)annual settlement of interest;- receivable: day 16 of each monthmonthly settlement of interest.
10.000.000.000 JPY - payable: 26 June and Dec 5.64% (annual) 72.899 tEur half yearly settlement of interest; 2.71% up to Jun 2019 and Jun 2024 (4,083)
- receivable: 26 June and Dec Euribor 6M +190 b.p. half yearly settlement of interest. from that date- payable: 5 Feb, May, Aug and Nov
50.000 tEur quarterly settlement of interest; Euribor 3M 2.19% May 2012 (576)- receivable: 5 Feb, May, Aug and Novquarterly settlement of interest.- payable: 15 Mar, Jun, Sep rand Dec
134.000 tEur quarterly settlement of interest; Euribor 3M 2.28% Jun 2012 (1,563)
Total (10,148)
The main features of the interest rate swaps contracted with financial institutions(Amounts expressed in thousands of euros – tEuro
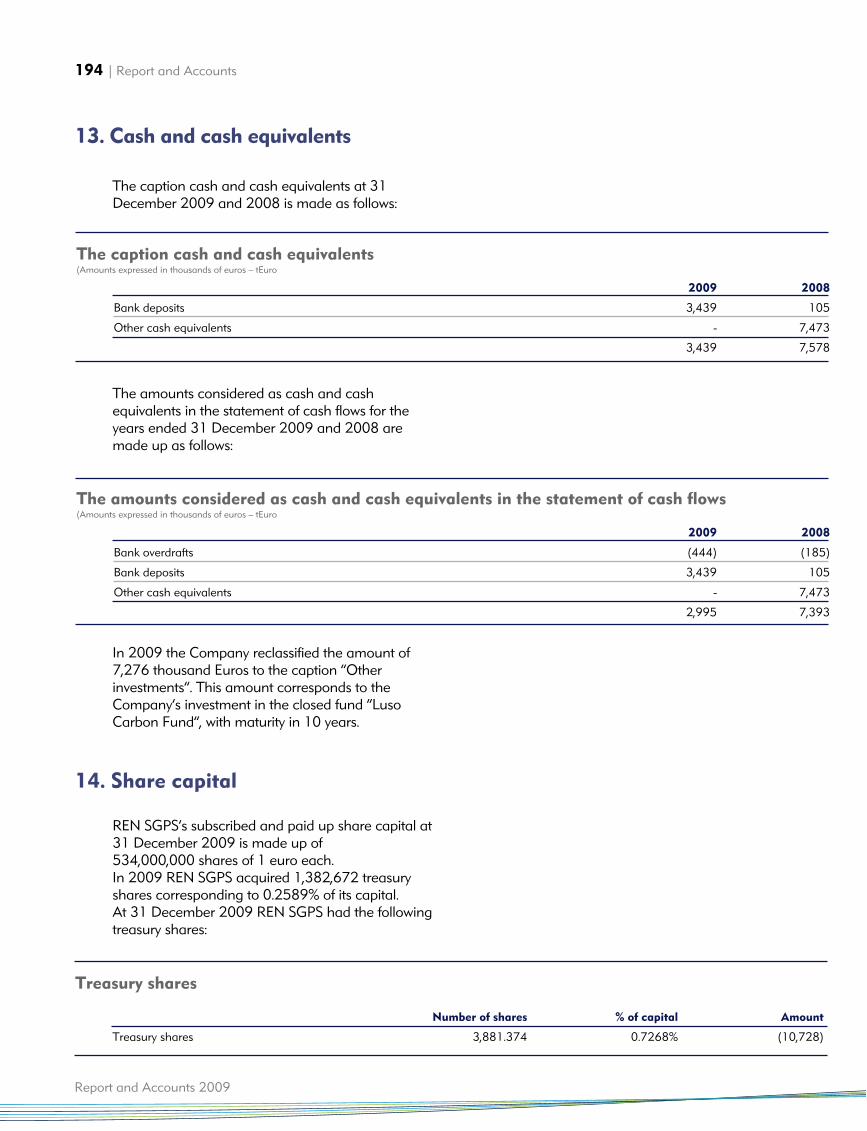
The caption cash and cash equivalents at 31December 2009 and 2008 is made as follows: quadro3 pag 242 e
The amounts considered as cash and cashequivalents in the statement of cash flows for theyears ended 31 December 2009 and 2008 aremade up as follows:
In 2009 the Company reclassified the amount of7,276 thousand Euros to the caption “Otherinvestments”. This amount corresponds to theCompany’s investment in the closed fund “LusoCarbon Fund”, with maturity in 10 years.
Capital social
REN SGPS’s subscribed and paid up share capital at31 December 2009 is made up of 534,000,000 shares of 1 euro each. In 2009 REN SGPS acquired 1,382,672 treasuryshares corresponding to 0.2589% of its capital.At 31 December 2009 REN SGPS had the followingtreasury shares:quadro1 pag 244
194 | Report and Accounts
Report and Accounts 2009
13. Cash and cash equivalents
14. Share capital
Number of shares % of capital Amount
Treasury shares 3,881.374 0.7268% (10,728)
Treasury shares
2009 2008
Bank deposits 3,439 105
Other cash equivalents - 7,473
3,439 7,578
The caption cash and cash equivalents(Amounts expressed in thousands of euros – tEuro
2009 2008
Bank overdrafts (444) (185)
Bank deposits 3,439 105
Other cash equivalents - 7,473
2,995 7,393
The amounts considered as cash and cash equivalents in the statement of cash flows(Amounts expressed in thousands of euros – tEuro
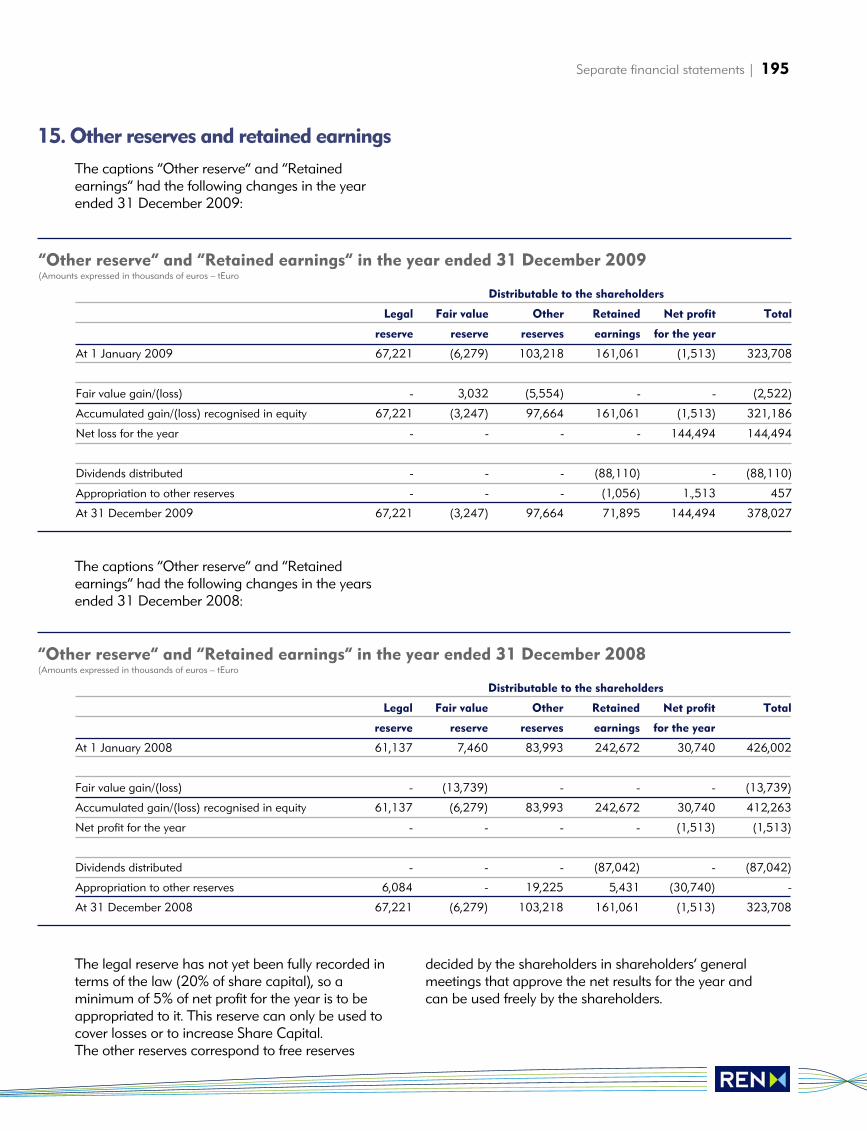
Separate financial statements | 195
Outras reservas e resultados acumulados
The captions “Other reserve” and “Retainedearnings” had the following changes in the yearended 31 December 2009:quadro2 pag 244
The captions “Other reserve” and “Retainedearnings” had the following changes in the yearsended 31 December 2008:
The legal reserve has not yet been fully recorded interms of the law (20% of share capital), so aminimum of 5% of net profit for the year is to beappropriated to it. This reserve can only be used tocover losses or to increase Share Capital.The other reserves correspond to free reserves
decided by the shareholders in shareholders’ generalmeetings that approve the net results for the year andcan be used freely by the shareholders.
Empréstimos
Distributable to the shareholders
Legal Fair value Other Retained Net profit Total
reserve reserve reserves earnings for the year
At 1 January 2008 61,137 7,460 83,993 242,672 30,740 426,002
Fair value gain/(loss) - (13,739) - - - (13,739)
Accumulated gain/(loss) recognised in equity 61,137 (6,279) 83,993 242,672 30,740 412,263
Net profit for the year - - - - (1,513) (1,513)
Dividends distributed - - - (87,042) - (87,042)
Appropriation to other reserves 6,084 - 19,225 5,431 (30,740) -
At 31 December 2008 67,221 (6,279) 103,218 161,061 (1,513) 323,708
“Other reserve” and “Retained earnings” in the year ended 31 December 2008(Amounts expressed in thousands of euros – tEuro
Distributable to the shareholders
Legal Fair value Other Retained Net profit Total
reserve reserve reserves earnings for the year
At 1 January 2009 67,221 (6,279) 103,218 161,061 (1,513) 323,708
Fair value gain/(loss) - 3,032 (5,554) - - (2,522)
Accumulated gain/(loss) recognised in equity 67,221 (3,247) 97,664 161,061 (1,513) 321,186
Net loss for the year - - - - 144,494 144,494
Dividends distributed - - - (88,110) - (88,110)
Appropriation to other reserves - - - (1,056) 1.,513 457
At 31 December 2009 67,221 (3,247) 97,664 71,895 144,494 378,027
“Other reserve” and “Retained earnings” in the year ended 31 December 2009(Amounts expressed in thousands of euros – tEuro
15. Other reserves and retained earnings
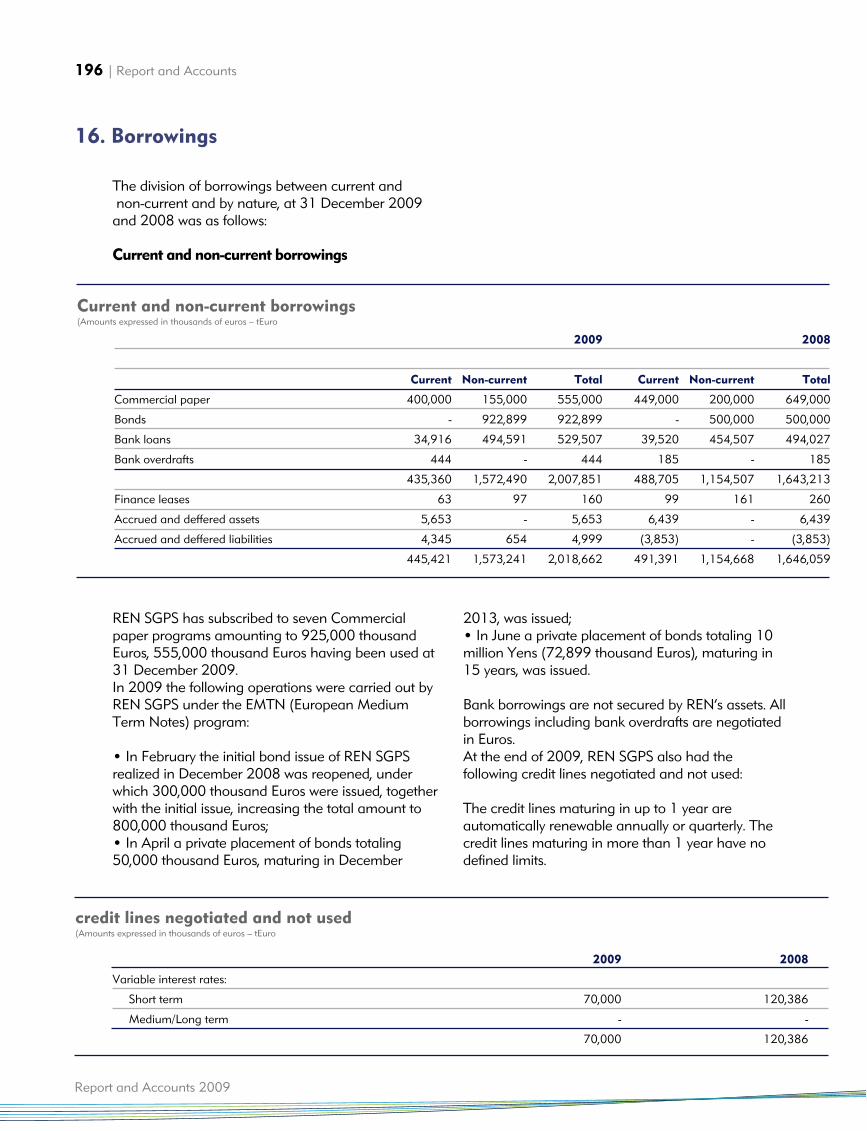
196 | Report and Accounts
Report and Accounts 2009
The division of borrowings between current andnon-current and by nature, at 31 December 2009
and 2008 was as follows:
Current and non-current borrowings quadro1 pag245
REN SGPS has subscribed to seven Commercialpaper programs amounting to 925,000 thousandEuros, 555,000 thousand Euros having been used at31 December 2009.In 2009 the following operations were carried out byREN SGPS under the EMTN (European MediumTerm Notes) program:
• In February the initial bond issue of REN SGPSrealized in December 2008 was reopened, underwhich 300,000 thousand Euros were issued, togetherwith the initial issue, increasing the total amount to800,000 thousand Euros; • In April a private placement of bonds totaling50,000 thousand Euros, maturing in December
2013, was issued; • In June a private placement of bonds totaling 10million Yens (72,899 thousand Euros), maturing in15 years, was issued.
Bank borrowings are not secured by REN’s assets. Allborrowings including bank overdrafts are negotiatedin Euros.At the end of 2009, REN SGPS also had thefollowing credit lines negotiated and not used:
The credit lines maturing in up to 1 year areautomatically renewable annually or quarterly. Thecredit lines maturing in more than 1 year have nodefined limits.
16. Borrowings
2009 2008
Current Non-current Total Current Non-current Total
Commercial paper 400,000 155,000 555,000 449,000 200,000 649,000
Bonds - 922,899 922,899 - 500,000 500,000
Bank loans 34,916 494,591 529,507 39,520 454,507 494,027
Bank overdrafts 444 - 444 185 - 185
435,360 1,572,490 2,007,851 488,705 1,154,507 1,643,213
Finance leases 63 97 160 99 161 260
Accrued and deffered assets 5,653 - 5,653 6,439 - 6,439
Accrued and deffered liabilities 4,345 654 4,999 (3,853) - (3,853)
445,421 1,573,241 2,018,662 491,391 1,154,668 1,646,059
Current and non-current borrowings (Amounts expressed in thousands of euros – tEuro
2009 2008
Variable interest rates:
Short term 70,000 120,386
Medium/Long term - -
70,000 120,386
credit lines negotiated and not used(Amounts expressed in thousands of euros – tEuro
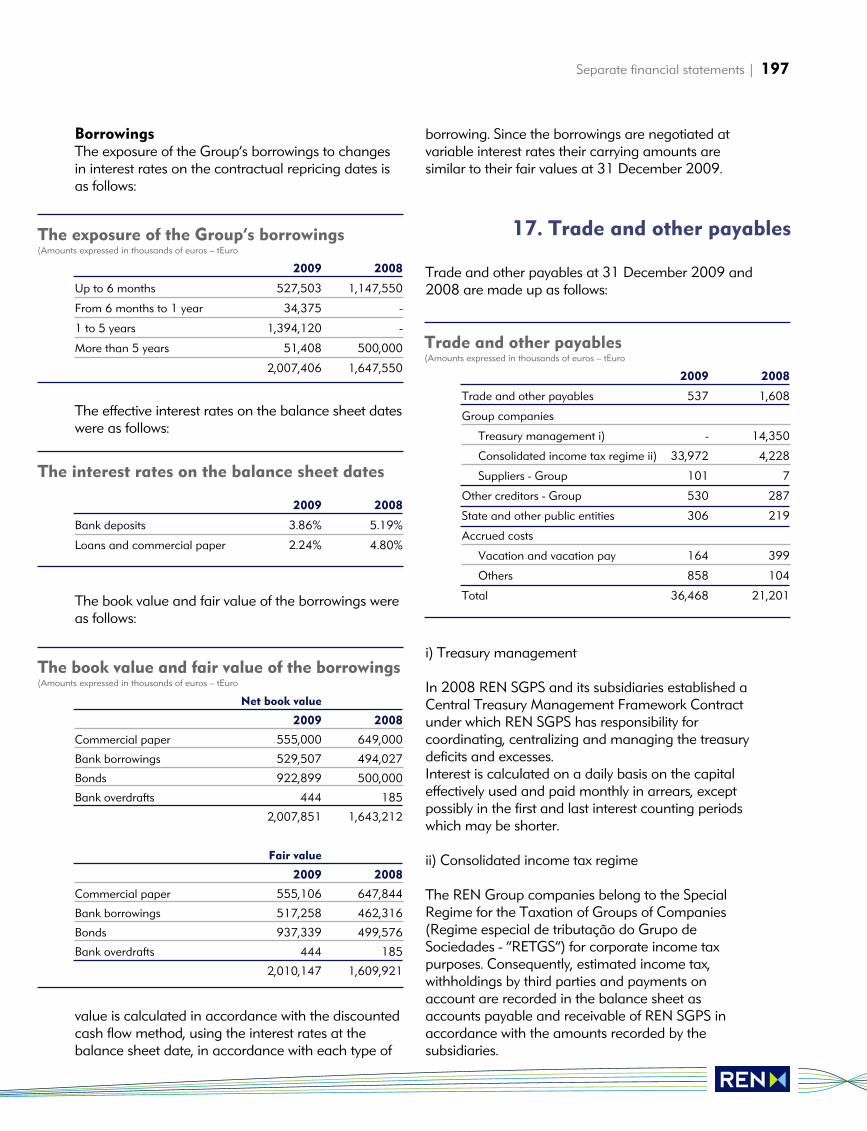
Separate financial statements | 197
BorrowingsThe exposure of the Group’s borrowings to changesin interest rates on the contractual repricing dates isas follows:quadro1 pag246
The effective interest rates on the balance sheet dateswere as follows:
quadro2 pag246The book value and fair value of the borrowings wereas follows: quadro3 pag246
value is calculated in accordance with the discountedcash flow method, using the interest rates at thebalance sheet date, in accordance with each type of
borrowing. Since the borrowings are negotiated atvariable interest rates their carrying amounts aresimilar to their fair values at 31 December 2009.
Trade and other payables at 31 December 2009 and2008 are made up as follows:quadro1 pag247
i) Treasury management
In 2008 REN SGPS and its subsidiaries established aCentral Treasury Management Framework Contractunder which REN SGPS has responsibility forcoordinating, centralizing and managing the treasurydeficits and excesses. Interest is calculated on a daily basis on the capitaleffectively used and paid monthly in arrears, exceptpossibly in the first and last interest counting periodswhich may be shorter.
ii) Consolidated income tax regime
The REN Group companies belong to the SpecialRegime for the Taxation of Groups of Companies(Regime especial de tributação do Grupo deSociedades - “RETGS”) for corporate income taxpurposes. Consequently, estimated income tax,withholdings by third parties and payments onaccount are recorded in the balance sheet asaccounts payable and receivable of REN SGPS inaccordance with the amounts recorded by thesubsidiaries.
2009 2008
Up to 6 months 527,503 1,147,550
From 6 months to 1 year 34,375 -
1 to 5 years 1,394,120 -
More than 5 years 51,408 500,000
2,007,406 1,647,550
The exposure of the Group’s borrowings(Amounts expressed in thousands of euros – tEuro
2009 2008
Trade and other payables 537 1,608
Group companies
Treasury management i) - 14,350
Consolidated income tax regime ii) 33,972 4,228
Suppliers - Group 101 7
Other creditors - Group 530 287
State and other public entities 306 219
Accrued costs
Vacation and vacation pay 164 399
Others 858 104
Total 36,468 21,201
Trade and other payables(Amounts expressed in thousands of euros – tEuro
2009 2008
Bank deposits 3.86% 5.19%
Loans and commercial paper 2.24% 4.80%
The interest rates on the balance sheet dates
Net book value
2009 2008
Commercial paper 555,000 649,000
Bank borrowings 529,507 494,027
Bonds 922,899 500,000
Bank overdrafts 444 185
2,007,851 1,643,212
Fair value
2009 2008
Commercial paper 555,106 647,844
Bank borrowings 517,258 462,316
Bonds 937,339 499,576
Bank overdrafts 444 185
2,010,147 1,609,921
The book value and fair value of the borrowings(Amounts expressed in thousands of euros – tEuro
17. Trade and other payables
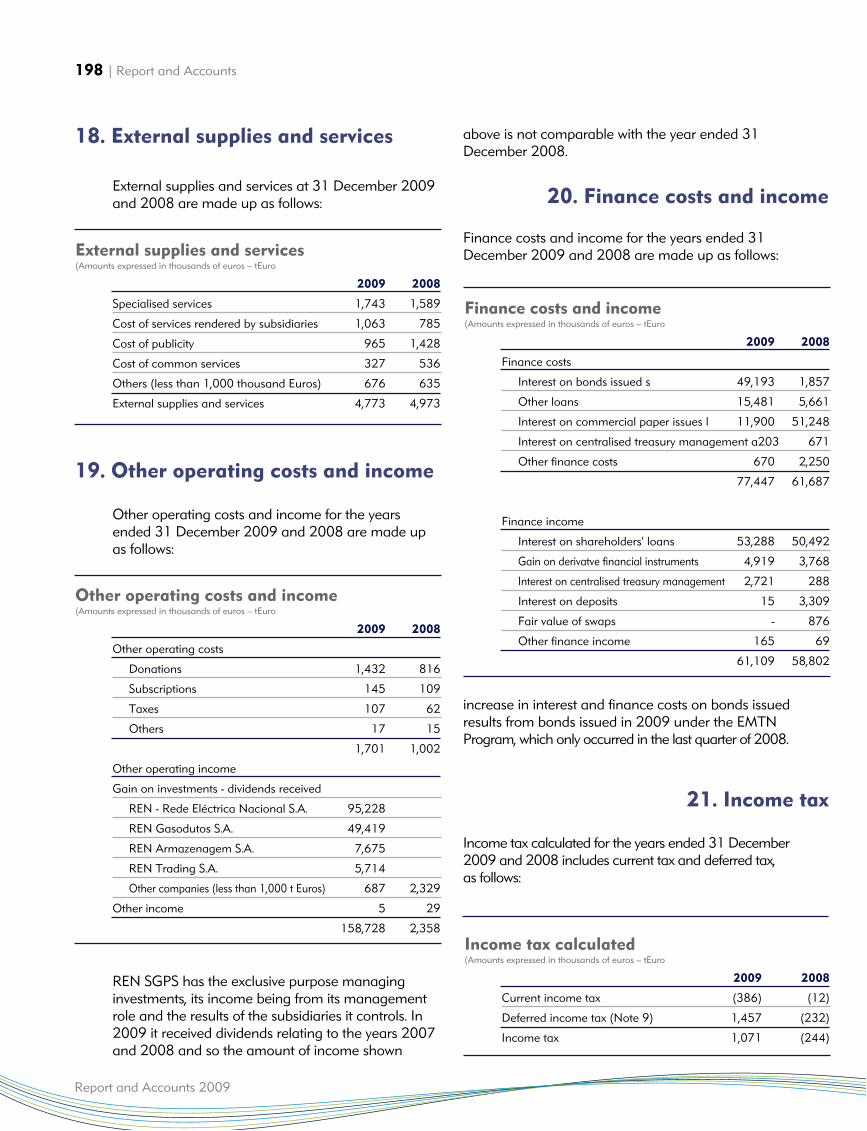
198 | Report and Accounts
Report and Accounts 2009
External supplies and services at 31 December 2009and 2008 are made up as follows: quadro2 pag247
Outros Custos e Proveitos Operacionais
Other operating costs and income for the yearsended 31 December 2009 and 2008 are made upas follows:quadro1 pag248
REN SGPS has the exclusive purpose managinginvestments, its income being from its managementrole and the results of the subsidiaries it controls. In2009 it received dividends relating to the years 2007and 2008 and so the amount of income shown
above is not comparable with the year ended 31December 2008.
Custos de financiamento e proveitos financeirosFinance costs and income for the years ended 31December 2009 and 2008 are made up as follows:quadro2 pag248
increase in interest and finance costs on bonds issuedresults from bonds issued in 2009 under the EMTNProgram, which only occurred in the last quarter of 2008.
Income tax calculated for the years ended 31 December2009 and 2008 includes current tax and deferred tax,as follows:quadro1 pag249
20. Finance costs and income
19. Other operating costs and income
2009 2008
Specialised services 1,743 1,589
Cost of services rendered by subsidiaries 1,063 785
Cost of publicity 965 1,428
Cost of common services 327 536
Others (less than 1,000 thousand Euros) 676 635
External supplies and services 4,773 4,973
External supplies and services(Amounts expressed in thousands of euros – tEuro
2009 2008
Other operating costs
Donations 1,432 816
Subscriptions 145 109
Taxes 107 62
Others 17 15
1,701 1,002
Other operating income
Gain on investments - dividends received
REN - Rede Eléctrica Nacional S.A. 95,228
REN Gasodutos S.A. 49,419
REN Armazenagem S.A. 7,675
REN Trading S.A. 5,714
Other companies (less than 1,000 t Euros) 687 2,329
Other income 5 29
158,728 2,358
Other operating costs and income(Amounts expressed in thousands of euros – tEuro
2009 2008
Finance costs
Interest on bonds issued s 49,193 1,857
Other loans 15,481 5,661
Interest on commercial paper issues l 11,900 51,248
Interest on centralised treasury management a203 671
Other finance costs 670 2,250
77,447 61,687
Finance income
Interest on shareholders' loans 53,288 50,492
Gain on derivatve financial instruments 4,919 3,768
Interest on centralised treasury management 2,721 288
Interest on deposits 15 3,309
Fair value of swaps - 876
Other finance income 165 69
61,109 58,802
Finance costs and income(Amounts expressed in thousands of euros – tEuro
18. External supplies and services
2009 2008
Current income tax (386) (12)
Deferred income tax (Note 9) 1,457 (232)
Income tax 1,071 (244)
Income tax calculated(Amounts expressed in thousands of euros – tEuro
21. Income tax
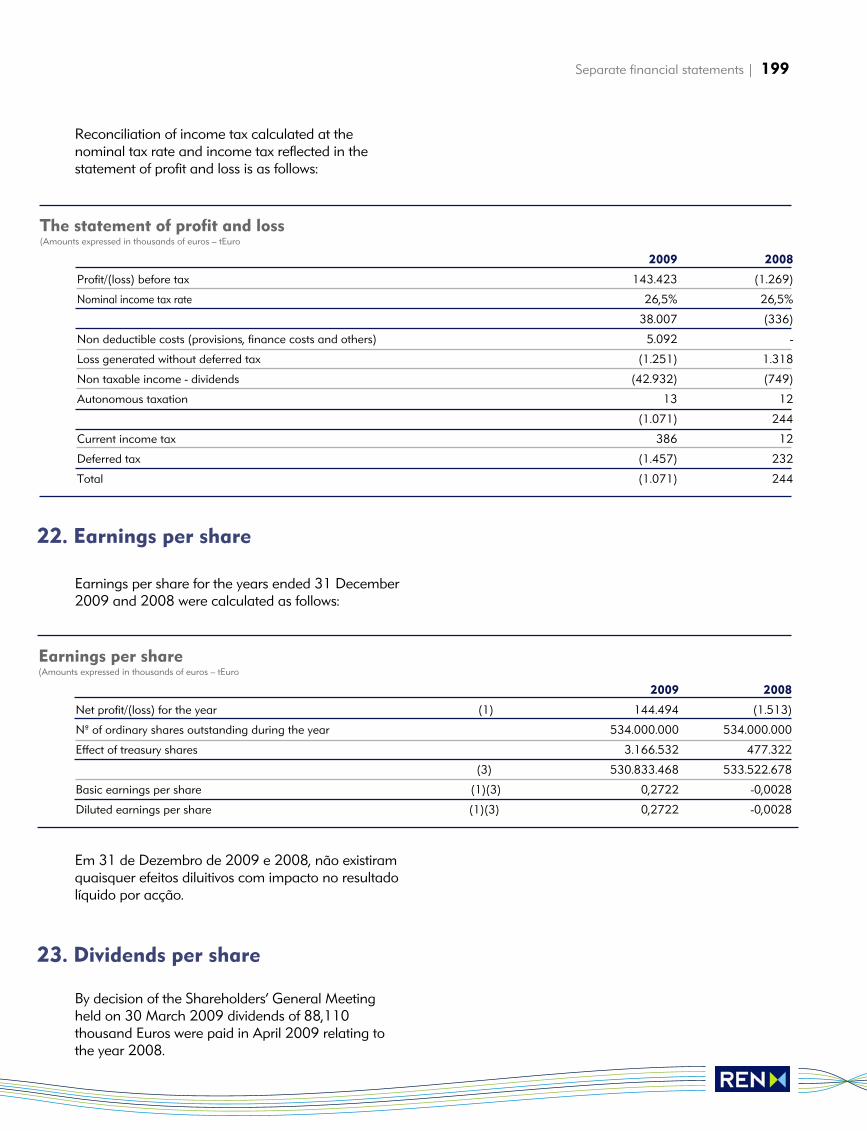
Separate financial statements | 199
Reconciliation of income tax calculated at thenominal tax rate and income tax reflected in thestatement of profit and loss is as follows:quadro2 pag249
Resultado por acção
Earnings per share for the years ended 31 December2009 and 2008 were calculated as follows:quadro3 pag249
Em 31 de Dezembro de 2009 e 2008, não existiramquaisquer efeitos diluitivos com impacto no resultadolíquido por acção.
Dividendos por acção
By decision of the Shareholders’ General Meetingheld on 30 March 2009 dividends of 88,110thousand Euros were paid in April 2009 relating tothe year 2008.
22. Earnings per share
2009 2008
Profit/(loss) before tax 143.423 (1.269)
Nominal income tax rate 26,5% 26,5%
38.007 (336)
Non deductible costs (provisions, finance costs and others) 5.092 -
Loss generated without deferred tax (1.251) 1.318
Non taxable income - dividends (42.932) (749)
Autonomous taxation 13 12
(1.071) 244
Current income tax 386 12
Deferred tax (1.457) 232
Total (1.071) 244
The statement of profit and loss(Amounts expressed in thousands of euros – tEuro
2009 2008
Net profit/(loss) for the year (1) 144.494 (1.513)
Nº of ordinary shares outstanding during the year 534.000.000 534.000.000
Effect of treasury shares 3.166.532 477.322
(3) 530.833.468 533.522.678
Basic earnings per share (1)(3) 0,2722 -0,0028
Diluted earnings per share (1)(3) 0,2722 -0,0028
Earnings per share(Amounts expressed in thousands of euros – tEuro
23. Dividends per share
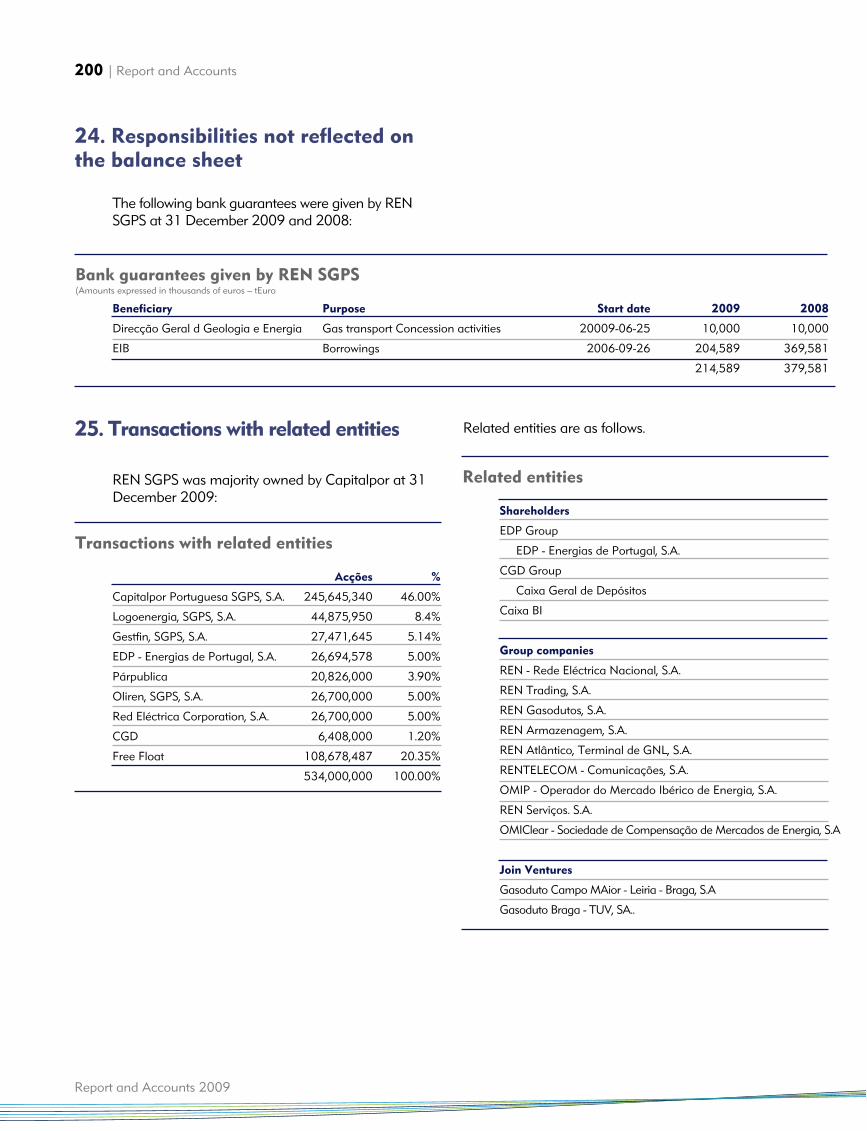
200 | Report and Accounts
Report and Accounts 2009
Responsabilidades não reflectidas no Balanço
The following bank guarantees were given by RENSGPS at 31 December 2009 and 2008: quadro1 pag250
Transacções com entidades relacionadas
REN SGPS was majority owned by Capitalpor at 31December 2009: quadro2 pag250
Related entities are as follows. quadro2 pag250
24. Responsibilities not reflected onthe balance sheet
25. Transactions with related entities
Acções %
Capitalpor Portuguesa SGPS, S.A. 245,645,340 46.00%
Logoenergia, SGPS, S.A. 44,875,950 8.4%
Gestfin, SGPS, S.A. 27,471,645 5.14%
EDP - Energias de Portugal, S.A. 26,694,578 5.00%
Párpublica 20,826,000 3.90%
Oliren, SGPS, S.A. 26,700,000 5.00%
Red Eléctrica Corporation, S.A. 26,700,000 5.00%
CGD 6,408,000 1.20%
Free Float 108,678,487 20.35%
534,000,000 100.00%
Transactions with related entities
Shareholders
EDP Group
EDP - Energias de Portugal, S.A.
CGD Group
Caixa Geral de Depósitos
Caixa BI
Group companies
REN - Rede Eléctrica Nacional, S.A.
REN Trading, S.A.
REN Gasodutos, S.A.
REN Armazenagem, S.A.
REN Atlântico, Terminal de GNL, S.A.
RENTELECOM - Comunicações, S.A.
OMIP - Operador do Mercado Ibérico de Energia, S.A.
REN Serviços. S.A.
OMIClear - Sociedade de Compensação de Mercados de Energia, S.A
Join Ventures
Gasoduto Campo MAior - Leiria - Braga, S.A
Gasoduto Braga - TUV, SA..
Related entities
Beneficiary Purpose Start date 2009 2008
Direcção Geral d Geologia e Energia Gas transport Concession activities 20009-06-25 10,000 10,000
EIB Borrowings 2006-09-26 204,589 369,581
214,589 379,581
Bank guarantees given by REN SGPS(Amounts expressed in thousands of euros – tEuro
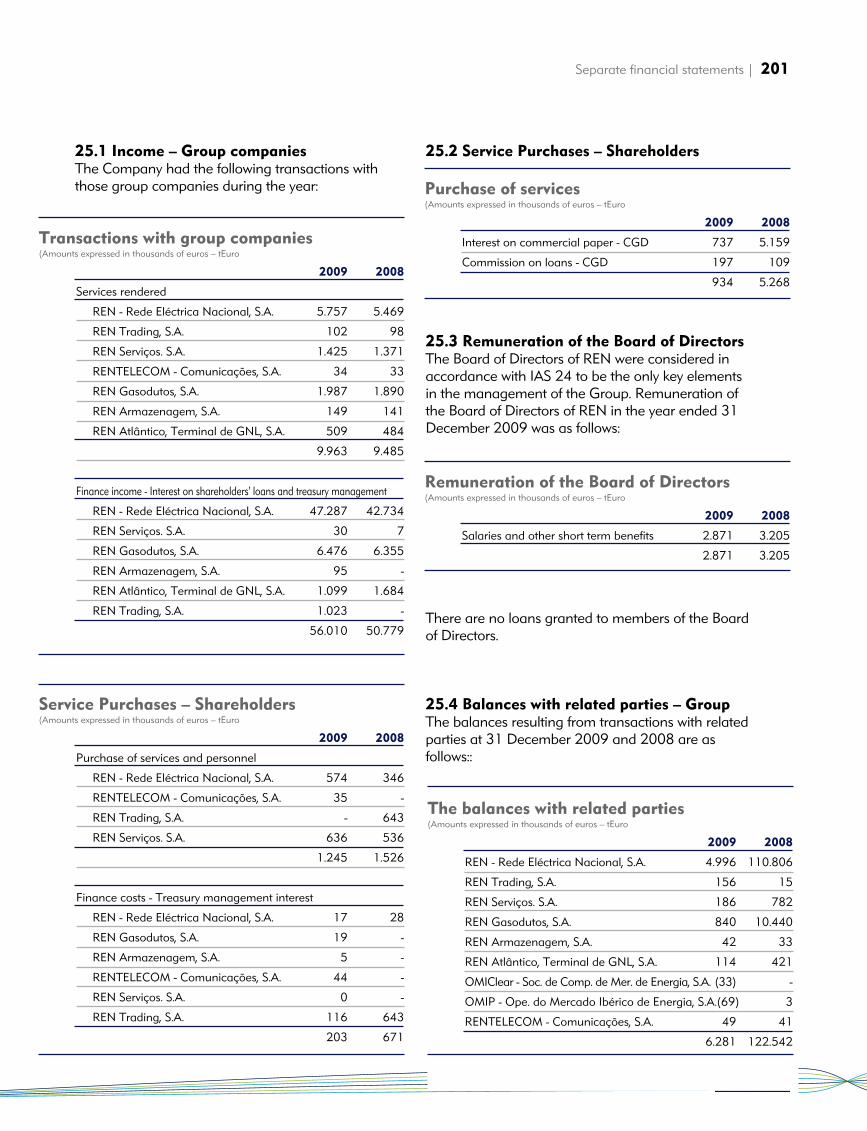
Separate financial statements | 201
25.1 Income – Group companiesThe Company had the following transactions withthose group companies during the year:quadro1 pag251
Custos – Empresas do Grupoquadro1 pag252
25.2 Service Purchases – Shareholders
quadro2 pag25225.3 Remuneration of the Board of Directors The Board of Directors of REN were considered inaccordance with IAS 24 to be the only key elementsin the management of the Group. Remuneration ofthe Board of Directors of REN in the year ended 31December 2009 was as follows:quadro3 pag252
There are no loans granted to members of the Boardof Directors.
25.4 Balances with related parties – Group The balances resulting from transactions with relatedparties at 31 December 2009 and 2008 are asfollows::quadro1 pag253
2009 2008
Services rendered
REN - Rede Eléctrica Nacional, S.A. 5.757 5.469
REN Trading, S.A. 102 98
REN Serviços. S.A. 1.425 1.371
RENTELECOM - Comunicações, S.A. 34 33
REN Gasodutos, S.A. 1.987 1.890
REN Armazenagem, S.A. 149 141
REN Atlântico, Terminal de GNL, S.A. 509 484
9.963 9.485
Finance income - Interest on shareholders' loans and treasury management
REN - Rede Eléctrica Nacional, S.A. 47.287 42.734
REN Serviços. S.A. 30 7
REN Gasodutos, S.A. 6.476 6.355
REN Armazenagem, S.A. 95 -
REN Atlântico, Terminal de GNL, S.A. 1.099 1.684
REN Trading, S.A. 1.023 -
56.010 50.779
Transactions with group companies(Amounts expressed in thousands of euros – tEuro
2009 2008
Interest on commercial paper - CGD 737 5.159
Commission on loans - CGD 197 109
934 5.268
Purchase of services(Amounts expressed in thousands of euros – tEuro
2009 2008
REN - Rede Eléctrica Nacional, S.A. 4.996 110.806
REN Trading, S.A. 156 15
REN Serviços. S.A. 186 782
REN Gasodutos, S.A. 840 10.440
REN Armazenagem, S.A. 42 33
REN Atlântico, Terminal de GNL, S.A. 114 421
OMIClear - Soc. de Comp. de Mer. de Energia, S.A. (33) -
OMIP - Ope. do Mercado Ibérico de Energia, S.A.(69) 3
RENTELECOM - Comunicações, S.A. 49 41
6.281 122.542
The balances with related parties(Amounts expressed in thousands of euros – tEuro
2009 2008
Purchase of services and personnel
REN - Rede Eléctrica Nacional, S.A. 574 346
RENTELECOM - Comunicações, S.A. 35 -
REN Trading, S.A. - 643
REN Serviços. S.A. 636 536
1.245 1.526
Finance costs - Treasury management interest
REN - Rede Eléctrica Nacional, S.A. 17 28
REN Gasodutos, S.A. 19 -
REN Armazenagem, S.A. 5 -
RENTELECOM - Comunicações, S.A. 44 -
REN Serviços. S.A. 0 -
REN Trading, S.A. 116 643
203 671
Service Purchases – Shareholders(Amounts expressed in thousands of euros – tEuro
2009 2008
Salaries and other short term benefits 2.871 3.205
2.871 3.205
Remuneration of the Board of Directors(Amounts expressed in thousands of euros – tEuro
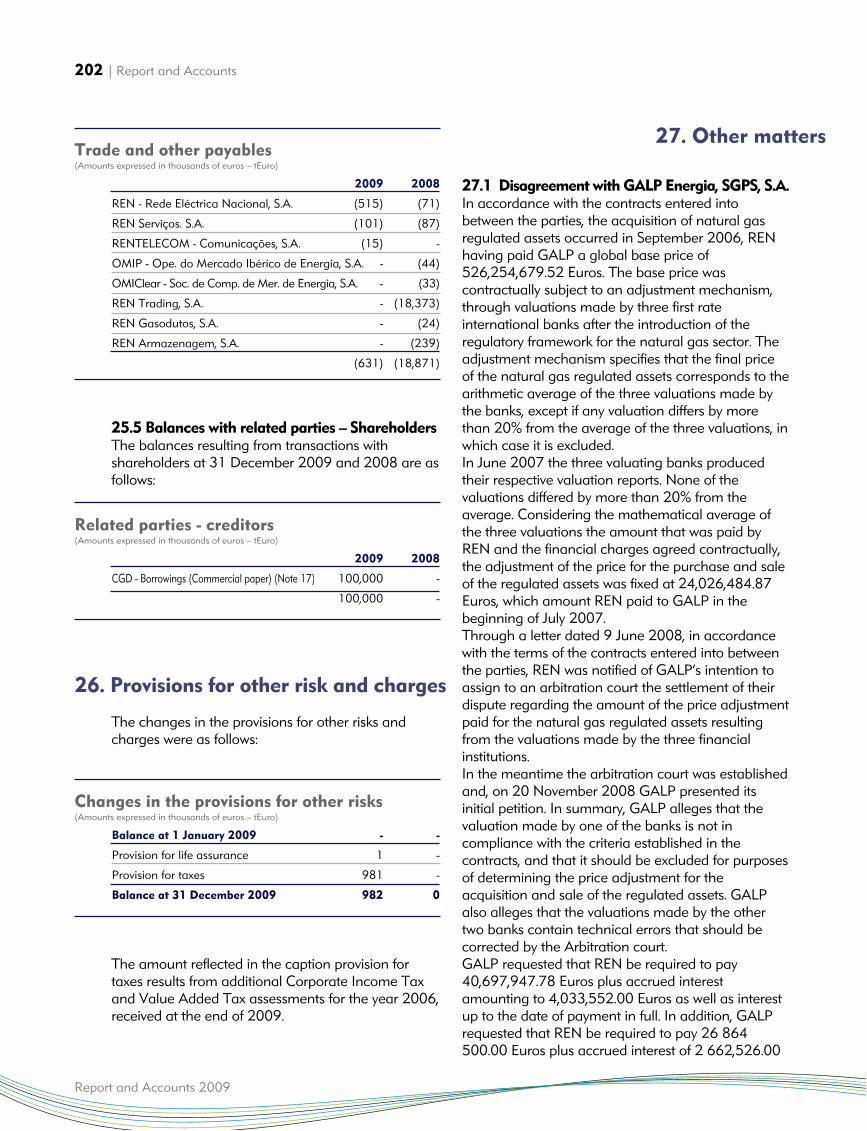
202 | Report and Accounts
Report and Accounts 2009
quadro2 pag25325.5 Balances with related parties – Shareholders The balances resulting from transactions withshareholders at 31 December 2009 and 2008 are asfollows:quadro3 pag253
The changes in the provisions for other risks andcharges were as follows:quadro4 pag253
The amount reflected in the caption provision fortaxes results from additional Corporate Income Taxand Value Added Tax assessments for the year 2006,received at the end of 2009.
27.1 Disagreement with GALP Energia, SGPS, S.A.In accordance with the contracts entered intobetween the parties, the acquisition of natural gasregulated assets occurred in September 2006, RENhaving paid GALP a global base price of526,254,679.52 Euros. The base price wascontractually subject to an adjustment mechanism,through valuations made by three first rateinternational banks after the introduction of theregulatory framework for the natural gas sector. Theadjustment mechanism specifies that the final priceof the natural gas regulated assets corresponds to thearithmetic average of the three valuations made bythe banks, except if any valuation differs by morethan 20% from the average of the three valuations, inwhich case it is excluded.In June 2007 the three valuating banks producedtheir respective valuation reports. None of thevaluations differed by more than 20% from theaverage. Considering the mathematical average ofthe three valuations the amount that was paid byREN and the financial charges agreed contractually,the adjustment of the price for the purchase and saleof the regulated assets was fixed at 24,026,484.87Euros, which amount REN paid to GALP in thebeginning of July 2007.Through a letter dated 9 June 2008, in accordancewith the terms of the contracts entered into betweenthe parties, REN was notified of GALP’s intention toassign to an arbitration court the settlement of theirdispute regarding the amount of the price adjustmentpaid for the natural gas regulated assets resultingfrom the valuations made by the three financialinstitutions.In the meantime the arbitration court was establishedand, on 20 November 2008 GALP presented itsinitial petition. In summary, GALP alleges that thevaluation made by one of the banks is not incompliance with the criteria established in thecontracts, and that it should be excluded for purposesof determining the price adjustment for theacquisition and sale of the regulated assets. GALPalso alleges that the valuations made by the othertwo banks contain technical errors that should becorrected by the Arbitration court.GALP requested that REN be required to pay40,697,947.78 Euros plus accrued interestamounting to 4,033,552.00 Euros as well as interestup to the date of payment in full. In addition, GALPrequested that REN be required to pay 26 864500.00 Euros plus accrued interest of 2 662,526.00
2009 2008
REN - Rede Eléctrica Nacional, S.A. (515) (71)
REN Serviços. S.A. (101) (87)
RENTELECOM - Comunicações, S.A. (15) -
OMIP - Ope. do Mercado Ibérico de Energia, S.A. - (44)
OMIClear - Soc. de Comp. de Mer. de Energia, S.A. - (33)
REN Trading, S.A. - (18,373)
REN Gasodutos, S.A. - (24)
REN Armazenagem, S.A. - (239)
(631) (18,871)
Trade and other payables(Amounts expressed in thousands of euros – tEuro)
2009 2008
CGD - Borrowings (Commercial paper) (Note 17) 100,000 -
100,000 -
Related parties - creditors(Amounts expressed in thousands of euros – tEuro)
Balance at 1 January 2009 - -
Provision for life assurance 1 -
Provision for taxes 981 -
Balance at 31 December 2009 982 0
Changes in the provisions for other risks(Amounts expressed in thousands of euros – tEuro)
27. Other matters
26. Provisions for other risk and charges
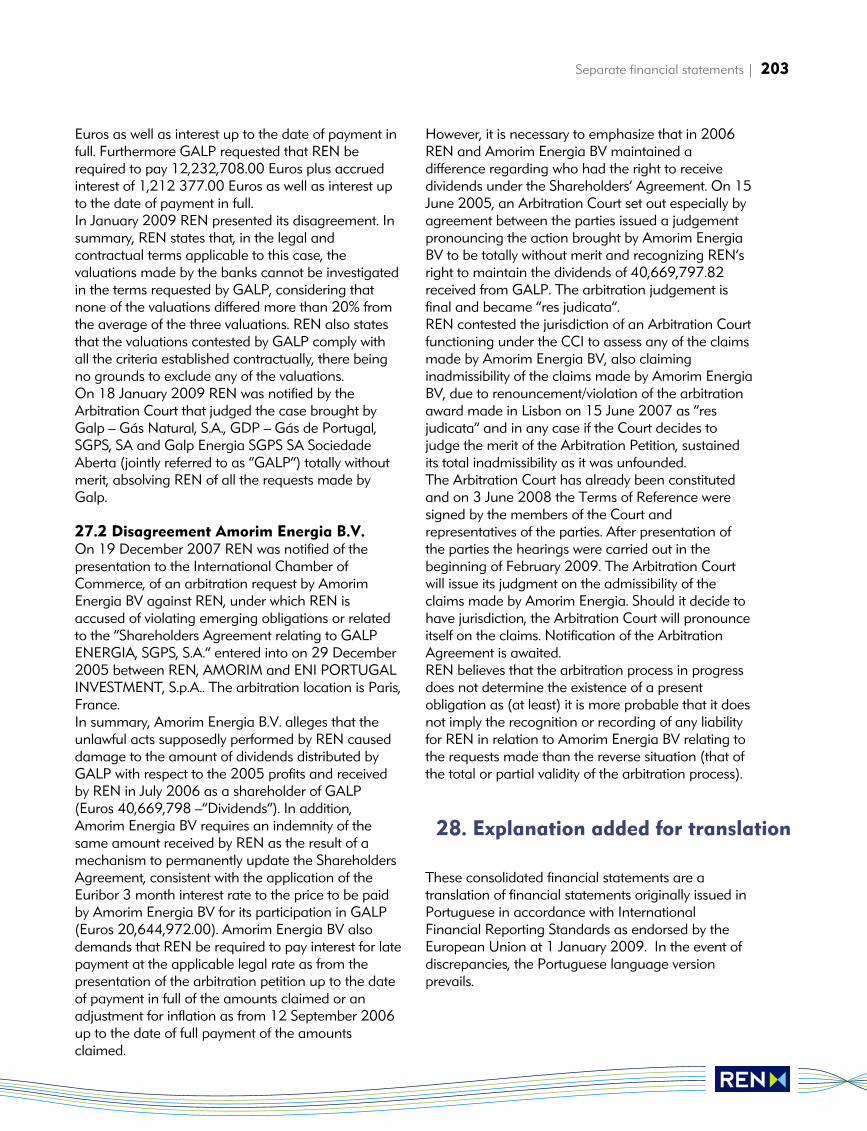
Separate financial statements | 203
Euros as well as interest up to the date of payment infull. Furthermore GALP requested that REN berequired to pay 12,232,708.00 Euros plus accruedinterest of 1,212 377.00 Euros as well as interest upto the date of payment in full.In January 2009 REN presented its disagreement. Insummary, REN states that, in the legal andcontractual terms applicable to this case, thevaluations made by the banks cannot be investigatedin the terms requested by GALP, considering thatnone of the valuations differed more than 20% fromthe average of the three valuations. REN also statesthat the valuations contested by GALP comply withall the criteria established contractually, there beingno grounds to exclude any of the valuations.On 18 January 2009 REN was notified by theArbitration Court that judged the case brought byGalp – Gás Natural, S.A., GDP – Gás de Portugal,SGPS, SA and Galp Energia SGPS SA SociedadeAberta (jointly referred to as “GALP”) totally withoutmerit, absolving REN of all the requests made byGalp.
27.2 Disagreement Amorim Energia B.V.On 19 December 2007 REN was notified of thepresentation to the International Chamber ofCommerce, of an arbitration request by AmorimEnergia BV against REN, under which REN isaccused of violating emerging obligations or relatedto the “Shareholders Agreement relating to GALPENERGIA, SGPS, S.A.” entered into on 29 December2005 between REN, AMORIM and ENI PORTUGALINVESTMENT, S.p.A.. The arbitration location is Paris,France.In summary, Amorim Energia B.V. alleges that theunlawful acts supposedly performed by REN causeddamage to the amount of dividends distributed byGALP with respect to the 2005 profits and receivedby REN in July 2006 as a shareholder of GALP(Euros 40,669,798 –“Dividends”). In addition,Amorim Energia BV requires an indemnity of thesame amount received by REN as the result of amechanism to permanently update the ShareholdersAgreement, consistent with the application of theEuribor 3 month interest rate to the price to be paidby Amorim Energia BV for its participation in GALP(Euros 20,644,972.00). Amorim Energia BV alsodemands that REN be required to pay interest for latepayment at the applicable legal rate as from thepresentation of the arbitration petition up to the dateof payment in full of the amounts claimed or anadjustment for inflation as from 12 September 2006up to the date of full payment of the amountsclaimed.
However, it is necessary to emphasize that in 2006REN and Amorim Energia BV maintained adifference regarding who had the right to receivedividends under the Shareholders’ Agreement. On 15June 2005, an Arbitration Court set out especially byagreement between the parties issued a judgementpronouncing the action brought by Amorim EnergiaBV to be totally without merit and recognizing REN’sright to maintain the dividends of 40,669,797.82received from GALP. The arbitration judgement isfinal and became “res judicata”.REN contested the jurisdiction of an Arbitration Courtfunctioning under the CCI to assess any of the claimsmade by Amorim Energia BV, also claiminginadmissibility of the claims made by Amorim EnergiaBV, due to renouncement/violation of the arbitrationaward made in Lisbon on 15 June 2007 as “resjudicata” and in any case if the Court decides tojudge the merit of the Arbitration Petition, sustainedits total inadmissibility as it was unfounded.The Arbitration Court has already been constitutedand on 3 June 2008 the Terms of Reference weresigned by the members of the Court andrepresentatives of the parties. After presentation ofthe parties the hearings were carried out in thebeginning of February 2009. The Arbitration Courtwill issue its judgment on the admissibility of theclaims made by Amorim Energia. Should it decide tohave jurisdiction, the Arbitration Court will pronounceitself on the claims. Notification of the ArbitrationAgreement is awaited.REN believes that the arbitration process in progressdoes not determine the existence of a presentobligation as (at least) it is more probable that it doesnot imply the recognition or recording of any liabilityfor REN in relation to Amorim Energia BV relating tothe requests made than the reverse situation (that ofthe total or partial validity of the arbitration process).
These consolidated financial statements are atranslation of financial statements originally issued inPortuguese in accordance with InternationalFinancial Reporting Standards as endorsed by theEuropean Union at 1 January 2009. In the event ofdiscrepancies, the Portuguese language versionprevails.
28. Explanation added for translation
Audit reports and statements
Relatório e Contas 2009
Audit Reports and Statements| 205
206 | Report and Accounts
Report and Accounts 2009
Audit Reports and Statements| 207
208 | Report and Accounts
Report and Accounts 2009
Audit Reports and Statements| 209
210 | Report and Accounts
Report and Accounts 2009
Audit Reports and Statements| 211
AUDIT REPORT CONSOLIDATED FINANCIAL STATEMENTS
(Translation of a consolidated audit report originally issued in Portuguese – Note 39)
INTRODUCTION
1. We have examined the consolidated financial statements of REN – Redes Energéticas Nacionais, S.G.P.S.,S.A. (“the Company”) and subsidiaries (“the Group”), which include the Consolidated Statement of FinancialPosition at 31 December 2009 that reflects a total of 4,294,113 thousand Euros and shareholders’ equity of996,599 thousand Euros, including a consolidated net profit of 134,047 thousand Euros and the ConsolidatedStatements of Profit and Loss, the Consolidated statement of other comprehensive income, Changes in Equityand Cash Flows for the year then ended and the corresponding notes.
RESPONSIBILITIES
2. The preparation of consolidated financial statements that present a true and fair view of the financialposition of the companies included in the consolidation, their consolidated other comprehensive income, theconsolidated changes in their shareholders’ equity and their consolidated cash flows, as well as the adoption ofadequate accounting principles and criteria and the maintenance of appropriate systems of internal control arethe responsibility of the Board of Directors. Our responsibility is to express a professional and independentopinion on these consolidated financial statements, based on our examination.
SCOPE
3. Our examination was performed in accordance with the auditing standards (“Normas Técnicas e asDirectrizes de Revisão/Auditoria”) issued by the Portuguese Institute of Statutory Auditors (“Ordem dosRevisores Oficiais de Contas”), which require that the examination be planned and performed with theobjective of obtaining reasonable assurance about whether the financial statements are free of materialmisstatement. Our examination included verifying, on a sample basis, evidence supporting the amounts anddisclosures in the financial statements and assessing the estimates, based on judgements and criteria definedby the Board of Directors, used in their preparation. Our examination also included verifying the consolidationprocedures used and that the financial statements of the companies included in the consolidation wereappropriately examined, assessing the adequacy of the accounting principles used, their uniform applicationand disclosure, taking into consideration the circumstances, verifying the applicability of the going concernconcept, assessing the adequacy of the overall presentation of the consolidated financial statements andassessing that in all material respects the financial information is complete, true, current, clear, objective andlicit . We believe that our examination provides a reasonable basis for expressing our opinion.
OPINION
4. In our opinion, the financial statements referred to in paragraph 1 above, present fairly, in all materialrespects, the consolidated financial position of REN – Redes Energéticas Nacionais, S.G.P.S., S.A. andsubsidiaries as of 31 December 2009, their consolidated other comprehensive income, consolidated changesin their equity and their consolidated cash flows for the year then ended in accordance with InternationalFinancial Reporting Standards as endorsed by the European Union.
Lisbon, 26 February 2010 __________________________________________ DELOITTE & ASSOCIADOS, SROC S.A.Represented by Jorge Carlos Batalha Duarte Catulo
Audit report of financial statements
212 | Report and Accounts
Report and Accounts 2009
AUDIT REPORT SEPARATE FINANCIAL STATEMENTS
(Translation of an audit report originally issued in Portuguese – Note 28)
INTRODUCTION
1. We have examined the accompanying financial statements of REN – Redes Energéticas Nacionais, S.G.P.S.,S.A. (“the Company”), which comprise the Statement of Financial Position as of 31 December 2009, that totals2,967,560 thousand Euros and equity of 901,299 thousand Euros, including a net profit of 144,494 thousandEuros, the Statements of Profit and Loss, the Statement of Other Comprehensive Income, Changes in FinancialPosition and Cash Flows for the year then ended and the corresponding notes.
RESPONSIBILITIES
2. The preparation of financial statements that present a true and fair view of the financial position of theCompany, its other comprehensive income, changes in equity and cash flows, as well as the adoption ofadequate accounting principles and criteria and the maintenance of appropriate systems of internal control arethe responsibility of the Company’s Board of Directors. Our responsibility is to express a professional andindependent opinion on these financial statements, based on our examination.
SCOPE
3. Our examination was performed in accordance with the auditing standards (Normas Técnicas e asDirectrizes de Revisão/Auditoria) issued by the Portuguese Institute of Statutory Auditors (“Ordem dosRevisores Oficiais de Contas”), which require that the examination be planned and performed with theobjective of obtaining reasonable assurance about whether the financial statements are free of materialmisstatement. Our examination included verifying, on a sample basis, evidence supporting the amounts anddisclosures in the financial statements and assessing the estimates, based on judgements and criteria definedby the Board of Directors used in their preparation. Our examination also included assessing the adequacy ofthe accounting principles used and their disclosure, taking into consideration the circumstances, verifying theapplicability of the going concern concept and assessing the adequacy of the overall presentation of thefinancial statements. We believe that our examination provides a reasonable basis for expressing our opinion.
OPINION
4. In our opinion, the financial statements referred to in paragraph 1 above, present fairly, in all materialrespects, the financial position of REN – Redes Energéticas Nacionais, S.G.P.S., S.A. as of 31 December 2009and its statement of other comprehensive income, changes in equity and cash flows for the year then ended, inconformity with International Financial Reporting Standards (“IFRS”) as endorsed by the European Union.
EMPHASIS
5. The financial statements referred to in paragraph 1 above refer to the Company’s operations on a separatenon-consolidated basis and were prepared for approval and publication in accordance with current legislation. Asexplained in Note 3.1 to the financial statements, investments in subsidiaries are stated at cost. As required bycurrent legislation, the Company has prepared consolidated financial statements in accordance with InternationalFinancial Reporting Standards as endorsed by the European Union, for separate publication.
Lisbon, 26 February 2010__________________________________________ DELOITTE & ASSOCIADOS, SROC S.A. Represented by Jorge Carlos Batalha Duarte Catulo
Audit Reports and Statements| 213
REN - REDES ENERGÉTICAS NACIONAIS, SGPS, S.A.
REPORT AND OPINION OF THE AUDIT COMMITTEE
CONSOLIDATED ACCOUNTS
Under the powers conferred to it, the Audit Committee followed the progress of REN – REDES ENERGÉTICASNACIONAIS, SGPS, S.A. and its subsidiary companies, oversaw the compliance with law, regulations andarticles of association, monitored the compliance with accounting policies and practices and supervised thepreparation and disclosure of financial information, statutory accounts, the effectiveness of the internal controlsystems, risk management, as well as the independence and activity of the statutory auditor and the externalauditor, including in relation to the capacity of independence in the provision of non-audit services.The Audit Committee has also examined the financial information contained on the Management Report andAccounts and the consolidated financial statements of REN – REDES ENERGÉTICAS NACIONAIS, SGPS, S.A.for the financial year ending on 31 December 2009, which contain the consolidated statements of the financialposition on 31 December 2009, the consolidated statements of the results regarding the financial year endedon 31 December 2009, the consolidated statements on the comprehensive income, the consolidatedstatements on the changes on equity and the consolidated statements on cash flows for the year ended on 31December 2009, and the respective Annex to the consolidated financial statements for December 2009, aswell as the Consolidated Management Report drawn up by the Board of Directors regarding the 2009 financialyear.The Audit Committee reviewed the Legal Certification of Accounts and the Audit Report on the consolidatedfinancial information drawn up by the Statutory Auditor, which obtained its agreement.In addition, the Audit Committee reviewed the Audit Report on the consolidated financial information drawn upby the External Auditor, which also received its agreement.Pursuant the analysis carried out, the Audit Committee has also supervised the compliance and accuracy ofthe accounting policies, procedures and practices and the valuation methods adopted, as well as the regularityand quality of the Company’s accounting information.In light of the above, the Audit Committee believes that the Consolidated Financial Statements andConsolidated Management Report, as well as the proposal contained therein, are in accordance with theapplicable accounting, legal and statutory provisions, and thus, recommends its approval in the AnnualGeneral Meeting.
Lisbon, 26 February 2010
José Luis Alvim (Chairman of the Audit Committee)José Frederico Jordão (Member of the Audit Committee)Fernando António Portela Rocha de Andrade (Member of the Audit Committee)
214 | Report and Accounts
Report and Accounts 2009
REN - REDES ENERGÉTICAS NACIONAIS, SGPS, S.A.
REPORT AND OPINION OF THE AUDIT COMMITTEE
INDIVIDUAL ACCOUNTS
Under the powers conferred to it, the Audit Committee followed the progress of REN – REDES ENERGÉTICASNACIONAIS, SGPS, S.A. and its subsidiary companies, oversaw the compliance with law, regulations andarticles of association, monitored the compliance with accounting policies and practices and supervised thepreparation and disclosure of financial information, statutory accounts, the effectiveness of the internal controlsystems, risk management, as well as the independence and activity of the statutory auditor and the externalauditor, including in relation to the capacity of independence in the provision of non-audit services.The Audit Committee has also examined the financial information contained in the Management Report andAccounts and the individual financial statements of REN – REDES ENERGÉTICAS NACIONAIS, SGPS, S.A. forthe financial year ending on 31 December 2009, which contain the financial position statements on 31December 2009, the results statements regarding the financial year ended on 31 December 2009, thecomprehensive income statements, the changes on equity statements, the cash flow statements for the yearended on 31 December 2009 and the respective Annex to the individual financial statements. The Audit Committee reviewed the Legal Certification of Accounts and the Audit Report on the consolidatedfinancial information drawn up by the Statutory Auditor, which obtained its agreement.In addition, the Audit Committee reviewed the Audit Report on the individual financial information drawn up bythe External Auditor, which also received its agreement.Pursuant the analysis carried out, the Audit Committee has also supervised the compliance and accuracy ofthe accounting policies, procedures and practices and the valuation methods adopted, as well as the regularityand quality of the Company’s accounting information.In light of the above, the Audit Committee believes that the Individual Financial Statements and ConsolidatedManagement Report, as well as the proposal contained therein, are in accordance with the applicableaccounting, legal and statutory provisions, and so, recommends its approval in the Annual General Meeting.
Lisbon, 26 February 2010
José Luis Alvim (Chairman of the Audit Committee)José Frederico Jordão (Member of the Audit Committee)Fernando António Portela Rocha de Andrade (Member of the Audit Committee)
Audit Reports and Statements| 215
216 | Report and Accounts
Extract from minutes of the General Meeting of Shareholders
Report and Accountss 2009
Extract of the Minutes no. 1/2010On the 15th of March of the year two thousand andten , at ten a.m., at the Company’s auditorium,located at EN 116, Bucelas, Municipality of Loures,was held the General Meeting of REN – RedesEnergéticas Nacionais, SGPS, S.A., a public company(hereinafter called “REN” or “Company”), that hasits registered office at Avenida dos Estados Unidosda América, no. 55, in Lisbon, with the share capitalof € 534 000 000.00, holder of the corporate per-son identification card number 503 264 032 and registered at the Commercial Registry Office ofLisbon under the same number , in accordance withthe call notice published on February 12, 2010 inthe Internet sites of the Ministry of Justice, thePortuguese Securities Market Commission (CMVM)and REN. ---------------------------------------------------------------(…) The Chairman of the General Meeting’s Board commenced the works of the session, with the following agenda: (…)IItteemm TTwwoo – Decide on the approval of the consolidatedand individual accounts’ reporting documents forthe financial year that ended on December 31,2009, in particular the global management report,legal certification of accounts, opinion of the auditbody, activity report of the Audit Committee and thecorporate governance report. ----------------------------------IItteemm TThhrreeee – Decide on the proposal for the distribution of the financial year end results -------------IItteemm FFoouurr – General appraisal of the company’smanagement and supervisory corporate bodies
auditing activities, under the terms of the provisionsestablished in article 455 of the PortugueseCompanies Code. ---------------------------------------------------(…)Given that no further shareholders had registered tospeak, the voting procedure commenced, and theproposal related to IItteemm TTwwoo was unanimouslyapproved by the votes issued (with 433,145,843 votesin favour, 0 votes against and 469,468 abstentions). Proceeding to the next item on the agenda, theChairman of the General Meeting’s Board clarifiedthat the proposal presented by the Board ofDirectors in relation to IItteemm TThhrreeee of the agendahad been made available in due time, includedwithin the materials supplied to the GeneralMeeting, thus dispensing with the need to read it,and its respective content is transcribed into thepresent minutes: -----------------------------------------------------“REN SGPS’ consolidated net result in the 2009
financial year was € 134,046,810.44 (one hundredand thirty four million, forty six thousand, eight hundred and ten euros and forty four cents). -----------In light of the above, the Board of Directors, underthe terms of article 28 of the Bylaws of REN SGPS,S.A. and articles 31 to 33 and 66, no. 5 of thePortuguese Companies Code, proposes that the netresult for the 2009 financial year, determined in theindividual financial statements, in accordance withthe International Financial Reporting Standards, inthe amount of € 144,493,679.21 (one hundred andforty four million four hundred and ninety threethousand, six hundred and seventy nine euros andtwenty-one cents), shall be appropriated as follows:
Extract from minutes of the General Meeting of Shareholders | 217
To the legal reserve - € 7,224,683.96 (seven milliontwo hundred and twenty four thousand, six hundredand eighty three euros and ninety six cents); -----------To dividends - € 89,178,000 (eighty nove million,one hundred and seventy eight thousand euros),corresponding to a distribution of 66.527% of theconsolidated result of REN SGPS, S.A. in the 2009financial year - that was € 134,046,810.44 (onehundred and thirty four million, forty six thousand,eight hundred and ten euros and forty four cents),and equivalent to distribution of the gross dividendamount per share of € 0.167; ---------------------------------To the free reserve, the amount of € 48,090,995.25(forty eight million ninety thousand, nine hundredand ninety five euros and twenty five cents). ------------(…)The Chairman of the General Meeting’s Board theninvited shareholders to vote upon the proposal relatedto IItteemm TThhrreeee, in relation to appropriation of the netresult for the financial year that ended on December31, 2009. The proposal was unanimously approvedby the votes issued (with 433,592,809 votes infavour, 0 votes against and 22,502 abstentions).In the discussion of IItteemm FFoouurr on the agenda, theChairman of the General Meeting’s Board informedall those present that the General Meeting’s Boardhad only received one proposal, subscribed by theShareholders, Capitalpor – ParticipaçõesPortuguesas, SGPS, S.A., Parpública – ParticipaçõesPúblicas (SGPS), S.A. and Caixa Geral de Depósitos;S.A., that was also subscribed, during the works ofthe session, by the Shareholder, António AlbertoFrança de Oliveira, acting on its own behalf and in
representation of the Shareholder, Bento da RochaCabral Scientific Research Institute. The proposalhad been made available in due time, includedwithin the materials supplied to the GeneralMeeting, thus dispensing with the need to read it,and its respective content is transcribed into thepresent minutes: -----------------------------------------------------“By means of the present document, a proposal ismade to the General Meeting of REN – RedesEnergéticas Nacionais, SGPS, S.A. to carry out ageneral appraisal of the company’s managementand supervision activities, in accordance with theprovisions established in article 455 of thePortuguese Companies Code, in accordance withthe following terms: ------------------------------------------------A vote of positive appraisal and praise for the Boardof Directors for pursuit of its management functionsduring the 2009 financial year;--------------------------------A vote of positive appraisal and praise for the AuditCommittee for pursuit of its auditing functions duringthe 2009 financial year; -----------------------------------------A vote of positive appraisal and praise for theChartered Accountant (ROC) for pursuit of its functionsduring the 2009 financial year.”------------------------------The Chairman of the General Meeting’s Board theninvited all those present to vote upon the proposalrelated to IItteemm FFoouurr of the agenda, which wasunanimously approved by the votes issued (with433,581,319 votes in favour, 0 votes against and33,992 abstentions). ----------------------------------------------(…)
Report and Accounts 2009
Energy legislation published in 2009
ERSE Ordinance 59/2009 of 2 January, D.R. 1, Série IIApproves tariffs and prices for electricity and otherservices in 2009 and regulation parameters for2009-2011
Decree-Law 23/2009 of 20 January, D. R. 13, Série IAmends Decree-Law 172/2006 of 23 August andtransposes into Portuguese law Directive2005/89/EC of the European Parliament and of theCouncil of 18 January 2006 on measures to guarantee security of supply of electricity and investment in infrastructures
ERSE Ordinance 3827/2009of 30 January, D.R. 21, Série IIApproves schedule loss profiles and consumptionprofiles to be applied from 1 January to 31December 2009
Ministerial Order MEI 5579-A/2009 of 18 February, D. R. 34, Suplemento, Série IICorrected tariff stability
Parliamentary Resolution 12/2009 of 2 March, D. R. 42, Série IPromotion of hydroelectric plants
Parliamentary Resolution 17/2009 of 23 March, D. R. 57, Série IApproves the agreement revising the agreementbetween Portugal and Spain on the constitution of an Iberian electricity market signed in Braga on 18 January 2008
Presidential Decree 21/2009 of 23 March, D. R. 57, Série IRatifies the agreement revising the agreementbetween Portugal and Spain on the constitution ofan Iberian electricity market signed in Braga on 18 January 2008
ERSE Ordinance 9244/2009of 2 April, D.R. 65, Série IIEstablishes the monitoring of reference prices andaverage prices charged by electricity suppliers
ERSE Ordinance 9974/2009 of 14 April, D.R. 72, Série IIAmends the System Manager Manual ofProcedures with regard to the balance sheet andsupply units for power stations in the Mondego, Tejo and Zêzere river basins
ERSE Ordinance 9975/2009 of 14 April, D.R. 72, Série IIApproves the method for calculating the value ofsecurity deposits associated with electricity supplies
Ministerial Order MEI – DGEG 10956-A/2009 of 29 April, D. R. 83, Suplemento, Série IIAnnounces a new period for submitting requests forprior information for connection to the independentnetwork of electricity installations
ERSE Ordinance 15816/2009 of 10 July, D.R. 132, Série IIApproves the method for codifying electricity delivery points
ERSE Ordinance 18138/2009of 5 August, D.R. 150, Série IIApproves the incentive mechanism and parameters for increasing availability of RNT elements and the incentive parameters for keepingon equipment at the end of its useful life
Ordinance 865/2009 of 13 August, D. R. 156, Série IDetermines coefficient Z applicable to electricpower stations that use geothermal energy in mainland Portugal for projects of great depth and high enthalpy
Regulation (EC) 713/2009 of the European Parliament and of the Council of13 July, OJEU 211, Series L, 14 August Institutes anAgency for the Cooperation of Energy Regulators
Regulation (EC) 714/2009 of the European Parliament and of the Council of 13 July, OJEU 211, Series L, 14 AugustLays down the conditions on access to the networkfor cross-border exchanges of electricity and revokesRegulation (EC) 1228/2003
Legislation | 219
Energy legislation published in 2009
Electricity
Directive 2009/72/EC of the European Parliament and of the Council of13 July, OJEU 211, Series L, 14 AugustLays down common rules for the internal market inelectricity and revokes Directive 2003/54/EC
Law 83/2009 of 26 August, D. R. 165; Série IAuthorises the government to set up a specialregime on expropriations necessary for buildinghydroelectric plants in the National Programme ofDams with High Hydroelectric Potential and thehydroelectric plants at Ribeiradio - Ermida andBaixo Sabor
ERSE Ordinance 20218/2009 of 7 September, D.R. 173, Série IIRevises the regulations on business relations in theelectricity sector
Council of Ministers Resolution 81/2009of 7 September, D. R. 173, Série ISets the goals and new measures for the ElectricityMobility Programme in Portugal and approves theelectricity mobility model
Decree-Law 246/2009of 22 September, D. R. 184, Série IMakes the first amendment to Decree-Law 4/93 of8 January, which approves the Regulations onElectrical Installation Rates
Decree-Law 319/2009 of 3 November, D. R. 213, Série ITransposes into Portugal law Directive 2006/32/ECof the European Parliament and of the Council of 5April in energy end-use efficiency and public energyservices and aims at increasing cost effectiveness inenergy end use
ERSE Ordinance 27599/2009 of 24 December, D.R. 248, Série IIRevises and republishes the Electricity Sector TariffRegulations
ERSE Ordinance 27650/2009 of 28 December, D.R. 249, Série IITariffs and prices for electricity in 2010
220 | Legislation
Report and Accounts 2009
Legislation | 221
ERSE Ordinance 1 800/2009 of 14 January, D.R. 9, Série IIApproves the rules on the natural gas auction for the 2009-2010 gas year
ERSE Ordinance 1 801/2009 of 14 January, D.R. 9, Série IIApproves the Guide on Measurement, Reading and Publication of Data for the natural gas sector
ERSE Ordinance 1 802/2009 of 14 January, D.R. 9, Série IIQuarterly revision for energy prices in natural gastariffs in the first quarter of 2009
ERSE Ordinance 6 973/2009 of 5 March, D.R. 45, Série IIApproves procedures and time limits in the management of the change of natural gas seller
ERSE Ordinance 9 677/2009 of 7 April, D.R. 68, Série IIQuarterly revision for energy prices in natural gas
tariffs in the second quarter of 2009.
ERSE Ordinance 13 964/2009 of 18 June, D.R. 116, Série IIAmends tariff regulations of the natural gas sector – more flexible tariffs
ERSE Ordinance 14 148/2009 of 23 June, D.R. 119, Série IINatural gas tariffs and prices for the 2009-2010gas year
ERSE Ordinance 16 874/2009of 22 July, D.R. 140, Série IIAlterations to the manual of system operation procedures and the compensation procedures of the natural gas sector
Regulation (EC) 663/2009 of the European Parliament and of the Council of 13 July, OJEU 200, Series L, 31 JulyProgramme to aid economic recovery by grantingfinancial assistance to projects in the field of energy
Directive 2009/73/EC of the European Parliament and of the Council of 14 August, OJEU 211, Series LEstablishes common rules for the internal market innatural gas and revokes Directive 2003/55/EC
Regulation (EC) 715/2009 of the European Parliament and of the Council of 13 July, OJEU 211, Series L, 14 AugustEstablishes the conditions for access to the natural gas transport network and revokesRegulation (EC) 1775/2005
Natural gas
Report and Accounts 2009
Glossary
Glossary | 223
CapexInvestment at total costs in the purchase orimprovement of tangible fixed assets
Debt to equity ratioNet debt / equity
Dividend per shareOrdinary dividend / total number of shares
EBITEarnings before interest and taxes (operating profit)
EBITDAEarnings before interest, taxes, depreciation and amortization
EBITDA Margin
EBITDA/turnover
Net debtShort- and long-term financial debt – cash in hand
Payout ratioOrdinary dividends/net profit
Return on assets (ROA)EBIT/net assets
Return on equity (ROE)Net profit/equity
TurnoverSales and services
Acronyms
AGCNatural Gas Consumption Management Agreement
CERCertified Emissions Reductions
CESUREnergy Contracts for Delivery to Supplier of LastResort
CIGRÉInternational Council on Large Electric Networks
CMVMPortuguese Stock Exchange Comission
DGEGDepartment of Energy and Geology
DRPortuguese Official Gazette
DRSDisaster Recovery System
DWDMDense Wavelength Division Multiplexing
ECEuropean Commission
ECXEuropean Climate Exchange
EDPEnergias de Portugal, S.A.
EGIGEuropean Gas pipeline Incident Data Group
EHVExtra high voltage
EIBEuropean Investment Bank
EITEquivalent Interruption Time
Financial glossary Technical glossary
Report and Accounts 2009
224 | Glossary
EMTNEuro Medium Term Notes
ENSEnergy Not Supplied
ERGEGEuropean Regulators Group for Electricity and Gas
ERSEEnergy Services Regulatory Authority
ETAElectricity Transmission Activity
ETSEmissions Trading Scheme
ETSOEuropean Transmission System Operators
EUEuropean Union
EURELECTRICUnion of the Electricity Industry
GDPGross Domestic Product
GDPGás de Portugal, SGPS, S.A.
GHGGreenhouse gases
GMRSGas Regulating and Metering Station
GRMGas Regulating and Metering Station
GVAGross Value Added
HCPIHarmonised Consumer Price Index
HVHigh Voltage
IDNIndustrial Data Network
IEAInternational Energy Agency
IFRSsInternational Financial Reporting Standards
INENational Institute of Statistics
IPInternet Protocol
IRCCorporate Income Tax
ISDAInternational Swap and Derivatives Association
IVAValue Added Tax
LNGLiquefied natural gas
MEFFSpanish Options and Futures Market
MIBELIberian Electricity Market
MLTMedium and Long Term
MTSPMunicipal Tax on Sale of Property
NGNatural gas
NNTGNNational Natural Gas Transport Network
NTGNational Electricity Transmission Grid
OECDOrganisation for Economic Cooperation andDevelopment
OMELOperador del Mercado Ibérico de Energía- Polo Español, S.A.
Glossary | 225
OMIIberian Energy Market Operator
OMIClearSociedade de Compensação de Mercadosde Energia, S. A.
OMIPOperador do Mercado Ibérico de Energia (Pólo Português), S.A.
OSSIofficial social security institutions
OPEXOperating and Maintenance Costs
PNALENational Emission Allowance Plan
PNBEPHNational Programme for Dams of High HydroelectricPotential
POCPortuguese Official Accounting Standards
PPAPower Purchase Agreement
PPDAEnvironmental Performance Promotion Plan
PPECPlan for the Efficient Use of Electricity
RABRegulatory Asset Base
RCCPCurrent ROE
RECSRenewable Energy Certificate System
RENTELECOMRENTELECOM-Comunicações, S.A.
REORTEuropean Network of Transmission SystemOperators for Gas
RESDirective on Renewable Energy Sources
R&DResearch and development
RNDGNNational Natural Gas Distribution Network
RNTIATNational LNG transport, storage infrastructure andterminal network
ROAReturn on Assets
SAPSystems Applications and Products in Data Processing
SDHSynchronous Digital Hierarchy
SESubstation
IESIndependent Electricity System
SENNational Electricity System
SEPPublic Electricity Supply System
SGNLSociedade Portuguesa de Gás Natural Liquefeito, S.A.
SGPSHolding company
SGRISouth Gas Region Initiative
SNGNNational Natural Gas System
SQRService Quality Regulations
SRGSpecial Regime Generators
SRPVPrivate Voice Network Services
TENTrans European Networks
226 | Glossary
Report and Accounts 2009
bcm 109 cubic metres
cent.€ euro cents
CO2 carbon dioxide
EUR euro
€ euro
GHz gigahertz
GJ gigajoule
GW gigawatt
GWh gigawatt hour
k€ thousands of euros
km kilometre
kV kilovolt
kWh kilowatt hour
m3 cubic metre
m3(n) normal cubic metre (volume of gas metered at 0º Celsius and at 1 atmosphere of pressure)re)
M€ millions of euros
mEuros thousands of euros
MVA megavolt-ampere
Mvar megavolt-ampere reactive
MW megawatt
MWh megawatt hour
p.p. percentage points
s second
t tonne
tcm 1012 cubic metres
tCO2eq equivalent tonne of CO2
TWh terawatt-hour
Unidades
TSOTransmission System Operators
UAGIndependent Gasification Units
UCTEUnion for the Coordination of Transmission ofElectricity
UGSTariff for General Use of the System
URTTariff for Use of the Transmission Grid
USAEuropean Union Allowances

Credits | 227
Conselhoeditorial e gráfico
www.sinoptica.pt
Design e paginação
Francisco [email protected]
REN - Redes Energéticas Nacionais, SGPS, S.A.Avenida dos Estados Unidos da América, 551749-061 LISBOA - PortugalTel: +351 210 013 500