a probabilistic sampling method (psm) for estimating geographic distance to health services when...
TRANSCRIPT

RESEARCH Open Access
A probabilistic sampling method (PSM) forestimating geographic distance to health serviceswhen only the region of residence is knownKirsten MM Beyer1, Audrey F Saftlas2, Anne B Wallis2*, Corinne Peek-Asa3, Gerard Rushton4
Abstract
Background: The need to estimate the distance from an individual to a service provider is common in publichealth research. However, estimated distances are often imprecise and, we suspect, biased due to a lack of specificresidential location data. In many cases, to protect subject confidentiality, data sets contain only a ZIP Code or acounty.
Results: This paper describes an algorithm, known as “the probabilistic sampling method” (PSM), which was usedto create a distribution of estimated distances to a health facility for a person whose region of residence wasknown, but for which demographic details and centroids were known for smaller areas within the region. Fromthis distribution, the median distance is the most likely distance to the facility. The algorithm, using Monte Carlosampling methods, drew a probabilistic sample of all the smaller areas (Census blocks) within each participant’sreported region (ZIP Code), weighting these areas by the number of residents in the same age group as theparticipant. To test the PSM, we used data from a large cross-sectional study that screened women at a clinic forintimate partner violence (IPV). We had data on each woman’s age and ZIP Code, but no precise residentialaddress. We used the PSM to select a sample of census blocks, then calculated network distances from eachcensus block’s centroid to the closest IPV facility, resulting in a distribution of distances from these locations to thegeocoded locations of known IPV services. We selected the median distance as the most likely distance traveledand computed confidence intervals that describe the shortest and longest distance within which any givenpercent of the distance estimates lie. We compared our results to those obtained using two other geocodingapproaches. We show that one method overestimated the most likely distance and the other underestimated it.Neither of the alternative methods produced confidence intervals for the distance estimates. The algorithm wasimplemented in R code.
Conclusions: The PSM has a number of benefits over traditional geocoding approaches. This methodologyimproves the precision of estimates of geographic access to services when complete residential addressinformation is unavailable and, by computing the expected distribution of possible distances for any respondentand associated distance confidence limits, sensitivity analyses on distance access measures are possible. Faulty orimprecise distance measures may compromise decisions about service location and misdirect scarce resources.
BackgroundEpidemiologists and public health policy researchersshare an interest in studying geographic access to healthservices, especially for high-risk populations and under-served communities. Computing geographic access,
however, is complicated by the fact that many data setscontain geographic information such as the census tract,ZIP Code or county of residence instead of precise resi-dential address information. Because of the geographicand demographic heterogeneity of these areas, distancecalculations may be imprecise with no informationabout the most likely range of distances within whichthe true distance will lie (confidence limits). Ascertain-ing the best estimate of geographical access to services
* Correspondence: [email protected] of Epidemiology, University of Iowa, C-21M General Hospital,Iowa City, IA 52242, USAFull list of author information is available at the end of the article
Beyer et al. International Journal of Health Geographics 2011, 10:4http://www.ij-healthgeographics.com/content/10/1/4
INTERNATIONAL JOURNAL OF HEALTH GEOGRAPHICS
© 2011 Beyer et al; licensee BioMed Central Ltd. This is an Open Access article distributed under the terms of the Creative CommonsAttribution License (http://creativecommons.org/licenses/by/2.0), which permits unrestricted use, distribution, and reproduction inany medium, provided the original work is properly cited.
afforded by available data is critical to efforts aimed atimproving health access. Imprecise estimates, however,can compromise the efficacy of policy and programmaticdecisions and may misdirect scarce resources.There is a sizeable literature that seeks to improve
estimation of geographic access to health care services[1] and to assess the potential errors in the methodscurrently in use [2]. Methods for calculating distancesbetween an individual and a facility include Euclidean(straight line) and network distance calculations. Net-work distance calculations take into account street net-works and may incorporate other data, such as speedlimits or the time it takes to make a turn. At present,Euclidean distance is the most widely used method;however, it is flawed because people travel by real trans-portation networks, not “as the crow flies” [1]. Increas-ingly, web-based distance estimating algorithms areavailable to provide more accurate distance estimates,but it is common for a user to know only the areawithin which a person lives rather than their exact loca-tion. This problem is generally solved by assigning ageocode representative of the area in question to theindividual, which raises the question of determining themost appropriate geocode for this purpose.Determining the best geocode to use in calculating
distance is a common problem [3,4]. It has been com-mon practice to use the centroid - or geometric center -of a geographic area as a point location representing theresidence of an individual known to reside within thatarea, when no further information is available. Often,the ZIP Code is the best available geocode in a dataset.However, use of a ZIP Code area centroid as a represen-tation of a person’s location within that ZIP Code canbe problematic for several reasons.First, it is difficult to locate the centroid of a ZIP
Code, as true boundaries of ZIP Codes are generally notknown. US ZIP Codes were defined as routes for thedelivery of mail, not as distinct geographic areas, and insome cases they do not even form spatially contiguousareas. Since 2000, ZIP Code centroids have been calcu-lated using a new US Census Bureau geographical unitthat establishes ZIP Code boundaries: the ZIP CodeTabulation Areas (ZCTAs™). The ZCTA was developedto estimate the geographical area represented by a ZIPCode. ZCTAs are created from Census blocks, wherethe ZIP Code of the majority of residents in a Censusblock determines that block’s membership within aZCTA. The merits and detriments of the ZIP Code as ageocode have been discussed at length previously [5-10].A second weakness is that the ZCTA centroid repre-
sents the center of land area within a ZIP Code, whichmay not be a population center. The resultant centroidlocation may be non-representative of population den-sity (e.g., very few people may live there) or it may be
the location of a lake or other non-residential area. Pre-vious work has sought to address this problem by pla-cing the geocode not at the centroid of the ZCTA, butat the centroid of the largest incorporated area withinthe ZCTA - the ZIP Code population center - arguingthat this better represents the location of an individual’strue residence [6]. It is well known that if the largestpopulation center within a ZIP Code is larger than one-half of the population of the ZIP Code, it is the medianpopulation center of the ZIP Code area no matterwhere it is located within the ZIP Code area.We conclude that there are serious limitations and
some undesirable consequences of using current meth-ods for estimating distances from people whose loca-tions are known only by the areas within which theylive. However, we have access to information about thepopulation distribution within a ZIP Code that, to somedegree, can be used to address these limitations.In this paper, we present a method which utilizes
knowledge of the distribution of people with their areaof residence for estimating geographic access to a speci-fied health service for a defined user-group, thus makingit possible to improve efforts to equitably distributeneeded services. Specifically, we (1) describe a probabil-istic sampling approach to approximate an individual’sgeographic location, when only a region is known, andestimate the most likely distance the person would haveto travel to access services, (2) compare the results ofour method to those obtained by two other distance-estimating approaches, and (3) show that the two meth-ods over-estimate and underestimate respectively, thedistance of the person to the health facility. We applythese methods to a sample of women screened for inti-mate partner violence (IPV) in a reproductive healthclinic to identify the distance from each of the womento the closest domestic violence intervention facilities,with a focus on rural women. Since this was an anon-ymous screening, individual addresses were not col-lected, although participants did report their ZIP Codeof residence.
ResultsAlgorithmTo estimate the distance a person (e.g. a survey respon-dent) would have to travel to reach their nearest facilitywhen only their region of residence (e.g. ZIP Code) isknown, we first identified the smaller areas (e.g. CensusBlocks) nested within that region, for which detaileddemographic information and centroids were available.Our algorithm selected 30 sampled locations (includingup to 30 different smaller areas) within the larger regionusing probability proportional to size sampling withreplacement. This sampling strategy selects one smallerarea from within the larger region, with each area’s
Beyer et al. International Journal of Health Geographics 2011, 10:4http://www.ij-healthgeographics.com/content/10/1/4
Page 2 of 11
probability of selection weighted by the number ofwomen of the respondent’s age living in that area; thearea selected is then “replaced” back into the set of pos-sible areas for selection, and the sampling procedure isrepeated until a sample size of 30 is obtained. Thismeans that an area’s probability of being selected duringthe first iteration is the same as its probability of selec-tion in each subsequent iteration, making each selectionindependent of the others. An area could be selectedmore than once or not at all. We next identified thecentroid (geometric center) of each smaller areasampled, and calculated distance along the road networkbetween each of the 30 centroids of the smaller areasand the nearest facility. This process resulted in a popu-lation-weighted distribution of distances that representthe distances each respondent might have to travel. Wethen identified the median distance, bounded by 93%confidence intervals, as the most likely distance therespondent would have to travel to access services, asthis provides a measure of central tendency that is resis-tant to outliers in addition to a measure of certaintyregarding the estimate. The use of the median - asopposed to the mean - is common practice in locationscience because the median of a spatial distribution isthe point that minimizes the sum of the distances ofpeople to itself, whereas the mean minimizes the sum ofthe squared distances of people to itself. The 93% confi-dence interval was employed here for the sake of conve-nience, due to the fact that we sampled a total of 30locations; the interval presented is bounded by the sec-ond (shorter) and 29th (longer) distances in the distribu-tion of 30 distances calculated for each woman.Alternative definitions and thresholds could be employedfor the presentation of measures of “confidence” or“range” associated with our median distance measure.Note that all estimated distances were calculated to theclosest health facility from each smaller area within theregion, and therefore estimated distances from any regionwere not necessarily to the same health facility. In orderto maintain the probabilistic nature of the method, were-sampled for each respondent even if more than onerespondent resided in the same region. This re-samplingapproach was selected over the alternative deterministicapproach, which could have established precisely the pro-portion of persons of the same demographic characteris-tics as the person of interest at different distances fromthe smaller areas, because we wanted to estimate the like-lihood of a given person on a given occasion being at agiven distance from their nearest health facility. The per-formance of a set of facilities for serving a given popula-tion can be better evaluated with reference to possibledistances than by reference to average distances. Possibleextreme distances matter in accessing the viability of par-ticular facility location decisions.
TestingWe tested our method using a study sample of partici-pants in an anonymous clinic-based survey designed toestimate the prevalence of IPV among women seekingabortion services at a large clinic in Iowa [11], consider-ing the survey respondent’s ZIP Code as her “region”and the Census Blocks within that ZIP Code as the“smaller areas.” It is known that women seeking abor-tions are at increased risk of IPV [12-14], and that geo-graphic isolation and access to domestic violenceservices can pose difficulties in rural areas [15-17]; thus,we were interested to know how far these high riskwomen, located throughout a rural state, would have totravel to access domestic violence intervention services,in order to determine whether distance to services mayconstitute a potential barrier to addressing the problemof IPV among this population. We sought to providethe best estimate of geographic access to services givenour limited knowledge of only a survey respondent’s ageand ZIP Code - a common problem in public healthresearch. An analysis exploring geographic disparity inaccess to domestic violence services using distances gen-erated by the method we describe was complete andnearing submission for peer review at the time of thiswriting.Data were collected between November 2006 and July
2008. The study sample of 1501 respondents includeddata on ZIP Code of residence and age. Of the original1501 respondent records, 22 were deleted due to miss-ing data (age, ZIP Code, or both). In addition, sixty-onerecords contained ZIP Codes not included in Iowa’s 949ZCTAs; we reassigned 52 of these records to ZCTAs byidentifying their locations through the USPS ZIP CodeLookup tool; 9 records were deleted because no ZCTAcould be determined using the lookup tool or becausethe ZIP Code was for an out-of-state location. We dis-covered 3 cases in which ZCTA population data con-tained no women of the respondents’ age; therefore, itwas impossible to perform the sampling procedure, andthe records were deleted. The final dataset for which thesampling procedure was performed included 1467records.We used respondents’ age and ZIP Code in concert
with US Census 2000 population data to estimate loca-tion of residence. Geographic areas used were ZIPCode/ZCTA to represent the known residence “region”and the Census block to represent the “smaller areas”within the region. In 2000, there were 949 ZCTAs inthe state of Iowa, each created based on Census blocksand intended to estimate the area covered by a particu-lar ZIP Code. Not all valid ZIP Codes are representedby a ZCTA; some may fall within a ZCTA associatedwith a different ZIP Code. Geographic boundaries ofIowa Census blocks were obtained from the ESRI data
Beyer et al. International Journal of Health Geographics 2011, 10:4http://www.ij-healthgeographics.com/content/10/1/4
Page 3 of 11
center http://arcdata.esri.com/data/tiger2000/tiger_-download.cfm and ZCTA boundaries were obtainedfrom the US Census Bureau website http://www.census.gov/geo/www/cob/z52000.html. Census data on age andgender were obtained for Iowa Census blocks (Census2000 table P12). http://factfinder.census.gov/servlet/DownloadDatasetServlet?_lang=en. Study participantswere females 18-44 years of age.We performed our sampling procedure using ZCTAs
as “regions” and Census Blocks contained within themas “smaller areas”, as described above. Code was writtenand implemented using R software using the ppswr()function available in the pps package [18].To validate our sampling method, we plotted all parti-
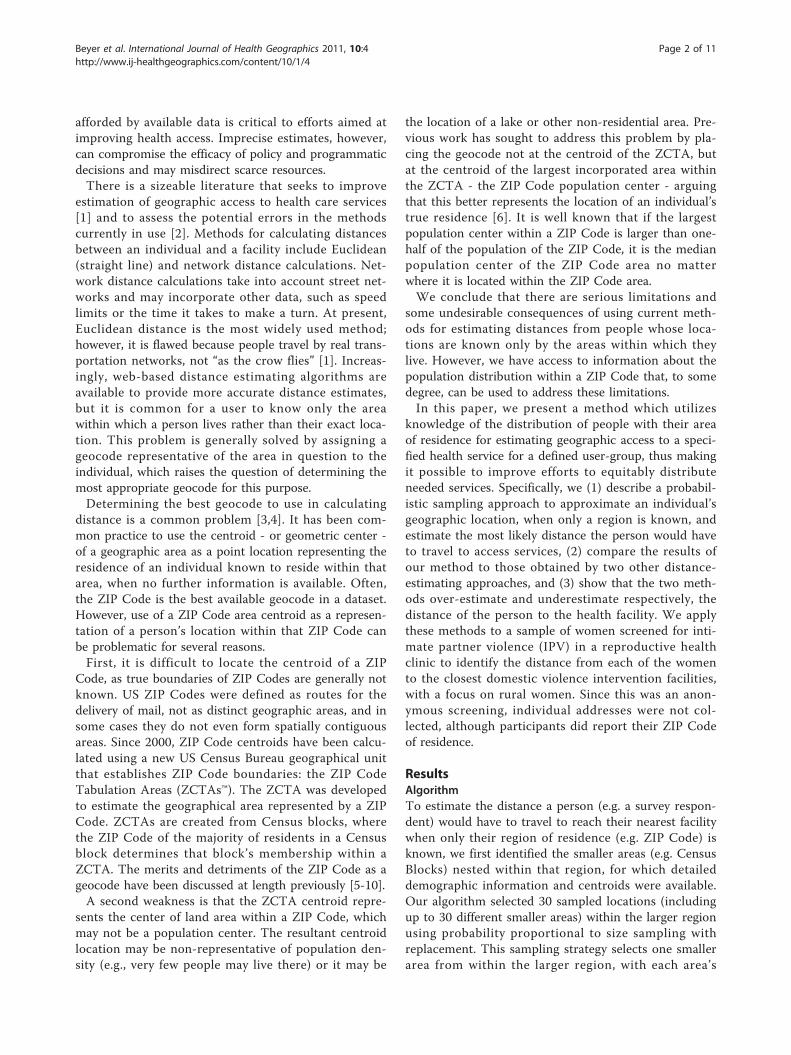
cipants to show the proportion of the ZCTA populationin each Census block with the number of times theblock was selected using the PSM. Figure 1 shows thatthe blocks were sampled proportionate to the ZCTA’sage-specific population within a block (i.e., ZCTAs withfew women of reproductive age had fewer sampledblocks than those with more women of reproductiveage). We also inspected the samples visually to confirmthat the sampling was probabilistic and not determinis-tic (i.e., that not all blocks with a proportion of .33population are sampled exactly 10 times), and confirmedthat there were 30 blocks sampled for each respondent.
ImplementationWe geocoded 28 IPV resource center locations providedby Children & Families of Iowa Family Violence Center,who maintain and update annually a compendium ofstate IPV resources. Locations were identified by a streetaddress or a Post Office (PO) box number with city andZIP Code. We geocoded 14 locations with address infor-mation using ESRI ArcMap. Of these 14, 10 were geo-coded with 100% accuracy, and 4 with 81% accuracy.Locations were geocoded using the street network of
Iowa obtained from the Iowa Natural Resources GISLibrary http://www.igsb.uiowa.edu/nrgislibx/, which isbased on the US Census TIGER/Line files for 2000. Theremaining 14 records had only PO boxes and ZIPCodes; for these, the resource center was placed at thecentroid of the largest incorporated area in the ZIPCode–a method described in more detail elsewhere [6].We calculated distances along the road networkbetween the sampled block centroids and the servicecenter locations, using ESRI ArcMap™ software (includ-ing the Network Analyst extension). This resulted in adistribution of 30 distance estimates for each individual.We then selected the median distance in this distribu-tion as the most likely distance an individual wouldhave to travel to access IPV services and calculated the93% confidence intervals to identify the likely range ofdistances.It is important to consider how this distance estima-
tion method compares to other common approaches toestimating distances when only the ZIP Code of resi-dence is known. A common practice is to use the cen-troid of an individual’s ZCTA as their geocodedresidence. Another approach is to select the centroid ofthe largest incorporated area in an individual’s ZIPCode/ZCTA, a method described previously [6]. We cal-culated two new sets of network distances to IPV servicelocations, using these two alternative methods, and usedlinear regression analyses to predict the median distanceobtained using our PSM with the ZCTA centroid andZIP Code center distances, respectivelyFigure 2 illustrates how these three distance estima-
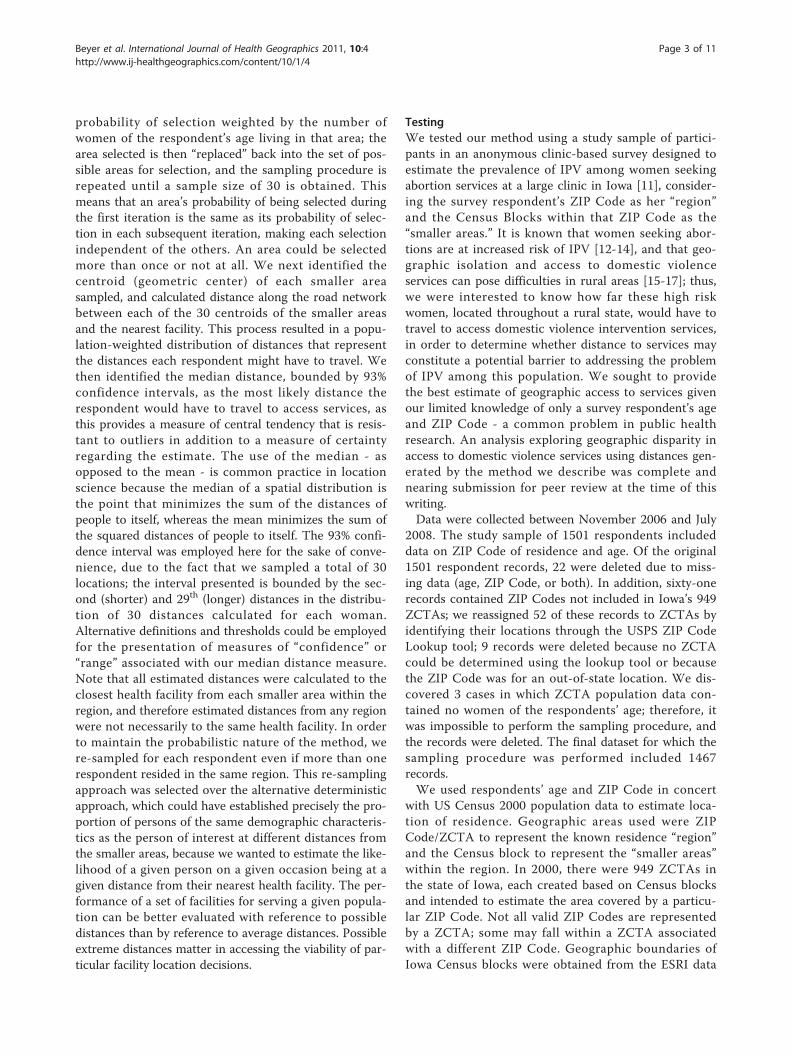
tion approaches differ. The panel on the left shows thedifference between the ZCTA centroid and the ZIPCode population center methods, where the ZIP Codecenter point more closely corresponds with the locationsof the sampled blocks. In Panel 2, depending on thegeocode (ZCTA centroid vs. ZIP Code center), a differ-ent service center is identified as being the closest; whenour PSM is used, both facilities are represented in thecalculation, with the number of times they are includedreflecting their likelihood of the IPV facility being clo-sest to the subject’s residence.Our discussion of the results of this comparison of
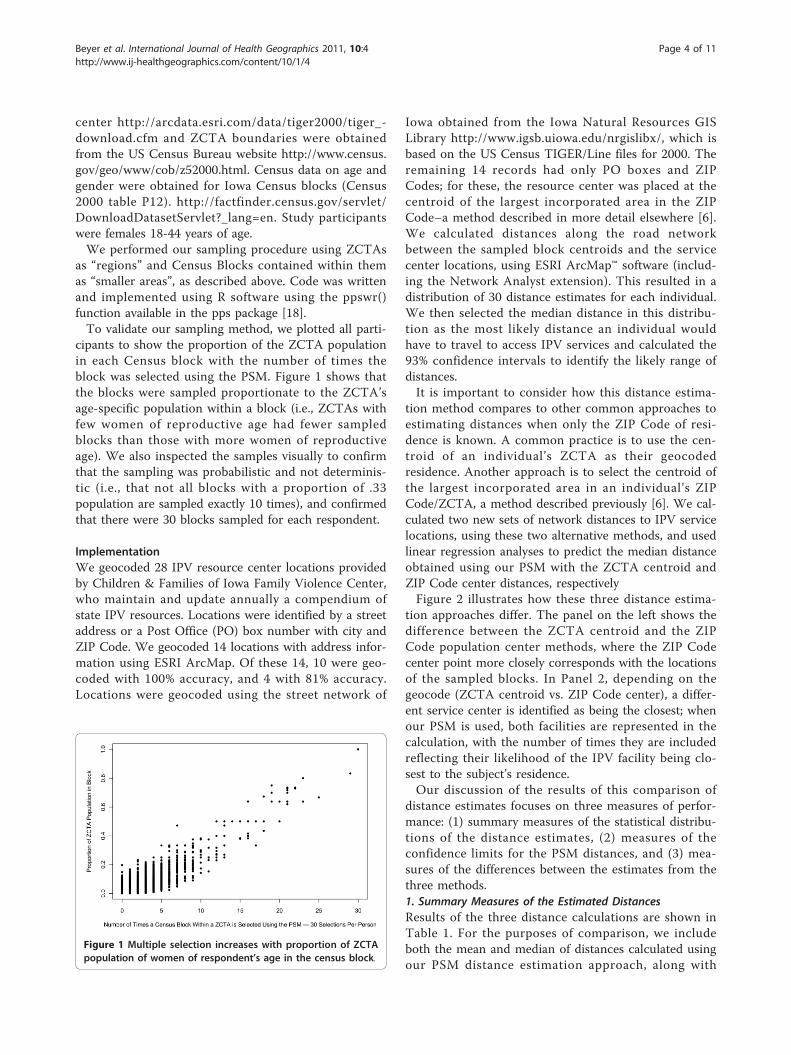
distance estimates focuses on three measures of perfor-mance: (1) summary measures of the statistical distribu-tions of the distance estimates, (2) measures of theconfidence limits for the PSM distances, and (3) mea-sures of the differences between the estimates from thethree methods.1. Summary Measures of the Estimated DistancesResults of the three distance calculations are shown inTable 1. For the purposes of comparison, we includeboth the mean and median of distances calculated usingour PSM distance estimation approach, along with
Figure 1 Multiple selection increases with proportion of ZCTApopulation of women of respondent’s age in the census block.
Beyer et al. International Journal of Health Geographics 2011, 10:4http://www.ij-healthgeographics.com/content/10/1/4
Page 4 of 11
ZCTA centroids and ZIP Code population centers asgeocodes. It is important to note that the minimum dis-tance value calculated using the ZIP Code populationcenter point as a geocode for the woman’s residence is0 because some IPV service locations were also geo-coded to the ZIP Code population center when streetaddress information was unavailable. Likewise, some dis-tances calculated using ZCTA centroid points are essen-tially calculations of the distance between the ZCTAcentroid and the ZIP Code population center, if IPV ser-vice centers were geocoded to the ZIP Code center
points and women’s residences were geocoded to ZCTAcentroids.In our sample, the distribution is skewed toward
shorter distances, with a minimum distance traveled of0.39 miles and a maximum of 66.4 miles. The mediandistance to the closest service facility for all women was5.2 miles using the PSM. The maximum number of facil-ities used for estimating distance for a single respondentwas 4, which again was not a frequent occurrence, as themean number of facilities used to calculate distances was1.66, and the median was 1.
Data sources: IPV resource addresses provided by Children and Families of Iowa Family Violence Center; block centroids coordinates calculated using block shapefiles from ESRI; Iowa roads data and data used to create ZIP code population center points from the Iowa Natural Resources GIS Library maintained by Iowa DNR and Iowa Geological Survey; ZCTA centroids calculated using ZCTA shapefiles from the US Census Bureau; ZIP code population centers are centroids of largest incorporated areas in ZIP code.
!.
!.
!.
!.
ZIP code population center ZCTA centroidZIP center route ZCTA centroid route
Sampled respondent locations
Sampled locations traveling with ZCTA centroid route
Sampled locations traveling with ZIP center route
Iowa road network
0 0.5 10.25 Miles0 0.5 10.25 Miles
!.!.
Figure 2 The effects of residential geocode on distance estimation and determination of closest facility. PANEL 1 shows that in somecases, the ZIP Code center is much closer to representing the geography of the sampled locations than the ZCTA centroid, although the effecton distance estimation may be negligible. PANEL 2 illustrates that respondents may be comparably close to multiple service centers. Use ofZCTA centroid or ZIP Code center geocode alone may result in different determinations of which facility is closest. A probabilistic samplingapproach includes all facilities to the degree that they are relevant.
Table 1 Measures of central tendency for estimated distances (in miles) between respondent locations and IPV servicecenters using three methods
PSM (median) PSM (mean) ZCTA centroid as geocode† ZIP Code population center as geocode
Range 0.39 - 66.4 0.53 - 65.6 0.09 - 67.2 0.00* - 66.6
Median 5.2 5.4 5.4 6.0
Mean (SD) 10.1 (11.2) 10.2 (11.2) 10.5 (11.1) 9.9 (11.2)
1st Quartile 2.9 3.1 3.6 3.4
3rd Quartile 12.2 12.3 12.1 11.7
The table compares distance estimates obtained using the Probabilistic Sampling Method (PSM), ZCTA centroid, and ZIP Code population center geocodingapproaches (n = 1467). * The value of 0 reflects the distance (e.g., 0 miles) between the ZIP Code center point and itself when it is used as a geocode for boththe subject’s residence and the location of the IPV service center. † Some distances calculated using the ZCTA centroid as the geocode for the subject’sresidence reflect the distance between the ZCTA centroid and the ZIP Code center point, when IPV service centers were geocoded to ZIP Code centers.
Beyer et al. International Journal of Health Geographics 2011, 10:4http://www.ij-healthgeographics.com/content/10/1/4
Page 5 of 11

Estimated distances vary depending on the geocodeused, and differences among methods are most apparentat shorter distances, which make up the vast majority ofdistances calculated. Figure 3 illustrates the variability ofdistances calculated using the ZCTA and Zip Codepopulation center methods for the 150 women with theshortest distances to their nearest IPV center as calcu-lated by the PSM median distance method. As bothgraphs order the observations by the PSM median dis-tance calculated for each individual and use the samevalue scale, the graphs can be directly compared. Boththe ZCTA centroid and ZIP Code center distances varysignificantly from the median of sampled distances. Thisvariability of the distance estimates in the short distancerange shows that ZCTA centroid and ZIP Code centerdistance calculations do not take into account theknown distribution of the distance estimates around anysingle case. In general, the ZIP Code center geocodeappears to exhibit less variability, which can be attribu-ted to the fact that it is deliberately placed in a popu-lated area. However, in some cases it may be moreproblematic than the ZCTA centroid, for example, insituations where there are two significant populatedplaces within a ZIP Code, and a woman is geocoded tothe larger of these places when in fact she actuallyresides in the smaller one; the ZCTA centroid may be abetter approximation of her actual location in thissituation.
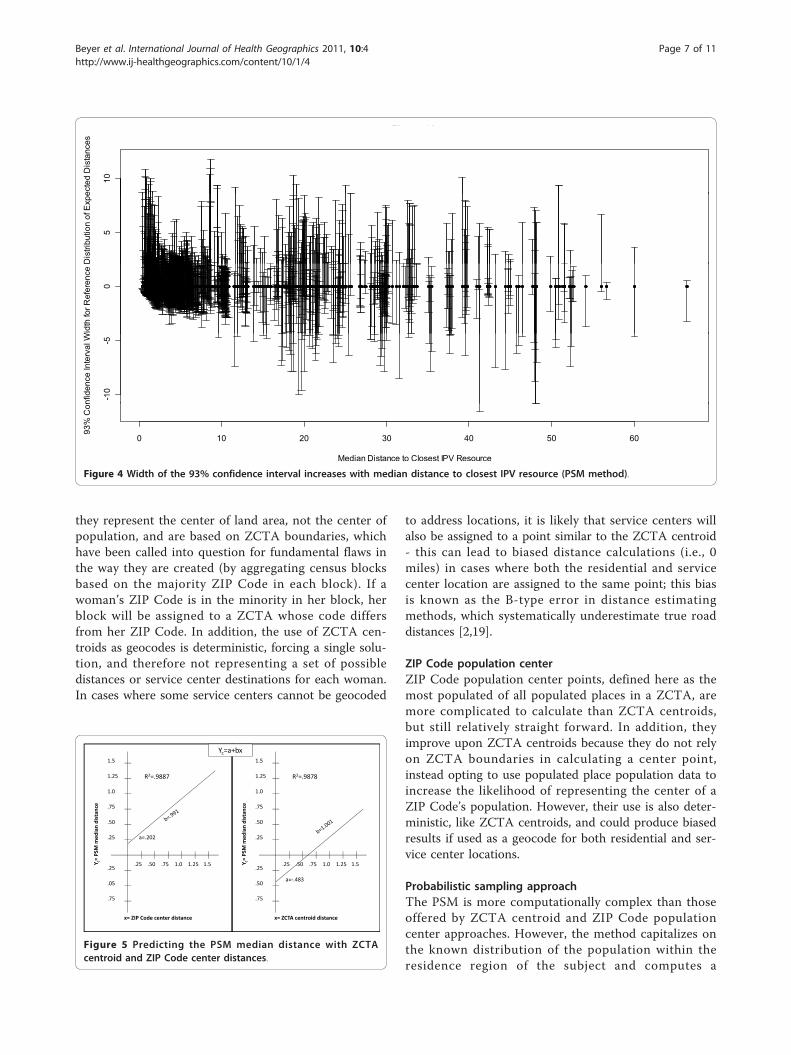
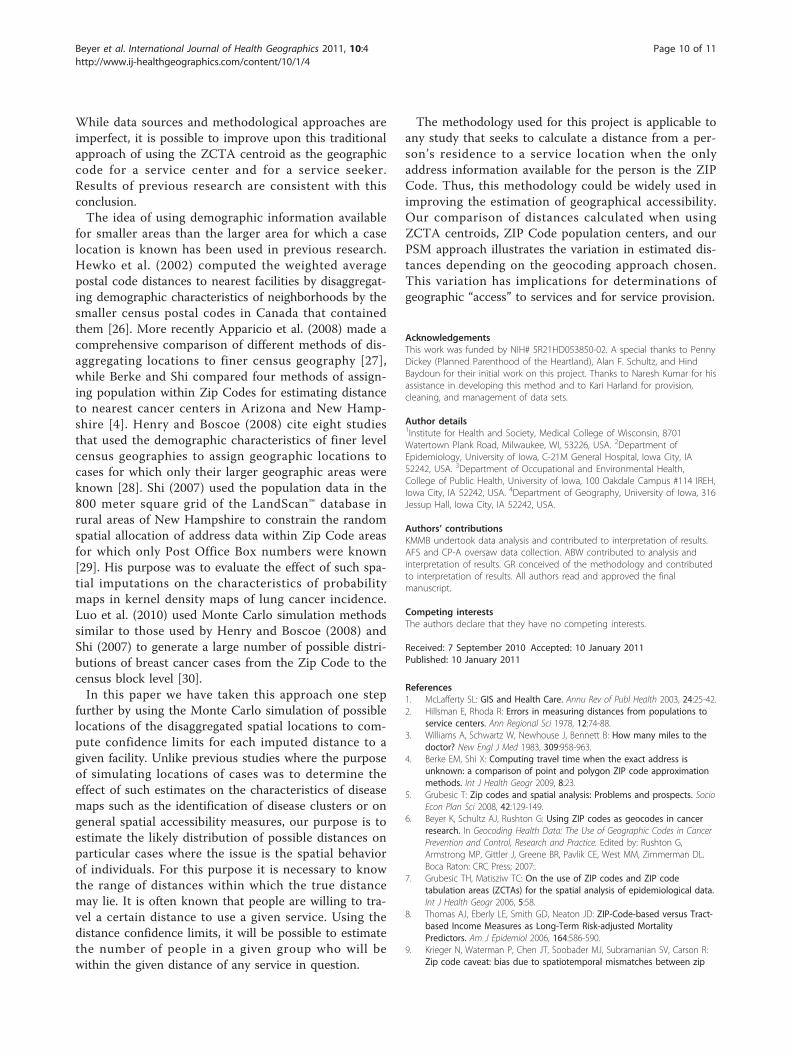
2. Measures of the confidence limits for the PSM distancesFigure 4 shows the 93% confidence intervals for eachperson using PSM. These figures show tighter confi-dence intervals (greater precision) for shorter distances(e.g., more urban service areas) and wider confidenceintervals for greater distances (e.g., more rural loca-tions). Neither the ZCTA centroid nor ZIP Code centercalculations provide confidence estimates.3. Measures of the differences between the estimates fromthe three methodsWe measured the consistency of the distance estimatesby the three methods by regressing each median PSMdistance estimate against the distance estimate of theZCTA centroid and Zip Code center respectively. Figure5 shows the results of these regressions. In both cases thestatistical fit (R2) is very high and the linear coefficientvery close to 1.0. However, in both cases it is evident thatthe estimated distances are biased in relation to the dis-tances estimated by the PSM median distance method. Ingeneral, the distances computed using the ZIP Codepopulation centers underestimate the distances and thedistances using the ZCTA centroids overestimate them.These results can be generalized to other efforts to
measure spatial access measures to health facilities. Thetheoretical literature in geographic information scienceconcludes that the size of the over- and under-estima-tion is, in general, a function of the ratio of the numberof areal units to the number of health facilities [19]. Asthe number of ZIP Codes per IPV facility increases, thenumber of participants allocated to more than one IPVfacility will decrease, within the boundaries of their ZIPCode using the PSM.In the Iowa study region where we used the PSM,
there were 218 ZIP Codes and 28 IPV facilities–a ratioof approximately 8:1. For either of the two comparisonmethods, as this ratio decreased, the overestimation ofdistances increased. In this implementation, the ratio ofapproximately 8:1 leaves one method to underestimatedistances and the other method to overestimate them.Sensitivity of results to the value of this ratio in anyimplementation requires attention and can be estimatedthrough simulation studies not developed in this paper.
DiscussionThis research suggests that the PSM used for computinggeographic access of health data, aggregated by ZIPCodes, has several advantages over traditional methodsof computing geographic access. The geocodingapproaches presented in this paper have their respectivebenefits and limitations, as follows.
ZCTA centroidZCTA centroids are easy to calculate from ZCTAboundary files, which are publicly available. However,
7
8
9
ZCTA CentroidProbabilistic Sampling Median
4
5
6
7
1
2
3
4
0
1
8
9
5
6
7
8
Zip Code CenterProbabilistic Sampling Median
2
3
4
5
0
1
2
Figure 3 Comparison of the PSM distances with two commonlyused alternative methods for estimating distances betweenresidence and service location.
Beyer et al. International Journal of Health Geographics 2011, 10:4http://www.ij-healthgeographics.com/content/10/1/4
Page 6 of 11
they represent the center of land area, not the center ofpopulation, and are based on ZCTA boundaries, whichhave been called into question for fundamental flaws inthe way they are created (by aggregating census blocksbased on the majority ZIP Code in each block). If awoman’s ZIP Code is in the minority in her block, herblock will be assigned to a ZCTA whose code differsfrom her ZIP Code. In addition, the use of ZCTA cen-troids as geocodes is deterministic, forcing a single solu-tion, and therefore not representing a set of possibledistances or service center destinations for each woman.In cases where some service centers cannot be geocoded
to address locations, it is likely that service centers willalso be assigned to a point similar to the ZCTA centroid- this can lead to biased distance calculations (i.e., 0miles) in cases where both the residential and servicecenter location are assigned to the same point; this biasis known as the B-type error in distance estimatingmethods, which systematically underestimate true roaddistances [2,19].
ZIP Code population centerZIP Code population center points, defined here as themost populated of all populated places in a ZCTA, aremore complicated to calculate than ZCTA centroids,but still relatively straight forward. In addition, theyimprove upon ZCTA centroids because they do not relyon ZCTA boundaries in calculating a center point,instead opting to use populated place population data toincrease the likelihood of representing the center of aZIP Code’s population. However, their use is also deter-ministic, like ZCTA centroids, and could produce biasedresults if used as a geocode for both residential and ser-vice center locations.
Probabilistic sampling approachThe PSM is more computationally complex than thoseoffered by ZCTA centroid and ZIP Code populationcenter approaches. However, the method capitalizes onthe known distribution of the population within theresidence region of the subject and computes a
10
ecte
d D
ista
nces
Figure 2b
5
Dis
tribu
tion
of E
xpe
0
Wid
th fo
r Ref
eren
ce D
-10
-5
nfid
ence
Inte
rval
W
0 10 20 30 40 50 60
Median Distance to Closest IPV Resource
93%
Con
Figure 4 Width of the 93% confidence interval increases with median distance to closest IPV resource (PSM method).
1 5 1 5
Yc=a+bx
1 0
1.25
1.5
R2=.9887
1 0
1.25
1.5
R2=.9878
.50
.75
1.0
distan
ce
.50
.75
1.0
distan
ce
.25
=PSM
med
ian
a=.202 .25
=PSM
med
ian
.25
.05
.25 .50 .75 1.0 1.25 1.5Y c=
.25
.50
.25 .50 .75 1.0 1.25 1.5Y c=
a= .483
.75
x= ZIP Code center distance
.75
x= ZCTA centroid distance
Figure 5 Predicting the PSM median distance with ZCTAcentroid and ZIP Code center distances.
Beyer et al. International Journal of Health Geographics 2011, 10:4http://www.ij-healthgeographics.com/content/10/1/4
Page 7 of 11

distribution of distance estimates for each subject, fromwhich it is possible to calculate the confidence limits ofeach subject’s distance estimate. In addition, thismethod allows for travel to alternative facilities that areclose to the individual, thus offering more insightregarding service access for those with responsibilitiesfor interpreting and using the information. Distanceestimates from the PSM method together improve uponthe ZCTA centroid, as they represent the center ofpopulation within a ZIP Code instead of land area, andimprove upon ZIP Code population center points byproviding a range of possible locations instead of a sin-gle point. Further, this method can be used to weightthe sampled blocks based on available demographicinformation, making it possible to represent the centerof different types of populations, such as women of acertain age. The PSM capitalizes on the increased spatialdetail that is often available in spatial demographic datacompared with the spatial detail used to represent thelocation of participants whose health is of concern.Finally, this method will likely not result in biasedresults of 0 distance, as residential and service locationsare not assigned to share a single location in space.Selection of the median distance calculated is likelymore representative of the true distance traveled, as it isresistant to outlier distances calculated from sampledlocations unlikely to be the true residential location ofthe woman.Our claim that the PSM is more accurate than other
methods used to date, including the two methods usedin this paper, rests not on any empirical finding, but onthe logic that we have used the spatial distribution ofsocio-demographic characteristics within the larger resi-dential area and that we have generated the possible dis-tribution of distances to the nearest facility for theperson in question. This logic permits us to concludethat we can infer the proportions of cases in which thedistance in question will reach any known or given stan-dards of geographical access. Other, non probabilisticmethods of distance estimation cannot address thisimportant question. Empirical tests of this methodwould be valuable in that they would reinforce thisassertion and illustrate the scale of the added benefit ofthe knowledge of the distribution of distances affordedby the use of the PSM. Empirical tests would also con-tribute to understanding the differential benefit affordedin different geographic settings, such as in urban versusrural settings.Our limited testing of the PSM algorithm belies the
many situations in which it could be used. This type ofprobabilistic method, which does not require individualaddresses, will be increasingly important with increasedefforts to protect the confidentiality of health data. Spatialaggregation of the health data of individuals is the most
commonly used method to protect the privacy of indivi-dual health data. Implemented either at the stage of dataacquisition; e.g. “what is your ZIP Code?” or at the stage ofdata dissemination “location of subject: ZIP Code,” thenames of the regions perform the function of a geographicmask, preserving the confidentiality of the informationpromised to the subject and enforced by law [20].There are a number of situations in which we would
anticipate the results of a probabilistic samplingapproach to differ even more significantly from ZCTAcentroid or ZIP Code center calculations. In Iowa,ZCTAs are of relatively constant geographical size; thisis not true throughout the US. In states in which ZIPs/ZCTAs are quite large geographically, one would expectmore disparity between calculations using differentmethods. Also, in cases in which a ZCTA contains morethan one highly populated place, calculations using theZIP Code population center point are likely to differ sig-nificantly from calculations using our methodology,especially if these two populated places are far fromeach other. Finally, in communities that are highly seg-regated by age, sex, race, ethnicity, or any other charac-teristic of a respondent used to weight the sampledcensus blocks, or are zoned to severely separate residen-tial from commercial areas, it is more likely that thePSM will achieve different results than either the ZCTAcentroid or ZIP Code center methods.Table 2 illustrates the many situations in which the
PSM algorithm could be used. Typical situations arefound where spatial data is collected and disseminatedin a spatial hierarchy where smaller areas nest withinlarger regions which, in turn, nest within even largerregions. A large literature now exists on methods tospatially disaggregate data using symptomatic attributesand geographic information science [21-23]. The lastline in this table references one such method which hasbeen widely disseminated recently [21].An important limitation of this study is that the IPV
resource facilities to which distances were calculatedmay not reflect the actual choices a woman would makein seeking services. Factors not taken into accountinclude the type of services available at each facility,whether or not the facility’s location is protected forprivacy reasons, and the notion that a woman may notwant to seek services close to her home, as she may fearfor her safety or want to minimize the chances that herseeking of services is made known to people with whomshe is acquainted. A more realistic estimation of accessto services could be obtained by evaluating the surveyresponses for each woman in order to determine whichservices she would likely seek and then interrogating thenature of each facility and using this information torestrict the facilities considered in the analysis to thoseappropriate to a woman’s stated criteria.
Beyer et al. International Journal of Health Geographics 2011, 10:4http://www.ij-healthgeographics.com/content/10/1/4
Page 8 of 11

Other limitations are also relevant. This study usesCensus block population data from the year 2000 whilethe survey results were collected from 2006-2008. Wecould have attempted to account for this by utilizingblock populations that were several years younger thanthe woman’s age at the time of her survey completion.However, this approach would have assumed a lack ofmigration (unlikely given the ages of many respondents,who may be moving for school or work). In addition,demographic characteristics beyond age and gender,such as race and ethnicity were not taken into accountin the weighting process and could potentially be usedin refining the sampling procedure.The geocoding of the IPV service locations in this
study is imperfect, as nearly half of the facilities onlyprovided P.O. Box and ZIP Code - not street addressinformation - and thus their actual locations may notcoincide with their geocoded locations. As mentionedpreviously, they are geocoded to the point representingthe largest populated place in the ZIP Code [6]. Wechose these points instead of ZCTA centroids to repre-sent locations of the IPV services because we believethey more accurately represent the center of populationin the ZIP Code. However, it should be kept in mindthat assuming that a domestic violence shelter is locatedin the center of population is likely a flaw in logic, asthey are often intended to have a confidential location,which may be on the outskirts of an urban area. How-ever, without knowing in which direction to offset thelocation from the urban center, a central location is themost logical solution and is likely superior to using aZCTA centroid, which is a center of land area and notpopulation.Following this, a comparison of ZCTA centroid and
ZIP Code center distances (Table 1) must include anawareness of the effect of the service center geocode. Incases in which the service center is geocoded to the ZIPCode population center point and falls in the sameZCTA as the woman’s residence, ZCTA centroid calcu-lations are in effect a calculation of the distance betweenthe ZCTA centroid and ZIP Code center; distance cal-culations using ZIP Code centers would be zero. In alarger sense, our geocoding of service centers - whilenecessary due to limited available information - results
in distance estimation error, especially given the highproportion of distances that are quite small. This is nota problem that is likely to be rectified, given the neces-sity of maintaining the confidentiality and security ofcertain IPV shelters.Also in regard to the ZIP Code as geocode, we assume
that the ZIP Code reported by a woman will correspondgeographically to the ZCTA represented by the same 5-digit code. However, this may be a limitation as ZIPCodes and ZCTAs are subject to spatial misalignment.ZCTAs are constructed from all US census blockswhere the majority of residents have a particular ZIPCode. If a survey respondent happens to report a ZIPCode that is in the minority in her block, she may beassigned to a ZCTA that does not actually contain heraddress. As no indication of the accuracy of ZIP Codeto ZCTA assignment is publicly available, we cannotaddress this limitation in our methodology.Finally, while implementing this method, we discov-
ered three cases in which ZCTA population data con-tained no women of the respondent’s age; in these cases,it was impossible to perform the procedure, and thus wedeleted these three records. These scenarios, while few,could be due to the temporal misalignment between theUS Census population data (2000) and our survey data(2006-2008) or they could be due to the practice of theU.S. Census to perturb census attribute informationbetween census blocks to prevent users of census datafrom imputing the attributes of individuals when smallnumbers of people are found in the cells of the datatables they publish.
ConclusionsOur findings indicate that the approach used to estimatethe geographic location of both services and potentialservice seekers can affect the estimation of distancesbetween services and service seekers, especially atshorter distances representing more urban areas, andcan therefore affect determinations of geographic acces-sibility of services. Examples of studies that have usedcentroid to centroid of ZIP Codes to estimate distancesto health facilities include Athas et al. (2000) and Onegaet al. (2008) to estimate travel distances to radiationtherapy and other cancer treatment locations [24,25].
Table 2 U.S. examples for using the Probabilistic Sampling Method (PSM) for distance estimation
Region of knownresidence (p)
Smaller areas within the region for which demographicdata is available (q)
Typical ratio (q/p)
county Zip Code, census tract, township, block group, census block Can vary widely from 36:1 for rural counties to 1000:1 formetropolitan counties.
Zip Code Census tract, census block group, census block From 10:1 to 10,000:1
Census tract Census block group, census block Variable; 50:1
Census tract 94 Meter grid population data for the U.S. (LandScan U.S.A.) Highly variable: 1000:1
Beyer et al. International Journal of Health Geographics 2011, 10:4http://www.ij-healthgeographics.com/content/10/1/4
Page 9 of 11
While data sources and methodological approaches areimperfect, it is possible to improve upon this traditionalapproach of using the ZCTA centroid as the geographiccode for a service center and for a service seeker.Results of previous research are consistent with thisconclusion.The idea of using demographic information available
for smaller areas than the larger area for which a caselocation is known has been used in previous research.Hewko et al. (2002) computed the weighted averagepostal code distances to nearest facilities by disaggregat-ing demographic characteristics of neighborhoods by thesmaller census postal codes in Canada that containedthem [26]. More recently Apparicio et al. (2008) made acomprehensive comparison of different methods of dis-aggregating locations to finer census geography [27],while Berke and Shi compared four methods of assign-ing population within Zip Codes for estimating distanceto nearest cancer centers in Arizona and New Hamp-shire [4]. Henry and Boscoe (2008) cite eight studiesthat used the demographic characteristics of finer levelcensus geographies to assign geographic locations tocases for which only their larger geographic areas wereknown [28]. Shi (2007) used the population data in the800 meter square grid of the LandScan™ database inrural areas of New Hampshire to constrain the randomspatial allocation of address data within Zip Code areasfor which only Post Office Box numbers were known[29]. His purpose was to evaluate the effect of such spa-tial imputations on the characteristics of probabilitymaps in kernel density maps of lung cancer incidence.Luo et al. (2010) used Monte Carlo simulation methodssimilar to those used by Henry and Boscoe (2008) andShi (2007) to generate a large number of possible distri-butions of breast cancer cases from the Zip Code to thecensus block level [30].In this paper we have taken this approach one step
further by using the Monte Carlo simulation of possiblelocations of the disaggregated spatial locations to com-pute confidence limits for each imputed distance to agiven facility. Unlike previous studies where the purposeof simulating locations of cases was to determine theeffect of such estimates on the characteristics of diseasemaps such as the identification of disease clusters or ongeneral spatial accessibility measures, our purpose is toestimate the likely distribution of possible distances onparticular cases where the issue is the spatial behaviorof individuals. For this purpose it is necessary to knowthe range of distances within which the true distancemay lie. It is often known that people are willing to tra-vel a certain distance to use a given service. Using thedistance confidence limits, it will be possible to estimatethe number of people in a given group who will bewithin the given distance of any service in question.
The methodology used for this project is applicable toany study that seeks to calculate a distance from a per-son’s residence to a service location when the onlyaddress information available for the person is the ZIPCode. Thus, this methodology could be widely used inimproving the estimation of geographical accessibility.Our comparison of distances calculated when usingZCTA centroids, ZIP Code population centers, and ourPSM approach illustrates the variation in estimated dis-tances depending on the geocoding approach chosen.This variation has implications for determinations ofgeographic “access” to services and for service provision.
AcknowledgementsThis work was funded by NIH# 5R21HD053850-02. A special thanks to PennyDickey (Planned Parenthood of the Heartland), Alan F. Schultz, and HindBaydoun for their initial work on this project. Thanks to Naresh Kumar for hisassistance in developing this method and to Kari Harland for provision,cleaning, and management of data sets.
Author details1Institute for Health and Society, Medical College of Wisconsin, 8701Watertown Plank Road, Milwaukee, WI, 53226, USA. 2Department ofEpidemiology, University of Iowa, C-21M General Hospital, Iowa City, IA52242, USA. 3Department of Occupational and Environmental Health,College of Public Health, University of Iowa, 100 Oakdale Campus #114 IREH,Iowa City, IA 52242, USA. 4Department of Geography, University of Iowa, 316Jessup Hall, Iowa City, IA 52242, USA.
Authors’ contributionsKMMB undertook data analysis and contributed to interpretation of results.AFS and CP-A oversaw data collection. ABW contributed to analysis andinterpretation of results. GR conceived of the methodology and contributedto interpretation of results. All authors read and approved the finalmanuscript.
Competing interestsThe authors declare that they have no competing interests.
Received: 7 September 2010 Accepted: 10 January 2011Published: 10 January 2011
References1. McLafferty SL: GIS and Health Care. Annu Rev of Publ Health 2003, 24:25-42.2. Hillsman E, Rhoda R: Errors in measuring distances from populations to
service centers. Ann Regional Sci 1978, 12:74-88.3. Williams A, Schwartz W, Newhouse J, Bennett B: How many miles to the
doctor? New Engl J Med 1983, 309:958-963.4. Berke EM, Shi X: Computing travel time when the exact address is
unknown: a comparison of point and polygon ZIP code approximationmethods. Int J Health Geogr 2009, 8:23.
5. Grubesic T: Zip codes and spatial analysis: Problems and prospects. SocioEcon Plan Sci 2008, 42:129-149.
6. Beyer K, Schultz AJ, Rushton G: Using ZIP codes as geocodes in cancerresearch. In Geocoding Health Data: The Use of Geographic Codes in CancerPrevention and Control, Research and Practice. Edited by: Rushton G,Armstrong MP, Gittler J, Greene BR, Pavlik CE, West MM, Zimmerman DL.Boca Raton: CRC Press; 2007:.
7. Grubesic TH, Matisziw TC: On the use of ZIP codes and ZIP codetabulation areas (ZCTAs) for the spatial analysis of epidemiological data.Int J Health Geogr 2006, 5:58.
8. Thomas AJ, Eberly LE, Smith GD, Neaton JD: ZIP-Code-based versus Tract-based Income Measures as Long-Term Risk-adjusted MortalityPredictors. Am J Epidemiol 2006, 164:586-590.
9. Krieger N, Waterman P, Chen JT, Soobader MJ, Subramanian SV, Carson R:Zip code caveat: bias due to spatiotemporal mismatches between zip
Beyer et al. International Journal of Health Geographics 2011, 10:4http://www.ij-healthgeographics.com/content/10/1/4
Page 10 of 11

codes and US census-defined geographic areas–the Public HealthDisparities Geocoding Project. Am J Public Health 2002, 92:1100-1102.
10. Carretta HJ, Mick SS: Geocoding public health data. Am J Public Health2003, 93:699, author reply 699-700..
11. Saftlas AF, Wallis AB, Shochet T, Harland KK, Dickey P, Peek-Asa C:Prevalence of intimate partner violence among an abortion clinicpopulation. Am J Public Health 2010, 100:1412-1415.
12. Woo J, Fine P, Goetzl L: Abortion Disclosure and the Association WithDomestic Violence. Obstet Gynecol 2005, 105:1329-1334.
13. Glander SS, Moore ML, Michielutte R, Parsons LH: The prevalence ofdomestic violence among women seeking abortion. Obstet Gynecol 1998,91:1002.
14. Evins G, Chescheir N: Prevalence of domestic violence among womenseeking abortion services. Women Health Iss 1996, 6:204-210.
15. Grama J: Women forgotten: Difficulties faced by rural victims ofdomestic violence. Am J Fam Law 2000, 14:173-189.
16. Lanier C, Maume M: Intimate partner violence and social isolation acrossthe rural/urban divide. Violence Against Women 2009, 15:1311.
17. Teaster P, Roberto K, Dugar T: Intimate Partner Violence of Rural AgingWomen. Fam Relat 2006, 55:636-648.
18. Gambino J: Functions for PPS sampling. [http://cran.r-project.org/web/packages/pps/pps.pdf].
19. Francis R, Lowe T, Rushton G, Rayco M: A synthesis of aggregationmethods for multi-facility location problems: strategies for containingerror. Geogr Anal 1999, 31:67-87.
20. Armstrong M, Rushton G, Zimmerman D: Geographically masking healthdata to preserve confidentiality. Stat Med 1999, 18:497-525.
21. Bhaduri B, Bright E, Coleman P, Urban M: LandScan USA: A high-resolutiongeospatial and temporal modeling approach for population distributionand dynamics. GeoJournal 2007, 69:103-117.
22. Flowerdew R, Green M: Developments in areal interpolation methodsand GIS. Ann Regional Sci 1992, 26:67-78.
23. Goodchild M, Anselin L, Deichmann U: A framework for the arealinterpolation of socioeconomic data. Environ Plann A 1993, 25:383-397.
24. Athas W, Adams-Cameron M, Hunt W, Amir-Fazli A, Key C: Travel Distanceto Radiation Therapy and Receipt of Radiotherapy Following Breast-Conserving Surgery. J Natl Cancer Inst 2000, 92:269-271.
25. Onega T, Duell E, Shi X, Wang D, Demidenko E, Goodman D: Geographicaccess to cancer care in the US. Cancer 2008, 112:909-918.
26. Hewko J, Smoyer-Tomic K, Hodgson M: Measuring neighbourhood spatialaccessibility to urban amenities: does aggregation error matter? EnvironPlann A 2002, 34:1185-1206.
27. Apparicio P, Abdelmajid M, Riva M, Shearmur R: Comparing alternativeapproaches to measuring the geographical accessibility of urban healthservices: Distance types and aggregation-error issues. Int J Health Geogr2008, 7:7.
28. Henry K, Boscoe F: Estimating the accuracy of geographical imputation.Int J Health Geogr 2008, 7:3.
29. Shi X: Evaluating the uncertainty caused by Post Office Box addresses inenvironmental health studies: A restricted Monte Carlo approach. Int JGeogr Inf Sci 2007, 21:325-340.
30. Luo L, McLafferty S, Wang F: Analyzing spatial aggregation error instatistical models of late-stage cancer risk: a Monte Carlo simulationapproach. Int J Health Geogr 2010, 9:51.
doi:10.1186/1476-072X-10-4Cite this article as: Beyer et al.: A probabilistic sampling method (PSM)for estimating geographic distance to health services when only theregion of residence is known. International Journal of Health Geographics2011 10:4.
Submit your next manuscript to BioMed Centraland take full advantage of:
• Convenient online submission
• Thorough peer review
• No space constraints or color figure charges
• Immediate publication on acceptance
• Inclusion in PubMed, CAS, Scopus and Google Scholar
• Research which is freely available for redistribution
Submit your manuscript at www.biomedcentral.com/submit
Beyer et al. International Journal of Health Geographics 2011, 10:4http://www.ij-healthgeographics.com/content/10/1/4
Page 11 of 11