a new flextensional piezoelectric ultrasonic motor—design, fabrication and characterisation
TRANSCRIPT
Published in: Sensors & Actuators: A. Physical Manuscript Draft Manuscript Number: SNA-D-05-00620R1 Title: A new flextensional piezoelectric ultrasonic motor - design, fabrication and characterisation Article Type: Research Paper Keywords: Ultrasonic motor, flextensional amplifier, pulley-brake, high-speed imaging, torque measurement Corresponding Author: Dr. Joni Tapio Leinvuo, PhD Corresponding Author's Institution: VTI Technologies Oy First Author: Joni T Leinvuo Order of Authors: Joni T Leinvuo; Joni T Leinvuo; Stephen A Wilson; Roger W Whatmore; Markys G Cain Abstract: This paper presents the techniques used for the characterization of a new type of standing-wave piezoelectric ultrasonic motor. The motor uses a metallic flextensional amplifier, or "cymbal", to convert the radial mode vibrations of a piezoelectric ceramic disc into flexural oscillations, which are further converted to produce rotary actuation by means of an elastic-fin friction drive. The motor operates on a single-phase electrical supply. A beryllium copper rotor design with three-fin configuration was adopted. The best stall torque, no load speed, transient time and efficiency for a 25 mm motor were 2 Nmm, 680 r/min, 2 ms and 4.8 % respectively. The operational characteristics of the motor were evaluated by using two methods: one based on the pulley brake principle and one on high-speed imaging. The results obtained from using these two techniques are contrasted and compared.
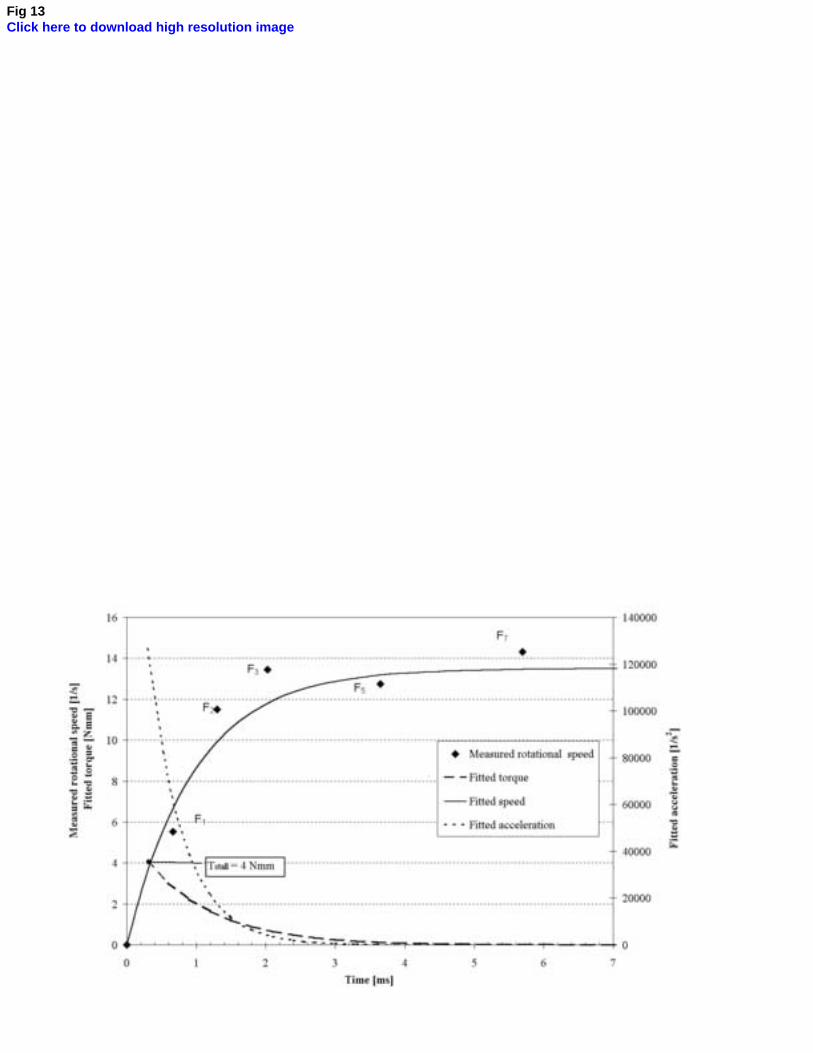
Fig 13Click here to download high resolution image
Revisions to paper A new flextensional piezoelectric ultrasonic motor – design, fabrication and characterization Page 11: The definition of time constant modified. Page 12: Updated value for stall torque. Discussion about the bias force is removed. Fig 13: Updated speed torque characteristics with a better fit Page 13: (Discussion and Conclusions) Some discussion added for the analysis of the the difference between pulley brake and transient based torque measurement.
* Revision Notes/Letter
1
A new flextensional piezoelectric ultrasonic motor – design, fabrication and characterisation
J.T. Leinvuo†, S.A. Wilson R.W. Whatmore and M. G. Cain* Cranfield University, Cranfield, Bedford, MK43 0AL, UK
† Present address: VTI Technologies Oy, Vantaa, Finland * National Physical Laboratory, Teddington, Middlesex, UK Abstract This paper presents the techniques used for the characterization of a new type of standing-wave piezoelectric ultrasonic motor. The motor uses a metallic flextensional amplifier, or “cymbal”, to convert the radial mode vibrations of a piezoelectric ceramic disc into flexural oscillations, which are further converted to produce rotary actuation by means of an elastic-fin friction drive. The motor operates on a single-phase electrical supply. A beryllium copper rotor design with three-fin configuration was adopted. The best stall torque, no load speed, transient time and efficiency for a 25 mm motor were 2 Nmm, 680 r/min, 2 ms and 4.8 % respectively. The operational characteristics of the motor were evaluated by using two methods: one based on the pulley brake principle and one on high-speed imaging. The results obtained from using these two techniques are contrasted and compared. Key words: Ultrasonic motor, flextensional amplifier, pulley-brake, high-speed imaging, torque measurement
Manuscript
2
1 Introduction Piezoelectric ultrasonic motors [1] have a number of potential advantages. They maintain relatively high torque at relatively low speeds, without a reduction gear, and exhibit a self-locking feature when electric power is turned off because the driving mechanics use friction between the vibrating stator and the rotor. They are light compared with electromagnetic motors and their equivalent inertias are low. They neither create electromagnetic fields nor are they affected by them. They also have many advantages for applications in micro- electromechanical systems (MEMS) because, in contrast with electromagnetic motors, their simple construction makes them well suited for miniaturization and their overall efficiency is relatively insensitive to size. This paper is concerned with presenting and comparing two techniques for the characterisation of such motors, particularly with the assessment of their torque/speed characteristics as a function of the bias force acting between the rotor and the stator. In this particular case, the characterisation techniques are applied to a new type of piezoelectric motor which combines a stator consisting of a flextensional amplifier driven by a flat piezoelectric plate with a rotor bearing three angled fins [2-6]. The rotational speed of electric motors can be measured by using a rotary encoder to convert pulse frequency to speed. It is important that an encoder does not have a large internal friction, which could prevent the motor from rotating. The torque can be measured by the reactive force method where the force sensor is mounted to the stator and an external load is applied to the rotor. The torque can also be measured by the pulley-brake principle [7,8,9]. The system consists of one weight / force-sensor pair which are connected together by a thin string. The string is assembled around the rotor bearing and is allowed to slide around the smooth bearing surface. In operation, the weight generates a frictional load to the rotor and the torque is proportional to the difference between the force-sensor reading and the external weight. The weight can also be replaced by another force-sensor where the load is varied by changing the distance between the two force-sensors. A dual force-sensor arrangement has been demonstrated with a resolution of 1 µNm between 0-40 µNm [7]. In contrast with the above, a high speed imaging technique can be employed to measure the mechanical transient characteristics of the rotor. Based on a knowledge of the moment of inertia of the rotating parts (the rotor and encoder) the acceleration characteristics of the torque can be calculated. Torque evaluation based on the measurement of transient characteristics using an optical encoder has previously been reported in [10,11,12] for rotary type ultrasonic motors. In summary, there are contact based methods to measure torque characteristics and non-contact methods to measure speed (i.e. rotary encoder) of the electric motors. This paper is focused on a comparison of these two methods for the operational characterization of a flextensional piezoelectric motor using: 1) pulley brake torque measurement and 2) high speed imaging. The study reported here deals with a standing wave type motor of very simple design, which is shown in Fig. 1. The resonating structure combines the radial mode vibrations of a piezoelectric ceramic disc with a metallic flextensional amplifier (i.e. cymbal [13,14]) to turn the radial vibrations (in x-y plane) into a “vertical” motion in magnitude of ∆z
3
perpendicular to the plane of the disc. The magnitude of radial vibration is described with the dimensions x(I) in extraction and x(III) in contraction of a piezoelectric ceramic, respectively. A rotor employs an elastic fin. The operational principle of this has been described previously in [15]. The combination of these two operational principles into a working motor has been described in detail previously [2-6] and will not be discussed further here.
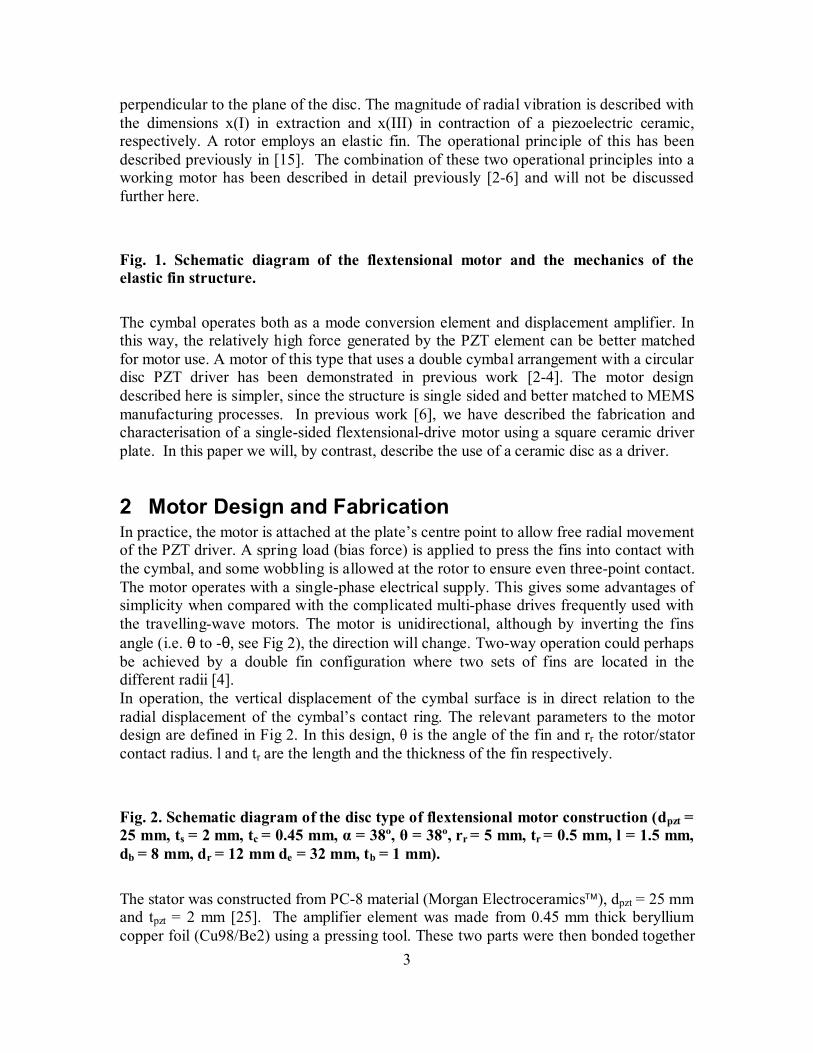
Fig. 1. Schematic diagram of the flextensional motor and the mechanics of the elastic fin structure. The cymbal operates both as a mode conversion element and displacement amplifier. In this way, the relatively high force generated by the PZT element can be better matched for motor use. A motor of this type that uses a double cymbal arrangement with a circular disc PZT driver has been demonstrated in previous work [2-4]. The motor design described here is simpler, since the structure is single sided and better matched to MEMS manufacturing processes. In previous work [6], we have described the fabrication and characterisation of a single-sided flextensional-drive motor using a square ceramic driver plate. In this paper we will, by contrast, describe the use of a ceramic disc as a driver.
2 Motor Design and Fabrication In practice, the motor is attached at the plate’s centre point to allow free radial movement of the PZT driver. A spring load (bias force) is applied to press the fins into contact with the cymbal, and some wobbling is allowed at the rotor to ensure even three-point contact. The motor operates with a single-phase electrical supply. This gives some advantages of simplicity when compared with the complicated multi-phase drives frequently used with the travelling-wave motors. The motor is unidirectional, although by inverting the fins angle (i.e. θ to -θ, see Fig 2), the direction will change. Two-way operation could perhaps be achieved by a double fin configuration where two sets of fins are located in the different radii [4]. In operation, the vertical displacement of the cymbal surface is in direct relation to the radial displacement of the cymbal’s contact ring. The relevant parameters to the motor design are defined in Fig 2. In this design, θ is the angle of the fin and rr the rotor/stator contact radius. l and tr are the length and the thickness of the fin respectively.
Fig. 2. Schematic diagram of the disc type of flextensional motor construction (dpzt = 25 mm, ts = 2 mm, tc = 0.45 mm, α = 38º, θ = 38º, rr = 5 mm, tr = 0.5 mm, l = 1.5 mm, db = 8 mm, dr = 12 mm de = 32 mm, tb = 1 mm). The stator was constructed from PC-8 material (Morgan Electroceramics), dpzt = 25 mm and tpzt = 2 mm [25]. The amplifier element was made from 0.45 mm thick beryllium copper foil (Cu98/Be2) using a pressing tool. These two parts were then bonded together
4
with electrically conductive epoxy (CircuitWorks® CW2400) in order to provide electrical connection between the cymbal and PZT. In practice, the parts were held together at a temperature of 40ºC for several hours and cooled down before testing. In addition, electric wires were bonded to the cymbal and PZT with the same conductive epoxy. The top surface of the device mount was bonded with the Loctite® 402 cyanoacrylate adhesive to the centre of the PZT disc. The lower part of the device mount was connected to the external test jig. All of the rotors were wet chemically etched from the same material as the amplifier. The outside diameter of the rotor is 12 mm (dr). Encoder disc diameter of 32 mm (de) was bonded onto the rotor. The ball bearing was bonded along the rotor’s centre axis using a centring tool. The bonding work used Loctite® 402 cyanoacrylate. Fins were bent to angle θ = 38º under a video microscope using a bending tool with a resolution of ±1º.
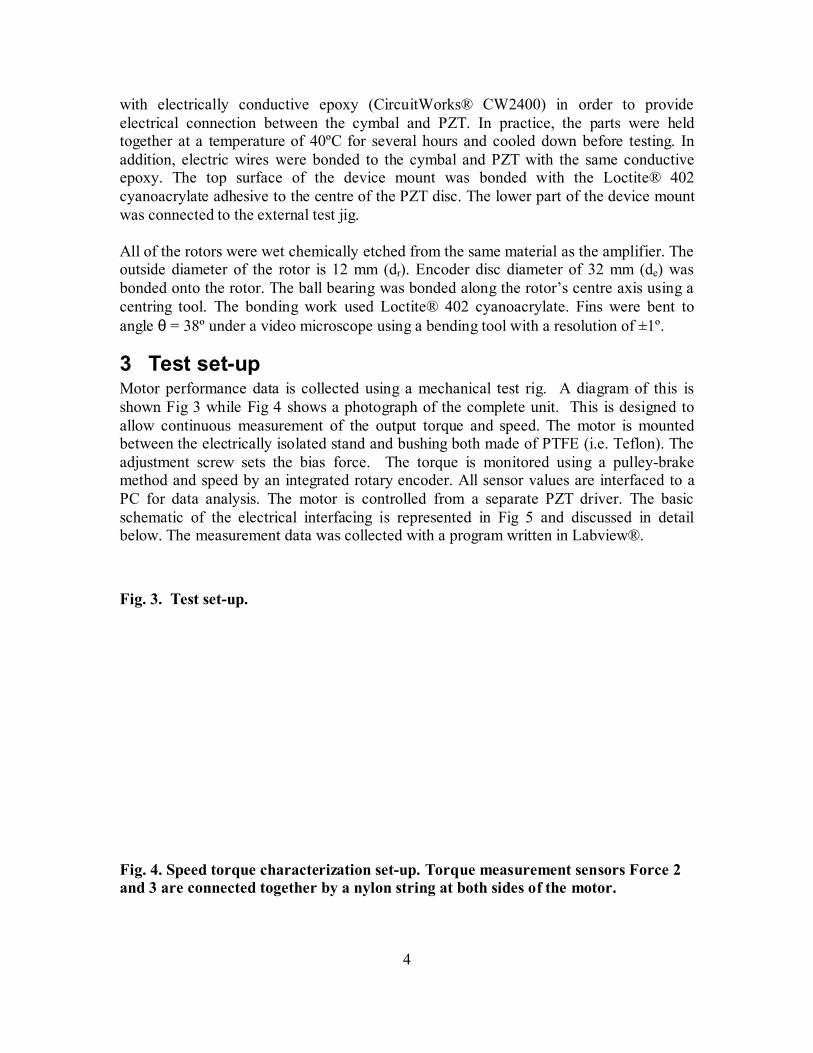
3 Test set-up Motor performance data is collected using a mechanical test rig. A diagram of this is shown Fig 3 while Fig 4 shows a photograph of the complete unit. This is designed to allow continuous measurement of the output torque and speed. The motor is mounted between the electrically isolated stand and bushing both made of PTFE (i.e. Teflon). The adjustment screw sets the bias force. The torque is monitored using a pulley-brake method and speed by an integrated rotary encoder. All sensor values are interfaced to a PC for data analysis. The motor is controlled from a separate PZT driver. The basic schematic of the electrical interfacing is represented in Fig 5 and discussed in detail below. The measurement data was collected with a program written in Labview®.
Fig. 3. Test set-up.
Fig. 4. Speed torque characterization set-up. Torque measurement sensors Force 2 and 3 are connected together by a nylon string at both sides of the motor.
5
Fig. 5. Electrical interfacing of the PC based speed torque measurement system. (R1 = 330.1 kΩΩΩΩ, R2 = 150.3 kΩΩΩΩ, R3 = 12.0 ΩΩΩΩ, Riso = 27 ΩΩΩΩ).
3.1 Pulley brake torque measurement A pulley-brake technique was employed for torque measurements. In this method, the load is measured by using a sliding nylon string (Perlon, Bayer, Kamasan Ø0.16 mm) wound once around the rotor bearing with both ends attached to force sensors (Force 2 and 3) as is shown diagrammatically in Fig. 6 and illustrated in the photograph in Fig. 4. The sensors are from Omega Engineering (LCL-113G [16]). Sensors include strain gauges on the top of the beryllium copper flexure. When the rotation commences against the frictional force (Fµ), this adds tension to one side of the line (Force 2) and reduces it at the other (Force 3). The torque of the motor can be represented by Tm [Nm] = (Force 2 [N] - Force 3 [N]) rb [m] = Fµ rb, where rb is the radius of bearing (rb = db / 2, Fig. 2). In practice, tension in the string is adjusted by moving the sensor Force 2. The adjusted pre-tension is indicated by zero (0). When the rotor rotates as indicated in Fig. 6, the Force 2 tends to decrease (-) while the Force 3 increases (+).
Fig. 6. Pulley-brake torque measurement using two flexure force sensors.
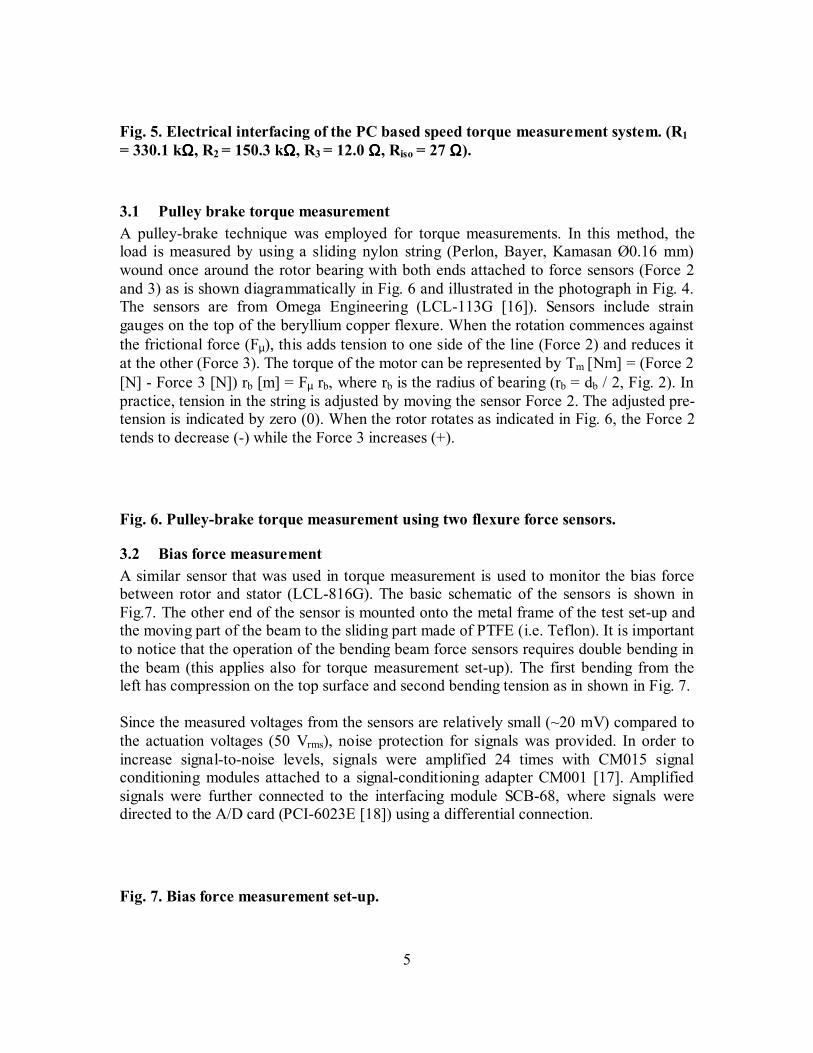
3.2 Bias force measurement A similar sensor that was used in torque measurement is used to monitor the bias force between rotor and stator (LCL-816G). The basic schematic of the sensors is shown in Fig.7. The other end of the sensor is mounted onto the metal frame of the test set-up and the moving part of the beam to the sliding part made of PTFE (i.e. Teflon). It is important to notice that the operation of the bending beam force sensors requires double bending in the beam (this applies also for torque measurement set-up). The first bending from the left has compression on the top surface and second bending tension as in shown in Fig. 7. Since the measured voltages from the sensors are relatively small (~20 mV) compared to the actuation voltages (50 Vrms), noise protection for signals was provided. In order to increase signal-to-noise levels, signals were amplified 24 times with CM015 signal conditioning modules attached to a signal-conditioning adapter CM001 [17]. Amplified signals were further connected to the interfacing module SCB-68, where signals were directed to the A/D card (PCI-6023E [18]) using a differential connection.
Fig. 7. Bias force measurement set-up.
6
Force sensors (Force 1, 2 and 3) were calibrated using a spring balance and free weights. The ratio between the load in grams [g] and sensor output [mV] are kForce 1 = 0.4564 [mV/g], kForce 2 = -4.9524 mV/g and kForce 3 = 4.4714 mV/g respectively. It should be noted that the reading of Force 2 is negative because of the direction of loading in the flexure. Bending in the other direction provides positive readings.
3.3 Speed measurement There are several commercial systems that could potentially be used to measure the rotational speed of an electric motor. However, very few were found to be suitable for the flextensional piezoelectric motor. One of the most common methods with electro-magnetic motors is to use a ready-made encoder, which provides digital pulse frequency as a function of rotational speed. However, one of the most severe problems with this method is the high starting torque mainly caused by the encoder bearings and sealing. Because of the problems encountered with finding a suitable commercial apparatus, the speed measurement was made by counting pulses from a fibre optic probe mounted on the test set-up, which senses an integrated angular encoder on the shaft. The sensor (FU-20, FS-V11P [19]) can detect targets as small as 0.01 mm. Detected pulses (200 pulse / revolution) are converted to rotational speed information using the high-speed counter of the A/D card (PCI-6023E [18]). The fibre optic probe is based on the light emitting diode and receiver. When the light barrier is blocked over certain intervals ∆t (as happens with a rotating encoder disc) the result is a pulse frequency proportional to the rotational speed (N [rps] = (∆t [s] nholes)-1, where nholes is a number of features in one revolution).
3.4 Electrical characterization In order to measure the electrical energy supplied to the motor, it is necessary to measure an electric current, voltage and phase difference. The voltage Uin is evaluated by a voltage divider (Fig. 5) since the input voltage range of the PC integrated digital scope (PCI-5102 [18]) employed is ± 50V. Measuring the voltage U3 (CHA1) over a resistor R3 monitors the electric current Iin (equation (1)). Since the measured voltage U3 << Uin, it can be ignored when evaluating Uin. The voltage U2 (i.e. CHA0) over the resistor R2 is measured using an oscilloscope, which measures a current I2. Now, the voltage taken by a motor Uin can be calculated from R1, R2 and I2 (equation (2)). The electric current can be evaluated from the Ohm’s law where U3 is a current measured across the resistor R3.
3
3
RU
Iin = (1)
The voltage between the two electrodes of the motor (Uin) can be calculated by an equation (2)
2
22
21221 )(
RU
I
RRIUUU in
=
+=+=
(2)
7
When calculating the flextensional motor’s input power under sinusoidal excitation, it is important to apply power factor compensation cos(φ) in respect of the phase difference φ between the voltage and current to take account of the capacitive and inductive load components. The power factor is calculated from the phase difference between the signals at CHA0 and CHA1. Ploss defines the resistive power loss generated by the measurement electronics (Riso, R3) (see Fig. 5). The electrical power input (Pin – Ploss), mechanical power output (Pout) and efficiency (η) are defined with equation (3), where Tm is the torque of the motor [Nm] and ω the angular velocity [rad/s]. Uin and Iin are RMS voltage and current supplied to the motor.
%100)()cos(
[%] 23 inisoinin
m
lossin
out
IRRIUT
PPP
+−=
−=
φωη (3)
3.5 PZT driver The motor is operated by SHINSEI USR-45 drive [20]. This driving unit generates a high voltage (100 Vrms) and current (1.2 A) square wave up to 56 kHz. The frequency can be controlled manually with a potentiometer. This unit requires a single 12 VDC high current power supply.
4 Operational characteristics of the flextensional motor (pulley brake torque measurement)
Operational characteristics of the flextensional motor were logged by varying the torque on the rotor and by measuring the rotational speed. Current, voltage and phase angle were recorded simultaneously. Columns in the recorded text file present measured data in a 20s time period (rotational speed [rpm], Force 1 [V], Force 2 [V], Force 3 [V], fV [kHz], fI [kHz], input voltage across the R2 [Vrms] and input current across the R3 [Vrms]. Once all data were collected to the text file, it was converted, and filtered and the responses plotted using MATLAB®. The force, voltage and current measurements were filtered using averaging. The result of the speed measurement was filtered using a median filter algorithm over the measured values. Fig. 8 represents the operational characteristics of the flextensional motor at 56 kHz. The driving conditions were cos(φ) = 0.3, Uin = 78 Vrms, Iin = 57 mArms and Force 1 = 3600 mN. The graph indicates that maximum speed is achieved at close to no load conditions (680 rpm) and the stall torque at zero speed (~1.94 Nmm). The variation in power input values is practically stable with 37 mW variations, only 3 % of the average values. The achieved maximum efficiency is 4.8 %. Every point in the graph is a result of the measurements taken at 20s time intervals. In practice, the phase angle φ was measured separately to the speed-torque measurements, but under the same driving conditions.
Fig. 8. Operational characteristics of the flextensional motor.
8
5 Test set-up in acceleration measurements Previously it has been demonstrated that once acceleration is defined, it is possible to calculate the mechanical torque of the motor when the moment of inertia is known [10]. One of the most common methods to measure acceleration is to use a ready-made encoder with a wide enough bandwidth. This method has previously been demonstrated for example in [11] and [12]. Another way to measure transient characteristics is to use stroboscopic light in conjunction with a standard CCD camera as demonstrated in [21] and [26]. Here an alternative way to measure flextensional motor transient characteristics using a high-speed camera will be described. A similar camera has, for example, been used in the analysis of transient characteristics of a microturbine [22]. The same flextensional motor and test set-up is employed as presented before but with additional triggering electronics. A basic schematic of the electrical interfacing is shown in Fig. 9.
Fig. 9. Layout of the electrical interfacing in the acceleration measurements (Rt = 3.3 Ω).
5.1 High speed camera (Imacon 468) The high-speed imaging was carried out with an Imacon 468 imager. The camera takes pictures at rates from 1000 fps (frames per second) up to 100 million fps, but only captures 8 pictures. The pixel resolution is 576(H) and 385(V), one pixel is 22 µm square [23]. Each picture can be individually set so that the exposure of each channel and the inter-frame time between each channel can be completely independent of each other. Image intensifiers are built into the camera in order to allow gating of framing speeds thus the camera is relatively sensitive to light. Triggering is via a TTL signal (50Ω or 1kΩ, 2V to 25V positive or negative edges). A 266 MHz computer running Windows 95 controls the system. The basic layout of the imaging arrangement is represented in Fig. 10. The zoom lens (Leica Monozoom® 7) was attached to the Imacon 468 using a special fitting. The top view of the encoder disc was formed via a plastic mirror attached to the test jig tilted at 45º to the camera’s imaging axis. The ruler was attached to the test jig in order to get a reference measurement for the obtained images. The double flashlights were used in parallel in both side of the optics. Also, a single halogen light was attached on the side of the optics in order to adjust focus and magnification before the imaging.
9
Fig. 10. Close up of the measurement set-up. The motor is located between the force sensor and the height adjustable stand. The image of the encoder’s top surface is formed via use of the tilted mirror. The ruler is used as a spatial reference.
5.2 Electrical interfacing The electrical interfacing is represented in Fig 9. The motor was operated by a SHINSEI HV (i.e. high voltage) square wave driver. The supply voltage of the drive was 8.2 VDC, which estimates Uin = 75 Vrms (i.e. the same as with the pulley-brake method). In comparison, the measured output voltage of the SHINSEI drive was 109 Vrms with 12 VDC input (VS). The driving frequency was 56 kHz. Three resistors, each of 10 Ω (Rt = 10 Ω / 3), were connected in parallel as a current trigger. Once the driving unit is turned on, the current rises in the input stage and this can be monitored via the A/D card. A Labview® based program was set up to trigger the imaging. By adjusting the triggering level (i.e. voltage amplitude) in software, it was possible to vary the time constant between motor start and imaging. The triggering was conducted by a digital output (DOUT, TTL-level) from the A/D card. The fibre optic sensor was used to derive a speed reference by monitoring a single black dot on the encoder disc. The pulse frequency (i.e. rotational speed) was monitored visually from the FLUKE ScopeMeter® 123.
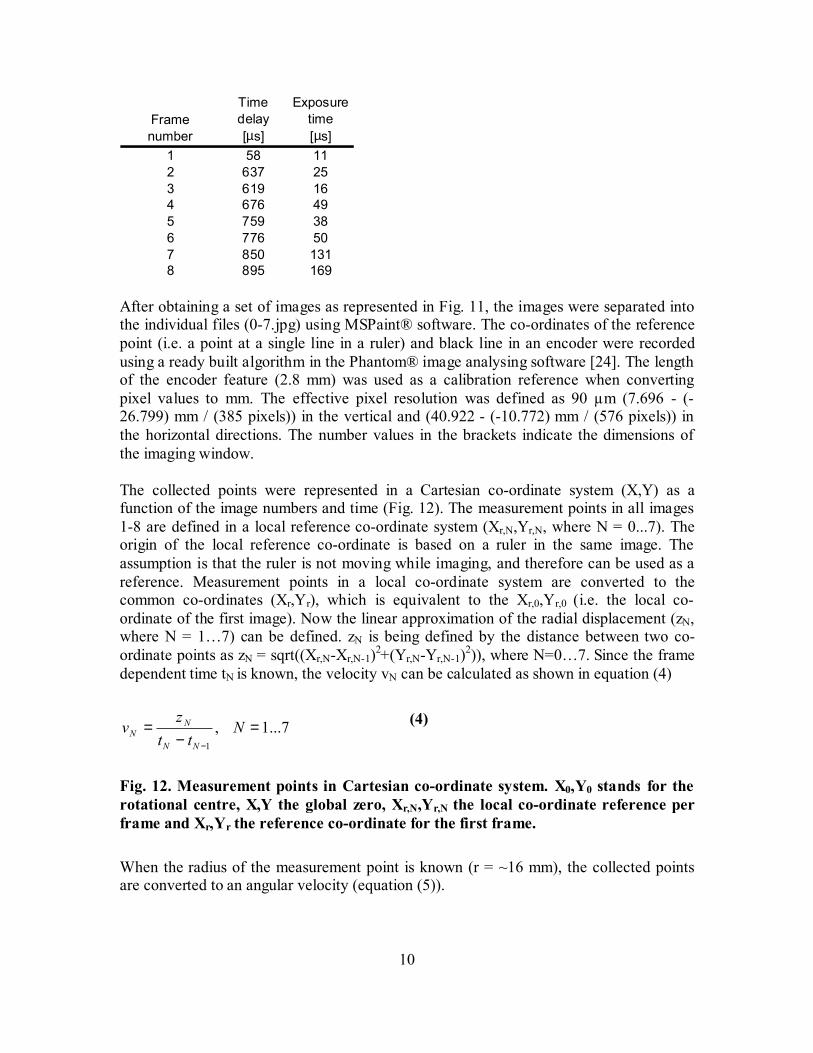
5.3 Recording the rotor’s transient response Several sets of images were captured in order to track the rotor’s transient behaviour. A sample set of images is represented in Fig. 11. The sequence of images, time delay between adjacent frames and the exposure times are represented in Table 1, respectively. Exposure times had to be increased as a function of image numbers because a single flash was generated at the beginning of the imaging.
Fig. 11. Images taken from an encoder disc during the acceleration. Numbers 1-8 indicate the frame order.
Table 1. Sequence of images (1-8), time of delay between frames and the time of exposure.
10
Framenumber
Time delay[µs]
Exposure time[µs]
1 58 112 637 253 619 164 676 495 759 386 776 507 850 1318 895 169
After obtaining a set of images as represented in Fig. 11, the images were separated into the individual files (0-7.jpg) using MSPaint® software. The co-ordinates of the reference point (i.e. a point at a single line in a ruler) and black line in an encoder were recorded using a ready built algorithm in the Phantom® image analysing software [24]. The length of the encoder feature (2.8 mm) was used as a calibration reference when converting pixel values to mm. The effective pixel resolution was defined as 90 µm (7.696 - (-26.799) mm / (385 pixels)) in the vertical and (40.922 - (-10.772) mm / (576 pixels)) in the horizontal directions. The number values in the brackets indicate the dimensions of the imaging window. The collected points were represented in a Cartesian co-ordinate system (X,Y) as a function of the image numbers and time (Fig. 12). The measurement points in all images 1-8 are defined in a local reference co-ordinate system (Xr,N,Yr,N, where N = 0...7). The origin of the local reference co-ordinate is based on a ruler in the same image. The assumption is that the ruler is not moving while imaging, and therefore can be used as a reference. Measurement points in a local co-ordinate system are converted to the common co-ordinates (Xr,Yr), which is equivalent to the Xr,0,Yr,0 (i.e. the local co-ordinate of the first image). Now the linear approximation of the radial displacement (zN, where N = 1…7) can be defined. zN is being defined by the distance between two co-ordinate points as zN = sqrt((Xr,N-Xr,N-1)2+(Yr,N-Yr,N-1)2)), where N=0…7. Since the frame dependent time tN is known, the velocity vN can be calculated as shown in equation (4)
7...1,1
=−
=−
Ntt
zv
NN
NN
(4)
Fig. 12. Measurement points in Cartesian co-ordinate system. X0,Y0 stands for the rotational centre, X,Y the global zero, Xr,N,Yr,N the local co-ordinate reference per frame and Xr,Yr the reference co-ordinate for the first frame. When the radius of the measurement point is known (r = ~16 mm), the collected points are converted to an angular velocity (equation (5)).
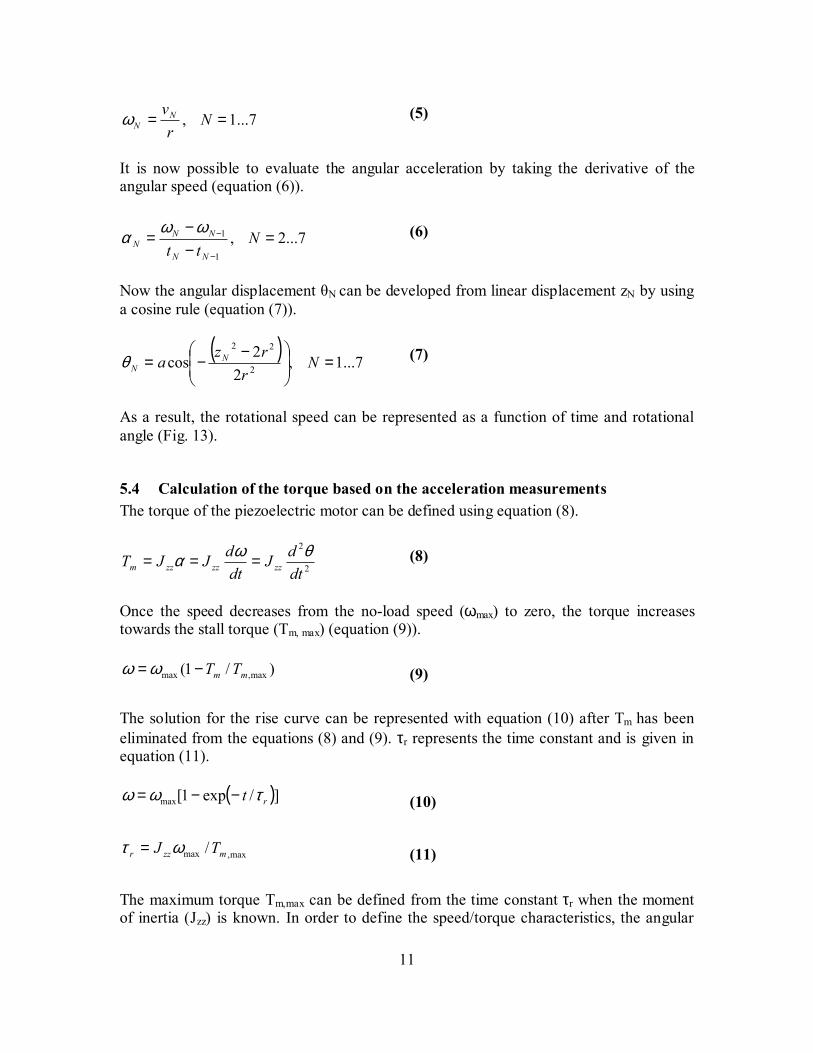
11
7...1, == Nr
vNNω (5)
It is now possible to evaluate the angular acceleration by taking the derivative of the angular speed (equation (6)).
7...2,1
1 =−−
=−
− Ntt NN
NNN
ωωα (6)
Now the angular displacement θN can be developed from linear displacement zN by using a cosine rule (equation (7)).
( )7...1,
22
cos 2
22
=
−−= N
rrz
a NNθ (7)
As a result, the rotational speed can be represented as a function of time and rotational angle (Fig. 13).
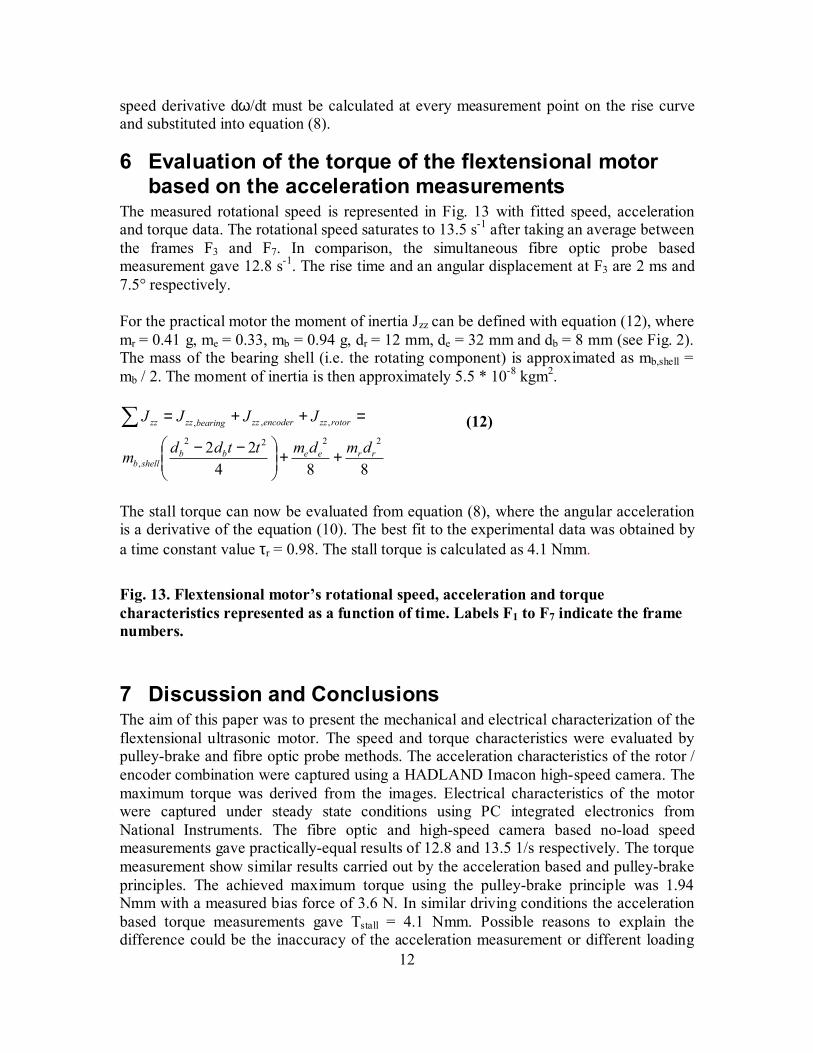
5.4 Calculation of the torque based on the acceleration measurements The torque of the piezoelectric motor can be defined using equation (8).
2
2
dtdJ
dtdJJT zzzzzzm
θωα === (8)
Once the speed decreases from the no-load speed (ωmax) to zero, the torque increases towards the stall torque (Tm, max) (equation (9)).
)/1( max,max mm TT−=ωω (9) The solution for the rise curve can be represented with equation (10) after Tm has been eliminated from the equations (8) and (9). τr represents the time constant and is given in equation (11).
( )]/exp1[max rt τωω −−= (10)
max,max / mzzr TJ ωτ = (11) The maximum torque Tm,max can be defined from the time constant τr when the moment of inertia (Jzz) is known. In order to define the speed/torque characteristics, the angular
12
speed derivative dω/dt must be calculated at every measurement point on the rise curve and substituted into equation (8).
6 Evaluation of the torque of the flextensional motor based on the acceleration measurements
The measured rotational speed is represented in Fig. 13 with fitted speed, acceleration and torque data. The rotational speed saturates to 13.5 s-1 after taking an average between the frames F3 and F7. In comparison, the simultaneous fibre optic probe based measurement gave 12.8 s-1. The rise time and an angular displacement at F3 are 2 ms and 7.5° respectively. For the practical motor the moment of inertia Jzz can be defined with equation (12), where mr = 0.41 g, me = 0.33, mb = 0.94 g, dr = 12 mm, de = 32 mm and db = 8 mm (see Fig. 2). The mass of the bearing shell (i.e. the rotating component) is approximated as mb,shell = mb / 2. The moment of inertia is then approximately 5.5 * 10-8 kgm2.
88422 2222
,
,,,
rreebbshellb
rotorzzencoderzzbearingzzzz
dmdmttddm
JJJJ
++
−−
=++=∑
(12)
The stall torque can now be evaluated from equation (8), where the angular acceleration is a derivative of the equation (10). The best fit to the experimental data was obtained by a time constant value τr = 0.98. The stall torque is calculated as 4.1 Nmm.
Fig. 13. Flextensional motor’s rotational speed, acceleration and torque characteristics represented as a function of time. Labels F1 to F7 indicate the frame numbers.
7 Discussion and Conclusions The aim of this paper was to present the mechanical and electrical characterization of the flextensional ultrasonic motor. The speed and torque characteristics were evaluated by pulley-brake and fibre optic probe methods. The acceleration characteristics of the rotor / encoder combination were captured using a HADLAND Imacon high-speed camera. The maximum torque was derived from the images. Electrical characteristics of the motor were captured under steady state conditions using PC integrated electronics from National Instruments. The fibre optic and high-speed camera based no-load speed measurements gave practically-equal results of 12.8 and 13.5 1/s respectively. The torque measurement show similar results carried out by the acceleration based and pulley-brake principles. The achieved maximum torque using the pulley-brake principle was 1.94 Nmm with a measured bias force of 3.6 N. In similar driving conditions the acceleration based torque measurements gave Tstall = 4.1 Nmm. Possible reasons to explain the difference could be the inaccuracy of the acceleration measurement or different loading
13
configuration between these two measurement trials. It should be noted that the transient based torque measurement is very sensitive to the fitting parameters. In order to improve accuracy of this principle the transient should be recorded multiple times and the result of measurement points integrated prior to fitting. Alternatively, more measurement points per a single transient could be used. Ideally, acceleration and pulley brake results should be recorded simultaneously in order to fully explain the root cause of the different readings. In order to compare flextensional motor’s characteristics to other motors it is important to scale variables to the volume of PZT and voltage applied. The volume of PZT is following: Vpzt = πrpzt
2 tpzt = 981 mm3. The maximum stall torque achieved was 24 Nµm/Vrms. By scaling it as a respect of volume of PZT it becomes 25 Nnm/Vrms/mm3 (see Fig. 9). In comparison, the previous study of a similar motor but with square plate stator showed 14 Nnm/Vrms/mm3 [5]. The stall torque data compares with a thickness mode elastic fin motor presented by Uchiki et al, which achieved a maximum torque of 178 Nµm/Vrms but with much bigger PZT disc dimensions (dpzt = 30 mm, tpzt = 14 mm) [15]. The Uchiki’s motor generates 18 Nnm/Vrms/mm3 whereas the flextensional motor 25 Nnm/Vrms/mm3 indicating that the smaller volume of PZT used in the flextensional structure is much better used in the generation of torque. The difference between the disc and square plate stators can partly be explained by the material difference, because the disc was made of the hard PC8 material and the square plate the slightly softer PC4. The achieved efficiency of 4.8 % in this work compares well with the 0.6 % achieved in [15].
8 Acknowledgements The authors gratefully acknowledge the partial financial support of the Engineering and Physical Sciences Research Council (EPSRC grant number GR/N 34017) and BAeSystems (Sowerby Research Center) in the development of the piezoelectric motor and the National Physical Laboratory in the development of the characterisation system.
14
9 References [1] K. Uchino Piezoelectric actuators and ultrasonic motors, MA: Kluwer Academic, 1997 [2] Rayner, P., Piezoelectric ultrasonic motors and micromotors 2000. PhD Thesis, Cranfield Univ. [3] Rayner, P. J. and Whatmore, R. W., "Piezoelectric ultrasonic motor using flextensional amplification of a disc radial mode with elastic fin drive," Proc. 9th US-Japan Seminar on Dielectric and Piezoelectric Ceramics, Okinawa, Japan, pp. 151-154, 1999. [4] Rayner, P. J. and Whatmore, R. W., Ultrasonic motor. UK. Patent No. 9910483.8 1999. [5] Leinvuo, J., Flextensional piezoelectric motors, PhD thesis 2004. Cranfield University. [6] J.T. Leinvuo, S.A. Wilson and R.W. Whatmore “Flextensional Piezoelectric Motor using the Contour Mode of a Square Piezoelectric Plate” IEEE Transactions on Ultrasonics, Ferroelectrics and Frequency Control 51 929-936 (2004) [7] Brenner, W., Haddad, G., Popovic, G., Vujanic, A., Abraham, G., and Matzner, A., "The measurement of minimotors and micromotors torque characteristic," Proc. IEEE Microelectronics, NIŠ, Yugoslavia, pp. 535-538, 1997. [8] Brenner, W., Haddad, G., Popovic, A., Vujanic, A., Chatzitheodoridis, E., Duffait, R., and Wurmsdobler, P., "Principles of torque measurements for rotating microsystems," Advanced Manufacturing Systems and Technology, CISM Cources and Lectures, pp. 721-728, 1999. [9] Brenner, W., Vujanic, A., Popovic, G., and Del Medico, O., "Micro torque measurement based on the cable brake principle," Sensors, 2002. Proceedings of IEEE, pp. 936-941 vol.2, 2002. [10] Nakamura, K., Kurosawa, M., Kurebayashi, H., and Ueha, S., An estimation of load characteristics of an ultrasonic motor IEEE Transactions on Ultrasonics, Ferroelectrics and Frequency Control, vol. 38, no. 5, pp. 481-485, 1991. 0885-3010. [11] Yao, K., Koc, B., and Uchino, K., Longitudinal-bending mode micromotor using multilayer piezoelectric actuator Ultrasonics, Ferroelectrics and Frequency Control, IEEE Transactions on, vol. 48, pp. 1066-1071, Jun, 2001. [12] Koc, B., Bouchilloux, P., and Uchino, K., Piezoelectric micromotor using a metal-ceramic composite structure Ultrasonics, Ferroelectrics and Frequency Control, IEEE Transactions on, vol. 47, pp. 836-843, Jul, 2000. [13] Dogan, A., Fernandez, J. F., Uchino, K., and Newnham, R. E., "The "Cymbal" electromechanical actuator," IEEE Ultrason. Symp. Proc., East Bruswick, NJ, pp. 213-216, 1996. [14] Dogan, A., Uchino, K., and Newnham, E., Composite piezoelectric transducer with truncated conical endcaps "Cymbal" IEEE Trans. Ultrason., Ferroelect., Freq. Contr., vol. 44, no. 3, pp. 597-605, May, 1997. [15] Uchiki, T., Nakazawa, T., Nakamura, K., Kurosawa, M., and Ueha, S., Ultrasonic motor utilizing elastic fin rotor Jpn. J. Appl. Phys., vol. 30, pp. 2289-2291, Sep, 1991. [16] Omega Engineering Inc., OMEGA Complete Pressure, Strain, and Force Measurement Handbook & Encyclopedia 2000. CT, USA.
15
[17] PICO Technology Limited. Signal conditioning. 2002. [18] National Instruments, The Measurement and Automation catalog 2001 2001. National Instruments. AUSTIN, TX. [19] Keyence (UK) Limited, Sensors Vision Systems & Measuring Instruments 2001-2002, no. G2001-UK-2-0700, 2000. Keyence Corporation. Japan. [20] Shinsei Corporation, Operation Manual for Ultrasonic Motor (USR-60, USR-45, USR-30) Shinsei Corporation. Tokyo, Japan. [21] Tavrow, L. S., Bart, S. F., and Lang, J. H., "Operational characteristics of microfabricated electric motors," Solid-State Sensors and Actuators, 1991. Digest of Technical Papers, TRANSDUCERS '91., 1991 International Conference on, pp. 877-881, 1991. [22] Rembe, C., Tibken, B., and Hofer, E. P., Analysis of the dynamics in microactuators using high-speed cine photomicrography Journal of microelectromechanical systems, IEEE, vol. 10, pp. 137-145, Mar, 2001. [23] DRS Hadland Ltd., Imacon 468, User Guide Revision 3.10, DRS Hadland Ltd. Herts, UK. [24] Photo-Sonics International Ltd. Phantom V4 .0 data sheet. 2003. [25] Morgan Matroc Ltd. - Unilator Division, Piezoelectric ceramic products UK. [26] Bart, S. F., Mehregany, M., Tavrow, L. S., Lang, J. H., and Senturia, S. D., "Measurement of electric micromotor dynamics," Microstructures, Sensors & Actuators, Dallas, TX, pp. 19-29.
16
10 Biography
Joni Leinvuo was born in Helsinki, Finland, on April 1971. He received his M.S. in M.E. (Mechatronics) from Helsinki University of Technology in 2000 and PhD from Cranfield University, UK in 2005 related to piezoelectric motors and micro-motors. He currently holds a position at VTI Technologies, Finland as a Sensor Design Engineer related to micro electro mechanical pressure sensors. His research interest includes piezoelectric motors, micro-motors and pressure sensors.
Stephen Wilson is a Senior Research Fellow in Advanced Materials at Cranfield University. He received a PhD at Cranfield University for his thesis on ‘Electric Field Structuring of Piezoelectric Composites’, which explored the use of moderately high electric-fields during processing to induce anisotropic properties in ferroelectric ceramic/polymer composite materials. His study of materials processing parameters has been used to optimise the performance of piezoelectric sensor arrays for a real-time 3D ultrasound imaging system and his research interests are in piezoelectric micro-actuators, ultraprecision machining of ceramics and dielectrophoresis. He is module coordinator and lectures on Microsystems Design.
17
Roger Whatmore graduated with his PhD from Cambridge University in 1977 and spent nearly twenty years working with the GEC Marconi (formerly Plessey) research laboratories at Caswell in the UK on the development and exploitation of ferroelectric materials in a wide range of electronic devices, particularly sensors and actuators, for which work he was awarded GEC’s Nelson Gold Medal in 1993. In October 1994 he took the Royal Academy of Engineering Chair in Engineering Nanotechnology at Cranfield University, where he is developing the use of ferroelectrics in microsystems and nanotechnology, particularly for sensors and actuators integrated onto silicon. He has published over 200 papers and 30 patents in the field. He was awarded the degree of Doctor of Science by Cambridge University in 2001. He is a Fellow of the Royal Academy of Engineering and a Fellow of the Institute of Materials, Minerals and Mining, who in June 2003 awarded him their Griffith Medal and Prize for Distinguished Work in Materials Science.
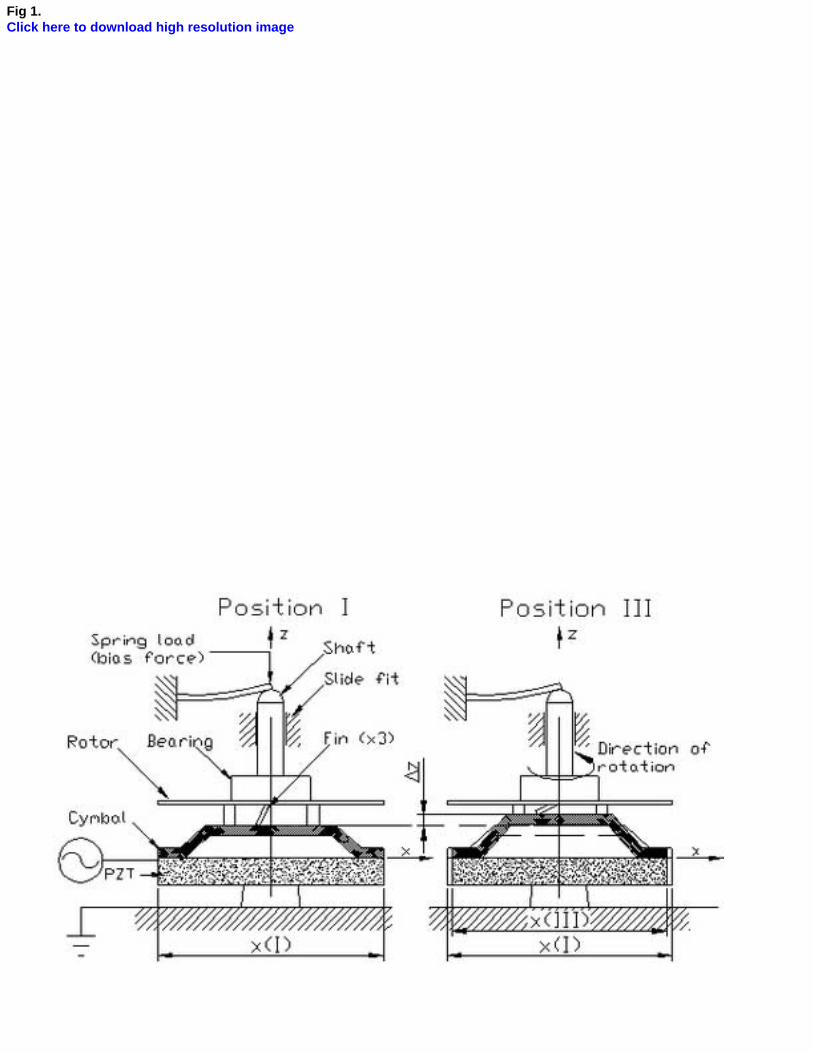
Fig 1.Click here to download high resolution image
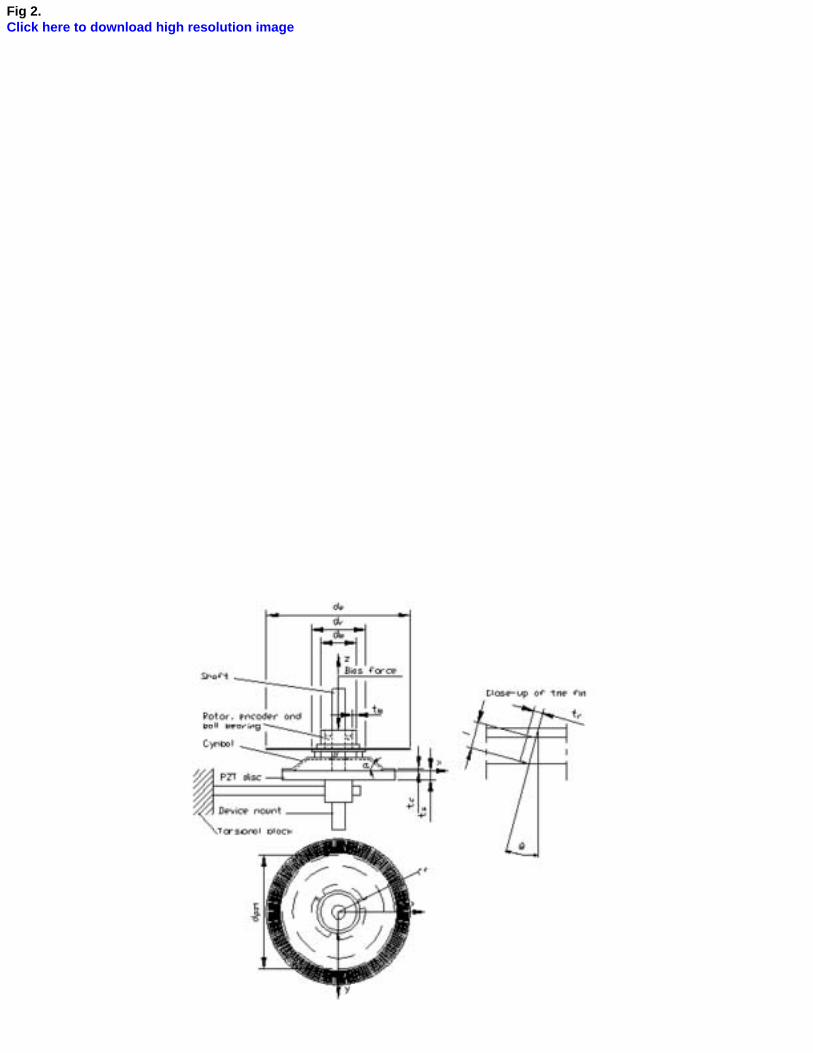
Fig 2.Click here to download high resolution image
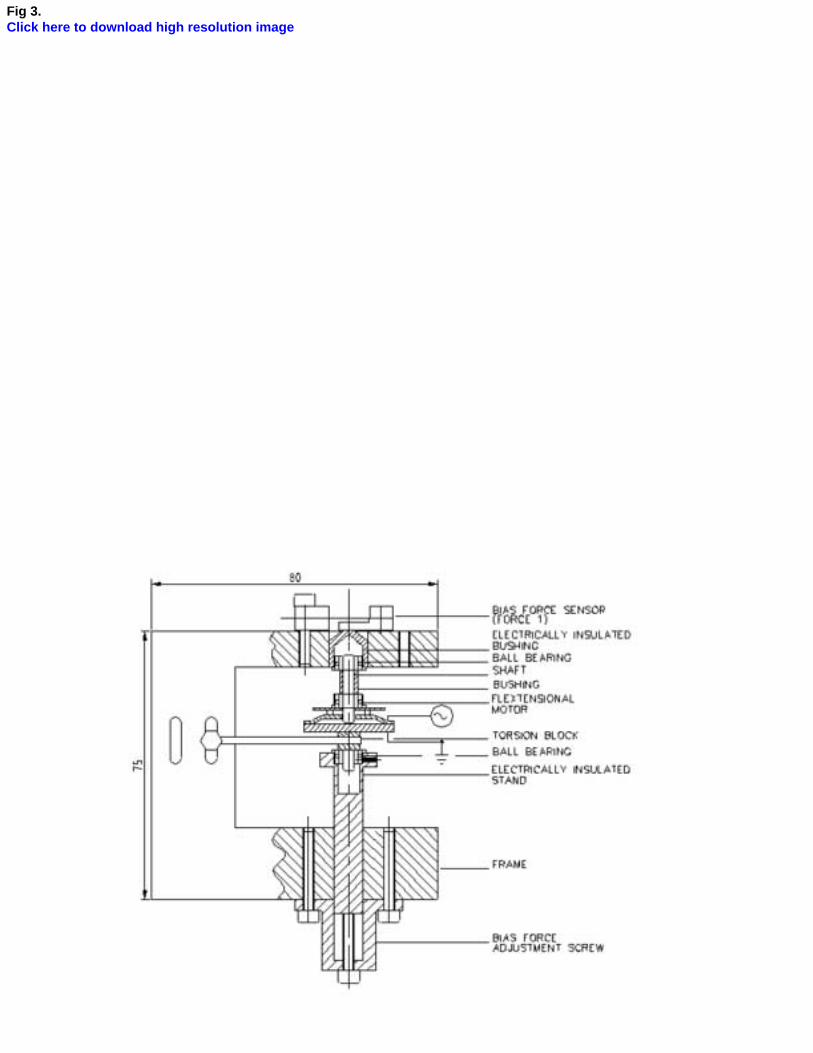
Fig 3.Click here to download high resolution image
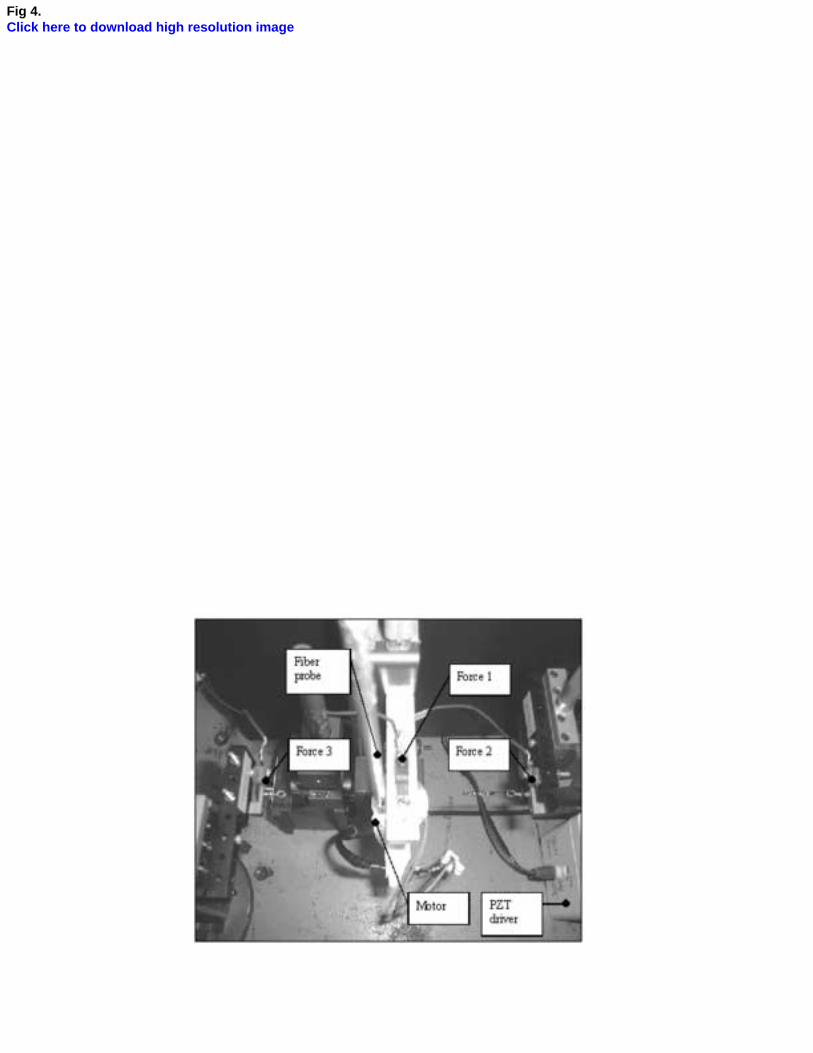
Fig 4.Click here to download high resolution image
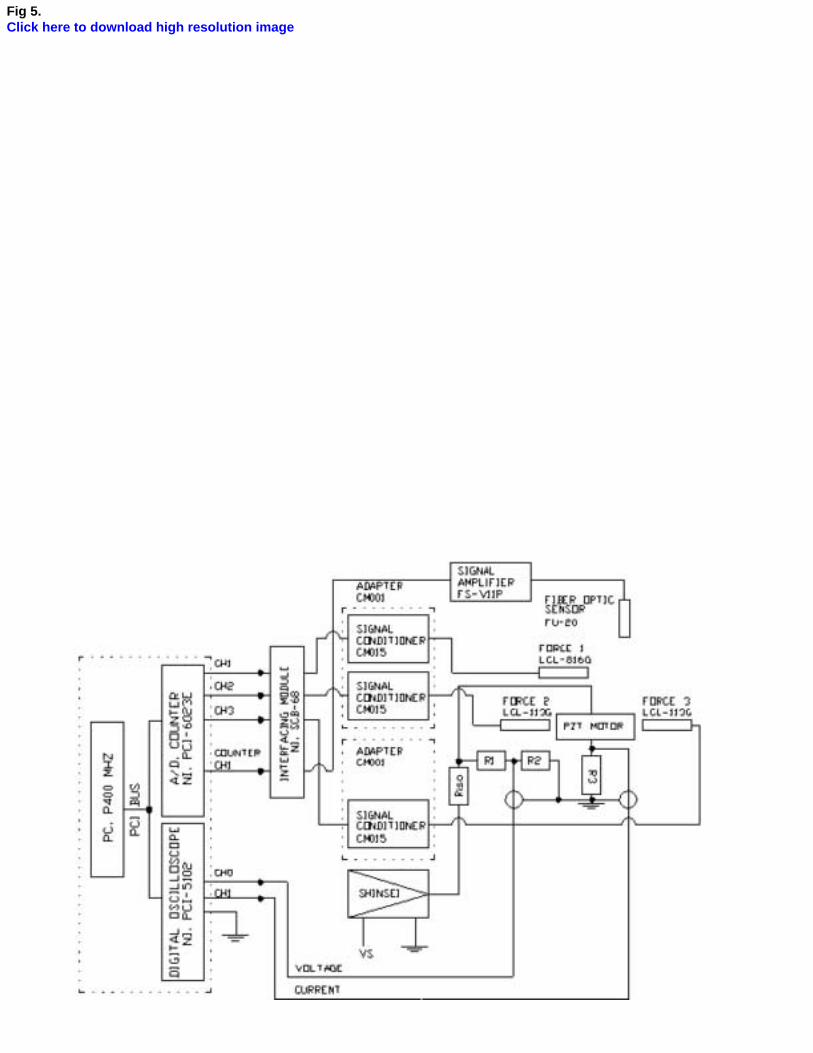
Fig 5.Click here to download high resolution image
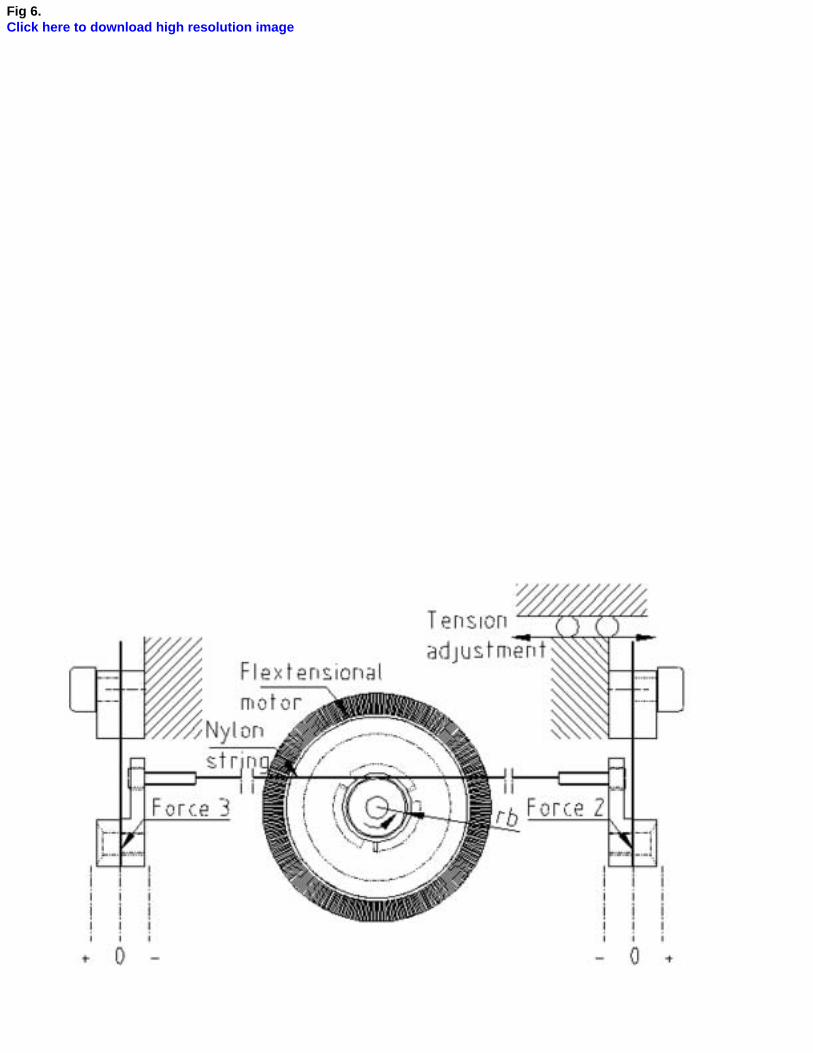
Fig 6.Click here to download high resolution image
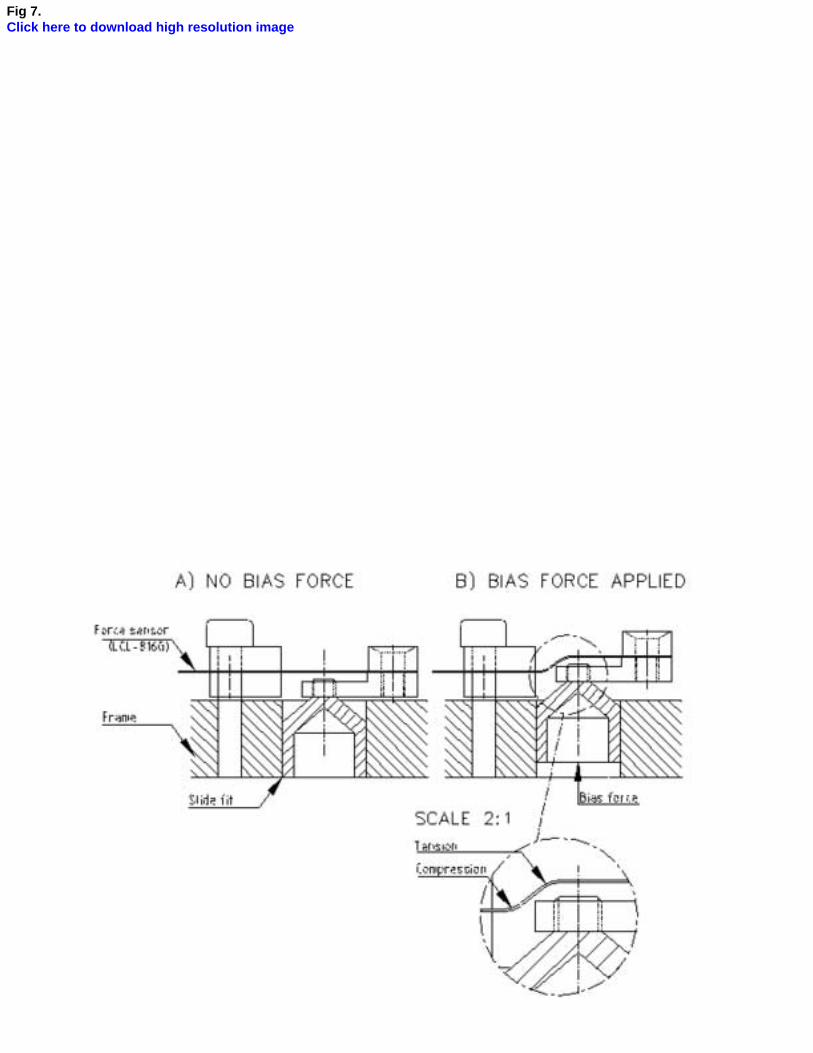
Fig 7.Click here to download high resolution image
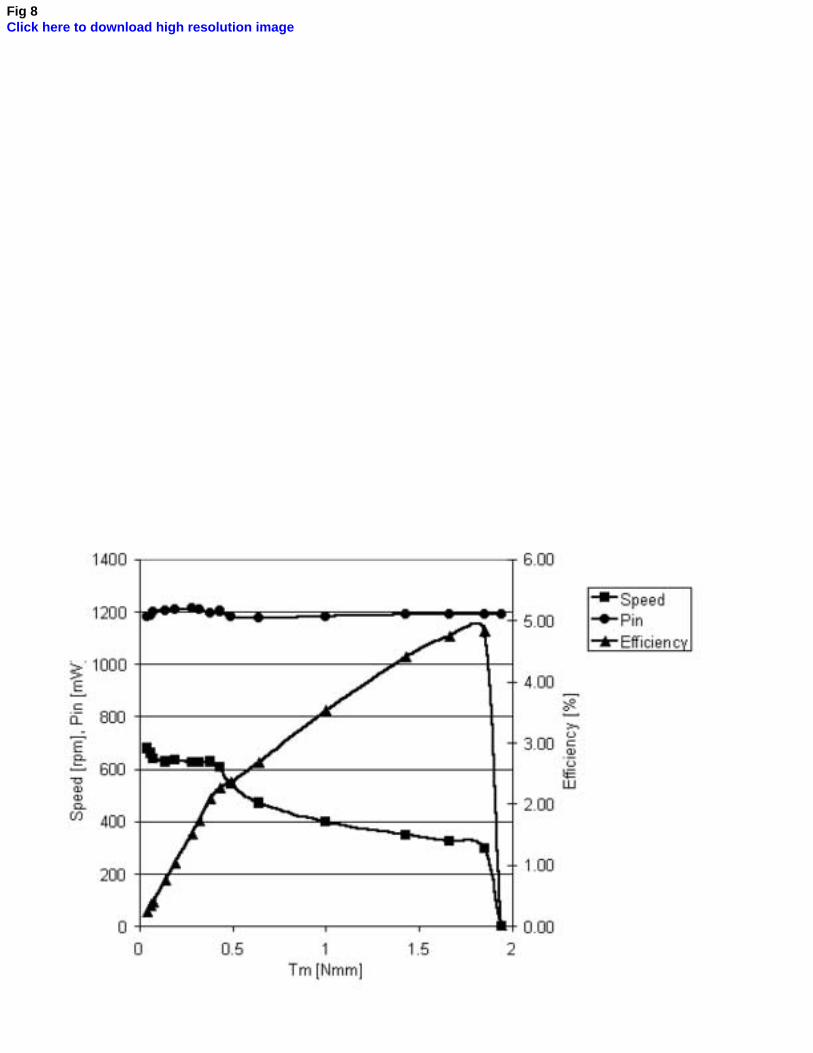
Fig 8Click here to download high resolution image
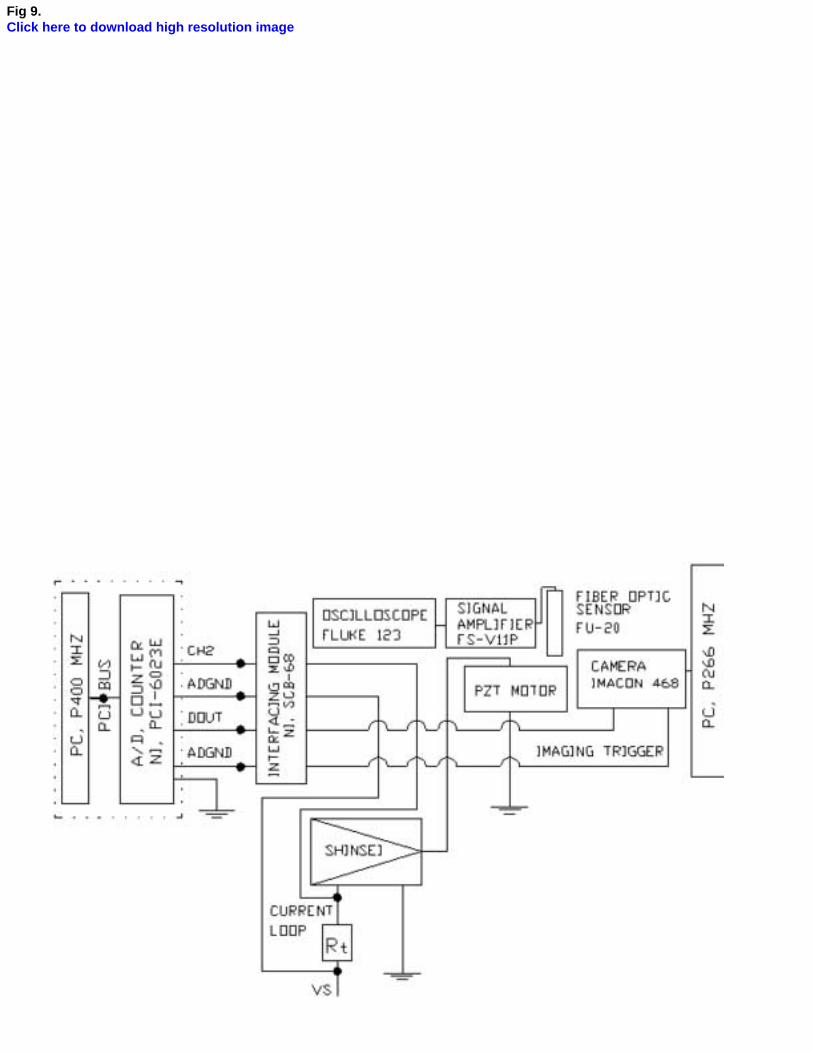
Fig 9.Click here to download high resolution image
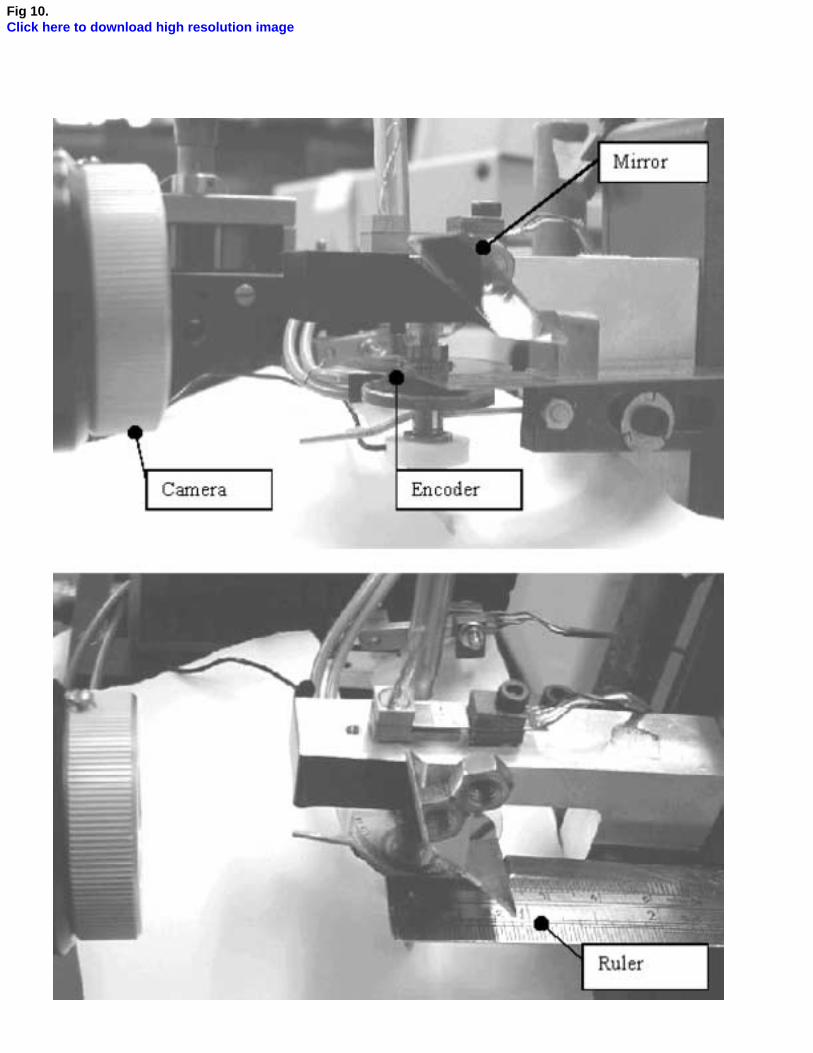
Fig 10.Click here to download high resolution image
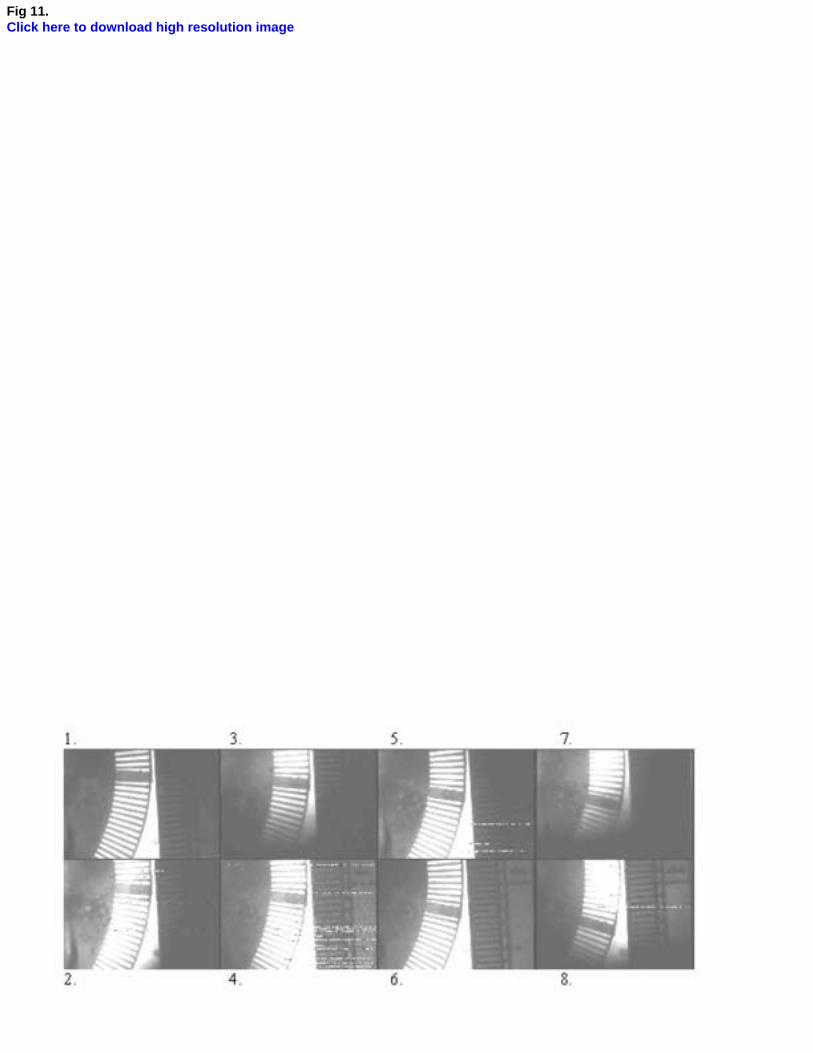
Fig 11.Click here to download high resolution image
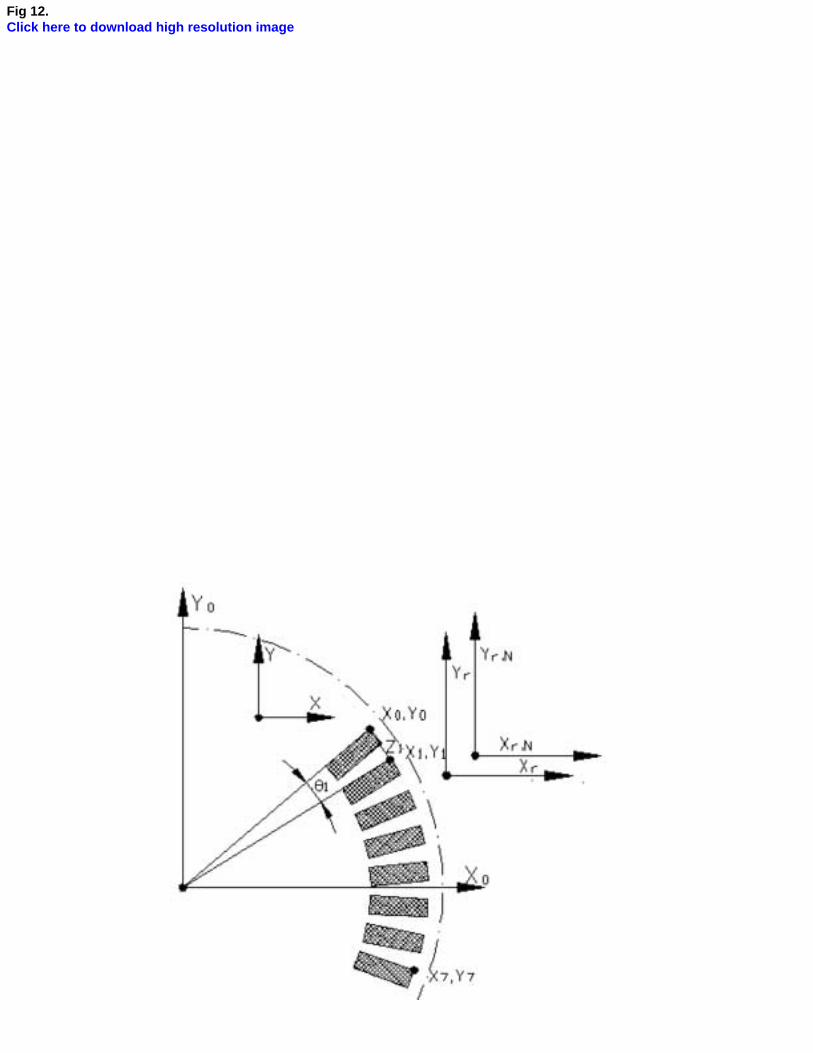
Fig 12.Click here to download high resolution image
A new flextensional piezoelectric ultrasonic motor – design, fabrication and characterisation
J.T. Leinvuo†, S.A. Wilson R.W. Whatmore and M. G. Cain* Cranfield University, Cranfield, Bedford, MK43 0AL, UK
† Present address: VTI Technologies Oy, Vantaa, Finland * National Physical Laboratory, Teddington, Middlesex, UK Abstract This paper presents the techniques used for the characterization of a new type of standing-wave piezoelectric ultrasonic motor. The motor uses a metallic flextensional amplifier, or “cymbal”, to convert the radial mode vibrations of a piezoelectric ceramic disc into flexural oscillations, which are further converted to produce rotary actuation by means of an elastic-fin friction drive. The motor operates on a single-phase electrical supply. A beryllium copper rotor design with three-fin configuration was adopted. The best stall torque, no load speed, transient time and efficiency for a 25 mm motor were 2 Nmm, 680 r/min, 2 ms and 4.8 % respectively. The operational characteristics of the motor were evaluated by using two methods: one based on the pulley brake principle and one on high-speed imaging. The results obtained from using these two techniques are contrasted and compared. Key words: Ultrasonic motor, flextensional amplifier, pulley-brake, high-speed imaging, torque measurement Corresponding author: Joni Leinvuo, [email protected] Editor: Prof. P.J. French Electronic Instrumentation Laboratory Delft University of Technology Faculty of Electrical Engineering, Mathematics and Computer Science Dept. of Microelectronics Mekelweg 4 2628 CD Delft The Netherlands
* Cover Letter
A new flextensional piezoelectric ultrasonic motor – design, fabrication and characterisation List of figures Fig. 1. Schematic diagram of the flextensional motor and the mechanics of the elastic fin structure. Fig. 2. Schematic diagram of the disc type of flextensional motor construction (dpzt = 25 mm, ts = 2 mm, tc = 0.45 mm, α = 38º, θ = 38º, rr = 5 mm, tr = 0.5 mm, l = 1.5 mm, db = 8 mm, dr = 12 mm de = 32 mm, tb = 1 mm). Fig. 3. Test set-up. Fig. 4. Speed torque characterization set-up. Torque measurement sensors Force 2 and 3 are connected together by a nylon string at both sides of the motor. Fig. 5. Electrical interfacing of the PC based speed torque measurement system. (R1 = 330.1 kΩΩΩΩ, R2 = 150.3 kΩΩΩΩ, R3 = 12.0 ΩΩΩΩ, Riso = 27 ΩΩΩΩ). Fig. 6. Pulley-brake torque measurement using two flexure force sensors. Fig. 7. Bias force measurement set-up. Fig. 8. Operational characteristics of the flextensional motor. Fig. 9. Layout of the electrical interfacing in the acceleration measurements (Rt = 3.3 Ω). Fig. 10. Close up of the measurement set-up. The motor is located between the force sensor and the height adjustable stand. The image of the encoder’s top surface is formed via use of the tilted mirror. The ruler is used as a spatial reference. Fig. 11. Images taken from an encoder disc during the acceleration. Numbers 1-8 indicate the frame order. Fig. 12. Measurement points in Cartesian co-ordinate system. X0,Y0 stands for the rotational centre, X,Y the global zero, Xr,N,Yr,N the local co-ordinate reference per frame and Xr,Yr the reference co-ordinate for the first frame. Fig. 13. Flextensional motor’s rotational speed, acceleration and torque characteristics represented as a function of time. Labels F1 to F7 indicate the frame numbers.
List of figures
