a new 3he-free thermal neutrons detector concept based on the gem technology
TRANSCRIPT

Nuclear Instruments and Methods in Physics Research A 729 (2013) 117–126
Contents lists available at SciVerse ScienceDirect
Nuclear Instruments and Methods inPhysics Research A
0168-90http://d
n CorrItaly. Tel
E-mpietropa
1 PrItaly.
journal homepage: www.elsevier.com/locate/nima
A new 3He-free thermal neutrons detector concept basedon the GEM technology
A. Pietropaolo a,n, F. Murtas b, G. Claps b, L. Quintieri b,1, D. Raspino c, G. Celentano d,A. Vannozzi d, O. Frasciello b
a Consiglio Nazionale delle Ricerche, Istituto di Fisica del Plasma “P. Caldirola”, Milano, Italyb Istituto Nazionale di Fisica Nucleare, Laboratori Nazionali di Frascati, Frascati, Italyc Science and technology Facility Council, ISISI Facility, Chilton, Didicot, United Kingdomd ENEA Centro Ricerche Frascati, Frascati, Italy
a r t i c l e i n f o
Article history:Received 20 November 2012Received in revised form29 May 2013Accepted 12 June 2013Available online 5 July 2013
Keywords:GEM detectorThermal neutrons detectorsNeutron instrumentation
02/$ - see front matter & 2013 Elsevier B.V. Ax.doi.org/10.1016/j.nima.2013.06.058
esponding author. Present address: ENEA-Cen.: +39 0694005013.ail addresses: [email protected],[email protected] (A. Pietropaolo).esent address: ENEA Centro Ricerche Casaccia
a b s t r a c t
A thermal neutron detector based on the Gas Electron Multiplier technology is presented. It is configuredto let a neutron beam interact with a series of borated glass layers placed in sequence along the neutronpath inside the device. The detector has been tested on beam both at the ISIS (UK) spallation neutronsource and at the TRIGA reactor of ENEA, at the Casaccia Research Center, near Rome in Italy. For acomplete characterization and description of the physical mechanism underlying the detector operation,several Monte Carlo simulations were performed using both Fluka and Geant4 code. These simulationsare intended to help in seeking the optimal geometrical set-up and material thickness (converter layer,gas gap, sheet substrate) to improve the final detector design in terms of achieving the best detectorefficiency possible.
& 2013 Elsevier B.V. All rights reserved.
1. Introduction
The research and development activity on He-free neutrondetectors is of strategic importance for neutron applications inscience and technology. As a matter of fact, the lack of 3He istriggering an interesting and stimulating technological effort infinding out effective substitutes of the He-gas tubes typicallyoperating at both reactor and/or accelerator driven neutron sourcesworldwide.
The most important request for the new detectors is to provide ahigh detection efficiency (above 50%), high rate capability (MHz/cm2)and large area covering (1 m2 just to give an order of magnitude).
Boron technology seems to be an effective way as indicated by aseries of experimental and simulation studies [1–4] although otherapproaches, for example based on radiative capture, are also beinginvestigated [5].
In this paper, we report about an experimental study carriedout on the Gas Electron Multiplier (GEM) [6] technology at the ISISspallation neutron source. In particular, a triple GEM device [7,8]was setup with a series of glass sheets, borated on both surfaces,
ll rights reserved.
tro Ricerche Frascati, Frascati,
, via Anguillarese 123, Rome,
acting as neutron-charged particle converters with the neutronbeam impinging laterally onto the detector rather than frontally, astypically happens in other particle applications [9,10]. The aim ofthis work is to characterize the detector performances in terms oflinearity of the response, efficiency and gamma backgroundrejection. A series of Monte Carlo simulations, using two differentcodes, were also performed for a thorough description of thephysics underlying the detector's operation and as a mandatoryvalidation step for other simulations of more complex detector'sarchitectures that should lead to define a more efficient device.
The manuscript is organized as follows: in Section 1, wedescribe the device, including a brief discussion on the procedureto obtain 10B coating on glass sheets; in Section 2, we providethree sets of Monte Carlo simulations to optimize the detectorperformance and to determine the expected efficiency of thedevice with the dimensions and parameters adopted; in Section 3,we include the description of the experimental tests of the device in-beam, performed at the ISIS spallation neutron source (Rutheford-Appleton Laboratory in UK). In those experiments we demonstrateda fairly good agreement with our calculation predictions. Finally inSection 4, the conclusions are presented.
2. Description of the device
The conceived device, assembled at the Laboratori Nazionalidi Frascati of the Istituto Nazionale di Fisica Nucleare (LNF-INFN)

A. Pietropaolo et al. / Nuclear Instruments and Methods in Physics Research A 729 (2013) 117–126118
is shown in Fig. 1. The neutron beam impinges laterally onto thedetector rather than onto the cathode, as typically happens inalmost all GEM-based detectors applications. When a neutron isabsorbed into the 10B layer, an alpha particle and a 7Li ion areproduced following the reactions n+10B-4He+7Li (Q¼2.8 MeV,BR¼7%) or n+10B-4He+7Li+γ(478 keV) (Q¼2.3 MeV, BR¼93%).These charged particles ionize the Ar/CO2 gas mixture (70%/30%)in the drift region of the detector thus producing secondaryelectrons. These, moved by the electric field in this region, reachthe three GEM foils where they are further proportionally multi-plied in cascade, inducing a detectable signal in the pad-basedreadout. The 128 pads 3�6 mm2 are organized in a matrix of16�8; the 8 rows are parallel to the glass sheets while only 8 over16 columns are below the borated part. For this prototype the rowspitch is not equal to the sheets one. In this prototype detector, aseries of five glass sheets 40�10�1 mm3 were borated, whileanother set of five sheets (identical to the previous ones), placedinto the same detector, were not borated in order to check, underlocalized irradiation, the difference between the two sets. Fig. 2shows a picture of the sheets setup in the detector.
10B coating was obtained by means of electron beam evapora-tion techniques. Film depositions were carried out in a vacuumchamber equipped with a multi-crucible Thermionics 3 kW elec-tron beam system with 4 kV of electron acceleration voltage and750 mA of maximum current. Boron tablets of 0.5 in. diameterwere used as source for evaporation using 10B enriched boronmetal powder (isotopic 10B497 at%, Eagle Picher Technologies,LLc). Five glass substrates were disposed side by side on a rotatingsample holder in such a way that both surfaces can be subse-quently exposed to the evaporation source and substrates can becompletely coated during the same coating process. Film growthrate was monitored by a quartz crystal controller and fixed at
Fig. 1. Schematic of the sheets setup within the GEM-based detector: neutrons impingeof borated glass sheets.
Fig. 2. (left panel) Inner view of the detector before complete assembly showing theassembly during the measurements on beam at ISIS spallation neutron source (see text
0.2–0.3 nm/s by tuning the electron beam current, Ib. The distancebetween evaporation source and sample holder was 12.5 cm.In this configuration, the film thickness uniformity across thewhole deposition area 40�50 mm2 is greater than 90%. Eachsurface was coated with 300 nm 10B film. Although the optimizedthickness may be in the order of about 1 μm, this thickness waschosen to achieve a low intrinsic efficiency for a single sheet, asthe detector was to be used on the direct neutron beam in acondition similar to a beam monitor. Films as thick as 680 nmwere successfully deposited on a single surface exhibiting goodadherence and stability against aging (no delamination occurredwithin 2–3 months). For this reason, it is reasonably expected thatsheets with 1 μm thick 10B films on both surfaces can be easilyproduced simply using bigger tablets on larger crucibles.
3. Monte Carlo simulations
Monte Carlo simulations of glass sheets coated with 10B layers,hit by thermal neutrons, have been performed to estimate theexpected yields of charged particles, produced by the neutroncapture on 10B. These simulations were done using mainly theFluka code [11] and then Geant4 [12] for benchmarking purposes.The reference case for validation has been assumed to be thesingle glass sheet coated on the two parallel wider externalsurfaces with a 300 nm 10B layer. Indeed, in this case the thicknessof converter is sufficiently thin, so that the Monte Carlo predic-tions are expected to be in agreement with the theoreticalexpectations.
The energy spectra and angular distributions of alphas and 7Liions entering into the Ar/CO2 (70%/30%) gas region, around thesheets, were accurately simulated.
laterally onto the detector and the beam interacts with the sequential arrangement
positions of the borated and naked glass sheets; and (right panel) final detectorfor details).

2.5×10−53.03.54.04.55.05.56.06.5
7.0×10⁻⁵
B10 Single Layer [nm]
200 300 400 500 600 700 800 900 1000 1100 1200 1300
Ene
rgy
depo
site
d in
gas
(1
cm g
ap) [
GeV
]
Fig. 3. Comparison between Geant4 and Fluka simulations of the total energydeposited per neutron in the gas region around a single sheet by the chargedparticles produced in the converter 10B layers as a function of 10B thickness.
A. Pietropaolo et al. / Nuclear Instruments and Methods in Physics Research A 729 (2013) 117–126 119
The ionization produced in the gas mainly determines thedetector efficiency and it depends on the energy deposited bythe charged particles.
The electrons and positrons in Fluka code are transported downto 1 keV, while the threshold of electron kinetic energy, in the lowenergy EM package of Geant4, is set to 250 eV. On the other side,the majority of ionization electrons produced in Ar/CO2 at 1 atmhas energy of about 28 eV [13]. Thus, using Fluka and Geant4, theionization produced in the gas can be derived in an indirect way bymapping, as much accurately as possible, the energy deposited bythe primary charged particles (both alphas and 7Li ions) alongtheir tracks in the gas region, then dividing these values by theionization potential. This method provides a conservative estima-tion of the number of secondary electrons per unit volumeproduced by ionization.
Analytic α prod. in B10 Geant4 α prod. in B10Fluka α prod. in B10Fluka charg.part. into gas Geant4 charg.part. into gas
Gla
ss
Neu
tron
to c
harg
ed p
artic
le c
onve
rsio
n
0.02
0.05
0.1
0.2
0.5
B10 Single Layer Thickness [nm]
0 500 1000 1500 2000 2500 3000 3500 4000
Fig. 4. Charged particles produced per neutron in the converter 10B layers of asingle sheet and charged particles actually entering into the gas region as a functionof 10B thickness: comparison between Fluka, Geant4 and analytic results.
3.1. Optimization of the conversion efficiency of a single 10B-coatedsheet
In the following, the optimization of the conversion efficiencyfor a 10B coated single sheet is discussed.
The energy deposited by the alphas and 7Li ions (and indirectlythe number of electrons produced by ionization) in a fixed gasregion around the sheet has been estimated as a function of the10B thickness, in order to find out the single sheet geometricalconfiguration that can maximize the conversion detector effi-ciency. The gas region considered for the simulations has trans-versal cross section equal to the coated sheet surface and 1 cmdepth along the direction of the incident neutrons.
Fig. 3 reports the results of the simulations to estimate theenergy deposited by the charged particles in the gas, for differentconverter thickness values (from 300 up to 1200 nm), showing agood agreement between the Geant4 and Fluka predictions. Thefirst important feature to highlight is that by increasing the 10Bthickness by a factor of 4 (from 300 nm to 1200 nm) the energydeposited in the gas is increased only by a factor of 2.
In Fig. 4, the estimated values of alphas produced per incidentneutron inside the converter layers are reported together with thevalues of the charged particles (alphas and 7Li ions) leaving the 10Blayers and entering into the gas region. In this figure, the alphasproduced per incident neutron predicted by Monte Carlo codes arecompared to the analytic estimation. The latter was obtained usingthe relation Rα¼NB10sΦ(n) V2, where N is the atomic density of 10Bin the considered volume, s is the microscopic cross section of the10B (n, α) 7Li reaction (s¼3580b), Φ(n) is the neutron fluence and Vthe converter volume.
For 10B thickness below 900 nm, Fluka and Geant4 are well inagreement in predicting the total charged particle production aswell as the number of charged particles that enter the gas region.The differences above 900 nm are likely due to the different waysthe ions are transported in the two codes, so that, according toGeant4, the number of charged particles (alphas and 7Li ions) thatenter the gas in case of 1200 nm of 10B thickness is about 8% lessthan the respective Fluka predictions. The good agreement for thetotal energy deposited in the gas region shown in previous Fig. 3,indicates that the difference is likely due to the different treatmentof the final part of the generic ion track, where the ion kineticenergy is well below the threshold (1 keV). As a matter of fact,when the kinetic energy of the charged particles (alphas and ions)becomes lower than the cut-off, the particle is transported to restin an approximate way (linear interpolation). Anyway these
2 In the frame of a simplified conservative approach, the dependence of theprobability of neutron interaction upon the depth of converter layer has beenneglected. This assumption could work well only for thin converter thickness.
differences between the codes are still under investigation inorder to be better understood.
The value of the conversion efficiency of a single sheet made ofa 1 mm glass substrate and 300 nm of 10B on both sides isestimated to be, respectively, 3.1% by Fluka, 3.0% by Geant4 and3.2% by analytical calculation. The agreement between the MCresults and the analytical one, for a single sheet with thin 10Blayers, allows assessing that the physics is correctly reproducedfrom the quantitative point of view.
As the 10B thickness increases, the number of charged particlesproduced differs from the number of charged particles that reachthe gas region and this effect becomes appreciable for 10B thick-ness much lower than the alpha and 7Li range values (the range of1.47 MeV alphas and 0.84 MeV 7Li ions in 10B is respectively about3.6 μm and 2 μm). This is explained considering that the reactionproducts are emitted quite isotropically [14], so that the chargedparticles that are traveling in a solid angle larger than a certain θL(whose value depends on the 10B thickness as shown in Fig. 5)have a higher probability to be absorbed inside the solid converter.
Fig. 6 shows how the angular distribution changes as a functionof the 10B thickness for the alphas leaving the sheet and enteringinto the gas (forward with respect to the neutron primary beamdirection). The spatial distribution is quite uniform over all thesolid angle only for very thin 10B layers (o400 nm), whileincreasing the 10B thickness, two regions can be distinguished: acentral zone inside the θL angle (see distribution plotted in Fig. 5),where the particle density is quite uniform and an external one(for θLoθoπ/2), where the particle density decreases almostlinearly with θ. For the 7Li ions the general trend is quite similarto the one shown in Fig. 6 for the alphas.

A. Pietropaolo et al. / Nuclear Instruments and Methods in Physics Research A 729 (2013) 117–126120
3.2. Spatial energy deposition and particles fluence: detailed resultsfor a 300 nm 10B-coated single sheet
The spatial distribution of the energy deposited inside a solidsheet, coated with 300 nm 10B layer, and in the gas all around hasbeen estimated for both alphas and 7Li ions (see Fig. 7). The resultsof simulations of Fig. 7 refer to a primary neutron beam, parallel tothe z axis (zero divergence), uniform in energy (25 meV kineticenergy without any energy spread), with 4�1 cm2 transversalcross section area, centered with respect to the total transversalsurface of the sheet (7�1 cm2). The region of gas consideredaround the sheet has a volume of 10�10�3 cm3, centered at theaxis origin, which coincides with the sheet center too. Fig. 7 showsthe projection on the xz and yz planes of the deposited energydensity, by alphas and 7Li ions respectively, obtained averaging thevalues in each bin along the third direction perpendicular to theprojection planes.
The ranges of 1.47 MeV alphas in 10B and glass (46% O, 33.7% Si,10.7% Ca, and about 9.6% of Na) have also been estimated: theseare found to be, respectively, 3.6 μm (in 10B) and 5 μm (in glass).The range for 0.84 MeV 7Li ions in 10B and in glass has beenestimated to be, respectively, 2 μm and 2.7 μm. As a consequence,alpha particles and 7Li ions that move toward the inner side of thesheet (whose thickness is 1 mm in the beam direction) are
Fig. 6. Forward angular distribution, with respect to the neutron primary beam directiothickness.
Fig. 5. Limit angle defining the uniform spatial distribution of alpha entering intothe gas region as a function of the 10B thickness. Rα is the range of alpha inside the10B layer while r is the distance between the particle source point and the point onthe 10B external surface where alpha enters the gas region.
expected to be totally absorbed close (within 5 μm) the crossingboundary between 10B and glass.
The stopping power in a Ar/CO2 mixture (70%/30%) at 1 atm ofrespectively 1.47 MeV and 1.78 MeV alphas have been calculatedsupposing to have mono-directional and mono-energetic alphaspassing through the medium. The linear energy deposition fea-tures as a broadened Bragg peak whose maximum for 1.47 MeValpha is around 3 mm (5 mm for 1.78 alpha) and extends up toabout 9 mm (11 mm for 1.78 MeV). Simulations of the range of1.47 MeV alpha in Ar/CO2 at 10 atm provided a value of 880 μm,thus shorter by almost an order of magnitude with respect to thecorresponding value at 1 atm, in agreement with the Bragg-Kleeman rule [15]. This indicates a possible way to increase thedetector efficiency per unit volume.
The energy spectrum of the alphas and 7Li entering into the gasregion is reported in Fig. 8. It can be noted that the alpha spectrumis peaked mostly at 1.47 MeV with another lower peak around1.78 MeV. The estimated ratio between the two peaks area is about6%, corresponding to the different branching ratios of the radiativeand non radiative channels of the 10B(n, α) 7Li reaction.
The continuous tails at lower energy and the broadened peaks inthe spectra (especially appreciable in case of the 0.84 MeV peak of7Li ions) are due to the energy straggling that particles experiencein passing through different thickness of boron before reaching thegas region: indeed, particles emitted at large angles travel overlonger tracks inside the 10B layer, thus loosing much more energy.
In spite of being mono-directional and mono-energetic, thealphas and 7Li that emerge from the 10B layers and enter the gashave the angular and energetic distribution shown in Figs. 6 and 8,respectively. The overall energy density profile (energy depositionfrom alphas and 7Li ions, respectively) in the simulated region(solid sheet and gas around) is obtained by cumulating thecontributions of all the particles and is shown in Fig. 9.
The spatial fluence of the 478 keV gamma rays due to thethermal neutron radiative capture in 10B has been estimated allaround the solid sheet (simulated gas volume 10�10�10 cm3): itappears to be quite isotropic, as shown in Fig. 10.
3.3. Optimization study of a multi-sheets detector
In what follows some considerations are reported on thesimulations performed by Fluka in the case of a detector made
n, of the alphas leaving the sheet and entering into the gas as a function of the 10B

Fig. 7. Spatial distribution of energy deposited by alphas (top) and 7Li ions (bottom): the plots are the projections onto the yz and xz planes of the energy density depositedby alphas and 7Li, respectively, averaged along the third perpendicular direction (the simulated region: x[�5:5] cm, y[�2,2] cm and z[�1.5,1–5] cm, z being the direction ofthe neutron primary beam).
Fig. 8. Energy spectra of alphas (top) and 7Li (bottom) escaping from boron layers and entering into the gas region.
A. Pietropaolo et al. / Nuclear Instruments and Methods in Physics Research A 729 (2013) 117–126 121
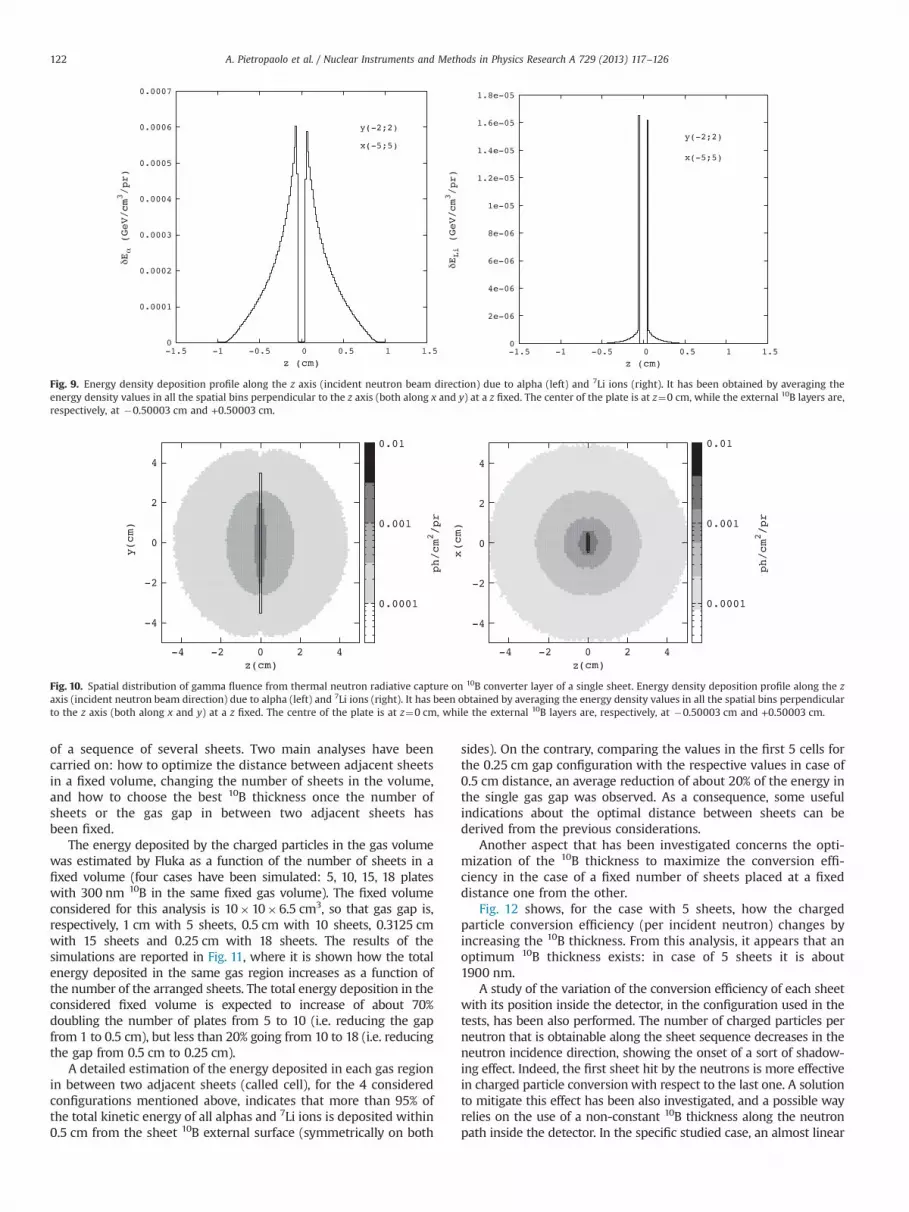
Fig. 9. Energy density deposition profile along the z axis (incident neutron beam direction) due to alpha (left) and 7Li ions (right). It has been obtained by averaging theenergy density values in all the spatial bins perpendicular to the z axis (both along x and y) at a z fixed. The center of the plate is at z¼0 cm, while the external 10B layers are,respectively, at �0.50003 cm and +0.50003 cm.
Fig. 10. Spatial distribution of gamma fluence from thermal neutron radiative capture on 10B converter layer of a single sheet. Energy density deposition profile along the zaxis (incident neutron beam direction) due to alpha (left) and 7Li ions (right). It has been obtained by averaging the energy density values in all the spatial bins perpendicularto the z axis (both along x and y) at a z fixed. The centre of the plate is at z¼0 cm, while the external 10B layers are, respectively, at �0.50003 cm and +0.50003 cm.
A. Pietropaolo et al. / Nuclear Instruments and Methods in Physics Research A 729 (2013) 117–126122
of a sequence of several sheets. Two main analyses have beencarried on: how to optimize the distance between adjacent sheetsin a fixed volume, changing the number of sheets in the volume,and how to choose the best 10B thickness once the number ofsheets or the gas gap in between two adjacent sheets hasbeen fixed.
The energy deposited by the charged particles in the gas volumewas estimated by Fluka as a function of the number of sheets in afixed volume (four cases have been simulated: 5, 10, 15, 18 plateswith 300 nm 10B in the same fixed gas volume). The fixed volumeconsidered for this analysis is 10�10�6.5 cm3, so that gas gap is,respectively, 1 cm with 5 sheets, 0.5 cm with 10 sheets, 0.3125 cmwith 15 sheets and 0.25 cm with 18 sheets. The results of thesimulations are reported in Fig. 11, where it is shown how the totalenergy deposited in the same gas region increases as a function ofthe number of the arranged sheets. The total energy deposition in theconsidered fixed volume is expected to increase of about 70%doubling the number of plates from 5 to 10 (i.e. reducing the gapfrom 1 to 0.5 cm), but less than 20% going from 10 to 18 (i.e. reducingthe gap from 0.5 cm to 0.25 cm).
A detailed estimation of the energy deposited in each gas regionin between two adjacent sheets (called cell), for the 4 consideredconfigurations mentioned above, indicates that more than 95% ofthe total kinetic energy of all alphas and 7Li ions is deposited within0.5 cm from the sheet 10B external surface (symmetrically on both
sides). On the contrary, comparing the values in the first 5 cells forthe 0.25 cm gap configuration with the respective values in case of0.5 cm distance, an average reduction of about 20% of the energy inthe single gas gap was observed. As a consequence, some usefulindications about the optimal distance between sheets can bederived from the previous considerations.
Another aspect that has been investigated concerns the opti-mization of the 10B thickness to maximize the conversion effi-ciency in the case of a fixed number of sheets placed at a fixeddistance one from the other.
Fig. 12 shows, for the case with 5 sheets, how the chargedparticle conversion efficiency (per incident neutron) changes byincreasing the 10B thickness. From this analysis, it appears that anoptimum 10B thickness exists: in case of 5 sheets it is about1900 nm.
A study of the variation of the conversion efficiency of each sheetwith its position inside the detector, in the configuration used in thetests, has been also performed. The number of charged particles perneutron that is obtainable along the sheet sequence decreases in theneutron incidence direction, showing the onset of a sort of shadow-ing effect. Indeed, the first sheet hit by the neutrons is more effectivein charged particle conversionwith respect to the last one. A solutionto mitigate this effect has been also investigated, and a possible wayrelies on the use of a non-constant 10B thickness along the neutronpath inside the detector. In the specific studied case, an almost linear

Fig. 11. Total energy deposited in a fixed volume (10�10�6.5 cm3) as a function of the number of sheets, coated with 300 nm 10B layers on both sides (see text for details).Errors are less than 3%.
Fig. 12. Conversion efficiency, estimated by Fluka, of neutron to charged particles into the gas for a 5 sheets bundle, with 1 cm gas gap among the sheets, as a function of the10B thickness.
A. Pietropaolo et al. / Nuclear Instruments and Methods in Physics Research A 729 (2013) 117–126 123
increase of the thickness, from 300 nm of the first sheet to 400 nm ofthe last one (with respect to the neutron incidence direction, fromleft to right), seems effective in reducing the shadowing effect.
The results of this study are summarized in Fig. 13 where theempty dots show the estimated conversion efficiency in case ofincreased thickness and the full dots are the values for constant10B thickness. By increasing in a controlled way the thickness ofthe 10B converter it is possible to make uniform the neutron tocharged particle conversion efficiency along the neutron pathinside the detector.
4. Tests on beam
The detector was tested at the ISIS spallation neutron source [16]at the Rutherford Appleton Laboratory (UK) at the ROTAX beam line[17]. This instrument is a neutron diffractometer, mostly used formagnetic neutron scattering and cultural heritages studies usingneutron diffraction [18,19]. At present, it is used as a test beam linefor detector development [20,21]. ROTAX is downstream of thePRISMA beam line and it is in the line of view of a solid methanemoderator at T¼95 K. This moderator is decoupled from the ber-yllium reflector and poisoned by a gadolinium sheet. The primaryflight path (from moderator to the sample position) is L0≈15 m. A T0
chopper blocks the beam at the point when the protons hit the targetthus blocking out a large component of the fast neutrons andgammas, while the use of the neutron guides in the front end ofthe PRISMA beam line ensures an enhanced thermal neutronintensity at the sample position. The neutron spectrum is peakedat about 10 meV and features a high energy tail up to multi-MeVenergies [22,23].
The measurement was performed by placing the side-on GEM(henceforth named S-GEM) in the incident neutron beam at adistance of about 16 m from the moderator and recording neutroncounts by using a time window of 1 ms and delaying it with respectto the ISIS clock in steps of 1 ms from 0 to 19 ms (i.e. the whole timeframe of ISIS beam lines). The detector was biased at a voltage ofabout 870 V and thus at a gain to ensure an almost completerejection of the gamma background [24] that is always present in aneutron beam line and composed of different contributions [25,26].Thus the detector results also insensitive to the 478 keV gammarays coming from the radiative thermal neutron capture in boron.The reconstructed time spectrum (corresponding to the incidentneutron spectrum in the time-of-flight domain) is shown in Fig. 14and compared to the same spectrum measured by the ROTAXincident neutron beam monitor (a Li-glass scintillation detector)operating with the standard Data Acquisition Electronics used atISIS. The two spectra were normalized with respect to the peak at

Fig. 13. Estimated conversion efficiency simulated by Fluka in the case of the actual sheets setup used in the test (5 sheets 300 nm 10B layer 1 cm apart). The shadowingeffect can be mitigated by using a non-constant 10B coating along the neutron path inside the detector.
Fig. 14. Neutron time of flight spectrum recorded by the S-GEM placed in theincident beam of the ROTAX instrument at ISIS.
A. Pietropaolo et al. / Nuclear Instruments and Methods in Physics Research A 729 (2013) 117–126124
6 ms of the S-GEM spectrum for a more clear shape comparison.The two trends are very similar and show a peak at about 6 ms andthen a rapid falling edge starting at 2 ms. The peak at 6 ms is thepeak of the Maxwell–Boltzmann component of the neutron spec-trum induced by the effect of the moderator while the rapiddecrease below 2 ms is due to the combined effect of the T0chopper operating on ROTAX, and used to drop away from thebeam the high-energy neutrons components and the gamma flashfrom the target, and the decreasing efficiency of the monitor and S-GEM with increasing neutron velocity (both 6Li and 10B absorptioncross section decrease as 1/v, v being the neutron velocity).
Another measurement was performed on ROTAX by placingtwo close spaced (about 5 mm distance) cadmium sheets, 1 mmthickness and about 10�1 cm2 area. The two sheets were placedin front of the entrance window of the S-GEM so to intercept theincident neutron beam and absorb thermal neutrons impingingonto the Cd surface. Indeed, 1 mm natural Cd provides a very high(close to 100%) absorption efficiency for neutrons with energy upto about 400 meV (cadmium cut-off). Fig. 15 shows the 2Dintensity plots and the corresponding contour plots relative tothe measurements with and without the cadmium sheets in front
of the S-GEM. In the right panel, the counts are present in theregion between the two absorbing Cd sheets. It is to be stressedthat in both cases shown in Fig. 15, the signals from gamma-rays(both environmental as well as from neutron radiative capture in10B and Cd) do not contribute thanks to the high rejectioncapability of the detector at the used operational bias. This furthermeasurement is a clear demonstration that the S-GEM detector issensitive to thermal neutron with a spatial resolution related tothe pad's dimension.
A different measurement was made using the TRIGA reactor atthe ENEA-Centro Ricerche Casaccia (Rome) [27]. The reactor can beoperated at different powers from a few Watt to 1 MW with aneutron flux of about 2�106 n/cm2/s at the maximum powerfeaturing a Maxwellian spectrum with about 70 meV full widthhalf maximum. By running at different powers (and thus atdifferent neutron fluxes) there was the possibility to check thedetector response in terms of detector's count rate as a function ofthe incident neutrons rate from the beam line. Fig. 16 reports thecorrelation between the S-GEM count rate and the neutrons rateprovided by the reactor along the extraction port chosen for themeasurements showing a good linearity over 6 orders of magni-tude. The slope of the fitting line provides an estimation of thedetection efficiency that comes out to be 4.8(5)% that should becompared with the one estimated by MC codes, 7.6%70.6%,obtained using in the simulations the actual spectrum providedby the ENEA TRIGA reactor. The difference between the MCprediction and the measurement may be likely due to: (1) theoverall charge production/amplification/threshold in the detectorstages, that is not included in the MC model; (2) a possiblecontamination of B2O3 and the reduced density of the films withrespect to the bulk value in the 10B films that reduces the actualamount of 10B atoms in the borated sheets. This last issue is goingto be addressed in a thorough experimental study in view of theproduction of a new high-efficiency S-GEM detector to be used inneutron scattering measurements.
5. Conclusions
A new configuration of a GEM-based neutron detector wastested and characterized on beam at the ISIS spallation neutron

Fig. 15. 2D Intensity profiles recorded through the S-GEM using two cadmium sheets in front of the detector (see text for details).
Fig. 16. S-GEM counting rate vs neutron rate provided by the TRIGA reactor at theENEA-Casaccia (Italy). The continuous line is a linear fit to data.
A. Pietropaolo et al. / Nuclear Instruments and Methods in Physics Research A 729 (2013) 117–126 125
source and the ENEA TRIGA reactor. The detector is made of aseries of glass sheets borated on both sides, the 10B layer being300 nm, and filled by Ar/CO2 mixture. Monte Carlo simulationswere also performed to finely outline the physical mechanismsunderlying the detector operation, to envisage optimized config-urations and to predict the measured efficiency.
The experimental tests at ISIS showed the effectiveness ofthe S-GEM in detecting thermal neutrons, reproducing themain features of the neutron spectrum in a comparable waywith respect to the standard neutron beam monitor used on thebeam line.
The tests at the TRIGA reactor provided a first experimentaldetermination of the detector efficiency and of its dynamicrange in the present configuration, over an extended interval ofneutron flux.
In perspective, the devices can be made more efficient byincreasing the number of borated sheets (about a factor of 3 fixingthe present detector's volume) and thickening in a controlled waythe 10B layer in order to reach a good compromise betweenneutron absorption and secondary particles escaping probabilitiesand minimizing possible shadowing effects.
Acknowledgments
The authors greatly acknowledge Eng. M. Palomba and Eng.A. Grossi from ENEA-Centro Ricerche Casaccia and the technicalstaff of the TRIGA reactor for their collaboration during the tests.The authors warmly acknowledge G. Corradi, A. Balla, D. Tagnaniand C. Paglia from electronics group of the Laboratori Nazionali diFrascati-INFN.
References
[1] R.T. Kouzes, J.H. Ely, A.T. Lintereur, E.R. Siciliano, M.L. Woodring, , 2009, PNNLReport 19050.
[2] A. Lintereur, K. Conlin, J. Ely, L. Erikson, R. Kouzes, E. Siciliano, D. Stromswold,M. Woodring, Nuclear Instruments and Methods A 652 (2011) 347.
[3] M. Klein, C.J. Schmidt, Nuclear Instruments and Methods A 628 (2011) 9.[4] A.S. Tremsin, W.B. Feller, R.G. Downing, Nuclear Instruments and Methods A
539 (2005) 278.[5] G. Festa, A. Pietropaolo, F. Grazzi, E. Barzagli, A. Scherillo, E.M. Schooneveld,
Nuclear Instruments and Methods A 654 (2011) 373.[6] F. Sauli, Nuclear Instruments and Methods A 386 (1997) 531.[7] F. Murtas, B. Buonomo, G. Corradi, G. Mazzitelli, M. Pistilli, M. Poli Lener,
D. Tagnani, P. Valente, Nuclear Instruments and Methods A 617 (2010) 237.[8] F. Murtas, G. Croci, A. Pietropaolo, G. Claps, C.D. Frost, E. Perelli Cippo,
D. Raspinod, M. Rebai, N.J. Rhodes, E.M. Schooneveld, M. Tardocchi,G. Gorini, Journal of Instrumentation 7 (2012) P07021.
[9] M. Alfonsi, G. Bencivenni, P. de Simone, F. Murtas, M. Poli Lener, W. Bonivento,A. Cardini, C. Deplano, D. Pinci, D. Raspino, B. Saitta, Nuclear Instruments andMethods A 525 (2004) 17.
[10] G.P. Guedes, A. Breskin, R. Chechik, D. Vartsky, D. Bar, A.F. Barbosa, P.R.B. Marinho, Nuclear Instruments and Methods A 513 (2003) 473.
[11] A..Fassò et al., A multi-particle transport code, CERN-2005-10, INFN/TC-05/11,2005.
[12] S. Agostinelli, et al., Nuclear Instruments and Methods A 506 (2003) 250.[13] A. Sharma, Properties of some gas mixtures used in tracking detectors, SLAC-
JOURNAL-ICFA-16-3.[14] K. Maluszynska, L. Natanson, Yuan Han-Yong, Azimuthal angular distribution
of α-particles from the 10B(n, α)7Li reaction with polarized thermal neutrons,PAN-194/I-A 1961; Nuclear Science, Abstract, vol. 15, p. 2420, Abstract, p.18734, 1961.
[15] W.H. Bragg, R. Kleeman, Philosophical Magazine 10 (1905) 358.[16] ISIS web site: ⟨www.isis.stfc.ac.uk⟩.[17] H. Tietze, W. Schmidt, R. Geick, Physica B 156–157 (1989) 550 ⟨http://www.
isis.stfc.ac.uk/instruments/rotax⟩.[18] W. Kockelmann, A. Kirfel, Physica B 350 (2004) e581.[19] A. Filabozzi, C. Andreani, M.P. de Pascale, G. Gorini, A. Pietropaolo, E. Perelli
Cippo, R. Senesi, M. Tardocchi, W. Kockelmann, Journal of Neutron Research 14(2006) 55.
[20] A. Pietropaolo, C. Andreani, M. Rebai, L. Giacomelli, G. Gorini, E. Perelli Cippo,M. Tardocchi, A. Fazzi, G. Verona Rinati, C. Verona, M. Marinelli, E. Milani, C.D. Frost, E.M. Schooneveld, Europhysics Letters 92 (2010) 68003.

A. Pietropaolo et al. / Nuclear Instruments and Methods in Physics Research A 729 (2013) 117–126126
[21] A. Pietropaolo, C. Andreani, M. Rebai, L. Giacomelli, G. Gorini, E. Perelli Cippo,M. Tardocchi, A. Fazzi, G. Verona Rinati, C. Verona, Marco Marinelli, E. Milani,C.D. Frost, E.M. Schooneveld, Europhysics Letters 94 (2011) 62001.
[22] R. Bedogni, A. Esposito, C. Andreani, R. Senesi, M.P. De Pascale, P. Picozza,A. Pietropaolo, G. Gorini, C.D. Frost, S. Ansell, Nuclear Instruments andMethods A 612 (2009) 143.
[23] A.N. Smirnov, A. Pietropaolo, A.V. Prokofiev, E.E. Rodionova, C.D. Frost,S. Ansell, E.M. Schooneveld, G. Gorini, Nuclear Instruments and Methods A687 (2012) 14.
[24] F. Murtas, G. Croci, A. Pietropaolo, G. Claps, C.D. Frost, E. Perelli Cippo,D. Raspino, M. Rebai, N.J. Rhodes, E.M. Schooneveld, M. Tardocchi, G. Gorini,Journal of Instrumentation 7 (2012) P07021.
[25] A. Pietropaolo, M. Tardocchi, E.M. Schooneveld, R. Senesi, Nuclear Instrumentsand Methods A 568 (2006) 826.
[26] A. Pietropaolo, E. Perelli Cippo, G. Gorini, M. Tardocchi, E.M. Schooneveld,C. Andreani, R. Senesi, Nuclear Instruments and Methods A 608 (2009) 121.
[27] R. Rosa, F. Andreoli, M. Mattoni, M. Palomba, Nuclear Instruments andMethods A 605 (2009) 57.