a multiscalar photoluminescence approach to discriminate among semiconducting historical zinc white...
TRANSCRIPT
A multiscalar photoluminescence approach to discriminate amongsemiconducting historical zinc white pigments†
Loıc Bertrand,∗a,b Matthieu Refregiers,b Barbara Berrie,c Jean-Philippe Echard,d and MathieuThourya
Received Xth XXXXXXXXXX 20XX, Accepted Xth XXXXXXXXX 20XXFirst published on the web Xth XXXXXXXXXX 200XDOI: 10.1039/b000000x
In order to fully characterize the zinc white artists’ pigment (ZnO), much used since the mid-nineteenth century, three samplescollected in the early 20th century were studied using a combination of synchrotron and macroscopic photoluminescence spec-troscopy and imaging. An improved microscope setup based on synchrotron-microspectroscopy and imaging microspectroscopywas used to study the powders dispersed onto indium foil. The synchrotron setup offered diffraction-limited resolution of 153 nm.The PL spectra of individual grains were measured and the distribution of particles’ emission spectra mapped at the nanoscale.The results revealed that while the samples have apparent homogeneous photoluminescence behavior at the macroscale (bulk),their PL signatures are inhomogenous below 20 µm. At the nanoscale the three powder samples have quite different PL signa-tures. Different sources, perhaps even different batches, of zinc white might be readily differentiated using this method.
1 Introduction
Zinc oxide has been used as an artists’ pigment since the lateeighteenth century. It replaced lead white in watercolor paint-ings and then was favored by artists from the early twentiethcentury on, including Picasso, Cezanne, and van Gogh1,2. Itwas gradually replaced by titanium white in the mid-20th cen-tury. Traditionally, zinc white was prepared from the ore us-ing an indirect process involving formation of the metal whichwas roasted in air1. Later, in the United States, a direct processrelying on roasting of a particularly pure ore was introducedaround 18523. By 1911, a patent for production of ZnO us-ing a solution (wet) process had been issued4, though it seemsthat the wet processes were not much used for at least a decadeafter. Refinements of these continue today, providing nodular,acicular, and nanoparticles of ZnO. In both dry manufactur-ing methods, the final product was obtained by collecting thefine crystalline deposit from hoppers. The whiteness and fine-ness of the pigment improved as the distance from the roastingfurnace increased. Several grades were distinguished basedon the pigment hiding power, ranging from White to Green
† Electronic Supplementary Information (ESI) available: [details of anysupplementary information available should be included here]. See DOI:10.1039/b000000x/a IPANEMA USR 3461 CNRS/MCC, BP48 Saint-Aubin, F-91192 Gif-sur-Yvette, France. E-mail: [email protected] Synchrotron SOLEIL, BP48 Saint-Aubin, F-91192 Gif-sur-Yvette, France.c Scientific Research Department, National Gallery of Art, 4th and Constitu-tion Avenue NW, Washington D.C. 20565, United States of America.d Laboratoire de Recherche et de Restauration, Musee de la musique, Cite dela musique, 221 avenue Jean Jaures, F-75019 Paris, France.
Seals1,5.Zinc oxide is a II–VI direct semiconductor which has ma-
jor applications in photonics and spintronics on account of itswide band gap (Eg ≈ 3.37 eV at room temperature) and highexciton-binding energy6–8. ZnO has been extensively studiedusing photoluminescence (PL) spectroscopy at the macroscaleat both low and room temperatures. By allowing direct prob-ing of electronic transitions at and around the Fermi level, PLprovides information on the electronic structure and proper-ties9. Room-temperature PL spectra of ZnO typically consistof a UV emission and possibly one or more emission bands inthe visible that are related to levels located within the bandgap,induced by the presence of oxygen (or zinc) deficiency, in-terstitials, impurities and/or dislocations7,10,11. MacroscopicPL has occasionally been used to identify zinc white pig-ments in paintings, paint cross-sections and mock-up paintsamples12–17.
Generally, information obtained using PL at the macro-scopic scale is insufficient to deconstruct the PL signals fromluminophores in distinct local environments and crystallineforms, such as varieties of ZnO in artists’ paints. However,in semiconductor research, reports on micro-PL imaging re-main scarce. At high spatial resolution, PL imaging of indi-vidual dispersed semiconductor nanowires was reported witha full-width at half-maximum (FWHM) of the emission sig-nal close to 800 nm18. Laser scanning confocal microscopy(LSCM) has led to a contrast signal at submicrometer spatialresolutions19. Recently, several alternative high-resolutionapproaches to standard PL were developed, including near-field PL20, and — for specific types of materials — photoacti-
1–8 | 1
vated localization microscopy and stimulated emission deple-tion microscopy21. These methods are constrained by samplepreparation, the difficulty of collecting over large areas in areasonable timeframe, data interpretation and the classes ofmaterials they can be applied to.
Attaining and continuous scanning in the deep ultraviolet(DUV) is particularly challenging. The tuning range of mi-croscopes coupled to high-brightness sources is typically lim-ited in the UV to ranges of several tens of nanometers22. Thishas called for the use of alternative techniques at high spatialresolution, such as cathodoluminescence (CL)23–25, ionolumi-nescence26 or X-ray excited optical luminescence (XEOL)27.The downside of these approaches are: the energy distribu-tion broadening from charged particles braking in materialsthat hampers energy-specific measurements28, the need to putsamples under vacuum, and potential beam damage to thesample. Electron beam thermal effects were reported to causedistortion in CL spectra of semiconductors29. Comparison ofCL data with easily obtained macroscopic PL data may also bedifficult due to the specific excitation mechanisms involved.
Some of the main limitations encountered with current PLsetups are the difficulty of (i) attaining very high spatial res-olution, (ii) probing large areas in reasonable timeframes,(iii) tuning over wide ranges in excitation energy – a particu-larly challenging issue when reaching the deep UV, while pre-serving the ease of use and versatility of PL. An approach ad-dressing these constraints would be considered ideal for manyfields of physico-chemical characterization.
ZnO in artists’ pigment has occasionally been characterisedby its crystal structure and morphology. X-ray powder diffrac-tion studies of historic samples in the Forbes Collection foundevidence for only the wurtzite crystal form of zinc oxide30.Recent studies have demonstrated the presence of metal im-purities associated with the ZnO crystals at the nanoscale31.Here, using synchrotron-based spectral and PL analysis, weshow that three historic samples, dating from around 1930,are remarkably different one from another in the distributionof photoluminescence properties of individual crystalllites ob-servable at the submicrometric scale, where emission fromindividual particles is measured. This diversity of behaviorwithin and among samples may be used to distinguish be-tween zinc oxide paints an artist used from one work to an-other. It may assist in solidifying relative dating of workswithin an artist’s oeuvre, and even aid in discovering differ-ences between original and reworked areas within the sameartwork. Zinc oxide is known to react with oleaginous bindingmedia, but the reason for different reactivity of different paintsremains unknown32–34. Future work will investigate the rela-tionship between the chemical reactivity of various samples ofZnO in oil and their PL behavior.
2 Experimental
2.1 Photoluminescence setups
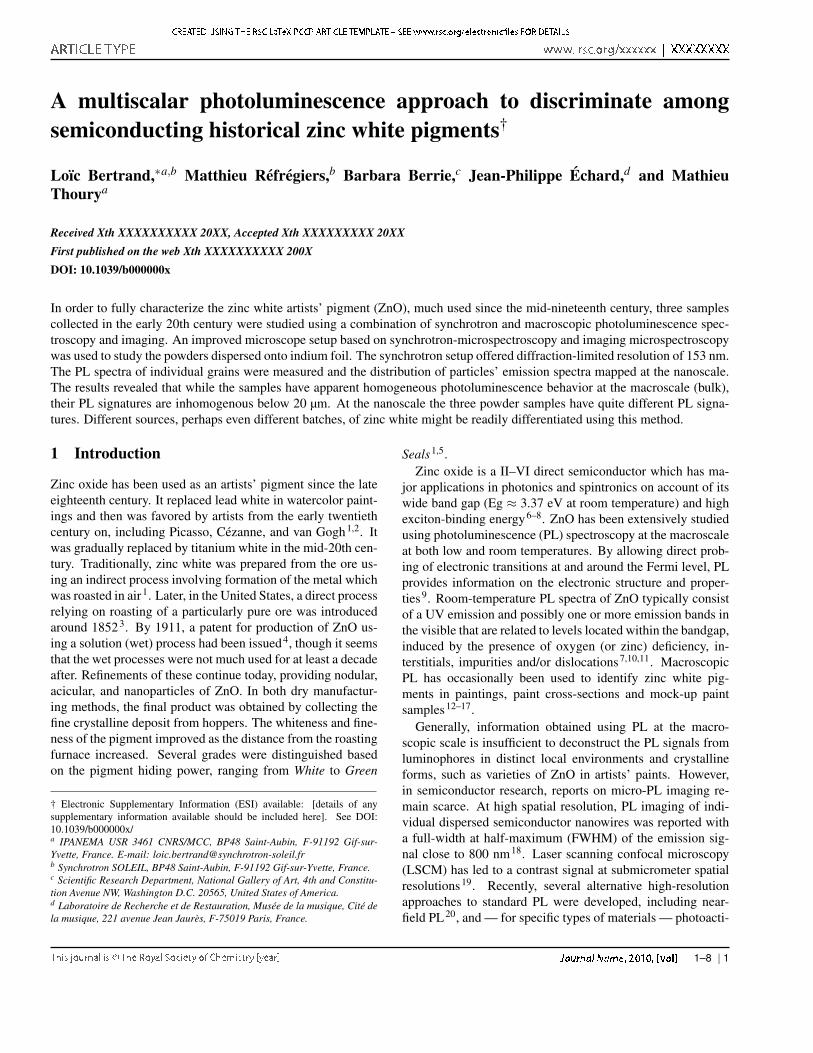
The source at the SOLEIL synchrotron (Saint-Aubin, France)was coupled to two tailored ultraviolet microscopes at theDISCO beamline: one set up for full-field imaging and theother for microspectroscopy, respectively named the Telemosand Polypheme endstations35,36. The energy range coveredat DISCO extends from 180 nm to 1000 nm, and the exci-tation wavelength is selected by a monochromator allowinga stray light rejection ratio of 5×10⁻⁴. All images acquiredat the Telemos endstation were collected using an excitationwavelength of 280 nm through a sharp 300 nm beamsplit-ter (Omega Optical, Brattleboro, VT). Two full-field detec-tors were used: a Hamamatsu C9100-13 EM-CCD (Hama-matsu City, Japan) with windows modified for better QE inthe UV domain (512×512 pixels) resulting in a 385 nm pro-jected pixel size when using a 40× objective (NA=0.6) inFigs 3 and 4; and a Princeton Instruments PIXIS 1024/BUV(1024×1024 pixels) with QE above 50% in the 220–820 nmrange resulting in a 153 nm projected pixel size when usinga 100× objective (NA=1.25) in Figs 2 and 6. The setup forfull-field imaging is shown in Figure 1. Images at Telemos
Synchrotronλ=180–1,000 nm Filter wheel
Camera
DMSlits
Cover slip
Quartz immersionobjective
Glycerin
Sample
Excitationmonochromator
Fig. 1 Schematic of the full-field photoluminescence experimental setup atDISCO. DM: dichroic mirror.
were collected in nine spectral bands between 335–590 nm.The corresponding collection range (360–630 nm) was em-ployed at Polypheme. Except in excitation mode, all spectraacquired at the Polypheme endstation were collected using amonochromatic excitation wavelength of 300 nm with a UVBbeamsplitter (Jobin-Yvon, Longjumeau, France). A calibratedsource was used to correct all data from Polypheme for thesource intensity, the beamsplitter reflectance, and the spec-tral response of the detection chain. In summary, access toa wide spatial dynamic range was provided by megapixel full-field PL images. Excitation energies could be continuouslytuned from the DUV (λex > 180 nm) to the visible. Char-acteristic emission and excitation spectra of single grains ofzinc oxide could be measured. The excellent stability of thesource allowed quantitative intercomparison between PL im-ages that had been collected within milliseconds to minutes of
2 | 1–8
each other. The acquisition time for all images collected inthe current DISCO setup was below 10 s. This setup allowedcollecting images with a projected pixel size of 153 nm, closeto the diffraction limit.
Macroscale PL spectra of the samples were collected usinga Xenon arc source Fluorolog3-2 spectrofluorometer (Jobin-Yvon, Longjumeau, France) equipped with a R928 photo-multiplier tube (Hamamatsu) at an excitation wavelength of300 nm. To allow comparison between macroscale PL anddata acquired at the Polypheme endstation, excitation datafrom both datasets were scaled so that the value of the inten-sity at λem 384 nm was set to 1.0 at 315 nm.
2.2 Samples
Paint manufacturers usually obtained their raw materials fromthe same source as chemical and industrial users. A U.S. gov-ernment bulletin listed about 25 producers active in 192237.Our test powders were three historical ZnO pigments. Twowere obtained from the Forbes collection of pigments (identi-fied as 1.06.9 and “1.06.x; (529)” – here noted 1.06.529) andone from the Akademie der bildenden Kunste of Vienna col-lections (identified as ABK 8). The sample denoted 1.06.9 wasidentified by Forbes as “Zinc Oxide Merck 1929 EWF (bottlesa,b)”.
In addition, a high-purity 99.999% recent ZnO powder wasanalysed (Aldrich Chem. Corp, ref. 204951), as well as threeother semiconductor pigments, under the following commer-cial designations: cadmium lemon yellow (Sennelier ref. 535),lithopone (Couleurs du Quai ref. 210724) and titanium white(Couleurs du Quai ref. 210726) all bought from Sennelier,Paris in 2013.
2.3 Sample preparation
Samples were prepared by dispersing mineral grains from thepigment powders on a clean flat surface then pressing against99.999% ultrapure indium disks (Goodfellow Metals Ltd).The use of a malleable metal provided very flat samples usingminimal mechanical stress and sample contamination. Sam-ple preparation simply required laying the powders embeddedinto the foil onto quartz coverslips (170-µm thick, Suprasyl)on the inverted microscopes. Complexity and interference as-sociated with the optical and luminescence properties of anembedding resin were thus avoided, thereby optimizing mea-surement of the intrinsic PL properties of the ZnO pigments.This type of sample preparation, widely used in surface sci-ence, is not a common practice in the study of historical mate-rials38.
2.4 Software and image rendering
Individual spectra and raster scans from Polypheme were cor-rected and rendered using self-written procedures within theR statistical computing environment39, and the SpectroMi-cro package. Images from Telemos were processed using theENVI software package version 4.8 (Exelis VIS, Boulder, Co,USA).
All RGB images on historical ZnO pigments shown wereconstructed using the following color designations: blue –380 nm, 15 nm FWHM; green – 425 nm, 30 nm FWHM; red –500 nm, 20 nm FWHM. The averaged value of the dark fieldwas subtracted from each image. For each channel, the lowestvalue of the 2nd percentile and the highest value of the 98thpercentile of the intensity distribution of all three images wereused as end points for an intensity stretch in order to facilitatevisual comparisons.
RGB images from modern pigments use the followingcolor designations and integration time: titanium white (red –900 nm, 40 nm FWHM; green – 865 nm, 70 nm FWHM;blue – 770 nm, 20 nm FWHM; 600 s), lithopone (red –865 nm, 70 nm FWHM; green – 625 nm, 50 nm FWHM;blue – 400 nm, 20 nm FWHM; 600 s), cadmium lemon yel-low (red – 900 nm, 40 nm FWHM; green – 865 nm, 70 nmFWHM; blue – 770 nm, 20 nm FWHM; 180 s) and ZnOAldrich (red – 525 nm, 20 nm FWHM; green – 425 nm, 30 nmFWHM; blue – 380 nm, 15 nm FWHM; 80 s). The imagesshown are cropped to 455×455 pixels, corrected for the darkfield and registered. For each channel of each individual im-age, the lowest value of the 2nd percentile and the highestvalue of the 98th percentile of the intensity distribution wereused as end points for an intensity stretch. As the selectedbands vary with the nature of the pigment investigated, unlikefor Fig. 3, this intensity stretch cannot be made common to thefour images in Fig. 6.
3 Results and discussion
The new aspects of the experimental set-up at DISCO endsta-tions allowed resolving adjacent ZnO particles of a diameterclose to the pixel size of 153 nm (Fig. 2). In the configurationdescribed here the Rayleigh criterion leads to a theoretical res-olution d = 0.61λ /NA of 244 nm at a wavelength of 500 nm.This unprecedented resolution in PL is an almost doubling ofthe 290-nm projected pixel size we had achieved in a previousPL study40,41.
The current resolution allowed measurement of PL emis-sion from individual ZnO grains. The PL spectrum obtainedon a single pixel represents the emission from one to a fewparticles depending on the dispersion of the grains in the fieldof view. The spectra typically, but not always, contain a rel-atively intense peak at λmax ≈ 380 nm and a contribution
1–8 | 3
(a)
525 530 535 540 545 550 555
0.5
0.6
0.7
0.8
0.9
1.0
Pixel number
Nor
mal
ized
inte
nsity 459 nm
612 nm
500 nm 425 nm
380 nm Composite
(b)
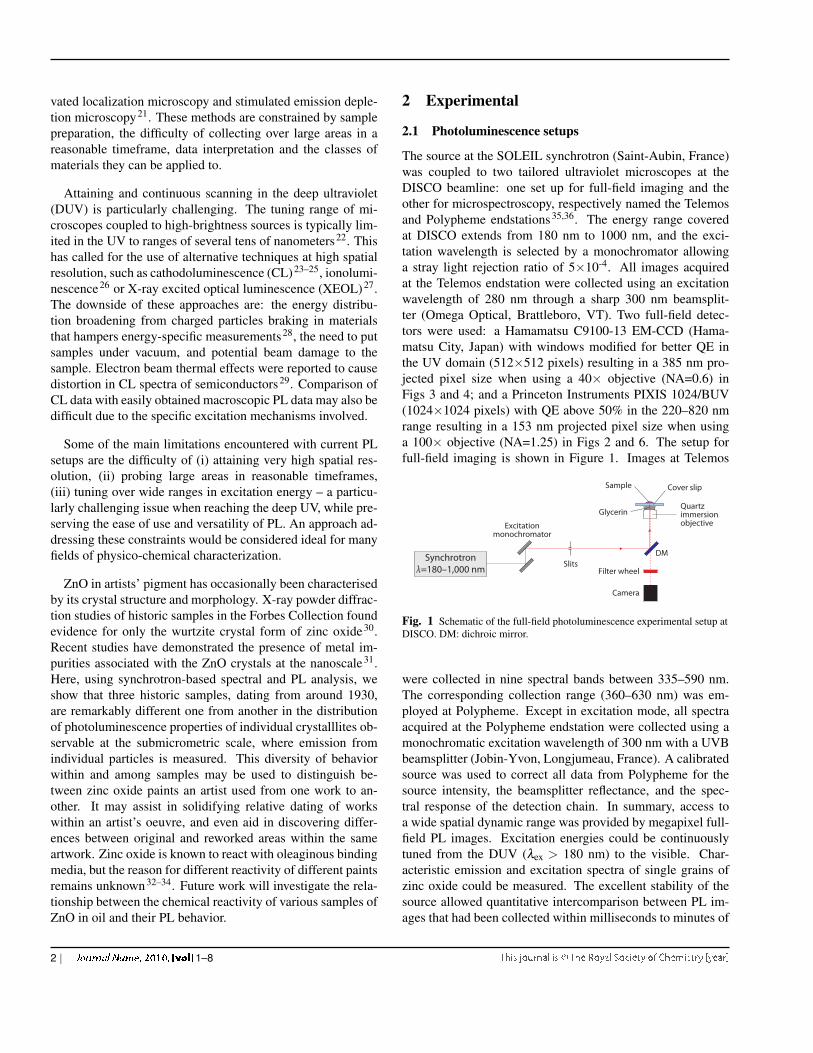
Fig. 2 Collection of photoluminescence signal under DUV excitation ata 153 nm projected pixel size. (a) 300×200 pixels area from a 1024×1024pixels false color RGB composite of powder 1.06.529 (scale bar: 2 µm).Colors correspond to the emission signal in the bands indicated in Methods.(b) Synchrotron full-field images of a zoomed area of powder 1.06.529obtained with the 100× objective showing the spectral variability of PLemission from submicrometric ZnO grains (scale bar: 500 nm). An intensityprofile along the yellow line shows that submicrometric objects can bedistinguished.
from lower energy peaks due to emission from various trappedstates within the band gap. When present, the latter tended tobe broad and centered at c. 425 nm and c. 510 nm. Fig. 3illustrates the false-colored images and associated spectra ob-tained for the three samples of ZnO that were studied. Thecolors used for mapping are associated with the wavelengthranges shown in Fig. 3d: blue for the band gap emission cen-tered at 380, green for emission centered around 425, and redfor emission centered around 510 nm. Identical intensity scal-ing allows visual intercomparison of the main associated emis-sions.
The major features of the synchrotron PL images are con-sistent with averaged spectra from synchrotron microspec-troscopy raster scans and macroscopic spectra (Figs 3d–f).The red hue of the image shown in Fig. 3c indicates a com-paratively strong contribution to the spectrum from emissionin the 490–510 nm range for powder ABK 8, while the bluehue of image in Fig. 3b illustrates that the predominant emis-sion from the majority of particles in 1.06.9 is near the band-edge at 380 nm. The similarity between the macroscopic PLspectra and those obtained using averaged synchrotron mi-
(a) 1.06.529
20 µm
(b) 1.06.9 (c) ABK 8
400 450 500 550
0.0
0.5
1.0
1.5
2.0
Wavelength (nm)
x1
(d)
400 450 500 550
0.0
0.5
1.0
1.5
2.0
Wavelength (nm)
x14.6
(e)
400 450 500 550
0.0
0.5
1.0
1.5
2.0
Wavelength (nm)
x53.9
(f)
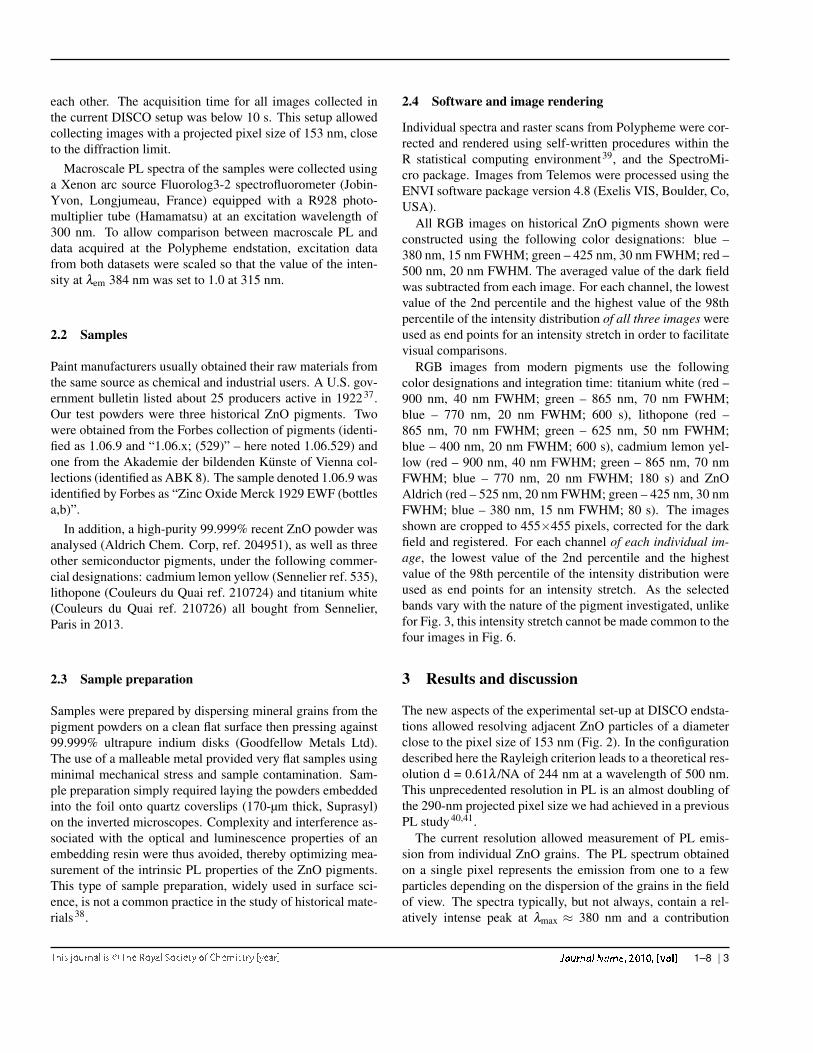
Fig. 3 Intercomparison of full-field UV PL images on a commonintensity scale. (a–c) Spatially-registered false-color RGB imagesconstructed from the synchrotron full-field multispectral imaging of the ZnOpowders using a 40× objective. In 1.06.9 (b), the box indicates the zonemapped in 4a. (d–f) Normalised average despiked spectra calculated fromraster-scan synchrotron PL measurements (thin lines) and despikedmacroscopic PL spectra of the three ZnO powders collected using thespectrofluorometer (thick lines). The relative variation in signal intensity atthe macroscale is indicated by the scaling factor.
crospectroscopy reveals that the scale of heterogeneity of theluminescence signal in these dispersed powders is less than20 µm. The PL images of the powders allow direct visualiza-tion of the heterogeneous distribution of the emission amongdispersed crystalline grains below this length scale. Powders1.06.529 and 1.06.9 contain numerous individual grains dis-tributed throughout the sample that exhibit strong lumines-cence in the 425-nm region. In 1.06.529, particles of diameterat or slightly above the submicrometric pixel size contributesignificantly to the emission spectrum in the 490–510 nm re-gion (Fig. 3a).
As just noted, the spectra of the three pigments studiedhere are rather different in the macroscale spectra as seen inFig. 3d–f. In addition, the spatial distribution of the lumi-nescent domains provides an additional source of informationfor further discrimination. For instance, the relative intensi-ties of band-edge and the two defect emissions observable inthe three images are very different among the powders whenmeasured at the submicrometer scale (Fig. 3a–c). SubmicronPL can therefore be employed as an additional critical markerfor characterization, and in our case for discriminating amongvarious samples of zinc oxide. A striking example is the ob-servation of grains luminescing in the 410–440 nm region inthe powder ABK 8. Although at the macroscale the contribu-
4 | 1–8
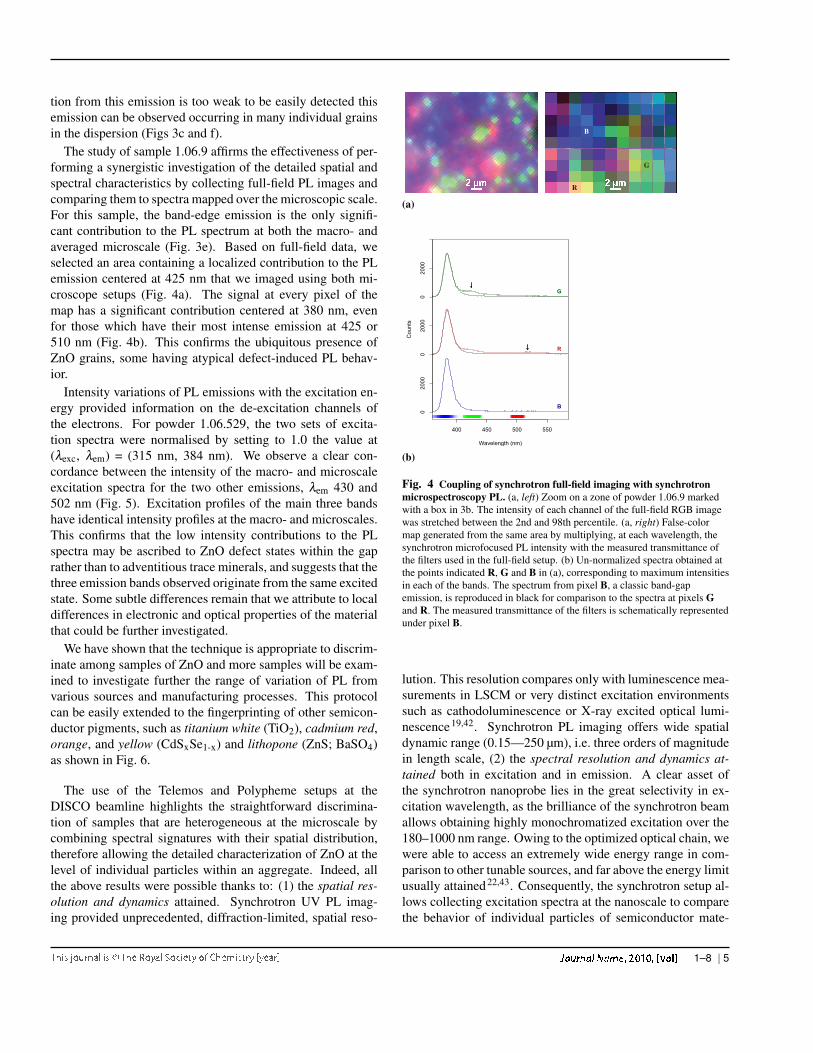
tion from this emission is too weak to be easily detected thisemission can be observed occurring in many individual grainsin the dispersion (Figs 3c and f).
The study of sample 1.06.9 affirms the effectiveness of per-forming a synergistic investigation of the detailed spatial andspectral characteristics by collecting full-field PL images andcomparing them to spectra mapped over the microscopic scale.For this sample, the band-edge emission is the only signifi-cant contribution to the PL spectrum at both the macro- andaveraged microscale (Fig. 3e). Based on full-field data, weselected an area containing a localized contribution to the PLemission centered at 425 nm that we imaged using both mi-croscope setups (Fig. 4a). The signal at every pixel of themap has a significant contribution centered at 380 nm, evenfor those which have their most intense emission at 425 or510 nm (Fig. 4b). This confirms the ubiquitous presence ofZnO grains, some having atypical defect-induced PL behav-ior.
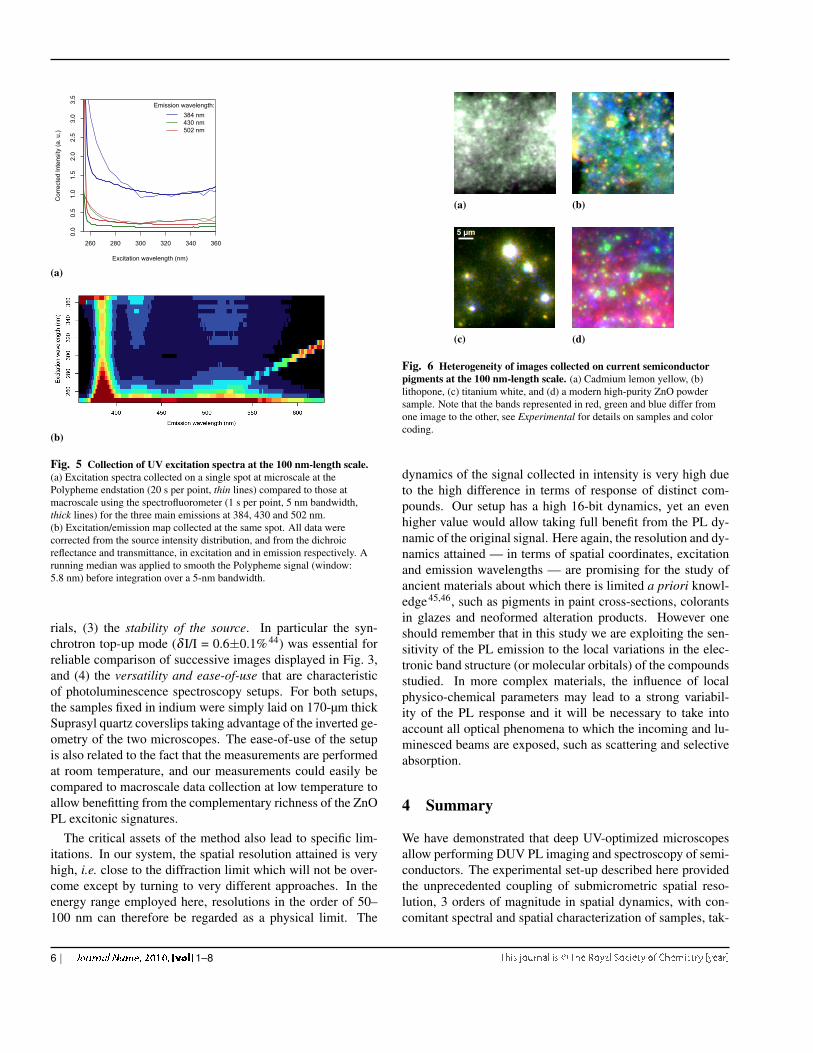
Intensity variations of PL emissions with the excitation en-ergy provided information on the de-excitation channels ofthe electrons. For powder 1.06.529, the two sets of excita-tion spectra were normalised by setting to 1.0 the value at(λexc, λem) = (315 nm, 384 nm). We observe a clear con-cordance between the intensity of the macro- and microscaleexcitation spectra for the two other emissions, λem 430 and502 nm (Fig. 5). Excitation profiles of the main three bandshave identical intensity profiles at the macro- and microscales.This confirms that the low intensity contributions to the PLspectra may be ascribed to ZnO defect states within the gaprather than to adventitious trace minerals, and suggests that thethree emission bands observed originate from the same excitedstate. Some subtle differences remain that we attribute to localdifferences in electronic and optical properties of the materialthat could be further investigated.
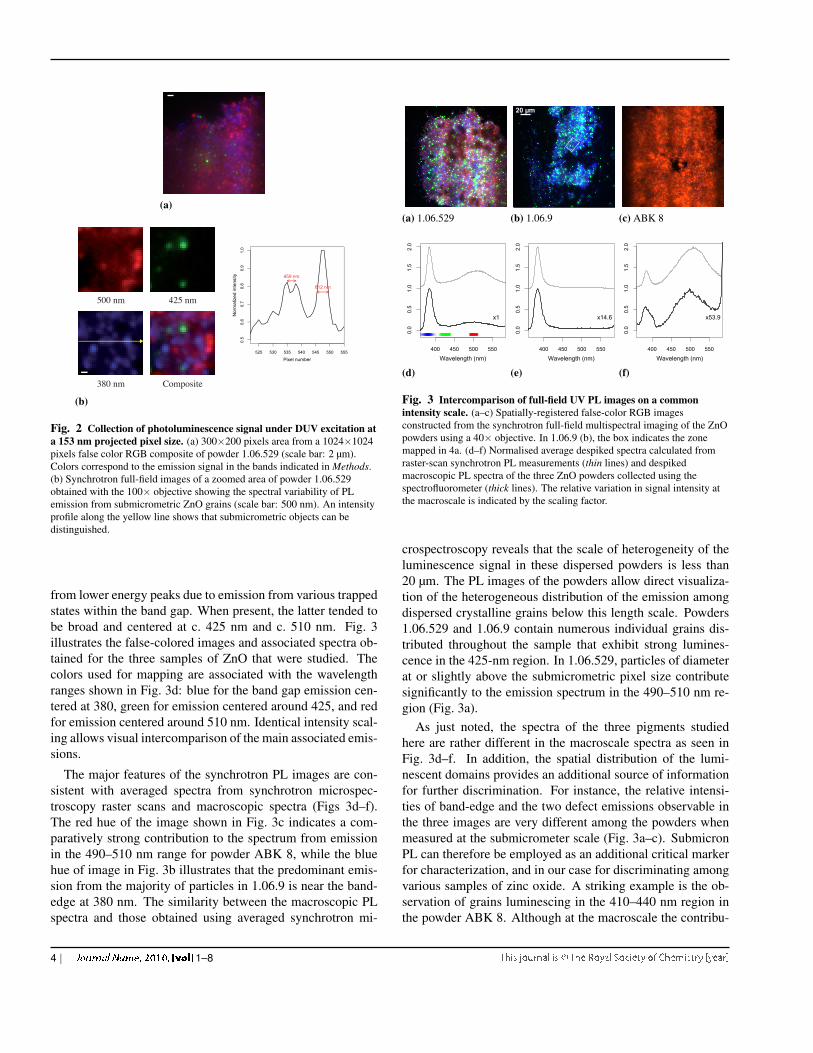
We have shown that the technique is appropriate to discrim-inate among samples of ZnO and more samples will be exam-ined to investigate further the range of variation of PL fromvarious sources and manufacturing processes. This protocolcan be easily extended to the fingerprinting of other semicon-ductor pigments, such as titanium white (TiO2), cadmium red,orange, and yellow (CdSxSe1-x) and lithopone (ZnS; BaSO4)as shown in Fig. 6.
The use of the Telemos and Polypheme setups at theDISCO beamline highlights the straightforward discrimina-tion of samples that are heterogeneous at the microscale bycombining spectral signatures with their spatial distribution,therefore allowing the detailed characterization of ZnO at thelevel of individual particles within an aggregate. Indeed, allthe above results were possible thanks to: (1) the spatial res-olution and dynamics attained. Synchrotron UV PL imag-ing provided unprecedented, diffraction-limited, spatial reso-
G
B
R
(a)
400 450 500 550
Wavelength (nm)
Counts
B
R
G
02000
02000
02000
(b)
Fig. 4 Coupling of synchrotron full-field imaging with synchrotronmicrospectroscopy PL. (a, left) Zoom on a zone of powder 1.06.9 markedwith a box in 3b. The intensity of each channel of the full-field RGB imagewas stretched between the 2nd and 98th percentile. (a, right) False-colormap generated from the same area by multiplying, at each wavelength, thesynchrotron microfocused PL intensity with the measured transmittance ofthe filters used in the full-field setup. (b) Un-normalized spectra obtained atthe points indicated R, G and B in (a), corresponding to maximum intensitiesin each of the bands. The spectrum from pixel B, a classic band-gapemission, is reproduced in black for comparison to the spectra at pixels Gand R. The measured transmittance of the filters is schematically representedunder pixel B.
lution. This resolution compares only with luminescence mea-surements in LSCM or very distinct excitation environmentssuch as cathodoluminescence or X-ray excited optical lumi-nescence19,42. Synchrotron PL imaging offers wide spatialdynamic range (0.15—250 µm), i.e. three orders of magnitudein length scale, (2) the spectral resolution and dynamics at-tained both in excitation and in emission. A clear asset ofthe synchrotron nanoprobe lies in the great selectivity in ex-citation wavelength, as the brilliance of the synchrotron beamallows obtaining highly monochromatized excitation over the180–1000 nm range. Owing to the optimized optical chain, wewere able to access an extremely wide energy range in com-parison to other tunable sources, and far above the energy limitusually attained22,43. Consequently, the synchrotron setup al-lows collecting excitation spectra at the nanoscale to comparethe behavior of individual particles of semiconductor mate-
1–8 | 5
260 280 300 320 340 360
0.0
0.5
1.0
1.5
2.0
2.5
3.0
3.5
Excitation wavelength (nm)
Cor
rect
ed In
tens
ity (a
. u.)
Emission wavelength:384 nm430 nm502 nm
(a)
(b)
Fig. 5 Collection of UV excitation spectra at the 100 nm-length scale.(a) Excitation spectra collected on a single spot at microscale at thePolypheme endstation (20 s per point, thin lines) compared to those atmacroscale using the spectrofluorometer (1 s per point, 5 nm bandwidth,thick lines) for the three main emissions at 384, 430 and 502 nm.(b) Excitation/emission map collected at the same spot. All data werecorrected from the source intensity distribution, and from the dichroicreflectance and transmittance, in excitation and in emission respectively. Arunning median was applied to smooth the Polypheme signal (window:5.8 nm) before integration over a 5-nm bandwidth.
rials, (3) the stability of the source. In particular the syn-chrotron top-up mode (δ I/I = 0.6±0.1%44) was essential forreliable comparison of successive images displayed in Fig. 3,and (4) the versatility and ease-of-use that are characteristicof photoluminescence spectroscopy setups. For both setups,the samples fixed in indium were simply laid on 170-µm thickSuprasyl quartz coverslips taking advantage of the inverted ge-ometry of the two microscopes. The ease-of-use of the setupis also related to the fact that the measurements are performedat room temperature, and our measurements could easily becompared to macroscale data collection at low temperature toallow benefitting from the complementary richness of the ZnOPL excitonic signatures.
The critical assets of the method also lead to specific lim-itations. In our system, the spatial resolution attained is veryhigh, i.e. close to the diffraction limit which will not be over-come except by turning to very different approaches. In theenergy range employed here, resolutions in the order of 50–100 nm can therefore be regarded as a physical limit. The
(a) (b)
5 µm
(c) (d)
Fig. 6 Heterogeneity of images collected on current semiconductorpigments at the 100 nm-length scale. (a) Cadmium lemon yellow, (b)lithopone, (c) titanium white, and (d) a modern high-purity ZnO powdersample. Note that the bands represented in red, green and blue differ fromone image to the other, see Experimental for details on samples and colorcoding.
dynamics of the signal collected in intensity is very high dueto the high difference in terms of response of distinct com-pounds. Our setup has a high 16-bit dynamics, yet an evenhigher value would allow taking full benefit from the PL dy-namic of the original signal. Here again, the resolution and dy-namics attained — in terms of spatial coordinates, excitationand emission wavelengths — are promising for the study ofancient materials about which there is limited a priori knowl-edge45,46, such as pigments in paint cross-sections, colorantsin glazes and neoformed alteration products. However oneshould remember that in this study we are exploiting the sen-sitivity of the PL emission to the local variations in the elec-tronic band structure (or molecular orbitals) of the compoundsstudied. In more complex materials, the influence of localphysico-chemical parameters may lead to a strong variabil-ity of the PL response and it will be necessary to take intoaccount all optical phenomena to which the incoming and lu-minesced beams are exposed, such as scattering and selectiveabsorption.
4 Summary
We have demonstrated that deep UV-optimized microscopesallow performing DUV PL imaging and spectroscopy of semi-conductors. The experimental set-up described here providedthe unprecedented coupling of submicrometric spatial reso-lution, 3 orders of magnitude in spatial dynamics, with con-comitant spectral and spatial characterization of samples, tak-
6 | 1–8
ing full benefit of the stability of the source and its tunabilityin the 180–1000 nm excitation range. Our system providesthe ability for straightforward full PL characterization of het-erogeneous samples by combining spectral information withhigh spatial location. Application to the study of ZnO powdersdemonstrated that access to this resolution thus far inaccessi-ble with conventional PL in the DUV allowed straightforwardvisualization, comparison, and study of the luminescencefrom individual mineral grains. We showed that historical zincwhite powders that appear homogeneous at the macroscale arehighly heterogeneous at the micro- and nanoscales, and aredistinctly different from one another in that the relative inten-sities of the band-edge and the two defect-associated emis-sions observed at the submicrometer scale are very different.Our ability to image at the nanoscale allows deeper prob-ing of the microscale heterogeneity. Submicron PL has beenshown to be very promising to become a critical methodologyfor characterizing and, in this case, for discriminating amongsources of the historical pigment zinc oxide.
Acknowledgements
We thank Prof. Pierre Laszlo for his critical reading of the text.We are particularly grateful to M.-A. Languille (IPANEMA),S. Kascakova and F. Jamme (DISCO, SOLEIL) for their help-ful comments, and to T. Severin-Fabiani, P. Gueriau andM. Didier for their assistance in collecting data. Beam-time was funded by Synchrotron SOLEIL under projects No.20100754 and 20110971. The ‘R’ SpectroMicro package wasdeveloped by S. Cohen (IPANEMA). We thank A. Maıtre andW. Daney de Marcillac for access to the spectrofluorometer atINSP Paris. This research is part of a larger program on his-torical pigments for which we thank the following institutionsfor providing samples: the Straus Center for Conservationand Technical Studies, Harvard Art Museums (sample ForbesPigment Collection inv. 1.06.9), the Museum of Fine Arts ofBoston (sample Forbes Pigment Collection inv. 1.06.529), andthe Akademie der bildenden Kunste of Vienna (sample inv.ABK 8).
References1 H. Kuhn, in Artists’ Pigments: A Handbook of their History and Charac-
teristics. vol. I, ed. R. L. Feller, National Gallery of Art, Washington, DC,1986, pp. 169–186.
2 K. Muir, G. Gautier, F. Casadio and A. Vila, Proc. 16th ICOM-CC trien-nial conf., Lisbon, Portugal, Sept. 19–23, 2011, 2011.
3 W. Yates, The Pennsylvania Magazine of History and Biography, 1974,98, 469–514.
4 P. Fleury, The Preparation and Uses of White Zinc Paints, Scott, Green-wood & Son, London, 1912.
5 J. Cruickshank Smith and A. P. Laurie, in Oxide of Zinc: its nature, prop-erties & uses, with special reference to the making and application ofpaint, Trade Papers Publishing, London, UK, 1909, ch. 1.
6 Z. R. Tian, J. A. Voigt, J. Liu, B. McKenzie, M. J. McDermott, M. Ro-driguez, H. Konishi and H. Xu, Nat. Mater., 2003, 2, 821–826.
7 A. B. Djurisic and Y. H. Leung, Small, 2006, 2, 944–961.8 C. Klingshirn, J. Fallert, H. Zhou, J. Sartor, C. Thiele, F. Maier-Flaig,
D. Schneider and H. Kalt, Phys. Stat. Sol. (b), 2010, 247, 1424–1447.9 I. Pelant and J. Valenta, Luminescence Spectroscopy of Semiconductors,
Oxford University Press, 2012.10 D. Li, Y. H. Leung, A. B. Djurisic, Z. T. Liu, M. H. Xie, S. L. Shi, S. J.
Xu and W. K. Chan, Appl. Phys. Lett., 2004, 85, 1601–1603.11 Z. L. Wang, J. Phys.: Condens. Matter, 2004, 16, R829–R858.12 C. Miliani, A. Sgamellotti, K. Kahrim, B. G. Brunetti, A. Aldrovandi,
M. R. van Bommel, K. J. van den Berg and H. Janssen, Proc. 15th ICOM-CC triennial triennial meeting, New Delhi, India, 2008, pp. 244–251.
13 F. S. Welsh, APT Bull.: J. Preserv. Technol., 2008, 39, 17–30.14 E. R. de la Rie, Stud. Conserv., 1982, 27, 1–7.15 T. Miyoshi, M. Ikeya, S. Kinoshita and T. Kushida, Jap. J. Appl. Phys.,
1982, 21, 1032–1036.16 I. Borgia, R. Fantoni, C. Flamini, T. M. D. Palma, A. G. Guidoni and
A. Mele, Appl. Surf. Sci., 1998, 127–129, 95–100.17 C. Clementi, F. Rosi, A. Romani, R. Vivani, B. G. Brunetti and C. Miliani,
Appl. Spectrosc., 2012, 66, 1233–1241.18 J. Wang, M. S. Gudiksen, X. Duan, Y. Cui and C. M. Lieber, Science,
2001, 293, 1455–1457.19 K. Okamoto, A. Kaneta, Y. Kawakami, S. Fujita, J. Choi, M. Terazima
and T. Mukai, J. Appl. Phys., 2005, 98, 064503.20 K. Matsuda, T. Saiki, S. Nomura, M. Mihara and Y. Aoyagi, Appl. Phys.
Lett., 2002, 81, 2291.21 J. Folling, M. Bossi, H. Bock, R. Medda, C. Wurm, B. Hein, S. Jakobs,
C. Eggeling and S. Hell, Nat. Meth., 2008, 5, 943–945.22 F. Trager, in Springer handbook of lasers and optics, Springer Verlag, 2nd
edn., 2012, ch. 11, pp. 641–1046.23 Y. M. Oh, K. M. Lee, K. H. Park, Y. Kim, Y. H. Ahn, J.-Y. Park and
S. Lee, Nano Lett., 2007, 7, 3681–3685.24 J. Bubendorff, J. Ebothe, A. El Hichou, R. Dounia and M. Addou, J. Appl.
Phys., 2006, 100, 014505–014505.25 A. El Hichou, A. Bougrine, J. L. Bubendorff, J. Ebothe, M. Addou and
M. Troyon, Semicond. Sci. Technol., 2002, 17, 607–613.26 A. Quaranta, J.-C. Dran, J. Salomon, M. Tonezzer, C. Scian, L. Beck,
S. Carturan, G. Maggioni and G. Della Mea, Nucl. Instrum. Meth. B,2008, 266, 2301–2305.
27 L. Armelao, F. Heigl, A. Jurgensen, R. I. R. Blyth, T. Regier, X.-T. Zhouand T. K. Sham, J. Phys. Chem. C, 2007, 111, 10194–10200.
28 Cathodoluminescence and its Application in the Planetary Sciences, ed.A. Gucsik, Springer-Verlag, Berlin, Heidelberg, 2009.
29 M. R. Phillips, O. Gelhausen and E. M. Goldys, Phys. Stat. Sol. (a), 2004,201, 229–234.
30 G. W. Carriveau and D. Omecinsky, J. Am. Inst. Cons., 1983, 22, 68–81.31 F. Casadio and V. Rose, New Tools Open New Frontiers in Paint Analysis:
hard x-ray nanoprobe applications to the paints of Pablo Picasso, Oralconference at SR2A 2012, Int. Conf. on Synchrotron Radiation in Art andArchaeology, New-York, USA, 5–8 June, 2012, 2012.
32 R. Mazzeo, S. Prati, M. Quaranta, E. Joseph, E. Kendix and M. Galeotti,Analytical and bioanalytical chemistry, 2008, 392, 65–76.
33 G. Gautier, A. Bezur, K. Muir, F. Casadio and I. Fiedler, Appl. Spectrosc.,2009, 63, 597–603.
34 G. Osmond, J. J. Boon, L. Puskar and J. Drennan, Appl. Spectrosc., 2012,66, 1136–1144.
35 A. Giuliani, F. Jamme, V. Rouam, F. Wien, J.-L. Giorgetta, B. Lagarde,O. Chubar, S. Bac, I. Yao, S. Rey, C. Herbeaux, J.-L. Marlats, D. Zerbib,F. Polack and M. Refregiers, J. Synchrotron Rad., 2009, 16, 835–841.
36 F. Jamme, S. Villette, A. Giuliani, V. Rouam, F. Wien, B. Lagarde andM. Refregiers, Microsc. Microanal., 2010, 16, 507–514.
1–8 | 7
37 C. E. Siebenthal and A. Stoll, in Lead and Zinc Pigments and Salts in1922, U.S. Geol. Survey, Mineral Resources, Washington, 1923, pp. 77–85.
38 M. Derrick, L. Souza, T. Kieslich, H. Florsheim and D. Stulik, J. Am. Inst.Cons., 1994, 33, 227–245.
39 R Development Core Team, R: A Language and Environment for Statisti-cal Computing, R Foundation for Statistical Computing, Vienna, Austria,2011.
40 M. Thoury, J.-P. Echard, M. Refregiers, B. Berrie, A. Nevin, F. Jammeand L. Bertrand, Anal. Chem., 2011, 83, 1737–1745.
41 L. Bertrand, M. Cotte, M. Stampanoni, M. Thoury, F. Marone andS. Schoder, Phys. Rep., 2012, 519, 51–96.
42 H. Petty, Microscopy research and technique, 2007, 70, 687–709.43 B. J. Zeskind, C. D. Jordan, W. Timp, L. Trapani, G. Waller, V. Horodincu,
D. J. Ehrlich and P. Matsudaira, Nat. Meth., 2007, 4, 567–569.44 J. M. Filhol, A. Nadji, J. Besson, P. Brunelle, L. Cassinari, M.-E. Cou-
prie, J.-C. Denard, C. Herbeaux, N. Hubert, J.-F. Lamarre, P. Lebasque,M. Level, P. Marchand and R. Nagaoka, Proc. IPAC’10, May 23–28,2010, Kyoto, Japan, 2010, pp. 2493–2495.
45 G. Spoto, A. Torrisi and A. Contino, Chem. Soc. Rev., 2000, 29, 429–439.46 L. Bertrand, M. Thoury and E. Anheim, J. Cult. Heritage, 2012.
8 | 1–8