a modelling framework for addressing the synergies between global conventions through land use...
TRANSCRIPT
This paper can be downloaded without charge at:
The Fondazione Eni Enrico Mattei Note di Lavoro Series Index: http://www.feem.it/Feem/Pub/Publications/WPapers/default.htm
Social Science Research Network Electronic Paper Collection:
http://ssrn.com/abstract=976600
The opinions expressed in this paper do not necessarily reflect the position of Fondazione Eni Enrico Mattei
Corso Magenta, 63, 20123 Milano (I), web site: www.feem.it, e-mail: [email protected]
A Modelling Framework for Addressing the Synergies between Global
Conventions through Land Use Changes: Carbon Sequestration, Biodiversity
Conservation, Prevention of Land Degradation and Food Security in Agricultural and Forested
Lands in Developing Countries Raul Ponce-Hernandez
NOTA DI LAVORO 30.2007
MARCH 2007 CCMP – Climate Change Modelling and Policy
Raul Ponce-Hernandez, Environmental and Resource Studies Program and Department of Geography, Trent University
A Modelling Framework for Addressing the Synergies between Global Conventions through Land Use Changes: Carbon Sequestration, Biodiversity Conservation, Prevention of Land Degradation and Food Security in Agricultural and Forested Lands in Developing Countries Summary This paper proposed a methodological framework for the assessment of carbon stocks and the development and identification of land use, land use change and land management scenarios, whereby enhancing carbon sequestration synergistically increases biodiversity, the prevention of land degradation and food security through the increases in crop yields. The framework integrates satellite image interpretation, computer modelling tools (i.e. software customization of off-the-shelf soil organic matter turnover simulation models) and Geographical Information Systems (GIS). The framework addresses directly and indirectly the cross-cutting ecological concerns foci of major global conventions: climate change, biodiversity, the combat of desertification and food security. Their synergies are targeted by providing procedures for assessing and identifying simultaneously carbon sinks, potential increases in plant diversity, measures to prevent land degradation and enhancements in food security through crop yields, implicit in each land use change and land management scenario. The scenarios aim at providing “win-win” options to decision makers through the framework’s decision support tools. Issues concerning complex model parameterization and spatial representation were tackled through tight coupling soil carbon models to GIS via software customization. Results of applying the framework in the field in two developing countries indicate that reasonably accurate estimates of carbon sequestration can be obtained through modeling; and that alternative best soil organic matter management practices that arrest shifting “slash-and-burn” cultivation and prevent burning and emissions, can be identified. Such options also result in increased crop yields and food security for an average family size in the area, while enhancing biodiversity and preventing land degradation. These options demonstrate that the judicious management of organic matter is central to greenhouse gas mitigation and the attainment of synergistic ecological benefits, which is the concern of global conventions. The framework is to be further developed through successive approximations and refinement in future, extending its applicability to other landscapes. Keywords: Climate Change, Greenhouse Gas Mitigation, Carbon Sequestration, Soil Organic Matter, Modeling, Land-Use Change, Land Management, Ecological Synergies, Agriculture JEL Classification: C15, C21, Q1, Q15, Q24
This paper was presented at the Workshop on “Climate Mitigation Measures in the Agro-Forestry Sector and Biodiversity Futures”, Trieste, 16-17 October 2006 and jointly organised by The Ecological and Environmental Economics - EEE Programme, The Abdus Salam International Centre for Theoretical Physics - ICTP, UNESCO Man and the Biosphere Programme - MAB, and The International Institute for Applied Systems Analysis - IIASA.
Address for correspondence: Raul Ponce-Hernandez Environmental and Resource Studies Program and Department of Geography Trent University Peterborough Ontario Canada E-mail: [email protected]
2
Introduction
The validation of standard methodologies for carbon stock inventories that incorporate “sinks” projects
must be solved satisfactorily, if practical implementations of the mechanisms of the Protocol are to be
effective. In particular, the implementation of projects to promote carbon “sinks” in non-annex I countries,
under the Clean Development Mechanism (CDM). Standard methods and procedures for the inventory and
monitoring of carbon stocks and carbon sequestration in both, current and potential land use systems, for
all situations of data and technical and ecological circumstances, must be validated and certified. Else, the
variability of assessment methods and their uncertainties may hamper carbon transactions from field-
implemented “sinks” projects. Deliberate land management actions that enhance the sequestration of CO2 or reduce its emissions have the potential to remove a significant amount of CO2 from the atmosphere over
the short and medium term.
Equitable ways of accounting for carbon sinks and reward activities that increase the amount of carbon
stored in terrestrial ecosystems require of standard procedures and methods. The challenge remains; a
commonly agreed and scientifically sound, yet flexible methodological framework must be in place for
assessment, monitoring and verification purposes, part of any carbon trading transactions involving afforestation and reforestation activities under the Clean Development Mechanism of the Kyoto Protocol.
Under “sinks” projects, on the one hand, land use changes pursuing the fast accrual of biomass and soil
organic matter can have adverse impacts on biodiversity and may even accelerate land degradation; if for
example the intent is to encourage only mono-cropping with one or a few carbon-sequestration efficient
species. On the other hand, afforestation / reforestation, land use change and land management activities
can also be designed so that they may be potential contributors to biodiversity conservation (Secretariat of
the Convention on Biological Diversity, 2003). Therefore, such activities depending on their concrete
design have the chance to simultaneously contribute to the Kyoto Protocol, to the Convention on
Biological Diversity (CBD) and the Convention to Combat Desertification (CCD). To achieve these
synergies, issues such as the integration of biodiversity considerations and land degradation in the
implementation of the Kyoto Protocol through sinks projects must be fully achieved and documented.
Measures promoting carbon sequestration, biodiversity conservation and prevention of land degradation
are expected to have other positive effects such as the increase in crop yields improving local food
security, and help in alleviating rural poverty (FAO, 1999). In this paper the development and testing of a
proposed framework of methods and procedures is described. The framework allows for measuring and
inventorying carbon stocks in biomass and in soil, and for generating projections of carbon sequestration
potential, resulting from land use changes and associated land management regimes, while considering
their effects on biodiversity, land degradation and crop yields. Such kind of methodological framework has been the concern of agencies such as the FAO of the UN and others in the last few years (FAO, 1999).
The results of practical application of the framework in two contrasting pilot areas in Latin America (i.e.
Mexico) are presented. It is also shown that the framework and tools proved quite useful in generating and
identifying favorable scenarios of land use change and land management. In particular, it was
demonstrated that soil organic matter plays a central role in arresting and stabilizing shifting “slash-and-
burn” cultivation into permanent agriculture through sequestering carbon in soils over time, enhancing biodiversity, increasing crop yields and producing sufficient amounts of staple foods to meet the
requirements of an average family size in the area studied.
The Methodological Framework
The framework consists of methods for assessing the present status of carbon stocks in current land use
systems, and those of plant diversity and land degradation.
3
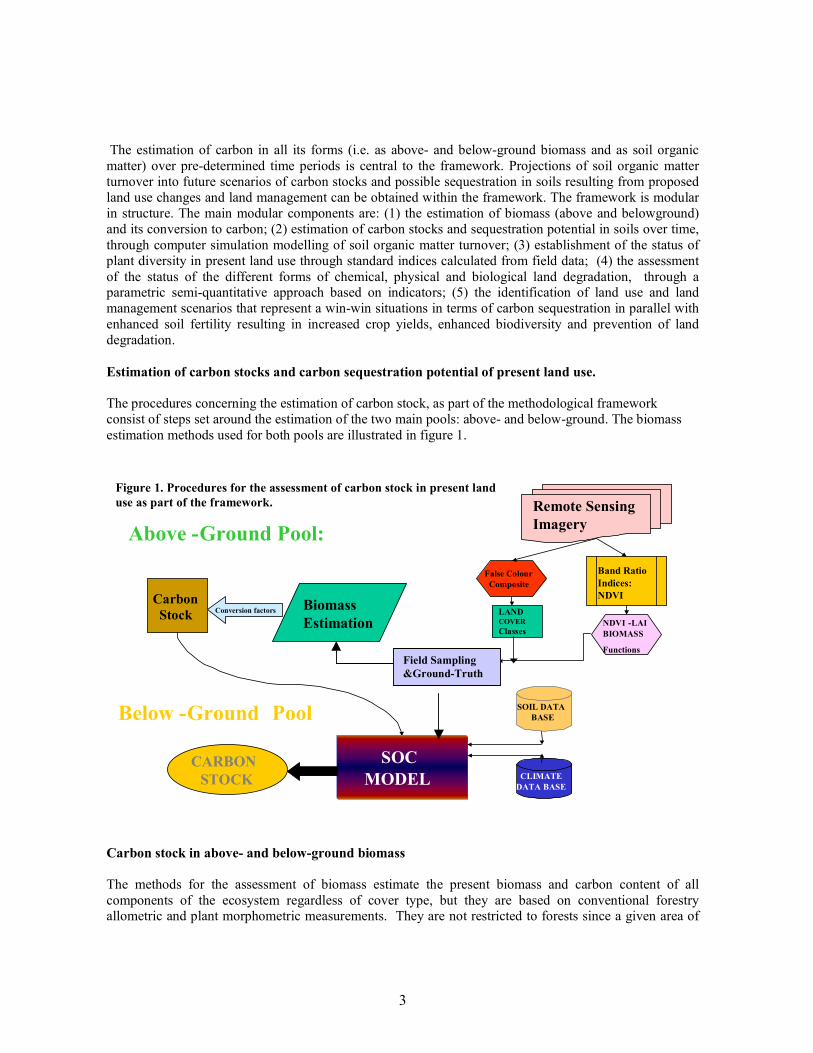
The estimation of carbon in all its forms (i.e. as above- and below-ground biomass and as soil organic
matter) over pre-determined time periods is central to the framework. Projections of soil organic matter
turnover into future scenarios of carbon stocks and possible sequestration in soils resulting from proposed
land use changes and land management can be obtained within the framework. The framework is modular
in structure. The main modular components are: (1) the estimation of biomass (above and belowground)
and its conversion to carbon; (2) estimation of carbon stocks and sequestration potential in soils over time,
through computer simulation modelling of soil organic matter turnover; (3) establishment of the status of
plant diversity in present land use through standard indices calculated from field data; (4) the assessment
of the status of the different forms of chemical, physical and biological land degradation, through a parametric semi-quantitative approach based on indicators; (5) the identification of land use and land
management scenarios that represent a win-win situations in terms of carbon sequestration in parallel with
enhanced soil fertility resulting in increased crop yields, enhanced biodiversity and prevention of land
degradation.
Estimation of carbon stocks and carbon sequestration potential of present land use.
The procedures concerning the estimation of carbon stock, as part of the methodological framework
consist of steps set around the estimation of the two main pools: above- and below-ground. The biomass
estimation methods used for both pools are illustrated in figure 1.
Carbon stock in above- and below-ground biomass
The methods for the assessment of biomass estimate the present biomass and carbon content of all
components of the ecosystem regardless of cover type, but they are based on conventional forestry allometric and plant morphometric measurements. They are not restricted to forests since a given area of
Above - Ground Pool:
Below - Ground Pool
Biomass Estimation
Remote Sensing Imagery
False Colour Composite Band Ratio
Indices: NDVI
LAND COVER Classes NDVI - LAI
BIOMASS Functions
Carbon Stock Conversion factors
SOC MODEL
SOIL DATA BASE
CLIMATE DATA BASE
CARBON STOCK
Figure 1. Procedures for the assessment of carbon stock in present land
use as part of the framework.
Field Sampling
&Ground-Truth
4
study may be a landscape consisting of a patchwork of woodlots, grasslands and croplands, with the latter
dominating in predominantly agricultural areas. The live mass above and below ground of trees, shrubs,
palms, saplings and debris, as well as the herbaceous layer on the floor and in the soil are considered. The
greatest fraction of the total above-ground biomass is represented by these components and, generally
speaking, their estimation doest not represent many logistic problems.(Brown, 1997). Remote sensing
imagery have proven to be extremely useful in regional carbon stock inventories and estimation of carbon
fluxes (Ahern et al, 1991; Running, et al, 1994; Foody et al, 1996; Fazakas et al, 1999; Houghton et al, 2001; Friedl, et al, 2002; Joint Research Centre, 2003 ), but their use is also of value in local inventories
(Ponce-Hernandez, 1999; Nelson et al, 2000). In local assessments, remotes sensing has proven useful in
several ways, including: (a) the estimation of above-ground biomass, indirectly, through quantitative relationships between band-ratio indices (e.g. NDVI, GVI, etc.) with measures of biomass or with
parameters directly related to biomass (e.g. Leaf Area Index, LAI). (b) Classification of vegetation cover
and generation of a vegetation types map. This partitions spatial variability of vegetation into relatively
uniform classes, which can be used as sampling framework for the location of ground measurement sites
and the identification of plant species. (c) As up-scaling mechanism using mapped vegetation classes with
reasonable internal uniformity as interpolating means, or to facilitate the application of spatial interpolation
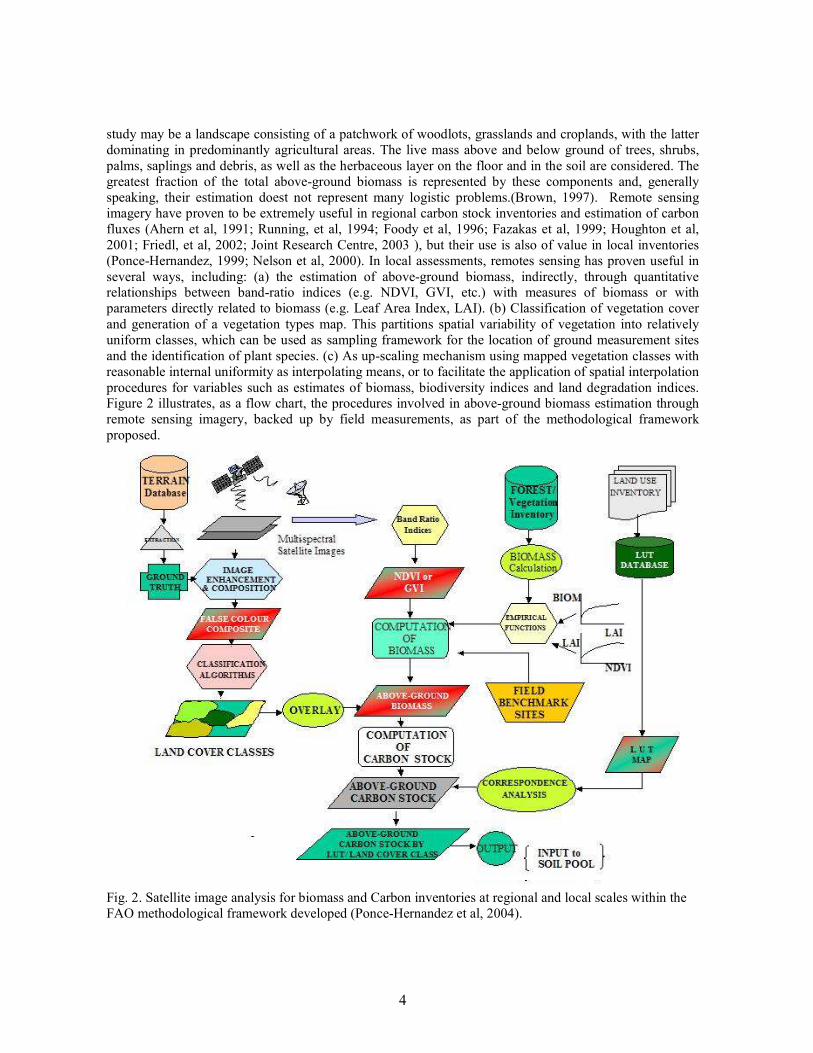
procedures for variables such as estimates of biomass, biodiversity indices and land degradation indices. Figure 2 illustrates, as a flow chart, the procedures involved in above-ground biomass estimation through
remote sensing imagery, backed up by field measurements, as part of the methodological framework
proposed.
Fig. 2. Satellite image analysis for biomass and Carbon inventories at regional and local scales within the
FAO methodological framework developed (Ponce-Hernandez et al, 2004).
5
Procedures for Field Sampling and Ground-truth: Multi-purpose field survey and sampling design
A multipurpose field sampling design is recommended in the framework to achieve efficiencies in data
collection and minimize costs. The same sites are used for obtaining measurements of above-ground
biomass, for estimation of biodiversity and for land degradation assessment via indicators. Sampling
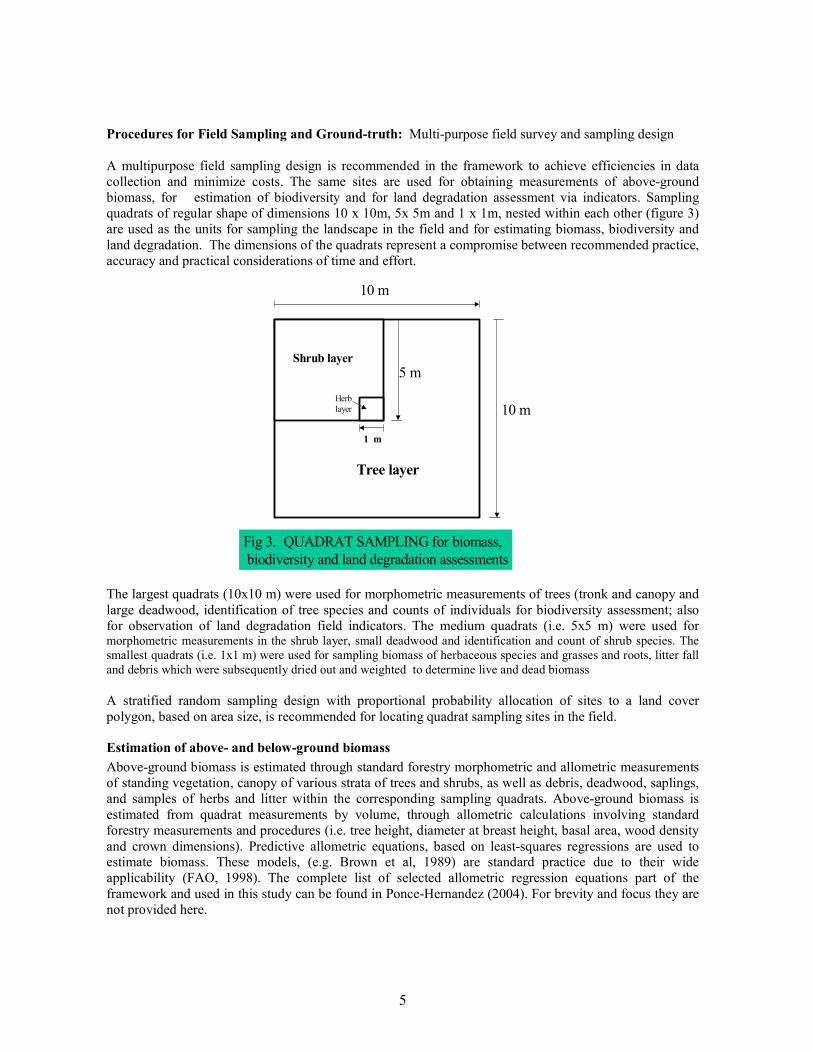
quadrats of regular shape of dimensions 10 x 10m, 5x 5m and 1 x 1m, nested within each other (figure 3)
are used as the units for sampling the landscape in the field and for estimating biomass, biodiversity and
land degradation. The dimensions of the quadrats represent a compromise between recommended practice,
accuracy and practical considerations of time and effort.
The largest quadrats (10x10 m) were used for morphometric measurements of trees (tronk and canopy and
large deadwood, identification of tree species and counts of individuals for biodiversity assessment; also
for observation of land degradation field indicators. The medium quadrats (i.e. 5x5 m) were used for morphometric measurements in the shrub layer, small deadwood and identification and count of shrub species. The
smallest quadrats (i.e. 1x1 m) were used for sampling biomass of herbaceous species and grasses and roots, litter fall
and debris which were subsequently dried out and weighted to determine live and dead biomass
A stratified random sampling design with proportional probability allocation of sites to a land cover
polygon, based on area size, is recommended for locating quadrat sampling sites in the field.
Estimation of above- and below-ground biomass
Above-ground biomass is estimated through standard forestry morphometric and allometric measurements
of standing vegetation, canopy of various strata of trees and shrubs, as well as debris, deadwood, saplings,
and samples of herbs and litter within the corresponding sampling quadrats. Above-ground biomass is
estimated from quadrat measurements by volume, through allometric calculations involving standard
forestry measurements and procedures (i.e. tree height, diameter at breast height, basal area, wood density
and crown dimensions). Predictive allometric equations, based on least-squares regressions are used to estimate biomass. These models, (e.g. Brown et al, 1989) are standard practice due to their wide
applicability (FAO, 1998). The complete list of selected allometric regression equations part of the
framework and used in this study can be found in Ponce-Hernandez (2004). For brevity and focus they are
not provided here.
1 m
5 m
10 m
Fig 3. QUADRAT SAMPLING for biomass,
biodiversity and land degradation assessments
Tree layer
Shrub layer
Herb
layer 10 m
6
Depending on the type of forest and the ecological condition in turn, above-ground biomass can be
estimated by applying the corresponding allometric regression equation. Total biomass is calculated for
each tree in the sample quadrat by the addition of the trunk and crown biomass estimates, then summing up
the results for all trees in the sample quadrat (kg/100m2) converted to tonnes per hectare. To the tree
biomass estimate in the 10 x 10m quadrat, the estimates from shrubs, deadwood and debris measured in the
nested 5 x 5m quadrat are added. The herbaceous layer, the litter and other organic debris collected in the
field from the 1x1m quadrat are taken to the laboratory, dried out and weighted. The surface dry organic
matter estimate per m2 is added to the estimates of total above-ground biomass for each of the field
sampling sites (10x10m quadrats). Below-ground biomass is estimated from root biomass as a function of
above-ground biomass by non-destructive methods. These are based on calculations of below-ground biomass for similar types of vegetation and conversion coefficients (see Ponce-Hernandez, 2004 for
details). For agro-ecosystems the estimation of biomass makes sense only as the fraction of crop residues
added back to the soil and not removed, used as animal feed, or for any other non-destructive use,
discounting the harvest fraction. Crop growth computer models (De Wit et al, 1978; Van Diepen et al,
1989; Jones et al, 1991) are used to project estimates of biomass into the future, when an estimate is
required. Thus, average expected crop yields and crop residue production are used as indicators of biomass
production in crops.
Estimation of the status of biodiversity.
Biodiversity is a complex multi-scale and inclusive concept. Operationally, the diversity of plant and
animal species is to be considered from that at the genetic level to that of habitats and landscapes. This
complexity and the ambulatory nature of animals makes it difficult to consider biodiversity in its broadest
sense for rapid assessments on the ground, particularly when assessments of carbon sequestration may only
be concerned with direct effects to plant diversity. It is for these reasons that relatively expedite
assessments are required within the framework proposed, therefore, only plant diversity is considered.
Thus, biodiversity in the context of the framework is limited, in the examples in this paper, as plant
diversity. A number of quantitative indices have been designed to provide information on the various
aspects of biodiversity in landscapes. The most common are listed in Magurran (1988). Of this set, only
three were applied to the case studies, notably: the total number of species or species richness (S); Species
abundance from the Simpson’s diversity index; and species evenness from the Shannon information index.
These indices can be computed readily from species counts in the sampling quadrats, and an automated
template customized within a spreadsheet software, was designed and used in the filed for the case studies.
These indices are standard in the landscape ecology literature (e.g. Magurran, 1988; Whittaker, 1972).
Plant species are identified and counted for calculation of these biodiversity indices. Alfa and Beta plant
diversity (Whittaker, 1972) are determined by calculating standard indices from field surveys and species
counts (Hernandez-Stefanoni and Ponce-Hernandez, 2003). In some instances, due to practical constraints, it is not possible to collect, for the purpose of plant identification, plants with all the morphological
components needed for identification in a herbarium. Therefore, the indigenous knowledge of local folk
can be used to identify plant species using local names.
For the purposes of identifying the optimal sample size, an interactive approach is suggested. Pielou’s
pooled quadrat method (Magurran, 1988) is used to calculate the number of samples needed in the
landscape in order to produce reliable estimates of the status of biodiversity in the area. The method consists of taking a sample of one quadrat at a time and incrementally and interactively calculating the
diversity values (indices) in the quadrats entered, monitoring the number of samples after which gains in
the values of the indices are negligible or nil (i.e. the curve of the index becomes asymptotic to the axis of
the number of samples). In practice, since the sampling sites are multi-purpose sites, the final number of
sampling sites will be a compromise between the factors mentioned above and considerations related to
biomass estimation and land degradation assessment.
7
The methodological framework includes links to GIS of the plant diversity indices calculated by each
sampling quadrat from the customized template, to enable display of the spatial variability of these indices.
This is achieved by either, spatial interpolation of point-estimates (where the quadrats represent points on
the landscape), or by generalization of average values from quadrats to map units representing vegetation
classes. This is a typical problem of up-scaling of estimates of environmental variables.
Land degradation assessment.
To perform the assessment of land degradation assessment within the framework, a parametric semi-
quantitative approach is adopted using a set of indicator variables from those proposed in the FAO/UNEP methodology (FAO, 1978). The approach is based on the observation of parameters that are directly related
to physical, chemical and biological processes of land degradation, through their most visible indicators,
which are related to the same land degradation processes. The main aim of the assessment is to obtain a
picture of the current status of degradation of the land in expedite, low-cost and useful manner with little
demand for either, specific expertise in modelling or on data. The fundamental premise of the approach is
that by observing diagnostic parameters or indicators of climate, soil, topography and human factors in any
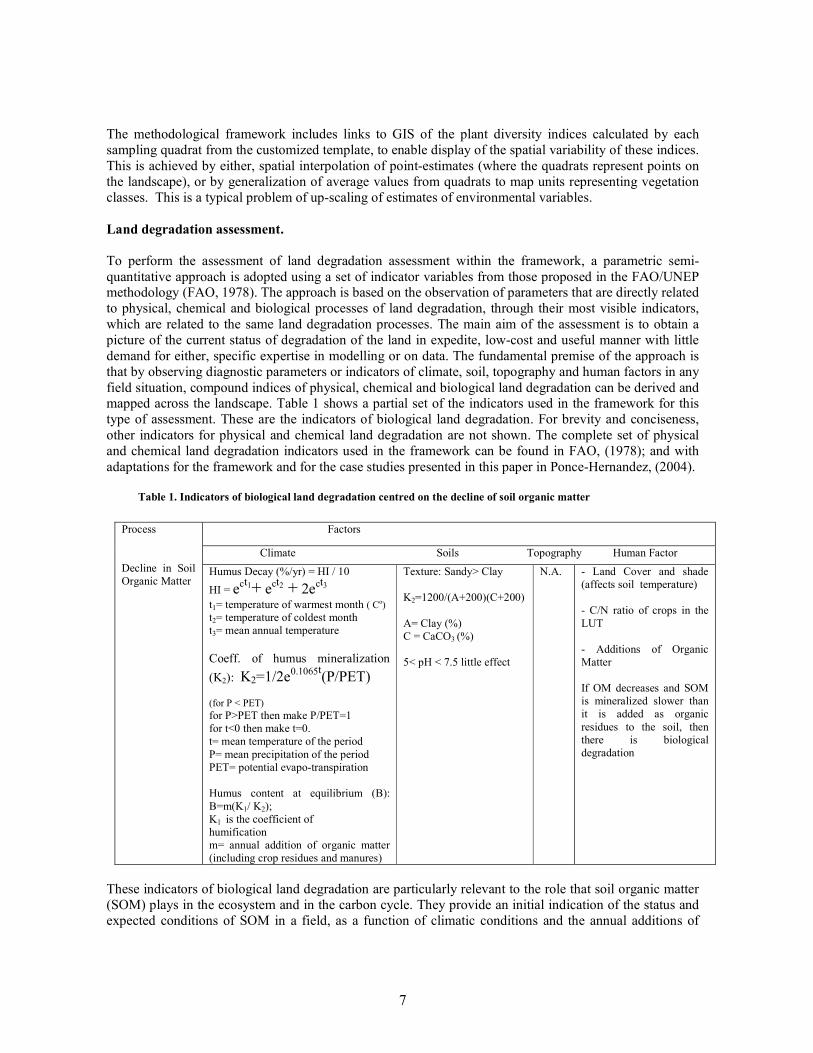
field situation, compound indices of physical, chemical and biological land degradation can be derived and mapped across the landscape. Table 1 shows a partial set of the indicators used in the framework for this
type of assessment. These are the indicators of biological land degradation. For brevity and conciseness,
other indicators for physical and chemical land degradation are not shown. The complete set of physical
and chemical land degradation indicators used in the framework can be found in FAO, (1978); and with
adaptations for the framework and for the case studies presented in this paper in Ponce-Hernandez, (2004).
Factors
Climate Soils Topography Human Factor
Process
Decline in Soil
Organic Matter Humus Decay (%/yr) = HI / 10
HI = ect1+ ec
t2 + 2ect3
t1= temperature of warmest month ( Co)
t2= temperature of coldest month
t3= mean annual temperature
Coeff. of humus mineralization
(K2): K2=1/2e0.1065t
(P/PET) (for P < PET)
for P>PET then make P/PET=1
for t<0 then make t=0.
t= mean temperature of the period
P= mean precipitation of the period
PET= potential evapo-transpiration
Humus content at equilibrium (B):
B=m(K1/ K2);
K1 is the coefficient of
humification
m= annual addition of organic matter
(including crop residues and manures)
Texture: Sandy> Clay
K2=1200/(A+200)(C+200)
A= Clay (%)
C = CaCO3 (%)
5< pH < 7.5 little effect
N.A. - Land Cover and shade
(affects soil temperature)
- C/N ratio of crops in the
LUT
- Additions of Organic
Matter
If OM decreases and SOM
is mineralized slower than
it is added as organic
residues to the soil, then
there is biological
degradation
These indicators of biological land degradation are particularly relevant to the role that soil organic matter
(SOM) plays in the ecosystem and in the carbon cycle. They provide an initial indication of the status and
expected conditions of SOM in a field, as a function of climatic conditions and the annual additions of
Table 1. Indicators of biological land degradation centred on the decline of soil organic matter
8
organic matter as crop residues and manures. Other indicators of physical degradation include soil erosion
by water and wind and compaction and crusting; for chemical degradation: nutrient depletion,
acidification, salinity and the presence of organic and organic toxic substances are included. As with
indicators of land degradation, some of them are not directly observable in the field, or only partially, but
most can either, be inferred through surrogate variables, or can be calculated from available data. In the
framework here proposed, readily attainable meteorological and soil data are required for calculation of the
indices.
Mapping assessment and estimation results: up-scaling procedures for carbon stock estimates,
biodiversity and land degradation indices in present land use.
Carbon stock totals in present land use are derived from the addition of carbon in biomass to carbon in
soils; i.e. Carbon stock (total) = C as biomass (above and below) + SOC. The conversion of biomass to
carbon is achieved through standard species-dependent coefficients reported in published work (e.g. Mac
Dicken, 1998). The soil organic carbon (SOC) is estimated from analytical data of samples taken at the
quadrat sites, with support from reported soil survey data of the area of concern. Conversion of SOM to
SOC, when values of SOC are not reported and laboratory analysis are not possible, can be made through standard conversion factors (e.g. SOC=0.57xSOM).
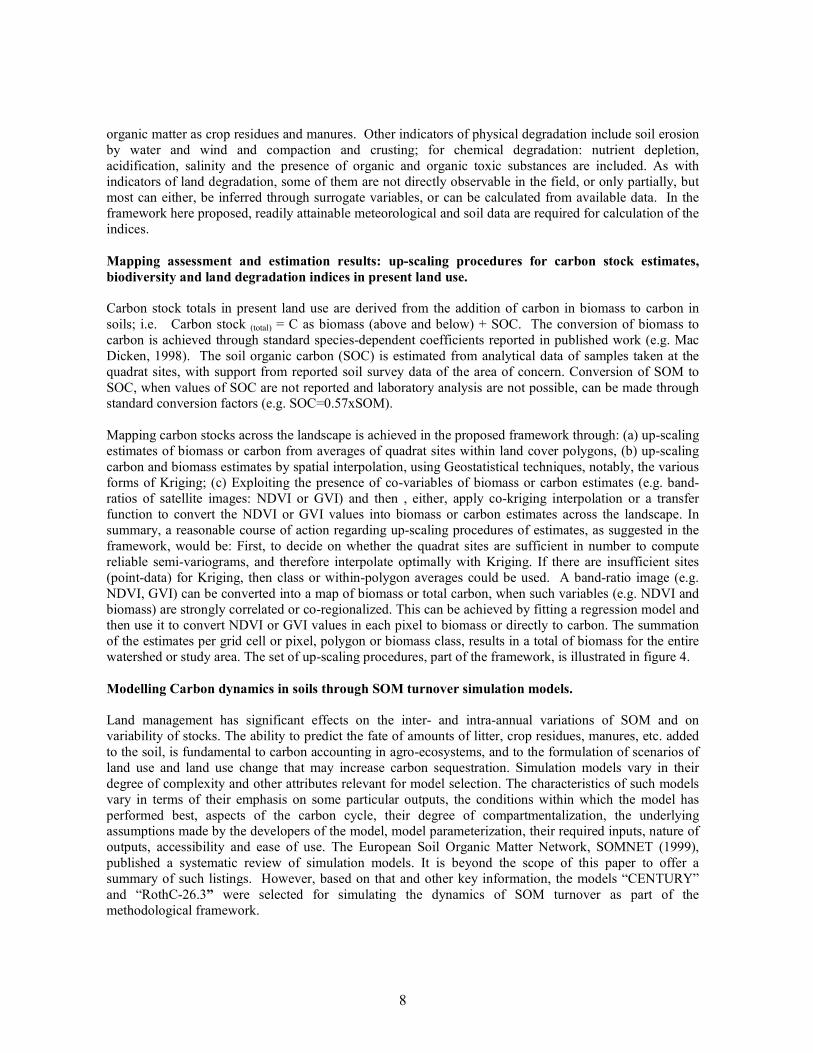
Mapping carbon stocks across the landscape is achieved in the proposed framework through: (a) up-scaling
estimates of biomass or carbon from averages of quadrat sites within land cover polygons, (b) up-scaling
carbon and biomass estimates by spatial interpolation, using Geostatistical techniques, notably, the various
forms of Kriging; (c) Exploiting the presence of co-variables of biomass or carbon estimates (e.g. band-
ratios of satellite images: NDVI or GVI) and then , either, apply co-kriging interpolation or a transfer
function to convert the NDVI or GVI values into biomass or carbon estimates across the landscape. In
summary, a reasonable course of action regarding up-scaling procedures of estimates, as suggested in the
framework, would be: First, to decide on whether the quadrat sites are sufficient in number to compute
reliable semi-variograms, and therefore interpolate optimally with Kriging. If there are insufficient sites
(point-data) for Kriging, then class or within-polygon averages could be used. A band-ratio image (e.g.
NDVI, GVI) can be converted into a map of biomass or total carbon, when such variables (e.g. NDVI and
biomass) are strongly correlated or co-regionalized. This can be achieved by fitting a regression model and
then use it to convert NDVI or GVI values in each pixel to biomass or directly to carbon. The summation
of the estimates per grid cell or pixel, polygon or biomass class, results in a total of biomass for the entire
watershed or study area. The set of up-scaling procedures, part of the framework, is illustrated in figure 4.
Modelling Carbon dynamics in soils through SOM turnover simulation models.
Land management has significant effects on the inter- and intra-annual variations of SOM and on
variability of stocks. The ability to predict the fate of amounts of litter, crop residues, manures, etc. added
to the soil, is fundamental to carbon accounting in agro-ecosystems, and to the formulation of scenarios of
land use and land use change that may increase carbon sequestration. Simulation models vary in their
degree of complexity and other attributes relevant for model selection. The characteristics of such models
vary in terms of their emphasis on some particular outputs, the conditions within which the model has
performed best, aspects of the carbon cycle, their degree of compartmentalization, the underlying assumptions made by the developers of the model, model parameterization, their required inputs, nature of
outputs, accessibility and ease of use. The European Soil Organic Matter Network, SOMNET (1999),
published a systematic review of simulation models. It is beyond the scope of this paper to offer a
summary of such listings. However, based on that and other key information, the models “CENTURY”
and “RothC-26.3” were selected for simulating the dynamics of SOM turnover as part of the
methodological framework.
9
These models represent extremes in a gradient of accessibility, ease of use and detail, CENTURY being
the most detailed but structurally complex. Rothc-26.3 is a model that allows for the effects of soil type,
temperature, moisture content and plant cover on the SOM turnover process. It uses a monthly time step to
calculate total organic carbon (t ha -1), microbial biomass carbon (t ha -1) and ∆14C (from which the radiocarbon
age of the soil can be calculated), on a time scale of years to centuries (Jenkinson et al. 1987; Jenkinson, 1990;
Jenkinson et al. 1991; Jenkinson et al. 1992; Jenkinson and Coleman, 1994). RothC-26.3 needs few inputs and
these are easily obtainable. The model computes the changes in organic carbon as it is partitioned into five
basic compartments: Inert Organic matter (IOM), Decomposable Plant Material (DPM), Resistant Plant
Material (RPM), Microbial Biomass (BIO) and Humified Organic Matter (HUM).
The CENTURY model, on the other hand, simulates the long-term dynamics of carbon (C), nitrogen (N),
phosphorus (P), and sulphur (S) for different plant-soil systems. The model can simulate the dynamics of
grassland systems, agricultural crop systems, forest systems, and savannah systems. The grassland/crop
and forest systems have different plant production sub-models that are linked to a common soil organic
matter sub-model. The soil organic matter sub-model simulates the flow of C, N, P, and S through plant
litter and the different inorganic and organic pools in the soil. The model runs using a monthly time step
(Parton et al, 1992).
Model customization and SOM model-GIS integration
The full parameterization of CENTURY, v. 4.0, is a rather laborious process requiring many variables,
some of them very specific or uncommon, on a cumbersome unfriendly MS-DOS interface in a PC
computer. The difficulties in running and manipulating frequently the CENTURY model in routine assessments, in order to simulate the partition of SOM into its fractions over time for preparing different
scenarios, brought about the need for developing enhanced input/output interfaces, particularly those
related to model parameterization and to the model-GIS integration. After careful study of the model
Use of co-variables
(C0-KRIGING) of ground
measurements:
reflectance NDVI
GVI
Map of
Vegetation Classes
Sample Data
Class means
Spatial interpolation of point-dataa: Kriging,
distance functions, splines
Biomass or Biomass or Biomass or Biomass or
DiversityDiversityDiversityDiversity
Fig. 4. Up-scaling procedures of estimates of biomass, Carbon,
plant diversity and land degradation.
10
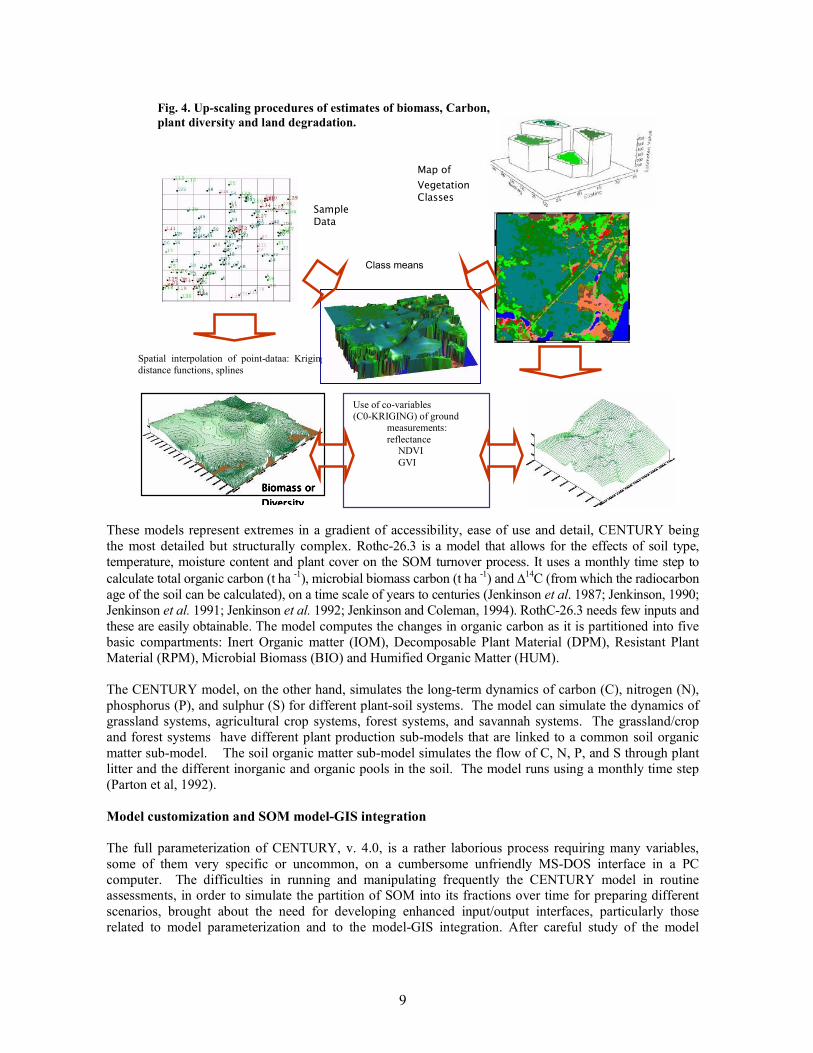
structure, software was developed in Visual Basic programming language to create a graphic user interface
(GUI) to enable ease of input, model parameterization and GIS output. This resulted in a sort of spatial
decision support system that was called “Soil-C” (fig 5). SOIL-C consists of a suite of programs, which
interface with the input and output of the model CENTURY (v. 4.0). The options in the main screen of
SOIL-C (figure 5) introduce the user to a hierarchy of menus for input of site data (equivalent to input data
through a “FILE100” in CENTURY), input management data (equivalent to input “EVENT100”
parameters and creation of the schedule files), select output variables (equivalent to choose output
variables through “LIST100”), GIS output definition and the interface to run the model (fig 6).
The parameterization of the models is achieved through the computation of “pedo-climatic cells” (PCC), which are pixels indexed to attribute tables containing all soil and climate parameters necessary for
running the simulation models. These PCC result from the spatial interpolation of point data from
meteorological station values of the variables required by the model, and from soil profile analysis data.
Then, these data layers were overlaid in the GIS to a common geo-referencing system.
Estimation of Carbon stock and sequestration in potential land utilization types (LUT)
In order to generate possible scenarios of land use change (LUC) within the framework, potential LUT are
considered. First, a short list of candidate LUT is developed by including in the selection criteria, high
efficiency for CO2 photosynthetic absorption and conversion to biomass. Plants with photosynthetic
pathways C3 and C4 are selected. Then their physical suitability for the ecological conditions of the land in the study area is evaluated through standard land suitability assessment procedures (FAO, 1984). Bio-
physically suitable and photo-synthetically efficient crops are selected and crop patterns then formed. Crop
growth models (Van Diepen et al, 1989; Jones et al, 1991) are used for predicting biomass and yields over
time, under the climate and soil conditions predominant in the different PCC or land polygons of the area
under study. The estimated inputs of organic matter in the form of litter, crop residues and manures from
these LUT become then the starting point for modelling SOM turnover and for projecting such outcomes
into future periods.
INPUT OF SITE
PARAMETERS IN
THE SOIL-C
Interface
Fig.5. SOIL-C: Customization of the CENTURY model interfaces with
Visual Basic programming language
SOIL-C Soil Carbon Spatial Decision Support
System

11
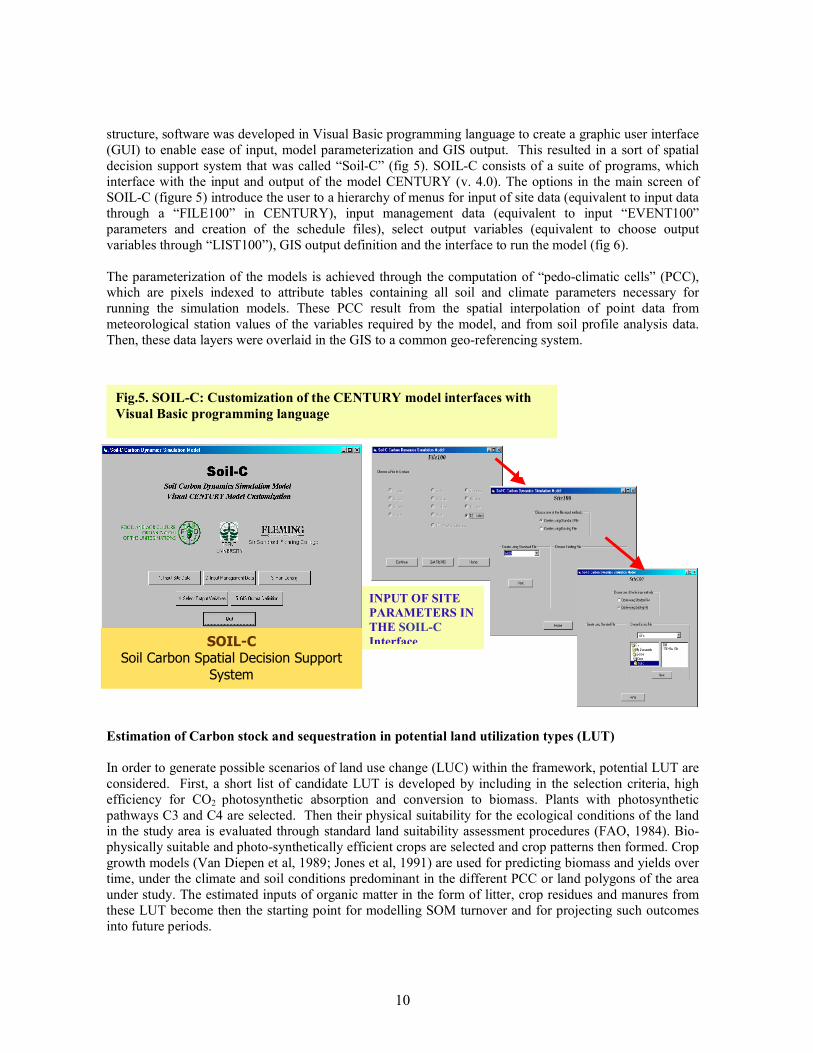
Full carbon accounting then takes place, and the difference between the actual carbon stock of present land
use and that of any potential LUT can be accounted for as either, carbon sequestration or emission. Figure
7 illustrates with a flow chart such sequence of procedures for potential LUT, as part of the methodological
framework. The land suitability assessment process could be a cumbersome one, depending on the land-
use/crop requirements considered and the data on the land qualities and land characteristics available to
match such requirements. FAO (1984) has published comprehensive literature and guidelines for land
evaluation under many types of agriculture. The details of the suitability assessment process can be
obtained directly from that source. What is new here is that the suitability assessment process includes now
high efficiency for CO2 photosynthetic absorption and conversion to biomass, i.e. high carbon
sequestration efficiency, as a criterion for crop selection. It is worth mention too that the suitability
assessment process is automated through the development of decision-trees using the Automated Land
Evaluation System (ALES) (Rossiter, 1995).
Applying the methodological framework in the field through case studies
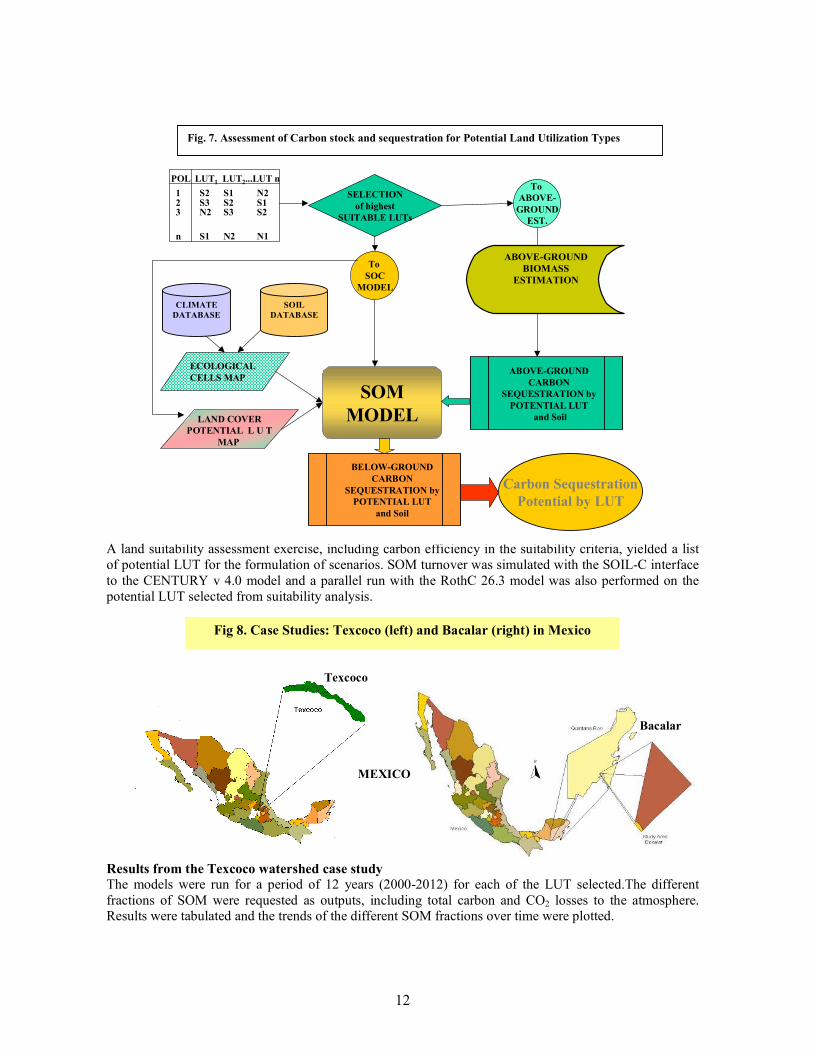
Results from applying the methodological framework to two contrasting areas in Mexico (figure 8), are
presented in this paper. The areas selected are the Texcoco watershed (agriculturally-based, dry, highland
sub-tropics) in a rural area near Mexico City (fig. 9) and an area of about 1000 ha near Bacalar, in the
Yucatan Peninsula (tropical sub-deciduous forests subject to cycles of “slash-and-burn” shifting cultivation and fallow, with an ancient Mayan subsistence agricultural tradition). In both case study areas, land cover
units were mapped through remote sensing procedures (figure 2), and quadrat sampling sites were located
according to the sampling procedures outlined in the framework. Figure 9 illustrates the position of the
quadrat sampling sites in the Texcoco watershed. Above- and below-ground biomass estimates were
computed at quadrat sites and interpolated. Estimates of biomass and carbon content were derived for each land cover polygon throughout the watershed, thus providing estimates of the carbon stocks in present
land use.
Fig 6. SOIL-C selection of CENTURY
Model output variables and file specification for interface with the GIS and map display.
12
A land suitability assessment exercise, including carbon efficiency in the suitability criteria, yielded a list
of potential LUT for the formulation of scenarios. SOM turnover was simulated with the SOIL-C interface
to the CENTURY v 4.0 model and a parallel run with the RothC 26.3 model was also performed on the
potential LUT selected from suitability analysis.
Results from the Texcoco watershed case study
The models were run for a period of 12 years (2000-2012) for each of the LUT selected.The different
fractions of SOM were requested as outputs, including total carbon and CO2 losses to the atmosphere. Results were tabulated and the trends of the different SOM fractions over time were plotted.
To
SOC
MODEL
SELECTION
of highest
SUITABLE LUTs
To
ABOVE-
GROUND
EST.
SOM
MODEL
ABOVE-GROUND
CARBON
SEQUESTRATION by
POTENTIAL LUT
and Soil
BELOW-GROUND
CARBON
SEQUESTRATION by
POTENTIAL LUT
and Soil
Carbon Sequestration
Potential by LUT
ECOLOGICAL
CELLS MAP
LAND COVER
POTENTIAL L U T
MAP
LUT1 LUT2...LUT nPOL
123
n
S1S2 N2S3 S2 S1
S2S3N2
N1N2S1
Fig. 7. Assessment of Carbon stock and sequestration for Potential Land Utilization Types
CLIMATE
DATABASE SOIL
DATABASE
ABOVE-GROUND
BIOMASS
ESTIMATION
Fig 8. Case Studies: Texcoco (left) and Bacalar (right) in Mexico
MEXICO
Texcoco
Bacalar
13
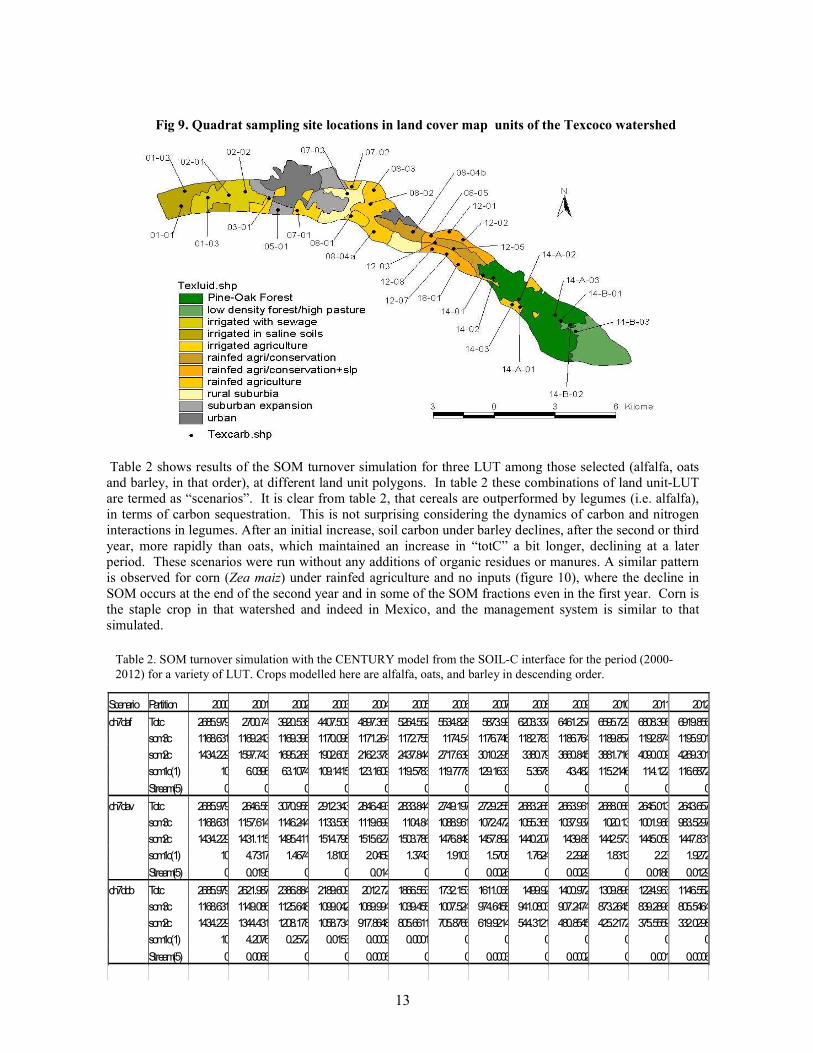
Table 2 shows results of the SOM turnover simulation for three LUT among those selected (alfalfa, oats
and barley, in that order), at different land unit polygons. In table 2 these combinations of land unit-LUT
are termed as “scenarios”. It is clear from table 2, that cereals are outperformed by legumes (i.e. alfalfa),
in terms of carbon sequestration. This is not surprising considering the dynamics of carbon and nitrogen
interactions in legumes. After an initial increase, soil carbon under barley declines, after the second or third
year, more rapidly than oats, which maintained an increase in “totC” a bit longer, declining at a later
period. These scenarios were run without any additions of organic residues or manures. A similar pattern
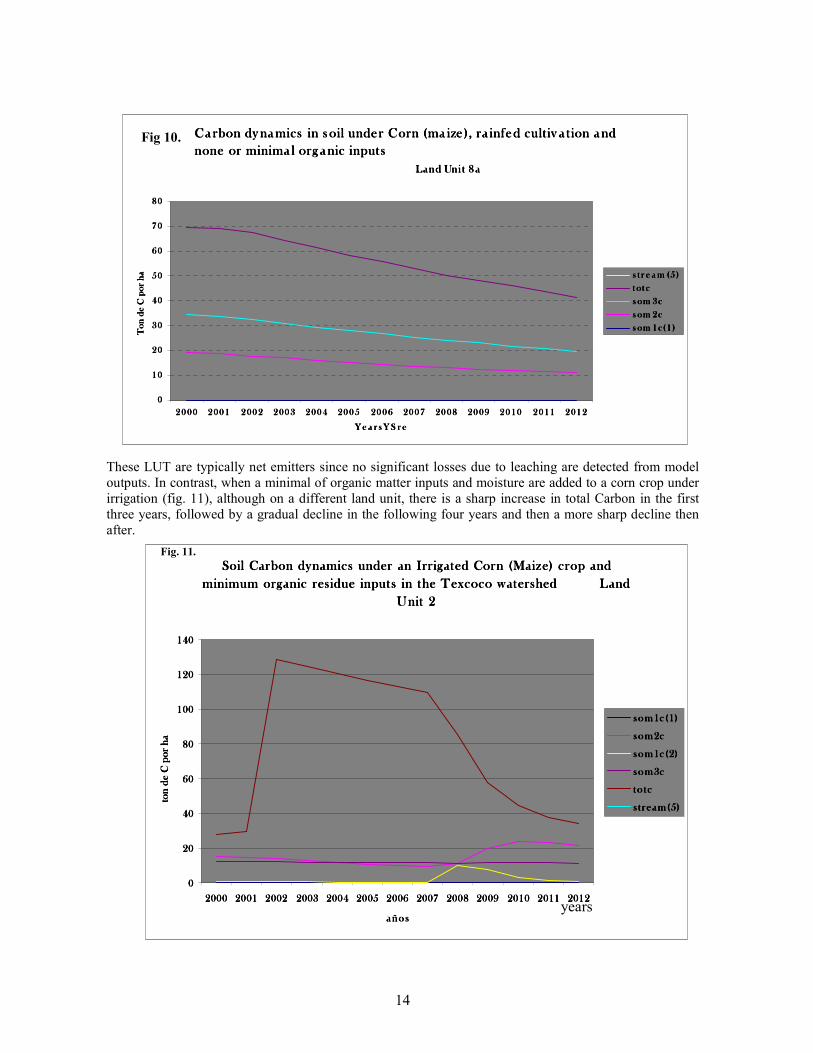
is observed for corn (Zea maiz) under rainfed agriculture and no inputs (figure 10), where the decline in
SOM occurs at the end of the second year and in some of the SOM fractions even in the first year. Corn is
the staple crop in that watershed and indeed in Mexico, and the management system is similar to that
simulated.
Fig 9. Quadrat sampling site locations in land cover map units of the Texcoco watershed
Table 2. SOM turnover simulation with the CENTURY model from the SOIL-C interface for the period (2000-
2012) for a variety of LUT. Crops modelled here are alfalfa, oats, and barley in descending order.
Scenario Partition 2000 2001 2002 2003 2004 2005 2006 2007 2008 2009 2010 2011 2012
ch7daf Totc 2685.979 2700.74 3920.538 4407.509 4897.365 5264.552 5534.828 5873.99 6203.337 6461.257 6595.729 6808.396 6919.856
som3c 1168.631 1169.243 1169.396 1170.098 1171.264 1172.755 1174.54 1176.746 1182.783 1186.764 1189.857 1192.874 1195.901
som2c 1434.229 1597.743 1695.268 1902.605 2162.378 2437.844 2717.639 3010.295 3380.79 3660.845 3881.716 4090.009 4269.301
som1c(1) 10 6.0396 63.1074 109.1415 123.1609 119.5783 119.7778 129.1633 5.3678 43.482 115.2146 114.122 116.6872
Stream(5) 0 0 0 0 0 0 0 0 0 0 0 0 0
ch7dav Totc 2685.979 2646.58 3070.958 2912.343 2846.493 2833.844 2749.197 2729.255 2683.265 2663.961 2688.066 2645.013 2643.657
som3c 1168.631 1157.614 1146.244 1133.536 1119.699 1104.84 1088.961 1072.472 1055.365 1037.937 1020.13 1001.966 983.5297
som2c 1434.229 1431.115 1495.411 1514.798 1515.627 1503.786 1476.849 1457.892 1440.207 1439.88 1442.573 1445.059 1447.831
som1c(1) 10 4.7317 1.4674 1.8106 2.0459 1.3743 1.9103 1.5708 1.7624 2.2928 1.8313 2.23 1.9272
Stream(5) 0 0.0195 0 0 0.014 0 0 0.0026 0 0.0029 0 0.0188 0.0129
ch7dcb Totc 2685.979 2621.987 2386.884 2189.609 2012.72 1866.563 1732.153 1611.068 1499.92 1400.972 1309.896 1224.963 1146.552
som3c 1168.631 1149.086 1125.648 1099.042 1069.994 1039.458 1007.524 974.6458 941.0803 907.2474 873.2645 839.2896 805.5464
som2c 1434.229 1344.431 1208.178 1058.734 917.8648 805.6611 705.8766 619.9214 544.3121 480.8545 425.2172 375.5559 332.0298
som1c(1) 10 4.2076 0.2572 0.0153 0.0009 0.0001 0 0 0 0 0 0 0
Stream(5) 0 0.0066 0 0 0.0006 0 0 0.0003 0 0.0002 0 0.001 0.0006
14
These LUT are typically net emitters since no significant losses due to leaching are detected from model
outputs. In contrast, when a minimal of organic matter inputs and moisture are added to a corn crop under
irrigation (fig. 11), although on a different land unit, there is a sharp increase in total Carbon in the first
three years, followed by a gradual decline in the following four years and then a more sharp decline then
after.
Ca rbon dy namics in s oil under Corn (ma ize ), ra infed cult iv a t ion a nd Ca rbon dy namics in s oil under Corn (ma ize ), ra infed cult iv a t ion a nd Ca rbon dy namics in s oil under Corn (ma ize ), ra infed cult iv a t ion a nd Ca rbon dy namics in s oil under Corn (ma ize ), ra infed cult iv a t ion a nd
none or minima l org a nic inputsnone or minima l org a nic inputsnone or minima l org a nic inputsnone or minima l org a nic inputs
Land Uni t 8 a Land Uni t 8 a Land Uni t 8 a Land Uni t 8 a
0000
10101010
20202020
30303030
40404040
50505050
60606060
70707070
80808080
2000200020002000 2001200120012001 2002200220022002 2003200320032003 2004200420042004 2005200520052005 2006200620062006 2007200720072007 2008200820082008 2009200920092009 2010201020102010 2011201120112011 2012201220122012
Y e a r s Y S r eY e a r s Y S r eY e a r s Y S r eY e a r s Y S r e
Ton de C por ha
Ton de C por ha
Ton de C por ha
Ton de C por ha s t r e a m (5 )s t r e a m (5 )s t r e a m (5 )s t r e a m (5 )
t ot ct ot ct ot ct ot c
s om 3cs om 3cs om 3cs om 3c
s om 2cs om 2cs om 2cs om 2c
s om 1c(1 )s om 1c(1 )s om 1c(1 )s om 1c(1 )
Fig 10.
Soil Carbon dynamics under an Irrigated Corn (Maize) crop and Soil Carbon dynamics under an Irrigated Corn (Maize) crop and Soil Carbon dynamics under an Irrigated Corn (Maize) crop and Soil Carbon dynamics under an Irrigated Corn (Maize) crop and
minimum organic residue inputs in the Texcoco watershed Land minimum organic residue inputs in the Texcoco watershed Land minimum organic residue inputs in the Texcoco watershed Land minimum organic residue inputs in the Texcoco watershed Land
Unit 2Unit 2Unit 2Unit 2
0000
20202020
40404040
60606060
80808080
100100100100
120120120120
140140140140
2000200020002000 2001200120012001 2002200220022002 2003200320032003 2004200420042004 2005200520052005 2006200620062006 2007200720072007 2008200820082008 2009200920092009 2010201020102010 2011201120112011 2012201220122012
añosañosañosaños
ton de C por ha
ton de C por ha
ton de C por ha
ton de C por ha
s om1c (1)som1c (1)som1c (1)som1c (1)
som2csom2csom2csom2c
som1c (2)som1c (2)som1c (2)som1c (2)
som3csom3csom3csom3c
to tcto tcto tcto tc
s tream(5)s tream(5)s tream(5)s tream(5)
years
Fig. 11.
15
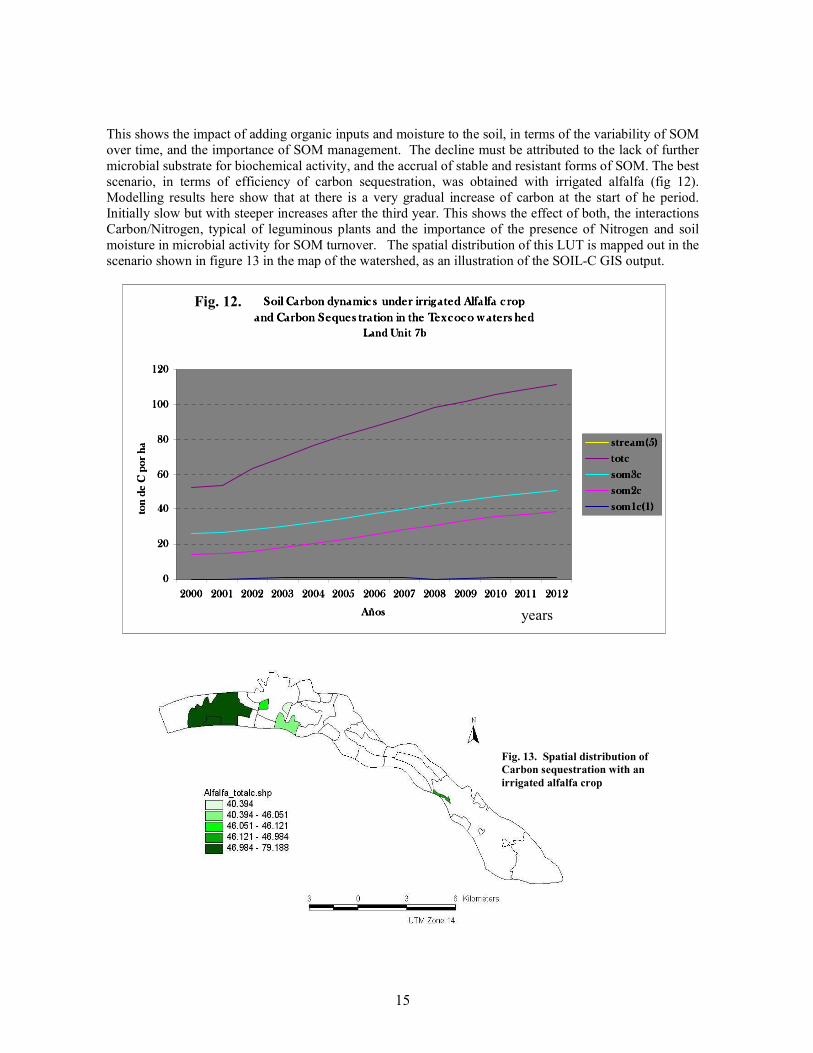
This shows the impact of adding organic inputs and moisture to the soil, in terms of the variability of SOM
over time, and the importance of SOM management. The decline must be attributed to the lack of further
microbial substrate for biochemical activity, and the accrual of stable and resistant forms of SOM. The best
scenario, in terms of efficiency of carbon sequestration, was obtained with irrigated alfalfa (fig 12).
Modelling results here show that at there is a very gradual increase of carbon at the start of he period.
Initially slow but with steeper increases after the third year. This shows the effect of both, the interactions
Carbon/Nitrogen, typical of leguminous plants and the importance of the presence of Nitrogen and soil
moisture in microbial activity for SOM turnover. The spatial distribution of this LUT is mapped out in the
scenario shown in figure 13 in the map of the watershed, as an illustration of the SOIL-C GIS output.
Fig. 13. Spatial distribution of
Carbon sequestration with an
irrigated alfalfa crop
Soil Carbon dynamic s under irrig a ted Alfa lfa c ropSoil Carbon dynamic s under irrig a ted Alfa lfa c ropSoil Carbon dynamic s under irrig a ted Alfa lfa c ropSoil Carbon dynamic s under irrig a ted Alfa lfa c rop
and Carbon Seques tra tion in the Texcoco w a ters hedand Carbon Seques tra tion in the Texcoco w a ters hedand Carbon Seques tra tion in the Texcoco w a ters hedand Carbon Seques tra tion in the Texcoco w a ters hed
Land Unit 7bLand Unit 7bLand Unit 7bLand Unit 7b
0000
20202020
40404040
60606060
80808080
100100100100
120120120120
2000200020002000 2001200120012001 2002200220022002 2003200320032003 2004200420042004 2005200520052005 2006200620062006 2007200720072007 2008200820082008 2009200920092009 2010201020102010 2011201120112011 2012201220122012
AñosAñosAñosAños
ton de C por ha
ton de C por ha
ton de C por ha
ton de C por ha s tream(5)stream(5)stream(5)stream(5)
totctotctotctotc
som3csom3csom3csom3c
som2csom2csom2csom2c
som1c(1)som1c(1)som1c(1)som1c(1)
years
Fig. 12.
16
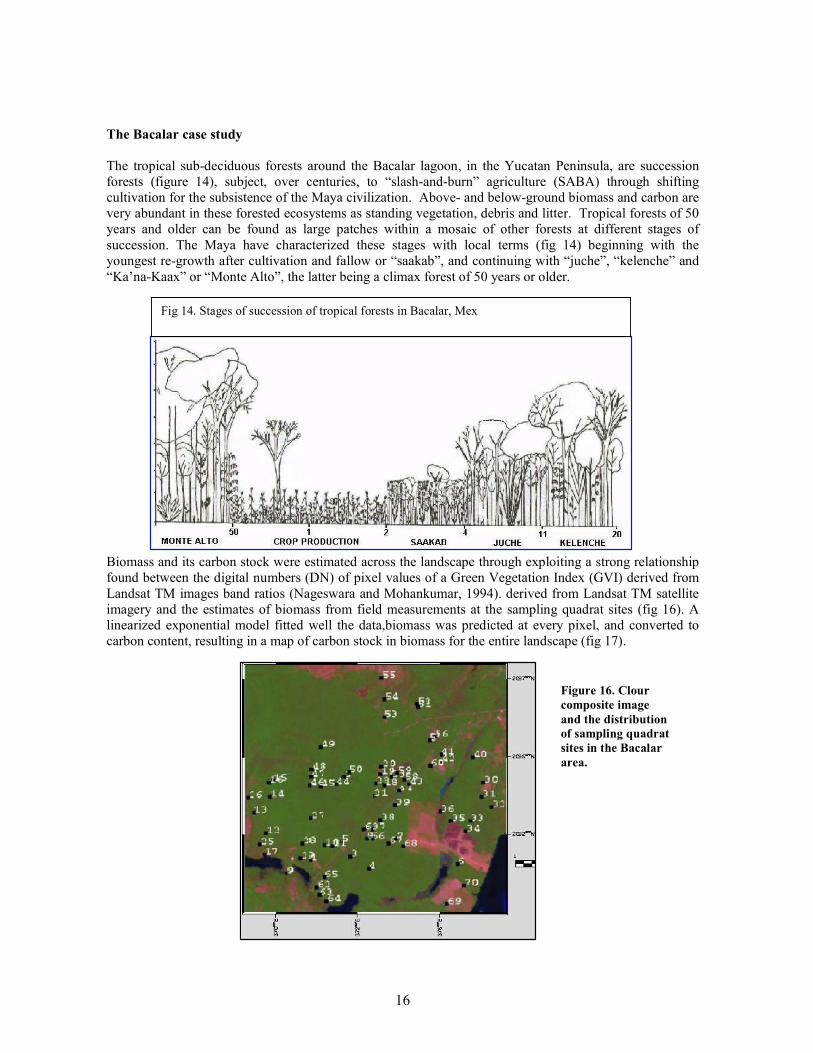
The Bacalar case study
The tropical sub-deciduous forests around the Bacalar lagoon, in the Yucatan Peninsula, are succession
forests (figure 14), subject, over centuries, to “slash-and-burn” agriculture (SABA) through shifting
cultivation for the subsistence of the Maya civilization. Above- and below-ground biomass and carbon are
very abundant in these forested ecosystems as standing vegetation, debris and litter. Tropical forests of 50
years and older can be found as large patches within a mosaic of other forests at different stages of
succession. The Maya have characterized these stages with local terms (fig 14) beginning with the
youngest re-growth after cultivation and fallow or “saakab”, and continuing with “juche”, “kelenche” and
“Ka’na-Kaax” or “Monte Alto”, the latter being a climax forest of 50 years or older.
Biomass and its carbon stock were estimated across the landscape through exploiting a strong relationship
found between the digital numbers (DN) of pixel values of a Green Vegetation Index (GVI) derived from
Landsat TM images band ratios (Nageswara and Mohankumar, 1994). derived from Landsat TM satellite
imagery and the estimates of biomass from field measurements at the sampling quadrat sites (fig 16). A
linearized exponential model fitted well the data,biomass was predicted at every pixel, and converted to
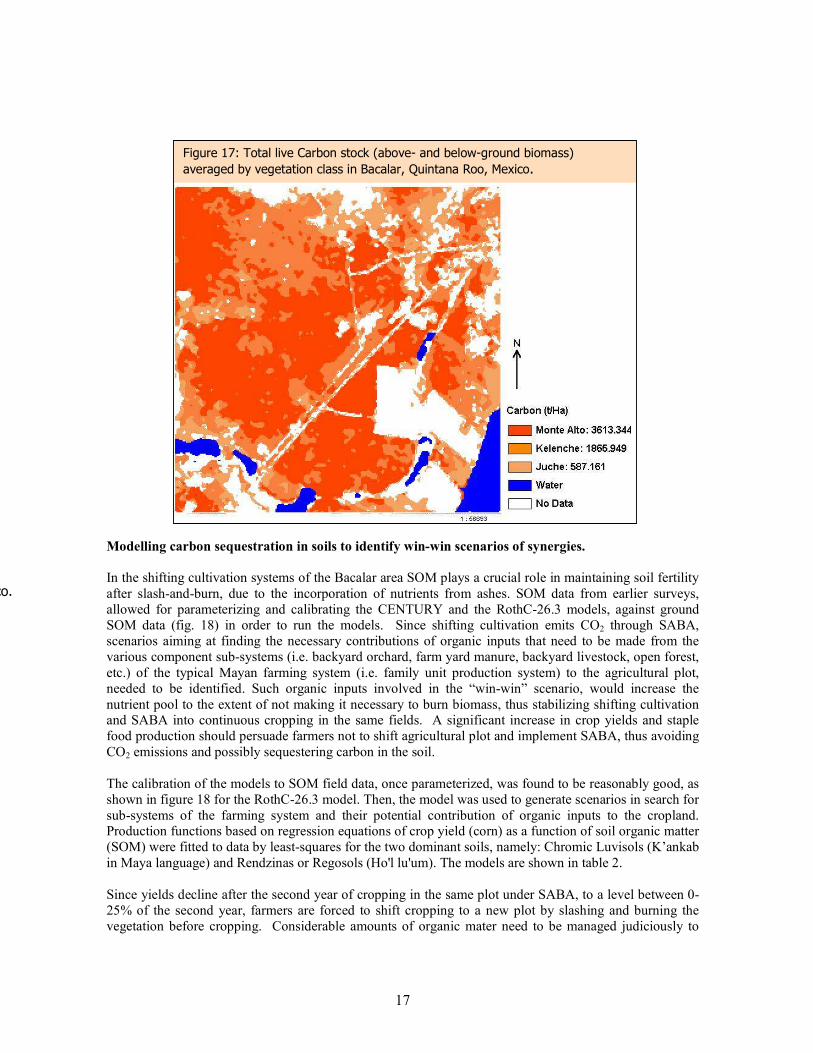
carbon content, resulting in a map of carbon stock in biomass for the entire landscape (fig 17).
Fig 14. Stages of succession of tropical forests in Bacalar, Mex
Figure 16. Clour
composite image
and the distribution
of sampling quadrat
sites in the Bacalar
area.
17
Modelling carbon sequestration in soils to identify win-win scenarios of synergies.
In the shifting cultivation systems of the Bacalar area SOM plays a crucial role in maintaining soil fertility
after slash-and-burn, due to the incorporation of nutrients from ashes. SOM data from earlier surveys,
allowed for parameterizing and calibrating the CENTURY and the RothC-26.3 models, against ground
SOM data (fig. 18) in order to run the models. Since shifting cultivation emits CO2 through SABA,
scenarios aiming at finding the necessary contributions of organic inputs that need to be made from the
various component sub-systems (i.e. backyard orchard, farm yard manure, backyard livestock, open forest,
etc.) of the typical Mayan farming system (i.e. family unit production system) to the agricultural plot,
needed to be identified. Such organic inputs involved in the “win-win” scenario, would increase the
nutrient pool to the extent of not making it necessary to burn biomass, thus stabilizing shifting cultivation and SABA into continuous cropping in the same fields. A significant increase in crop yields and staple
food production should persuade farmers not to shift agricultural plot and implement SABA, thus avoiding
CO2 emissions and possibly sequestering carbon in the soil.
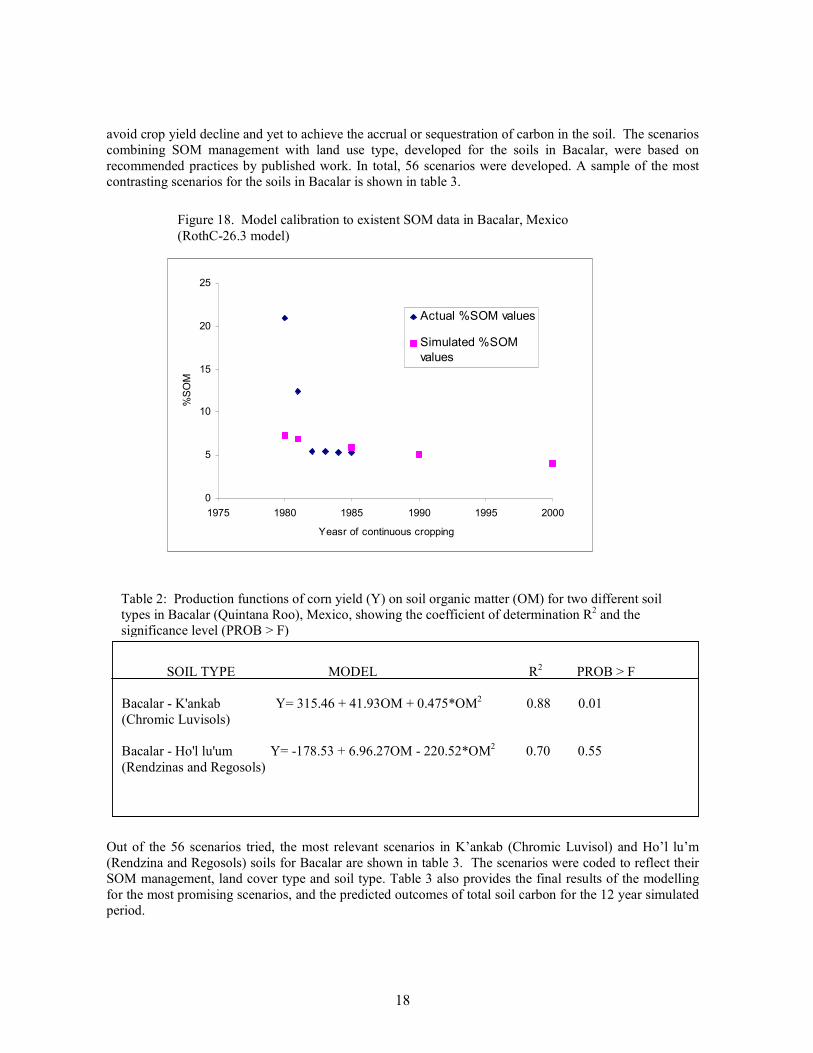
The calibration of the models to SOM field data, once parameterized, was found to be reasonably good, as
shown in figure 18 for the RothC-26.3 model. Then, the model was used to generate scenarios in search for
sub-systems of the farming system and their potential contribution of organic inputs to the cropland. Production functions based on regression equations of crop yield (corn) as a function of soil organic matter
(SOM) were fitted to data by least-squares for the two dominant soils, namely: Chromic Luvisols (K’ankab
in Maya language) and Rendzinas or Regosols (Ho'l lu'um). The models are shown in table 2.
Since yields decline after the second year of cropping in the same plot under SABA, to a level between 0-
25% of the second year, farmers are forced to shift cropping to a new plot by slashing and burning the
vegetation before cropping. Considerable amounts of organic mater need to be managed judiciously to
Figure 2.8: Total Biomass (t/Ha) by vegetation class, Bacalar, QR, Mexico.
Figure 17: Total live Carbon stock (above- and below-ground biomass)
averaged by vegetation class in Bacalar, Quintana Roo, Mexico.
18
avoid crop yield decline and yet to achieve the accrual or sequestration of carbon in the soil. The scenarios
combining SOM management with land use type, developed for the soils in Bacalar, were based on
recommended practices by published work. In total, 56 scenarios were developed. A sample of the most
contrasting scenarios for the soils in Bacalar is shown in table 3.
Out of the 56 scenarios tried, the most relevant scenarios in K’ankab (Chromic Luvisol) and Ho’l lu’m
(Rendzina and Regosols) soils for Bacalar are shown in table 3. The scenarios were coded to reflect their
SOM management, land cover type and soil type. Table 3 also provides the final results of the modelling
for the most promising scenarios, and the predicted outcomes of total soil carbon for the 12 year simulated
period.
0
5
10
15
20
25
1975 1980 1985 1990 1995 2000
Yeasr of continuous cropping
%SO
M
Actual %SOM values
Simulated %SOM
values
Figure 18. Model calibration to existent SOM data in Bacalar, Mexico
(RothC-26.3 model)
SOIL TYPE MODEL R2 PROB > F
Bacalar - K'ankab Y= 315.46 + 41.93OM + 0.475*OM2 0.88 0.01
(Chromic Luvisols)
Bacalar - Ho'l lu'um Y= -178.53 + 6.96.27OM - 220.52*OM2 0.70 0.55
(Rendzinas and Regosols)
Table 2: Production functions of corn yield (Y) on soil organic matter (OM) for two different soil
types in Bacalar (Quintana Roo), Mexico, showing the coefficient of determination R2 and the
significance level (PROB > F)
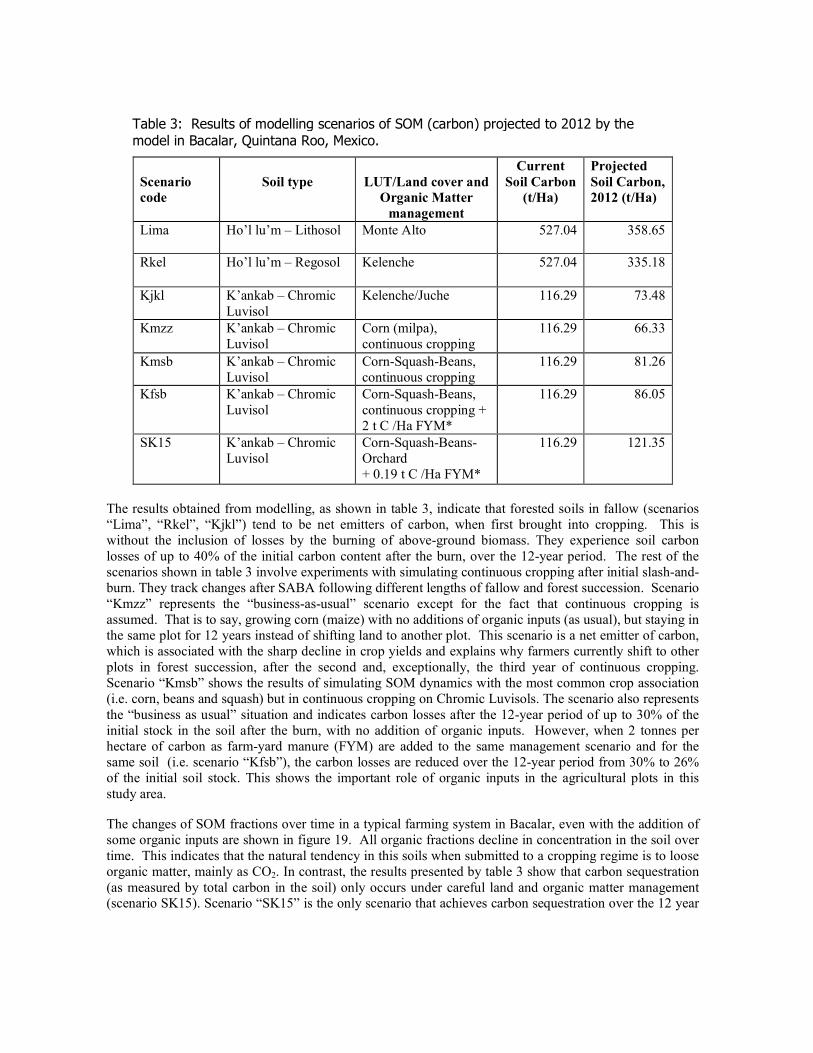
The results obtained from modelling, as shown in table 3, indicate that forested soils in fallow (scenarios
“Lima”, “Rkel”, “Kjkl”) tend to be net emitters of carbon, when first brought into cropping. This is
without the inclusion of losses by the burning of above-ground biomass. They experience soil carbon
losses of up to 40% of the initial carbon content after the burn, over the 12-year period. The rest of the
scenarios shown in table 3 involve experiments with simulating continuous cropping after initial slash-and-
burn. They track changes after SABA following different lengths of fallow and forest succession. Scenario
“Kmzz” represents the “business-as-usual” scenario except for the fact that continuous cropping is
assumed. That is to say, growing corn (maize) with no additions of organic inputs (as usual), but staying in
the same plot for 12 years instead of shifting land to another plot. This scenario is a net emitter of carbon,
which is associated with the sharp decline in crop yields and explains why farmers currently shift to other
plots in forest succession, after the second and, exceptionally, the third year of continuous cropping.
Scenario “Kmsb” shows the results of simulating SOM dynamics with the most common crop association
(i.e. corn, beans and squash) but in continuous cropping on Chromic Luvisols. The scenario also represents
the “business as usual” situation and indicates carbon losses after the 12-year period of up to 30% of the
initial stock in the soil after the burn, with no addition of organic inputs. However, when 2 tonnes per
hectare of carbon as farm-yard manure (FYM) are added to the same management scenario and for the
same soil (i.e. scenario “Kfsb”), the carbon losses are reduced over the 12-year period from 30% to 26%
of the initial soil stock. This shows the important role of organic inputs in the agricultural plots in this
study area.
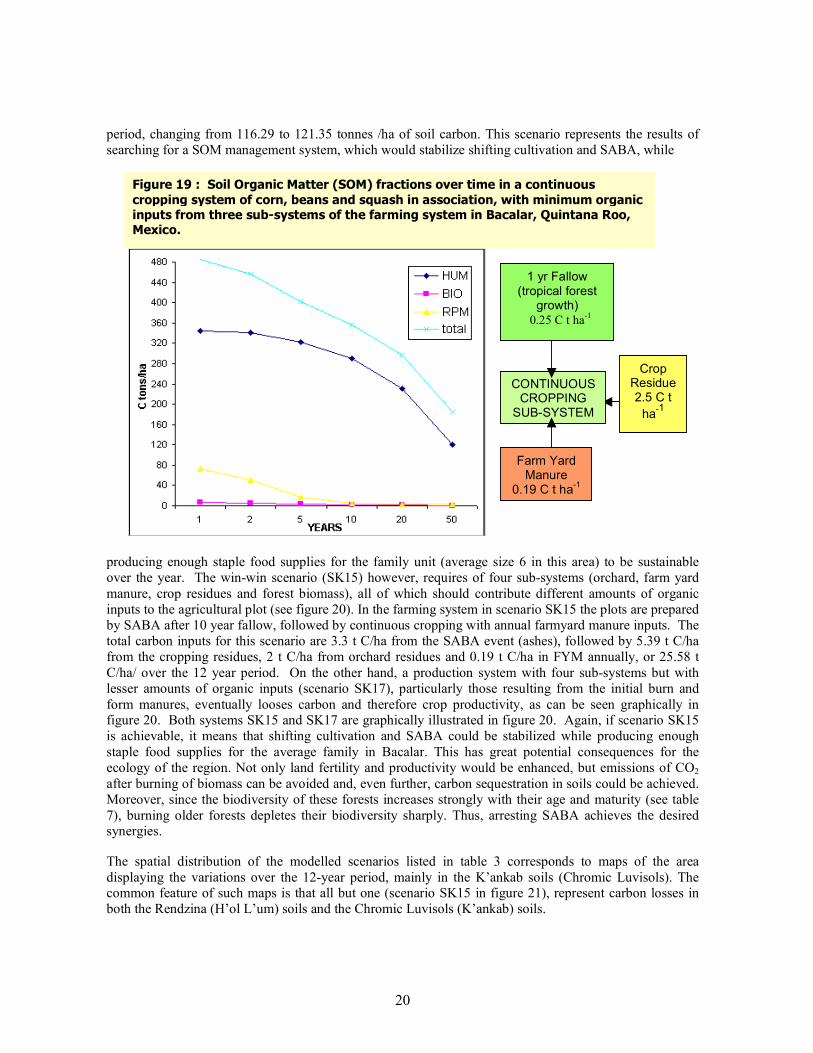
The changes of SOM fractions over time in a typical farming system in Bacalar, even with the addition of
some organic inputs are shown in figure 19. All organic fractions decline in concentration in the soil over
time. This indicates that the natural tendency in this soils when submitted to a cropping regime is to loose
organic matter, mainly as CO2. In contrast, the results presented by table 3 show that carbon sequestration
(as measured by total carbon in the soil) only occurs under careful land and organic matter management (scenario SK15). Scenario “SK15” is the only scenario that achieves carbon sequestration over the 12 year
Scenario
code
Soil type
LUT/Land cover and
Organic Matter
management
Current
Soil Carbon
(t/Ha)
Projected
Soil Carbon,
2012 (t/Ha)
Lima Ho’l lu’m – Lithosol Monte Alto 527.04 358.65
Rkel Ho’l lu’m – Regosol Kelenche 527.04 335.18
Kjkl K’ankab – Chromic
Luvisol
Kelenche/Juche 116.29 73.48
Kmzz K’ankab – Chromic
Luvisol
Corn (milpa),
continuous cropping
116.29 66.33
Kmsb K’ankab – Chromic
Luvisol
Corn-Squash-Beans,
continuous cropping
116.29 81.26
Kfsb K’ankab – Chromic
Luvisol
Corn-Squash-Beans,
continuous cropping +
2 t C /Ha FYM*
116.29 86.05
SK15 K’ankab – Chromic
Luvisol
Corn-Squash-Beans-
Orchard
+ 0.19 t C /Ha FYM*
116.29 121.35
Table 3: Results of modelling scenarios of SOM (carbon) projected to 2012 by the model in Bacalar, Quintana Roo, Mexico.
20
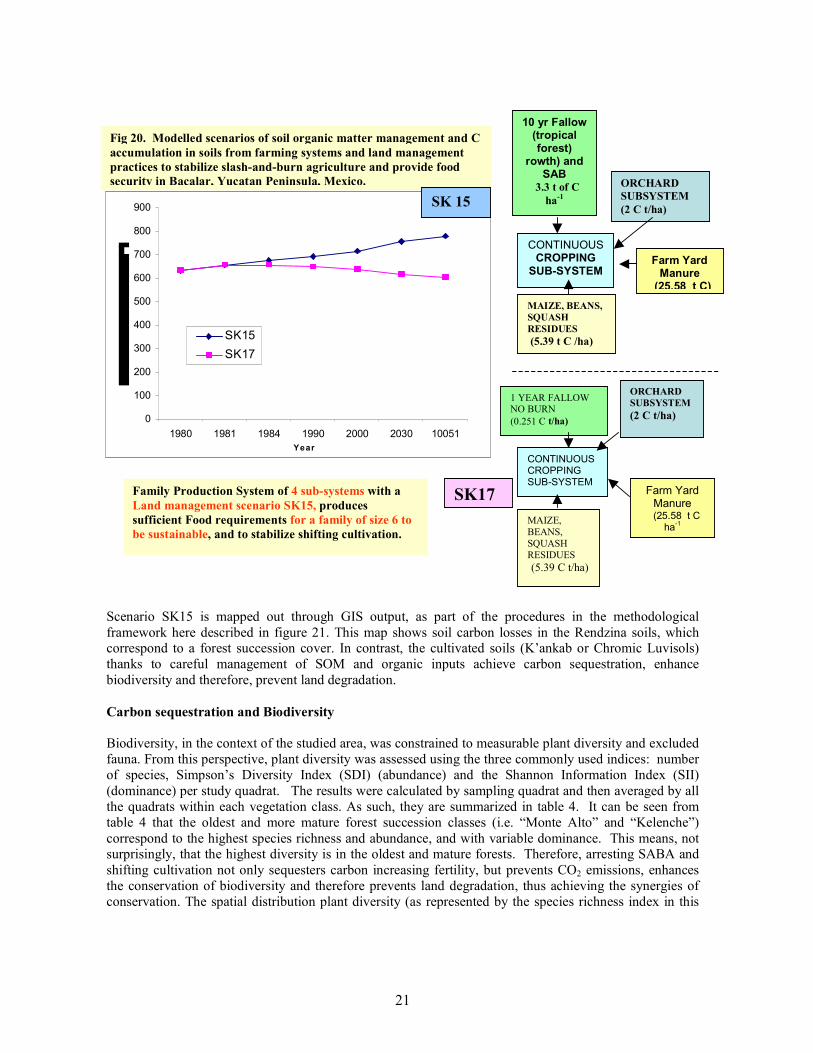
period, changing from 116.29 to 121.35 tonnes /ha of soil carbon. This scenario represents the results of
searching for a SOM management system, which would stabilize shifting cultivation and SABA, while
producing enough staple food supplies for the family unit (average size 6 in this area) to be sustainable
over the year. The win-win scenario (SK15) however, requires of four sub-systems (orchard, farm yard
manure, crop residues and forest biomass), all of which should contribute different amounts of organic
inputs to the agricultural plot (see figure 20). In the farming system in scenario SK15 the plots are prepared
by SABA after 10 year fallow, followed by continuous cropping with annual farmyard manure inputs. The
total carbon inputs for this scenario are 3.3 t C/ha from the SABA event (ashes), followed by 5.39 t C/ha
from the cropping residues, 2 t C/ha from orchard residues and 0.19 t C/ha in FYM annually, or 25.58 t
C/ha/ over the 12 year period. On the other hand, a production system with four sub-systems but with
lesser amounts of organic inputs (scenario SK17), particularly those resulting from the initial burn and
form manures, eventually looses carbon and therefore crop productivity, as can be seen graphically in figure 20. Both systems SK15 and SK17 are graphically illustrated in figure 20. Again, if scenario SK15
is achievable, it means that shifting cultivation and SABA could be stabilized while producing enough
staple food supplies for the average family in Bacalar. This has great potential consequences for the
ecology of the region. Not only land fertility and productivity would be enhanced, but emissions of CO2 after burning of biomass can be avoided and, even further, carbon sequestration in soils could be achieved.
Moreover, since the biodiversity of these forests increases strongly with their age and maturity (see table
7), burning older forests depletes their biodiversity sharply. Thus, arresting SABA achieves the desired synergies.
The spatial distribution of the modelled scenarios listed in table 3 corresponds to maps of the area
displaying the variations over the 12-year period, mainly in the K’ankab soils (Chromic Luvisols). The common feature of such maps is that all but one (scenario SK15 in figure 21), represent carbon losses in
both the Rendzina (H’ol L’um) soils and the Chromic Luvisols (K’ankab) soils.
Crop Residue 2.5 C t
ha-1
1 yr Fallow (tropical forest
growth) 0.25 C t ha
-1
CONTINUOUS CROPPING
SUB-SYSTEM
Farm Yard Manure
0.19 C t ha-1
Figure 19 : Soil Organic Matter (SOM) fractions over time in a continuous
cropping system of corn, beans and squash in association, with minimum organic inputs from three sub-systems of the farming system in Bacalar, Quintana Roo, Mexico.
21
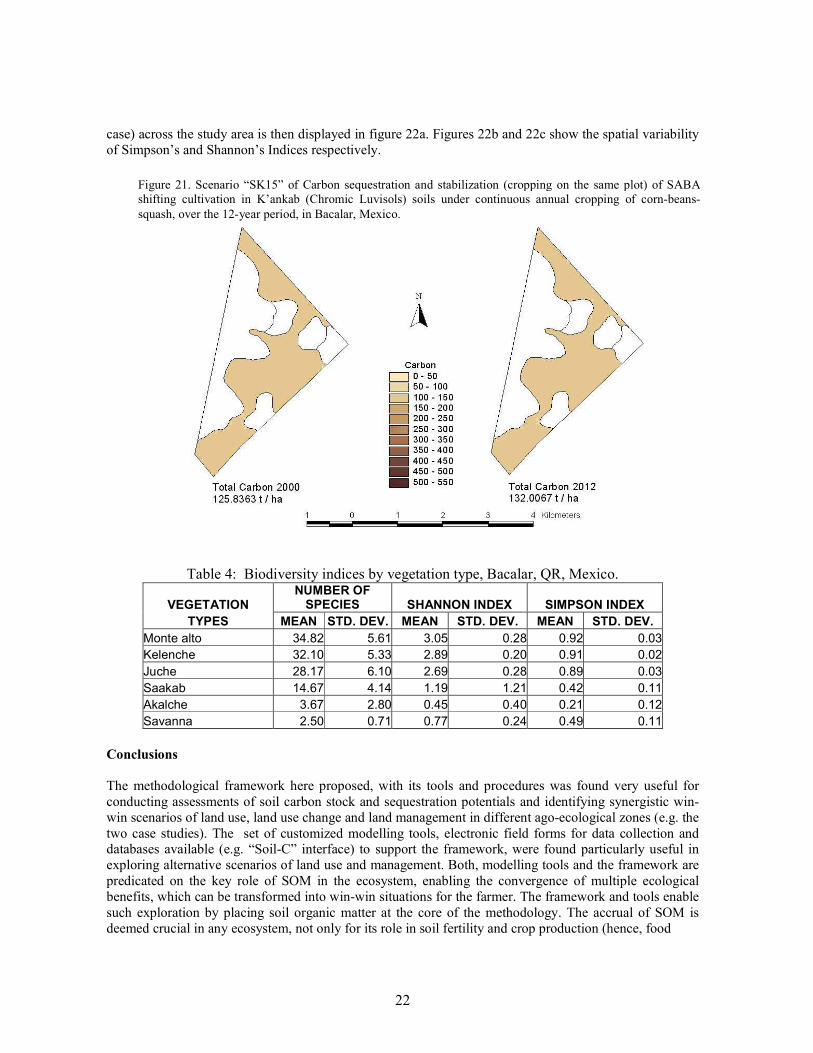
Scenario SK15 is mapped out through GIS output, as part of the procedures in the methodological
framework here described in figure 21. This map shows soil carbon losses in the Rendzina soils, which correspond to a forest succession cover. In contrast, the cultivated soils (K’ankab or Chromic Luvisols)
thanks to careful management of SOM and organic inputs achieve carbon sequestration, enhance
biodiversity and therefore, prevent land degradation.
Carbon sequestration and Biodiversity
Biodiversity, in the context of the studied area, was constrained to measurable plant diversity and excluded
fauna. From this perspective, plant diversity was assessed using the three commonly used indices: number
of species, Simpson’s Diversity Index (SDI) (abundance) and the Shannon Information Index (SII)
(dominance) per study quadrat. The results were calculated by sampling quadrat and then averaged by all
the quadrats within each vegetation class. As such, they are summarized in table 4. It can be seen from
table 4 that the oldest and more mature forest succession classes (i.e. “Monte Alto” and “Kelenche”)
correspond to the highest species richness and abundance, and with variable dominance. This means, not surprisingly, that the highest diversity is in the oldest and mature forests. Therefore, arresting SABA and
shifting cultivation not only sequesters carbon increasing fertility, but prevents CO2 emissions, enhances
the conservation of biodiversity and therefore prevents land degradation, thus achieving the synergies of
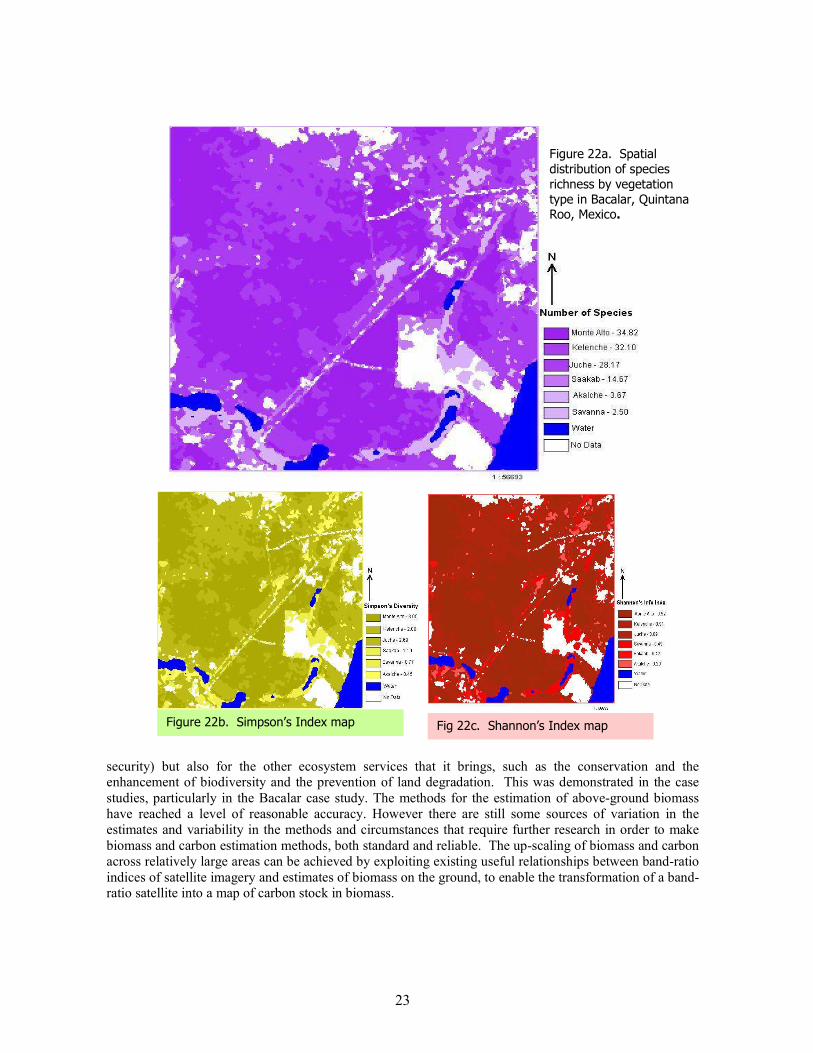
conservation. The spatial distribution plant diversity (as represented by the species richness index in this
MAIZE,
BEANS,
SQUASH
RESIDUES
(5.39 C t/ha)
Fig 20. Modelled scenarios of soil organic matter management and C
accumulation in soils from farming systems and land management
practices to stabilize slash-and-burn agriculture and provide food
security in Bacalar, Yucatan Peninsula, Mexico.
10 yr Fallow (tropical forest)
rowth) and SAB
3.3 t of C
ha-1
CONTINUOUS CROPPING SUB-SYSTEM
Farm Yard Manure
(25.58 t C)
0
100
200
300
400
500
600
700
800
900
1980 1981 1984 1990 2000 2030 10051
Year
SK15
SK17
ORCHARD
SUBSYSTEM
(2 C t/ha)
MAIZE, BEANS,
SQUASH
RESIDUES
(5.39 t C /ha)
1 YEAR FALLOW NO BURN
(0.251 C t/ha)
CONTINUOUS CROPPING SUB-SYSTEM
Farm Yard Manure
(25.58 t C ha
-1
ORCHARD
SUBSYSTEM
(2 C t/ha)
SK17
SK 15
Family Production System of 4 sub-systems with a
Land management scenario SK15, produces
sufficient Food requirements for a family of size 6 to
be sustainable, and to stabilize shifting cultivation.
22
case) across the study area is then displayed in figure 22a. Figures 22b and 22c show the spatial variability
of Simpson’s and Shannon’s Indices respectively.
Table 4: Biodiversity indices by vegetation type, Bacalar, QR, Mexico.
VEGETATION NUMBER OF SPECIES SHANNON INDEX SIMPSON INDEX
TYPES MEAN STD. DEV. MEAN STD. DEV. MEAN STD. DEV.
Monte alto 34.82 5.61 3.05 0.28 0.92 0.03
Kelenche 32.10 5.33 2.89 0.20 0.91 0.02
Juche 28.17 6.10 2.69 0.28 0.89 0.03
Saakab 14.67 4.14 1.19 1.21 0.42 0.11
Akalche 3.67 2.80 0.45 0.40 0.21 0.12
Savanna 2.50 0.71 0.77 0.24 0.49 0.11
Conclusions
The methodological framework here proposed, with its tools and procedures was found very useful for
conducting assessments of soil carbon stock and sequestration potentials and identifying synergistic win-win scenarios of land use, land use change and land management in different ago-ecological zones (e.g. the
two case studies). The set of customized modelling tools, electronic field forms for data collection and databases available (e.g. “Soil-C” interface) to support the framework, were found particularly useful in
exploring alternative scenarios of land use and management. Both, modelling tools and the framework are
predicated on the key role of SOM in the ecosystem, enabling the convergence of multiple ecological
benefits, which can be transformed into win-win situations for the farmer. The framework and tools enable
such exploration by placing soil organic matter at the core of the methodology. The accrual of SOM is
deemed crucial in any ecosystem, not only for its role in soil fertility and crop production (hence, food
Figure 21. Scenario “SK15” of Carbon sequestration and stabilization (cropping on the same plot) of SABA
shifting cultivation in K’ankab (Chromic Luvisols) soils under continuous annual cropping of corn-beans-
squash, over the 12-year period, in Bacalar, Mexico.
23
security) but also for the other ecosystem services that it brings, such as the conservation and the enhancement of biodiversity and the prevention of land degradation. This was demonstrated in the case
studies, particularly in the Bacalar case study. The methods for the estimation of above-ground biomass
have reached a level of reasonable accuracy. However there are still some sources of variation in the
estimates and variability in the methods and circumstances that require further research in order to make
biomass and carbon estimation methods, both standard and reliable. The up-scaling of biomass and carbon
across relatively large areas can be achieved by exploiting existing useful relationships between band-ratio
indices of satellite imagery and estimates of biomass on the ground, to enable the transformation of a band-ratio satellite into a map of carbon stock in biomass.
Figure 22a. Spatial
distribution of species
richness by vegetation
type in Bacalar, Quintana Roo, Mexico.
Figure 22b. Simpson’s Index map Fig 22c. Shannon’s Index map
24
The integration of a suite of models of all kinds into a customized spatial decision-support system for
assessments of carbon sequestration and synergistic ecological co-benefits, and for monitoring purposes, is
highly desirable for it would bring methodological consistency, even in the face of the uncertainties of
current day estimation methods. As starting point in determining the potential of lands for carbon
sequestration and sinks projects, the status of indicators of soil biological degradation, through parametric
semi-quantitative methods, such those in the framework proposed here, can be a very useful entry point in
the identification and design of a sinks projects. The set of useful indicators to the current status of SOM
can be used for indicating the health of soils, and the potential for GHG mitigation efforts. The procedures
proposed here as part of the framework and their models and tools can fully exploit the virtues of
Optimization Models as offered by the field of operations research in order to derive optimal scenarios of land use change and land management that also include economic and social decision variables to support
decision making concerning carbon sinks and GHG mitigation measures. Further work to these tools
should include the ability to include optimization criteria and multi-objective decision-making models.
The present framework and its tools are targeted for application in field projects in support of initiatives in
GHG mitigation and ecological co-benefits around the planet.
References
Ahern, F., T. Erdle, D. Maclean, and I. Kneppeck (1991) A quantitative relationship between forest growth
rates and Thematic Mapper reflectance measurements. International Journal of Remote Sensing. 12
(3): 387-400
Brown, S.A.J. and A.E Lugo (1989). Biomass estimation methods for tropical forests with application to
forest inventory data. For Sci. 35 (4): 881-902.
Brown, S.A.J. 1997. Estimating Biomass and Biomass Change of Tropical Forests: a Primer. FAO
Forestry Paper – 134. Food and Agriculture Organization: Rome.
CENTURY (1992) Soil Organic Matter Model Environment, Technical Documentation, Agroecosystem
Version 4.0, Colorado State Univeristy, Fort Collins, CO 80523.
Coleman, K. & Jenkinson, D.S. (1995) RothC-26 3. A model for the turnover of carbon in soil: model
description and users guide. ISBN 0951 4456 69.
Coleman, K. & Jenkinson, D.S. (1995) RothC-26 3. A model for the turnover of carbon in soil. In:
"Evaluation of soil organic matter models using existing long-term datasets." (Ed: D.S. Powlson, P.
Smith & J.U. Smith), NATO ASI Series I, Volume 38, Springer-Verlag, Heidelberg: 237-246.
De Wit, C.T., Goudriaan J., van Laar H. H., Penning de Vries, F.W.T. Rabbinge, R. van Keulen, H.,
Louwerse W., Sibma, L. and C. De Jonge (1978) Simulation of assimilation, respiration and
transpiration of crops. Centre for Agricultural Publishing and Documentation (PUDOC), Wageningen,
The Netherlands.
Fazakas, Z., M. Nilsson and H. Olsson (1999) Regional forest biomass and wood volume estimation using satellite data and ancillary data. Agricultural and Forest Meteorology 98-99: 417-425.
FAO (1978) Methodology for assessing soil degradation. Report on the FAO/UNEP expert consultation.
Rome 25-27 January 1978. Rome.
FAO (1984) Guidelines: land evaluation for rainfed agriculture. Soils Bulleting 52. FAO. Rome.
FAO (1998) Estimating biomass and biomass change of tropical forests: A premier. FAO Forestry Paper
134. Food and Agriculture Organization of the United Nations, Rome
FAO (1999). Pevention of land degradation, enhancement of carbon sequestration and conservation of biodiversity through land use change and sustainable land management with a focus on Latin America
and the Caribbean. Proceedings of a FAO/IFAD Expert Consultation, IFAD, Rome.
Foody, M., G. Palubinskas, M. Lucas, P. Curran, and M. Honzak, (1996) Identifying terrestrial carbon
sinks: Classification of successional stages in regenerating tropical forest from Landsat TM data.
Remote Sensing of Environment. 55: 205-216.
Friedl M., D. McIver, J. Hodges, et al (2002) Global land cover mapping from MODIS: algorithms and
early results. Remote Sensing of Environment 83: 287-302.
25
Houghton, R., K. Lawrence, J. Hackler and S. Brown (2001) The spatial distribution of forest biomass in
the Brazilian Amazon: a comparison of estimates. Global Change Biology. 7: 731-746.
IPCC (2003) Good Practice Guidance for land use, land use change and forestry. Intergovernmental Panel
on Climate Change. IPCC Greenhouse Gas Inventory Programme. Kanagawa, Japan.
Jenkinson, D.S. and Rayner, J.H. 1977. The turnover of soil organic matter in some of the Rothamsted
classical experiments. Soil Science 123, 298-305.
Jenkinson, D.S., Hart, P.B.S., Rayner, J.H. and Parry, L.C. 1987. Modelling the turnover of organic matter
in long-term experiments at Rothamsted. INTECOL Bulletin 15, 1-8
Jenkinson, D.S. 1990. The turnover of organic carbon and nitrogen in soil. Philosophical transactions of
the Royal Society, B. 329, 361-368. Jenkinson, D.S., Harkness, D.D., Vance, E.D., Adams, D.E. and Harrison, A.F.(1992). Calculating net
primary production and annual input of organic matter to soil from the amount and radiocarbon content
of soil organic matter. Soil Biology and Biochemistry 24(4), 295-308.
Joint Research Centre (2003) Land use change monitoring in the framework of the UNFCCC and its Kyoto
Protocol: report on current capabilities of satellite remote sensing technology. Joint Research Centre of
the European Commission. Ispra, Italy.
Jones, C.A., P.T. Dyke, J.R. Williams, J.R. Kinery, V.W. Benson and R.H. Griggs (1991). EPIC: an operational model for evaluation of agricultural sustainability. Agricultural Systems 35:341-350.
Luckman A., J. Baker, T. Mora, F. Corina da Costa, C.A. Frery (1997). A study of the Relationship
between Radar Backscatter and Regeneration Tropical Forest Biomass for Spaceborne SAR
instruments. Remote Sensing of Environment, 60:1-13.
Mac Dicken, K.G. (1998) A Guide to monitoring Carbon Storage in forestry and agroforestry projects.
Winrock International Institute for Agricultural Development. USA.
Magurran, A.E. (1988) Ecological Diversity and its Measurement. Princeton University Press, Princeton,
N. J.
Nageswara P.P. and A. Mohankumar (1994) Cropland inventory in the command area of Krishnarajasagar
project using satellite data. International Journal of Remote Sensing. 15(6): 1295-1305. Nelson, B., D. Kimes, W. Salas and M. Routhier (2000) Secondary forest age and tropical forest biomass
estimation using thematic mapper imagery. Bioscience. 50: 419-431.
Parton, W.J., R. McKeown, V. Kirchner, D. Ojima (1992) CENTURY Users' Manual, Natural Resource
Ecology Laboratory, Colorado State University, Ft. Collins
Ponce-Hernandez, R. (1999) Assessing the carbon stock and carbon sequestration potential of current and
potential land use systems and the economic rationality of land use conversions. In World Soil
Resources Report 86, pp 77-92, FAO , Rome.
Ponce-Hernandez, R. (2004) Assessing carbon stocks and modelling win-win scenarios of carbon carbon
sequestration through land use changes. FAO, Rome.
Rossiter, D. G. (1995) ALES: Automated Land Evaluation System. User’s manual. Cornell University, Ithaca, New York.
Running, S. W., T. R. Loveland and L. L. Pierce (1994) A vegetation classification logic based on remote
sensing for use in global scale biogeochemical models. Ambio 23: 77-81
Secretariat of the Convention on Biological Diversity (2003) Interlinkages between biological diversity
and climate change: advice on the integration of biodiversity considerations into the implementation of
the UNFCCC and its Kyoto Protocol. CBD Technical Series No. 10
SOMNET (1999) http://saffron.res.bbsrc.ac.uk/cgi-bin/somnet-models Van Diepen, C. A., Wolf, J. van Keulen, H. and C. Rapoldt (1989) WOFOST: a simulation model of
crop production. Soil Use and Management 5(1) 16-24
Whittaker, R.A. (1972) Evolution and measures of species diversity. Taxon. 21: 213-251
Winrock International Institute for Agricultural Development (1998) A Guide to monitoring Carbon
Storage in forestry and agroforestry projects. Winrock International Institute, Forest Carbon
Monitoring and Verification Services, USA.
NOTE DI LAVORO DELLA FONDAZIONE ENI ENRICO MATTEI Fondazione Eni Enrico Mattei Working Paper Series
Our Note di Lavoro are available on the Internet at the following addresses: http://www.feem.it/Feem/Pub/Publications/WPapers/default.htm
http://www.ssrn.com/link/feem.html http://www.repec.org
http://agecon.lib.umn.edu http://www.bepress.com/feem/
NOTE DI LAVORO PUBLISHED IN 2007 NRM 1.2007 Rinaldo Brau, Alessandro Lanza, and Francesco Pigliaru: How Fast are Small Tourist Countries Growing? The
1980-2003 Evidence PRCG 2.2007 C.V. Fiorio, M. Florio, S. Salini and P. Ferrari: Consumers’ Attitudes on Services of General Interest in the EU:
Accessibility, Price and Quality 2000-2004 PRCG 3.2007 Cesare Dosi and Michele Moretto: Concession Bidding Rules and Investment Time Flexibility IEM 4.2007 Chiara Longo, Matteo Manera, Anil Markandya and Elisa Scarpa: Evaluating the Empirical Performance of
Alternative Econometric Models for Oil Price Forecasting PRCG 5.2007 Bernardo Bortolotti, William Megginson and Scott B. Smart: The Rise of Accelerated Seasoned Equity
Underwritings CCMP 6.2007 Valentina Bosetti and Massimo Tavoni: Uncertain R&D, Backstop Technology and GHGs Stabilization CCMP 7.2007 Robert Küster, Ingo Ellersdorfer, Ulrich Fahl (lxxxi): A CGE-Analysis of Energy Policies Considering Labor
Market Imperfections and Technology Specifications CCMP 8.2007 Mònica Serrano (lxxxi): The Production and Consumption Accounting Principles as a Guideline for Designing
Environmental Tax Policy CCMP 9.2007 Erwin L. Corong (lxxxi): Economic and Poverty Impacts of a Voluntary Carbon Reduction for a Small
Liberalized Developing Economy: The Case of the Philippines CCMP 10.2007 Valentina Bosetti, Emanuele Massetti, and Massimo Tavoni: The WITCH Model. Structure, Baseline, Solutions SIEV 11.2007 Margherita Turvani, Aline Chiabai, Anna Alberini and Stefania Tonin: Public Policies for Contaminated Site
Cleanup: The Opinions of the Italian Public CCMP 12.2007 M. Berrittella, A. Certa, M. Enea and P. Zito: An Analytic Hierarchy Process for The Evaluation of Transport
Policies to Reduce Climate Change Impacts NRM 13.2007 Francesco Bosello, Barbara Buchner, Jacopo Crimi, Carlo Giupponi and Andrea Povellato: The Kyoto
Protocol and the Effect of Existing and Planned Measures in the Agricultural and Forestry Sector in the EU25 NRM 14.2007 Francesco Bosello, Carlo Giupponi and Andrea Povellato: A Review of Recent Studies on Cost Effectiveness of
GHG Mitigation Measures in the European Agro-Forestry Sector CCMP 15.2007 Massimo Tavoni, Brent Sohngen, and Valentina Bosetti: Forestry and the Carbon Market Response to Stabilize
Climate ETA 16.2007 Erik Ansink and Arjan Ruijs: Climate Change and the Stability of Water Allocation Agreements ETA 17.2007 François Gusdorf and Stéphane Hallegatte: Compact or Spread-Out Cities: Urban Planning, Taxation, and the
Vulnerability to Transportation Shocks NRM 18.2007 Giovanni Bella: A Bug’s Life: Competition Among Species Towards the Environment IEM 19.2007 Valeria Termini and Laura Cavallo: “Spot, Bilateral and Futures Trading in Electricity Markets. Implications for
Stability” ETA 20.2007 Stéphane Hallegatte and Michael Ghil: Endogenous Business Cycles and the Economic Response to Exogenous
Shocks CTN 21.2007 Thierry Bréchet, François Gerard and Henry Tulkens: Climate Coalitions: A Theoretical and Computational
Appraisal CCMP 22.2007 Claudia Kettner, Angela Köppl, Stefan P. Schleicher and Gregor Thenius: Stringency and Distribution in the
EU Emissions Trading Scheme –The 2005 Evidence NRM 23.2007 Hongyu Ding, Arjan Ruijs and Ekko C. van Ierland: Designing a Decision Support System for Marine Reserves
Management: An Economic Analysis for the Dutch North Sea CCMP 24.2007 Massimiliano Mazzanti, Anna Montini and Roberto Zoboli: Economic Dynamics, Emission Trends and the EKC
Hypothesis New Evidence Using NAMEA and Provincial Panel Data for Italy ETA 25.2007 Joan Canton: Redealing the Cards: How the Presence of an Eco-Industry Modifies the Political Economy of
Environmental Policies ETA 26.2007 Joan Canton: Environmental Taxation and International Eco-Industries CCMP 27.2007 Oscar Cacho and Leslie Lipper (lxxxii): Abatement and Transaction Costs of Carbon-Sink Projects Involving
Smallholders CCMP 28.2007 A. Caparrós, E. Cerdá, P. Ovando and P. Campos (lxxxii): Carbon Sequestration with Reforestations and
Biodiversity-Scenic Values CCMP 29.2007 Georg E. Kindermann, Michael Obersteiner, Ewald Rametsteiner and Ian McCallcum (lxxxii): Predicting the
Deforestation–Trend Under Different Carbon–Prices
CCMP 30.2007 Raul Ponce-Hernandez (lxxxii): A Modelling Framework for Addressing the Synergies between Global Conventions through Land Use Changes: Carbon Sequestration, Biodiversity Conservation, Prevention of Land Degradation and Food Security in Agricultural and Forested Lands in Developing Countries
(lxxxi) This paper was presented at the EAERE-FEEM-VIU Summer School on "Computable General Equilibrium Modeling in Environmental and Resource Economics", held in Venice from June 25th to July 1st, 2006 and supported by the Marie Curie Series of Conferences "European Summer School in Resource and Environmental Economics". (lxxxii) This paper was presented at the Workshop on “Climate Mitigation Measures in the Agro-Forestry Sector and Biodiversity Futures”, Trieste, 16-17 October 2006 and jointly organised by The Ecological and Environmental Economics - EEE Programme, The Abdus Salam International Centre for Theoretical Physics - ICTP, UNESCO Man and the Biosphere Programme - MAB, and The International Institute for Applied Systems Analysis - IIASA.
2007 SERIES
CCMP Climate Change Modelling and Policy (Editor: Marzio Galeotti )
SIEV Sustainability Indicators and Environmental Valuation (Editor: Anil Markandya)
NRM Natural Resources Management (Editor: Carlo Giupponi)
KTHC Knowledge, Technology, Human Capital (Editor: Gianmarco Ottaviano)
IEM International Energy Markets (Editor: Matteo Manera)
CSRM Corporate Social Responsibility and Sustainable Management (Editor: Giulio Sapelli)
PRCG Privatisation Regulation Corporate Governance (Editor: Bernardo Bortolotti)
ETA Economic Theory and Applications (Editor: Carlo Carraro)
CTN Coalition Theory Network