a method for strategic scenario-based architecting
TRANSCRIPT

A Method for Strategic Scenario-Based Architecting
1Mugurel T. Ionita,
2Pierre America and
1Dieter K. Hammer
1Eindhoven University of Technology,
2Philips Research
[email protected]; [email protected]; [email protected]
Abstract
Strategic decisions have to be made when long-lasting architectures for software-intensive systems are
developed. It is a good idea to consider various changes
in the business environment before the final system
architecture is proposed. Since the future cannot be
predicted accurately, strategic scenarios are a useful way
of guiding the strategic decision-making process. Strategic scenarios can be defined as stories that describe
plausible futures; they are particularly useful for guiding
one’s perception of the future.
This paper presents our approach to the use of
strategic scenarios for directing the strategic and tactical decision-making process when developing long-lasting
system architectures. This approach was applied in a case
study carried out in the medical imaging domain.
1. Introduction
Organizations that develop long-lasting architectures
for software-intensive systems find themselves faced with
a complex situation. On the one hand, they are under
increasing pressure from their competitors on the market
and, on the other hand, they are faced with a highly
uncertain future business context. In order to deal with
these two issues effectively, organizations have to
carefully research the future and prepare for it. It is
impossible to predict the future with all relevant details.
However, it is possible to construct pictures of a variety
of plausible futures and to use these when making long-
term decisions; this process is called strategic planning.
The process of strategic planning emerged as a
discipline in the late 50s [8]. Initially a rigid activity
intended to deliver the best strategy for the one and only
envisaged future, it evolved into an agile process focused
on the adaptability of the organization to adapt to the
changes in the business environment [9][15].
In literature, scenarios are advocated as powerful tools
that support the strategic planning process. For strategic
planning, a scenario is defined as a story describing a
plausible future, hereafter called strategic scenario [19].
At Philips Research we conducted a case study in
which we looked at how to incorporate the strategic
scenarios in the planning and decision-making process
when developing long-lasting system architectures [16]. In
this paper we present the resulting method.
The remainder of this paper is organized as follows.
Section 2 outlines the business rationale for taking a
scenario view on the systems architecting discipline, and
section 3 introduces our method for evolving long-lasting
software system architectures. Section 4 presents how we
applied the method in a case study. Section 5 ends the
paper with some conclusions.
2. Scenario-Based Approaches
Successful architectures are considered to be those that
can survive over a long period of time, and are therefore
able to adapt constantly to new market requirements [3],
[16]. However, experience shows that it is impossible to
build a flexible architecture that can deal equally well
with any future change. Organizations that develop long-
lasting system architectures must therefore possess a deep
understanding of the various business contexts in which
the future systems might have to function, carefully
analyze these contexts, and try to adapt the architectures
accordingly. However, it is not actually possible to predict
the future accurately. Instead, methods have been
developed for exploring a variety of plausible futures.
Such methods include scenario analysis, judgmental and
technological forecasting – also called roadmapping [6].
Some kinds of scenarios are proposed for managing
the complexity of the design process [7]. Here, scenarios
are stories for managing the complexity of the software
design by concretization rather than abstraction. Scenarios
are used to understand stakeholders’ needs, envisioning
activities and learning how the future system will be used.
They are used instead of designing software architectures
by listing requirements and functional specifications.
Scenarios are also used for making architecting
decisions, approaches called sensitivity analysis [14], or
for describing possible changes in the requirements for
the software architecture; established approaches include
SAAM (Software Architecture Analysis Method), ATAM
(Architecture Trade-off Analysis Method), or CBAM
(Cost-Benefit Analysis Method) [5]. However, these
approaches are not clear on how to choose the future
changes of the software architecture.
Our research focuses on using strategic scenarios and
forecasting methods to support the decision process in the
early phases of the architecting process. A method for
Strategic Scenario-Based Architecting (SSBA) has been
developed.
0-7695-2268-8/05/$20.00 (C) 2005 IEEE
Proceedings of the 38th Hawaii International Conference on System Sciences - 2005
1Authorized licensed use limited to: Wuhan University. Downloaded on April 7, 2009 at 19:31 from IEEE Xplore. Restrictions apply.

3. The SSBA Method
The goal of the SSBA method is to provide a step-by-
step approach for evolving system architectures that are
more future-proof, i.e. architectures that are more resilient
to future change. In order to accomplish this goal we
studied the following issues:
What are suitable methods for exploring the long-
term future for supporting strategic decision making?
How can strategic business decisions be translated
into concrete architectural solutions?
How can the feasibility of the proposed architectural
solutions be analyzed?
The SSBA method has been developed to answer these
questions. It consists of the steps shown in Figure 1.
- Product Portfolio
- Market Segmentation
2. Business Strategies
Bu
sin
ess
En
vir
on
men
t
Co
nseq
uen
ces
Tac
tical
Mo
ves
1. Strategic
Scenarios
Different plausible futures
3. Architectural Scenarios
as responses to the
business strategies
4. Scenarios Feasibility
estimated per
strategic scenario
- Product Portfolio
- Market Segmentation
2. Business Strategies
- Product Portfolio
- Market Segmentation
2. Business Strategies
Bu
sin
ess
En
vir
on
men
t
Co
nseq
uen
ces
Tac
tical
Mo
ves
1. Strategic
Scenarios
Different plausible futures
3. Architectural Scenarios
as responses to the
business strategies
4. Scenarios Feasibility
estimated per
strategic scenario
Figure 1: The SSBA Method Steps
Step 1: Develop Strategic Scenarios
In this step we explore the future business environment
using scenarios. The goal of this activity is to create the
context for making strategic architectural decisions. To
create these scenarios we followed the approach proposed
by Schwartz [18]. This approach proposes an iterative
scenario-building process that starts by isolating the
decision to be made, then identifies the key elements that
would affect the decision, and finishes by constructing
several scenario plot lines, analyzing their implications
and refining them by seeking yet more key elements.
The results of this step are a set of strategic scenarios
that describe different plausible futures.
Typically, business analysts perform this step. The
effort to perform this step is usually 2 to 3 person-months.
However, this is an iterative and incremental process,
which spreads out usually over a whole year.
Step 2: Propose Business Strategies
In step two, different business strategies are proposed
as responses of the organization to the external
opportunities and possible threats. A business strategy can
be defined as “the actions that need to be taken to achieve
the organization’s goals” [10]. For example, if the
objective is to improve the profitability of an
organization, one can choose between a standardization
strategy, which focuses on reducing the operational costs,
and a customization strategy, which focuses on improving
the market value of the product.
In order to come up with sound strategies one might
have to look into the current product portfolio of the
organization and the type and size of the different market
segments at which the new product is targeted.
Business strategists are involved in this step. There is
some involvement from architects. The business
strategists will design the business strategies, while the
architects will provide feedback on the technical
feasibility. The estimated effort in performing this step is
usually 1 to 2 person-months.
Step 3: Create Architectural Scenarios
In this step various architectural solutions are proposed
as possible implementations of the business strategies
defined in step 2.
Architecture descriptions typically contain different
views [13][17]. For describing the architectural solutions,
in our case study we chosen to use an in-house model
consisting of five views, namely Customer, Application,
Functional, Conceptual and Realization (CAFCR) [1][16].
For dealing with the possible variations within each view
we use variation models [2][3]. Finally, the proposed
architectures are described by means of architectural
scenarios. An architectural scenario is a set of specific and
consistent choices from the various variation models [3].
This step gives rise to a couple of architectural
scenarios intended to implement the specific business
strategies defined in the previous step.
Architects and system designers carry out this step.
The effort in performing this step can be up to 8 person-
months, depending on the complexity of the system under
consideration.
Step 4: Analyze the Scenarios Feasibility
In the last step the proposed architectural scenarios are
analyzed according to how well they help the organization
achieve its strategic and business objectives.
In this step, the architects need to ensure that the
proposed scenarios are able to satisfy the customer
objectives in terms of provided functionality, quality, and
price. A method for systematic quantitative analysis of
scenario heuristics (SQUASH) [11][12], has been
developed in SSBA to enable this task to be carried out.
0-7695-2268-8/05/$20.00 (C) 2005 IEEE
Proceedings of the 38th Hawaii International Conference on System Sciences - 2005
2Authorized licensed use limited to: Wuhan University. Downloaded on April 7, 2009 at 19:31 from IEEE Xplore. Restrictions apply.
In this step we question primarily the feasibility of the
proposed solutions in the business contexts described by
the different strategic scenarios from step 1. The effort
required in performing this step is usually 2 to 4 person-
months
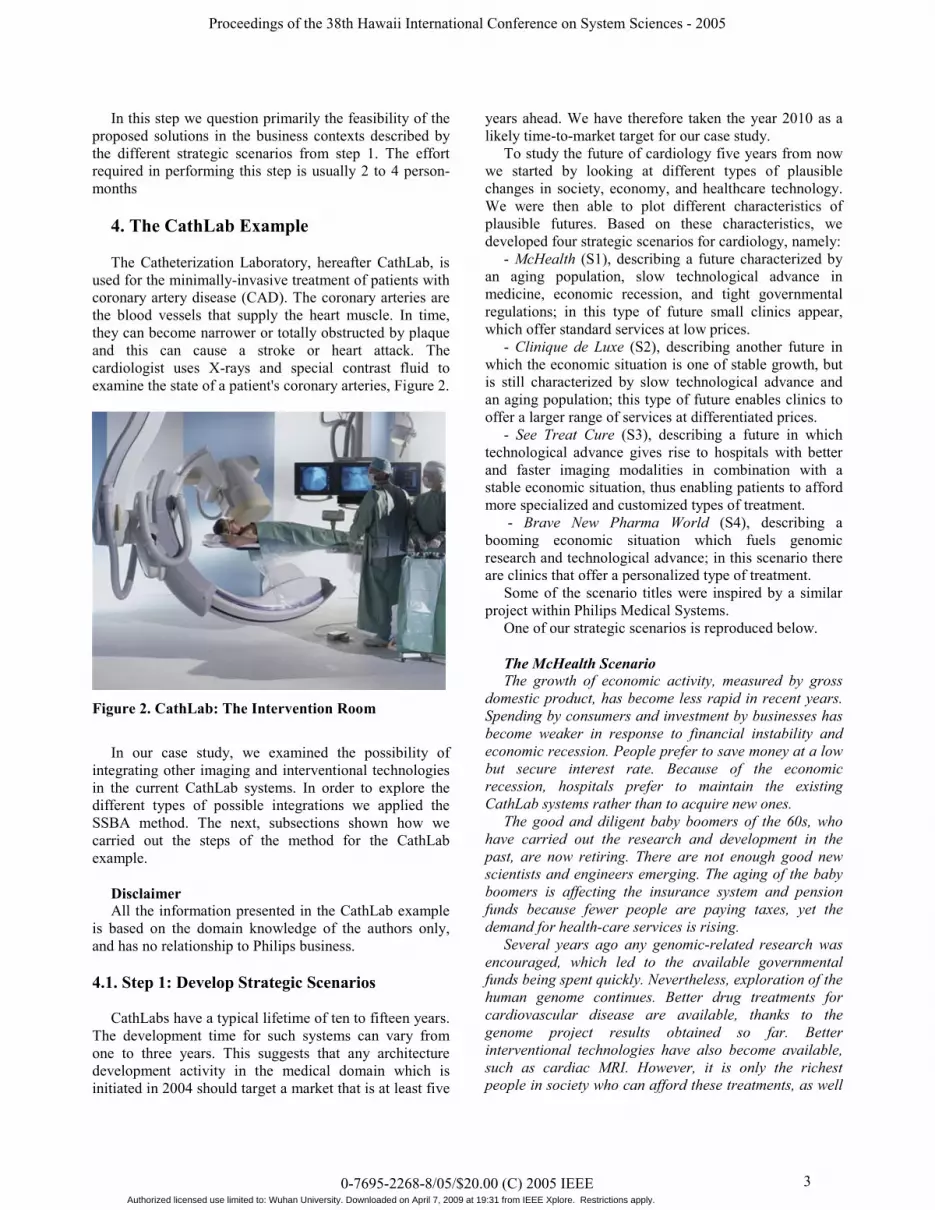
4. The CathLab Example
The Catheterization Laboratory, hereafter CathLab, is
used for the minimally-invasive treatment of patients with
coronary artery disease (CAD). The coronary arteries are
the blood vessels that supply the heart muscle. In time,
they can become narrower or totally obstructed by plaque
and this can cause a stroke or heart attack. The
cardiologist uses X-rays and special contrast fluid to
examine the state of a patient's coronary arteries, Figure 2.
Figure 2. CathLab: The Intervention Room
In our case study, we examined the possibility of
integrating other imaging and interventional technologies
in the current CathLab systems. In order to explore the
different types of possible integrations we applied the
SSBA method. The next, subsections shown how we
carried out the steps of the method for the CathLab
example.
Disclaimer
All the information presented in the CathLab example
is based on the domain knowledge of the authors only,
and has no relationship to Philips business.
4.1. Step 1: Develop Strategic Scenarios
CathLabs have a typical lifetime of ten to fifteen years.
The development time for such systems can vary from
one to three years. This suggests that any architecture
development activity in the medical domain which is
initiated in 2004 should target a market that is at least five
years ahead. We have therefore taken the year 2010 as a
likely time-to-market target for our case study.
To study the future of cardiology five years from now
we started by looking at different types of plausible
changes in society, economy, and healthcare technology.
We were then able to plot different characteristics of
plausible futures. Based on these characteristics, we
developed four strategic scenarios for cardiology, namely:
- McHealth (S1), describing a future characterized by
an aging population, slow technological advance in
medicine, economic recession, and tight governmental
regulations; in this type of future small clinics appear,
which offer standard services at low prices.
- Clinique de Luxe (S2), describing another future in
which the economic situation is one of stable growth, but
is still characterized by slow technological advance and
an aging population; this type of future enables clinics to
offer a larger range of services at differentiated prices.
- See Treat Cure (S3), describing a future in which
technological advance gives rise to hospitals with better
and faster imaging modalities in combination with a
stable economic situation, thus enabling patients to afford
more specialized and customized types of treatment.
- Brave New Pharma World (S4), describing a
booming economic situation which fuels genomic
research and technological advance; in this scenario there
are clinics that offer a personalized type of treatment.
Some of the scenario titles were inspired by a similar
project within Philips Medical Systems.
One of our strategic scenarios is reproduced below.
The McHealth Scenario
The growth of economic activity, measured by gross
domestic product, has become less rapid in recent years.
Spending by consumers and investment by businesses has
become weaker in response to financial instability and
economic recession. People prefer to save money at a low
but secure interest rate. Because of the economic recession, hospitals prefer to maintain the existing
CathLab systems rather than to acquire new ones.
The good and diligent baby boomers of the 60s, who
have carried out the research and development in the
past, are now retiring. There are not enough good new scientists and engineers emerging. The aging of the baby
boomers is affecting the insurance system and pension
funds because fewer people are paying taxes, yet the
demand for health-care services is rising.
Several years ago any genomic-related research was
encouraged, which led to the available governmental funds being spent quickly. Nevertheless, exploration of the
human genome continues. Better drug treatments for
cardiovascular disease are available, thanks to the
genome project results obtained so far. Better
interventional technologies have also become available,
such as cardiac MRI. However, it is only the richest people in society who can afford these treatments, as well
0-7695-2268-8/05/$20.00 (C) 2005 IEEE
Proceedings of the 38th Hawaii International Conference on System Sciences - 2005
3Authorized licensed use limited to: Wuhan University. Downloaded on April 7, 2009 at 19:31 from IEEE Xplore. Restrictions apply.

as MRI or CT screenings and regular preventive controls,
because they are not paid for by insurance companies, or
government. Only the most efficient hospitals can afford to remain
open in the face of increasing economic pressure. This
results in lower subsidies and fewer young graduates
specializing in the cardiovascular field. Instead, fast
treatment clinics are appearing. They offer boutique
services, which for cardiology consists of a standard echo-cardio diagnosis and catheterisation using X-ray.
Some of these clinics offer also premium services like
IVUS, cardiac MR and CT to attract the rich. The success
of these clinics lies in their ability to reduce costs.
Patients with coronary artery disease (CAD) receive
standard treatment, no more personal than the service of a fast food restaurant.
However, the fast clinics perform very well also in
Asia and Eastern Europe.
The catheterization is now performed much faster than
in the year 2000. The clinics have invested in information
management systems to reduce the bottlenecks in the patient information handling process. Together with the
doubling of computing power almost every two years, this
has enabled a higher throughput in the treatment of CAD.
Some suppliers have introduced multi-processor
machines using processors of 10GHz and higher to enable the 3D reconstruction of the heart vessels in real
time. Although they have developed new interventional
technologies for the CathLab, such as IVUS, or cardiac
MRI, these technologies have not yet been adopted by the
fast treatment clinics.
The economic recession also affects the life-style of the population. Only a minority practise sport, whilst the
majority live on an unhealthy diet. People do not have
time for regular checks, preferring to visit the fast
treatment clinics when problems occur. They believe the
standard medical treatment they receive in the fast clinics
to be good enough.
4.2. Step 2: Propose Business Strategies
After scouting out different futures and understanding
their possible consequences and impact on the current
CathLab systems, we design specific business strategies.
In order to come up with reasonable strategies, we have to
also look at possible changes in the CathLab markets, and
customer segments - for both, the CathLab customers
(hospitals and clinics), and their customers (CAD
patients).
Patient Segmentation
Statistics show that in 2001 about 2,365,000 cardiac
catheterizations and angioplasty procedures were
performed in the Unites States alone, with an average
growth of about 5% per year [4]. By extrapolating this
information, we learn that in 2010 the potential CAD
market size will be of about 5 million interventions.
The reason for which we consider the CAD patient
market size is because we want to be able to anticipate the
future patient load for our customers, and its implications.
Moreover, we want to study also the preferences and
objectives of the different types of CAD patients, so that
we can anticipate the type of treatments that should be
available for these patients. For structuring this analysis
we create a patient segmentation. The characteristics of
each segment are described with so-called patient
scenarios.
We constructed four such patient segments, namely:
- The Minimalist Segment – this type of patients are
interested in fast and standard CAD treatment, with high
accuracy, good treatment outcome, at a low price.
- The BioMed Segment – this type of patients are also
interested in standard, accurate and low price CAD
treatment, but unlike the Minimalists, the BioMeds like to
have all kinds of gadgets at home, such as devices for
measuring blood pressure, cholesterol level, sugar level,
stress level, weight, etc. They have a more preventive
attitude towards the CAD disease.
- The Modernist Segment – this type of patients can
afford a higher quality of treatment. Modernists require
more advanced diagnosis technologies. However, they do
not pay much attention to CAD prevention.
- The Premium Segment – this type of patients are the
top customers of the CathLab. Premiums are interested in
accurate and personalized CAD diagnosis and treatment.
One such segment is characterized below:
The Minimalist Patient, “If it ain’t broke I won’t fix it” - I am the type of patient who only requests CAD
diagnosis or treatment when problems occur. I am too
busy to think about prevention or I have no means to do
so. I prefer standard services at a low price. These
services are good enough for me. I will only seek more
specialized services or clinics if my state of health becomes critical.
Based on market data, we quantify the size of the
different patient segments for each strategic scenario, as
shown in Table 1.
Table 1: Estimates Patient Segments Size in 2010
Patient Segment (pk)
Str
ateg
ic
Sce
nar
io
(sm)
Minimalist BioMed Modernist Premium
S1
S2
S3
S4
where, = 500,000 patients, and = ½ .
0-7695-2268-8/05/$20.00 (C) 2005 IEEE
Proceedings of the 38th Hawaii International Conference on System Sciences - 2005
4Authorized licensed use limited to: Wuhan University. Downloaded on April 7, 2009 at 19:31 from IEEE Xplore. Restrictions apply.

Customer Segmentation
According to American Heart Association [4], in the
United States are currently about 1,774 healthcare
institutions offering angioplasty and catheterization
services.
Looking at the landscape offered by the strategic
scenarios, patient scenarios, we observe a specialization
of the cardiac-healthcare institutions into two main types:
• One is the type of mass treatment hospitals,
offering standard CAD treatment services, and
thus requiring efficient CathLab systems for
supporting high patient throughput workflows.
• Second is the type of more specialized clinics,
offering higher quality of treatment and comfort
for the CAD patients. In this type of clinics high
patient throughput is not an issue.
The distribution of the patient types per healthcare
institution type is depicted in Table 2. For the sake of
brevity we considered that this distribution is independent
of the strategic scenario considered.
Table 2: The Distribution of Patient per Institutions
(pk) Mass Treatment Hospitals
(h)
Specialized Clinics
(c)
Minimalist 97% 3%
BioMed 79% 21%
Modernist 55% 45%
Premium 25% 75%
For all m strategic scenarios, m=1 to 4, based on Table
1 and Table 2, with the formulas (1) and (2), we calculate
the number of patients per customer segment.
(1) 4
1
m k k m
k
h( s ) h( p )* p ( s )=
=
(2) 4
1
m k k m
k
c( s ) c( p )* p ( s )=
=
The resulted data is shown in Table 3.
Table 3: Estimated Number and Type of Patients per
Strategic Scenario for 2010
(sm) Mass Treatment Hospitals
(h)
Specialized Clinics
(c)
S1 3.950.000 1.050.000 S2 3.545.000 1.455.000
S3 3.185.000 1.815.000
S4 3.005.000 1.995.000
To come to the number of CathLab systems required
per institution, for the different strategic scenarios we
estimated 800 patients per CathLab (p/CL) for the mass
treatment hospitals, and 300p/CL for the specialized
clinics. Based on the data from Table 3 we calculated
with (3) and (4) the CathLab market size for each
strategic scenario.
(3) 800
mm
h( s )LCL( s ) = ; (4)
300
mm
c( s )HCL( s ) =
The result is shown in Table 4.
Table 4: The Required Number and Type of CathLabs
per Strategic Scenario for 2010
(sm) Low-end CathLabs
(LCL)
High-end CathLabs
(HCL)
S1 4.938 3.500 S2 4.431 4.850
S3 3.981 6.050
S4 3.756 6.650
The replacement rate of these CathLabs is 8 years for
the low end CathLabs (LCL) and 5 years for the high-end
CathLabs (HCL), Table 4.
If the number of CathLabs on the market is currently
estimated at 3200, out of which 2⁄3 are LCLs for mass
treatment hospitals, and 1⁄3 are HCLs for specialized
clinics, we can calculate with (5) and (6) the market size
for the new low-end CathLabs (NLCL), and new high-end
CathLabs (NHCL) required for 2010 as, Table 5.
(5) 2
32003
m mNLCL( s ) LCL( s )= −
(6) 1
32003
m mNHCL( s ) HCL( s )= −
Table 5: Estimated Number of New CathLabs
Required for 2010
(sm) New Low-end CathLabs
(NLCL)
New High-end CathLabs
(NHCL)
S1 2.804 2.433 S2 2.298 3.783
S3 1.848 4.983
S4 1.623 5.583
To estimate the required CathLab market for 2010, we
consider a replacement rate of 8 years for the existing
low-end CathLabs, respectively 5 years for the high-end
CathLabs, to which we add the demand per year of new
CathLabs for each segment. The resulting CathLab
market size figures for 2010 are presented in Table 6.
The Business Strategies
Summarizing the findings about the CathLab
customers and the CAD patients, the situation looks as
0-7695-2268-8/05/$20.00 (C) 2005 IEEE
Proceedings of the 38th Hawaii International Conference on System Sciences - 2005
5Authorized licensed use limited to: Wuhan University. Downloaded on April 7, 2009 at 19:31 from IEEE Xplore. Restrictions apply.
follows. The strategic scenario S1 projects a high demand
of Low-end CathLabs versus a moderate demand of more
expensive High-end CathLabs, (i.e. 4.138 versus 2.647),
Table 6. In scenario S2 the demand for the two CathLab
types is almost equal (i.e. 3.631 versus 3.997), Table 6.
While the scenarios S3 and S4 project low sales for the
low-end CathLabs and high sales for the expensive high-
end CathLabs.
Table 6: Estimated CathLab Sales for 2010
(sm) Low-end CathLabs High-end CathLabs
S1 4.138 2.647 S2 3.631 3.997
S3 3.181 5.197
S4 2.956 5.797
Based on these observations, one can notice that there
are two major trends – (1) standardization of services,
required in times of recession, or stable economic
situation (e.g. S1, S2, S3) by people with low and average
income (e.g. Minimalists and Bio-Meds); and (2)
diversification of services and specialized treatment,
especially required in times of a booming economy, by
people with higher incomes. Therefore, we created two
main strategies following these trends, namely:
• A standardization strategy, which focuses on
producing efficient CathLabs with standard
functionality, improved workflow, improved
accuracy, and low intervention costs.
• And a customization strategy, which focuses on
producing effective CathLabs that support
personalized treatment, higher quality of care,
and higher accuracy of the interventions.
The two strategies will be used to shape the
architecting process in the next step.
4.3 Step 3: Create Architectural Scenarios
In this step we study what possible CathLab
configurations could be used to successfully implement
the two business strategies proposed in the previous step.
To implement the standardization strategy we first
focus on optimizing the current CathLab with respect to
intervention duration, intervention cost, personnel
involved, and image reconstruction duration. This aims to
satisfy the requirements of the mass patient segment.
Workflow optimization keeps the standard interventional
steps in place, but provides faster ways to achieve the
result. For this we study the usability and performance
aspects of the existing CathLab and improve the existing
bottlenecks.
Still within the context of the standardization strategy,
we then focus on improving the intervention accuracy
offered by the existing CathLab, but still bear in mind
issues such as cost effectiveness and waiting-time
optimization. Here we introduce new technologies like
intravascular ultrasound (IVUS), which help to increase
substantially the intervention accuracy. These
technologies address the strategic objectives of In-house
BioMeds and some Modernists.
To implement the customization strategy, which
targets the higher classes of customers, such as the
Modernists and Premiums, we shift the focus to softer
attributes that involve a higher development time and
cost, such as quality of care, accuracy of treatment and so
forth. Our aim was to integrate technologies that will not
necessarily improve the patient workflow or keep the
interventional costs at a low level, but that can help
cardiologists to offer specialized services for each type of
cardiac disease, personalized treatment for different types
of patients, age groups, or stages of the disease. For this
purpose, we looked into new diagnostic and interventional
imaging technologies such as magnetic resonance (MR).
In this step we want to describe and document the
architectural choices from different viewpoints. For this
we made use of variation models and represented the
choices in the CAFCR model.
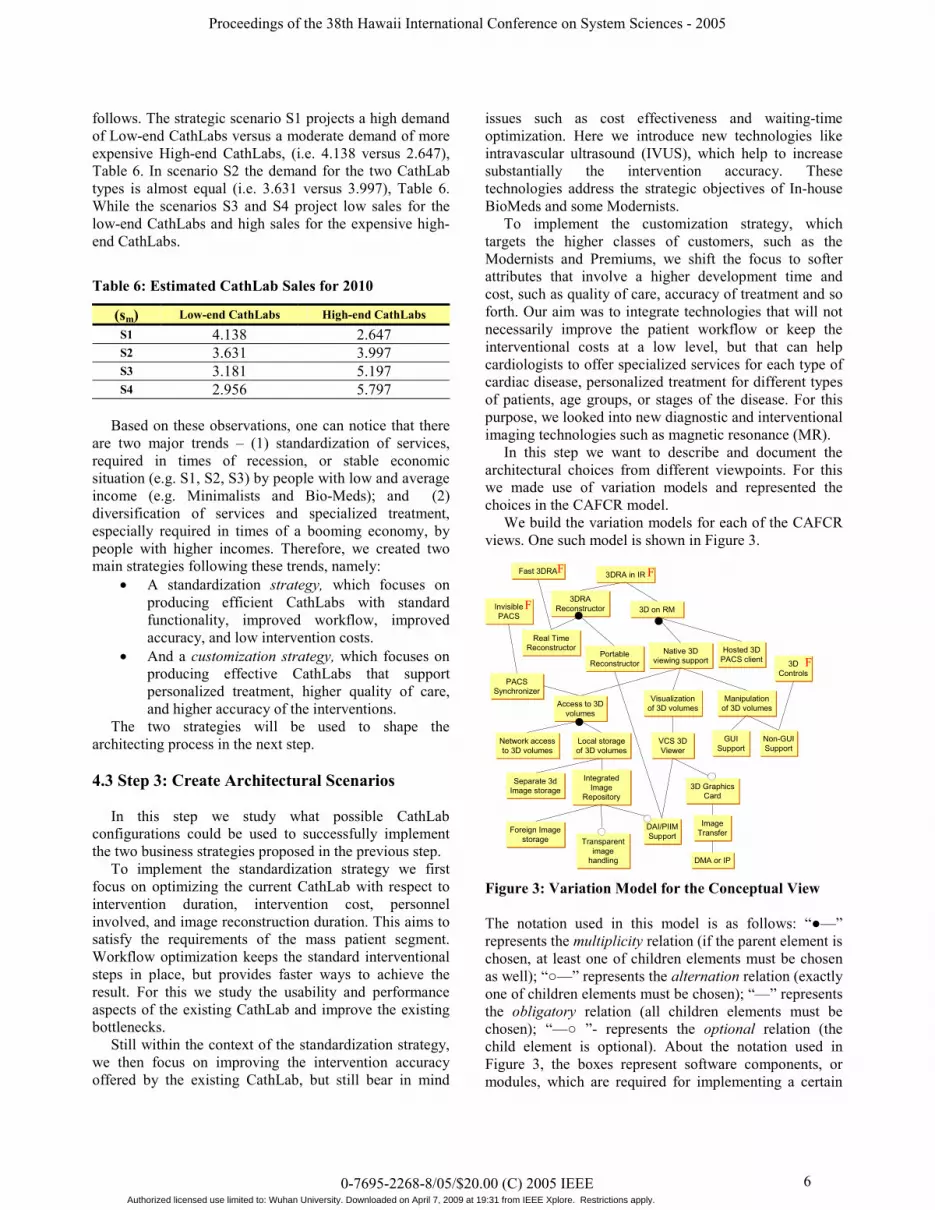
We build the variation models for each of the CAFCR
views. One such model is shown in Figure 3.
Invisible
PACS
Invisible
PACS
PACS
Synchronizer
PACS
Synchronizer
Fast 3DRAFast 3DRA
Real Time
Reconstructor
Real Time
Reconstructor
3DRA
Reconstructor
3DRA
Reconstructor
Portable
Reconstructor
Portable
Reconstructor
3DRA in IR3DRA in IR
3D on RM3D on RM
Native 3D
viewing support
Native 3D
viewing support
Access to 3D
volumes
Access to 3D
volumes
Network access
to 3D volumes
Network access
to 3D volumesLocal storage
of 3D volumes
Local storage
of 3D volumes
Visualization
of 3D volumes
Visualization
of 3D volumesManipulation
of 3D volumes
Manipulation
of 3D volumes
Hosted 3D
PACS client
Hosted 3D
PACS client
Integrated
Image
Repository
Integrated
Image
Repository
Separate 3d
Image storage
Separate 3d
Image storage
DAI/PIIM
Support
DAI/PIIM
Support
VCS 3D
Viewer
VCS 3D
Viewer
Foreign Image
storage
Foreign Image
storage Transparent
image
handling
Transparent
image
handling
3D Graphics
Card
3D Graphics
Card
Image
Transfer
Image
Transfer
DMA or IPDMA or IP
F
F F
GUI
Support
GUI
SupportNon-GUI
Support
Non-GUI
Support
3D
Controls
3D
Controls
F
Invisible
PACS
Invisible
PACS
PACS
Synchronizer
PACS
Synchronizer
Fast 3DRAFast 3DRA
Real Time
Reconstructor
Real Time
Reconstructor
3DRA
Reconstructor
3DRA
Reconstructor
Portable
Reconstructor
Portable
Reconstructor
3DRA in IR3DRA in IR
3D on RM3D on RM
Native 3D
viewing support
Native 3D
viewing support
Access to 3D
volumes
Access to 3D
volumes
Network access
to 3D volumes
Network access
to 3D volumesLocal storage
of 3D volumes
Local storage
of 3D volumes
Visualization
of 3D volumes
Visualization
of 3D volumesManipulation
of 3D volumes
Manipulation
of 3D volumes
Hosted 3D
PACS client
Hosted 3D
PACS client
Integrated
Image
Repository
Integrated
Image
Repository
Separate 3d
Image storage
Separate 3d
Image storage
DAI/PIIM
Support
DAI/PIIM
Support
VCS 3D
Viewer
VCS 3D
Viewer
Foreign Image
storage
Foreign Image
storage Transparent
image
handling
Transparent
image
handling
3D Graphics
Card
3D Graphics
Card
Image
Transfer
Image
Transfer
DMA or IPDMA or IP
F
F F
GUI
Support
GUI
SupportNon-GUI
Support
Non-GUI
Support
3D
Controls
3D
Controls
F
Figure 3: Variation Model for the Conceptual View
The notation used in this model is as follows: “ —”
represents the multiplicity relation (if the parent element is
chosen, at least one of children elements must be chosen
as well); “ —” represents the alternation relation (exactly
one of children elements must be chosen); “—” represents
the obligatory relation (all children elements must be
chosen); “— ”- represents the optional relation (the
child element is optional). About the notation used in
Figure 3, the boxes represent software components, or
modules, which are required for implementing a certain
0-7695-2268-8/05/$20.00 (C) 2005 IEEE
Proceedings of the 38th Hawaii International Conference on System Sciences - 2005
6Authorized licensed use limited to: Wuhan University. Downloaded on April 7, 2009 at 19:31 from IEEE Xplore. Restrictions apply.

architectural scenario. If a box is noted with an ‘F’, it
represents a new feature added to the CathLab for
optimizing its workflow. More on variation modeling can
be found in [2] and [3].
After charting the possible choices in variation models
for each of the CAFCR views, we chose suitable
architectural scenarios in each of these models. An
architectural scenario is defined as a set of consistent
choices in the variation models across the different
architectural views. The cross-view modeling of the
architectural scenarios has been discussed in [3]. For
example, we show how such an architectural scenario
would look like for Workflow Optimization, Figure 4.
For optimizing the workflow of the CathLab we
proposed four more functions to be added to the existing
CathLab, namely a fast reconstructor for creating the 3D
models in real time, an invisible PACS (picture archiving
and communication system) for caching the diagnostic
images onto the X-ray system and thus reducing the
transfer time for image reviewing or archiving, 3D
controls for easy navigation of the 3D models, and 3D
reconstruction capability in the intervention room.
Invisible
PACS
Invisible
PACS
PACS
Synchronizer
PACS
Synchronizer
Fast 3DRAFast 3DRA
Real Time
Reconstructor
Real Time
Reconstructor
3DRA
Reconstructor
3DRA
Reconstructor
Portable
Reconstructor
3DRA in IR3DRA in IR
3D on RM3D on RM
Native 3D
viewing support
Native 3D
viewing support
Access to 3D
volumes
Access to 3D
volumes
Network access
to 3D volumesLocal storage
of 3D volumes
Local storage
of 3D volumes
Visualization
of 3D volumes
Visualization
of 3D volumesManipulation
of 3D volumes
Manipulation
of 3D volumes
Hosted 3D
PACS client
Hosted 3D
PACS client
Integrated
Image
Repository
Integrated
Image
Repository
Separate 3d
Image storage
DAI/PIIM
Support
DAI/PIIM
Support
VCS 3D
Viewer
VCS 3D
Viewer
Foreign Image
storage
Transparent
image
handling
Transparent
image
handling
3D Graphics
Card
3D Graphics
Card
Image
Transfer
Image
Transfer
DMA or IPDMA or IP
F
F F
GUI
SupportNon-GUI
Support
Non-GUI
Support
3D
Controls
3D
Controls
F
Invisible
PACS
Invisible
PACS
PACS
Synchronizer
PACS
Synchronizer
Fast 3DRAFast 3DRA
Real Time
Reconstructor
Real Time
Reconstructor
3DRA
Reconstructor
3DRA
Reconstructor
Portable
Reconstructor
3DRA in IR3DRA in IR
3D on RM3D on RM
Native 3D
viewing support
Native 3D
viewing support
Access to 3D
volumes
Access to 3D
volumes
Network access
to 3D volumesLocal storage
of 3D volumes
Local storage
of 3D volumes
Visualization
of 3D volumes
Visualization
of 3D volumesManipulation
of 3D volumes
Manipulation
of 3D volumes
Hosted 3D
PACS client
Hosted 3D
PACS client
Integrated
Image
Repository
Integrated
Image
Repository
Separate 3d
Image storage
DAI/PIIM
Support
DAI/PIIM
Support
VCS 3D
Viewer
VCS 3D
Viewer
Foreign Image
storage
Transparent
image
handling
Transparent
image
handling
3D Graphics
Card
3D Graphics
Card
Image
Transfer
Image
Transfer
DMA or IPDMA or IP
F
F F
GUI
SupportNon-GUI
Support
Non-GUI
Support
3D
Controls
3D
Controls
F
Figure 4: Workflow Optimization Scenario
In our case study, we ended up with four architectural
scenarios describing various CathLab integrations that
could be used to implement the two business strategies
defined in SSBA Step 2. The final architectural scenarios
considered in our case study were as follows:
- Workflow Optimization, focusing on supporting the
workflow of their users; the CathLab systems can be
adjusted to meet users’ specific workflow needs and
habits.
- Diagnostic MR Integration, adding to the existing
CathLab the viewing capability for magnetic resonance
imaging in order to improve the diagnostic outcome.
- IVUS Integration, focusing on enabling the existing
CathLab with intravascular ultrasound imaging modality.
- Interventional MR Integration, focusing on
adapting the existing CathLab so that it uses magnetic
resonance imaging modality instead of X-rays for both
diagnostic and intervention purposes.
4.4 Step 4: Analyze Scenarios’ Feasibility
In the last step we looked at the feasibility of the
proposed architectural scenarios in the different future
contexts. Here we wanted to see what type of integration
suits what future, and how large the market segment could
be. Ultimately, we tried to quantify the attractiveness of
the different integrations by showing an estimate figure of
the profit the organization could make.
We started by quantifying the change in the market
share due to acceptance or rejection of the quality
attributes of the product offered. For this task, we used
expert judgment. For example, what if we were to
propose an expensive and highly accurate CathLab
treatment to the mass treatment hospitals segment.
Although the advantage of such a solution is
unquestionable, the majority of customers in this segment
will not be able to afford such a solution, and would
possibly not even consider it at all. If the solution offered
does not comply with the stakeholder objectives, the
customers will opt for solutions offered by competitors.
We therefore want to estimate the magnitude of the
changes in customer segment size triggered by different
integrations. It is not realistic to count on fixed market
segments, regardless of the proposed scenario or type of
future. However, the change will be different in the
various futures. If we consider, for example, a booming
economic situation – the Brave New Pharma World
scenario in our case – even the Minimalists might be able
to afford more expensive and accurate CathLab treatment.
If there is a recession, the Minimalists are most likely to
require basic treatment services. The Premiums, on the
other hand, will be influenced by treatment accuracy
rather than costs.
We quantified the modification of the market share due
to the perceived quality attributes of the proposed
architectural scenarios.
For assessing the different quality attributes of the
proposed architectural scenarios we developed a method
called SQUASH (Systematic Quantitative Analysis of
Scenarios Heuristics), initially presented in [11] and [12].
The method considers the quantified stakeholder quality
objectives, and the architectural scenarios, as input for the
assessment process. The output of the method is a
quantitative overview of the different quality aspects
exhibited by the architectural scenarios.
We applied SQUASH method for assessing the
stakeholders’ quality objectives for the architectural
0-7695-2268-8/05/$20.00 (C) 2005 IEEE
Proceedings of the 38th Hawaii International Conference on System Sciences - 2005
7Authorized licensed use limited to: Wuhan University. Downloaded on April 7, 2009 at 19:31 from IEEE Xplore. Restrictions apply.

scenarios resulted in Step 2. Three such objectives were:
intervention duration, number personnel involved, and the
intervention accuracy, relevant for type of stakeholders -
the healthcare providers and the patients. Table 7 presents
the data gathered with SQUASH for the mass production
type of hospitals treating the Minimalist and In-house
BioMed segments.
Table 7: SQUASH Results - for Minimalist and In-
house BioMed Segments
Quality
Attribute
Workf
low
Diag.
MR IVUS
Interv.
MR
Intervention
Duration
(in Minutes)
30 60 45 90
Personnel Involved
(in Persons) 2 2 3 3
Accuracy (in re-
interventions/year) 2 1 0,5 0,1
For assessing the feasibility of the proposed
architectural scenarios, we need (1) to estimate the
relative importance of the individual quality attributes of
the architectural scenarios per strategic scenario and
customer type, and (2) the impact of the different levels of
the quality attributes on the market share of an
organization.
For simplicity reasons, we assume the initial CathLab
market share of the organization equal to 30% of the
overall figures given in Table 4.
To reason about the influence of the combination of
different quality attribute levels on the organization’s
market share, we proposed the following formula, (7).
1
1n
i , j i , j k k
k i , j
New _ Share Initial _ Share w * v( a )=
= + (7)
where: New_Sharei, j is the new size of the organization‘s
market share in segment i and future j, Initial_Sharei, j, is
the initial estimate of the organization’s market share in
segment i and future j (e.g. Table 4), v(ak) is the change,
measured in percentages, in the organization’s market
share due to the level of acceptance a certain quality
attribute ak, and wk is the relative importance of the
quality attribute ak, both v(ak) and wk being estimated per
segment i and future j.
For example, the change in market share yielded by
three quality attributes, namely the intervention duration
personnel involved, and the intervention accuracy (see
Table 7), for the Workflow Optimization scenario in the
McHealth strategic scenario was calculate with (4),
4 138 0 3 0 7 0 3 0 1 0 1 0 0 6
2 154
CathLabs _ Sales _ DueTo _ New _ Share
{ . * [ . ( . * . . * . * . )]}
New _ Sales . CathLabs
== + + +
=
Table 8 shows an example of the change in the
organization’s initial 30% market share, due to the
introduction of the different architectural scenarios.
Table 8: The Yield in Market Share, from 30% initial
S1 S2 S3 S4
Workflow 52,06% 42,56% 26,00% 14,50%
Lo
w
en
d
Diag. MR 43,30% 41,00% 35,30% 31,00%
IVUS 37,80% 38,80% 44,90% 46,35%
Hig
h
en
d
Interv.
MR 33,60% 34,60% 51,00% 57,30%
We repeated the same judgments for the other
scenarios. The final feasibility estimates will be expressed
in terms of the profit the organization can expect per
architectural scenario in the different strategic scenarios;
in general the profit is calculated as the difference
between the CathLab market price and its implementation
costs, multiplied by its expected sales figure, from which
is subtracted the initial development cost and the
marketing cost for the new product, as in formula (8).
Pr ofit New _ Share* ( MarketP r ice Pr oductionCost )
DevelopmentCost MarketingCost
= − −− −
(8)
However, our final profit estimates were calculated as
a cumulative figure, taking into account the time to
achieve the new market share and the future value of
money, [4]. For example, in a McHealth Strategic
Scenario, the development costs together with the
marketing and sales costs for the Workflow Optimization
scenario were estimated at 20 million euros (M€). The
production costs of the CathLab implementing the
Workflow Optimization scenario were estimated at
300.000 €, and the final market price at 600.000 €. The
time to develop the CathLab implementing the Workflow
architectural scenario was considered one year, while the
time to achieve the new market share, five years, with
total sales of five percent in the first year. Formula (8) is
now adjusted so it takes into consideration the future
value of money, representing the interest calculations (V
coefficient); then we calculated the nominal profit per
year. For example for the Workflow Optimization
Scenario in S1 we obtained,
5 5
7 7
2 154 0 05 3 10 3 10 0 04 4
2 10 2 10 0 04 5
first _ yearPr ofit . * , * * V ( ; , ; )
* V ( , , , ) 12.430.558 euros
= ⋅ ⋅ −
− ⋅ ⋅ =
where, V(a;b;c) is the future value of money a, at an interest rate of b% per year, over c number of years, with V(a;b;c)=a*(1+b)c , as introduced in [4]. The cumulative net profit and the time to achieve the new market share in the McHealth Scenario are depicted in Figure 5 for two architectural scenarios: the Workflow Optimization and the Interventional MR, for exemplification purposes.
0-7695-2268-8/05/$20.00 (C) 2005 IEEE
Proceedings of the 38th Hawaii International Conference on System Sciences - 2005
8Authorized licensed use limited to: Wuhan University. Downloaded on April 7, 2009 at 19:31 from IEEE Xplore. Restrictions apply.

Cumulative Net Profit for the Workflow
Optimization versus the Interventional
MR Scenario in S1
-0,1
0
0,1
0,2
0,3
0,4
0,5
0,6
0,7
2004 2005 2006 2007 2008 2009 2010 2011
Year
Cu
mu
lati
ve
ne
t
pro
fit,
in
B€
Workflow
Interventional MR
Cumulative Net Profit for the Workflow
Optimization versus the Interventional
MR Scenario in S1
-0,1
0
0,1
0,2
0,3
0,4
0,5
0,6
0,7
2004 2005 2006 2007 2008 2009 2010 2011
Year
Cu
mu
lati
ve
ne
t
pro
fit,
in
B€
Workflow
Interventional MR
Figure 5: Cumulative Profit per Year, with respect to
the time to achieve the new market share
Repeating the same type of reasoning for each
architectural scenario in each strategic future we obtained
the following profit estimates for 2010, Table 9.
Table 9: Estimated Profit for 2010 in B€
Strategic
Scenario
Workflow Optimization
Diagnostic MR
IVUS Interv.
MR
S1 0.56 0,43 0,25 0,17
S2 0,40 0,38 0,42 0,3
S3 0,20 0,28 0,61 0,63
S4 0,10 0,25 0,76 0,8
In order to visualize the results of the feasibility study,
the Table 9 is plotted on a radar chart, Figure 6.
Estimated Profit for 2010 in B€
0,0
0,2
0,4
0,6
0,8
1,0 McHealth
(S1)
Clinique
de Luxe
(S2)
See Treat Cure
(S3)
Brave New
Pharma
(S4)
Workflow
Diagnostic MR
IVUS
Interventional MR
Figure 6: The Profit in B€ for 2010 for each
Architectural Scenario and Strategic Scenario
Figure 6 shows the cumulative net profit in billion
euros in 2010 yielded by each architectural scenario in
each of the strategic scenarios. This way the decision
makers have a good basis for taking more informed
strategic decisions when multiple architectural scenarios
are considered. Based such kind of data - such as the ones
presented in Figure 5 and Figure 6, the growth objectives
and the long-term planning strategy of the organization,
one or more architectural scenario could be considered.
For brevity reasons, this type of analysis did not take
into account issues like the upgrade costs for the systems,
or the maintenance cost issues. Few reasons for omitting
these aspects are as follows. First, the maintenance and/or
upgrading operations are actually sources of income for
our organization rather than an additional actual cost; and
second, the maintenance and upgrade could be performed
in many ways – such as remotely, or at the customer site,
as well as by third parties, or by the organization itself.
A company could choose to rely on the existing system
offer (i.e. do nothing), rather than scouting the future and
come up with new products (i.e. innovate). In such a case
we don’t necessarily talk about a decrease in profits but
about loss of competitive advantage and company image.
A similar type of feasibility analysis is proposed in
CBAM [5]. However, instead of qualitative estimates, in
SSBA we base our judgment on quantitative data all
along the architecting process. Moreover in SSBA we use
strategic scenarios to anchor our decisions and assess the
feasibility of the proposed architectures in context. Using
quantitative data, later in time we can calibrate our
assumptions and see if our judgment was actually correct.
Using a subjective scale in providing the input data for the
feasibility study will make it difficult to see whether the
data used was actually right.
5. Conclusions
In this paper we presented a method for developing
and assessing the feasibility of different architectural
solutions when new systems architectures are built. The
SSBA method combines forecasting techniques used for
anticipating trends in technology and society, with
scenario techniques used for exploring varied plausible
futures when proposing systems architectures.
The advantages of our SSBA method are:
- It provides the architects with a systematic way of
developing architectures that are more future-proof, by
considering the various changes that may take place in
their business environment before strategic architectural
decisions are made.
- It incorporates explicitly the use of strategic scenarios,
which are useful tools envisaging future changes,
functionality, or new requirements the system is likely to
incorporate in the future.
0-7695-2268-8/05/$20.00 (C) 2005 IEEE
Proceedings of the 38th Hawaii International Conference on System Sciences - 2005
9Authorized licensed use limited to: Wuhan University. Downloaded on April 7, 2009 at 19:31 from IEEE Xplore. Restrictions apply.

- Since it is impossible to adapt the architecture in all
possible directions, the strategic scenarios will draw the
changes that are most likely to occur in the future, and
hence the architectural scenarios are easier to be built.
Moreover, the strategic scenarios are used to evaluate the
feasibility of the architectural scenarios proposed.
- By involving detailed knowledge about the customer
and future changes in the business environment, the
SSBA method provides sufficient information for making
sound decisions at a strategic and tactical level, early in
the design and implementation stages of the proposed
system architectures.
Acknowledgements
We are grateful to our colleagues Wim van der Linden
and Eelco Rommes for reviewing this work, and
suggesting possible improvements.
We also mention the ITEA Project Families, and the
Stichting Technische Wetenschappen (STW), Project
EWI.4877, which funded this research, as well as the
Philips Research Laboratories, The Netherlands, which
provided us with the industrial context for performing this
research.
References
[1] P. America, H. Obbink, R. van Ommering, and F. van der
Linden, “CoPAM: A Component Oriented Platform Architecting
Method Family for Product Family Engineering”, In Patrick
Donohoe, ed.: Software Product Lines: Experiences and
Research Directions, Proceedings of the First Software Product
Lines Conference (SPLC1), Denver, Colorado, August 2000,
Kluwer, pp. 167-180.
[2] P. America, E. Rommes and H. Obbink, “Multi-View
Variation Modeling for Scenario Analysis”, in Frank van der
Linden, ed., Springer, LNCS, PFE-5: Fifth International
Workshop on Product Family Engineering, Siena, Italy,
November 4-6, 2003.
[3] P. America, D. Hammer, M.T. Ionita, H. Obbink, and E.
Rommes, “Scenario-Based Decision Making for Architectural
Variability in Product Families”, in the Proceedings of Third
Software Product Lines Conference, (SPLC’04), Boston,
Massachusetts, 2004.
[4] American Heart Association Report – Heart Disease and
Stroke Statistics, 2004 Update, available online at:
www.americanheart.org/downloadable/heart/1075102824882H
DSStats2004UpdateREV1-23-04.pdf.
[4] B.W. Boehm, Software Engineering Economics, Prentice
Hall, 1981, p.216-217, p.588-589.
[5] L. Bass, P. Clements, and R. Kazman, Software Architecture
in Practice: Second Edition, Addison-Wesley, 2003.
[6] H. Bouwman, and P. van der Duin, “Technological
Forecasting and Scenarios Matter: Research into the use of
information and communication technology in the home
environment in 2010”, Foresight, Vol.5, Number 4, 2003, p.8-20
[7] J.M. Carroll, Making Use: Scenario-based design of human-
computer interaction, 2000, Massachusetts Institute of
Technology.
[8] F. Gouillart, “The day the music died”, Journal of Business
Strategy, 16(3), May-June 1995, p. 14-20.
[9] S. G. Haines, The Systems Thinking Approach to Strategic
Planning and Management, St. Lucie Press, Boca Raton, FL,
2000.
[10] C.W.L. Hill, International Business: Competing in the
Global Marketplace, McGraw-Hill, NY, 2002.
[11] M.T. Ionita, P. America, J.H. Obbink, and D.K. Hammer,
“Quantitative Architecture Usability Assessment with
Scenarios”, Closing the Gaps: Software Engineering and
Human-Computer Interaction, Proceedings, INTERACT 2003,
http://www.se-hci.org/bridging/interact.
[12] M.T. Ionita, P. America, D. Hammer, H. Obbink, and J.
Trienekens, “A Scenario-driven Approach for Value, Risk and
Cost Analysis in System Architecting for Innovation”, in the
Proceedings of the Fourth Working IEEE/IFIP Conference on
Software Architecture 2004 (WICSA’04), June 12-15, Oslo,
Norway.
[13] P. Kruchten, “The 4+1 View Model of Architecture”, IEEE
Software, November 1995.
[14] C.H. Lung, S. Bot, K. Kalaichelvan, and R. Kazman: “An
Approach to Software Architecture Analysis for Evolution and
Reusability”, in: J. Howard Johnson, ed.: CASCON '97,
Toronto, Canada, November 10-13, 1997.
[15] H. Mintzberg, The Rise and Fall of Strategic Planning, The
Free Press, NY, 1994.
[16] H. Obbink, and P. America, “Towards Evergreen
Architectures: On the usage of scenarios in system architecting”,
International Conference on Software Maintenance, ICSM
2003, Amsterdam, The Netherlands, September 22-26, 2003,
IEEE, p. 298-303.
[17] D. Soni, R.L. Nord, and C. Hofmeister, “Software
Architecture in Industrial Applications”, International
Conference on Software Engineering, Proceedings, 1995.
[18] P. Schwartz, The Art of the Long View: Planning for the
Future in an Uncertain World, Doubleday, NY, 1996.
[19] K. van der Heijden, Scenarios: The Art of Strategic
Conversation, John Wiley & Sons, UK, 1996.
0-7695-2268-8/05/$20.00 (C) 2005 IEEE
Proceedings of the 38th Hawaii International Conference on System Sciences - 2005
10Authorized licensed use limited to: Wuhan University. Downloaded on April 7, 2009 at 19:31 from IEEE Xplore. Restrictions apply.