the haywired scenario—telecommunications and
TRANSCRIPT
The HayWired Scenario—Telecommunications and Information Communication Technology
By Anne M. Wein, David T. Witkowski, Jamie L. Jones, Keith A. Porter, Laurel R. Ballanti, and Sara K. McBride
Chapter S ofThe HayWired Earthquake Scenario—Societal ConsequencesEdited by Shane T. Detweiler and Anne M. Wein
Scientific Investigations Report 2017–5013–R–W
U.S. Department of the InteriorU.S. Geological Survey

U.S. Geological Survey, Reston, Virginia: 2021
For more information on the USGS—the Federal source for science about the Earth, its natural and living resources, natural hazards, and the environment—visit https://www.usgs.gov or call 1–888–ASK–USGS (1–888–275–8747).
For an overview of USGS information products, including maps, imagery, and publications, visit https://store.usgs.gov.
Any use of trade, firm, or product names is for descriptive purposes only and does not imply endorsement by the U.S. Government.
Although this information product, for the most part, is in the public domain, it also may contain copyrighted materials as noted in the text. Permission to reproduce copyrighted items must be secured from the copyright owner.
Suggested citation:Wein, A.M., Witkowski, D.T., Jones, J.L., Porter, K.A., Ballanti, L.R., and McBride, S.K., 2021, The HayWired scenario—Telecommunications and information communication technology, chap. S of Detweiler, S.T., and Wein, A.M., eds., The HayWired earthquake scenario—Societal consequences: U.S. Geological Survey Scientific Investigations Report 2017–5013–R–W, 94 p., https://doi.org/10.3133/sir20175013v3.
Associated data for this publication: Wein, A.M., 2020, Voice and data telecommunications restoration curves for 15 counties affected by the April 18, 2018, M 7.0 HayWired earthquake scenario mainshock: U.S. Geological Survey data release, https://doi.org/10.5066/P9HKJU90.
ISSN 2328-0328 (online)
iii
ContentsAbstract ...........................................................................................................................................................1Introduction.....................................................................................................................................................2
Today’s World of Telecommunications ..............................................................................................2Telecommunications and Earthquakes .............................................................................................3Disruption of Telecommunications Services ....................................................................................3Study Approach.....................................................................................................................................4Chapter Overview .................................................................................................................................5
Telecommunications Systems, Subscriber Connectivity, and Infrastructure Failure Modes ...........5Telecommunications Systems ............................................................................................................5
Copper Pair Systems ...................................................................................................................6Data and Voice Over Internet Protocol (VoIP) Systems ........................................................8Cellular Voice, Data, and Text Messaging Systems ...............................................................8The Internet...................................................................................................................................8
Subscriber Connectivity ....................................................................................................................129–1–1 Calls—Public Safety Answering Points .....................................................................12Home and Small Business Telephony ....................................................................................12Home-Based and Virtual Offices Requiring Broadband......................................................13Small and Medium Businesses Requiring High Bandwidth ...............................................13Central Offices, Data Centers, and Large Corporations Using Fiber Optic Lines ............13Enterprises that Require Reliable Connectivity ....................................................................13
Physical Failure Modes......................................................................................................................13Provider Equipment Failure Modes ........................................................................................13Wired Channel Failure Modes .................................................................................................14Wireless Channel Failure Modes ............................................................................................14Subscriber Equipment Failure Modes ....................................................................................14
Telecommunications Infrastructure Exposure and Damage from HayWired Earthquake Hazards ..14HayWired Scenario Hazards ............................................................................................................15Observations of Earthquake Damage ..............................................................................................15Methods................................................................................................................................................17
Telecommunications Infrastructure Data ..............................................................................17Physical Damage Estimation ...................................................................................................17
Shaking Damage Estimation for Central Offices and Data Centers .........................19Shaking Damage Estimation for Unanchored Equipment ..........................................20Shaking Damage Estimation for Cellular Sites ............................................................20
Free-Standing Towers .............................................................................................20Rooftop Towers and Building-Mounted Antennas .............................................21Cellular Site Equipment ...........................................................................................21
Exposure of Infrastructure to Ground Failure, Fire, and Aftershock Shaking ........21Ground Failure Exposure ........................................................................................21Fire Exposure ............................................................................................................22Aftershock Exposure ...............................................................................................22
Collocation of Fiber Optic Lines on Bridges .................................................................22Functionality of Public Safety Answering Points ........................................................22

iv
HayWired Hazard Exposure and Damage Results ........................................................................22Central Offices and Wireless Switch Centers ......................................................................22Data Centers ...............................................................................................................................26Cellular Sites ...............................................................................................................................28
Free-Standing Towers ......................................................................................................28Rooftop Towers and Building-Mounted Antennas ......................................................32Summary of Cellular Site Damage Assessment ..........................................................34
Wired Channels ..........................................................................................................................34Fiber Optic Lines ...............................................................................................................34Copper Pair and Coaxial Lines ........................................................................................38
Public Safety Answering Points ..............................................................................................38Exposure to Aftershock Shaking .............................................................................................40
Voice and Data Service Restoration .........................................................................................................40Voice and Data Service Restoration After Disasters ....................................................................42
Service Restoration after Earthquakes ..................................................................................42Service Restoration after Hurricanes ....................................................................................43
Simple Model of Voice and Data Demand Served ........................................................................43Base Case: Residual Capacity, Power Outages, Demand Surge .......................................43
Residual Network Capacity .............................................................................................43Estimate of Residual Network Capacity After the HayWired Mainshock ......44
Dependence on Electric Power Restoration ................................................................45Estimate of Network Capacity Dependent on Electric Power Restoration ...........46
Service Degradation from Demand Surge ...................................................................47Estimate of Demand Surge After the HayWired Mainshock ............................48
Demand Served Restoration Estimation Method: Base Case ...................................48Resilience Case of Permanent Backup Power .....................................................................48
Backup Power Options, Prevalence, and Running Time ............................................48Fuel Delivery to Permanent Generators ........................................................................49Demand Served Restoration Estimation Method: Permanent Backup Power .......50
Resilience Case of Portable Equipment .................................................................................50Demand Served Restoration Estimation Method: Portable Equipment ...................51
Resilience Case of Managing User Behavior .......................................................................51Demand Served Restoration Estimation Method: User Behavior Management ...52
Resilience Case of All Capabilities .........................................................................................52Voice and Data Demand Served ......................................................................................................52
Restoration Curves ....................................................................................................................52Restoration Model Uncertainties ............................................................................................53Variability of Subscriber Experience ......................................................................................55
Knowledge Gaps and Study Limitations ..................................................................................................56Earthquake Hazard Uncertainties ....................................................................................................56Limitations of Study Scope ................................................................................................................56Data Limitations of Evolving Telecommunications Infrastructure Data ....................................57Scant Telecommunications Infrastructure Design and Fragility Data .......................................57Simple Model of Network Capacity and Service Restoration Times .........................................57
Summary and Conclusion ...........................................................................................................................58Telecommunications Infrastructure Hazard Exposure and Damage .........................................58
v
Central Offices, Wireless Switches, and Data Centers .......................................................59Cellular Sites ...............................................................................................................................59Unanchored Equipment ............................................................................................................59Wired and Wireless Channels .................................................................................................60Summary of Hazard Impacts on Infrastructure ....................................................................60
Network Functionality and Demand for Services .........................................................................60Residual Network Capacity ......................................................................................................60Electric Power Supply Dependence .......................................................................................61Permanent Backup Power .......................................................................................................61Fuel Delivery and Portable Equipment Deployment .............................................................62Network Congestion ..................................................................................................................62
Societal Consequences .....................................................................................................................62Health and Safety ......................................................................................................................62
9–1–1 After an Earthquake ..............................................................................................62Fire Reporting ....................................................................................................................63Vulnerable Populations ....................................................................................................63Populations with Access and Functional Needs .........................................................63
Enterprise Recovery ..................................................................................................................63Business Interruption Losses from Telecommunications Service Disruptions......63Business Interruption Loss Reductions from Telework ..............................................64
Interactions with Other Lifeline Infrastructure Systems .....................................................64Opportunities for Increasing Resilience .........................................................................................64Resilience Opportunities for Voice and Data Service Providers ................................................64
1. Mitigating Damage from Multiple Earthquake Hazards ..................................................641.1. Mitigating Shaking Damage .....................................................................................641.2. Mitigating Ground Failure Damage .........................................................................651.3. Considering Fire Following Earthquake .................................................................65
2. Addressing Dependencies on Building Sites and Other Lifeline Infrastructure Systems ..652.1. Mitigating Risks to Cellular Sites on Buildings .....................................................652.2. Mitigating Collateral Infrastructure Damage ........................................................652.3. Decoupling Telecommunications Equipment Dependence on Commercial
Electric Power .....................................................................................................662.4. Understanding Water Supply Dependencies ........................................................66
3. Preparing for Telecommunications Restoration Contingencies ....................................663.1. Planning for and Coordinating Limited Fuel Supply .............................................663.2. Improving Cooperation with Electric Power Companies ....................................673.3. Planning for Inaccessibility of Sites .......................................................................673.4. Planning for Skilled Labor Supply ...........................................................................673.5. Planning for Supplying and Sharing Spare Parts .................................................67
4. Working with Governments ..................................................................................................674.1. Identifying Community Infrastructure Vulnerabilities ..........................................674.2. Preparing for Telecommunications Restoration ...................................................67
5. Using Earthquake Risk Communications ...........................................................................685.1. ShakeAlert Earthquake Early Warning System ....................................................685.2. Aftershock Forecasts ................................................................................................685.3. Afterslip Forecasts ....................................................................................................69

vi
6. Managing User Behavior of Commercial Networks ........................................................69Resilience Opportunities for Users of Voice and Data Services ................................................69
7. Preparing for Emergency Response ...................................................................................697.1. Improving Resilience of 9–1–1 Call Services ........................................................697.2. Enhancing Emergency Response Communications ............................................697.3. Improving Communication of Alerts .......................................................................697.4. Attending to Vulnerable Populations ......................................................................707.5. Planning for Evacuations and Displaced Populations .........................................70
8. User Preparedness ................................................................................................................718.1. Preparing for Power Outages ..................................................................................718.2. Being Informed About Using Voice and Data Services .......................................71
9. Planning for Business Contingencies and Continuity ......................................................719.1. Reducing Business Interruption from Telecommunications Outages ..............719.2. Reducing Business Interruption with Teleworking ..............................................71
Acknowledgments .......................................................................................................................................71References Cited..........................................................................................................................................72Glossary .........................................................................................................................................................80Appendix 1. Program of the U.S. Geological Survey’s Telecommunications Phase 2 Workshop ..83Appendix 2. Demand Served Restoration Curves by County ................................................................85Appendix 3. Home Uninterruptible Power Supply Set Up .....................................................................93
Figures
1. Schematic diagram illustrating an example of a system that uses copper pair technology in plain old telephone service and digital subscriber line, as well as the system’s potential failure modes ................................................................................................6
2. Schematic diagram illustrating an example of a system that uses wired technology of data and voice over internet protocol connected via coaxial and fiber optic lines, as well as the system’s potential failure modes ...........................................................................7
3. Schematic diagram illustrating an example of a system that uses cellular voice, data, and text messaging systems, as well as the system’s potential failure modes .................9
4. Schematic diagram illustrating an example of an internet-based system .......................10 5. Schematic diagram illustrating an example of a system that uses satellite broadband
internet connection, as well as potential failure modes ........................................................11 6. Photograph showing utility pole damage to a cellular site after the 2011 Christchurch,
New Zealand, earthquake ..........................................................................................................16 7. Photograph showing cellular sites on a heavily damaged hotel after the 2009 L’Aquila,
Italy, earthquake ..........................................................................................................................16 8. Maps showing damage and exposure to HayWired scenario mainshock hazards for
central offices in the San Francisco Bay region, California ................................................23 9. Maps showing damage and exposure to HayWired scenario mainshock hazards for
wireless switches in the San Francisco Bay region, California .........................................24 10. Maps showing damage and exposure to HayWired scenario mainshock hazards for
data centers in the San Francisco Bay region, California ...................................................27 11. Maps showing damage and exposure to HayWired scenario mainshock hazards for self-
supporting towers and guyed towers in the San Francisco Bay region, California .................29
vii
12. Maps showing damage and exposure to HayWired scenario mainshock hazards for monopoles in the San Francisco Bay region, California ......................................................31
13. Maps showing damage and exposure to HayWired scenario mainshock hazards for rooftop towers and building-mounted antennas in the San Francisco Bay region, California ..............33
14. Map showing combined hazards for all types of cellular sites for the HayWired scenario mainshock in the San Francisco Bay region, California ......................................35
15. Maps showing the exposure of fiber optic lines to rupture fault crossings, liquefaction and landslide probability, fire density, and affected bridges for the HayWired scenario mainshock in the San Francisco Bay region, California .........................................................36
16. Map of the San Francisco Bay region, California, showing fiber optic line running through HayWired scenario mainshock shaking and liquefaction hazards above thresholds for failure rates for old conduit .............................................................................38
17. Maps showing the exposure of surface streets to liquefaction and landslide probability, fire density, and the maximum hazard exposure for all mapped hazards for the HayWired scenario mainshock in the San Francisco Bay region, California .............................................39
18. Map showing HayWired scenario mainshock impacts from all hazards to telecommunica-tions infrastructure compared to exposure to aftershock shaking in San Mateo and Santa Clara Counties ...............................................................................................................................41
19. Photographs showing repair dependence between telecommunications and electrical power poles ..................................................................................................................................46
20. Line graph showing the electric power restoration curve by county for the HayWired scenario mainshock in the nine counties adjacent to San Francisco Bay, California ....47
21. Photograph showing a cell on light truck outside Freedom Tower in New York City after Hurricane Sandy ...........................................................................................................................51
22. Line graph showing voice and data demand served and power restoration curves for Alameda County for the HayWired scenario mainshock in the San Francisco Bay region, California .........................................................................................................................53
23. Line graph showing voice and data demand served and power restoration curves when the effect of demand surge is removed for Alameda County for the HayWired scenario mainshock in the San Francisco Bay region, California ......................................54
24. Line graph showing optimistic voice and data restoration curves when three resilience capabilities are implemented for the HayWired scenario mainshock in the San Francisco Bay region, California ...................................................................................................................54
Tables
1. Voice and data connections, primary users, and classification of technology ...............12 2. Median capacity for central offices in terms of 5-percent-damped elastic spectral
acceleration response at a period of 1.0 second ..................................................................20 3. Median overturning capacity of common, unanchored central office equipment in terms
of 5-percent-damped elastic spectral acceleration response at a period of 1.0 second........20 4. Median capacity for cellular towers in terms of 5-percent-damped elastic spectral
acceleration response at a period of 1.0 second ..................................................................21 5. Liquefaction and landslide probability hazard intensity ranges for the HayWired
scenario mainshock in the San Francisco Bay region, California .......................................21 6. Fire hazard thresholds for the HayWired scenario mainshock in the San Francisco Bay
region, California ...........................................................................................................................22 7. Counts by county of carriers in central offices that are exposed to HayWired scenario
mainshock hazards and the maximum hazard exposure level affecting them ...................25
viii
8. Counts by county of wireless switches that are exposed to HayWired scenario mainshock hazards and the maximum hazard exposure level affecting them ............................................26
9. Counts by county of providers in data centers that are exposed to HayWired scenario mainshock hazards and the maximum hazard exposure level affecting them .......................28
10. Counts by county of carriers at different types of cellular sites in the San Francisco Bay region, California .................................................................................................................28
11. Counts by county of carriers on self-supporting towers and guyed towers that are exposed to HayWired scenario mainshock hazards and the maximum hazard exposure level affecting them .....................................................................................................................30
12. Counts by county of carriers on monopoles that are exposed to HayWired scenario mainshock hazards and the maximum hazard exposure level affecting them ..................32
13. Counts by county of carriers on rooftop towers and building-mounted antennas that are exposed to HayWired scenario mainshock hazards and the maximum hazard exposure level affecting them ..................................................................................................34
14. Lengths of long-haul fiber optic lines, by county, exposed to HayWired scenario mainshock hazards and the maximum hazard exposure level affecting each length of line .......................37
15. Lengths of interoffice fiber optic lines, by county, exposed to HayWired scenario mainshock hazards and the maximum hazard exposure level affecting each length of line .........................37
16. Lengths of surface streets, by county, exposed to HayWired scenario mainshock hazards and the maximum hazard exposure level affecting each route ................................................40
17. Functionality on day one of facilities located with public safety answering points according to Hazus analysis of mainshock shaking and default liquefaction at collocated police and fire facilities ..........................................................................................40
18. Average industry estimate of likely residual network capacity caused by earthquake damage .........................................................................................................................................44
19. Estimates of residual capacity of facilities and transmission channels after the HayWired scenario mainshock in the San Francisco Bay region, California, using damage and ground-failure probability functionality assumptions ...................................45
20. Estimates of residual network capacity after the HayWired scenario mainshock in the San Francisco Bay region, California, using the high-level calculation based on all earthquake hazards and industry consensus based on shaking .......................................45
21. Fraction of demand surge that could be served by pre-earthquake network capacity after the HayWired scenario mainshock in the San Francisco Bay region, California, by shaking intensity ..........................................................................................................................48
22. Fuel truck delivery delays to sites in three zones of impact from Hurricane Sandy in the northeastern United States ..........................................................................................................49
23. Major telecommunications infrastructure components and exposure levels to earthquake hazards in the HayWired earthquake scenario in the San Francisco Bay region, California .........................................................................................................................61

ix
Conversion Factors
U.S. customary units to International System of Units
Multiply By To obtainLength
inch (in.) 2.54 centimeter (cm)inch (in.) 25.4 millimeter (mm)foot (ft) 0.3048 meter (m)mile (mi) 1.609 kilometer (km)
Areaacre 4,047 square meter (m2)acre 0.004047 square kilometer (km2)square foot (ft2) 929.0 square centimeter (cm2)square foot (ft2) 0.09290 square meter (m2)square mile (mi2) 259.0 hectare (ha)square mile (mi2) 2.590 square kilometer (km2)
International System of Units to U.S. customary units
Multiply By To obtainLength
centimeter (cm) 0.3937 inch (in.)millimeter (mm) 0.03937 inch (in.)meter (m) 3.281 foot (ft) kilometer (km) 0.6214 mile (mi)
Areasquare meter (m2) 0.0002471 acre square kilometer (km2) 247.1 Acresquare centimeter (cm2) 0.001076 square foot (ft2)square meter (m2) 10.76 square foot (ft2) hectare (ha) 0.003861 square mile (mi2) square kilometer (km2) 0.3861 square mile (mi2)
DatumVertical coordinate information is referenced to the North American Vertical Datum of 1988 (NAVD 88).
Horizontal coordinate information is referenced to the North American Datum of 1983 (NAD 83).
x
Abbreviations and Acronyms3G third generation cellular
3GPP Third Generation Partnership Project, a standards body
4G fourth generation cellular
5G fifth generation cellular; an ITU recommendation governed by the IMT-2020 standard
ADSL asynchronous digital subscriber line
AM amplitude modulation
ANSI American National Standards Institute
ASCE American Society of Civil Engineers
ATC American Technology Council
BayRICS Bay Area Regional Interoperable Communications System
Cal OES California Office of Emergency Services
cm/s centimeter per second
COLT cell on light truck
COW cell on wheels
CSCC Communications Sector Coordinating Council
DAS distributed antenna system
DLC digital loop carrier
DOCSIS Data Over Cable Service Interface Specification
DSLAM digital subscriber line access multiplexer
DSL/xDSL digital subscriber line; xDSL is a generic term for a family of digital subscriber lines,
including ADSL, ADSL2+, and VDSL
DSn digital signal line, where n is an ordinal number (DS1, DS2, and so on)
FEMA Federal Emergency Management Agency
fiber fiber optic line
FM frequency modulation
FOA Fiber Optic Association
g acceleration due to gravity
GETS Government Emergency Telecommunications Service
GIS geographic information system
GRP gross regional product
GSP gross state product
GT guyed tower
HetNet heterogeneous network
IBC International Building Code
xi
ICT information and communications technology
IEEE Institute of Electrical and Electronics Engineers
IoT Internet of Things
IP internet protocol
ISP internet service provider
IXP internet exchange point
LTE Long-Term Evolution
M magnitude
Mw moment magnitude
microwave electromagnetic frequencies above 3 gigahertz
MMI Modified Mercalli Intensity
MMS multimedia service messages
MOP methods of procedures
MP monopole
MSC mobile switching center
MTSO Mobile Telephone Switching Office
MTX mobile telephone exchange
NAS Network Attached Storage
NCC National Coordinating Center for Communications
NECA National Electrical Contractors Association
NFPA National Fire Protection Association
NOAA National Oceanic and Atmospheric Administration
OLC optical loop carrier
ONT optical network terminal
OSH optical short hop
PBX private branch exchange
PGA peak ground acceleration
PGV peak ground velocity
POTS plain old telephone service
PSAP public safety answering point
PSPS Public Safety Power Shutoff
PSTN public switched telephone network
RF radio frequencies
SA spectral acceleration
SAFRR Science Application for Risk Reduction
SCADA Supervisory Control and Data Acquisition

xii
SIM subscriber identity module
SMS short message service
SOW switch on wheels
SST self-supporting tower
TCP Transmission Control Protocol
TIA Telecommunications Industry Association, a standards body
Tn transmission system, where n is a version number (T1, T2, and so on)
TSP Telecommunications System Priority
UPS uninterruptible power supply
USB Universal Serial Bus
USGS U.S. Geological Survey
VA voltampere
VDSL very high bitrate digital subscriber line
VoIP Voice over Internet Protocol
WEA Wireless Emergency Alert
Wi-Fi wireless internet, the IEEE 802.11 family of standards
WPS Wireless Priority Service
The HayWired Earthquake Scenario—Societal Consequences Edited by Shane T. Detweiler and Anne M. Wein Scientific Investigations Report 2017–5013–R–W [Also see https://doi.org/10.3133/sir20175013v3]
Chapter S
The HayWired Scenario—Telecommunications and Information Communication Technology
By Anne M. Wein, David T. Witkowski, Jamie L. Jones, Keith A. Porter, Laurel R. Ballanti, and Sara K. McBride
AbstractThe HayWired scenario—a moment magnitude (Mw) 7.0
rupture of the Hayward Fault and an aftershock sequence—is initiated in the east bay part of the San Francisco Bay region of California and is within 25 miles of Silicon Valley, a global center of internet commerce and communications technology. The scenario is named, in part, to recognize society’s dependence on wired and wireless communication technologies (telecommunications) and the networked information, computing, data storage, and processing technologies known collectively as information and communications technology. Following the Applied Technology Council, we refer to these technologies collectively as telecommunications.
This chapter considers how voice and data services may be disrupted and restored after a large earthquake in the region. The problem is complex, pertaining to multiple competitive service providers in a largely unregulated industry, the convergence of analog and digital systems on to the internet protocol platform, layers of hardware and software functionality, dependence of equipment on electric power, and the dynamic evolution of technology. It is challenging to stay abreast of changes in infrastructure and design standards, let alone assess network functionality and resilience. Telecommunications systems contrast with the more static single operator systems (electric power, transportation, and water supply) for which capabilities to model earthquake damage and system performance are more developed.
Our approach is to build upon previous earthquake studies of telecommunications and engage with industry experts about potential earthquake damage to telecommunications infrastructure and restoration of phone and internet services. We also consider restoration of phone and internet services after non-seismic incidents (hurricanes, wildfires, floods, and wide-scale power shutdowns). By using locations of central offices, data centers, wireless switches, cellular sites, and fiber optic lines from GeoTel Communications, LLC, we employ a geographic information system (GIS) to illustrate potential infrastructure damage from ground shaking and exposure to ground failure (surface fault rupture, liquefaction, and landslides), fire following earthquake, and aftershocks. We develop a simple restoration
model that incorporates residual network capacity (informed by the GIS analyses and expert opinion), further capacity losses from dependence on electric power (using the HayWired analysis of electric power restoration), and increased demand for these services after a disaster (indicated by expert input and reports on prior seismic and non-seismic disasters). This model incorporates resilience assumptions about the prevalence of permanent backup power on equipment, delivery of fuel and deployment of portable equipment to failed sites, and management of user behavior to illustrate the effects of these measures on demand served—a percentage of the demand for telecommunications services delivered.
For the HayWired scenario, we find potential fragilities of central offices and unanchored equipment to extreme shaking in the east bay, which is compounded by fires following the earthquake, and that data centers are more prone to liquefaction and cumulative effects of large aftershocks in Silicon Valley. Cellular towers built to Telecommunications Industry Alliance standards for wind loads appear to resist seismic loads of the HayWired scenario and are mostly located away from other earthquake hazards, but are vulnerable to power outages. Cellular equipment on poles and buildings are vulnerable to extreme shaking, liquefaction, and fire hazards. Long-haul and interoffice fiber optic lines cross the fault rupture, run through areas with liquefaction and (or) fire (and landslides, to a lesser extent), and may run along the length of three-quarters of the more than 100 heavily affected bridges. Collateral damage to fiber optic lines may result from damage to or repair of bridges and similarly from collocations with roadways, railways, and water, gas, and oil pipelines.
Meeting demand for voice and data services after a large earthquake is limited by network functionality losses from damage to infrastructure, power outages, and surges in demand for services. An assessment of prior disasters and our simple restoration model suggest that systems are initially overwhelmed by the increase in post-disaster demand despite resilience strategies of permanent backup power and management of user behavior that are critical soon after the disaster. The effectiveness of these two resilience strategies is short lived, but eventual arrivals of trucks with fuel and portable equipment are more able to sustain restoration that would otherwise be strongly influenced by the rate
2 The HayWired Earthquake Scenario—Societal Consequences
of electric power restoration. Alameda County service restoration is reduced to serving 7 percent of demand because it incurs the heaviest damage, broadest power outages, and largest increase in demand for services. A slower restoration in Alameda County is caused by longer power outages and delays in truck arrivals. However, with the deployment of portable equipment and fuel delivery, it is possible for telecommunications service restoration to get ahead of electric power restoration. User experience would be variable depending on their location and restoration priorities, how they are connecting to networks, what types of telecommunications systems they are using, who or what website they are trying to access, and whether they have adequate power to run and recharge their electronic devices.
The percentage of demand for voice and data services that is met is at its lowest when most needed for public health and safety immediately after the earthquake, and likely below the outcomes of recent telecommunications outages caused by Public Safety Power Shutoffs in 2019 and 2020 to reduce risk of wildfires. Additional considerations include the reduced functionality of 9–1–1 public safety answering points, delays in fire reporting contributing to fire spread, dependence of other critical lifeline systems (notably transportation) on telecommunications services, disproportionate effects on socially vulnerable populations, and widespread economic losses from telecommunications disruptions through the digital economy. However, voice and data service disruption as a source of economic losses is dwarfed by much larger economic losses from property damage and transportation disruption such that telecommuting (enabled by telecommunications) could play a role in reducing billions of dollars of economic losses.
Opportunities to improve the restoration of voice and data services after an earthquake lie with the industry, governments, subscribers, and businesses and include the following.
• Mitigation of earthquake damages including attention to telecommunications infrastructure standards for ground-failure hazards and fire, and consistent standards for equipment installation.
• Mitigation of interactions with other infrastructure, including effects of widespread electric power outages on network functionality and collateral damage to fiber optic lines (for example, from bridge damage, derailed trains, or pipeline [water, oil, or gas] breaks).
• Attention to the many cellular sites on buildings regarding building codes, backup power, and inspection protocols.
• Industry’s preparedness for restoration contingencies, especially potential fuel and labor shortages in the San Francisco Bay region.
• Readiness to use scientific earthquake hazard information in response and recovery decisions, including ShakeAlert warnings and afterslip and aftershock forecasts.
• User and (or) subscriber preparedness with sufficient power and data backups and management of their behavior to conserve bandwidth after a disaster.
• Attention to community telecommunications vulnerabilities, including the expansion of wireless small cells (with no backup power), implications of regulatory constraints, potential loss of 9–1–1 system functionality, competition with emergency response communications, and information and communication needs of socially vulnerable and (or) displaced populations.
• Business continuity practices for service outages and technological and organizational support for telecommuting after a disaster.
IntroductionThe HayWired scenario—a moment magnitude (Mw) 7.0
rupture of the Hayward Fault and an aftershock sequence—is initiated in the east bay part of the San Francisco Bay region and occurs within 25 miles of Silicon Valley, a global center of internet commerce and communications technology. The HayWired scenario is named, in part, to recognize society’s dependence on the wired and wireless communication technologies (telecommunications) and the networked information, computing, data storage, and processing technologies known collectively as information and communications technology (ICT). Following the Applied Technology Council (2016), we refer to these technologies collectively as telecommunications.
This study was conducted with the aim to inform San Francisco Bay region residents, public agencies, governing bodies, and enterprises about the potential disruption of voice and data services that would affect their lives during and after a large earthquake. This chapter addresses a broad audience and seeks to strike a balance between detailed and general descriptions; however, we recognize that some readers may prefer less or more technical detail. A scenario of potential telecommunications infrastructure hazard exposure or damage and voice and data service restoration can be used in exercises and planning along with comparable information for water supply, power supply and transportation (Porter, 2018; Jones and others, this volume). Results from this telecommunications study are also used in the economic consequence analyses (reported by Sue Wing and others, this volume) to examine effects of service losses on the digital economy in the San Francisco Bay region and the State of California. The overarching objectives are to highlight potential telecommunications infrastructure fragilities to multiple earthquake hazards, service restoration vulnerabilities, and opportunities for the industry and subscribers to improve the provision of telecommunications services after a large earthquake in the San Francisco Bay region (and any entity living near major faults).
Today’s World of Telecommunications
Today, voice communications use the plain old telephone service (POTS), digital voice over internet protocol (VoIP), or a combination of the two. For many people, interpersonal

Chapter S. Telecommunications and Information Communication Technology 3
communication is also achieved through text messaging, application-based chat, email, and social media networks. Our physical lives are increasingly intertwined with our virtual lives online. The internet is where we can communicate, but also obtain and store information, pay bills, do banking, and shop for goods and services.
News is no longer obtained only from television and radio broadcasts, but also audio and video streaming over the internet. Ownership of broadcast radio receivers is declining—a 2016 report showed that the number of households that do not own a radio receiver outside of a car radio increased from 4 percent in 2008 to 21 percent in 2016 (Hill, 2016) and in the 18–34 age group reached 32 percent (Edison Research, 2016). These numbers match declining television viewership and ownership trends.
Platforms for our online activities range from desktop and laptop computers, to mobile devices such as tablets, smartphones, and smartwatches. Mobile devices host calendars, take and share photographs, record videos, provide navigation assistance to drivers and pedestrians, entertain, and even act as digital assistants capable of listening and responding to our verbal commands. Many of the advanced functions on smartphones require interactions over telecommunications networks, causing exponentially increased usage of those networks. For example, processing of voice commands for artificial intelligence assistants on smartphones is not done locally—an audio file is recorded and sent to a server for analysis and processing, then the response is sent back to the smartphone, which takes action or reads the result back to the user.
Remote sensors, telemetry and telecommand radio networks, data collection and analysis, and technologies such as Supervisory Control and Data Acquisition (SCADA) (DPS Telecom, 2016) provide automated control and management of the electric grid, natural gas, and water pipelines, and other critical infrastructure systems.1 Automation systems that use commercial networks are used to control physical security, heat, light, and water for residents. Increasingly, more systems are based on the inter-networking of autonomous computing devices, data centers, artificial intelligence algorithms, actuators, and sensors—that is, the Internet of Things (IoT).
Telecommunications and Earthquakes
ShakeAlert, an earthquake early warning system for the west coast of the United States, uses telecommunications technologies to warn people of heavy shaking seconds after an earthquake has initiated (Strauss and others, this volume). Broadcast media is no longer the go-to solution for wide dissemination of information before, during, and after an emergency—it is being replaced with text messages, tweets, and the Wireless Emergency Alert (WEA) system that generates pop-up messages on smartphones (Federal Communications Commission, 2017a).
1Some infrastructure systems (such as electric, natural gas, and water utilities) operate SCADA on private networks, independent of commercial networks.
The capability of social media to provide insights into earthquake occurrences is the subject of the U.S. Geological Survey (USGS) Twitter Earthquake Dispatch (USGSted) project, which mines Twitter messages for keywords and geolocation data to determine if an earthquake has occurred (Crooks and others, 2013). The increasing number of network-connected devices means that even fitness trackers (presuming the data is gathered while protecting the privacy rights of the wearer) can be used to determine if an earthquake has occurred by mining the data to show that large numbers of people are suddenly awake and moving in the middle of the night (Mercer, 2014).
Disruption of Telecommunications Services
The last major disaster to affect the entire San Francisco Bay region, the 1989 Loma Prieta earthquake, occurred almost a decade before email came into common usage. How might the telecommunications networks, on which our modern world is based, be disrupted by a large earthquake like the HayWired scenario? Telecommunications networks, whether traditional or modern, fail during a large earthquake. In the HayWired scenario, equipment and structures are physically damaged, and connections are severed by ground shaking, ground movement, and cascading hazards of fire following the earthquake. Power outages are widespread and some backup power systems on equipment are lacking or fail. In addition, telecommunications networks are congested by heavy usage in the aftermath of the disaster. Not all of the San Francisco Bay region’s telecommunications systems will work in the hours and days after a major earthquake, yet we commonly expect that these modern conveniences and monitoring advances will always be available.
Voice and data service disruptions affect both humans and the machines that support our modern lives. Service outages can severely disrupt the operations of other critical infrastructure, economic activities, and everyday life. Importantly, immediately after an earthquake strikes, network capacity losses and congestion disrupt voice and data services when they are most needed for public health and safety.
As the internet connects more of our infrastructure to telecommunications networks, the impact of outages potentially increases. Many critical services that may have been able to function effectively with only minimal telecommunications technology now rely on external information resources. For example, medical facilities may store electronic medical records in cloud services offsite. Patients may rely on remote monitoring of chronic conditions. On the positive side, the use of cloud services—located in geographically diverse and generally well-protected facilities—also enables companies to resume their operations from any location (for example, NZ Herald, 2012).
For a population that is accustomed to using the internet and mobile data to manage their lives, the impact of service outages will accentuate the emotional and mental challenges of an earthquake. In a small amount of literature on the emotional aspects of limited mobile phone use, Hoffner and others (2015) found that 70 percent of people recalled loneliness, anxiousness, or vulnerability when involuntarily separated from their mobile

4 The HayWired Earthquake Scenario—Societal Consequences
phone. Regarding people’s behavior, police have stated that cellular service and charged phones help with law enforcement after a disaster (T. Serio, Verizon Wireless, oral commun., 2014).
There are social disparities in disruptions of telecommunications that are increasingly serviced through cellular voice and data networks. In 2008, only 20 percent of U.S. households had exclusively cellular phone service (Blumberg and Luke, 2009); by the end of 2018, nearly 60 percent of households in the United States no longer had wired telephones (Blumberg and Luke, 2019), and for certain demographics (adults under age 34, Hispanic households, and people living below the poverty line), wireless phones are overwhelmingly the sole method of voice telephony. This is also true for data transmissions, where wireless is increasingly the preferred means of connection for people with incomes at or below the national poverty level. A 2016 survey found that the only connection to the internet for 14 percent of Californians is via a smartphone (California Emerging Technology Fund, 2017). Furthermore, in an emergency, wireline 9–1–1 phone calls are associated with a fixed location, but the location information of a mobile phone call is less specific for emergency responders (Federal Communications Commission, 2018), exacerbating the social vulnerabilities for certain demographics reliant on a cellular phone.
Study Approach
Compared to utilities and transportation systems, the disruption of telecommunications networks is challenging to investigate. Unlike traditional services such as physical and fixed single-operator networks for water supply, commercial power, highways, and commuter rail, telecommunications infrastructure differs in four crucial aspects: (1) it has multiple layers of functionality; (2) it has stronger dependencies than other infrastructure, in particular functional dependence on electric power; (3) infrastructure and services are commonly provided competitively, rather than by a public or single private utility, and are likely unregulated (Applied Technology Council, 2016); and (4) the demand for services increase above normal levels after a disaster (referred to as a demand surge). Another factor that complicates modeling network functionality is the constantly evolving technology, for example, the on-going convergence of voice and data networks using internet protocol (IP) technologies, the recent expansion of small cell technology for wireless sites, and the impending deployment of fifth generation (5G) cellular networks.
Nonetheless, similar to the analyses of other critical infrastructure systems, we assemble telecommunications infrastructure data and document failure modes; analyze potential infrastructure hazard exposure or damage for the HayWired earthquake scenario; and develop a simple model of voice and data service disruption that integrates effects of multiple earthquake hazards, power supply outages, demand surge, and service restoration strategies. The restoration strategies include permanent backup power on equipment, logistics of trucking in portable generators and (or) equipment
to enhance network functionality, and management of subscriber behavior to reduce congestion in networks.
To complement spatial analyses and modeling, we facilitated conversations with a range of collaborators including industry representation, municipal information officers, and users or subscribers of voice and data services (for example, business, government, and individuals). Participation was instigated through two workshops and individual consultations. The first workshop hosted 18 industry experts and public emergency communication managers in February 2016, and the second workshop hosted approximately 60 industry experts, researchers, and emergency management practitioners (in government, critical infrastructure, and business roles) in September 2017. The second workshop rotated industry expertise through technical discussions and stakeholders (users) through coordination topics (see appendix 1).
Analyses and assumptions are grounded in observations from recent studies of global disasters, earthquakes in particular, but also other disasters in the United States. Earthquake disasters that provide information about damage to telecommunications infrastructure and service restoration include:
• California earthquakes
• 1989 Mw 6.9 Loma Prieta earthquake in the San Francisco Bay region
• 1994 Mw 6.7 Northridge earthquake in the San Fernando Valley region
• 2014 Mw 6.0 South Napa earthquake in the San Francisco Bay region
• International earthquakes
• 2010 Mw 8.8 Maule earthquake offshore of Biobío, Chile
• 2010 Mw 7.1 Darfield earthquake, followed by the 2011 Mw 6.1 aftershock, in Christchurch, New Zealand
• 2011 Mw 9.0 Tohoku earthquake and tsunami in Japan
• 2015 Mw 7.8 Gorkha earthquake and aftershocks in Nepal
• 2016 Mw 6.0 and Mw 7.0 Kumamoto earthquakes in Japan
• 2018 Mw 6.6 Hokkaido earthquake in Japan.Recent disasters in the United States that provide relevant
information on telecommunications restoration dependencies and resilience strategies include:
• 2001 September 11 attacks
• 2005 Hurricane Katrina
• 2012 Hurricane Sandy
• 2017 wildfires in northern California (including the TubbsFire) and southern California (including the Thomas Fire)

Chapter S. Telecommunications and Information Communication Technology 5
• 2018 wildfires in northern California (including the Men-docino Complex Fire)
• 2019 Public Safety Power Shutoffs (PSPS) in California.The 2019–2020 Ridgecrest, California, and the Puerto
Rico earthquake sequences occurred after information on these events was compiled, and as a result are not incorporated into this study.
Our approach follows the principles of a Science Application for Risk Reduction (SAFRR) scenario (Porter and Sherrill, 2011; Hudnut and others, 2017) by providing a plausible outcome based on available science, disaster research, engineering knowledge, and consensus among experts. This chapter does not present a robust technical analysis (which is not currently practically or analytically feasible), but it does delve deeper and is more comprehensive than any known prior disaster scenario analysis of telecommunications infrastructure and services.
Chapter Overview
This report proceeds with basic descriptions of the telecommunications systems, various types of subscriber connectivity, and failure modes of equipment and transmission channels. The next section describes available telecommunications infrastructure data and results of analytical methods used to estimate multi-hazard exposure or damage to central offices, data centers, cellular sites, and fiber optic lines in the HayWired scenario. The following section provides estimates of residual network capacity and generates voice and data service restoration curves by county for cases of full dependence on commercial electric power supply, demand surge, and the various restoration strategies for the HayWired scenario. Numerous study limitations are acknowledged in the next section.
The last section summarizes results of telecommunications infrastructure exposure and damage and service restoration analyses for the HayWired scenario. Perspectives on societal consequences are drawn from the functionality of 9–1–1 call centers, and other HayWired analyses including the effect of communication delays in the spread of fire following earthquake, compounded vulnerabilities for populations at risk of displacement, and economic impacts of voice and data service outages. In conclusion, opportunities that emerged from a deeper examination of an earthquake scenario are emphasized to complement the Applied Technology Council’s (2016) broader disaster assessment of telecommunications systems. Opportunities for the industry pertain to mitigating damage from multiple earthquake hazards, addressing dependencies on building sites and other lifeline infrastructure systems, preparing for restoration contingencies, working with governments, using hazard and risk communications, and managing subscriber behavior. Opportunities for improving societal resilience to service disruptions include preparing for emergency response communications, informing user behavior, and planning for business contingencies and continuity.
Telecommunications Systems, Subscriber Connectivity, and Infrastructure Failure Modes
This section provides some basic information about telecommunications systems; typical connectivity for businesses of different sizes, homes, and public safety answering points (PSAPs); and potential equipment and channel failure modes. The intention is to provide context for situating physical infrastructure in the multi-hazard landscape of the HayWired earthquake scenario, for estimating network capacity losses, and for considering societal impacts.
Telecommunications Systems
Telecommunications systems are composed of wired and wireless technology for voice communications and data transfer, storage, and processing. Wired systems use physical media to transmit voice and data at different frequencies. Copper wire lines pass information by conducting electromagnetic energy between transmitters and receivers. Fiber optic lines pass information by conducting pulses of light along strands of glass that are one-tenth the size of a human hair. Except for filling in, all new construction of fixed lines is likely to be fiber optic; copper and coaxial lines are rarely used for new construction, even in residential areas (Applied Technology Council, 2016) or for reconstruction after recent disasters (for example, Blagdon, 2013), but many of the original copper lines still remain.
Wireless systems (for example, cellular, satellite, and Wi-Fi) use radio waves instead of physical lines to provide service to end users. Most commonly, wireless systems extend the reach of voice and data services; ultimately the majority of these services depend on connectivity with physical wiring and fiber optic lines, although there are some sites that use high-frequency microwave links in lieu of fiber optic lines as the backhaul to the backbone network. There are also wireless data links known as optical short hop (OSH) that use laser transceivers that must be very precisely aligned; however, these are uncommon and used only for short distances.2
A complete description of modern communication systems is complex because they have been built up over time since the original plain old telephone system (POTS), which connects telephones to the public switched telephone network (PSTN), uses analog (continuous non-digital signal) technology over copper twisted pair wires to transmit voice. Telecommunications technology has evolved from single-purpose networks to a converged network that supports both analog and digital technology across wired and wireless systems for both voice communication and data transmission. For example, copper wires can use frequency splitting to carry
2OSH has more bandwidth than radio waves but has distance limitations of a few hundred meters. OSH is more expensive but may be cheaper than digging trenches or installing conduit in some places, and may be required in cases where digging is not an option.
6 The HayWired Earthquake Scenario—Societal Consequences
both analog and digital transmissions; analog signals can be converted to digital signals and vice versa (by sampling and reconstruction, respectively), and digital modulation can host analog services (as in the case of VoIP telephony).
Understanding that various data and voice systems increasingly share copper pair, coaxial, and fiber optic lines and backbone infrastructure, the various types of equipment and channels needed to support various voice and data services can be illustrated in system diagrams of:
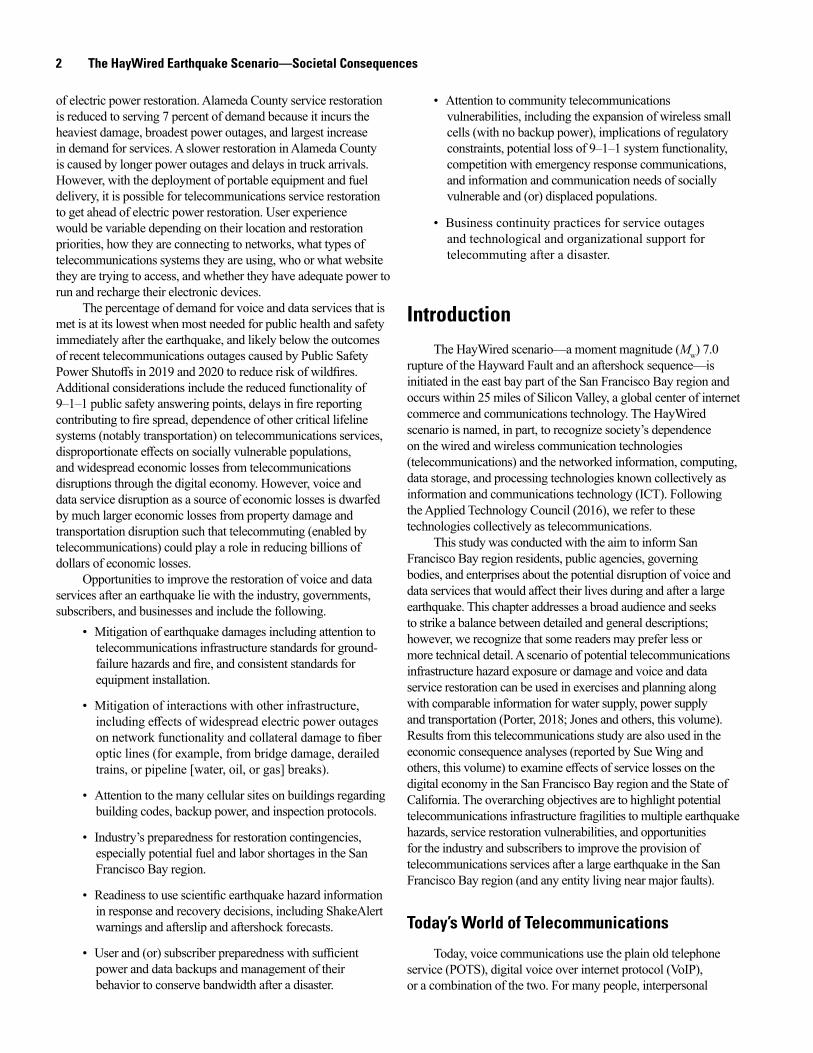
• copper-paired POTS and digital subscriber line (DSL) (fig. 1),
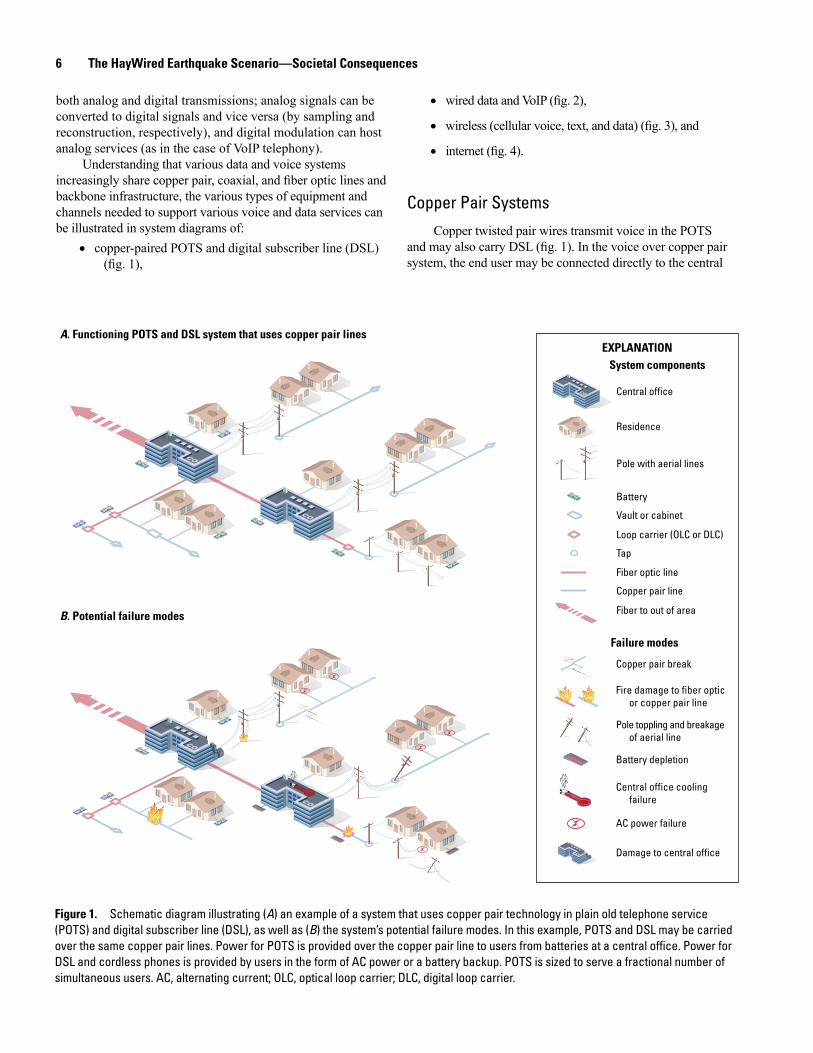
• wired data and VoIP (fig. 2),
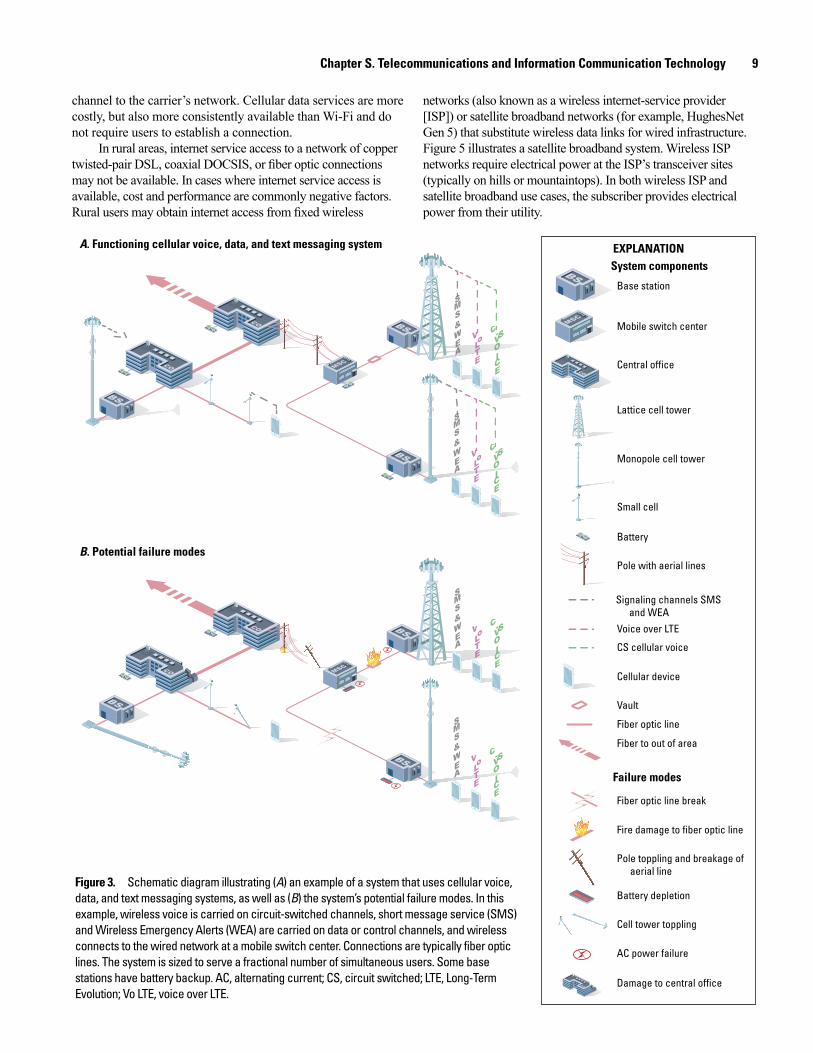
• wireless (cellular voice, text, and data) (fig. 3), and
• internet (fig. 4).
Copper Pair SystemsCopper twisted pair wires transmit voice in the POTS
and may also carry DSL (fig. 1). In the voice over copper pair system, the end user may be connected directly to the central
men21-7516_fig01
CO
CO
CO
CO
Failure modes
System components
Fiber optic line
Fiber to out of area
Copper pair line
Loop carrier (OLC or DLC)
Vault or cabinet
Tap
Battery
CO Central office
Residence
Pole with aerial lines
EXPLANATION
COCO
Copper pair break
Battery depletion
AC power failure
Damage to central officeCOCO
Fire damage to fiber optic or copper pair line
Central office cooling failure
Pole toppling and breakage of aerial line
A. Functioning POTS and DSL system that uses copper pair lines
B. Potential failure modes
Figure 1. Schematic diagram illustrating (A) an example of a system that uses copper pair technology in plain old telephone service (POTS) and digital subscriber line (DSL), as well as (B) the system’s potential failure modes. In this example, POTS and DSL may be carried over the same copper pair lines. Power for POTS is provided over the copper pair line to users from batteries at a central office. Power for DSL and cordless phones is provided by users in the form of AC power or a battery backup. POTS is sized to serve a fractional number of simultaneous users. AC, alternating current; OLC, optical loop carrier; DLC, digital loop carrier.
Chapter S. Telecommunications and Information Communication Technology 7
office,3 or be extended by a loop carrier (or subscriber loop carrier). The connection from a telephone to a central office was originally called a loop—a term that dates back to the early days of the telegraph when central offices were the end point for local copper loops and housed switching equipment as well as connections to toll and routing centers for long-distance
3Not all central offices are the same. For example, some central offices called tandem or toll switches only communicate to other central offices and have no connection to end users. As a result, these toll switches are more important and have a higher hierarchy than regular central offices.
calling. Later implementations of this system moved provider equipment closer to subscribers; these systems are referred to as digital loop carriers (DLCs). In DLC systems, subscriber lines connect to loop carrier equipment, where the analog signal from the end user is digitized and multiplexed onto a data line between the loop carrier and a central office.4 Optical loop
4The method of multiplexing connections is also used in digital subscriber line (DSL) data service, where the DSLs are combined into a single data channel by using a digital subscriber line access multiplexer (DSLAM). This can be done in conjunction with DLC or OLC systems. The benefit of a DSLAM is that DSLs are limited to approximately 17,000 feet in length between the serving system and the subscriber. Data speed via DSL is inversely proportional to line length, so shortening the line length of a DSLAM allows faster subscriber speeds.
men21-7516_fig02
CO
H
H
CO
H
H
Flood damage to coaxial cable
Failure modes
Coaxial cable break
Fiber optic line
Copper pair line
Coaxial cable
HHub
Battery depletion
AC power failure
Node
Amplifier
Tap
Battery
CO Central office
Residence
Pole with aerial lines
Fiber to out of area
System components
EXPLANATION
Fire damage to coaxial cable
Pole toppling and breakage of aerial line
A. Functioning data and VoIP system that uses wired connections
B. Potential failure modes
Figure 2. Schematic diagram illustrating (A) an example of a system that uses wired technology of data and voice over internet protocol (VoIP) connected via coaxial and fiber optic lines, as well as (B) the system’s potential failure modes. In this example, data is carried on copper pair, coaxial, or fiber optic lines to gateway equipment, which optionally provides a telephone connection. Power for gateway equipment is provided by users in the form of AC power or battery backup. Users typically have cordless phones that also require power. Operator-provided battery backup may last only 3–4 hours. Inline amplifiers require power. AC, alternating current.
8 The HayWired Earthquake Scenario—Societal Consequences
carriers (OLCs) are an even later implementation of this system (see fig. 2). They are commonly referred to as “fiber to the curb” because they user fiber optic lines between the loop carrier and central office and OLC equipment is typically installed in curbside cabinets in residential neighborhoods.
Power sources are needed to supply central offices and loop carriers with power. Whether subscribers are directly connected to a central office or to a loop carrier, they receive power for their POTS from the service provider. However, cordless phones (which are nearly ubiquitous in modern homes and small businesses that still have landline telephone service) require their own source of electric power for the base unit and the batteries need to be charged.
Data and Voice Over Internet Protocol (VoIP) Systems
Today, VoIP is gradually replacing the voice over copper pair technology of the POTS system. The VoIP system digitizes a user’s voice, then transports it over a data network using a private internet protocol (IP) provided by carriers (as opposed to public internet). Digitized voice to and from subscribers is carried by the same copper wires as POTS using IP DSL (fig. 1) or IP coaxial lines using Data Over Cable Service Interface Specification (DOCSIS) or fiber optic lines (fig. 2).
Power sources are needed to supply central offices, hubs, and amplifiers with power. An important distinction between older POTS service and VoIP is that VoIP (and data) subscribers need to provide electrical power locally to their broadband equipment (commonly called modems or gateways). This equipment may have only rudimentary backup batteries—if they have a battery at all. Even if the gateway battery exists and is functioning, cordless phones attached to VoIP gateways still require their own source of electric power.
Cellular Voice, Data, and Text Messaging SystemsCellular networks carry both digitized voice and text
communications and data (fig. 3). Older cellular voice networks operated in similar fashion to wired PSTNs and are said to be circuit switched—each call between a phone and a cellular site is assigned to a dedicated frequency or digital channel. As the data speed and coverage of modern fourth generation (4G) cellular networks have improved, some carriers have begun to handle calls using voice over Long-Term Evolution (LTE), which provides better audio quality and allows the wireless carrier greater flexibility in managing their network capacity and resources.
At the heart of the wireless communication network, Mobile Telephone Switching Offices (MTSOs) contain a mobile switching center (MSC) that switches cell phones to the cellular site that provides the best reception and connects phones to central offices. In figure 3, we show that MSC buildings are constructed adjacent to central offices, but more commonly they are collocated with central offices in the same building. In the early days, when large
PSTN frame racks were still dominant, the buildings could not fit more equipment so early MSCs were located nearby. As PSTN has given way to VoIP telephony, VoIP system equipment requires less space and MSCs are able to fit in central offices.
Cellular sites are the point of entry for wireless subscriber devices and also act as control points for management and monitoring of cellular calls and other services. Figure 3 illustrates macrocells (on lattice towers and monopoles) as well as distributed antenna systems (DAS) and small cells, collectively known as heterogeneous networks, or HetNets. HetNets first appeared as capacity enhancement and expansion technologies for 4G cellular networks. Over the past 5 to 6 years, carriers have deployed small wireless cells primarily on utility poles, streetlights, kiosks, trees, and buildings. Equipment is either mounted to the pole or placed in an equipment enclosure on a pedestal or in an underground vault. HetNets improve performance in small areas where cellular coverage is weak or there are large concentrations of users (such as in dense population and business centers, in public venues, or along roadways).
Cellular networks require electric power at cellular sites and along wired connections (for example, amplifiers on fiber optic lines) to function. Backup power is common at macrosite base stations and required at MSCs and central offices. Although HetNet technology provides a more dispersed point of entry and could help improve post-disaster telecommunications network performance, small cells in HetNets typically do not have backup electrical power systems because of size constraints and local ordinances. Individual users are responsible for charging their cellular devices.
The InternetThe public internet transfers data between computers and
isolated networks are linked together using the IP standard. Internet exchange points (IXPs) are major exchange hubs (in buildings located in major cities around the world) where different networks interconnect for the exchange of data between networks owned and operated by commercial or public entities (Thompson, 2016). For example, the Federal Internet Exchange connects the U.S. Government’s various networks with public networks. Four types of data centers have different levels of control of data transit (see sidebar 1). Fiber optic lines connect these centers to each other (fig. 4). Terrestrial microwave links may be used in place of fiber optic connections.
Internet-based services can be delivered using diverse technologies ranging from fiber optic and copper loops to cellular wireless and satellite (Applied Technology Council, 2016). Digital data originating from a computer may be transmitted by copper pair or DSL, coaxial cable5 or DOCSIS, or fiber optic line. Cellular smartphones operate as a computer in the public internet system. A smartphone’s data connection for internet access can occur in parallel with the carrier’s voice connection, either via a Wi-Fi connection or a cellular data
5Coaxial cable is the same cable used for television and has an inner conductor (for example, copper plated steel wire) that is shielded to reduce traffic interference.
Chapter S. Telecommunications and Information Communication Technology 9
channel to the carrier’s network. Cellular data services are more costly, but also more consistently available than Wi-Fi and do not require users to establish a connection.
In rural areas, internet service access to a network of copper twisted-pair DSL, coaxial DOCSIS, or fiber optic connections may not be available. In cases where internet service access is available, cost and performance are commonly negative factors. Rural users may obtain internet access from fixed wireless
networks (also known as a wireless internet-service provider [ISP]) or satellite broadband networks (for example, HughesNet Gen 5) that substitute wireless data links for wired infrastructure. Figure 5 illustrates a satellite broadband system. Wireless ISP networks require electrical power at the ISP’s transceiver sites (typically on hills or mountaintops). In both wireless ISP and satellite broadband use cases, the subscriber provides electrical power from their utility.
men21-7516_fig03
MSC
CO
CO
BS
BS
VoLTE
BS
VoLTE
MSC
CO
BS
BS
VoLTE
BS
C-SVOICE
VoLTE
SMS&WEA
Failure modes
Signaling channels SMS and WEA
Voice over LTE
CS cellular voice
Base stationBS
MSCMobile switch center
COCentral office
SMS&WEA
C-SVOICE
C-SVOICE
SMS&WEA
SMS&WEA
C-SVOICE
Pole with aerial lines
Battery
System componentsEXPLANATIONA. Functioning cellular voice, data, and text messaging system
B. Potential failure modes
Monopole cell tower
Lattice cell tower
Small cell
Fiber optic line
Fiber to out of area
Cellular device
Vault
COCO
Fiber optic line break
Fire damage to fiber optic line
Pole toppling and breakage of aerial line
Battery depletion
Cell tower toppling
AC power failure
Damage to central officeCOCO
Figure 3. Schematic diagram illustrating (A) an example of a system that uses cellular voice, data, and text messaging systems, as well as (B) the system’s potential failure modes. In this example, wireless voice is carried on circuit-switched channels, short message service (SMS) and Wireless Emergency Alerts (WEA) are carried on data or control channels, and wireless connects to the wired network at a mobile switch center. Connections are typically fiber optic lines. The system is sized to serve a fractional number of simultaneous users. Some base stations have battery backup. AC, alternating current; CS, circuit switched; LTE, Long-Term Evolution; Vo LTE, voice over LTE.
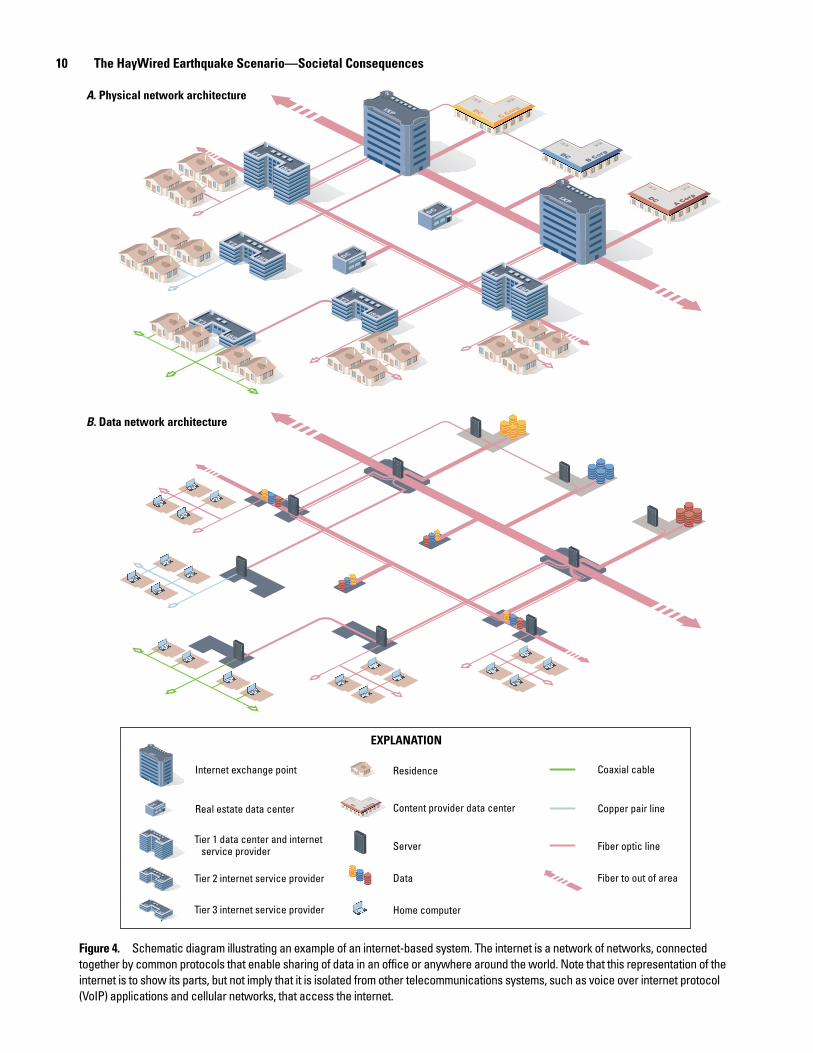
10 The HayWired Earthquake Scenario—Societal Consequences
men21-7516_fig04
DC
DC
ISP
T1
ISP
T2
ISP
T3
ISP
T1
ISP
T2
IXP
IXP DCA Corp
DCB Corp
DCC Corp
Residence
EXPLANATION
DCA Corp Content provider data center
Tier 2 internet service providerISP
T2
ISP
T1
Tier 1 data center and internet service provider
ISP
T3
Tier 3 internet service provider
IXP
Internet exchange point
DC
Real estate data center
Server
Data
Home computer
Copper pair line
Fiber optic line
Coaxial cable
Fiber to out of area
A. Physical network architecture
B. Data network architecture
Figure 4. Schematic diagram illustrating an example of an internet-based system. The internet is a network of networks, connected together by common protocols that enable sharing of data in an office or anywhere around the world. Note that this representation of the internet is to show its parts, but not imply that it is isolated from other telecommunications systems, such as voice over internet protocol (VoIP) applications and cellular networks, that access the internet.
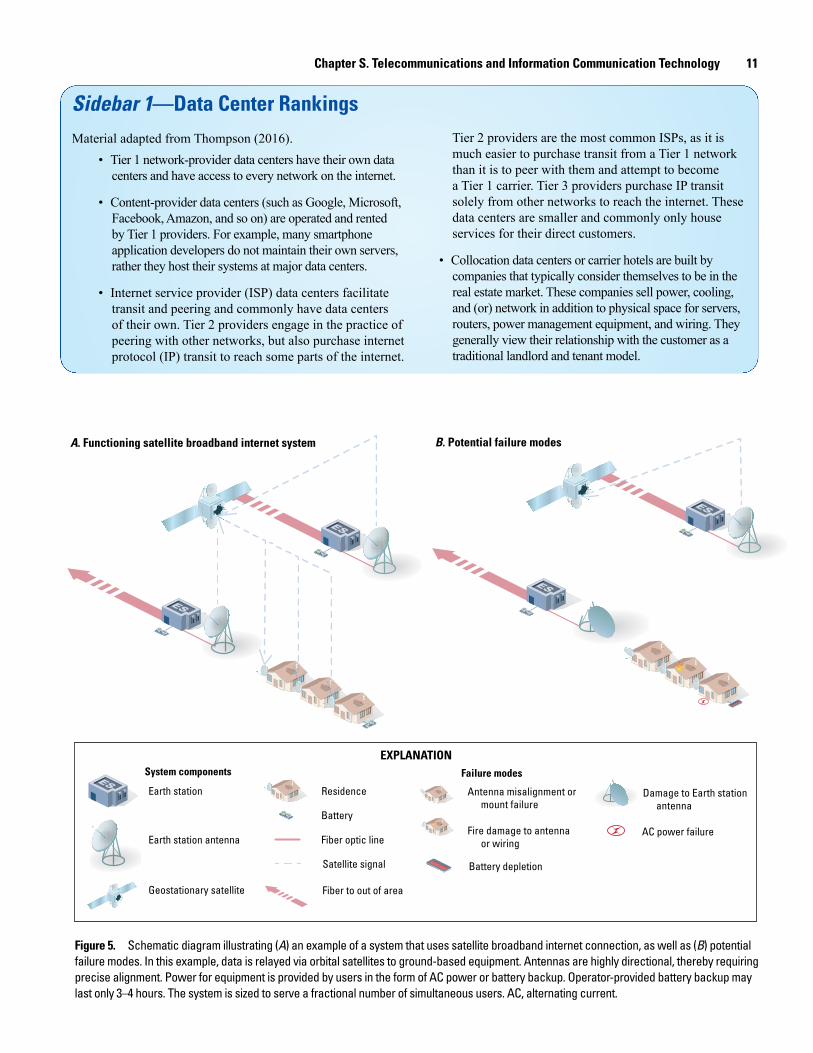
Chapter S. Telecommunications and Information Communication Technology 11
Sidebar 1—Data Center RankingsMaterial adapted from Thompson (2016).
• Tier 1 network-provider data centers have their own data centers and have access to every network on the internet.
• Content-provider data centers (such as Google, Microsoft, Facebook, Amazon, and so on) are operated and rented by Tier 1 providers. For example, many smartphone application developers do not maintain their own servers, rather they host their systems at major data centers.
• Internet service provider (ISP) data centers facilitate transit and peering and commonly have data centers of their own. Tier 2 providers engage in the practice of peering with other networks, but also purchase internet protocol (IP) transit to reach some parts of the internet.
Tier 2 providers are the most common ISPs, as it is much easier to purchase transit from a Tier 1 network than it is to peer with them and attempt to become a Tier 1 carrier. Tier 3 providers purchase IP transit solely from other networks to reach the internet. These data centers are smaller and commonly only house services for their direct customers.
• Collocation data centers or carrier hotels are built by companies that typically consider themselves to be in the real estate market. These companies sell power, cooling, and (or) network in addition to physical space for servers, routers, power management equipment, and wiring. They generally view their relationship with the customer as a traditional landlord and tenant model.
men21-7516_fig05
ES
ES
ES
ES
Failure modes
AC power failure
Damage to Earth station antenna
Geostationary satellite
Earth station antenna
ESEarth station Residence
Battery
Fiber to out of area
Satellite signal
Fiber optic line
System componentsEXPLANATION
Antenna misalignment or mount failure
Fire damage to antenna or wiring
Battery depletion
A. Functioning satellite broadband internet system B. Potential failure modes
Figure 5. Schematic diagram illustrating (A) an example of a system that uses satellite broadband internet connection, as well as (B) potential failure modes. In this example, data is relayed via orbital satellites to ground-based equipment. Antennas are highly directional, thereby requiring precise alignment. Power for equipment is provided by users in the form of AC power or battery backup. Operator-provided battery backup may last only 3–4 hours. The system is sized to serve a fractional number of simultaneous users. AC, alternating current.
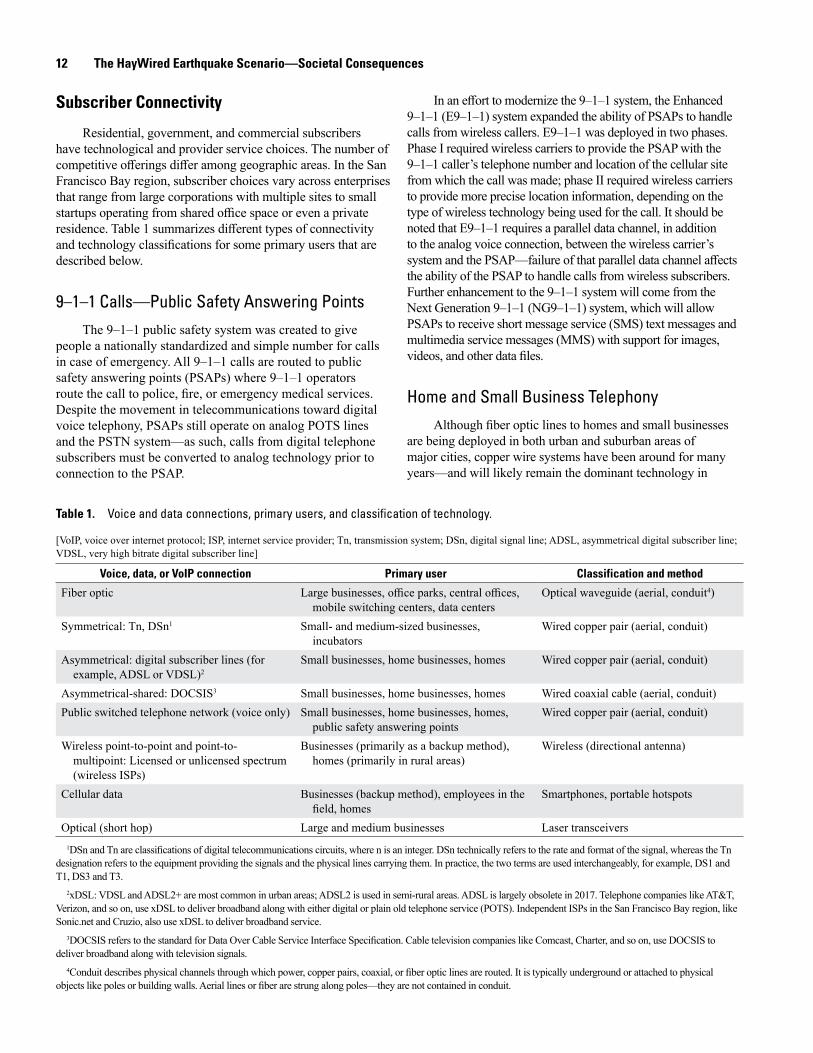
12 The HayWired Earthquake Scenario—Societal Consequences
Subscriber Connectivity
Residential, government, and commercial subscribers have technological and provider service choices. The number of competitive offerings differ among geographic areas. In the San Francisco Bay region, subscriber choices vary across enterprises that range from large corporations with multiple sites to small startups operating from shared office space or even a private residence. Table 1 summarizes different types of connectivity and technology classifications for some primary users that are described below.
9–1–1 Calls—Public Safety Answering PointsThe 9–1–1 public safety system was created to give
people a nationally standardized and simple number for calls in case of emergency. All 9–1–1 calls are routed to public safety answering points (PSAPs) where 9–1–1 operators route the call to police, fire, or emergency medical services. Despite the movement in telecommunications toward digital voice telephony, PSAPs still operate on analog POTS lines and the PSTN system—as such, calls from digital telephone subscribers must be converted to analog technology prior to connection to the PSAP.
Table 1. Voice and data connections, primary users, and classification of technology.
[VoIP, voice over internet protocol; ISP, internet service provider; Tn, transmission system; DSn, digital signal line; ADSL, asymmetrical digital subscriber line; VDSL, very high bitrate digital subscriber line]
In an effort to modernize the 9–1–1 system, the Enhanced 9–1–1 (E9–1–1) system expanded the ability of PSAPs to handle calls from wireless callers. E9–1–1 was deployed in two phases. Phase I required wireless carriers to provide the PSAP with the 9–1–1 caller’s telephone number and location of the cellular site from which the call was made; phase II required wireless carriers to provide more precise location information, depending on the type of wireless technology being used for the call. It should be noted that E9–1–1 requires a parallel data channel, in addition to the analog voice connection, between the wireless carrier’s system and the PSAP—failure of that parallel data channel affects the ability of the PSAP to handle calls from wireless subscribers. Further enhancement to the 9–1–1 system will come from the Next Generation 9–1–1 (NG9–1–1) system, which will allow PSAPs to receive short message service (SMS) text messages and multimedia service messages (MMS) with support for images, videos, and other data files.
Home and Small Business TelephonyAlthough fiber optic lines to homes and small businesses
are being deployed in both urban and suburban areas of major cities, copper wire systems have been around for many years—and will likely remain the dominant technology in
Voice, data, or VoIP connection Primary user Classification and method
Fiber optic Large businesses, office parks, central offices, mobile switching centers, data centers
Optical waveguide (aerial, conduit4)
Symmetrical: Tn, DSn1 Small- and medium-sized businesses, incubators
Wired copper pair (aerial, conduit)
Asymmetrical: digital subscriber lines (for example, ADSL or VDSL)2
Small businesses, home businesses, homes Wired copper pair (aerial, conduit)
Asymmetrical-shared: DOCSIS3 Small businesses, home businesses, homes Wired coaxial cable (aerial, conduit)Public switched telephone network (voice only) Small businesses, home businesses, homes,
public safety answering pointsWired copper pair (aerial, conduit)
Wireless point-to-point and point-to-multipoint: Licensed or unlicensed spectrum (wireless ISPs)
Businesses (primarily as a backup method), homes (primarily in rural areas)
Wireless (directional antenna)
Cellular data Businesses (backup method), employees in the field, homes
Smartphones, portable hotspots
Optical (short hop) Large and medium businesses Laser transceivers1DSn and Tn are classifications of digital telecommunications circuits, where n is an integer. DSn technically refers to the rate and format of the signal, whereas the Tn
designation refers to the equipment providing the signals and the physical lines carrying them. In practice, the two terms are used interchangeably, for example, DS1 and T1, DS3 and T3.
2xDSL: VDSL and ADSL2+ are most common in urban areas; ADSL2 is used in semi-rural areas. ADSL is largely obsolete in 2017. Telephone companies like AT&T, Verizon, and so on, use xDSL to deliver broadband along with either digital or plain old telephone service (POTS). Independent ISPs in the San Francisco Bay region, like Sonic.net and Cruzio, also use xDSL to deliver broadband service.
3DOCSIS refers to the standard for Data Over Cable Service Interface Specification. Cable television companies like Comcast, Charter, and so on, use DOCSIS to deliver broadband along with television signals.
4Conduit describes physical channels through which power, copper pairs, coaxial, or fiber optic lines are routed. It is typically underground or attached to physical objects like poles or building walls. Aerial lines or fiber are strung along poles—they are not contained in conduit.
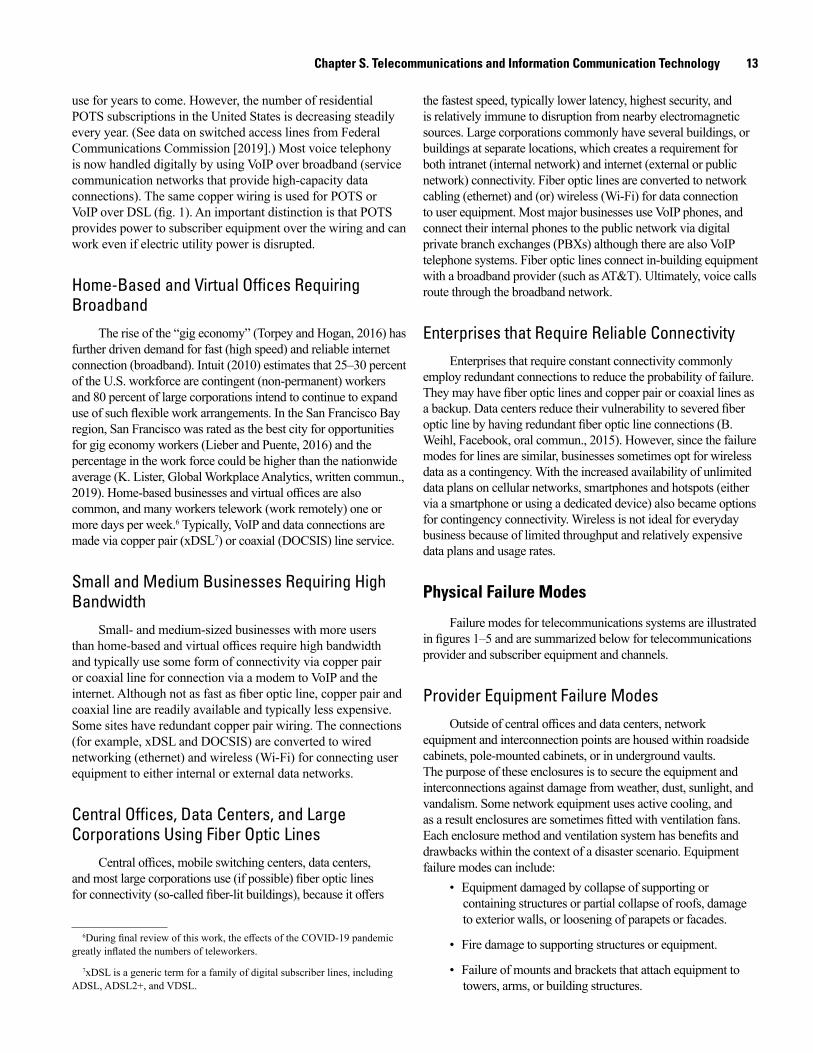
Chapter S. Telecommunications and Information Communication Technology 13
use for years to come. However, the number of residential POTS subscriptions in the United States is decreasing steadily every year. (See data on switched access lines from Federal Communications Commission [2019].) Most voice telephony is now handled digitally by using VoIP over broadband (service communication networks that provide high-capacity data connections). The same copper wiring is used for POTS or VoIP over DSL (fig. 1). An important distinction is that POTS provides power to subscriber equipment over the wiring and can work even if electric utility power is disrupted.
Home-Based and Virtual Offices Requiring Broadband
The rise of the “gig economy” (Torpey and Hogan, 2016) has further driven demand for fast (high speed) and reliable internet connection (broadband). Intuit (2010) estimates that 25–30 percent of the U.S. workforce are contingent (non-permanent) workers and 80 percent of large corporations intend to continue to expand use of such flexible work arrangements. In the San Francisco Bay region, San Francisco was rated as the best city for opportunities for gig economy workers (Lieber and Puente, 2016) and the percentage in the work force could be higher than the nationwide average (K. Lister, Global Workplace Analytics, written commun., 2019). Home-based businesses and virtual offices are also common, and many workers telework (work remotely) one or more days per week.6 Typically, VoIP and data connections are made via copper pair (xDSL7) or coaxial (DOCSIS) line service.
Small and Medium Businesses Requiring High Bandwidth
Small- and medium-sized businesses with more users than home-based and virtual offices require high bandwidth and typically use some form of connectivity via copper pair or coaxial line for connection via a modem to VoIP and the internet. Although not as fast as fiber optic line, copper pair and coaxial line are readily available and typically less expensive. Some sites have redundant copper pair wiring. The connections (for example, xDSL and DOCSIS) are converted to wired networking (ethernet) and wireless (Wi-Fi) for connecting user equipment to either internal or external data networks.
Central Offices, Data Centers, and Large Corporations Using Fiber Optic Lines
Central offices, mobile switching centers, data centers, and most large corporations use (if possible) fiber optic lines for connectivity (so-called fiber-lit buildings), because it offers
6During final review of this work, the effects of the COVID-19 pandemic greatly inflated the numbers of teleworkers.
7xDSL is a generic term for a family of digital subscriber lines, including ADSL, ADSL2+, and VDSL.
the fastest speed, typically lower latency, highest security, and is relatively immune to disruption from nearby electromagnetic sources. Large corporations commonly have several buildings, or buildings at separate locations, which creates a requirement for both intranet (internal network) and internet (external or public network) connectivity. Fiber optic lines are converted to network cabling (ethernet) and (or) wireless (Wi-Fi) for data connection to user equipment. Most major businesses use VoIP phones, and connect their internal phones to the public network via digital private branch exchanges (PBXs) although there are also VoIP telephone systems. Fiber optic lines connect in-building equipment with a broadband provider (such as AT&T). Ultimately, voice calls route through the broadband network.
Enterprises that Require Reliable ConnectivityEnterprises that require constant connectivity commonly
employ redundant connections to reduce the probability of failure. They may have fiber optic lines and copper pair or coaxial lines as a backup. Data centers reduce their vulnerability to severed fiber optic line by having redundant fiber optic line connections (B. Weihl, Facebook, oral commun., 2015). However, since the failure modes for lines are similar, businesses sometimes opt for wireless data as a contingency. With the increased availability of unlimited data plans on cellular networks, smartphones and hotspots (either via a smartphone or using a dedicated device) also became options for contingency connectivity. Wireless is not ideal for everyday business because of limited throughput and relatively expensive data plans and usage rates.
Physical Failure Modes
Failure modes for telecommunications systems are illustrated in figures 1–5 and are summarized below for telecommunications provider and subscriber equipment and channels.
Provider Equipment Failure ModesOutside of central offices and data centers, network
equipment and interconnection points are housed within roadside cabinets, pole-mounted cabinets, or in underground vaults. The purpose of these enclosures is to secure the equipment and interconnections against damage from weather, dust, sunlight, and vandalism. Some network equipment uses active cooling, and as a result enclosures are sometimes fitted with ventilation fans. Each enclosure method and ventilation system has benefits and drawbacks within the context of a disaster scenario. Equipment failure modes can include:
• Equipment damaged by collapse of supporting orcontaining structures or partial collapse of roofs, damageto exterior walls, or loosening of parapets or facades.
• Fire damage to supporting structures or equipment.
• Failure of mounts and brackets that attach equipment totowers, arms, or building structures.
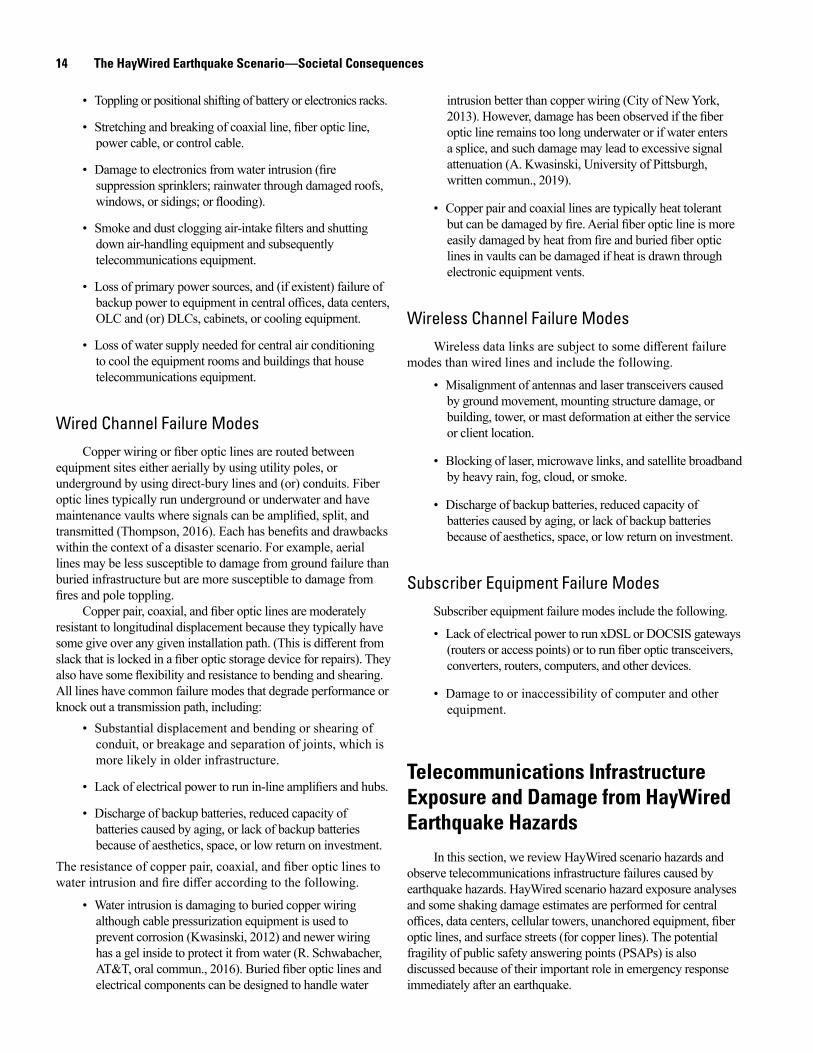
14 The HayWired Earthquake Scenario—Societal Consequences
• Toppling or positional shifting of battery or electronics racks.
• Stretching and breaking of coaxial line, fiber optic line, power cable, or control cable.
• Damage to electronics from water intrusion (fire suppression sprinklers; rainwater through damaged roofs,windows, or sidings; or flooding).
• Smoke and dust clogging air-intake filters and shutting down air-handling equipment and subsequentlytelecommunications equipment.
• Loss of primary power sources, and (if existent) failure ofbackup power to equipment in central offices, data centers, OLC and (or) DLCs, cabinets, or cooling equipment.
• Loss of water supply needed for central air conditioningto cool the equipment rooms and buildings that housetelecommunications equipment.
Wired Channel Failure ModesCopper wiring or fiber optic lines are routed between
equipment sites either aerially by using utility poles, or underground by using direct-bury lines and (or) conduits. Fiber optic lines typically run underground or underwater and have maintenance vaults where signals can be amplified, split, and transmitted (Thompson, 2016). Each has benefits and drawbacks within the context of a disaster scenario. For example, aerial lines may be less susceptible to damage from ground failure than buried infrastructure but are more susceptible to damage from fires and pole toppling.
Copper pair, coaxial, and fiber optic lines are moderately resistant to longitudinal displacement because they typically have some give over any given installation path. (This is different from slack that is locked in a fiber optic storage device for repairs). They also have some flexibility and resistance to bending and shearing. All lines have common failure modes that degrade performance or knock out a transmission path, including:
• Substantial displacement and bending or shearing ofconduit, or breakage and separation of joints, which ismore likely in older infrastructure.
• Lack of electrical power to run in-line amplifiers and hubs.
• Discharge of backup batteries, reduced capacity ofbatteries caused by aging, or lack of backup batteriesbecause of aesthetics, space, or low return on investment.
The resistance of copper pair, coaxial, and fiber optic lines to water intrusion and fire differ according to the following.
• Water intrusion is damaging to buried copper wiringalthough cable pressurization equipment is used toprevent corrosion (Kwasinski, 2012) and newer wiringhas a gel inside to protect it from water (R. Schwabacher,AT&T, oral commun., 2016). Buried fiber optic lines and electrical components can be designed to handle water
intrusion better than copper wiring (City of New York, 2013). However, damage has been observed if the fiber optic line remains too long underwater or if water enters a splice, and such damage may lead to excessive signal attenuation (A. Kwasinski, University of Pittsburgh, written commun., 2019).
• Copper pair and coaxial lines are typically heat tolerantbut can be damaged by fire. Aerial fiber optic line is more easily damaged by heat from fire and buried fiber optic lines in vaults can be damaged if heat is drawn throughelectronic equipment vents.
Wireless Channel Failure ModesWireless data links are subject to some different failure
modes than wired lines and include the following.
• Misalignment of antennas and laser transceivers causedby ground movement, mounting structure damage, orbuilding, tower, or mast deformation at either the serviceor client location.
• Blocking of laser, microwave links, and satellite broadbandby heavy rain, fog, cloud, or smoke.
• Discharge of backup batteries, reduced capacity ofbatteries caused by aging, or lack of backup batteriesbecause of aesthetics, space, or low return on investment.
Subscriber Equipment Failure ModesSubscriber equipment failure modes include the following.
• Lack of electrical power to run xDSL or DOCSIS gateways(routers or access points) or to run fiber optic transceivers, converters, routers, computers, and other devices.
• Damage to or inaccessibility of computer and otherequipment.
Telecommunications Infrastructure Exposure and Damage from HayWired Earthquake Hazards
In this section, we review HayWired scenario hazards and observe telecommunications infrastructure failures caused by earthquake hazards. HayWired scenario hazard exposure analyses and some shaking damage estimates are performed for central offices, data centers, cellular towers, unanchored equipment, fiber optic lines, and surface streets (for copper lines). The potential fragility of public safety answering points (PSAPs) is also discussed because of their important role in emergency response immediately after an earthquake.
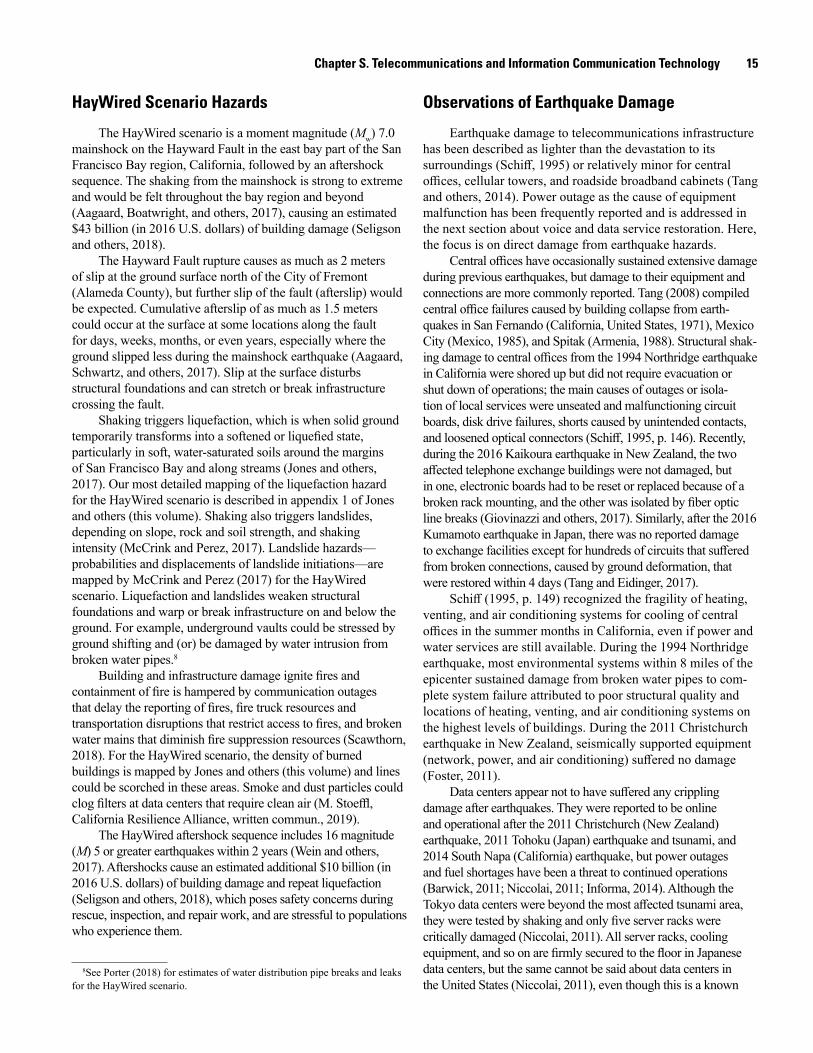
Chapter S. Telecommunications and Information Communication Technology 15
HayWired Scenario Hazards
The HayWired scenario is a moment magnitude (Mw) 7.0 mainshock on the Hayward Fault in the east bay part of the San Francisco Bay region, California, followed by an aftershock sequence. The shaking from the mainshock is strong to extreme and would be felt throughout the bay region and beyond (Aagaard, Boatwright, and others, 2017), causing an estimated $43 billion (in 2016 U.S. dollars) of building damage (Seligson and others, 2018).
The Hayward Fault rupture causes as much as 2 meters of slip at the ground surface north of the City of Fremont (Alameda County), but further slip of the fault (afterslip) would be expected. Cumulative afterslip of as much as 1.5 meters could occur at the surface at some locations along the fault for days, weeks, months, or even years, especially where the ground slipped less during the mainshock earthquake (Aagaard, Schwartz, and others, 2017). Slip at the surface disturbs structural foundations and can stretch or break infrastructure crossing the fault.
Shaking triggers liquefaction, which is when solid ground temporarily transforms into a softened or liquefied state, particularly in soft, water-saturated soils around the margins of San Francisco Bay and along streams (Jones and others, 2017). Our most detailed mapping of the liquefaction hazard for the HayWired scenario is described in appendix 1 of Jones and others (this volume). Shaking also triggers landslides, depending on slope, rock and soil strength, and shaking intensity (McCrink and Perez, 2017). Landslide hazards—probabilities and displacements of landslide initiations—are mapped by McCrink and Perez (2017) for the HayWired scenario. Liquefaction and landslides weaken structural foundations and warp or break infrastructure on and below the ground. For example, underground vaults could be stressed by ground shifting and (or) be damaged by water intrusion from broken water pipes.8
Building and infrastructure damage ignite fires and containment of fire is hampered by communication outages that delay the reporting of fires, fire truck resources and transportation disruptions that restrict access to fires, and broken water mains that diminish fire suppression resources (Scawthorn, 2018). For the HayWired scenario, the density of burned buildings is mapped by Jones and others (this volume) and lines could be scorched in these areas. Smoke and dust particles could clog filters at data centers that require clean air (M. Stoeffl, California Resilience Alliance, written commun., 2019).
The HayWired aftershock sequence includes 16 magnitude (M) 5 or greater earthquakes within 2 years (Wein and others, 2017). Aftershocks cause an estimated additional $10 billion (in 2016 U.S. dollars) of building damage and repeat liquefaction (Seligson and others, 2018), which poses safety concerns during rescue, inspection, and repair work, and are stressful to populations who experience them.
8See Porter (2018) for estimates of water distribution pipe breaks and leaks for the HayWired scenario.
Observations of Earthquake Damage
Earthquake damage to telecommunications infrastructure has been described as lighter than the devastation to its surroundings (Schiff, 1995) or relatively minor for central offices, cellular towers, and roadside broadband cabinets (Tang and others, 2014). Power outage as the cause of equipment malfunction has been frequently reported and is addressed in the next section about voice and data service restoration. Here, the focus is on direct damage from earthquake hazards.
Central offices have occasionally sustained extensive damage during previous earthquakes, but damage to their equipment and connections are more commonly reported. Tang (2008) compiled central office failures caused by building collapse from earth-quakes in San Fernando (California, United States, 1971), Mexico City (Mexico, 1985), and Spitak (Armenia, 1988). Structural shak-ing damage to central offices from the 1994 Northridge earthquake in California were shored up but did not require evacuation or shut down of operations; the main causes of outages or isola-tion of local services were unseated and malfunctioning circuit boards, disk drive failures, shorts caused by unintended contacts, and loosened optical connectors (Schiff, 1995, p. 146). Recently, during the 2016 Kaikoura earthquake in New Zealand, the two affected telephone exchange buildings were not damaged, but in one, electronic boards had to be reset or replaced because of a broken rack mounting, and the other was isolated by fiber optic line breaks (Giovinazzi and others, 2017). Similarly, after the 2016 Kumamoto earthquake in Japan, there was no reported damage to exchange facilities except for hundreds of circuits that suffered from broken connections, caused by ground deformation, that were restored within 4 days (Tang and Eidinger, 2017).
Schiff (1995, p. 149) recognized the fragility of heating, venting, and air conditioning systems for cooling of central offices in the summer months in California, even if power and water services are still available. During the 1994 Northridge earthquake, most environmental systems within 8 miles of the epicenter sustained damage from broken water pipes to com-plete system failure attributed to poor structural quality and locations of heating, venting, and air conditioning systems on the highest levels of buildings. During the 2011 Christchurch earthquake in New Zealand, seismically supported equipment (network, power, and air conditioning) suffered no damage (Foster, 2011).
Data centers appear not to have suffered any crippling damage after earthquakes. They were reported to be online and operational after the 2011 Christchurch (New Zealand) earthquake, 2011 Tohoku (Japan) earthquake and tsunami, and 2014 South Napa (California) earthquake, but power outages and fuel shortages have been a threat to continued operations (Barwick, 2011; Niccolai, 2011; Informa, 2014). Although the Tokyo data centers were beyond the most affected tsunami area, they were tested by shaking and only five server racks were critically damaged (Niccolai, 2011). All server racks, cooling equipment, and so on are firmly secured to the floor in Japanese data centers, but the same cannot be said about data centers in the United States (Niccolai, 2011), even though this is a known

16 The HayWired Earthquake Scenario—Societal Consequences
best practice when designing them. In Christchurch, data centers required clean up; occupancy could have been affected by lack of street power, water, and wastewater services, and one center had to restrict entry by personnel for safety reasons in the heavily affected central business district (Barwick, 2011).
After the 1994 Northridge earthquake, damage to cellular towers was described as minimal and microwave dish misalignment and severed landline interconnections were attended to within 3 days (Schiff, 1995, p. 152). The first instance of a self-supporting cellular tower folding in half of its height was observed after the 2016 Kumamoto earthquake in Japan (Tang and Eidinger, 2017). A few instances of damage to cellular towers from ground movement include a cellular tower destroyed by a rock fall and a monopole supporting wireless antennas tilted by liquefaction during the 2011 Christchurch earthquake in New Zealand (Eidinger and Tang, 2012). The 2015 Gorkha earthquake in Nepal misaligned 15 microwave links and landslides damaged fiber optic backhaul (Khanal, 2015). Therefore, dysfunction for some cellular sites have resulted from severed interconnecting lines (both metallic and fiber optic) caused by ground deformation (Tang and Eidinger, 2017). Sites on utility poles have been damaged by shaking and liquefaction (for example, fig. 6).
In Christchurch, roof-mounted cellular sites were more commonly affected: a cell tower on the roof of a collapsed building was destroyed, two rooftop cell sites were badly damaged, and another 26 rooftop cell sites (of two different providers) were out of service (Tang and others, 2014). Similarly, roof-mounted cellular site failures occurred when a building collapsed during both the 1995 Kobe (Japan) and 1999 Chi Chi (Taiwan) earthquakes (Tang, 2008), and more recently during the 2017 Puebla (Mexico) earthquake at a site operated
by three carriers (A. Tang, L&T Consultant, written commun., 2017). Furthermore, sites on heavily damaged buildings are not immediately accessible after an earthquake (for example, fig. 7).
Damage to aerial and buried lines have resulted from transient shaking and permanent ground failure (from fault rupture, landslides, or liquefaction) and damaged bridge crossings (for example, Tang and others, 2014; Giovinazzi and others, 2017; Tang and Eidinger, 2017; Eidinger and Tang, 2019). During the 2016 Kaikoura earthquake in New Zealand, most of the damage to the telecommunications networks was to buried lines (mostly copper) that were stretched and broken as a result of ground motions, permanent ground displacement, fault rupture, and damaged bridge crossings (Giovinazzi and others, 2017). A major fiber optic line was severely damaged by six breaks that cut off communication outside of a rural township such that only local telephone communications over copper wires remained possible (Worthington, 2016). Similarly, in the 2016 Kumamoto earthquake, permanent ground displacement from landslides and damage to bridge crossings damaged landlines (including fiber optic line) (Tang and Eidinger, 2017). In Christchurch, liquefaction and associated flooding and shifting manholes stretched or damaged many buried public switched telephone network (PSTN) copper lines (Tang and others, 2014). Aerial lines were also stretched by poles that moved and tilted from shaking and (or) ground movement near streams (Giovinazzi and others, 2017). Wires that connect houses to poles have been damaged by pole failures (such as a toppled pole applying excess tension to the aerial lines and causing adjoining poles to lean at a high angle) and house collapses (Tang and Eidinger, 2017).
Fire following earthquake has damaged telecommunications infrastructure. For example, the Balboa Boulevard gas explosion and fire in the 1994 Northridge earthquake burned both power and
men21-7516_fig06
Figure 6. Photograph showing utility pole damage to a cellular site after the 2011 Christchurch, New Zealand, earthquake. The pole split along a fold seam midway up the pole; the head load is thought to be the issue (Wes Bonney, written commun., March 26, 2021). Photograph from Wes Bonney, Vodafone, New Zealand, February 22, 2011, used with permission.
men21-7516_fig07
Figure 7. Photograph showing cellular sites on a heavily damaged hotel after the 2009 L’Aquila, Italy, earthquake. Photograph by A. Tang, L&T Consultant, June 20, 2009, used with permission.
Chapter S. Telecommunications and Information Communication Technology 17
telecommunications lines (Schiff, 1995, p. 150). Fire from other disasters (for example, hurricanes and wildfires) have resulted in burning of aerial lines (Kwasinski, 2012; Tiffen, 2017). Recently, during the October 2017 wildfires in northern California, many aerial lines on poles were damaged by poles falling down, and even buried fiber optic lines were scorched through vault vents that provide ground-level access (Tiffen, 2017). In all, 77 cellular sites were damaged or disconnected by the fires, including a key cellular hub (Baron, 2017).
Methods
A description of analytical methods covers telecommunica-tions infrastructure data sources; shaking damage estimation for buildings, towers, and equipment; and infrastructure exposure analyses for ground failure and fire hazards.
Telecommunications Infrastructure DataWe purchased a set of spatial data for cellular sites, fiber optic
lines, wireless switching centers, and fiber-lit buildings (including central offices and data centers) from GeoTel Communications, LLC (GeoTel) (GeoTel Communications, 2018). On request, fiber optic lines were categorized as long-haul lines that transport strong signals traveling great distances and interoffice lines that are typically metropolitan connections among and from central offices and, nowadays, includes backhaul from cellular towers that are spliced to serve those in the area, such as business parks (E. Cabading, GeoTel Communications, oral commun., 2019). These data support a regional analysis to illustrate potential patterns of telecommunications infrastructure exposure or fragility to earthquake hazards.
Checking the data against imagery revealed that the GeoTel data contained some:
• Additional data (for example, radio broadcast arrays in cell tower data);
• Duplicate entries (for example, multiple listings of a shared cellular site by each carrier at the same location);
• Inconsistent categorization of assets (for example, antennas on buildings may be classified as building or occupancy type [for example, education or commercial]); and
• Missing data (for example, some internet exchange points were not represented in the data).
Some effort was expended to correct for these issues by using imagery to reclassify data, remove duplicates, verify antennas on a sample of buildings, and consult other datasets. Internet exchange points (IXPs) were cross-checked against two sources (a map of data centers from Data Center Map, available at https://www.datacentermap.com/ixps.html, and a map of IXPs from the Network Startup Resource Center, available at https://nsrc.org/ixp/NorthAmerica.html) and a few more IXPs were inserted to the GeoTel data center entries.
Copper wires for plain old telephone service (POTS) were first installed more than 100 years ago. As the population of the San Francisco Bay region grew, especially in the post-WWII era, hundreds if not thousands of miles of copper wiring were installed. This work is old enough that some records are now lost. Therefore, we assume that copper wires are mostly strung along pole lines or buried in public rights of way following surface roads along with various utilities.
Although some data for small cell sites in densely developed areas is becoming available, we did not attempt to build a comprehensive dataset for this analysis. No data was obtained for digital or optical loop carriers (DLCs and OLCs). No data was obtained to assess point-to-point high-frequency microwave connections. These types of point-to-point connections are used in the San Francisco Bay region across hills and canyons, and to connect to satellites.
PSAP locations were obtained from the Federal Com-munications Commission’s 9–1–1 Master PSAP Registry (available at https://www.fcc.gov/general/9-1-1-master-psap-registry). Orphaned PSAPs were removed from the dataset. The PSAP locations were cross-referenced to public safety facilities (for example, police or fire) where they coincided in the Federal Emergency Management Agency’s (FEMA) Hazus-MH 2.1 (hereafter referred to as Hazus) inventory data (D. Bausch, Federal Emergency Management Agency, written commun., 2014).
Physical Damage EstimationIn a state-of-the-practice damage analysis of a structure, a
building’s type and other engineering characteristic data would be taken from construction documents or examination of the building. Similarly, estimating physical damage to equipment requires knowledge of installation design and practices for that kind of equipment. For the present study, such data is not publicly available. Existing codes, standards, and guidelines covering a selection of telecommunications equipment and structures are summarized by the Applied Technology Council (2016). These and others are listed in sidebar 2.
However, the Applied Technology Council (2016) states that “design standards are voluntary (not mandated by law) but may be incorporated by reference into building codes, siting permits for towers, commercial contracts, or even financial auditing obligations, for example, for data center reliability.” It refers to the Communications Security, Reliability, and Interoperability Council’s (2014, p. 6) explanations for the voluntary nature of design standards that include “flexibility, innovation, and control in the management of different carriers’ unique business models, cost, feasibility, and resource limitations.” The Applied Technology Council (2016) concludes that “there does not appear to be any data on whether resiliency-related standards and best practices are widely followed by the communication industry. In particular, it is unclear to what extent outside plant, including fiber communication facilities, and central offices follow resiliency-related standards.”

18 The HayWired Earthquake Scenario—Societal Consequences
Sidebar 2—Telecommunications Infrastructure Design Guidelines and Regulations
Codes, standards, and guidelines for telecommunications infrastructure identified by the Applied Technology Council (2016) and from our own investigations include the following.
• Data center functionality and resiliency standards (by tier) have been established (Telecommunications Industry Association, 2014; Applied Technology Council, 2016).
• The industry standard for central offices—the Network Equipment Building System for levels of performance—may be supplemented by carrier-specific earthquake- and fire-resistant test methods and performance requirements (for example, GR-63 [Telcordia, 2012], GR-1089 [Telcordia, 2011], ATIS 0600329 [Alliance for Telecommunications Industry Solutions, 2014]) (see Applied Technology Council, 2016).
• The industry reference for fiber optic line is NECA/FOA 301 (Fiber Optic Administration, 2016) and it does not address building for seismic events or guidelines for laying fiber optic line across fault lines or through liquefaction- and landslide-susceptible areas.
• Design and maintenance standards for tower structures, mounts, and antennas were Telecommunications Industry Association’s (TIA) TR-14 (TIA-222-G) (see Erichsen, n.d.) reinforced by construction and maintenance standards (American Society of Safety Engineers A10.48 and TIA-322). The standards divide tower structures into three classes, depending on whether they may present a hazard to human life and whether the services provided are optional or essential. Implementation of a 1.5 importance factor is set for structures that meet certain criteria.
• The standard was revised to TIA-222-H during the course of this study. TIA-222-H incorporates long-period transitions as part of the earthquake design loads for telecommunications towers. This design criterion was taken specifically from the equivalent lateral force method from American Society of Civil Engineers (ASCE) 7 and is meant to account for structures with varying fundamental frequencies or periods (B. Lanier, American Tower Corporation, written commun., 2017). ASCE 7-18 and TIA-222-H design criteria accounts for amplification of shaking for cellular sites on buildings.
• TIA-TSB-5053 addresses antenna mount design loads applicable for extreme wind, extreme ice, and maintenance conditions to advise diverse suppliers with variable installation techniques. By default, the advisory encompasses shaking loads.
• Guidelines for cellular site foundations consider factors of liquefaction including soil parameters, some seismic parameters, and depth of the water table, as cited in the TIA-222-G standard; TIA-222-H cites minimum information that should be provided in a geotechnical report (B. Lanier, Telecommunications Industry Association, written commun., 2019).
• Guidelines for siting towers in landslide-prone or fire-threatened areas were not found.
• Guidelines are lacking for equipment racks that confine and organize equipment at telecommunications sites. Housings for electronic components at cellular sites are commonly pre-built, and are not standardized. Methods of procedures (MOPs) are typically based on the Telcordia GR-63-CORE and International Building Code (IBC) standards (Young, n.d.), and various carriers confirmed that stacked dry cell batteries should be bolted together and anchored in heavy steel containers designed for California building codes and lead-acid battery racks in plastic containers should be bolted to the floor.
• Utilities can place poles (that may support telecommunications equipment) in many different types of soil conditions, including sand, rock, clay, and dirt with various properties, and most of the poles set in the right-of-way are set in concrete or asphalt. The rule that exists for all placements is a prescribed setting depth that ranges from 5 to 10 feet in the ground, depending on the height of the pole. The recent California General Order 95 (Public Utilities Commission, 2018) could help with pole maintenance going forward because it requires all utilities to inspect wooden utility poles on a regular basis. The purpose of these inspections is to ensure that any safety concerns are addressed and corrected. One item on the check list is pole lean, which could indicate that the soil conditions have changed and any time this condition is identified, the requirement is to report it and correct it (W. Mueller, Extenet Systems, written commun., 2017). Other pole inspection items include sound timber, minimum circumference, and unacceptable damage. Pole maintenance could also reduce the likelihood of electric wires acting as a source of fire ignitions.
• Codes and standards for fire protection exist for telecommunications facilities that provide telephone, data, wireless, internet, and video services to the public (National Fire Protection Association [NFPA] 76) and for fire suppression and detection and building construction for information technology equipment (NFPA 75). The Applied Technology Council (2016, p. 5–19) notes that “[f]or fire alarms, NFPA 72 (NFPA, 2016) mandates in Section 10.6.7.2, that alarm systems, including communication components, can maintain operation on secondary power for 24 hours.”
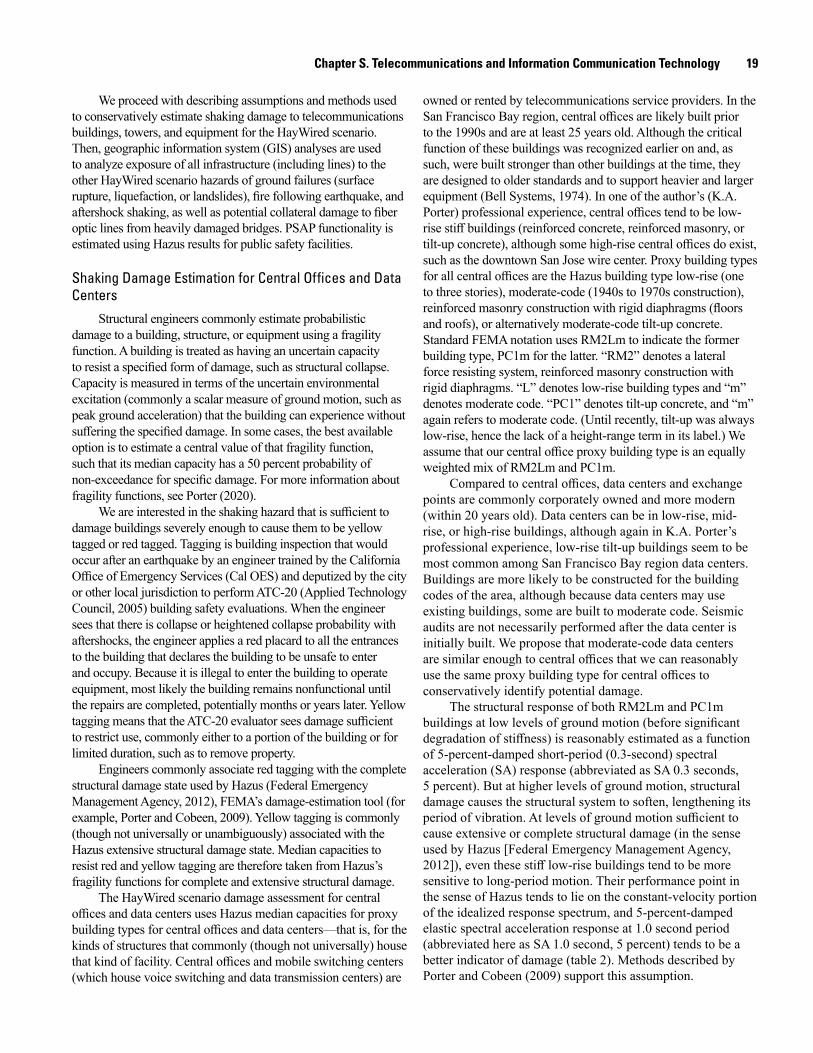
Chapter S. Telecommunications and Information Communication Technology 19
We proceed with describing assumptions and methods used to conservatively estimate shaking damage to telecommunications buildings, towers, and equipment for the HayWired scenario. Then, geographic information system (GIS) analyses are used to analyze exposure of all infrastructure (including lines) to the other HayWired scenario hazards of ground failures (surface rupture, liquefaction, or landslides), fire following earthquake, and aftershock shaking, as well as potential collateral damage to fiber optic lines from heavily damaged bridges. PSAP functionality is estimated using Hazus results for public safety facilities.
Shaking Damage Estimation for Central Of fices and Data Centers
Structural engineers commonly estimate probabilistic damage to a building, structure, or equipment using a fragility function. A building is treated as having an uncertain capacity to resist a specified form of damage, such as structural collapse. Capacity is measured in terms of the uncertain environmental excitation (commonly a scalar measure of ground motion, such as peak ground acceleration) that the building can experience without suffering the specified damage. In some cases, the best available option is to estimate a central value of that fragility function, such that its median capacity has a 50 percent probability of non-exceedance for specific damage. For more information about fragility functions, see Porter (2020).
We are interested in the shaking hazard that is sufficient to damage buildings severely enough to cause them to be yellow tagged or red tagged. Tagging is building inspection that would occur after an earthquake by an engineer trained by the California Office of Emergency Services (Cal OES) and deputized by the city or other local jurisdiction to perform ATC-20 (Applied Technology Council, 2005) building safety evaluations. When the engineer sees that there is collapse or heightened collapse probability with aftershocks, the engineer applies a red placard to all the entrances to the building that declares the building to be unsafe to enter and occupy. Because it is illegal to enter the building to operate equipment, most likely the building remains nonfunctional until the repairs are completed, potentially months or years later. Yellow tagging means that the ATC-20 evaluator sees damage sufficient to restrict use, commonly either to a portion of the building or for limited duration, such as to remove property.
Engineers commonly associate red tagging with the complete structural damage state used by Hazus (Federal Emergency Management Agency, 2012), FEMA’s damage-estimation tool (for example, Porter and Cobeen, 2009). Yellow tagging is commonly (though not universally or unambiguously) associated with the Hazus extensive structural damage state. Median capacities to resist red and yellow tagging are therefore taken from Hazus’s fragility functions for complete and extensive structural damage.
The HayWired scenario damage assessment for central offices and data centers uses Hazus median capacities for proxy building types for central offices and data centers—that is, for the kinds of structures that commonly (though not universally) house that kind of facility. Central offices and mobile switching centers (which house voice switching and data transmission centers) are
owned or rented by telecommunications service providers. In the San Francisco Bay region, central offices are likely built prior to the 1990s and are at least 25 years old. Although the critical function of these buildings was recognized earlier on and, as such, were built stronger than other buildings at the time, they are designed to older standards and to support heavier and larger equipment (Bell Systems, 1974). In one of the author’s (K.A. Porter) professional experience, central offices tend to be low-rise stiff buildings (reinforced concrete, reinforced masonry, or tilt-up concrete), although some high-rise central offices do exist, such as the downtown San Jose wire center. Proxy building types for all central offices are the Hazus building type low-rise (one to three stories), moderate-code (1940s to 1970s construction), reinforced masonry construction with rigid diaphragms (floors and roofs), or alternatively moderate-code tilt-up concrete. Standard FEMA notation uses RM2Lm to indicate the former building type, PC1m for the latter. “RM2” denotes a lateral force resisting system, reinforced masonry construction with rigid diaphragms. “L” denotes low-rise building types and “m” denotes moderate code. “PC1” denotes tilt-up concrete, and “m” again refers to moderate code. (Until recently, tilt-up was always low-rise, hence the lack of a height-range term in its label.) We assume that our central office proxy building type is an equally weighted mix of RM2Lm and PC1m.
Compared to central offices, data centers and exchange points are commonly corporately owned and more modern (within 20 years old). Data centers can be in low-rise, mid-rise, or high-rise buildings, although again in K.A. Porter’s professional experience, low-rise tilt-up buildings seem to be most common among San Francisco Bay region data centers. Buildings are more likely to be constructed for the building codes of the area, although because data centers may use existing buildings, some are built to moderate code. Seismic audits are not necessarily performed after the data center is initially built. We propose that moderate-code data centers are similar enough to central offices that we can reasonably use the same proxy building type for central offices to conservatively identify potential damage.
The structural response of both RM2Lm and PC1m buildings at low levels of ground motion (before significant degradation of stiffness) is reasonably estimated as a function of 5-percent-damped short-period (0.3-second) spectral acceleration (SA) response (abbreviated as SA 0.3 seconds, 5 percent). But at higher levels of ground motion, structural damage causes the structural system to soften, lengthening its period of vibration. At levels of ground motion sufficient to cause extensive or complete structural damage (in the sense used by Hazus [Federal Emergency Management Agency, 2012]), even these stiff low-rise buildings tend to be more sensitive to long-period motion. Their performance point in the sense of Hazus tends to lie on the constant-velocity portion of the idealized response spectrum, and 5-percent-damped elastic spectral acceleration response at 1.0 second period (abbreviated here as SA 1.0 second, 5 percent) tends to be a better indicator of damage (table 2). Methods described by Porter and Cobeen (2009) support this assumption.
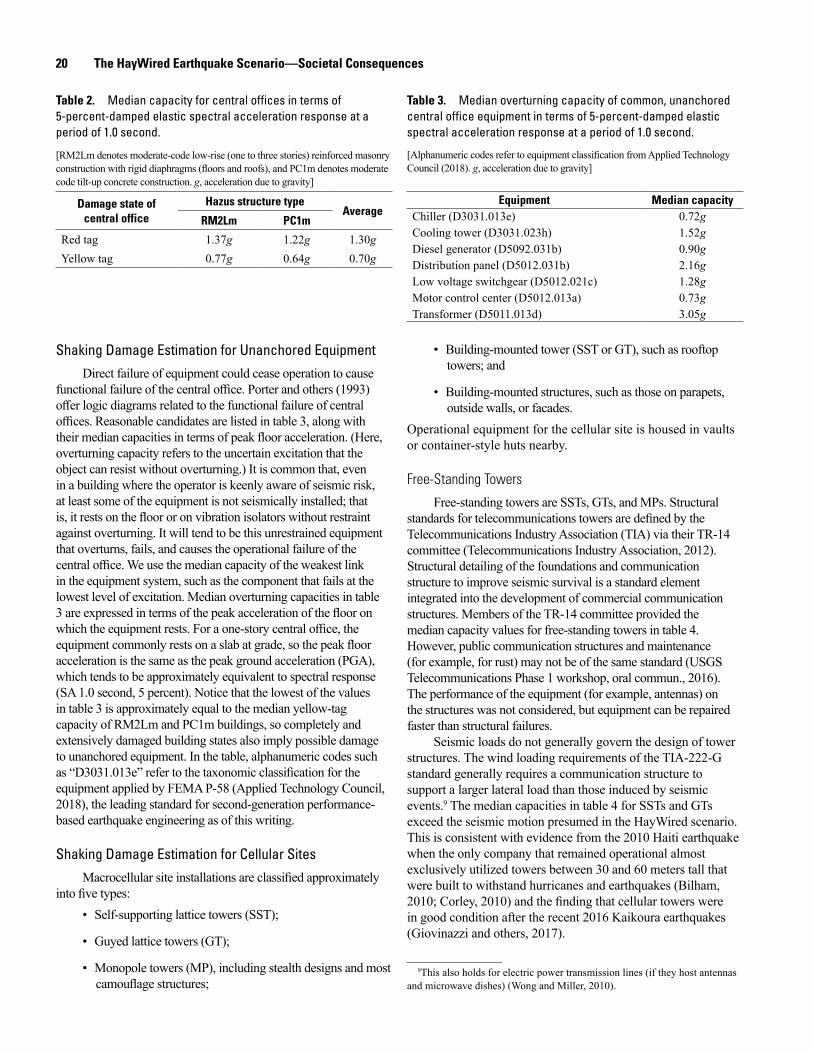
20 The HayWired Earthquake Scenario—Societal Consequences
Table 2. Median capacity for central offices in terms of 5-percent-damped elastic spectral acceleration response at a period of 1.0 second.
[RM2Lm denotes moderate-code low-rise (one to three stories) reinforced masonry construction with rigid diaphragms (floors and roofs), and PC1m denotes moderate code tilt-up concrete construction. g, acceleration due to gravity]
Damage state of central office
Hazus structure typeAverage
RM2Lm PC1m
Red tag 1.37g 1.22g 1.30gYellow tag 0.77g 0.64g 0.70g
Shaking Damage Estimation for Unanchored EquipmentDirect failure of equipment could cease operation to cause
functional failure of the central office. Porter and others (1993) offer logic diagrams related to the functional failure of central offices. Reasonable candidates are listed in table 3, along with their median capacities in terms of peak floor acceleration. (Here, overturning capacity refers to the uncertain excitation that the object can resist without overturning.) It is common that, even in a building where the operator is keenly aware of seismic risk, at least some of the equipment is not seismically installed; that is, it rests on the floor or on vibration isolators without restraint against overturning. It will tend to be this unrestrained equipment that overturns, fails, and causes the operational failure of the central office. We use the median capacity of the weakest link in the equipment system, such as the component that fails at the lowest level of excitation. Median overturning capacities in table 3 are expressed in terms of the peak acceleration of the floor on which the equipment rests. For a one-story central office, the equipment commonly rests on a slab at grade, so the peak floor acceleration is the same as the peak ground acceleration (PGA), which tends to be approximately equivalent to spectral response (SA 1.0 second, 5 percent). Notice that the lowest of the values in table 3 is approximately equal to the median yellow-tag capacity of RM2Lm and PC1m buildings, so completely and extensively damaged building states also imply possible damage to unanchored equipment. In the table, alphanumeric codes such as “D3031.013e” refer to the taxonomic classification for the equipment applied by FEMA P-58 (Applied Technology Council, 2018), the leading standard for second-generation performance-based earthquake engineering as of this writing.
Shaking Damage Estimation for Cellular Sites Macrocellular site installations are classified approximately
into five types:• Self-supporting lattice towers (SST);
• Guyed lattice towers (GT);
• Monopole towers (MP), including stealth designs and most camouflage structures;
Table 3. Median overturning capacity of common, unanchored central office equipment in terms of 5-percent-damped elastic spectral acceleration response at a period of 1.0 second.
[Alphanumeric codes refer to equipment classification from Applied Technology Council (2018). g, acceleration due to gravity]
Equipment Median capacityChiller (D3031.013e) 0.72gCooling tower (D3031.023h) 1.52gDiesel generator (D5092.031b) 0.90gDistribution panel (D5012.031b) 2.16gLow voltage switchgear (D5012.021c) 1.28gMotor control center (D5012.013a) 0.73gTransformer (D5011.013d) 3.05g
• Building-mounted tower (SST or GT), such as rooftop towers; and
• Building-mounted structures, such as those on parapets, outside walls, or facades.
Operational equipment for the cellular site is housed in vaults or container-style huts nearby.
Free-Standing Towers
Free-standing towers are SSTs, GTs, and MPs. Structural standards for telecommunications towers are defined by the Telecommunications Industry Association (TIA) via their TR-14 committee (Telecommunications Industry Association, 2012). Structural detailing of the foundations and communication structure to improve seismic survival is a standard element integrated into the development of commercial communication structures. Members of the TR-14 committee provided the median capacity values for free-standing towers in table 4. However, public communication structures and maintenance (for example, for rust) may not be of the same standard (USGS Telecommunications Phase 1 workshop, oral commun., 2016). The performance of the equipment (for example, antennas) on the structures was not considered, but equipment can be repaired faster than structural failures.
Seismic loads do not generally govern the design of tower structures. The wind loading requirements of the TIA‐222‐G standard generally requires a communication structure to support a larger lateral load than those induced by seismic events.9 The median capacities in table 4 for SSTs and GTs exceed the seismic motion presumed in the HayWired scenario. This is consistent with evidence from the 2010 Haiti earthquake when the only company that remained operational almost exclusively utilized towers between 30 and 60 meters tall that were built to withstand hurricanes and earthquakes (Bilham, 2010; Corley, 2010) and the finding that cellular towers were in good condition after the recent 2016 Kaikoura earthquakes (Giovinazzi and others, 2017).
9This also holds for electric power transmission lines (if they host antennas and microwave dishes) (Wong and Miller, 2010).
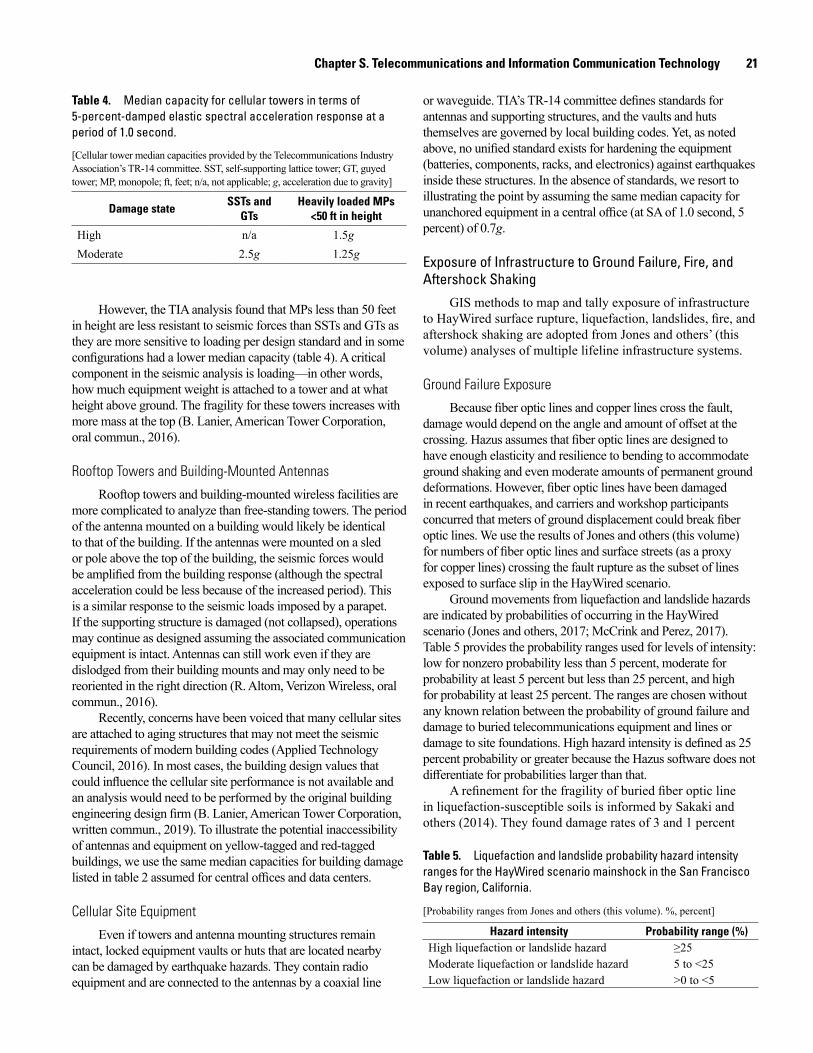
Chapter S. Telecommunications and Information Communication Technology 21
Table 4. Median capacity for cellular towers in terms of 5-percent-damped elastic spectral acceleration response at a period of 1.0 second.
[Cellular tower median capacities provided by the Telecommunications Industry Association’s TR-14 committee. SST, self-supporting lattice tower; GT, guyed tower; MP, monopole; ft, feet; n/a, not applicable; g, acceleration due to gravity]
Damage stateSSTs and
GTsHeavily loaded MPs
<50 ft in height
High n/a 1.5gModerate 2.5g 1.25g
However, the TIA analysis found that MPs less than 50 feet in height are less resistant to seismic forces than SSTs and GTs as they are more sensitive to loading per design standard and in some configurations had a lower median capacity (table 4). A critical component in the seismic analysis is loading—in other words, how much equipment weight is attached to a tower and at what height above ground. The fragility for these towers increases with more mass at the top (B. Lanier, American Tower Corporation, oral commun., 2016).
Rooftop Towers and Building-Mounted Antennas
Rooftop towers and building-mounted wireless facilities are more complicated to analyze than free-standing towers. The period of the antenna mounted on a building would likely be identical to that of the building. If the antennas were mounted on a sled or pole above the top of the building, the seismic forces would be amplified from the building response (although the spectral acceleration could be less because of the increased period). This is a similar response to the seismic loads imposed by a parapet. If the supporting structure is damaged (not collapsed), operations may continue as designed assuming the associated communication equipment is intact. Antennas can still work even if they are dislodged from their building mounts and may only need to be reoriented in the right direction (R. Altom, Verizon Wireless, oral commun., 2016).
Recently, concerns have been voiced that many cellular sites are attached to aging structures that may not meet the seismic requirements of modern building codes (Applied Technology Council, 2016). In most cases, the building design values that could influence the cellular site performance is not available and an analysis would need to be performed by the original building engineering design firm (B. Lanier, American Tower Corporation, written commun., 2019). To illustrate the potential inaccessibility of antennas and equipment on yellow-tagged and red-tagged buildings, we use the same median capacities for building damage listed in table 2 assumed for central offices and data centers.
Cellular Site Equipment
Even if towers and antenna mounting structures remain intact, locked equipment vaults or huts that are located nearby can be damaged by earthquake hazards. They contain radio equipment and are connected to the antennas by a coaxial line
or waveguide. TIA’s TR-14 committee defines standards for antennas and supporting structures, and the vaults and huts themselves are governed by local building codes. Yet, as noted above, no unified standard exists for hardening the equipment (batteries, components, racks, and electronics) against earthquakes inside these structures. In the absence of standards, we resort to illustrating the point by assuming the same median capacity for unanchored equipment in a central office (at SA of 1.0 second, 5 percent) of 0.7g.
Exposure of Infrastructure to Ground Failure, Fire, and Aftershock Shaking
GIS methods to map and tally exposure of infrastructure to HayWired surface rupture, liquefaction, landslides, fire, and aftershock shaking are adopted from Jones and others’ (this volume) analyses of multiple lifeline infrastructure systems.
Ground Failure Exposure
Because fiber optic lines and copper lines cross the fault, damage would depend on the angle and amount of offset at the crossing. Hazus assumes that fiber optic lines are designed to have enough elasticity and resilience to bending to accommodate ground shaking and even moderate amounts of permanent ground deformations. However, fiber optic lines have been damaged in recent earthquakes, and carriers and workshop participants concurred that meters of ground displacement could break fiber optic lines. We use the results of Jones and others (this volume) for numbers of fiber optic lines and surface streets (as a proxy for copper lines) crossing the fault rupture as the subset of lines exposed to surface slip in the HayWired scenario.
Ground movements from liquefaction and landslide hazards are indicated by probabilities of occurring in the HayWired scenario (Jones and others, 2017; McCrink and Perez, 2017). Table 5 provides the probability ranges used for levels of intensity: low for nonzero probability less than 5 percent, moderate for probability at least 5 percent but less than 25 percent, and high for probability at least 25 percent. The ranges are chosen without any known relation between the probability of ground failure and damage to buried telecommunications equipment and lines or damage to site foundations. High hazard intensity is defined as 25 percent probability or greater because the Hazus software does not differentiate for probabilities larger than that.
A refinement for the fragility of buried fiber optic line in liquefaction-susceptible soils is informed by Sakaki and others (2014). They found damage rates of 3 and 1 percent
Table 5. Liquefaction and landslide probability hazard intensity ranges for the HayWired scenario mainshock in the San Francisco Bay region, California.
[Probability ranges from Jones and others (this volume). %, percent]
Hazard intensity Probability range (%)High liquefaction or landslide hazard ≥25Moderate liquefaction or landslide hazard 5 to <25Low liquefaction or landslide hazard >0 to <5
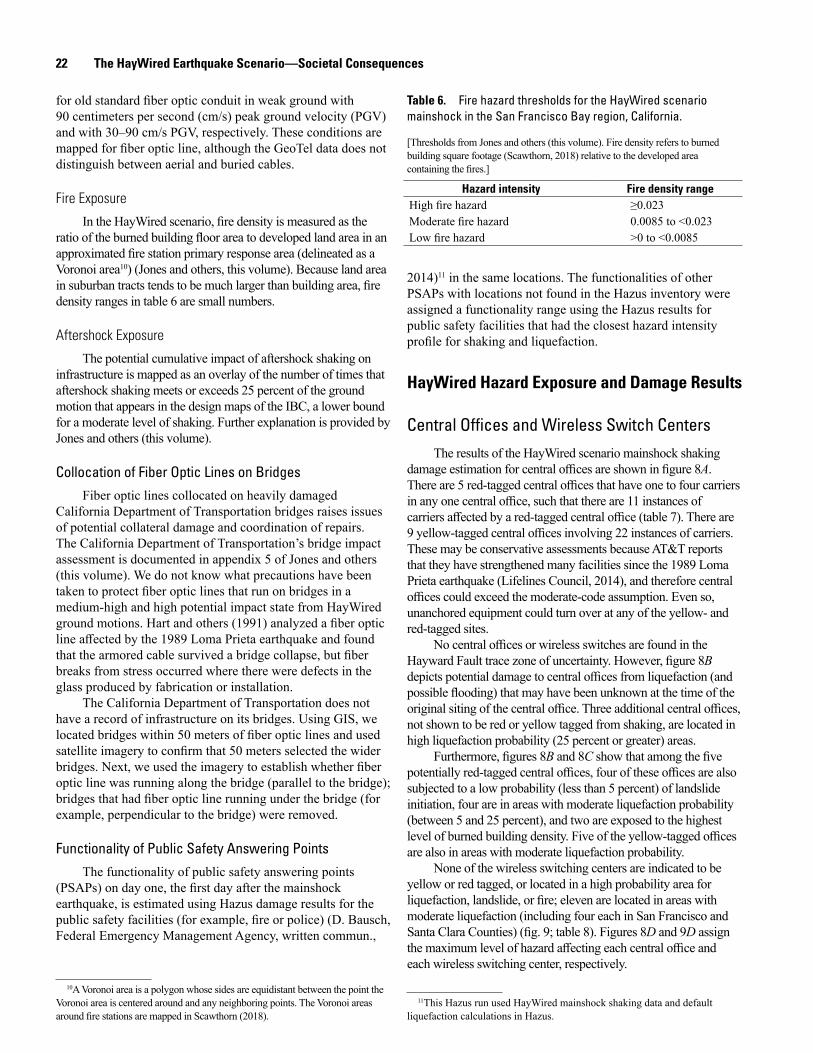
22 The HayWired Earthquake Scenario—Societal Consequences
for old standard fiber optic conduit in weak ground with 90 centimeters per second (cm/s) peak ground velocity (PGV) and with 30–90 cm/s PGV, respectively. These conditions are mapped for fiber optic line, although the GeoTel data does not distinguish between aerial and buried cables.
Fire Exposure
In the HayWired scenario, fire density is measured as the ratio of the burned building floor area to developed land area in an approximated fire station primary response area (delineated as a Voronoi area10) (Jones and others, this volume). Because land area in suburban tracts tends to be much larger than building area, fire density ranges in table 6 are small numbers.
Aftershock Exposure
The potential cumulative impact of aftershock shaking on infrastructure is mapped as an overlay of the number of times that aftershock shaking meets or exceeds 25 percent of the ground motion that appears in the design maps of the IBC, a lower bound for a moderate level of shaking. Further explanation is provided by Jones and others (this volume).
Collocation of Fiber Optic Lines on BridgesFiber optic lines collocated on heavily damaged
California Department of Transportation bridges raises issues of potential collateral damage and coordination of repairs. The California Department of Transportation’s bridge impact assessment is documented in appendix 5 of Jones and others (this volume). We do not know what precautions have been taken to protect fiber optic lines that run on bridges in a medium-high and high potential impact state from HayWired ground motions. Hart and others (1991) analyzed a fiber optic line affected by the 1989 Loma Prieta earthquake and found that the armored cable survived a bridge collapse, but fiber breaks from stress occurred where there were defects in the glass produced by fabrication or installation.
The California Department of Transportation does not have a record of infrastructure on its bridges. Using GIS, we located bridges within 50 meters of fiber optic lines and used satellite imagery to confirm that 50 meters selected the wider bridges. Next, we used the imagery to establish whether fiber optic line was running along the bridge (parallel to the bridge); bridges that had fiber optic line running under the bridge (for example, perpendicular to the bridge) were removed.
Functionality of Public Safety Answering PointsThe functionality of public safety answering points
(PSAPs) on day one, the first day after the mainshock earthquake, is estimated using Hazus damage results for the public safety facilities (for example, fire or police) (D. Bausch, Federal Emergency Management Agency, written commun.,
10A Voronoi area is a polygon whose sides are equidistant between the point the Voronoi area is centered around and any neighboring points. The Voronoi areas around fire stations are mapped in Scawthorn (2018).
Table 6. Fire hazard thresholds for the HayWired scenario mainshock in the San Francisco Bay region, California.
[Thresholds from Jones and others (this volume). Fire density refers to burned building square footage (Scawthorn, 2018) relative to the developed area containing the fires.]
Hazard intensity Fire density rangeHigh fire hazard ≥0.023Moderate fire hazard 0.0085 to <0.023Low fire hazard >0 to <0.0085
2014)11 in the same locations. The functionalities of other PSAPs with locations not found in the Hazus inventory were assigned a functionality range using the Hazus results for public safety facilities that had the closest hazard intensity profile for shaking and liquefaction.
HayWired Hazard Exposure and Damage Results
Central Offices and Wireless Switch CentersThe results of the HayWired scenario mainshock shaking
damage estimation for central offices are shown in figure 8A. There are 5 red-tagged central offices that have one to four carriers in any one central office, such that there are 11 instances of carriers affected by a red-tagged central office (table 7). There are 9 yellow-tagged central offices involving 22 instances of carriers. These may be conservative assessments because AT&T reports that they have strengthened many facilities since the 1989 Loma Prieta earthquake (Lifelines Council, 2014), and therefore central offices could exceed the moderate-code assumption. Even so, unanchored equipment could turn over at any of the yellow- and red-tagged sites.
No central offices or wireless switches are found in the Hayward Fault trace zone of uncertainty. However, figure 8B depicts potential damage to central offices from liquefaction (and possible flooding) that may have been unknown at the time of the original siting of the central office. Three additional central offices, not shown to be red or yellow tagged from shaking, are located in high liquefaction probability (25 percent or greater) areas.
Furthermore, figures 8B and 8C show that among the five potentially red-tagged central offices, four of these offices are also subjected to a low probability (less than 5 percent) of landslide initiation, four are in areas with moderate liquefaction probability (between 5 and 25 percent), and two are exposed to the highest level of burned building density. Five of the yellow-tagged offices are also in areas with moderate liquefaction probability.
None of the wireless switching centers are indicated to be yellow or red tagged, or located in a high probability area for liquefaction, landslide, or fire; eleven are located in areas with moderate liquefaction (including four each in San Francisco and Santa Clara Counties) (fig. 9; table 8). Figures 8D and 9D assign the maximum level of hazard affecting each central office and each wireless switching center, respectively.
11This Hazus run used HayWired mainshock shaking data and default liquefaction calculations in Hazus.
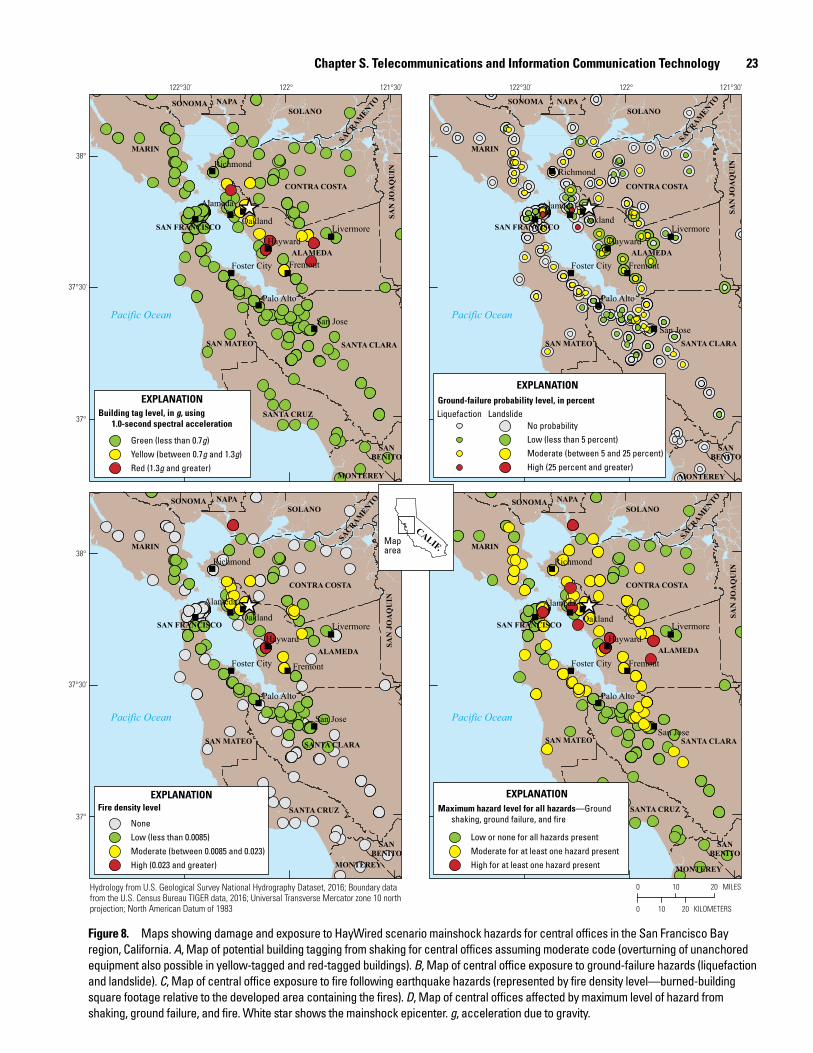
Chapter S. Telecommunications and Information Communication Technology 23
men21-7516_fig08
Hydrology from U.S. Geological Survey National Hydrography Dataset, 2016; Boundary data from the U.S. Census Bureau TIGER data, 2016; Universal Transverse Mercator zone 10 north projection; North American Datum of 1983
20 MILES100
20 KILOMETERS100
38°
37°
37°30’
122°122°30’ 121°30’
38°
37°
37°30’
122°122°30’ 121°30’
38°
"
""
"
"
"
"
"
"
"
"
""
"
"
"
"
"
"
"
"
""
"
"
"
"
"
"
"
"
""
"
"
"
"
"
"
"
_̂ _̂
_̂_̂
Richmond
Alameda
LivermoreHayward
FremontFoster City
Palo Alto
San Jose
Oakland
Richmond
Alameda
LivermoreHayward
FremontFoster City
Palo Alto
San Jose
Oakland
Richmond
Alameda
LivermoreHayward
FremontFoster City
Palo Alto
San Jose
Oakland
Richmond
Alameda
LivermoreHayward
FremontFoster City
Palo Alto
San Jose
Oakland
SONOMA NAPASOLANO
SACRAM
ENTO
SAN
JO
AQ
UIN
CONTRA COSTA
SAN FRANCISCO
SAN MATEO
ALAMEDA
SANTA CLARA
SANTA CRUZ
SANBENITO
MONTEREY
MARIN
SONOMA NAPASOLANO
SACRAM
ENTO
SAN
JO
AQ
UIN
CONTRA COSTA
SAN FRANCISCO
SAN MATEO
ALAMEDA
SANTA CLARA
SANTA CRUZ
SANBENITO
MONTEREY
MARIN
SONOMA NAPASOLANO
SACRAM
ENTO
SAN
JO
AQ
UIN
CONTRA COSTA
SAN FRANCISCO
SAN MATEO
ALAMEDA
SANTA CLARA
SANTA CRUZ
SANBENITO
MONTEREY
MARIN
SONOMA NAPASOLANO
SACRAM
ENTO
SAN
JO
AQ
UIN
CONTRA COSTA
SAN FRANCISCO
SAN MATEO
ALAMEDA
SANTA CLARA
SANTA CRUZ
SANBENITO
MONTEREY
MARIN
Pacific OceanPacific Ocean
Pacific OceanPacific Ocean
Maparea
CALIF.
EXPLANATIONBuilding tag level, in g, using
1.0-second spectral acceleration
Green (less than 0.7g)Yellow (between 0.7g and 1.3g)Red (1.3g and greater)
EXPLANATIONGround-failure probability level, in percent
LandslideLiquefactionNo probabilityLow (less than 5 percent)Moderate (between 5 and 25 percent)High (25 percent and greater)
EXPLANATIONFire density level
Low (less than 0.0085)Moderate (between 0.0085 and 0.023)High (0.023 and greater)
None
EXPLANATIONMaximum hazard level for all hazards—Ground
shaking, ground failure, and fire
Low or none for all hazards presentModerate for at least one hazard presentHigh for at least one hazard present
Figure 8. Maps showing damage and exposure to HayWired scenario mainshock hazards for central offices in the San Francisco Bay region, California. A, Map of potential building tagging from shaking for central offices assuming moderate code (overturning of unanchored equipment also possible in yellow-tagged and red-tagged buildings). B, Map of central office exposure to ground-failure hazards (liquefaction and landslide). C, Map of central office exposure to fire following earthquake hazards (represented by fire density level—burned-building square footage relative to the developed area containing the fires). D, Map of central offices affected by maximum level of hazard from shaking, ground failure, and fire. White star shows the mainshock epicenter. g, acceleration due to gravity.
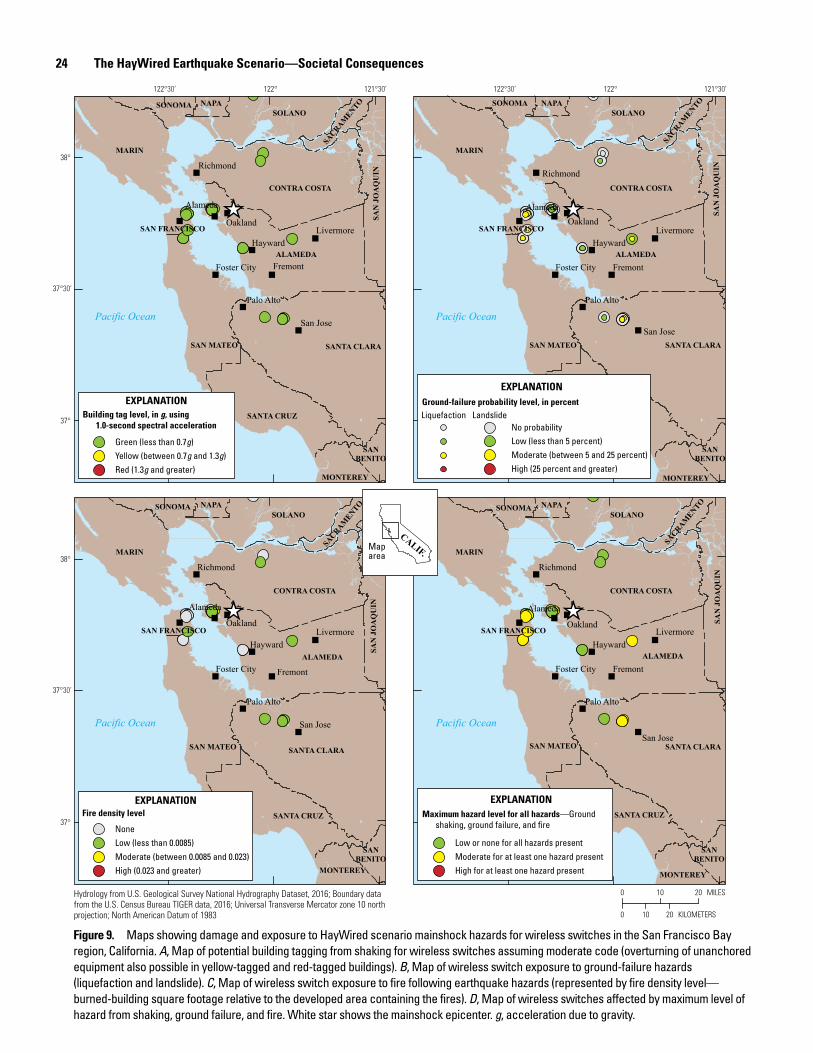
24 The HayWired Earthquake Scenario—Societal Consequences
men21-7516_fig09
20 MILES100
20 KILOMETERS100
38°
37°
37°30’
122°122°30’ 121°30’
38°
37°
37°30’
122°122°30’ 121°30’
38°
"
""
"
"
"
"
"
"
"
"
""
"
"
"
"
"
"
"
"
""
"
"
"
"
"
"
"
"
""
"
"
"
"
"
"
"
_̂ _̂
_̂_̂
Richmond
Alameda
LivermoreHayward
FremontFoster City
Palo Alto
San Jose
Oakland
Richmond
Alameda
LivermoreHayward
FremontFoster City
Palo Alto
San Jose
Oakland
Richmond
Alameda
LivermoreHayward
FremontFoster City
Palo Alto
San Jose
Oakland
Richmond
Alameda
LivermoreHayward
FremontFoster City
Palo Alto
San Jose
Oakland
SONOMA NAPASOLANO
SACRAM
ENTO
SAN
JO
AQ
UIN
CONTRA COSTA
SAN FRANCISCO
SAN MATEO
ALAMEDA
SANTA CLARA
SANTA CRUZ
SANBENITO
MONTEREY
MARIN
SONOMA NAPASOLANO
SACRAM
ENTO
SAN
JO
AQ
UIN
CONTRA COSTA
SAN FRANCISCO
SAN MATEO
ALAMEDA
SANTA CLARA
SANTA CRUZ
SANBENITO
MONTEREY
MARIN
SONOMA NAPASOLANO
SACRAM
ENTO
SAN
JO
AQ
UIN
CONTRA COSTA
SAN FRANCISCO
SAN MATEO
ALAMEDA
SANTA CLARA
SANTA CRUZ
SANBENITO
MONTEREY
MARIN
SONOMA NAPASOLANO
SACRAM
ENTO
SAN
JO
AQ
UIN
CONTRA COSTA
SAN FRANCISCO
SAN MATEO
ALAMEDA
SANTA CLARA
SANTA CRUZ
SANBENITO
MONTEREY
MARIN
Pacific OceanPacific Ocean
Pacific OceanPacific Ocean
Maparea
CALIF.
EXPLANATIONBuilding tag level, in g, using
1.0-second spectral acceleration
Green (less than 0.7g)Yellow (between 0.7g and 1.3g)Red (1.3g and greater)
EXPLANATIONGround-failure probability level, in percent
LandslideLiquefactionNo probabilityLow (less than 5 percent)Moderate (between 5 and 25 percent)High (25 percent and greater)
EXPLANATIONFire density level
Low (less than 0.0085)Moderate (between 0.0085 and 0.023)High (0.023 and greater)
None
EXPLANATIONMaximum hazard level for all hazards—Ground
shaking, ground failure, and fire
Low or none for all hazards presentModerate for at least one hazard presentHigh for at least one hazard present
Hydrology from U.S. Geological Survey National Hydrography Dataset, 2016; Boundary data from the U.S. Census Bureau TIGER data, 2016; Universal Transverse Mercator zone 10 north projection; North American Datum of 1983
Figure 9. Maps showing damage and exposure to HayWired scenario mainshock hazards for wireless switches in the San Francisco Bay region, California. A, Map of potential building tagging from shaking for wireless switches assuming moderate code (overturning of unanchored equipment also possible in yellow-tagged and red-tagged buildings). B, Map of wireless switch exposure to ground-failure hazards (liquefaction and landslide). C, Map of wireless switch exposure to fire following earthquake hazards (represented by fire density level—burned-building square footage relative to the developed area containing the fires). D, Map of wireless switches affected by maximum level of hazard from shaking, ground failure, and fire. White star shows the mainshock epicenter. g, acceleration due to gravity.
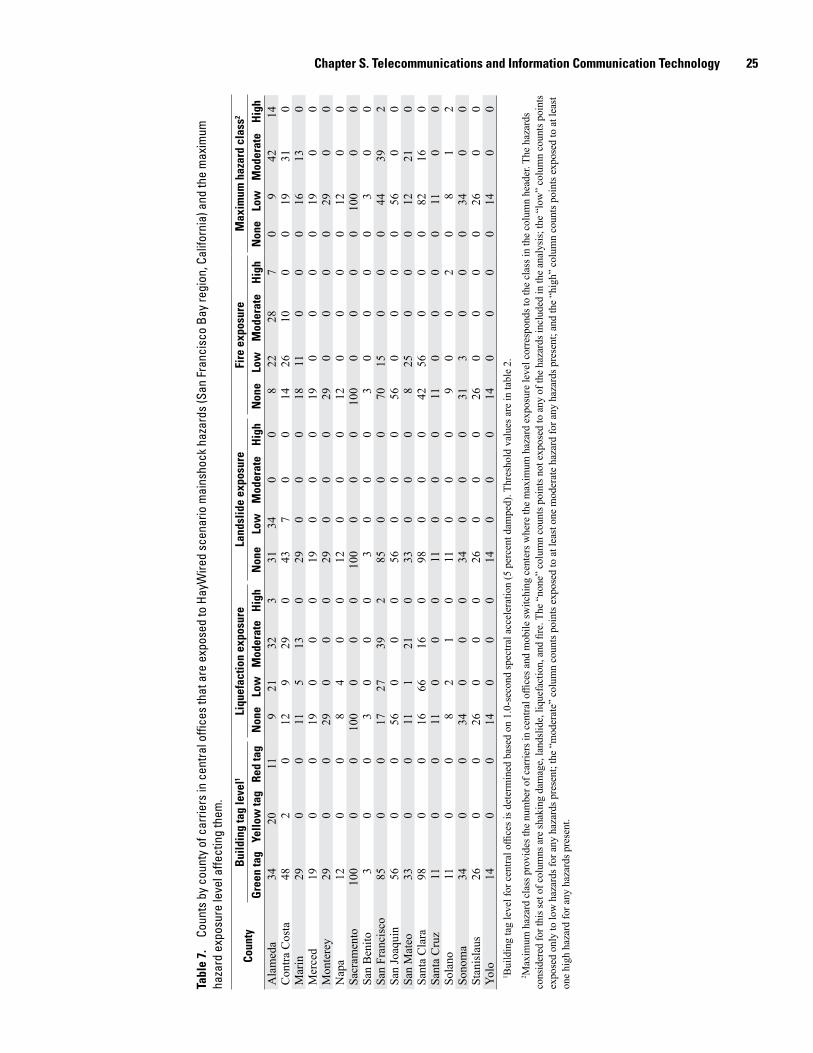
Chapter S. Telecommunications and Information Communication Technology 25
Tabl
e 7.
Co
unts
by
coun
ty o
f car
riers
in c
entra
l offi
ces
that
are
exp
osed
to H
ayW
ired
scen
ario
mai
nsho
ck h
azar
ds (S
an F
ranc
isco
Bay
regi
on, C
alifo
rnia
) and
the
max
imum
ha
zard
exp
osur
e le
vel a
ffect
ing
them
.
Coun
tyB
uild
ing
tag
leve
l1Li
quef
actio
n ex
posu
reLa
ndsl
ide
expo
sure
Fire
exp
osur
eM
axim
um h
azar
d cl
ass2
Gre
en ta
gYe
llow
tag
Red
tag
Non
eLo
wM
oder
ate
Hig
hN
one
Low
Mod
erat
eH
igh
Non
eLo
wM
oder
ate
Hig
hN
one
Low
Mod
erat
eH
igh
Ala
med
a34
2011
921
323
3134
00
822
287
09
4214
Con
tra C
osta
482
012
929
043
70
014
2610
00
1931
0M
arin
290
011
513
029
00
018
110
00
1613
0M
erce
d19
00
190
00
190
00
190
00
019
00
Mon
tere
y29
00
290
00
290
00
290
00
029
00
Nap
a12
00
84
00
120
00
120
00
012
00
Sacr
amen
to10
00
010
00
00
100
00
010
00
00
010
00
0Sa
n B
enito
30
03
00
03
00
03
00
00
30
0Sa
n Fr
anci
sco
850
017
2739
285
00
070
150
00
4439
2Sa
n Jo
aqui
n56
00
560
00
560
00
560
00
056
00
San
Mat
eo33
00
111
210
330
00
825
00
012
210
Sant
a C
lara
980
016
6616
098
00
042
560
00
8216
0Sa
nta
Cru
z11
00
110
00
110
00
110
00
011
00
Sola
no11
00
82
10
110
00
90
02
08
12
Sono
ma
340
034
00
034
00
031
30
00
340
0St
anis
laus
260
026
00
026
00
026
00
00
260
0Yo
lo14
00
140
00
140
00
140
00
014
00
1 Bui
ldin
g ta
g le
vel f
or c
entra
l offi
ces i
s det
erm
ined
bas
ed o
n 1.
0-se
cond
spec
tral a
ccel
erat
ion
(5 p
erce
nt d
ampe
d). T
hres
hold
val
ues a
re in
tabl
e 2.
2 Max
imum
haz
ard
clas
s pro
vide
s the
num
ber o
f car
riers
in c
entra
l offi
ces a
nd m
obile
switc
hing
cen
ters
whe
re th
e m
axim
um h
azar
d ex
posu
re le
vel c
orre
spon
ds to
the
clas
s in
the
colu
mn
head
er. T
he h
azar
ds
cons
ider
ed fo
r thi
s set
of c
olum
ns a
re sh
akin
g da
mag
e, la
ndsli
de, l
ique
fact
ion,
and
fire
. The
“no
ne”
colu
mn
coun
ts po
ints
not e
xpos
ed to
any
of t
he h
azar
ds in
clud
ed in
the
anal
ysis;
the
“low
” co
lum
n co
unts
poin
ts
expo
sed
only
to lo
w h
azar
ds fo
r any
haz
ards
pre
sent
; the
“m
oder
ate”
col
umn
coun
ts po
ints
expo
sed
to a
t lea
st on
e m
oder
ate
haza
rd fo
r any
haz
ards
pre
sent
; and
the
“hig
h” c
olum
n co
unts
poin
ts ex
pose
d to
at l
east
one
high
haz
ard
for a
ny h
azar
ds p
rese
nt.

26 The HayWired Earthquake Scenario—Societal ConsequencesTa
ble
8.
Coun
ts b
y co
unty
of w
irele
ss s
witc
hes
that
are
exp
osed
to H
ayW
ired
scen
ario
mai
nsho
ck h
azar
ds (S
an F
ranc
isco
Bay
regi
on, C
alifo
rnia
) and
the
max
imum
haz
ard
expo
sure
leve
l affe
ctin
g th
em.
Coun
tyB
uild
ing
tag
leve
l1Li
quef
actio
n ex
posu
reLa
ndsl
ide
expo
sure
Fire
exp
osur
eM
axim
um h
azar
d cl
ass2
Gre
en ta
gYe
llow
tag
Red
tag
Non
eLo
wM
oder
ate
Hig
hN
one
Low
Mod
erat
eH
igh
Non
eLo
wM
oder
ate
Hig
hN
one
Low
Mod
erat
eH
igh
Ala
med
a8
00
07
10
71
00
34
10
06
20
Con
tra C
osta
20
01
10
02
00
01
10
00
20
0M
arin
00
00
00
00
00
00
00
00
00
0M
erce
d0
00
00
00
00
00
00
00
00
00
Mon
tere
y5
00
50
00
50
00
50
00
05
00
Nap
a0
00
00
00
00
00
00
00
00
00
Sacr
amen
to7
00
70
00
70
00
70
00
07
00
San
Ben
ito0
00
00
00
00
00
00
00
00
00
San
Fran
cisc
o6
00
20
40
60
00
51
00
02
40
San
Joaq
uin
90
09
00
09
00
09
00
00
90
0Sa
n M
ateo
20
00
02
02
00
02
00
00
02
0Sa
nta
Cla
ra5
00
01
40
50
00
05
00
01
40
Sant
a C
ruz
00
00
00
00
00
00
00
00
00
0So
lano
10
01
00
01
00
01
00
00
10
0So
nom
a1
00
10
00
10
00
10
00
01
00
Stan
isla
us2
00
20
00
20
00
20
00
02
00
Yolo
40
04
00
04
00
04
00
00
40
01 B
uild
ing
tag
leve
l for
wire
less
switc
hes i
s det
erm
ined
bas
ed o
n 1.
0-se
cond
spec
tral a
ccel
erat
ion
(5 p
erce
nt d
ampe
d). T
hres
hold
val
ues a
re in
tabl
e 2.
2 Max
imum
haz
ard
clas
s pro
vide
s the
num
ber o
f wire
less
switc
hes w
here
the m
axim
um h
azar
d ex
posu
re le
vel c
orre
spon
ds to
the c
lass
in th
e col
umn
head
er. T
he h
azar
ds co
nsid
ered
for t
his s
et o
f col
umns
are s
haki
ng
dam
age,
land
slide
, liq
uefa
ctio
n, an
d fir
e. Th
e “no
ne” c
olum
n co
unts
poin
ts no
t exp
osed
to an
y of
the h
azar
ds in
clud
ed in
the a
naly
sis; t
he “l
ow” c
olum
n co
unts
poin
ts ex
pose
d on
ly to
low
haz
ards
for a
ny h
azar
ds p
rese
nt; t
he
“mod
erat
e” co
lum
n co
unts
poin
ts ex
pose
d to
at le
ast o
ne m
oder
ate h
azar
d fo
r any
haz
ards
pre
sent
; and
the “
high
” col
umn
coun
ts po
ints
expo
sed
to at
leas
t one
hig
h ha
zard
for a
ny h
azar
ds p
rese
nt.
Data CentersNo data centers are located in the Hayward Fault
trace zone of uncertainty and only one data center is potentially yellow tagged from HayWired scenario mainshock shaking assuming it is built to moderate code (fig. 10A; table 9). Data centers are less exposed to fire following earthquake in the HayWired scenario; three are in areas with a moderate density of burned buildings (fig. 10C). One of these data centers is located on the east side of the foothills.
A potential hazard for data centers appears to be liquefiable soils, in San Francisco and Santa Clara Counties in particular (fig. 10B). Also, data centers are more exposed to repeated moderate level of shaking from HayWired scenario aftershocks than central offices (Jones and others, this volume). Each shaking incident is not heavy enough for yellow- or red-tag level of damage, but the cumulative effect of multiple events is unknown.
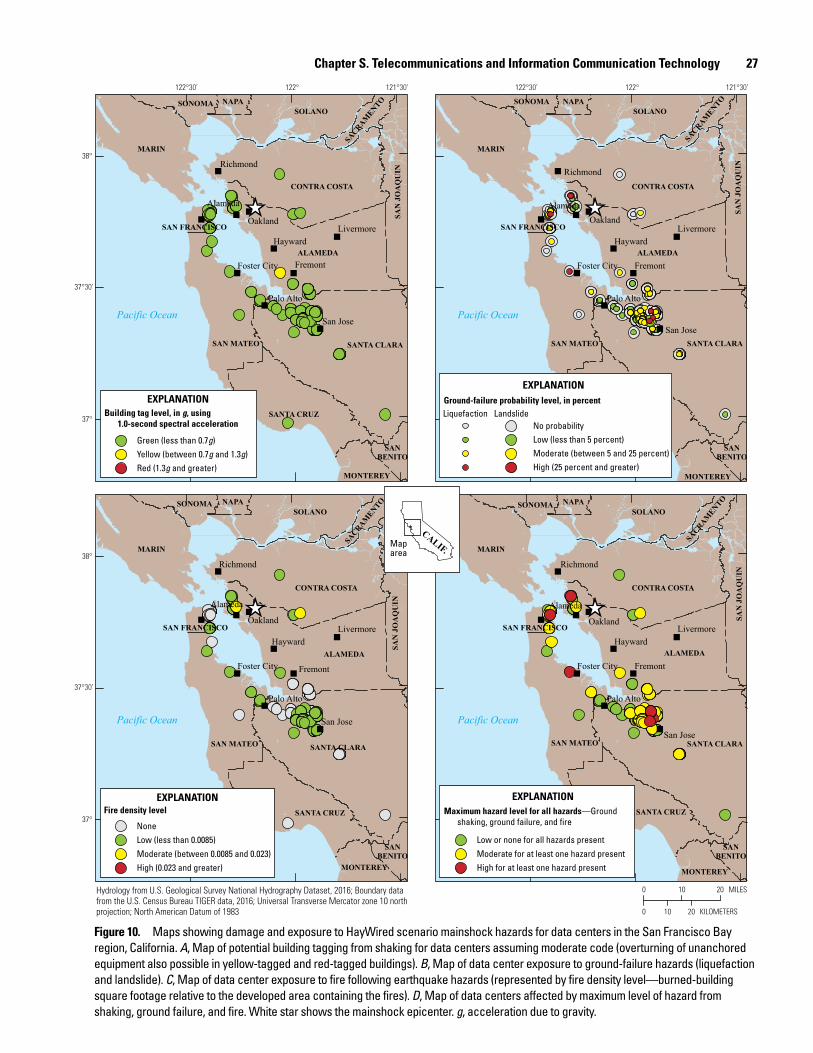
Chapter S. Telecommunications and Information Communication Technology 27
men21-7516_fig10
20 MILES100
20 KILOMETERS100
38°
37°
37°30’
122°122°30’ 121°30’
38°
37°
37°30’
122°122°30’ 121°30’
38°
"
""
"
"
"
"
"
"
"
"
""
"
"
"
"
"
"
"
"
""
"
"
"
"
"
"
"
"
""
"
"
"
"
"
"
"
_̂ _̂
_̂_̂
Richmond
Alameda
LivermoreHayward
FremontFoster City
Palo Alto
San Jose
Oakland
Richmond
Alameda
LivermoreHayward
FremontFoster City
Palo Alto
San Jose
Oakland
Richmond
Alameda
LivermoreHayward
FremontFoster City
Palo Alto
San Jose
Oakland
Richmond
Alameda
LivermoreHayward
FremontFoster City
Palo Alto
San Jose
Oakland
SONOMA NAPASOLANO
SACRAM
ENTO
SAN
JO
AQ
UIN
CONTRA COSTA
SAN FRANCISCO
SAN MATEO
ALAMEDA
SANTA CLARA
SANTA CRUZ
SANBENITO
MONTEREY
MARIN
SONOMA NAPASOLANO
SACRAM
ENTO
SAN
JO
AQ
UIN
CONTRA COSTA
SAN FRANCISCO
SAN MATEO
ALAMEDA
SANTA CLARA
SANTA CRUZ
SANBENITO
MONTEREY
MARIN
SONOMA NAPASOLANO
SACRAM
ENTO
SAN
JO
AQ
UIN
CONTRA COSTA
SAN FRANCISCO
SAN MATEO
ALAMEDA
SANTA CLARA
SANTA CRUZ
SANBENITO
MONTEREY
MARIN
SONOMA NAPASOLANO
SACRAM
ENTO
SAN
JO
AQ
UIN
CONTRA COSTA
SAN FRANCISCO
SAN MATEO
ALAMEDA
SANTA CLARA
SANTA CRUZ
SANBENITO
MONTEREY
MARIN
Pacific OceanPacific Ocean
Pacific OceanPacific Ocean
Maparea
CALIF.
EXPLANATIONBuilding tag level, in g, using
1.0-second spectral acceleration
Green (less than 0.7g)Yellow (between 0.7g and 1.3g)Red (1.3g and greater)
EXPLANATIONGround-failure probability level, in percent
LandslideLiquefactionNo probabilityLow (less than 5 percent)Moderate (between 5 and 25 percent)High (25 percent and greater)
EXPLANATIONFire density level
Low (less than 0.0085)Moderate (between 0.0085 and 0.023)High (0.023 and greater)
None
EXPLANATIONMaximum hazard level for all hazards—Ground
shaking, ground failure, and fire
Low or none for all hazards presentModerate for at least one hazard presentHigh for at least one hazard present
Hydrology from U.S. Geological Survey National Hydrography Dataset, 2016; Boundary data from the U.S. Census Bureau TIGER data, 2016; Universal Transverse Mercator zone 10 north projection; North American Datum of 1983
Figure 10. Maps showing damage and exposure to HayWired scenario mainshock hazards for data centers in the San Francisco Bay region, California. A, Map of potential building tagging from shaking for data centers assuming moderate code (overturning of unanchored equipment also possible in yellow-tagged and red-tagged buildings). B, Map of data center exposure to ground-failure hazards (liquefaction and landslide). C, Map of data center exposure to fire following earthquake hazards (represented by fire density level—burned-building square footage relative to the developed area containing the fires). D, Map of data centers affected by maximum level of hazard from shaking, ground failure, and fire. White star shows the mainshock epicenter. g, acceleration due to gravity.
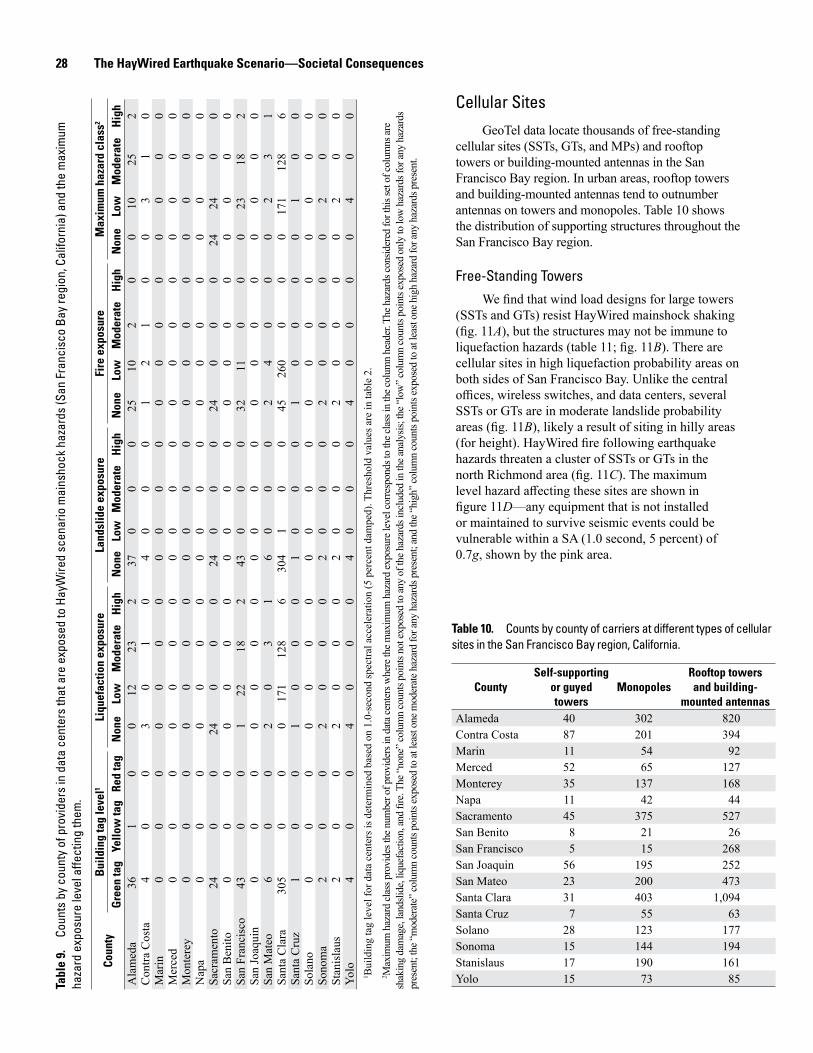
28 The HayWired Earthquake Scenario—Societal ConsequencesTa
ble
9.
Coun
ts b
y co
unty
of p
rovi
ders
in d
ata
cent
ers
that
are
exp
osed
to H
ayW
ired
scen
ario
mai
nsho
ck h
azar
ds (S
an F
ranc
isco
Bay
regi
on, C
alifo
rnia
) and
the
max
imum
ha
zard
exp
osur
e le
vel a
ffect
ing
them
.
Coun
tyB
uild
ing
tag
leve
l1Li
quef
actio
n ex
posu
reLa
ndsl
ide
expo
sure
Fire
exp
osur
eM
axim
um h
azar
d cl
ass2
Gre
en ta
gYe
llow
tag
Red
tag
Non
eLo
wM
oder
ate
Hig
hN
one
Low
Mod
erat
eH
igh
Non
eLo
wM
oder
ate
Hig
hN
one
Low
Mod
erat
eH
igh
Ala
med
a36
10
012
232
370
00
2510
20
010
252
Con
tra C
osta
40
03
01
04
00
01
21
00
31
0M
arin
00
00
00
00
00
00
00
00
00
0M
erce
d0
00
00
00
00
00
00
00
00
00
Mon
tere
y0
00
00
00
00
00
00
00
00
00
Nap
a0
00
00
00
00
00
00
00
00
00
Sacr
amen
to24
00
240
00
240
00
240
00
2424
00
San
Ben
ito0
00
00
00
00
00
00
00
00
00
San
Fran
cisc
o43
00
122
182
430
00
3211
00
023
182
San
Joaq
uin
00
00
00
00
00
00
00
00
00
0Sa
n M
ateo
60
02
03
16
00
02
40
00
23
1Sa
nta
Cla
ra30
50
00
171
128
630
41
00
4526
00
00
171
128
6Sa
nta
Cru
z1
00
10
00
10
00
10
00
01
00
Sola
no0
00
00
00
00
00
00
00
00
00
Sono
ma
20
02
00
02
00
02
00
00
20
0St
anis
laus
20
02
00
02
00
02
00
00
20
0Yo
lo4
00
40
00
40
00
40
00
04
00
1 Bui
ldin
g ta
g le
vel f
or d
ata
cent
ers i
s det
erm
ined
bas
ed o
n 1.
0-se
cond
spec
tral a
ccel
erat
ion
(5 p
erce
nt d
ampe
d). T
hres
hold
val
ues a
re in
tabl
e 2.
2 Max
imum
haz
ard
clas
s pro
vide
s the
num
ber o
f pro
vide
rs in
dat
a cen
ters
whe
re th
e max
imum
haz
ard
expo
sure
leve
l cor
resp
onds
to th
e cla
ss in
the c
olum
n he
ader
. The
haz
ards
cons
ider
ed fo
r thi
s set
of c
olum
ns ar
e sh
akin
g da
mag
e, la
ndsli
de, l
ique
fact
ion,
and
fire.
The “
none
” col
umn
coun
ts po
ints
not e
xpos
ed to
any
of th
e haz
ards
incl
uded
in th
e ana
lysis
; the
“low
” col
umn
coun
ts po
ints
expo
sed
only
to lo
w h
azar
ds fo
r any
haz
ards
pr
esen
t; th
e “m
oder
ate”
colu
mn
coun
ts po
ints
expo
sed
to at
leas
t one
mod
erat
e haz
ard
for a
ny h
azar
ds p
rese
nt; a
nd th
e “hi
gh” c
olum
n co
unts
poin
ts ex
pose
d to
at le
ast o
ne h
igh
haza
rd fo
r any
haz
ards
pre
sent
.
Cellular SitesGeoTel data locate thousands of free-standing
cellular sites (SSTs, GTs, and MPs) and rooftop towers or building-mounted antennas in the San Francisco Bay region. In urban areas, rooftop towers and building-mounted antennas tend to outnumber antennas on towers and monopoles. Table 10 shows the distribution of supporting structures throughout the San Francisco Bay region.
Free-Standing TowersWe find that wind load designs for large towers
(SSTs and GTs) resist HayWired mainshock shaking (fig. 11A), but the structures may not be immune to liquefaction hazards (table 11; fig. 11B). There are cellular sites in high liquefaction probability areas on both sides of San Francisco Bay. Unlike the central offices, wireless switches, and data centers, several SSTs or GTs are in moderate landslide probability areas (fig. 11B), likely a result of siting in hilly areas (for height). HayWired fire following earthquake hazards threaten a cluster of SSTs or GTs in the north Richmond area (fig. 11C). The maximum level hazard affecting these sites are shown in figure 11D—any equipment that is not installed or maintained to survive seismic events could be vulnerable within a SA (1.0 second, 5 percent) of 0.7g, shown by the pink area.
Table 10. Counts by county of carriers at different types of cellular sites in the San Francisco Bay region, California.
CountySelf-supporting
or guyed towers
MonopolesRooftop towers and building-
mounted antennasAlameda 40 302 820Contra Costa 87 201 394Marin 11 54 92Merced 52 65 127Monterey 35 137 168Napa 11 42 44Sacramento 45 375 527San Benito 8 21 26San Francisco 5 15 268San Joaquin 56 195 252San Mateo 23 200 473Santa Clara 31 403 1,094Santa Cruz 7 55 63Solano 28 123 177Sonoma 15 144 194Stanislaus 17 190 161Yolo 15 73 85
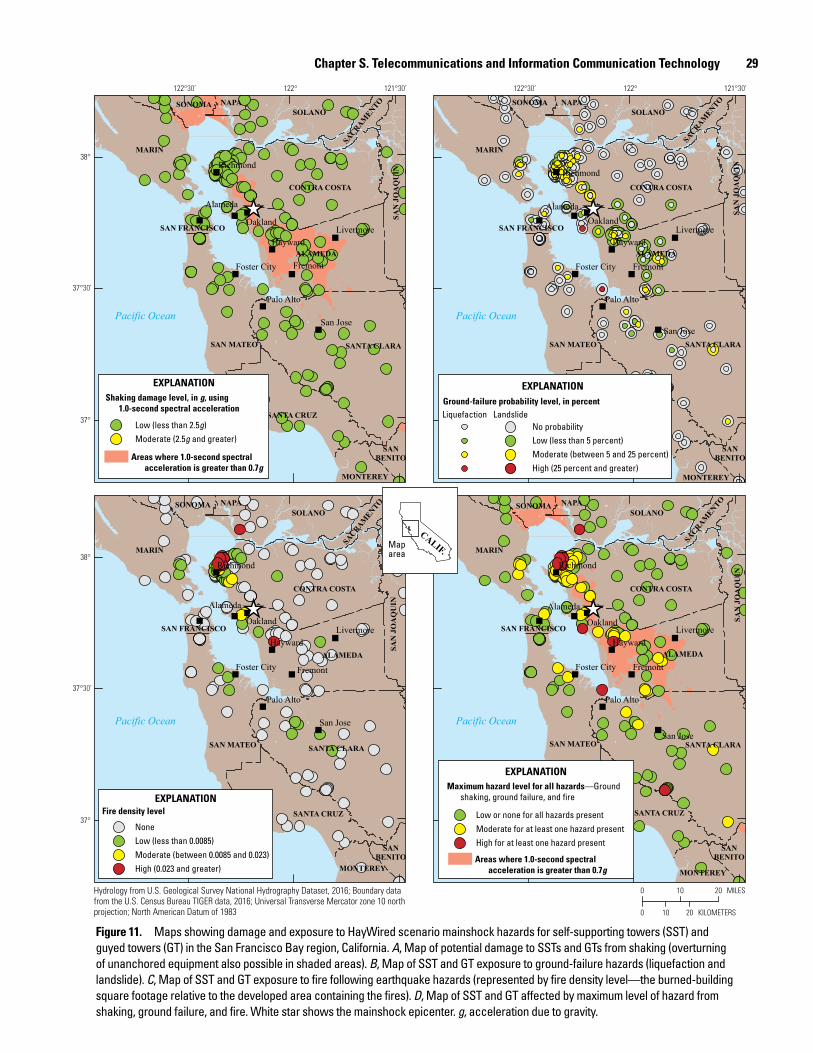
Chapter S. Telecommunications and Information Communication Technology 29
men21-7516_fig11
20 MILES100
20 KILOMETERS100
38°
37°
37°30’
122°122°30’ 121°30’
38°
37°
37°30’
122°122°30’ 121°30’
38°
"
""
"
"
"
"
"
"
"
"
""
"
"
"
"
"
"
"
"
""
"
"
"
"
"
"
"
"
""
"
"
"
"
"
"
"
_̂ _̂
_̂_̂
Richmond
Alameda
LivermoreHayward
FremontFoster City
Palo Alto
San Jose
Oakland
Richmond
Alameda
LivermoreHayward
FremontFoster City
Palo Alto
San Jose
Oakland
Richmond
Alameda
LivermoreHayward
FremontFoster City
Palo Alto
San Jose
Oakland
Richmond
Alameda
LivermoreHayward
FremontFoster City
Palo Alto
San Jose
Oakland
SONOMA NAPASOLANO
SACRAM
ENTO
SAN
JO
AQ
UIN
CONTRA COSTA
SAN FRANCISCO
SAN MATEO
ALAMEDA
SANTA CLARA
SANTA CRUZ
SANBENITO
MONTEREY
MARIN
SONOMA NAPASOLANO
SACRAM
ENTO
SAN
JO
AQ
UIN
CONTRA COSTA
SAN FRANCISCO
SAN MATEO
ALAMEDA
SANTA CLARA
SANTA CRUZ
SANBENITO
MONTEREY
MARIN
SONOMA NAPASOLANO
SACRAM
ENTO
SAN
JO
AQ
UIN
CONTRA COSTA
SAN FRANCISCO
SAN MATEO
ALAMEDA
SANTA CLARA
SANTA CRUZ
SANBENITO
MONTEREY
MARIN
SONOMA NAPASOLANO
SACRAM
ENTO
SAN
JO
AQ
UIN
CONTRA COSTA
SAN FRANCISCO
SAN MATEO
ALAMEDA
SANTA CLARA
SANTA CRUZ
SANBENITO
MONTEREY
MARIN
Pacific OceanPacific Ocean
Pacific OceanPacific Ocean
Maparea
CALIF.
EXPLANATIONShaking damage level, in g, using
1.0-second spectral acceleration
Areas where 1.0-second spectral acceleration is greater than 0.7g
Low (less than 2.5g)Moderate (2.5g and greater)
EXPLANATIONGround-failure probability level, in percent
LandslideLiquefactionNo probabilityLow (less than 5 percent)Moderate (between 5 and 25 percent)High (25 percent and greater)
EXPLANATIONFire density level
Low (less than 0.0085)Moderate (between 0.0085 and 0.023)High (0.023 and greater)
None
EXPLANATIONMaximum hazard level for all hazards—Ground
shaking, ground failure, and fire
Low or none for all hazards presentModerate for at least one hazard presentHigh for at least one hazard present
Areas where 1.0-second spectral acceleration is greater than 0.7g
Hydrology from U.S. Geological Survey National Hydrography Dataset, 2016; Boundary data from the U.S. Census Bureau TIGER data, 2016; Universal Transverse Mercator zone 10 north projection; North American Datum of 1983
Figure 11. Maps showing damage and exposure to HayWired scenario mainshock hazards for self-supporting towers (SST) and guyed towers (GT) in the San Francisco Bay region, California. A, Map of potential damage to SSTs and GTs from shaking (overturning of unanchored equipment also possible in shaded areas). B, Map of SST and GT exposure to ground-failure hazards (liquefaction and landslide). C, Map of SST and GT exposure to fire following earthquake hazards (represented by fire density level—the burned-building square footage relative to the developed area containing the fires). D, Map of SST and GT affected by maximum level of hazard from shaking, ground failure, and fire. White star shows the mainshock epicenter. g, acceleration due to gravity.
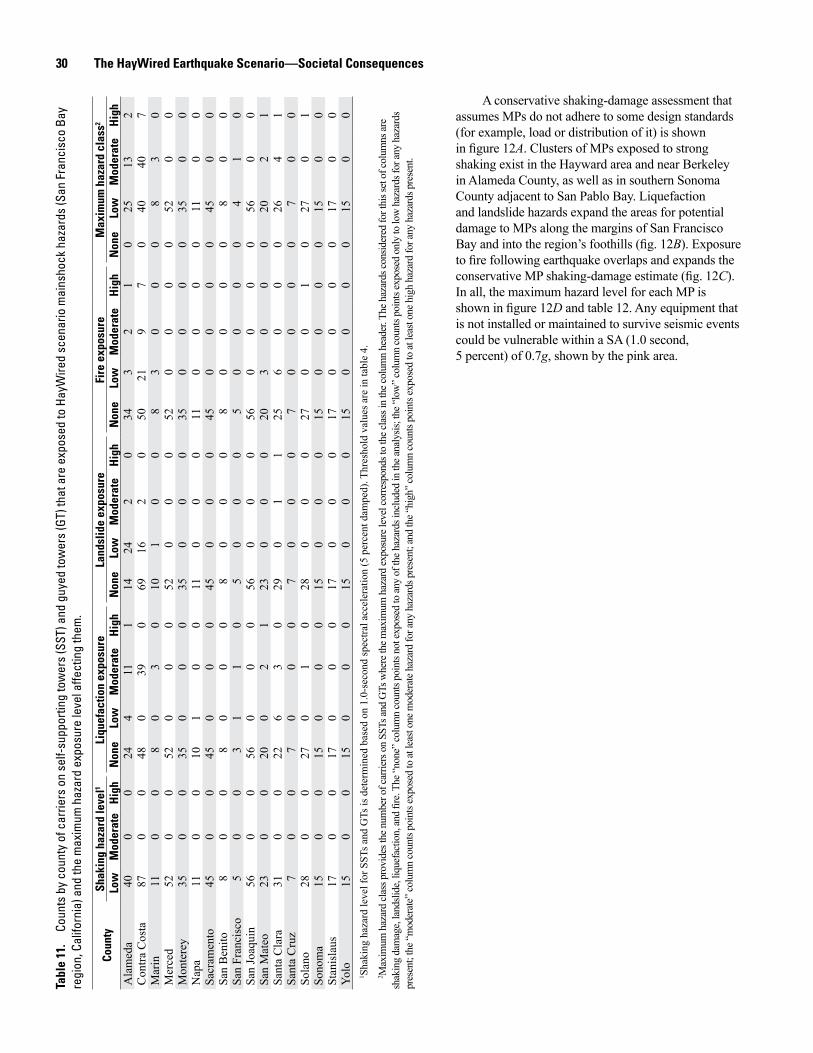
30 The HayWired Earthquake Scenario—Societal ConsequencesTa
ble
11.
Coun
ts b
y co
unty
of c
arrie
rs o
n se
lf-su
ppor
ting
tow
ers
(SST
) and
guy
ed to
wer
s (G
T) th
at a
re e
xpos
ed to
Hay
Wire
d sc
enar
io m
ains
hock
haz
ards
(San
Fra
ncis
co B
ay
regi
on, C
alifo
rnia
) and
the
max
imum
haz
ard
expo
sure
leve
l affe
ctin
g th
em.
Coun
tySh
akin
g ha
zard
leve
l1Li
quef
actio
n ex
posu
reLa
ndsl
ide
expo
sure
Fire
exp
osur
eM
axim
um h
azar
d cl
ass2
Low
Mod
erat
eH
igh
Non
eLo
wM
oder
ate
Hig
hN
one
Low
Mod
erat
eH
igh
Non
eLo
wM
oder
ate
Hig
hN
one
Low
Mod
erat
eH
igh
Ala
med
a40
00
244
111
1424
20
343
21
025
132
Con
tra C
osta
870
048
039
069
162
050
219
70
4040
7M
arin
110
08
03
010
10
08
30
00
83
0M
erce
d52
00
520
00
520
00
520
00
052
00
Mon
tere
y35
00
350
00
350
00
350
00
035
00
Nap
a11
00
101
00
110
00
110
00
011
00
Sacr
amen
to45
00
450
00
450
00
450
00
045
00
San
Ben
ito8
00
80
00
80
00
80
00
08
00
San
Fran
cisc
o5
00
31
10
50
00
50
00
04
10
San
Joaq
uin
560
056
00
056
00
056
00
00
560
0Sa
n M
ateo
230
020
02
123
00
020
30
00
202
1Sa
nta
Cla
ra31
00
226
30
290
11
256
00
026
41
Sant
a C
ruz
70
07
00
07
00
07
00
00
70
0So
lano
280
027
01
028
00
027
00
10
270
1So
nom
a15
00
150
00
150
00
150
00
015
00
Stan
isla
us17
00
170
00
170
00
170
00
017
00
Yolo
150
015
00
015
00
015
00
00
150
01 S
haki
ng h
azar
d le
vel f
or S
STs a
nd G
Ts is
det
erm
ined
bas
ed o
n 1.
0-se
cond
spec
tral a
ccel
erat
ion
(5 p
erce
nt d
ampe
d). T
hres
hold
val
ues a
re in
tabl
e 4.
2 Max
imum
haz
ard
clas
s pro
vide
s the
num
ber o
f car
riers
on
SSTs
and
GTs
whe
re th
e max
imum
haz
ard
expo
sure
leve
l cor
resp
onds
to th
e cla
ss in
the c
olum
n he
ader
. The
haz
ards
cons
ider
ed fo
r thi
s set
of c
olum
ns ar
e sh
akin
g da
mag
e, la
ndsli
de, l
ique
fact
ion,
and
fire.
The “
none
” col
umn
coun
ts po
ints
not e
xpos
ed to
any
of th
e haz
ards
incl
uded
in th
e ana
lysis
; the
“low
” col
umn
coun
ts po
ints
expo
sed
only
to lo
w h
azar
ds fo
r any
haz
ards
pr
esen
t; th
e “m
oder
ate”
colu
mn
coun
ts po
ints
expo
sed
to at
leas
t one
mod
erat
e haz
ard
for a
ny h
azar
ds p
rese
nt; a
nd th
e “hi
gh” c
olum
n co
unts
poin
ts ex
pose
d to
at le
ast o
ne h
igh
haza
rd fo
r any
haz
ards
pre
sent
.
A conservative shaking-damage assessment that assumes MPs do not adhere to some design standards (for example, load or distribution of it) is shown in figure 12A. Clusters of MPs exposed to strong shaking exist in the Hayward area and near Berkeley in Alameda County, as well as in southern Sonoma County adjacent to San Pablo Bay. Liquefaction and landslide hazards expand the areas for potential damage to MPs along the margins of San Francisco Bay and into the region’s foothills (fig. 12B). Exposure to fire following earthquake overlaps and expands the conservative MP shaking-damage estimate (fig. 12C). In all, the maximum hazard level for each MP is shown in figure 12D and table 12. Any equipment that is not installed or maintained to survive seismic events could be vulnerable within a SA (1.0 second, 5 percent) of 0.7g, shown by the pink area.

Chapter S. Telecommunications and Information Communication Technology 31
men21-7516_fig12
20 MILES100
20 KILOMETERS100
Hydrology from U.S. Geological Survey National Hydrography Dataset, 2016; Boundary data from the U.S. Census Bureau TIGER data, 2016; Universal Transverse Mercator zone 10 north projection; North American Datum of 1983
38°
37°
37°30’
122°122°30’ 121°30’
38°
37°
37°30’
122°122°30’ 121°30’
38°
"
""
"
"
"
"
"
"
"
"
""
"
"
"
"
"
"
"
"
""
"
"
"
"
"
"
"
"
""
"
"
"
"
"
"
"
_̂ _̂
_̂_̂
Richmond
Alameda
LivermoreHayward
FremontFoster City
Palo Alto
San Jose
Oakland
Richmond
Alameda
LivermoreHayward
FremontFoster City
Palo Alto
San Jose
Oakland
Richmond
Alameda
LivermoreHayward
FremontFoster City
Palo Alto
San Jose
Oakland
Richmond
Alameda
LivermoreHayward
FremontFoster City
Palo Alto
San Jose
Oakland
SONOMA NAPASOLANO
SACRAM
ENTO
SAN
JO
AQ
UIN
CONTRA COSTA
SAN FRANCISCO
SAN MATEO
ALAMEDA
SANTA CLARA
SANTA CRUZ
SANBENITO
MONTEREY
MARIN
SONOMA NAPASOLANO
SACRAM
ENTO
SAN
JO
AQ
UIN
CONTRA COSTA
SAN FRANCISCO
SAN MATEO
ALAMEDA
SANTA CLARA
SANTA CRUZ
SANBENITO
MONTEREY
MARIN
SONOMA NAPASOLANO
SACRAM
ENTO
SAN
JO
AQ
UIN
CONTRA COSTA
SAN FRANCISCO
SAN MATEO
ALAMEDA
SANTA CLARA
SANTA CRUZ
SANBENITO
MONTEREY
MARIN
SONOMA NAPASOLANO
SACRAM
ENTO
SAN
JO
AQ
UIN
CONTRA COSTA
SAN FRANCISCO
SAN MATEO
ALAMEDA
SANTA CLARA
SANTA CRUZ
SANBENITO
MONTEREY
MARIN
Pacific OceanPacific Ocean
Pacific OceanPacific Ocean
Maparea
CALIF.
EXPLANATIONGround-failure probability level, in percent
LandslideLiquefactionNo probabilityLow (less than 5 percent)Moderate (between 5 and 25 percent)High (25 percent and greater)
EXPLANATIONFire density level
Low (less than 0.0085)Moderate (between 0.0085 and 0.023)High (0.023 and greater)
None
EXPLANATIONShaking damage level, in g, using
1.0-second spectral acceleration
Areas where 1.0-second spectral acceleration is greater than 0.7g
Low (less than 1.25g)Moderate (between 1.25g and 1.5g)
High (1.5g and greater)
EXPLANATIONMaximum hazard level for all hazards—Ground
shaking, ground failure, and fire
Low or none for all hazards presentModerate for at least one hazard presentHigh for at least one hazard present
Areas where 1.0-second spectral acceleration is greater than 0.7g
Figure 12. Maps showing damage and exposure to HayWired scenario mainshock hazards for monopoles (MPs) in the San Francisco Bay region, California. A, Map of potential damage to vulnerable MPs from shaking (overturning of unanchored equipment also possible in shaded areas). B, Map of MP exposure to ground-failure (liquefaction and landslide) hazards. C, Map of MP exposure to fire following earthquake hazards (represented by fire density level—the burned-building square footage relative to the developed area containing the fires). D, Map of MPs affected by maximum level of hazard from shaking, ground failure, and fire. White star shows the mainshock epicenter. g, acceleration due to gravity.
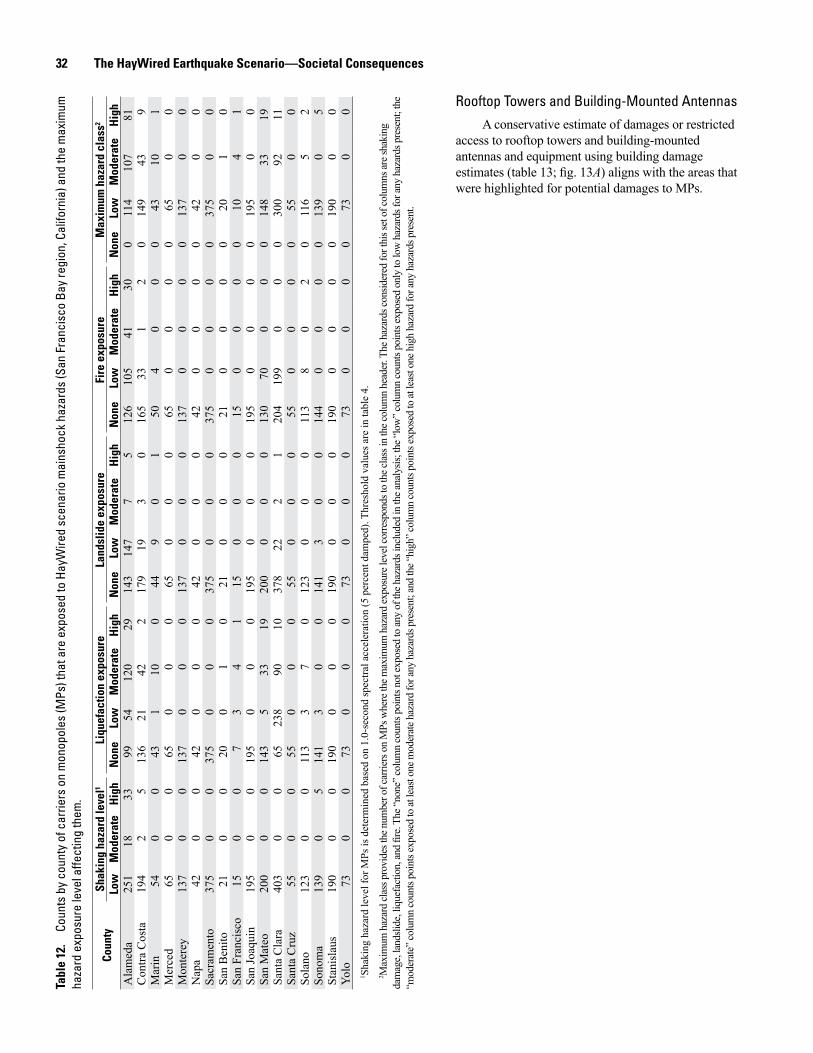
32 The HayWired Earthquake Scenario—Societal ConsequencesTa
ble
12.
Coun
ts b
y co
unty
of c
arrie
rs o
n m
onop
oles
(MPs
) tha
t are
exp
osed
to H
ayW
ired
scen
ario
mai
nsho
ck h
azar
ds (S
an F
ranc
isco
Bay
regi
on, C
alifo
rnia
) and
the
max
imum
ha
zard
exp
osur
e le
vel a
ffect
ing
them
.
Coun
tySh
akin
g ha
zard
leve
l1Li
quef
actio
n ex
posu
reLa
ndsl
ide
expo
sure
Fire
exp
osur
eM
axim
um h
azar
d cl
ass2
Low
Mod
erat
eH
igh
Non
eLo
wM
oder
ate
Hig
hN
one
Low
Mod
erat
eH
igh
Non
eLo
wM
oder
ate
Hig
hN
one
Low
Mod
erat
eH
igh
Ala
med
a25
118
3399
5412
029
143
147
75
126
105
4130
011
410
781
Con
tra C
osta
194
25
136
2142
217
919
30
165
331
20
149
439
Mar
in54
00
431
100
449
01
504
00
043
101
Mer
ced
650
065
00
065
00
065
00
00
650
0M
onte
rey
137
00
137
00
013
70
00
137
00
00
137
00
Nap
a42
00
420
00
420
00
420
00
042
00
Sacr
amen
to37
50
037
50
00
375
00
037
50
00
037
50
0Sa
n B
enito
210
020
01
021
00
021
00
00
201
0Sa
n Fr
anci
sco
150
07
34
115
00
015
00
00
104
1Sa
n Jo
aqui
n19
50
019
50
00
195
00
019
50
00
019
50
0Sa
n M
ateo
200
00
143
533
1920
00
00
130
700
00
148
3319
Sant
a C
lara
403
00
6523
890
1037
822
21
204
199
00
030
092
11Sa
nta
Cru
z55
00
550
00
550
00
550
00
055
00
Sola
no12
30
011
33
70
123
00
011
38
02
011
65
2So
nom
a13
90
514
13
00
141
30
014
40
00
013
90
5St
anis
laus
190
00
190
00
019
00
00
190
00
00
190
00
Yolo
730
073
00
073
00
073
00
00
730
01 S
haki
ng h
azar
d le
vel f
or M
Ps is
det
erm
ined
bas
ed o
n 1.
0-se
cond
spec
tral a
ccel
erat
ion
(5 p
erce
nt d
ampe
d). T
hres
hold
val
ues a
re in
tabl
e 4.
2 Max
imum
haz
ard
clas
s pro
vide
s the
num
ber o
f car
riers
on
MPs
whe
re th
e max
imum
haz
ard
expo
sure
leve
l cor
resp
onds
to th
e cla
ss in
the c
olum
n he
ader
. The
haz
ards
cons
ider
ed fo
r thi
s set
of c
olum
ns ar
e sha
king
da
mag
e, la
ndsli
de, l
ique
fact
ion,
and
fire.
The “
none
” col
umn
coun
ts po
ints
not e
xpos
ed to
any
of th
e haz
ards
incl
uded
in th
e ana
lysis
; the
“low
” col
umn
coun
ts po
ints
expo
sed
only
to lo
w h
azar
ds fo
r any
haz
ards
pre
sent
; the
“m
oder
ate”
colu
mn
coun
ts po
ints
expo
sed
to at
leas
t one
mod
erat
e haz
ard
for a
ny h
azar
ds p
rese
nt; a
nd th
e “hi
gh” c
olum
n co
unts
poin
ts ex
pose
d to
at le
ast o
ne h
igh
haza
rd fo
r any
haz
ards
pre
sent
.
Rooftop Towers and Building-Mounted AntennasA conservative estimate of damages or restricted
access to rooftop towers and building-mounted antennas and equipment using building damage estimates (table 13; fig. 13A) aligns with the areas that were highlighted for potential damages to MPs.

Chapter S. Telecommunications and Information Communication Technology 33
men21-7516_fig13
20 MILES100
20 KILOMETERS100
Hydrology from U.S. Geological Survey National Hydrography Dataset, 2016; Boundary data from the U.S. Census Bureau TIGER data, 2016; Universal Transverse Mercator zone 10 north projection; North American Datum of 1983
38°
37°
37°30’
122°122°30’ 121°30’
38°
37°
37°30’
122°122°30’ 121°30’
38°
"
""
"
"
"
"
"
"
"
"
""
"
"
"
"
"
"
"
"
""
"
"
"
"
"
"
"
"
""
"
"
"
"
"
"
"
_̂ _̂
_̂_̂
Richmond
Alameda
LivermoreHayward
FremontFoster City
Palo Alto
San Jose
Oakland
Richmond
Alameda
LivermoreHayward
FremontFoster City
Palo Alto
San Jose
Oakland
Richmond
Alameda
LivermoreHayward
FremontFoster City
Palo Alto
San Jose
Oakland
Richmond
Alameda
LivermoreHayward
FremontFoster City
Palo Alto
San Jose
Oakland
SONOMA NAPASOLANO
SACRAM
ENTO
SAN
JO
AQ
UIN
CONTRA COSTA
SAN FRANCISCO
SAN MATEO
ALAMEDA
SANTA CLARA
SANTA CRUZ
SANBENITO
MONTEREY
MARIN
SONOMA NAPASOLANO
SACRAM
ENTO
SAN
JO
AQ
UIN
CONTRA COSTA
SAN FRANCISCO
SAN MATEO
ALAMEDA
SANTA CLARA
SANTA CRUZ
SANBENITO
MONTEREY
MARIN
SONOMA NAPASOLANO
SACRAM
ENTO
SAN
JO
AQ
UIN
CONTRA COSTA
SAN FRANCISCO
SAN MATEO
ALAMEDA
SANTA CLARA
SANTA CRUZ
SANBENITO
MONTEREY
MARIN
SONOMA NAPASOLANO
SACRAM
ENTO
SAN
JO
AQ
UIN
CONTRA COSTA
SAN FRANCISCO
SAN MATEO
ALAMEDA
SANTA CLARA
SANTA CRUZ
SANBENITO
MONTEREY
MARIN
Pacific OceanPacific Ocean
Pacific OceanPacific Ocean
Maparea
CALIF.
EXPLANATIONBuilding tag level, in g, using
1.0-second spectral acceleration
Green (less than 0.7g)Yellow (between 0.7g and 1.3g)Red (1.3g and greater)
EXPLANATIONGround-failure probability level, in percent
LandslideLiquefactionNo probabilityLow (less than 5 percent)Moderate (between 5 and 25 percent)High (25 percent and greater)
EXPLANATIONFire density level
Low (less than 0.0085)Moderate (between 0.0085 and 0.023)High (0.023 and greater)
None
EXPLANATIONMaximum hazard level for all hazards—Ground
shaking, ground failure, and fire
Low or none for all hazards presentModerate for at least one hazard presentHigh for at least one hazard present
Figure 13. Maps showing damage and exposure to HayWired scenario mainshock hazards for rooftop towers and building-mounted antennas in the San Francisco Bay region, California. A, Map of potential damage to rooftop towers and building-mounted antennas from shaking (overturning of unanchored equipment also possible in yellow-tagged and red-tagged buildings). B, Map of rooftop tower and building-mounted antenna exposure to ground-failure (liquefaction and landslide) hazards. C, Map of rooftop tower and building-mounted antenna exposure to fire following earthquake hazards (represented by fire density level—the burned-building square footage relative to the developed area containing the fires). D, Map of rooftop towers and building-mounted antennas affected by maximum level of hazard for shaking, ground failure, and fire. White star shows the mainshock epicenter. g, acceleration due to gravity.

34 The HayWired Earthquake Scenario—Societal ConsequencesTa
ble
13.
Coun
ts b
y co
unty
of c
arrie
rs o
n ro
ofto
p to
wer
s an
d bu
ildin
g-m
ount
ed a
nten
nas
that
are
exp
osed
to H
ayW
ired
scen
ario
mai
nsho
ck h
azar
ds (S
an F
ranc
isco
Bay
re
gion
, Cal
iforn
ia) a
nd th
e m
axim
um h
azar
d ex
posu
re le
vel a
ffect
ing
them
.
Coun
tyB
uild
ing
tag
leve
l1Li
quef
actio
n ex
posu
reLa
ndsl
ide
expo
sure
Fire
exp
osur
eM
axim
um h
azar
d cl
ass2
Gre
en ta
gYe
llow
tag
Red
tag
Non
eLo
wM
oder
ate
Hig
hN
one
Low
Mod
erat
eH
igh
Non
eLo
wM
oder
ate
Hig
hN
one
Low
Mod
erat
eH
igh
Ala
med
a44
822
914
312
519
940
888
446
370
40
263
317
181
590
194
383
243
Con
tra C
osta
363
1516
205
6811
83
343
464
125
810
715
140
242
126
26M
arin
920
036
946
189
30
076
150
10
4446
2M
erce
d12
70
012
70
00
127
00
012
70
00
012
70
0M
onte
rey
168
00
168
00
016
80
00
168
00
00
168
00
Nap
a44
00
413
00
440
00
440
00
044
00
Sacr
amen
to52
70
052
70
00
527
00
052
70
00
052
70
0Sa
n B
enito
260
026
00
026
00
026
00
00
260
0Sa
n Fr
anci
sco
268
00
6782
9227
268
00
023
335
00
014
992
27Sa
n Jo
aqui
n25
20
025
20
00
252
00
025
20
00
025
20
0Sa
n M
ateo
473
00
207
4511
310
847
01
02
191
282
00
025
011
311
0Sa
nta
Cla
ra1,
092
20
7455
338
978
1,07
022
11
333
761
00
062
339
279
Sant
a C
ruz
630
063
00
063
00
063
00
00
630
0So
lano
177
00
150
1411
217
61
00
164
110
20
163
104
Sono
ma
183
47
187
70
018
52
61
192
20
00
182
48
Stan
isla
us16
10
016
10
00
161
00
016
10
00
016
10
0Yo
lo85
00
850
00
850
00
850
00
085
00
1 Bui
ldin
g ta
g le
vel f
or ro
ofto
p to
wer
s and
bui
ldin
g-m
ount
ed a
nten
nas i
s det
erm
ined
bas
ed o
n 1.
0-se
cond
spec
tral a
ccel
erat
ion
(5 p
erce
nt d
ampe
d). T
hres
hold
val
ues a
re in
tabl
e 2.
2 Max
imum
haz
ard
clas
s pro
vide
s the
num
ber o
f car
riers
on
roof
top
ante
nnas
and
build
ing-
mou
nted
ante
nnas
whe
re th
e max
imum
haz
ard
expo
sure
leve
l cor
resp
onds
to th
e cla
ss in
the c
olum
n he
ader
. The
haz
ards
cons
id-
ered
for t
his s
et o
f col
umns
are s
haki
ng d
amag
e, la
ndsli
de, l
ique
fact
ion,
and
fire.
The “
none
” col
umn
coun
ts po
ints
not e
xpos
ed to
any
of th
e haz
ards
incl
uded
in th
e ana
lysis
; the
“low
” col
umn
coun
ts po
ints
expo
sed
only
to
low
haz
ards
for a
ny h
azar
ds p
rese
nt; t
he “m
oder
ate”
colu
mn
coun
ts po
ints
expo
sed
to at
leas
t one
mod
erat
e haz
ard
for a
ny h
azar
ds p
rese
nt; a
nd th
e “hi
gh” c
olum
n co
unts
poin
ts ex
pose
d to
at le
ast o
ne h
igh
haza
rd fo
r any
ha
zard
s pre
sent
.
Summary of Cellular Site Damage AssessmentAll potential vulnerabilities for cellular sites
are combined in figure 14. The sites are mapped for the maximum assessment from shaking, ground movement (liquefaction and landslide), and fire. It shows concentrations of potential damages from shaking near the Hayward Fault and the Livermore basin, from liquefaction around San Francisco Bay margins and along streams, and from fire spread in Hayward, northern Richmond, and areas in Napa and Solano Counties. There are relatively few exposures of cellular sites to moderate or high landslide probabilities.
Wired Channels
Fiber Optic LinesFiber optic lines are mapped against the HayWired
scenario fault rupture, liquefaction and landslide probabilities, and fire density in figure 15. Jones and others (this volume) identify 227 incidences of fiber optic lines crossing the Hayward Fault that could be affected by slip and 123 of those incidences are potentially exposed to coseismic slip at the time of the HayWired mainshock. The lengths of fiber optic line exposed to the other hazards are: 1,324 kilometers (km) in areas with liquefaction probability of 25 percent or greater, 830 km in areas with landslide probability of 25 percent or greater, and 663 km in the most densely burned areas. In addition, more than three-quarters of the medium-high or high potential impact bridges appear to carry fiber optic lines—that is, 37 of 51 high potential impact bridges and 50 of 60 medium-high potential impact bridges. Approximately 15 percent of the bridges in the San Francisco Bay region are estimated to carry fiber optic lines—meaning that a disproportionate number of potentially damaged bridges are carrying fiber optic lines.
Tables 14 and 15 show the hazard exposure for interoffice and long-haul fiber optic lines across counties. Notably, most of the landslide exposure involves interoffice fiber optic lines and occurs in Alameda and Contra Costa Counties in particular; in contrast, long-haul fiber optic lines are more exposed to high liquefaction probability and (or) fire density in these counties, and are relatively less exposed to landslides in the region as a whole.
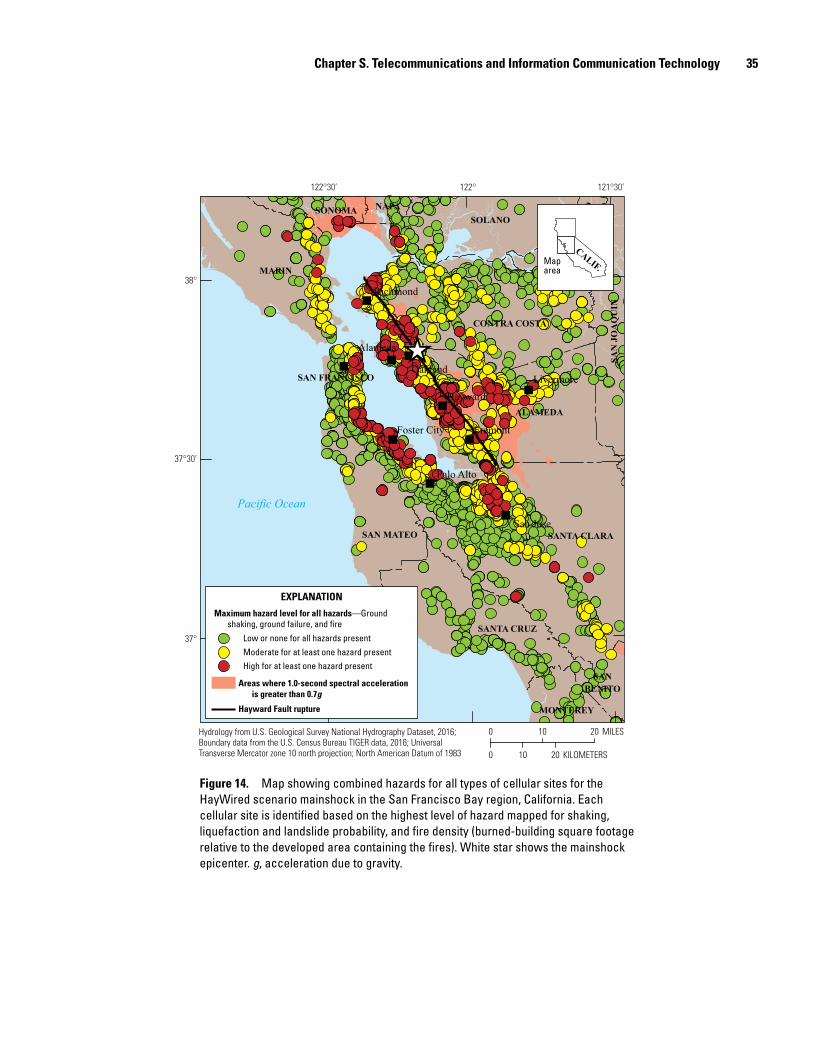
Chapter S. Telecommunications and Information Communication Technology 35
men21-7516_fig14
20 MILES100
20 KILOMETERS100
37°
37°30’
121°30’122°122°30’
38°
"
""
"
"
"
"
"
"
"
_̂
Richmond
Alameda
LivermoreHayward
FremontFoster City
Palo Alto
San Jose
Oakland
SONOMA NAPASOLANO
SACRAM
ENTO
SAN
JO
AQ
UIN
CONTRA COSTA
SAN FRANCISCO
SAN MATEO
ALAMEDA
SANTA CLARA
SANTA CRUZ
SANBENITO
MONTEREY
MARIN
Pacific Ocean
Maparea
CALIF.
EXPLANATION
Maximum hazard level for all hazards—Ground shaking, ground failure, and fire
Low or none for all hazards presentModerate for at least one hazard presentHigh for at least one hazard present
Areas where 1.0-second spectral acceleration is greater than 0.7g
Hayward Fault rupture
Hydrology from U.S. Geological Survey National Hydrography Dataset, 2016; Boundary data from the U.S. Census Bureau TIGER data, 2016; Universal Transverse Mercator zone 10 north projection; North American Datum of 1983
Figure 14. Map showing combined hazards for all types of cellular sites for the HayWired scenario mainshock in the San Francisco Bay region, California. Each cellular site is identified based on the highest level of hazard mapped for shaking, liquefaction and landslide probability, and fire density (burned-building square footage relative to the developed area containing the fires). White star shows the mainshock epicenter. g, acceleration due to gravity.
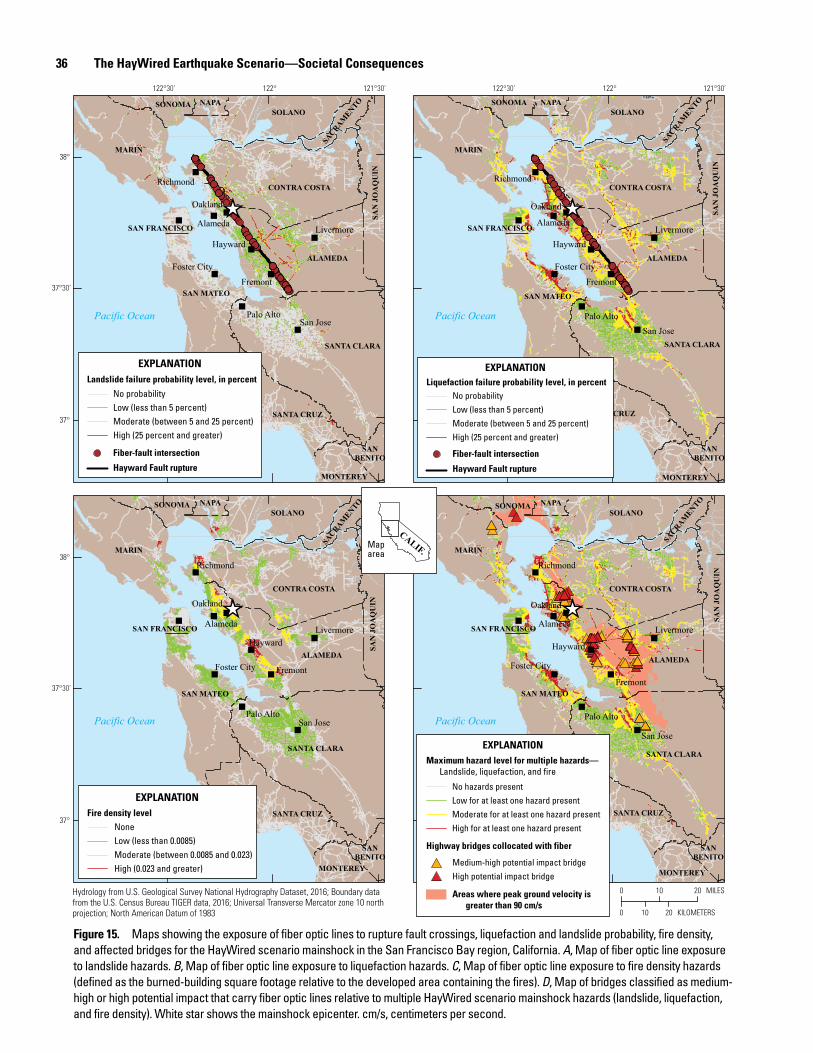
36 The HayWired Earthquake Scenario—Societal Consequences
men21-7516_fig015
20 MILES100
20 KILOMETERS100
Hydrology from U.S. Geological Survey National Hydrography Dataset, 2016; Boundary data from the U.S. Census Bureau TIGER data, 2016; Universal Transverse Mercator zone 10 north projection; North American Datum of 1983
38°
37°
37°30’
122°122°30’ 121°30’
38°
37°
37°30’
122°122°30’ 121°30’
38°
#####
######
######
#
#
#
#
#
####
##
####
#
##
#
##
##
########
###
####
###
### #
###
#
######## ######
#######"
""
"
"
"
"
"
"
"
"
""
"
"
"
"
"
"
"
"
""
"
"
"
"
"
"
"
"
""
"
"
"
"
"
"
"
_̂ _̂
_̂_̂
Richmond
AlamedaLivermore
Hayward
FremontFoster City
Palo AltoSan Jose
Oakland
Richmond
AlamedaLivermore
Hayward
Fremont
Foster City
Palo AltoSan Jose
Oakland
Richmond
AlamedaLivermore
Hayward
Fremont
Foster City
Palo Alto
San Jose
Oakland
Richmond
AlamedaLivermore
Hayward
Fremont
Foster City
Palo AltoSan Jose
Oakland
SONOMA NAPASOLANO
SACRAM
ENTO
SAN
JO
AQ
UIN
CONTRA COSTA
SAN FRANCISCO
SAN MATEO
ALAMEDA
SANTA CLARA
SANTA CRUZ
SANBENITO
MONTEREY
MARIN
SONOMA NAPASOLANO
SACRAM
ENTO
SAN
JO
AQ
UIN
CONTRA COSTA
SAN FRANCISCO
SAN MATEO
ALAMEDA
SANTA CLARA
SANTA CRUZ
SANBENITO
MONTEREY
MARIN
SONOMA NAPASOLANO
SACRAM
ENTO
SAN
JO
AQ
UIN
CONTRA COSTA
SAN FRANCISCO
SAN MATEO
ALAMEDA
SANTA CLARA
SANTA CRUZ
SANBENITO
MONTEREY
MARIN
SONOMA NAPASOLANO
SACRAM
ENTO
SAN
JO
AQ
UIN
CONTRA COSTA
SAN FRANCISCO
SAN MATEO
ALAMEDA
SANTA CLARA
SANTA CRUZ
SANBENITO
MONTEREY
MARIN
Pacific OceanPacific Ocean
Pacific OceanPacific Ocean
Maparea
CALIF.
EXPLANATIONLandslide failure probability level, in percent
Low (less than 5 percent)Moderate (between 5 and 25 percent)High (25 percent and greater)
No probability
Hayward Fault rupture
Fiber-fault intersection
EXPLANATIONLiquefaction failure probability level, in percent
Low (less than 5 percent)Moderate (between 5 and 25 percent)High (25 percent and greater)
No probability
Hayward Fault rupture
Fiber-fault intersection
EXPLANATIONFire density level
Low (less than 0.0085)Moderate (between 0.0085 and 0.023)High (0.023 and greater)
None
##
EXPLANATIONMaximum hazard level for multiple hazards—
Landslide, liquefaction, and fire
Low for at least one hazard presentModerate for at least one hazard presentHigh for at least one hazard present
No hazards present
Highway bridges collocated with fiber
Medium-high potential impact bridgeHigh potential impact bridge
Areas where peak ground velocity is greater than 90 cm/s
Figure 15. Maps showing the exposure of fiber optic lines to rupture fault crossings, liquefaction and landslide probability, fire density, and affected bridges for the HayWired scenario mainshock in the San Francisco Bay region, California. A, Map of fiber optic line exposure to landslide hazards. B, Map of fiber optic line exposure to liquefaction hazards. C, Map of fiber optic line exposure to fire density hazards (defined as the burned-building square footage relative to the developed area containing the fires). D, Map of bridges classified as medium-high or high potential impact that carry fiber optic lines relative to multiple HayWired scenario mainshock hazards (landslide, liquefaction, and fire density). White star shows the mainshock epicenter. cm/s, centimeters per second.
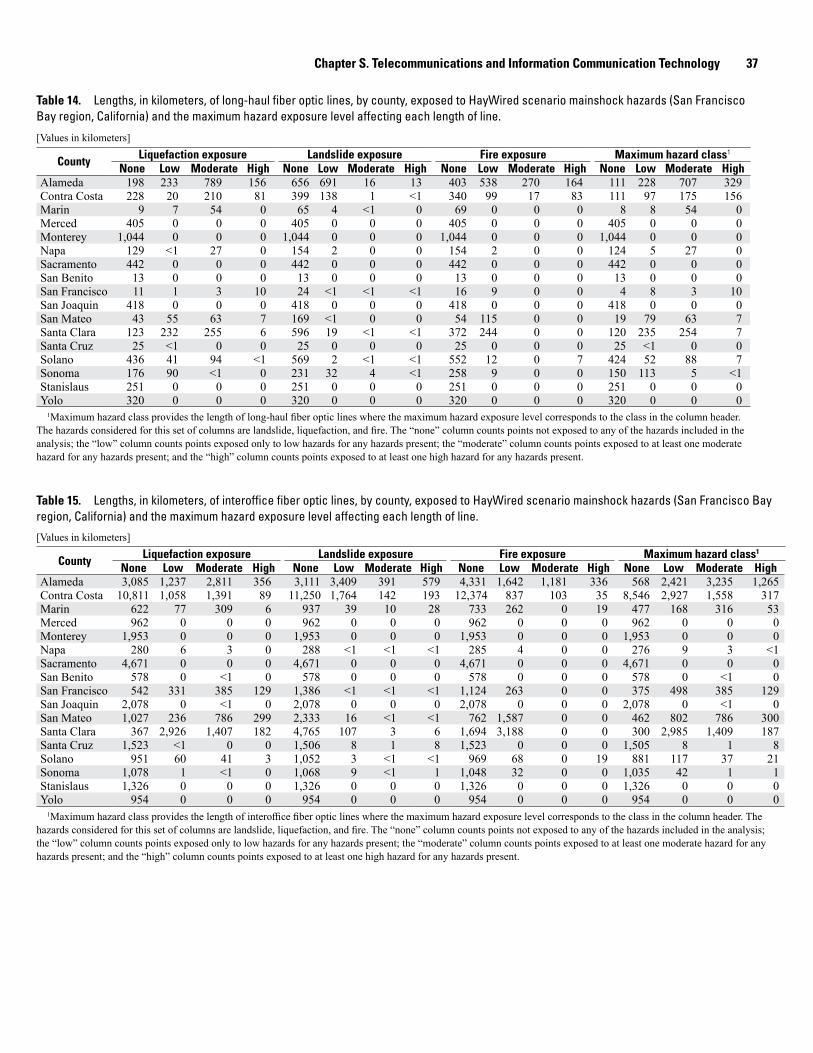
Chapter S. Telecommunications and Information Communication Technology 37
Table 14. Lengths, in kilometers, of long-haul fiber optic lines, by county, exposed to HayWired scenario mainshock hazards (San Francisco Bay region, California) and the maximum hazard exposure level affecting each length of line.
[Values in kilometers]
County Liquefaction exposure Landslide exposure Fire exposure Maximum hazard class1
None Low Moderate High None Low Moderate High None Low Moderate High None Low Moderate HighAlameda 198 233 789 156 656 691 16 13 403 538 270 164 111 228 707 329Contra Costa 228 20 210 81 399 138 1 <1 340 99 17 83 111 97 175 156Marin 9 7 54 0 65 4 <1 0 69 0 0 0 8 8 54 0Merced 405 0 0 0 405 0 0 0 405 0 0 0 405 0 0 0Monterey 1,044 0 0 0 1,044 0 0 0 1,044 0 0 0 1,044 0 0 0Napa 129 <1 27 0 154 2 0 0 154 2 0 0 124 5 27 0Sacramento 442 0 0 0 442 0 0 0 442 0 0 0 442 0 0 0San Benito 13 0 0 0 13 0 0 0 13 0 0 0 13 0 0 0San Francisco 11 1 3 10 24 <1 <1 <1 16 9 0 0 4 8 3 10San Joaquin 418 0 0 0 418 0 0 0 418 0 0 0 418 0 0 0San Mateo 43 55 63 7 169 <1 0 0 54 115 0 0 19 79 63 7Santa Clara 123 232 255 6 596 19 <1 <1 372 244 0 0 120 235 254 7Santa Cruz 25 <1 0 0 25 0 0 0 25 0 0 0 25 <1 0 0Solano 436 41 94 <1 569 2 <1 <1 552 12 0 7 424 52 88 7Sonoma 176 90 <1 0 231 32 4 <1 258 9 0 0 150 113 5 <1Stanislaus 251 0 0 0 251 0 0 0 251 0 0 0 251 0 0 0Yolo 320 0 0 0 320 0 0 0 320 0 0 0 320 0 0 0
1Maximum hazard class provides the length of long-haul fiber optic lines where the maximum hazard exposure level corresponds to the class in the column header. The hazards considered for this set of columns are landslide, liquefaction, and fire. The “none” column counts points not exposed to any of the hazards included in the analysis; the “low” column counts points exposed only to low hazards for any hazards present; the “moderate” column counts points exposed to at least one moderate hazard for any hazards present; and the “high” column counts points exposed to at least one high hazard for any hazards present.
Table 15. Lengths, in kilometers, of interoffice fiber optic lines, by county, exposed to HayWired scenario mainshock hazards (San Francisco Bay region, California) and the maximum hazard exposure level affecting each length of line.
[Values in kilometers]
County Liquefaction exposure Landslide exposure Fire exposure Maximum hazard class1
None Low Moderate High None Low Moderate High None Low Moderate High None Low Moderate HighAlameda 3,085 1,237 2,811 356 3,111 3,409 391 579 4,331 1,642 1,181 336 568 2,421 3,235 1,265Contra Costa 10,811 1,058 1,391 89 11,250 1,764 142 193 12,374 837 103 35 8,546 2,927 1,558 317Marin 622 77 309 6 937 39 10 28 733 262 0 19 477 168 316 53Merced 962 0 0 0 962 0 0 0 962 0 0 0 962 0 0 0Monterey 1,953 0 0 0 1,953 0 0 0 1,953 0 0 0 1,953 0 0 0Napa 280 6 3 0 288 <1 <1 <1 285 4 0 0 276 9 3 <1Sacramento 4,671 0 0 0 4,671 0 0 0 4,671 0 0 0 4,671 0 0 0San Benito 578 0 <1 0 578 0 0 0 578 0 0 0 578 0 <1 0San Francisco 542 331 385 129 1,386 <1 <1 <1 1,124 263 0 0 375 498 385 129San Joaquin 2,078 0 <1 0 2,078 0 0 0 2,078 0 0 0 2,078 0 <1 0San Mateo 1,027 236 786 299 2,333 16 <1 <1 762 1,587 0 0 462 802 786 300Santa Clara 367 2,926 1,407 182 4,765 107 3 6 1,694 3,188 0 0 300 2,985 1,409 187Santa Cruz 1,523 <1 0 0 1,506 8 1 8 1,523 0 0 0 1,505 8 1 8Solano 951 60 41 3 1,052 3 <1 <1 969 68 0 19 881 117 37 21Sonoma 1,078 1 <1 0 1,068 9 <1 1 1,048 32 0 0 1,035 42 1 1Stanislaus 1,326 0 0 0 1,326 0 0 0 1,326 0 0 0 1,326 0 0 0Yolo 954 0 0 0 954 0 0 0 954 0 0 0 954 0 0 0
1Maximum hazard class provides the length of interoffice fiber optic lines where the maximum hazard exposure level corresponds to the class in the column header. The hazards considered for this set of columns are landslide, liquefaction, and fire. The “none” column counts points not exposed to any of the hazards included in the analysis; the “low” column counts points exposed only to low hazards for any hazards present; the “moderate” column counts points exposed to at least one moderate hazard for any hazards present; and the “high” column counts points exposed to at least one high hazard for any hazards present.
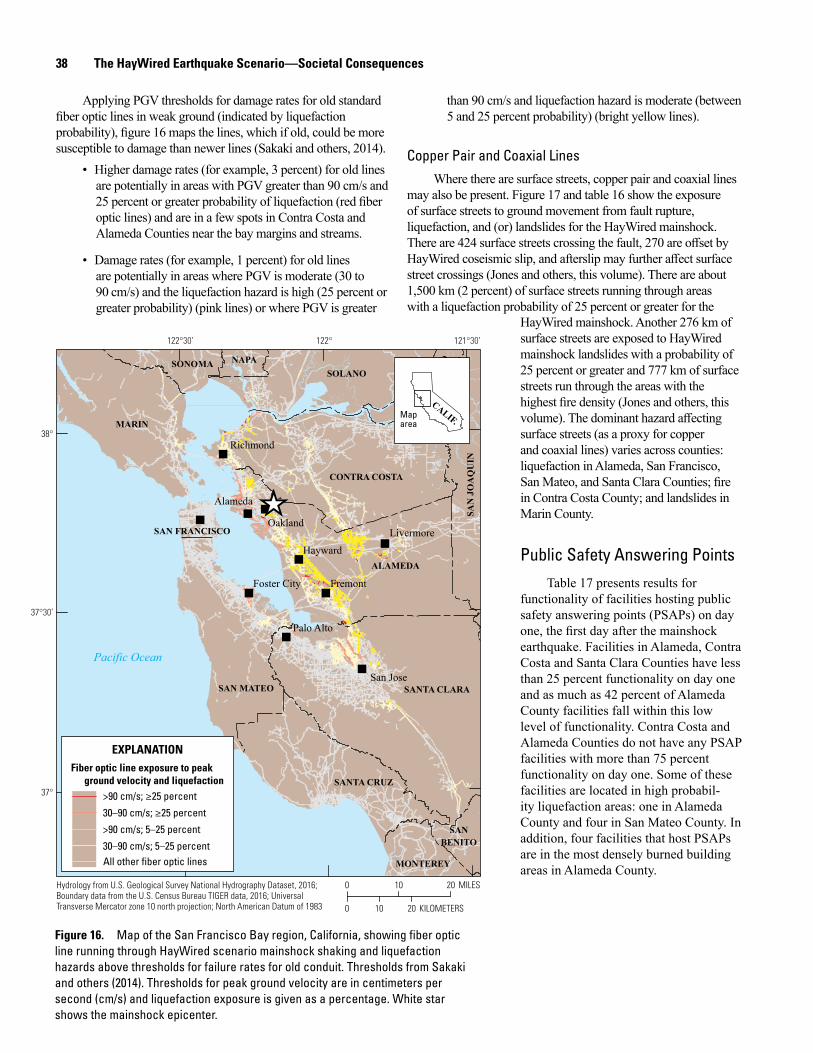
38 The HayWired Earthquake Scenario—Societal Consequences
Applying PGV thresholds for damage rates for old standard fiber optic lines in weak ground (indicated by liquefaction probability), figure 16 maps the lines, which if old, could be more susceptible to damage than newer lines (Sakaki and others, 2014).
• Higher damage rates (for example, 3 percent) for old lines are potentially in areas with PGV greater than 90 cm/s and 25 percent or greater probability of liquefaction (red fiber optic lines) and are in a few spots in Contra Costa and Alameda Counties near the bay margins and streams.
• Damage rates (for example, 1 percent) for old lines are potentially in areas where PGV is moderate (30 to 90 cm/s) and the liquefaction hazard is high (25 percent or greater probability) (pink lines) or where PGV is greater
men21-7516_fig16
20 MILES100
20 KILOMETERS100
Hydrology from U.S. Geological Survey National Hydrography Dataset, 2016; Boundary data from the U.S. Census Bureau TIGER data, 2016; Universal Transverse Mercator zone 10 north projection; North American Datum of 1983
37°
37°30’
121°30’122°122°30’
38°
"
""
"
"
"
"
"
"
"
_̂
Richmond
Alameda
LivermoreHayward
FremontFoster City
Palo Alto
San Jose
Oakland
SONOMA NAPASOLANO
SACRAM
ENTO
SAN
JO
AQ
UIN
CONTRA COSTA
SAN FRANCISCO
SAN MATEO
ALAMEDA
SANTA CLARA
SANTA CRUZ
SANBENITO
MONTEREY
MARIN
Pacific Ocean
Maparea
CALIF.
EXPLANATIONFiber optic line exposure to peak
ground velocity and liquefaction>90 cm/s; ≥25 percent
30–90 cm/s; ≥25 percent
>90 cm/s; 5–25 percent
30–90 cm/s; 5–25 percentAll other fiber optic lines
Figure 16. Map of the San Francisco Bay region, California, showing fiber optic line running through HayWired scenario mainshock shaking and liquefaction hazards above thresholds for failure rates for old conduit. Thresholds from Sakaki and others (2014). Thresholds for peak ground velocity are in centimeters per second (cm/s) and liquefaction exposure is given as a percentage. White star shows the mainshock epicenter.
than 90 cm/s and liquefaction hazard is moderate (between 5 and 25 percent probability) (bright yellow lines).
Copper Pair and Coaxial LinesWhere there are surface streets, copper pair and coaxial lines
may also be present. Figure 17 and table 16 show the exposure of surface streets to ground movement from fault rupture, liquefaction, and (or) landslides for the HayWired mainshock. There are 424 surface streets crossing the fault, 270 are offset by HayWired coseismic slip, and afterslip may further affect surface street crossings (Jones and others, this volume). There are about 1,500 km (2 percent) of surface streets running through areas with a liquefaction probability of 25 percent or greater for the
HayWired mainshock. Another 276 km of surface streets are exposed to HayWired mainshock landslides with a probability of 25 percent or greater and 777 km of surface streets run through the areas with the highest fire density (Jones and others, this volume). The dominant hazard affecting surface streets (as a proxy for copper and coaxial lines) varies across counties: liquefaction in Alameda, San Francisco, San Mateo, and Santa Clara Counties; fire in Contra Costa County; and landslides in Marin County.
Public Safety Answering PointsTable 17 presents results for
functionality of facilities hosting public safety answering points (PSAPs) on day one, the first day after the mainshock earthquake. Facilities in Alameda, Contra Costa and Santa Clara Counties have less than 25 percent functionality on day one and as much as 42 percent of Alameda County facilities fall within this low level of functionality. Contra Costa and Alameda Counties do not have any PSAP facilities with more than 75 percent functionality on day one. Some of these facilities are located in high probabil-ity liquefaction areas: one in Alameda County and four in San Mateo County. In addition, four facilities that host PSAPs are in the most densely burned building areas in Alameda County.
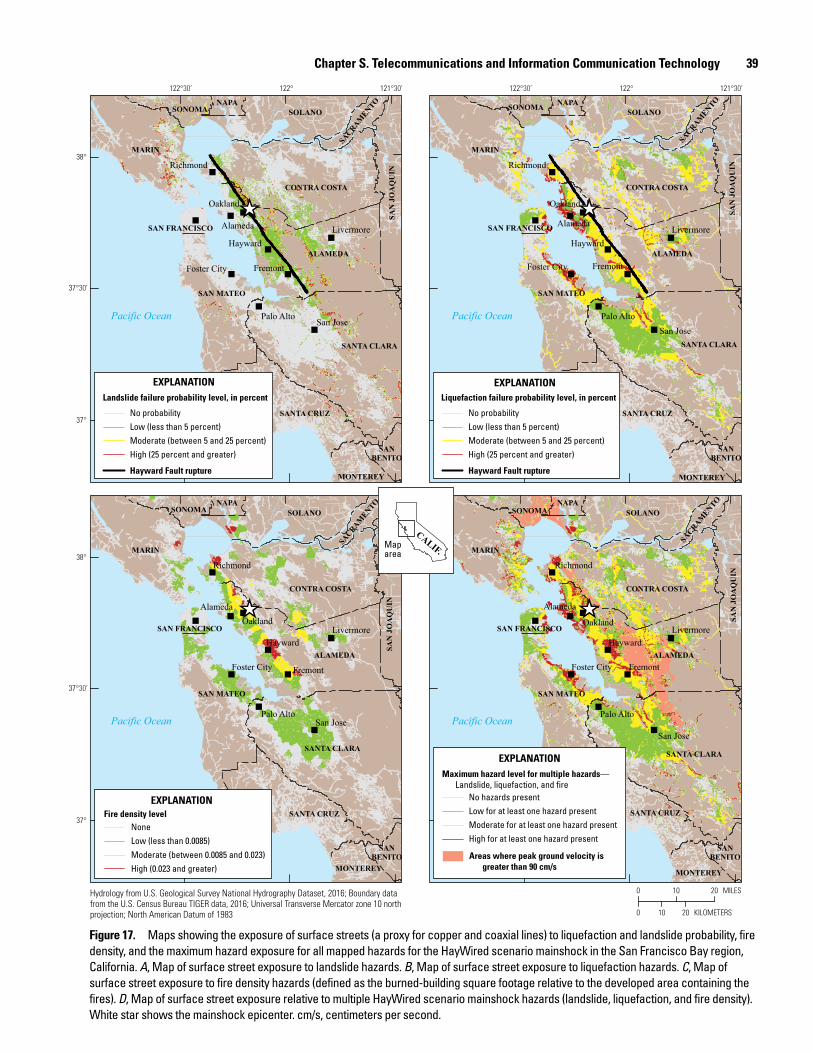
Chapter S. Telecommunications and Information Communication Technology 39
men21-7516_fig17
20 MILES100
20 KILOMETERS100
Hydrology from U.S. Geological Survey National Hydrography Dataset, 2016; Boundary data from the U.S. Census Bureau TIGER data, 2016; Universal Transverse Mercator zone 10 north projection; North American Datum of 1983
38°
37°
37°30’
122°122°30’ 121°30’
38°
37°
37°30’
122°122°30’ 121°30’
38°
"
""
"
"
"
"
"
"
"
"
""
"
"
"
"
"
"
"
"
""
"
"
"
"
"
"
"
"
""
"
"
"
"
"
"
"
_̂ _̂
_̂_̂
Richmond
Alameda
LivermoreHayward
FremontFoster City
Palo AltoSan Jose
Oakland
Richmond
Alameda LivermoreHayward
FremontFoster City
Palo AltoSan Jose
Oakland
Richmond
Alameda
LivermoreHayward
FremontFoster City
Palo Alto
San Jose
Oakland
Richmond
AlamedaLivermore
Hayward
FremontFoster City
Palo AltoSan Jose
Oakland
SONOMANAPA
SOLANO
SACRAM
ENTO
SAN
JO
AQ
UIN
CONTRA COSTA
SAN FRANCISCO
SAN MATEO
ALAMEDA
SANTA CLARA
SANTA CRUZ
SANBENITO
MONTEREY
MARIN
SONOMANAPA
SOLANO
SACRAM
ENTO
SAN
JO
AQ
UIN
CONTRA COSTA
SAN FRANCISCO
SAN MATEO
ALAMEDA
SANTA CLARA
SANTA CRUZ
SANBENITO
MONTEREY
MARIN
SONOMA NAPASOLANO
SACRAM
ENTO
SAN
JO
AQ
UIN
CONTRA COSTA
SAN FRANCISCO
SAN MATEO
ALAMEDA
SANTA CLARA
SANTA CRUZ
SANBENITO
MONTEREY
MARIN
SONOMANAPA
SOLANO
SACRAM
ENTO
SAN
JO
AQ
UIN
CONTRA COSTA
SAN FRANCISCO
SAN MATEO
ALAMEDA
SANTA CLARA
SANTA CRUZ
SANBENITO
MONTEREY
MARIN
Pacific OceanPacific Ocean
Pacific OceanPacific Ocean
Maparea
CALIF.
EXPLANATIONLandslide failure probability level, in percent
Low (less than 5 percent)Moderate (between 5 and 25 percent)High (25 percent and greater)
No probability
Hayward Fault rupture
EXPLANATIONLiquefaction failure probability level, in percent
Low (less than 5 percent)Moderate (between 5 and 25 percent)High (25 percent and greater)
No probability
Hayward Fault rupture
EXPLANATIONFire density level
Low (less than 0.0085)Moderate (between 0.0085 and 0.023)High (0.023 and greater)
None
EXPLANATIONMaximum hazard level for multiple hazards—
Landslide, liquefaction, and fire
Low for at least one hazard presentModerate for at least one hazard presentHigh for at least one hazard present
No hazards present
Areas where peak ground velocity is greater than 90 cm/s
Figure 17. Maps showing the exposure of surface streets (a proxy for copper and coaxial lines) to liquefaction and landslide probability, fire density, and the maximum hazard exposure for all mapped hazards for the HayWired scenario mainshock in the San Francisco Bay region, California. A, Map of surface street exposure to landslide hazards. B, Map of surface street exposure to liquefaction hazards. C, Map of surface street exposure to fire density hazards (defined as the burned-building square footage relative to the developed area containing the fires). D, Map of surface street exposure relative to multiple HayWired scenario mainshock hazards (landslide, liquefaction, and fire density). White star shows the mainshock epicenter. cm/s, centimeters per second.
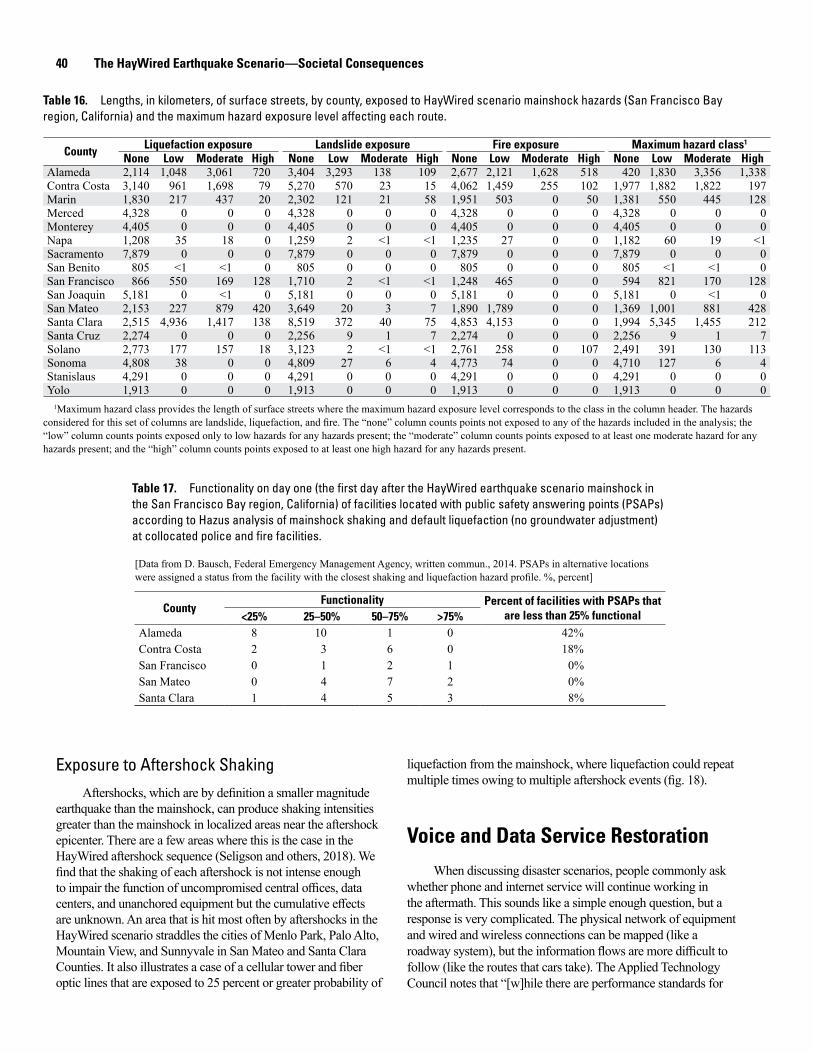
40 The HayWired Earthquake Scenario—Societal Consequences
Table 16. Lengths, in kilometers, of surface streets, by county, exposed to HayWired scenario mainshock hazards (San Francisco Bay region, California) and the maximum hazard exposure level affecting each route.
County Liquefaction exposure Landslide exposure Fire exposure Maximum hazard class1
None Low Moderate High None Low Moderate High None Low Moderate High None Low Moderate HighAlameda 2,114 1,048 3,061 720 3,404 3,293 138 109 2,677 2,121 1,628 518 420 1,830 3,356 1,338Contra Costa 3,140 961 1,698 79 5,270 570 23 15 4,062 1,459 255 102 1,977 1,882 1,822 197Marin 1,830 217 437 20 2,302 121 21 58 1,951 503 0 50 1,381 550 445 128Merced 4,328 0 0 0 4,328 0 0 0 4,328 0 0 0 4,328 0 0 0Monterey 4,405 0 0 0 4,405 0 0 0 4,405 0 0 0 4,405 0 0 0Napa 1,208 35 18 0 1,259 2 <1 <1 1,235 27 0 0 1,182 60 19 <1Sacramento 7,879 0 0 0 7,879 0 0 0 7,879 0 0 0 7,879 0 0 0San Benito 805 <1 <1 0 805 0 0 0 805 0 0 0 805 <1 <1 0San Francisco 866 550 169 128 1,710 2 <1 <1 1,248 465 0 0 594 821 170 128San Joaquin 5,181 0 <1 0 5,181 0 0 0 5,181 0 0 0 5,181 0 <1 0San Mateo 2,153 227 879 420 3,649 20 3 7 1,890 1,789 0 0 1,369 1,001 881 428Santa Clara 2,515 4,936 1,417 138 8,519 372 40 75 4,853 4,153 0 0 1,994 5,345 1,455 212Santa Cruz 2,274 0 0 0 2,256 9 1 7 2,274 0 0 0 2,256 9 1 7Solano 2,773 177 157 18 3,123 2 <1 <1 2,761 258 0 107 2,491 391 130 113Sonoma 4,808 38 0 0 4,809 27 6 4 4,773 74 0 0 4,710 127 6 4Stanislaus 4,291 0 0 0 4,291 0 0 0 4,291 0 0 0 4,291 0 0 0Yolo 1,913 0 0 0 1,913 0 0 0 1,913 0 0 0 1,913 0 0 0
1Maximum hazard class provides the length of surface streets where the maximum hazard exposure level corresponds to the class in the column header. The hazards considered for this set of columns are landslide, liquefaction, and fire. The “none” column counts points not exposed to any of the hazards included in the analysis; the “low” column counts points exposed only to low hazards for any hazards present; the “moderate” column counts points exposed to at least one moderate hazard for any hazards present; and the “high” column counts points exposed to at least one high hazard for any hazards present.
Table 17. Functionality on day one (the first day after the HayWired earthquake scenario mainshock in the San Francisco Bay region, California) of facilities located with public safety answering points (PSAPs) according to Hazus analysis of mainshock shaking and default liquefaction (no groundwater adjustment) at collocated police and fire facilities.
[Data from D. Bausch, Federal Emergency Management Agency, written commun., 2014. PSAPs in alternative locations were assigned a status from the facility with the closest shaking and liquefaction hazard profile. %, percent]
CountyFunctionality Percent of facilities with PSAPs that
are less than 25% functional<25% 25–50% 50–75% >75%Alameda 8 10 1 0 42%Contra Costa 2 3 6 0 18%San Francisco 0 1 2 1 0%San Mateo 0 4 7 2 0%Santa Clara 1 4 5 3 8%
Exposure to Aftershock ShakingAftershocks, which are by definition a smaller magnitude
earthquake than the mainshock, can produce shaking intensities greater than the mainshock in localized areas near the aftershock epicenter. There are a few areas where this is the case in the HayWired aftershock sequence (Seligson and others, 2018). We find that the shaking of each aftershock is not intense enough to impair the function of uncompromised central offices, data centers, and unanchored equipment but the cumulative effects are unknown. An area that is hit most often by aftershocks in the HayWired scenario straddles the cities of Menlo Park, Palo Alto, Mountain View, and Sunnyvale in San Mateo and Santa Clara Counties. It also illustrates a case of a cellular tower and fiber optic lines that are exposed to 25 percent or greater probability of
liquefaction from the mainshock, where liquefaction could repeat multiple times owing to multiple aftershock events (fig. 18).
Voice and Data Service RestorationWhen discussing disaster scenarios, people commonly ask
whether phone and internet service will continue working in the aftermath. This sounds like a simple enough question, but a response is very complicated. The physical network of equipment and wired and wireless connections can be mapped (like a roadway system), but the information flows are more difficult to follow (like the routes that cars take). The Applied Technology Council notes that “[w]hile there are performance standards for
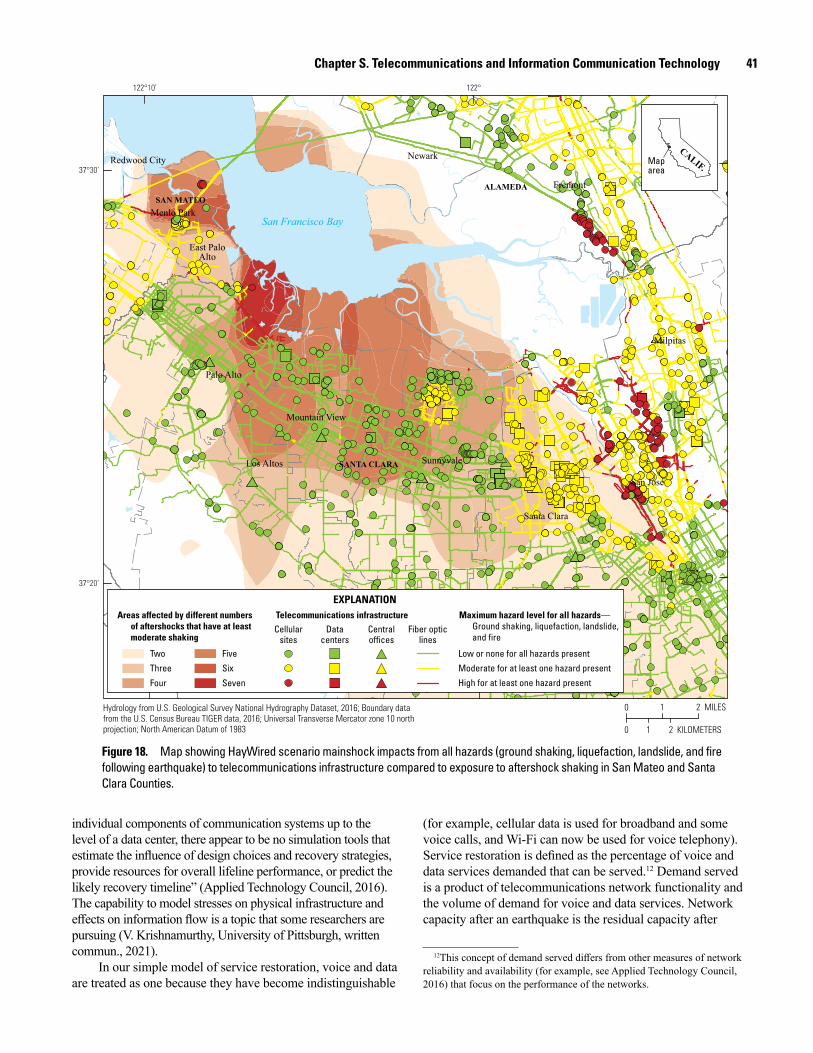
Chapter S. Telecommunications and Information Communication Technology 41
men21-7516_fig18
SAN MATEO
SANTA CLARA
ALAMEDA
Campbell
Cupertino
Saratoga
Redwood City
Menlo Park
East PaloAlto
Palo Alto
Los Altos
Mountain View
Sunnyvale
Santa Clara
San Jose
Milpitas
Fremont
Newark
122°122°10’
37°30’
37°20’
San Francisco Bay
2 MILES0 1
2 KILOMETERS0 1
Maparea
CALIF.
EXPLANATIONTelecommunications infrastructure
Low or none for all hazards present
Moderate for at least one hazard present
High for at least one hazard present
Maximum hazard level for all hazards—Ground shaking, liquefaction, landslide, and fire
Cellularsites
Datacenters
Centraloffices
Fiber opticlines
Areas affected by different numbers of aftershocks that have at least moderate shaking
Two
Three
Four
Five
Six
Seven
Hydrology from U.S. Geological Survey National Hydrography Dataset, 2016; Boundary data from the U.S. Census Bureau TIGER data, 2016; Universal Transverse Mercator zone 10 north projection; North American Datum of 1983
Figure 18. Map showing HayWired scenario mainshock impacts from all hazards (ground shaking, liquefaction, landslide, and fire following earthquake) to telecommunications infrastructure compared to exposure to aftershock shaking in San Mateo and Santa Clara Counties.
individual components of communication systems up to the level of a data center, there appear to be no simulation tools that estimate the influence of design choices and recovery strategies, provide resources for overall lifeline performance, or predict the likely recovery timeline” (Applied Technology Council, 2016). The capability to model stresses on physical infrastructure and effects on information flow is a topic that some researchers are pursuing (V. Krishnamurthy, University of Pittsburgh, written commun., 2021).
In our simple model of service restoration, voice and data are treated as one because they have become indistinguishable
(for example, cellular data is used for broadband and some voice calls, and Wi-Fi can now be used for voice telephony). Service restoration is defined as the percentage of voice and data services demanded that can be served.12 Demand served is a product of telecommunications network functionality and the volume of demand for voice and data services. Network capacity after an earthquake is the residual capacity after
12This concept of demand served differs from other measures of network reliability and availability (for example, see Applied Technology Council, 2016) that focus on the performance of the networks.
42 The HayWired Earthquake Scenario—Societal Consequences
damage to infrastructure. Network functionality may be further compromised by power outages. Conversely, network functionality may be augmented by resilience measures. For example, decoupling dependence of equipment on electric power by using backup power options increases uptime and reestablishing network capacity can be hastened by truck deliveries of portable equipment, including gensets, cells on wheels (COWs), cells on light trucks (COLTs), and microwave links. On the other hand, demand surge from increased communication and information seeking after a disaster congests and degrades network performance such that managing user behavior could improve the demand served.
We proceed by first compiling available information about landline, mobile phone, and internet network functionalities and service restoration times after recent disasters. Next, for the HayWired scenario, we analyze a base case of demand served over time by county that incorporates
• physical damage (informed by infrastructure hazardexposure and damage from the previous section),
• demand surge (informed by available data from priordisasters), and
• complete dependence on electric power restoration(described in appendix 3 of Jones and others, this volume).
Next, we sequentially add the effects of • permanent backup battery and generator power sources,
• capabilities for trucks to deliver portable equipment (at thesame rate as truck arrival after Hurricane Sandy), and
• managing user behavior to reduce congestion.These cases illustrate the effects of various resilience measures on demand served and are used in an analysis of macroeconomic impacts of voice and data service disruptions (Sue Wing and others, this volume).
Voice and Data Service Restoration After Disasters
Reports on recent international earthquakes and U.S. hurricanes provide reference points for phone and internet service restoration.
Service Restoration after EarthquakesAfter recent earthquakes, the bulk of voice and data
services have been reported as restored to normal on the order of days to weeks. There are some discrepancies among reported infrastructure restoration, “back to normal” services, and user experience with phone and internet services. For example, services may be said to have returned to normal, but not necessarily to original levels of functionality (if people left the area) or consistent with users’ experiences.
• After the 2010 Maule earthquake in Chile,communications were reported as returned to normal
within 7 days (Tang and others, 2011), but data collected by Krishnamurthy and others (2016) convey that after one week:
• Landline service was about 80 percent and mobile service was about 50 percent restored in the Biobío region.
• Landline service was about 95 percent and mobile service was about 75 percent restored in the Maule region.
• The slower infrastructure restoration in the Biobío region reflected more damage from shaking in a more populated and developed area than in the Maule region. Also, in the Maule region there was more extensive use of portable diesel generators (gensets) and COWs.
• After the 2010 Darfield (New Zealand) earthquake,communication systems were reported as back tonormal after 3 days (Tang and others, 2014).
• After the more impactful 2011 Christchurch (NewZealand) earthquake, communications were consideredback to normal after 9 days. Compared to the Darfieldearthquake, the longer restoration time was dictatedby a longer electric power restoration time (Tang andothers, 2014). From the perspective of people workingfrom home, reliable service took longer.
• Telephone services were disrupted for 13 and 3.4percent of the staff working from home after 1 week and 3 weeks, respectively.
• Internet services slightly lagged behind telephoneservice—17 and 6 percent of staff reported internet disruptions after 1 week and 3 weeks, respectively.
• Telephone, power, and internet services were reliablefor all customers within 2 months (Donnelly andProctor-Thomson, 2013).
• After the 2011 Tohoku earthquake and tsunami in Japan,pre-earthquake mobile and landline telecommunicationsinfrastructure were restored within 14 to 17 days, exceptfor mobile facilities whose base stations were destroyed(Krishnamurthy and others, 2016).
• After the 2015 Kumamoto earthquake, the recoveryof cellular sites was a little bit slower than previousM6 earthquakes in Japan because of difficult access tosome areas and aftershocks (Tang and Eidinger, 2017):
• About 85 percent of the cellular sites were restoredwithin 4 days after the mainshock.
• 99 percent of normal operations were recovered within12 days.
Chapter S. Telecommunications and Information Communication Technology 43
Service Restoration after HurricanesAfter Hurricane Katrina, an event with centralized (rather
than distributed) damage, cellular telephony service was almost fully operational after 1 week along the Gulf Coast and partially operational in New Orleans and Plaquemines Parish; the diversity and flexibility of mobile networks and priority to restore them outstripped the restoration of PSTN networks (Kwasinski and others, 2006).
After Hurricane Sandy, the number of cellular site outages decreased from 25 percent to 19 percent over the course of the first day, and steadily improved over the next few days, except for isolated outages that lingered where electric power remained unavailable and where the storm caused more widespread damage (Davidson and Santorelli, 2012). The Communications Sector Coordinating Council (CSCC) reported that Verizon was operating at 94 percent capacity immediately after Hurricane Sandy and at 99 percent capacity 5 days later (T. Serio, Verizon Wireless, oral commun., 2014).
As for internet services after Hurricane Sandy, 10 percent of the network in metropolitan areas was offline (Davidson and Santorelli, 2012). Flood damage to data centers and service providers (including InterNAP) resulted in unavailable websites and online services for almost a week (Davidson and Santorelli, 2012). Heidemann and others (2013) pinged networks for responses and detected a doubling of baseline U.S. internet outages when the hurricane made landfall. They traced the sources of the outages to the States of New York and New Jersey and found that it took about 4 days to recover to normal performance levels. Overall, it appears that most services after Hurricane Sandy were restored within a week except for isolated cases of internet and phone outages, which lasted for months (Smith, 2013).
Simple Model of Voice and Data Demand Served
A simple model of voice and data service restoration begins with a base case. This worst case illustrates a lower bound for service restoration for counties in the San Francisco Bay region, and we subsequently build in various resilience capabilities.
Base Case: Residual Capacity, Power Outages, Demand Surge
The base case assumes that demand served is constrained by residual network capacity, is fully dependent on and follows the restoration of electric power, and is degraded by congestion caused by a surge in demand for voice and data services. We develop assumptions for each of these factors and combine the effects into estimates of demand served over time.
Residual Network Capacity
After an earthquake, residual capacity is the percentage of pre-earthquake network capacity remaining after physical damage. The convergence of the voice (landline and cellular)
and data (internet, cloud, VoIP, and so on) networks makes it difficult to identify the total capacity of the networks because they cannot be isolated as single components of a particular carrier’s system owing to interoperability. In addition, network design has diversity as well as controls that help to reduce loss of information flow when parts of the physical system are compromised (sidebar 3). On the other hand, networks may have single points of failure, both well known and hidden, that could cause widespread outages during and after hazard events (Applied Technology Council, 2016) (sidebar 4). However, the largest single point of failure would likely manifest from failure of the electric power grid, which is addressed below in the context of power dependency.
Sidebar 3—Examples of Resilient Network Design• Central office operations can be diverted and performed
at other central offices that have circuits available (for example, Davidson and Santorelli, 2012).
• Subscribers may be covered by multiple cellular serviceareas; cell coverage overlaps to enable the signal to behanded over as the user moves from one area to anotherwithout a disruption in service. This means that acellular site can be lost without affecting coverage in an overlapping area, but cellular data speeds may be slowedfrom the loss of capacity, and fewer customers may beable to make calls at the same time (R. Altom, VerizonWireless, oral commun., 2016).
• Carriers build in redundant entry points to self-healingfiber ring networks that might help in the case where fiber optic lines cross a fault multiple times.
• Path diversity is built into the system via independentconnections to a network backbone. Wireless networkscan serve as backup for broken lines (Applied TechnologyCouncil, 2016).
• Data centers use data replication and failover to preservedata and access to it—the process of transferringoperational control of a corporation within seconds to aremote location (for example, Perry 2016). Many serviceproviders have data centers outside of the region andaccess to data can be transferred to them, although withsome increased latency (M. Thompson, Argonne NationalLabs, oral commun., 2017).
• The Transmission Control Protocol (TCP), one of theprimary communications protocols used on the internet,is designed as an end-to-end protocol, meaning that itattempts to guarantee message delivery from sender toreceiver despite changes or outages in the interveningnetwork nodes. This protocol allows networks that useTCP to be highly resistant to failures, albeit slower, whenmultiple paths from sender to receiver exist.
44 The HayWired Earthquake Scenario—Societal Consequences
Sidebar 4—Examples of Single Points of Failure for Parts of a Network
• Because of the process known as traffic grooming, carriers may inadvertently route circuits that were meant to begeographically diverse through the same physical line.
• Transmission Control Protocol data flow has the potential to fail if a concentration of high-capacity routes betweena particular sender and receiver become unavailable(Thompson and Evans, 2016).
• Possible critical points of failure for the internet includesingle fiber optic line cuts (in the absence of diversity)(Thompson and Evans, 2016) and disruption to internetexchange points that house important connections(Murphy, 2015).
• For cellular networks, damage to wired or wirelessbackhaul feeding a macrocell site (or cluster of sites) isa potential single point of failure for the site or cluster,unless the site or cluster has a redundant wired orwireless backhaul connection.
• During Hurricane Katrina, wireless services wereaffected by public switched telephone network failurebecause it was the backbone for many of the networks(Kwasinski and others, 2006).
• Damage to a single site shared by multiple carriers(known as colocation facilities) could put a largenumber of customers on different carriers out of service.
• Customers could be out of service because of failures intheir distribution networks13 (last mile) with no alternativeconnection to the backbone network or from being directlyconnected to a central office that fails.
Estimate of Residual Network Capacity After the HayWired Mainshock
Without tools to estimate network capacity, we first elicited industry expert consensus about the residual capacity of the networks after the HayWired mainshock. In a workshop, industry experts postulated residual network capacity as a function of shaking intensity (table 18). For each county, we calculated the average Modified Mercalli Index (MMI) score affecting the county and assigned the residual capacity from table 18.
To include the effects of multiple hazards (such as liquefaction as well as shaking), we developed a second approach to assign capacity reductions to facilities and channels and combine them into a representation of network capacity. We
13Last-mile wired connections are primarily copper twisted pairs (for voice, digital subscriber line, and legacy data services), coaxial (for cable television), and fiber (for cable television, business data services, cellular backhaul, and internet access).
Table 18. Average industry estimate of likely residual network capacity caused by earthquake damage (listed by shaking intensity).
[MMI, Modified Mercalli Intensity; %, percent]
MMI VII Very strong
shaking
MMI VIII Severe shaking
MMI IX or X Violent or
extreme shaking
Network capacity after the earthquake
80% 70% 50%
consider that a user of the networks requires an exchange type of facility (like a data center, central office, or mobile switching center), a local channel (like a cellular tower or fiber optic or copper line), and a long-haul channel (like long-haul fiber optic line). Because of resilience in the networks, we assume that residual capacity is governed by the average residual capacities of each type of requirement.
Our HayWired scenario mainshock damage analysis provides estimates for numbers of extensive (for example, yellow-tagged building) or complete (for example, red-tagged building) damage to central offices, data centers, and three types of cellular sites. For the estimation of capacity losses, we assumed that red-tag damage corresponds to 100 percent loss of equipment capacity and yellow-tag damage represents a loss of 22 percent of equipment capacity.14 Our liquefaction and landslide exposure analyses yield numbers of facilities and lengths of interoffice and long-haul fiber that are exposed to the probability of these ground failures. The capacity loss from ground-failure hazards is assumed to be functionally consistent with the probability range as follows.
• 30 percent capacity loss for 25 percent and greater chanceof ground failure,
• 15 percent capacity loss for between 5 and 25 percentchance of ground failure, and
• 2.5 percent capacity loss for 0.1 to 5 percent chance ofground failure.
For each county, each infrastructure capacity loss from each earthquake hazard is summed and capped at 100 percent capacity loss (for example, if complete damage from shaking and 30 percent probability of ground failure coincide). In table 19, we show that the largest exchange-type capacity loss estimate is for central offices in Alameda and Contra Costa Counties and for data centers in San Francisco, San Mateo, and Santa Clara Counties. The largest capacity loss estimate for transmission channels is cellular sites on buildings in all counties, but only 2 percent above capacity loss estimates for interoffice fiber in most counties, except in the more heavily affected Alameda and Contra Costa Counties.
We make a very high-level calculation of residual network capacity for each county from the product of:
• the average percentage of residual capacity of centraloffices and data centers;
14A range of functionality coincides with extensive damage. The 22 percent value derives from an estimate of average functionality of yellow-tagged buildings after the 2014 South Napa earthquake by one of the authors, K.A. Porter.
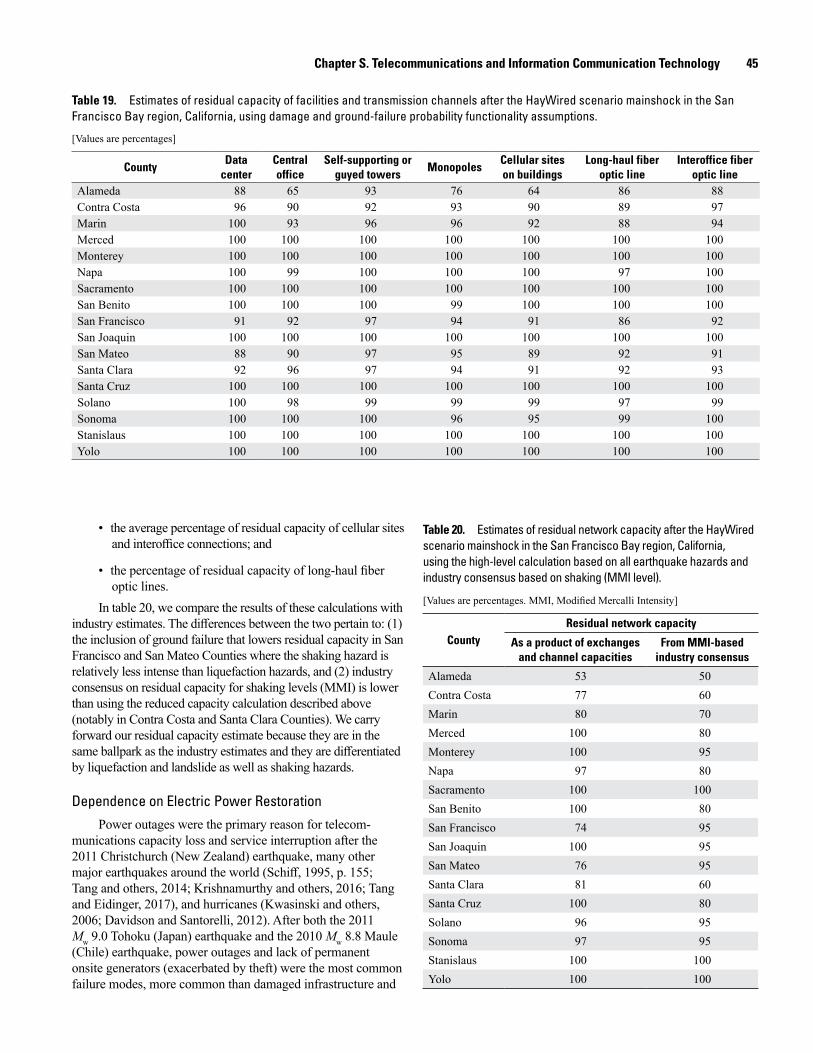
Chapter S. Telecommunications and Information Communication Technology 45
Table 19. Estimates of residual capacity of facilities and transmission channels after the HayWired scenario mainshock in the San Francisco Bay region, California, using damage and ground-failure probability functionality assumptions.
[Values are percentages]
CountyData
centerCentral office
Self-supporting or guyed towers
MonopolesCellular sites on buildings
Long-haul fiber optic line
Interoffice fiber optic line
Alameda 88 65 93 76 64 86 88Contra Costa 96 90 92 93 90 89 97Marin 100 93 96 96 92 88 94Merced 100 100 100 100 100 100 100Monterey 100 100 100 100 100 100 100Napa 100 99 100 100 100 97 100Sacramento 100 100 100 100 100 100 100San Benito 100 100 100 99 100 100 100San Francisco 91 92 97 94 91 86 92San Joaquin 100 100 100 100 100 100 100San Mateo 88 90 97 95 89 92 91Santa Clara 92 96 97 94 91 92 93Santa Cruz 100 100 100 100 100 100 100Solano 100 98 99 99 99 97 99Sonoma 100 100 100 96 95 99 100Stanislaus 100 100 100 100 100 100 100Yolo 100 100 100 100 100 100 100
• the average percentage of residual capacity of cellular sitesand interoffice connections; and
• the percentage of residual capacity of long-haul fiber optic lines.
In table 20, we compare the results of these calculations with industry estimates. The differences between the two pertain to: (1) the inclusion of ground failure that lowers residual capacity in San Francisco and San Mateo Counties where the shaking hazard is relatively less intense than liquefaction hazards, and (2) industry consensus on residual capacity for shaking levels (MMI) is lower than using the reduced capacity calculation described above (notably in Contra Costa and Santa Clara Counties). We carry forward our residual capacity estimate because they are in the same ballpark as the industry estimates and they are differentiated by liquefaction and landslide as well as shaking hazards.
Dependence on Electric Power RestorationPower outages were the primary reason for telecom-
munications capacity loss and service interruption after the 2011 Christchurch (New Zealand) earthquake, many other major earthquakes around the world (Schiff, 1995, p. 155; Tang and others, 2014; Krishnamurthy and others, 2016; Tang and Eidinger, 2017), and hurricanes (Kwasinski and others, 2006; Davidson and Santorelli, 2012). After both the 2011 Mw 9.0 Tohoku (Japan) earthquake and the 2010 Mw 8.8 Maule (Chile) earthquake, power outages and lack of permanent onsite generators (exacerbated by theft) were the most common failure modes, more common than damaged infrastructure and
Table 20. Estimates of residual network capacity after the HayWired scenario mainshock in the San Francisco Bay region, California, using the high-level calculation based on all earthquake hazards and industry consensus based on shaking (MMI level).
[Values are percentages. MMI, Modified Mercalli Intensity]
CountyResidual network capacity
As a product of exchanges and channel capacities
From MMI-based industry consensus
Alameda 53 50Contra Costa 77 60Marin 80 70Merced 100 80Monterey 100 95Napa 97 80Sacramento 100 100San Benito 100 80San Francisco 74 95San Joaquin 100 95San Mateo 76 95Santa Clara 81 60Santa Cruz 100 80Solano 96 95Sonoma 97 95Stanislaus 100 100Yolo 100 100
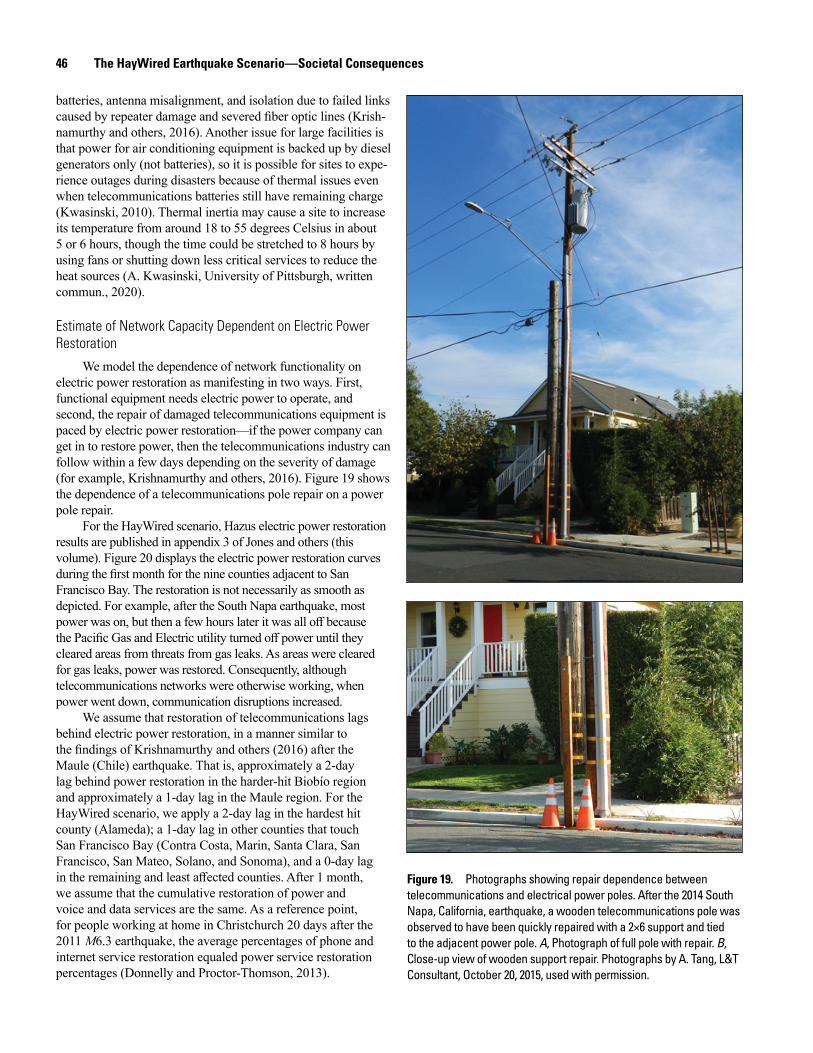
46 The HayWired Earthquake Scenario—Societal Consequences
batteries, antenna misalignment, and isolation due to failed links caused by repeater damage and severed fiber optic lines (Krish-namurthy and others, 2016). Another issue for large facilities is that power for air conditioning equipment is backed up by diesel generators only (not batteries), so it is possible for sites to expe-rience outages during disasters because of thermal issues even when telecommunications batteries still have remaining charge (Kwasinski, 2010). Thermal inertia may cause a site to increase its temperature from around 18 to 55 degrees Celsius in about 5 or 6 hours, though the time could be stretched to 8 hours by using fans or shutting down less critical services to reduce the heat sources (A. Kwasinski, University of Pittsburgh, written commun., 2020).
Estimate of Network Capacity Dependent on Electric Power Restoration
We model the dependence of network functionality on electric power restoration as manifesting in two ways. First, functional equipment needs electric power to operate, and second, the repair of damaged telecommunications equipment is paced by electric power restoration—if the power company can get in to restore power, then the telecommunications industry can follow within a few days depending on the severity of damage (for example, Krishnamurthy and others, 2016). Figure 19 shows the dependence of a telecommunications pole repair on a power pole repair.
For the HayWired scenario, Hazus electric power restoration results are published in appendix 3 of Jones and others (this volume). Figure 20 displays the electric power restoration curves during the first month for the nine counties adjacent to San Francisco Bay. The restoration is not necessarily as smooth as depicted. For example, after the South Napa earthquake, most power was on, but then a few hours later it was all off because the Pacific Gas and Electric utility turned off power until they cleared areas from threats from gas leaks. As areas were cleared for gas leaks, power was restored. Consequently, although telecommunications networks were otherwise working, when power went down, communication disruptions increased.
We assume that restoration of telecommunications lags behind electric power restoration, in a manner similar to the findings of Krishnamurthy and others (2016) after the Maule (Chile) earthquake. That is, approximately a 2-day lag behind power restoration in the harder-hit Biobío region and approximately a 1-day lag in the Maule region. For the HayWired scenario, we apply a 2-day lag in the hardest hit county (Alameda); a 1-day lag in other counties that touch San Francisco Bay (Contra Costa, Marin, Santa Clara, San Francisco, San Mateo, Solano, and Sonoma), and a 0-day lag in the remaining and least affected counties. After 1 month, we assume that the cumulative restoration of power and voice and data services are the same. As a reference point, for people working at home in Christchurch 20 days after the 2011 M6.3 earthquake, the average percentages of phone and internet service restoration equaled power service restoration percentages (Donnelly and Proctor-Thomson, 2013).
men21-7516_fig19
men21-7516_fig19
Figure 19. Photographs showing repair dependence between telecommunications and electrical power poles. After the 2014 South Napa, California, earthquake, a wooden telecommunications pole was observed to have been quickly repaired with a 2×6 support and tied to the adjacent power pole. A, Photograph of full pole with repair. B, Close-up view of wooden support repair. Photographs by A. Tang, L&TConsultant, October 20, 2015, used with permission.
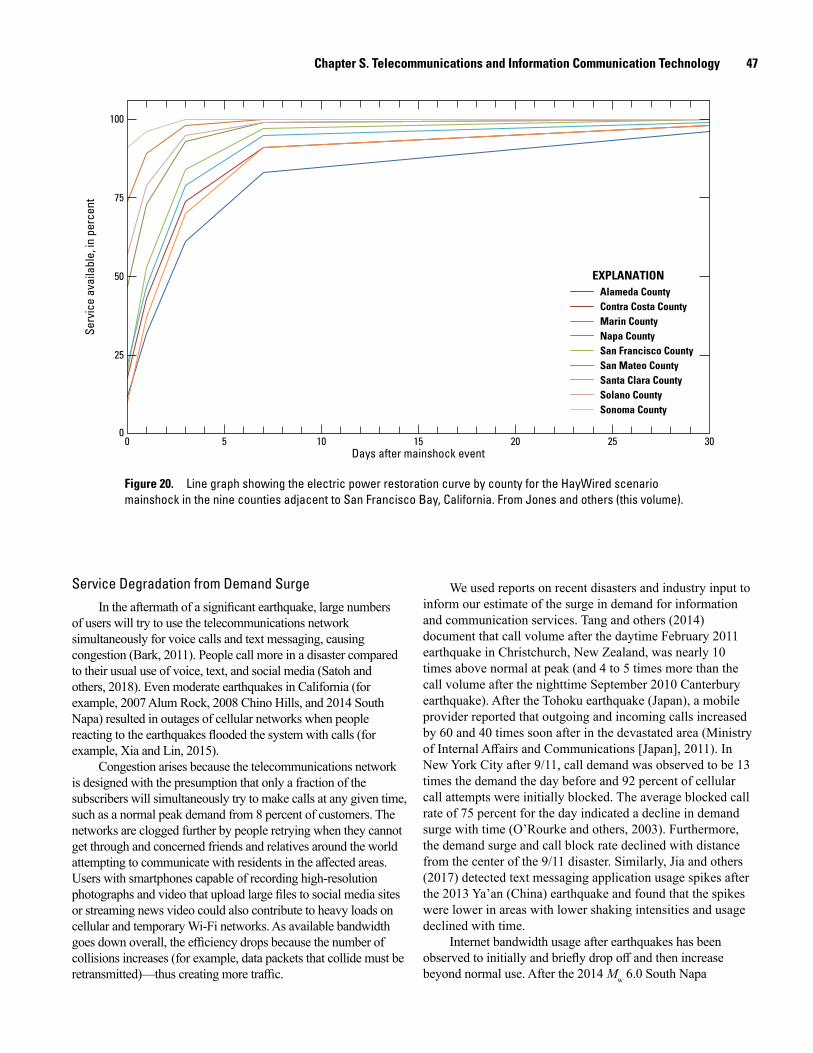
Chapter S. Telecommunications and Information Communication Technology 47
men21-7516_fig20
Alameda CountyContra Costa CountyMarin CountyNapa County
EXPLANATION
San Francisco CountySan Mateo CountySanta Clara CountySolano CountySonoma County
00
25
50
75
100
5 10 15 20 25 30Days after mainshock event
Serv
ice
avai
labl
e, in
per
cent
Figure 20. Line graph showing the electric power restoration curve by county for the HayWired scenario mainshock in the nine counties adjacent to San Francisco Bay, California. From Jones and others (this volume).
Service Degradation from Demand SurgeIn the aftermath of a significant earthquake, large numbers
of users will try to use the telecommunications network simultaneously for voice calls and text messaging, causing congestion (Bark, 2011). People call more in a disaster compared to their usual use of voice, text, and social media (Satoh and others, 2018). Even moderate earthquakes in California (for example, 2007 Alum Rock, 2008 Chino Hills, and 2014 South Napa) resulted in outages of cellular networks when people reacting to the earthquakes flooded the system with calls (for example, Xia and Lin, 2015).
Congestion arises because the telecommunications network is designed with the presumption that only a fraction of the subscribers will simultaneously try to make calls at any given time, such as a normal peak demand from 8 percent of customers. The networks are clogged further by people retrying when they cannot get through and concerned friends and relatives around the world attempting to communicate with residents in the affected areas. Users with smartphones capable of recording high-resolution photographs and video that upload large files to social media sites or streaming news video could also contribute to heavy loads on cellular and temporary Wi-Fi networks. As available bandwidth goes down overall, the efficiency drops because the number of collisions increases (for example, data packets that collide must be retransmitted)—thus creating more traffic.
We used reports on recent disasters and industry input to inform our estimate of the surge in demand for information and communication services. Tang and others (2014) document that call volume after the daytime February 2011 earthquake in Christchurch, New Zealand, was nearly 10 times above normal at peak (and 4 to 5 times more than the call volume after the nighttime September 2010 Canterbury earthquake). After the Tohoku earthquake (Japan), a mobile provider reported that outgoing and incoming calls increased by 60 and 40 times soon after in the devastated area (Ministry of Internal Affairs and Communications [Japan], 2011). In New York City after 9/11, call demand was observed to be 13 times the demand the day before and 92 percent of cellular call attempts were initially blocked. The average blocked call rate of 75 percent for the day indicated a decline in demand surge with time (O’Rourke and others, 2003). Furthermore, the demand surge and call block rate declined with distance from the center of the 9/11 disaster. Similarly, Jia and others (2017) detected text messaging application usage spikes after the 2013 Ya’an (China) earthquake and found that the spikes were lower in areas with lower shaking intensities and usage declined with time.
Internet bandwidth usage after earthquakes has been observed to initially and briefly drop off and then increase beyond normal use. After the 2014 Mw 6.0 South Napa
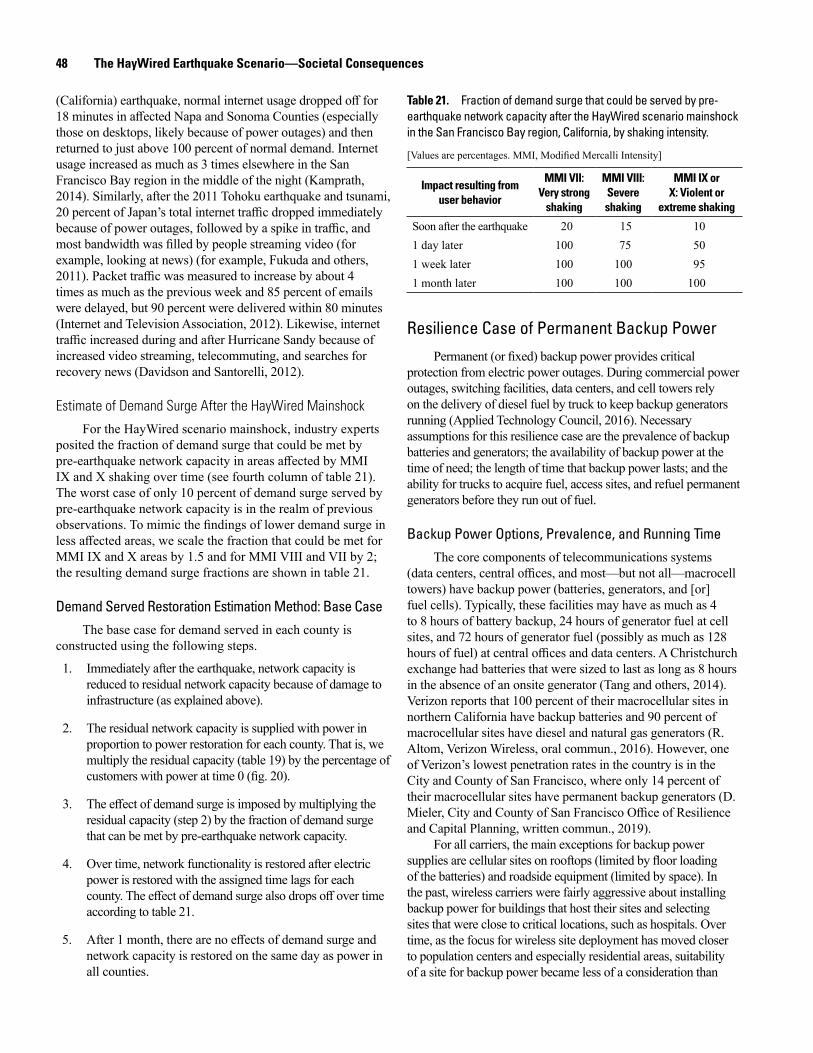
48 The HayWired Earthquake Scenario—Societal Consequences
(California) earthquake, normal internet usage dropped off for 18 minutes in affected Napa and Sonoma Counties (especially those on desktops, likely because of power outages) and then returned to just above 100 percent of normal demand. Internet usage increased as much as 3 times elsewhere in the San Francisco Bay region in the middle of the night (Kamprath, 2014). Similarly, after the 2011 Tohoku earthquake and tsunami, 20 percent of Japan’s total internet traffic dropped immediately because of power outages, followed by a spike in traffic, and most bandwidth was filled by people streaming video (for example, looking at news) (for example, Fukuda and others, 2011). Packet traffic was measured to increase by about 4 times as much as the previous week and 85 percent of emails were delayed, but 90 percent were delivered within 80 minutes (Internet and Television Association, 2012). Likewise, internet traffic increased during and after Hurricane Sandy because of increased video streaming, telecommuting, and searches for recovery news (Davidson and Santorelli, 2012).
Estimate of Demand Surge After the HayWired Mainshock
For the HayWired scenario mainshock, industry experts posited the fraction of demand surge that could be met by pre-earthquake network capacity in areas affected by MMI IX and X shaking over time (see fourth column of table 21). The worst case of only 10 percent of demand surge served by pre-earthquake network capacity is in the realm of previous observations. To mimic the findings of lower demand surge in less affected areas, we scale the fraction that could be met for MMI IX and X areas by 1.5 and for MMI VIII and VII by 2; the resulting demand surge fractions are shown in table 21.
Demand Served Restoration Estimation Method: Base CaseThe base case for demand served in each county is
constructed using the following steps.
1. Immediately after the earthquake, network capacity is reduced to residual network capacity because of damage to infrastructure (as explained above).
2. The residual network capacity is supplied with power in proportion to power restoration for each county. That is, we multiply the residual capacity (table 19) by the percentage of customers with power at time 0 (fig. 20).
3. The effect of demand surge is imposed by multiplying the residual capacity (step 2) by the fraction of demand surge that can be met by pre-earthquake network capacity.
4. Over time, network functionality is restored after electric power is restored with the assigned time lags for each county. The effect of demand surge also drops off over time according to table 21.
5. After 1 month, there are no effects of demand surge and network capacity is restored on the same day as power in all counties.
Table 21. Fraction of demand surge that could be served by pre-earthquake network capacity after the HayWired scenario mainshock in the San Francisco Bay region, California, by shaking intensity.
[Values are percentages. MMI, Modified Mercalli Intensity]
Impact resulting from user behavior
MMI VII: Very strong
shaking
MMI VIII: Severe shaking
MMI IX or X: Violent or
extreme shaking
Soon after the earthquake 20 15 101 day later 100 75 501 week later 100 100 951 month later 100 100 100
Resilience Case of Permanent Backup PowerPermanent (or fixed) backup power provides critical
protection from electric power outages. During commercial power outages, switching facilities, data centers, and cell towers rely on the delivery of diesel fuel by truck to keep backup generators running (Applied Technology Council, 2016). Necessary assumptions for this resilience case are the prevalence of backup batteries and generators; the availability of backup power at the time of need; the length of time that backup power lasts; and the ability for trucks to acquire fuel, access sites, and refuel permanent generators before they run out of fuel.
Backup Power Options, Prevalence, and Running TimeThe core components of telecommunications systems
(data centers, central offices, and most—but not all—macrocell towers) have backup power (batteries, generators, and [or] fuel cells). Typically, these facilities may have as much as 4 to 8 hours of battery backup, 24 hours of generator fuel at cell sites, and 72 hours of generator fuel (possibly as much as 128 hours of fuel) at central offices and data centers. A Christchurch exchange had batteries that were sized to last as long as 8 hours in the absence of an onsite generator (Tang and others, 2014). Verizon reports that 100 percent of their macrocellular sites in northern California have backup batteries and 90 percent of macrocellular sites have diesel and natural gas generators (R. Altom, Verizon Wireless, oral commun., 2016). However, one of Verizon’s lowest penetration rates in the country is in the City and County of San Francisco, where only 14 percent of their macrocellular sites have permanent backup generators (D. Mieler, City and County of San Francisco Office of Resilience and Capital Planning, written commun., 2019).
For all carriers, the main exceptions for backup power supplies are cellular sites on rooftops (limited by floor loading of the batteries) and roadside equipment (limited by space). In the past, wireless carriers were fairly aggressive about installing backup power for buildings that host their sites and selecting sites that were close to critical locations, such as hospitals. Over time, as the focus for wireless site deployment has moved closer to population centers and especially residential areas, suitability of a site for backup power became less of a consideration than

Chapter S. Telecommunications and Information Communication Technology 49
providing desired signal coverage, meeting business and economic expectations, and conforming to local government regulations. Reasons for restrictions on backup generators include fire safety, aesthetics, space, and noise from testing.
For the components of the distribution system, batteries are smaller or less prevalent than they are for the core components. For roadside cabinets and rural huts in Christchurch, battery reserves ranged from 2 hours at urban sites to 5 hours at rural sites (Tang and others, 2014). After the 2010 Maule earthquake in Chile, reserve battery power in most distributed network facilities was depleted after 3 hours (Earthquake Engineering Research Institute, 2010). Backup power supplies for small cells are typically not approved by municipal permitting processes (R. Altom, Verizon Wireless, oral commun., 2016).
Batteries may last less time than expected because lead-acid, absorbent glass mat type batteries can lose capacity with age, and under heavy use (for example, the type of use that occurs after a disaster) they discharge faster. After the 2011 Christchurch earthquake, batteries did not perform as well as they did after the 2010 Darfield mainshock, likely because the mainshock had disrupted power 5 months earlier and accelerated the aging of batteries (Tang and others, 2014).
Given the range of backup power installations, including none, we assume a combined effect on network functionality equivalent to 50 percent with a battery only and 50 percent with a generator. We assume that batteries drain on the first day and that generators run for 3 days before needing to be refueled.
Fuel Delivery to Permanent GeneratorsThe arrival of fuel trucks depends on available labor
and equipment, roadway conditions, and security issues. In Christchurch, road access to refuel cabinets was difficult because of road closures, roads damaged by liquefaction and landslides, and traffic congestion (Fenwick, 2011); a central office in the cordoned area of Christchurch required fuel delivery by helicopter (Tang and others, 2014). After the 2010 Maule (Chile) earthquake, damage to roads and bridges made access to cell sites and remote offices that were relying on battery reserve power difficult to access once the batteries had discharged (Tang and others, 2011). After Hurricane Katrina, civil unrest affected access to several BellSouth central offices and fuel trucks met obstacles of inaccessible routes and security checkpoints (Kwasinski and others, 2006). During the Hurricane Sandy response, companies were unable to access damaged sites because of downed trees, flooding, or other physical impediments (for example, damaged roofs housing cell towers) (Davidson and Santorelli, 2012).
The Lifelines Council (2014) concluded that damage to regional roads and city streets would strongly affect restoration of telecommunications services. A HayWired scenario hazard exposure and damage analysis for roadways (Jones and others, this volume) indicate very limited access in some areas because of heavily damaged bridges and landslides on roadways. Near the bay shoreline, liquefaction damage to driving surfaces—especially sand boils and cracks from lateral spreading—would
require repair vehicles to drive very slowly, but not necessarily obstruct them.
A critical contingency in the San Francisco Bay region event is the uncertainty of fuel supply within the first 10 days of a large earthquake (G. Schremp, California Energy Commission, written commun., 2018; Jones and others, this volume). As recent hurricanes demonstrate, there is a serious gap for the industry between expectations for the availability of fuel and the threat to fuel supplies from disasters. Even if the fuel gets to its destination, there have been cases when it was misdirected to the wrong generator.
Another consideration for the San Francisco Bay region is the potential lack of availability of skilled labor to construct, maintain, repair and upgrade, fuel, and manage telecommunications systems. Skill sets range from advanced university degrees to construction and manual labor. It is perceived that the technology boom and housing costs are already driving competition for these talents in the San Francisco Bay region such that the availability of qualified personnel is an ongoing issue. Locating human resources to recover from a HayWired-type earthquake is expected to be very challenging. One of the authors (D.T. Witkowski) knows contractors that came to the San Francisco Bay region from out of state during the response to the 2019 Public Safety Power Shutoffs (PSPSs). Access to sites may be further obstructed by delays in credentialing contract labor and (or) when buildings are secured for safety and inspection.
In our model, we assume that permanent generators can be refueled using first-truck delay data from a Hurricane Sandy study by Krishnamurthy and Kwasinski (2014). The setting of Hurricane Sandy is similar to the San Francisco Bay region in terms of density of large cities, importance of bridge access, and presence of centers of world industry that depend on telecommunications services (A. Kwasinski, University of Pittsburgh, written commun., 2018). Although warnings for hurricanes enable pre-staging of fuel trucks and equipment, the excitation of that hazard lasts longer (for example, a day) than the seconds of an earthquake, which could make up some of the time lost from not being able to pre-stage, except where there is fire following the earthquake. Krishnamurthy and Kwasinski (2014) report triangular distributions of truck entry delay days described by the minimum, average, and maximum number of days in three Hurricane Sandy impact zones (where 1 is the most affected) (see table 22). We note that the minimum delay of 2 days for the most affected area is consistent with the
Table 22. Fuel truck delivery delays (in days) to sites in three zones of impact from Hurricane Sandy in the northeastern United States.
[Data from Krishnamurthy and Kwasinski (2014). The time for the first trucks to arrive at a site is a triangular distribution described by the minimum, maximum, and average number of days]
Zone of impact Minimum Average Maximum
1 2 4.3 72 1 3 53 1 2 3

50 The HayWired Earthquake Scenario—Societal Consequences
mobilization and placement of large AT&T trailers containing telecommunications equipment at a site in New Jersey within 48 hours of the 9/11 attack (O’Rourke and others, 2003). We use the zone 1 data for Alameda County, zone 2 data for other counties adjacent to San Francisco Bay, and zone 3 data in the least affected counties—the same geographical divide used to assign telecommunications restoration time lags after power restoration in the base case.
Backup power equipment itself may fail to work because of insufficient testing and maintenance, overheating and sulfation (a change in chemistry in the case of batteries), or damage by the earthquake event (for example, Kwasinski and others, 2006; Fenwick, 2011; Davidson and Santorelli, 2012). After the 2014 South Napa earthquake, a central office had a nonfunctioning generator, but was still able to run on battery systems until generators and a cooling system were installed (Noyes, 2014). Less fortunate were the central office operations that were interrupted when Hurricane Sandy floods damaged backup power equipment including onsite diesel generators and fuel pumps in their basement or first floor (Kwasinski, 2012). Closer to home, during the 2019 PSPSs, a San Mateo County radio shop had to contend with two generator failures (out of 11 sites with generators) and after calling 27 sources in California could not find replacement generators (A. David, County of San Mateo, oral commun., 2019).
Grant and others (1996) found that stand-by diesel generators at U.S. commercial nuclear power plants had an 85 percent availability when operated for more than 24 hours. Failure modes included being out of service for maintenance, failure to start, and failure to keep running. In our model, we simply assume permanent batteries and generators are 90 percent available.
Demand Served Restoration Estimation Method: Permanent Backup Power
Demand served by the telecommunications network with backup power is estimated using the following steps to build on the base case. 1. Permanent backup power is effectively present in the
proportion of 50 percent of network functionality with a battery that runs out within 1 day and 50 percent of network functionality with a generator and 3 days of fuel.
2. Backup power is 90 percent available; 10 percent of backup power is assumed to malfunction. At time zero, the network functionality is the base case plus 90 percent of the residual capacity that is without electric power but running on permanent and available backup power.
3. After 1 day, the batteries drain such that 50 percent of the residual capacity that is without commercial power is reduced to the power-dependent restoration case (applying steps 2 and 4 of the base case).
4. After 3 days, when generators run out of fuel, fuel trucks are able to refuel generators according to the triangular
distribution of the county’s impact zone (table 22). In zone 3, all generators are refueled without a lag, in zone 2 half of the generators are out of fuel for 1 or 2 days, and in zone 3 more than half of the generators are out of fuel for 1 to 4 days. Sites with generators that are not refueled within 3 days fall back to the base case of power-dependent restoration.
Resilience Case of Portable EquipmentPortable (or deployable) equipment, including gensets and
telecommunications equipment, are trucked in after disasters. After Hurricane Sandy, Verizon used as many as 1,500 generators, consuming 100,000 gallons of fuel each day (Cheng, 2012). After the 2011 Christchurch earthquake, more than 500 gensets were needed and it took a few days to source them.
Portable cellular sites on wheels (COWs) or light trucks (COLTs), typically used to provide supplemental cellular voice and data capacity for large gatherings (sports events, tradeshows, music festivals, and so on), can substitute for damaged sites or augment coverage in critical areas. For example, a temporary wireless antenna was erected in northern New Jersey to support financial institutions and stock exchanges after Hurricane Sandy (Davidson and Santorelli, 2012) (fig. 21).
COWs and COLTs require electric power (although they typically have on-board batteries and generators) and connect to the network via either fiber optic lines or wireless data links. In areas with persistent outages, AT&T has connected portable satellite connections to cellular towers until fiber optic connections or terrestrial wireless links can be restored (Davidson and Santorelli, 2012).
In the rarer cases of an inoperable central office, a digital loop carrier (DLC) could be installed and connected to an operational central office with a fiber optic line to replace the damaged central office operations. A more expensive option of a switch on wheels (SOW) may be preferable for reliability, functionality, reducing congestion, and better telecommunications traffic distribution (Kwasinski and others, 2006). More recently, mobile telephone exchanges (MTXs) have been used to backup central office failure. AT&T has several trailers composing a core network (Fitchard, 2014). The links for these MTXs are either by microwave, high-speed copper or fiber lines, and (or) satellite.
As with fuel deliveries, roadway conditions, security checkpoints, the number of technician teams working in parallel, and the difficulty of resourcing fuel and spare parts or replacements influence the arrival of trucks at sites. We assume that carriers can deliver gensets and other portable equipment into counties at the same rate as fuel trucks (described above). We also apply the 90 percent backup-power availability rate assuming that similar hitches can apply to portable equipment as with permanent backup power and that there are impracticalities of setting up generators on rooftops and next to roadside wireless equipment cabinets (for example, Eidinger and Tang, 2012).
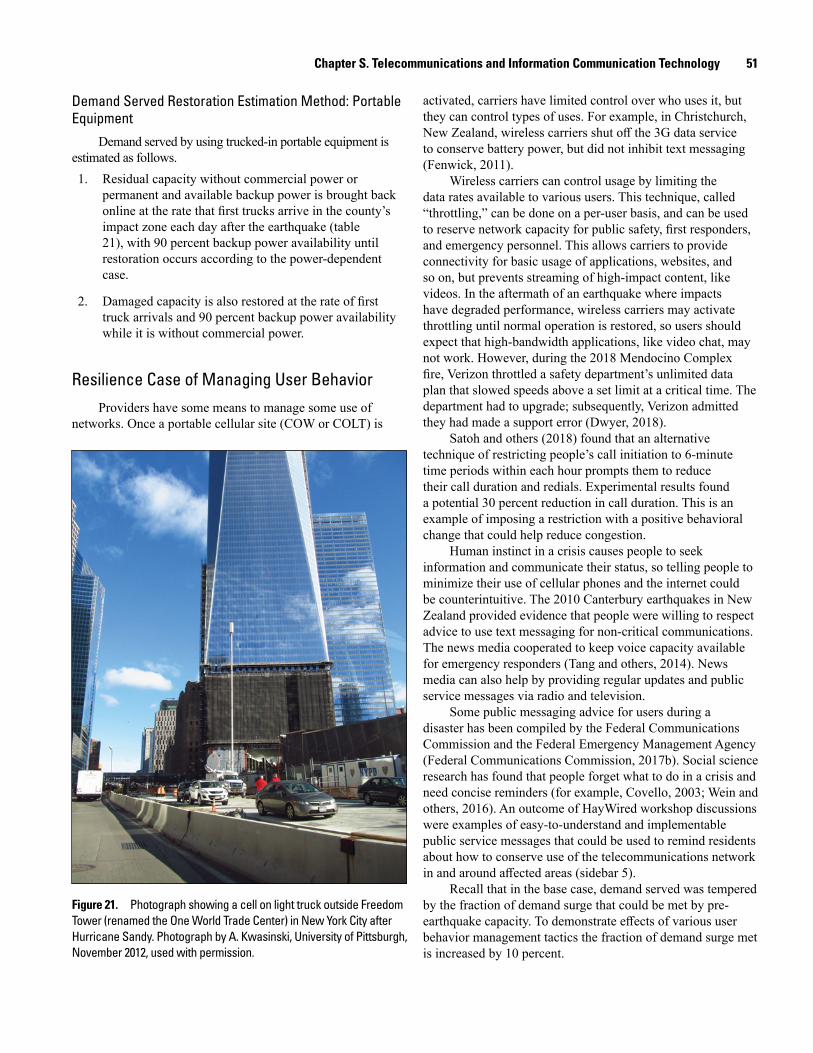
Chapter S. Telecommunications and Information Communication Technology 51
Demand Served Restoration Estimation Method: Portable Equipment
Demand served by using trucked-in portable equipment is estimated as follows.1. Residual capacity without commercial power or
permanent and available backup power is brought backonline at the rate that first trucks arrive in the county’simpact zone each day after the earthquake (table21), with 90 percent backup power availability untilrestoration occurs according to the power-dependentcase.
2. Damaged capacity is also restored at the rate of firsttruck arrivals and 90 percent backup power availabilitywhile it is without commercial power.
Resilience Case of Managing User BehaviorProviders have some means to manage some use of
networks. Once a portable cellular site (COW or COLT) is
men21-7516_fig21
Figure 21. Photograph showing a cell on light truck outside Freedom Tower (renamed the One World Trade Center) in New York City after Hurricane Sandy. Photograph by A. Kwasinski, University of Pittsburgh, November 2012, used with permission.
activated, carriers have limited control over who uses it, but they can control types of uses. For example, in Christchurch, New Zealand, wireless carriers shut off the 3G data service to conserve battery power, but did not inhibit text messaging (Fenwick, 2011).
Wireless carriers can control usage by limiting the data rates available to various users. This technique, called “throttling,” can be done on a per-user basis, and can be used to reserve network capacity for public safety, first responders, and emergency personnel. This allows carriers to provide connectivity for basic usage of applications, websites, and so on, but prevents streaming of high-impact content, like videos. In the aftermath of an earthquake where impacts have degraded performance, wireless carriers may activate throttling until normal operation is restored, so users should expect that high-bandwidth applications, like video chat, may not work. However, during the 2018 Mendocino Complex fire, Verizon throttled a safety department’s unlimited data plan that slowed speeds above a set limit at a critical time. The department had to upgrade; subsequently, Verizon admitted they had made a support error (Dwyer, 2018).
Satoh and others (2018) found that an alternative technique of restricting people’s call initiation to 6-minute time periods within each hour prompts them to reduce their call duration and redials. Experimental results found a potential 30 percent reduction in call duration. This is an example of imposing a restriction with a positive behavioral change that could help reduce congestion.
Human instinct in a crisis causes people to seek information and communicate their status, so telling people to minimize their use of cellular phones and the internet could be counterintuitive. The 2010 Canterbury earthquakes in New Zealand provided evidence that people were willing to respect advice to use text messaging for non-critical communications. The news media cooperated to keep voice capacity available for emergency responders (Tang and others, 2014). News media can also help by providing regular updates and public service messages via radio and television.
Some public messaging advice for users during a disaster has been compiled by the Federal Communications Commission and the Federal Emergency Management Agency (Federal Communications Commission, 2017b). Social science research has found that people forget what to do in a crisis and need concise reminders (for example, Covello, 2003; Wein and others, 2016). An outcome of HayWired workshop discussions were examples of easy-to-understand and implementable public service messages that could be used to remind residents about how to conserve use of the telecommunications network in and around affected areas (sidebar 5).
Recall that in the base case, demand served was tempered by the fraction of demand surge that could be met by pre-earthquake capacity. To demonstrate effects of various user behavior management tactics the fraction of demand surge met is increased by 10 percent.
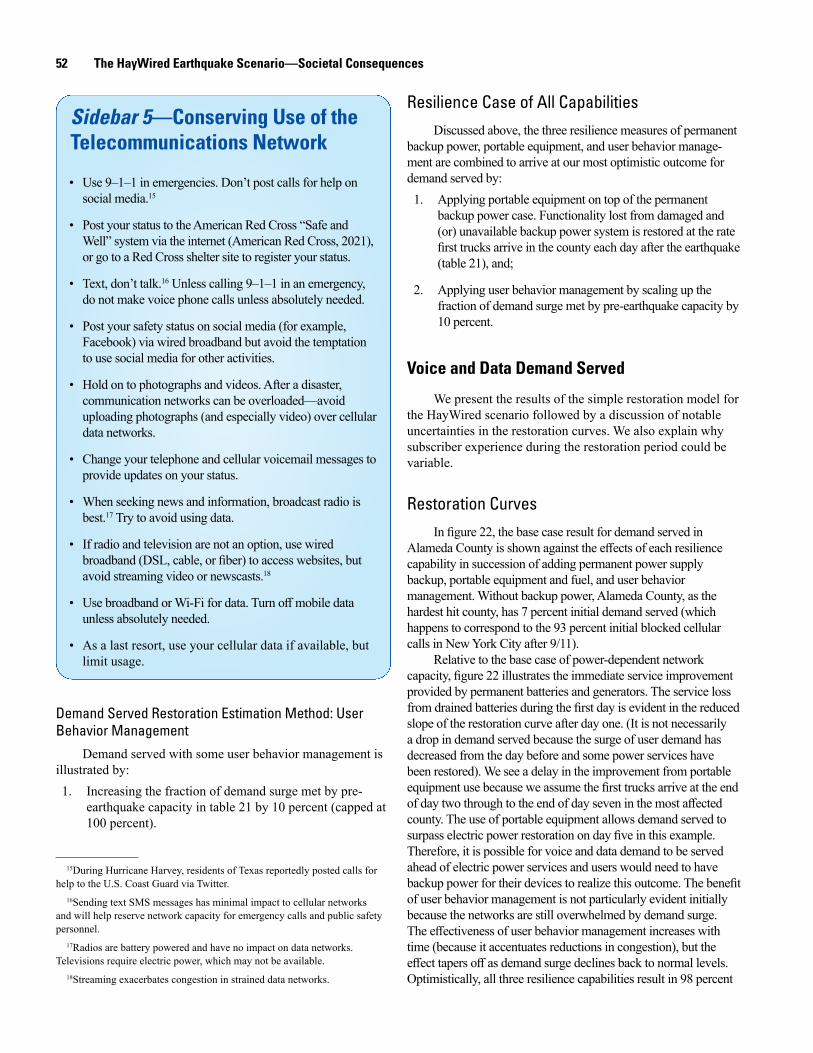
52 The HayWired Earthquake Scenario—Societal Consequences
Sidebar 5—Conserving Use of the Telecommunications Network
• Use 9–1–1 in emergencies. Don’t post calls for help onsocial media.15
• Post your status to the American Red Cross “Safe and Well” system via the internet (American Red Cross, 2021), or go to a Red Cross shelter site to register your status.
• Text, don’t talk.16 Unless calling 9–1–1 in an emergency,do not make voice phone calls unless absolutely needed.
• Post your safety status on social media (for example,Facebook) via wired broadband but avoid the temptationto use social media for other activities.
• Hold on to photographs and videos. After a disaster,communication networks can be overloaded—avoiduploading photographs (and especially video) over cellulardata networks.
• Change your telephone and cellular voicemail messages toprovide updates on your status.
• When seeking news and information, broadcast radio isbest.17 Try to avoid using data.
• If radio and television are not an option, use wiredbroadband (DSL, cable, or fiber) to access websites, but avoid streaming video or newscasts.18
• Use broadband or Wi-Fi for data. Turn off mobile data unless absolutely needed.
• As a last resort, use your cellular data if available, butlimit usage.
Demand Served Restoration Estimation Method: User Behavior Management
Demand served with some user behavior management is illustrated by:1. Increasing the fraction of demand surge met by pre-
earthquake capacity in table 21 by 10 percent (capped at100 percent).
15During Hurricane Harvey, residents of Texas reportedly posted calls for help to the U.S. Coast Guard via Twitter.
16Sending text SMS messages has minimal impact to cellular networks and will help reserve network capacity for emergency calls and public safety personnel.
17Radios are battery powered and have no impact on data networks. Televisions require electric power, which may not be available.
18Streaming exacerbates congestion in strained data networks.
Resilience Case of All CapabilitiesDiscussed above, the three resilience measures of permanent
backup power, portable equipment, and user behavior manage-ment are combined to arrive at our most optimistic outcome for demand served by:1. Applying portable equipment on top of the permanent
backup power case. Functionality lost from damaged and(or) unavailable backup power system is restored at the ratefirst trucks arrive in the county each day after the earthquake (table 21), and;
2. Applying user behavior management by scaling up thefraction of demand surge met by pre-earthquake capacity by10 percent.
Voice and Data Demand Served
We present the results of the simple restoration model for the HayWired scenario followed by a discussion of notable uncertainties in the restoration curves. We also explain why subscriber experience during the restoration period could be variable.
Restoration CurvesIn figure 22, the base case result for demand served in
Alameda County is shown against the effects of each resilience capability in succession of adding permanent power supply backup, portable equipment and fuel, and user behavior management. Without backup power, Alameda County, as the hardest hit county, has 7 percent initial demand served (which happens to correspond to the 93 percent initial blocked cellular calls in New York City after 9/11).
Relative to the base case of power-dependent network capacity, figure 22 illustrates the immediate service improvement provided by permanent batteries and generators. The service loss from drained batteries during the first day is evident in the reduced slope of the restoration curve after day one. (It is not necessarily a drop in demand served because the surge of user demand has decreased from the day before and some power services have been restored). We see a delay in the improvement from portable equipment use because we assume the first trucks arrive at the end of day two through to the end of day seven in the most affected county. The use of portable equipment allows demand served to surpass electric power restoration on day five in this example. Therefore, it is possible for voice and data demand to be served ahead of electric power services and users would need to have backup power for their devices to realize this outcome. The benefit of user behavior management is not particularly evident initially because the networks are still overwhelmed by demand surge. The effectiveness of user behavior management increases with time (because it accentuates reductions in congestion), but the effect tapers off as demand surge declines back to normal levels. Optimistically, all three resilience capabilities result in 98 percent
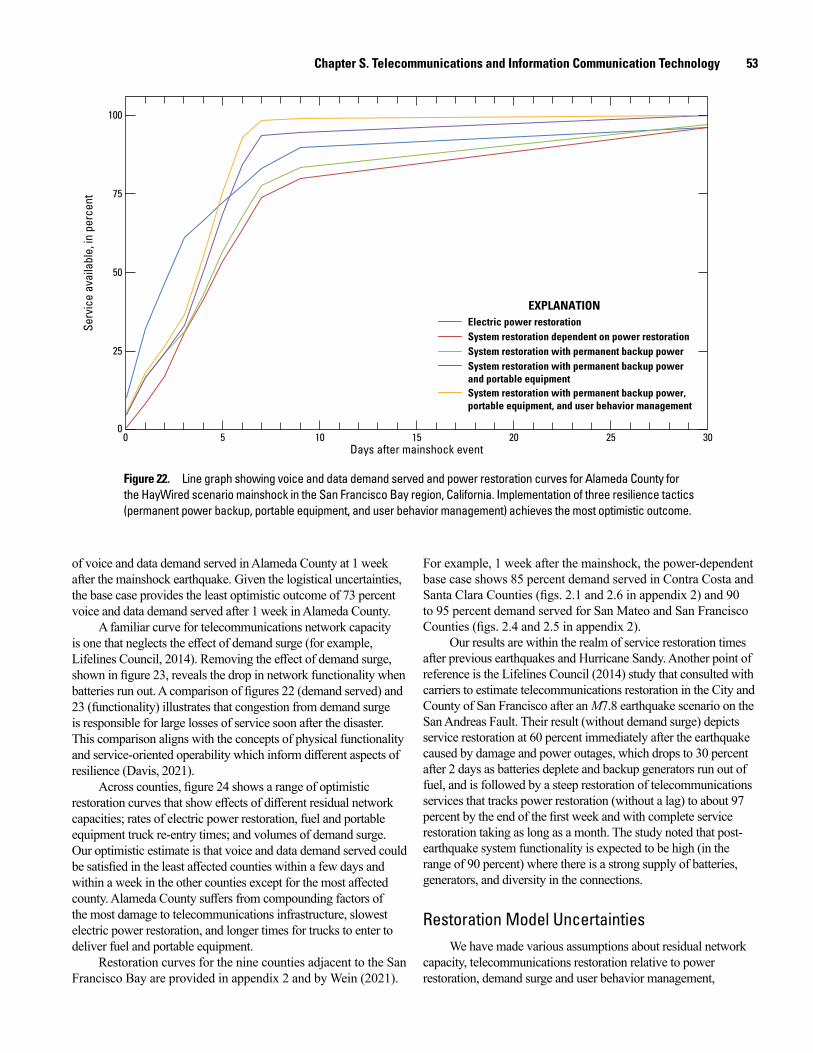
Chapter S. Telecommunications and Information Communication Technology 53
men21-7516_fig22
00
25
50
75
100
5 10 15 20 25 30Days after mainshock event
Serv
ice
avai
labl
e, in
per
cent
EXPLANATIONElectric power restorationSystem restoration dependent on power restorationSystem restoration with permanent backup powerSystem restoration with permanent backup powerand portable equipmentSystem restoration with permanent backup power,portable equipment, and user behavior management
Figure 22. Line graph showing voice and data demand served and power restoration curves for Alameda County for the HayWired scenario mainshock in the San Francisco Bay region, California. Implementation of three resilience tactics (permanent power backup, portable equipment, and user behavior management) achieves the most optimistic outcome.
of voice and data demand served in Alameda County at 1 week after the mainshock earthquake. Given the logistical uncertainties, the base case provides the least optimistic outcome of 73 percent voice and data demand served after 1 week in Alameda County.
A familiar curve for telecommunications network capacity is one that neglects the effect of demand surge (for example, Lifelines Council, 2014). Removing the effect of demand surge, shown in figure 23, reveals the drop in network functionality when batteries run out. A comparison of figures 22 (demand served) and 23 (functionality) illustrates that congestion from demand surge is responsible for large losses of service soon after the disaster. This comparison aligns with the concepts of physical functionality and service-oriented operability which inform different aspects of resilience (Davis, 2021).
Across counties, figure 24 shows a range of optimistic restoration curves that show effects of different residual network capacities; rates of electric power restoration, fuel and portable equipment truck re-entry times; and volumes of demand surge. Our optimistic estimate is that voice and data demand served could be satisfied in the least affected counties within a few days and within a week in the other counties except for the most affected county. Alameda County suffers from compounding factors of the most damage to telecommunications infrastructure, slowest electric power restoration, and longer times for trucks to enter to deliver fuel and portable equipment.
Restoration curves for the nine counties adjacent to the San Francisco Bay are provided in appendix 2 and by Wein (2021).
For example, 1 week after the mainshock, the power-dependent base case shows 85 percent demand served in Contra Costa and Santa Clara Counties (figs. 2.1 and 2.6 in appendix 2) and 90 to 95 percent demand served for San Mateo and San Francisco Counties (figs. 2.4 and 2.5 in appendix 2).
Our results are within the realm of service restoration times after previous earthquakes and Hurricane Sandy. Another point of reference is the Lifelines Council (2014) study that consulted with carriers to estimate telecommunications restoration in the City and County of San Francisco after an M7.8 earthquake scenario on the San Andreas Fault. Their result (without demand surge) depicts service restoration at 60 percent immediately after the earthquake caused by damage and power outages, which drops to 30 percent after 2 days as batteries deplete and backup generators run out of fuel, and is followed by a steep restoration of telecommunications services that tracks power restoration (without a lag) to about 97 percent by the end of the first week and with complete service restoration taking as long as a month. The study noted that post-earthquake system functionality is expected to be high (in the range of 90 percent) where there is a strong supply of batteries, generators, and diversity in the connections.
Restoration Model UncertaintiesWe have made various assumptions about residual network
capacity, telecommunications restoration relative to power restoration, demand surge and user behavior management,
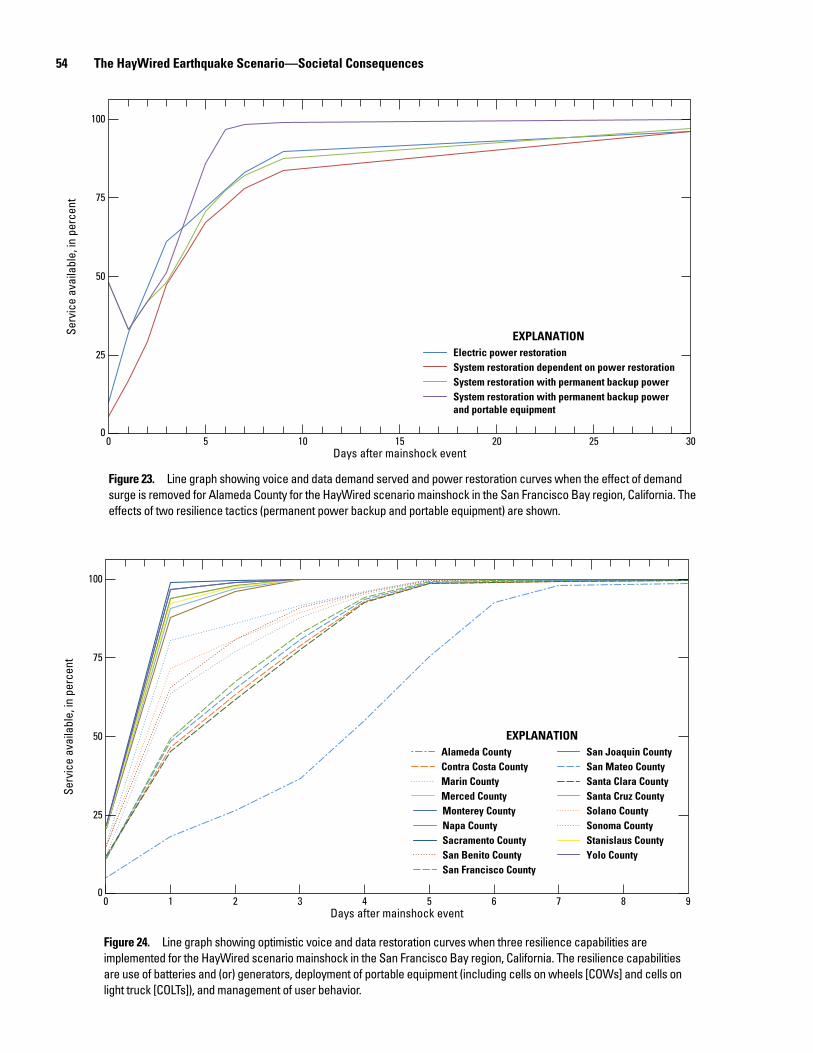
54 The HayWired Earthquake Scenario—Societal Consequences
men21-7516_fig23
00
25
50
75
100
5 10 15 20 25 30Days after mainshock event
Serv
ice
avai
labl
e, in
per
cent
EXPLANATIONElectric power restorationSystem restoration dependent on power restorationSystem restoration with permanent backup powerSystem restoration with permanent backup powerand portable equipment
Figure 23. Line graph showing voice and data demand served and power restoration curves when the effect of demand surge is removed for Alameda County for the HayWired scenario mainshock in the San Francisco Bay region, California. The effects of two resilience tactics (permanent power backup and portable equipment) are shown.
men21-7516_fig24
00
25
50
75
100
4 5 6 7 8 9Days after mainshock event
Serv
ice
avai
labl
e, in
per
cent
321
Alameda CountyContra Costa CountyMarin CountyMerced CountyMonterey CountyNapa CountySacramento CountySan Benito County
San Joaquin CountySan Mateo CountySanta Clara CountySanta Cruz CountySolano CountySonoma County
San Francisco County
Stanislaus County
EXPLANATION
Yolo County
Figure 24. Line graph showing optimistic voice and data restoration curves when three resilience capabilities are implemented for the HayWired scenario mainshock in the San Francisco Bay region, California. The resilience capabilities are use of batteries and (or) generators, deployment of portable equipment (including cells on wheels [COWs] and cells on light truck [COLTs]), and management of user behavior.
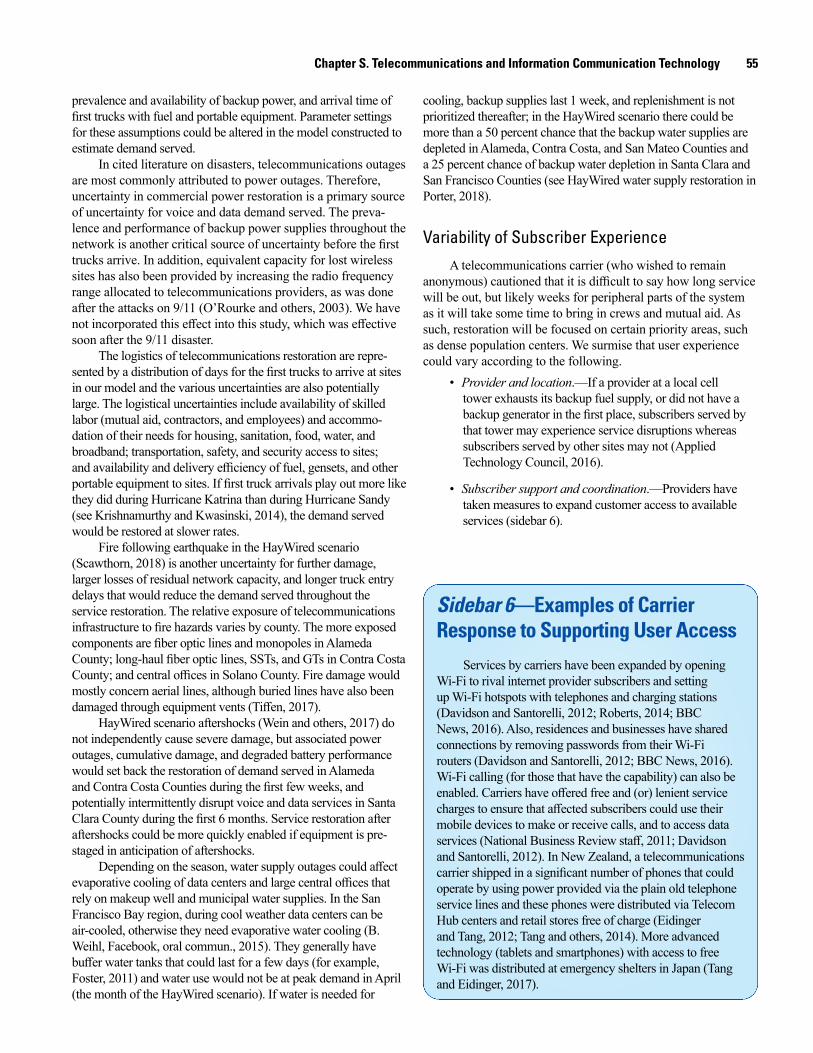
Chapter S. Telecommunications and Information Communication Technology 55
prevalence and availability of backup power, and arrival time of first trucks with fuel and portable equipment. Parameter settings for these assumptions could be altered in the model constructed to estimate demand served.
In cited literature on disasters, telecommunications outages are most commonly attributed to power outages. Therefore, uncertainty in commercial power restoration is a primary source of uncertainty for voice and data demand served. The preva-lence and performance of backup power supplies throughout the network is another critical source of uncertainty before the first trucks arrive. In addition, equivalent capacity for lost wireless sites has also been provided by increasing the radio frequency range allocated to telecommunications providers, as was done after the attacks on 9/11 (O’Rourke and others, 2003). We have not incorporated this effect into this study, which was effective soon after the 9/11 disaster.
The logistics of telecommunications restoration are repre-sented by a distribution of days for the first trucks to arrive at sites in our model and the various uncertainties are also potentially large. The logistical uncertainties include availability of skilled labor (mutual aid, contractors, and employees) and accommo-dation of their needs for housing, sanitation, food, water, and broadband; transportation, safety, and security access to sites; and availability and delivery efficiency of fuel, gensets, and other portable equipment to sites. If first truck arrivals play out more like they did during Hurricane Katrina than during Hurricane Sandy (see Krishnamurthy and Kwasinski, 2014), the demand served would be restored at slower rates.
Fire following earthquake in the HayWired scenario (Scawthorn, 2018) is another uncertainty for further damage, larger losses of residual network capacity, and longer truck entry delays that would reduce the demand served throughout the service restoration. The relative exposure of telecommunications infrastructure to fire hazards varies by county. The more exposed components are fiber optic lines and monopoles in Alameda County; long-haul fiber optic lines, SSTs, and GTs in Contra Costa County; and central offices in Solano County. Fire damage would mostly concern aerial lines, although buried lines have also been damaged through equipment vents (Tiffen, 2017).
HayWired scenario aftershocks (Wein and others, 2017) do not independently cause severe damage, but associated power outages, cumulative damage, and degraded battery performance would set back the restoration of demand served in Alameda and Contra Costa Counties during the first few weeks, and potentially intermittently disrupt voice and data services in Santa Clara County during the first 6 months. Service restoration after aftershocks could be more quickly enabled if equipment is pre-staged in anticipation of aftershocks.
Depending on the season, water supply outages could affect evaporative cooling of data centers and large central offices that rely on makeup well and municipal water supplies. In the San Francisco Bay region, during cool weather data centers can be air-cooled, otherwise they need evaporative water cooling (B. Weihl, Facebook, oral commun., 2015). They generally have buffer water tanks that could last for a few days (for example, Foster, 2011) and water use would not be at peak demand in April (the month of the HayWired scenario). If water is needed for
cooling, backup supplies last 1 week, and replenishment is not prioritized thereafter; in the HayWired scenario there could be more than a 50 percent chance that the backup water supplies are depleted in Alameda, Contra Costa, and San Mateo Counties and a 25 percent chance of backup water depletion in Santa Clara and San Francisco Counties (see HayWired water supply restoration in Porter, 2018).
Variability of Subscriber ExperienceA telecommunications carrier (who wished to remain
anonymous) cautioned that it is difficult to say how long service will be out, but likely weeks for peripheral parts of the system as it will take some time to bring in crews and mutual aid. As such, restoration will be focused on certain priority areas, such as dense population centers. We surmise that user experience could vary according to the following.
• Provider and location.—If a provider at a local cell tower exhausts its backup fuel supply, or did not have a backup generator in the first place, subscribers served by that tower may experience service disruptions whereas subscribers served by other sites may not (Applied Technology Council, 2016).
• Subscriber support and coordination.—Providers have taken measures to expand customer access to available services (sidebar 6).
Sidebar 6—Examples of Carrier Response to Supporting User Access
Services by carriers have been expanded by opening Wi-Fi to rival internet provider subscribers and setting up Wi-Fi hotspots with telephones and charging stations (Davidson and Santorelli, 2012; Roberts, 2014; BBC News, 2016). Also, residences and businesses have shared connections by removing passwords from their Wi-Fi routers (Davidson and Santorelli, 2012; BBC News, 2016). Wi-Fi calling (for those that have the capability) can also be enabled. Carriers have offered free and (or) lenient service charges to ensure that affected subscribers could use their mobile devices to make or receive calls, and to access data services (National Business Review staff, 2011; Davidson and Santorelli, 2012). In New Zealand, a telecommunications carrier shipped in a significant number of phones that could operate by using power provided via the plain old telephone service lines and these phones were distributed via Telecom Hub centers and retail stores free of charge (Eidinger and Tang, 2012; Tang and others, 2014). More advanced technology (tablets and smartphones) with access to free Wi-Fi was distributed at emergency shelters in Japan (Tang and Eidinger, 2017).
56 The HayWired Earthquake Scenario—Societal Consequences
• Service restoration priorities.—Services are restored using the Telecommunications System Priority (TSP) program to ensure that critical services receive the highest priority and to minimize service disruptions to central offices and focus on recovery of technology (for example, AT&T, 2005). Conversely, if only a feeder line from a central office to a neighborhood is affected, the neighborhood outage could receive a lower repair priority.
• Subscriber priorities.—Currently, the Government Emergency Telecommunications Service (GETS) and Wireless Priority Service (WPS) provide priority access to landline and cellular communications services when communication networks are congested after a disaster (see Cybersecurity and Infrastructure Security Agency, n.d.), but there are limitations because the service cannot preempt and cannot deny service to users, which means that the resources used to process call requests (for example, the cellular signaling channels) can still be saturated by large numbers of people trying to make calls as well as compete with text messages that are also carried on the signaling channels.
• Types of services.—Text messaging is likely more available than cellular phone calls. Some websites might be unavailable (for example, InterNAP was down after Hurricane Sandy).
• Subscriber demographics.—Households with annual incomes below $50,000 increasingly rely on cellular data for access to the internet (McHenry, 2016) and likely lack other options (for example, to switch to in-home broadband) so the impact of cellular outages on lower income users would be greater.
• Property damage.—If property damage restricts use of buildings it will by extension restrict the use of broadband in those buildings, even if broadband service remains operational.
• Subscriber preparedness for power outages.—Only the analog POTS telephone system provides power over subscriber lines. Cordless phones and answering machines, DSL modems, DOCSIS cable modems, and VoIP gateways do not work without power. Backup power for residential and small business network equipment is crucial to maintain and restore communication capabilities at scale (Applied Technology Council, 2016).
Knowledge Gaps and Study LimitationsKnowledge gaps and study limitations apply to all aspects
of our HayWired scenario analysis of physical infrastructure fragilities and voice and data service restoration. Before we address these knowledge gaps, it is important to remember that there are uncertainties and unknowns in how the Hayward Fault
will rupture in the next earthquake. Although scientists are sure that the Hayward Fault will rupture again, they cannot say when and how the fault will rupture in the next large earthquake on the Hayward Fault. Therefore, the HayWired scenario analysis characterizes situations that might arise in any San Francisco Bay region earthquake.
Earthquake Hazard Uncertainties
The hypocenter in the HayWired scenario is under the City of Oakland, but the hypocenter of the next large earthquake on the Hayward Fault could occur at other places along the fault. A rupture from a different hypocenter would affect the directivity of the shaking intensity throughout the San Francisco Bay region (Aagaard, Boatwright, and others, 2017). Likewise, the amount of slip at each point along the fault at the time of the earthquake will affect the pattern of shaking intensity and damage to the copper pair, coaxial, and fiber optic lines crossing it. The new work on liquefaction and landslide probability assessments for the mainshock have data and methodological limitations that are documented in those chapters in volumes 1 and 3 of the HayWired earthquake scenario (Jones and others, 2017; McCrink and Perez, 2017; Jones and others, this volume). In addition, the aftershock sequence could play out in an infinite number of ways. Aftershocks would likely occur within 30 miles of the epicenter, but the sequence could remain active in this area or migrate to the east, the north, or around San Francisco Bay (as it does in the HayWired scenario aftershock sequence) (Wein and others, 2017). The uncertainties in fire following earthquake are large; the numbers of burned buildings could be more or less, and fire could spread through the wildland-urban interface. There are many factors that affect fire ignitions and containment, including building stock, wind, number of fire trucks, and aspects of response (communications, roadway access, and water supply) that are also affected by other earthquake hazards (Scawthorn, 2018).
Another unknown is the impact of the earthquake sequence on the Sacramento-San Joaquin Delta levee system with respect to fiber optic conduits and amplifiers and repeaters that run through that area to serve Contra Costa County emergency services. Finally, human-caused hazards could create cascading failure and security problems if hackers take advantage of post-earthquake chaos as a cover to launch cyberattacks (for example, take advantage of victims by setting up malicious sites) or if thieves remove copper pair, coaxial, and fiber optic lines (for example, Greenberg, 2019) and gensets.
Limitations of Study Scope
The scope of this study considers only physical components of telecommunications networks. A discussion of the software for routing, management, access control, and many other functions, located either in routing or switching equipment or separate servers, is in the Applied Technology Council’s (2016) assessment. We are unaware of software incidents during an

Chapter S. Telecommunications and Information Communication Technology 57
earthquake and recognize that such an occurrence could have a more far-reaching effect.
Although we focus on two-way communication and data transmission, in an emergency, one-way wireless communication via AM and FM radio and television provides an alternative and critical source of information independent of telecommunications systems. The lower radio frequencies of television and radio broadcasts use omni-directional antennas that are not sensitive to misalignment. Indeed, radio services held up during the 2011 Christchurch earthquake in New Zealand (Mowll, 2012). In the HayWired scenario, television transmitters are not located in the most hazardous areas or exposed to the most intense landslides or fire following hazards, although 11 (less than 3 percent) AM and FM radio antennas are located in high liquefaction probability areas (Jones and others, this volume). A deeper analysis could examine exposure of fiber optic lines and coaxial data lines connecting transmission equipment, broadcast studios, and broadcast towers to earthquake hazards.
Data Limitations of Evolving Telecommunications Infrastructure Data
Unlike the analyses of water supply and transportation system infrastructures (used by Porter, 2018, and Jones and others, this volume), telecommunications technology is constantly evolving (Applied Technology Council, 2016) and no one entity can provide complete telecommunications infrastructure data. It is impractical for wireless carriers to collaborate or share data because of sensitivity of their information, overlapping network infrastructure, and the competitiveness of their industry. GeoTel periodically updates a collection of telecommunications infrastructure data and we used a 2018 version (see Telecommunications Infrastructure Data section under Methods).
The GeoTel data do not capture OLCs or DLCs, microwave links, or the trend of small cells. In 2008, most cellular infrastruc-ture was handled by large macrotowers covering many square miles, but today, wireless telecommunications are increasingly reliant on heterogeneous network (HetNet) technologies, such as distributed-antenna systems (DAS) and small cells, and this tech-nology trend will continue as the industry continues to expand the 4G network and transitions to 5G beginning in 2020.
Scant Telecommunications Infrastructure Design and Fragility Data
Neither age data nor other design parameters for facilities and equipment installation exist in the GeoTel data. We used Hazus fragility information to estimate shaking damage to central offices, data centers, unanchored equipment, and PSAP facilities. For purposes of selecting Hazus fragility information to use, we assumed that central offices and data centers are generally one to three stories tall, were built between about 1940 and the 1990s, and have walls of reinforced masonry construction plus rigid floor and roof diaphragms or have tilt-up reinforced concrete panel walls. We used the same
default fragilities for buildings supporting cellular sites for illustrative purposes. With help from industry advisors, we estimated shaking damage to cellular towers (SSTs, GTs, and monopoles) by comparing seismic loads with wind load design standards in the TIA-222-G standard. We represented the risk of overturning unanchored equipment in a central office using the minimum median capacity of typical central office equipment and loosely applied the same shaking threshold for all types of telecommunications equipment. We mapped infrastructure with respect to ground-failure probabilities and fire density to indicate potential hazard exposure falling short of integrating damage estimation across hazards.
Little is known about the fragility of optical fiber line to earthquake hazards, except for one study of shaking and liq-uefaction hazards. Furthermore, Applied Technology Council (2016) recommends conducting studies to compare mean time between failure and mean time to repair for buried versus aerial installations of fiber optic lines to test the hypothesis that buried fiber optic lines are more resilient. We are unaware of any such studies to date.
Although aftershock shaking is generally less intense than the mainshock shaking in the HayWired scenario, we were unable to account for weakening of structures and equipment or aging of the backup batteries throughout the sequence that would reduce their performance during an aftershock sequence.
Simple Model of Network Capacity and Service Restoration Times
Even if component fragilities and functionality (including uncertainties of power supplies and backup power) were better understood in the region, there is no capability to show how the networks will perform with component capacity losses in the context of network diversity, single points of failure, and correlated failures. The Applied Technology Council (2016) recommends developing computational models and tools for simulating the impact of disruptive hazard events on telecommunications design choices and restoration strategies using realistic recovery assumptions. Modeling real telecommunications systems and the effects of stresses on them is a nascent field. Simulations are being developed to answer questions about the probability of cascading outages within networks and to assess effects of call duration and how much call blocking (if a state of emergency is declared) might be necessary when a network is stressed. Researchers also aim to provide guidance on the number of COWs and COLTs to dispatch after disasters and during evacuations (V. Krishnamurthy, University of Pittsburgh, written commun., 2017). The Applied Technology Council (2016) identifies the lack of data, metrics, and tools to measure, monitor, and diagnose network system performance. Although the Federal Communications Commission gathers data about large-scale network outages both during normal operation and after hazard events, the data are currently not available for root-cause analysis or to estimate recovery times (Applied Technology Council, 2016).

58 The HayWired Earthquake Scenario—Societal Consequences
Voice and data service restoration times are needed to examine impacts to emergency response, businesses resumption, community recovery, and the digital and regional economies. Therefore, we assemble a simple model of voice and data demand served for the purpose of estimating restoration times for the HayWired scenario and investigating the effectiveness of resilience measures. We use the notion of demand served that encompasses network functionality and demand surge. Data and models needed to describe the elements of voice and data service restoration include the following:
• Functionality of telecommunications infrastructure components damaged by multiple earthquake hazards and the effect on the residual network capacity;
• The prevalence, availability, and running times of backup power options and dependence of telecommunications equipment on uncertain electric power restoration;
• Dependence of cooling equipment in data centers and central offices on water supply restoration;
• Arrival times of the first trucks carrying fuel, gensets, and portable equipment to compromised sites; and
• Spatiotemporal demand surge for voice and data services after an earthquake and effectiveness of user behavior management.
Summary and ConclusionAnalyses of telecommunications infrastructure and service
restoration for the HayWired earthquake scenario complements the Applied Technology Council’s (2016) effort that broadly considers telecommunications standards, guidelines, and per-formance criteria; lifeline infrastructure interdependencies and societal impacts; and research and operational recommendations for disaster recovery. The Applied Technology Council’s (2016) assessment concerns various hazard events and derives primarily from recent hurricane events in the United States, whereas the HayWired scenario more extensively examines the multiple haz-ards of an earthquake sequence in the San Francisco Bay region.
This chapter describes the culminating effects of a large earthquake on commercial voice and data services considering:
• Capacity losses from damage to telecommunications infrastructure caused by ground shaking, ground failure or movement (surface fault rupture, liquefaction, and landslides), and fire following earthquake.
• Amplification of network functionality losses from electrical power supply outages and battery and (or) generator backup power-supply failures.
• Network congestion from surges in demand for voice and data services, caused by subscriber activity that is above network-design capacity following a large earthquake.
• Logistical delays in deploying portable equipment, replacement parts, and fuel for power generation to failed sites.
In this final section, we first summarize the telecommunications infrastructure exposure to or damage from HayWired scenario hazards and service restoration estimates. We then draw insights on societal impacts from the reduced functionality of public safety answering point (PSAP) facilities and from other HayWired chapters regarding delays in reporting fires following an earthquake, interactions of telecommunications infrastructure with other lifeline infrastructures, information and communication needs of displaced populations, and economic consequences of voice and data service outages. In conclusion, we compile opportunities to improve the performance of telecommunications networks and restoration of services after a large earthquake by the industry, and resilience opportunities for governments, subscribers, and enterprises.
Telecommunications Infrastructure Hazard Exposure and Damage
Resilient telecommunications networks are composed of
• structures, equipment, and communication channels built to resist hazards according to their primary use;
• diverse backhaul connecting edge equipment to the core of a network;
• redundant interconnection points between operators;
• failover facilities; and
• reliable access to power and water supply (where needed for cooling).
As noted in the section on knowledge gaps, examination of resilience is limited by the paucity of performance metrics and resilience standards, response exercises, and simulations and models to test, monitor, and report network functionality and operability when some components fail. The HayWired analyses are only able to indicate potential hazard exposure or damage to certain infrastructure components. Findings of these analyses are summarized below for:
• central offices, wireless switches, and data centers;
• macrocellular sites;
• any unanchored equipment;
• wired and wireless channelsTo summarize multiple earthquake hazard impacts on infrastructure components, we expand the Applied Technology Council’s (2016) ratings for (low or high) hazard threat or preventable damage.
Chapter S. Telecommunications and Information Communication Technology 59
Central Offices, Wireless Switches, and Data Centers
For the HayWired scenario, assuming a moderate building code for typical central office buildings (reinforced masonry construction that have rigid diaphragms or tilt-up concrete), shaking damage estimates suggests nine central offices could be restricted use (yellow tag) and five central offices could be unsafe to enter or occupy (red tag) affecting more than 30 instances of carriers in central offices. Assuming the same building types for data centers, there could be only one that is yellow tagged because of the location of these facilities. Relatively more data centers are located on the San Francisco Peninsula and in the south bay, further away from the ground shaking and fire hazards caused by the Hayward Fault rupture scenario. However, more data centers are located in high (25 percent or greater) liquefaction probability areas, including six in Santa Clara County. Data centers are also exposed to the largest aftershocks in the HayWired scenario earthquake sequence. Wireless carrier switch locations appear to be largely out of harm’s way for this particular scenario.
Data centers may also outperform central offices based on Applied Technology Council’s (2016) finding that data centers are the only communication-related entities that have a comprehensive, verifiable set of standards with auditing. A new data center in San Jose features earthquake-proof design (see https://www.ragingwire.com/wholesale-data-centers/silicon-valley-california). Although carriers have indicated investments into earthquake mitigation of San Francisco Bay region central offices, the specifics of the seismic performance of the offices are unknown to the authors.
Cellular SitesWorking with the Telecommunications Industry Association
(TIA), we find self-supporting towers (SSTs) and guyed towers (GTs) designed per the TIA-222-G standard to resist high wind loads are also expected to resist the seismic loads of the HayWired scenario. The exposure of the approximately 500 towers to other HayWired scenario hazards are relatively small in number: seven are exposed to a high level of fire density in Contra Costa County, one tower is in a high liquefaction probability area in both Alameda and San Mateo Counties, and one tower is in a high landslide probability area in Santa Clara County.
In the study region, there are a large number of cellular sites (approximately 2,500) that are classified as monopoles. Of these, about 30 in each case are potentially vulnerable to shaking damage, high liquefaction probability, and (or) high level of fire density in Alameda County. The weight of the equipment (load) and height of the pole (less than 50 feet) are important considerations for avoiding shaking damage at monopole sites. We were not able to evaluate the growing trend of cellular network densification using heterogeneous network (for example, small cell) wireless sites deployed on streetlight or utility poles.
The most common location for siting of antennas or towers in the San Francisco Bay region is on buildings; approximately 5,000 buildings support cellular sites. These sites are subject to seismic building performance that could be structurally more fragile than freestanding towers, as seen in previous disasters. In the HayWired scenario, ground shaking is the dominant hazard for building-located cellular sites but building age and type data have not been associated with sites. Assuming the same building construction as for central offices and data centers, 45 percent of 820 buildings supporting cellular sites in Alameda County will receive a yellow or red tag, for example. Other hazard exposures include 7 percent of building sites in Alameda County in areas with a high density of burned buildings; 23 percent of 266 building sites in San Mateo County exposed to high (25 percent or greater) liquefaction probability; and one or two building sites in high (25 percent or greater) landslide probability areas in Contra Costa, San Mateo, Santa Clara, and Sonoma Counties. Although damage to the building does not presume damage to the cellular site, it could limit or restrict access to the site.
Overall, we expect older and (or) poorly maintained cellular towers and building sites will be more vulnerable to earthquake hazards than newer structures. The latest TIA design guidelines classify tower structures according to the importance of the cellular tower to the network and published safety of the structure in ANSI/TIA-222-G and ASCE 7 (Lanier and Garrett, 2017). The updated standard (TIA-222-H) now provides guidelines for long period motions of tall tower structures, including monopoles (B. Lanier, American Tower Corporation, written commun., 2019). TIA-222-G/H cite minimum technical information to use in designing cellular site foundations (B. Lanier, American Tower Corporation, written commun., 2019). However, when selecting a building for cellular siting it is fair to say that seismic building performance is not a primary criterion for site selection; the wireless industry primarily considers several factors, including location relative to needed coverage, lease rates, costs of preparation and construction, and so on (T. Page, Crown Castle International, oral commun., 2019).
Unanchored EquipmentThe vulnerability of unanchored equipment, including
heating, ventilation, and air conditioning systems (which performed poorly during the 1994 Northridge earthquake [Schiff, 1995]), corresponds to the shaking threshold for yellow-tagged moderate code buildings of the types assumed for data centers and central offices in our HayWired scenario analysis. Based on prior earthquake observations, unanchored equipment and other equipment failures are more common than damage to containing or supporting structures. Inconsistent wireless industry standards for anchoring equipment, tethering battery racks and equipment, and so on, within vaults and buildings create unknowns about their potential performance during an earthquake.
60 The HayWired Earthquake Scenario—Societal Consequences
Wired and Wireless ChannelsHayWired workshops in 2017–2018 and Applied Technology
Council (2016) established that backhaul from cellular sites to the backbone and core networks is as important as site performance during an earthquake to maintain functionality. Copper lines, fiber optic lines, and microwave links have been damaged by shaking, ground-failure hazards (landslide, liquefaction, and [or] fault offset), and (or) fire from earthquakes (see Telecommunications Infrastructure Exposure and Damage from HayWired Earthquake Hazards section).
In the HayWired scenario, hundreds of interoffice or long-haul fiber optic lines cross the Hayward Fault and are exposed to as much as 2 meters of surface offset from fault surface rupture and afterslip (Aagaard, Schwartz, and others, 2017). More than 1,000 kilometers of interoffice fiber optic line and more than 300 kilometers of long-haul fiber optic line run through areas with liquefaction, fire following earthquake, and (or) landslide hazards. Long-haul fiber optic line is relatively more exposed to high (25 percent or greater) liquefaction probability and high burned-building density (exposing 4 percent of lines in the region in each case), and interoffice fiber optic line is relatively more exposed to high (25 percent or greater) landslide initiation probability (exposing 2 percent of these lines in the region). Surface streets (along which copper and coaxial lines commonly run from DLCs and OLCs) are similarly exposed to these same hazards. Design guidelines are lacking for buried fiber optic line regarding ground failure hazards, including fault crossings. The Applied Technology Council (2016) concludes that fiber backbone, first- and last-mile impacts, and preventions are unknown for earthquakes.
In addition, collateral damage could result from lines collocated on bridges and power poles, along transportation corridors, and along water and energy pipeline routes that are damaged by earthquake hazards. In the HayWired analysis of collocated lifeline infrastructure (Jones and others, this volume), interoffice fiber optic line is commonly collocated with other infrastructure (oil and gas, electric power, water and waste-water transmission systems, and roadways and railway lines) in about 10,000 places in areas with one or more high-intensity hazard. Long-haul fiber optic line appears to be collocated in about 1,300 places, and 800 of these collocations are with other types of transmission infrastructure. However, based on available data, we do not know whether fiber optic line is an aerial or buried installation.
A particular example is fiber optic lines running along bridges that could be damaged by shaking or ground failure. Using geographic information systems (GIS) and bridge shaking damage estimates (Jones and others, appendix 5, this volume), we estimated that fiber optic line may be collocated on 37 and 50 medium-high and high potential impact bridges, respectively, in the HayWired scenario. Another possible transportation interaction is damage to fiber optic line in a railway easement from a train derailment (for example, Ratner, 2001) caused by shaking.
There is a further risk of causing more damage to collocated buried infrastructure during repairs. Crews using backhoes to repair buried water or natural gas pipelines have accidentally damaged buried copper or fiber optic line. Workshop participants reported that the Underground Services Alert clearinghouse of precise wire and fiber line locations are updated infrequently—not often enough to be a reliable source during an emergency.
Summary of Hazard Impacts on Infrastructure Table 23 summarizes the impacts of earthquake hazards on
key components of telecommunications networks. The table is adapted from one by the Applied Technology Council (2016). The single earthquake column in that table is expanded into five earthquake hazards here. Impact levels are characterized as low or high, where low indicates that most elements will continue to function after the exposure to the hazard, and high indicates a large fraction of the exposed components are affected. Some are preventable owing to the existence of regulations (for example, data centers) and guidelines (for example, towers). Compared to Applied Technology Council’s (2016) table, submarine lines and landings are excluded because they are not in the HayWired scenario study region (for example, Burrington, 2015), and software is excluded because we have no further information. Three rows are added to include DLCs and OLCs, building-mounted or supported cellular sites, and unanchored equipment.
Network Functionality and Demand for Services
Voice and data services are inseparable for analysis purposes owing to convergence of communication and information systems. The abilities of telecommunications networks to meet demand are affected by
• residual capacity after earthquake damage,
• equipment failure from power outages, and
• congestion from surge in demand for services after alarge earthquake.
Strategies that increase network functionality include permanent (fixed) backup power on equipment, delivery of fuel and deployment of portable equipment to sites, and management of user behavior. The effects of a large earthquake are greater than recent Public Safety Power Shutoffs (PSPS) because of damage to telecommunications infrastructure, larger expected demand for services, and damage to other infrastructure, creating fuel shortages and logistical problems in addition to electric power outages.
Residual Network CapacityResidual network capacity in each county is approximated
from the product of the residual capacity estimates for central offices or data centers, cellular towers or interoffice fiber optic lines, and long-haul fiber optic lines considering all hazards. The
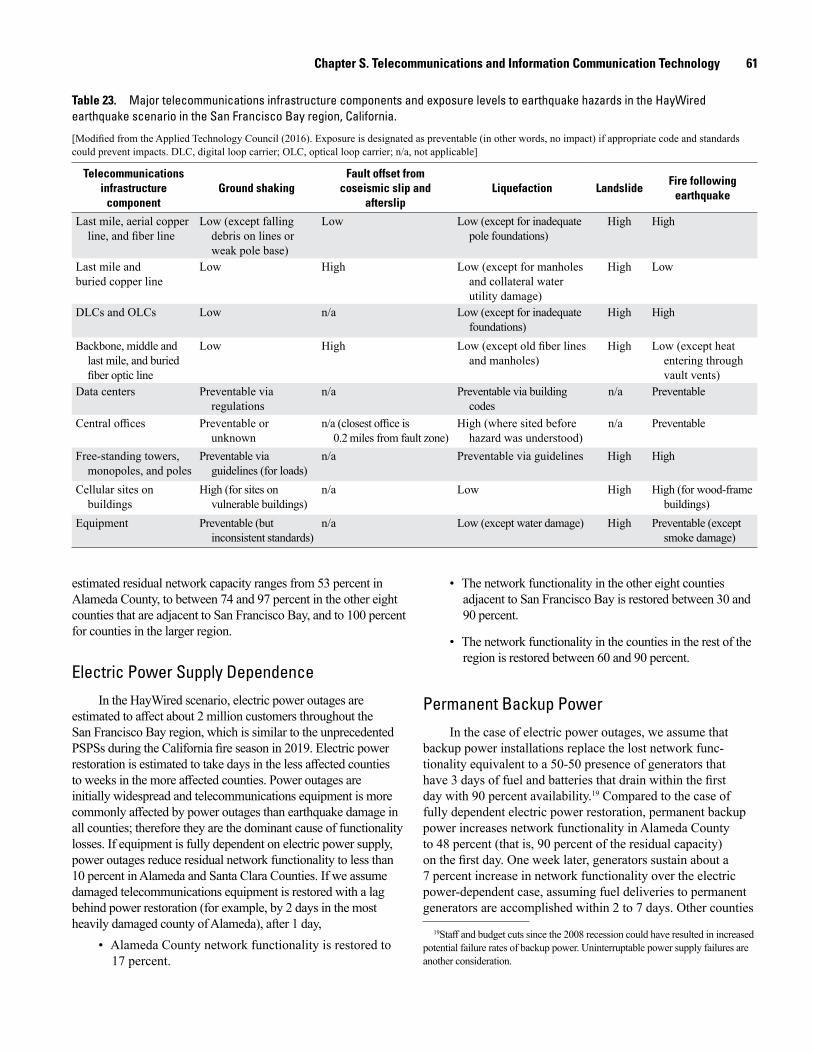
Chapter S. Telecommunications and Information Communication Technology 61
Table 23. Major telecommunications infrastructure components and exposure levels to earthquake hazards in the HayWired earthquake scenario in the San Francisco Bay region, California.
[Modified from the Applied Technology Council (2016). Exposure is designated as preventable (in other words, no impact) if appropriate code and standards could prevent impacts. DLC, digital loop carrier; OLC, optical loop carrier; n/a, not applicable]
Telecommunications infrastructure
componentGround shaking
Fault offset from coseismic slip and
afterslipLiquefaction Landslide
Fire following earthquake
Last mile, aerial copper line, and fiber line
Low (except falling debris on lines or weak pole base)
Low Low (except for inadequate pole foundations)
High High
Last mile andburied copper line
Low High Low (except for manholes and collateral water utility damage)
High Low
DLCs and OLCs Low n/a Low (except for inadequate foundations)
High High
Backbone, middle and last mile, and buried fiber optic line
Low High Low (except old fiber lines and manholes)
High Low (except heat entering through vault vents)
Data centers Preventable via regulations
n/a Preventable via building codes
n/a Preventable
Central offices Preventable or unknown
n/a (closest office is 0.2 miles from fault zone)
High (where sited before hazard was understood)
n/a Preventable
Free-standing towers, monopoles, and poles
Preventable via guidelines (for loads)
n/a Preventable via guidelines High High
Cellular sites on buildings
High (for sites on vulnerable buildings)
n/a Low High High (for wood-frame buildings)
Equipment Preventable (but inconsistent standards)
n/a Low (except water damage) High Preventable (except smoke damage)
estimated residual network capacity ranges from 53 percent in Alameda County, to between 74 and 97 percent in the other eight counties that are adjacent to San Francisco Bay, and to 100 percent for counties in the larger region.
Electric Power Supply DependenceIn the HayWired scenario, electric power outages are
estimated to affect about 2 million customers throughout the San Francisco Bay region, which is similar to the unprecedented PSPSs during the California fire season in 2019. Electric power restoration is estimated to take days in the less affected counties to weeks in the more affected counties. Power outages are initially widespread and telecommunications equipment is more commonly affected by power outages than earthquake damage in all counties; therefore they are the dominant cause of functionality losses. If equipment is fully dependent on electric power supply, power outages reduce residual network functionality to less than 10 percent in Alameda and Santa Clara Counties. If we assume damaged telecommunications equipment is restored with a lag behind power restoration (for example, by 2 days in the most heavily damaged county of Alameda), after 1 day,
• Alameda County network functionality is restored to 17 percent.
• The network functionality in the other eight counties adjacent to San Francisco Bay is restored between 30 and 90 percent.
• The network functionality in the counties in the rest of the region is restored between 60 and 90 percent.
Permanent Backup PowerIn the case of electric power outages, we assume that
backup power installations replace the lost network func-tionality equivalent to a 50-50 presence of generators that have 3 days of fuel and batteries that drain within the first day with 90 percent availability.19 Compared to the case of fully dependent electric power restoration, permanent backup power increases network functionality in Alameda County to 48 percent (that is, 90 percent of the residual capacity) on the first day. One week later, generators sustain about a 7 percent increase in network functionality over the electric power-dependent case, assuming fuel deliveries to permanent generators are accomplished within 2 to 7 days. Other counties
19Staff and budget cuts since the 2008 recession could have resulted in increased potential failure rates of backup power. Uninterruptable power supply failures are another consideration.

62 The HayWired Earthquake Scenario—Societal Consequences
show similar patterns of improvement from permanent backup power, but the improvement relative to the electric power-dependent case peaks earlier than it does in Alameda County owing to faster electric power restoration that reduces the need for backup power in those counties.
Fuel Delivery and Portable Equipment DeploymentIndustry preparedness and response is represented by
modeling portable equipment deployment and fuel deliveries to sites with equipment and (or) power failures that occur at the same rates that the first trucks arrived after Hurricane Sandy. Inherent in the first truck arrival rates are contingencies of fuel supply, labor supply, and site access; the industry expressed less concern about availability of materials and equipment. In Alameda County, the model estimates as much as a 20 percent increase in network functionality over the electric-power-dependent case (peaking on day six) from fuel and equipment delivery to failed sites when the first trucks arrive between 2 and 7 days after the earthquake. The telecommunications system could outperform the electric power system on day four. The network functionality improvements from the industry response occur quicker in other counties because first truck arrivals are modeled to happen between 1 and 5 days after the earthquake.
Network CongestionA surge in subscriber demand after a disaster can exceed
residual network capacity, and even the network design capacity before the disaster. In our model, the percentage of post-earthquake demand that can be served by pre-event design capacity is initially assumed to be 10 percent in the most affected county of Alameda. The demand surge is assumed to decline with time and distance from the earthquake. In Alameda County, the demand surge initially reduces the demand served in the fully power-dependent network to almost zero, and to 7 percent for the case of permanent backup power. Two days after the earthquake, the network is about 40 percent functional (batteries have run out) but demand served increases to 25 percent because demand surge has declined. In the permanent backup-power case, demand served is initially below 20 percent in other counties, but demand served restores faster than in Alameda County owing to faster electric power restorations, faster industry responses, and lower levels of demand surge.
If we assume that demand surge can be reduced by 10 percent from carriers doing what they can to control subscribers’ use of the networks and subscribers conforming to advice to reduce phone calls and other actions to conserve bandwidth, the model shows little initial benefit in Alameda County because the networks are still overwhelmed. However, user behavior management offers about a 9 percent increase in demand served 6 days later when network functionality has restored to 96 percent and demand only slightly exceeds the network design capacity. Similarly, in other counties, a 10 percent reduction in demand surge does not markedly
relieve congestion on the first day. This illustrates how communications are crippled when they are most needed for health and safety responses immediately after a disaster.
Societal Consequences
The percentage of voice and data demand served has societal consequences for public health and safety, restoration of other critical lifeline services, and enterprise recovery (Applied Technology Council, 2016). We flesh out some of these societal impacts using the public safety answering point (PSAP) functionality analyses in this chapter and other HayWired chapters about fire hazards, communities at risk, and economic impacts.
Health and SafetyAs is typical after a large earthquake, the safety of
populations is most threatened when communication failures are the greatest owing to reduced network functionality and surges in demand for services (for example, Yamamura and others, 2014). During the hours and days after a disaster, commercial telecommunications networks are needed for emergency response communications to alert, warn, and inform the public about their safety, resources (such as food, shelter, or medical care), and restrictions or advisories (such as road closures or boil-water advisories) (Applied Technology Council, 2016), as well as for some of their own internal response communications. The problem is well known, and all U.S. States and territories have opted into FirstNet (https://www.firstnet.com/home), a network built through a public-private partnership with AT&T, that dedicates wireless broadband for emergency responders, and possibly provides some improvements to commercial networks at the same time (for example, backup power at shared sites). The migration of public safety broadband to FirstNet has initiated in the cities of San Jose and San Francisco (for example, AT&T, 2019) and is being tested in other Hayward Fault communities, including the City of Oakland. During the adoption phase of FirstNet, the biggest concern is coverage (C. Reynolds, Bay Area Regional Interoperable Communications System [BayRICS], written commun., 2020).
Other health and safety issues are• Loss of functionality of PSAPs, further degrading 9–1–1
services,
• Delayed reporting of fires after a large earthquake,
• Inequitable services for socially vulnerable populations with fewer options, and
• Services for individuals with access and functional needs.
9–1–1 After an EarthquakeDuring and soon after disasters, PSAPs handle 9–1–1
calls for emergency services. In the HayWired scenario, facilities hosting PSAPs are not fully functional after the
Chapter S. Telecommunications and Information Communication Technology 63
Mw 7 earthquake, particularly in the hardest hit county of Alameda, where 42 percent of buildings that host PSAPs are estimated to be less than 25 percent functional on day one. The performance of 9–1–1 will depend on the extent that San Francisco Bay region PSAPs maintain critical 9–1–1 circuit diversity, central office backup power, diverse network monitoring, and backup internet or sites to improve their availability (per Federal Communications Commission, 2015, 2016; and Office of the Federal Register, 2015).
Fire Reporting
Scawthorn’s (2018) modeling of fire following earthquake for the HayWired scenario assumes that 9–1–1 systems and PSAPs are completely overwhelmed, and persons calling in to report fires cannot get through, such that responses are delayed until either fire companies themselves observe smoke from a fire, or a resident travels (drives, runs, and so on) to the fire station or company and reports the fire (a still alarm). Meanwhile, fires spread, and this has been the experience in major earthquakes (C. Scawthorn, SPA Risk LLC, written commun., 2019).
Vulnerable Populations
Socially vulnerable populations have a greater prevalence of housing-related and income-related challenges (for example, lack of home ownership, high housing cost burden, lower household incomes) and literacy challenges (for example, lower levels of education and more non-English speakers) (section B of Johnson and others, this volume). These populations disproportionately reside in areas of heavier and concentrated building damage in the HayWired scenario (section B of Johnson and others, this volume).
Socially vulnerable populations are also more likely to have only wireless connections and lower cost plans with fewer features (Anderson and Hitlin, 2016; California Emerging Technology Fund, 2017; Blumberg and Luke, 2019). Certain populations (young adults, Hispanics, renters, multifamily households, and households that have income levels below the Federal poverty line) are more likely to have given up wired telephones (whether POTS or VoIP) and have wireless only for voice service (Anderson and Hitlin, 2016; Blumberg and Luke, 2019). Households that have incomes below $50,000 per year are increasingly likely to rely on cellular data for access to the internet (McHenry, 2016). During the post-earthquake response and recovery phases, many of these people will not have the option of switching to in-home broadband for voice and data services—because they do not have it to begin with. During the 2020 pandemic, we learned that people without home broadband could not engage in distance learning, telehealth, or telework (Vogels and others, 2020; Galperin and others, 2021).
Furthermore, socially vulnerable populations residing in heavily damaged areas are prone to displacement (section B of Johnson and others, this volume). The ability for people to return home is governed by authorities allowing access that largely influences the pace and place for the recovery, including upgrades of telecommunications services (V. Krishnamurthy, University
of Pittsburgh, written commun., 2017). The telecommunications recovery process has been less favorable for areas that have socially vulnerable populations after a disaster—even without a disaster, these communities currently lag behind on installations of fiber to the curb.
Populations with Access and Functional NeedsAlthough households that have individuals with disabilities
are not disproportionately affected by concentrated building damage in the HayWired scenario (section B of Johnson and others, this volume), they are identified as having below-average rates of in-home broadband services (California Emerging Technology Fund, 2017) and therefore fewer options. Electric power and telecommunications outages compromise their ability to maintain their health, receive mobility assistance, and call for help.
Enterprise Recovery Everyday business and other enterprise operations (non-
profits and government) are generally affected by telecommu-nications disruptions for between 1 and 12 weeks after disaster events (Applied Technology Council, 2016). The Applied Technology Council (2016) proposes research be conducted to understand the economic impacts of sustained communication outages. Sue Wing and others (this volume) models 6 months of business interruption losses measured as gross state product (GSP) losses from the telecommunications service disruptions determined in this chapter. Inversely, the provision of telecom-munications services enables teleworking to reduce business interruption losses from property damage and transportation disruptions (Sue Wing and others [this volume] and Kroll and others [this volume], respectively). We elaborate on these two aspects for the HayWired scenario below.
Business Interruption Losses from Telecommunications Service Disruptions
Sue Wing and others (this volume) isolate the impact of voice and data service disruption on the macroeconomy by modeling the ripple effects of the service disruption through the sectors that supply and purchase goods and services from each other in the San Francisco Bay region and California economies. Top purchasers of telecommunications and data processing and hosting sectors include telecommunications; professional scientific and technical services; publishing, motion pictures, and broadcasting; and finance, insurance, real estate, and leasing sectors (Sue Wing and others, this volume).
In the case of electric-power-dependent telecommunications restoration, the $350 million loss of GSP is larger than the losses from electric power. However, these losses may be reduced by the implementation of various resilience measures, including carrier responses and business continuity practices. Permanent backup power on telecommunications equipment and subscriber behavior management are effective immediately; although short-lived,
64 The HayWired Earthquake Scenario—Societal Consequences
each show a reduction of about $50 million of GSP losses. The deployment of portable equipment and fuel delivery, albeit delayed, achieves a larger reduction of $150 million of business interruption losses.
Alternatively, supposing that none of these industry measures are implemented and enterprises instead use workarounds of paper records, data backup, and cash transactions to continue business with an effectiveness equivalent to 20 percent increase in voice and data services, the GSP losses are also reduced by $150 million. The effects of resilience measures are not additive, but if all are implemented, the GSP losses from telecommunications disruptions are reduced from $350 million to $37 million. To put these losses in perspective, GSP losses from property damage caused by the earthquake sequence and fire contribute 98 percent of the total estimated $43 billion GSP losses.
Business Interruption Loss Reductions from TeleworkUsing the prevalence of telework in industry sectors, Sue
Wing and others (this volume) found that telework reduced GSP losses from telecommunications service disruption by about $5 million, but more effectively reduced business interruption losses from property damages by about $3 billion or 6 percent of the estimated 6-month $43 billion of GSP losses. Kroll and others (this volume) found that halving the implementation of telecommuting in the case of highway and rapid transit transportation disruptions increased total gross regional product (GRP) losses by $4 billion or a 6 percent increase of the estimated total $67 billion of multi-year GRP losses. These results illustrate the important role of telecommunications services for teleworking that enhances economic resilience. However, the ability of employees to work remotely relies on telecommunications providers restoring internet service or at least high-quality mobile data services to homes and alternative workplaces (also see Applied Technology Council, 2016) and shifts in demand. During the 2020 pandemic, use of home-based broadband increased and was pushed out to the edges of the networks (Shanmugaraj, 2021).
Interactions with Other Lifeline Infrastructure Systems
Other lifeline infrastructure systems depend on telecommunications to monitor and operate transportation, water, and energy systems, and communicate about their statuses (Applied Technology Council, 2016). For example, during the 2014 South Napa earthquake, the supervisory control and data acquisition system for monitoring water tank levels failed owing to power outages in the absence of backup power (J. Eldredge, City of Napa, written commun., 2017). The dependence of critical infrastructure operations on telecommunications services can be seen in the economic analysis of Sue Wing and others (this volume). Electric power and various transportation sectors are among the top purchasers of telecommunications services, amounting to about 1 percent of their gross output. HayWired
telecommunications service outages reduce 6-month outputs of water and various transportation sectors by approximately 0.02 to 0.25 percent (depending on implementation of resilience measures), but output losses in the electricity and gas sectors are less sensitive.
Opportunities for Increasing Resilience
Findings from the HayWired scenario, an earthquake sequence initiated by a moment magnitude (Mw) 7.0 earthquake on the Hayward Fault, are used to identify and reinforce opportunities for improving the performance of San Francisco Bay region telecommunications networks and societal resilience to service disruptions. The following points, derived from HayWired scenario analyses and workshops, complement and overlap with those in the Applied Technology Council (2016) report about disasters, earthquake reconnaissance reports, and Bay Area Urban Area Security Initiative and other local government communications resilience programs. For providers of voice and data services, opportunities pertain to mitigating damage from multiple earthquake hazards, addressing dependencies on building sites and other lifeline infrastructure systems, preparing for restoration contingencies, using earthquake risk communications, working with governments, and managing user behavior. Societal resilience to voice and data service disruptions could be increased by emergency response planning, user preparedness, and business continuity planning.
Resilience Opportunities for Voice and Data Service Providers
1. Mitigating Damage from Multiple Earthquake Hazards
1.1. Mitigating Shaking DamageIn the HayWired scenario, ground shaking is strong
throughout the San Francisco Bay region, and violent near the fault and in sedimentary basins in the east bay. Telecommunications infrastructure that is most vulnerable to very strong or higher intensities of shaking includes older infrastructure, central offices (owing to unknown retrofit and siting standards), unanchored equipment, poles that are heavily loaded with equipment, and sites on seismically vulnerable buildings.
• Performance-based retrofits and building codes, TIA design guidelines, and development of a set of consistent standards for securing equipment and battery racks20 are
20Network Equipment-Building System GR-63 guidance for central office equipment provides a starting point for securing equipment (A. Tang, L&T Consultant, written commun., 2018).
Chapter S. Telecommunications and Information Communication Technology 65
all mitigation actions that could be taken to reduce damage to telecommunications infrastructure from shaking.
• With education, standards could be required by contracts to ensure equipment is properly installed to resist seismic events.
1.2. Mitigating Ground Failure DamageIn the HayWired scenario analysis, telecommunications
infrastructure is mapped on fault rupture and surface offset as well as liquefaction and landslide probabilities to illustrate exposures of fiber optic and copper lines, monopoles and cellular sites on buildings, and central offices and data centers in the San Francisco Bay region.
• The performance of telecommunications infrastructure could be improved with increased knowledge about ground failure hazards and geotechnical design guidance for
• Transitions from copper to fiber optic lines and (or) aerial to buried lines;
• Redundant and diverse backhaul, backbone, and inter-networking connections between central offices and data centers on opposite sides of the fault; and
• Structure and pole foundations, vaults, and manholes at sites susceptible to liquefaction and landslide hazards (see also Tang and others, 2014).
1.3. Considering Fire Following EarthquakeFire after an earthquake concentrates and spreads
building damage (especially among densely spaced wood buildings) that may affect cellular sites in the area. Fire threatens aerial lines more than buried lines but produces heat that could enter underground vaults via vents to melt lines. Smoke and soot could clog filters and interfere with heating, ventilation, and air conditioning systems.
• The telecommunications industry could be made aware of how to prevent fire ignitions from earthquake shaking and ground movement and to prepare for conflagrations after an earthquake.
• The telecommunications industry could consider fire hazards in the built environment when siting and designing equipment. For example, for vaults with active ventilation, the use of pyrostats—which will turn on fans for cooling but also shut down fans if the air temperature indicates a fire—could help reduce heat damage.
• One complicating factor of fire spread after earthquakes is the inability to report fires when communications fail, and this interaction warrants further study.
2. Addressing Dependencies on Building Sites and Other Lifeline Infrastructure Systems
2.1. Mitigating Risks to Cellular Sites on BuildingsSeismically vulnerable buildings during an earthquake
present multiple threats to cellular sites owing to large numbers of sites on buildings in the urbanized San Francisco Bay region, constraints on backup power equipment loads on top of buildings, and municipal building inspection policies that delay entry to telecommunications sites. In the past, wireless carriers were aggressive about installing backup power for buildings hosting their sites that were close to critical locations, such as government buildings and hospitals. As wireless site deployment has moved closer to population centers and especially residential areas, suitability of a site is now driven more by availability and business considerations.
• The industry could prioritize seismic building performance in siting equipment and network designs, emphasize the importance of backup power with building owners, and discuss building inspection policies with local governments in addition to the current site selection criteria of signal coverage, service expectations, and conforming to other local government regulations.
• Buildings conforming to modern building codes provide an added resiliency benefit for cellular sites located on them.
2.2. Mitigating Collateral Infrastructure DamageInteroffice and long-haul fiber optic lines are collocated
with other types of lifeline infrastructure in HayWired earthquake high-hazard-intensity areas throughout the San Francisco Bay region.
• The trend to replace buried and aerial copper wiring with buried fiber optic lines provides a stronger defense against flooding damage from water distribution pipeline breaks and fire following earthquake, respectively.
• Pole construction standards (for example, General Order 95 in California [Public Utilities Commission, 2018]) could potentially improve resiliency where infrastructure is shared.
• Lines along bridges could be designed to resist bridge damage, including installations with slack at bridge abutments (Eidinger and Tang, 2019) and redundant routes to ensure connectivity (Tang and Eidinger, 2017).
• Maintaining current knowledge of infrastructure collocations could reduce damage from digging to make repairs and help coordinate “dig once” policies.
66 The HayWired Earthquake Scenario—Societal Consequences
2.3. Decoupling Telecommunications Equipment Dependence on Commercial Electric Power
Widespread commercial electric power outages after a large earthquake can cause more equipment failures than damage to equipment from the earthquake hazards themselves. Backup power is not always available when needed and during an earthquake sequence, backup batteries may last less time than expected because lead-acid, absorbent glass mat type batteries can lose capacity with heavy use—known as damage by deep discharge (see Tang and others, 2014). Data centers and central offices operating heating, ventilation, and (or) air conditioning that require large amounts of electric power would need alternative power sources. Backup power is more limited in the last-mile distribution system from DLCs and OLCs to subscribers. HetNet (DAS and small cell) sites, deployed in the public rights-of-way near population centers, do not have permanent backup power in order to minimize cabinet size and improve visual and auditory aesthetics. The potential loss of network functionality from loss of electrical power for HetNet wireless facilities cannot be understated because network buildout is shifting from macrocells and monopoles toward network densification using DAS and small cells.
• Diesel fuel is the most efficient way to store energy (Kwasinski, 2009). Replenishment plans for on-site fuel storage could factor in multi-hazards (for example, a large earthquake occurring toward the end of a fire season of Public Safety Power Shutoffs).
• Hybrid fuel generators (for example, using natural gas) reduce the need for onsite fuel storage, but they could be a less effective redundancy in an earthquake (compared to a hurricane) where ground failure concurrently damages the gas distribution system or gas is shut off to reduce fire hazards after an earthquake.
• Use of solar panels and rechargeable batteries is increasingly more feasible and could reduce the most common causes of infrastructure failure: power supply loss, generator failures, and fuel replenishment during restoration.21
• Effective generator testing (for example, testing that exceeds 1 hour) and battery maintenance before and during the earthquake sequence could improve availability of backup power when needed.
• Backup power solutions for small cell sites are needed. The use of digital power (also known as packetized power) could be an inexpensive way to keep communication components powered at a distance by generators, or possibly via fuel cells. Another option is to build small cell networks that can be easily powered by portable generators, which can be brought in as needed during response and recovery.
21A large array of solar panels is needed to power a data center, but data centers are generally installing solar panels to supplement power supply. Only a few are installing solar panels in quantities sufficient to fully power a data center for environmental sustainability reasons.
• Providers could plan and exercise for power supply solutions for a large earthquake during Public Safety Power Shutoffs.
• Microgrids that provide a continuous power solution are changing the power supply landscape. Microgrids for telecommunications22 could be evaluated for their reliability during a widespread electric power outage after an earthquake.
2.4. Understanding Water Supply Dependencies
Heating, ventilation, and air conditioning systems use water for cooling. In the HayWired scenario, water supply restoration takes a few days to as much as 6 months.
• To better understand the water dependency for heating, ventilation, and air conditioning systems, the water supplies, usage rates, and inventories during the summer months could be assessed for data centers and central offices in the San Francisco Bay region.
3. Preparing for Telecommunications Restoration Contingencies
3.1. Planning for and Coordinating Limited Fuel Supply
Fuel supply is a large logistical uncertainty owing to time to restart refineries after an earthquake, the somewhat isolated fuel system in the San Francisco Bay region, California Air Resource Board compliancy for generator fuel, disruptions to alternative fuel transportation systems, and inefficient fuel deliveries to sites.
• Fuel needs and delivery for data centers, central offices, and cellular sites could be assessed in the San Francisco Bay region and integrated with the assessment of water and electric power utility backup fuel needs.
• Plans for shortages of California Air Resources Board compliant gasoline fuel could be developed.
• Telecommunications providers, wireless site owners and operators, and network data center operators could plan for at least 10 days of fuel shortages and develop several points of contact for fuel sourcing and transportation.
• Fuel delivery could be coordinated among multiple carriers and site owners and operators who share the same cellular sites to improve efficiency and reduce congestion on roads (see also Kwasinski and others, 2006).
22NTT (Japan) and Verizon (Garden City, New York) are telecommunications service providers deploying microgrids (A. Kwasinski, University of Pittsburgh, written commun., 2018).

Chapter S. Telecommunications and Information Communication Technology 67
3.2. Improving Cooperation with Electric Power CompaniesIn the absence of available backup power, restoration of
voice and data services depends on and lags behind electric power restoration in affected areas.
• A lesson learned for telecommunications companiesafter the Canterbury, New Zealand, earthquakewas the need to engage with power utilities beforethe next disaster (Peter Anderson, Jacobs, writtencommun., 2021).
• Better reporting of power service restoration status andplans (for example, rotating outage blocks) and coor-dination of hierarchical repairs on shared infrastructurecould improve the allocation of gensets and efficiency of telecommunications service restoration.23
3.3. Planning for Inaccessibility of SitesInaccessible telecommunications sites after an earthquake
may differ from those identified by the Applied Technology Council (2016) for hurricanes, which focus on coastal areas and floodplains.
• Backup power planning could consider isolation oftelecommunications equipment from roads blockedby landslides, dangerous or cordoned areas subject toaftershocks, bridge damage to major transportationroutes, detours resulting from fires, prohibited entry of red-tagged buildings, and hazardous material spills.
3.4. Planning for Skilled Labor SupplySkilled labor for telecommunications restoration and
repair is expected to be in short supply in the San Francisco Bay region owing to increased demand for these skills, competition from other jobs in the technology sector, and high housing costs that limit workers’ ability to live locally.
• Knowing that large earthquakes are an inevitability inthe San Francisco Bay region, an assessment of peopleas critical infrastructure and current talent gaps could beconducted.
• The knowledge gained from after-action analysis of non-earthquake disasters (fires, floods, hurricanes, and so on) could provide training opportunities for earthquakeresponse.
• Planning to take care of the people who address serviceoutages could be coordinated with communities—displaced and temporary contract labor will need food,shelter, sanitation, communications, and other support, orthese people will have to be transported to and from otherareas, causing delays and extended repair times.
• Local labor for transport and refueling could help if theyare trained in advance, instead of flying in generator delivery and refueling contractors from other areas of theUnited States.24
3.5. Planning for Supplying and Sharing Spare Parts
Nearly all commercial telecommunications providers are members of the Communications Information Sharing and Analysis Center, operating through the Department of Homeland Security and the Cybersecurity and Infrastructure Security Agency as the National Coordinating Center for Communications (NCC). Through NCC, commercial telecommunications providers may engage in spare-part sharing in cases where supply chain issues negatively affect response and recovery efforts. (S. Kisting, Proactive Telecommunications Solutions, LLC, written commun., 2020)
4. Working with Governments
4.1. Identifying Community Infrastructure VulnerabilitiesOutside of a disaster, there are tensions between communi-
ties and the telecommunications industry, including battles around local control versus Federal Communications Commission orders, and vocal concerns about the safety of high-frequency electromag-netic fields around cellular sites and perceived negative impacts of wireless facilities to property values in the San Francisco Bay region (Witkowski, 2019).
• Local jurisdictions with amateur radio members (see side-bar 7) could investigate community telecommunications infrastructure with providers to understand reliance on and potential effects of equipment failures (including power backup) on neighborhoods (also see Applied Technology Council, 2016).
• Public safety agencies could work with their providersto understand potential impacts to and backup needs foremergency operation centers and public safety broadbandsystems, including FirstNet.
4.2. Preparing for Telecommunications Restoration
Relations between communities and telecommunications providers are unofficial (also see Bay Area Urban Areas Security Initiative, 2015) and commonly contentious, as mentioned above. Most interactions between them are transactional and occur via local government’s public works and planning departments, in the context of specific applications for deployment of wireless facilities. During recent Public Safety Power Shutoffs, telecommunications providers did not have contacts for local emergency operations centers (California Public Utilities Commission hearing, oral commun., 2019).
23Some State laws, such as Act 12-148 (State of Connecticut, 2012), mandate close cooperation between electric and telecommunications utilities (Applied Technology Council, 2016).
24During the 2019 Public Safety Power Shutdowns, cellular providers brought in contract crews to transport generators and fuel to cellular sites in the blackout zones. In some cases, these crews were flown in from places like North Carolina, because the contractors in those areas have prior experience in refueling operations during hurricane response.
68 The HayWired Earthquake Scenario—Societal Consequences
• To increase resiliency, local governments and agencies could hold interviews, workshops, and exercises with communications providers and utilities, focused on planning for telecommunications restoration. One example is a San Francisco Lifelines Council effort to examine telecommunications restoration with providers (D. Mieler, City and County of San Francisco Office of Resilience and Capital Planning, written commun., 2019). Joint workshop and exercise objectives (informed by Corey Reynolds, BayRICS, written commun., 2019) may include:
• Coordination between cities, towns, counties, and the State on telecommunications restoration priorities.
• Deciding what and how information will be shared among telecommunications industry representatives, local city and county emergency operations centers, and the State.25
• Consideration of a pathway for data center and content providers to contribute to resilience efforts and (or) communicate criticality during an emergency (for example, Thompson and Evans, 2016). This would be a paradigm change to recognize the role of telecommunications operators and providers in a disaster response beyond the Federal Communications Commission regulated 9–1–1, E9–1–1, and NG9–1–1 services.
• Shared understanding of restoration and recovery processes and needs of the commercial telecommuni-cations providers, carriers, site owners and operators, and contractors.
• Pre-planning by carriers and local governments and agencies for
• Fast credentialing of outside contractors and pre-defining the process for contractors to request law enforcement escorts to reduce criminal activity (for example, when contractors are transporting high value items, such as solar panels, generators, or fuel).
• Locations for deployment of mobile assets.
• Exploring capabilities and plans to restore telecom-munications services to customers and targets (for example, number of customers restored within 1 week) together by using a local version of what is known as a “threat and hazard identification and risk assessment,” similar to the Bay Area Urban Areas Security Initiative assessment completed every 3 years for the San Francisco Bay region.
25For example, State Senate Bill 670 proposes telecommunications providers be required to notify the California Governor’s Office of Emergency Services within 60 minutes of discovery whenever an outage occurs that limits the provider’s customers’ ability to make 9–1–1 calls or receive emergency notifications (California State Senate, 2019). The California Governor’s Office of Emergency Services would notify applicable county emergency services, sheriffs, and PSAPs (California Governor’s Office of Emergency Services, 2019).
• Overcoming regulatory hurdles and permit process-ing of new and upgrades of older equipment that delay restoration of services. Local governments and telecom-munications providers could pre-define what equipment would be replaced if damage occurs, and pre-process sets of contingency applications and permits.
5. Using Earthquake Risk Communications
5.1. ShakeAlert Earthquake Early Warning SystemWarning of the strongest shaking may be received with only
seconds of notice in the San Francisco Bay region (for example, via the ShakeAlert earthquake early warning system), given sufficient distance from the epicenter (Strauss and others, this volume). In the HayWired scenario, ShakeAlert could provide as much as 25 seconds of warning of very strong (or more intense) ground shaking or prompt confirmation of an earthquake occurrence in the San Francisco Bay region (Strauss and others, this volume).
• The telecommunications industry could investigate the use of ShakeAlert in protecting their assets, data collection networks, and people. For example, it could:
• Initiate and (or) automate data failover seconds earlier than it would otherwise;
• Shut down equipment, drives, and computers, initiating backups, and so on; or
• Warn people in trenches or on towers to protect the safety of crews.
• There are some interactions and consequences to explore should the electric power company use ShakeAlert to turn off power to reduce damage ahead of heavy shaking. In that instance, backup power on telecommunications equipment could be of utmost importance for complete delivery and receipt of ShakeAlerts.
5.2. Aftershock ForecastsOnce a large earthquake has occurred, USGS aftershock
forecasts will provide expected ranges of numbers and magnitudes of aftershocks within specific time frames (next day, within a week, and so on). For example, a HayWired scenario aftershock forecast following the mainshock includes a statement, “within the next week, about 470 magnitude Mw 3 or larger aftershocks could be felt throughout the Bay Area, and about 5 aftershocks could be damaging” (Wein and others, 2017). During HayWired workshops, the telecommunications industry expressed interest in maps of aftershock forecasts in the future.
• The industry could consider use of aftershock forecasts in restoration decisions, such as
• Where to leave portable equipment in place to “pre-stage” for aftershocks;
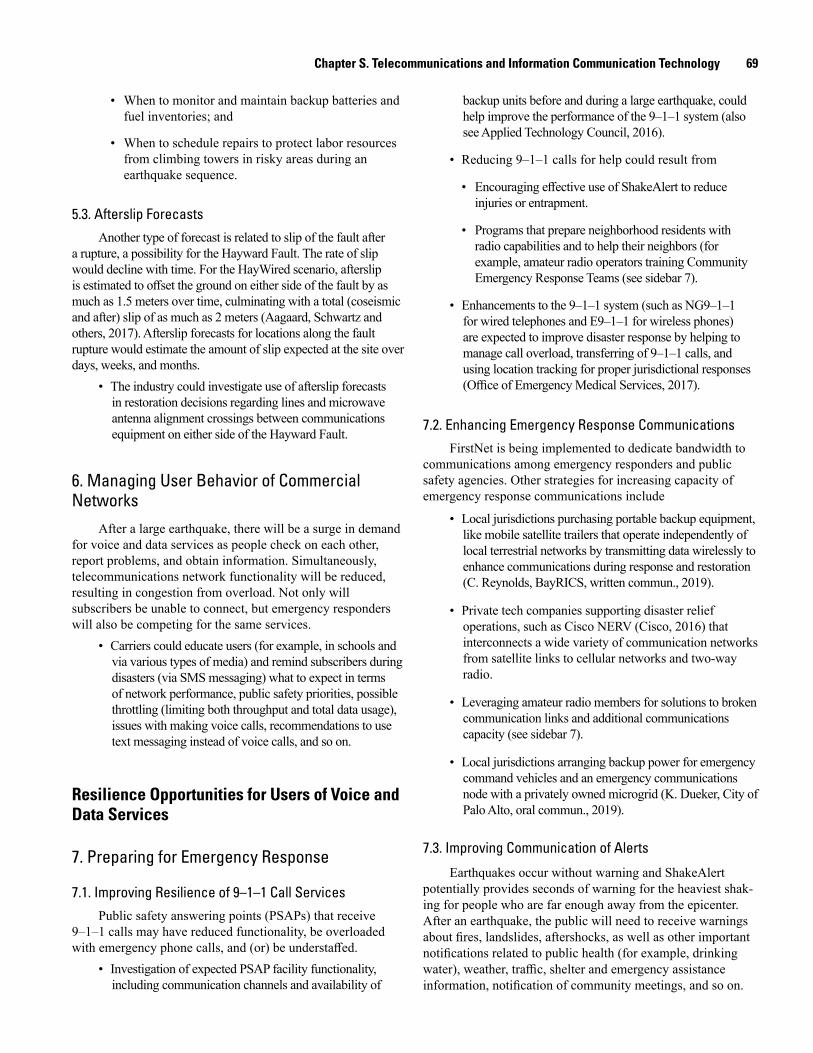
Chapter S. Telecommunications and Information Communication Technology 69
• When to monitor and maintain backup batteries and fuel inventories; and
• When to schedule repairs to protect labor resources from climbing towers in risky areas during an earthquake sequence.
5.3. Afterslip ForecastsAnother type of forecast is related to slip of the fault after
a rupture, a possibility for the Hayward Fault. The rate of slip would decline with time. For the HayWired scenario, afterslip is estimated to offset the ground on either side of the fault by as much as 1.5 meters over time, culminating with a total (coseismic and after) slip of as much as 2 meters (Aagaard, Schwartz and others, 2017). Afterslip forecasts for locations along the fault rupture would estimate the amount of slip expected at the site over days, weeks, and months.
• The industry could investigate use of afterslip forecasts in restoration decisions regarding lines and microwave antenna alignment crossings between communications equipment on either side of the Hayward Fault.
6. Managing User Behavior of Commercial Networks
After a large earthquake, there will be a surge in demand for voice and data services as people check on each other, report problems, and obtain information. Simultaneously, telecommunications network functionality will be reduced, resulting in congestion from overload. Not only will subscribers be unable to connect, but emergency responders will also be competing for the same services.
• Carriers could educate users (for example, in schools and via various types of media) and remind subscribers during disasters (via SMS messaging) what to expect in terms of network performance, public safety priorities, possible throttling (limiting both throughput and total data usage), issues with making voice calls, recommendations to use text messaging instead of voice calls, and so on.
Resilience Opportunities for Users of Voice and Data Services
7. Preparing for Emergency Response
7.1. Improving Resilience of 9–1–1 Call ServicesPublic safety answering points (PSAPs) that receive
9–1–1 calls may have reduced functionality, be overloaded with emergency phone calls, and (or) be understaffed.
• Investigation of expected PSAP facility functionality, including communication channels and availability of
backup units before and during a large earthquake, could help improve the performance of the 9–1–1 system (also see Applied Technology Council, 2016).
• Reducing 9–1–1 calls for help could result from
• Encouraging effective use of ShakeAlert to reduce injuries or entrapment.
• Programs that prepare neighborhood residents with radio capabilities and to help their neighbors (for example, amateur radio operators training Community Emergency Response Teams (see sidebar 7).
• Enhancements to the 9–1–1 system (such as NG9–1–1 for wired telephones and E9–1–1 for wireless phones) are expected to improve disaster response by helping to manage call overload, transferring of 9–1–1 calls, and using location tracking for proper jurisdictional responses (Office of Emergency Medical Services, 2017).
7.2. Enhancing Emergency Response CommunicationsFirstNet is being implemented to dedicate bandwidth to
communications among emergency responders and public safety agencies. Other strategies for increasing capacity of emergency response communications include
• Local jurisdictions purchasing portable backup equipment, like mobile satellite trailers that operate independently of local terrestrial networks by transmitting data wirelessly to enhance communications during response and restoration (C. Reynolds, BayRICS, written commun., 2019).
• Private tech companies supporting disaster relief operations, such as Cisco NERV (Cisco, 2016) that interconnects a wide variety of communication networks from satellite links to cellular networks and two-way radio.
• Leveraging amateur radio members for solutions to broken communication links and additional communications capacity (see sidebar 7).
• Local jurisdictions arranging backup power for emergency command vehicles and an emergency communications node with a privately owned microgrid (K. Dueker, City of Palo Alto, oral commun., 2019).
7.3. Improving Communication of Alerts
Earthquakes occur without warning and ShakeAlert potentially provides seconds of warning for the heaviest shak-ing for people who are far enough away from the epicenter. After an earthquake, the public will need to receive warnings about fires, landslides, aftershocks, as well as other important notifications related to public health (for example, drinking water), weather, traffic, shelter and emergency assistance information, notification of community meetings, and so on.

70 The HayWired Earthquake Scenario—Societal Consequences
Sidebar 7—Roles for the Amateur Radio Community
A disaster response resource for local government is the amateur radio community, which may have experience with the process of building both temporary and permanent networks, including obtaining permits, signing contracts with tower or building owners, installing antennas, attending to lightning protection, installing and maintaining batteries, and so on. They provided communications when existing systems failed during the 1989 Loma Prieta earthquake, the 2001 9/11 attacks, hurricanes, floods, wildfires, and recently to more reliably establish a data communication network with the American Red Cross for communication of Safe and Well updates in Puerto Rico after Hurricane Maria (Murphy and Krupa, 2017). Amateur radio can step in if the link is broken between residents and the emergency operations center for 9–1–1 emergencies (for example, Presley, 2019).
In the San Francisco Bay region, people in the amateur radio community have led the Disaster Preparedness Initiative (Joint Venture Silicon Valley, 2011), have written about Survivable Social Networks26 (Iannucci and others, 2013), and created a regional network that can support both fixed and portable data communications stations to link government and private emergency operations centers sites (for example, see San Jose Wireless Emergency Network [available at https://sjraces.org/?page_id=311], Amateur Radio Emergency Data Network [available at https://www.arednmesh.org], and Santa Clara Emergency Wireless Network [available at https://www.scc-ares-races.org/aresraces.htm]).
Amateur radio members can help prepare communi-ties by
• Participating in joint workshops and exercises about community telecommunications vulnerabilities and commercial service restoration processes (A. Ramirez and M. Kim-Molina, Bay Area Urban Areas Security Initiative, oral commun., 2019; also see Bay Area Urban Areas Security Initiative, 2019, for a regional training and exercise program).
• Training residents to use radios in their neighborhoods with predetermined channels in and out of neighborhoods (for example, Palo Alto’s emergency services volunteer program).
26These are islands of connectivity that can provide local communications for neighbors when commercial networks are down and that can link to other Survivable Social Network nodes in a mesh network.
• Jurisdictions could promote and communicate the importance of the public signing up for opt-in alerting and public safety notifications (such as “reverse 9–1–1” systems). The Bay Area Urban Areas Security Initiative is working to improve the disparate regional reverse 9–1–1 systems through its Bay Area Alert and Warning Toolkit (available at http://www.bayareauasi.org/alertandwarning).
• Jurisdictions could encourage the public to receive alerts through various modalities (such as ShakeAlert, application-based alerting, SMS alerting, fixed and mobile sirens, and National Oceanic and Atmospheric Administration [NOAA] weather radio).
• Jurisdictions could participate in tests and exercises of public alerting systems for an earthquake scenario.
7.4. Attending to Vulnerable PopulationsSocially vulnerable populations are disproportionately
affected by damage to housing and buildings in their neighbor-hoods in the HayWired scenario. Lower income populations are more vulnerable to wireless network outages because of their greater reliance on mobile devices and fewer connectivity options (for example, broadband). Language barriers may interfere with messages that do get through. Individuals with access and func-tional needs can be particularly reliant on electric power and tele-communications services to maintain their health, receive mobility assistance, and call for help.
• Emergency managers could
• Prepare messages about how to prepare to communicate before, during, and after an earthquake for population groups respecting different languages, cultures, age demographics, and people with disabilities in their communities.
• Design websites with emergency information for smartphones and tablets because users may not be able to access the internet using a desktop computer.
• Redundant wireless coverage, fiber broadband service to economically disadvantaged areas, and municipal-owned community Wi-Fi could help provide services to populations that need them most after a large earthquake. For example, during the 2020 pandemic, school districts provided cellular hotspots with prepaid SIM cards to students with access and functional needs who did not have home broadband.
• Improved identification of individuals with access and functional needs could guide Community Emergency Response Teams in making wellness checks.
7.5. Planning for Evacuations and Displaced PopulationsHundreds of thousands of people are at risk of evacuation
or displacement by earthquake damage and fire after a large earthquake in the San Francisco Bay region.
Chapter S. Telecommunications and Information Communication Technology 71
• Shelters and community resource centers could beequipped with sufficient and secure voice and dataservices, power supplies and electrical outlets, andUSB chargers (also see Lifelines Council, 2014).
• Cities and communities could exercise and plan forfacilitating communications during evacuations andtracking the movement of people over time.
8. User Preparedness
8.1. Preparing for Power OutagesUsers and subscribers are responsible for backup power
of their devices and broadband gateways. Most subscribers can no longer rely on power supplied from a central office as they did with the traditional landline telephony (POTS) systems. The industry’s use of temporary portable equipment to restore services during response means that telecommunications services may be available to a subscriber even though electric power is not restored. The positive benefit of recent PSPSs is that some residents have now experienced widespread power outages, which had not occurred since the 1989 Loma Prieta earthquake or in the age of the internet.
• For those that have not experienced power shutoffs, a day without (using) power exercise could help users betterunderstand their battery backup needs for laptops, mobiledevices, and broadband gateways. See appendix 3 forguidance on installing an uninterruptable power supply.
8.2. Being Informed About Using Voice and Data ServicesAfter a large earthquake, the usage of voice and data services
spike, exceed network design capacity, and cause congestion. Usage is concentrated in the disaster-affected area because people contact their friends and family out of concern for their safety.
• Users of telecommunications services could learn abouttriaging uses of information and communication channelsto help manage system overload. See sidebar 6 and tipsposted by the Federal Communications Commission andthe Federal Emergency Management Agency at https://www.fcc.gov/emergency.
9. Planning for Business Contingencies and Continuity
9.1. Reducing Business Interruption from Telecommunications Outages
Voice and data service disruptions could potentially have larger and more widespread impacts on businesses and the digital and broader economies than other utility outages. Telecommunications industry resilience measures of backup power are effective immediately for residual capacity but short-lived; the delivery of fuel and (or) portable equipment
to sites is more effective at reducing economic losses from telecommunications service disruption.
• While telecommunications services are being restored tomeet demand that has changed in volume and location,business continuity practices such as conservation ofbandwidth and substitution for electronic processes (forexample, using paper and local data backup27) could helpto reduce business and economic losses.
9.2. Reducing Business Interruption with TeleworkingIn the HayWired scenario, most of the business and
economic losses result from earthquake damage to buildings and their contents and transportation systems disrupting commutes. Teleworking assumptions reduce losses by about 6 percent. Teleworking in response to the ongoing COVID-19 viral pandemic has suggested even greater potential efficacy.
• Teleworker arrangements at alternative workplaces andusing cloud and other telecommunications servicesreduce business and economic impacts from propertydamage and transportation system disruptions.
However, the telecommunications industry would need to respond to changes in redistribution of demand for various services across the networks in an equitable manner.
AcknowledgmentsThe authors thank the following people for their insightful
contributions to this research: John Erichsen, EET, LLC; Scott Kisting, Proactive Telecommunications Solutions, LLC; Bryan Lanier, American Tower Corporation; Randall Schwabacher, AT&T Wireless; Randy Altom, Verizon Wireless; Mark Ehlen, Sandia National Laboratories; and Tim Ayers, Extenet Systems. The authors also thank all workshop participants, break-out group leads (Andrew Michael, Corey Reynolds, Vaidy Krishnamurthy, Scott Kisting, and Paula Scalingi), note takers (Susan Benjamin, Michael Germeraad, Gerald Kiernan, Dale Cox, Stephanie Ross, and Juliette Finzi Hart), and support crew members who made the workshop a success (Jeff Peters and Mara Tongue). Thanks also go to Matthew Jamieson for crafting the telecommunications systems figures, Corey Reynolds and Kenneth Dueker for review of the summary and opportunities, and Christopher Soulard for mapping assistance. We are incredibly grateful to two reviewers, Alex Tang and Alexis Kwasinski, who provided critical line-by-line review and much-needed technical support for improving our analyses.
Contributors to this report include• Telecommunications designers—John Erichsen and
Bryan Lanier
27Based on an informal survey with Silicon Valley municipal governments, data replication and fail-over is not a given for smaller operations such as cities, counties, and mid-sized companies.
72 The HayWired Earthquake Scenario—Societal Consequences
• Telecommunications carriers (wired, wireless, build, fix and reactive)—AT&T, Verizon, Comcast, Crown Castle International, and Extenet Systems
• Telecommunications providers and internet exchanges, level 3, State, Federal government
• Internet content providers and aggregators—Facebook
• Data storage and serving (Amazon), corporate and city Chief Information Officers
• Electric, natural gas, and water utilities
• Public safety communications, including city and county offices of emergency service
• Amateur radio operators, including the City of Cupertino Amateur Radio Emergency Service and City of San Jose Radio Amateur Civil Emergency Service
• Oversight—California Public Utilities Commission (regarding power and telecommunications)
• California Office of Emergency Services office of Access and Functional Needs—Vance Taylor
• Telecommunications and Internet Security Officers
• U.S. Geological Survey physical scientists
References Cited
Aagaard, B.T., Boatwright, J.L., Jones, J.L., MacDonald, Porter, K.A., and Wein, A.M., 2017, HayWired scenario mainshock ground motions, chap. C of Detweiler, S.T., and Wein, A.M., eds., The HayWired earthquake scenario—Earthquake hazards: U.S. Geological Survey Scientific Investigations Report 2017–5013–A–H, 126 p., https://doi.org/10.3133/sir20175013v1.
Aagaard, B.T., Schwartz, D.P., Wein, A.M., Jones, J.L., and Hudnut, K.W., 2017, HayWired scenario mainshock coseismic and postseismic surface fault slip, chap. D of Detweiler, S.T., and Wein, A.M., eds., The HayWired earthquake scenario—Earthquake hazards: U.S. Geological Survey Scientific Investigations Report 2017–5013–A–H, 126 p., https://doi.org/10.3133/sir20175013v1.
Alliance for Telecommunications Industry Solutions, 2014, Network equipment—Earthquake resistance: Alliance for Telecommunications Industry Solutions report ATIS-0600329.2014, 33 p.
American Red Cross, 2021, Let family know you’re safe—Use Red Cross app and website, accessed March 31, 2021, at https://www.redcross.org/about-us/news-and-events/news/Learn-More-about-Red-Cross-Safe-and-Well-App-Feature-and-Website.html.
Anderson, M., and Hitlin, P., 2016, Social media conversations about race: Pew Research Center, 34 p., accessed January 24, 2020, at https://www.pewresearch.org/internet/wp-content/uploads/sites/9/2016/08/PI_2016.08.15_Race-and-Social-Media_FINAL.pdf.
Applied Technology Council, 2005, ATC-20 building safety evaluation forms and placards: Applied Technology Council web page, accessed December 15, 2017, at https://www.atcouncil.org/atc-20.
Applied Technology Council, 2016, Critical assessment of lifeline system performance—Understanding societal needs in disaster recovery: Applied Technology Council Grant/Contractor Report 16-917-39, 392 p., accessed April 1, 2021, at https://nvlpubs.nist.gov/nistpubs/gcr/2016/NIST.GCR.16-917-39.pdf.
Applied Technology Council, 2018, Seismic Performance Assessment of Buildings, Volume 2—Implementation Guide (2d ed.): Federal Emergency Management Agency report FEMA P-58-2, 378 p., accessed April 1, 2021, at https://femap58.atcouncil.org/documents/fema-p-58/25-fema-p-58-volume-2-implementation-second-edition/file.
AT&T, 2005, Network disaster recovery: AT&T web page, accessed December 14, 2017, at https://www.corp.att.com/ndr.
AT&T, 2019, San Jose deploys FirstNet capabilities: AT&T news release, June 26, 2019, accessed January 23, 2020, at https://about.att.com/story/2019/san_jose_deploys_fn.html.
Bark, S., 2011, East coast earthquake brings cell networks down: RCR Wireless News, August 23, 2011, accessed December 15, 2017, at https://www.rcrwireless.com/20110823/carriers/east-coast-earthquake-brings-cell-networks-down.
Baron, E., 2017, Danger, road closures hamper efforts to restore phone and internet service in North Bay fire areas: San Jose Mercury News, October 13, 2017, accessed December 14, 2017, at http://www.mercurynews.com/2017/10/10/danger-road-closures-hamper-efforts-to-restore-phone-and-internet-service-in-fire-areas.
Barwick, H., 2011, Christchurch data centers survive earthquake: Computerworld blog post, February 23, 2011, accessed October 1, 2019, at http://www2.computerworld.com.au/article/377644/christchurch_data_centres_survive_earthquake.
Bay Area Urban Areas Security Initiative, 2015, Bay Area emergency agreements analysis—Summary report: Bay Area Urban Areas Security Initiative, 45 p., accessed December 17, 2019, at http://bayareauasi.org/sites/default/files/resources/081315%20Agenda%20Item%2010%20Appendix%20A%20Emergency%20Agreements%20Analysis%20Summary%20Report.pdf.
Bay Area Urban Areas Security Initiative, 2019, Training & exercise: Bay Area Urban Areas Security Initiative web page, accessed January 23, 2020, at http://www.bayareauasi.org/programs/training.
Chapter S. Telecommunications and Information Communication Technology 73
BBC News, 2016, Italy quake rescuers ask locals to unlock their wi-fi: BBC News, August 25, 2016, accessed December 14, 2017, at http://www.bbc.com/news/technology-37186290.
Bell Systems, 1974, Engineering planning—Long lines plans for survivable communications: Bell System Practices Section 001–780–201 LL, 16 p., accessed December 14, 2017, at http://www.long-lines.net/documents/BSP-001-780-201-LL/p01.html.
Bilham, R., 2010, Lessons from the Haiti earthquake: Nature, v. 463, no. 7283, p. 878–879.
Blagdon, J., 2013, Verizon bringing FiOS to Fire Island to make up for Hurricane Sandy damage: The Verge, September 10, 2013, accessed December 15, 2017, at https://www.theverge.com/2013/9/10/4717286/verizon-bringing-fios-to-fire-island-to-make-up-for-hurricane-sandy-damage.
Blumberg, S.J., and Luke, J.V., 2009, Wireless substitution—Early release of estimates from the National Health Interview Survey, July-December 2008: Division of Health Interview Statistics of the National Center for Health Studies, 13 p., accessed October 2, 2019, at https://www.cdc.gov/nchs/data/nhis/earlyrelease/wireless200905.pdf.
Blumberg, S.J., and Luke, J.V., 2019, Wireless substitution—Early release of estimates from the National Health Interview Survey, July–December 2018: Division of Health Interview Statistics, National Center for Health Studies, 13 p, accessed October 2, 2019, at https://www.cdc.gov/nchs/data/nhis/earlyrelease/wireless201906.pdf.
Burrington, I., 2015, Where the cloud rises from the sea: The Atlantic, November 12, 2015, accessed December 14, 2017, at https://www.theatlantic.com/technology/archive/2015/11/where-the-cloud-rises-from-the-sea/415236.
California Emerging Technology Fund, 2017, Broadband internet connectivity and the “Digital Divide” in California—2017: University of California at Berkeley Institute of Governmental Studies, 20 p., accessed December 14, 2017, at https://www.cetfund.org/wp-content/uploads/2020/01/002_CETF_2017_002_IGS_Poll_CA_Digital_Divide.pdf.
California Governor’s Office of Emergency Services, 2019, Notice of proposed rulemaking: California Governor’s Office of Emergency Services, 7 p., accessed January 8, 2020, at https://www.caloes.ca.gov/PublicSafetyCommunicationsSite/Documents/NoticeofProposedRulemaking.pdf.
California State Senate, 2019, Telecommunications—Community isolation outage—Notification: California Government Code, bill 670, chap. 412, §53122, accessed January 23, 2020, at https://leginfo.legislature.ca.gov/faces/billTextClient.xhtml?bill_id=201920200SB670.
Cheng, R., 2012, How Verizon kept wireless service going after Sandy hit: CNET blog post, November 5, 2012, accessed October 2, 2019, at https://www.cnet.com/news/how-verizon-kept-wireless-service-going-after-sandy-hit.
Cisco, 2016, Cisco Network Emergency Response Vehicle: Cisco, 2 p., accessed December 15, 2017, at https://www.cisco.com/c/dam/en_us/solutions/industries/docs/gov/NERV_AAG.pdf.
City of New York, 2013, Telecommunications, chap. 9 in City of New York, A stronger, more resilient New York: New York City Special Initiative for Rebuilding and Resiliency report, 438 p., accessed October 1, 2019, at https://www1.nyc.gov/site/sirr/report/report.page.
Communications Security, Reliability, and Interoperability Council, 2014, Final report—Legacy best practices: Communications Security, Reliability, and Interoperability Council Working Group 7 report, 165 p., accessed June 21, 2019, at https://transition.fcc.gov/pshs/advisory/csric4/CSRIC%20IV%20WG7%20Legacy%20Best%20Practices%20Final.pdf.
Corley, A-M., 2010, Why Haiti’s cellphone networks failed: IEEE Spectrum, February 19, 2010, accessed December 14, 2017, at https://spectrum.ieee.org/telecom/wireless/why-haitis-cellphone-networks-failed.
Covello, V.T., 2003, Best practices in public health risk and crisis communication: Journal of Health Communication, v. 8, no. S1, p. 5–8.
Crooks, A., Croitoru, A., Stefanidis, A., and Radzikowski, J., 2013, #Earthquake—Twitter as a distributed sensor system: Transactions in GIS, v. 17, no. 1, p. 124–147.
Cybersecurity and Infrastructure Security Agency, [n.d.], Emergency communications: Cybersecurity and Infrastructure Security Agency web page, accessed April 24, 2021, at https://www.cisa.gov/emergency-communications.
Davidson, C.M., and Santorelli, M.J., 2012, Communications Network Outages—Learning from Hurricane Sandy: Briefing to the Advanced Communications Law and Policy Institute, 10 p., accessed December 14, 2017, at http://comms.nyls.edu/ACLP/ACLP-Briefing-Network-Outages-December-2012.pdf.
Davis, C.A., 2021, Understanding functionality and operability for infrastructure system resilience: Natural Hazards Review, v. 22, no. 1, 6 p., https://doi.org/10.1061/(ASCE)NH.1527-6996.0000431.
Donnelly, N., and Proctor-Thomson, S., 2013, Working from home—Lessons from the Christchurch experience: Victoria University of Wellington report, prepared for Inland Revenue Te Tari Taake and the Public Service Association Te Pūkenga Here Tikanga Mahi, 54 p., accessed December 14, 2017, at https://www.victoria.ac.nz/som/researchprojects/research-reports-vms/IRPSA-Working-From-Home-Report-FINAL.pdf.
74 The HayWired Earthquake Scenario—Societal Consequences
DPS Telecom, 2016, What is a supervisory control and data acquisition system?: DPS Telecom web page, accessed December 14, 2017, at http://www.dpstele.com/scada/what-is.php.
Dwyer, C., 2018, Verizon throttled firefighters’ data as Mendocino wildfire raged, fire chief says: NPR, August 22, 2018, accessed October 2, 2019, at https://www.npr.org/2018/08/22/640815074/verizon-throttled-firefighters-data-as-mendocino-wildfire-raged-fire-chief-says.
Earthquake Engineering Research Institute, 2010, Learning from earthquakes—The Mw 8.8 Chile earthquake of February 27, 2010: Earthquake Engineering Research Institute Special Earthquake Report, 20 p., accessed December 15, 2017, at https://www.eeri.org/site/images/eeri_newsletter/2010_pdf/Chile10_insert.pdf.
Edison Research, 2016, The Infinite Dial 2016—Edison Research and Triton Digital presentation, accessed on December 14, 2017, at http://www.edisonresearch.com/wp-content/uploads/2016/03/The-Infinite-Dial-2016.pdf.
Eidinger, J., and Tang, A.K., eds., 2012, Christchurch, New Zealand earthquake sequence of Mw 7.1 September 04, 2010, Mw 6.3 February 22, 2011, Mw 6.0 June 13, 2011—Lifeline performance: Technical Council on Lifeline Earthquake Engineering Monograph no. 40, American Society of Civil Engineers, 327 p., accessed December 14, 2017, at http://www.geengineeringsystems.com/ewExternalFiles/TCLEE%20Monograph%20Rev%200%20lr.pdf.
Eidinger, J., and Tang, A.K., 2019, Hokkaido, Japan, Mw 6.7 earthquake of September 6, 2018—Lifeline performance: The Council of Lifeline Earthquake Engineering no. 4, G&E Report R98.23.01 (revision 1), 228 p., accessed September 30, 2019, at http://www.geengineeringsystems.com/ewExternalFiles/TCLEE%20No.%204.pdf.
Erichsen, J.R., [n.d.], ANSI/TA-222-G explained: Tower Numerics, Inc., presentation, 44 p., accessed November 6, 2019, at http://www.towernx.com/downloads/TIA-222-G_Explained.pdf.
Federal Communications Commission, 2015, Emergency Alert System (EAS): Federal Communications Commission web page, accessed December 15, 2017, at https://www.fcc.gov/consumers/guides/emergency-alert-system-eas.
Federal Communications Commission, 2016, Improving 911 reliability; reliability and continuity of communications networks, including broadband technologies: Federal Communications Commission no. DA-16-525, 4 p., accessed March 31, 2021, at https://www.fcc.gov/document/improving-911-reliability-0.
Federal Communications Commission, 2017a, Wireless Emergency Alerts (WEA): Federal Communications Commission web page, accessed December 14, 2017, at https://www.fcc.gov/consumers/guides/wireless-emergency-alerts-wea.
Federal Communications Commission, 2017b, FCC/FEMA tips for communicating during an emergency: Federal Communications Commission web page, accessed December 15, 2017, at https://www.fcc.gov/consumers/guides/fccfema-tips-communicating-during-emergency.
Federal Communications Commission, 2018, Tips for making 911 wireless calls: Federal Communication Commission web page, accessed on January 24, 2020 at https://www.fcc.gov/consumers/guides/911-wireless-services.
Federal Communications Commission, 2019, Voice telephone services—Status as of December 31, 2019: Federal Communications Commission, Industry Analysis Division Office of Economics and Analytics, 17 p., accessed November 4, 2019, at https://docs.fcc.gov/public/attachments/DOC-359343A1.pdf.
Federal Emergency Management Agency, 2012, Hazus multi-hazard loss estimation methodology, earthquake model, Hazus®–MH 2.1 technical manual: Federal Emergency Management Agency, Mitigation Division, 718 p., accessed July 18, 2017, at https://www.fema.gov/sites/default/files/2020-09/fema_hazus_earthquake-model_technical-manual_2.1.pdf.
Fenwick, T., 2011, Emergency telephone call services and the February 2011 Christchurch earthquake—A review for the Ministry of Economic Development: [New Zealand] Ministry of Economic Development, Energy and Communications Branch, 39 p., accessed March 31, 2021, at https://docplayer.net/9972420-Emergency-telephone-call-services-and-the-february-2011-christchurch-earthquake.html.
Fiber Optic Administration, 2016, NECA/FOA–301 fiber optic installation standard: Fiber Optic Administration web page, accessed December 15, 2017, at https://www.thefoa.org/NECA301.html.
Fitchard, K., 2014, When the network gets fried—A photographic look inside AT&T’s disaster recovery operations, GIGAOM blog post, May 16, 2014, accessed November 6, 2019, at https://gigaom.com/2014/05/16/when-the-network-gets-fried-a-photographic-look-inside-atts-disaster-recovery-operations/.
Foster, C., 2011, Earthquake performance of telecommunications infrastructure in Christchurch 2010/2011, in International Telecommunications Energy Conference, 33rd, Amsterdam, Netherlands, 2011, Proceedings: Institute of Electrical and Electronics Engineers, p. 1–5, accessed December 14, 2017, at http://ieeexplore.ieee.org/document/6099735.

Chapter S. Telecommunications and Information Communication Technology 75
Fukuda, K., Aoki, M., Abe, S., Ji, Y., Koibuchi, M., Nakamura, M., Yamada, S., and Urushidani, S., 2011, Impact of Tohoku earthquake on R&E network in Japan [abs.]: Proceedings of the Special Workshop on Internet and Disasters, Tokyo, Japan, December 6–9, 2011, 6 p., accessed September 30, 2019, at https://doi.org/10.1145/2079360.2079361.
Galperin, H., Bar, F., Traube, D., and Le., T.V., 2021, CETF-USC statewide broadband adoption survey--Supporting sustainability and expanding learning and health services through broadband investments: California Emerging Technology Fund and the University of Southern California report, 13 p, accessed August 1, 2021, at http://arnicusc.org/wp-content/uploads/2021/05/Statewide-Survey-on-Broadband-Adoption-Sustainability-and-Green-Strategies.pdf.
GeoTel Communications, 2018, Telecom data products: GeoTel Communications web page, accessed December 14, 2018, at https://www.geo-tel.com/telecom-data-sets-overview.
Giovinazzi, S., Austin, A., Ruiter, R., Foster, C., Nayyerloo, M., Nair, N.-K., and Wotherspoon, L.M., 2017, Resilience and fragility of the telecommunication network to seismic events—Evidence at the Kaikoura (New Zealand) earthquake: Bulletin of the New Zealand Society for Earthquake Engineering, v. 50, no. 2, p. 318–328.
Grant, G.M., Poloski, J.P., Luptak, A.J., Gentillon, C.D., and Galyean, W.J., 1996, Emergency diesel engine generator power system reliability 1987–1993: Idaho National Engineering Laboratory Publication INEL-95/0035, 213 p., accessed April 6, 2020, at https://inldigitallibrary.inl.gov/Reports/INEL-95-0035.pdf.
Greenberg, 2019, Mount Rainier High School is latest school targeted by copper wire thieves in recent weeks: K5 News, September 23, 2019, accessed January 24, 2020 at https://www.king5.com/article/news/local/string-of-copper-wire-thefts-at-athletic-fields/281-aad407fb-c5ee-4cd3-a915-aae8e267f2dd.
Hart, P.W., Tucker, R., Yuce, H.H., Varachi, J.P., Wieczorek, C.J., and DeVito, A., 1991, Effect of earthquake motion on the mechanical reliability of optical cables, in Microelectronic Interconnect and Integrated Processing Symposium, San Jose, California, 1990, Proceedings: Society of Photo-Optical Instrumentation Engineers, v. 1366, Fiber Optics Reliability—Benign and Adverse Environments IV, 9 p.
Heidemann, J., Quan, L., and Pradkin, Y., 2013, A preliminary analysis of network outages during Hurricane Sandy: University of Southern California Information Science Institute Technical Report ISI-TR-685b, 8 p., accessed May 7, 2019, at https://www.isi.edu/~johnh/PAPERS/Heidemann12d.pdf.
Hill, B., 2016, Pandora, YouTube, AM/FM, Spotify compete for ears as American listenership evolves—Infinite Dial 2016: Radio and Internet News blog post, March 10, 2016, accessed October 2, 2019, at http://rainnews.com/pandora-youtube-amfm-spotify-compete-for-ears-as-american-listenership-evolves-infinite-dial-2016/.
Hoffner, A., Lee, S., and Park, S.J., 2015, “I miss my mobile phone!”—Self-expansion via mobile phone and responses to phone loss: New Media and Society, v. 18, no. 11, p. 2,452–2,468, accessed March 1, 2021, at https://doi.org/10.1177/1461444815592665.
Hudnut, K.W., Wein, A.M, Cox, D.A., Perry, S.C., Porter, K.A., Johnson, L.A., and Strauss, J.A., 2017, The HayWired scenario—How can the San Francisco Bay region bounce back from or avert an earthquake disaster in an interconnected world?, chap. A of Detweiler, S.T., and Wein, A.M., eds., The HayWired earthquake scenario—Earthquake hazards: U.S. Geological Survey Scientific Investigations Report 2017–5013–A–H, 126 p., https://doi.org/10.3133/sir20175013v1.
Iannucci, B., Cali, J., Caney, R., and Kennedy, S., 2013, A Survivable Social Network: International Conference on Technologies for Homeland Security, Waltham, Mass., Proceedings: Institute of Electrical and Electronics Engineers, p. 252–258, accessed March 31, 2021, at https://doi.org/10.1109/THS.2013.6699009.
Informa, 2014, Weekend earthquake a disaster recovery reminder: ITPro Today blog post, August 27, 2014, accessed October 1, 2019, at https://www.itprotoday.com/colocation/weekend-earthquake-disaster-recovery-reminder.
Internet and Television Association, 2012, Lessons learned from the Tohoku earthquake: NCTA—The Internet and Television Association web page, accessed December 18, 2019, at https://www.ncta.com/whats-new/lessons-learned-from-the-tohoku-earthquake.
Intuit, 2010, Intuit 2020 report—Twenty trends that will shape the next decade: Inutit, 26 p., accessed October 1, 2019, at http://http-download.intuit.com/http.intuit/CMO/intuit/futureofsmallbusiness/intuit_2020_report.pdf.
Jia, J.S., Jia, J., Hsee, C.K., and Shiv, B., 2017, The role of hedonic behavior in reducing perceived risk: Psychological Science, v. 28, no. 1, p. 23–35. [Also available at https://doi.org/10.1177%2F0956797616671712].
Joint Venture Silicon Valley, 2011, Disaster preparedness: Joint Venture Silicon Valley web site, accessed December 15, 2017, at https://jointventure.org/initiatives/completed-initiatives/disaster-preparedness.

76 The HayWired Earthquake Scenario—Societal Consequences
Jones, J.L., Knudsen, K.L., and Wein, A.M., 2017, HayWired scenario mainshock—Liquefaction probability mapping, chap. E of Detweiler, S.T., and Wein, A.M., eds., The HayWired earthquake scenario—Earthquake hazards: U.S. Geological Survey Scientific Investigations Report 2017–5013–A–H, 126 p., https://doi.org/10.3133/sir20175013v1.
Kamprath, M., 2014, The Napa quake’s impact on regional internet usage—Going mobile in a crisis: Quantcast blog post, August 25, 2014, accessed December 15, 2017, at https://www.quantcast.co.uk/blog/the-napa-quakes-impact-on-regional-internet-usage-going-mobile-in-a-crisis.
Khanal, A.R., 2015, Nepal’s experience in responding to a disaster—A telecommunications/ICT sector perspective, in Regional Development Forum, Bangkok, Thailand, August 21, 2015, Proceedings: International Telecommunication Union, presentation accessed October 1, 2019, at https://www.itu.int/en/ITU-D/Regional-Presence/AsiaPacific/Documents/Events/2015/August-RDF2015/Session-4/S4_Ananda_Raj_Khanal.pptx.
Krishnamurthy, V., and Kwasinski, A., 2014, Empirically validated availability model of information and communication technologies facilities under hurricane conditions, in International Telecommunications Energy Conference, 36th, Vancouver, British Columbia, September 28–October 2, 2014, Proceedings: Institute of Electrical and Electronics Engineers, 8 p., accessed December 15, 2017, at https://doi.org/10.1109/INTLEC.2014.6972189.
Krishnamurthy, V., Kwasinski, A., and Dueñas-Osorio, L., 2016, Comparison of power and telecommunications dependencies and interdependencies in the 2011 Tohoku and 2010 Maule earthquakes: Journal of Infrastructure Systems, v. 22, no. 3, 16 p.
Kwasinski, A., 2009, Telecommunications outside plant power infrastructure—Past performance and technological alternatives for improved resilience to hurricanes, in International Telecommunications Energy Conference, 31st, Incheon, South Korea, October 18–22, 2009, Proceedings: Institute of Electrical and Electronics Engineers, 6 p., accessed July 26, 2019, at https://doi.org/10.1109/INTLEC.2009.5352092.
Kwasinski, A., 2010, Analysis of vulnerabilities of telecommunication systems to natural disasters, in International Systems Conference, San Diego, California, April 5–8, 2010, Proceedings: Institute of Electrical and Electronics Engineers, p. 359–364, accessed July 26, 2019, at https://doi.org/10.1109/SYSTEMS.2010.5482356.
Kwasinski, A., 2012, Hurricane Sandy effects on communication systems: University of Texas at Austin preliminary report no. PR-AK-0112-2012, 21 p., accessed December 14, 2017, at http://users.ece.utexas.edu/~kwasinski/preliminary%20telecom%20report%20v3%20comp.pdf.
Kwasinski, A., Weaver, W.W., Krein, P.T., and Chapman, P.L., 2006, Hurricane Katrina—Damage assessment of power infrastructure for distribution, telecommunication, and backup: Grainger Center for Electric Machinery and Electromechanics at the University of Illinois at Urbana-Champaign Technical Report CEME-TR-06-05, 176 p., accessed October 2, 2019, at https://www.ideals.illinois.edu/handle/2142/34919.
Lanier, B., and Garrett, W., 2017, Classification of tower structures per ANSI/TIA-222-G, IBC and ASCE 7, planning advisory notice: Tower Times, January–February 2017, accessed November 6, 2019 at https://tirap.org/wp-content/uploads/2017/06/PAN_ClassTwrStructures_Jan-Feb_2017.pdf.
Lieber, J., and Puente, L., 2016, Beyond the gig economy—How new technologies are reshaping the future of work: Thumbtack, 24 p., accessed April 1, 2021, at https://www.slideshare.net/JonathanLieber1/beyond-the-gig-economy.
Lifelines Council, 2014, Lifelines interdependency study: The City and County of San Francisco, 56 p., accessed October 20, 2017, at http://sfgov.org/esip/sites/default/files/Documents/homepage/LifelineCouncil%20Interdependency%20Study_FINAL.pdf.
McCrink, T.P., and Perez, F.G., 2017, HayWired scenario mainshock—Earthquake-induced landslide hazards, chap. F of Detweiler, S.T., and Wein, A.M., eds., The HayWired earthquake scenario—Earthquake hazards: U.S. Geological Survey Scientific Investigations Report 2017–5013–A–H, 126 p., https://doi.org/10.3133/sir20175013v1.
McHenry, G., 2016, Evolving technologies change the nature of internet use: National Telecommunications and Information Administration blog post, April 19, 2016, accessed December 15, 2017, at https://www.ntia.doc.gov/blog/2016/evolving-technologies-change-nature-internet-use.
Mercer, B., 2014, Napa earthquake first major bay area quake in smart phone, social media technology age: CBS SF Bay Area, August 25, 2014, accessed December 14, 2017, at http://sanfrancisco.cbslocal.com/2014/08/25/south-napa-earthquake-first-major-quake-in-smart-phone-social-media-age-explores-power-of-technology-first-tweet-after-the-quake-jawbone-up-twitter-facebook-tweet-wea-fema-alerts-cameras.
Ministry of Internal Affairs and Communications [Japan], 2011, Maintaining communications capabilities during major natural disasters and other emergency situations—Final report: Study Group on Maintaining Communications Capabilities during Major Natural Disasters and other Emergency Situations, Ministry of Internal Affairs and Communications, 61 p., accessed September 30, 2019, at http://www.soumu.go.jp/main_content/000146938.pdf.
Chapter S. Telecommunications and Information Communication Technology 77
Mowll, R., 2012, Lifeline utilities restoration times for metropolitan Wellington following a Wellington fault earthquake: Wellington Lifelines Group, prepared for the Wellington Civil Defence Emergency Management Group Joint Committee, 63 p., accessed December 14, 2017, at http://www.gw.govt.nz/assets/Emergencies--Hazards/Emergency-Planning/12-11-13-WeLG-report-to-CDEM-Joint-Committee-restoration-times-FINAL.pdf.
Murphy, K., 2015, The cyberthreat under the street: The New York Times, November 7, 2015, accessed December 14, 2017, at https://www.nytimes.com/2015/11/08/sunday-review/the-cyberthreat-under-the-street.html?_r=0.
Murphy, P.P., and Krupa, M., 2017, Ham radio operators are saving Puerto Rico one transmission at a time: CNN, September 27, 2017, accessed October 2, 2019, at https://www.cnn.com/2017/09/27/us/puerto-rico-maria-ham-radio-operators-trnd/index.html.
National Business Review staff, 2011, Christchurch quake—phone network updates: National Business Review, February 22, 2011, accessed December 14, 2017, at https://www.nbr.co.nz/article/christchurch-quake-phone-network-updates-ck-86690.
National Fire Protection Association [NFPA], 2016, Standards for the fire protection of telecommunications facilities: National Fire Protection Association Standard NFPA 76, accessed December 14, 2017, at http://www.nfpa.org/codes-and-standards/all-codes-and-standards/list-of-codes-and-standards/detail?code=76.
Niccolai, J., 2011, How Japan’s data centers survived the earthquake: Computerworld blog post, June 30, 2011, accessed October 1, 2019, at https://www.computerworld.com/article/2509799/how-japan-s-data-centers-survived-the-earthquake.html.
Noyes, D., 2014, I-Team investigates AT&T center after Napa quake: ABC 7, August 27, 2017, accessed December 14, 2017, at http://abc7news.com/news/i-team-investigates-at-t-center-after-napa-quake/284302.
NZ Herald, 2012, Small business—Earthquakes show use of cloud: NZ Herald, October 8, 2012, accessed December 15, 2017, at http://www.nzherald.co.nz/business/news/article.cfm?c_id=3&objectid=10839025.
Office of Emergency Medical Services, 2017, Next Generation 911: National Highway Traffic Safety Administration web page, accessed January 8, 2020, at https://www.911.gov/issue_nextgeneration911.html.
Office of the Federal Register, 2015, Resiliency, Redundancy, and Reliability of Communications: Code of Federal Regulations, title 47, part 12, National Archives and Records Administration, Washington, D.C., accessed January 24, 2020 at https://www.gpo.gov/fdsys/pkg/CFR-2015-title47-vol1/pdf/CFR-2015-title47-vol1-sec12-4.pdf.
O’Rourke, T.D., Lembo, A.J., and Nozick, L.K., 2003, Lessons learned from the World Trade Center disaster about critical utility systems, in Beyond September 11th—An account of post-disaster research: Natural Hazards Research and Applications Information Center Special Publication 39, p. 269–290, accessed September 30, 2019, at http://citeseerx.ist.psu.edu/showciting;jsessionid=019941E9577C998156E7753DB9B68152?doi=10.1.1.489.622.
Perry, T.S., 2016, Facebook engineers crash data centers in real-world stress test: IEEE Spectrum, September 2, 2016, accessed December 15, 2017, at https://spectrum.ieee.org/view-from-the-valley/computing/it/facebook-engineers-crash-data-centers-in-realworld-stress-test.
Porter, K.A., 2018, A new model of water-network resilience, with application to the HayWired scenario, chap. N of Detweiler, S.T., and Wein, A.M., eds., The HayWired earthquake scenario—Engineering implications: U.S. Geological Survey Scientific Investigations Report 2017–5013–I–Q, 429 p., https://doi.org/10.3133/sir20175013v2.
Porter, K.A., 2020, A beginner’s guide to fragility, vulnerability, and risk: University of Colorado Boulder, 136 p, http://www.sparisk.com/pubs/Porter-beginners-guide.pdf.
Porter, K.A., and Cobeen, K., 2009, Loss estimates for large soft-story woodframe buildings in San Francisco, in Goodno, B., ed., Conference on Improving the Seismic Performance of Existing Buildings and Other Structures, San Francisco, California, December 9–11, 2009, Proceedings: American Society of Civil Engineers, p. 1,191–1,203, accessed December 14, 2017, at http://www.sparisk.com/pubs/Porter-2009-CAPSS-1.pdf.
Porter, K.A., Johnson, G.S., Zadeh, M., Scawthorn, C., and Eder, S.J., 1993, Seismic vulnerability of equipment in critical facilities—Life-safety and operational consequences: National Center for Earthquake Engineering Research Technical Report NCEER–93–0022, 368 p., accessed December 14, 2017, at https://ubir.buffalo.edu/xmlui/handle/10477/649.
Porter, K.A., and Sherrill, R., 2011, Utility performance panels in the ShakeOut scenario: Earthquake Spectra, v. 27, no. 2, p. 443–458.
Presley, D., 2019, Do Hams Still Matter?: PAARAgraphs, v. 70, no. 11, p. 2–4, accessed November 19, 2019, at https://paara.org/newsletter/2019/graph1119.pdf.
Public Utilities Commission, 2018 [updated from 1948], General Order 95—Rules for overhead electric line construction: Public Utilities Commission of the State of California, 592 p., accessed December 14, 2018, at http://docs.cpuc.ca.gov/PublishedDocs/Published/G000/M217/K418/217418779.pdf.
Ratner, A., 2001, Train derailment severs communications: The Baltimore Sun, July 20, 2001, accessed November 15, 2019, at https://www.baltimoresun.com/bal-email19-story.html.
78 The HayWired Earthquake Scenario—Societal Consequences
Roberts, C., 2014, Comcast offers free WiFi following Napa earthquake: NBC 7 San Diego, August 26, 2014, accessed December 14, 2017, at https://www.nbcsandiego.com/news/california/Comcast-Frees-Its-WiFi-Following-Napa-Earthquake-272809731.html.
Sakaki, K., Tanaka, K., Wakatake, M., and Ito, A., 2014, Protecting telecommunication services from earthquake damage: NTT Technical Review, v. 12, no. 10, 8 p., accessed March 22, 2018, at https://www.ntt-review.jp/archive/ntttechnical.php?contents=ntr201410fa3.html.
Satoh, D., Takano, Y., Sudo, R., and Mochida, T., 2018, Reduction of communication demand under disaster congestion using control to change human communication behavior without direct restriction: Computer Networks, v. 134, p. 105–115, https://doi.org/10.1016/j.comnet.2018.01.049.
Scawthorn, C., 2018, Fire following the HayWired earthquake scenario mainshock, chap. P of Detweiler, S.T., and Wein, A.M., eds., The HayWired earthquake scenario—Engineering implications: U.S. Geological Survey Scientific Investigations Report 2017–5013–I–Q, 429 p., https://doi.org/10.3133/sir20175013v2.
Schiff, A.J., 1995, Northridge earthquake—Lifeline performance and post-earthquake response: Technical Council on Lifeline Earthquake Engineering Monograph no. 8, 339 p.
Seligson, H.A., Wein, A.M., and Jones, J.L., 2018, HayWired scenario—Hazus analyses of the mainshock and aftershocks, chap. J of Detweiler, S.T., and Wein, A.M., eds., The HayWired earthquake scenario—Engineering implications: U.S. Geological Survey Scientific Investigations Report 2017–5013–I–Q, 429 p., https://doi.org/10.3133/sir20175013v2.
Shanmugaraj, R., 2021, Four telecommunications trends impacted by the pandemic: Forbes Technology Council post, January 26, 2021, accessed August 1, 2021, at https://www.forbes.com/sites/forbestechcouncil/2021/01/26/four-telecommunications-trends-impacted-by-the-pandemic/?sh=3418905d73d1.
Smith, G., 2013, Verizon outages strand lower Manhattan businesses 4 months after Sandy: The Huffington Post, February 28, 2013, accessed December 15, 2017, at https://www.huffingtonpost.com/2013/02/28/verizon-sandy-new-york_n_2782664.html.
State of Connecticut, 2012, Public Act 12-148—An Act Enhancing Emergency Preparedness and Response, Substitute Senate Bill No. 23: Hartford, Connecticut, 20 p., accessed March 31, 2021, at https://www.cga.ct.gov/2012/act/pa/pdf/2012PA-00148-R00SB-00023-PA.pdf.
Tang, A.K., 2008, The ShakeOut scenario supplemental study—Telecommunications: SPA Risk, LLC, 37 p., accessed December 14, 2017, at https://hazards.colorado.edu/archive/shakeout/telecommunications.pdf.
Tang, A.K., and Eidinger, J., 2017, Kumamoto, Kyushu, Japan, earthquakes of Mw 6.0 April 14, 2016, Mw 7.0 April 16, 2016—Lifeline performance: The Council of Lifeline Earthquake Engineering, TCLEE no. 2, 277 p., accessed September 30, 2019, at https://www.geengineeringsystems.com/ewExternalFiles/Kumamoto%205.7.17.pdf.
Tang, A.K., Eng, P., Eng, C., and Asce, F., 2011, Lifelines performance of the Mw 8.8 off shore Biobío, Chile earthquake: Procedia Engineering, v. 14, p. 922–930.
Tang, A.K., Kwasinski, A., Eidinger, J., Foster, C., and Anderson, P., 2014, Telecommunication systems’ performance—Christchurch earthquakes: Earthquake Spectra, v. 30, no. 1, p. 231–252.
Telcordia, 2011, Electromagnetic compatibility and electrical safety—Generic criteria for network telecommunications equipment: Telcordia Technologies Report GR-1089, no. 6, 300 p.
Telcordia, 2012, NEBS requirements—Physical protection: Telcordia Technologies Report GR-63, no. 4, 188 p.
Telecommunications Industry Association, 2012, TR–14, Structural standards for communication and small wind turbine support structures: Telecommunications Industry Association web page, accessed December 14, 2017, at https://tiaonline.org/standards-committees/tr-14.
Telecommunications Industry Association, 2014, Telecommunications infrastructure standard for data centers: Arlington, Virginia, Telecommunications Industry Association Standard ANSI/TIA-942.
Thompson, M., 2016, Understanding physical internet infrastructure vulnerabilities: Center for Infrastructure Protection and Homeland Security, accessed December 14, 2017, at https://cip.gmu.edu/2016/10/26/understanding-physical-internet-infrastructure-vulnerabilities.
Thompson, M., and Evans, N., 2016, Internet resilience in Ashburn, Virginia, in 2016 Resilience Week (RWS), Chicago, August 16–18, 2016, Proceedings: Institute of Electrical and Electronics Engineers, p. 146–151, accessed December 14, 2017, at https://doi.org/10.1109/RWEEK.2016.7573323.
Tiffen, S., 2017, Fires highlight critical weaknesses in communication infrastructure: Cloverdale Reveille, October 31, 2017, accessed June 21, 2019, at http://www.sonomawest.com/cloverdale_reveille/news/fires-highlight-critical-weaknesses-in-communication-infrastructure/article_132b2252-be96-11e7-92df-efb7fe002f1c.html.
Torpey, E., and Hogan, A., 2016, Working in a gig economy: Career Outlook, Bureau of Labor Statistics, May 2016, accessed December 14, 2017, at https://www.bls.gov/careeroutlook/2016/article/what-is-the-gig-economy.htm.
Chapter S. Telecommunications and Information Communication Technology 79
Vogels, E.A., Perrin, A., Rainie, L., and Anderson, M., 2020, 53% of Americans say the internet has been essential during the COVID-19 outbreak: Pew Research Center report, 24 p., accessed August 1, 2021, at https://www.pewresearch.org/internet/wp-content/uploads/sites/9/2020/04/PI_2020.04.30_COVID-internet_REPORT.pdf.
Wein, A.M., 2021, Voice and data telecommunications restoration curves for 15 counties affected by the April 18, 2018, M7.0 HayWired earthquake scenario mainshock: U.S. Geological Survey data release, https://doi.org/10.5066/P9HKJU90.
Wein, A.M., Becker, J., Potter, S., Johal, S., and Doyle, E., 2016, Communications during an earthquake sequence—Coordinating the science message with other communication roles: Seismological Research Letters, v. 87, no. 1., p. 112–118, https://doi.org/10.1785/0220150113.
Wein, A.M., Felzer, K.R., Jones, J.L., and Porter, K.A., 2017, HayWired scenario aftershock sequence, chap. G of Detweiler, S.T., and Wein, A.M., eds., The HayWired earthquake scenario—Earthquake hazards: U.S. Geological Survey Scientific Investigations Report 2017–5013–A–H, 126 p., https://doi.org/10.3133/sir20175013v1.
Witkowski, D., 2019, Bridging the Gap—21st Century Wireless Telecommunications Handbook (2d ed.): Joint Venture Silicon Valley, 51 p., accessed January 24, 2020, at http://bit.ly/jvsv-telecom-hbook-v2.
Wong, C.J., and Miller, M.D., eds., 2010, Guidelines for electrical transmission line structural loading (2d ed.): American Society of Civil Engineers, 191 p., https://doi.org/10.1061/9780784410356.
Worthington, S., 2016, NZ earthquake—Kiwi telcos join forces for Kaikoura recovery: bizEDGE, November 15, 2016, accessed December 14, 2017, at https://bizedge.co.nz/story/nz-earthquake-kiwi-telcos-join-forces-kaikoura-recovery/.
Xia, R., and Lin, R-G., II, 2015, L.A. becomes first U.S. city to enact quake safety standards for new cellphone towers: Los Angeles Times, May 8, 2015, accessed December 15, 2017, at http://www.latimes.com/local/lanow/la-me-ln-quake-cellphone-20150508-story.html.
Yamamura, H., Kaneda, K., and Mizobata, Y., 2014, Communication problems after the great East Japan earthquake of 2011: Disaster Medicine and Public Health Preparedness, v. 8, no. 4, p. 293–296.
Young, J., [n.d.], Protecting data centers from seismic activity: Emcor Enclosures white paper, 9 p., accessed December 14, 2017, at https://www.missioncriticalmagazine.com/ext/resources/MC/Home/Files/PDFs/Seismic_White_Paper.pdf.
80 The HayWired Earthquake Scenario—Societal Consequences
Glossary
Asynchronous digital subscriber line (ADSL) is a technology standard for transferring broadband data over twisted-pair copper wiring to home and small business subscribers.
AT&T is a multinational conglomerate holding company, and the world’s largest telecommunica-tions company. AT&T traces its ancestry to the Bell Telephone Company, which was renamed the American Telephone and Telegraph Company in 1885, and later became AT&T Corporation. In 1984, as part of a consent decree in United States v. AT&T, AT&T Corporation’s local operations were split into seven regional Bell operating companies. Over time, five of the operating companies merged to form AT&T Inc.
Broadband is data that transfers at minimum speeds of 25 megabits per second (Mbps) download, 3 Mbps upload (per the Federal Communications Commission’s 2015 definition).
Cellular is a network of radio sites that provide voice and data service using wireless technologies. The term refers to the regular spacing of sites, each with a coverage area, arranged so that subscribers can move from site to site without losing connection.
Coaxial line (coax) is a physical medium used to carry modulated radio frequency signals. Coaxial line is used by cable utilities to deliver video and broadband data to subscribers.
Colocation refers to the installation of wireless equipment and antennas for multiple technologies and (or) competing carriers to a single tower or wireless facility. When spelled “collocation,” the term also refers to different types of infrastructure at the same location.
Copper pair line (copper pair) is a physical medium used to carry plain old telephone service (POTS) telephony and modulated radio frequency signals for various digital subscriber line services (xDSL). Copper pair line is used by telephony utilities to deliver broadband data to subscribers.
Data Over Cable Service Interface Specification (DOCSIS) is a digital data line technology and standard for transferring broadband data over coaxial line to home and small business subscribers.
Digital signal line (DSn) is a digital data line technology for transfer of information over physical T-carrier lines. Levels of service range from DS0 (64 kilobits per second [kbps]) to DS5 (400.352 Mbps).
Digital subscriber line (DSL) carries digital data over a telephone line. There are several variants of DSL, collectively called xDSL.
Distributed antenna system can be indoor (typically called DAS) or outdoor (usually called o-DAS).
Fiber optic line is a digital data line technology for transmission of information using pulses of light (optical).
Gig economy is the economic shift of workers away from full-time, long-term employment to transient short-term jobs or “gigs”—sometimes called the contractor economy.
Heterogeneous network (HetNet) is a system of dissimilar wireless technologies operating as a whole.
Information and communications technology (ICT) is a broad term used to describe the integration of information technology (servers, data storage, and data processing) with the networks used to link them together.
International Telecommunications Union (ITU) is the technology standardization and coordination arm of the United Nations.
Internet exchange points (IXPs) are locations where privately owned, publicly owned, academic, and government-owned networks connect together.

Chapter S. Telecommunications and Information Communication Technology 81
Internet of Thing (IoT) is the connection of stand-alone nodes, systems, and devices to the internet.
Internet protocol (IP) is the standard for data interconnection over the internet.
Lattice tower is a type of communications tower constructed from a lattice of metal sections—can be either guyed (GT) or self-supporting (SST).
Long-Term Evolution (LTE) is the name given to the 4G radio interface standard published by the Third Generation Partnership Project (3GPP).
Macrocellular site tower is a large tower (either guyed or freestanding) that supports communications equipment and antennas.
Monopole (MP) is a type of wireless tower; disguised versions of monopole are named for the objects they resemble, including monopines, monopalms, monocacti, and so on.
NECA/FOA 301 is a standard for the installation and testing of fiber optic lines.
Optical short hop (OSH) is a system where lasers are used instead of wires or fiber optic lines to create a data link.
Pacific Gas and Electric is an investor-owned electric and natural gas utility that serves nearly all cities, towns, and counties in northern California.
Plain old telephone service (POTS) is an older subscriber service that carries analog voice signals over copper pair wiring. POTS provides both signals and power to subscriber telephones. POTS connects to the public switched telephone network (PSTN) system for call processing, switching, and signaling.
Private branch exchange (PBX) is an older system used in workplaces to create an internal phone network. Connects to the public switched telephone network (PSTN) for calling in and out of the internal network.
Public switched telephone network (PSTN) is an older system for carrying and handling voice telephony.
Radio Amateur Civil Emergency Service (RACES) is a radio sevice that operates from oversight from the Federal Emergency Management Agency and the Federal Communications Commission.
Small cell is a type of communications equipment that operates at lower power levels than a macrocellular site. Small cells typically cover areas from a single room to several hundred meters in radius. They are commonly attached to other structures, such as building roof perimeters, street lights, and utility poles.
T-carrier is a physical copper line used to transport multiplexed communication channels.
Transmission Control Protocol (TCP) is one of the main components of internet protocol (IP) technology.
Wireless is a generic term for telecommunications channels of voice or data using radio frequency (RF) or microwave signals.
xDSL is a generalized term for various classes of digital subscriber line (DSL) services. Common classes are ADSL2, ADSL2+, VDSL, VDSL2+, and G.fast.

Appendixes

Chapter S. Telecommunications and Information Communication Technology 83
Appendix 1. Program of the U.S. Geological Survey’s Telecommunications Phase 2 Workshop
HayWired Telecomm/ICT Workshop Agenda
General Session (8:00 a.m.–10:00 a.m.)
• Opening, welcome, and housekeeping (David Witkowski, 15 minutes)
• Presentation on HayWired roll-out plan (Dale Cox, 15 minutes)
• Presentation: Lessons from Recent Disasters (Scott Kisting, 15 minutes)
• Presentation: Haywired Telecom/ICT Chapter (David Witkowski and Anne Wein, 45 minutes with question-and-answer session)
• Morning track agenda and introduction of track leads (David Witkowski and Anne Wein, 15 minutes)
Working Lunch (12:00 p.m.–1:00 p.m.)
• 12:15 p.m.: Vision Presentation (Russ Hancock, Joint Venture Silicon Valley, 15 minutes)
• Afternoon track agenda and introduction of track leads
• Technical track groups prepare top 5 points
• Practitioner track leads can prepare for their sessions
General Session (2:30 p.m.–5:00 p.m.)
• 2:30 p.m.–3:00 p.m., snack break and track lead preparation
• 3:00 p.m.–4:30 p.m., top 5 points from track leads and question and answer session
• 4:30 p.m.–5:00 p.m., wrap-up, next steps, invite to continue dialog, methods for remaining in touch (Google group, Slack, Wiki, and so on), commitment to April 18th, 2018
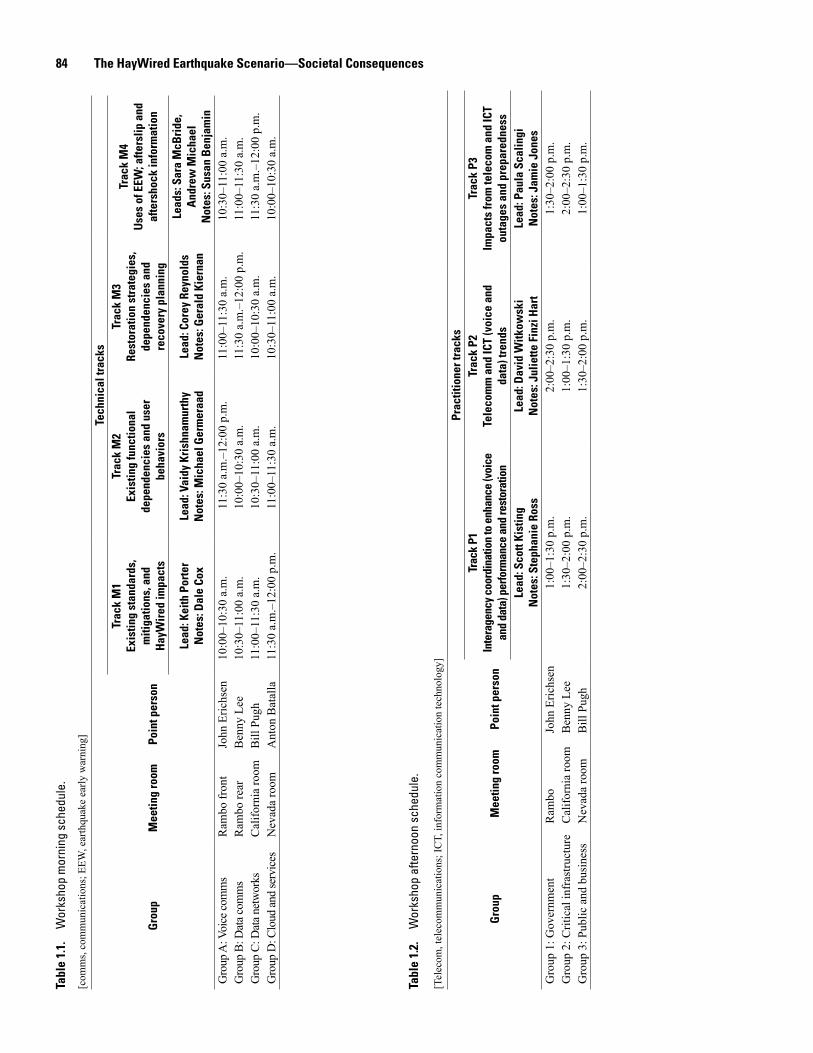
84 The HayWired Earthquake Scenario—Societal ConsequencesTa
ble
1.1.
W
orks
hop
mor
ning
sch
edul
e.
[com
ms,
com
mun
icat
ions
; EEW
, ear
thqu
ake
early
war
ning
]
Gro
upM
eetin
g ro
omPo
int p
erso
n
Tech
nica
l tra
cks
Trac
k M
1Ex
istin
g st
anda
rds,
m
itiga
tions
, and
H
ayW
ired
impa
cts
Trac
k M
2Ex
istin
g fu
nctio
nal
depe
nden
cies
and
use
r be
havi
ors
Trac
k M
3Re
stor
atio
n st
rate
gies
, de
pend
enci
es a
nd
reco
very
pla
nnin
g
Trac
k M
4U
ses
of E
EW; a
fters
lip a
nd
afte
rsho
ck in
form
atio
n
Lead
: Kei
th P
orte
rN
otes
: Dal
e Co
xLe
ad: V
aidy
Kri
shna
mur
thy
Not
es: M
icha
el G
erm
eraa
dLe
ad: C
orey
Rey
nold
sN
otes
: Ger
ald
Kier
nan
Lead
s: S
ara
McB
ride
, A
ndre
w M
icha
elN
otes
: Sus
an B
enja
min
Gro
up A
: Voi
ce co
mm
sR
ambo
fron
tJo
hn E
richs
en10
:00–
10:3
0 a.
m.
11:3
0 a.
m.–
12:0
0 p.
m.
11:0
0–11
:30
a.m
.10
:30–
11:0
0 a.
m.
Gro
up B
: Dat
a com
ms
Ram
bo re
arB
enny
Lee
10:3
0–11
:00
a.m
.10
:00–
10:3
0 a.
m.
11:3
0 a.
m.–
12:0
0 p.
m.
11:0
0–11
:30
a.m
.G
roup
C: D
ata n
etw
orks
Cal
iforn
ia ro
omB
ill P
ugh
11:0
0–11
:30
a.m
.10
:30–
11:0
0 a.
m.
10:0
0–10
:30
a.m
.11
:30
a.m
.–12
:00
p.m
.G
roup
D: C
loud
and
serv
ices
Nev
ada
room
Ant
on B
atal
la11
:30
a.m
.–12
:00
p.m
.11
:00–
11:3
0 a.
m.
10:3
0–11
:00
a.m
.10
:00–
10:3
0 a.
m.
Tabl
e 1.
2.
Wor
ksho
p af
tern
oon
sche
dule
.
[Tel
ecom
, tel
ecom
mun
icat
ions
; IC
T, in
form
atio
n co
mm
unic
atio
n te
chno
logy
]
Gro
upM
eetin
g ro
omPo
int p
erso
n
Prac
titio
ner t
rack
sTr
ack
P1In
tera
genc
y co
ordi
natio
n to
enh
ance
(voi
ce
and
data
) per
form
ance
and
rest
orat
ion
Trac
k P2
Tele
com
m a
nd IC
T (v
oice
and
da
ta) t
rend
s
Trac
k P3
Impa
cts
from
tele
com
and
ICT
outa
ges
and
prep
ared
ness
Lead
: Sco
tt Ki
stin
gN
otes
: Ste
phan
ie R
oss
Lead
: Dav
id W
itkow
ski
Not
es: J
ulie
tte F
inzi
Har
tLe
ad: P
aula
Sca
lingi
Not
es: J
amie
Jon
esG
roup
1: G
over
nmen
tR
ambo
John
Eric
hsen
1:00
–1:3
0 p.
m.
2:00
–2:3
0 p.
m.
1:30
–2:0
0 p.
m.
Gro
up 2
: Crit
ical
infr
astru
ctur
eC
alifo
rnia
room
Ben
ny L
ee1:
30–2
:00
p.m
.1:
00–1
:30
p.m
.2:
00–2
:30
p.m
.G
roup
3: P
ublic
and
bus
ines
sN
evad
a ro
omB
ill P
ugh
2:00
–2:3
0 p.
m.
1:30
–2:0
0 p.
m.
1:00
–1:3
0 p.
m.
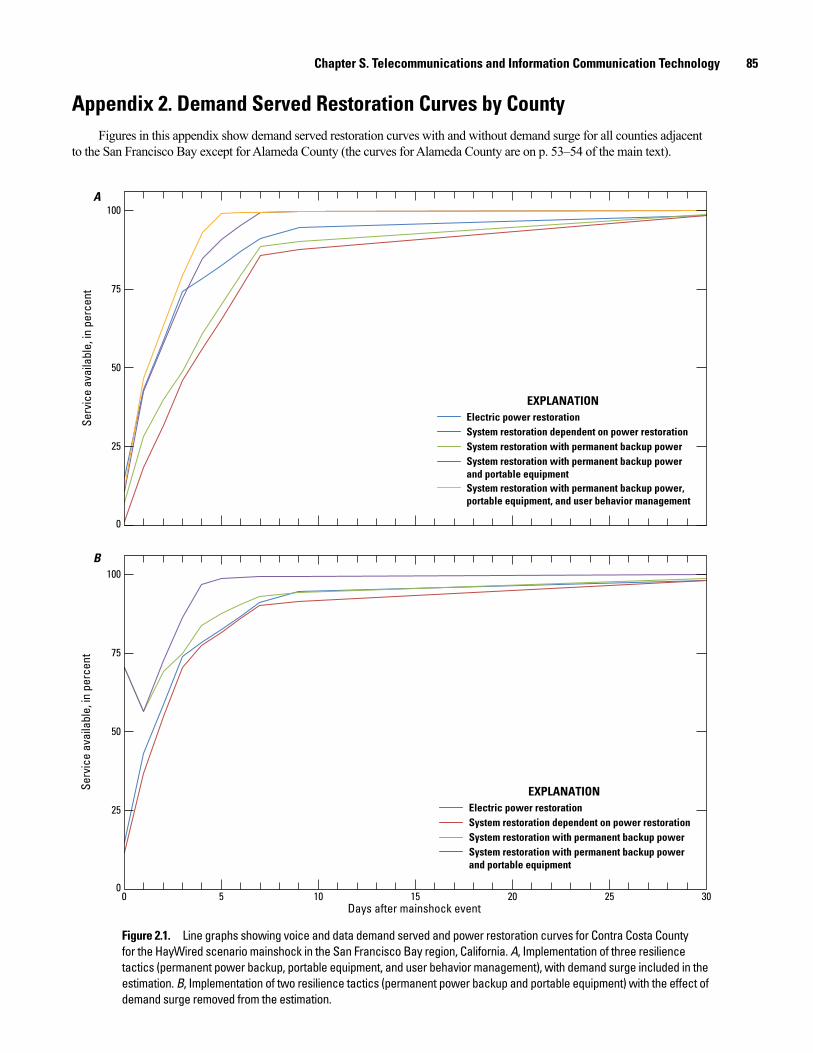
Chapter S. Telecommunications and Information Communication Technology 85
Appendix 2. Demand Served Restoration Curves by CountyFigures in this appendix show demand served restoration curves with and without demand surge for all counties adjacent
to the San Francisco Bay except for Alameda County (the curves for Alameda County are on p. 53–54 of the main text).
men21-7516_fig02.01
EXPLANATIONElectric power restorationSystem restoration dependent on power restorationSystem restoration with permanent backup powerSystem restoration with permanent backup powerand portable equipment
00
25
50
75
100
5 10 15 20 25 30Days after mainshock event
Serv
ice
avai
labl
e, in
per
cent
0
25
50
75
100
Serv
ice
avai
labl
e, in
per
cent
EXPLANATIONElectric power restorationSystem restoration dependent on power restorationSystem restoration with permanent backup powerSystem restoration with permanent backup powerand portable equipmentSystem restoration with permanent backup power,portable equipment, and user behavior management
A
B
Figure 2.1. Line graphs showing voice and data demand served and power restoration curves for Contra Costa County for the HayWired scenario mainshock in the San Francisco Bay region, California. A, Implementation of three resilience tactics (permanent power backup, portable equipment, and user behavior management), with demand surge included in the estimation. B, Implementation of two resilience tactics (permanent power backup and portable equipment) with the effect of demand surge removed from the estimation.
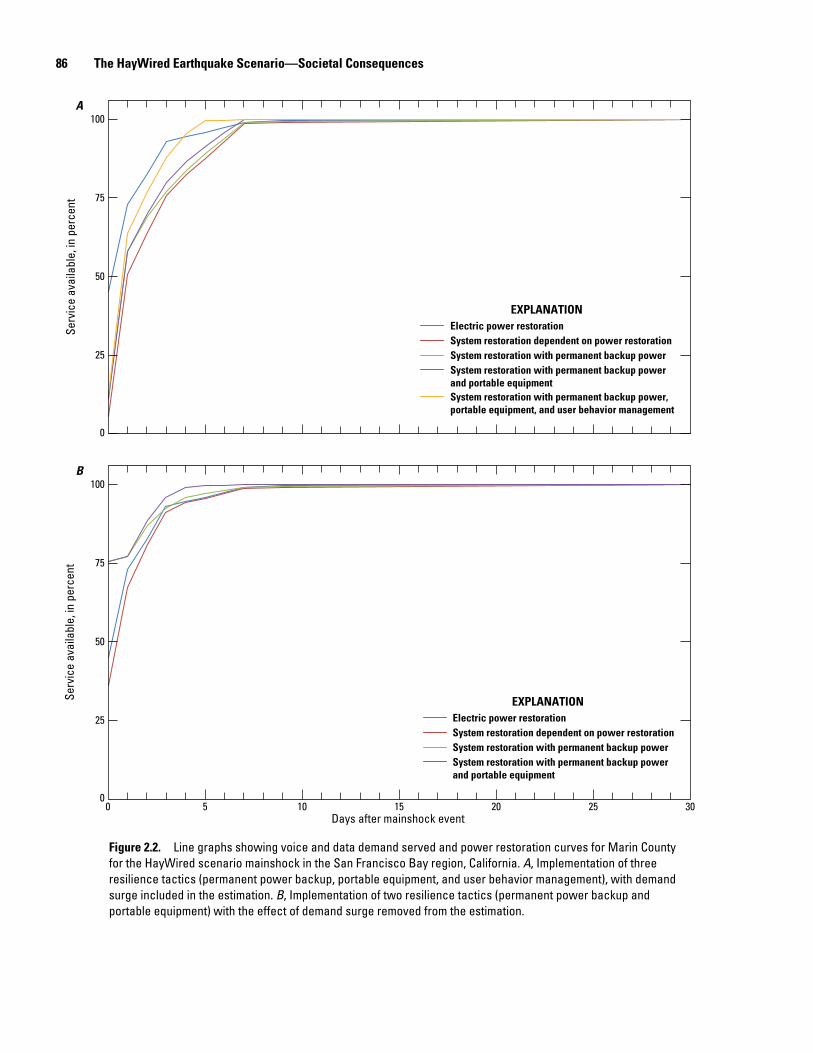
86 The HayWired Earthquake Scenario—Societal Consequences
men21-7516_fig02.02
EXPLANATIONElectric power restorationSystem restoration dependent on power restorationSystem restoration with permanent backup powerSystem restoration with permanent backup powerand portable equipment
00
25
50
75
100
5 10 15 20 25 30Days after mainshock event
Serv
ice
avai
labl
e, in
per
cent
0
25
50
75
100
Serv
ice
avai
labl
e, in
per
cent
EXPLANATIONElectric power restorationSystem restoration dependent on power restorationSystem restoration with permanent backup powerSystem restoration with permanent backup powerand portable equipmentSystem restoration with permanent backup power,portable equipment, and user behavior management
A
B
Figure 2.2. Line graphs showing voice and data demand served and power restoration curves for Marin County for the HayWired scenario mainshock in the San Francisco Bay region, California. A, Implementation of three resilience tactics (permanent power backup, portable equipment, and user behavior management), with demand surge included in the estimation. B, Implementation of two resilience tactics (permanent power backup and portable equipment) with the effect of demand surge removed from the estimation.
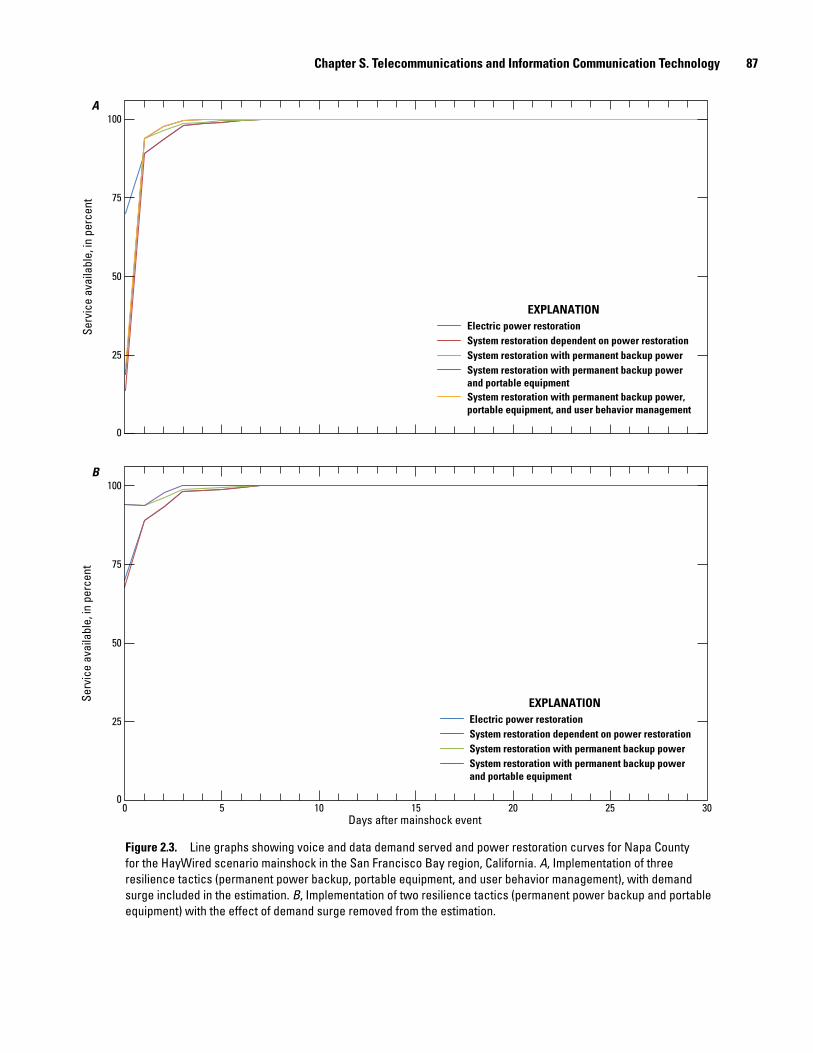
Chapter S. Telecommunications and Information Communication Technology 87
Figure 2.3. Line graphs showing voice and data demand served and power restoration curves for Napa County for the HayWired scenario mainshock in the San Francisco Bay region, California. A, Implementation of three resilience tactics (permanent power backup, portable equipment, and user behavior management), with demand surge included in the estimation. B, Implementation of two resilience tactics (permanent power backup and portable equipment) with the effect of demand surge removed from the estimation.
men21-7516_fig02.03
EXPLANATIONElectric power restorationSystem restoration dependent on power restorationSystem restoration with permanent backup powerSystem restoration with permanent backup powerand portable equipment
00
25
50
75
100
5 10 15 20 25 30Days after mainshock event
Serv
ice
avai
labl
e, in
per
cent
0
25
50
75
100
Serv
ice
avai
labl
e, in
per
cent
EXPLANATIONElectric power restorationSystem restoration dependent on power restorationSystem restoration with permanent backup powerSystem restoration with permanent backup powerand portable equipmentSystem restoration with permanent backup power,portable equipment, and user behavior management
A
B
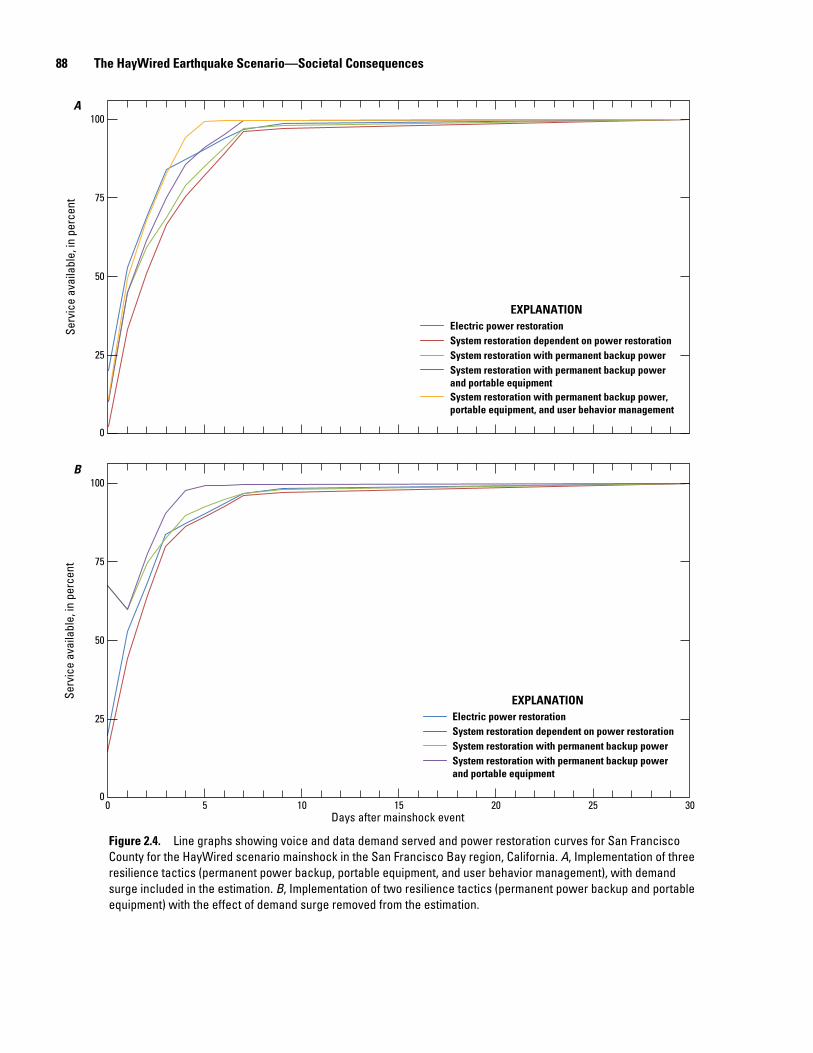
88 The HayWired Earthquake Scenario—Societal Consequences
Figure 2.4. Line graphs showing voice and data demand served and power restoration curves for San Francisco County for the HayWired scenario mainshock in the San Francisco Bay region, California. A, Implementation of three resilience tactics (permanent power backup, portable equipment, and user behavior management), with demand surge included in the estimation. B, Implementation of two resilience tactics (permanent power backup and portable equipment) with the effect of demand surge removed from the estimation.
men21-7516_fig02.04
EXPLANATIONElectric power restorationSystem restoration dependent on power restorationSystem restoration with permanent backup powerSystem restoration with permanent backup powerand portable equipment
00
25
50
75
100
5 10 15 20 25 30Days after mainshock event
Serv
ice
avai
labl
e, in
per
cent
0
25
50
75
100
Serv
ice
avai
labl
e, in
per
cent
EXPLANATIONElectric power restorationSystem restoration dependent on power restorationSystem restoration with permanent backup powerSystem restoration with permanent backup powerand portable equipmentSystem restoration with permanent backup power,portable equipment, and user behavior management
A
B
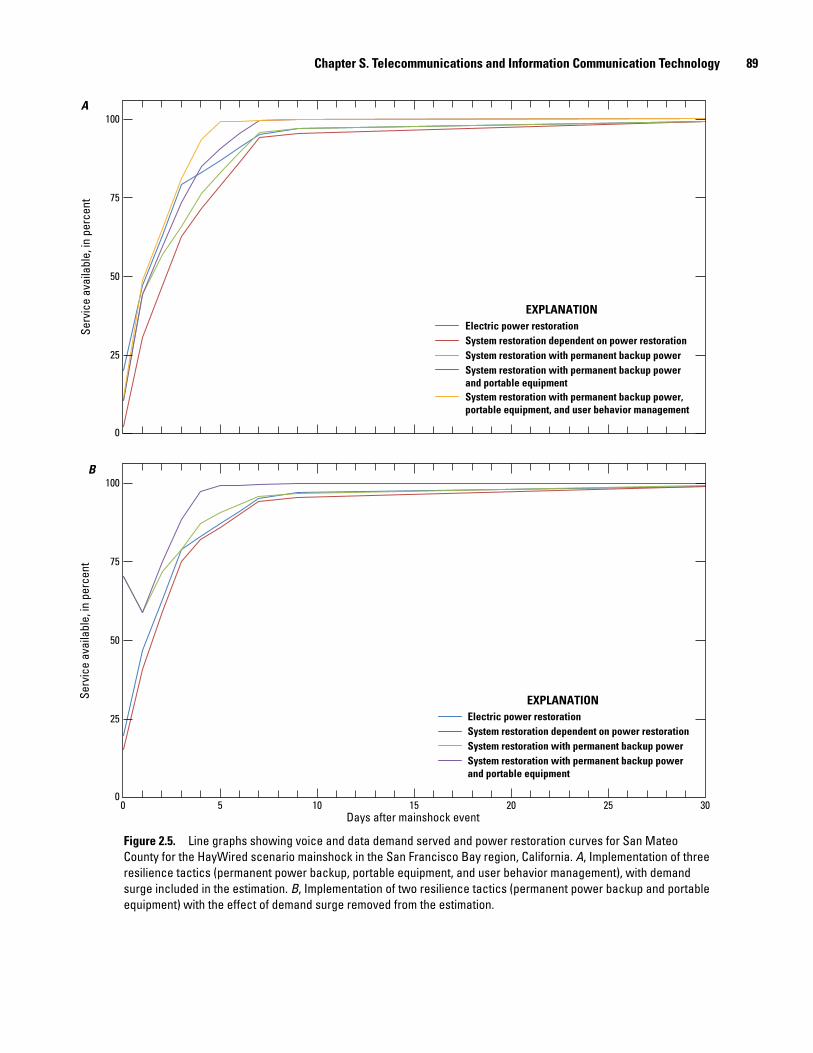
Chapter S. Telecommunications and Information Communication Technology 89
Figure 2.5. Line graphs showing voice and data demand served and power restoration curves for San Mateo County for the HayWired scenario mainshock in the San Francisco Bay region, California. A, Implementation of three resilience tactics (permanent power backup, portable equipment, and user behavior management), with demand surge included in the estimation. B, Implementation of two resilience tactics (permanent power backup and portable equipment) with the effect of demand surge removed from the estimation.
men21-7516_fig02.05
00
25
50
75
100
5 10 15 20 25 30Days after mainshock event
Serv
ice
avai
labl
e, in
per
cent
EXPLANATIONElectric power restorationSystem restoration dependent on power restorationSystem restoration with permanent backup powerSystem restoration with permanent backup powerand portable equipment
0
25
50
75
100
Serv
ice
avai
labl
e, in
per
cent
EXPLANATIONElectric power restorationSystem restoration dependent on power restorationSystem restoration with permanent backup powerSystem restoration with permanent backup powerand portable equipmentSystem restoration with permanent backup power,portable equipment, and user behavior management
A
B
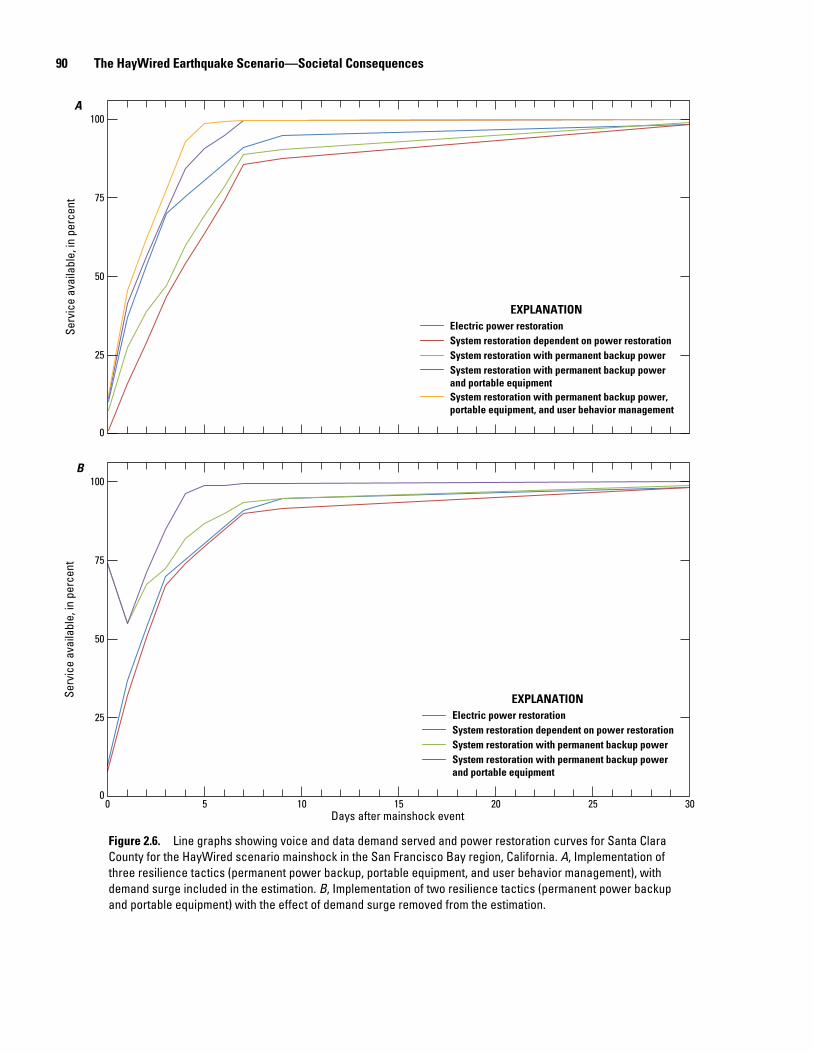
90 The HayWired Earthquake Scenario—Societal Consequences
Figure 2.6. Line graphs showing voice and data demand served and power restoration curves for Santa Clara County for the HayWired scenario mainshock in the San Francisco Bay region, California. A, Implementation of three resilience tactics (permanent power backup, portable equipment, and user behavior management), with demand surge included in the estimation. B, Implementation of two resilience tactics (permanent power backup and portable equipment) with the effect of demand surge removed from the estimation.
men21-7516_fig02.06
00
25
50
75
100
5 10 15 20 25 30Days after mainshock event
Serv
ice
avai
labl
e, in
per
cent
EXPLANATIONElectric power restorationSystem restoration dependent on power restorationSystem restoration with permanent backup powerSystem restoration with permanent backup powerand portable equipment
0
25
50
75
100
Serv
ice
avai
labl
e, in
per
cent
EXPLANATIONElectric power restorationSystem restoration dependent on power restorationSystem restoration with permanent backup powerSystem restoration with permanent backup powerand portable equipmentSystem restoration with permanent backup power,portable equipment, and user behavior management
A
B

Chapter S. Telecommunications and Information Communication Technology 91
Figure 2.7. Line graphs showing voice and data demand served and power restoration curves for Solano County for the HayWired scenario mainshock in the San Francisco Bay region, California. A, Implementation of three resilience tactics (permanent power backup, portable equipment, and user behavior management), with demand surge included in the estimation. B, Implementation of two resilience tactics (permanent power backup and portable equipment) with the effect of demand surge removed from the estimation.
men21-7516_fig02.07
00
25
50
75
100
5 10 15 20 25 30Days after mainshock event
Serv
ice
avai
labl
e, in
per
cent
EXPLANATIONElectric power restorationSystem restoration dependent on power restorationSystem restoration with permanent backup powerSystem restoration with permanent backup powerand portable equipment
0
25
50
75
100
Serv
ice
avai
labl
e, in
per
cent
EXPLANATIONElectric power restorationSystem restoration dependent on power restorationSystem restoration with permanent backup powerSystem restoration with permanent backup powerand portable equipmentSystem restoration with permanent backup power,portable equipment, and user behavior management
A
B
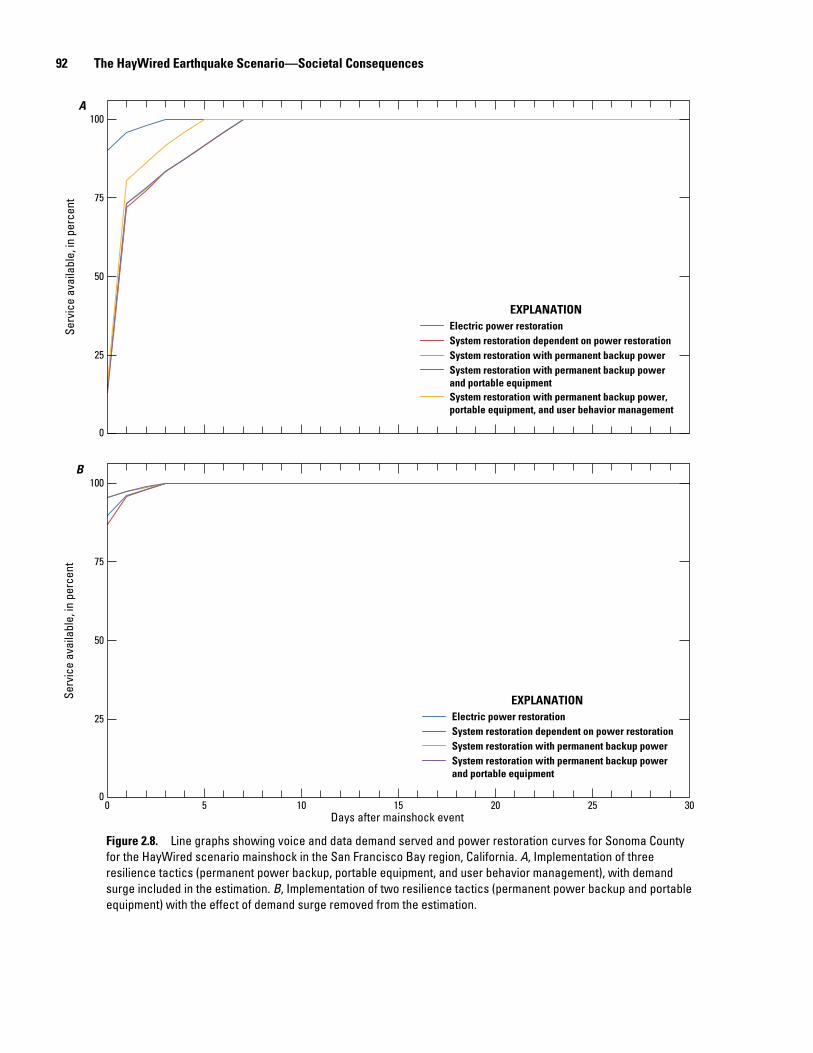
92 The HayWired Earthquake Scenario—Societal Consequences
men21-7516_fig02.08
00
25
50
75
100
5 10 15 20 25 30Days after mainshock event
Serv
ice
avai
labl
e, in
per
cent
EXPLANATIONElectric power restorationSystem restoration dependent on power restorationSystem restoration with permanent backup powerSystem restoration with permanent backup powerand portable equipment
0
25
50
75
100
Serv
ice
avai
labl
e, in
per
cent
EXPLANATIONElectric power restorationSystem restoration dependent on power restorationSystem restoration with permanent backup powerSystem restoration with permanent backup powerand portable equipmentSystem restoration with permanent backup power,portable equipment, and user behavior management
A
B
Figure 2.8. Line graphs showing voice and data demand served and power restoration curves for Sonoma County for the HayWired scenario mainshock in the San Francisco Bay region, California. A, Implementation of three resilience tactics (permanent power backup, portable equipment, and user behavior management), with demand surge included in the estimation. B, Implementation of two resilience tactics (permanent power backup and portable equipment) with the effect of demand surge removed from the estimation.

Chapter S. Telecommunications and Information Communication Technology 93
Appendix 3. Home Uninterruptible Power Supply Set Up
Most modern voice over internet protocol (VoIP) gateways do not have internal backup batteries, and most subscribers do not have an uninterruptible power supply (UPS) to keep their gateways and cordless phones running in the absence of electric power. Sidebar 8 and figure 3.1 illustrate how to set up a UPS.1
Reference Cited
Department of Homeland Security, 2017, Plan ahead for disasters: Department of Homeland Security web site, accessed December 15, 2017, at https://www.ready.gov/plan.
1Subscribers who receive broadband and telephone service over a copper pair line (xDSL) or coaxial line (DOCSIS) must provide local backup power, using a UPS, to the router or gateway. Subscribers who receive broadband and telephone service over fiber optic lines must provide local backup power, using a UPS, to either the router or gateway and also to the optical network terminal (ONT) that interfaces with the router or gateway to the fiber line.
Sidebar 8—How Large a UPS Would I Need?This is not a simple question, because the answer depends on several factors:• Where do you live?
• How stable is your local electrical grid in the event of an earthquake?
• How long do you expect to want or need power?
• How much space do you have for equipment, and how much weight can the shelf where it will sit support?
• How much power does your equipment consume?
• How much are you willing to spend?
As of November 2017, a typical consumer-grade UPS that provides approximately 350 voltamperes (VA) per hour of capacity costs just under $50 U.S. dollars. In 2015, the power consumption for a Pace 5268AC (as tested by a coauthor of this report [D.T. Witkowski]) was measured at 13 VA, a standard measure of power consumption that considers the efficiency of the power adapter. The author’s UPS was rated (with a new battery at time of purchase) to provide 350 VA of capacity—which means that the UPS can keep the 5268AC running for just under 27 hours. The author later measured power consumption of another gateway, the ARRIS BGW210, at 23 VA—which drops the runtime of that same UPS down to just over 15 hours. Reduced capacity from battery aging will further reduce that runtime—to be safe, the author estimates runtime at only 12 hours. This runtime falls short of the Department
of Homeland Security’s Ready.gov recommendation that citizens prepare for 72 hours of self-sufficiency (Department of Homeland Security, 2017). To reach 24 hours of runtime, the 350-VA UPS would have to be upgraded to at least 550 VA, or even more to account for battery aging. To meet the recommended 72 hours of disruption at 23 VA, a UPS would require just under 1,700 VA capacity. The author located a UPS with 2,200 VA capacity (list price in November 2017) for $750 U.S. dollars—and it weighs 112 pounds. Will the average user be able to afford this UPS to have 72 hours of capacity, and are they willing to carry in over 100 pounds of UPS to get it? Furthermore, this approximate estimate does not account for the power consumption of a cordless phone. Additional equipment such as wired routers and Network Attached Storage (NAS) drives will further reduce runtime.

94 The HayWired Earthquake Scenario—Societal Consequences
men21-7516_fig03.01
Electricutility
Setup 1—Home office
Setup 2—Office
Setup 3—Home
UP
SU
PS
UP
S
UP
S
Gateway
Gateway
AC / DC
AC / DC
AC / DC
AC / DC
Internet andtelephone
serviceprovider
Gateway
AC / DC
Uninterruptible power supply
Router or gatewayGateway
EXPLANATION
Figure 3.1. Schematic diagram illustrating examples of modern telephone resiliency setups for uninterruptible power supply (UPS). Setup 1 is for a home office that has a desktop or laptop computer that uses softphone. Setup 2 is for an office that has a desktop internet protocol (IP) phone as well as a desktop analog phone. Setup 3 is for a home that has a cordless analog phone as well as a cell phone that uses Voice over Internet Protocol (VoIP) applications.