a logistic regression model for explaining urban development on the basis of accessibility: a case...
TRANSCRIPT
1
A logistic regression model for explaining urban development on the basis of accessibility: a case study of Naples
Maria Teresa BorzacchielloDepartment of Transportation Engineering, “Federico II” Universityvia Claudio 21, 80125, NaplesItalyE-mail: [email protected]
Peter NijkampDepartment of Spatial Economics, VU University AmsterdamDe Boelelaan 1105, 1081 HV AmsterdamThe NetherlandsE-mail: [email protected]
Henk J. ScholtenDepartment of Spatial Economics, VU University AmsterdamDe Boelelaan 1105, 1081 HV AmsterdamThe NetherlandsE-mail: [email protected]
Abstract: In this paper, we present a statistical modelling approach in order to explain the presence and development of built-up areas by means of a set of distinct accessibility indicators, so as to use these results in local planning studies, to test urban sustainability measures, and to eventually forecast the impact of accessibility to transport systems on urban development. On the basis of encouraging results obtained in a previous study in the Netherlands, the authors apply a multinomial logistic regression, with urban development as the dependent variable and accessibility and context information as independent variables. The statistical model employs two kinds of accessibility measure: simple Euclidean distances, as well as a specific articulated accessibility indicator which takes into account spatial opportunities as well as distances. The results confirm the reliability and robustness of the chosen approach and confirm the limited usefulness of retrieving and deploying complex data to obtain composite indicators.
Keywords: logistic regression, accessibility pn280mtbhk (August 18, 2008)
Biographical notes: M.T. Borzacchiello is a junior researcher (PhD) at the Federico II University in Naples, who has specialized in transportation research. P. Nijkamp is full professor in regional economics at the VU University Amsterdam; he has been involved in transportation and environmental research for several decades. H. J. Scholten is professor in Spatial Informatics at the VU University Amsterdam and CEO of Geodan Amsterdam; he has been involved in GIS research for more than 20 years.
2 M. T. BORZACCHIELLO, P. NIJKAMP AND H. J. SCHOLTEN
1 INTRODUCTION
Transportation and sustainability are two interlinked phenomena in the city. The transportation sector is one of those enabling sectors that offer a significant contribution to economic progress and the spatial differences therein. At the same time, it also generates adverse effects in terms of negative externalities, such as air pollution, noise, fatalities and decline in land use quality. Consequently, to develop a sustainable transportation policy, it is of great importance to understand the forces at work and to assess the complex relationship between land use, accessibility and urban development. Any statement on urban sustainability would have to include the transportation sector and urban land use.
This paper aims to extend the results of a previous study about the influence of accessibility on urban development (Borzacchiello et al., 2007). In the original study, the impact of the proximity of transportation infrastructure on the presence of the built environment was investigated by means of a logistic regression approach (Kleinbaum and Klein, 2002) using a geographical basis of raster gridsconcerning four Dutch cities (Amsterdam, Rotterdam, Utrecht and The Hague). The empirical resultsobtained showed that it is possible to explain, with sufficient goodness of fit, the presence and size of built-up areas by means of simple accessibility indicators, such as the distance from major transportation infrastructures and the localization characteristics within a particular urban area (e.g. the sphere of influence of airport noise, restrictive land-use plans). The methodology used also gave the possibility to identify distance thresholds, beyond which the influence of the transport infrastructures concerned is no longer significant to explain the presence of nearby built-up areas. This result is particularly useful in studies which involve the analysis of accessibility indicators to explain the impact of transportation on land use (Koomen et al., 2007).
There is, however, a need for a more comprehensive analysis, because the previous study did not take into account socio-economic variables. In this paper we aim, therefore, to further investigate the validity of that methodology, by applying it to an Italian case study (the city of Naples), and selecting as accessibility indicators not only Euclidean distances, but also a socio-economic opportunity-based accessibility indicator. The outcomes will tell us whether it is worth spending efforts retrieving a large amount of data to try to explain the same phenomenon with different independent variables, or whether it is enough to consider only Euclidean distances as a proxy for accessibility indicators. The paper is structured as follows: Section 2 provides an overview of the most common accessibility measures, in particular those measures used in this study. In Section 3 the authors’ own approach is outlined, while in Section 4 the statistical results are compared with respect to the three accessibility measures consideredhere. Finally, Section 5 draws conclusions and indicates further research issues.
2 OVERVIEW OF ACCESSIBILITY MEASURES
This study aims to use already commonly employed accessibility indicators, rather than find a new accessibility indicator. In the current literature, many studies deal with the definition of new accessibility measures (a new approach considering, for example, daily activity schedules can be found in Ettema and Timmermans, 2007), and it is possible to find several good reviews as well (Reggiani, 1998; Geurs and Ritsema van Eck, 2001; Geurs and van Wee, 2004). The traditional account of accessibility indicators, which identifies in the indicator a transport, a land-use, a time and an individual component, defines different measures, depending on the importance of each component in them.
A LOGISTIC REGRESSION APPROACH TO EXPLAIN URBAN DEVELOPMENT USING ACCESSIBILITY: AN ITALIAN CITY 3
In each of the above review studies, it is clear that the definition of the accessibility concept and the choice of the relative measure depend on the particular study context.
In our case, as we want to investigate the influence of accessibility on urban development we can define accessibility as the ‘possibility to reach transport infrastructures from a built-up location’.
The most common classification of accessibility measures (Geurs and Ritsema van Eck, 2001) identifies three main categories: infrastructure-based, activity-based, and utility-based measures. The infrastructure-based approach involves the calculation of the transportation system’s performance. The activity-based accessibility measures, mainly tied with the spatial distribution of activities, include (i) simple distance measures; (ii) contour measures (the amount of reachable opportunities within a given time or space); (iii) potential measures, which combine factors related to the transportation system and factors related to the socio-economic system, in order to explain the potential accessibility to different kinds of opportunities (jobs, services, and so on); (iv) measures obtained using the balancing factors of a spatial interaction model, in order to take into account competition effects between different locations (Wilson, 1971); (v) measures which involve temporal aspects, which consider the activities that individuals do at different times of the day. The utility-based measures find their roots in economic theory and consider accessibility as an indicator deriving from the maximum utility that a particular kind of individual obtains from the transportation and the land use system.
For further insight into the different measures, the present authors refer to the above-mentioned study (Geurs and Ritsema van Eck, 2001), which provides a very detailed state of the art and discusses for the advantages and disadvantages of each measure.
In this paper, we want to explore the relationship between accessibility and urban development by means of a methodology based on available geographical and socio-economic data organized in spatial grids as inputs of a multinomial logistic regression model. Because of the huge amount of data involved, we are interested in finding an as simple as possible accessibility measure which involves minimum computing efforts, but gives good results in the model. For this reason, we selected two kinds of accessibility measure in order to test the approach used in the previous study (Borzacchiello et al., 2007)with different accessibility indicators. The selected accessibility measures are:
distance measure, operationalized as Euclidean distances of built-up areas to the main urban centres and infrastructure points and lines;
a potentiality measure, to consider not only variables related to localization and transport infrastructure characteristics but also socio-economic variables.
The first measure is obtained calculating Euclidean distances from the source infrastructure, to the centre of each of the surrounding built-up cells.
The second one involves a formulation based on the well-known equation:
N
jijji CfWgA
1
i,j (1)
where Ai is the accessibility of zone i; g(Wj) is a function of the activities W in j; and f(Cij) is a function of the impedance Cij to reach i from j. As anticipated, this formulation belongs to the family of potential accessibility measures (or gravity-based measures: see Geurs and van Wee, 2006, Dong et al., 2006), and measures the accessibility of opportunity in zone i to all other zones (n) (Geurs and van Wee, 2006). The formulation above considers mutual influences among the opportunities of the zones of a study area.
Although several complex formulations of the g and f functions have been proposed in the literature, in our case we will use as the opportunity measure the number of jobs in the built-up cell concerned, and as the impedance measure the Euclidean distances defined above. In this way we can combine in this measure both physical variables which derive from the position of the built-up area we are considering,
4 M. T. BORZACCHIELLO, P. NIJKAMP AND H. J. SCHOLTEN
and the opportunity which that particular built-up area offers to people willing to localize their residence potentiality. In our analysis, we will not take into account mutual influences among the different cells of the study area, thus discarding the sum. The derived formulation is:
1 ijiij dJobsA i,j (2)
where Aij is the accessibility measure of the cell i with respect to the infrastructure j; Jobsi is the number of jobs of the cell i; and dij is the Euclidean distance between the cell i and the infrastructure j.
Clearly, the basic potential accessibility measure has some limitations (e.g. it does not take into account individual behaviour) (Geurs and Ritsema van Eck, 2001). But because of the particular aim of this study which does not involve competition effects among opportunities, and because of the particularly detailed geographic scale chosen (25x25m grids), it seems reasonable that these limitations can be ignored. The choice of a unitary parameter of distance deterrence is explained by the fact that this is an exploratory study in which we want first to determine the weight that the simple variables have in explaining urban development. Once we have obtained results confirming that the potential measure is better in explaining urban development, we can then start to investigate which particular potential measure is best, by calibrating the exponent value. This will be further outlined in Section 3.
3 METHODOLOGY
The case study used in our analysis concerns the city of Naples, in Southern Italy. Geographical data are organized in an ESRI software based geo-database, and are derived from national data sets (ISTAT, 2001) and commercially available datasets (Tele Atlas North America, Inc., 2006). The input data for each case study represent (in brackets the shape of the geographic data set):
the area of interest (chosen with the criterion of the minimum bounding rectangle applied to the city borders);
the buildings (spatial polygons) the railway stations, including the Intercity stations (spatial points); the highway exits (points); the highway lines (represented by their surface area or polygon); the railway lines (polygon); the location of the city centre (point); the areas subjected to noise influence from Capodichino airport (Mennitti, 2005); the areas subjected to environmental protection by current urban plans.
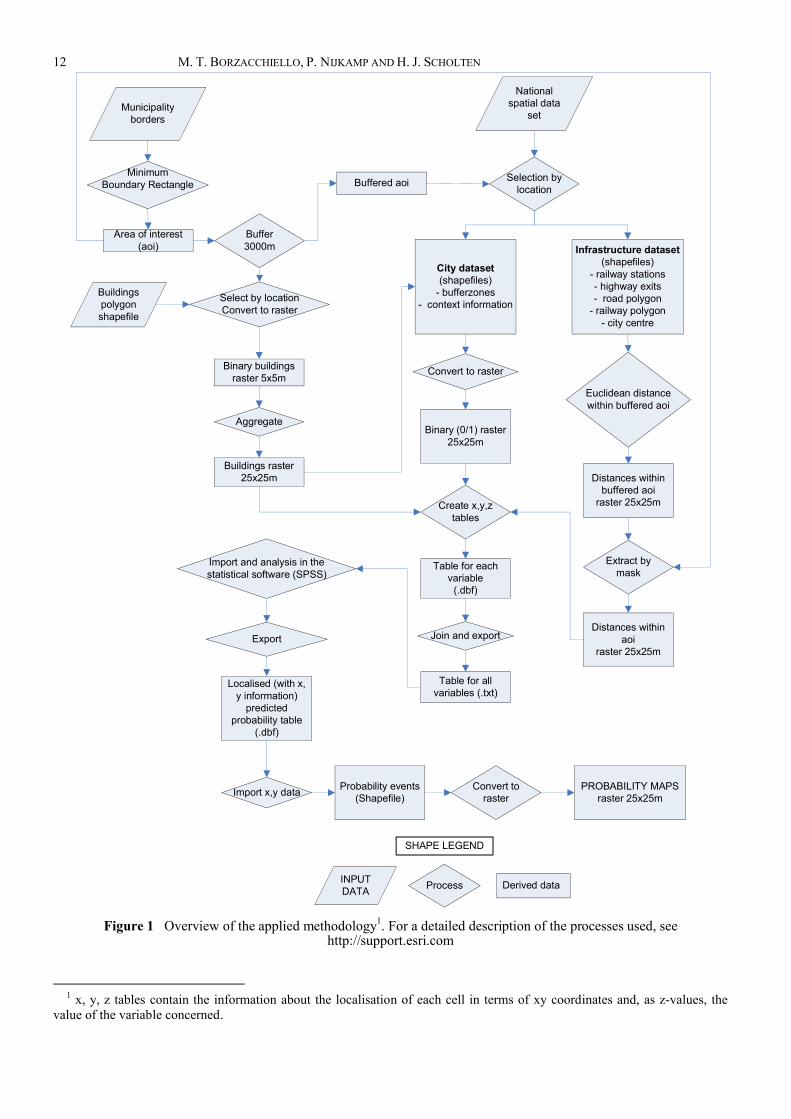
Such input data are processed, according to the methodology, whose full explanation can be found in Borzacchiello et al. (2007), and overview of which is given in Figure 1.
FIGURE 1 ABOUT HERE
In order to investigate the influence of accessibility measures and context characteristics, our spatial representation employs continuous and binary variables relating to urban development, which is explained by a binary variable which assumes a value of 0 or 1, depending on whether there are non-built-up or built-up areas, respectively. Then logistic regressions will be performed, since this is aparticularly suitable technique for this kind of data.
A LOGISTIC REGRESSION APPROACH TO EXPLAIN URBAN DEVELOPMENT USING ACCESSIBILITY: AN ITALIAN CITY 5
The binary variables are geographically represented by raster grids at a scale of 25 by 25 metres. In addition, the study tries to define the distance threshold beyond which the influence on the presence of a built-up area of that particular transport infrastructure becomes negligible.
As indicated in the introduction, the following steps were carried out:
preparatory analysis and retrieval of data; rasterization of vectorial data; calculation of Euclidean distances; calculation of accessibility indicators according to formulation (2); logistic regression using as explanatory variables context information, and three alternatives,
accessibility as Euclidean distances (case A), accessibility as Euclidean distances, with the addition of an “opportunity” variable, represented by the number of jobs per cell (case B), and accessibility as a combination of the opportunity measure and distances (Case C);
Comparison and discussion of results related to the model’s goodness of fit statistics and to the distance threshold that it is possible to recognize from the analyses.
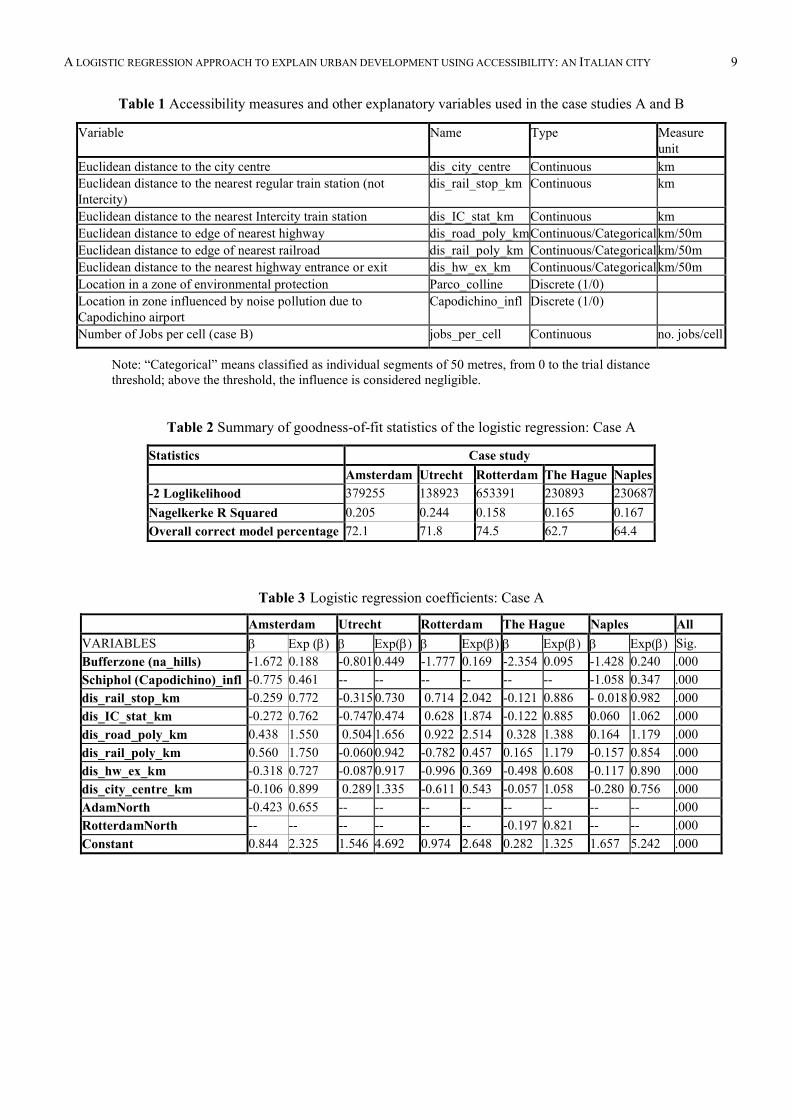
Tables 1 and 5 contain a list of the variables, together with their definition and description, for the three cases described above. The choice of distance threshold was made by considering the independent variable not as continuous variables, but as categorical ones, that is, classifying them as individual segments of 50 metres, from 0 to a distance threshold (3000 m) determined with a trial and error approach; above that threshold, the influence of that particular infrastructure on the presence of a built-up area is considered to be negligible. The distance threshold of railway stations is not included, because the results of the logistic regression using the distance from railway stops as categorical variables were not all significant enough.
In the next section, the results of the logistic regression analyses for the different cases are presented.
TABLES 1, 2, 3, 4, 5 ABOUT HERE
4 COMPARISON OF RESULTS
4.1 Accessibility as a Euclidean distance (Case A)
The use of Euclidean distances as accessibility indicators leads us to a direct comparison between the case of Naples and the Dutch cities previously analysed (see Tables 2, 3 and 4). In the current case study, the goodness of fit statistics are comparable to the most similar Dutch case, that is, the city of The Hague (from Table 4 we see that the areal extent of these two cities, both located near the sea, is rather coincident). On the basis of the elaborations performed, there are analogies between Naples and The Hague (this could also be due to the similarity of shape and dimensions of the area of interest, as shown in Table 4). The tables relating to the case of Naples do indeed show almost the same values for the binary variables: we expect exp() to be lower than 1 for the binary variables involved, that is, the Capodichino airport influence and environmental plan variables, because it is most unlikely to find a built-up cell within those areas. However, although we expect exp() to be lower than 1 but increasing with the distance when categorical for the variables railway polygon and road polygon distances, because we expect urban development near those infrastructures, but not exactly next to them, these expectations are not confirmed from a logistic regression performed on the corresponding categorical variables of Naples (whose values, all higher than 1 in the significant cases, are not reported here for reasons of space). The explanation for this trend could be that in the Italian city the built environment is very close
6 M. T. BORZACCHIELLO, P. NIJKAMP AND H. J. SCHOLTEN
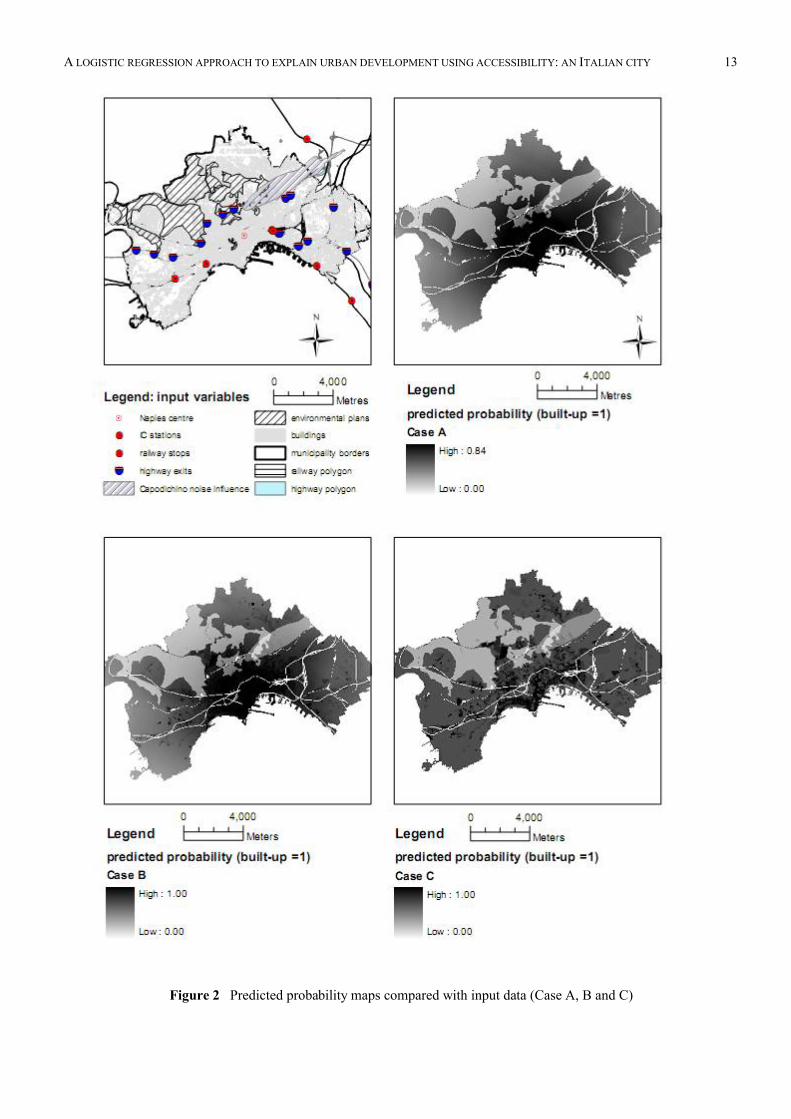
to the highway and railway, not having been subject to a systematic regulation. Similarly, while we expect exp() to be higher than 1 initially increasing then decreasing for the variable highway exits, we see that the trend behaves in the opposite way, showing therefore that it is unlikely to find built-up areas near highway exits. Hence, looking at the results of the logistic regression performed using only categorical variables (Table 3), the Naples case shows some similarities to the Dutch cities, perhaps related to resemblances in the physical distribution of buildings recognisable in areas with the same extent, and, particularly, with the same form (see, e.g., the presence of the sea in the case of both The Hague and Naples). But the outcomes of the approach with categorical variables are different, as explained before, and this also concerns differences in the definition of distance thresholds (see Table 4). In Table 3, some of the values for the different case studies have a peculiar value, different from the usual ones. This happens especially for the city of Rotterdam and its variables representing the distance from railway stops, and this trend could be interpreted by considering the localisation of the railway stations (all on one side of the river). Regarding the positive value for the variable distance from the city centre of the city of Utrecht, this may be related to the presence of the railway polygon passing directly through the centre of the city. Instead, the fluctuation of values for the variable distance from the railway polygon of the different case studies could be again due to the influence of other intervening variables. Figure 2 presents the predicted localized probabilities as they result from the logistic regression with continuous variables, for the case of Naples (case A).
FIGURE 2 ABOUT HERE
4.2 Addition of an “opportunity” variable (Case B)
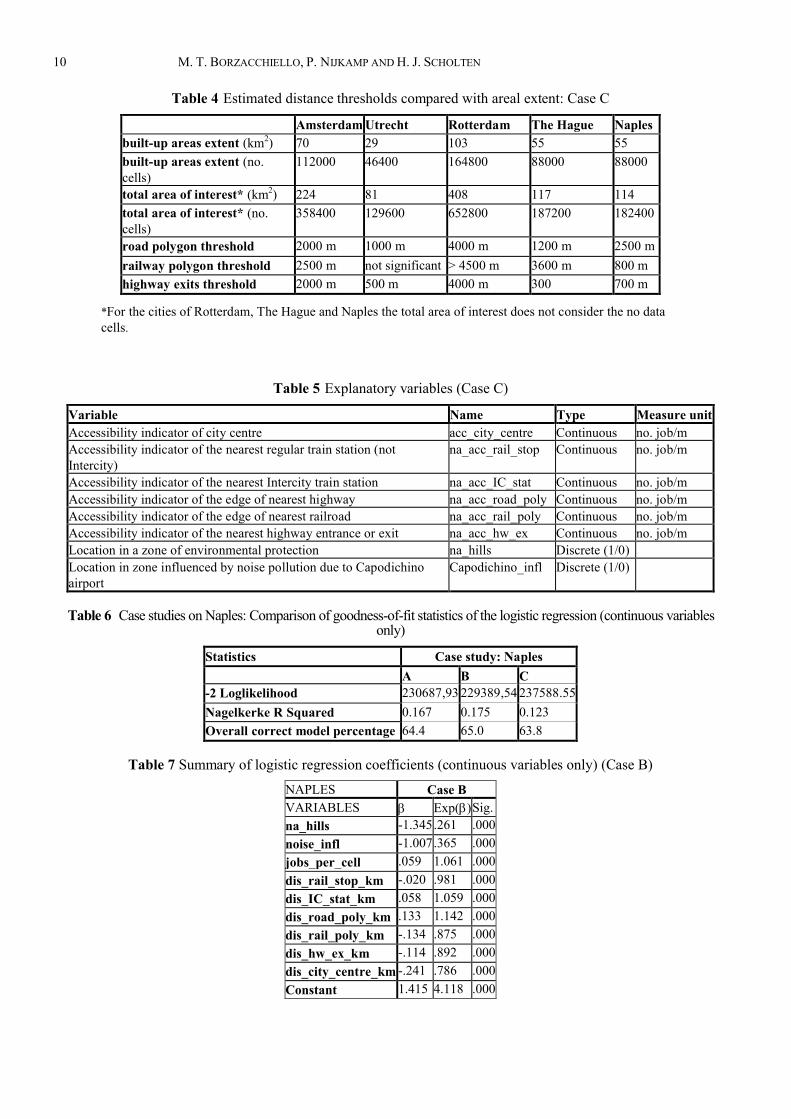
Before using a combined accessibility indicator, it is interesting to see whether it is possible to reach some better results by involving in the analyses a socio-economic variable, represented by the number of jobs in each cell, as a further variable describing the attractiveness of the area (known as potentiality variable). In order to explore the influence of this further variable, together with the others employed in case A, a similar logistic regression was performed, leading to the outcome shown in Tables 6 and 7. Perhaps not so surprisingly, the goodness of fit is better than in all the other cases, while the distribution of the model coefficients is largely similar to case A, with a high level of significance. The same can be said for the logistic regression performed with categorical variables, which led to the definition of more or less similar distance thresholds (Table 9). These outcomes show therefore that the model would indeed benefit from the inclusion of a socio-economic variable, which would explain part of the phenomenon of the urban development without reducing the power of the other accessibility variables.
TABLES 6, 7, 8, 9 ABOUT HERE
4.3 Accessibility as a combination of opportunity measures and distances (Case C)
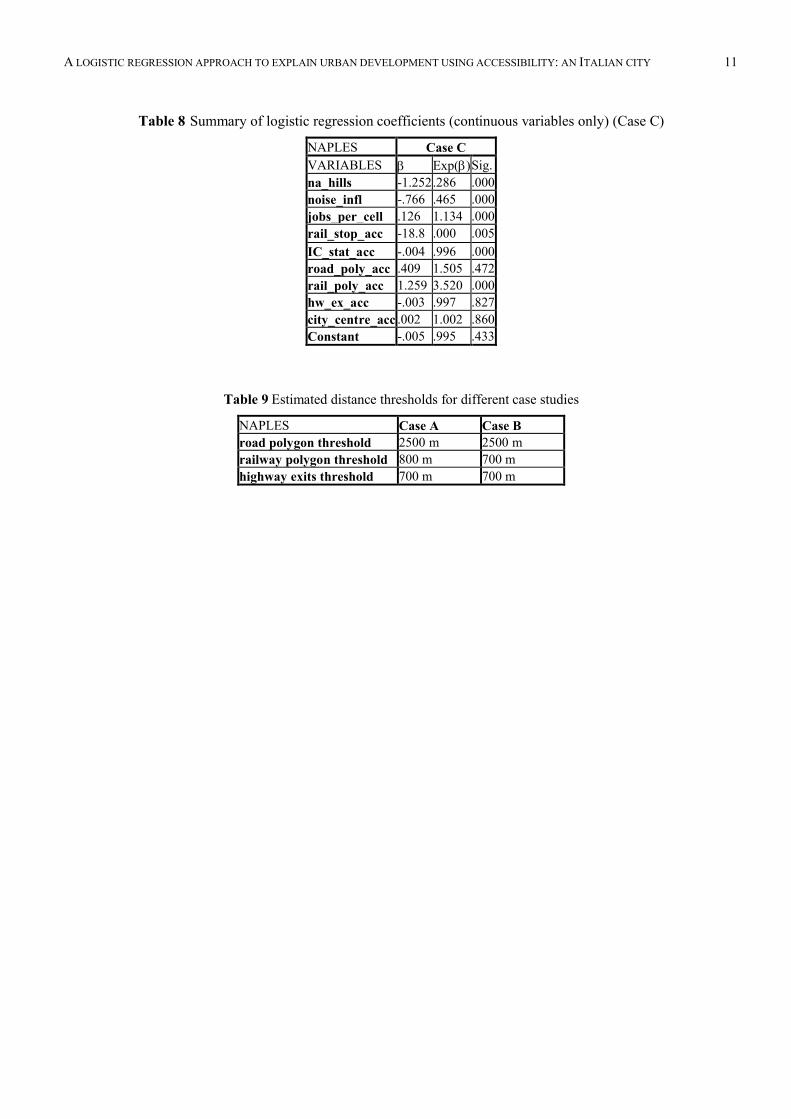
In this case, formulation (2) was used to calculate a more complex accessibility indicator, which does not involve the consideration of a socio-economic indicator as a separate variable, but only as part of the complex indicator. A description of the variables considered in this case is provided in Table 5. The results connected with this case show worse goodness of fit statistics (Table 6), and model coefficients that do not reach a high level of significance for all variables (Table 8). In addition, the definition of distance thresholds is not possible in this case, because we cannot refer to simple distance measures and classify them.
A LOGISTIC REGRESSION APPROACH TO EXPLAIN URBAN DEVELOPMENT USING ACCESSIBILITY: AN ITALIAN CITY 7
Looking at Figure 2, representing the probability maps for the three cases, let us consider that, while case A gives a more continuous representation of the probabilities concentrated in the central part of the city, cases B and C are able to better explain the distribution of the built environment throughout theentire city area. However, case B is able to better distribute the probabilities in the central area, and can benefit from a higher level of significance.
5 CONCLUSIONS AND FURTHER RESEARCH
It is clear that our exploratory study on the possibility and the appropriateness to use more or less complex accessibility indicators to identify influences on urban development has led to various interesting results.
First of all, a comparison of the merits of the methodology in a wider European scale has been undertaken, by evaluating the same approach applied to four Dutch cities and an Italian city. In particular, similarities have been recognized between cities having the same areal extent and comparable form (The Hague and Naples), but only if taking into account continuous variables: in other words, only regarding the problem from a general point of view. If considering the problem with a major insight (e.g. use of categorical variables), such similarities set aside and the real distribution of buildings is highlighted.
Secondly, the evaluation of the decision to include socio-economic variables in the model, investigatedusing alternatively an opportunity variable as an independent one, and then incorporating in an accessibility indicator, has brought to light that urban development is better explained in the first case than in the second, thus leading to the consideration that it is not worth using too complex indicators in order to achieve the aim of this study.
Further research is needed to analyse the use of network distances, instead of Euclidean distances, as accessibility indicators within the same methodology, and different formulations of the accessibility indicator, in order to confirm the results here obtained.
Moreover, it will be interesting in future research to examine the model power in explaining urban development using input data deriving from previous time horizons, in order to find cause-effects relationships between transport infrastructures and the built environment. The latter direction could be followed only if data regarding the past were available, thus highlighting the importance, for this kind of studies, of systematically monitoring both the land use and the transportation system, as is strongly recommended by several research sectors in the discipline (see, e.g., Ballis, 2006; Bejleri et al., 2006).
ACKNOWLEDGEMENTS
We are grateful to Eric Koomen who contributed to prepare the path for this study, and to the anonymous reviewers for their comments and suggestions.
REFERENCES
Ballis, A. (2006) ‘Implementing the European Transport Information System’, Transportation Research Record, 1957, 23-31.
Bejleri, I., Roaza, R., McGilvray, P., Thomas, A. (2006) ‘Integrating Information Technology in Efficient Transportation Decision Making – Florida’s Environmental Screening Tool’, Transportation Research Record, 1983, 15-23.
8 M. T. BORZACCHIELLO, P. NIJKAMP AND H. J. SCHOLTEN
Borzacchiello, M. T., Nijkamp, P., Koomen, E. (2007) ‘Accessibility and urban development: a grid-based comparative statistical analysis of Dutch cities’, paper presented at the NECTAR Workshop ‘Network Dynamics and Location Choice, Stuttgart, Germany, 26-27 October, 2007, http://econpapers.repec.org/paper/dgrvuarem/2007-15.
Dong, X., Ben-Akiva, M. E., Bowman, J. L., Walker, J. L. (2006) ‘Moving from trip-based to activity-based measures of accessibility’, Transportation Research Part A 40 163–180
Ettema, D., Timmermans, H. (2007) ‘Space-time Accessibility under Conditions of Uncertain Travel Times: Theory and Numerical Simulations’, Geographic Analysis 39(2) 217 - 240
Geurs, K. T., Ritsema van Eck, J. R. (2001) ‘Accessibility Measures: Review and Applications’, RIVM report 408505 006, National Institute of Public Health and the Environment, Bilthoven
Geurs, K. T., van Wee, B. (2004) ‘Accessibility Evaluation of Land-use and Transport Strategies: Review and Research Directions’, Journal of Transport Geography 12 127 – 140
ISTAT (2001) 14th Censimento Generale delle Popolazione e delle Abitazioni, www.istat.it.Kleinbaum, D. G., Klein, M., (2002) Logistic Regression – a Self Learning Text (2nd edition), Springer-
Verlag, BerlinKoomen, E., Stillwell, J., Bakema, A., Scholten, H.J. (2007) ‘Modelling land-use change; progress and
applications’, GeoJournal Library, Vol. 90, Springer Verlag, Berlin/Dordrecht (forthcoming)Mennitti, F. (2005) ‘L’inquinamento acustico generato dalle nuove rotte di decollo dell’aeroporto di
Capodichino sulla città di Napoli’, MSc Dissertation University of Naples “Federico II”.Reggiani, A. (1998) ‘Accessibility, Trade and Locational Behaviour’, Ashgate, AldershotTele Atlas North America, Inc. (2006) TeleAtlas Multinet Shapefile Data Base, Content and
Documentation CD..Wilson, A. G. (2001) ‘A family of spatial interaction models, and associated developments’,
Environment and Planning B 3(1), 1–32
A LOGISTIC REGRESSION APPROACH TO EXPLAIN URBAN DEVELOPMENT USING ACCESSIBILITY: AN ITALIAN CITY 9
Table 1 Accessibility measures and other explanatory variables used in the case studies A and B
Note: “Categorical” means classified as individual segments of 50 metres, from 0 to the trial distance threshold; above the threshold, the influence is considered negligible.
Table 2 Summary of goodness-of-fit statistics of the logistic regression: Case A
Table 3 Logistic regression coefficients: Case A
Amsterdam Utrecht Rotterdam The Hague Naples All
VARIABLES Exp () Exp() Exp() Exp() Exp() Sig.
Bufferzone (na_hills) -1.672 0.188 -0.801 0.449 -1.777 0.169 -2.354 0.095 -1.428 0.240 .000
Schiphol (Capodichino)_infl -0.775 0.461 -- -- -- -- -- -- -1.058 0.347 .000
dis_rail_stop_km -0.259 0.772 -0.315 0.730 0.714 2.042 -0.121 0.886 - 0.018 0.982 .000
dis_IC_stat_km -0.272 0.762 -0.747 0.474 0.628 1.874 -0.122 0.885 0.060 1.062 .000
dis_road_poly_km 0.438 1.550 0.504 1.656 0.922 2.514 0.328 1.388 0.164 1.179 .000
dis_rail_poly_km 0.560 1.750 -0.060 0.942 -0.782 0.457 0.165 1.179 -0.157 0.854 .000
dis_hw_ex_km -0.318 0.727 -0.087 0.917 -0.996 0.369 -0.498 0.608 -0.117 0.890 .000
dis_city_centre_km -0.106 0.899 0.289 1.335 -0.611 0.543 -0.057 1.058 -0.280 0.756 .000
AdamNorth -0.423 0.655 -- -- -- -- -- -- -- -- .000
RotterdamNorth -- -- -- -- -- -- -0.197 0.821 -- -- .000
Constant 0.844 2.325 1.546 4.692 0.974 2.648 0.282 1.325 1.657 5.242 .000
Variable Name Type Measure unit
Euclidean distance to the city centre dis_city_centre Continuous kmEuclidean distance to the nearest regular train station (not Intercity)
dis_rail_stop_km Continuous km
Euclidean distance to the nearest Intercity train station dis_IC_stat_km Continuous kmEuclidean distance to edge of nearest highway dis_road_poly_kmContinuous/Categorical km/50mEuclidean distance to edge of nearest railroad dis_rail_poly_km Continuous/Categorical km/50mEuclidean distance to the nearest highway entrance or exit dis_hw_ex_km Continuous/Categoricalkm/50mLocation in a zone of environmental protection Parco_colline Discrete (1/0)Location in zone influenced by noise pollution due to Capodichino airport
Capodichino_infl Discrete (1/0)
Number of Jobs per cell (case B) jobs_per_cell Continuous no. jobs/cell
Statistics Case study
Amsterdam Utrecht Rotterdam The Hague Naples
-2 Loglikelihood 379255 138923 653391 230893 230687
Nagelkerke R Squared 0.205 0.244 0.158 0.165 0.167
Overall correct model percentage 72.1 71.8 74.5 62.7 64.4
10 M. T. BORZACCHIELLO, P. NIJKAMP AND H. J. SCHOLTEN
Table 4 Estimated distance thresholds compared with areal extent: Case C
Amsterdam Utrecht Rotterdam The Hague Naplesbuilt-up areas extent (km2) 70 29 103 55 55
built-up areas extent (no. cells)
112000 46400 164800 88000 88000
total area of interest* (km2) 224 81 408 117 114
total area of interest* (no. cells)
358400 129600 652800 187200 182400
road polygon threshold 2000 m 1000 m 4000 m 1200 m 2500 m
railway polygon threshold 2500 m not significant > 4500 m 3600 m 800 m
highway exits threshold 2000 m 500 m 4000 m 300 700 m
*For the cities of Rotterdam, The Hague and Naples the total area of interest does not consider the no data cells.
Table 5 Explanatory variables (Case C)
Variable Name Type Measure unitAccessibility indicator of city centre acc_city_centre Continuous no. job/mAccessibility indicator of the nearest regular train station (not Intercity)
na_acc_rail_stop Continuous no. job/m
Accessibility indicator of the nearest Intercity train station na_acc_IC_stat Continuous no. job/mAccessibility indicator of the edge of nearest highway na_acc_road_poly Continuous no. job/mAccessibility indicator of the edge of nearest railroad na_acc_rail_poly Continuous no. job/mAccessibility indicator of the nearest highway entrance or exit na_acc_hw_ex Continuous no. job/mLocation in a zone of environmental protection na_hills Discrete (1/0)Location in zone influenced by noise pollution due to Capodichino airport
Capodichino_infl Discrete (1/0)
Table 6 Case studies on Naples: Comparison of goodness-of-fit statistics of the logistic regression (continuous variables only)
Statistics Case study: Naples
A B C-2 Loglikelihood 230687,93 229389,54 237588.55
Nagelkerke R Squared 0.167 0.175 0.123
Overall correct model percentage 64.4 65.0 63.8
Table 7 Summary of logistic regression coefficients (continuous variables only) (Case B)
NAPLES Case BVARIABLES Exp()Sig.
na_hills -1.345.261 .000
noise_infl -1.007.365 .000
jobs_per_cell .059 1.061 .000
dis_rail_stop_km -.020 .981 .000
dis_IC_stat_km .058 1.059 .000
dis_road_poly_km .133 1.142 .000
dis_rail_poly_km -.134 .875 .000
dis_hw_ex_km -.114 .892 .000
dis_city_centre_km -.241 .786 .000
Constant 1.415 4.118 .000
A LOGISTIC REGRESSION APPROACH TO EXPLAIN URBAN DEVELOPMENT USING ACCESSIBILITY: AN ITALIAN CITY 11
Table 8 Summary of logistic regression coefficients (continuous variables only) (Case C)
NAPLES Case CVARIABLES Exp()Sig.na_hills -1.252.286 .000noise_infl -.766 .465 .000jobs_per_cell .126 1.134 .000rail_stop_acc -18.8 .000 .005
IC_stat_acc -.004 .996 .000road_poly_acc .409 1.505 .472rail_poly_acc 1.259 3.520 .000hw_ex_acc -.003 .997 .827city_centre_acc .002 1.002 .860Constant -.005 .995 .433
Table 9 Estimated distance thresholds for different case studies
NAPLES Case A Case Broad polygon threshold 2500 m 2500 mrailway polygon threshold 800 m 700 mhighway exits threshold 700 m 700 m
12 M. T. BORZACCHIELLO, P. NIJKAMP AND H. J. SCHOLTEN
Municipality borders
MinimumBoundary Rectangle
Area of interest (aoi)
Buffer3000m
Buffered aoi
National spatial data
set
Selection by location
Infrastructure dataset(shapefiles)
- railway stations- highway exits- road polygon
- railway polygon- city centre
Buildingspolygon shapefile
Select by locationConvert to raster
Binary buildings raster 5x5m
Aggregate
Buildings raster 25x25m
Euclidean distance within buffered aoi
City dataset(shapefiles)
- bufferzones- context information
Distances within buffered aoi
raster 25x25m
Extract by mask
Distances within aoi
raster 25x25m
Convert to raster
Binary (0/1) raster 25x25m
Create x,y,z tables
Table for each variable
(.dbf)
Import and analysis in the statistical software (SPSS)
Join and export
Table for all variables (.txt)
Localised (with x, y information)
predicted probability table
(.dbf)
Export
Import x,y dataProbability events
(Shapefile)Convert to
rasterPROBABILITY MAPS
raster 25x25m
SHAPE LEGEND
Derived dataProcessINPUT DATA
Figure 1 Overview of the applied methodology1. For a detailed description of the processes used, see http://support.esri.com
1 x, y, z tables contain the information about the localisation of each cell in terms of xy coordinates and, as z-values, the
value of the variable concerned.
A LOGISTIC REGRESSION APPROACH TO EXPLAIN URBAN DEVELOPMENT USING ACCESSIBILITY: AN ITALIAN CITY 13
Figure 2 Predicted probability maps compared with input data (Case A, B and C)