accessibility patterns: poland case study
TRANSCRIPT

EUROPA XXI
Vol. 24, 2013, pp. 77-93
http://dx.doi.org/10.7163/Eu21.2013.24.6
Institute of Geography and Spatial Organization
Polish Academy of Sciences
www.igipz.pan.pl
Accessibility patterns: Poland Case Study1 2
Marcin StępniakDepartment of Urban and Population StudiesInstitute of Geography and Spatial OrganizationPolish Academy of Sciencesul. Twarda 51/55, 00-818 Warsaw, [email protected]
Piotr Rosik, Tomasz KomornickiDepartment of Spatial OrganizationInstitute of Geography and Spatial OrganizationPolish Academy of Sciencesul. Twarda 51/55, 00-818 Warsaw, [email protected], [email protected]
Abstract: The paper presents the spatial pattern of accessibility indicators in Poland. The distribution of the results seems, to a large extent, a by-product of the settlement network pattern, distribution of jobs and services of general interest. The impact of the transport infrastructure itself is rather not visible. Furthermore, the accessibility of regional centres in Poland is conditioned by geographical and historical factors, which determine the distribution of centres, while the transport infrastructure has an inconsiderable influence. Moreover, between some of the regional centres, internal peripheries may be detected. The results have confirmed that there is acute spatial incompatibility between places where people live and places where they work throughout Poland.In the conditions of the low level of current transport infrastructure development, Poland should make great effort towards the implementation of TEN-T investments. Nevertheless, although TEN-T projects cover most of Poland, particular attention is paid to modern roads connecting Warsaw and other metropolises with the rest of the country. The system aims mainly at improving accessibility between the main metropolises where the majority of Poles live.
Keywords: accessibility, transport infrastructure, accessibility pattern, TEN-T, GIS, Poland.
1 The analyses presented in this paper are using the databases concerning public transport systems prepared on the basis of research project 'Multimodal public transport accessibility of Polish gminas' The project has been financed from the National Science Centre DEC-2012/05/E/HS4/01798. The travel speed model and the road network have been prepared within the research project ‘Transport infrastructure development and modal shift in the Polish space in the years 2000-2010’. The project has been financed from the National Science Centre DEC-2011/01/D/HS4/01862.
2 This paper has been developed under the applied research project TRansport ACCessibility at regional/local scale and patterns in Europe led by Spiekermann & Wegener Urban and Regional Research (S&W) Germany. It has been financed by the ESPON 2013 Programme and its financial support is gratefully acknowledged. Texts, maps and conclusions stemming from research projects under the ESPON programme presented in this paper do not necessarily reflect the opinions of the ESPON Monitoring Committee. © ESPON, 2013.
EUROPEAN UNIONPart-financed by the European Regional Development FundINVESTING IN YOUR FUTURE ESP N
zlecenie___011.indb 77zlecenie___011.indb 77 07-03-2014 10:42:4807-03-2014 10:42:48

78 Marcin Stępniak, Piotr Rosik, Tomasz Komornicki
Case study introduction
The case study covers the whole territory of Poland, i.e. surface area of 312,685 km², with the population of about 38.2 million. Basic administrative units of the country are gminas (municipalities, LAU2 units, 2,479 units in total). The northern border of Poland runs partly (about 440 km) along the Baltic Sea coast. Poland shares the rest of the border (3,511 km) with its seven neighbouring countries including, since 2004, 1,908 km of internal EU borders (within the Schengen area since 2007) with Germany, the Czech Republic, Slovakia and Lithuania and, since 2007, about 1,163 km of new eastern Schengen borders with Ukraine, Belarus and Russia. The Sudety mountains are located on the Polish-Czech border and the Carpathian mountains stretch along Poland’s border with Slovakia. However, the majority of the country is lowland (Figure 1).
Spatial structureThe structure of the Polish urban system is polycentric. Compared with the urban systems of other large European countries like Spain or France, the capital of Poland (Warsaw) is less dominant in the Polish urban hierarchy. The official population of Warsaw is about 1.7 million people (only 4.5% of the total population of the country) and the population of the metropolitan area is around 2.8 million. Besides Warsaw, the populations of Krakow, Łódź, Wrocław and Poznań exceed 500,000. The population twelve other cities exceeds 200,000. There are 306 urban municipalities (12% of total municipalities).
NUTS 2 population density ranges between 59 people per 1 km² in north-eastern Poland (Warmińsko-Mazurskie and Podlaskie Voivodeships) and more than 200 people per 1 km² in the south-central part of the country (217 people per 1 km² in Małopolskie and 377 people per 1 km² in Śląskie Voivodeships). The average population density in Poland is about 122 people per 1 km².
The actual distribution of the population proves slightly different from that shown by the statistics. A large part of migrations, both internal and foreign, is not registered by population records. As a result, the population of major Polish cities, and especially of their suburban zones, is higher than officially estimated, whereas peripheral areas have, in fact, lower population.
Socio-economic situationIn the past two decades, Polish GDP has grown rapidly and today Poland ranks sixth in the EU in terms of real total GDP (PPP-based). The Polish economy avoided a decline in GDP during the financial crisis and managed to generate the highest GDP growth in the EU in 2009, when Polish GDP increased by 1.6%. GDP growth amounted to 3.9% in 2010 and 4.3% in 2011. There are considerable inner differences in GDP. Under the current EU programming period, all of the regions (NUTS 2) are eligible for support from EU structural funds, since their GDP level was below 75% of the EU average. In the case of Eastern Poland regions, it was even lower, not exceeding 40% of the EU average. Currently, the Mazowieckie Voivodeship’s GDP oscillates at 90% of the EU average (in terms of the purchasing power parity).
The restructuring of heavy industry and the agricultural sector after 1989 led to higher unem-ployment in Poland (20% of the economically active population without a job in 2002-2003). In the following years, after Poland joined the European Union in 2004, the situation improved and the unemployment rate decreased to the level of 7.1% in 2008 (e.g. as a result of investment projects, but
zlecenie___011.indb 78zlecenie___011.indb 78 07-03-2014 10:42:4807-03-2014 10:42:48

Accessibility patterns: Poland Case Study 79
also due to economic migration). However, due to the financial crisis, it increased again to 9.7% in 2011 (in Warmińsko-Mazurskie Voivodeship it exceeds 20%).
Poland’s large internal market of 38 million consumers possibly helped the country to be more independent of the global economy than the rest of Eastern European states. Exports generate 41% of GDP. However, as early as from 1995, 70% of Polish export has been directed to EU Member States (particularly Germany). The figure has even increased, constituting nearly 80% in 2010 (including 26% to Germany).
The GDP structure includes mainly the service sector (68%), followed by industry and construc-tion (29%), and agriculture (3%). Overemployment in agriculture (about 15% of the workforce), particularly in the eastern parts of the country, remains an obstacle to modernisation.
The spatial structure of industry in Poland has its roots in the time when Poland was partitioned by the Prussian, Austrian and Russian empires. The western and southern parts of Poland became more industrialised than the central and eastern parts (with the exception of metropolitan areas and Świętokrzyskie Voivodeship). Despite a strong decline of coal mining and metallurgy in terms of employment, the main industrial part of Poland remains the industrial conurbation of Upper Silesia. The automobile industry has developed to a considerable extent in south-western Poland, but most of the offices and foreign direct investments are located in Warsaw and its surroundings or in the other large metropolitan areas. In some regions (also in Eastern Poland), new clusters of furniture and food industries (e.g. dairy) have emerged.
For several years Poland has seen considered emigration to the UK and Ireland where 1 million Poles outnumber other immigrants from Eastern Europe. This process influenced the contemporary national job market to a considerable extent.
Transport aspectsBefore 1989, the Polish transport system was characterised by freight traffic flows in the east-west direction between the Soviet Union and the GDR and in the north-south direction between Polish harbours and the Upper Silesian coal region. After 1989, the decline in freight transport and the rapid increase in private mobility and motorisation (much faster than GDP growth) resulted in the people owning more than 450 motor vehicles per 1,000 inhabitants in 2010. In spite of the process of the growing motorisation of the society, the 1990s were the decade of further delay in major decisions concerning transport infrastructure investments. After 2000, Poland made up for lost time by implementing the largest national motorway construction programme in Europe. In 2000, about 500 km of motorways and expressways were in operation, while 12 years later, in July 2012, more than 2,000 km was in operation and another 1,000 km were under construction. However, after 2012 the process of road infrastructure improvement will slow down significantly due to budgetary constraints.
Road traffic is particularly concentrated in high population density areas: Upper Silesia region, Poznań and Warsaw agglomerations. The highest traffic volumes are observed on international roads: the existing motorway sections of A4 (E40), A2 (E30) and A1 (E-75; mainly Upper Silesia – Central Poland section), E-77 (from Gdańsk through Warsaw to Krakow) and E-67 from (from Wrocław through Warsaw to the Polish-Lithuanian border). The main transit roads are the routes from Germany through Poznań and Warsaw to the Baltic States and from Germany through Wrocław, Katowice and Krakow to the Polish-Ukrainian border.
Until the very end of the centrally planned economy era, there had been huge disparities as regards the density of the railway network, which can be accounted for by the pattern of borders dating back
zlecenie___011.indb 79zlecenie___011.indb 79 07-03-2014 10:42:4807-03-2014 10:42:48

80 Marcin Stępniak, Piotr Rosik, Tomasz Komornicki
to the partition period. At the same time, however, after World War II, the majority of important railway lines in Poland was electrified by enormous effort (the level of electrification was estimated to be in the order of 60%). However, it was not accompanied by modernisation in terms of construction of additional supplementary rails, replacement of damaged tracks and implementation of up-to-date technologies in railway signalling. After 1990, the railway network has been subject to increasingly accelerated regression, which began as early as in the 1970s. In the years 1985-2004, a total of 8,200 km of railway lines were closed down for passenger traffic. That regression occurred, in the first place, in Western Poland, characterized by higher network density, which led to a decrease in regional disparities. After 1990, new lines were no longer constructed. Among huge investment projects, only the Warsaw-Berlin line was modernised successively. Furthermore, some cross-border connections were restored, yet some of them were liquidated again due to low demand. Nowadays, Southern Poland enjoys the best developed railway network (especially Upper Silesia), with Northern and Eastern Poland lagging behind with a significantly underdeveloped network (in Podlaskie Voivodeship it was merely 3.4 km per 100 km2 in 2006).
As a result, Poland suffers from lack of a proper railway infrastructure. The large decrease in technical speeds on many railway lines has forced the modal shift from railways to roads. The government plan of building the first Polish high speed railway line from Warsaw to Poznań, Wrocław and Łódź (Y line) has been postponed indefinitely.
Poland's regional airports are catching up with the country's main airport in Warsaw in terms of the number of passengers following the accession to the EU. In 2011, more than 57% of the total of 21.7 million passengers of Polish airports used regional airports. The main destinations are the UK and Germany. The expansion of low-cost carriers resulted in an increase in the number of domestic flights and passengers in recent years.
Cargo port operations are concentrated in Gdańsk and Gdynia (Pomorskie Voivodeship), and on a smaller scale also in Szczecin and Świnoujście (Zachodniopomorskie Voivodeship). Since 2011, the sudden increase in international container shipping was possible thanks to Post-Panamax ships which operate the weekly direct Far East container service from Shanghai to Gdańsk.
zlecenie___011.indb 80zlecenie___011.indb 80 07-03-2014 10:42:4807-03-2014 10:42:48

Accessibility patterns: Poland Case Study 81
Figure 1. Poland case study region.
zlecenie___011.indb 81zlecenie___011.indb 81 07-03-2014 10:42:4807-03-2014 10:42:48

82 Marcin Stępniak, Piotr Rosik, Tomasz Komornicki
Accessibility patterns
The analyses presented below are based on the common methodology adopted under the ESPON TRACC project (Biosca et al., 2013). The calculations of travel time by a passenger car are based on the spatial database of the road network developed by IGSO PAS and the attributed travel speeds derived from the Polish Highway Code, which were adjusted for driving impediments. The model includes 14 categories of roads in Poland (for details please consult: Komornicki et al. 2010, Rosik 2012, Stępniak & Rosik 2013). Next, logit functions were used and this way the average speed in Poland was calculated for parts of the road network taking account of traffic regulations and some other variables influencing speed. For each road category and for each variable influencing speed, different parameters were applied in the logit functions producing the appropriate speed limit-related reductions of travel speed. In general, the duration of travel by road transport in Poland was estimated on the basis of the traffic velocity model for more than 12,000 road segments, including local – poviat (county) and gmina (municipality) – roads. The velocity model for Poland was elaborated under the assumption of the influence of various variables on speed, including:
Road quality category, Road width, Population in the buffer zone of 5 km in the vicinity of a given segment, Developed areas, Terrain relief.
To estimate travel times by public transport, the original spatial database was established. Its core covers the railway network supplemented by travel times between railway stations using different types of railway connections (i.e. express trains, as well as fast and slow regional trains). It allows us to connect approx. 30% of all LAU2 nodes (gminas – municipalities). Bus travel times were estimated based on the dedicated geographical database. Using GIS software (TransCad), the polyline layer was built where each polyline connects nodes via the road network. We decided to select the fastest path, in order to avoid the use of local roads instead of main ones, and even there the duration of travel is slightly longer. To make the network more ‘realistic’, a selection of nodes (i.e. LAU2 municipalities) was made, as the ‘real’ public transport does not allow to travel between all municipalities directly. Finally, the procedure consisted of four stages.
First of all, the ‘core’ network was built that allowed to reach all poviats (LAU1 nodes) from all gminas (LAU2 nodes) located within the area. It was based on a set of ‘spider graphs’ composed of 1,986 polylines in total, leading to one of the 335 LAU1 nodes. There are no connections between particular sub-networks.
Secondly, direct connections between all pairs of local centres (LAU1, poviats) were generated. To simplify the network, all the sub-networks were checked and edges connecting adjacent LAU1 nodes to the final database were selected. Ultimately, the sub-network consists of 1,320 edges after very detailed verification.
The third sub-network consists of the edges which (directly) connect the LAU2 nodes located outside the railway network with train stations. All LAU2 nodes were connected to the nearest train station. If there was more than one train station in the proximity of a node (LAU2), we decided to add all of the connections which meet following conditions:
Lengthi < 40 km, and Lengthi < = 1.33 * LengthMINi
•••••
•
zlecenie___011.indb 82zlecenie___011.indb 82 07-03-2014 10:42:4907-03-2014 10:42:49

Accessibility patterns: Poland Case Study 83
Lengthi is the distance between municipality i and investigated train station and LengthMINi is the distance between municipality i and the closest train station.
In consequence, we came up with a sub-network that consists of 2,845 original edges (some of the edges were the same as in one of the previous sub-networks. i.e. LAU1 to LAU1 or LAU2 to the adequate LAU1). The last step was to generate road-rail connectors, if necessary (778).
Finally, we generated a network of public transport that consists of 8,656 edges. It connects all of the 2,321 LAU2 nodes. Estimated travel speeds were randomly tested and verified. Finally, the following parameters in relation to travel speed and time were used:
For rail: real travel times (based on timetables),For estimated bus transport: 30 km/h,For rail-LAU2 connectors: 15 minutes for distances up to 1.5 km, and proportionally up to 30 minutes for the longer ones (maximum distance: approx. 6 km); it allowed to include both the time necessary to change of transport mode as well as the time needed to reach a railway station located outside a municipality centre (if necessary).
Daily accessibility of jobs by carIn general, jobs are concentrated in particular in metropolises with a population of more than 500,000. The best accessibility of jobs within 60 minutes’ travel time is within the metropolitan areas of Warsaw, Łódź, Wrocław, Poznań, Krakow and Upper Silesia conurbation. The access is better also where long distances are concerned if a good connection by motorway or expressway is available, for instance along A2 motorway near Poznań and A4 motorway near Wrocław, A1 motorway between Gdańsk and Toruń or along S8 expressway section north-east of Warsaw. Relatively favourable accessibility of jobs is also the case in South-Eastern Poland voivodeships (Podkarpackie, Lubelskie, Świętokrzyskie). In this case, it is due to greater dispersion of industrial companies in medium-sized towns (in the second half of the 20th century, that part of Poland was industrialised based on commuting to work from rural areas).
Access to jobs is the lowest in the municipalities located near the border, especially near the outer Schengen area border with Ukraine (Bieszczady mountains), Belarus (south of Białystok, close to Białowieża forest) and Russia. These areas are known for their migration outflow (Figure 2). Zones that are characterised by poor accessibility of jobs seem to directly correspond to the regions with the highest unemployment. This corroborates the thesis that unemployment in Poland is structural. At the same time, several studies on commuting (Wiśniewski 2012) prove that a significant part of these trips is made at a distance greater than 60 minutes (for example in North-Eastern Poland). This leads to a general conclusion that job accessibility is not correlated with demand for work. There is acute spatial incompatibility between places where people live and places where they work. It can be solved only by way of migration or development of infrastructure and/or public transport.
Based on the results, one can put forward a hypothesis that the population from rural areas (including peripheral regions) faces great difficulties with finding jobs because of extremely restricted job accessibility within the 60-minute isochrone.
Regional accessibility potential by carAgainst the background of the entire country, the best accessibility is bragged by the Metropolitan Area of Warsaw, Upper Silesia and Krakow, the areas along A2 motorway routes (between Poznań and Łódź; the calculation was carried out before the Łódź – Warsaw section was opened), A4 (between Wrocław and Krakow), A1 (between the Gdańsk and Toruń), along the dual carriageway between Warsaw, Piotrków Trybunalski and Katowice and, although to a lesser extent, the areas of
•
•••
zlecenie___011.indb 83zlecenie___011.indb 83 07-03-2014 10:42:4907-03-2014 10:42:49

84 Marcin Stępniak, Piotr Rosik, Tomasz Komornicki
the other large agglomerations with high population density. The regions with the worst accessibility are the regions located near the border, the outer Schengen area border in particular (Figure 3), but also, fragmentarily, along the border with Germany and Czech Republic. Some compact areas with lower potential accessibility can be found in Pomerania (except for the Gdańsk subregion). The dif-ference between regions with the best and the worst accessibility in the national dimension remains huge, even among neighbouring NUTS 2 regions, even up to levels of accessibility of Krakow in comparison with Bieszczady mountains which are higher by more than ten times.
Access to regional centres by public transportIn the analysis, ‘regional centres’ are the main cities of NUTS 3 units. In the case of Poland, there are 65 cities considered regional centres which are, however, not evenly distributed throughout the country (Figure 4). As a result, vast differences in access to the nearest regional centre are observed. Although the population’s weighted average access to regional centres by public transport is about 40 minutes, the median value of time needed to reach a regional centre increased to 65 minutes. Moreover, there are many municipalities that are almost inaccessible by public transport, i.e. for which the travel time to the nearest regional centre exceeds 100 minutes.
The analysis clearly highlighted the zones of the so-called inner peripheries (not located near the state borders) where the distance to regional centres is noticeably greater. These are located mainly in the north (for example, the internal zone of Pomerania) as well as in Eastern Poland. The existence of such inner zones is, in some cases, determined by the distribution of the settlement network (e.g. absence of large cities in Pomerania or areas lying at the German border which are cut off from principal historical centres located on the western bank of Oder River). In other regions, the existence of these zones can be explained by acute shortages in transport infrastructure (e.g. in the direction of the Warsaw – Krakow and Warsaw – Gdańsk corridor). Further, in Central Poland, the area of poor accessibility of regional centres by public transport covers also a belt along the Central Railway Line (Warsaw – Upper Silesia), which is due to the fact that there is no railway station over a 150 km long and the fastest section of the line.
Naturally, urban municipalities have on average much better access to regional centres than rural municipalities. The conclusion is that people who live in rural areas are practically forced to use their own car. The situation is relatively better only in suburban zones of regional centres where public transport can be treated as a viable alternative to private transport.
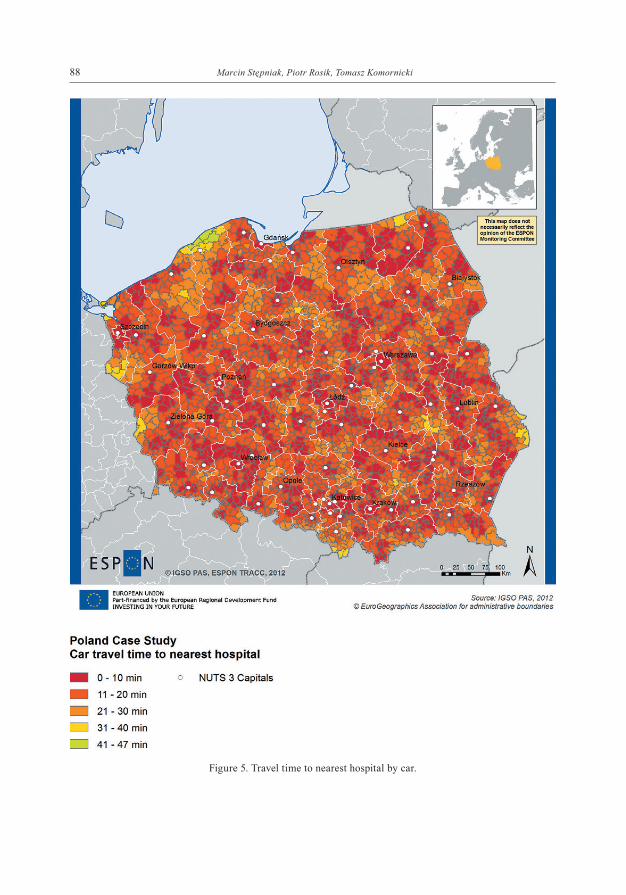
Access to health care facilities by carHospitals are, in general, much more equally distributed throughout the country than other services. There are many hospitals located in rural areas, in poviat centres (LAU1). For that reason, travel time to the nearest hospital in Poland rarely exceeds 30 minutes. There are also many hospitals located near the borders of Poland, even in cities which are not regional centres (Figure 5). The situation is only worse in several borderland regions as well as on the Baltic coast. In the case of Słupsk area, there situation has already changed thanks to opening a new medical facility in 2011. To the south-east of Warsaw, poor accessibility of hospitals is compounded by a shortage of bridges on the middle stretch of Vistula River.
The population’s weighted average travel time to the nearest hospital by car for all municipalities is 10 minutes. The situation in urban areas is only a little better than in rural areas. This confirms the conclusion that hospitals are distributed in Poland equally and access to hospitals for all the people, even from the most remote areas, is relatively good.
zlecenie___011.indb 84zlecenie___011.indb 84 07-03-2014 10:42:5007-03-2014 10:42:50

Accessibility patterns: Poland Case Study 85
Figure 2. Jobs accessible within 60 minutes by car.
zlecenie___011.indb 85zlecenie___011.indb 85 07-03-2014 10:42:5007-03-2014 10:42:50

86 Marcin Stępniak, Piotr Rosik, Tomasz Komornicki
Figure 3. Potential accessibility to population by car.
zlecenie___011.indb 86zlecenie___011.indb 86 07-03-2014 10:42:5107-03-2014 10:42:51

Accessibility patterns: Poland Case Study 87
Figure 4. Travel time to nearest regional centre by public transport.
zlecenie___011.indb 87zlecenie___011.indb 87 07-03-2014 10:42:5107-03-2014 10:42:51
88 Marcin Stępniak, Piotr Rosik, Tomasz Komornicki
Figure 5. Travel time to nearest hospital by car.
zlecenie___011.indb 88zlecenie___011.indb 88 07-03-2014 10:42:5207-03-2014 10:42:52

Accessibility patterns: Poland Case Study 89
Impact of future TEN-T road network developments
The analysis presented herein attempts to answer the question to what extent the improvement of accessibility resulting from the implementation of TEN-T project would be noticed and what would be the spatial pattern of these improvements. The effect of TEN-T projects is calculated on the basis of several assumptions. First of all, the travel speed on all new expressways and motorways is calculated on the assumption of influence of various variables on the speed of vehicles on each road section, including:
Road category (motorway or expressway),Population in the buffer of 5 km in the vicinity of a given segment, developed areas and terrain relief (to a lesser extent).
Taking into account the above mentioned conditions, average speed on expressways ranges between 100 km/h and 120 km/h, and on motorways it is 120-140 km/h. The maximum speed for a car in Poland is 120 km/h on expressways and 140 km/h on motorways. On most motorway and expressway sections in Poland, traffic is still below 25,000 vehicles/24 h, and for this reason such high speeds are reasonable.
Last but not least, the TEN-T accessibility analysis is carried out with the use of the EU TEN-T network proposal used under all TRACC case studies, which is not the same as the list of sections which are to be implemented by Polish government in the nearest future.
Currently, Poland makes great efforts to enlarge the TEN-T network in its territory. Nevertheless, although TEN-T projects cover most of Poland, particular attention is paid to modern roads connect-ing Warsaw and other metropolises with the rest of the country (Figure 6). There are no investment projects in the areas shaped like two big triangles: the first one between Szczecin, Gdańsk and Bydgoszcz and the second one between Gdańsk, Warsaw and Białystok. The system aims to mainly improve accessibility between the main metropolises, where the majority of Poles live. The cohesion effect in the areas located within the above-mentioned two triangles will be improved local roads rather than expressways or motorways. TEN-T projects are designed for the most congested corridors and are the answer to demand and expectations.
TEN-T road projects concern mainly the lacking parts of the most important motorways and expressways. There are missing parts of A1, A2 and A4 motorways and S3, S5, S7 and S8 expressways which are to be completed mostly within the 2014-2020 European financial perspective or later.
The implementation of the all TEN-T projects (if the current plans remain in effect) will lead to significant changes in the accessibility pattern of Poland. The improvement of expressways in all directions from Warsaw will significantly improve accessibility of Eastern Poland and its big cities: Lublin and Rzeszów, which today still suffer from the absence of a modern road connection with the capital (Figure 6). Besides, Eastern and Central Poland will also benefit from the motorway and expressway construction programme. North-Western Poland, where traffic needs are the lowest, is the loser under the programme. This is mainly due to the fact that neither S6 expressway (Gdańsk – Szczecin) nor S10 expressway (Szczecin – Bydgoszcz section) is on the list of TEN-T projects, and they will be implemented in remote future. These relatively not satisfactory advantages in North-Eastern Poland will hopefully be boosted as a result of a change in the course of Via Baltica and the choice of a variant located more to the west (forced by environment protection considerations).
••
zlecenie___011.indb 89zlecenie___011.indb 89 07-03-2014 10:42:5307-03-2014 10:42:53

90 Marcin Stępniak, Piotr Rosik, Tomasz Komornicki
Figure 6. Relative increase in potential accessibility to population by car with TEN-T projects.
zlecenie___011.indb 90zlecenie___011.indb 90 07-03-2014 10:42:5307-03-2014 10:42:53

Accessibility patterns: Poland Case Study 91
Conclusions
The analysis carried out in Poland allowed identification of the basic differences in terms of spatial accessibility in one of the new EU Member States that is significantly backward in terms of develop-ment of its transport infrastructure. Poland has not modernised its road or railway infrastructure since the 1980s.
In the first few years of rapid economic growth in Poland (1994-2000), we did not take advantage of expansion of the transport infrastructure. Consequently, when Poland joined the European Union in 2004, its transport infrastructure differed only marginally from that of 1989, and almost all plans concerning future investment projects were based on the expected influx of European funds. At the same time, the basic gaps in networks were so significant that despite the nominally highest (compared to other countries) expected transfers (both in 2004-2006 and in 2007-2013), it turned out impossible to implement all the most urgent tasks using the structural funds. This entailed the necessity, to a higher degree than in other accession countries, of making a selection of the investment projects that would be supported (from a long list of priority tasks).
In the above conditions, the distribution of spatial accessibility remains, to a large extent, a by-product of the settlement network pattern and of the distribution of jobs and public utility services (for example, health care and education). Influence of the transport infrastructure itself is clearly visible in public transport, which results from its uneven density (i.a. as a consequence of closing down many railway lines), and primarily from the quality of railway routes.
The situation is slightly different in road transport. It results from the fact that Poland had had a relatively evenly developed and a quite dense network of sealed roads even before the transition period. Simultaneously, there is a shortage of investment projects aimed at developing modern routes (motorways and expressways), due to which accessibility has not been adequately improving by new developments. Just the opposite, fast growth in the number of cars resulted in substantial overload of the road network and congestion, leading to deterioration of the accessibility level locally. Not until 2004 the development projects that had been undertaken led to a differentiation in spatial accessibility indicators in view of the condition of infrastructure. There was noticeable improvement in the selection of directions. The scale of the improvement (and thus the scale of spatial differentia-tion) was limited due to scarcity of investment projects on the road sections entering major cities (including, especially, Warsaw), which was due to spatial conflicts in suburbanisation zones as well as to environmental protection functions.
At the same time, in the field under analysis, the findings overlapped with socio-economic proc-esses going on in Poland which had a spatial dimension. In the first place, this concerns internal and external migrations (changes in the distribution of the population), and investments in health care.
Interpretation of the results has to take into account the methodological assumptions. Assumed fixed travel access time and travel time by public transport, whose value is necessarily slightly too high in strongly urbanized areas, and sometimes too small in rural peripheral areas, are of particular significance. This means that in reality (in respect of the presented results): (a) public transport is not very much competitive in metropolitan areas, (b) disparities in accessibility by public transport between urbanised units and rural units are even greater. The second methodological limitation is based on assuming a division into types of units (in terms of degree of urbanisation) at the NUTS 3 level, which in Polish conditions (as compared to German units, where units of that level comprise large areas) leads to significant flattening of the results.
zlecenie___011.indb 91zlecenie___011.indb 91 07-03-2014 10:42:5407-03-2014 10:42:54
92 Marcin Stępniak, Piotr Rosik, Tomasz Komornicki
Additionally, internal accessibility in Poland has understandably different spatial distribution from that investigated at the European level. In reality, evaluation of the situation in particular local units should take into consideration both kinds of indicators. This concerns especially units located along the German border, where transport linkages with Central Poland are sometimes poor (see: Zaucha et al., 2013).
In Poland, accessibility of regional centres is conditioned by geographical and historical factors. Thereby it is much better in South-Central Poland and inferior in the north where population density is lower and cities/towns are sparse (especially in Pomerania and Masuria regions). It translated into the availability of public utility services (health care, education) only partially, since many of such functions are fulfilled by poviat centres, which are evenly distributed also in sparsely populated regions. Between some of the regional centres there are clearly visible internal peripheries. The existence of some of these peripheries is still tied to the borders left over from the historical period of the Partitions (for example, 19th century borders between the Russian and Austrian rule between Rzeszów and Przemyśl and Lublin and Zamość or the pre-war Polish-German border).
The results have confirmed that there is acute spatial incompatibility between places where people live and work throughout Poland. Concentration of places where people work in major metropolises and in some medium-sized centres is markedly greater than the concentration of the population. This is the reason behind large-scale traveling/commuting to work even from places far beyond what is conventionally perceived as the upper limit isochrone – 60-minutes’ travel time.
On the basis of the indicators we investigated, it can be inferred that new road investments (after 2004) have clearly become apparent during the analysis of potential accessibility to the population to a large degree. A strongly positive effect is immediately perceptible in the long progression of built motorways and expressways (despite their formally lower technical standards and thus lower passing through speed adopted in the traffic model). In the first place, this involves road routes linking large demographic potentials, such as A4 motorway between Wrocław, Upper Silesia and Krakow. The advantages are, however, visible also in areas more sparsely populated, for example between Gdańsk and Toruń (A1 motorway) as well as in areas located to north-east of Warsaw (sections of expressways along Via Baltica).
The analysis also revealed a relatively satisfactory and evenly distributed development of public utility services, such as health care facilities, in Poland. Yet, disparities in accessibility of different public utility institutions (e.g. hospitals) in immediate vicinity of places of residence have become apparent (in the relevant isochrone).
The study of the impact of investment projects that are envisaged within the framework of the current TEN-T network has attested to their significant potential shown in numerous previous EU studies (for example, the Fifth EU Cohesion Report) on improvement of accessibility by the road network. In particular, it needs to be stressed that there is prime necessity for development of the road infrastructure in the following directions: in Warsaw – Upper Silesia direction (south section of A1 motorway) – which has been proven by considerable improvement in accessibility, Gdańsk – Poznań – Wrocław (S5 expressway), and from Warsaw to regional centres located in Eastern Poland (S8 and S17 expressways to Lublin and Białystok).
zlecenie___011.indb 92zlecenie___011.indb 92 07-03-2014 10:42:5407-03-2014 10:42:54

Accessibility patterns: Poland Case Study 93
References
Biosca O., Spiekermann K., Stępniak M., 2013. Transport accessibility at regional scale, EUROPA XXI, vol. 24, pp. 5-17.
Komornicki T., Śleszyński P., Rosik P., Pomianowski W., 2010. Dostępność przestrzenna jako przesłanka kształtowania polskiej polityki transportowej. Biuletyn KPZK PAN, Warsaw, vol. 241.
Local Data Bank, http://www.stat.gov.pl/bdlen/app/strona.html?p_name=indeks [25 September 2013].
National Census 2011. Raport z wyników, Narodowy Spis Powszechny Ludności i Mieszkań 2011. Warsaw: Central Statistical Office.
Rosik P., 2012. Dostępność lądowa przestrzeni Polski w wymiarze europejskim. Prace Geograficzne, Warszawa: IGiPZ PAN, vol. 233. http://rcin.org.pl/Content/17917/WA51_35679_r2012-nr233_Prace-Geogr.pdf [25 September 2013].
Stępniak M., Rosik P., 2013. Accessibility improvement, territorial cohesion and spillovers: a mul-tidimensional evaluation of two motorway sections in Poland, Journal of Transport Geography, vol. 31, July, pp. 154–163.
Transport – activity results in 2010, 2011, Statistical Information and Elaborations, Central Statistical Office, Warsaw.
Wiśniewski R., 2012. Codzienne dojazdy do pracy – metodyczne aspekty badania wielkości i struk-tury dojazdów na przykładzie Białegostoku, Studia Regionalne i Lokalne, vol. 3, pp. 50-64.
Zaucha J., Komornicki T., Świątek D., Bohme K., Żuber P., 2013. Territorial keys for bringing closer the Territorial Agenda of the EU and Europe 2020. European Planning Studies, vol 22, iss. 2.
zlecenie___011.indb 93zlecenie___011.indb 93 07-03-2014 10:42:5507-03-2014 10:42:55

zlecenie___011.indb 94zlecenie___011.indb 94 07-03-2014 10:42:5507-03-2014 10:42:55
http://rcin.org.pl