a laboratory information management system for dna barcoding workflows
TRANSCRIPT
This journal is c The Royal Society of Chemistry 2012 Integr. Biol.
Cite this: DOI: 10.1039/c2ib00146b
A laboratory information management system for DNA barcoding
workflowswzThuy Duong Vu,*
aUrsula Eberhardt,
bSzaniszlo Szoke,
aMarizeth Groenewald
band
Vincent Roberta
Received 19th October 2011, Accepted 30th December 2011
DOI: 10.1039/c2ib00146b
This paper presents a laboratory information management system for DNA sequences (LIMS)
created and based on the needs of a DNA barcoding project at the CBS-KNAW Fungal
Biodiversity Centre (Utrecht, the Netherlands). DNA barcoding is a global initiative for species
identification through simple DNA sequence markers. We aim at generating barcode data for all
strains (or specimens) included in the collection (currently ca. 80 k). The LIMS has been
developed to better manage large amounts of sequence data and to keep track of the whole
experimental procedure. The system has allowed us to classify strains more efficiently as the
quality of sequence data has improved, and as a result, up-to-date taxonomic names have been
given to strains and more accurate correlation analyses have been carried out.
1 Introduction
DNA barcoding is a global initiative, which aims at streamlining
species identification through simple DNA sequence markers.19
The leading principles of the approach are (i) general agreement
on (or a few) marker regions; (ii) usage of vouchered strains; (iii)
and the assembly of sequence data and the specimen metadata
in public databases.38 The vision is that DNA barcoding will
open the field of species identification to non-experts and
therefore will enhance biological and medical progress at large.
This is no overstatement, because in many fields of biology,
agriculture, medicine, and even commerce, species form the key
to describing biological interactions.11,28
However, species are theoretical constructs, irrespective of
the species concept applied.11 Even putting aside the question
of the species concept adopted, the assignment of organisms to
species is often a matter of opinion, especially in microbiology.
This becomes obvious if contradictory interpretations of either
species descriptions or observations on the organism are possible,
or if the characters available for identification are ambiguous. In
addition, taxonomy is a dynamic system in which new insights
are constantly incorporated, so that identifications that were
correct according to the state of the art 10 years ago could be
wrong today. This may be rarely the case for enigmatic
organisms, but it is very common in small or inconspicuous
life forms (i.e. ref. 8, 16 and 22).
To actually gain new insights from species lists, it is often
necessary to investigate physiological properties of species.
The most direct avenue is the experimental approach. Notably,
not species, only representatives of species can be experimentally
challenged. Another possibility is to record occurrences and
conditions, under which species have been observed and draw
conclusions from many of such records (i.e. ref. 28). Genomic
(transcriptomic, proteomic, metabolomic) data can be used to
predict physiological features of species,41 though to date only
few eukaryote taxa and per taxon, often only few individuals
have been investigated. In addition, in many cases there is only
circumstantial evidence, i.e. based on similarity. Most experi-
mental and observation data reside in a disparate literature.
a Bioinformatics Group, CBS-KNAW Fungal Biodiversity Centre,Utrecht, The Netherlands. E-mail: [email protected]
b Collection Group, CBS-KNAW Fungal Biodiversity Centre,Utrecht, The Netherlands
w Published as part of an iBiology themed issue entitled ‘‘Computa-tional Integrative Biology’’ Guest Editor: Prof. Jan Baumbach.z Electronic supplementary information (ESI) available. See DOI:10.1039/c2ib00146b
Insight, innovation, integration
This paper describes the results of research where the
association of molecular and a large amount of physiological
data has been analyzed (integration) in order to evaluate a
new and advanced algorithm to cluster very large amounts of
data (innovation). The latter algorithm has been included in
new software capable of managing any biological data
(innovation). This software and its capacity to manage,
cluster and classify data (insight) properly have been studied.
Integrative Biology Dynamic Article Links
www.rsc.org/ibiology PAPER
Dow
nloa
ded
by Y
ale
Uni
vers
ity L
ibra
ry o
n 06
Mar
ch 2
012
Publ
ishe
d on
17
Febr
uary
201
2 on
http
://pu
bs.r
sc.o
rg |
doi:1
0.10
39/C
2IB
0014
6BView Online / Journal Homepage
Integr. Biol. This journal is c The Royal Society of Chemistry 2012
Whatever the source of information, a lot of human input is
needed to draw conclusions about particular traits of species.
Keeping track of which taxonomic concept was applied at a
given time is impossible if no vouchers are mentioned (which is
the case for many studies).
In the CBS fungal collection we have an almost unique
situation in that many of the requirements necessary for
linking species with physiological and other properties are
already in place. Moreover, the data are easily accessible. The
CBS-KNAW fungal collection is a culture collection of fungal
strains. The organisms remain available for testing physiological
traits. A BioloMICS-based34 collection database containing
many kinds of metadata is in operation and publicly accessible
(http://www.cbs.knaw.nl/collections). Being the main source of
information on the collection, the database is continuously
curated and will keep being curated. The CBS DNA-Barcoding
project is aiming at generating barcode data for all strains
included in the collection (currently ca. 80 k). Another project,
the Fungal Growth Database,12 is assembling further ecologically
relevant data, using the same database system.
Fungi, the test case group of this paper, are also a group of
organisms in which taxonomy and identification practice has
been drastically altered through the availability of PCR and
sequence based methods.2,4,20,36 Only a fraction (ca. 74 K) of
the estimated 1.5 million fungal species is formally described.18
Molecular data have revealed numerous undescribed taxa
contained in described taxa, many of which are currently
considered as so-called cryptic taxa. On the other hand, hitherto
distinguished taxa have been shown to be the same. While the
latter case is less problematic, the discovery of new taxa poses a
huge challenge for taxonomy and the management of species
metadata.
The nuclear ribosomal genes are the DNA region(s) commonly
used for fungal identification.2 The ITS (internal transcribed
spacer) is most often applied. It is likely to become the designated
fungal barcode region.35 Currently, ITS data for about 1.5% of the
estimated total of fungal species have been published.28 Taxonomic
progress and the usual sources of error like mix-ups and
misidentification have led to a situation in which an estimated
20% of the ITS data published for fungi is wrongly labelled.29
Curated databases containing reference sequence data are
disparate and exist only for very limited groups of fungi.2
With the CBS DNA barcoding project we ultimately aim to
publish a sizable reference data set of ITS and LSU (large
subunit of the nuclear ribosomal genes) that is taxonomically
validated. The curators of the CBS collection database of about
80 000 strains are constantly working on keeping identifications
up to date. However, a large proportion of the strains have been
identified last at the time of their accession (the oldest strains
have been deposited in 1907) with the methods that were then
the state of the art. Our expectation is that we will find, even
among the identified strains, a considerable portion of potentially
undescribed diversity (see also ref. 6). This implies that all data
produced must be validated, and, if initially there is no suitable
reference data available, possibly re-validated at regular intervals.
In this paper, we describe two tools that were added to the
BioloMICS software34 to facilitate the DNA barcoding process.
Faced with the logistics of the CBS Barcoding project, the
LIMS software module has been created for generating and
managing sequence data. The DNA barcoding workflow is princi-
pally the same for all kinds of Sanger sequencing projects in which
a small set of loci is amplified for a large set of DNA extracts.
The second tool described in this paper is a very versatile
clusteringmechanism for sequence data, that automatically assigns
names to groups of sequences. Many applications are possible
with this module. It could be used as an identification tool to
assign taxon names from a reference data set to unidentified
sequences. Likewise, it could be used for species discovery, if a
reference set with data for all relevant reference data of known
relatives are available. Within the barcoding project of CBS the
foremost function of this tool will be taxonomic validation:
validation of sequence data, but also validation of the taxonomic
assignment of strains in the collection. Moreover, the similarity of
the strains (read: individuals) comprised in the same clusters can be
calculated for other properties recorded in the database, including
physiological traits.
2 LIMS software description
The DNA barcoding lab workflow is as follows: DNA is
extracted from 94 biological samples in the 96 well format
(leaving room for controls in the PCR reactions). As a
standard, two PCR reactions for two different loci (ITS and
LSU) are carried out for each plate of extracts. Positive PCR
products are assembled in 96 well plates for bidirectional
Sanger sequencing.13 In the LIMS workflow, lists of biological
samples to be extracted, in this case strains of fungi from the CBS
collection, are imported manually into the system as tabulated
text files. Details of methods, primers, cycler programmes, etc.
are entered into the system and linked with the microplates,
extracts, PCR and cycle sequencing samples as appropriate
during their passage through the LIMS. Lists of trace-file names
are exported from the LIMS, which later facilitate automated
import of trace-files into the system. During trace-file import,
contigs of forward and reverse files are automatically assembled
and saved in the system, either in existing or newly created
sequence records, which are again automatically linked with all
appropriate records in other tables. Quality values for traces
and contigs are computed and saved. The system recognizes
primer names and can thus create different links for different loci
if the system has been set up in this way. Technical (sequence
editing) and taxonomic (BLAST) validations are carried out
manually within the system. Automated sequence validation
is also implemented (see Fig. 1).
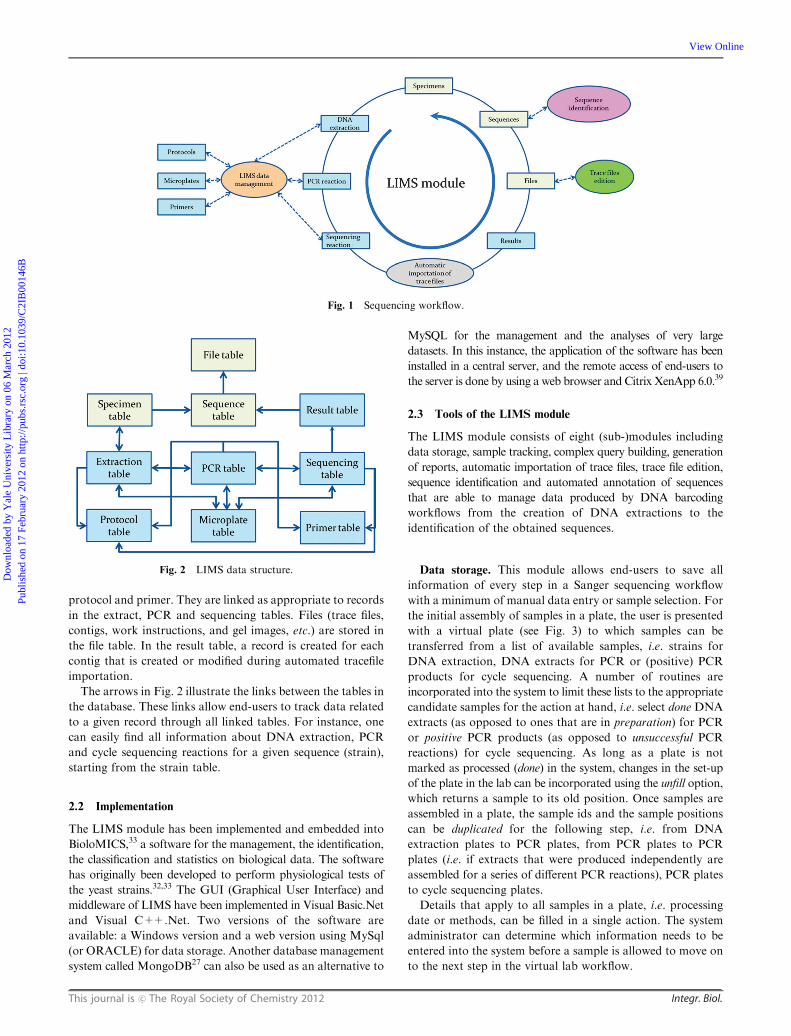
2.1 Data structure
The data structure of the LIMS is designed based on ten tables
as illustrated in Fig. 2. Of these, only three, the strain/specimen,
DNA extraction and sequence tables, are user defined, while the
other seven tables are implemented as default in the system.
However, additional fields can be added to all tables as
required. In our application, the strain table is the strain table
of the fungal collection of CBS. DNA extraction, PCR and
sequencing tables contain for each extract or PCR or cycle
sequencing reaction a unique record with associated informa-
tion. Records of the microplate table are linked to all sample
records (DNA extracts, PCR or sequencing) assembled in one
plate. The protocol and primer tables contain records for each
Dow
nloa
ded
by Y
ale
Uni
vers
ity L
ibra
ry o
n 06
Mar
ch 2
012
Publ
ishe
d on
17
Febr
uary
201
2 on
http
://pu
bs.r
sc.o
rg |
doi:1
0.10
39/C
2IB
0014
6B
View Online
This journal is c The Royal Society of Chemistry 2012 Integr. Biol.
protocol and primer. They are linked as appropriate to records
in the extract, PCR and sequencing tables. Files (trace files,
contigs, work instructions, and gel images, etc.) are stored in
the file table. In the result table, a record is created for each
contig that is created or modified during automated tracefile
importation.
The arrows in Fig. 2 illustrate the links between the tables in
the database. These links allow end-users to track data related
to a given record through all linked tables. For instance, one
can easily find all information about DNA extraction, PCR
and cycle sequencing reactions for a given sequence (strain),
starting from the strain table.
2.2 Implementation
The LIMS module has been implemented and embedded into
BioloMICS,33 a software for the management, the identification,
the classification and statistics on biological data. The software
has originally been developed to perform physiological tests of
the yeast strains.32,33 The GUI (Graphical User Interface) and
middleware of LIMS have been implemented in Visual Basic.Net
and Visual C++.Net. Two versions of the software are
available: a Windows version and a web version using MySql
(or ORACLE) for data storage. Another database management
system called MongoDB27 can also be used as an alternative to
MySQL for the management and the analyses of very large
datasets. In this instance, the application of the software has been
installed in a central server, and the remote access of end-users to
the server is done by using a web browser and Citrix XenApp 6.0.39
2.3 Tools of the LIMS module
The LIMS module consists of eight (sub-)modules including
data storage, sample tracking, complex query building, generation
of reports, automatic importation of trace files, trace file edition,
sequence identification and automated annotation of sequences
that are able to manage data produced by DNA barcoding
workflows from the creation of DNA extractions to the
identification of the obtained sequences.
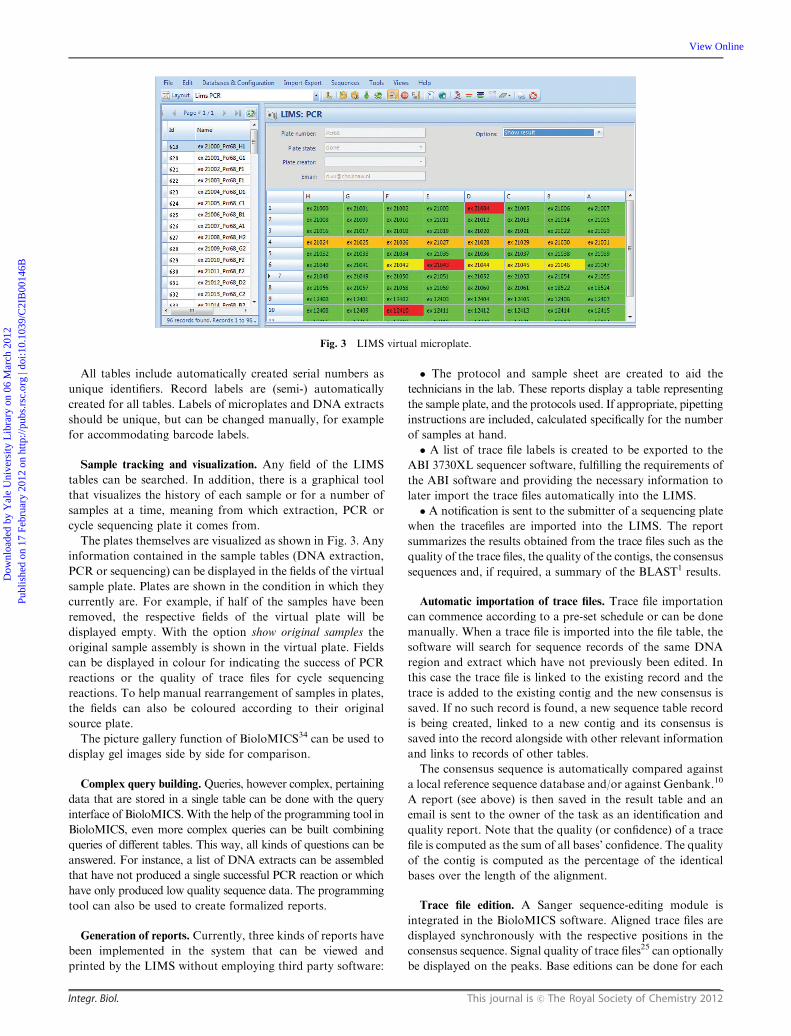
Data storage. This module allows end-users to save all
information of every step in a Sanger sequencing workflow
with a minimum of manual data entry or sample selection. For
the initial assembly of samples in a plate, the user is presented
with a virtual plate (see Fig. 3) to which samples can be
transferred from a list of available samples, i.e. strains for
DNA extraction, DNA extracts for PCR or (positive) PCR
products for cycle sequencing. A number of routines are
incorporated into the system to limit these lists to the appropriate
candidate samples for the action at hand, i.e. select done DNA
extracts (as opposed to ones that are in preparation) for PCR
or positive PCR products (as opposed to unsuccessful PCR
reactions) for cycle sequencing. As long as a plate is not
marked as processed (done) in the system, changes in the set-up
of the plate in the lab can be incorporated using the unfill option,
which returns a sample to its old position. Once samples are
assembled in a plate, the sample ids and the sample positions
can be duplicated for the following step, i.e. from DNA
extraction plates to PCR plates, from PCR plates to PCR
plates (i.e. if extracts that were produced independently are
assembled for a series of different PCR reactions), PCR plates
to cycle sequencing plates.
Details that apply to all samples in a plate, i.e. processing
date or methods, can be filled in a single action. The system
administrator can determine which information needs to be
entered into the system before a sample is allowed to move on
to the next step in the virtual lab workflow.
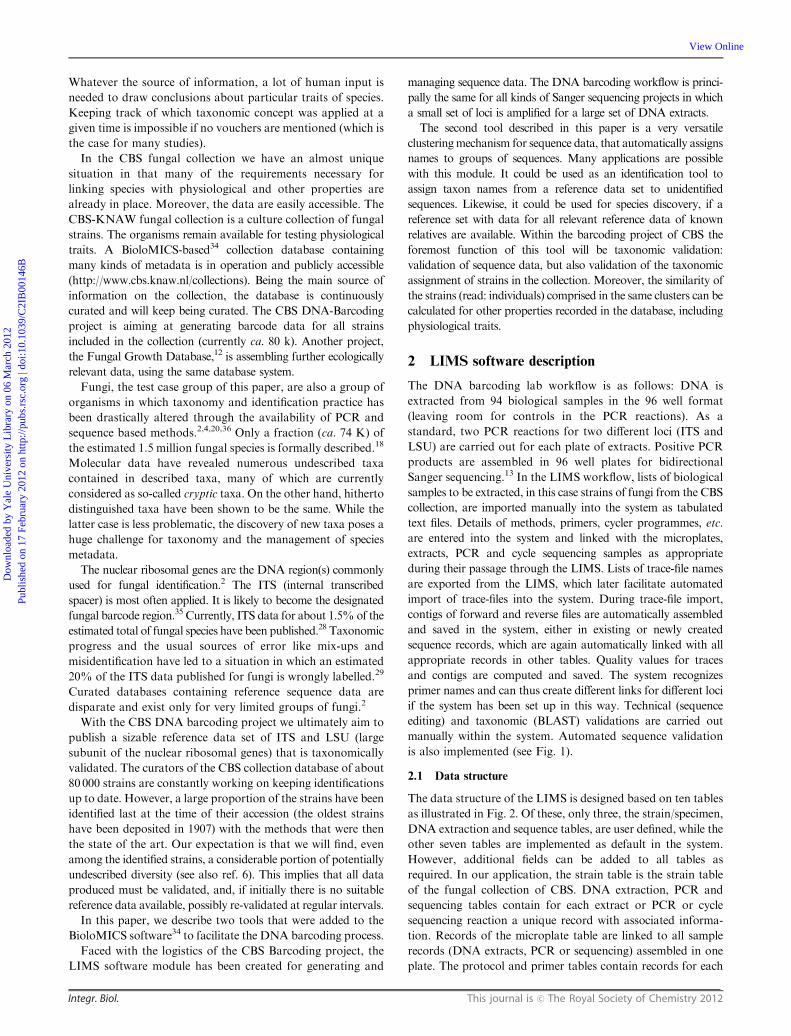
Fig. 1 Sequencing workflow.
Fig. 2 LIMS data structure.
Dow
nloa
ded
by Y
ale
Uni
vers
ity L
ibra
ry o
n 06
Mar
ch 2
012
Publ
ishe
d on
17
Febr
uary
201
2 on
http
://pu
bs.r
sc.o
rg |
doi:1
0.10
39/C
2IB
0014
6B
View Online
Integr. Biol. This journal is c The Royal Society of Chemistry 2012
All tables include automatically created serial numbers as
unique identifiers. Record labels are (semi-) automatically
created for all tables. Labels of microplates and DNA extracts
should be unique, but can be changed manually, for example
for accommodating barcode labels.
Sample tracking and visualization. Any field of the LIMS
tables can be searched. In addition, there is a graphical tool
that visualizes the history of each sample or for a number of
samples at a time, meaning from which extraction, PCR or
cycle sequencing plate it comes from.
The plates themselves are visualized as shown in Fig. 3. Any
information contained in the sample tables (DNA extraction,
PCR or sequencing) can be displayed in the fields of the virtual
sample plate. Plates are shown in the condition in which they
currently are. For example, if half of the samples have been
removed, the respective fields of the virtual plate will be
displayed empty. With the option show original samples the
original sample assembly is shown in the virtual plate. Fields
can be displayed in colour for indicating the success of PCR
reactions or the quality of trace files for cycle sequencing
reactions. To help manual rearrangement of samples in plates,
the fields can also be coloured according to their original
source plate.
The picture gallery function of BioloMICS34 can be used to
display gel images side by side for comparison.
Complex query building. Queries, however complex, pertaining
data that are stored in a single table can be done with the query
interface of BioloMICS.With the help of the programming tool in
BioloMICS, even more complex queries can be built combining
queries of different tables. This way, all kinds of questions can be
answered. For instance, a list of DNA extracts can be assembled
that have not produced a single successful PCR reaction or which
have only produced low quality sequence data. The programming
tool can also be used to create formalized reports.
Generation of reports. Currently, three kinds of reports have
been implemented in the system that can be viewed and
printed by the LIMS without employing third party software:
� The protocol and sample sheet are created to aid the
technicians in the lab. These reports display a table representing
the sample plate, and the protocols used. If appropriate, pipetting
instructions are included, calculated specifically for the number
of samples at hand.
� A list of trace file labels is created to be exported to the
ABI 3730XL sequencer software, fulfilling the requirements of
the ABI software and providing the necessary information to
later import the trace files automatically into the LIMS.
� A notification is sent to the submitter of a sequencing plate
when the tracefiles are imported into the LIMS. The report
summarizes the results obtained from the trace files such as the
quality of the trace files, the quality of the contigs, the consensus
sequences and, if required, a summary of the BLAST1 results.
Automatic importation of trace files. Trace file importation
can commence according to a pre-set schedule or can be done
manually. When a trace file is imported into the file table, the
software will search for sequence records of the same DNA
region and extract which have not previously been edited. In
this case the trace file is linked to the existing record and the
trace is added to the existing contig and the new consensus is
saved. If no such record is found, a new sequence table record
is being created, linked to a new contig and its consensus is
saved into the record alongside with other relevant information
and links to records of other tables.
The consensus sequence is automatically compared against
a local reference sequence database and/or against Genbank.10
A report (see above) is then saved in the result table and an
email is sent to the owner of the task as an identification and
quality report. Note that the quality (or confidence) of a trace
file is computed as the sum of all bases’ confidence. The quality
of the contig is computed as the percentage of the identical
bases over the length of the alignment.
Trace file edition. A Sanger sequence-editing module is
integrated in the BioloMICS software. Aligned trace files are
displayed synchronously with the respective positions in the
consensus sequence. Signal quality of trace files25 can optionally
be displayed on the peaks. Base editions can be done for each
Fig. 3 LIMS virtual microplate.
Dow
nloa
ded
by Y
ale
Uni
vers
ity L
ibra
ry o
n 06
Mar
ch 2
012
Publ
ishe
d on
17
Febr
uary
201
2 on
http
://pu
bs.r
sc.o
rg |
doi:1
0.10
39/C
2IB
0014
6B
View Online
This journal is c The Royal Society of Chemistry 2012 Integr. Biol.
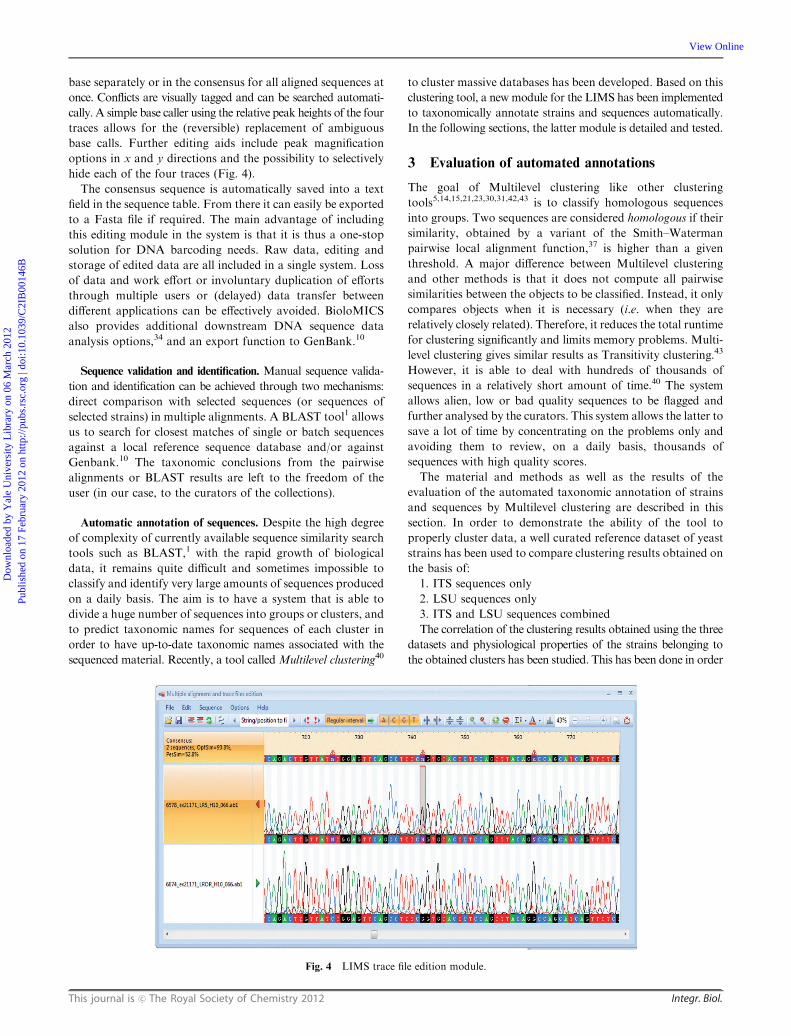
base separately or in the consensus for all aligned sequences at
once. Conflicts are visually tagged and can be searched automati-
cally. A simple base caller using the relative peak heights of the four
traces allows for the (reversible) replacement of ambiguous
base calls. Further editing aids include peak magnification
options in x and y directions and the possibility to selectively
hide each of the four traces (Fig. 4).
The consensus sequence is automatically saved into a text
field in the sequence table. From there it can easily be exported
to a Fasta file if required. The main advantage of including
this editing module in the system is that it is thus a one-stop
solution for DNA barcoding needs. Raw data, editing and
storage of edited data are all included in a single system. Loss
of data and work effort or involuntary duplication of efforts
through multiple users or (delayed) data transfer between
different applications can be effectively avoided. BioloMICS
also provides additional downstream DNA sequence data
analysis options,34 and an export function to GenBank.10
Sequence validation and identification. Manual sequence valida-
tion and identification can be achieved through two mechanisms:
direct comparison with selected sequences (or sequences of
selected strains) in multiple alignments. A BLAST tool1 allows
us to search for closest matches of single or batch sequences
against a local reference sequence database and/or against
Genbank.10 The taxonomic conclusions from the pairwise
alignments or BLAST results are left to the freedom of the
user (in our case, to the curators of the collections).
Automatic annotation of sequences. Despite the high degree
of complexity of currently available sequence similarity search
tools such as BLAST,1 with the rapid growth of biological
data, it remains quite difficult and sometimes impossible to
classify and identify very large amounts of sequences produced
on a daily basis. The aim is to have a system that is able to
divide a huge number of sequences into groups or clusters, and
to predict taxonomic names for sequences of each cluster in
order to have up-to-date taxonomic names associated with the
sequenced material. Recently, a tool calledMultilevel clustering40
to cluster massive databases has been developed. Based on this
clustering tool, a newmodule for the LIMS has been implemented
to taxonomically annotate strains and sequences automatically.
In the following sections, the latter module is detailed and tested.
3 Evaluation of automated annotations
The goal of Multilevel clustering like other clustering
tools5,14,15,21,23,30,31,42,43 is to classify homologous sequences
into groups. Two sequences are considered homologous if their
similarity, obtained by a variant of the Smith–Waterman
pairwise local alignment function,37 is higher than a given
threshold. A major difference between Multilevel clustering
and other methods is that it does not compute all pairwise
similarities between the objects to be classified. Instead, it only
compares objects when it is necessary (i.e. when they are
relatively closely related). Therefore, it reduces the total runtime
for clustering significantly and limits memory problems. Multi-
level clustering gives similar results as Transitivity clustering.43
However, it is able to deal with hundreds of thousands of
sequences in a relatively short amount of time.40 The system
allows alien, low or bad quality sequences to be flagged and
further analysed by the curators. This system allows the latter to
save a lot of time by concentrating on the problems only and
avoiding them to review, on a daily basis, thousands of
sequences with high quality scores.
The material and methods as well as the results of the
evaluation of the automated taxonomic annotation of strains
and sequences by Multilevel clustering are described in this
section. In order to demonstrate the ability of the tool to
properly cluster data, a well curated reference dataset of yeast
strains has been used to compare clustering results obtained on
the basis of:
1. ITS sequences only
2. LSU sequences only
3. ITS and LSU sequences combined
The correlation of the clustering results obtained using the three
datasets and physiological properties of the strains belonging to
the obtained clusters has been studied. This has been done in order
Fig. 4 LIMS trace file edition module.
Dow
nloa
ded
by Y
ale
Uni
vers
ity L
ibra
ry o
n 06
Mar
ch 2
012
Publ
ishe
d on
17
Febr
uary
201
2 on
http
://pu
bs.r
sc.o
rg |
doi:1
0.10
39/C
2IB
0014
6B
View Online
Integr. Biol. This journal is c The Royal Society of Chemistry 2012
to evaluate the ability of Multilevel clustering to produce
homogeneous groupings.
3.1 Material and methods
Predicting an optimal threshold to cluster sequences of a given
locus. To place sequences in the right taxonomic groups and
automatically annotate them, an optimal similarity threshold
(OST) has to be established. This threshold allows placing all
sequences of the same species into the same cluster and sequences
representing other species are excluded. In order to achieve this
goal, for each kind of sequences, a gold standard dataset has
been created and contains sequences checked and validated by
experts. This dataset is then clustered with different thresholds.
The OST is the one that gives the best quality for clustering
which is computed by the F-measure function proposed by
Paccanaro et al. [ref. 30; see below as well]. Sequences from
different loci can have different OSTs.
Quality of clustering. In order to evaluate the quality of
clustering, the result of clustering needs to be compared
against some gold standard dataset. This dataset consists of
pre-clustered sequences containing well-known and curated
information, created, updated and checked by experts. To do
this, the F-measure function proposed by Paccanaro et al.30
has been used and is described below.
Let us consider a set V of sequences. Let C= (C1, . . ., Cl) be
the gold standard partition of V, and K = (K1, . . ., Km) the
partition obtained by clustering objects of V. The F-measure
function F(K, C) is defined as follows:
FðK,CÞ ¼ 1
n
Xlj¼1
n j �max1�i�m2n j
i
ni þ n j
!
where n is the number of sequences in V, ni is the number of
sequences inKi, nj is the number of sequences inCj, and n j
i is the
number of sequences in Ki - Cj for 1 r i r m and 1 r j r l.
The value of F(K,C) is between 0 and 1. Clustering results are
considered as very good when they are very similar to the gold
standard dataset, i.e. the F-measure is equal to 1, and very bad
when the F-measure is equal to 0. The more reliable the gold
standard dataset is the better evaluation of clustering will be.
Annotation of strains using only one locus. Having predicted
an OST for a set of sequences of a given locus, all the
sequences of the ITS and LSU datasets are then clustered
with their respective OSTs. Based on the obtained groups, one
can already attribute taxon names to the sequences. All
sequences of a given cluster have the same taxon name which
is the most common or frequent name amongst the sequences
of the cluster. Since sequences of the same strain must have the
same taxon name, a more accurate prediction method is
proposed to attribute taxon names to the sequences as follows.
First of all, it is to ensure that sequences from different
clusters cannot be given the same taxonomic name. If a
sequence belonging to a cluster has a taxonomic name that
appears in another cluster, this name is appended with the
index of the cluster in order to distinguish it from the previous
name. A candidate taxonomic name (CTN) of a cluster is a
given taxonomic name of one of the sequences of the cluster.
The quality of a candidate taxonomic name of a cluster is the
percentage of the sequences having this name in the cluster.
However, if this candidate taxonomic name is given to a
validated sequence of the cluster that is linked to a type strain,
its quality is set to 1.
We define a CTN and its quality for a given strain as
follows. Every CTN of a sequence of a strain is also a CTN
of the strain. LetT be a CTN of a strain s, andQ the quality of T.
Let n be the number of sequences of s having the CTN T, and N
the number of all sequences of s. The quality of T with respect
to s is given by q ¼ n�QN
. The taxonomic name attributed to s is
then the CTN of s with the highest quality value. All sequences
of s are also annotated with this taxonomic name.
Annotation of strains using several loci. In ref. 35, there is an
agreement that there should be only one DNA barcode locus
for fungi which is the ITS. Although the use of ITS as an
official fungal barcode represents a solution that will satisfy
many fungal groups, it does not resolve them all.36 In addition,
the aim of this study is to develop a system that can be applied
not only to fungi but to other organisms as well, where a
second or even more barcoding markers will be necessary for
precise species identification. Therefore, in LIMS an algorithm
that combines different loci to annotate strains and sequences
has been implemented. This algorithm can predict the taxonomic
name of strains as well as its quality for each loci. The final
taxonomic name of a strain is the one that has the highest
quality produced by one of the loci. Experiments show that
this combination gives better annotations than the single locus
approach (see results below).
Comparisons of gold standard datasets. The gold standard
datasets used comprise yeast strains from the CBS collection
(see Table S3 in ESIz) for which DNA sequences of both the
ITS and/or LSU loci are available, and that have been
validated by the curators of the CBS collection9 on the basis
of their morphological, sexual, physiological and molecular
properties. The ITS dataset then consists of 1907 sequences
from 653 strains, while the LSU dataset consists of 1999
sequences from 683 strains. For both datasets, strains are
belonging to 344 different species.
Comparisons of physiological properties. Eighty-eight physio-
logical characteristics (2-keto-D-gluconate, 5-keto-D-gluconate,
a,a-trehalose, acetic acid 1%, arbutin, butane 2,3-diol, cadaverine,
cellobiose, citrate, creatine, creatinine, cycloheximide 0.01%,
cycloheximide 0.1%, D-arabinose, D-galactonate, D-galactose,
D-galacturonate, D-glucarate, D-glucitol, D-gluconate, D-glucono-
1,5-lactone, D-glucosamine, D-glucose, D-glucuronate, DL-lactate,
D-mannitol, D-proline, D-ribose, D-tartaric acid, D-tryptophan,
D-xylose, erythritol, ethylamine, ethylene glycol, fluconazole,
galactaric acid, galactitol, gentobiose, glucosamine, glycerol,
growth at pH= 3, growth at pH= 9.5, growth on 10%NaCl,
growth on 16%NaCl, growth w/o biotin, growth w/o biotin &
thiamin, growth w/o myo-inositol, growth w/o niacin, growth
w/o PABA, growth w/o pantothenate, growth w/o pyridoxine,
growth w/o pyridoxine & thiamin, growth w/o thiamin,
growth w/o vitamins, imidazole, inulin, lactose, L-arabinitol,
L-arabinose, levulinate, L-lysine, L-malic acid, L-rhamnose,
L-sorbose, L-tartaric acid, maltose, Me a-D-glucoside, melezitose,
melibiose, meso-tartaric acid, myo-inositol, nitrate, nitrite,
Dow
nloa
ded
by Y
ale
Uni
vers
ity L
ibra
ry o
n 06
Mar
ch 2
012
Publ
ishe
d on
17
Febr
uary
201
2 on
http
://pu
bs.r
sc.o
rg |
doi:1
0.10
39/C
2IB
0014
6B
View Online
This journal is c The Royal Society of Chemistry 2012 Integr. Biol.
palatinose, propane 1,2 diol, putrescine, quinic acid, raffinose,
ribitol, salicin, starch, succinate, sucrose, Tween 40, Tween 60,
Tween 80, uric acid, xylitol) have been used to compare the set
of strains used in both ITS and LSU datasets listed in Table 2.
All physiological characteristics of the strains studied are
available from the CBS database (http://www.cbs.knaw.nl/
collections). The results of physiological observations can be
represented by four possible states (Table 1).
To measure a physiological similarity between two strains, the
method introduced by Robert et al.32 has been used. All strains
have been compared to each other’s using all available physio-
logical characteristics. The global physiological similarity
between two strains is the average of the obtained similarities
for each of the physiological tests available for the two strains.
The physiological similarity of an individual to its cluster is
the average physiological similarity with all the members of
the cluster to which it belongs. The physiological similarity of
a cluster is represented by the minimum physiological similarity
of its members.
3.2 Results and discussion
In this section, the results obtained from the automatic
annotation method on the two gold standard datasets (ITS
and LSU) are explained. The correspondence between physio-
logical and molecular (ITS and LSU) data is discussed.
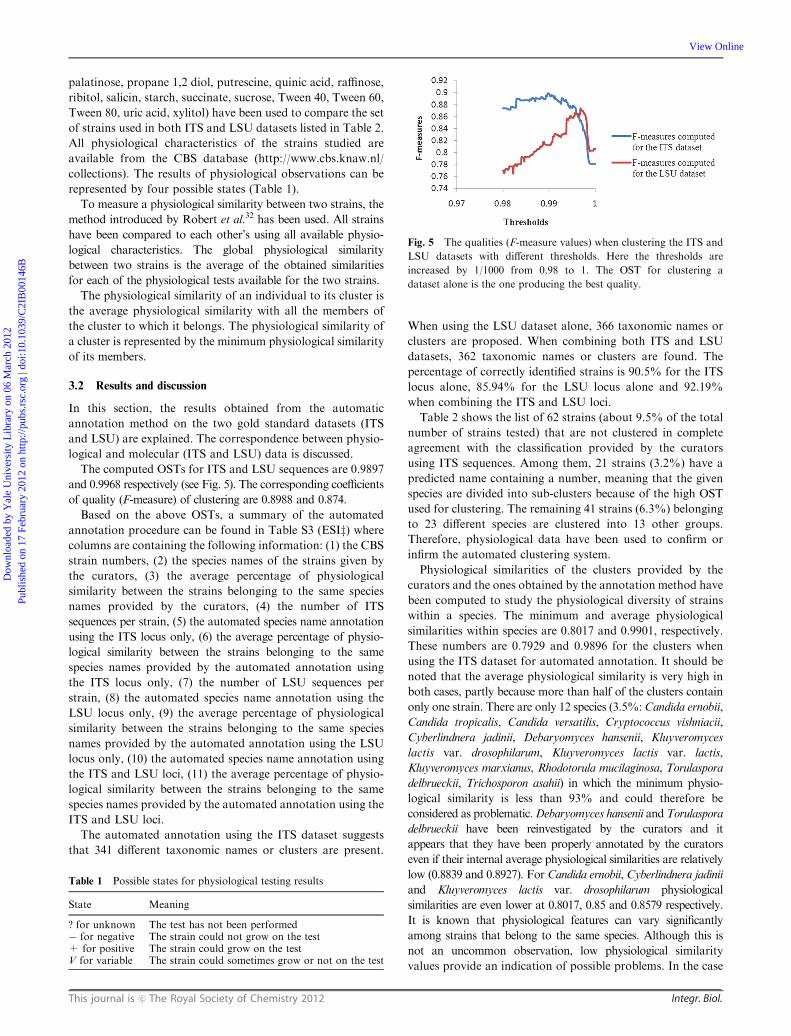
The computed OSTs for ITS and LSU sequences are 0.9897
and 0.9968 respectively (see Fig. 5). The corresponding coefficients
of quality (F-measure) of clustering are 0.8988 and 0.874.
Based on the above OSTs, a summary of the automated
annotation procedure can be found in Table S3 (ESIz) wherecolumns are containing the following information: (1) the CBS
strain numbers, (2) the species names of the strains given by
the curators, (3) the average percentage of physiological
similarity between the strains belonging to the same species
names provided by the curators, (4) the number of ITS
sequences per strain, (5) the automated species name annotation
using the ITS locus only, (6) the average percentage of physio-
logical similarity between the strains belonging to the same
species names provided by the automated annotation using
the ITS locus only, (7) the number of LSU sequences per
strain, (8) the automated species name annotation using the
LSU locus only, (9) the average percentage of physiological
similarity between the strains belonging to the same species
names provided by the automated annotation using the LSU
locus only, (10) the automated species name annotation using
the ITS and LSU loci, (11) the average percentage of physio-
logical similarity between the strains belonging to the same
species names provided by the automated annotation using the
ITS and LSU loci.
The automated annotation using the ITS dataset suggests
that 341 different taxonomic names or clusters are present.
When using the LSU dataset alone, 366 taxonomic names or
clusters are proposed. When combining both ITS and LSU
datasets, 362 taxonomic names or clusters are found. The
percentage of correctly identified strains is 90.5% for the ITS
locus alone, 85.94% for the LSU locus alone and 92.19%
when combining the ITS and LSU loci.
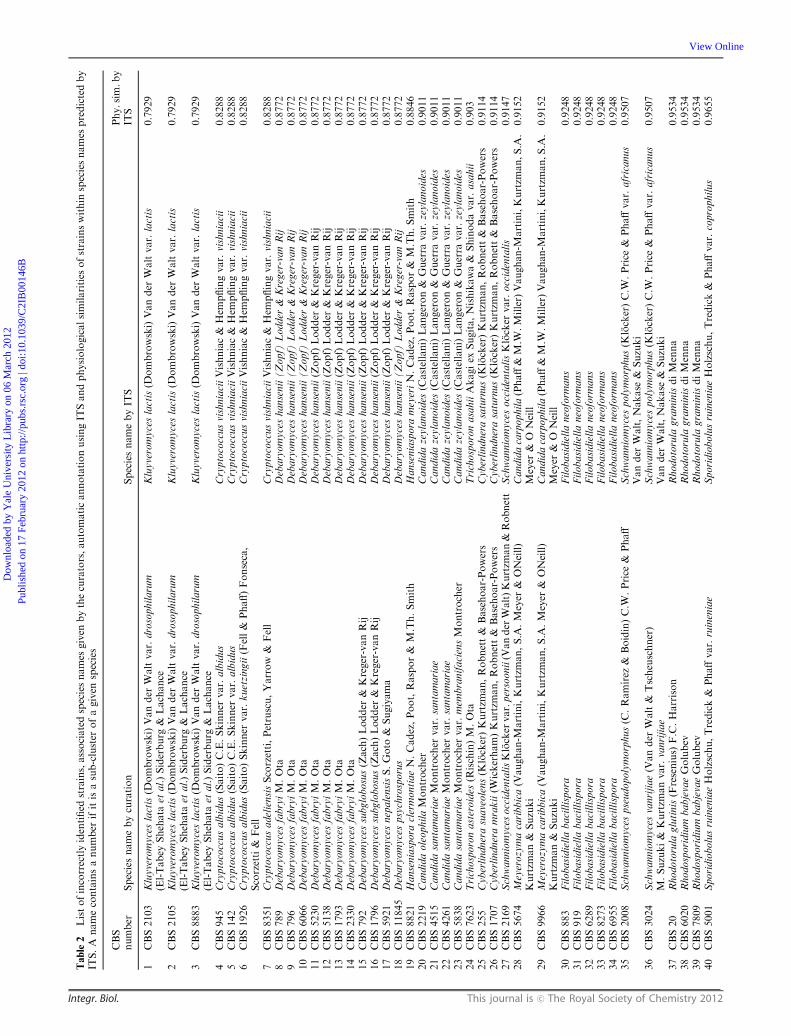
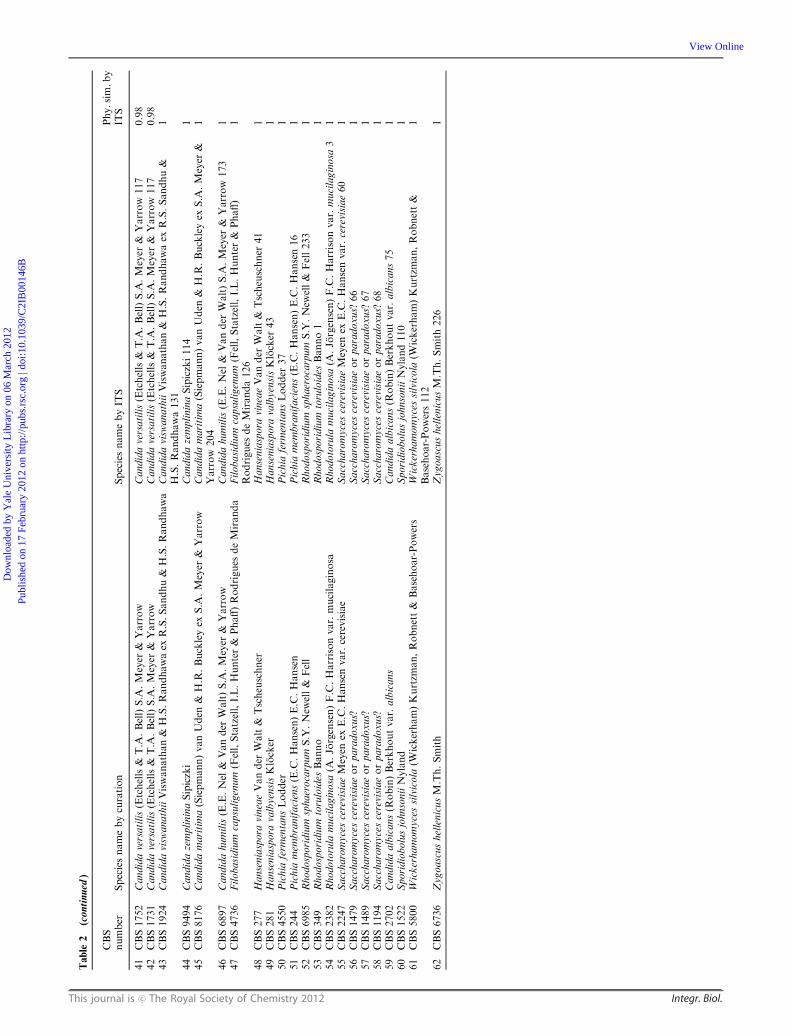
Table 2 shows the list of 62 strains (about 9.5% of the total
number of strains tested) that are not clustered in complete
agreement with the classification provided by the curators
using ITS sequences. Among them, 21 strains (3.2%) have a
predicted name containing a number, meaning that the given
species are divided into sub-clusters because of the high OST
used for clustering. The remaining 41 strains (6.3%) belonging
to 23 different species are clustered into 13 other groups.
Therefore, physiological data have been used to confirm or
infirm the automated clustering system.
Physiological similarities of the clusters provided by the
curators and the ones obtained by the annotation method have
been computed to study the physiological diversity of strains
within a species. The minimum and average physiological
similarities within species are 0.8017 and 0.9901, respectively.
These numbers are 0.7929 and 0.9896 for the clusters when
using the ITS dataset for automated annotation. It should be
noted that the average physiological similarity is very high in
both cases, partly because more than half of the clusters contain
only one strain. There are only 12 species (3.5%:Candida ernobii,
Candida tropicalis, Candida versatilis, Cryptococcus vishniacii,
Cyberlindnera jadinii, Debaryomyces hansenii, Kluyveromyces
lactis var. drosophilarum, Kluyveromyces lactis var. lactis,
Kluyveromyces marxianus, Rhodotorula mucilaginosa, Torulaspora
delbrueckii, Trichosporon asahii) in which the minimum physio-
logical similarity is less than 93% and could therefore be
considered as problematic.Debaryomyces hansenii and Torulaspora
delbrueckii have been reinvestigated by the curators and it
appears that they have been properly annotated by the curators
even if their internal average physiological similarities are relatively
low (0.8839 and 0.8927). For Candida ernobii, Cyberlindnera jadinii
and Kluyveromyces lactis var. drosophilarum physiological
similarities are even lower at 0.8017, 0.85 and 0.8579 respectively.
It is known that physiological features can vary significantly
among strains that belong to the same species. Although this is
not an uncommon observation, low physiological similarity
values provide an indication of possible problems. In the case
Table 1 Possible states for physiological testing results
State Meaning
? for unknown The test has not been performed� for negative The strain could not grow on the test+ for positive The strain could grow on the testV for variable The strain could sometimes grow or not on the test
Fig. 5 The qualities (F-measure values) when clustering the ITS and
LSU datasets with different thresholds. Here the thresholds are
increased by 1/1000 from 0.98 to 1. The OST for clustering a
dataset alone is the one producing the best quality.
Dow
nloa
ded
by Y
ale
Uni
vers
ity L
ibra
ry o
n 06
Mar
ch 2
012
Publ
ishe
d on
17
Febr
uary
201
2 on
http
://pu
bs.r
sc.o
rg |
doi:1
0.10
39/C
2IB
0014
6B
View Online
Integr. Biol. This journal is c The Royal Society of Chemistry 2012
Table2
Listofincorrectlyidentified
strains,associatedspeciesnames
given
bythecurators,automaticannotationusingIT
Sandphysiologicalsimilarities
ofstrainswithin
speciesnames
predictedby
ITS.A
namecontainsanumber
ifitisasub-cluster
ofagiven
species
CBS
number
Speciesnamebycuration
SpeciesnamebyIT
SPhy.sim.by
ITS
1CBS2103
Kluyveromyceslactis(D
ombrowski)Vander
Waltvar.drosophilarum
(El-Tabey
Shehata
etal.)Siderburg
&Lachance
Kluyveromyceslactis(D
ombrowski)Vander
Waltvar.lactis
0.7929
2CBS2105
Kluyveromyceslactis(D
ombrowski)Vander
Waltvar.drosophilarum
(El-Tabey
Shehata
etal.)Siderburg
&Lachance
Kluyveromyceslactis(D
ombrowski)Vander
Waltvar.lactis
0.7929
3CBS8883
Kluyveromyceslactis(D
ombrowski)Vander
Waltvar.drosophilarum
(El-Tabey
Shehata
etal.)Siderburg
&Lachance
Kluyveromyceslactis(D
ombrowski)Vander
Waltvar.lactis
0.7929
4CBS945
Cryptococcusalbidus(Saito)C.E.Skinner
var.albidus
CryptococcusvishniaciiVishniac&
Hem
pflingvar.vishniacii
0.8288
5CBS142
Cryptococcusalbidus(Saito)C.E.Skinner
var.albidus
CryptococcusvishniaciiVishniac&
Hem
pflingvar.vishniacii
0.8288
6CBS1926
Cryptococcusalbidus(Saito)Skinner
var.kuetzingii(Fell&
Phaff)Fonseca,
Scorzetti&
Fell
CryptococcusvishniaciiVishniac&
Hem
pflingvar.vishniacii
0.8288
7CBS8351
CryptococcusadeliensisScorzetti,Petruscu,Yarrow
&Fell
CryptococcusvishniaciiVishniac&
Hem
pflingvar.vishniacii
0.8288
8CBS789
DebaryomycesfabryiM.Ota
Debaryomyceshansenii(Zopf)
Lodder
&Kreger-vanRij
0.8772
9CBS796
DebaryomycesfabryiM.Ota
Debaryomyceshansenii(Zopf)
Lodder
&Kreger-vanRij
0.8772
10
CBS6066
DebaryomycesfabryiM.Ota
Debaryomyceshansenii(Zopf)
Lodder
&Kreger-vanRij
0.8772
11
CBS5230
DebaryomycesfabryiM.Ota
Debaryomyceshansenii(Zopf)Lodder
&Kreger-vanRij
0.8772
12
CBS5138
DebaryomycesfabryiM.Ota
Debaryomyceshansenii(Zopf)Lodder
&Kreger-vanRij
0.8772
13
CBS1793
DebaryomycesfabryiM.Ota
Debaryomyceshansenii(Zopf)Lodder
&Kreger-vanRij
0.8772
14
CBS2330
DebaryomycesfabryiM.Ota
Debaryomyceshansenii(Zopf)Lodder
&Kreger-vanRij
0.8772
15
CBS792
Debaryomycessubglobosus(Zach)Lodder
&Kreger-vanRij
Debaryomyceshansenii(Zopf)Lodder
&Kreger-vanRij
0.8772
16
CBS1796
Debaryomycessubglobosus(Zach)Lodder
&Kreger-vanRij
Debaryomyceshansenii(Zopf)Lodder
&Kreger-vanRij
0.8772
17
CBS5921
DebaryomycesnepalensisS.Goto
&Sugiyama
Debaryomyceshansenii(Zopf)Lodder
&Kreger-vanRij
0.8772
18
CBS11845
Debaryomycespsychrosporus
Debaryomyceshansenii(Zopf)
Lodder
&Kreger-vanRij
0.8772
19
CBS8821
Hanseniaspora
clermontiaeN.Cadez,Poot,Raspor&
M.Th.Smith
Hanseniaspora
meyeriN.Cadez,Poot,Raspor&
M.Th.Smith
0.8846
20
CBS2219
CandidaoleophilaMontrocher
Candidazeylanoides
(Castellani)Langeron&
Guerra
var.zeylanoides
0.9011
21
CBS4515
CandidasantamariaeMontrocher
var.santamariae
Candidazeylanoides
(Castellani)Langeron&
Guerra
var.zeylanoides
0.9011
22
CBS4261
CandidasantamariaeMontrocher
var.santamariae
Candidazeylanoides
(Castellani)Langeron&
Guerra
var.zeylanoides
0.9011
23
CBS5838
CandidasantamariaeMontrocher
var.mem
branifaciensMontrocher
Candidazeylanoides
(Castellani)Langeron&
Guerra
var.zeylanoides
0.9011
24
CBS7623
Trichosporonasteroides
(Rischin)M.Ota
TrichosporonasahiiAkagiex
Sugita,Nishikawa&
Shinodavar.asahii
0.903
25
CBS255
Cyberlindnerasuaveolens(K
locker)Kurtzm
an,Robnett&
Basehoar-Powers
Cyberlindnerasaturnus(K
locker)Kurtzm
an,Robnett&
Basehoar-Powers
0.9114
26
CBS1707
Cyberlindneramrakii(W
ickerham)Kurtzm
an,Robnett&
Basehoar-Powers
Cyberlindnerasaturnus(K
locker)Kurtzm
an,Robnett&
Basehoar-Powers
0.9114
27
CBS2169
SchwanniomycesoccidentalisKlocker
var.persoonii(V
ander
Walt)Kurtzm
an&Robnett
SchwanniomycesoccidentalisKlocker
var.occidentalis
0.9147
28
CBS5674
Meyerozymacaribbica(V
aughan-M
artini,Kurtzm
an,S.A
.Meyer
&ONeill)
Kurtzm
an&
Suzuki
Candidacarpophila(Phaff&
M.W
.Miller)Vaughan-M
artini,Kurtzm
an,S.A
.Meyer
&O
Neill
0.9152
29
CBS9966
Meyerozymacaribbica(V
aughan-M
artini,Kurtzm
an,S.A
.Meyer
&ONeill)
Kurtzm
an&
Suzuki
Candidacarpophila(Phaff&
M.W
.Miller)Vaughan-M
artini,Kurtzm
an,S.A
.Meyer
&O
Neill
0.9152
30
CBS883
Filobasidiellabacillispora
Filobasidiellaneoform
ans
0.9248
31
CBS919
Filobasidiellabacillispora
Filobasidiellaneoform
ans
0.9248
32
CBS6289
Filobasidiellabacillispora
Filobasidiellaneoform
ans
0.9248
33
CBS8273
Filobasidiellabacillispora
Filobasidiellaneoform
ans
0.9248
34
CBS6955
Filobasidiellabacillispora
Filobasidiellaneoform
ans
0.9248
35
CBS2008
Schwanniomycespseudopolymorphus(C
.Ramırez
&Boidin)C.W
.Price
&Phaff
Schwanniomycespolymorphus(K
locker)C.W
.Price
&Phaffvar.africanus
Vander
Walt,Nakase
&Suzuki
0.9507
36
CBS3024
Schwanniomycesvanrijiae(V
ander
Walt&
Tscheuschner)
M.Suzuki&
Kurtzm
anvar.vanrijiae
Schwanniomycespolymorphus(K
locker)C.W
.Price
&Phaffvar.africanus
Vander
Walt,Nakase
&Suzuki
0.9507
37
CBS20
Rhodotorula
glutinis(Fresenius)
F.C.Harrison
Rhodotorula
graminisdiMenna
0.9534
38
CBS6020
Rhodosporidium
babjevaeGolubev
Rhodotorula
graminisdiMenna
0.9534
39
CBS7809
Rhodosporidium
babjevaeGolubev
Rhodotorula
graminisdiMenna
0.9534
40
CBS5001
SporidiobolusruineniaeHolzschu,Tredick&
Phaffvar.ruineniae
SporidiobolusruineniaeHolzschu,Tredick&
Phaffvar.coprophilus
0.9655
Dow
nloa
ded
by Y
ale
Uni
vers
ity L
ibra
ry o
n 06
Mar
ch 2
012
Publ
ishe
d on
17
Febr
uary
201
2 on
http
://pu
bs.r
sc.o
rg |
doi:1
0.10
39/C
2IB
0014
6B
View Online
This journal is c The Royal Society of Chemistry 2012 Integr. Biol.
Table
2(continued
)
CBS
number
Speciesnamebycuration
SpeciesnamebyIT
SPhy.sim.by
ITS
41
CBS1752
Candidaversatilis(Etchells&
T.A
.Bell)S.A
.Meyer
&Yarrow
Candidaversatilis(Etchells&
T.A
.Bell)S.A
.Meyer
&Yarrow
117
0.98
42
CBS1731
Candidaversatilis(Etchells&
T.A
.Bell)S.A
.Meyer
&Yarrow
Candidaversatilis(Etchells&
T.A
.Bell)S.A
.Meyer
&Yarrow
117
0.98
43
CBS1924
Candidavisw
anathiiViswanathan&
H.S.Randhawaex
R.S.Sandhu&
H.S.Randhawa
Candidavisw
anathiiViswanathan&
H.S.Randhawaex
R.S.Sandhu&
H.S.Randhawa131
1
44
CBS9494
CandidazemplininaSipiczki
CandidazemplininaSipiczki114
145
CBS8176
Candidamaritima(Siepmann)vanUden
&H.R
.Buckleyex
S.A
.Meyer
&Yarrow
Candidamaritima(Siepmann)vanUden
&H.R
.Buckleyex
S.A
.Meyer
&Yarrow
204
1
46
CBS6897
Candidahumilis(E.E.Nel
&Vander
Walt)S.A
.Meyer
&Yarrow
Candidahumilis(E.E.Nel
&Vander
Walt)S.A
.Meyer
&Yarrow
173
147
CBS4736
Filobasidium
capsuligenum
(Fell,Statzell,I.L.Hunter&
Phaff)Rodrigues
deMiranda
Filobasidium
capsuligenum
(Fell,Statzell,I.L.Hunter&
Phaff)
Rodrigues
deMiranda126
1
48
CBS277
Hanseniaspora
vineaeVander
Walt&
Tscheuschner
Hanseniaspora
vineaeVander
Walt&
Tscheuschner
41
149
CBS281
Hanseniaspora
valbyensisKlocker
Hanseniaspora
valbyensisKlocker
43
150
CBS4550
Pichia
ferm
entansLodder
Pichia
ferm
entansLodder
37
151
CBS244
Pichia
mem
branifaciens(E.C.Hansen)E.C.Hansen
Pichia
mem
branifaciens(E.C.Hansen)E.C.Hansen16
152
CBS6985
Rhodosporidium
sphaerocarpum
S.Y
.New
ell&
Fell
Rhodosporidium
sphaerocarpum
S.Y
.New
ell&
Fell233
153
CBS349
Rhodosporidium
toruloides
Banno
Rhodosporidium
toruloides
Banno1
154
CBS2382
Rhodotorula
mucilaginosa
(A.Jorgensen)F.C.Harrisonvar.mucilaginosa
Rhodotorula
mucilaginosa
(A.Jorgensen)F.C.Harrisonvar.mucilaginosa
31
55
CBS2247
SaccharomycescerevisiaeMeyen
exE.C.Hansenvar.cerevisiae
SaccharomycescerevisiaeMeyen
exE.C.Hansenvar.cerevisiae60
156
CBS1479
Saccharomycescerevisiaeorparadoxus?
Saccharomycescerevisiaeorparadoxus?
66
157
CBS1489
Saccharomycescerevisiaeorparadoxus?
Saccharomycescerevisiaeorparadoxus?
67
158
CBS1194
Saccharomycescerevisiaeorparadoxus?
Saccharomycescerevisiaeorparadoxus?
68
159
CBS2702
Candidaalbicans(R
obin)Berkhoutvar.albicans
Candidaalbicans(R
obin)Berkhoutvar.albicans75
160
CBS1522
SporidiobolusjohnsoniiNyland
SporidiobolusjohnsoniiNyland110
161
CBS5800
Wickerhamomycessilvicola
(Wickerham)Kurtzm
an,Robnett&
Basehoar-Powers
Wickerhamomycessilvicola
(Wickerham)Kurtzm
an,Robnett&
Basehoar-Powers112
1
62
CBS6736
ZygoascushellenicusM.Th.Smith
ZygoascushellenicusM.Th.Smith226
1
Dow
nloa
ded
by Y
ale
Uni
vers
ity L
ibra
ry o
n 06
Mar
ch 2
012
Publ
ishe
d on
17
Febr
uary
201
2 on
http
://pu
bs.r
sc.o
rg |
doi:1
0.10
39/C
2IB
0014
6B
View Online
Integr. Biol. This journal is c The Royal Society of Chemistry 2012
of the three remaining ‘‘problematic’’ species further extensive
investigations based on additional molecular and sexual data
have been done and the original grouping made by the
curators has been confirmed.
After investigating the physiological similarity of species in
the ITS gold standard dataset, the physiological similarity of
clusters obtained by the annotation method is looked at to
point out incorrectly-grouped clusters. There are 16 clusters
(4.7%: Candida carpophila, Candida ernobii, Candida tropicalis,
Candida zeylanoides, Cryptococcus vishniacii, Cyberlindnera jadinii,
Cyberlindnera saturnus, Debaryomyces hansenii, Filobasidiella
neoformans, Hanseniaspora meyeri, Kluyveromyces lactis var.
lactis, Kluyveromyces marxianus, Rhodotorula mucilaginosa,
Schwanniomyces occidentalis, Torulaspora delbrueckii, Trichosporon
asahii) having physiological similarities lower than 93%. It is
interesting to see that among them, five clusters (Candida ernobii,
Candida tropicalis, Cyberlindnera jadinii, Kluyveromyces marxianus
and Torulaspora delbrueckii) with intra-specific physiological
similarities of 0.8017, 0.9216, 0.85, 0.9149 and 0.8927 (respectively)
are the same as five of the species of the gold standard dataset. In
other words, they are clustered in complete agreement with the
classification provided by the curators. The cluster with the
predicted taxon name Rhodotorula mucilaginosa with an intra-
specific physiological similarity of 0.9145 is a sub-cluster of the
given species because of the high OST used for clustering. The
10 remaining clusters (Candida carpophila, Candida zeylanoides,
Cryptococcus vishniacii, Cyberlindnera saturnus, Debaryomyces
hansenii, Filobasidiella neoformans, Hanseniaspora meyeri,
Kluyveromyces lactis var. lactis, Schwanniomyces occidentalis,
Trichosporon asahii) have a problem of different species sharing
the same ITS sequences. As an example, the cluster with
predicted taxon name Debaryomyces hansenii contains strains
of five different species: Debaryomyces hansenii, Debaryomyces
fabryi M. Ota, Debaryomyces subglobosus (Zach) Lodder &
Kreger-van Rij, Debaryomyces nepalensis S. Goto & Sugiyama,
and Debaryomyces psychrosporus. These species contain highly
similar ITS sequences, and therefore cannot be distinguished by
ITS sequences but can be distinguished by other methods such
as RAPD-PCR analysis, PCR-RFLP or PCR finger printing.24
It is noted that the ten clusters above are the clusters predicted
by ITS containing incorrectly identified strains in Table 2.
The Schwanniomyces polymorphus, Rhodotorula graminis and
Sporidiobolus ruineniae var. coprophilus clusters left from
Table 2 with physiological similarities of 0.9507, 0.9534 and
0.9655 also face the same problem. To solve the problem of
different species sharing the same ITS sequences, one or more
markers or loci would be needed in order to obtain correct
species identification. It also shows that ITS locus is not
discriminative enough in some taxonomic groups.
The next experiment is the annotation of strains and
sequences of the LSU dataset in the same way as for the ITS
dataset. The optimal threshold predicted for this dataset
for sequence clustering is 0.9968 with a quality of 0.874.
The percentage of correctly identified strains in this case is
85.94%. Again, the physiological similarity in a cluster of the
LSU dataset and the dataset obtained by clustering is
very high. Very similar clustering or grouping results to the
ITS dataset have been obtained using the LSU dataset alone
(see Table S3 in ESIz).
When combining the ITS and LSU loci, the percentage of
correctly identified strains rises to 92.19%, indicating that the
quality of the identification process improves whenmore markers
are used. Using both loci, only seven ‘‘problematic’’ clusters
remain (Kluyveromyces lactis var. lactis, Debaryomyces hansenii,
Cyberlindnera saturnus, Candida carpophila, Schwanniomyces
occidentalis, Rhodotorula graminis and Candida zeylanoides) with
low intra-specific physiological similarities (0.7929, 0.8836,
0.9114, 0.9146, 0.9147, 0.9492 and 0.9692).
In conclusion for this section, biologists often identify species
to predict their physiological features. With our experiments,
we can see a strong correspondence between molecular species
identification and their physiological features. Therefore,
physiological properties of strains belonging to a given taxonomic
group can somehow be predicted on the basis of molecular
identification. On the other hand, physiological properties together
with molecular markers can be used to detect wrongly identified
strains. It must be noted that although representatives of the same
species are physiologically quite similar as can be seen from the
data obtained by this study, in this case the identification of species
based on only physiological feature is not reliable, since many
different species can share the same physiological features. In
addition, there are also species for which strains can vary
significantly in their physiological features as can be seen in
some of the clades obtained in the analyses done during
this study.
One can also use Transitivity clustering43 to cluster sequences
of the two ITS and LSU datasets. The optimal thresholds
predicted for them are 0.9826 and 0.9901 with the F-measures
of 0.8945 and 0.8959. The percentages of correctly identified
strains based on the two datasets alone using Transitivity
clustering are 87.44% and 86.53%, and 91.42% when combining
them. So, Transitivity clustering and Multilevel clustering are
both performing well on small datasets. However, on large
sequence datasets (i.e. 4500000) Transitivity clustering can
hardly be used while Multilevel clustering is scaling well.40
It also has to be taken into account that the markers have to
be of good quality and that the signal they give should be
meaningful in the identification process.
4 Conclusion and future work
The described LIMS has been used by the barcoding group of
the CBS-KNAW Fungal Biodiversity Centre since January
2011 (for about 9 months). During this period of time, more
than 11 k DNA extractions, more than 29 k PCR reactions
and almost 42 k cycle sequencing reactions have been carried out.
More than 17 k sequences have been edited within the system.
Owing to other changes implemented around the same period in
the lab work, the effect of the LIMS on the productivity cannot
be easily determined. The LIMS has improved the quality of the
obtained data by avoiding many errors or making the remaining
ones traceable. Within the CBS project, the system does not
require any typing of sample ids; therefore, the risk of confusing
sample ids in the electronic system is minimized. The LIMS
makes the task of lab managers more efficient. The latter can
easily monitor progress, success rates of protocols, decide about
(redo) strategies, and track the fate of individual samples. In terms
of work organisation, one of the greatest advantages of the
Dow
nloa
ded
by Y
ale
Uni
vers
ity L
ibra
ry o
n 06
Mar
ch 2
012
Publ
ishe
d on
17
Febr
uary
201
2 on
http
://pu
bs.r
sc.o
rg |
doi:1
0.10
39/C
2IB
0014
6B
View Online
This journal is c The Royal Society of Chemistry 2012 Integr. Biol.
systems is that generally all data are available and accessible
through the same interface, which allows the division of labour
by process (and not by sample). This signifies a major step
from cottage style to industry style production.
The LIMS has been created for the particular purpose of
DNA barcode data production, based on the needs of the
CBS-KNAW Barcoding project. One of the leading principles
has been to implement procedures that are commonly used in
DNA Sanger sequencing projects in the code and to use
the afore named BioloMICS programming tool for creating
routines that are more specific, i.e. for scripts that manage
the communication with automated lab equipment. Regular
progress reports can be created through scripts as well as
the generation of lists of samples destined to enter specific
workflows. Automated validation is implemented in the
barcoding process.
All possible applications of the automated clustering and
naming procedure have not yet been explored. Within the
DNA barcoding project we experience that, after implementation
of the LIMS and 96-well based methods, sequence validation is
the most severe bottleneck, without even venturing yet to the
necessary task of repeated validation as more (validated) data
accumulate. The current lack of validated data is generally
perceived as a setback for fungal research and its applica-
tions.2,3,7,28,36 With the designation of the fungal barcode
region (expected by the end of 201135) there is expectation
that more validated fungal (ITS) sequences will become avail-
able. Even though the number of strains in the CBS collection
is only a fraction of the total number of fungal species, and is
representing only the culturable biodiversity, it is still going to
be a very valuable dataset for the mycological community at
large, last but not least because of its ca. 8000 (ex) type and
authentic strains.26
New sequencing technologies will boost the availability of
sequence data in many areas of mycology. While experimental
approaches often reveal a considerable variability in complex
traits of fungi, simple characters like fermentation skills in
yeasts or, for example, extrolites in Aspergillus (i.e. ref. 17 and
24) tend to be species specific. The described tool can be
applied either for checking assumptions about species’ properties
or exploring them. Even if traits are not strictly species specific,
like, for examples sensitivity against certain antimycotica,
clustering results could still give an indication about cures if
a pathogen has been identified to a species.
Acknowledgements
We thank Janneke Bloem and Nathalie van de Wiele for
testing the LIMS.
References
1 S. F. Altschul, T. L. Madden, A. A. Schaffer, J. Zhang, Z. Zhang,W. Miller and D. J. Lipman, Gapped blast and psi-blast: a newgeneration of protein database search programs, Nucleic AcidsRes., 1997, 25(17), 3389–3402.
2 D. Begerow, H. Nilsson, M. Unterseher and W. Maier, Currentstate and perspectives of fungal DNA barcoding and rapididentification procedures, Appl. Microbiol. Biotechnol., 2010, 87,99–108.
3 M. I. Bidartondo and 256 other authors, Preserving accuracy ingenbank, Science, 2008, 319, 1616.
4 M. Blackwell, D. S. Hibbett, J. W. Taylor and J. W. Spatafora,Research coordination networks: a phylogeny for kingdom fungi(deep hypha), Mycologia, 2006, 98, 829–837.
5 E. Bolten, A. Schliep, S. Schneckener, D. Schomburg andR. Schrader, Clustering protein sequences-structure prediction bytransitive homology, Bioinformatics, 2001, 17, 935–941.
6 P.M. Brock, H. Doring andM. I. Bidartondo, How to know unknownfungi: the role of a herbarium, New Phytol., 2009, 181(3), 719–724.
7 T. D. Bruns, A. E. Arnold and K. W. Hughes, Fungal networksmade of humans: unite, fesin, and frontiers in fungal ecology,New Phytol., 2008, 177, 586–588.
8 E. N. Cianciola, T. R. Popolizio, C. W. Schneider and C. E. Lane,Using molecular-assisted alpha taxonomy to better understand redalgal biodiversity in bermuda, Diversity, 2010, 2, 946–958.
9 CBS databases. http://www.cbs.knaw.nl/databases/.10 NCBI databases. http://www.ncbi.nlm.nih.gov/.11 K. de Queiroz, Species concepts and species delimitation, Syst.
Biol., 2007, 56(6), 879–886.12 R. P. de Vries, A. Wiebenga and V. Robert, Fungal growth
database: linking growth to genome, http://www.fung-growth.org.13 U. Eberhardt, Methods for DNA barcoding fungi, in DNA
Barcodes: Methods and Protocols, ed. J. W. Kress andD. L. Erickson, Humana Press.
14 A. J. Enright, S. Van Dongen and C. A. Ouzounis, An efficientalgorithm for large-scale detection of protein families, NucleicAcids Res., 2002, 30(7), 1575–1584.
15 A. J. Enright, S. Van Dongen and C. A. Ouzounis, Protein familiesand tribes in genome sequence space, Nucleic Acids Res., 2003,31(15), 4632–4638.
16 D. Erpenbeck and G. Woheide, On the molecular phylogeny ofsponges (porifera), Zootaxa, 2007, 1668, 107–126.
17 D. M. Geiser, M. A. Klich, J. C. Frisvad, S. W. Peterson, J. Vargaand R. A. Samson, The current status of species recognition andidentification in aspergillus studies, Mycology, 2007, 59, 1–10.
18 D. L. Hawksworth, The magnitude of fungal diversity: the 1 � 5million species estimate revisited, Mycol. Res., 2001, 105(12),1422–1432.
19 P. D. Hebert, A. Cywinska, S. L. Ball and J. R. de Waard,Biological identifications through DNA barcodes, Proc. R. Soc.London, Ser. B, 2003, 270, 313–321.
20 T. Y. James, F. Kauff, C. L. Schoch and 70 co authors, Reconstructingthe early evolution of fungi using a six-gene phylogeny, Nature,2006, 443, 818–822.
21 S. Kim and J. Lee, Bag: a graph theoretic sequence clusteringalgorithm, Int. J. Data Min. Bioinf., 2006, 1(2), 178–200.
22 T. K. Konstantinos and J. M. Tiedje, Genomic insights thatadvance the species definition for prokaryotes, Proc. Natl. Acad.Sci. U. S. A., 2005, 102(7), 2567–2572.
23 A. Krause, J. Stoye and M. Vingron, Large scale hierarchical-clustering of protein sequences, BMC Bioinformatics, 2005, 6, 15.
24 The yeasts—a taxonomic study, ed. C. P. Kurtzman, J. W. Fell andT. Boekhout, 2011.
25 C. B. Lawrence and V. V. Solovyev, Assignment of position-specific error probability to primary DNA sequence data, NucleicAcids Res., 1994, 22(7), 1272–1280.
26 S. E. Miller, DNA barcoding and the renaissance of taxonomy,Proc. Natl. Acad. Sci. U. S. A., 2007, 104(12), 4775–4776.
27 MongoDB. http://www.mongodb.org/.28 R. H. Nilsson, K. Abarenkov, K. H. Larsson and U. Koljalg,
Molecular identification of fungi: rationale, philosophical concerns,and the unite database, Open Appl. Inf. J., 2011, 5, 81–86.
29 R. H. Nilsson, E. Kristiansson, M. Ryberg, K. Abarenkov,K. H. Larsson, U. Koljalg and C. Fairhead, Taxonomic reliabilityof DNA sequences in public sequence databases: a fungal perspective,PLoS One, 2006, 1(1), e59.
30 P. Paccanaro, J. A. Casbon and M. A. Saqi, Spectral clustering ofproteins sequences, Nucleic Acids Res., 2006, 34(5), 1571.
31 S. Rahmann, T. Wittkop, J. Baumbach and M. Martin, Exact andheuristic algorithms for weighted cluster editing, Comput. Syst.Bioinf. Conf., 2007, 6, 391–401.
32 V. Robert, J. E. de Bien and G. L. Hennebert, Allev, a newprogram for computer-assisted identification of yeasts, Taxon,1994, 43, 433–439.
Dow
nloa
ded
by Y
ale
Uni
vers
ity L
ibra
ry o
n 06
Mar
ch 2
012
Publ
ishe
d on
17
Febr
uary
201
2 on
http
://pu
bs.r
sc.o
rg |
doi:1
0.10
39/C
2IB
0014
6B
View Online
Integr. Biol. This journal is c The Royal Society of Chemistry 2012
33 V. Robert, P. Evrard and G. L. Hennebert, Bccm/allev 2.0 an auto-mated system for identification of yeasts,Mycotaxon, 1997, 64, 455–463.
34 V. Robert, S. Szoke, J. Jabas, T. D. Vu, O. Chouchen, E. Blom andG. Cardinali, Biolomics software: biological datamanagement, identifi-cation, classification and statistic, Open Appl. Inf. J., 2011, 5, 87–98.
35 C. Schoch, et al. The nuclear ribosomal internal transcribed spacer(ITS) region as a universal DNA barcode marker for Fungi, Proc.Natl. Acad. Sci. U. S. A., 2011.
36 K. A. Seifert, Progress towards DNA barcoding of fungi, Mol.Ecol. Resour., 2009, 9, 83–89.
37 T. F. Smith and M. S. Waterman, Identification of commonmolecular subsequences, J. Mol. Biol., 1981, 147, 195–197.
38 M. Y. Stoeckle and P. D. Hebert, Barcode of life, Sci. Am., 2008,299, 82–86.
39 Citrix system. http://www.citrix.com/.40 T. D. Vu, S. Szoke, C. Wiwie, J. Baumbach and V. Robert,
Multilevel clustering for curation of massive biological data, 2011.In preparation.
41 R. A. Wilson and N. J. Talbot, Fungal physiology a futureperspective, Microbiology, 2009, 155, 3810–3815.
42 T. Wittkop, J. Baumbach, F. P. Lobo and S. Rahmann, Largescale clustering of protein sequences with force—a layout basedheuristic for weighted clustering editing, BMC Bioinformatics,2007, 8(1), 396.
43 T. Wittkop, D. Emig, S. Lange, S. Rahmann, M. Albrecht,J. Morris, S. Boker, J. Stoye and J. Baumbach, Partitioningbiological data with transitivity clustering, Nat. Methods, 2010,7, 419–420.
Dow
nloa
ded
by Y
ale
Uni
vers
ity L
ibra
ry o
n 06
Mar
ch 2
012
Publ
ishe
d on
17
Febr
uary
201
2 on
http
://pu
bs.r
sc.o
rg |
doi:1
0.10
39/C
2IB
0014
6B
View Online