a directional clustering technique for random data classification
TRANSCRIPT
A Directional Clustering Technique for RandomData Classification
Carlos Reyes1,2 and Malek Adjouadi*21Coulter Corporation, Research and Technology Instrument Systems, Miami, Florida
2Center for Advanced Technology and Education, Department of Electrical and Computer Engineering, Florida InternationalUniversity, University Park, Miami, Florida
Received 22 January 1996; Accepted 30 July 1996
This paper introduces a new clustering techniquefor random data classification based on an enhancedversion of the Voronoi diagram. This technique isoptimized to deal in the best way possible with datadistributions which in their spatial representationsexperience overlap. A mathematical framework isgiven in view of this enhanced analysis and providesinsight to key issues involving (a) the use of acorrection process to complement the traditionalVoronoi diagram and (b) the introducion of direc-
tional vectors in Gaussian and elliptical data distribu-tions for enhanced data clustering. The computa-tional requirements of the proposed approach areprovided, and the computer results involving bothrandomly generated and real-world data prove thesoundness of this clustering technique. Cytometry27:126–135, 1997. r 1997 Wiley-Liss, Inc.
Key terms: directional Voronoi diagram; directionalvectors; data clustering
In this study, the traditional application of the Voronoidiagram to data clustering is augmented through a new setof Voronoi lines which take into account not only theposition of the populations but also their relative direc-tions. This new set of lines will be referred to as thedirectional Voronoi lines or the directional Voronoi dia-gram. It is shown to enhance clustering results andovercomes some of the problems imposed by overlappingdata. The mathematical foundation for this approach isdetailed, and the application of such an approach tovarious data sets is contrasted to the traditional approachof the Voronoi diagram.The Voronoi diagram detailed in Aurenhammer (1) is a
clustering technique which assumes the nearest neighborrule in associating each point to an associated subset (orsite) closest to it. The main theme behind Voronoidiagrams revolves around the classification of statisticaldata which at first may appear unrelated. The Voronoiinherent geometric constructs (a fundamental study of thedata structure through computational geometry) allowsfor a well-defined data cluster separation and eventualclassification. Voronoi diagrams have found their use inmany disciplines as described in the elaborate survey givenin (1) and are exploited in the area of data clustering andclassification as well. Darro et al. (4), for instance, makesuse of the Voronoi diagrams to characterize and differenti-ate human colorectal cancer lines. The findings of thisstudy show a characteristic organization in the topographi-cal distribution of cells as a function of the media wherethese cells were cultivated.
Many of the fundamental clustering and pattern classifi-cation algorithms are well described in the excellentclassic and current textbooks (8, 10, 11, 14, 18). Many ofthese algorithms have been exploited in different ways toyield different clustering techniques (2, 3, 5, 6, 9, 12, 13,15, 16, 17, 19). In order to optimize the results ofclustering, some of these studies set a priori some con-straints on either the morphology of the clusters them-selves (5, 12, 15) or on the number of classes that can behandled at any given pass of the process (13). Otherstudies introduce measures which respond to the need formean shifting (gradient mapping), similarity measure-ments, thresholding, and image segmentation, respec-tively (3, 9, 17, 19). An important issue involves aresolution to the dilemma of processing time requirementsversus the accuracy sought in clustering the data. Forexample, Bakker Schut et al. (2) combine the k-meansclustering algorithm with a modified nearest neighbortechnique in order to achieve fast cluster analysis of real aswell as artificial cytometric data. Studies (5 and 12), on the
Contract grant sponsor: National Science Foundation; Contract grantnumbers: CDA-9313624 and CDA-9512454; Contract grant sponsor: Cen-ter for Advanced Technology & Education; Contract grant sponsor: theDepartment of Electrical and Computer Engineering; Contract grantsponsor: Coulter Corporation; Contract grant number: DSRT-571822400.*Correspondence to: Malek Adjouadi, Center for Advanced Technology
and Education, Dept. of Electrical and Computer Engineering, FloridaInternational Univ., University Park, Miami, FL 33199. E-mail:[email protected].
r 1997 Wiley-Liss, Inc. Cytometry 27:126–135 (1997)
other hand, focus on clusters which take ellipsoidal orcircular shapes referred to as shells, and fuzzy clusteringalgorithms in contrast to direct (hard) algorithms such asthe well known k-means algorithm are developed toaddress both the memory requirements as well the compu-tational speed in contrast to the use of the Houghtransform and Newton’s method.The main objective of all these studies is to seek an
effective clustering technique which partitions or sepa-rates random data into subsets or clusters where intraclassmembers reveal features of closest similarity. This isexactly what constitutes the theme of this study. In thisendeavor, however, attention is given to overcoming theproblematic areas of overlap where the Voronoi diagrammeets its limitation while simultaneously consolidating thefact of bringing the computational requirements to arealistic level (within seconds).In line with this main objective, an important aspect of
this study consists of introducing directional vectorsreminiscent of the first and second principal components(7) in order to enhance the partitioning of data clusters.Computer implementations of this partitioning schemeillustrate the correction obtained over the standard Voro-noi approach as the error in data classification is mini-mized. A mathematical framework is provided in supportof this new partitioning scheme, yielding in our view anoptimized clustering technique. Applications of such atechnique are foreseen to extend to any k-dimensionalgeometrical construct for any k features found in theclassification of the given data clusters.Mathematical formulations are provided in support of
this main objective and include several proofs and applica-tions on the issues of (a) the regression line versus theminimum distance error line, (b) directional vectors inGaussian distributions, (c) the problem of data overlap, (d)the extension to elliptical data distributions; and (e) thecomputational requirements of the proposed approach.
AN IMPLEMENTATION OF THE VORONOI DIAGRAMThe Standard Voronoi Clustering Approach
The purpose of this paper is to provide a more accuratemethod which will work well in separating various clus-ters in their diverse spatial representations. Cluster separa-tion is the ability to separate various clusters in any givennumber of dimensions and to be able to assign a set of datapoints to the specific cluster to which they appropriatelybelong (8, 10, 18).In this study, Gaussian distributions were created in two
dimensions initially in an attempt to provide ideas aboutmethods which could possibly be used to separate accu-rately the given data into their respective populations orclusters. The standard Voronoi diagram is used as a basisfor the development of a more accurate method ofclustering.An example of a Voronoi diagram with its associated
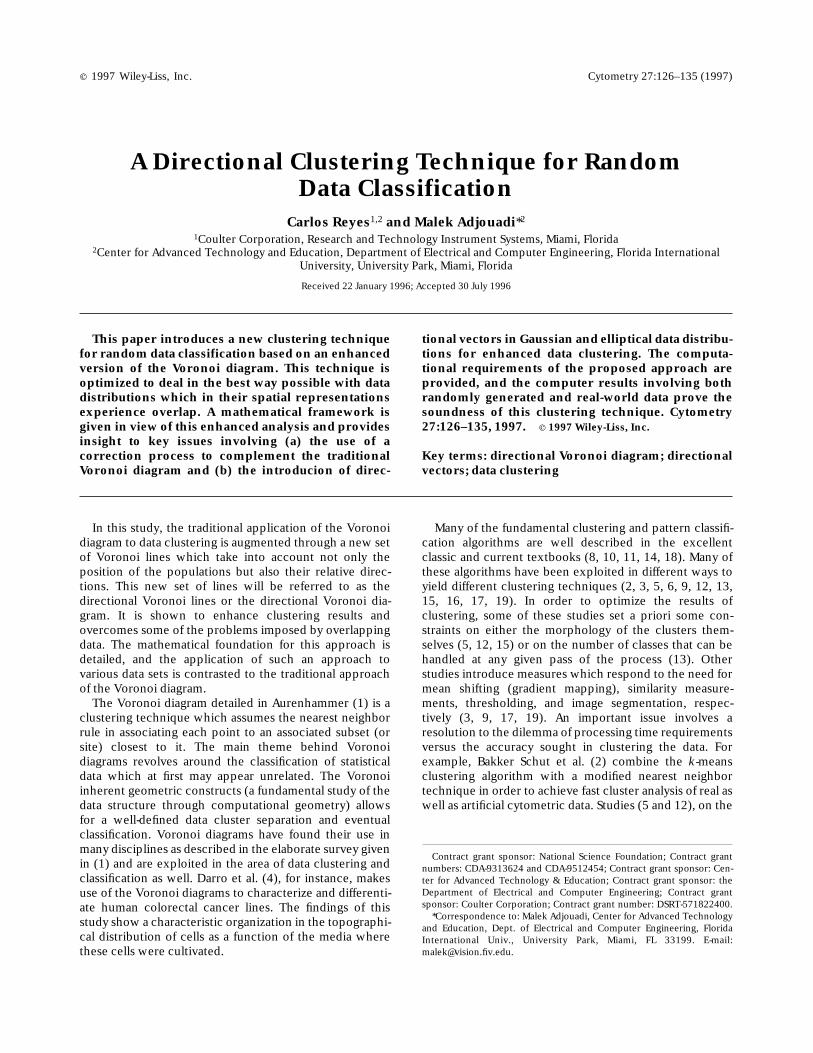
data site points is shown in Figure 1. The Voronoi diagramthus establishes regions of minimum distance to the sitepoints.
A Correction Scheme to the Voronoi Approach
The method introduced in this paper employs theVoronoi diagram as a first step to generate reference linesfor cluster definition. A correction scheme on the Voronoiseparation lines is then applied to optimize the results ofthe cluster separation task. In establishing the foundationsfor a Voronoi diagram, an effective peak finding algorithmis utilized in this study to insure the proper identificationof existing clusters within the given data. This task is asearch for a point surrounded by the maximum of datapoints within a neighborhood delimited by a set windowsize which is convolved throughout the image. Whenmore than one point satisfies this condition the midpointor the center of all the points satisfying the condition willbe declared the peak point or site point. This is animportant step since a given data cluster may appear tohave various peaks, and the algorithm may otherwiseerroneously separate a single cluster into two or moresmaller clusters. Also, the site point itself may or may notbe an actual data point.The data set used to test part of the algorithm was
created using 2-dimensional Gaussian distributions whichcould be rotated by any given angle u such that
G(x,y) 5 A · e21
231x2x0
sx22
1 1y2y0
sy22
4(1)
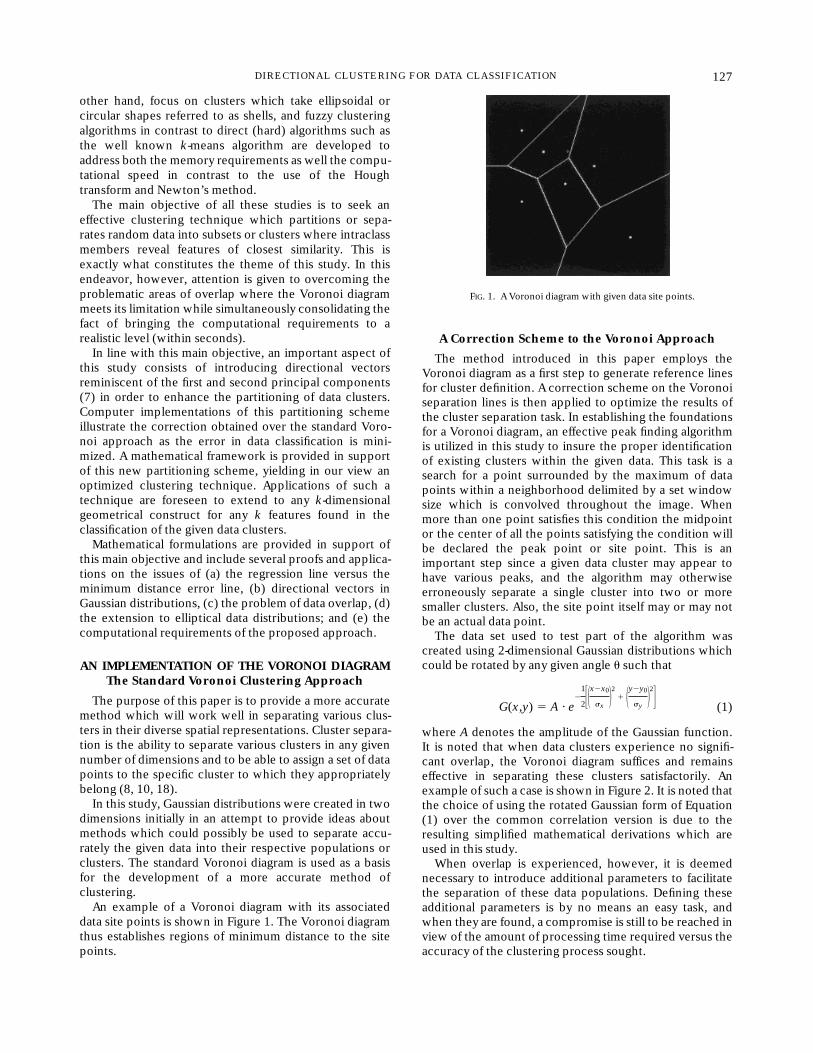
where A denotes the amplitude of the Gaussian function.It is noted that when data clusters experience no signifi-cant overlap, the Voronoi diagram suffices and remainseffective in separating these clusters satisfactorily. Anexample of such a case is shown in Figure 2. It is noted thatthe choice of using the rotated Gaussian form of Equation(1) over the common correlation version is due to theresulting simplified mathematical derivations which areused in this study.When overlap is experienced, however, it is deemed
necessary to introduce additional parameters to facilitatethe separation of these data populations. Defining theseadditional parameters is by no means an easy task, andwhen they are found, a compromise is still to be reached inview of the amount of processing time required versus theaccuracy of the clustering process sought.
FIG. 1. A Voronoi diagram with given data site points.
127DIRECTIONAL CLUSTERING FOR DATA CLASSIFICATION
The Dilemma of Cluster Overlap
The design concept of the Voronoi diagram is a soundone; however, problems arise when one is separatingpopulations which have different shapes and/or differentdegrees of overlap. In Figure 3, the result of the standardVoronoi algorithm operating on data clusters experiencingoverlap is illustrated. Note how the algorithm fails toprovide good definition in the regions of overlap. Theclusters which do not experience overlap are, as ex-pected, well separated by the Voronoi diagram. However,the separation between the 2 lowest clusters that experi-ence overlap is, as anticipated, shown to be ineffective. Toaddress this problem, the algorithm devised here correctsthe Voronoi lines to go through the minimum gradient andin so doing provides, as we shall see, a more effectivecluster separation in the regions of overlap.
The Correction Process of the Voronoi Lines
The intensity or gray levels of the Voronoi lines areencoded to provide information as to which 2 data pointscreated them. The intensity level of the lines is determinedby first assigning a level equivalent to (255 ? i
n), where idenotes the site point pertaining to the region of the givendata, n is the total number of site points found, and 255 isthe maximum value in the range of gray-level valuesobtained using an 8-bit/pixel resolution (0 through 2821).The derivatives in x and then in y are obtained in order toplace the lines at the boundaries of these regions. Since the
level of the region contains its associated point, thederivative provides the information to obtain the secondpoint. If the peaks of any 2 given populations are (XI ,YI)and (XJ ,YJ), where I and J are the populations, the Voronoiline separating any 2 populations can be described instandard form as
Y 5 mX 1 b with m 5
2XI 2 XJ
YI 2 YJand b 5
1
2 3YJ2 2 YI
2 1 XJ2 2 XI
2
YJ 2 YI4 (2)
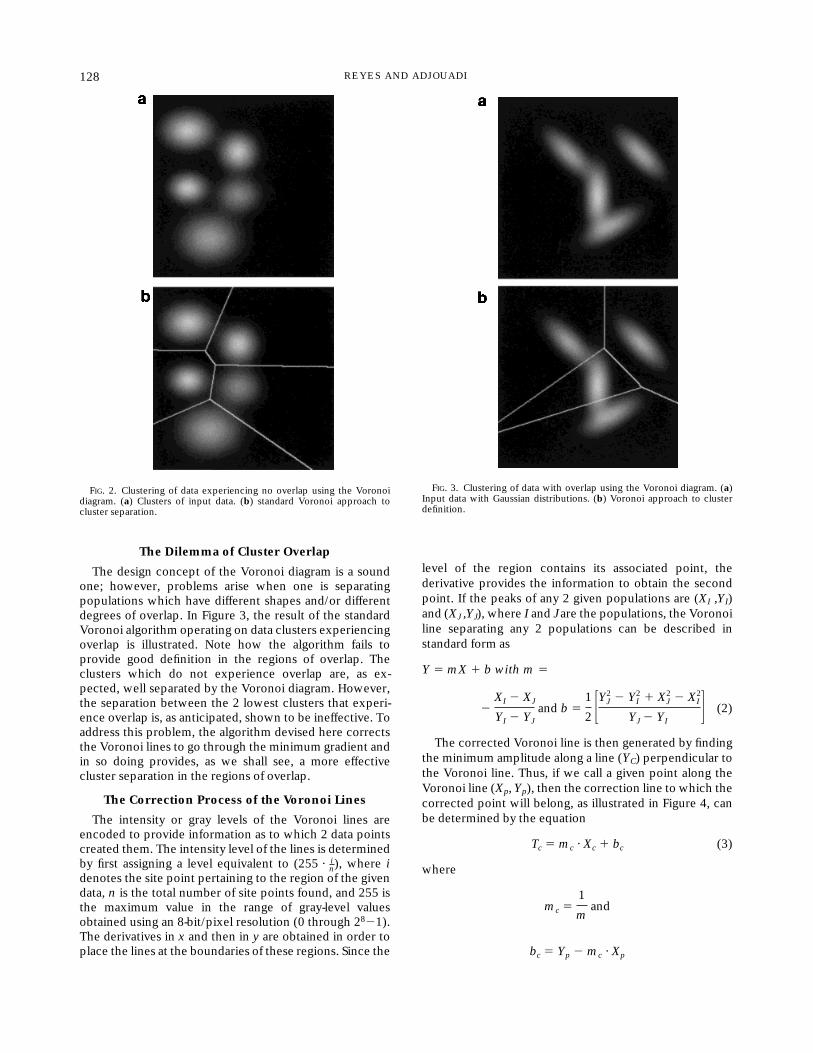
The corrected Voronoi line is then generated by findingthe minimum amplitude along a line (YC) perpendicular tothe Voronoi line. Thus, if we call a given point along theVoronoi line (Xp, Yp), then the correction line to which thecorrected point will belong, as illustrated in Figure 4, canbe determined by the equation
Tc 5 mc · Xc 1 bc (3)
where
mc 51
mand
bc 5 Yp 2 mc · Xp
FIG. 2. Clustering of data experiencing no overlap using the Voronoidiagram. (a) Clusters of input data. (b) standard Voronoi approach tocluster separation.
FIG. 3. Clustering of data with overlap using the Voronoi diagram. (a)Input data with Gaussian distributions. (b) Voronoi approach to clusterdefinition.
128 REYES AND ADJOUADI
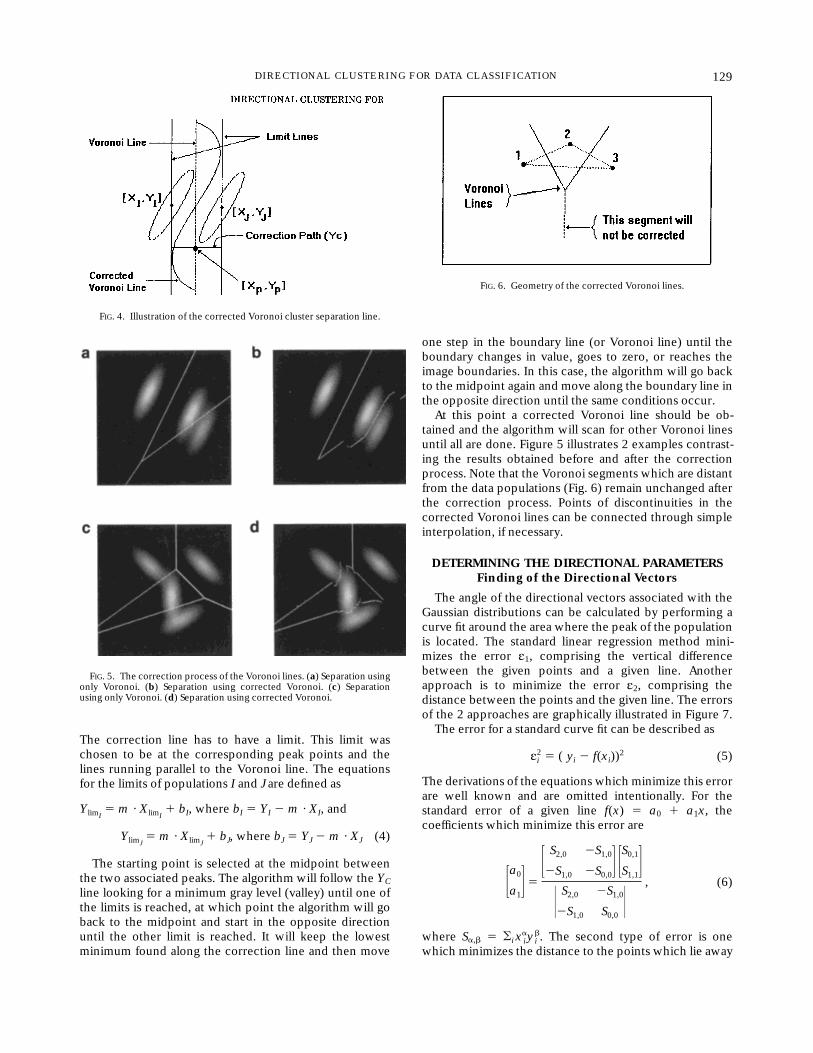
The correction line has to have a limit. This limit waschosen to be at the corresponding peak points and thelines running parallel to the Voronoi line. The equationsfor the limits of populations I and J are defined as
YlimI5 m · XlimI
1 bI, where bI 5 YI 2 m · XI, and
YlimJ5 m · XlimJ
1 bJ, where bJ 5 YJ 2 m · XJ (4)
The starting point is selected at the midpoint betweenthe two associated peaks. The algorithm will follow the YCline looking for a minimum gray level (valley) until one ofthe limits is reached, at which point the algorithm will goback to the midpoint and start in the opposite directionuntil the other limit is reached. It will keep the lowestminimum found along the correction line and then move
one step in the boundary line (or Voronoi line) until theboundary changes in value, goes to zero, or reaches theimage boundaries. In this case, the algorithm will go backto the midpoint again and move along the boundary line inthe opposite direction until the same conditions occur.At this point a corrected Voronoi line should be ob-
tained and the algorithm will scan for other Voronoi linesuntil all are done. Figure 5 illustrates 2 examples contrast-ing the results obtained before and after the correctionprocess. Note that the Voronoi segments which are distantfrom the data populations (Fig. 6) remain unchanged afterthe correction process. Points of discontinuities in thecorrected Voronoi lines can be connected through simpleinterpolation, if necessary.
DETERMINING THE DIRECTIONAL PARAMETERSFinding of the Directional Vectors
The angle of the directional vectors associated with theGaussian distributions can be calculated by performing acurve fit around the area where the peak of the populationis located. The standard linear regression method mini-mizes the error E1, comprising the vertical differencebetween the given points and a given line. Anotherapproach is to minimize the error E2, comprising thedistance between the points and the given line. The errorsof the 2 approaches are graphically illustrated in Figure 7.The error for a standard curve fit can be described as
Ei2 5 ( yi 2 f(xi))
2 (5)
The derivations of the equations which minimize this errorare well known and are omitted intentionally. For thestandard error of a given line f(x) 5 a0 1 a1x, thecoefficients which minimize this error are
3a0
a14 5
3S2,0 2S1,0
2S1,0 2S0,04 3S0,1
S1,14
0S2,0 2S1,0
2S1,0 S0,00
, (6)
where Sa,b 5 oix iayi
b. The second type of error is onewhich minimizes the distance to the points which lie away
FIG. 4. Illustration of the corrected Voronoi cluster separation line.
FIG. 5. The correction process of the Voronoi lines. (a) Separation usingonly Voronoi. (b) Separation using corrected Voronoi. (c) Separationusing only Voronoi. (d) Separation using corrected Voronoi.
FIG. 6. Geometry of the corrected Voronoi lines.
129DIRECTIONAL CLUSTERING FOR DATA CLASSIFICATION
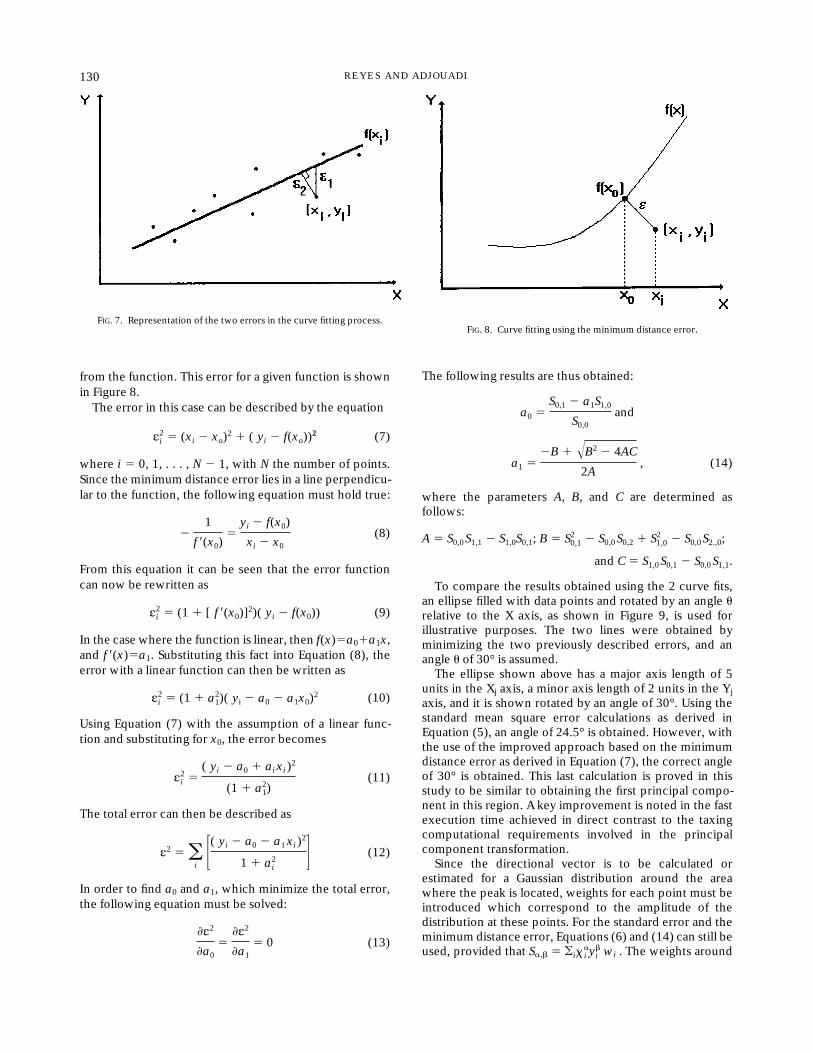
from the function. This error for a given function is shownin Figure 8.The error in this case can be described by the equation
Ei2 5 (xi 2 xo)
2 1 ( yi 2 f(xo))2 (7)
where i 5 0, 1, . . . , N 2 1, with N the number of points.Since the minimum distance error lies in a line perpendicu-lar to the function, the following equation must hold true:
21
f 8(x0)5yi 2 f(x0)
xi 2 x0(8)
From this equation it can be seen that the error functioncan now be rewritten as
Ei2 5 (1 1 [ f 8(x0)]
2)( yi 2 f(x0)) (9)
In the case where the function is linear, then f(x)5a01a1x,and f 8(x)5a1. Substituting this fact into Equation (8), theerror with a linear function can then be written as
Ei2 5 (1 1 a1
2)( yi 2 a0 2 a1x0)2 (10)
Using Equation (7) with the assumption of a linear func-tion and substituting for x0, the error becomes
Ei2 5
( yi 2 a0 1 aixi)2
(1 1 a12)
(11)
The total error can then be described as
E2 5 oi3( yi 2 a0 2 a1xi)
2
1 1 ai2 4 (12)
In order to find a0 and a1, which minimize the total error,the following equation must be solved:
≠E2
≠a05
≠E2
≠a15 0 (13)
The following results are thus obtained:
a0 5S0,1 2 a1S1,0
S0,0and
a1 52B 1 ŒB2 2 4AC
2A, (14)
where the parameters A, B, and C are determined asfollows:
A 5 S0,0S1,1 2 S1,0S0,1; B 5 S0,12 2 S0,0S0,2 1 S1,0
2 2 S0,0S2.,0;
and C 5 S1,0S0,1 2 S0,0S1,1.
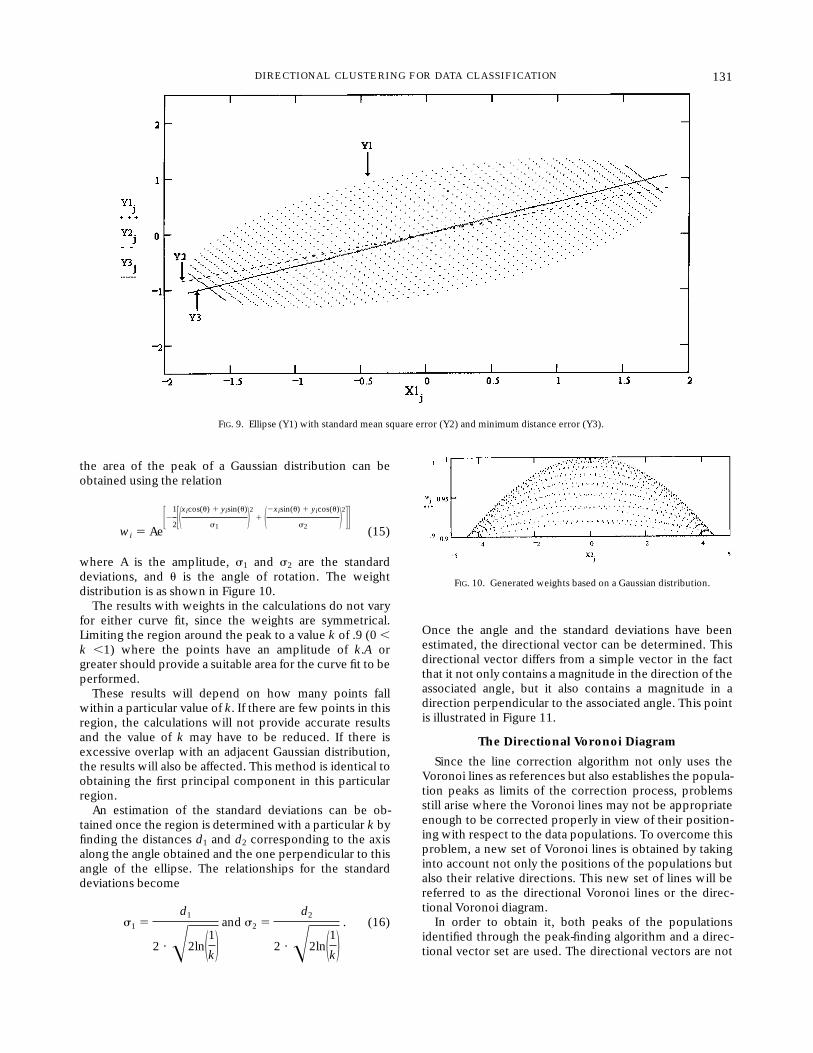
To compare the results obtained using the 2 curve fits,an ellipse filled with data points and rotated by an angle urelative to the X axis, as shown in Figure 9, is used forillustrative purposes. The two lines were obtained byminimizing the two previously described errors, and anangle u of 30° is assumed.The ellipse shown above has a major axis length of 5
units in the Xj axis, a minor axis length of 2 units in the Yjaxis, and it is shown rotated by an angle of 30°. Using thestandard mean square error calculations as derived inEquation (5), an angle of 24.5° is obtained. However, withthe use of the improved approach based on the minimumdistance error as derived in Equation (7), the correct angleof 30° is obtained. This last calculation is proved in thisstudy to be similar to obtaining the first principal compo-nent in this region. A key improvement is noted in the fastexecution time achieved in direct contrast to the taxingcomputational requirements involved in the principalcomponent transformation.Since the directional vector is to be calculated or
estimated for a Gaussian distribution around the areawhere the peak is located, weights for each point must beintroduced which correspond to the amplitude of thedistribution at these points. For the standard error and theminimum distance error, Equations (6) and (14) can still beused, provided that Sa,b 5 oix i
ayib wi . The weights around
FIG. 8. Curve fitting using the minimum distance error.FIG. 7. Representation of the two errors in the curve fitting process.
130 REYES AND ADJOUADI
the area of the peak of a Gaussian distribution can beobtained using the relation
wi 5 Ae321
231xicos(u) 1 yisin(u)
s122
1 12xisin(u) 1 yicos(u)
s222
44(15)
where A is the amplitude, s1 and s2 are the standarddeviations, and u is the angle of rotation. The weightdistribution is as shown in Figure 10.The results with weights in the calculations do not vary
for either curve fit, since the weights are symmetrical.Limiting the region around the peak to a value k of .9 (0 ,k ,1) where the points have an amplitude of k.A orgreater should provide a suitable area for the curve fit to beperformed.These results will depend on how many points fall
within a particular value of k. If there are few points in thisregion, the calculations will not provide accurate resultsand the value of k may have to be reduced. If there isexcessive overlap with an adjacent Gaussian distribution,the results will also be affected. This method is identical toobtaining the first principal component in this particularregion.An estimation of the standard deviations can be ob-
tained once the region is determined with a particular k byfinding the distances d1 and d2 corresponding to the axisalong the angle obtained and the one perpendicular to thisangle of the ellipse. The relationships for the standarddeviations become
s1 5d1
2 ·Œ2ln11k2and s2 5
d2
2 ·Œ2ln11k2. (16)
Once the angle and the standard deviations have beenestimated, the directional vector can be determined. Thisdirectional vector differs from a simple vector in the factthat it not only contains a magnitude in the direction of theassociated angle, but it also contains a magnitude in adirection perpendicular to the associated angle. This pointis illustrated in Figure 11.
The Directional Voronoi Diagram
Since the line correction algorithm not only uses theVoronoi lines as references but also establishes the popula-tion peaks as limits of the correction process, problemsstill arise where the Voronoi lines may not be appropriateenough to be corrected properly in view of their position-ing with respect to the data populations. To overcome thisproblem, a new set of Voronoi lines is obtained by takinginto account not only the positions of the populations butalso their relative directions. This new set of lines will bereferred to as the directional Voronoi lines or the direc-tional Voronoi diagram.In order to obtain it, both peaks of the populations
identified through the peak-finding algorithm and a direc-tional vector set are used. The directional vectors are not
FIG. 9. Ellipse (Y1) with standard mean square error (Y2) and minimum distance error (Y3).
FIG. 10. Generated weights based on a Gaussian distribution.
131DIRECTIONAL CLUSTERING FOR DATA CLASSIFICATION
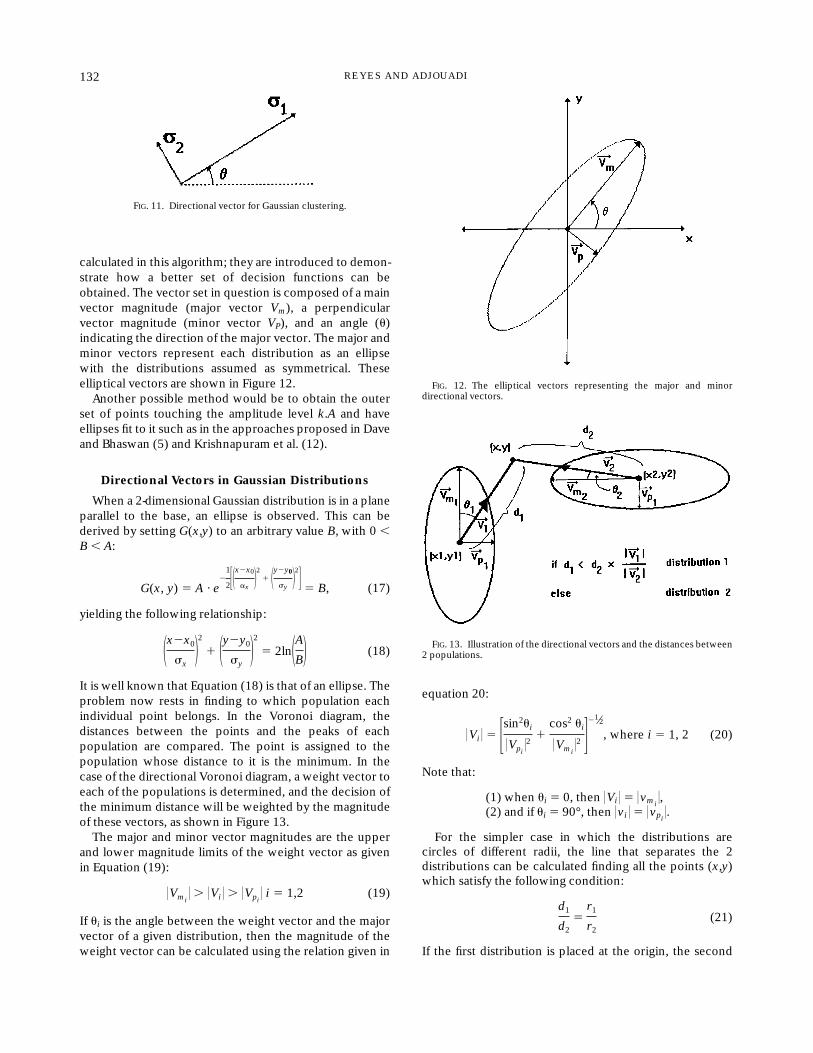
calculated in this algorithm; they are introduced to demon-strate how a better set of decision functions can beobtained. The vector set in question is composed of a mainvector magnitude (major vector Vm), a perpendicularvector magnitude (minor vector VP), and an angle (u)indicating the direction of the major vector. The major andminor vectors represent each distribution as an ellipsewith the distributions assumed as symmetrical. Theseelliptical vectors are shown in Figure 12.Another possible method would be to obtain the outer
set of points touching the amplitude level k.A and haveellipses fit to it such as in the approaches proposed in Daveand Bhaswan (5) and Krishnapuram et al. (12).
Directional Vectors in Gaussian Distributions
When a 2-dimensional Gaussian distribution is in a planeparallel to the base, an ellipse is observed. This can bederived by setting G(x,y) to an arbitrary value B, with 0 ,B , A:
G(x, y) 5 A · e21
231x2x0
ax22
1 1y2y0
sy22
45 B, (17)
yielding the following relationship:
1x2x0
sx22
1 1y2y0
sy22
5 2ln1AB2 (18)
It is well known that Equation (18) is that of an ellipse. Theproblem now rests in finding to which population eachindividual point belongs. In the Voronoi diagram, thedistances between the points and the peaks of eachpopulation are compared. The point is assigned to thepopulation whose distance to it is the minimum. In thecase of the directional Voronoi diagram, a weight vector toeach of the populations is determined, and the decision ofthe minimum distance will be weighted by the magnitudeof these vectors, as shown in Figure 13.The major and minor vector magnitudes are the upper
and lower magnitude limits of the weight vector as givenin Equation (19):
0Vmi0 . 0Vi 0 . 0Vpi 0 i 5 1,2 (19)
If ui is the angle between the weight vector and the majorvector of a given distribution, then the magnitude of theweight vector can be calculated using the relation given in
equation 20:
0Vi 0 5 3sin2ui
0Vpi 02
1cos2 ui
0Vmi02 4
21⁄2, where i 5 1, 2 (20)
Note that:
(1) when ui 5 0, then 0Vi 0 5 0vmi0,
(2) and if ui 5 90°, then 0vi 0 5 0vpi 0.
For the simpler case in which the distributions arecircles of different radii, the line that separates the 2distributions can be calculated finding all the points (x,y)which satisfy the following condition:
d1
d25r1
r2(21)
If the first distribution is placed at the origin, the second
FIG. 11. Directional vector for Gaussian clustering.
FIG. 12. The elliptical vectors representing the major and minordirectional vectors.
FIG. 13. Illustration of the directional vectors and the distances between2 populations.
132 REYES AND ADJOUADI
distribution is placed at (x2,y2), and r1 . r2, then thefollowing relationships are set:
d1 5 (x2 1 y2)
1
2
d2 5 ((x 2 x2)2 1 ( y 2 y2)
2)
1
2, and (22)
R 5r1
r2
The function which satisfies this condition is found to be acircle given by:
3x 2 x2 · 1 R2
R2 2 1242
1 3y 2 y2 · 1 R2
R2 2 1242
5 [(x2)2 1 ( y2)
2] ·R2
(R2 2 1)2 (23)
It should be noted that if R. 1 (r1 . r2), then the center ofthe circle will be located past (x2,y2), but if R , 1, then thecenter will shift to the left of the origin, making a circlearound distribution 1. In the case where R 5 1 can bederived by letting d1 5 d2 and solving for y, the result is theequation of the Voronoi lines which are perpendicular tothe points and given by
y 5(x2)
2 1 ( y2)2
2y22 x ·
x2
y2(24)
A Resolution to the Problem of Overlap
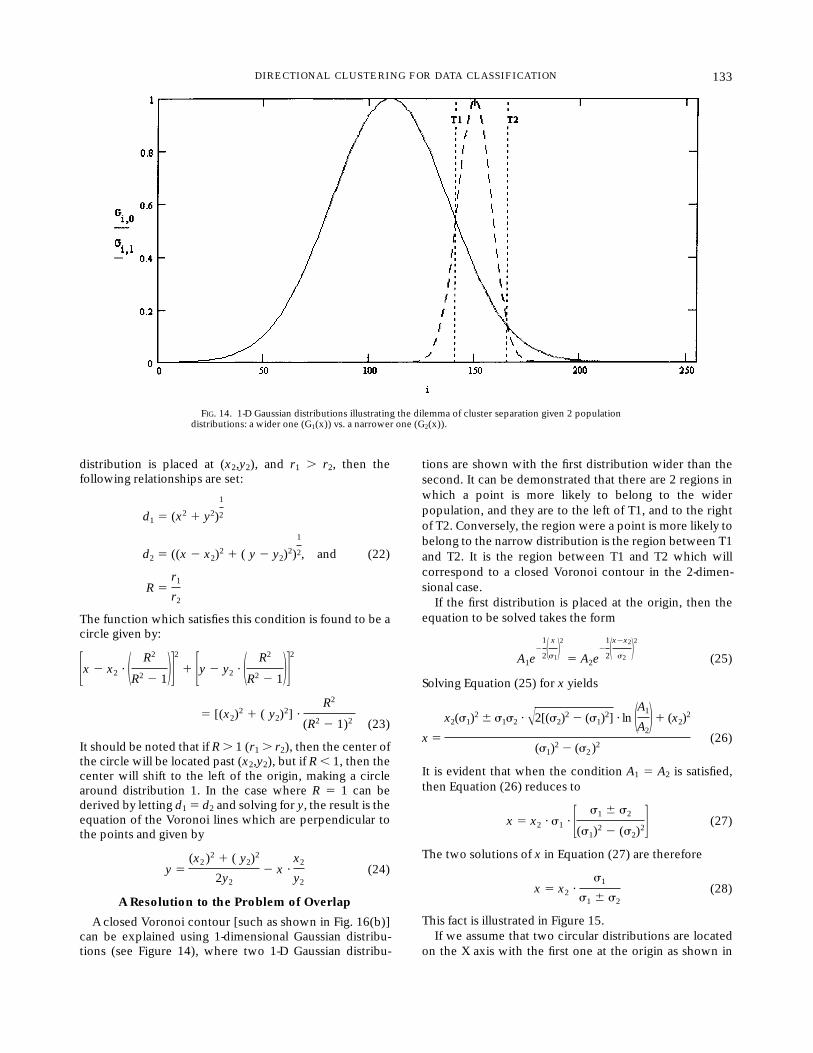
A closed Voronoi contour [such as shown in Fig. 16(b)]can be explained using 1-dimensional Gaussian distribu-tions (see Figure 14), where two 1-D Gaussian distribu-
tions are shown with the first distribution wider than thesecond. It can be demonstrated that there are 2 regions inwhich a point is more likely to belong to the widerpopulation, and they are to the left of T1, and to the rightof T2. Conversely, the region were a point is more likely tobelong to the narrow distribution is the region between T1and T2. It is the region between T1 and T2 which willcorrespond to a closed Voronoi contour in the 2-dimen-sional case.If the first distribution is placed at the origin, then the
equation to be solved takes the form
A1e21
21x
s122
5 A2e21
21x2x2
s222
(25)
Solving Equation (25) for x yields
x5
x2(s1)2 6 s1s2 ·Œ2[(s2)
2 2 (s1)2] · ln 1A1A221 (x2)
2
(s1)2 2 (s2)
2(26)
It is evident that when the condition A1 5 A2 is satisfied,then Equation (26) reduces to
x 5 x2 · s1 · 3s1 6 s2
(s1)2 2 (s2)
24 (27)
The two solutions of x in Equation (27) are therefore
x 5 x2 ·s1
s1 6 s2
(28)
This fact is illustrated in Figure 15.If we assume that two circular distributions are located
on the X axis with the first one at the origin as shown in
FIG. 14. 1-D Gaussian distributions illustrating the dilemma of cluster separation given 2 populationdistributions: a wider one (G1(x)) vs. a narrower one (G2(x)).
133DIRECTIONAL CLUSTERING FOR DATA CLASSIFICATION
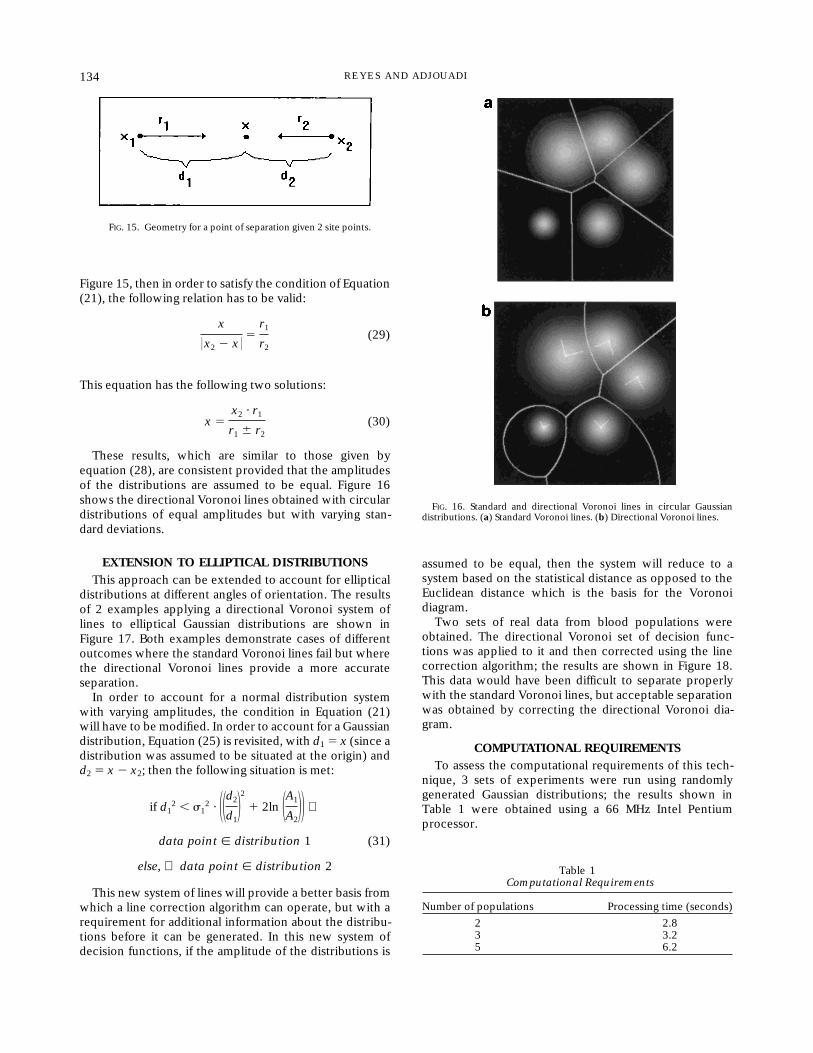
Figure 15, then in order to satisfy the condition of Equation(21), the following relation has to be valid:
x
0x2 2 x 05r1
r2(29)
This equation has the following two solutions:
x 5x2 · r1
r1 6 r2(30)
These results, which are similar to those given byequation (28), are consistent provided that the amplitudesof the distributions are assumed to be equal. Figure 16shows the directional Voronoi lines obtained with circulardistributions of equal amplitudes but with varying stan-dard deviations.
EXTENSION TO ELLIPTICAL DISTRIBUTIONS
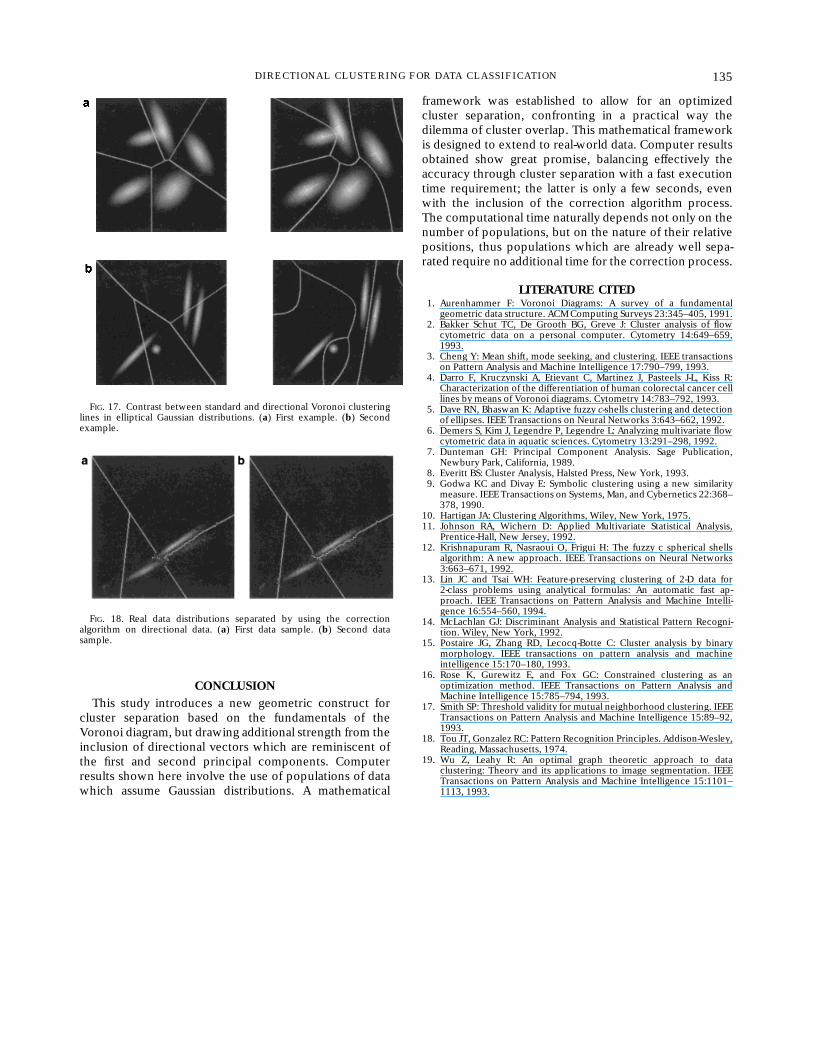
This approach can be extended to account for ellipticaldistributions at different angles of orientation. The resultsof 2 examples applying a directional Voronoi system oflines to elliptical Gaussian distributions are shown inFigure 17. Both examples demonstrate cases of differentoutcomes where the standard Voronoi lines fail but wherethe directional Voronoi lines provide a more accurateseparation.In order to account for a normal distribution system
with varying amplitudes, the condition in Equation (21)will have to be modified. In order to account for a Gaussiandistribution, Equation (25) is revisited, with d1 5 x (since adistribution was assumed to be situated at the origin) andd2 5 x 2 x2; then the following situation is met:
if d12 , s1
2 · 11d2d122
1 2ln 1A1A222 ⇒
data point [ distribution 1 (31)
else, ⇒ data point [ distribution 2
This new system of lines will provide a better basis fromwhich a line correction algorithm can operate, but with arequirement for additional information about the distribu-tions before it can be generated. In this new system ofdecision functions, if the amplitude of the distributions is
assumed to be equal, then the system will reduce to asystem based on the statistical distance as opposed to theEuclidean distance which is the basis for the Voronoidiagram.Two sets of real data from blood populations were
obtained. The directional Voronoi set of decision func-tions was applied to it and then corrected using the linecorrection algorithm; the results are shown in Figure 18.This data would have been difficult to separate properlywith the standard Voronoi lines, but acceptable separationwas obtained by correcting the directional Voronoi dia-gram.
COMPUTATIONAL REQUIREMENTSTo assess the computational requirements of this tech-
nique, 3 sets of experiments were run using randomlygenerated Gaussian distributions; the results shown inTable 1 were obtained using a 66 MHz Intel Pentiumprocessor.
FIG. 16. Standard and directional Voronoi lines in circular Gaussiandistributions. (a) Standard Voronoi lines. (b) Directional Voronoi lines.
Table 1Computational Requirements
Number of populations Processing time (seconds)
2 2.83 3.25 6.2
FIG. 15. Geometry for a point of separation given 2 site points.
134 REYES AND ADJOUADI
CONCLUSIONThis study introduces a new geometric construct for
cluster separation based on the fundamentals of theVoronoi diagram, but drawing additional strength from theinclusion of directional vectors which are reminiscent ofthe first and second principal components. Computerresults shown here involve the use of populations of datawhich assume Gaussian distributions. A mathematical
framework was established to allow for an optimizedcluster separation, confronting in a practical way thedilemma of cluster overlap. This mathematical frameworkis designed to extend to real-world data. Computer resultsobtained show great promise, balancing effectively theaccuracy through cluster separation with a fast executiontime requirement; the latter is only a few seconds, evenwith the inclusion of the correction algorithm process.The computational time naturally depends not only on thenumber of populations, but on the nature of their relativepositions, thus populations which are already well sepa-rated require no additional time for the correction process.
LITERATURE CITED1. Aurenhammer F: Voronoi Diagrams: A survey of a fundamental
geometric data structure. ACM Computing Surveys 23:345–405, 1991.2. Bakker Schut TC, De Grooth BG, Greve J: Cluster analysis of flow
cytometric data on a personal computer. Cytometry 14:649–659,1993.
3. Cheng Y: Mean shift, mode seeking, and clustering. IEEE transactionson Pattern Analysis and Machine Intelligence 17:790–799, 1993.
4. Darro F, Kruczynski A, Etievant C, Martinez J, Pasteels J-L, Kiss R:Characterization of the differentiation of human colorectal cancer celllines by means of Voronoi diagrams. Cytometry 14:783–792, 1993.
5. Dave RN, Bhaswan K: Adaptive fuzzy c-shells clustering and detectionof ellipses. IEEE Transactions on Neural Networks 3:643–662, 1992.
6. Demers S, Kim J, Legendre P, Legendre L: Analyzing multivariate flowcytometric data in aquatic sciences. Cytometry 13:291–298, 1992.
7. Dunteman GH: Principal Component Analysis. Sage Publication,Newbury Park, California, 1989.
8. Everitt BS: Cluster Analysis, Halsted Press, New York, 1993.9. Godwa KC and Divay E: Symbolic clustering using a new similarity
measure. IEEE Transactions on Systems, Man, and Cybernetics 22:368–378, 1990.
10. Hartigan JA: Clustering Algorithms, Wiley, New York, 1975.11. Johnson RA, Wichern D: Applied Multivariate Statistical Analysis,
Prentice-Hall, New Jersey, 1992.12. Krishnapuram R, Nasraoui O, Frigui H: The fuzzy c spherical shells
algorithm: A new approach. IEEE Transactions on Neural Networks3:663–671, 1992.
13. Lin JC and Tsai WH: Feature-preserving clustering of 2-D data for2-class problems using analytical formulas: An automatic fast ap-proach. IEEE Transactions on Pattern Analysis and Machine Intelli-gence 16:554–560, 1994.
14. McLachlan GJ: Discriminant Analysis and Statistical Pattern Recogni-tion. Wiley, New York, 1992.
15. Postaire JG, Zhang RD, Lecocq-Botte C: Cluster analysis by binarymorphology. IEEE transactions on pattern analysis and machineintelligence 15:170–180, 1993.
16. Rose K, Gurewitz E, and Fox GC: Constrained clustering as anoptimization method. IEEE Transactions on Pattern Analysis andMachine Intelligence 15:785–794, 1993.
17. Smith SP: Threshold validity for mutual neighborhood clustering. IEEETransactions on Pattern Analysis and Machine Intelligence 15:89–92,1993.
18. Tou JT, Gonzalez RC: Pattern Recognition Principles. Addison-Wesley,Reading, Massachusetts, 1974.
19. Wu Z, Leahy R: An optimal graph theoretic approach to dataclustering: Theory and its applications to image segmentation. IEEETransactions on Pattern Analysis and Machine Intelligence 15:1101–1113, 1993.
FIG. 17. Contrast between standard and directional Voronoi clusteringlines in elliptical Gaussian distributions. (a) First example. (b) Secondexample.
FIG. 18. Real data distributions separated by using the correctionalgorithm on directional data. (a) First data sample. (b) Second datasample.
135DIRECTIONAL CLUSTERING FOR DATA CLASSIFICATION