a cross-country study of electronic business adoption using the technology organization-environment...
TRANSCRIPT
A Cross-Country Study of Electronic Business Adoption Using the Technology-Organization-Environment Framework December 2002 Kevin Zhu, Kenneth L. Kraemer and Sean Xu Center for Research on Information Technology and Organizations University of California, Irvine ICIS 2002 Best Paper: Conference Theme (93 accepted of 526 submitted papers)
This research is part of the Globalization of E-Commerce Project of the Center for Research on Information Technology and Organizations (CRITO) at the University of California, Irvine. The material is based upon work supported by the National Science Foundation under Grant No. 0085852. Any opinions, findings, and conclusions or recommendations expressed in this maternial are those of the author(s) and do not necessarily reflect the views of the National Science Foundation. ______________________________________________________________________________
Center for Research on Information Technology and Organizations University of California, Irvine | www.crito.uci.edu
2002 � Twenty-Third International Conference on Information Systems 337
A CROSS-COUNTRY STUDY OF ELECTRONICBUSINESS ADOPTION USING THE TECHNOLOGY-ORGANIZATION-ENVIRONMENT FRAMEWORK
Kevin ZhuCenter for Research on Information
Technology and OrganizationsUniversity of California, Irvine
Irvine, CA [email protected]
Kenneth L. KraemerCenter for Research on Information
Technology and OrganizationsUniversity of California, Irvine
Irvine, CA [email protected]
Sean XuGraduate School of ManagementUniversity of California, Irvine
Irvine, CA [email protected]
Abstract
In this study, we developed a conceptual model for electronic business (e-business or EB) adoptionincorporating six adoption facilitators and inhibitors, based on the technology-organization-environmentframework. Survey data from 3,100 businesses and 7,500 consumers in eight European countries were usedto test the model. We conducted confirmatory factor analysis to assess the reliability and validity of constructs.To examine whether adoption behaviors differ across different e-business environments, we divided the fullsample into high EB-intensity and low EB-intensity countries. The fitted logit models demonstrated fourfindings: (1) Technology competence, firm scope and size, consumer readiness, and competitive pressure aresignificant adoption drivers, while lack of trading partner readiness is a significant adoption inhibitor. (2) AsEB-intensity increases, two environmental factors�consumer readiness and lack of trading partnerreadiness�become less important. (3) In high EB-intensity countries, e-business is no longer a phenomenondominated by large firms; as more and more firms engage in e-business, network effect works to the advantageof small firms. (4) Firms are more cautious into adopting e-business in high EB-intensity countries, whichseems to suggest that the more informed firms are less aggressive into adopting e-business.
Keywords: Electronic business, adoption, Europe, empirical study, cross-country analysis, technologycompetence, readiness, firm scope, technology-organization-environment framework
1 INTRODUCTION
Internet-based electronic business (e-business or EB) has been predicted to experience significant growth across Europe. Yet, inadopting e-business, companies face a broad range of obstacles, particularly their missing ability to transcend significant technical,managerial, and cultural issues (Anderson Consulting 1999; Forrester Research 1999). Hence, understanding adoption driversand barriers becomes increasingly important. However, such issues have not been well studied in the literature. In particular, whatis missing from the existing literature is (1) a theoretical framework specific to e-business adoption, (2) measurement of factors
Zhu et al./Electronc Business Adoption
338 2002 � Twenty-Third International Conference on Information Systems
affecting e-business adoption, and (3) empirical assessment based on large sample datasets. Our study seeks to reduce these gaps.Key research questions that motivate our work are: (1) What framework can be used as a theoretical basis for studying e-businessadoption? (2) What facilitators and inhibitors can be identified within the theoretical framework? (3) What different adoptionbehaviors can be found across different e-business environments?
To better understand these issues, we developed a conceptual model for e-business adoption based on the technology-organization-environment framework from the technology innovation and information systems (IS) literature. Then we tested this frameworkusing survey data from 3,100 businesses and 7,500 consumers in eight European countries. Data analysis identified significantadoption facilitators and inhibitors in general, but demonstrated differing adoption behaviors across different e-businessenvironments.
The following section reviews the relevant literature, on which the technology-organization-environment framework wasdeveloped. Within this framework, a conceptual model and research hypotheses are then presented, followed by research method,analysis, and results. The paper concludes with a discussion of research findings, limitations, and contributions from both researchand managerial perspectives.
2 THEORETICAL BACKGROUND: THE TECHNOLOGY-ORGANIZATION-ENVIRONMENT FRAMEWORK
To study adoption of general technological innovation, Tornatzky and Fleischer (1990) developed the technology-organization-environment framework, which identified three aspects of a firm�s context that influence the process by which it adopts andimplements technological innovation: organizational context, technological context, and environmental context. Organizationalcontext is typically defined in terms of several descriptive measures: firm size; the centralization, formalization, and complexityof its managerial structure; the quality of its human resource; and the amount of slack resources available internally. Technologicalcontext describes both the internal and external technologies relevant to the firm. This includes existing technologies inside thefirm, as well as the pool of available technologies in the market. Environment context is the arena in which a firm conducts itsbusiness��its industry, competitors, access to resources supplied by others, and dealings with government (Tornatzky andFleischer 1990, pp. 152-154).
This framework has been examined by a number of studies on various IS domains. In particular, the adoption of electronic datainterchange (EDI), an antecedent of e-business, has been studied extensively in the last decade (Mukhopadhyay et al. 1995). Anexamination of this literature by Iacovou et al. (1995) reveals many factors that were demonstrated as significant adoption driversand barriers in previous studies. Following Tornatzky and Fleischer, Iacovou et al. developed a model formulating three aspectsof EDI adoption influences�technological factor (perceived benefits), organizational factor (organizational readiness), andenvironmental factor (external pressure)�as the main reasons for EDI adoption, and examined the model by seven case studies.Their model was further tested by other researchers using large samples. For example, Kuan and Chau (2001) developed aperception-based technology-organization-environment framework incorporating six factors as EDI adoption predictors, andconfirmed the usefulness of the technology-organization-environment framework for studying adoption of technologicalinnovations.
Although specific factors identified within the three contexts may vary across different studies, the technology-organization-environment framework has a solid theoretical basis, consistent empirical support, and promise of applying to other IS innovationdomains. Thus, we adopted this theoretical framework and extended it to the e-business domain, which has not been done in theliterature. The next two sections discuss its conceptualization and operationalization in the e-business context.
3 CONCEPTUAL MODEL AND HYPOTHESES
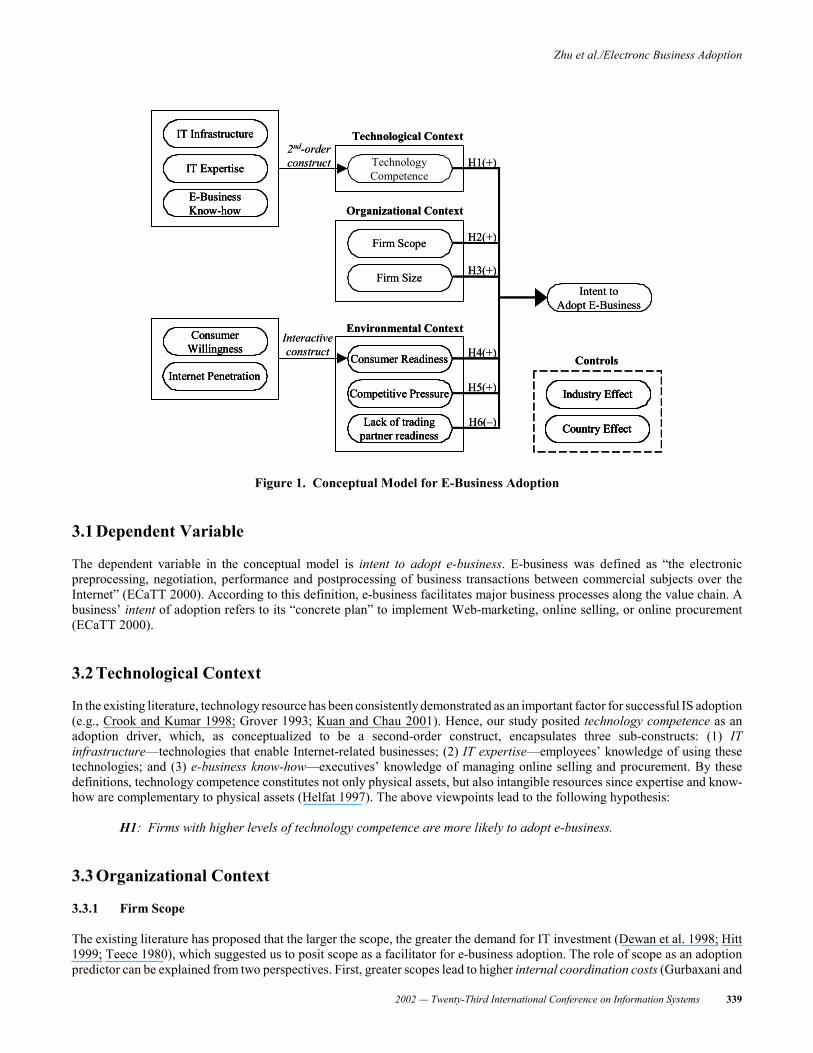
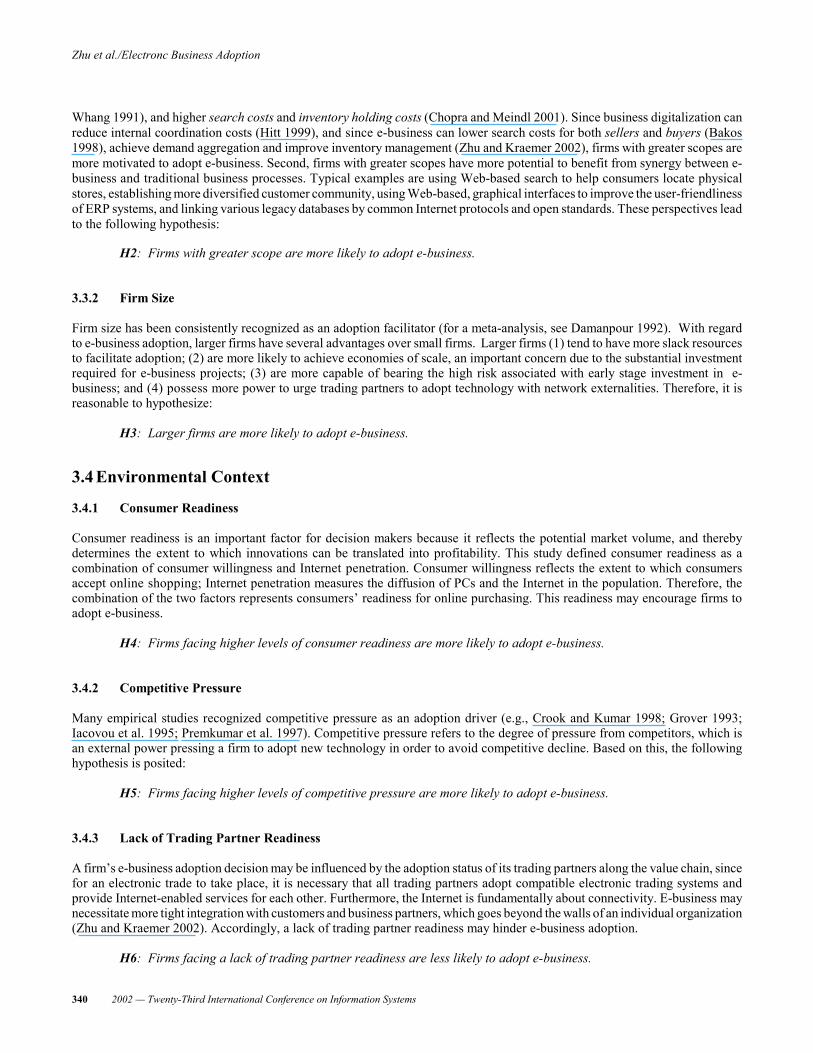
Based on the technology-organization-environment framework, we proposed a conceptual model for e-business adoption, shownin Figure 1. This conceptual model posited six predictors for e-business adoption within the three-context framework, andcontrolled for country and industry effects.
Zhu et al./Electronc Business Adoption
2002 � Twenty-Third International Conference on Information Systems 339
Intent to Adopt E-Business
Technology Competence
IT Infrastructure
IT Expertise
E-BusinessKnow-how
Technological Context
Firm Scope
Firm Size
Organizational Context
Consumer Readiness
Competitive Pressure
Lack of trading partner readiness
Consumer Willingness
Internet Penetration
Environmental Context
Industry Effect
Country Effect
Controls
H1(+)
H2(+)
H3(+)
H4(+)
H5(+)
H6(�)
2nd-order construct
Interactive construct
Intent to Adopt E-Business
Technology Competence
IT InfrastructureIT Infrastructure
IT ExpertiseIT Expertise
E-BusinessKnow-howE-BusinessKnow-how
Technological Context
Firm Scope
Firm Size
Organizational Context
Consumer ReadinessConsumer Readiness
Competitive PressureCompetitive Pressure
Lack of trading partner readinessLack of trading
partner readiness
Consumer WillingnessConsumer
Willingness
Internet PenetrationInternet Penetration
Environmental Context
Industry Effect
Country Effect
Industry EffectIndustry Effect
Country EffectCountry Effect
Controls
H1(+)
H2(+)
H3(+)
H4(+)
H5(+)
H6(�)
2nd-order construct
Interactive construct
Figure 1. Conceptual Model for E-Business Adoption
3.1 Dependent Variable
The dependent variable in the conceptual model is intent to adopt e-business. E-business was defined as �the electronicpreprocessing, negotiation, performance and postprocessing of business transactions between commercial subjects over theInternet� (ECaTT 2000). According to this definition, e-business facilitates major business processes along the value chain. Abusiness� intent of adoption refers to its �concrete plan� to implement Web-marketing, online selling, or online procurement(ECaTT 2000).
3.2 Technological Context
In the existing literature, technology resource has been consistently demonstrated as an important factor for successful IS adoption(e.g., Crook and Kumar 1998; Grover 1993; Kuan and Chau 2001). Hence, our study posited technology competence as anadoption driver, which, as conceptualized to be a second-order construct, encapsulates three sub-constructs: (1) ITinfrastructure�technologies that enable Internet-related businesses; (2) IT expertise�employees� knowledge of using thesetechnologies; and (3) e-business know-how�executives� knowledge of managing online selling and procurement. By thesedefinitions, technology competence constitutes not only physical assets, but also intangible resources since expertise and know-how are complementary to physical assets (Helfat 1997). The above viewpoints lead to the following hypothesis:
H1: Firms with higher levels of technology competence are more likely to adopt e-business.
3.3 Organizational Context
3.3.1 Firm Scope
The existing literature has proposed that the larger the scope, the greater the demand for IT investment (Dewan et al. 1998; Hitt1999; Teece 1980), which suggested us to posit scope as a facilitator for e-business adoption. The role of scope as an adoptionpredictor can be explained from two perspectives. First, greater scopes lead to higher internal coordination costs (Gurbaxani and
Zhu et al./Electronc Business Adoption
340 2002 � Twenty-Third International Conference on Information Systems
Whang 1991), and higher search costs and inventory holding costs (Chopra and Meindl 2001). Since business digitalization canreduce internal coordination costs (Hitt 1999), and since e-business can lower search costs for both sellers and buyers (Bakos1998), achieve demand aggregation and improve inventory management (Zhu and Kraemer 2002), firms with greater scopes aremore motivated to adopt e-business. Second, firms with greater scopes have more potential to benefit from synergy between e-business and traditional business processes. Typical examples are using Web-based search to help consumers locate physicalstores, establishing more diversified customer community, using Web-based, graphical interfaces to improve the user-friendlinessof ERP systems, and linking various legacy databases by common Internet protocols and open standards. These perspectives leadto the following hypothesis:
H2: Firms with greater scope are more likely to adopt e-business.
3.3.2 Firm Size
Firm size has been consistently recognized as an adoption facilitator (for a meta-analysis, see Damanpour 1992). With regardto e-business adoption, larger firms have several advantages over small firms. Larger firms (1) tend to have more slack resourcesto facilitate adoption; (2) are more likely to achieve economies of scale, an important concern due to the substantial investmentrequired for e-business projects; (3) are more capable of bearing the high risk associated with early stage investment in e-business; and (4) possess more power to urge trading partners to adopt technology with network externalities. Therefore, it isreasonable to hypothesize:
H3: Larger firms are more likely to adopt e-business.
3.4 Environmental Context
3.4.1 Consumer Readiness
Consumer readiness is an important factor for decision makers because it reflects the potential market volume, and therebydetermines the extent to which innovations can be translated into profitability. This study defined consumer readiness as acombination of consumer willingness and Internet penetration. Consumer willingness reflects the extent to which consumersaccept online shopping; Internet penetration measures the diffusion of PCs and the Internet in the population. Therefore, thecombination of the two factors represents consumers� readiness for online purchasing. This readiness may encourage firms toadopt e-business.
H4: Firms facing higher levels of consumer readiness are more likely to adopt e-business.
3.4.2 Competitive Pressure
Many empirical studies recognized competitive pressure as an adoption driver (e.g., Crook and Kumar 1998; Grover 1993;Iacovou et al. 1995; Premkumar et al. 1997). Competitive pressure refers to the degree of pressure from competitors, which isan external power pressing a firm to adopt new technology in order to avoid competitive decline. Based on this, the followinghypothesis is posited:
H5: Firms facing higher levels of competitive pressure are more likely to adopt e-business.
3.4.3 Lack of Trading Partner Readiness
A firm�s e-business adoption decision may be influenced by the adoption status of its trading partners along the value chain, sincefor an electronic trade to take place, it is necessary that all trading partners adopt compatible electronic trading systems andprovide Internet-enabled services for each other. Furthermore, the Internet is fundamentally about connectivity. E-business maynecessitate more tight integration with customers and business partners, which goes beyond the walls of an individual organization(Zhu and Kraemer 2002). Accordingly, a lack of trading partner readiness may hinder e-business adoption.
H6: Firms facing a lack of trading partner readiness are less likely to adopt e-business.
Zhu et al./Electronc Business Adoption
1 For examples of using second-order constructs, see Segars and Grover (1998) and Sethi and King (1994).
2002 � Twenty-Third International Conference on Information Systems 341
3.5 Controls
To control data variation that would not have been captured by the explanatory variables discussed above, we included countrydummies and industry dummies as independent variables.
4 RESEARCH METHOD
4.1 Data
Our data source is ECaTT, a database developed by Empirica, Society for Communication and Technology Research Ltd., basedin Bonn, Germany. ECaTT includes two major surveys: General Population Survey (GPS) and Decision Maker Survey (DMS).GPS is a survey of about 7,500 European consumers, covering attitudes toward electronic commerce. DMS is a survey of about4,000 European businesses at the establishment/division level, covering current practices and plans to introduce the various formsof electronic business. To check for data consistency and reliability, we compared the ECaTT data with OECD statistics. Theymatched well for most countries, with only one exception�Sweden�which therefore was excluded from the analysis. Data fromthe Netherlands were removed due to considerations of missing data. The final sample includes eight European countries(Germany, the United Kingdom, Denmark, Ireland, France, Spain, Italy, and Finland) and 13 industries covering manufacturing,distribution and service sectors.
4.2 Operationalization of Constructs
Several constructs are operationalized as observed variables. First, intent to adopt e-business was measured as a dichotomy. Afirm was classified as an adopter if it had made concrete plans to implement e-business by 2001. Second, we used the numberof establishments as a proxy for scope. Third, we used the number of employees (in logarithm transformation) to measure firmsize. Fourth, competitive pressure was the percentage of firms in each industry that had already adopted e-business at the timeof the survey in 1999. Other variables were operationalized as multi-item constructs. First, technology competence was modeledas a second-order construct.1 The theoretical interpretation of this second-order construct is an overall trait of technologicaladvantage, manifesting in three related dimensions. Taken together, they measure an overarching, second-order construct oftechnology competence. Second, the interactive effect, consumer readiness, is of the Kenny and Judd (1984) type. We modeledthis as an interactive construct since each of its two sub-constructs�consumer willingness and Internet penetration�serves asa necessary condition for the other to evolve into actual online-purchasing readiness.
4.3 Instrument Validation
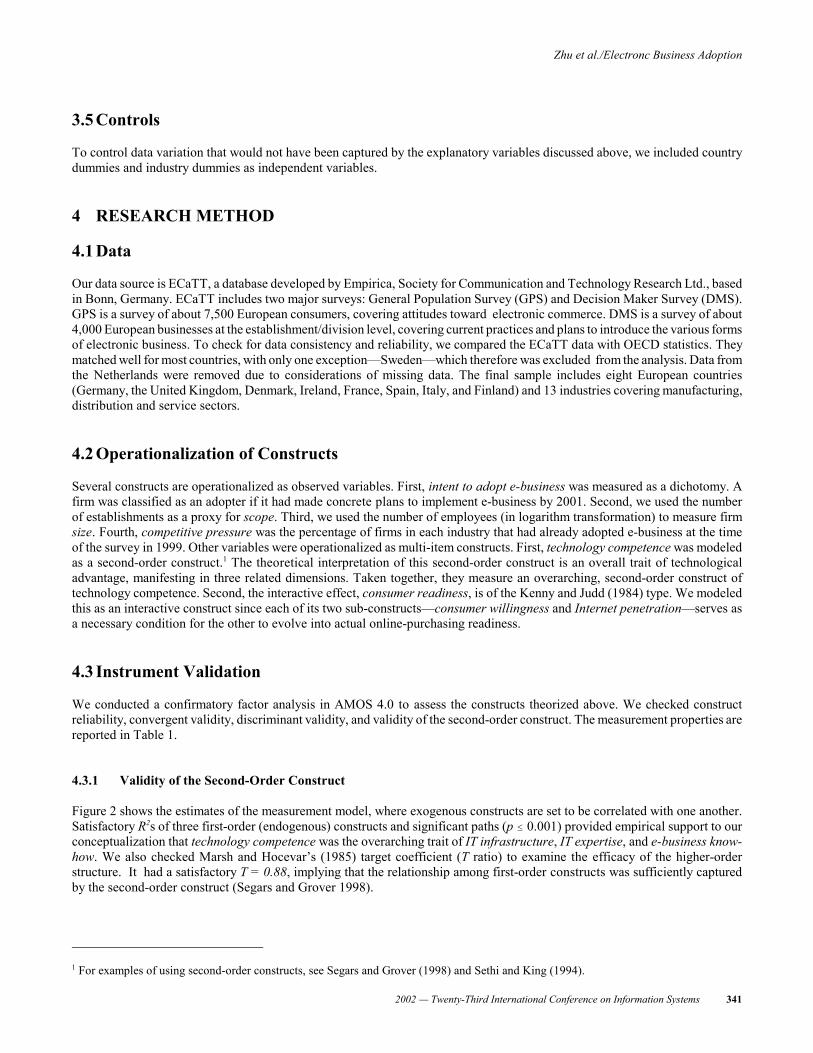
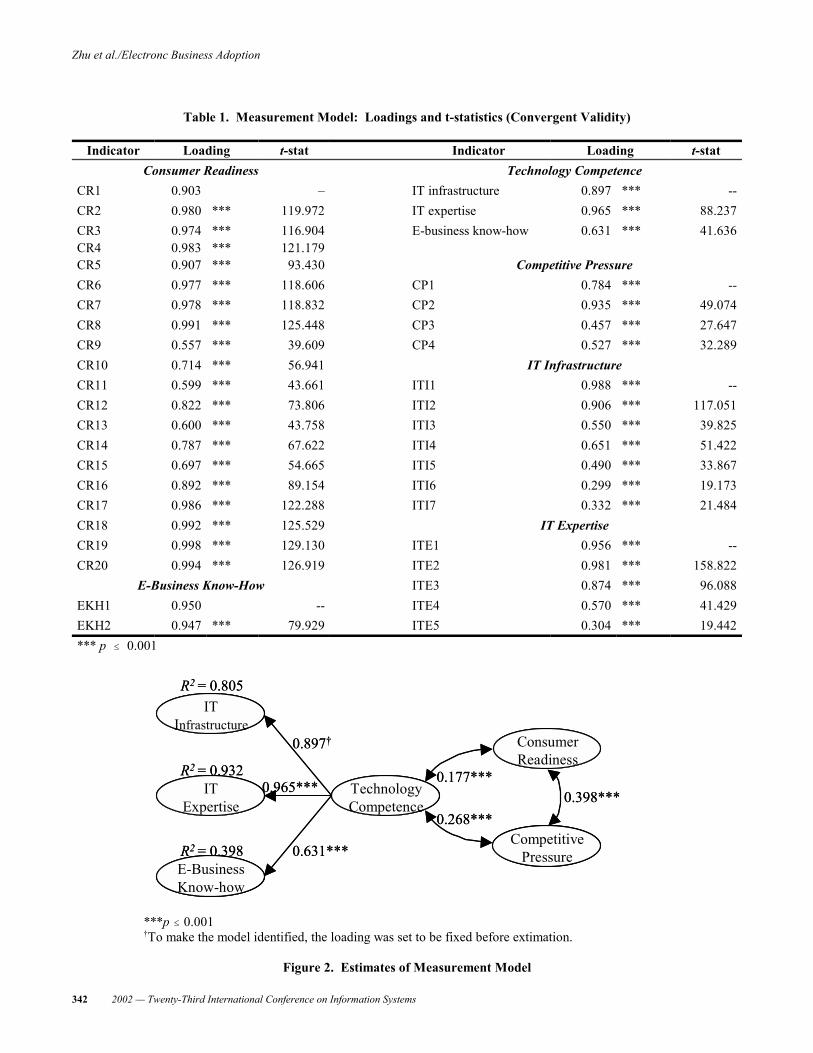
We conducted a confirmatory factor analysis in AMOS 4.0 to assess the constructs theorized above. We checked constructreliability, convergent validity, discriminant validity, and validity of the second-order construct. The measurement properties arereported in Table 1.
4.3.1 Validity of the Second-Order Construct
Figure 2 shows the estimates of the measurement model, where exogenous constructs are set to be correlated with one another.Satisfactory R2s of three first-order (endogenous) constructs and significant paths (p # 0.001) provided empirical support to ourconceptualization that technology competence was the overarching trait of IT infrastructure, IT expertise, and e-business know-how. We also checked Marsh and Hocevar�s (1985) target coefficient (T ratio) to examine the efficacy of the higher-orderstructure. It had a satisfactory T = 0.88, implying that the relationship among first-order constructs was sufficiently capturedby the second-order construct (Segars and Grover 1998).
Zhu et al./Electronc Business Adoption
342 2002 � Twenty-Third International Conference on Information Systems
IT Infrastructure
IT Expertise
E-Business Know-how
Technology Competence
Consumer Readiness
Competitive Pressure
R2 = 0.805
R2 = 0.932
R2 = 0.398
0.897�
0.965***
0.631***
0.177***
0.268***0.398***
IT Infrastructure
IT Infrastructure
IT Expertise
IT Expertise
E-Business Know-howE-Business Know-how
Technology CompetenceTechnology Competence
Consumer ReadinessConsumer Readiness
Competitive Pressure
Competitive Pressure
R2 = 0.805
R2 = 0.932
R2 = 0.398
0.897�
0.965***
0.631***
0.177***
0.268***0.398***
Table 1. Measurement Model: Loadings and t-statistics (Convergent Validity)
Indicator Loading t-stat Indicator Loading t-statConsumer Readiness Technology Competence
CR1 0.903 � IT infrastructure 0.897 *** --CR2 0.980 *** 119.972 IT expertise 0.965 *** 88.237CR3 0.974 *** 116.904 E-business know-how 0.631 *** 41.636CR4 0.983 *** 121.179CR5 0.907 *** 93.430 Competitive PressureCR6 0.977 *** 118.606 CP1 0.784 *** --CR7 0.978 *** 118.832 CP2 0.935 *** 49.074CR8 0.991 *** 125.448 CP3 0.457 *** 27.647CR9 0.557 *** 39.609 CP4 0.527 *** 32.289CR10 0.714 *** 56.941 IT InfrastructureCR11 0.599 *** 43.661 ITI1 0.988 *** --CR12 0.822 *** 73.806 ITI2 0.906 *** 117.051CR13 0.600 *** 43.758 ITI3 0.550 *** 39.825CR14 0.787 *** 67.622 ITI4 0.651 *** 51.422CR15 0.697 *** 54.665 ITI5 0.490 *** 33.867CR16 0.892 *** 89.154 ITI6 0.299 *** 19.173CR17 0.986 *** 122.288 ITI7 0.332 *** 21.484CR18 0.992 *** 125.529 IT ExpertiseCR19 0.998 *** 129.130 ITE1 0.956 *** --CR20 0.994 *** 126.919 ITE2 0.981 *** 158.822
E-Business Know-How ITE3 0.874 *** 96.088EKH1 0.950 -- ITE4 0.570 *** 41.429EKH2 0.947 *** 79.929 ITE5 0.304 *** 19.442*** p # 0.001
***p # 0.001�To make the model identified, the loading was set to be fixed before extimation.
Figure 2. Estimates of Measurement Model
Zhu et al./Electronc Business Adoption
2002 � Twenty-Third International Conference on Information Systems 343
4.3.2 Construct Reliability
Construct reliability measures the degree to which indicators are free from random error and, therefore, yield consistent results.The values of Cronbach�s alpha in Table 2 ranged from 0.764 to 0.947, indicating adequate reliability. We also calculatedcomposite reliability, which ranged from 0.783 to 0.985, all above the cutoff value of 0.70 (Straub 1989).
4.3.3 Convergent Validity and Discriminant Validity
Convergent validity assesses the consistency across multiple operationalizations. All estimated standard loading were significantat p # 0.001 level (Table 1), suggesting good convergent validity. To assess the discriminant validity�the extent to whichdifferent constructs diverge from one another�we used Fornell and Larcker�s (1981) criteria: average variance extracted (AVE)for each construct should be greater than the squared correlation between constructs. The correlation matrix on the right-hand sideof Table 2 shows that our measurement model met this condition.
In summary, our measurement model satisfied various reliability and validity criteria. Moreover, for the purpose of testing therobustness of our measurement model, we also ran exploratory factor analysis on all indicators. Principal component analysis withequamax rotation yielded a consistent grouping with CFA. Thus, factor scores based on this measurement model can be used insubsequent analyses.
Table 2. Measurement Model: Construct Reliability and Discriminant Validity
ConstructCronbach�s
alphaComposite reliability CR CP TC
Exogenous constructs Correlation matrix Consumer readiness (CR) 0.922 0.985 0.879 Competitive pressure (CP) 0.764 0.783 0.398 0.703 Technology competence (TC) NA � 0.878 0.177 0.268 0.843Endogenous constructs IT infrastructure 0.828 0.815 IT expertise 0.870 0.875 E-business know-how 0.947 0.947 � Since technology competence does not have observed items, we did not calculate alpha for it.
5 ANALYSIS
5.1 Logit Regression
Since the dependent variable is dichotomous, a binary logit model was developed. Based on the conceptual model for e-businessadoption in Figure 1, the logit regression model is specified as follows:
(1)1 2 3 4 5 6
Pr( 1) ( ' )( i i j j
i j
Adoption xTC S FS CR CP LTPR C I
γα β β β β β β δ λ
= = Λ= Λ + ⋅ + ⋅ + ⋅ + ⋅ + ⋅ + ⋅ + +∑ ∑
where TC stands for technology competence, S for scope, FS for firm size, CR for consumer readiness, CP for competitivepressure, LTPR for lack of trading partner readiness, Ci's (i = 1,�,8) for country dummies, and Ij's (j = 1,�,13) for industrydummies. 7(@) denotes the probability density function of the logistic distribution. This model is consistent with our conceptualframework in Figure 1 and the six hypotheses defined earlier. Testing the six hypotheses is equivalent to testing whethercoefficients $1 to $6 are non-zero: Significant and positive coefficients imply adoption facilitators while significant and negativecoefficients imply inhibitors. However, note that �the parameters of the logit model, like those of any nonlinear regression model,
Zhu et al./Electronc Business Adoption
344 2002 � Twenty-Third International Conference on Information Systems
are not necessarily the marginal effects we are accustomed to analyzing� (Greene 2000, p. 815). Actually, the marginaleffect�incremental change of the adoption probability due to unit increase of the regressor�is a function of all coefficients andregressors:
(2)Pr( 1) ( ' )[1 ( ' )]Adoption x x
xγ γ γ∂ = = Λ − Λ
∂
In interpreting the estimated model, it will be useful to calculate this value at the means of the regressors, which is labeled asslopes by Greene (2000, p. 816). In short, to test hypotheses, we check the significance of coefficients in (1), while we rely onslopes defined in (2) for economic interpretation.
5.2 Analysis of the Full Sample
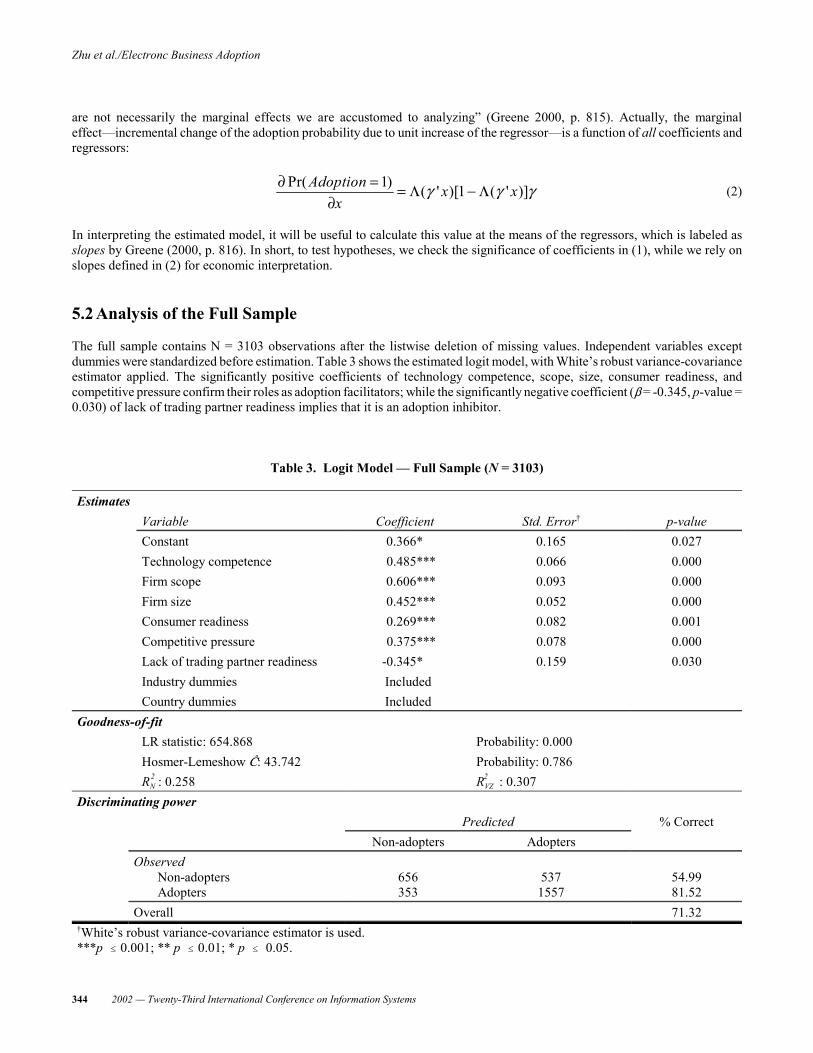
The full sample contains N = 3103 observations after the listwise deletion of missing values. Independent variables exceptdummies were standardized before estimation. Table 3 shows the estimated logit model, with White�s robust variance-covarianceestimator applied. The significantly positive coefficients of technology competence, scope, size, consumer readiness, andcompetitive pressure confirm their roles as adoption facilitators; while the significantly negative coefficient ($ = -0.345, p-value =0.030) of lack of trading partner readiness implies that it is an adoption inhibitor.
Table 3. Logit Model � Full Sample (N = 3103)
EstimatesVariable Coefficient Std. Error� p-valueConstant 0.366* 0.165 0.027Technology competence 0.485*** 0.066 0.000Firm scope 0.606*** 0.093 0.000Firm size 0.452*** 0.052 0.000Consumer readiness 0.269*** 0.082 0.001Competitive pressure 0.375*** 0.078 0.000Lack of trading partner readiness -0.345* 0.159 0.030Industry dummies IncludedCountry dummies Included
Goodness-of-fitLR statistic: 654.868 Probability: 0.000Hosmer-Lemeshow †: 43.742 Probability: 0.786RN
2 : 0.258 RVZ2 : 0.307
Discriminating powerPredicted % Correct
Non-adopters AdoptersObserved
Non-adoptersAdopters
656353
5371557
54.9981.52
Overall 71.32�White�s robust variance-covariance estimator is used.***p # 0.001; ** p # 0.01; * p # 0.05.
Zhu et al./Electronc Business Adoption
2002 � Twenty-Third International Conference on Information Systems 345
Goodness-of-fit of the model was assessed in three ways. First, a likelihood ratio (LR) test was conducted to examine the jointexplanation power of independent variables. Second, the Hosmer-Lemeshow (2000, p. 147) test was used to compare the proposedmodel with a perfect model that can classify respondents into their respective groups correctly (Chau and Tam 1997). Aninsignificant Hosmer-Lemeshow index † implies good model fit. Third, we calculated two pseudo-R2s to measure the proportionof data variation explained: RN
2 (Nagelkerke 1991) and RVZ2 (Veall and Zimmermann 1992). The estimated logit model on the full
sample had significant LR test (LR = 654.868, p # 0.001), insignificant Hosmer-Lemeshow test († = 43.742, p = 0.786), andsatisfactory R2s (25.8% and 30.7%), all suggesting a good model fit.
The logit model was also assessed in terms of the discriminating power (Hosmer and Lemeshow 2000). Based on the observation-prediction table, the rate of correct predictions by the logit model and that by random guess was computed. The logit model hadan overall prediction accuracy of 71.32 percent. As there are 1,193 adopters and 1,910 non-adopters, the classification accuracyby random guess would be (1193/3103)2 + (1910/3102)2 = 52.67%. Thus, we concluded that the logit model had much higherdiscriminating power.
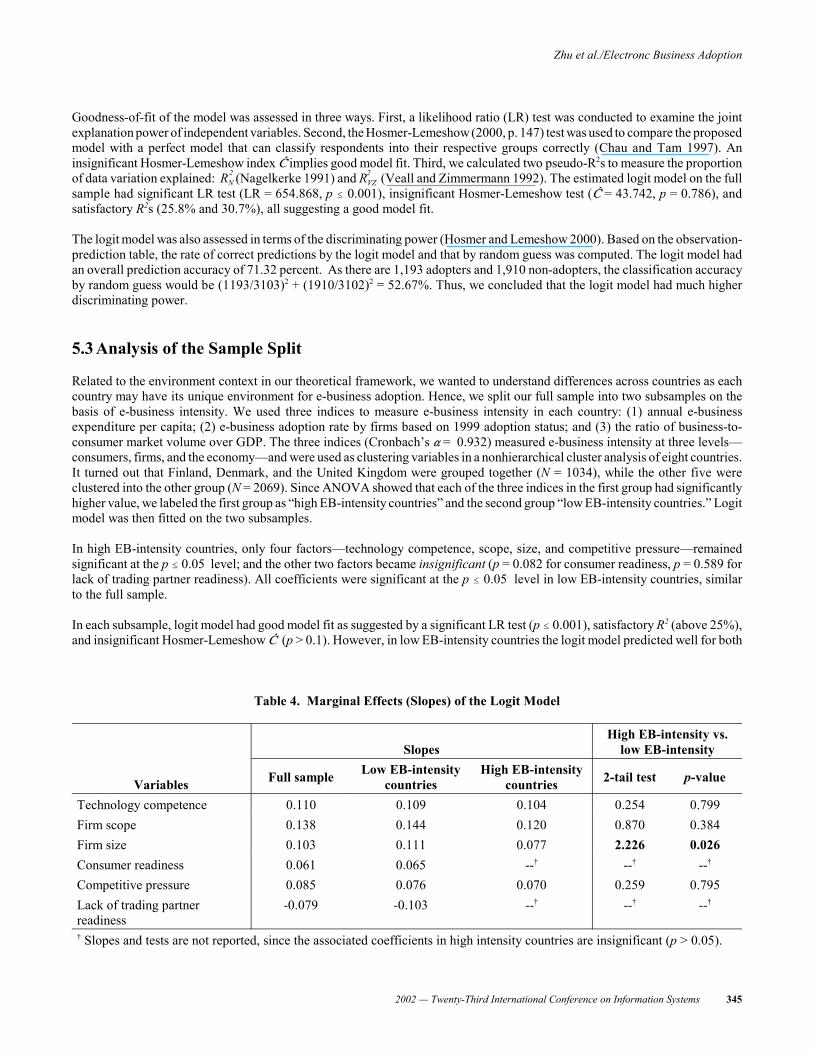
5.3 Analysis of the Sample Split
Related to the environment context in our theoretical framework, we wanted to understand differences across countries as eachcountry may have its unique environment for e-business adoption. Hence, we split our full sample into two subsamples on thebasis of e-business intensity. We used three indices to measure e-business intensity in each country: (1) annual e-businessexpenditure per capita; (2) e-business adoption rate by firms based on 1999 adoption status; and (3) the ratio of business-to-consumer market volume over GDP. The three indices (Cronbach�s " = 0.932) measured e-business intensity at three levels�consumers, firms, and the economy�and were used as clustering variables in a nonhierarchical cluster analysis of eight countries.It turned out that Finland, Denmark, and the United Kingdom were grouped together (N = 1034), while the other five wereclustered into the other group (N = 2069). Since ANOVA showed that each of the three indices in the first group had significantlyhigher value, we labeled the first group as �high EB-intensity countries� and the second group �low EB-intensity countries.� Logitmodel was then fitted on the two subsamples.
In high EB-intensity countries, only four factors�technology competence, scope, size, and competitive pressure�remainedsignificant at the p # 0.05 level; and the other two factors became insignificant (p = 0.082 for consumer readiness, p = 0.589 forlack of trading partner readiness). All coefficients were significant at the p # 0.05 level in low EB-intensity countries, similarto the full sample.
In each subsample, logit model had good model fit as suggested by a significant LR test (p # 0.001), satisfactory R2 (above 25%),and insignificant Hosmer-Lemeshow † (p > 0.1). However, in low EB-intensity countries the logit model predicted well for both
Table 4. Marginal Effects (Slopes) of the Logit Model
Variables
SlopesHigh EB-intensity vs.
low EB-intensity
Full sample Low EB-intensitycountries
High EB-intensitycountries 2-tail test p-value
Technology competence 0.110 0.109 0.104 0.254 0.799Firm scope 0.138 0.144 0.120 0.870 0.384Firm size 0.103 0.111 0.077 2.226 0.026Consumer readiness 0.061 0.065 --� --� --�
Competitive pressure 0.085 0.076 0.070 0.259 0.795Lack of trading partnerreadiness
-0.079 -0.103 --� --� --�
� Slopes and tests are not reported, since the associated coefficients in high intensity countries are insignificant (p > 0.05).
Zhu et al./Electronc Business Adoption
346 2002 � Twenty-Third International Conference on Information Systems
adopters (prediction accuracy = 73.8%) and non-adopters (prediction accuracy = 62.7%), but in high EB-intensity countries thelogit model predicted well only for adopters (prediction accuracy = 91.6%), but poorly for non-adopters (prediction accuracy =36.8%). The implication of this distinction is discussed later.
We calculated slopes by plugging sample means into (2). Values of slopes are shown in Table 4. We conducted a two-tail testto examine whether the two subsamples had the same slopes; it turned out that the two-tail test was significant only for firm size,which meant that firm size had different impacts on e-business adoption across two different e-business environments.
6 DISCUSSION
6.1 Major Findings and Interpretation
Finding 1: Technology competence, firm scope and size, consumer readiness, and competitive pressure are significant adoptionfacilitators; while lack of trading partner readiness is a significant adoption inhibitor.
This result is suggested by the significant coefficients of the logit regression (Table 3). The good model fit and satisfactorydiscriminating power demonstrated the comprehensiveness of the technology-organization-environment framework. Significantregression coefficients provided strong support for the six hypotheses. These results were consistent with our theoreticalarguments based on the technology-organization-environment framework.
Finding 2: As EB-intensity increases, two environmental factors�consumer readiness and lack of trading partner readiness�become less important.
All six factors were significant in low EB-intensity countries; yet, in high EB-intensity countries, consumer readiness becamemarginal (p = 0.082), and lack of trading partner readiness became insignificant (p = 0.589). This is surprising, given thatconsumer readiness was higher in high EB-intensity countries (mean = 1352) than in low EB-intensity countries (mean = 298).A plausible explanation is that, as more customers and competitors adopt e-business and as e-business becomes more prevalentin the value chain, firms in the high EB-intensity countries tend to regard it as a long-run strategic necessity. The lack of tradingpartner readiness became an insignificant factor, possibly because in high EB-intensity countries it is much easier to find onlinepartners as more firms have adopted e-business, which causes decision makers to downgrade this factor in the decision-makingprocess.
Finding 3: In high EB-intensity countries, e-business is no longer a phenomenon dominated by large firms; as more and morefirms engage in e-business, network effect works to the advantage of small firms.
We resorted to slopes to compare two subsamples (Table 4). The comparison suggested that the impact of firm size on adoptionis significantly lower in high EB-intensity countries than in low EB-intensity countries. This implies that, in high EB-intensitycountries, e-business is no longer a phenomenon dominated by large firms, and consequently there are more opportunities forsmall- and medium-sized enterprises (SMEs) to participate in the e-business arena. A possible explanation is that thedisadvantages of SMEs, such as less power in the market and more resource constraints in technological and financial resources,tend to be leveled out as EB-intensity increases. That is, as more and more firms engage in e-business, network effect works tothe special advantage of small firms. In addition, in high EB-intensity countries, there commonly exist more available technologyproviders and service providers, which may help SMEs adopt new technology; executives accumulate more managerialexperience, which helps lower the adoption risk; and as e-business diffuses from low intensity to high intensity, the governmentalso gradually improves its regulation policies. All of these improved situations might facilitate e-business adoption by SMEs.
Finding 4: Firms are more cautious into adopting e-business in high EB-intensity countries - it seems to suggest that the moreinformed firms are less aggressive into adopting e-business.
As discussed above, in low EB-intensity countries, the logit model predicted well for both adopters and non-adopters; however,in high EB-intensity countries, the logit model predicted well for adopters, but poorly for non-adopters. This implies that our logitmodel is overoptimistic when applying to high EB-intensity countries, in the sense that our model optimistically predicted manyfirms (182 out of 288 non-adopters in the high EB-intensity subsample) as adopters, which actually were non-adopters. In otherwords, firms in high EB-intensity countries behaved more cautiously than predicted by our model. In comparison, firms in lowEB-intensity countries behaved more aggressively. A possible explanation is that in high EB-intensity countries, managers tend
Zhu et al./Electronc Business Adoption
2002 � Twenty-Third International Conference on Information Systems 347
to have a more balanced understanding about e-business in terms of its benefits, costs, and risks. Accordingly, they tend toconsider more factors when assessing e-business projects and make more cautious adoption decisions, rather than quickly jumpingonto the e-business bandwagon.
6.2 Limitations and Future Research
The research design of this study has incorporated multiple rounds of theory building through literature review and expert opinion.The empirical part also instituted a series of validating procedures and controls. Still, our methodology required tradeoffs that maylimit the use of the data and interpretation of the results. First, our study only investigated adoption decisions. To gain a holisticunderstanding of e-business, implementation processes and the impacts of e-business on business performance should beexamined. Second, all countries in our dataset are industrialized countries. We do not know whether these results would applyto developing countries or newly industrialized countries. Accordingly, one future research direction is to design a longitudinalstudy examining implementation and impacts on firm performance. Another direction is to compare e-business adoption inindustrialized countries with developing and newly industrialized countries.
6.3 Implications and Concluding Remarks
Our research model was tested on a broad empirical base with a large dataset that was not limited to a single country. This helpsto strengthen the generalizability of the findings. Drawing up the data and results, our study offered several contributions. First,we demonstrated the usefulness of the technology-organization-environment framework for identifying facilitators and inhibitorsof e-business adoption. This framework could be applied by researchers to study other IS adoptions in different settings. Second,our empirical analysis identified six significant e-business adoption predictors and revealed differing adoption behaviors acrossdifferent e-business environments. These results might be useful to serve as a basis for others to derive their research models.Another technical message is to develop second-order constructs and interactive constructs to operationalize complex concepts.Finally, instruments used in this study passed various reliability and validity tests, so they could be used in other studies.
This study also has managerial implications as well. First, it is important for firms to build up their technology competence toadopt e-business, including both physical infrastructure and intangible properties (e.g., e-business know-how). Second, managersneed to re-evaluate the benefits and costs of e-business adoption as the environment changes. Another important message formanagers is to realize that, as e-business intensity increases, SMEs have more opportunities to compete in the e-business domain.
7 ACKNOWLEDGMENTS
The authors wish to thank Empirica, GMBH, Bonn, Germany, for providing the data. The research has benefitted from commentsof Sanjeev Dewan, Deborah Dunkle, John Mooney, Paul Gray, and seminar participants at the Center for Research on InformationTechnology and Organizations (CRITO), University of California, Irvine.
8 REFERENCES
Anderson Consulting. �eEurope Takes Off,� 1999 (available online at http://www.ac.com/ecommerce/ecom_efuture1.html).Bakos, Y. �The Emerging Role of Electronic Marketplaces on the Internet,� Communications of the ACM (41:8), 1998, pp. 35-42.Chau, P. Y. K., and Tam, K. Y. �Factors Affecting the Adoption of Open Systems: An Exploratory Study,� MIS Quarterly
(21:1), 1997, pp. 1-21.Chopra, S., and Meindl, P. Supply Chain Management. Upper Saddle River, NJ: Prentice-Hall, Inc., 2001.Crook, C. W., and Kumar, R. L. �Electronic Data Interchange: A Multi-Industry Investigation Using Grounded Theory,�
Information & Management (34), 1998, pp. 75�89.Damanpour, F. �Organizational Size and Innovation,� Organization Studies (13:3), 1992, pp. 375-402.Dewan, S., Michael, S., and Min, C. �Firm Characteristics and Investments in Information Technology: Scale and Scope
Effects,� Information Systems Research (9:3), 1998, pp. 219- 232.ECaTT. �Benchmarking Progress on New Ways of Working and New Forms of Business Across Europe,� 2000 (available online
at http://www.ecatt.com/).
Zhu et al./Electronc Business Adoption
348 2002 � Twenty-Third International Conference on Information Systems
Fornell, C., and Larcker, D. F. �Structural Equation Models with Unobserved Variables and Measurement Errors,� Journal ofMarketing Research (18:1), 1981, pp. 39-50.
Forrester Research. �Europe: The Sleeping Giant Awakens,� 1999 (available online at http://www.forrester.com/ER/Research/Report/Summary/0,1338,8706,00.html).
Greene, W. H. Econometric Analysis (4th ed.). Upper Saddle River, NJ: Prentice-Hall, Inc., 2000. Grover, V. �An Empirically Derived Model for the Adoption of Customer-Based Interorganizational Systems,� Decision Science
(24:3), 1993, pp. 603�640.Gurbaxani, V., and Whang, S. �The Impact of Information Systems on Organizations and Markets,� Communications of the ACM
(34:1), 1991, pp. 59-73.Helfat, C. E. �Know-How and Asset Complementarity and Dynamic Capability Accumulation: The Case of R&D,� Strategic
Management Journal (18:5), 1997, pp. 339-360.Hitt, L. �Information Technology and Firm Boundaries: Evidence from Panel Data,� Information Systems Research (10:2), 1999,
pp. 134-149.Hosmer, D. W., and Lemeshow, S. Applied Logistic Regression (2nd ed.). New York: John Wiley & Sons, Inc., 2000.Iacovou, C. L., Benbasat, I., and Dexter, A. S. �Electronic Data Interchange and Small Organizations: Adoption and Impact of
Technology,� MIS Quarterly (19:4), 1995, pp. 465�485.Kenny, D. A., and Judd, C. M. �Estimating the Nonlinear and Interactive Effects of Latent Variables,� Psychological Bulletin
(96), 1984, pp. 201-210.Kuan, K. K. Y., and Chau, P. Y. K. �A Perception-Based Model for EDI Adoption in Small Business Using a Technology-
Organization-Environment Framework,� Information and Management (38), 2001, pp. 507-512.Marsh, H. W., and Hocevar, D. �A New, More Powerful Approach to Multitrait-Multimethod Analyses: Application of Second-
Order Confirmatory Factor Analysis,� Journal of Applied Psychology (73:1), 1985, pp. 107-117.Mukhopadhyay, T., Kekre, S., and Kalathur, S. �Business Value of Information Technology: A Study of Electronic Data
Interchange,� MIS Quarterly (19:2), 1995, pp. 137-156.Nagelkerke, N. J. D. �A Note on a General Definition of the Coefficient of Determination,� Biometrika (78:3), 1991, pp. 691-693.Premkumar, G., Ramamurthy, K., and Crum, M. R. �Determinants of EDI Adoption in the Transportation Industry,� European
Journal of Information Systems (6:2), 1997, pp. 107-121.Segars, A. H., and Grover, V. �Strategic Information Systems Planning Success: An Investigation of the Construct and its
Measurement,� MIS Quarterly (22:2), 1998, pp. 139�163.Sethi, V., and King, W. R. �Development of Measures to Assess the Extent to which an Information Technology Application
Provides Competitive Advantage,� Management Science (40:12), 1994, pp. 1601-1627.Straub, D. W. �Validating Instruments in MIS Research,� MIS Quarterly (13:2), 1989, pp. 147-169.Teece, D. J. �Economics of Scope and the Scope of the Enterprise,� Journal of Economic Behavior and Organization (1:2), 1980,
pp. 223-247.Tornatzky, L. G., and Fleischer, M. The Process of Technology Innovation. Lexington, MA: Lexington Books, 1990.Veall, M. R., and Zimmermann, K. F. �Pseudo-R2s in the Ordinal Probit Model,� Journal of Mathematical Sociology (16:4),
1992, pp. 333-342.White, H. �A Heteroscedasticity-Consistent Covariance Matrix Estimator and a Direct Test for Heteroscedasticity,� Econometrica
(48:4), 1980, pp. 817-838.Zhu, K., and Kraemer, K. L. �E-Commerce Metrics for Net-Enhanced Organizations: Assessing the Value of E-Commerce to
Firm Performance in the Manufacturing Sector,� Information Systems Research (13:3), 2002, pp. 275-295.